UNITED STATES
SECURITIES AND EXCHANGE COMMISSION
Washington, D.C. 20549
___________________________
FORM 10-K
___________________________
(Mark One)
| | | | | |
| x | ANNUAL REPORT PURSUANT TO SECTION 13 OR 15(d) OF THE SECURITIES EXCHANGE ACT OF 1934 |
For the fiscal year ended December 31, 2024
| | | | | |
| o | TRANSITION REPORT PURSUANT TO SECTION 13 OR 15(d) OF THE SECURITIES EXCHANGE ACT OF 1934 |
For the transition period from to
Commission file number 001-39511
___________________________
BURFORD CAPITAL LIMITED
(Exact name of registrant as specified in its charter)
___________________________
| | | | | | | | |
| Bailiwick of Guernsey | | N/A |
| (State or other jurisdiction of incorporation or organization) | | (I.R.S. employer identification no.) |
| Oak House, Hirzel Street, St. Peter Port, Guernsey | | GY1 2NP |
| (Address of principal executive offices) | | (Zip code) |
+44 1481 723 450
(Registrant’s telephone number, including area code)
___________________________
Securities registered pursuant to Section 12(b) of the Act:
| | | | | | | | |
| Title of each class | Trading Symbol(s) | Name of each exchange on which registered |
| Ordinary shares, no par value | BUR | New York Stock Exchange |
| Ordinary shares, no par value | BUR | London Stock Exchange AIM |
Securities registered pursuant to section 12(g) of the Act: None
___________________________
Indicate by check mark if the registrant is a well-known seasoned issuer, as defined in Rule 405 of the Securities Act. Yes x No o
Indicate by check mark if the registrant is not required to file reports pursuant to Section 13 or Section 15(d) of the Act. Yes o No x
Indicate by check mark whether the registrant (1) has filed all reports required to be filed by Section 13 or 15(d) of the Securities Exchange Act of 1934 during the preceding 12 months (or for such shorter period that the registrant was required to file such reports), and (2) has been subject to such filing requirements for the past 90 days. Yes x No o
Indicate by check mark whether the registrant has submitted electronically every Interactive Data File required to be submitted pursuant to Rule 405 of Regulation S-T (§ 232.405 of this chapter) during the preceding 12 months (or for such shorter period that the registrant was required to submit such files). Yes x No o
Indicate by check mark whether the registrant is a large accelerated filer, an accelerated filer, a non-accelerated filer, a smaller reporting company, or an emerging growth company. See the definitions of “large accelerated filer,” “accelerated filer,” “smaller reporting company,” and "emerging growth company" in Rule 12b-2 of the Exchange Act.
| | | | | | | | | | | | | | |
| Large accelerated filer | x | | Accelerated filer | o |
| Non-accelerated filer | o | | Smaller reporting company | o |
| | | Emerging growth company | o |
If an emerging growth company, indicate by check mark if the registrant has elected not to use the extended transition period for complying with any new or revised financial accounting standards provided pursuant to Section 13(a) of the Exchange Act. o
Indicate by check mark whether the registrant has filed a report on and attestation to its management’s assessment of the effectiveness of its internal control over financial reporting under Section 404(b) of the Sarbanes-Oxley Act (15 U.S.C. 7262(b)) by the registered public accounting firm that prepared or issued its audit report. x
If securities are registered pursuant to Section 12(b) of the Act, indicate by check mark whether the financial statements of the registrant included in the filing reflect the correction of an error to previously issued financial statements. o
Indicate by check mark whether any of those error corrections are restatements that required a recovery analysis of incentive-based compensation received by any of the registrant’s executive officers during the relevant recovery period pursuant to §240.10D-1(b). o
Indicate by check mark whether the registrant is a shell company (as defined in Rule 12b-2 of the Act). Yes o No x
As of June 30, 2024, the aggregate market value of ordinary shares, no par value (“ordinary shares”), held by non-affiliates of the registrant was $2,601,352,143 based on the closing price of ordinary shares as reported by the New York Stock Exchange on June 30, 2024).
As of February 24, 2025, there were 219,421,904 ordinary shares outstanding.
DOCUMENTS INCORPORATED BY REFERENCE
The information required by Part III of this Annual Report on Form 10-K for the year ended December 31, 2024 (this “2024 Form 10-K”), to the extent not set forth in this 2024 Form 10-K, is incorporated herein by reference from the registrant’s definitive proxy statement relating to the annual general meeting of shareholders to be held in 2025, which definitive proxy statement shall be filed with the US Securities and Exchange Commission within 120 days of December 31, 2024.
Table of contents
Forward-looking statements
This Annual Report on Form 10-K for the year ended December 31, 2024 (this “2024 Form 10-K”) contains “forward-looking statements” within the meaning of Section 27A of the US Securities Act of 1933, as amended (the “Securities Act”), and Section 21E of the US Securities Exchange Act of 1934, as amended (the “Exchange Act”), that are intended to be covered by the safe harbor provided for under these sections. In some cases, words such as “aim”, “anticipate”, “believe”, “continue”, “could”, “estimate”, “expect”, “forecast”, “guidance”, “intend”, “may”, “plan”, “potential”, “predict”, “projected”, “should” or “will”, or the negative of such terms or other comparable terminology, are intended to identify forward-looking statements. Although we believe that the assumptions, expectations, projections, intentions and beliefs about future results and events reflected in forward-looking statements have a reasonable basis and are expressed in good faith, forward-looking statements involve known and unknown risks, uncertainties and other factors, which could cause our actual results and events to differ materially from (and be more negative than) future results and events expressed, projected or implied by these forward-looking statements. Factors that might cause future results and events to differ include, among others, the following:
▪Adverse litigation outcomes and timing of resolution of litigation matters
▪Our ability to identify and select suitable legal finance assets
▪Improper use or disclosure of, or access to, privileged information under our control due to cybersecurity breaches, unauthorized use or theft
▪Inaccuracy or failure of the probabilistic model and decision science tools, including machine learning technology and generative artificial intelligence (collectively, “AI technologies”), we use to predict the returns on our legal finance assets and in our operations
▪Changes and uncertainty in laws, regulations and rules relating to the legal finance industry, including those relating to privileged information and/or disclosure and enforceability of legal finance arrangements
▪Inadequacies in our due diligence process or unforeseen developments
▪Credit risk and concentration risk relating to our legal finance assets
▪Lack of liquidity of our legal finance assets and commitments in excess of our available capital
▪Our ability to obtain attractive external capital, refinance our outstanding indebtedness or raise capital to meet our liquidity needs
▪Competitive factors and demand for our services and capital
▪Failure of lawyers to prosecute and/or defend claims which we have financed with necessary skill and care or misalignment of their clients' interests with ours
▪Poor performance by the commitments we make on behalf of our private funds
▪Negative publicity or public perception of the legal finance industry or us
▪Valuation uncertainty with respect to the fair value of our capital provision assets
▪Current and future legal, political and economic factors, including uncertainty surrounding the effects, severity and duration of public health threats and/or military actions
▪Developments in AI technologies and expectations relating to environmental, social and governance (“ESG”) considerations
▪Potential liability from litigation and legal proceedings against us
▪Our ability to hire and retain key personnel
▪Risks relating to our international operations as a result of differing legal and regulatory requirements, political, social and economic conditions and unforeseeable developments
▪Exposure to foreign currency exchange rate fluctuations
▪Uncertainty relating to the tax treatment of our financing arrangements
▪Cybersecurity risks and improper functioning of our information systems or those of our third-party service providers
▪Failure of our third-party service providers to fulfill their obligations or misconduct by our third-party service providers
▪Failure by us to maintain the privacy and security of personal information and comply with applicable data privacy and protection laws and regulations
▪Failure by us to maintain effective internal control over financial reporting or effective disclosure controls and procedures
▪Failure by us to comply with the requirements of being a US domestic public company and the costs associated therewith
▪Certain risks relating to our incorporation in Guernsey
▪Other factors discussed under “Risk factors”
These factors should not be construed as exhaustive and should be read in conjunction with the other cautionary statements contained in this 2024 Form 10-K and other periodic and current reports that we file with or furnish to the US Securities and Exchange Commission (the "SEC"). Many of these factors are beyond our ability to control or predict, and new factors emerge from time to time. Furthermore, we cannot assess the impact of each such factor on our business or the extent to which any factor or combination of factors may cause actual results and events to be materially different from those contained in any forward-looking statement. Given these uncertainties, readers are cautioned not to place undue reliance on our forward-looking statements.
All subsequent written and oral forward-looking statements attributable to us or to persons acting on our behalf are expressly qualified in their entirety by these cautionary statements. The forward-looking statements speak only as of the date of this 2024 Form 10-K and, except as required by applicable law, we undertake no obligation to update or revise any forward-looking statements, whether as a result of new information, future events or otherwise.
Glossary
In this 2024 Form 10-K, references to “Burford”, “we”, “us” or “our” refer to Burford Capital Limited and its subsidiaries, unless the context requires otherwise.
Certain additional terms used in this 2024 Form 10-K are set forth below:
Advantage Fund
Burford Advantage Master Fund LP, a private fund focused on pre-settlement litigation strategies where litigation risk remains, but where the overall risk return profile is generally lower than assets funded directly by our balance sheet. Investors in the Advantage Fund include third parties as well as Burford’s balance sheet. Assets held by the Advantage Fund are recorded as capital provision assets.
Asset management
Includes our activities administering the private funds we manage for third-party investors.
Asset Management and Other Services segment
One of our two reportable segments. Asset Management and Other Services includes the management of legal finance assets on behalf of third-party investors through private funds, and provides other services to the legal industry.
Asset recovery
Pursuit of enforcement of an unpaid legal judgment, which may include our financing of the cost of such pursuit and/or judgment enforcement.
BAIF
Burford Alternative Income Fund LP, a private fund focused on post-settlement matters.
BAIF II
Burford Alternative Income Fund II LP, a private fund focused on post-settlement matters.
BCIM
Burford Capital Investment Management LLC, a wholly owned indirect subsidiary of Burford Capital Limited, serves as the investment adviser to all of our private funds and is registered under the US Investment Advisers Act of 1940, as amended (the “Investment Advisers Act”).
BOF
Burford Opportunity Fund LP, a private fund focused on pre-settlement legal finance matters.
BOF-C
Burford Opportunity Fund C LP, a private fund through which a sovereign wealth fund invests in pre-settlement legal finance matters under the sovereign wealth fund arrangement.
Burford-only (non-GAAP)
A basis of presentation that refers to assets, liabilities and activities that pertain only to Burford on a proprietary basis, excluding any third-party interests and the portions of jointly owned entities owned by others.
Capital provision assets
Financial instruments that relate to the provision of capital in connection with legal finance.
Claimant or plaintiff
The party asserting a right or title in a legal proceeding.
Colorado
Colorado Investments Limited, an exempted company that was established for the secondary sale of some of our entitlement in the YPF-related Petersen matter.
COLP
BCIM Credit Opportunities, LP, a private fund focused on post-settlement matters.
Consolidated funds
Certain of our private funds in which, because of our investment in and/or control of such private funds, we are required under the generally accepted accounting principles in the United States (“US GAAP”) to consolidate the minority limited partner’s interests in such private funds and include the full financial results of such private funds within our consolidated financial statements. As of the date of this 2024 Form 10-K, BOF-C and the Advantage Fund are consolidated funds.
Defendant or respondent
The party against whom a civil action is brought in a legal proceeding.
Deployment
Financing provided for an asset, which adds to our deployed cost in such asset.
Definitive commitments
Commitments where we are contractually obligated to advance incremental capital and failure to do so would typically result in adverse contractual consequences (such as a dilution in our returns or the loss of our deployed capital in a case).
Discretionary commitments
Commitments where we are not contractually obligated to advance capital and generally would not suffer adverse financial consequences from not doing so.
Fair value adjustment
The amount of unrealized gain or loss recognized in our consolidated statements of operations in the relevant period and added to or subtracted from, as applicable, the asset or liability value in our consolidated statements of financial condition.
Group-wide
A basis of presentation which refers to the totality of assets managed by us, which includes assets financed by our balance sheet through our Principal Finance segment and assets financed by third-party capital through our Asset Management and Other Services segment.
Judgment debtor
A party against whom there is a final adverse court award.
Judgment enforcement
The activity of using legal and financial strategies to force a judgment debtor to pay an adverse award made by a court.
Legal finance
The provision of capital against the underlying value of litigation and legal assets.
Legal risk management
Relates to matters where we provide some form of legal risk arrangement, such as an indemnity or insurance for adverse legal costs. These services are typically provided in conjunction with the financing of a legal finance asset.
Litigation
We use the term litigation colloquially to refer to any type of matter involved in the litigation, arbitration or regulatory process and the costs and legal fees associated therewith.
LTIP
The Burford Capital 2016 Long Term Incentive Plan, as amended and renewed from time to time, or any successor plan thereto.
Monetization
The acceleration of a portion of the expected value of a litigation or arbitration matter prior to resolution of such matter, which permits a client to convert an intangible claim or award into tangible cash on a non-recourse basis.
NED Plan
The Burford Capital Limited 2021 Non‐Employee Directors’ Share Plan, as amended from time to time.
Net realized gain or loss
The sum of realized gains and realized losses.
Non-consolidated funds
Certain of our private funds that we are not required to include within our consolidated financial statements but include within group-wide data. As of the date of this 2024 Form 10-K, (i) BCIM Partners II, LP, (ii) BCIM Partners III, LP, (iii) COLP, (iv) BOF, (v) BAIF and (vi) BAIF II and any “sidecar” funds are non-consolidated funds.
NQDC Plan
The Burford Capital Deferred Compensation Plan, as amended from time to time.
Portfolio
The sum of the fair value of capital provision assets and the undrawn commitments.
Post-Settlement
Includes our financing of legal-related assets in situations where litigation has been resolved, such as financing of settlements and law firm receivables. At the date of this annual report, our post settlement activity occurs primarily in COLP, BAIF and BAIF II.
Principal Finance segment
One of our two reportable segments. Principal Finance includes the allocation of capital to legal finance assets from our balance sheet, primarily as capital provision assets, and in limited scope through interests in private funds managed by Burford.
Privileged information
Confidential information that is protected from disclosure due to the application of a legal privilege or other doctrine, including attorney work product, depending on the laws of the relevant jurisdiction.
PSUs
Performance share units awarded to employees under the LTIP.
Realization
A legal finance asset is realized when the asset is concluded (i.e., when litigation risk has been resolved). A realization will result in us receiving cash or, occasionally, non-cash assets, or recognizing a due from settlement receivable, reflecting what we are owed on the asset.
Realized gain or loss
Reflects the total amount of gain or loss, relative to cost, generated by a legal finance asset when it is realized, calculated as realized proceeds less deployed cost, without regard for any previously recognized fair value adjustment.
RSUs
Restricted share units awarded to employees under the LTIP.
Share-based awards
The total of RSUs and PSUs awarded to employees under the LTIP.
Strategic Value Fund
BCIM Strategic Value Master Fund, LP, a private fund that deployed capital in certain complex strategies assets. Investors in the Strategic Value Fund included third parties as well as Burford’s balance sheet. Assets held by the Strategic Value Fund were recorded as capital provision assets, and the Strategic Value Fund was a consolidated fund. As of December 31, 2023, all assets held at the Strategic Value Fund have concluded, and the Strategic Value Fund was liquidated.
Sovereign wealth fund arrangement
The agreement we have entered into with a sovereign wealth fund pursuant to which it provides financing for a portion of our legal finance assets through BOF-C. Under this agreement, we (in our capacity as the appointed investment adviser) receive reimbursement of expenses from BOF-C up to a certain level before we or the sovereign wealth fund, as applicable, receive a return of capital. After the repayment of capital, we then receive a portion of the return generated from the assets held by BOF-C, which is reported as profit sharing income from private funds.
Total segments
Refers to the sum of our two reportable segments, (i) Principal Finance and (ii) Asset Management and Other Services, and is presented on a Burford-only basis.
Unrealized gain or loss
Represents the fair value of our legal finance assets over or under their deployed cost, as determined in accordance with the requirements of the applicable US GAAP standards, for the relevant financial reporting period (consolidated statements of operations) or cumulatively (consolidated statements of financial condition).
Vintage
Refers to the calendar year in which a legal finance commitment is initially made.
YPF-related assets
Refers to our Petersen and Eton Park legal finance assets, which are two claims relating to the Republic of Argentina’s nationalization of YPF S.A., the Argentine energy company.
Notes on changes to reporting framework
Burford has always focused on providing disclosure that represents what shareholders actually own, which is reflected in the “Burford-only” basis of financial reporting. “Burford-only” reporting removes the impact of private fund entities that must be consolidated under accounting standards, even though economic ownership resides with a third party.
Beginning with our reporting for the year ended December 31, 2024, the Burford-only disclosure is enhanced with a more prominent use of segment reporting through two reportable segments: (i) “Principal Finance” (which captures the financial impact of the legal finance portfolio funded by Burford’s balance sheet) and (ii) “Asset Management and Other Services” (which captures fee income from Burford’s private funds funded by third-party capital and income earned from other service-related operations). Under US reporting standards, the use of segment reporting allows for more efficient and helpful disclosure on the key metrics that illuminate how Burford generates shareholder value in each segment.
The sum of Burford’s two reportable segments is referenced as “Total segments” in certain disclosure schedules, which is consistent and identical to reporting on an aggregate “Burford-only” basis.
The Principal Finance segment reporting is further simplified by discontinuing the use of the labels “capital provision-direct” or “core portfolio” (which described direct funding of legal finance assets by Burford’s balance sheet) and “capital provision-indirect” (which described indirect funding of legal finance assets through commitments made by Burford’s balance sheet to private funds). Performance track record measures such as return on invested capital (ROIC) and internal rate of return (IRR) is entirely consistent with prior reporting and reflect direct funding by the balance sheet (formerly referred to as “capital provision-direct” or “core portfolio”), excluding the impact of any balance sheet commitments to private funds.
Part I
Item 1. Business
Introduction
Burford is the world’s largest dedicated provider of capital, based on portfolio size, against the underlying value of litigation and legal assets, which we colloquially call legal finance.
We are a global firm that serves the industry of law by providing an array of financial products and services. Our largest business is providing capital to clients engaged in ongoing legal disputes, which they can use to pay the legal fees and expenses associated with disputes, to monetize the expected future value of disputes or to do both. Our focus is on large, complex disputes, not on small-scale litigation typically pursued by consumers or small businesses. We rarely engage in transactions in which we are providing less than $5.0 million in capital, and we frequently provide multiples of that amount up to hundreds of millions of dollars. Since our inception in 2009, we made commitments of more than $11.2 billion into legal finance assets on a group-wide basis.
Our clients are a wide range of litigants including a number of the world’s largest law firms and businesses. Legal finance allows law firm clients to obtain cash to operate their businesses and pay the salaries of their lawyers even when they have taken a case on a contingent fee or alternative fee basis. It also allows law firms that prefer to operate on an hourly basis to compete for contingency or alternative fee work. We have received financing inquiries from 94 of the 100 largest US law firms by revenue according to the 2024 rankings by The American Lawyer and 92 of the 100 largest global law firms by revenue according to the 2024 rankings by The American Lawyer as well as large regional firms and litigation boutiques. Legal finance allows litigants to hire law firms that generally work on an hourly fee basis without incurring those fees, and potentially to accelerate a portion of an expected recovery on the business's preferred schedule. Further, legal finance may enable clients to avoid incurring legal fees as an operating expense, and thus improve net income metrics, as well as boost liquidity by obtaining cash through upfront monetization of legal assets that otherwise would not be reflected in their financial statements.
We fund our legal finance portfolio primarily from our balance sheet using modest leverage, with the aim of re-investing proceeds to grow and compound returns. Our principal financing activities are supplemented by the use of third-party capital through private funds, from which we earn asset management income.
Today, we manage a group-wide legal finance portfolio of $7.4 billion. Our portfolio is diversified by geography and type of legal claim and is, we believe, the largest of its kind globally. Over the last 15 years, it has grown by a multiple of more than 50x when compared to $130 million raised at our inception.
In an industry that continues to grow and evolve, we believe we enjoy a substantial competitive advantage, given our lifetime track record of generating strong returns, our growing proprietary data set drawn from thousands of cases that guides optimal underwriting decisions, our balance sheet scale, our diversity of funding, our quality of team and our brand recognition.
In addition to legal finance, we see opportunity and potential growth for our company in providing certain additional service offerings within the business of law.
History and development
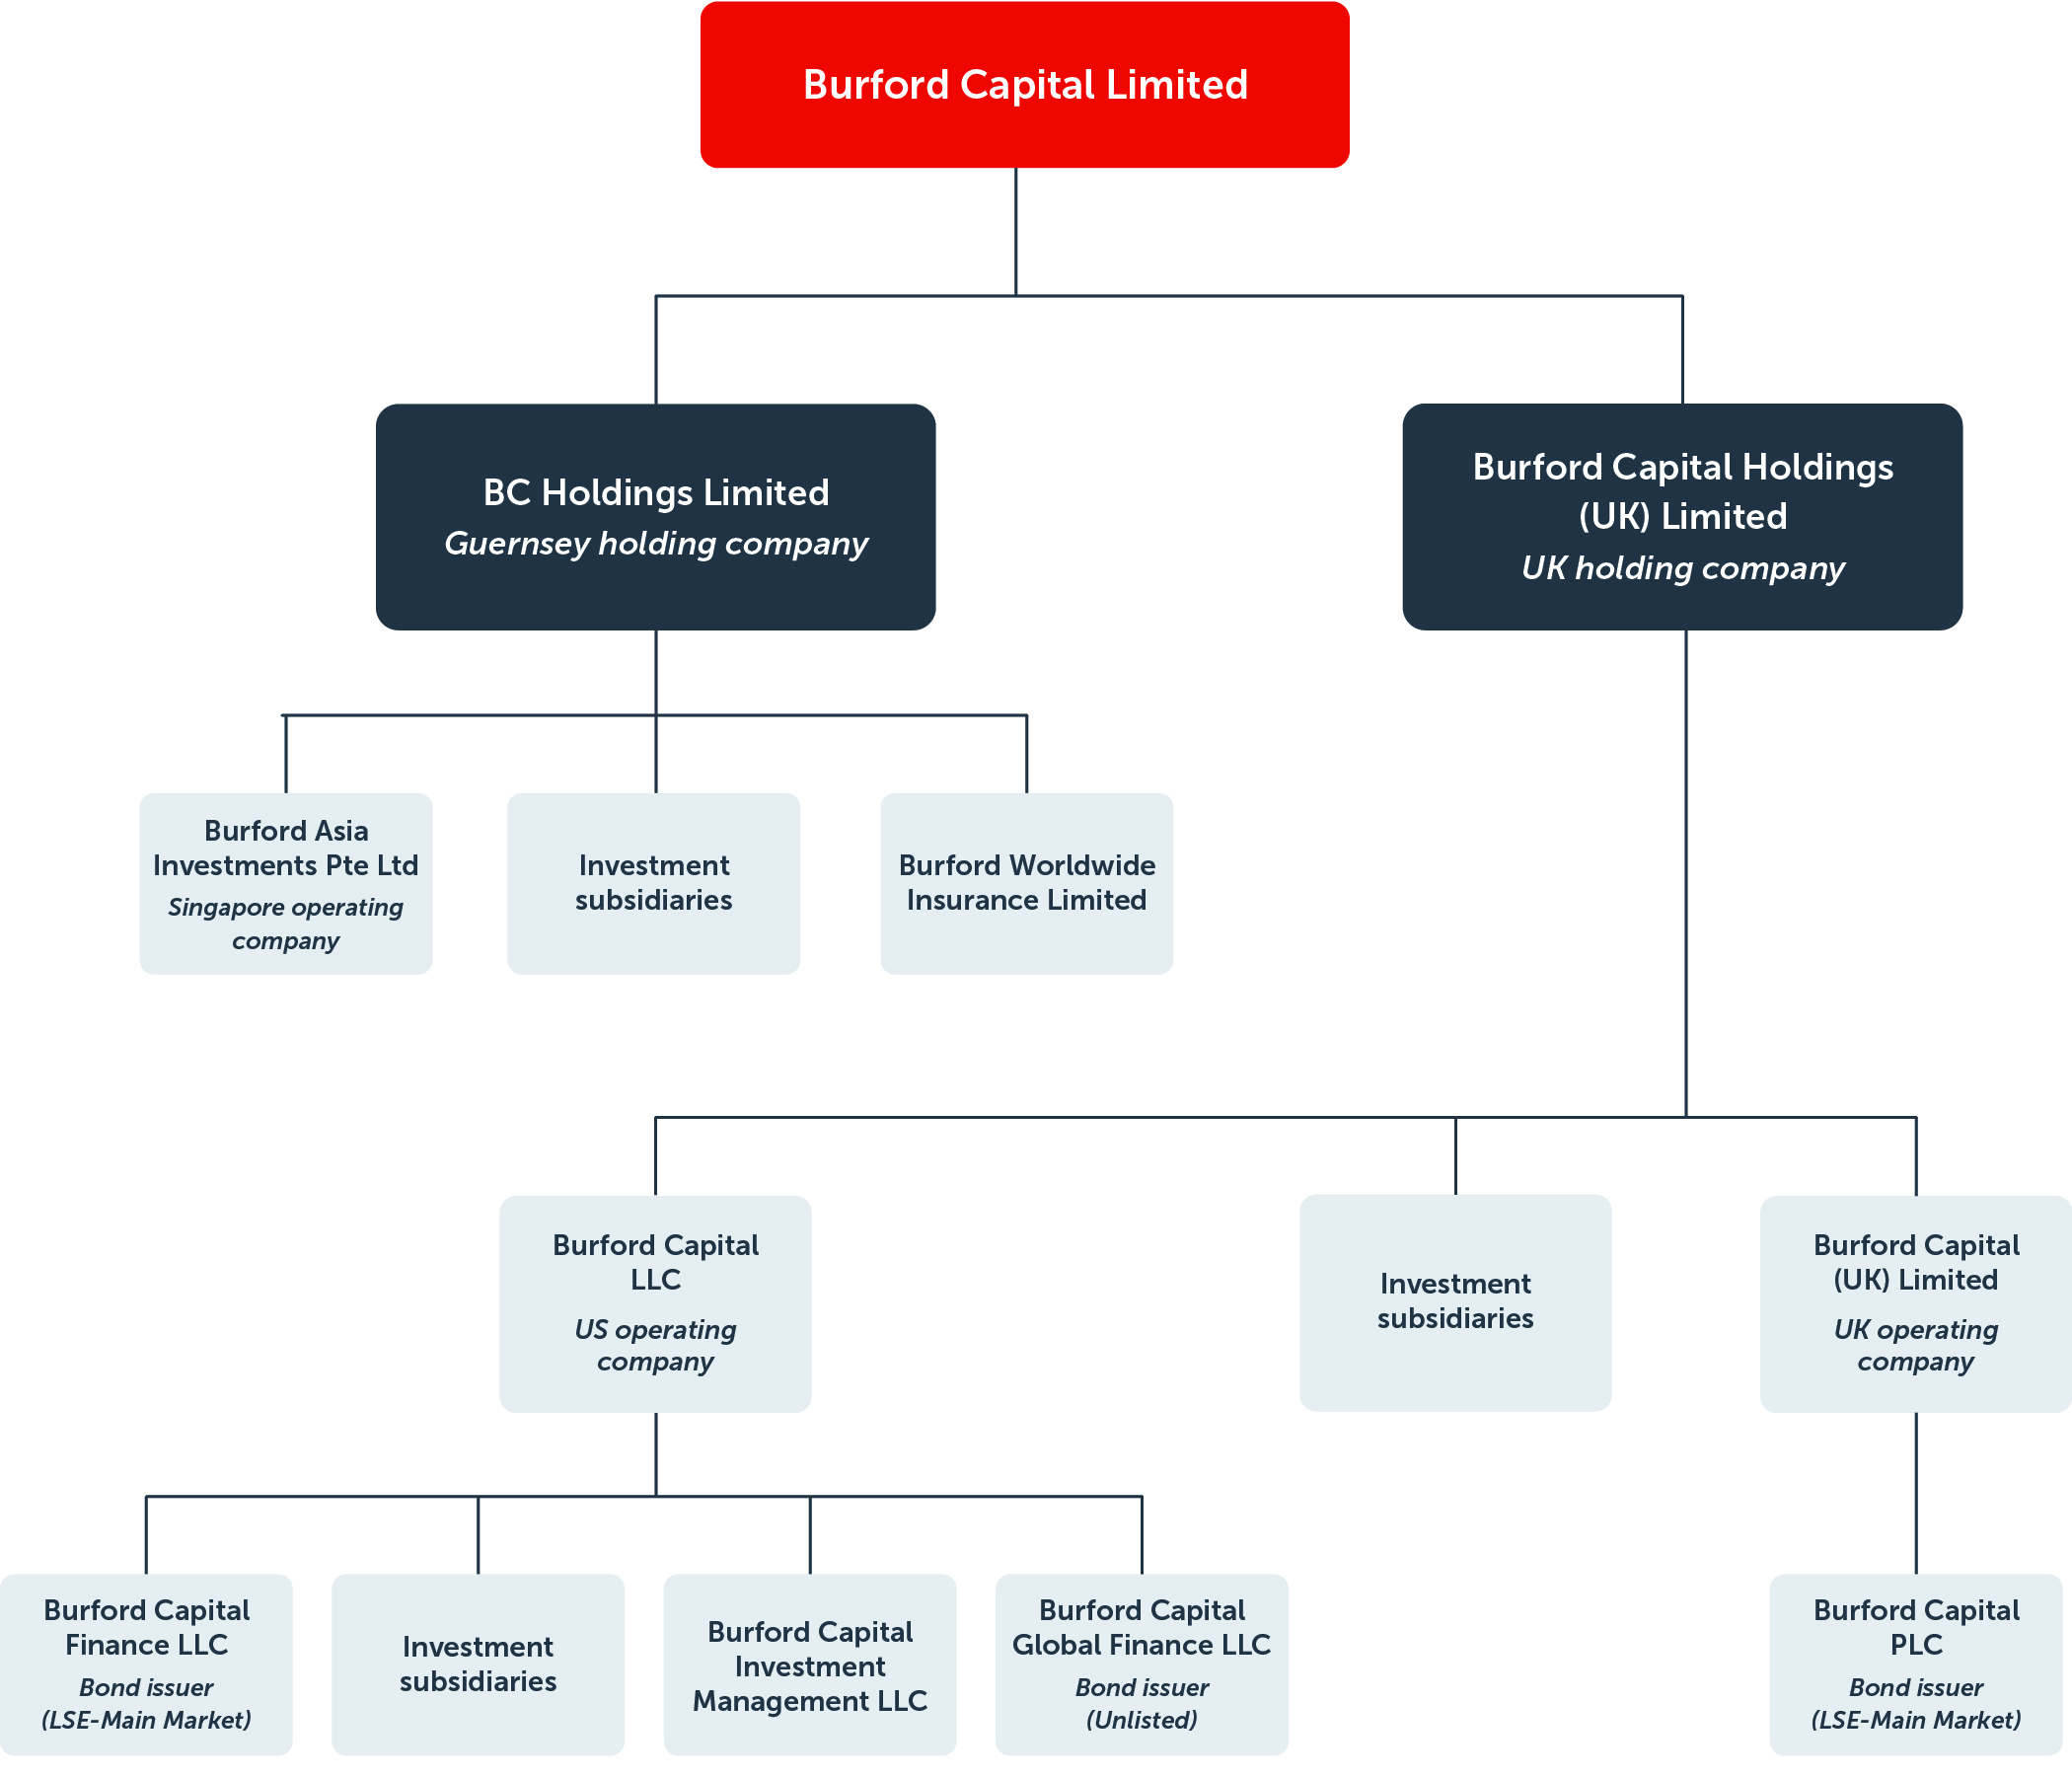
We are composed of our parent company, Burford Capital Limited, and numerous wholly owned subsidiaries in various jurisdictions through which our operations are conducted and our capital is deployed. Burford Capital LLC is a wholly owned indirect subsidiary of Burford Capital Limited and our primary operating company in the United States, and Burford Capital (UK) Limited is a wholly owned indirect subsidiary of Burford Capital Limited and our primary operating company in the United Kingdom. These two entities provide various corporate and investment advisory services to other group companies. Our parent company, Burford Capital Limited, does not have any operations or employees. See “—Organizational structure” for additional information with respect to our organizational structure.
In 2009, our founders launched Burford with a shared vision of an entity supported by permanent capital that could provide bespoke financing to help businesses and law firms address the significant economic challenges they faced in managing legal costs. At the time, the few capital providers addressing this investment proposition were generally domiciled in the United Kingdom, where prior judicial system reforms had permitted the entry of third-party capital into the delivery of a range of legal services. Thus, despite the investment adviser’s team being based in the United States, Burford Capital Limited was incorporated in the Bailiwick of Guernsey (“Guernsey”) as a closed-end fund company limited by shares on September 11, 2009 with a view to list the vehicle on the London Stock Exchange through an offering of new shares. Following
that initial public offering, Burford’s ordinary shares, under the symbol “BUR”, were admitted to trading on AIM, a market operated by the London Stock Exchange (“AIM”), on October 21, 2009.
Increased demand for our capital proposition soon meant the closed-end fund structure was insufficient to address the market opportunity. In 2012, our shareholders voted in support of a proposal to reconstitute Burford as a unitary, specialty finance operating company. The reconstitution permitted more debt capital to be raised to fund growth than was possible under the closed-end fund vehicle and, between 2014 and 2018, we raised $693.0 million through the sale of bonds listed on the Main Market of the London Stock Exchange, and the fair value of our capital provision assets grew by more than 6x. Outgrowing the UK bond market’s capacity to provide the US dollar funding needed to match the principal currency denomination of our legal finance assets, we sought credit ratings to facilitate access to the US private debt market and we duly obtained a maiden corporate family rating from Moody’s in October 2019 and a long-term debt rating from Standard & Poor’s in November 2019.
We have also made a few strategic acquisitions to support inorganic growth. Our acquisition in 2011 of Firstassist Legal Expenses Insurance, a leading provider of litigation expenses insurance in the United Kingdom, provided footprint in London and was the basis of our legacy adverse cost insurance business. Our acquisition in 2015 of a business intelligence firm Focus Intelligence Ltd enabled us to provide clients judgment enforcement services for their funded disputes. Our acquisition in 2016 of GKC Holdings, LLC, a law-focused asset manager registered as an investment adviser with the SEC, formed the initial core of our asset management business as well as expanded our US footprint and our ability to finance patent disputes.
To support further development of our standing in US capital markets, in 2020, Burford Capital Limited registered with the SEC as a “foreign private issuer”, which, among other things, allowed us to issue annual consolidated financial statements on Form 20-F and interim condensed consolidated financial statements on Form 6-K and exempted us from certain provisions applicable to US domestic public companies. We secured the admission of our ordinary shares on the New York Stock Exchange (the “NYSE”) on October 19, 2020, also under the symbol “BUR”. Subsequently, our subsidiaries issued $1.4 billion of debt securities through private placement transactions under Rule 144A and Regulation S under the Securities Act. See note 12 (Debt) to our consolidated financial statements contained in this 2024 Form 10-K for additional information with respect to our debt securities. Upon determining that the majority of our ordinary shares were held in the United States as of June 30, 2024, we no longer qualified as a “foreign private issuer” effective as of January 1, 2025. We are now subject to the same disclosure and financial reporting requirements as most US domestic public companies listed on the NYSE.
We maintain our registered address at Oak House, Hirzel Street, St. Peter Port, Guernsey GY1 2NP. Our telephone number at our registered address is +44 1481 723 450.
Our industry
Since our launch, the legal finance industry has experienced significant growth due to factors including increased visibility and normalization, greatly expanded use cases and regulatory and other developments that have fueled its practice in more jurisdictions. In our early days, our clients were often businesses that were unable or unwilling to pay their law firms’ hourly fees, and our financing served to bridge the gap between the needs of legal departments for risk-sharing and the reality that as cash partnerships many law firms have limited capacity to take on the substantial multi-year risk of working on a contingent fee basis. But the legal finance industry has grown considerably beyond this initial emphasis on simple cost and risk management for single claims. Law firms now use legal finance, in particular multi-case portfolios, to pursue new business and build books of high-value contingent claims. Equally if not more important, businesses including very large companies now use legal finance as a form of corporate finance for the legal department that allows them to accelerate high-value recoveries and preserve their working capital for revenue-generating activities. Increasingly, both law firms and businesses embrace legal finance as a tool for growth.
We believe our addressable market in legal finance to be focused on three areas of legal activity: (i) the underlying asset value of litigation claims and the enforcement of settlements, judgments and awards; (ii) the amount paid to law firms as legal fees and expenses; and (iii) the value of assets affected by litigation. We believe that each of these areas is of significant size, that their size is much greater than the supply of capital available and that we remain at an early stage of market development. In 2023, for instance, the most recent year of available industry data, the value of the largest 100 US verdicts was $23 billion1 and the value of pending arbitration cases before the International Chamber of Commerce's International Court of Arbitrati
1 ALM VerdictSearch, "The Top 100 Verdicts of 2023"
on was $255 billion2. Alternatively, annualized global legal fees were $819 billion3, of which $404 billion was in the United States, while estimated revenue of the largest 200 US law firms was $165 billion4. We continuously look for new opportunities to capitalize on deploying capital into, or otherwise generating returns from, the legal finance sector.
In addition to the legal finance market, the market for legal services, including not only legal fees but all of the other costs and expenses associated with litigation (including, among others, the costs of expert witnesses, jury consultants, court reporters, trial graphics, settlement administrators and electronic discovery vendors), is substantial and growing.
Segments
We provide a variety of legal finance services to our clients through our two segments: (i) Principal Finance and (ii) Asset Management and Other Services.
Principal Finance
Our Principal Finance segment allocates capital to legal finance assets from our balance sheet, primarily as capital provision assets and in limited scope through interests in private funds managed by us. These balance sheet capital provision assets and private fund interests generate capital provision income, which is the most significant driver of our total revenues.
Funding our legal finance portfolio predominantly using our own capital allows us, we believe, to maximize earnings and cash flow capacity for shareholders, compound our book value per share at a higher rate and achieve the most efficient financing strategy for the higher risk/return profile of this asset class. We utilize access to debt capital markets to modestly leverage the Principal Finance segment portfolio at an attractive cost of capital relative to our target returns and maintain a laddered debt maturity structure with an average maturity in excess of the expected average life of our portfolio assets.
We predominantly provide capital to clients, and in that capacity we remain passive investors without control of litigation. In limited instances we may purchase a claim and have greater rights over litigation decision-making but remain a third party to the litigation. In other instances, we may make an investment in which an asset's value is impacted by litigation but we are the principal and have no client.
The scope of our Principal Finance portfolio is broad and encompasses a wide variety of structures, risk levels and anticipated returns. We provide capital against the underlying value of high-value single or multiple litigation and arbitration matters at any stage of the process, from before filing to after a final judgment has been entered. In some instances, we provide capital to a law firm that has agreed to take a case on a contingent fee or alternative fee basis. In other instances, we provide capital directly to the client. Our provision of capital may finance the costs of the fees and/or expenses needed to take the matter forward, or it may monetize some of the potential future value of a claim by providing an upfront cash payment to the client. In return, we receive our contractually agreed entitlement from the ultimate settlement, judgment or award on the claim and, if the claim does not produce any cash proceeds or other value, we generally lose our capital. At times we provide capital for multiple cases for the same client in cross-collateralized portfolios with terms that recognize the lower risk of loss generally associated with such diversified portfolios. Portfolios allow us to originate larger volumes of assets with greater efficiency, as well as to provide clients financing for cases that could otherwise be difficult to finance. We also deploy capital in other ways to express a view about litigation outcomes, such as by purchasing securities whose future value may be affected by litigation outcomes or by acquiring assets that are or can be the basis for legal claims.
We also provide legal risk management services to help protect clients against certain adverse litigation outcomes, including the risk of being held liable for adverse costs. In many legal jurisdictions (although generally not in the United States), the loser in a litigation must pay the winner’s legal expenses, creating adverse legal cost risk. Adverse legal cost risk can be a significant obstacle for clients, especially in the kind of larger complex litigation that is the focus of our core legal finance business. Burford Worldwide Insurance Limited, our wholly owned Guernsey licensed insurer, offers adverse legal cost insurance globally in litigation and arbitration cases that we are financing as part of our Principal Finance business, providing a further impetus for clients to work with us.
2 International Chamber of Commerce Dispute Resolution 2023 Statistics
3 The Business Research Company, "Legal Services Global Market report 2025"
4 Burford analysis of AmLaw 100 and AmLaw 200 data rankings 2023
Asset Management and Other Services
Our Asset Management and Other Services segment manages legal finance assets on behalf of third-party investors and provides other services to the legal industry. We receive fees for both of these types of activities. As of December 31, 2024, we operated eight private funds and three “sidecar” funds as an investment adviser registered with and regulated by the SEC. As of December 31, 2024 and 2023, our total assets under management (“AUM”) were $3.5 billion and $3.4 billion, respectively. We believe that we are the largest investment manager focused solely on the legal finance sector by a considerable margin.
Over the course of our history, we have used private fund capital to finance our portfolio across the risk / return spectrum and acquired in 2016 a fund management business to enhance our access to third-party capital. While currently we expect to prioritize the favorable economics of allocating capital from our balance sheet, we maintain a sizable asset management portfolio. Our most recently raised private funds focused on allocating to assets with a lower overall risk/return profile compared to our balance sheet, and our strategic sovereign wealth fund partner has invested alongside the balance sheet.
See “Management's discussion and analysis of financial condition and results of operations—Segments—Asset Management and Other Services segment—Private funds” for additional information with respect to the key statistics for each of our private funds.
Legal finance capital allocation
We allocate legal finance assets to different pools of capital based on their overall risk / return profile, which encompasses a range of characteristics, including, among others:
▪Expected yield and range of potential yield outcomes
▪Risk of capital loss and ability to contractually protect principal
▪Expected duration, including duration risk
▪Currency risk
▪Stage of legal process (merits risk and appeal risk)
▪Collection risk (counterparty creditworthiness and enforcement)
There are generally three pools of capital from which we currently or have historically funded legal finance assets:
▪Our balance sheet
▪Our sovereign wealth fund arrangement (BOF-C)
▪Various private funds managed by us (in some cases, including allocations from our balance sheet as a limited partner)
Our capital allocation policy for the legal finance portfolio, at any given point in time, has set clear parameters to determine allocation of capital to new legal finance assets based on a combination of the risk / return characteristics noted above. We have always maintained a disciplined policy framework that avoids conflicts of interest between our balance sheet and our third-party capital providers. When our balance sheet and third-party capital providers co-invest in a deal, we typically apportion the new legal finance asset based on a formulaic allocation policy to each capital provider. Over time, the composition and investment objectives of our third-party capital providers have evolved alongside broader market dynamics. We continually seek to maximize the operational efficiency of our platform to deliver attractive economics to our shareholders and, as a result, our capital allocation framework for the legal finance portfolio has evolved over time as well.
In general terms, our balance sheet has historically allocated to legal finance assets with a higher overall risk / return profile, supplemented at varying levels over time by BOF-C, our sovereign wealth fund arrangement, and certain private funds for which the investment period has now concluded. These private funds include BCIM Partners II, LP, BCIM Partners III, LP and BOF.
BOF-C’s fund commitment was fully utilized by September 2024 and thus BOF-C did not participate in further new commitments following that date through December 31, 2024, the end date of the BOF-C investment period. Burford and BOF-C are in active discussions about extending the investment period and expanding BOF-C’s commitment.
Our other private funds have generally allocated to legal finance assets with a lower overall risk / return profile, which can be generally addressed in two categories:
▪First, we offer our clients the ability to monetize post-settlement and other legal receivables, where little or no litigation risk remains. These assets are underwritten to target returns more similar to fixed income investments, and we have historically funded them with third-party capital through
COLP and its successor private funds BAIF and BAIF II. While the investment periods for COLP and BAIF concluded in 2019 and 2022, respectively, the investment period for BAIF II extends to September 2025.
▪Second, driven by an era of sustained low interest rates, we launched the Advantage Fund in 2022 to allocate capital to legal finance assets that (i) were pre-judgment or pre-settlement and (ii) presented an overall risk / return profile that was generally lower than those allocated to our balance sheet, but generally higher than our post-settlement strategies. The investment period for the Advantage Fund concluded in December 2024, and our balance sheet holds a 17% stake in the Advantage Fund.
Currently, we are pursuing a deliberate strategy to prioritize the allocation of capital from our balance sheet, as we believe capital provision income offers more attractive return economics for our shareholders compared to asset management fees. At the same time, a higher interest rate environment has altered the market appeal of private fund products like the Advantage Fund, and we believe it would be challenging to raise a successor private fund at this time at pricing terms that we would find attractive.
Consistent with this strategic evolution, our Principal Finance segment will selectively evaluate a wider range of legal finance opportunities with a diversified mix of risk / return characteristics. Our market opportunity is not static as this emerging alternative asset class continues to evolve and grow.
Operating processes
Origination and underwriting
Our origination and underwriting teams generate new opportunities to commit capital to legal finance assets, to be deployed over a period of time and/or upfront against those assets, both from our balance sheet and our private funds.
We engage in extensive marketing and origination activities. Upon receipt of inbound inquiries, we undertake an initial screening process that is intended to filter investable opportunities into our pipeline. Once a potential opportunity progresses into our pipeline, it is assigned to individual underwriters to conduct extensive in-house due diligence with input from our global team, including comprehensive legal and factual analysis. In addition, we undertake quantitative probabilistic modeling using proprietary analytical tools that rely on third-party data as well as a significant proprietary dataset we have developed since our inception in 2009.
Opportunities that satisfy the requirements of our in-house due diligence are then presented for review by our dedicated Commitments Committee, which is comprised of certain members of the management committee (the “Management Committee”) and senior members of the underwriting team (the “Commitments Committee”). All commitments of capital must be approved by the Commitments Committee, which considers legal and factual merits and risks, reasonably recoverable damages, proposed budget, proposed terms, collection issues and enforceability. If the Commitments Committee approves the opportunity, our underwriters negotiate terms with the goal of closing a transaction to provide the committed capital against the asset.
The manner in which we provide financing on a commitment varies widely. Some financing agreements require us to provide financing over a period of time, whereas other financing agreements require us to finance the total commitment upfront. In addition, our undrawn commitments are either discretionary or definitive. Discretionary commitments provide a framework and partnership through which to finance a client portfolio, but with funding ultimately subject to further case-level underwriting. Definitive commitments are those in which we are contractually obligated to advance incremental capital and where failure to do so would typically result in adverse contractual consequences (such as a dilution in our returns or the loss of our deployed capital in a case).
While the use of true artificial generative intelligence such that it could replace the human legal judgment required in our business remains in its infancy, we expect that ongoing development could continue to grow in benefit for our business, including by augmenting and enhancing our origination and underwriting. The legal industry in general and our business in particular have made increasing use of technological innovations over the past decade. We believe that we are well positioned relative to current market players or potential market entrants in the use of AI technologies in legal finance given our extensive database of dispute economics and outcomes.
Pricing and returns
We use a wide range of economic structures for our assets, and our returns can have several components. The terms of each asset are bespoke, which we believe offers an attractive degree of flexibility to serve our
clients. In a basic single-case financing transaction, we pay some or all of the claimant’s costs in bringing a litigation matter. In such transactions, we typically use an economic structure that provides that, upon conclusion of a successful claim, we would receive the return of our deployed capital, plus one or a combination of the following: (i) a time-based return, such as an interest rate; (ii) a multiple of our deployed capital that may increase over time; and (iii) an entitlement to some percentage of the net realization that may increase or decrease over time or may depend on the size of the total resolution amount. Moreover, the larger or more complex a matter, the more likely we will be to use an individually designed transactional structure that aligns interests, incentivizes rational economic behavior and accommodates the needs of the client and potentially multiple parties with different economic interests.
We also engage in transactions in which we seek to reduce the risk of loss, typically by using a portfolio or multi-case structure, but occasionally through a variety of other structures, such as interest-bearing recourse debt (sometimes with a premium based on net realizations) or the purchase of equity or debt assets that underlie the relevant litigation or arbitration claims.
We price our assets commensurate with the risks we identify and quantify as part of our in-house due diligence process, which relies on, among other things, our probabilistic modeling to evaluate each potential asset considered by the Commitments Committee.
Asset monitoring and realizations
Although most legal jurisdictions and our capital provision agreements generally stipulate that as a passive investor in legal finance assets we may not directly control or litigate cases, we invest substantial time and resources to actively advising our clients in the management of our legal finance assets. We maintain a team devoted to the oversight of those assets with a dedicated in-house legal professional assigned to monitor developments in each asset and its relevant underlying cases. In addition to receiving reports from counsel, we proactively monitor case developments, including receiving docket alerts and reviewing court documents filed. Our engagement varies depending on the circumstances of each individual matter, including not only the individual matter’s litigation dynamics, but also the experience and sophistication of our counterparties. We routinely consult on litigation strategy, participate in choosing arbitrators and expert witnesses, comment on draft pleadings, assist in the creation of the damages theory and consult on potential settlement, management of spending and performance against budget.
We devote meaningful resources to managing our legal finance assets and working collaboratively with clients to maximize their value. While our clients are generally not obliged to follow our advice, our clear alignment of interests makes our advice valuable and worthy of serious consideration, and we believe that many clients not only welcome our perspective but welcome our expertise as a reason to work with us. Thus, although we generally lack decision making authority in a contractual sense such that we could veto a decision by a counterparty, our active engagement and case management make us a valued and influential advisor to our clients and their respective litigation teams. On occasion, there are certain exceptions when we have specifically contracted to assume some control of a litigation matter or the underlying asset. In those instances, we have control over the conduct of the litigation matter subject to whatever contractual terms have been agreed.
We also conduct risk reviews on a regular basis and provide monthly and quarterly reporting on the portfolio and its risk profile to senior management and our board of directors (the “Board of Directors”). Further, we conduct an extensive review of every asset for valuation purposes following the occurrence of certain qualifying events in accordance with our valuation policy.
The matters underlying our assets resolve in various ways consistent with the typical course of litigation. Most matters reach a negotiated resolution (i.e., a settlement) between the litigants either before or after going to trial. Others do not resolve through settlement and proceed through the formal dispute resolution process, including trial and appeal(s). The timing of their outcomes varies widely depending on the complexity of the matter and the schedule of the relevant court or tribunal. In a small number of matters where we are permitted to do so, we have made a secondary sale of all or a portion of an asset prior to its conclusion.
In many instances, our clients receive their entire cash payment at the time of resolution of the legal dispute against which we have deployed our capital. However, in other instances, payments are delayed by agreement (i.e., when a settlement is paid in installments over time) or because the parties agree on an entitlement that includes non-cash value that must be monetized over time. Because our clients give up valuable leverage through the pendency of the litigation process by agreeing to a resolution, clients tend not to do so unless payment is reasonably certain. In our experience, defaults in connection with such payments
are rare, but in instances where the adverse party loses and refuses to pay, enforcement efforts may be needed.
Privileged information
Our underwriting and ongoing asset monitoring require that we receive privileged information from our clients. Such privileged information can lose its protection and become accessible to a litigation opponent if it is disclosed (a concept called “waiver” in the United States), which could have detrimental consequences for the litigant. We are entitled to receive such privileged information but are under a strict obligation to protect it to minimize the risk of waiver. Among other things, this obligation requires us to tightly restrict access to the privileged information itself and conclusions drawn from it. As a result, we do not release asset valuations of ongoing matters underlying our assets, including partially concluded matters, and we are similarly unable to provide other asset-specific information about our portfolio unless such information becomes publicly available through other means.
Competition
The legal finance industry is highly competitive and evolving as new competitors enter the market, which has affected and could affect our competitiveness in the future. We compete both globally and on the basis of region, industry and type of dispute based on factors including performance of our legal finance assets, transaction execution, access to capital, access to and retention of qualified personnel, reputation, range of products and services, innovation and pricing. Furthermore, we compete to finance assets primarily with pure-play legal finance companies and multi-strategy firms that engage in legal finance as one of many investment strategies.
Information concerning our competitors is limited as most participants in the legal finance industry either do not publish information publicly or, in the case of multi-strategy firms that engage in legal finance, do not publish information specific to their legal finance strategies. However, despite limited available information regarding our competitors, we believe that we are well-positioned competitively in the legal finance industry. We believe that we are more visible than our competitive set in legal and business publications. For example, according to “share of voice” calculations using Muck Rack, a provider of public relations tracking software, we were featured in over half of the total articles that discussed the legal finance industry and that mentioned other pure play legal finance providers during the year ended December 31, 2024. In addition, according to the interviews conducted in the second quarter of 2023 by an independent researcher commissioned by us, Burford is the most recognized brand in the legal finance industry and is the first or only legal finance provider to be named by the overwhelming majority of law firm and in-house lawyers able to name any legal finance provider in response to the question “With which legal finance providers are you most familiar?”.
Seasonality
While the litigation process is not driven by seasonality by nature, we have historically closed and financed a disproportionate amount of our new business in the fourth quarter, primarily driven by the behavior of our corporate and law firm clients. While realizations have also historically been higher in the fourth quarter, there can be meaningful variation in the timing of the resolution of our legal finance assets, so the timing of realizations may be different in the future, especially if a single large legal finance asset resolves in the first, second or third quarter of a year.
Regulatory and compliance matters
Our operations are subject to regulation and supervision in a number of jurisdictions. The level of regulation and supervision to which we are subject varies from jurisdiction to jurisdiction and is based on the type of activity involved. We, in conjunction with our outside advisors and counsel, seek to manage our operations in compliance with such regulation and supervision. There are a number of legislative and regulatory initiatives in the United States, the United Kingdom and the other jurisdictions in which we operate. The regulatory frameworks applicable to us and our operations are very detailed and technical. Accordingly, the discussion below is general in nature, does not purport to be complete and is current only as of the date of this 2024 Form 10-K.
United States
As a public company in the United States, we are subject to the rules and regulations of the SEC and the listing requirements of the NYSE. As of June 30, 2024, we determined that we no longer qualify as a “foreign private issuer” as defined under the Exchange Act and, as a result, effective as of January 1, 2025, we were no longer eligible to use the rules designed for foreign private issuers and are required to comply with the
reporting regime that applies to most US domestic public companies listed on the NYSE. Furthermore, our disclosure controls and procedures and internal control over financial reporting are documented, tested and assessed for design and operating effectiveness in accordance with the US Sarbanes-Oxley Act of 2002, as amended (the “Sarbanes-Oxley Act”).
BCIM, a wholly owned indirect subsidiary of Burford, serves as the investment adviser to all our private funds and is registered as an investment adviser with the SEC under the Investment Advisers Act. BCIM, as an investment adviser, is subject to the anti-fraud provisions of the Investment Advisers Act and to fiduciary duties derived from these provisions, which apply to our relationships with our advisory clients globally, including the private funds that we manage. These provisions and duties impose restrictions and obligations on us with respect to our dealings with our private fund investors and our legal finance assets, including for example limitations on agency cross and principal transactions between an adviser or its affiliates and advisory clients. BCIM is subject to periodic examinations by the SEC and other requirements under the Investment Advisers Act and related regulations primarily intended to benefit advisory clients. These additional requirements relate, among other things, to maintaining an effective and comprehensive compliance program and code of ethics, conflicts of interests, record-keeping and reporting requirements, advertising and custody requirements, political contributions and disclosure requirements. The Investment Advisers Act generally grants the SEC broad administrative powers, including the power to limit or restrict an investment adviser from conducting advisory activities in the event it fails to comply with federal securities laws. Additional sanctions that may be imposed for failure to comply with applicable requirements include the prohibition of individuals from associating with an investment adviser, the revocation of registrations and other censures and fines.
United Kingdom
The UK Financial Conduct Authority (the “FCA”) and the London Stock Exchange regulate the trading of our ordinary shares on AIM in the United Kingdom. Deutsche Numis (the trading name used by Deutsche Bank AG, Numis Securities Limited and Numis Europe Limited for the combined UK and Ireland corporate finance business) is our nominated adviser under the AIM rules, in which capacity it advises and guides us with respect to our responsibilities and continuing obligations under the rules and regulations of the London Stock Exchange. The FCA also reviews debt prospectuses for our retail bonds traded on the Main Market of the London Stock Exchange. In addition, the FCA regulates our legacy UK insurance business and our UK insurance intermediation business with respect to Burford Worldwide Insurance Limited.
Guernsey
The Guernsey Financial Services Commission regulates our insurance business conducted through Burford Worldwide Insurance Limited, our wholly owned Guernsey insurer. Burford Worldwide Insurance Limited is licensed to carry on international, domestic and general insurance business under the Insurance Business (Bailiwick of Guernsey) Law, 2002 (as amended).
Other laws, rules and regulations
We are also subject to various other laws, rules and regulations, ranging from the UK Bribery Act 2010, as amended, and the US Foreign Corrupt Practices Act of 1977, as amended, to anti-money laundering and know-your-customer regulations in numerous jurisdictions. In addition, we are subject to a range of US and international laws, rules and regulations relating to data privacy and protection, including the California Consumer Privacy Act, the California Privacy Rights Act, the UK General Data Protection Regulation, the UK Data Protection Act 2018, the EU General Data Protection Regulation and the DIFC Data Protection Law No. 5 of 2020.
Legal finance industry
We engage in a constant level of activity around monitoring of, and engagement with, regulatory initiatives relating to the legal finance industry. In the United States, some individual states and individual judicial districts have promulgated rules and regulations concerning matters such as disclosure of legal finance arrangements, and the US Government Accountability Office released a report on the legal finance industry in 2023 and a subsequent report on the patent legal finance industry in 2024. In general, we have not seen any indication that there is any groundswell of support for broad regulation of the legal finance industry, and ongoing discussion tends to focus on subsidiary issues, such as disclosure of the presence of litigation financing. As of the date of this 2024 Form 10-K, there are no new US state or federal regulations aimed at
the commercial legal finance industry, although various US state and federal legislative proposals have been introduced and considered that, if passed, could potentially affect the legal finance industry.
In the United Kingdom, in July 2023, the Supreme Court held in R (PACCAR Inc) v. Competition Appeal Tribunal that litigation funding agreements that entitle funders to payments based on the amount of damages recovered should be classified as damages-based agreements which need to comply with the Damages-Based Agreements Regulations 2013 or risk being deemed unenforceable. In March 2024, the government proposed legislation to restore the law as it existed prior to the decision, however, the legislation failed to pass ahead of the dissolution of Parliament in May 2024. While the new government has expressed support for a legislative fix, there is no legislation pending as of the date of this 2024 Form 10-K. In spring 2024, the then-Lord Chancellor called upon the Civil Justice Council to conduct a review of the litigation funding market, and its final report is due by summer 2025. In the European Union, following the passage of a European Parliamentary resolution in 2022, the European Commission has been conducting a “mapping study” to collect information on the litigation funding market and current practices in member states of the European Union. The results of the study could have an impact on potential future regulation by the European Union.
We are a founding member of the Association of Litigation Funders of England and Wales (“ALF”), an independent organization charged by the UK Ministry of Justice with self-regulation of litigation financing in England and Wales. The ALF’s Code of Conduct sets forth the standards by which all members must abide. We are also a founding member of the International Legal Finance Association (“ILFA”), a non-profit trade association and the only global organization that represents the commercial legal finance sector. ILFA promotes the highest standards of operation and service for the sector, including respecting duties to the courts, avoiding conflicts of interest and preserving confidentiality and legal privilege.
In newer markets, such as Singapore and Hong Kong, authorities have also enacted regulations largely focused on capital adequacy and constraining abusive behavior.
Compliance
Rigorous legal and compliance analysis of our businesses and legal finance arrangements is endemic to our culture and risk management. Our General Counsel supervises our legal and compliance personnel, who are responsible for addressing the regulatory and compliance matters that affect our operations. We strive to maintain a culture of compliance through the use of policies and procedures, including a code of ethics, electronic compliance systems, testing and monitoring, communication of compliance guidance and employee education and training. Our compliance policies and procedures address regulatory and compliance matters, such as the handling of material non-public information, personal securities trading, marketing practices, gifts and entertainment, anti-money laundering, anti-bribery and sanctions, privacy and data security, recordkeeping and potential conflicts of interest. Moreover, we are fundamentally a business run by experienced lawyers, including some who have functioned in senior legal roles in major global businesses. The challenge in many businesses is reining in individuals who take on unacceptable or ill-considered risks, and it is the function of the lawyers to hold those reins. At Burford, we have a business run by people accustomed to that role.
In addition, disclosure controls and procedures and internal control over financial reporting are documented, tested and assessed for design and operating effectiveness in accordance with the Sarbanes-Oxley Act. The internal audit group, which reports directly to the audit committee of the Board of Directors (the “Audit Committee”), operates with a global mandate and is responsible for providing independent assessments whether our network of risk management, control and governance processes is adequate and effective.
Corporate responsibility
We believe that legal finance has a positive social impact and delivers two primary benefits. First, our financing increases access to justice and reinforces and strengthens the rule of law, both fundamental social goods. The global economy and modern society need strong, clear and efficient legal systems in order to function. Our legal finance solutions support these systems and improve them by creating a more level economic playing field in disputes, allocating capital to meritorious legal matters and facilitating access to justice for litigants, including those with meritorious claims for whom the expense of litigating a claim would be unaffordable without the use of third-party financing.
Second, our legal finance helps to increase the efficient allocation of scarce economic resources, another social good. When companies and law firms finance litigation and arbitration with our capital, they preserve their own capital to invest in their businesses where and when doing so will have the greatest benefit, whether that means hiring employees, spending on research and development or simply easing liquidity
pressures that would otherwise harm the enterprise. This benefits our clients, their stakeholders and the broader economy.
We have led the institutionalization of our industry and have adopted corporate responsibility and best practices. The nominating and corporate governance committee of the Board of Directors assists the Board of Directors in its oversight of our management in defining and implementing our strategy relating to ESG matters.
Human capital management
We expend considerable effort towards human capital management, including recruitment of talented individuals, creating an appealing environment and continuing their development once employed. Competitive compensation is certainly an important part of that dynamic, but so too is a collaborative environment and mutual respect. The Management Committee regularly assesses our human capital strategy across each of our global offices, reviews our existing capabilities and performance and identifies any gaps to ensure that resources are appropriately allocated to realize our strategic and operational objectives as well as to support and develop our talent at each employee level.
We are a global company with a highly diverse footprint. As of December 31, 2024, we had a total of 160 full-time employees across our offices in the United States, the United Kingdom, United Arab Emirates, Singapore and other jurisdictions around the world where we do not have formal offices. As of December 31, 2024, our employees included 47 lawyers qualified to practice in the United States, the United Kingdom, Argentina, Australia, Germany, India and Switzerland, as applicable.
The table below sets forth our full-time employees by office location based on the respective office affiliation of such full-time employees as of December 31, 2024.
| | | | | |
| Office location | Number of employees |
| United States | 107 |
| United Kingdom | 41 |
| Rest of the world | 12 |
| Total | 160 |
Compensation and benefits
Our compensation structure is designed to attract and retain qualified employees as well as to incentivize and reward employee performance, and our goal is to provide competitive compensation in the markets where we compete for talent. Our basic compensation principles include, among others:
•Paying market levels of total cash compensation for individual functions that is tied to our overall performance and the performance of our portfolio
•Enabling long-term employees to build equity in our company over time by providing each employee an award of our ordinary shares to align their overall compensation with our long-term performance and growth
•Weighting a more significant proportion of senior- and executive-level employee compensation toward performance-based compensation
In addition, we offer a range of competitive benefits to our eligible employees, including matching contributions to a defined contribution 401(k) retirement plan, contributions to health savings accounts and payments of premiums for life insurance and long-term disability insurance.
Talent development
We are committed to investing in employee learning and development. Our flagship training initiative, Burford University, provides instruction to all employees on topics including client services, company policies, technical tools and industry know-how. We also provide mandatory compliance and data security training and assessment for all employees. Furthermore, we encourage and support our employees in receiving external training to maintain their professional credentials and in seeking opportunities for professional development, including courses and professional certifications, and regularly pay for such training and opportunities.
Health and safety
We are committed to ensuring the health, safety and well-being of our employees in each of our offices worldwide by complying with relevant laws and preventing health and occupational risks. In some of the jurisdictions where we have offices, the health and safety standards we operate may exceed local requirements.
Organizational structure
The chart below sets forth our organizational structure as of December 31, 2024. The chart does not depict all our subsidiaries, including intermediate holding companies through which certain of the subsidiaries depicted are held.
Available information, website and social media disclosure
We are subject to the reporting requirements under the Exchange Act and, accordingly, file certain reports with, and furnish other information to, the SEC. Such reports and other information may be inspected free of charge at a website maintained by the SEC at www.sec.gov.
We maintain a website at www.burfordcapital.com and make available free of charge, on or through the Investor Relations section of our website, our Annual Reports on Form 10-K, Quarterly Reports on Form 10-Q and Current Reports on Form 8-K, and any amendments to these reports filed or furnished pursuant to Section 13(a) or 15(d) of the Exchange Act, as soon as reasonably practicable after such reports are electronically filed with, or furnished to, the SEC.
In addition, we use our website (investors.burfordcapital.com) and social media platforms including LinkedIn (www.linkedin.com/company/burford-capital), X (www.x.com/burfordcapital), Instagram (www.instagram.com/burford_capital) and YouTube (www.youtube.com/c/burfordcapital) as channels of distribution for documents and other information about our company. The documents and other information we make available through these channels may be deemed material. Accordingly, investors should monitor these channels in addition to following our press releases, SEC filings and public conference calls and webcasts. Furthermore, investors may automatically receive email alerts and other information about our company upon submitting a request at the “Investor Email Alerts” section of our website at investors.burfordcapital.com.
The information on, or that can be accessed through, our website, social media and any alerts is not incorporated by reference into, and does not form a part of, this 2024 Form 10-K.
Item 1A. Risk factors
Investing in our securities involves risk. Persons investing in our securities should carefully consider the risks set forth below and the other information contained in this 2024 Form 10-K and our other reports that we file with, or furnish to, the SEC from time to time, including our consolidated financial statements and accompanying notes. Any of the following risks could materially and adversely affect our business, financial condition, results of operations and/or liquidity. Our business, financial condition, results of operations and/or liquidity could also be materially and adversely affected by additional factors that apply to all companies generally as well as other risks that are not currently known to us or that we currently view to be immaterial. In any such case, the trading price of our securities could decline, and you may lose all or part of your investment in our securities. While we may attempt to mitigate known risks to the extent we believe to be practicable and reasonable, we can provide no assurance, and we make no representation, that our mitigation efforts, if any, will be successful. See “Forward-looking statements”, “Business" and "Management's discussion and analysis of financial condition and results of operations" for additional information with respect to certain business, competitive, regulatory, market, economic and other conditions that may materially and adversely affect our business, financial condition, results of operations and/or liquidity.
Summary of risk factors
Risks relating to our business and industry
▪Litigation outcomes are risky and difficult to predict, and a loss in a litigation matter may result in the total loss of our capital associated with that matter.
▪Our revenues, earnings and cash flows can vary materially between periods as both the timing of resolution and the outcome of litigation matters are difficult to predict.
▪Our success depends on our ability to identify and select suitable legal finance assets to finance, and our failure to do so could have a material adverse effect on our business, financial condition, results of operations and/or liquidity.
▪Our business and operations could suffer if we are not able to prevent improper use or disclosure of, or access to, privileged information under our control due to cybersecurity breaches, unauthorized use or theft.
▪The inaccuracy or failure of the probabilistic model and decision science tools, including AI technologies, we use to predict the returns on our legal finance assets and in our operations could have a material adverse effect on our business.
▪The laws relating to privileged information are complex and continue to evolve, and any adverse court rulings, changes in law or other developments could impair our ability to conduct effective due diligence on potential legal finance assets.
▪The due diligence process that we undertake in connection with financing legal finance assets may not reveal all facts that may be relevant in connection with such financing.
▪Investors will not have an opportunity to independently evaluate our legal finance assets.
▪We are subject to credit risk relating to our various legal finance assets that could adversely affect our business, financial condition, results of operations and/or liquidity.
▪Our portfolio may be concentrated in cases likely to have correlated results, and we have a number of assets involving the same counterparty.
▪The lack of liquidity of our legal finance assets may adversely affect our business, financial condition, results of operations and/or liquidity.
▪We have commitments in excess of our available capital.
▪Changes in market conditions may negatively impact our ability to obtain attractive external capital or to refinance our outstanding indebtedness and may increase the cost of such financing or refinancing if it is obtained.
▪We face substantial competition for opportunities with respect to legal finance assets, which could delay commitment and/or deployment of our capital, reduce returns and result in losses.
▪If lawyers who prosecute and/or defend claims which we have financed fail to exercise due skill and care, or the interests of their clients do not align with ours, there may be a material adverse effect on the value of our legal finance assets.
▪We may not earn asset management fees and/or performance fees from our private funds.
▪A significant portion of our AUM is attributable to private funds with a single investor.
▪Negative publicity or public perception of the legal finance industry or us could adversely affect our reputation, business, financial condition, results of operations and/or liquidity.
▪We report our capital provision assets at fair value, which may result in us recognizing non-cash income that may never be realized.
▪Legal, political and economic uncertainty surrounding the effects, severity and duration of public health threats could adversely affect our business, financial condition, results of operations and/or liquidity.
▪Developments in AI technologies could disrupt the markets in which we operate and subject us to increased competition, legal and regulatory risks and compliance costs.
▪Expectations relating to ESG considerations could expose us to potential liabilities, increased costs and reputational harm and adversely affect our business, financial condition, results of operations and/or liquidity.
▪There are inherent uncertainties involved in estimates, judgments and assumptions used in the preparation of our consolidated financial statements.
▪Our past performance may not be indicative of our future results of operations.
▪Litigation and legal proceedings against us could adversely impact our business, financial condition, results of operations and/or liquidity.
▪Our success depends substantially on the continued retention of certain key personnel and our ability to hire and retain qualified personnel in the future to support our growth and execute our business strategies.
▪Our international operations subject us to increased risks.
▪We may face exposure to foreign currency exchange rate fluctuations and may hold unhedged securities positions.
▪The tax treatment of our financing arrangements is subject to significant uncertainty.
▪Changes in tax laws and regulations or unanticipated tax liabilities could affect our effective tax rate, business, financial condition, results of operations and/or liquidity.
Risks relating to regulation
▪The laws, regulations and rules relating to legal finance are evolving and may be uncertain, which may have negative consequences for the value or enforcement of our contractual agreements with our counterparties, our ability to do business in certain jurisdictions or our cost of doing business.
▪Our asset management business is highly regulated, and changes in regulation or regulatory violations could adversely affect our business.
▪We are subject to the risk of being deemed an investment company.
Risks relating to cybersecurity, third-party service providers, information systems and data privacy and protection
▪Cybersecurity risks could result in the loss of data, interruptions in our business or damage to our reputation and subject us to regulatory actions, increased costs and financial losses, any of which could have a material adverse effect on our business, financial condition, results of operations and/or liquidity.
▪Catastrophic events could materially adversely affect our business, financial condition, results of operations and/or liquidity.
▪The failure of our third-party service providers to fulfill their obligations, or misconduct by our third-party service providers, may have a material adverse effect on our business, financial condition, results of operations and/or liquidity.
▪Our operations are dependent on the proper functioning of information systems.
▪We are required to maintain the privacy and security of personal information and comply with applicable data privacy and protection laws and regulations.
Risks relating to our indebtedness
▪We face certain risk relating to our indebtedness and our ability to incur additional indebtedness.
Risks relating to our ordinary shares
▪We face certain risks relating to our ordinary shares, including fluctuations in the trading price and volume of our ordinary shares, lack of assurance that we will pay dividends or distributions on our ordinary shares and declines in the market price of our ordinary shares as a result of future issuances or sales of our securities.
▪We face certain risks relating to the requirements of being a US domestic public company.
▪The material weakness identified in our internal control over financial reporting and the determination that our internal control over financial reporting and disclosure controls and procedures were not effective could impact investors’ views on the reliability of our consolidated financial statements.
Risks relating to our incorporation in Guernsey
▪We face certain risks relating to our incorporation in Guernsey, including differences in rights and protections afforded to our shareholders under Guernsey law, insolvency laws of Guernsey being less favorable than US bankruptcy laws and complexities of effecting service of US court process or enforcement of US judgments.
Risk factors
Risks relating to our business and industry
Litigation outcomes are risky and difficult to predict, and a loss in a litigation matter may result in the total loss of our capital associated with that matter.
It is difficult to predict the outcome of litigation, particularly complex commercial litigation of the type in which we specialize. We typically advance capital to our counterparties on a non-recourse basis and are therefore entirely dependent on a positive, cash-generative outcome in the underlying litigation matter in order to recover our principal and earn a return. If our counterparty is unsuccessful in the underlying litigation matter, if the damages awarded in favor of our counterparty are less than we expect or if it is not possible to successfully enforce a favorable judgment, we could suffer a variety of adverse consequences, including the total loss of our deployed capital and, in some jurisdictions, liability for the adverse costs of the successful party to the litigation. In addition, to the extent we have provided insurance coverage in respect of adverse cost risk in the matter, a loss resulting from an adverse outcome would be compounded with additional adverse cost loss. Unfavorable outcomes in litigation matters we have financed could, individually or in the aggregate, have a material adverse effect on our business, financial condition, results of operations and/or liquidity.
Our revenues, earnings and cash flows can vary materially between periods as both the timing of resolution and the outcome of litigation matters are difficult to predict.
Our revenues, earnings and cash flows can vary materially from period to period due to the nature of our business, including the fact that litigation matters often take many years to resolve and the processes involved are subject to change and uncertainty. We are unable to control the progress and resolution of most of our assets because their timing depends upon parties working through the legal systems in various jurisdictions. As a result, the timelines for our receipt of any potential return on our assets and the related cash inflows can be long and are difficult to predict. Events or conditions that have not been anticipated may occur and may have a significant effect on the outcome or process of a litigation matter, which may reduce the actual rate of return on an asset. Moreover, the substantive or procedural law relevant to the litigation matters brought by our counterparties may change after we have committed capital. The time, complexity and expense involved in collecting returns on our assets, including the enforcement of judgments and the release of funds held in escrow pending the resolution of a litigation matter, also affect our cash flows. All these factors contribute to potentially significant volatility in our financial performance and the trading price of our securities. In addition, we cannot assure you that we will generate cash flows from the returns on our assets in an amount sufficient to enable us to meet all our obligations or to fund our working capital, asset and other business needs.
Our success depends on our ability to identify and select suitable legal finance assets to finance, and our failure to do so could have a material adverse effect on our business, financial condition, results of operations and/or liquidity.
Our success depends on our ability to identify and select legal finance assets that will be successful and pay returns, which in turn depends upon the management, conclusion and realization of suitable financing opportunities. The Commitments Committee is primarily responsible for approving the opportunities that have been identified for us to finance. There can be no assurance that we will be successful in sourcing suitable legal finance assets in a timely manner or at all or in sourcing a sufficient number of suitable legal finance assets to finance that meet our diversification, underwriting and other requirements. Our ability to select such legal finance assets depends on the availability of desirable financing opportunities, which is subject to market conditions, client demand, pricing, competition and other factors outside our control, including changes in regulations in various jurisdictions in which we operate and limitations on our ability to adequately investigate the merits of the matter or parties involved, among other things. A failure by us to identify and select suitable legal finance assets to finance could have a material adverse effect on our business, financial condition, results of operations and/or liquidity.
Our business and operations could suffer if we are not able to prevent improper use or disclosure of, or access to, privileged information under our control due to cybersecurity breaches, unauthorized use or theft.
We obtain privileged information as part of our analysis of potential legal finance assets and as part of our ongoing asset monitoring. When we receive privileged information, we are under a strict obligation to protect it. Among other things, this obligation requires us to tightly restrict access to the privileged information itself.
As described under “—Risks relating to cybersecurity, third-party service providers, information systems and data privacy and protection—Cybersecurity risks could result in the loss of data, interruptions in our business or damage to our reputation and subject us to regulatory actions, increased costs and financial losses, any of which could have a material adverse effect on our business, financial condition, results of operations and/or liquidity”, attempts to gain unauthorized access to our information systems have become increasingly sophisticated over time, and our efforts to detect and investigate all security incidents and to prevent their recurrence may be unsuccessful. In addition to the risk of a breach of confidentiality due to a cybersecurity incident, privileged information could be compromised in other ways. Although we have implemented controls to protect privileged information, there can be no assurance that such controls will be effective. If our employees, third-party service providers or counterparties engage in misconduct or fail to follow appropriate security measures, the improper release or use of privileged information could result.
The improper use or disclosure of, or access to, our intellectual property or litigation or business strategy or those of our clients due to a cybersecurity breach, unauthorized use or theft could harm our competitive position, reduce the value of our capital provision assets and have a negative impact on our reputation or otherwise adversely affect our business, financial condition, results of operations and/or liquidity. In addition, if the courts were to find that we have improperly used or disclosed privileged information, there could be significant adverse consequences for the litigant, and we could be subject to complaints or lawsuits for damages or regulatory action as a result.
The inaccuracy or failure of the probabilistic model and decision science tools, including AI technologies, we use to predict the returns on our legal finance assets and in our operations could have a material adverse effect on our business.
We use internally developed probabilistic modeling and other decision science tools in our operations, including AI technologies, to assist us in underwriting and pricing potential legal finance assets, evaluating the expected lifetime returns on our legal finance assets and managing capital and liquidity. At the time we enter into a contract to finance a legal finance asset, however, we are likely to have imperfect information about the litigation matter in question and the likely future outcome. In addition, our historical information about cases or portfolios of cases may not be indicative of the characteristics of subsequent cases or portfolios of cases within the same industry or with comparable other characteristics, and our internal databases and external statistical data may not be as extensive as needed for comprehensive decision science. We disclose aggregate calculations derived from our probabilistic modeling of individual matters and our portfolio as a whole. The inherent volatility and unpredictability of legal finance assets precludes forecasting and limits the predictive nature of our probabilistic model. Furthermore, the inherent nature of the probabilistic model is that actual results will differ from the modeled results, and such differences could
be material. If the probabilistic model and decision science tools we use are inaccurate or fail, including to accurately evaluate and predict the returns on our legal finance assets, there could be a material adverse effect on our business, financial condition, results of operations and/or liquidity. See “—Developments in AI technologies could disrupt the markets in which we operate and subject us to increased competition, legal and regulatory risks and compliance costs” for additional information with respect to various risks associated with our use of AI technologies in our operations.
The laws relating to privileged information are complex and continue to evolve, and any adverse court rulings, changes in law or other developments could impair our ability to conduct effective due diligence on potential legal finance assets.
To make informed financing decisions, we often need access to information beyond that which is publicly available about a litigation matter and regularly seek and obtain privileged information, which is information that is protected from disclosure due to the application of a legal privilege or other doctrine, including attorney work product, depending on the laws of the relevant jurisdiction. Such privileged information can lose its protection and become accessible to a litigation opponent if it is used publicly (a concept called “waiver”), which could have significant adverse consequences for the litigant. The laws relating to privileged information are complex and continue to evolve, and we could be adversely affected by court rulings, changes in law or other developments. If a court in a particular jurisdiction were to find that disclosure to legal finance providers effected a waiver of applicable legal privileges, our access to such privileged information could become constrained in that jurisdiction. Any significant limitations on our ability to access such privileged information could adversely affect our ability to conduct due diligence and make informed financing decisions with respect to certain legal finance assets.
The due diligence process that we undertake in connection with financing legal finance assets may not reveal all facts that may be relevant in connection with such financing.
Before offering to finance legal finance assets on specified economic and other terms, we conduct due diligence based on the facts and circumstances applicable to the matter that may be the subject of such financing. As part of our due diligence, we may be required to evaluate important and complex business, financial, tax, accounting, technological, environmental, social, governance, ethical, political, legal and regulatory issues. When conducting due diligence and making an assessment regarding financing a legal finance asset, we rely on the information available to us, including information provided by the parties involved in the case we intend to finance. We have no control over the accuracy or sufficiency of information received from such third parties and, in some cases, we have limited experience or no prior dealings with such third parties and are unable to assess their integrity.
The due diligence investigation that we carry out with respect to any financing opportunity may not reveal or highlight all relevant facts (including, among others, bribery, fraud or other illegal activities) or risks that would be helpful in evaluating such opportunity. Particularly where we finance a case that is at an early stage, such as before the conclusion of the fact discovery stage in a US litigation, we may have limited ability to ascertain the facts that may have a material impact on the outcome of the litigation. In addition, although we regularly perform factual and legal research beyond what is provided to us by our prospective counterparties, we may underestimate the importance of a legal or factual risk of financing an asset that ends up being conclusive. There are also material factors that contribute to the outcome of financing a legal finance asset that are impossible to research or predict at the outset, such as a judge’s or jury’s positive or negative disposition towards a particular party, witness or lawyer.
Further, we may not identify or foresee future developments that could have a material adverse effect on our returns on a legal finance asset, such as the credit risk from our counterparty or from a party in a case. For example, we may not uncover the risk associated with poor management of general finances or the litigation itself by a counterparty or other party, any insolvency risk or potential key-person risk from a counterparty or other party or a misalignment of economic incentives between us and a counterparty because of the economics of our financing and developments in the litigation. In addition, financial fraud or other deceptive practices, failures by personnel at our counterparties to comply with anti-bribery, trade or economic sanctions or other legal and regulatory requirements or our counterparties being or becoming subject to trade or economic sanctions could cause significant legal, reputational and business harm to us.
Poor returns on our legal finance assets due to shortcomings or failures in our due diligence process or unforeseen developments could adversely affect our reputation and could materially and adversely affect our business, financial condition, results of operations and/or liquidity.
Investors will not have an opportunity to independently evaluate our legal finance assets.
We generally do not disclose details of our existing or prospective legal finance assets (including their valuations for accounting purposes) on an individual basis because of restrictions applicable to privileged information and other relevant restrictions. As a result, investors will not have an opportunity to evaluate our legal finance assets and will be dependent upon our judgment and ability in selecting, managing and valuing our assets.
We are subject to credit risk relating to our various legal finance assets that could adversely affect our business, financial condition, results of operations and/or liquidity.
Prior to the conclusion of a litigation matter, we are subject to the risk that a claimant who is our counterparty, a party against whom our counterparty is making a claim, a law firm, an insurance company or another relevant party will encounter financial difficulties or become insolvent, which could delay or prevent the litigation matter from being resolved and could adversely affect our ability to earn a return on the relevant legal finance asset. On becoming contractually entitled to proceeds after the conclusion of a litigation matter, depending on the structure of the particular legal finance asset, we could be a creditor of, or otherwise subject to credit risk from, a claimant, a party against whom our counterparty is making a claim, a law firm, an insurance company or another relevant party. Moreover, we may be indirectly subject to credit risk to the extent a defendant does not pay a claimant immediately, notwithstanding successful adjudication of a claim in the claimant’s favor. If the defendant is unable or unwilling to pay or perform or if any of the parties challenges the judgment or award, we may encounter difficulties in collection. Furthermore, although we occasionally procure judgment preservation insurance to protect judgments and awards, such insurance policies may not provide full protection for several reasons, including because the circumstance of a loss was not covered by the insurance policy. Finally, in addition to the credit risk associated with individual parties to a litigation matter, losses due to the credit exposures inherent in our business could adversely affect our business, financial condition, results of operations and/or liquidity.
Our portfolio may be concentrated in cases likely to have correlated results, and we have a number of assets involving the same counterparty.
Our portfolio includes certain related exposures where we have financed multiple different counterparties in relation to the same or very similar claims, such that outcomes on these related exposures are likely to be correlated. We estimate that the fair value of the assets underlying our largest correlated exposure (excluding the YPF-related assets) represented approximately 6% and 8% of the consolidated fair value of capital provision assets as of December 31, 2024 and 2023, respectively, and approximately 5% and 7% of the capital provision assets in the Principal Finance segment as of December 31, 2024 and 2023, respectively. An adverse litigation outcome in respect of any of these individual claims may result in, or increase the likelihood of, losses on the other related claims.
In addition, we have several assets involving the same counterparty. See “Management's discussion and analysis of financial condition and results of operations—Segments—Principal Finance segment—Portfolio concentrations” for information with respect to our portfolio concentrations with a law firm and a corporate client. Accordingly, although our direct financial exposure to such law firm and/or corporate client is limited to matters in which such law firm or corporate client, as applicable, is our counterparty, if such law firm or corporate client were to encounter financial difficulties, dissolve or suffer a substantial loss of personnel, there could be a material adverse effect on our business, financial condition, results of operations and/or liquidity. Furthermore, we may enter into legal finance arrangements and hold legal finance assets with law firms that provide advice on transactions for which we or one of our counterparties is an underlying claimant, which may increase our direct or indirect overall exposure to the underlying claim.
Our exposure to cases likely to have correlated results or counterparty concentration could lead to increased volatility and could materially and adversely affect our business, financial condition, results of operations and/or liquidity.
The lack of liquidity of our legal finance assets may adversely affect our business, financial condition, results of operations and/or liquidity.
Our legal finance assets typically require significant advances of capital with no guarantee of return or repayment. It may be difficult or impossible to find willing buyers for these assets at prices we believe are representative of their underlying value or at all. Volatility in markets also could negatively impact the liquidity of our legal finance assets. Illiquid assets typically experience greater price volatility as a ready market does not exist and therefore they can be more difficult to value. In addition, the prices prospective buyers are willing to pay for illiquid assets may be more subjective than the prices for more liquid assets.
The illiquidity of legal finance assets also is exacerbated by the fact that third parties may be limited in their ability to value these assets because they cannot perform full legal due diligence on an underlying matter due to the limitations imposed by applicable legal privileges and protections. The illiquidity of our legal finance assets may make it difficult for us to sell such assets if the need or desire arises. If we are required to liquidate all or a portion of our portfolio quickly, we may realize significantly less than the value at which we have previously recorded our legal finance assets in our consolidated financial statements. As a result, our ability to change the makeup of our portfolio of legal finance assets in response to changes in economic and other conditions may be relatively limited, which could adversely affect our business, financial condition, results of operations and/or liquidity.
We have commitments in excess of our available capital.
We typically have commitments to finance legal finance assets that exceed our available capital. We seek to manage our available capital and our portfolio to minimize the risk of a mismatch between the timing of when our commitments will be drawn and available cash, and many of our capital provision agreements set forth timetables for draws or structure draws with reference to case events, which provides us with some control over the timing and amounts of capital we provide in respect of our commitments. However, as we do not control the timing of developments in the matters that we finance, it is possible that such a mismatch will occur, in which case we would need either to raise additional capital (which could include the potential sale of an interest in one or more of our existing legal finance assets) or to decline to meet a commitment. There can be no assurance that we will be able to raise capital on reasonable terms or at all, and our inability to do so could cause damage to our business and the potential loss of business and financial relationships. A failure by us to deploy capital on our definitive commitments may result in adverse consequences to our business such as a loss of entitlement to any returns with respect to such definitive commitments, a loss of capital we have already deployed or a claim by a counterparty for damages. Some of our private funds also have commitments in excess of capital available and, accordingly, have some of the foregoing risks.
Changes in market conditions may negatively impact our ability to obtain attractive external capital or to refinance our outstanding indebtedness and may increase the cost of such financing or refinancing if it is obtained.
Our strategy includes raising external capital to finance the growth of our business. If market conditions were to restrict our access to external capital, our growth prospects could be adversely affected, especially if cases resolve at a significantly slower than expected pace or if we are unable to attract new business due to the market conditions. In addition, to the extent that conditions in the credit markets impair our ability to refinance or extend maturities on our outstanding indebtedness, either on favorable terms or at all, our performance may be negatively impacted and may result in our inability to repay debt at maturity or pay interest when due. Any of the above factors, individually or in the aggregate, could adversely affect our growth prospects, business, financial condition, results of operations and/or liquidity.
We face substantial competition for opportunities with respect to legal finance assets, which could delay commitment and/or deployment of our capital, reduce returns and result in losses.
Competition for attractive opportunities with respect to legal finance assets may affect our ability to finance on terms that we consider attractive. We compete to finance assets primarily with pure-play legal finance companies and multi-strategy firms that engage in legal finance as one of many investment strategies. Our competitors may have advantages relative to us that could include access to financial resources, technical capabilities, relationships, lower cost of capital, access to financing sources unavailable to us, smaller and more flexible businesses or alternative financial arrangements that are more effective or less susceptible to challenges than ours. Developments in and adoption of big data analytics and AI technologies by our competitors may negatively affect our returns if their technical capabilities outpace our own. In addition, some of our competitors may have higher risk tolerances, lower return expectations or different risk assessments than we have. Any of these factors could allow our competitors to consider a wider variety of legal finance assets, establish more relationships, offer better pricing and/or provide more flexible transaction structures. In addition to the pure-play legal finance companies and multi-strategy firms that engage in legal finance, we may also face competition from smaller industry participants or law firms using alternative financing models, insurance companies that may offer products to claimants and their counsel, as well as market entrants that have a regional-, industry- or specific claims-based approach and may offer more competitive terms or more tailored approaches. Furthermore, our ability to compete effectively in our businesses will depend on our ability to attract new qualified personnel and consultants and retain and
motivate our existing personnel and consultants. We may lose financing opportunities if we do not match our competitors’ pricing, terms, structure and/or quality of service. If we are forced to match our competitors’ pricing, terms, structure and/or quality of service to commit and/or deploy our capital, we may not be able to achieve acceptable returns on our legal finance assets or may bear substantial risk of capital loss.
If lawyers who prosecute and/or defend claims which we have financed fail to exercise due skill and care, or the interests of their clients do not align with ours, there may be a material adverse effect on the value of our legal finance assets.
We are particularly reliant on lawyers to prosecute and/or defend claims which we have financed with due skill and care. If they are unable or unwilling to do this for any reason, it is likely to have a material adverse effect on the value of our legal finance assets. We typically evaluate the lawyers involved in any legal finance asset we underwrite, but we do not select such lawyers and/or we may have limited or no experience with such lawyers, and there can be no assurance that the outcome of a case will be in line with our or the lawyers’ assessment of the case or that such lawyers will perform with the expected skill and care. As a matter of legal ethics, in most jurisdictions, we are also unable to prevent our counterparties from discharging the lawyers who were originally in place in a case and replacing them with lawyers who may be less capable.
In addition, lawyers owe a duty to their clients as well as an overriding duty to the courts. We generally do not own or control a claim that we have financed and, as a result, we will not be the client of the law firm representing the claimant in a case that is the subject of our commitment or financing. Accordingly, that law firm may be required to act in accordance with its client’s instructions and interests rather than our own. If the interests of the claimants in the cases we have financed are not aligned with ours, the actions of the lawyers representing such claimants could have a material adverse effect on the value of our legal finance assets and, therefore, our business, financial condition, results of operations and/or liquidity.
We may not earn asset management fees and/or performance fees from our private funds.
Our income from our asset management business derives from fees earned from our management of our private funds and performance fees or carried interest with respect to those private funds. If the commitments we make on behalf of our private funds perform poorly, we may not earn performance fees. Further, if a private fund does not achieve certain returns over its life and carried interest that was previously distributed to us exceeds the amounts to which we are ultimately entitled, we may be required to repay such amounts under a “clawback” obligation. Moreover, to the extent we have deployed capital from our balance sheet in our private funds, we could experience losses on our own principal as a result of poor performance by our private funds or individual assets.
In addition, the asset management business is highly competitive and, if investors determine that our product offerings are not attractive or if the commitments we make on behalf of our private funds perform poorly, we may have difficulty securing additional investments in our existing private funds in the future. In order to attract capital, we may be required to structure investments for our private funds on terms that are less favorable to us or otherwise different from the terms that we have been able to obtain in the past. These risks could occur for reasons beyond our control, including general economic or market conditions, regulatory changes or increased competition. Our inability to maintain our asset management business could deter future investments in our private funds or cause investors to demand lower fees, resulting in a decrease in AUM, management fees and/or performance fees, in which case our business, financial condition, results of operations and/or liquidity may be adversely affected.
A significant portion of our AUM is attributable to private funds with a single investor.
As of December 31, 2024 and 2023, BOF-C and one of our “sidecar” funds, both funds with a single investor which is a sovereign wealth fund, represented approximately 31% and 30%, respectively, of our AUM. While the sovereign wealth fund is contractually obligated to advance capital on its commitments to such private funds, if it fails to do so we will no longer have access to this capital and our cash flows from these private funds will decline. This could result in our inability to meet a commitment, which in turn could cause damage and potential loss to our business and financial relationships. See “—We have commitments in excess of our available capital”.
Negative publicity or public perception of the legal finance industry or us could adversely affect our reputation, business, financial condition, results of operations and/or liquidity.
Negative publicity about the legal finance industry in general or us specifically, even if inaccurate, could adversely affect our reputation and the confidence in our business model. For example, there is regular negative political and media activity in the United States with respect to the US consumer litigation finance industry. Although we do not participate in the US consumer litigation finance industry, negative publicity about that industry could adversely affect the public perception of the commercial legal finance industry or lead to overly broad regulation of legal finance in general. See “—Risks relating to regulation—The laws, regulations and rules relating to legal finance are evolving and may be uncertain, which may have negative consequences for the value or enforcement of our contractual agreements with our counterparties, our ability to do business in certain jurisdictions or our cost of doing business” for additional information with respect to the risks relating to regulation.
Failure to protect our reputation and brand in the face of negative publicity and ethical, legal or moral challenges could lead to a loss of trust and confidence. There are various factors that may cause litigants, law firms and other actual and potential clients to be more reluctant to pursue external financing, such as stories in online, print and broadcast media about us or the legal finance industry, including real or perceived abusive practices or regulatory investigations or enforcement actions in the legal finance industry. Online articles, blogs and social media posts may lead to the increasingly rapid dissemination of a story and increase our exposure to negative publicity. Alternatively, our employees may knowingly or inadvertently damage our reputation or our brand by using digital or social media platforms in ways that may not be aligned with our digital or social media strategy. Negative publicity relating to legal or regulatory violations by any of the third parties we engage, or negative publicity relating to the kind of matters we pursue, could also result in reputational damage. Our success in maintaining and enhancing our reputation and brand depends on our ability to adapt to this rapidly changing media environment. Adverse publicity or negative commentary from any media outlets could damage our reputation, require us to expend substantial resources to remedy the damage or reduce the demand for our products and services, any of which could adversely affect our business, financial condition, results of operations and/or liquidity.
Negative publicity could jeopardize our relationships with existing clients, our ability to establish new relationships or our attractiveness to clients generally. Any of the foregoing could impact our ability to advance capital on our commitments, pursue our legal rights or collect amounts due to us and may materially and adversely affect our business, financial condition, results of operations and/or liquidity.
We report our capital provision assets at fair value, which may result in us recognizing non-cash income that may never be realized.
Our capital provision assets are classified as financial instruments and are accounted for at fair value in the consolidated statements of operations in accordance with US GAAP. See note 2 (Summary of significant accounting policies—Fair value of financial instruments), note 5 (Capital provision assets) and note 14 (Fair value of assets and liabilities) to our consolidated financial statements contained in this 2024 Form 10-K and “Management's discussion and analysis of financial condition and results of operations—Results of operations and financial condition—Fair value of capital provision assets” for additional information with respect to our valuation policy and fair value of our capital provision assets. In addition to using a discounted cash flow model that can be sensitive to changes in interest rates, duration and other traditional valuation factors, the valuation policy assigns an updated risk adjustment, in prescribed percentages, to the forecasted cash inflows based on the type of case (e.g., commercial litigation or patent), geography and case milestone. As a result, when there is an objective event in the underlying litigation that would cause a change in fair value, we reflect the positive or negative impact of such objective event through a fair value adjustment. Due to the illiquid nature of our capital provision assets, there is inherent valuation uncertainty in the assessment of fair value, and our valuation methodologies require us to make significant and complex judgments about legal and other matters that are intrinsically difficult to predict. As such, there is a risk that a case underlying one of our capital provision assets could experience a negative event even after a positive event that had previously resulted in a fair value adjustment in accordance with our valuation policy. This later event, in turn, could lower the value of such capital provision asset in our consolidated statements of financial condition and negatively impact related fair value adjustments recognized in our consolidated statements of operations in future periods. Certain of our individual assets represent a significant portion of the fair value of our capital provision assets. We have one set of exposures on the YPF-related assets that accounted for approximately 42% and 41% of the fair value of our capital provision assets as of December 31, 2024 and 2023, respectively. The fair value of
the YPF-related assets (both Petersen and Eton Park combined) on our consolidated statements of financial condition was $2.2 billion and $2.1 billion as of December 31, 2024 and 2023, respectively, with unrealized gains of $2.1 billion and $2.0 billion as of December 31, 2024 and 2023, respectively. See “Management's discussion and analysis of financial condition and results of operations—Results of operations and financial condition—Fair value of capital provision assets—Fair value of YPF-related assets” for additional information with respect to the YPF-related assets.
Accordingly, the application of fair value accounting to our capital provision assets may result in us recognizing non-cash income that may never be realized, which could have a material adverse effect on our business, financial condition, results of operations and/or liquidity.
Legal, political and economic uncertainty surrounding the effects, severity and duration of public health threats could adversely affect our business, financial condition, results of operations and/or liquidity.
Legal, political and economic uncertainty surrounding the effects, severity and duration of public health threats could adversely affect our business, financial condition, results of operations and/or liquidity. For example, the Covid-19 pandemic adversely affected the global economy, disrupted global supply chains and created significant volatility in the financial markets. In addition, the Covid-19 pandemic disrupted the operation of courts around the world, causing delays in, and elongation of the life of, a number of our existing matters and slowdowns in new litigation activity. In turn, this resulted in lower cash proceeds from litigation resolutions in affected periods as courts around the world worked through these issues.
In addition, in a period of constrained liquidity, litigation opponents may be less willing to settle litigation matters, extending the duration of our legal finance assets and therefore restricting our ability to recycle capital. There is also an increased risk that litigation opponents may encounter financial difficulties or become insolvent, which could impact the timing and quantum of realizations on our legal finance assets. To the extent that litigation opponents in our legal finance assets do become insolvent, the impact of their insolvency on pending litigation is difficult to predict as it is not only case specific but dependent on the insolvency process in the relevant jurisdiction. Our expected realizations may be delayed and could be reduced during the restructuring or liquidation process.
The counterparties to whom we provide capital may also encounter financial difficulties or become insolvent in a period of constrained liquidity. We typically provide capital to our counterparties on a non-recourse basis and receive a return only upon the successful conclusion of a claim. If our counterparties encounter financial difficulties or become insolvent before the final resolution of their claims and are otherwise unable or unwilling to continue with their claims, we may decide to advance additional capital to them on terms that are less favorable to us. If we decide not to advance additional capital to such counterparties, it is possible that they will not be able to pursue their claims and we may therefore not earn any returns from such counterparties.
While it is not possible to ascertain the precise impact that public health threats may have on us from an economic, financial or regulatory perspective, individually or in the aggregate, public health threats could have a material adverse effect on our business, financial condition, results of operations and/or liquidity.
Developments in AI technologies could disrupt the markets in which we operate and subject us to increased competition, legal and regulatory risks and compliance costs.
In the legal finance industry as in other industries, developments in AI technologies are rapidly evolving and uncertain in relation to their current and potential future applications, cybersecurity and privacy and data protection and the legal and regulatory frameworks within which they operate. The use of AI technologies in the legal finance industry business remains in its infancy, though we believe that ongoing development could continue to grow in benefit for our business, including by augmenting and enhancing our origination and underwriting. The legal industry in general and our business in particular have made increasing use of technological innovations over the past decade. We believe that we are well positioned relative to current market players or potential market entrants in the use of AI technologies in legal finance given our extensive database of dispute economics and outcomes. However, as AI technologies become further integrated into our business, the full extent of current or future risks related to AI technologies cannot be predicted. AI technologies could significantly disrupt the markets in which we operate and subject us to increased competition, legal and regulatory risks, reputational harm and compliance costs, which could have a material adverse effect on our business, financial condition, results of operations and/or liquidity.
We intend to avail ourselves of the potential benefits, insights and efficiencies offered by the use of AI technologies, which present possible risks that cannot be fully mitigated. Data in models that AI technologies
utilize may contain a degree of inaccuracy and error, which could result in flawed algorithms. This could reduce the effectiveness of AI technologies and adversely impact us and our operations to the extent we rely on the work product of such AI technologies in such operations. As is the case with any tool with which we share our data, there is also a risk that AI technologies may be misused or misappropriated by our employees and/or third parties engaged by us. For example, a user may input confidential information, including material nonpublic information or personally identifiable information, into AI technology applications, resulting in such information becoming part of a dataset that is accessible by third-party AI technology applications and users, including our competitors. Such actions could subject us to legal and regulatory investigations and/or actions. Furthermore, we may not be able to control how third-party AI technologies that we choose to use are developed or maintained or how data we input is used or disclosed, even where we have sought contractual protections with respect to these matters. The misuse or misappropriation of our data could have an adverse impact on our reputation and could subject us to legal and regulatory investigations and/or actions. In addition, should we communicate externally our development and use of AI technologies, we risk being accused of making inaccurate or misleading statements regarding our ability to avail ourselves of the potential benefits of AI technologies.
Regulations related to AI technologies may also impose on us certain obligations and costs related to monitoring and compliance. For example, in April 2023, the Federal Trade Commission, the US Department of Justice, the Consumer Financial Protection Bureau and the US Equal Employment Opportunity Commission released a joint statement on AI technologies demonstrating interest in monitoring the development and use of automated systems and enforcement of their respective laws and regulations. In October 2023, then-President Biden signed an executive order that established new standards for AI safety and security. In addition to the regulatory framework in the United States, the European Union is in the process of introducing a new regulation applicable to certain AI technologies and the data used to train, test and deploy them, which, if enacted, could impose significant requirements on both the providers and deployers of AI technologies.
Expectations relating to ESG considerations could expose us to potential liabilities, increased costs and reputational harm and adversely affect our business, financial condition, results of operations and/or liquidity.
Companies across industries face increasing scrutiny from clients, regulators, investors and other stakeholders related to their ESG practices and disclosures, and governments and regulators as well as investor advocacy groups, investment funds and influential investors are also increasingly focused on these issues, especially as they relate to the environment, health and safety, diversity, equity, inclusion, labor conditions and human and civil rights. Further, there is increased public awareness and concern regarding global climate change. As a result, our ESG practices or disclosure or the ESG practices or disclosure of any parties to whom we provide capital may be damaging to our business. In addition, increasing governmental and societal attention to ESG matters, including expanding mandatory and voluntary reporting, and disclosure topics such as climate change, sustainability, natural resources, waste reduction, energy, human capital and risk oversight, could expand the nature, scope and complexity of matters that we are required to control, assess and report. There are also increasingly competing views about these areas in different jurisdictions and it may prove to be difficult or impossible to reconcile those views in a way that is satisfactory to all stakeholders. Any failure or perceived failure to adhere to our public statements, comply with ESG laws and regulations or meet evolving and varied stakeholder expectations and standards could result in sales of our securities and declines in their market price, which could impact our ability to access capital markets and could in turn have a material adverse effect on our business, financial condition, results of operations and/or liquidity.
There are inherent uncertainties involved in estimates, judgments and assumptions used in the preparation of our consolidated financial statements.
The preparation of our consolidated financial statements requires us to make estimates, judgments and assumptions that affect the application of policies and the reported amounts of assets and liabilities, income and expenses. Estimates, judgments and assumptions are inherently subject to change in the future, and any such changes in these estimates, judgments or assumptions, including any changes due to modifications of accounting principles and guidance or their interpretation, could result in corresponding changes to the amounts of assets and liabilities, income and expenses and therefore unfavorable accounting charges or effects. Any errors or misstatements in our consolidated financial statements could have a material adverse effect on our business, financial condition, results of operations and/or liquidity.
Our past performance may not be indicative of our future results of operations.
Our past performance should not be considered indicative of our future results of operations. Our past returns have benefited from financing opportunities and general market conditions that may not continue or recur, and there can be no assurance that we or our private funds will be able to avail ourselves of comparable conditions. As the legal finance market matures, we may be subject to increased competition for talent and financing opportunities, and we may face new regulations in various jurisdictions. There can be no assurance that any of the current or future legal finance assets will eventually be successful. Failure to achieve results of operations consistent with our historical performance could have a material adverse effect on our business, financial condition, results of operations and/or liquidity.
Litigation and legal proceedings against us could adversely impact our business, financial condition, results of operations and/or liquidity.
We are regularly subject to litigation and arbitration incidental to our business, including tactical litigation against us in the context of an ongoing legal finance asset. The types of claims made against us in lawsuits include claims for compensatory damages, punitive and consequential damages or injunctive relief. When we finance cases against sovereigns, there is the further risk of retaliatory criminal investigation or prosecution, and we have been the subject of such actions in the past. In general, purported securities class action litigation has been instituted against companies following periods of volatility in the overall market and in the price of a company’s securities, and we have previously been the subject of one purported class action litigation of this nature. Although that litigation was withdrawn, we may be subject to similar litigation in the future, which may divert management’s attention and cause us to incur significant expenses defending these lawsuits, even if they are unsuccessful. Any insurance or indemnification rights we have may be insufficient or unavailable to protect us against losses. Any of these developments could materially adversely affect our business, financial condition, results of operations and/or liquidity.
Our success depends substantially on the continued retention of certain key personnel and our ability to hire and retain qualified personnel in the future to support our growth and execute our business strategies.
Our performance largely depends upon the judgment and abilities of our management, including, in particular, our co-founders, Chief Executive Officer Christopher Bogart and Chief Investment Officer Jonathan Molot. We also rely on other key personnel, including the members of the Management Committee and the Commitments Committee. Our success is therefore contingent upon our ability to retain certain members of our management and other key personnel and to compensate them appropriately and competitively relative to the major law firms from which they have typically come and the potential pressures on such compensation levels from the public markets. The death, incapacity or loss of service of any of our management or other key personnel could have a material adverse impact on our business. In addition, our performance may be limited by our ability to employ and retain sufficiently qualified personnel and consultants. Such a failure to retain qualified personnel or consultants or recruit suitable replacements for significant numbers of qualified personnel or consultants could materially adversely affect our business and growth prospects.
Our international operations subject us to increased risks.
We operate internationally and, accordingly, our business is subject to risks resulting from differing legal and regulatory requirements, political, social and economic conditions and unforeseeable developments in a variety of jurisdictions. Our non-US operations are subject to the following risks, among others:
▪Political instability
▪International hostilities, military actions (including the Ukraine War and the conflict in Israel and Gaza), international terrorist or cyber-terrorist activities and infrastructure disruptions
▪Differing economic cycles and adverse economic conditions
▪Unexpected changes in regulatory and tax environments and government interference in the economy
▪Changes to trade and economic sanctions laws and regulations
▪Foreign exchange controls and restrictions on repatriation of capital
▪Fluctuations in currency exchange rates
▪Inability to collect payments or seek recourse under, or comply with, ambiguous or vague commercial or other laws
▪Difficulties in attracting and retaining qualified management and/or personnel
▪Difficulties in penetrating new markets due to entrenched competitors or lack of local acceptance of our services
Our overall success as a global business depends, in part, on our ability to anticipate and effectively manage these risks, and there can be no assurance that we will be able to do so without incurring unexpected costs. If we are not able to manage the risks related to our non-US operations, our business, financial condition, results of operations and/or liquidity may be materially adversely affected.
The change in the US government to the Trump administration has resulted in uncertainty regarding potential changes in regulations, fiscal policy, social programs, domestic and foreign relations and international trade policies. Further, anti-American sentiment could harm the reputation and success of US companies doing business abroad. Our ability to respond to these developments or comply with any resulting new legal or regulatory requirements, including those involving economic sanctions, could increase our costs of doing business, reduce our financial flexibility and otherwise have material adverse effect on our business, financial condition, results of operations and/or liquidity.
We may face exposure to foreign currency exchange rate fluctuations and may hold unhedged securities positions.
One of our five series of debt securities outstanding as of the date of this 2024 Form 10-K is denominated in pound sterling, and some of our legal finance contracts and intercompany loans are denominated in local currencies. Fluctuations in the value of the US dollar and foreign currencies, particularly pound sterling, may affect our results of operations when translated into US dollars. We do not currently engage in any currency-hedging activities to seek to limit the risk of exchange rate fluctuations. However, in the future, we may use derivative instruments, such as foreign currency forward and option contracts, to seek to hedge certain exposures to fluctuations in foreign currency exchange rates. The use of such hedging activities may not offset any or more than a portion of the adverse financial effects of unfavorable movements in foreign exchange rates over the limited time the hedges are in place. Moreover, the use of hedging instruments may introduce additional risks if we are unable to structure effective hedges.
In addition, we may from time to time take substantial positions in the securities of companies that are subject to a corporate or regulatory event or to litigation. While we may seek to hedge these positions, appropriate hedging may not be available at a cost we consider reasonable or at all. If the value of the underlying securities was to decline, we would experience losses, which may have a materially adverse effect on our business, financial condition, results of operations and/or liquidity.
The tax treatment of our financing arrangements is subject to significant uncertainty.
We structure our financings on a case-by-case basis in consultation with our professional advisers and seek to comply with applicable law. However, there is limited authority and significant uncertainty regarding the tax treatment of legal finance and/or the structures through which we provide our financings in the applicable taxing jurisdictions in which they are made. Accordingly, there can be no assurance that an applicable taxing authority will accept our position on the tax treatment of a particular financing arrangement or the structures we employ. If an applicable tax authority was to successfully maintain a different position, the value of our assets could be adversely affected, we could be subject to additional tax liability or both. In addition, tax laws and regulations are under constant development and often subject to change as a result of government policy or case law developments, frequently with retroactive effect, and such changes in applicable tax laws could adversely affect the taxation of us or our assets.
Changes in tax laws and regulations or unanticipated tax liabilities could affect our effective tax rate, business, financial condition, results of operations and/or liquidity.
The global nature of our business operations and counterparties subjects us to taxation in the United States and numerous foreign jurisdictions. Due to economic and political conditions, tax rates in various jurisdictions may be subject to significant change. Our future effective tax rates could be affected by changes in the mix of earnings in countries with differing statutory tax rates, changes in the valuation of deferred tax assets and liabilities or changes in tax laws and regulations or their interpretation.
The Organization for Economic Co-operation and Development (the “OECD”) has introduced a framework to implement a global minimum tax of 15% for certain multinational companies (referred to as “Pillar Two”). During the course of the year ended December 31, 2024, Guernsey and certain countries in which we historically report a portion of our earnings have enacted tax legislation consistent with the Pillar Two mandate. Pillar Two taxes are considered an alternative minimum tax accounted for as a period cost that will impact the effective tax rate in the year the Pillar Two tax obligation arises. Therefore, deferred taxes will not be recognized or adjusted for the estimated effects of future minimum taxes. Importantly, Pillar Two tax obligation only arises as of the tax year following a period after a multinational enterprise has earned annual consolidated revenues of at least €750 million in at least two out of the prior four accounting periods.
Based on our annual consolidated total revenues over the past several years, we are not subject to the Pillar Two mandate as of the date of this 2024 Form 10-K. Notwithstanding this fact, we have assessed the potential impact of Pillar Two based on laws enacted as of the date of this 2024 Form 10-K, and there was no material effect on our current effective tax rate, business, financial condition, results of operations and/or liquidity for the year ended December 31, 2024. In addition, based on this assessment and the prospective nature of the effective date of the application of the Pillar Two rules, we also do not currently anticipate any material effect on our effective tax rate, business, financial condition, results of operations and/or liquidity for the year ending December 31, 2025. Our analysis and monitoring of the Pillar Two mandate is ongoing as the OECD continues to release additional guidance and countries continue to enact and implement legislation. To the extent additional legislative changes take place in the countries in which we currently operate or report earnings, it is possible that these changes may result in an adverse impact on our future overall effective tax rate, business, financial condition, results of operations and/or liquidity.
Risks relating to regulation
The regulatory and legal requirements that apply to our business and operations are subject to periodic change and may become more restrictive, which may make compliance with applicable requirements more difficult, expensive or otherwise restrict our ability to conduct our business and operations as they are now conducted. Changes in applicable regulatory and legal requirements, including changes in their enforcement, could materially and adversely affect our business, financial condition, results of operations and/or liquidity. As a matter of public policy, the regulatory bodies that regulate our business and operations are generally responsible for safeguarding the integrity of the securities and financial markets and protecting private fund investors who participate in those markets rather than protecting the interests of our shareholders.
The laws, regulations and rules relating to legal finance are evolving and may be uncertain, which may have negative consequences for the value or enforcement of our contractual agreements with our counterparties, our ability to do business in certain jurisdictions or our cost of doing business.
The laws, regulations and rules pertaining to the acquisition of or taking of a financial position or a commercial interest in legal claims and defenses is evolving and can be complex and uncertain in the United States and elsewhere. Our legal finance assets could be open to challenge, reduced in value or extinguished following changes in laws, rules or regulations. In various jurisdictions, there are prohibitions or restrictions in connection with financing claims (known in many common law jurisdictions as maintenance, and a form of maintenance, called champerty) or the assignment of, or other economic participation in, legal claims. For example, in the State of New York, Judiciary Law § 489 prohibits the assignment of a legal claim in certain circumstances, and certain other jurisdictions have similar laws. In the State of New York, the relevant case law provides as of the date of this 2024 Form 10-K that the contracts underlying our legal finance assets are valid. However, such case law may be overruled or the statutory and other laws in the State of New York or other jurisdictions could be amended to include additional prohibitions or restrictions, which may adversely affect our business. The ability to participate financially in a lawyer’s fees is also limited in certain jurisdictions (including by ethical rules prohibiting a lawyer from sharing fees with non-lawyers). Such prohibitions and restrictions are governed by the laws, regulations and rules of each relevant jurisdiction and vary in degrees of strength and enforcement in different state, federal or non-US jurisdictions. This is a complex issue that involves both substantive law and choice of law principles. However, in many jurisdictions, the relevant issues may not have been considered by the courts or addressed by statute, and thus obtaining legal advice or clarity is difficult. If we, our counterparties or the lawyers handling the matters underlying our legal finance assets were to be found to have violated prohibitions or restrictions in connection with these matters, there could be a materially adverse effect on the value of the affected legal finance assets, our ability to enforce the relevant contractual agreements with our counterparties and our recoveries from such matters, including our costs.
In addition, politicians, advocacy groups and media reports have, in the past, advocated action to restrict legal finance. Some jurisdictions have enacted or are considering enacting laws, regulations or rules requiring the disclosure of litigation financing or other non-prohibitory regulation. Such laws, regulations or rules or other future laws, regulations or rules may deter parties from engaging us, result in a reduction in the overall number of potential legal finance assets and/or adversely affect the value of legal finance assets already in existence in such jurisdictions.
The laws, regulations, rules and supervisory guidance and policies applicable to our business activities are subject to regular modification and change, including by institutions such as US state and federal legislatures, bar associations, courts and other US and non-US legislative, regulatory, judicial or advisory bodies. For example, in the United States, legislation has been introduced in the US Congress in multiple sessions that would require litigants to “produce for inspection and copying” any legal financing agreements creating contingent rights to payment in class actions and multidistrict litigations. Such legislation has not received consideration beyond introduction, but we expect that the same or similar legislation will be introduced again in the future. In addition, similar legislation is introduced in various US state legislatures from time to time. In addition, some newer entrants to the market, such as Singapore and Hong Kong, have also enacted regulatory regimes largely focused on capital adequacy and constraining abusive behavior. Further, recent case law in the United Kingdom held that certain litigation financing arrangements where the litigation finance provider is entitled to a percentage of any damages recovered are unenforceable if they do not comply with relevant legal requirements.
Changes to laws, regulations or rules, including changes in interpretation or implementation of laws, regulations or rules, could affect us in substantial and unpredictable ways. Such changes could subject us to additional costs, delay new financing arrangements, limit the quantity and size of our financing arrangements, limit the types of products and services we may offer or our financing opportunities, decrease returns on our legal finance or other assets and allow certain clients to void our contracts with them. Any of these developments may have a materially adverse effect on our business, financial condition, results of operations and/or liquidity.
Our asset management business is highly regulated, and changes in regulation or regulatory violations could adversely affect our business.
Our asset management business is highly regulated, and the applicable regulations are subject to change. Compliance with these regulations requires a significant investment of management and financial resources, and any liability imposed on us for violations of existing or future regulations could adversely affect our asset management business. The SEC regulates our investment management activities and is empowered to conduct investigations and administrative proceedings that can potentially result in fines, suspensions of personnel, changes in policies, procedures or disclosure or other sanctions, including censure, the issuance of cease-and-desist orders, the suspension or expulsion of an investment adviser from registration or memberships or the commencement of a civil or criminal lawsuit against us or our personnel. Any SEC actions or initiatives against us could have an adverse effect on our business, financial condition, results of operations and/or liquidity. Regardless of whether an investigation or proceeding resulted in a sanction or of the monetary size of any sanction imposed against us or our personnel, the adverse publicity relating to the investigation, proceeding or imposition of these sanctions could harm our reputation.
The SEC adopted amendments to existing rules under the Investment Advisers Act that will impact our asset management business. The first amended rule relates to the Form PF, which is a regulatory filing made to the SEC by investment advisers to private funds. The second amended rule imposes several new privacy-related protections for consumers of financial institutions, which includes investment advisers. In addition, the US Department of Treasury’s Financial Crimes Enforcement Network adopted a final rule that will require investment advisers to implement an anti-money laundering program. The amended rules will likely require investment of additional management and financial resources and otherwise have an impact on our asset management business, which may have an adverse effect on our business, financial condition, results of operations and/or liquidity.
We are subject to the risk of being deemed an investment company.
If we were deemed an “investment company” under the US Investment Company Act of 1940, as amended (the “Investment Company Act”), applicable restrictions could make it impractical for us to continue our business as contemplated and could have a material adverse effect on our business. An entity will generally be deemed to be an “investment company” for purposes of the Investment Company Act if (i) it is or holds itself out as being engaged primarily, or proposes to engage primarily, in the business of investing,
reinvesting or trading in securities (frequently referred to as an “orthodox” investment company) or (ii) absent an applicable exemption, it owns or proposes to acquire investment securities having a value exceeding 40% of the value of its total assets (exclusive of US government securities and cash items) on an unconsolidated basis (frequently referred to as an “inadvertent” investment company). Excluded from the term “investment securities”, among others, are US federal government securities and securities issued by majority-owned subsidiaries that are not themselves investment companies and are not relying on the exception from the definition of investment company set forth in Section 3(c)(1) or Section 3(c)(7) of the Investment Company Act.
We are and hold ourselves out as a leading global finance and asset management firm focused on law. We believe that, even if our legal finance assets were to be determined to constitute investment securities for purposes of the Investment Company Act, we should be exempt from registration as an investment company under Section 3(c)(5) of the Investment Company Act. Section 3(c)(5) of the Investment Company Act excludes from the definition of investment company “[a]ny person who is not engaged in the business of issuing redeemable securities, face-amount certificates of the installment type or periodic payment plan certificates, and who is primarily engaged in one or more of the following businesses: (A) [p]urchasing or otherwise acquiring notes, drafts, acceptances, open accounts receivable, and other obligations representing part or all of the sales price of merchandise, insurance, and services or (B) making loans to manufacturers, wholesalers, and retailers of, and to prospective purchasers of, specified merchandise, insurance, and services”. We and our subsidiaries that conduct our legal finance business are not in the business of issuing redeemable securities, face-amount certificates of the installment type or periodic payment plan certificates and are primarily engaged in the business of legal finance by way of financing and acquiring notes evidencing financing, for purposes of the Investment Company Act, to parties engaged in litigation or arbitration and their law firms. The purpose of such financing is to provide the counterparties with the capital necessary to finance the costs associated with litigation.
The Investment Company Act and the rules thereunder contain detailed parameters for the organization and operation of investment companies. Among others, the Investment Company Act and the rules thereunder limit or prohibit transactions with affiliates, impose limitations on the issuance of debt and equity securities, generally prohibit the issuance of options and impose certain governance requirements. We conduct our operations so that we will not be deemed an investment company under the Investment Company Act, which requires us to conduct our business in a manner that does not subject us to the registration and other requirements of the Investment Company Act. If we are deemed to be an investment company under the Investment Company Act, requirements imposed by the Investment Company Act, including limitations on our capital structure, ability to transact business with affiliates and ability to compensate key employees, could make it impractical for us to continue our business as currently conducted, impair the agreements and arrangements between and among us and our clients and materially adversely affect our business, financial condition, results of operations and/or liquidity.
Risks relating to cybersecurity, third-party service providers, information systems and data privacy and protection
Cybersecurity risks could result in the loss of data, interruptions in our business or damage to our reputation and subject us to regulatory actions, increased costs and financial losses, any of which could have a material adverse effect on our business, financial condition, results of operations and/or liquidity.
Our information systems may fail to operate properly or become disabled as a result of tampering or a breach of our network security systems or otherwise, or as a result of tampering or a breach of our third parties’ network security systems. In addition, our information systems and those of our third parties face ongoing cybersecurity threats and cyberattacks. Cyberattacks on our information systems and those of our third parties could involve, and in the past have involved, attempts to obtain unauthorized access to our proprietary information, destroy data or disable, degrade or sabotage our systems, or divert or otherwise steal funds, including through the introduction of computer viruses, “phishing” attempts and other forms of social engineering. Cyberattacks and other security threats could originate from a wide variety of external sources, including cyber criminals, nation state hackers, hacktivists and other outside parties. Cyberattacks and other security threats could also originate from the malicious or accidental acts of insiders, such as employees. In addition, there is an increased risk that we may experience cybersecurity-related incidents as a result of our employees, third-party service providers or other third parties working remotely on less secure systems and environments. Recent developments in the threat landscape that have heightened cybersecurity risk include use of AI technologies, as well as an increased number of cyber extortion and ransomware
attacks, with higher financial ransom demand amounts and increasing sophistication and variety of ransomware techniques and methodology. Increasing socioeconomic and political instability in some countries has further heightened these risks. Retaliatory acts by foreign governments in response to Western sanctions could include cyberattacks that could directly or indirectly impact our business. We face increased frequency and sophistication of cybersecurity threats, with cyberattacks ranging from those common to businesses generally to those that are more advanced and persistent and that may target us and our third parties because we hold significant privileged information about our legal finance assets. As a result, we and our third parties may face a heightened risk of a cybersecurity incident or disruption with respect to such privileged information. While we take significant efforts to protect our information systems and information, including establishing internal processes and implementing technological measures designed to provide multiple layers of security, our safety and security measures might be insufficient to prevent damage to, or interruption or breach of, our information systems, data (including personal data), and operations, especially because cyberattack techniques change frequently or are not recognized until successful. If our systems or those of our third parties are compromised, do not operate properly or are disabled, or if we fail to provide the appropriate regulatory or other notifications in a timely manner, we could suffer financial loss, a disruption of our business, liability to our shareholders and/or private funds and private fund investors, regulatory intervention or reputational damage. Furthermore, if we fail to comply with relevant laws, rules and regulations, it could result in regulatory investigations and penalties, which could lead to negative publicity and reputational harm and may cause our shareholders and/or private fund investors and counterparties to lose confidence in the effectiveness of our security measures.
Catastrophic events could materially adversely affect our business, financial condition, results of operations and/or liquidity.
A disruption or failure of our systems or operations in the event of a major earthquake, weather event (including those caused or exacerbated by the effects of climate change), fire, explosion, failure to contain hazardous materials, cyber-attack, terrorist attack, public health crisis, pandemic or other catastrophic event could cause delays in providing our products and services or performing other critical functions and operations. A catastrophic event that results in the destruction or disruption of any of our critical functions or operations, or of the capacity, reliability or security of our information technology systems, could harm our ability to conduct normal business operations, as well as expose us to claims, litigation and governmental investigations and fines.
Public health emergencies have in the past affected and may in the future adversely affect workforces, economies and financial markets globally, leading to an economic downturn. We remain focused on protecting the health and well-being of our employees while assuring the continuity of our business operations.
We may also face threats to our physical security, including to our facilities and the safety and well-being of our employees. In addition to the potential catastrophic events described above, these threats could involve insider threats, workplace violence or civil unrest, any of which could cause delays or other impacts that could adversely affect us and our ability to conduct our business operations. Our third-party partners and counterparties face similar risks that, if realized, could also adversely impact our business operations. We could also incur unanticipated costs to remediate such delays or other impacts.
If our backup and mitigation plans are not sufficient to minimize business disruptions, our business, financial condition, results of operations and/or liquidity could be adversely affected. We continuously monitor our operations and intend to take appropriate actions to mitigate the risks arising from catastrophic events, but there can be no assurances that we will be successful in doing so.
The failure of our third-party service providers to fulfill their obligations, or misconduct by our third-party service providers, may have a material adverse effect on our business, financial condition, results of operations and/or liquidity.
We depend on third-party service providers for, among other things, fund administration and provision of a variety of corporate services to manage our multi-jurisdictional structure. There can be no assurance that our internal controls and procedures will be effective in monitoring and managing such third-party service providers. The failure of our third-party service providers to fulfill their obligations to us, or misconduct by our third-party service providers, could disrupt our operations and lead to reputational harm, which may have a material adverse effect on our business, financial condition, results of operations and/or liquidity.
Our operations are dependent on the proper functioning of information systems.
We rely on our information systems or those of our third parties to conduct our business, including case management and documentation, producing financial and management reports on a timely basis, maintaining accurate records and utilizing AI technologies. Our information technology processes and information systems or those of our third parties may not operate as expected, may not fulfil their intended purpose or may be damaged or interrupted by increases in usage, human error, unauthorized access, natural or man-made hazards or disasters or similarly disruptive events. Any disruption or failure of our information systems or those of our third parties, including a disruption or failure involving electronic communications or other services used by us or our third-party service providers or affecting our cloud services providers, could lead to costs and disruptions that could adversely affect our reputation, prospects, business, financial condition, results of operations and/or liquidity.
Information systems are susceptible to malfunctions and interruptions (including those due to equipment damage, power outages, computer viruses, natural or man-made hazards or disasters and a range of other hardware, software and network problems). A significant malfunction or interruption of one or more of our information systems, or those of our third parties, could adversely affect our ability to keep our operations running efficiently and affect service availability. In addition, it is possible that a malfunction of our data system security measures could enable unauthorized persons to access sensitive data, including information relating to our intellectual property or litigation or business strategy or those of our clients. Any such malfunction or disruptions could cause economic losses. A failure of our information systems, or those of our third parties, could also cause damage to our reputation which could harm our business. Any of these developments, alone or in combination, could have a material adverse effect on our business, financial condition, results of operations and/or liquidity.
We are required to maintain the privacy and security of personal information and comply with applicable data privacy and protection laws and regulations.
We collect, store and process personal information about individuals, including employees, contractors and third-party service providers as well as suppliers, agents, clients, investors and counterparties. This information is increasingly subject to a range of international data privacy and protection laws and regulations, including the California Consumer Privacy Act, the California Privacy Rights Act, the UK General Data Protection Regulation, the UK Data Protection Act 2018, the Data Protection (Bailiwick of Guernsey) Law, 2017, the EU General Data Protection Regulation and the DIFC Data Protection Law No. 5 of 2020. Additional data privacy and protection laws and regulations may come into effect in the United States on a state-by-state basis or worldwide that could potentially impact our business. While we have invested and continue to invest resources to comply with data privacy and protection laws and regulations, many of these laws and regulations are new, complex and subject to interpretation. To maintain compliance with these laws and regulations, we may incur increased costs to continually evaluate and modify our policies and processes and to adapt to new legal and regulatory requirements. A failure to comply with data privacy and protection laws and regulations could result in negative publicity, damage to our reputation, regulatory investigations, penalties or significant legal liability. Furthermore, our business and operations could also be adversely affected if legislation or regulations are expanded to require changes in our business practices or if governing jurisdictions interpret or implement their legislation or regulations in ways that negatively affect our business.
Risks relating to our indebtedness
We may not be able to generate sufficient cash to service our indebtedness and may be forced to take other actions to meet our obligations under our indebtedness, which may not be successful.
We have significant debt service obligations. Our ability to make principal or interest payments when due on our indebtedness and to fund our ongoing operations will depend on our future performance and our ability to generate cash, which is subject to general economic, financial, competitive, legislative, legal, regulatory and other factors, many of which are beyond our control. In addition, our cash flows largely depend on the outcome of litigation matters to which we have made a capital commitment. Such outcomes are inherently uncertain, and it is difficult to accurately forecast our cash flows for any future period. While the interest payment dates on our debt obligations are fixed, the cash inflows from litigation matters fluctuate materially. In addition, the trust deeds and the indentures governing our indebtedness contain various covenants, including the requirement to maintain a certain leverage ratio in the case of the trust deeds. If we are unable to comply with these covenants, payment on our indebtedness may become due early. If we
do not have sufficient cash at the required time, we may have difficulty meeting our payment obligations under our existing indebtedness.
At the maturity of the obligations under our outstanding indebtedness and any other indebtedness that we may incur in the future, if we do not have sufficient cash flows from operations and other capital resources to pay our debt obligations or to fund our other liquidity needs, or if we are otherwise restricted from doing so due to corporate, tax or contractual limitations, we may be required to refinance our indebtedness. If we are unable to refinance all or a portion of our indebtedness or obtain such refinancing on terms acceptable to us, we may be forced to reduce or delay our business obligations, activities or capital expenditures, sell assets, raise additional debt or equity financing in amounts that could be substantial or restructure or refinance all or a portion of our indebtedness, on or before maturity. There can be no assurance that we would be able to accomplish any of these alternatives on a timely basis or on satisfactory terms, if at all, or that those actions would secure sufficient capital to meet our obligations under our indebtedness.
In particular, our ability to restructure or refinance our indebtedness will depend in part on our financial condition at the time of restructuring or refinancing as well as on many factors outside our control, including then prevailing conditions in the international credit and capital markets. Any refinancing of our indebtedness could be at higher interest rates than our existing indebtedness and may require us to comply with more onerous covenants. The terms of our existing or future indebtedness may restrict us from adopting some of these alternatives. In addition, any failure to make payments of interest or principal on our outstanding indebtedness on a timely basis would likely result in a reduction of our credit rating, which could harm our ability to incur additional indebtedness.
Despite our level of indebtedness, we may be able to incur substantial additional indebtedness, which could further exacerbate the risks associated with our existing indebtedness.
Despite our level of indebtedness, we may be able to incur substantial additional indebtedness in the future. Although the agreements governing our indebtedness contain restrictions on the incurrence of additional indebtedness, these restrictions are subject to a number of significant qualifications and exceptions and, under certain circumstances, the amount of indebtedness that could be incurred in compliance with these restrictions could be substantial. If additional indebtedness is added to our existing levels of indebtedness, the related risks that we now face would increase, and we may not be able to meet all the obligations under our existing indebtedness. In addition, our debt instruments do not prevent us from incurring obligations that do not constitute indebtedness.
Risks relating to our ordinary shares
Our ordinary shares are traded on more than one market, which may result in price and volume variations.
Our ordinary shares have traded on the NYSE since October 2020 and on AIM since 2009. Trading in our ordinary shares on these markets takes place in different currencies (US dollar on the NYSE and pound sterling on AIM) and at different times (resulting from different time zones, different trading days and different public holidays in the United States and the United Kingdom). The trading prices, volatility and liquidity of our ordinary shares on these two markets may differ due to these and other factors, including different custody and settlement arrangements that may affect cross-market trading. Any decrease in the price of our ordinary shares on AIM could cause a decrease in the trading price of our ordinary shares on the NYSE, and vice versa. Investors could seek to sell or buy our ordinary shares to take advantage of any price differences between the markets through a practice referred to as arbitrage. Any arbitrage activity could create unexpected volatility in the trading price of our ordinary shares.
The trading price of our ordinary shares may fluctuate significantly.
The market price of our ordinary shares has been highly volatile. For example, the market price of our ordinary shares has ranged on AIM from a high of £18.70 per ordinary share on March 14, 2019 (approximately $24.84 using the exchange rate of $1.3282 on March 14, 2019) to a low of £2.81 per ordinary share on March 18, 2020 (approximately $3.31 using the exchange rate of $1.1763 on March 18, 2020). The market price of our ordinary shares on the NYSE and AIM could continue to be volatile due to the risks set forth in this 2024 Form 10-K and others beyond our control, including:
▪Regulatory actions or changes in laws with respect to legal finance or practices commonly used in the legal finance industry
▪Actual or anticipated fluctuations in our financial condition and/or results of operations
▪Increased competition and actual or anticipated changes in our growth rate relative to our competitors
▪Announcements by us or our competitors of significant acquisitions, strategic partnerships, joint ventures, collaborations or capital commitments
▪Failure to meet or exceed financial estimates and projections of the investment community or that we provide to the public
▪Issuance of research reports by securities analysts or other members of the financial community
▪Fluctuations in the valuation of companies perceived by investors to be comparable to us
▪Additions or departures of key management
▪Sales or issuances of our ordinary shares by us, insiders or other shareholders
▪General economic and market conditions
These and other market and industry factors may cause the market price and demand for our ordinary shares to fluctuate significantly regardless of our actual operating performance. In addition, the trading market for our ordinary shares is affected by the research and reports that equity research analysts publish about us and our business, over which we have no control. The price of our ordinary shares could fluctuate significantly if one or more equity analysts issue unfavorable commentary or cease publishing reports about us.
There can be no assurance that we will pay dividends or distributions.
The Board of Directors has declared a final cash dividend for the year ended December 31, 2024 of 6.25¢ (US cents) per ordinary share, payable on June 13, 2025, subject to shareholder approval at our upcoming annual general meeting in May 2025. In the past, the Board of Directors did not declare a cash dividend on a number of occasions, and we cannot provide assurance that we will declare dividends or distributions in the future. The declaration and payment of dividends and distributions, if any, will always be subject to the discretion of the Board of Directors and the requirements of Guernsey law (including, among others, satisfaction of a statutory solvency test). The timing and amount of any dividends or distributions declared will depend on, among other things, our cash flows from operations and available liquidity, our earnings and financial condition and any applicable contractual restrictions, including restrictions in the instruments governing our debt securities.
Given the demand for our capital and the tax inefficiency of dividend payments to certain shareholders, we anticipate continuing to pay a total annual dividend of 12.50¢ (US cents) per ordinary share, payable semi-annually, but do not anticipate regular increases in our dividend per ordinary share level. However, the Board of Directors may review our dividend per ordinary share level from time to time.
In addition, we are a holding company with no material assets, other than the ownership of our subsidiaries, and no independent means of generating revenues. Accordingly, our ability to pay dividends or distributions will be subject to the ability of our subsidiaries to transfer funds to us.
Future issuances or sales of our securities may cause the market price of our ordinary shares to decline.
The market price of our ordinary shares could decline as a result of issuances of securities (including our ordinary shares) by us or sales by our existing shareholders of ordinary shares in the market, or the perception that such issuances or sales could occur. Sales of our ordinary shares by shareholders may make it more difficult for us to sell equity securities at a time and price that we deem appropriate. See note 18 (Share-based and deferred compensation) to our consolidated financial statements contained in this 2024 Form 10-K for information with respect to our ordinary shares issued, and available for future grants, under the LTIP. Issuances or sales of substantial numbers of our ordinary shares, or the perception that such issuances or sales could occur, may adversely affect the market price of our ordinary shares. The requirements of being a US domestic public company require significant resources and management attention, which increases our legal and financial compliance costs and could affect our ability to attract and retain key personnel and qualified senior management and members of the Board of Directors.
We are subject to the reporting requirements of the Exchange Act, the Sarbanes-Oxley Act, the Dodd-Frank Wall Street Reform and Consumer Protection Act of 2010, as amended, the listing requirements of the NYSE and other applicable securities rules and regulations. In addition, as of June 30, 2024, we determined that
we no longer qualify as a “foreign private issuer” as defined under the Exchange Act. As a result, effective as of January 1, 2025, we were no longer eligible to use the rules designed for foreign private issuers and are required to comply with the reporting regime that applies to US domestic public companies. In particular, we are required to file with the SEC periodic and current reports and registration statements on US domestic public company forms, which are generally more detailed and extensive than the forms available to foreign private issuers, are required to be filed within shorter time periods and are required to comply with, among other things, US proxy requirements and Regulation FD. In addition, our officers, directors and principal shareholders are subject to the beneficial ownership reporting and short-swing profit recovery requirements under Section 16 of the Exchange Act. We are also no longer eligible to rely upon exemptions from corporate governance requirements that are available to foreign private issuers or to benefit from other accommodations for foreign private issuers under the rules of the SEC or the NYSE, as applicable, and have modified certain of our policies to comply with good governance practices applicable to US domestic public companies.
Compliance with these rules and regulations has increased and, following our loss of the foreign private issuer status has further increased, our legal and financial compliance costs, making certain activities more difficult, time-consuming and costly and increasing demand on our systems and resources. As a result of the complexity involved in complying with the rules and regulations applicable to US domestic public companies, our management’s attention may be diverted from other business concerns, which could adversely affect our reputation, prospects, business, financial condition, results of operations and/or liquidity. These factors could also make it more difficult for us to attract and retain qualified senior management and members of the Board of Directors.
In addition, changing laws, regulations and standards relating to corporate governance, ESG matters and public disclosure are creating uncertainty for US domestic public companies, increasing legal and financial compliance costs and making certain activities more difficult, time-consuming and costly. These laws, regulations and standards are subject to varying interpretations, in many cases due to their lack of specificity and, as a result, their application in practice may evolve over time as new guidance is provided by regulatory and governing bodies. This could result in continuing uncertainty regarding compliance matters and higher costs necessitated by ongoing revisions to disclosure and governance practices. If our efforts to comply with new laws, regulations and standards differ from the activities intended by regulatory or governing bodies due to ambiguities related to their application and practice, regulatory and governing bodies may initiate legal proceedings against us, which could have a material adverse effect our business, financial condition, results of operations and/or liquidity.
Furthermore, we expect the Trump administration will seek to implement a regulatory and legislative reform agenda that is significantly different than that of the Biden administration. We expect there will be changes in the rule-making and enforcement priorities of certain federal agencies as well as potential significant developments in jurisprudence. The evolving regulatory and legal environment and uncertainty about the timing and scope of future laws, judicial decisions, regulations and policies may contribute to decisions we may make with respect to our operations, whereas adverse developments affecting the general economic climate could have a material adverse effect our business, financial condition, results of operations and/or liquidity.
The material weakness identified in our internal control over financial reporting and the determination that our internal control over financial reporting and disclosure controls and procedures were not effective could impact investors’ views on the reliability of our consolidated financial statements, resulting in loss of investor confidence, shareholder litigation or adverse regulatory consequences, any of which could cause the market value of our ordinary shares or debt securities to decline or impact our ability to access the capital markets.
The SEC rules implementing Section 404(a) of the Sarbanes-Oxley Act require a company subject to the reporting requirements of the Exchange Act to complete a comprehensive evaluation of its internal control over financial reporting. To comply with these rules, we are required to assess, document and test our internal control procedures, and our management is required to assess and issue a report concerning our internal control over financial reporting. We also maintain disclosure controls and procedures that are designed, among other things, to ensure that information required to be disclosed in the reports we file or furnish under the Exchange Act is recorded, processed, summarized and reported within the time periods specified in the SEC’s rules and forms and that such information is accumulated and communicated to management, including our Chief Executive Officer and Chief Financial Officer, as appropriate to allow timely decisions regarding required disclosure. In addition, we are subject to the independent auditor
attestation requirements under Section 404(b) of the Sarbanes-Oxley Act, pursuant to which our independent auditor is required to attest to and report on management’s assessment of our internal control over financial reporting.
Under the PCAOB auditing standards applicable to us as a reporting company under the Exchange Act, a “material weakness” is a deficiency, or a combination of deficiencies, in internal control over financial reporting, such that there is a reasonable possibility that a material misstatement of our consolidated financial statements will not be prevented or detected on a timely basis.
As disclosed under “Controls and procedures”, a material weakness existed in our internal control over financial reporting as of December 31, 2024 as we have not yet fully remediated the material weakness in internal control over financial reporting previously disclosed in the Company’s annual report on Form 20-F for the year ended December 31, 2023 filed with the SEC on March 28, 2024 (the “2023 Form 20-F”) relating to a lack of available evidence to demonstrate the precision of our management’s review of the process to determine certain assumptions used in the measurement of the fair value of our capital provision assets. Furthermore, as previously disclosed in the 2023 Form 20-F, we revised our approach to determining the fair value of our capital provision assets in consideration of Accounting Standards Codification Topic 820—Fair Value Measurement (“ASC 820”). In connection with this revision in approach, our management determined, together with the Audit Committee, that our historical approach to fair value accounting did not comply with US GAAP and resulted in measurement errors requiring restatement of our historical audited consolidated financial statements as of and for the years ended December 31, 2021, 2020 and 2019 and the unaudited condensed consolidated financial statements for the six months ended June 30, 2022. Under the PCAOB auditing standards, a restatement of financial statements is by definition evidence of a material weakness in internal controls. Thus, in connection with the identified material weakness in our internal control over financial reporting that failed to prevent or detect the identified misstatements requiring the restatement of our consolidated financial statements, we concluded that our internal control over financial reporting and disclosure controls and procedures were not effective as of December 31, 2022 and 2021.
There can be no assurance that the material weakness discussed above will be remediated on a timely basis or at all, or that additional material weaknesses will not be identified in the future. If we are unable to remediate the material weakness, if additional material weaknesses are identified in the future or if we are unable to successfully remediate any future material weaknesses or other deficiencies in our internal control over financial reporting or disclosure controls and procedures, our ability to record, process and report financial information accurately and to prepare consolidated financial statements within the time periods specified by the rules and regulations of the SEC could be adversely affected. This could in turn subject us to shareholder litigation or adverse regulatory consequences, including sanctions by the SEC or violations of the applicable listing rules of the NYSE, which may result in a breach of the covenants under our existing or future debt instruments. In addition, any failure to implement and maintain effective internal control over financial reporting could adversely affect the results of periodic management evaluations and the independent registered public accounting firm’s annual attestation reports regarding the effectiveness of our internal control over financial reporting. There could also be a negative reaction in the financial markets due to a loss of investor confidence in us and the reliability of our consolidated financial statements, which could have a material adverse effect on our business, financial condition, results of operations and/or liquidity, lead to a decline in the market price of our ordinary shares or debt securities or impact our ability to access capital markets.
If we are classified as a PFIC for US federal income tax purposes, such classification could result in adverse US federal income tax consequences to US investors.
If we are treated as a passive foreign investment company (“PFIC”) in any year during which a US Holder holds our ordinary shares, such US Holder could be subject to significant adverse US federal income tax consequences as a result of the ownership and disposition of our ordinary shares. See “Market for registrant's common equity, related stockholder matters and issuer purchases of equity securities—Tax considerations—Material US federal income tax considerations” for additional information with respect to PFIC classification and consequences to US federal income tax consequences to US investors.
Risks relating to our incorporation in Guernsey
The rights and protections of our shareholders are governed by Guernsey law, which may differ in certain material respects from the rights and protections of shareholders under US law.
The rights and protections of our shareholders are governed principally by our memorandum of incorporation and articles of incorporation and by the Companies (Guernsey) Law, 2008, as amended (the “Guernsey Companies Law”). The Guernsey Companies Law differs in certain material respects from laws applicable to companies organized under the laws of the United States. As a result, the rights and protections of our shareholders may differ in certain material respects from the rights and protections of shareholders of companies organized under the laws of the United States. See exhibit 4.1 to this 2024 Form 10-K for additional information with respect to the differences between the rights and protections of our shareholders and those of shareholders of companies organized under the laws of the United States.
The Royal Court of Guernsey may require a party to litigation to reimburse the prevailing party for its costs associated with the litigation, and our articles of incorporation entitle us to require shareholders to provide security against any such costs awarded to us by the Royal Court of Guernsey.
The Royal Court of Guernsey may require a party to litigation to reimburse the prevailing party for its costs associated with the litigation. Accordingly, if a shareholder was to bring an action against us in the Royal Court of Guernsey and we prevail in the litigation, the Royal Court of Guernsey may order the shareholder to reimburse us for our fees, costs and expenses incurred in connection with the defense of such action.
Article 38 of our articles of incorporation provides that we are entitled to security for costs in connection with any proceedings brought against us by a shareholder (which may include proceedings in jurisdictions outside Guernsey). This provision, for example, applies to any proceeding brought against us by a shareholder in its capacity as a shareholder under the Guernsey Companies Law or our articles of incorporation. Article 38 of our articles of incorporation does not apply to any proceeding brought against any of our directors, officers or affiliates. This means that, if a shareholder brings an action against us in the Royal Court of Guernsey, we may request that the Royal Court of Guernsey order such shareholder to provide security (which will need to be in a form acceptable to the Royal Court of Guernsey and may be direct or through a third-party surety) to satisfy any award of costs the Royal Court of Guernsey may award to us.
The Royal Court of Guernsey’s ability to award costs to us, and the provision in our articles of incorporation requiring shareholders to provide security for any such award of costs to us, could discourage shareholders from bringing lawsuits that might otherwise benefit our shareholders.
The insolvency laws of Guernsey and other jurisdictions may not be as favorable to shareholders as the US bankruptcy laws.
We are incorporated under the laws of Guernsey. In the event of a bankruptcy, insolvency or similar event, proceedings could be initiated in Guernsey or another relevant jurisdiction. The bankruptcy, insolvency, administrative and other laws of our and our subsidiaries’ jurisdictions of organization or incorporation may be materially different from, or in conflict with, one another and those of the United States, including in the areas of rights of creditors, shareholders, priority of governmental and other creditors and timing and duration of the proceedings. The application of these laws, or any conflict among them, could call into question whether any particular jurisdiction’s law should apply, adversely affecting our shareholders’ ability to enforce their rights under the ordinary shares in those jurisdictions or limit any amounts that they may receive.
It may be complex or time-consuming to effect service of US court process or enforcement of US judgments against us or certain of our directors and officers.
We are incorporated under the laws of Guernsey, and certain of our directors and officers reside outside the United States. In addition, a substantial portion of our assets is located outside the United States. It may be more complex or time-consuming to serve US court process on us or our officers or directors or to enforce US court judgments against us than if we were a US company with all our officers and directors located in the United States, including judgments predicated upon civil liabilities under US federal securities laws.
In Guernsey, foreign judgments may be recognized by the Royal Court of Guernsey either pursuant to the Judgments (Reciprocal Enforcement) (Guernsey) Law, 1957 (as amended), which provides an obligatory statutory framework for the enforcement of judgments from certain recognized jurisdictions, or pursuant to the principles of customary and common law. Guernsey is not party to any convention or bilateral treaty with the United States providing for the reciprocal recognition and enforcement of judgments. As a result, a judgment obtained in a court in the United States against us or any of our officers and directors incorporated or located, as applicable, in Guernsey will not automatically be recognized or enforced in Guernsey but may be enforceable by separate action on the judgment in accordance with the Guernsey customary and common law rules. To obtain an enforceable judgment in Guernsey, the claimant would be required to bring new
proceedings before the competent court in Guernsey (typically summary judgment proceedings). In such proceedings, the Guernsey court is unlikely to re-hear the case on its merits, except in accordance with principles of private international law. According to current practice, the Royal Court of Guernsey may enforce the judgment of a court in the United States in a claim in personam if the following conditions, among other things, are satisfied:
▪The judgment is for a debt or fixed or ascertainable sum of money (provided that the judgment does not relate to US penal, revenue or other public laws)
▪The judgment is final and conclusive
▪The court in the United States had, at the time when proceedings were served, jurisdiction over the judgment debtor in accordance with the principles of private international law, as applied by Guernsey law
▪The judgment was not (i) procured by fraud or (ii) given in breach of principles of natural or substantial justice
▪Recognition of the judgment would not be contrary to Guernsey public policy or natural justice
▪The judgment is not a judgment on a matter previously determined by a Guernsey court, or another court whose judgment is entitled to recognition in Guernsey, or that conflicts with an earlier judgment of such court
▪The judgment was not obtained in breach of an agreement for the settlement of disputes
▪Enforcement proceedings are not time barred under the Guernsey Laws on Prescription/Limitation. If the Guernsey court gives judgment for the sum payable under a judgment of a US court, the Guernsey judgment would be enforceable by the methods generally available for the enforcement of Guernsey judgments
These conditions give the court discretion whether to allow enforcement by any particular method. In addition, it may not be possible to obtain a Guernsey judgment or to enforce a Guernsey judgment if the judgment debtor is subject to any administration, winding-up or similar proceedings, if there is delay, if an appeal is pending or anticipated against the Guernsey judgment in Guernsey or against the foreign judgment in the courts of the United States or if the judgment debtor has any set-off or counterclaim against the judgment creditor.
Furthermore, any pre-existing security interest in Guernsey situs assets may affect both the enforcement of a judgment debt against the assets in which the interest has been created and the ability of any persons empowered under foreign insolvency law to act on behalf of an insolvent company, and recognized in Guernsey, to effect any recovery of such assets.
Item 1B. Unresolved staff comments
None.
Item 1C. Cybersecurity
Cybersecurity risk management and strategy
We strive to create a pervasive culture of cybersecurity and information systems security, focusing particularly on the tone set by our senior management. We have developed and implemented a cybersecurity risk management program intended to protect the confidentiality, integrity and availability of our critical information systems and data. Our cybersecurity risk management program leverages certain practices from the National Institute of Standards and Technology Cybersecurity Framework, the Center for Internet Security Top 20 Critical Security Controls and the Control Objectives for Information and Related Technologies. This does not imply that we meet any particular technical standards, specifications or requirements, only that we use these frameworks and controls as a guide to help us identify, assess and manage cybersecurity risks relevant to our business.
Our cybersecurity risk management program is integrated into our overall enterprise risk management program and shares common methodologies, reporting channels and governance processes that apply across the enterprise risk management program to other legal, compliance, strategic, operational and financial risk areas.
To provide for the resilience of critical information systems and data, maintain legal and regulatory compliance, manage our material risks from cybersecurity threats and protect against, detect and respond to cybersecurity incidents, our cybersecurity risk management program includes the following key elements:
▪24x7x365 security operations monitoring of our information systems and services to detect and act on weaknesses and potential intrusions
▪Cloud-based platform operations that allow us to store our data on the servers of technology companies, with built-in disaster recovery protection and regular backups
▪Regular internal and external security audits, penetration tests and risk assessments designed to help identify significant cybersecurity risks to our critical information systems and data
▪Collaboration with third-party service providers, where appropriate, to assess, test or otherwise assist with aspects of our security controls
▪Testing of new products and services to identify potential security vulnerabilities before release
▪Regular network and endpoint monitoring
▪Business resiliency planning with disaster recovery and business continuity testing
▪Role-based access controls to identify, authenticate and authorize individuals to access information systems based on their job responsibilities
▪Protection, including encryption, for the secure communication of sensitive data
▪Monitoring of emerging data protection laws and implementation of changes to our processes designed to comply therewith as well as regular review of best practices from both the legal and financial services industries and engaging in a program of continuous improvement
▪Regular review of policies, procedures and standards related to cybersecurity
▪Cybersecurity awareness training of our employees and senior management at regular intervals
▪Cross-functional approach to addressing cybersecurity risk, involving senior representatives from all our offices in business, information technology, finance and legal and compliance functions
▪Cybersecurity incident response plan that sets forth procedures for responding to cybersecurity incidents, including processes designed to triage, assess severity, escalate, contain, investigate and remediate such cybersecurity incidents, as well as to comply with potentially applicable legal and regulatory obligations and mitigate reputational damage
▪Third-party risk management process for certain service providers based on our assessment of their criticality to our business and risk profile
▪Strong access controls for platforms and devices, including multi-factor authentication and conditional access
As part of the above processes and procedures, we regularly engage with assessors, consultants and other third parties, including by having a third-party consultant review our cybersecurity risk management program on an annual basis to help identify areas for continued focus, improvement and compliance.
Our cybersecurity risk management program also addresses cybersecurity risks associated with our use of third-party service providers, including those who have access to our employee data or our information systems. Cybersecurity considerations affect the selection and oversight of our third-party service providers, and we perform diligence on third-party service providers that have access to our information systems, data or facilities that house such information systems or data. In addition, we distribute a cybersecurity survey to all major third-party service providers on an annual basis to assess their adherence to our cybersecurity requirements.
During the years ended December 31, 2024, 2023 and 2022, we have not identified any material cybersecurity incidents and have not identified any material risks from cybersecurity threats that have materially affected or are reasonably likely to materially affect our business strategy, results of operations or financial condition, and the expenses we have incurred from any cybersecurity incidents were immaterial. There can be no assurance that our cybersecurity risk management program, including our policies, processes, controls and procedures, will be fully implemented, complied with or effective in protecting our systems and information.
See “Risk factors—Risks relating to cybersecurity, third-party service providers, information systems and data privacy and protection” for additional information with respect to cybersecurity risks.
Cybersecurity governance
The Board of Directors considers cybersecurity risks as part of its risk management and oversight function and has oversight of our enterprise risk management program, including cybersecurity and other information systems risks. At each of its quarterly meetings, members of the Board of Directors receive a comprehensive risk presentation and review the key risks across the global enterprise focusing, among other things, on cybersecurity and other information systems risks. In addition, from time to time, the Board of Directors receives presentations on various cybersecurity topics from our Chief Information Officer, including relating to our efforts to improve our cybersecurity risk management program and comparison of our cybersecurity risk management program to those of other companies in the legal and financial services industries.
The Chief Information Officer and the cybersecurity committee have the responsibility for our overall cybersecurity risk management program. Our Chief Information Officer has primary responsibility for assessing and managing material risks from cybersecurity threats, and has over 20 years of cybersecurity work experience, including at major financial institutions and consulting firms and involving the management of information security and the development of cybersecurity strategy, and who has relevant degrees and certifications, including a Bachelor’s degree in Computer Science from Cornell University. Our Chief Information Officer supervises both our internal information technology team and our external cybersecurity consultants and other third-party service providers. Our Chief Information Officer meets regularly with our internal cybersecurity committee, composed of senior representatives from all our offices in business, information technology, finance and legal and compliance functions, including, among others, our Chief Financial Officer and our Chief Compliance Officer. With assistance from our internal information technology team, our Chief Information Officer conducts cybersecurity and other information systems risk assessments on at least an annual basis and reports the results of these assessments, as well as any material cybersecurity and other information systems risks, to the cybersecurity committee. The cybersecurity committee focuses on assessing processes and procedures to assist with prevention and detection of cybersecurity incidents, whereas our Chief Information Officer, with assistance from our internal information technology team, is responsible for mitigation and remediation of cybersecurity incidents. In addition, we engage third-party vendors to (i) perform a yearly cybersecurity assessment to identify any weaknesses and address them, including performing yearly penetration tests to determine if there are any vulnerabilities, and (ii) monitor our cloud environment 24/7, identify threats and respond to them by shutting down any activity that is deemed potentially harmful.
Our cybersecurity policies specify escalation points for reporting potential cybersecurity incidents to our Chief Information Officer and our Chief Compliance Officer, and we have adopted a cybersecurity incident response plan that sets forth procedures for responding to cybersecurity incidents. If applicable, the Board of Directors receives briefings from management on our cybersecurity risk management program and any significant cybersecurity incidents.
Item 2. Properties
We do not own any real property, and we lease our principal office spaces from third parties. The table below sets forth the location, square footage and main use of our principal leased offices as of December 31, 2024.
| | | | | | | | | | | | | | |
| Location | | Size (square footage) | | Main use |
| New York, New York, United States | | 19,516 | | Office space |
| London, United Kingdom | | 10,883 | | Office space |
| Chicago, Illinois, United States | | 7,113 | | Office space |
Both our Principal Finance and Asset Management and Other Services segments operate from our New York, London and Chicago offices.
We consider these facilities to be suitable and adequate for the management and operation of our businesses.
Item 3. Legal proceedings
The information with respect to legal proceedings is set forth in note 20 (Financial commitments and contingent liabilities—Legal proceedings) to our consolidated financial statements contained in this 2024 Form 10-K and is incorporated herein by reference.
Item 4. Mine safety disclosures
Not applicable.
Part II
Item 5. Market for registrant's common equity, related stockholder matters and issuer purchases of equity securities
We have a single class of ordinary shares, which trade on the NYSE and AIM, in each case, under the symbol “BUR”.
As of January 31, 2025, there were 210 shareholders of record of our ordinary shares. Because many of our ordinary shares are held by brokers and other institutions on behalf of shareholders, we are unable to estimate the total number of shareholders represented by these record holders.
Dividend policy
We anticipate continuing to pay a total annual dividend of 12.50¢ per ordinary share, payable semi-annually, but do not anticipate regular increases in our dividend per ordinary share level. The Board of Directors may review our dividend per ordinary share level from time to time. See “Risk factors—Risks relating to our ordinary shares—There can be no assurance that we will pay dividends or distributions” for additional information with respect to our declaration and payment of dividends.
Purchases of equity securities
The table below sets forth information about purchases by us and our affiliated purchasers during the year ended December 31, 2024, of equity securities that are registered by us pursuant to Section 12 of the Exchange Act.
| | | | | | | | | | | | | | | | | | | | | | | | | | |
| Period | | Total number of ordinary shares purchased | | Average price paid per ordinary share(1) | | Total number of ordinary shares purchased as part of publicly announced plans or programs | | Maximum number of ordinary shares that may yet be purchased under the plans or programs(2) |
| January 1, 2024 - January 31, 2024 | | — | | | $ | — | | | — | | | 21,634,721 | |
| February 1, 2024 - February 28, 2024 | | — | | | $ | — | | | — | | | 21,634,721 | |
| March 1, 2024 - March 31, 2024 | | 291,591(3) | | $ | 14.99 | | | 291,591 | | | 21,343,130 | |
| April 1, 2024 - April 30, 2024 | | 27,409(3) | | $ | 15.74 | | | 27,409 | | | 21,315,721 | |
| May 1, 2024 - May 31, 2024 | | — | | | $ | — | | | — | | | 21,864,608 | |
| June 1, 2024 - June 30, 2024 | | 19,285(4) | | $ | 14.50 | | | 19,285 | | | 21,845,323 | |
| July 1, 2024 - July 31, 2024 | | — | | | $ | — | | | — | | | 21,845,323 | |
| August 1, 2024 - August 31, 2024 | | — | | | $ | — | | | — | | | 21,845,323 | |
| September 1, 2024 - September 30, 2024 | | — | | | $ | — | | | — | | | 21,845,323 | |
| October 1, 2024 - October 31, 2024 | | — | | | $ | — | | | — | | | 21,845,323 | |
| November 1, 2024 - November 30, 2024 | | — | | | $ | — | | | — | | | 21,845,323 | |
| December 1, 2024 - December 31, 2024 | | — | | | $ | — | | | — | | | 21,845,323 | |
| Total | | 338,285 | | | $ | 15.02 | | | 338,285 | | | 21,845,323 | |
1.Includes broker commissions. The average price of our ordinary shares purchased on AIM was converted into US dollars using the applicable exchange rate.
2.On July 5, 2023, our shareholders approved a resolution at our annual general meeting renewing our authorization to purchase up to 21,895,721 ordinary shares on the open market, which authority is set to expire as of the close of our annual general meeting to be held in 2024. On May 15, 2024, our shareholders approved a resolution at our annual general meeting renewing our authorization to purchase up to 21,864,608 ordinary shares on the open market, which authority is set to expire the earlier of (i) the close of our annual general meeting to be held in 2025 and (ii) September 26, 2025.
3.Consists of ordinary shares purchased on the open market on AIM between March 19, 2024, and March 27, 2024.
4.Consists of ordinary shares purchased on the open market on AIM on June 4, 2024 to satisfy grants of awards under the NED Plan.
We use a variety of structures, including the purchases of our ordinary shares on the open market, to offset dilution from the issuance of new ordinary shares related to the equity-based or related compensation of our employees and directors.
Unregistered sales of equity securities and use of proceeds
There were no unregistered sales of equity securities during the years ended December 31, 2024, 2023 and 2022.
Five-year share performance graph
The performance graph below depicts the total return to holders of our ordinary shares from the closing price on December 31, 2019, through December 31, 2024, relative to the performance of the Russell 2000 index and the S&P Small Cap 600 Financials index. The performance graph assumes $100 invested on December 31, 2019, and dividends received reinvested in the security or index.
The performance graph is not intended to be indicative of future performance. The performance graph shall not be deemed “soliciting material” or to be “filed” with the SEC for purposes of Section 18 of the Exchange Act, or otherwise subject to the liabilities under Section 18 of the Exchange Act, and shall not be deemed to be incorporated by reference into any of our filings under the Securities Act or the Exchange Act.
Tax considerations
Guernsey tax considerations
The summary below is based on Guernsey law and published practice in Guernsey as of the date of this 2024 Form 10-K, both of which are subject to change, possibly with retroactive effect. This summary is intended as a general guide related to certain Guernsey tax matters potentially applicable to the holders of our ordinary shares only and is not, is not intended to be nor should it be construed to be, legal or tax advice or a summary of all tax matters in Guernsey.
Shareholders, whether corporations or individuals, that are not residents of Guernsey for tax purposes and that do not carry on business in Guernsey through a permanent establishment situated in Guernsey, will not be subject to Guernsey income tax or Guernsey withholding tax. Any distributions made by us to non-Guernsey tax resident shareholders will not be subject to Guernsey income tax or Guernsey withholding tax.
Individual shareholders who are residents of Guernsey for tax purposes will generally be subject to Guernsey income tax at the individual standard rate of 20% on distributions received from us.
Corporate shareholders that are residents of Guernsey for tax purposes (and that do not have exempt company status under the Income Tax (Exempt Bodies) (Guernsey) Ordinance, 1989, as amended) will generally be subject to Guernsey income tax at the company standard rate, which is currently 0%, on distributions received from us.
As of the date of this 2024 Form 10-K, Guernsey does not levy capital gains tax and, therefore, shareholders will not suffer capital gains tax in Guernsey on the sale or other disposition of our ordinary shares.
No stamp duty is chargeable in Guernsey on the issue, acquisition, transfer, conversion or redemption or other disposition of our ordinary shares (provided that we do not hold Guernsey real property).
Guernsey has implemented through domestic legislation matters related to (i) the Foreign Account Tax Compliance Act (“FATCA”) contained in the US Internal Revenue Code of 1986, as amended (the “Code”), and the Treasury Regulations promulgated thereunder and (ii) the Organisation for Economic Co-operation and Development’s regime known as the Common Reporting Standard (“CRS”). Pursuant to FATCA and CRS, disclosure and reporting of information may be required, including disclosure of certain information about shareholders, their ultimate beneficial owners and/or controllers and their investment in us. Shareholders should consult their tax advisers regarding the possible implications of FATCA, CRS and other similar regimes that may be relevant to their ownership and disposition of our ordinary shares.
Shareholders, including any nominees, should inform themselves as to all legal and tax consequences, and any foreign exchange requirements, which may apply to them in their respective jurisdictions in connection with their purchase, holding or disposal of our ordinary shares.
Material US federal income tax considerations
General
The following is a discussion of the material US federal income tax considerations that may be relevant to US Holders (as defined below). This discussion is based upon provisions of the Code, the Treasury Regulations promulgated thereunder and administrative rulings and court decisions, all as in effect or existence on the date of this Annual Report and all of which are subject to change, possibly with retroactive effect. Changes in these authorities may cause the tax consequences of ownership of our ordinary shares to vary substantially from the consequences described below.
The following discussion applies only to beneficial owners of our ordinary shares that own ordinary shares as “capital assets” within the meaning of Section 1221 of the Code (i.e., generally, for investment purposes) and is not intended to be applicable to all categories of shareholders, such as shareholders subject to special tax rules (e.g., including, among others, banks or financial institutions, regulated investment companies, insurance companies, broker-dealers or traders in stocks and securities or currencies, tax-exempt organizations, real estate investment trusts, retirement plans or individual retirement accounts, US expatriates, persons who hold our ordinary shares as part of a straddle, hedge, conversion, constructive sale or other integrated transaction for US federal income tax purposes, traders in securities that have elected the mark-to-market method of accounting for their securities, persons liable for alternative minimum tax, persons who are investors in pass-through entities, persons that own (actually or constructively) 10% or more of our equity securities (by vote or value), persons who elect to receive dividends in a currency other than the US dollar or persons who have a functional currency other than the US dollar), each of whom may be subject to unique tax rules that differ significantly from those summarized below. If a partnership, or other entity classified as a partnership for US federal income tax purposes, holds our ordinary shares, the tax treatment of its partners generally will depend upon the status of the partner and the activities of the partnership. Partners in a partnership holding our ordinary shares should consult their tax advisors regarding the tax consequences to them of the partnership’s ownership of our ordinary shares.
No ruling has been requested from the Internal Revenue Service (the “IRS”), nor is there any present intention to do so, in connection with any matter affecting us or our shareholders. The statements made herein may be challenged by the IRS and, if so challenged, may not be sustained upon review by a court of relevant taxing jurisdiction. This discussion does not contain any information regarding any US state, US local or US estate or gift tax considerations concerning the ownership or disposition of our ordinary shares. This discussion does not comment on all aspects of US federal income taxation that may be important to particular shareholders in light of their individual circumstances, and each shareholder is encouraged to consult its own tax advisor regarding the potential US federal, state, local and other tax consequences to such shareholder of the ownership or disposition of our ordinary shares.
As used herein, the term “US Holder” means a beneficial owner of our ordinary shares that is:
▪An individual citizen or resident of the US
▪A corporation (including any entity treated as a corporation for US federal income tax purposes) created or organized in or under the laws of the United States, any state thereof or the District of Columbia
▪An estate the income of which is subject to US federal income taxation regardless of its source or
▪A trust if (i) its administration is subject to the primary supervision of a court within the United States and one or more US persons, within the meaning of Section 7701(a)(30) of the Code, have the authority to control all substantial decisions of the trust or (ii) it has a valid election in effect under applicable Treasury Regulations to be treated as a US person for US federal income tax purposes.
Distributions
Subject to the discussion below of the rules applicable to PFICs, any distributions to a US Holder made by us with respect to our ordinary shares generally will constitute dividends to the extent of our current and accumulated earnings and profits, as determined under US federal income tax principles. Distributions in excess of our earnings and profits will be treated first as a nontaxable return of capital to the extent of the US Holder’s tax basis in our ordinary shares held by the US Holder and thereafter as capital gain. While we do not maintain calculations of our earnings and profits under US federal income tax principles, US Holders should expect that distributions generally will be treated as dividends for US federal income tax purposes. US Holders that are corporations generally will not be entitled to claim a dividend received deduction, as such term is defined under US tax law, with respect to distributions they receive from us. Distributions on our ordinary shares to certain non-corporate US Holders that satisfy a minimum holding period requirement and other generally applicable requirements should generally be eligible for taxation at preferential rates as “qualified dividend income”. However, non-corporate holders who do not meet a minimum holding period requirement during which they are not protected from the risk of loss or who elect to treat the dividend income as “investment income” pursuant to Section 163(d)(4) of the Code, for purposes of the investment interest expense limitation rules, will not be eligible for the reduced rates of taxation otherwise available for dividend distributions. Shareholders should consult their own tax advisors regarding the application of these rules to their particular circumstances. Dividends received with respect to our ordinary shares generally will be treated as foreign source “passive category income” for purposes of computing allowable foreign tax credits for US federal income tax purposes. The US foreign tax credit rules are complex, and US Holders are urged to consult their own tax advisors regarding the availability of the US foreign tax credits and the application of the US foreign tax credit rules to their particular situation.
Sale, exchange or other disposition of our ordinary shares
Subject to the discussion below of the rules applicable to PFICs, a US Holder generally will recognize gain or loss upon a sale, exchange or other disposition of our ordinary shares in an amount equal to the difference between the amount realized by the US Holder from such sale, exchange or other disposition and the US Holder’s adjusted tax basis in such ordinary shares. The US Holder’s tax basis in our ordinary shares held by the US Holder generally will be the US Holder’s purchase price for our ordinary shares reduced by the amount of any distributions on our ordinary shares that are treated as non-taxable returns of capital (see “—Distributions”). Such gain or loss will be treated as capital gain or loss and will be long-term capital gain or loss if the US Holder’s holding period attributable to the ordinary shares in question is greater than one year at the time of the sale, exchange or other disposition. Certain US Holders (including individuals) may be eligible for preferential rates of US federal income tax in respect of long-term capital gains. A US Holder’s ability to deduct capital losses is subject to several limitations as outlined under US tax laws. Any such capital gain or loss recognized on the sale, exchange or other disposition of our ordinary shares generally will be treated as US source gain or loss, as applicable, for US foreign tax credit purposes.
PFIC
In general, a foreign corporation will be treated as a PFIC under US tax laws if, in any tax year in which, after applying certain look-through rules, either (i) at least 75% of gross income for such taxable year consists of passive income (e.g., dividends, interest, rents, royalties and capital gains from the sale or exchange of investment property) or (ii) at least 50% of the average value of the assets held by it during such taxable year produce, or are held for the production of, passive income. If we were a PFIC for any year during which a US Holder holds our ordinary shares, we generally would continue to be treated as a PFIC with respect to that US Holder for all succeeding years during which that US Holder holds our ordinary shares, even if we otherwise ceased to meet the requirements for PFIC status in that year.
As of the date of this 2024 Form 10-K, there is substantial uncertainty regarding the tax treatment of our financing arrangements as well as the application of the PFIC rules to such financing arrangements and, in particular, whether all or some of our financing arrangements are passive assets or otherwise produce passive income under the applicable PFIC US tax rules. As a result, although we do not believe we are currently a PFIC or expect to be treated as a PFIC in the foreseeable future, there can be no assurance that the IRS will not successfully assert that we are or were a PFIC, that all or some portion of our financing arrangements are passive assets or otherwise produce passive income or that a change in law or interpretation of current law, possibly with retroactive effect, could cause us to be treated as a PFIC in a current, future or prior taxable year.
If we were treated as a PFIC, a US Holder could be subject to significant adverse US tax consequences, including our dividend distributions would not be eligible for preferential US tax rates (as discussed above), interest charges and additional taxes (including penalties), on certain excess distributions, sales, exchanges or other dispositions of our ordinary shares and certain transactions involving our subsidiaries that are themselves PFICs. A US Holder may mitigate certain, but not all, of these adverse consequences by making a timely “mark-to-market” election with respect to our ordinary shares. In addition, certain information
reporting requirements would apply with respect to the ownership of our ordinary shares. The US federal income tax rules relating to PFICs are very complex. Shareholders are strongly encouraged to consult their own tax advisor with respect to the impact of the PFIC US tax rules on the purchase, ownership and disposition of our ordinary shares.
Specified foreign financial assets
Individual US Holders that own “specified foreign financial assets” with an aggregate value in excess of (i) $50,000 on the last day of the tax year or (ii) $75,000 at any time during the tax year are generally required to report information relating to such assets. “Specified foreign financial assets” include any financial accounts held at a foreign financial institution, as well as securities issued by a foreign issuer (which would include our ordinary shares) that are not held in accounts maintained by financial institutions. Higher reporting thresholds apply to certain married individuals. The applicable Treasury Regulations extend this reporting requirement to certain entities that are treated as formed or availed of to hold direct or indirect interests in “specified foreign financial assets” based on certain objective criteria. US Holders who fail to report the required information could be subject to substantial penalties. Shareholders are encouraged to consult their own tax advisor regarding reporting obligations, if any, that would result from their purchase, ownership or disposition of our ordinary shares.
Backup withholding and information reporting
In general, US Holders will be subject to information reporting requirements on dividends received with respect to our ordinary shares and the proceeds of a disposition of our ordinary shares, unless a US Holder is an exempt recipient (such as a corporation). Backup withholding may apply to such amounts if the US Holder fails to provide an accurate taxpayer identification number (generally on an IRS Form W-9) or is otherwise subject to backup withholding. Backup withholding is not an additional tax. A US Holder generally may obtain a credit for any amount withheld against its liability for US federal income tax (and obtain a refund of any amounts withheld in excess of such liability), provided that certain required information is timely furnished to the IRS.
Item 6. [ Reserved ]
Item 7. Management's discussion and analysis of financial condition and results of operations
The following discussion and analysis of financial condition and results of operations is for the year ended December 31, 2024, as compared to the year ended December 31, 2023. This discussion should be read in conjunction with our consolidated financial statements and the accompanying notes thereto contained elsewhere in this 2024 Form 10-K.
Beginning for the year ended December 31, 2024, Burford renamed its capital provision segment to Principal Finance and allocated revenue, expenses and assets from other corporate to the two reportable segments, since the amounts relating to certain operating and non-operating activities previously presented as other corporate forms part of what is used internally to measure and evaluate the performance of the reportable segments. As a result of this change, we also recast certain previously reported amounts to conform with the change in allocation of revenue, expenses and assets to each reportable segment. As we did not consider this to be a material change and there was no change to our total segments (Burford-only) (as defined below) numbers, we did not deem it necessary to include herein any discussion and analysis of the financial condition and results of operations of Burford for the year ended December 31, 2023, as compared to the year ended December 31, 2022. Certain information contained in the following discussion and analysis includes forward-looking statements that involve known and unknown risks, uncertainties and other factors. See “Forward-looking statements”.
The following discussion and analysis also contain a discussion of certain unaudited KPIs (as defined below) and non-GAAP financial measures that are used by management to monitor our financial condition and results of operations. These KPIs and non-GAAP financial measures are supplemental and should not be considered in isolation from, as substitutes for, or superior to, our consolidated financial condition or results of operations as reported under US GAAP. See “—Basis of presentation of financial information” and “—Reconciliations” for additional information with respect to KPIs and non-GAAP financial measures and the applicable reconciliations.
The discussion and analysis of financial condition and results of operations of Burford for the year ended December 31, 2023, as compared to the year ended December 31, 2022, can be found in the “Operating and financial review and prospects” section of our annual report on Form 20-F for the year ended December 31, 2023, which was filed with the Securities and Exchange Commission on March 28, 2024.
Economic and market conditions
Our portfolio returns are driven by judicial activity, and we believe these returns are generally uncorrelated to market conditions or the performance of the overall economy. The most direct impact of economic and market conditions on our business relates to our cost of debt and ease of access to corporate debt capital markets, as well as movements in market rates that cause adjustments to the discount rates applied in the fair value of our assets and impact our quarterly revenue recognition in accordance with US GAAP. We believe that we maintain healthy access to corporate debt capital markets, supported by a credit rating from S&P that was upgraded in the third quarter 2024, and a positive rating outlook status from Moody’s as of the date of this 2024 Form-10K. Overall, we believe our business model is particularly resilient to economic and market cycles due to the nature of the assets that drive our revenues and cash flow.
More broadly, economic conditions can have an impact on the amount and type of litigation that we may consider financing. For example, increased rates of corporate insolvencies can lead to opportunities to finance litigation relating to or arising out of insolvencies and bankruptcies; higher interest rates or other forms of economic stress can cause businesses to act illegally (such as to conspire to fix prices), leading to financeable claims; and pressure from shareholders and markets can lead to the commission of securities fraud and other such acts, again leading to financeable claims.
See “Risk factors—Risks relating to our business and industry—We are subject to credit risk relating to our various legal finance assets that could adversely affect our business, financial condition, results of operations and/or liquidity” and “Risk factors—Risks relating to our business and industry—Legal, political and economic uncertainty surrounding the effects, severity and duration of public health threats could adversely affect our business, financial condition, results of operations and/or liquidity”.
Covid-19
Court systems and other forms of adjudication have returned to functionality in the aftermath of the Covid-19 pandemic. In general, court activity has continued to work through the backlog caused by the Covid-19 pandemic and, during the year ended December 31, 2024, we have observed continuing portfolio activity. Nevertheless, some court systems continue to face backlogs, delaying adjudication. Inevitably, some of our matters (and thus our cash realizations from them) in jurisdictions impacted by court backlogs have been slowed by these dynamics. We are often protected on duration risk, however, as many of our assets have time-based terms that increase our absolute returns as time passes, we consider delays to be deferral of income rather than its permanent diminution. We have not seen the discontinuance of any matters.
See “Risk factors—Risks relating to our business and industry—Legal, political and economic uncertainty surrounding the effects, severity and duration of public health threats could adversely affect our business, financial condition, results of operations and/or liquidity”.
Inflation
The effect of inflation on our revenues is mitigated to a significant extent by a number of factors, including the high returns generated by capital provision assets and their relatively short weighted average lives. Furthermore, inflationary increases in legal case fees and expenses can increase the size of commitments, deployments and damages sought. Because returns on most of our assets are at least partially based upon a multiple of those fees and expenses, our returns on successful cases should also increase in such circumstances. To the degree that inflation drives higher interest rates and to the extent that pre- and post-judgment interest rates in a particular jurisdiction are tied to market interest rates, higher inflation would result in increases in awards by the relevant courts. The effect of inflation on our expenses would predominantly be through employee costs, which represent the majority of our operating expenses, although a significant portion of compensation-related expenses are performance-based. Our Principal Finance costs include interest expenses associated with our outstanding debt securities, although these are fixed coupon and non-adjustable, regardless of the rate of inflation.
Party solvency
Litigation outcomes stand apart from the remainder of the conventional credit universe because they do not arise as a result of a contractual relationship between the judgment debtor and creditor, unlike essentially all other forms of credit obligation. Thus, for example, for a debtholder to recover on a defaulted debt, there are many steps, typically involving notice, a cure period and usually a subsequent judicial or insolvency proceeding that will generally sweep in other creditors, resulting in a meaningful risk of the debt being impaired or compromised. By contrast, a judgment creditor has immediate and unfettered rights of action, for example, to seize assets and garnish cash flows, meaning that a judgment creditor often has substantial
leverage and ability to secure payment of a judgment against even a financially distressed judgment debtor as long as the judgment debtor does not seek protection from creditors in a formal insolvency proceeding.
To the extent that the claimant in a matter we are financing becomes insolvent, insolvency proceedings typically provide for the continued prosecution of claims given that the claim is a valuable contingent asset, the recovery of which is in the best interests of the claimant’s stakeholders, and we are often a secured creditor with respect to the litigation we are financing. Nevertheless, a claimant’s insolvency may introduce delay in the underlying litigation while the insolvency process unfolds. To the extent that the defendant in a matter we are financing becomes insolvent, judgment creditors are typically unsecured creditors and the risk to our recovery is dependent on the financial condition of the judgment debtor and the availability of assets for unsecured creditors.
International sanctions on Russian businesses and individuals
The international sanctions imposed on Russian businesses and individuals continue to impact the legal industry. Our legal finance assets in jurisdictions outside Russia that involve claims against entities that might have an ultimate Russian parent or controller (regardless of sanction status) represented in the aggregate $115.0 million (or approximately 2% of total fair value for capital provision assets) as of December 31, 2024 as compared to $111.5 million (or approximately 2% of total fair value for capital provision assets) as of December 31, 2023. There have been no significant changes or developments with respect to the impact of these international sanctions on our business. We are mindful of any sanctions or other issues and work regularly with specialist counsel in the sanctions area (as well as ensuring compliance with all legal requirements, such as anti-money laundering). Where we are required to enforce judgments or awards, even against sanctioned entities, such enforcement tends to be consistent with the goals of international sanctions regimes rather than running afoul of them, and the US Office of Foreign Assets Control and the UK Office of Financial Sanctions Implementation regularly grant licenses to do so. We do not anticipate any adverse material impact on our business from the sanctions regime.
Conflict in Israel and Gaza
As of December 31, 2024, we did not have material assets in Israel and therefore we were not materially impacted, nor do we anticipate any adverse material impact, from the conflict in Israel and Gaza and its effect on neighboring regions.
Basis of presentation of financial information
We report our consolidated financial statements as of and for the year ended December 31, 2024, and comparative periods contained in this 2024 Form 10-K in accordance with US GAAP. Our consolidated financial statements are presented in US dollars.
Non-GAAP financial measures relating to our business structure
US GAAP requires us to present financial statements that consolidate some of the limited partner interests in private funds we manage as well as assets held on our balance sheet where we have a partner or minority investor. See note 15 (Variable interest entities) to our consolidated financial statements contained in this 2024 Form 10-K for additional information. We refer to this presentation as “consolidated” which refers to assets, liabilities and activities that include those third-party interests, partially owned subsidiaries and special purpose vehicles that we are required to consolidate under US GAAP. As of the date of this 2024 Form 10-K, the major entities where there is also a third-party partner in, or owner of, those entities include BOF-C, the Advantage Fund, Colorado and several other entities in which we hold investments where there is also a third-party partner in, or owner of, those entities.
Additionally, we believe it is useful to provide a view of Burford as a stand-alone business (i.e., eliminating the impact of these private funds) by furnishing information on a non-GAAP basis that eliminates the effect of this consolidation. We refer to this basis of presentation as “Burford-only”. Our segment reporting, which conveys the performance of our business across two reportable segments – Principal Finance and Asset Management and Other Services – is presented on a Burford-only basis. We refer to our segment reporting in the aggregate as “Total segments”. Note that we have introduced more prominent segment reporting in our disclosures with the issuance of this 2024 Form 10-K, as we transition to reporting as a US domestic issuer. Disclosures labeled as “Total segments (Burford-only)” in this 2024 Form 10-K are synonymous with similar disclosures labeled as “Burford-only” in prior reporting periods.
In addition to presenting our results on a consolidated basis in accordance with US GAAP, we use Burford-only financial measures, which are calculated and presented using methodologies other than in accordance with US GAAP, to supplement analysis and discussion of our consolidated financial statements. Burford-only financial measures exclude the proportional assets, liabilities and operating results that are attributable to third-party limited partners in our private funds, partners and minority investors. The presentation of
Burford-only financial measures is consistent with how management measures and assesses the performance of our reportable segments. In addition, for deployments and realizations, we use adjusted Burford-only as a financial measure, which is calculated by adjusting Burford-only for certain items. Accordingly, we believe that Burford-only and adjusted Burford-only financial measures provide valuable and useful information to investors to aid in understanding our performance in addition to our consolidated financial statements prepared in accordance with US GAAP. These non-GAAP financial measures should not be considered in isolation from, as a substitute for, or superior to, financial measures calculated in accordance with US GAAP. See “—Reconciliations” for the reconciliations of these non-GAAP financial measures to our consolidated financial statements prepared in accordance with US GAAP.
KPIs and non-GAAP financial measures relating to our operating and financial performance
KPIs
This 2024 Form 10-K presents certain unaudited key performance indicators (“KPIs”). The KPIs are presented because (i) we use them to monitor our financial condition and results of operations and/or (ii) we believe they are useful to investors, securities analysts and other interested parties. The KPIs, as defined by us, may not be comparable to similarly titled measures as presented by other companies due to differences in the way the KPIs are calculated. Even though the KPIs are used to assess our financial condition and results of operations, and these types of measures are commonly used by investors, they have important limitations as analytical tools and should not be considered in isolation from, as substitutes for, or superior to, our consolidated financial condition or results of operations prepared in accordance with US GAAP. Consistent with how management assesses Burford’s business, we also present certain of these KPIs on both a segment and a group-wide bases.
The presentation of the KPIs is for informational purposes only and does not purport to present what our actual financial condition or results of operations would have been, nor does it project our financial condition as of any future date or our results of operations for any future period. The presentation of the KPIs is based on information available as of the date of this 2024 Form 10-K and certain assumptions and estimates that we believe are reasonable. Several of the KPIs measure certain performance of our assets to the end of the period and include concluded and partially concluded assets (as defined below).
In discussing cash returns and performance of our asset management business, we refer to several key performance indicators as set forth below:
▪Assets under management
Consistent with our status as an SEC-registered investment adviser, we report publicly on our asset management business on the basis of US regulatory assets under management (“AUM”). AUM, as we report it, means the fair value of the capital invested in private funds and individual capital vehicles plus the capital that we are entitled to call from investors in those private funds and vehicles pursuant to the terms of their respective capital commitments to those private funds and vehicles. Our AUM differs from our private funds’ contribution to our group-wide portfolio, which consists of deployed cost, fair value adjustments and undrawn commitments made on the legal finance assets those private funds have financed.
▪Concluded and partially concluded assets
A legal finance asset is “concluded” for our purposes when there is no longer any litigation risk remaining. We use the term to encompass (i) entirely concluded legal finance assets where we have received all proceeds to which we are entitled (net of any entirely concluded losses), (ii) partially concluded legal finance assets where we have received some proceeds (for example, from a settlement with one party in a multi-party case) but where the case is continuing with the possibility of receiving additional proceeds and (iii) legal finance assets where the underlying litigation has been resolved and there is a promise to pay proceeds in the future (for example, in a settlement that is to be paid over time).
▪Deployed cost
Deployed cost is the amount of financing we have provided for an asset at the applicable point in time.
For purposes of calculating returns, we must consider how to allocate the costs associated with an asset in the event of a partial conclusion. Our approach to cost allocation depends on the type of asset:
◦When single case assets have partial resolutions along the way without the entire case being resolved, most commonly because one party settles and the remaining part(y)/(ies) continue to litigate, we report the partial resolution when agreed as a partial realization and allocate a
portion of the deployed cost to the partial resolution depending on the significance of the settling party to the overall claim.
◦In portfolio assets when a case (or part of a case) resolves or generates cash proceeds, we report the partial resolution when agreed as a partial realization and allocate a portion of the deployed cost to the resolution. The allocation depends on the structure of the individual portfolio arrangement and the significance of the resolution to the overall portfolio, but it is in essence a method that mimics the way an investor would allocate cost basis across a portfolio of security purchases.
▪Commitment
A commitment is the amount of financing we agree to provide for a legal finance asset. Commitments can be definitive (requiring us to provide financing on a schedule or, more often, when certain expenses are incurred) or discretionary (allowing us to provide financing after reviewing and approving a future matter). Commitments for which we have not yet provided financing are unfunded commitments.
▪Internal rate of return
Internal rate of return (“IRR”) is a discount rate that makes the net present value of a series of cash flows equal to zero and is expressed as a percentage figure. We compute IRR on concluded (including partially concluded) legal finance assets by treating that entire portfolio (or, when noted, a subset thereof) as one undifferentiated pool of capital and measuring actual and, if necessary, estimated inflows and outflows from that pool, allocating costs appropriately. IRRs do not include unrealized gains or losses.
▪Return on invested capital
Return on invested capital (“ROIC”) from a concluded asset is the absolute amount of realizations from such asset in excess of the amount of expenditure incurred in financing such asset divided by the amount of expenditure incurred, expressed as a percentage figure. ROIC is a measure of our ability to generate absolute returns on our assets. Some industry participants express returns on a multiple of invested capital (“MOIC”) instead of a ROIC basis. MOIC includes the return of capital and, therefore, is 1x higher than ROIC. In other words, 70% ROIC is the same as 1.70x MOIC.
▪Weighted average life
Weighted average life (“WAL”) of one of our legal finance assets represents the average length of time from deployment and/or cash outlay until we receive a cash realization (actual or, if necessary, estimated) from that asset weighted by the amount of that realization or deployment, as applicable. In other words, WAL is how long our asset is outstanding on average.
Unlike our IRR and ROIC calculations, using the aggregate cash flows from the portfolio in making our portfolio level computations will not readily work with WAL computations because our assets are originated in different timeframes. Instead, in calculating a portfolio WAL, we compute a weighted average of the individual asset WALs. In doing this, we weight the individual WALs by the costs deployed on the asset and also, as a separate calculation, by the amount of realizations on the individual assets.
▪Portfolio
Portfolio is defined as the fair value of capital provision assets plus the undrawn commitments to capital provision assets.
Non-GAAP financial measures
In addition to these measures of cash returns and performance of our asset management business, we also refer to cash receipts, tangible book value attributable to Burford Capital Limited and tangible book value attributable to Burford Capital Limited per ordinary share, which are non-GAAP financial measures:
▪Cash receipts
Cash receipts provide a measure of the cash that our capital provision and other assets generate during a given period as well as cash from certain other fees and income. In particular, cash receipts represent the cash generated from capital provision and other assets, including cash proceeds from realized or concluded assets and any related hedging assets, and cash received from asset management income, services and/or other income, before any deployments into financing existing or new assets.
Cash receipts are a non-GAAP financial measure and should not be considered in isolation from, as a substitute for, or superior to, financial measures calculated in accordance with US GAAP. The most
directly comparable measure calculated in accordance with US GAAP is proceeds from capital provision assets as set forth in our consolidated statements of cash flows. We believe that cash receipts are an important measure of our operating and financial performance and are useful to management and investors when assessing the performance of our Burford-only capital provision assets. See “—Reconciliations—Cash receipts reconciliations” for a reconciliation of cash receipts to proceeds from capital provision assets, the most comparable measure calculated in accordance with US GAAP.
▪Tangible book value attributable to Burford Capital Limited and tangible book value attributable to Burford Capital Limited per ordinary share
Tangible book value attributable to Burford Capital Limited is calculated by subtracting intangible assets (such as goodwill) from total Burford Capital Limited equity. Tangible book value attributable to Burford Capital Limited per ordinary share is calculated by dividing tangible book value attributable to Burford Capital Limited by the total number of outstanding ordinary shares.
Each of tangible book value attributable to Burford Capital Limited and tangible book value attributable to Burford Capital Limited per ordinary share is a non-GAAP financial measure and should not be considered in isolation from, as a substitute for, or superior to, financial measures calculated in accordance with US GAAP. The most directly comparable measure calculated in accordance with US GAAP is total Burford Capital Limited equity as set forth in our consolidated statements of financial condition. We believe that tangible book value attributable to Burford Capital Limited and tangible book value attributable to Burford Capital Limited per ordinary share are important measures of our financial condition and are useful to management and investors when assessing capital adequacy and our ability to generate earnings on tangible equity invested by our shareholders. See “—Reconciliations—Tangible book value attributable to Burford Capital Limited and tangible book value attributable to Burford Capital Limited per ordinary share reconciliations” for reconciliations of tangible book value attributable to Burford Capital Limited and tangible book value attributable to Burford Capital Limited per ordinary share to total Burford Capital Limited equity, the most comparable measure calculated in accordance with US GAAP.
Results of operations and financial condition
Set forth below is a discussion of our consolidated results of operations for the years ended December 31, 2024 and 2023, and our consolidated financial condition as of December 31, 2024 and 2023, in each case, on a consolidated basis, unless otherwise noted.
In this section, any references to 2024 refers to the year ended December 31, 2024 and any references to 2023 refers to the year ended December 31, 2023.
Consolidated statements of operations for the year ended December 31, 2024 as compared to the year ended December 31, 2023
Overview
The table below sets forth a summary of our consolidated statements of operations for the periods indicated.
| | | | | | | | | | | | | | | | | | | | | | | | | | |
| | Years ended December 31, | | | | |
| ($ in thousands) | | 2024 | | 2023 | | Change | | % change |
| Total revenues | | $ | 546,087 | | | $ | 1,086,902 | | | $ | (540,815) | | | (50) | % |
| Total operating expenses | | 155,485 | | | 271,236 | | | (115,751) | | | (43) | % |
| Operating income/(loss) | | 390,602 | | | 815,666 | | | (425,064) | | | (52) | % |
| | | | | | | | |
| Total other expenses | | 137,014 | | | 77,383 | | | 59,631 | | | 77 | % |
| Income/(loss) before income taxes | | 253,588 | | | 738,283 | | | (484,695) | | | (66) | % |
| | | | | | | | |
| Provision for/(benefit from) income taxes | | 24,005 | | | 20,084 | | | 3,921 | | | 19.5 | % |
| Net income/(loss) | | 229,583 | | | 718,199 | | | (488,616) | | | (68) | % |
| | | | | | | | |
| Net income attributable to non-controlling interests | | 83,099 | | | 107,677 | | | (24,578) | | | (23) | % |
| Net income/(loss) attributable to Burford Capital Limited shareholders | | 146,484 | | | 610,522 | | | (464,038) | | | (76) | % |
| Note: “NM” denotes not meaningful. Changes from negative to positive amounts and positive to negative amounts, increases or decreases from zero and changes greater than 700% are not considered meaningful. |
Total revenues decreased 50% for the year ended December 31, 2024, mainly due to the absence of large fair value increases in capital provision income for the YPF-related assets, which occurred during 2023, arising from two separate milestone events, the March 2023 Ruling (as defined below) and the September 2023 Final Judgment (as defined below). However, realizations increased year-over-year, resulting in a 75% increase in net realized gains to $439.7 million for the year ended December 31, 2024. The decrease in total revenues was partially offset by a decrease in operating expenses primarily due to a decrease in compensation-related accruals. The net result was $146.5 million in net income attributable to Burford Capital Limited shareholders for the year ended December 31, 2024, as compared to net income of $610.5 million for the year ended December 31, 2023.
Revenues
The table below sets forth the components of our total revenues for the periods indicated.
| | | | | | | | | | | | | | | | | | | | | | | | | | |
| | Years ended December 31, | | | | |
| ($ in thousands) | | 2024 | | 2023 | | Change | | % change |
| Capital provision income/(loss) | | $ | 552,066 | | | $ | 1,341,923 | | | $ | (789,857) | | | (59) | % |
| Plus/(Less): Third-party interests in capital provision assets | | (42,384) | | | (279,263) | | | 236,879 | | | (85) | % |
| Asset management income/(loss) | | 8,340 | | | 7,642 | | | 698 | | | 9 | % |
| Marketable securities income/(loss) and interest | | 25,014 | | | 12,208 | | | 12,806 | | | 105 | % |
| Other income/(loss) | | 3,051 | | | 4,392 | | | (1,341) | | | (31) | % |
| Total revenues | | 546,087 | | | 1,086,902 | | | (540,815) | | | (50) | % |
Capital provision income/(loss)
The table below sets forth the components of our capital provision income for the periods indicated.
| | | | | | | | | | | | | | | | | | | | | | | | | | |
| | Years ended December 31, | | | | |
| ($ in thousands) | | 2024 | | 2023 | | Change | | % change |
| Net realized gains/(losses) | | $ | 439,665 | | | $ | 251,618 | | | $ | 188,047 | | | 75 | % |
| Fair value adjustment during the period, net of previously recognized unrealized gains/(losses) transferred to realized gains/(losses) | | 127,981 | | | 1,081,644 | | | (953,663) | | | (88) | % |
| Foreign exchange gains/(losses) | | (15,701) | | | 8,012 | | | (23,713) | | | NM |
| Other | | 121 | | | 649 | | | (528) | | | (81) | % |
| Total capital provision income/(loss) | | 552,066 | | | 1,341,923 | | | (789,857) | | | (59) | % |
For the year ended December 31, 2024, net realized gains were $439.7 million, comprising $476.1 million of gross realized gains, offset by gross realized losses of $41.9 million. For the year ended December 31, 2023, net realized gains were $251.6 million, comprising $322.6 million of gross realized gains, offset by gross realized losses of $71.0 million. The increase in net realized gains is due to more case activity during 2024, which led to favorable conclusions and in higher amounts. The 75% increase in net realized gains includes three realizations that each individually exceeded $40.0 million in realized gains and together generated $170.6 million in realized gains in 2024. Overall, net realized gains resulted from $907.0 million in realizations for the year ended December 31, 2024, as compared to $708.3 million in realizations for the year ended December 31, 2023.
Fair value adjustments, net of previously recognized unrealized gains/(losses) transferred to realized gains, are affected by a number of factors, including changes in discount rate, duration and litigation risk premium, the reversal of previously recognized unrealized gains upon conclusion of a matter and its transfer to realized gains and actual performance of matters as they pass through milestones. All of those factors contributed to the unrealized gain of $128.0 million for the year ended December 31, 2024 as compared to an unrealized gain of $1.1 billion for the year ended December 31, 2023, which included $127.2 million and $820.0 million for YPF-related assets for 2024 and 2023, respectively. Excluding the fair value adjustments on the YPF-related assets for both 2024 and 2023, fair value adjustments, net of previously recognized unrealized gains/(losses) transferred to realized gains, decreased 100% year-over-year, largely impacted by the transfer of previously recognized unrealized gains to realized gains from the realizations of certain assets that occurred in 2024.
As part of our fair value methodology, we discount the expected future cash flows. If discount rates had remained unchanged from December 31, 2023, applying those same rates to the portfolio at December 31, 2024 fair value would have been approximately $8.7 million higher than as reported. The weighted average
discount rate across the portfolio slightly decreased to 6.9% as of December 31, 2024, from 7.0% as of December 31, 2023, and interest sensitivities of the portfolio to assumed basis point changes in rates at each period end are disclosed in “—Critical accounting estimates—Fair value of capital provision assets”. Fair value is also impacted by changes in the adjusted risk premium, which was slightly up at 31.4% as of December 31, 2024, from 30.2% as of December 31, 2023. The impact of the addition of newly acquired or originated capital provision assets during the period (which generally have higher risk premiums at the start of the capital provision asset’s life) was offset by net favorable developments across the rest of the portfolio.
Plus/(Less): Third-party interests in capital provision assets
Third-party interests in capital provision assets reduced capital provision income by $42.4 million for the year ended December 31, 2024, as compared to a $279.3 million reduction for the year ended December 31, 2023. While increases in the fair value of the YPF-related assets drive offsetting reductions due to the third-party interests in that matter, those increases were considerably smaller in 2024, given the absence of the 2023 events that drove fair value increases in that year.
Asset management income/(loss)
Asset management income increased 9% for the year ended December 31, 2024, primarily due to higher performance fee income earned during 2024. The timing of the recognition of performance fees is variable as they are recognized when a reliable estimate of the performance fees can be made, and it is probable that a significant reversal in the amount of cumulative revenue recognized will not occur. The maturity and the terms of the applicable distribution waterfall for each of our private funds impacts this timing. As BOF-C is a consolidated entity, asset management income from this private fund is eliminated on a consolidated basis and is not reflected here. See “—Asset Management and Other Services segment” for a discussion of our asset management income, reflecting the impact of the income from BOF-C.
Marketable securities income/(loss) and interest
Marketable securities income and interest increased 105% for the year ended December 31, 2024, mainly driven by higher income earned from our cash and cash equivalents, primarily due to larger average balances and higher interest rates throughout 2024, as compared to 2023.
Other income/(loss)
Other income decreased 31% for the year ended December 31, 2024, as there were more Burford Worldwide Insurance Limited matters closed in 2023 than in 2024.
Operating expenses
The table below sets forth the components of our total operating expenses for the periods indicated.
| | | | | | | | | | | | | | | | | | | | | | | | | | |
| | Years ended December 31, | | | | |
| ($ in thousands) | | 2024 | | 2023 | | Change | | % change |
| Salaries and benefits | | $ | 42,418 | | | $ | 39,788 | | | $ | 2,630 | | | 7 | % |
| Annual incentive compensation | | 29,210 | | | 32,697 | | | (3,487) | | | (11) | % |
| Share-based and deferred compensation | | 8,822 | | | 21,128 | | | (12,306) | | | (58) | % |
| Long-term incentive compensation including accruals | | 43,209 | | | 127,471 | | | (84,262) | | | (66) | % |
| Total compensation and benefits | | 123,659 | | | 221,084 | | | (97,425) | | | (44) | % |
| General, administrative and other | | 31,025 | | | 33,656 | | | (2,631) | | | (8) | % |
| Case-related expenditures ineligible for inclusion in asset cost | | 801 | | | 16,496 | | | (15,695) | | | (95) | % |
| Total operating expenses | | 155,485 | | | 271,236 | | | (115,751) | | | (43) | % |
Total operating expenses decreased 43% for the year ended December 31, 2024, driven primarily by lower fair value driven compensation-related accruals and lower case-related expenditures ineligible for inclusion in asset cost due to the resolution of certain assets in 2023 and recoveries from an insurance policy in 2024.
The decrease in long-term incentive compensation including accruals is primarily attributable to the absence in the year ended December 31, 2024, of large fair value increases in the YPF-related assets as a result of the March 2023 Ruling (as defined below) and the September 2023 Final Judgment (as defined below).
Case-related expenditures ineligible for inclusion in asset cost significantly decreased for the year ended December 31, 2024, reflecting a decrease in the level of expenses and instances where we incur legal or other related expenses that are directly attributable to a capital provision asset but that do not form part of the deployed amount under a capital provision agreement, such as when we bear incremental legal expenses
in cases. Examples of such expenses include fees paid to third parties when our management has sought its own legal advice or expert opinion with respect to matters related to a capital provision asset. These expenses are expected to fluctuate period-over-period and accounted for $2.7 million and $14.7 million of total case-related expenditures ineligible for inclusion in asset cost for the year ended December 31, 2024 and 2023, respectively. During 2024, we also resolved a long-running coverage dispute with our insurance carrier over payment of some such expenditures in matters where claims had been made against us, resulting in a $3.8 million payment that reduced case-related expenditures for 2024.
Case-related expenditures ineligible for inclusion in asset cost also include some situations where we are effectively the claimant in a litigation matter either due to the acquisition of assets or the assignment of a claim. Such expenditures accounted for $1.9 million and $1.8 million of the total case-related expenditures ineligible for inclusion in asset cost for the year ended December 31, 2024 and 2023, respectively. While we report these costs as expenses for accounting purposes, we treat them for return and performance purposes no differently than traditional legal finance arrangements.
Other expenses
The table below sets forth the components our total other expenses for the periods indicated.
| | | | | | | | | | | | | | | | | | | | | | | | | | |
| | Years ended December 31, | | | | |
| ($ in thousands) | | 2024 | | 2023 | | Change | | % change |
| Finance costs | | $ | 135,593 | | | $ | 99,135 | | | $ | 36,458 | | | 37 | % |
| Foreign currency transactions (gains)/losses | | 1,421 | | | (21,752) | | | 23,173 | | | NM |
| Total other expenses | | 137,014 | | | 77,383 | | | 59,631 | | | 77 | % |
Finance costs
Finance costs increased 37% for the year ended December 31, 2024, primarily due to the inclusion in 2024 of interest expense related to the Additional 2031 Notes (as defined below) issued in January 2024 and to the 2031 Notes issued in June 2023, partially offset by the early redemption of the 6.125% bonds due 2024 in July 2023.
Foreign currency transactions (gains)/losses
Foreign currency transactions (gains)/losses were losses of $1.4 million for the year ended December 31, 2024, as compared to gains of $21.8 million for the year ended December 31, 2023. The year-over-year change was primarily driven by the absence of a $19.3 million foreign currency gain from a capital redemption between subsidiaries with different functional currencies that occurred during 2023.
Provision for/(benefit from) income taxes
The table below sets forth our provision for/(benefit from) income taxes for the periods indicated.
| | | | | | | | | | | | | | | | | | | | | | | | | | |
| | Years ended December 31, | | | | |
| ($ in thousands) | | 2024 | | 2023 | | Change | | % change |
| Provision for/(benefit from) income taxes: | | $ | 24,005 | | | $ | 20,084 | | | $ | 3,921 | | | 20 | % |
Provision for income taxes increased 20% for the year ended December 31, 2024, due primarily to limitations on deductions and use of net operating losses in various jurisdictions, as compared to 2023, as well as more of our reported net income before taxes having been earned in jurisdictions with higher statutory tax rates. Cash taxes paid were $19.5 million and $14.1 million for the year ended December 31, 2024 and 2023, respectively.
The OECD has introduced Pillar Two which is considered an alternative minimum tax accounted for as a period cost that would impact our future effective tax rate in the year in which the Pillar Two tax obligation arises. Guernsey as well as certain countries in which we operate have enacted legislation to implement Pillar Two. It is important to note, however, Pillar Two tax obligation only arises as of the tax year following a period after a multi-national enterprise has earned annual consolidated revenues of at least €750 million in at least two out of the prior four accounting periods.
Based on our annual consolidated revenues over the past several years, we are not currently subject to the OECD Pillar Two mandate. Notwithstanding this fact, we have assessed the potential impact of Pillar Two based on laws enacted as of the date of this 2024 Form 10-K and there was no material effect on our current effective tax rate, business, financial condition, results of operations and/or liquidity for the year ended December 31, 2024. Based on this assessment and the prospective nature of the effective date of the
application of the Pillar Two rules, we also do not currently anticipate any material effect on our effective tax rate, business, financial condition, results of operations and/or liquidity for the year ending December 31, 2025. See “Risk factors—Changes in tax laws and regulations or unanticipated tax liabilities could affect our effective tax rate, business, financial condition, results of operations and/or liquidity” for additional information with respect to the risks relating to Pillar Two.
Net income/(loss) attributable to non-controlling interests
The table below sets forth our net income/(loss) attributable to non-controlling interests for the periods indicated.
| | | | | | | | | | | | | | | | | | | | | | | | | | |
| | Years ended December 31, | | | | |
| ($ in thousands) | | 2024 | | 2023 | | Change | | % change |
| Net income/(loss) attributable to non-controlling interests: | | $ | 83,099 | | | $ | 107,677 | | | $ | (24,578) | | | (23) | % |
We consolidate certain entities that have other shareholders and/or investors, including the Advantage Fund and BOF-C. The Advantage Fund does not have a traditional management and performance fee structure, but instead we retain any excess returns after the first 10% of annual simple returns are remitted to the Advantage Fund’s investors. With respect to BOF-C, under the co-investing arrangement with the sovereign wealth fund, we (in our capacity as the appointed investment adviser) receive reimbursement of expenses from BOF-C up to a certain level before we or the sovereign wealth fund, as applicable, receive a return of capital. After the repayment of capital, we then receive a portion of the return generated from the assets held by BOF-C. We include 100% of the Advantage Fund’s and BOF-C’s income and expenses in the applicable line items in our consolidated statements of operations (for example, 100% of the income on the Advantage Fund’s and BOF-C’s capital provision assets is included in capital provision income in our consolidated statements of operations), and the net amount of those income and expense line items that relate to third-party interests is included in net income attributable to non-controlling interests. In turn, this net amount is deducted from net income to arrive at net income attributable to Burford Capital Limited shareholders in our consolidated statements of operations. Net income attributable to non-controlling interests does not include Colorado. See note 2 (Summary of significant accounting policies—Consolidation) to our consolidated financial statements contained in this 2024 Form 10-K for additional information with respect to our consolidation policies. Net income attributable to non-controlling interests decreased 23% for the year ended December 31, 2024, reflecting non-controlling interests’ share of income on capital provision assets, the majority of which relates to the decrease in the capital provision income for BOF-C.
Consolidated statements of financial condition as of December 31, 2024 as compared to December 31, 2023
The table below sets forth specified line items from our consolidated statements of financial condition as of the dates indicated.
| | | | | | | | | | | | | | | | | | | | | | | | | | |
| | December 31 | | | | |
| ($ in thousands) | | 2024 | | 2023 | | Change | | % change |
| Cash and cash equivalents | | $ | 469,930 | | | $ | 220,549 | | | $ | 249,381 | | | 113 | % |
| Marketable securities | | 79,020 | | | 107,561 | | | (28,541) | | | (27) | % |
| Other assets | | 61,006 | | | 63,464 | | | (2,458) | | | (4) | % |
| Due from settlement of capital provision assets | | 183,858 | | | 265,540 | | | (81,682) | | | (31) | % |
| Capital provision assets | | 5,243,917 | | | 5,045,388 | | | 198,529 | | | 4 | % |
Cash and cash equivalents and marketable securities
Cash and cash equivalents increased 113% and marketable securities decreased 27% both as of December 31, 2024. The net increase in cash and cash equivalents and marketable securities primarily reflects the proceeds received from capital provision assets and from the issuance of the Additional 2031 Notes (as defined below) in January 2024, partially offset by the funding of capital provision assets and the impact from third-party net distributions as well as from the partial redemption of the 6.125% bonds due 2025 and the payment of dividends.
Other assets
Other assets was $61.0 million as of December 31, 2024, which remained relatively flat as compared to December 31, 2023.
Due from settlement of capital provision assets
Due from settlement of capital provision assets decreased 31% as of December 31, 2024, primarily as a result of collections of due from settlement receivables and the impact of realizations during 2024. Of the $265.5 million of due from settlement receivables as of December 31, 2023, 97% was collected in cash during 2024.
Capital provision assets
Capital provision assets increased 4% as of December 31, 2024, primarily reflecting fair value gains generated in 2024, and continued deployments into capital provision assets, partially offset by the impact of realizations.
Fair value of capital provision assets
Valuation policy
See note 2 (Summary of significant accounting policies—Fair value of financial instruments) to our consolidated financial statements contained in this 2024 Form 10-K for a description of our valuation policy for capital provision assets.
Fair value of capital provision assets
The table below sets forth the fair value of capital provision assets, comprised of deployed cost and unrealized gains, for the YPF-related assets and other assets as of the dates indicated.
| | | | | | | | | | | | | | | | | | | | | | | | | | | | | | | | | | | | | | |
| | December 31, 2024 | | December 31, 2023 |
| | | | | | Total | | | | | | Total |
| | | | Third-party | | segments | | | | Third-party | | segments |
| ($ in thousands) | | Consolidated | | interests | | (Burford-only) | | Consolidated | | interests | | (Burford-only) |
| Capital provision assets | | $ | 5,243,917 | | | $ | (1,672,693) | | | $ | 3,571,224 | | | $ | 5,045,388 | | | $ | (1,613,276) | | | $ | 3,432,112 | |
| Deployed costs | | 2,341,377 | | | (668,784) | | | 1,672,593 | | | 2,280,563 | | | (668,281) | | | 1,612,282 | |
| Deployed costs on YPF-related assets | | 76,405 | | | (6,829) | | | 69,576 | | | 67,167 | | | (6,829) | | | 60,338 | |
| Deployed costs on non-YPF-related assets | | 2,264,972 | | | (661,955) | | | 1,603,017 | | | 2,213,396 | | | (661,452) | | | 1,551,944 | |
| Unrealized gains | | 2,902,540 | | | (1,003,909) | | | 1,898,631 | | | 2,764,825 | | | (944,995) | | | 1,819,830 | |
| Unrealized gains on YPF-related assets | | 2,118,112 | | | (722,213) | | | 1,395,899 | | | 1,990,950 | | | (679,631) | | | 1,311,319 | |
| Unrealized gains on non-YPF-related assets | | 784,428 | | | (281,696) | | | 502,732 | | | 773,875 | | | (265,364) | | | 508,511 | |
On a consolidated basis, the aggregate fair value of our capital provision assets was $5.2 billion, the aggregate deployed cost was $2.3 billion and the aggregate unrealized gains were $2.9 billion each as of December 31, 2024. The increase of $60.8 million in deployed cost is a result of deployments during 2024, offset by the return of capital from realizations. See “—Consolidated statements of operations for the year ended December 31, 2024 as compared to the year ended December 31, 2023—Revenues” above for additional information with respect to the change in unrealized gains, which is driven by this period’s fair value adjustment, net of previously recognized unrealized gains transferred to realized gains.
Within total segments (Burford-only), the aggregate fair value of our capital provision assets was $3.6 billion, the aggregate deployed cost was $1.7 billion and the aggregate unrealized gains were $1.9 billion each as of December 31, 2024. The increase of $60.3 million in deployed cost is a result of deployments during 2024, offset by the return of capital from realizations. See “—Segments—Principal Finance segment—Gains from capital provision asset portfolio” for additional information with respect to the change in unrealized gains, which is driven by this period’s fair value adjustment, net of previously recognized unrealized gains transferred to realized gains.
Fair value of YPF-related assets
The determination of the fair value of the YPF-related assets—our financing of the Petersen and Eton Park claims (as described below)—is based on the same methodology that we use to value all our other capital provision assets. In June 2019, we sold a portion of the Petersen claim, constituting $100.0 million of a $148.0 million placement, to a number of institutional investors. Other third-party holders sold the remaining portion. Given the size of this sale and the participation of a meaningful number of third-party institutional investors, we concluded that this market evidence should be factored into our valuation process of the YPF-related assets. As a result, we have utilized the implicit valuation of the Petersen claim to calibrate our
model to determine the fair value of the YPF-related assets in subsequent periods through December 31, 2024. Episodic subsequent trading of portions of the Petersen claim have not been factored into our valuation process of the YPF-related assets.
On March 31, 2023, the US District Court for the Southern District of New York (the “Court”) issued its opinion and order (the “March 2023 Ruling”) in connection with the summary judgment motions filed by the parties in the Petersen and Eton Park cases against the Republic of Argentina and YPF S.A. In summary, the Court decided that (i) Argentina was liable to Petersen and Eton Park for failing to make a tender offer for their YPF shares in 2012, (ii) YPF was not liable for failing to enforce its bylaws against Argentina, (iii) the various arguments Argentina had made to try to reduce its damages liability from the straightforward application of the formula in the bylaws were unavailing and (iv) an evidentiary hearing was needed to resolve two factual issues to enable the computation of damages, where those issues were (1) the date on which the Republic of Argentina should have made a tender offer for YPF S.A.’s shares and (2) the appropriate rate of pre-judgment interest to be applied.
On September 8, 2023, the Court issued its findings of fact and conclusions of law in connection with the Petersen and Eton Park cases against the Republic of Argentina and YPF S.A. In summary, the Court decided the issues raised at the evidentiary hearing in Petersen’s and Eton Park’s favor, holding that the appropriate date for the tender offer was April 16, 2012, and that pre-judgment interest should run from May 3, 2012, at a simple interest rate of 8%.
On September 15, 2023, the Court issued a final judgment (the “September 2023 Final Judgment”) that resulted in a complete win by Petersen and Eton Park with respect to damages against the Republic of Argentina of $16.1 billion, comprised of $14.3 billion due to Petersen and $1.7 billion due to Eton Park. The September 2023 Final Judgment awards post-judgment interest at a rate of 5.42% per annum, computed daily to the date of payment and compounded annually. On October 10, 2023, the Republic of Argentina filed a notice of appeal with the US Court of Appeals for the Second Circuit and, on October 18, 2023, Petersen and Eton Park filed a notice a cross-appeal as to the dismissal of their claims against YPF S.A. On August 23, 2024, briefing on the appeal and cross-appeal was completed.
On a consolidated basis, the fair value of the YPF-related assets (both Petersen and Eton Park combined) was $2.2 billion as of December 31, 2024. Our cost basis and unrealized gains increased $9.2 million and $127.2 million to $76.4 million and $2.1 billion, respectively, during 2024, due to the progression closer to our expected conclusion date.
Within total segments (Burford-only), the fair value of the YPF-related assets (both Petersen and Eton Park combined) was $1.5 billion as of December 31, 2024. Our cost basis and our unrealized gains increased $9.2 million and $84.6 million to $69.6 million and $1.4 billion, respectively, during 2024, due to the progression closer to our expected conclusion date.
Undrawn commitments
Undrawn commitments are unfunded commitments which are attributable to our capital provision asset portfolio and can be divided into two categories: definitive and discretionary.
▪Definitive commitments are those where we are contractually obligated to advance incremental capital and failure to do so would typically result in adverse contractual consequences (such as a dilution in our returns or the loss of our deployed capital in a case).
▪Discretionary commitments are those where we retain a considerable degree of discretion over whether to advance capital and generally would not suffer an adverse financial consequence from not doing so
The table below sets forth the components of our total capital provision undrawn commitments as of the dates indicated.
| | | | | | | | | | | | | | | | | | | | | | | | | | |
| | December 31, | | | | |
| ($ in thousands) | | 2024 | | 2023 | | Change | | % change |
| Definitive | | $ | 962,808 | | | $ | 839,973 | | | $ | 122,835 | | | 15 | % |
| Discretionary | | 1,032,433 | | | 977,733 | | | 54,700 | | | 6 | % |
| Legal risk (definitive) | | 41,318 | | | 55,583 | | | (14,265) | | | (26) | % |
| Total capital provision undrawn commitments | | 2,036,559 | | | 1,873,289 | | | 163,270 | | | 9 | % |
As of December 31, 2024 approximately 49% of our legal finance undrawn commitments related to definitive commitments and approximately 51% related to discretionary, as compared to 48% and 52%, respectively as of December 31, 2023.
Segments
We have two reportable segments through which we provide legal finance products and services to our clients: (i) Principal Finance and (ii) Asset Management and Other Services.
Our Principal Finance segment funds capital to legal finance assets from Burford’s balance sheet, primarily as capital provision assets, and in limited scope through interests in private funds managed by Burford. These capital provision assets and private fund interests generate our capital provision income, which is the most significant driver of our total revenues.
Our Asset Management and Other Services segment manages legal finance assets on behalf of third-party investors, and we provide other services to the legal industry for both of which we receive fees. These fees are primarily reflected as asset management income, which is a secondary contributor to our total revenues. As of December 31, 2024, we operated eight private funds and three “sidecar” funds as an investment adviser registered with and regulated by the SEC.
The Asset Management and Other Services segment may also reflect the financial impact of new initiatives in the legal services space, including initial diligence and start-up costs, which may impact segment-level profitability.
Statements of operations for the year ended December 31, 2024, as compared to the year ended December 31, 2023
The table below sets forth the components of our income/(loss) before income taxes by segment for the periods indicated.
| | | | | | | | | | | | | | | | | | | | | | | | | | | | | | | | |
| | | | | | | | Reconciliation |
| ($ in thousands) | | Principal Finance | | Asset Management and Other Services | | Total segments (Burford-only) | | Reconciling items(1) | | Consolidated |
| Year ended December 31, 2024 | | | | | | | | | | |
| Total revenues | | $ | 412,702 | | | $ | 47,678 | | | $ | 460,380 | | | $ | 85,707 | | | $ | 546,087 | |
| Total operating expenses | | 125,713 | | | 27,341 | | | 153,054 | | | 2,431 | | | 155,485 | |
| Total other expenses | | 136,837 | | | — | | | 136,837 | | | 177 | | | 137,014 | |
| Income/(loss) before income taxes | | 150,152 | | | 20,337 | | | 170,489 | | | 83,099 | | | 253,588 | |
| | | | | | | | | | |
| Year ended December 31, 2023 | | | | | | | | | | |
| Total revenues | | 908,438 | | | 68,104 | | | 976,542 | | | 110,360 | | | 1,086,902 | |
| Total operating expenses | | 240,513 | | | 28,025 | | | 268,538 | | | 2,698 | | | 271,236 | |
| Total other expenses | | 77,399 | | | — | | | 77,399 | | | (16) | | | 77,383 | |
| Income/(loss) before income taxes | | 590,526 | | | 40,079 | | | 630,605 | | | 107,678 | | | 738,283 | |
| | | | | | | | | | |
| Change | | | | | | | | | | |
| Total revenues | | (495,736) | | | (20,426) | | | (516,162) | | | (24,653) | | | (540,815) | |
| Total operating expenses | | (114,800) | | | (684) | | | (115,484) | | | (267) | | | (115,751) | |
| Total other expenses | | 59,438 | | | — | | | 59,438 | | | 193 | | | 59,631 | |
| Income/(loss) before income taxes | | (440,374) | | | (19,742) | | | (460,116) | | | (24,579) | | | (484,695) | |
| 1. Reconciling items include the proportional operating results that are attributable to third-party limited partners and minority investors in consolidated entities, including BOF-C, the Strategic Value Fund, the Advantage Fund and Colorado. |
|
The absence of large fair value increases in capital provision income for the YPF-related assets, which occurred in 2023, was a significant driver of the decrease in income before income taxes for the year ended December 31, 2024 compared to the year ended December 31, 2023 on both a consolidated and total segments (Burford-only) basis. However, an increase in realizations resulting in a 75% increase in net realized gains year-over-year, on both a consolidated and total segments (Burford-only) basis, helped to offset the absence of large fair value increases for the YPF-related assets. Additionally, a decrease in operating expenses, for both consolidated and total segments (Burford-only), in each case primarily due to a decrease in compensation-related accruals, helped to partially offset the decrease in income before income taxes. The net result was $253.6 million and $170.5 million in income before income taxes for the year ended
December 31, 2024, on a consolidated and total segments (Burford-only) basis, respectively. For the year-over-year discussion of each of the reportable segments, refer to the specific segment sections further below.
The table below sets forth the components of our operating expenses by consolidated and total segments (Burford-only) for the periods indicated.
| | | | | | | | | | | | | | | | | | | | |
| | | | Reconciliation |
| ($ in thousands) | | Total segments (Burford-only) | | Reconciling items(1) | | Consolidated |
| Year ended December 31, 2024 | | | | | | |
| Compensation and benefits | | | | | | |
| Salaries and benefits | | $ | 42,418 | | | $ | — | | | $ | 42,418 | |
| Annual incentive compensation | | 29,210 | | | — | | | 29,210 | |
| Share-based and deferred compensation | | 8,822 | | | — | | | 8,822 | |
| Long-term incentive compensation including accruals | | 43,209 | | | — | | | 43,209 | |
| General, administrative and other | | 30,452 | | | 573 | | | 31,025 | |
| Case-related expenditures ineligible for inclusion in asset cost | | (1,057) | | | 1,858 | | | 801 | |
| Total operating expenses | | 153,054 | | | 2,431 | | | 155,485 | |
| | | | | | |
| Year ended December 31, 2023 | | | | | | |
| Compensation and benefits | | | | | | |
| Salaries and benefits | | 39,788 | | | — | | | 39,788 | |
| Annual incentive compensation | | 32,697 | | | — | | | 32,697 | |
| Share-based and deferred compensation | | 21,128 | | | — | | | 21,128 | |
| Long-term incentive compensation including accruals | | 127,471 | | | — | | | 127,471 | |
| General, administrative and other | | 32,783 | | | 873 | | | 33,656 | |
| Case-related expenditures ineligible for inclusion in asset cost | | 14,671 | | | 1,825 | | | 16,496 | |
| Total operating expenses | | 268,538 | | | 2,698 | | | 271,236 | |
| | | | | | |
| Change | | | | | | |
| Compensation and benefits | | | | | | |
| Salaries and benefits | | 2,630 | | | — | | | 2,630 | |
| Annual incentive compensation | | (3,487) | | | — | | | (3,487) | |
| Share-based and deferred compensation | | (12,306) | | | — | | | (12,306) | |
| Long-term incentive compensation including accruals | | (84,262) | | | — | | | (84,262) | |
| General, administrative and other | | (2,331) | | | (300) | | | (2,631) | |
| Case-related expenditures ineligible for inclusion in asset cost | | (15,728) | | | 33 | | | (15,695) | |
| Total operating expenses | | (115,484) | | | (267) | | | (115,751) | |
| 1. Adjusted for third-party interests in non-wholly owned consolidated entities, which included BOF-C, the Strategic Value Fund, the Advantage Fund, Colorado and several other entities in which the Company holds investments and there is a third-party partner in, or owner of, those entities. |
Total operating expenses, for the year ended December 31, 2024, decreased $115.8 million for consolidated and decreased $115.5 million for total segments (Burford-only). In each case, the decrease in total operating expenses was driven primarily by lower long-term incentive compensation accruals, which was driven by the absence in 2024 of large fair value increases in the YPF-related assets, and lower case-related expenditures ineligible for inclusion in asset cost due to the resolution of certain assets in 2023 and recoveries from an insurance policy in 2024.
Statements of financial condition as of December 31, 2024, as compared to December 31, 2023
The table below sets forth the components of our consolidated statements of financial condition by segment as of the dates indicated.
| | | | | | | | | | | | | | | | | | | | | | | | | | | | | | | | |
| | | | | | | | Reconciliation |
| ($ in thousands) | | Principal Finance | | Asset Management and Other Services | | Total segments (Burford-only) | | Reconciling items(1) | | Consolidated |
| Year ended December 31, 2024 | | | | | | | | | | |
| Cash and cash equivalents and marketable securities | | $ | 508,031 | | | $ | 12,650 | | | $ | 520,681 | | | $ | 28,269 | | | $ | 548,950 | |
| Other assets | | $ | 23,711 | | | $ | 151,770 | | | $ | 175,481 | | | $ | (114,475) | | | $ | 61,006 | |
| Due from settlement of capital provision assets | | $ | 183,651 | | | $ | — | | | $ | 183,651 | | | $ | 207 | | | $ | 183,858 | |
| Capital provision assets | | $ | 3,571,224 | | | $ | — | | | $ | 3,571,224 | | | $ | 1,672,693 | | | $ | 5,243,917 | |
| Total assets | | $ | 4,397,954 | | | $ | 190,377 | | | $ | 4,588,331 | | | $ | 1,586,694 | | | $ | 6,175,025 | |
| | | | | | | | | | |
| Year ended December 31, 2023 | | | | | | | | | | |
| Cash and cash equivalents and marketable securities | | $ | 291,386 | | | $ | 12,090 | | | $ | 303,476 | | | $ | 24,634 | | | $ | 328,110 | |
| Other assets | | $ | 26,165 | | | $ | 133,952 | | | $ | 160,117 | | | $ | (96,653) | | | $ | 63,464 | |
| Due from settlement of capital provision assets | | $ | 185,267 | | | $ | — | | | $ | 185,267 | | | $ | 80,273 | | | $ | 265,540 | |
| Capital provision assets | | $ | 3,432,112 | | | $ | — | | | $ | 3,432,112 | | | $ | 1,613,276 | | | $ | 5,045,388 | |
| Total assets | | $ | 4,043,848 | | | $ | 172,016 | | | $ | 4,215,864 | | | $ | 1,621,530 | | | $ | 5,837,394 | |
| | | | | | | | | | |
| Change | | | | | | | | | | |
| Cash and cash equivalents and marketable securities | | $ | 216,645 | | | $ | 560 | | | $ | 217,205 | | | $ | 3,635 | | | $ | 220,840 | |
| Other assets | | $ | (2,454) | | | $ | 17,818 | | | $ | 15,364 | | | $ | (17,822) | | | $ | (2,458) | |
| Due from settlement of capital provision assets | | $ | (1,616) | | | $ | — | | | $ | (1,616) | | | $ | (80,066) | | | $ | (81,682) | |
| Capital provision assets | | $ | 139,112 | | | $ | — | | | $ | 139,112 | | | $ | 59,417 | | | $ | 198,529 | |
| Total assets | | $ | 354,106 | | | $ | 18,361 | | | $ | 372,467 | | | $ | (34,836) | | | $ | 337,631 | |
| 1. Reconciling items include the proportional operating results that are attributable to third-party limited partners and minority investors in consolidated entities, including BOF-C, the Strategic Value Fund, the Advantage Fund and Colorado. |
Total assets, as of December 31, 2024, increased $337.6 million for consolidated and increased $372.5 million for total segments (Burford-only). In each case, the increase in total assets can be attributable to increases in cash and cash equivalents and marketable securities and increases in capital provision assets. See “—Consolidated statements of financial condition as of December 31, 2024, as compared to December 31, 2023” above for additional information on the components of our consolidated statements of financial condition. For the year-over-year discussion of each of the reportable segments, refer to the specific segment sections further below.
Group-wide portfolio
Group-wide portfolio refers to the totality of assets managed by us, which includes assets financed by our balance sheet through our Principal Finance segment and assets financed by third-party capital through our Asset Management and Other Services segment. The table below sets forth the components of our portfolio by segment as of the dates indicated.
| | | | | | | | | | | | | | | | | | | | | | | | | | |
| | December 31, | | | | |
| ($ in thousands) | | 2024 | | 2023 | | Change | | % change |
| Capital provision assets - Principal Finance segment | | | | | | | | |
| Fair value | | $ | 3,571,224 | | | $ | 3,432,112 | | | $ | 139,112 | | | 4 | % |
| Undrawn commitments | | 1,632,856 | | | 1,408,005 | | | 224,851 | | | 16 | % |
| Total portfolio value - Principal Finance segment | | 5,204,080 | | | 4,840,117 | | | 363,963 | | | 8 | % |
| | | | | | | | |
| Capital provision assets (funded by third parties) - Asset Management and Other Services segment | | | | | | | | |
| Fair value | | 1,353,893 | | | 1,385,958 | | | (32,065) | | | (2) | % |
| Undrawn commitments | | 491,186 | | | 582,924 | | | (91,738) | | | (16) | % |
| Total | | 1,845,079 | | | 1,968,882 | | | (123,803) | | | (6) | % |
| | | | | | | | |
| Post-settlement | | | | | | | | |
| Fair value | | 272,424 | | | 298,854 | | | (26,430) | | | (9) | % |
| Undrawn commitments | | 67,961 | | | 62,455 | | | 5,506 | | | 9 | % |
| Total | | 340,385 | | | 361,309 | | | (20,924) | | | (6) | % |
| | | | | | | | |
| Total portfolio value - Asset Management and Other Services segment | | 2,185,464 | | | 2,330,191 | | | (144,727) | | | (6) | % |
| | | | | | | | |
| Capital provision assets - group-wide portfolio | | | | | | | | |
| Fair value | | 5,197,541 | | | 5,116,924 | | | 80,617 | | | 2 | % |
| Undrawn commitments | | 2,192,003 | | | 2,053,384 | | | 138,619 | | | 7 | % |
| Total group-wide portfolio | | 7,389,544 | | | 7,170,308 | | | 219,236 | | | 3 | % |
Group-wide portfolio increased 3% as of December 31, 2024, comprised of increases in the fair value of capital provision assets (driven largely by increases in financing) and increases in undrawn commitments for capital provision assets (driven by new commitments added during the year). For the year-over-year discussion of each of the reportable segments, refer to the specific segment sections further below.
Group-wide new commitments
New commitments reflect new contractual financing agreements, which are inflows to the portfolio, and serve as one indicator for new business activity. When referring to new commitments for our combined business segments, we use the term “group-wide”, as opposed to total segments (Burford-only) which we use for our financial results, due to the third-party nature of the capital in our asset management business. The table below sets forth the components of our group-wide new commitments of capital provision assets by segment for the periods indicated.
| | | | | | | | | | | | | | | | | | | | | | | | | | |
| | Years ended December 31, | | | | |
| ($ in thousands) | | 2024 | | 2023 | | Change | | % change |
| Principal Finance segment (Burford-only) | | $ | 701,629 | | | $ | 724,211 | | | $ | (22,582) | | | (3) | % |
| Asset Management and Other Services segment (funded by third-parties) | | 184,423 | | | 502,389 | | | (317,966) | | | (63) | % |
| Group-wide new commitments | | 886,052 | | | 1,226,600 | | | (340,548) | | | (28) | % |
Group-wide new commitments, decreased 28% for the year ended December 31, 2024. The decrease in group-wide new commitments was largely due to the absence of new commitments for the Advantage Fund, and to a lesser extent, lower new commitments related to post-settlement assets, during the year ended December 31, 2024. The structure of the Advantage Fund, with its simple 10% preferred return to investors, was appealing in a low interest rate environment but less so as interest rates rose, and we considered the
desires of the fund’s investors in avoiding the deployment of additional capital if premium returns for investors were not available in its final year.
Principal Finance segment
Our Principal Finance segment allocates capital to legal finance assets from Burford’s balance sheet, primarily as capital provision assets, and in limited scope through interests in private funds managed by Burford. These capital provision assets and private fund interests generate capital provision income, which is the most significant driver of our total revenues.
Given the direct balance sheet exposure in our Principal Finance segment, we generate capital provision income directly from the gross returns of the portfolio, which are driven by the outcomes of litigation and related legal activity. Recognition of capital provision income is based on our fair value methodology, see note 2 (Summary of significant accounting policies) to our consolidated financial statements contained in this 2024 Form 10-K, for each asset in the portfolio, which we apply quarterly, and the resulting change in fair value across the Principal Finance segment portfolio.
Statements of operations for the year ended December 31, 2024, as compared to the year ended December 31, 2023
The table below sets forth the components of our income/(loss) before income taxes for our Principal Finance segment for the periods indicated.
| | | | | | | | | | | | | | | | | | | | | | | | | | |
| Principal Finance segment | | Years ended December 31, | | | | |
| ($ in thousands) | | 2024 | | 2023 | | Change | | % change |
| Capital provision income/(loss) | | $ | 388,124 | | | $ | 896,371 | | | $ | (508,247) | | | (57) | % |
| Marketable securities income/(loss) and interest | | 24,578 | | | 12,067 | | | 12,511 | | | 104 | % |
| Total revenues | | 412,702 | | | 908,438 | | | (495,736) | | | (55) | % |
| | | | | | | | |
| Compensation and benefits | | 101,758 | | | 196,623 | | | (94,865) | | | (48) | % |
| General, administrative and other | | 25,012 | | | 29,219 | | | (4,207) | | | (14) | % |
| Case-related expenditures ineligible for inclusion in asset cost | | (1,057) | | | 14,671 | | | (15,728) | | | NM |
| Total operating expenses | | 125,713 | | | 240,513 | | | (114,800) | | | (48) | % |
| | | | | | | | |
| Finance costs | | 135,593 | | | 99,136 | | | 36,457 | | | 37 | % |
| Foreign currency transactions (gains)/losses | | 1,244 | | | (21,737) | | | 22,981 | | | NM |
| Total other expenses | | 136,837 | | | 77,399 | | | 59,438 | | | 77 | % |
| | | | | | | | |
| Income/(loss) before income taxes | | 150,152 | | | 590,526 | | | (440,374) | | | (75) | % |
Total revenues decreased 55% for the year ended December 31, 2024, mainly due to the absence of large fair value increases in capital provision income for the YPF-related assets, which occurred during 2023, arising from two separate milestone events, the March 2023 Ruling and the September 2023 Final Judgment. The decrease in fair value was partially offset by a 75% increase in net realized gains to $327.2 million for the year ended December 31, 2024.
Total operating expenses decreased 48% for the year ended December 31, 2024, driven primarily by lower fair value driven compensation-related accruals and lower case-related expenditures ineligible for inclusion in asset cost due to the resolution of certain assets in 2023 and recoveries from an insurance policy in 2024.
Total other expenses increased 77% for the year ended December 31, 2024, primarily due to the inclusion in 2024 of interest expense related to the Additional 2031 Notes (as defined below) issued in January 2024 and to the 2031 Notes issued in June 2023, partially offset by the early redemption of the 6.125% bonds due 2024 in July 2023. In addition, the increase in other expenses was also driven by the absence of a $19.3 million foreign currency gain from a capital redemption between subsidiaries with different functional currencies that occurred during 2023.
As a result of the factors described above, income/(loss) before income taxes decreased 75% for the year ended December 31, 2024.
Gains from capital provision asset portfolio
The table below sets forth the components of our total capital provision income for the periods indicated.
| | | | | | | | | | | | | | | | | | | | | | | | | | |
| Principal Finance segment | | December 31, | | | | |
| ($ in thousands) | | 2024 | | 2023 | | Change | | % change |
| Net realized gains/(losses) | | $ | 327,174 | | | $ | 187,376 | | | $ | 139,798 | | | 75 | % |
| Fair value adjustment during the period, net of previously recognized unrealized gains/(losses) transferred to realized gains/(losses) | | 76,001 | | | 700,838 | | | (624,837) | | | (89) | % |
| Foreign exchange gains/(losses) | | (15,172) | | | 7,507 | | | (22,679) | | | NM |
| Other | | 121 | | | 650 | | | (529) | | | (81) | % |
| Total capital provision income | | 388,124 | | | 896,371 | | | (508,247) | | | (57) | % |
Realized gains
Net realized gains on capital provision assets increased 75% for the year ended December 31, 2024, which were comprised of $355.8 million in gross realized gains, offset by $34.1 million in gross realized losses. For the year ended December 31, 2023, net realized gains on capital provision assets were comprised of $242.1 million in gross realized gains, offset by $54.7 million in gross realized losses. The increase in net realized gains is due to more case activity during the year ended December 31, 2024, which led to favorable conclusions and in higher amounts. The 75% increase in net realized gains is largely impacted by two realizations that each individually exceeded $50.0 million in realized gains and together generated $121.0 million in realized gains during 2024, as well as due to the impact of smaller realized losses. As a percentage of average capital provision assets at cost during the year ended December 31, 2024, gross realized losses represented 2.8% as compared to 3.6% for the year ended December 31, 2023.
Unrealized gains
Unrealized gains consist of fair value adjustments during the period, which may be offset by the transfer of unrealized gains/(losses) to realized gains/(losses) upon realization of an asset. Fair value adjustments, net of previously recognized unrealized gains/(losses) transferred to realized gains, on capital provision assets decreased 89% for the year ended December 31, 2024, primarily due to the absence of large fair value increases totaling $542.9 million for the YPF-related assets, which occurred during 2023, arising from the March 2023 Ruling and the September 2023 Final Judgment. Excluding the impact of the YPF-related assets, fair value adjustments, net of previously recognized unrealized gains/(losses) transferred to realized gains, decreased 105% for the year ended December 31, 2024, largely impacted by the transfer of previously recognized unrealized gains to realized gains from the realizations of certain deals that occurred during 2024. See “—Consolidated statements of operations for the year ended December 31, 2024 as compared to the year ended December 31, 2023—Revenues—Capital provision income/(loss)” above for additional information with respect to the year-over-year change of fair value adjustment, net of previously recognized unrealized gains/(losses) transferred to realized gains/(losses).
Statements of financial condition as of December 31, 2024 as compared to December 31, 2023
The table below sets forth the components of our consolidated statements of financial condition for our Principal Finance segment as of the dates indicated.
| | | | | | | | | | | | | | | | | | | | | | | | | | |
| Principal Finance segment | | December 31, | | | | |
| ($ in thousands) | | 2024 | | 2023 | | Change | | % change |
| Cash and cash equivalents and marketable securities | | $ | 508,031 | | | $ | 291,386 | | | $ | 216,645 | | | 74 | % |
| Due from settlement of capital provision assets | | 183,651 | | | 185,267 | | | (1,616) | | | (1) | % |
| Capital provision assets | | 3,571,224 | | | 3,432,112 | | | 139,112 | | | 4 | % |
| Total assets | | 4,397,954 | | | 4,043,848 | | | 354,106 | | | 9 | % |
Total assets increased 9% as of December 31, 2024, primarily due to increase in cash and cash equivalents and marketable securities and due to increase in capital provision assets. See “—Consolidated statements of financial condition as of December 31, 2024 as compared to December 31, 2023” above for additional information.
Portfolio value – Principal Finance segment
The table below sets forth the components of our portfolio for our Principal Finance segment as of the dates indicated.
| | | | | | | | | | | | | | | | | | | | | | | | | | |
| Principal Finance segment | | December 31, | | | | |
| ($ in thousands) | | 2024 | | 2023 | | Change | | % change |
| Capital provision assets | | | | | | | | |
| Fair value | | $ | 3,571,224 | | | $ | 3,432,112 | | | $ | 139,112 | | | 4 | % |
| Undrawn commitments | | 1,632,856 | | | 1,408,005 | | | 224,851 | | | 16 | % |
| Total portfolio | | 5,204,080 | | | 4,840,117 | | | 363,963 | | | 8 | % |
Total portfolio increased 8% as of December 31, 2024, driven by increases in fair value of capital provision assets resulting from increases in financing and increase in undrawn commitments driven by new commitments added during 2024. Capital provision assets include our investment in the Advantage Fund which makes up less than 1% of the total portfolio as of December 31, 2024.
The table below sets forth our deployments and realizations for our Principal Finance segment for the periods indicated.
| | | | | | | | | | | | | | | | | | | | | | | | | | |
| Principal Finance segment | | Years ended December 31, | | | | |
| ($ in thousands) | | 2024 | | 2023 | | Change | | % change |
| Deployments | | $ | 399,312 | | | $ | 411,793 | | | $ | (12,481) | | | (3) | % |
| Realizations | | 646,876 | | | 512,655 | | | 134,221 | | | 26 | % |
The table below sets forth our deployments and realizations, for the periods indicated, adjusted primarily to (i) include case-related expenditures ineligible for inclusion in asset cost for our deployments and (ii) include (a) realizations arising from income on due from settlement of capital provision assets and (b) in cases where our interest is held through a private fund, adjust to reflect realizations based on the timing of occurrence with the capital provision asset and not when distributed out by the private fund for our realizations. See “—Reconciliations—Deployments reconciliations” and “—Reconciliations—Realizations reconciliations” for additional information with respect to the difference between the Principal Finance segment and the Burford-only basis tables.
| | | | | | | | | | | | | | | | | | | | | | | | | | |
| Adjusted Burford-only | | Years ended December 31, | | | | |
| ($ in thousands) | | 2024 | | 2023 | | Change | | % change |
| Deployments | | $ | 400,714 | | | $ | 411,551 | | | $ | (10,837) | | | (3) | % |
| Realizations | | 641,124 | | | 530,626 | | | 110,498 | | | 21 | % |
For both the Principal Finance segment and the adjusted Burford-only basis, total deployments slightly decreased by 3% for the year ended December 31, 2024. The decrease in deployments for both the Principal Finance segment and the adjusted Burford-only basis was primarily due to lower financing despite having more deployed assets, with the top three assets representing 28% of deployments in 2024, as compared to 35% of deployments in 2023.
We count each of our contractual relationships as an “asset”, although many such relationships are composed of multiple underlying litigation matters that are often cross collateralized rather than reliant on the performance of a single matter. As of December 31, 2024, our Principal Finance portfolio consisted of 227 assets funded directly by our balance sheet and 9 additional assets held through the Advantage Fund. As of December 31, 2023, our Principal Finance portfolio consisted of 206 assets funded directly by our balance sheet and 11 additional assets held through the Advantage Fund.
Total realizations increased by 26% for the Principal Finance segment and by 21% for the adjusted Burford-only basis for the year ended December 31, 2024. The increase in realizations for both the Principal Finance segment and the adjusted Burford-only basis was primarily due to robust realizations during 2024, which included a partial conclusion in a global antitrust portfolio that generated $114.5 million of realizations.
Undrawn commitments – Principal Finance segment
The table below sets forth the components of our total capital provision undrawn commitments for our Principal Finance segment as of the dates indicated.
| | | | | | | | | | | | | | | | | | | | | | | | | | |
| Principal Finance segment | | December 31, | | | | |
| ($ in thousands) | | 2024 | | 2023 | | Change | | % change |
| Definitive | | $ | 773,673 | | | $ | 591,942 | | | $ | 181,731 | | | 31 | % |
| Discretionary | | 817,865 | | | 766,537 | | | 51,328 | | | 7 | % |
| Legal risk (definitive) | | 41,318 | | | 49,526 | | | (8,208) | | | (17) | % |
| Total capital provision undrawn commitments | | 1,632,856 | | | 1,408,005 | | | 224,851 | | | 16 | % |
As of December 31, 2024, approximately 50% of our legal finance undrawn commitments related to definitive commitments and approximately 50% related to discretionary, as compared to 46% and 54%, respectively as of December 31, 2023.
Portfolio concentrations
Our Principal Finance portfolio includes certain related exposures where we have financed multiple different counterparties in relation to the same or very similar claims, such that outcomes on these related exposures are likely to be correlated. We estimate that the fair value of the assets underlying our largest correlated exposure (excluding YPF-related assets) represented approximately 6% and 8% of the consolidated fair value of capital provision assets as of December 31, 2024 and 2023, respectively, and approximately 5% and 7% of the capital provision assets in the Principal Finance segment as of December 31, 2024 and 2023, respectively.
The claims underlying our capital provision assets are generally diverse, as are our relationships with corporate and law firm clients. The table below sets forth the respective percentages of our commitments to corporate, law firm and other clients as of the dates indicated.
| | | | | | | | | | | | | | |
| | December 31, 2024 | | December 31, 2023 |
| Corporates | | 55 | % | | 55 | % |
| Law firms | | 40 | % | | 41 | % |
| Other | | 5 | % | | 4 | % |
Our largest commitment (including deployed capital and undrawn commitment) to a corporate client was $130.0 million, which accounted for 4% of our commitments, as of December 31, 2024 and 2023.
Our largest relationship with a single law firm consisted of (i) financing arrangements between us and the law firm, where the law firm seeks to monetize the risk that the law firm has taken with some of its clients, (ii) direct financing arrangements with counterparties that elect to hire the law firm where we finance the law firm’s legal fees and (iii) direct financing arrangements with counterparties that have hired the law firm but where our financing is used for corporate purposes other than for financing the law firm’s legal fees. This law firm is one of the 50 largest law firms in the United States based on revenue according to The American Lawyer, with more than 500 lawyers and more than 20 offices around the world. Our portfolio of matters with this law firm included more than 20 different litigation matters as of December 31, 2024. Taken together, these arrangements accounted for approximately $130.5 million, or 4% of our commitments as of December 31, 2024, as compared to $141.7 million, or 5% of our commitments as of December 31, 2023.
Portfolio tenor
The timing of realizations is difficult to forecast and is rarely in our control. The reality of litigation is that most cases settle and pay proceeds in a relatively short period of time, and a minority of cases go on to adjudication, which takes longer. Adjudication timing is subject to a myriad of factors, including delaying tactics by litigation opponents and court dockets and schedules, and the Covid-19 pandemic has added to this uncertainty. However, we are now seeing the impacts from the Covid-19 pandemic begin to subside. We believe that the impact of the Covid-19 pandemic delaying trial dates also has caused a delay in settlement timing, as an impending trial often can be a catalyst for a settlement. We do not believe there is a correlation between asset life and asset quality and endeavor to structure our asset pricing to compensate us if assets take longer to resolve.
We provide extensive data about the WAL of our concluded portfolio, although this data may not be predictive of the ultimate WAL of our existing portfolio. The WAL of our concluded portfolio may lengthen over time if the longer-tenor assets in our existing portfolio account for a greater share of future concluded
cases. Conversely, if our larger, more recently originated cases conclude relatively quickly, the WAL of our concluded portfolio could decrease.
In calculating the WAL of our portfolio, we compute a weighted average of the WALs of individual assets. On that basis, we assess the weighted average lives (beginning at the point of average deployment) of the concluded portfolio, weighted both by deployed cost and realizations. Weighting by deployed cost provides a view on how long on average a dollar of capital is deployed, while weighting by realizations provides a view on how long on average it takes to recover a dollar of return.
The WALs of the 248 concluded assets as of December 31, 2024 slightly increased as compared to the WALs of the 226 concluded assets as of December 31, 2023. As mentioned above, the impact from the Covid-19 pandemic delaying settlement timing is expected to cause a slight increase in the WALs. The table below sets forth the WALs, weighted by deployed cost and realizations, of the concluded assets, excluding the impact of our interest in private funds, as of the dates indicated.
| | | | | | | | | | | | | | |
| (in years) | | December 31, 2024 | | December 31, 2023 |
| WAL weighted by deployed cost | | 2.5 | | | 2.2 |
| WAL weighted by realizations | | 2.6 | | | 2.4 |
The age of our ongoing portfolio is reflected in the WAL of active deployed capital in the table below. Although we provide information for our portfolio by vintage years, the deployed costs for each vintage are generally financed across multiple years and the WAL of active deployed capital calculates the length of time our deployments have been outstanding based on the date when capital was deployed.
| | | | | | | | | | | | | | |
| (in years) | | December 31, 2024 | | December 31, 2023 |
| WAL of active deployed capital | | 3.1 | | | 2.9 |
Returns on concluded portfolio
The table below sets forth our ROIC, IRR and cumulative realizations on concluded and partially concluded assets in our capital provision portfolio as of the dates indicated since inception on a Burford-only basis.
| | | | | | | | | | | | | | |
| ($ in thousands) | | December 31, 2024 | | December 31, 2023 |
| ROIC | | 87 | % | | 82 | % |
| IRR | | 26 | % | | 27 | % |
| Cumulative realizations | | $ | 3,331,356 | | | $ | 2,707,300 |
As our older vintages conclude, we may see IRR decrease slightly as the impact from the Covid-19 pandemic caused delays in settlement timing. In addition to legal finance assets funded directly through our balance sheet, our Principal Finance segment also selectively allocates balance sheet capital through interests in select private funds, which tend to target a lower overall risk return profile. As of December 31, 2024, our balance sheet allocations through private funds accounted for approximately 1% of both current fair value and cumulative realizations from concluded or partially concluded assets. Returns from these concluded or partially concluded assets invested through private funds are not included in the ROICs and IRRs in the table above. If the concluded or partially concluded assets from the balance sheet’s interest in Advantage Fund were included the return calculations above, the ROIC would be 86% and the IRR would remain at 26%.
We do not consider cases to be concluded (and therefore part of these return metrics on our concluded portfolio) until there is no longer any litigation risk remaining. Return metrics on our concluded portfolio do not include fair value adjustments, either positive or negative. As a result, these return figures do not include the positive or negative impact of developments on matters while they remain pending.
Portfolio by vintage
The table below sets forth a summary by vintage of every legal finance asset that we have funded directly by our balance sheet, as of the date indicated since inception. For a table with all the individual vintages, refer to our website.
| | | | | | | | | | | | | | | | | | | | | | | | | | | | | | | | | | | | | | |
| | December 31, 2024 |
| | Number of | | Commitment | | Deployed | | Realized | | Concluded (fully and partially) |
| ($ in millions) | | assets | | amount(1)(2) | | costs(1) | | proceeds(1) | | ROIC | | IRR |
| Concluded | | 87 | | | 576 | | | 475 | | | 752 | | | 105 | % | | 25 | % |
| Partially realized - concluded | | — | | (3) | 33 | | | 28 | | | 276 | | | | | |
| Partially realized - ongoing | | 6 | | | 223 | | | 124 | | | — | | | | | |
| Ongoing | | 4 | | | 37 | | | 36 | | | — | | | | | |
| Pre-2016 Total | | 97 | | | 869 | | | 663 | | | 1,028 | | | | | |
| | | | | | | | | | | | |
| Concluded | | 71 | | | 779 | | | 601 | | | 1,111 | | | 88 | % | | 26 | % |
| Partially realized - concluded | | — | | (3) | 311 | | | 274 | | | 534 | | | | | |
| Partially realized - ongoing | | 44 | | | 578 | | | 373 | | | — | | | | | |
| Ongoing | | 51 | | | 596 | | | 347 | | | — | | | | | |
| 2016-2020 Total | | 166 | | | 2,264 | | | 1,595 | | | 1,645 | | | | | |
| | | | | | | | | | | | |
| Concluded | | 7 | | | 31 | | | 22 | | | 26 | | | 61 | % | | 29 | % |
| Partially realized - concluded | | — | | (3) | 190 | | | 188 | | | 313 | | | | | |
| Partially realized - ongoing | | 10 | | | 133 | | | 82 | | | — | | | | | |
| Ongoing | | 20 | | | 187 | | | 118 | | | — | | | | | |
| 2021 Total | | 37 | | | 541 | | | 410 | | | 339 | | | | | |
| | | | | | | | | | | | |
| Concluded | | 4 | | | 40 | | | 11 | | | 17 | | | 98 | % | | 48 | % |
| Partially realized - concluded | | — | | (3) | 53 | | | 51 | | | 106 | | | | | |
| Partially realized - ongoing | | 11 | | | 245 | | | 153 | | | — | | | | | |
| Ongoing | | 24 | | | 303 | | | 177 | | | — | | | | | |
| 2022 Total | | 39 | | | 641 | | | 392 | | | 123 | | | | | |
| | | | | | | | | | | | |
| Concluded | | 3 | | | 213 | | | 128 | | | 172 | | | 45 | % | | 43 | % |
| Partially realized - concluded | | — | | (3) | 5 | | | 5 | | | 21 | | | | | |
| Partially realized - ongoing | | 4 | | | 45 | | | 36 | | | — | | | | | |
| Ongoing | | 17 | | | 409 | | | 58 | | | — | | | | | |
| 2023 Total | | 24 | | | 672 | | | 227 | | | 193 | | | | | |
| | | | | | | | | | | | |
| Concluded | | — | | | — | | | — | | | — | | | 17 | % | | 86 | % |
| Partially realized - concluded | | — | | (3) | 3 | | | 3 | | | 3 | | | | | |
| Partially realized - ongoing | | 1 | | | 38 | | | 3 | | | — | | | | | |
| Ongoing | | 35 | | | 565 | | | 156 | | | — | | | | | |
| 2024 Total | | 36 | | | 606 | | | 162 | | | 3 | | | | | |
| | | | | | | | | | | | |
| Total portfolio: | | | | | | | | | | | | |
| Concluded | | 172 | | 1,639 | | 1,237 | | 2,078 | | 87 | % | | 26 | % |
Partially realized - concluded(4) | | 76 | | 595 | | 549 | | 1253 | | | | |
| Total concluded portion | | 248 | | 2,234 | | | 1,786 | | | 3,331 | | | | | |
Partially realized – ongoing portion(4) | | 76 | | 1,262 | | | 771 | | — | | | | |
| Ongoing | | 151 | | 2,097 | | | 892 | | — | | | | |
| Total ongoing portion | | 227 | | 3,359 | | | 1,663 | | | — | | | | | |
| Total portfolio | | 399 | | 5,593 | | | 3,449 | | | 3,331 | | | | | |
| | | | | | | | | | | | |
| | | | | | | | | | | | | | | | | | | | | | | | | | | | | | | | | | | | | | |
1. Amounts in currencies other than US dollar are reported in this table at the foreign exchange rates in effect at the time of the historical transaction, i.e., when the commitment or deployment was made or when proceeds were realized, respectively. Amounts related to those transactions (such as undrawn commitments or deployed costs) reflected elsewhere in this “Management's discussion and analysis of financial condition and results of operations” or in our consolidated financial statements contained in this 2024 Form 10-K may be reported based on the foreign exchange rates in effect as of the end of the applicable period and, therefore, may differ from the amounts in this table. |
2. A portion of certain ongoing assets’ undrawn commitments are no longer an obligation. This table presents an asset’s gross original commitments, so it does not reflect a reduction in commitment for the portion that is no longer an obligation. This will result in a difference when compared to undrawn commitments in note 20 (Financial commitments and contingent liabilities) to our consolidated financial statements contained in this 2024 Form 10-K. |
| 3. The number of assets for partially realized concluded transactions is listed under the number of assets for partially realized ongoing transactions as these are the concluded and ongoing portions of the same transactions. |
| 4. As of December 31, 2024, there were 76 capital provision assets with partial realizations. We repeat the number with partial realizations in total concluded and total ongoing. |
Asset Management and Other Services segment
Our Asset Management and Other Services segment manages legal finance assets on behalf of third-party investors, and we provide other services to the legal industry for both of which we receive fees. These fees are primarily reflected as asset management income, which is a secondary contributor to our total revenues.
Our internal allocation policy strictly prescribes the allocation of third-party private fund capital by fund based on the risk/return profile of assets, thus removing any potential allocation conflicts of interest with our Principal Finance segment.
We generally conduct our private funds activities through limited partnerships. Each private fund that is a limited partnership has a Burford-owned general partner that is responsible for the management and operation of the private fund’s affairs and makes all policy and asset selection decisions relating to the conduct of the private fund’s business. Except as required by law or as specified in a private fund’s governing documents, the limited partners of the private funds take no part in the conduct or control of the business of the private funds, have no right or authority to act for or bind the private funds, have limited visibility and input into the actions and decisions of the general partner and have no influence over the voting or disposition of the securities or other assets held by the private funds. Each private fund engages an investment adviser. BCIM serves as the investment adviser for all of our private funds and is registered under the Investment Advisers Act.
In addition, we operate certain “sidecar” funds pertaining to specific assets and had three active “sidecar” funds as of December 31, 2024. A “sidecar” fund is a pooled investment vehicle through which certain investors co-invest directly in specific assets alongside our private funds. Except as required by law or as specified in a “sidecar” fund’s governing documents, the investors in the “sidecar” funds take no part in the conduct or control of the business of the “sidecar” funds, have no right or authority to act for or bind the “sidecar” funds, have limited visibility and input into the actions and decisions of the general partner or manager of the “sidecar” funds and have no influence over the voting or disposition of the securities or other assets held by the “sidecar” funds. Our interest in the “sidecar” funds is generally limited to the opportunity to earn incentive fees, if any. The discussion of our private funds ignores “sidecar” funds unless specifically included, and we collapse fund structures into overall strategies, ignoring, for example, onshore and offshore separations and parallel funds.
Statements of operations for the year ended December 31, 2024, as compared to the year ended December 31, 2023
The table below sets forth the components of our income/(loss) before income taxes for our Asset Management and Other Services segment for the periods indicated.
| | | | | | | | | | | | | | | | | | | | | | | | | | |
| Asset Management and Other Services segment | | Years ended December 31, | | | | |
| ($ in thousands) | | 2024 | | 2023 | | Change | | % change |
| Asset management income/(loss) | | $ | 44,627 | | | $ | 63,712 | | | $ | (19,085) | | | (30) | % |
| Other income/(loss) | | 3,051 | | | 4,392 | | | (1,341) | | | (31) | % |
| Total revenues | | 47,678 | | | 68,104 | | | (20,426) | | | (30) | % |
| | | | | | | | |
| Compensation and benefits | | 21,901 | | | 24,461 | | | (2,560) | | | (10) | % |
| General, administrative and other | | 5,440 | | | 3,564 | | | 1,876 | | | 53 | % |
| Total operating expenses | | 27,341 | | | 28,025 | | | (684) | | | (2) | % |
| | | | | | | | |
| Income/(loss) before income taxes | | 20,337 | | | 40,079 | | | (19,742) | | | (49) | % |
Total revenues decreased 30% for the year ended December 31, 2024, reflecting a decrease in capital provision income earned by BOF-C and, therefore, less profit-sharing income from BOF-C contributing to asset management income for 2024.
Total operating expenses decreased 2% for the year ended December 31, 2024, primarily due to a decrease in compensation and benefits costs.
As a result of the factors described above, income before income taxes decreased 49% for the year ended December 31, 2024.
Asset management income
Asset management income is generally categorized as either (i) management fees, which are recurring fees paid to Burford for investment management services and typically being a rate of 2% or less charged on the basis of some component of assets under management in each fund, (ii) performance fees, which are fees paid to Burford contingent on satisfying certain performance thresholds as designated by each fund waterfall, or (iii) profit sharing income, which represents income from bespoke profit-sharing agreements with third-party investors, such as our strategic sovereign wealth fund partner.
The table below sets forth the components of our asset management income for the periods indicated.
| | | | | | | | | | | | | | | | | | | | | | | | | | |
| Asset Management and Other Services segment | | Years ended December 31, | | | | |
| ($ in thousands) | | 2024 | | 2023 | | Change | | % change |
| Management fee income | | $ | 6,840 | | | $ | 7,750 | | | $ | (910) | | | (12) | % |
| Performance fee income | | 1,500 | | | — | | | 1,500 | | | NM |
| Profit sharing income from private funds | | 36,287 | | | 55,962 | | | (19,675) | | | (35) | % |
| Total asset management income | | 44,627 | | | 63,712 | | | (19,085) | | | (30) | % |
Asset management income decreased 30% for the year ended December 31, 2024, primarily reflecting lower profit-sharing income from BOF-C, mainly from lower unrealized gains/(losses) related to BOF-C's capital provision assets.
Statements of financial condition as of December 31, 2024 as compared to December 31, 2023
The table below sets forth the components of our consolidated statements of financial condition for our Asset Management and Other Services segment as of the dates indicated.
| | | | | | | | | | | | | | | | | | | | | | | | | | |
| Asset Management and Other Services segment | | December 31, | | | | |
| ($ in thousands) | | 2024 | | 2023 | | Change | | % change |
| Cash and cash equivalents and marketable securities | | $ | 12,650 | | | $ | 12,090 | | | $ | 560 | | | 5 | % |
| Other assets | | 151,770 | | | 133,952 | | | 17,818 | | | 13 | % |
| Total assets | | 190,377 | | | 172,016 | | | 18,361 | | | 11 | % |
Total assets increased 11% as of December 31, 2024, primarily due to the unrealized income earned in BOF-C during the year, which increased the outstanding receivable from BOF-C within other assets.
Portfolio value – Asset Management and Other Services segment
The table below sets forth the components of our portfolio for our Asset Management and Other Services segment as of the dates indicated.
| | | | | | | | | | | | | | | | | | | | | | | | | | |
| Asset Management and Other Services segment | | December 31, | | | | |
| ($ in thousands) | | 2024 | | 2023 | | Change | | % change |
| Capital provision assets - funded by third parties | | | | | | | | |
| Fair value | | $ | 1,353,893 | | | $ | 1,385,958 | | | $ | (32,065) | | | (2) | % |
| Undrawn commitments | | 491,186 | | | 582,924 | | | (91,738) | | | (16) | % |
| Total | | 1,845,079 | | | 1,968,882 | | | (123,803) | | | (6) | % |
| | | | | | | | |
| Post-settlement | | | | | | | | |
| Fair value | | 272,424 | | | 298,854 | | | (26,430) | | | (9) | % |
| Undrawn commitments | | 67,961 | | | 62,455 | | | 5,506 | | | 9 | % |
| Total | | 340,385 | | | 361,309 | | | (20,924) | | | (6) | % |
| | | | | | | | |
| Total portfolio value | | 2,185,464 | | | 2,330,191 | | | (144,727) | | | (6) | % |
Total portfolio value, funded by third parties, decreased 6% as of December 31, 2024. The decrease in our total portfolio was driven largely by the impact of robust realizations which occurred in 2024.
Private funds
As of December 31, 2024, we operated eight private funds and three “sidecar” funds as an investment adviser registered with, and regulated by, the SEC. The table below sets forth key statistics for each of our private funds as of December 31, 2024.
| | | | | | | | | | | | | | | | | | | | | | | | | | | | | | | | | | | | | | | | | | | | | | | | | | |
| | | | December 31, 2024 | | | | | | |
| | | | Investor | | Asset | | Asset | | | | Fee structure(1) | | | | |
| | | | commitments | | commitments | | deployments | | | | (management/ | | | | Investment |
| ($ in millions) | | Strategy(6) | | closed | | to date | | to date | | AUM | | performance) | | Waterfall | | period (end) |
BCIM Partners II, LP(2) | | Core legal finance | | $ | 260 | | | $ | 253 | | | $ | 186 | | | $ | 141 | | | Class A: 2%/20%; Class B: 0%/50% | | European | | 12/15/2015 |
| BCIM Partners III, LP | | Core legal finance | | 412 | | | 447 | | | 331 | | | 413 | | | 2%/20% | | European | | 1/1/2020(3) |
| Burford Opportunity Fund LP & Burford Opportunity Fund B LP (BOF) | | Core legal finance | | 300 | | | 399 | | | 300 | | | 377 | | | 2%/20% | | European | | 12/31/2021(4) |
| BCIM Credit Opportunities, LP (COLP) | | Post-settlement | | 488 | | | 699 | | | 695 | | | 409 | | | 1% on undrawn/ 2% on funded and 20% incentive | | European | | 9/30/2019(3) |
Burford Alternative Income Fund LP (BAIF)(2) | | Post-settlement | | 327 | | | 677 | | | 662 | | | 268 | | | 1.5%/10% | | European | | 4/4/2022 |
| Burford Alternative Income Fund II LP (BAIF II) | | Post-settlement | | 350 | | | 349 | | | 289 | | | 382 | | | 1.5%/12.5% | | European | | 9/11/2025 |
| Burford Advantage Master Fund LP (Advantage Fund) | | Lower risk legal finance | | 360 | | | 370 | | | 366 | | | 410 | | | Profit split(5) | | American | | 12/24/2024 |
Burford Opportunity Fund C LP (BOF-C)(2) | | Core legal finance | | 766 | | | 1,274 | | | 781 | | | 1,055 | | | Expense reimbursement + profit share | | Hybrid | | 12/31/2024 |
| Total | | | | 3,263 | | | 4,468 | | | 3,610 | | | 3,455 | | | | | | | |
| 1. Management fees are paid to BCIM for investment management and advisory services provided to our private funds. The management fee rates set forth in the table above are annualized and applied to an asset or commitment base that typically varies between a private fund’s investment period and any subsequent periods in the fund term. We no longer earn any management fees from BCIM Partners II, LP, BCIM Partners III, LP, COLP and BAIF. Performance fees represent carried interest applied to distributions to a private fund’s limited partners after the return of capital contributions and preferred returns. |
|
| 2. Includes amounts related to “sidecar” funds. |
| 3. Ceased commitments to new legal finance assets in the fourth quarter of 2018 due to capacity. |
| 4. Ceased commitments to new legal finance assets in the fourth quarter of 2020 due to capacity. |
| 5. The Advantage Fund does not have a traditional management and performance fee structure, but instead provides the first 10% of annual simple returns to the fund investors while we retain any excess returns. However, if the Advantage Fund produces returns in excess of 18% (which are supranormal for this level of risk), a level of sharing with the fund investors would take effect, but we do not expect that to occur. |
As of December 31, 2024, and December 31, 2023, our total AUM was $3.5 billion and $3.4 billion respectively. AUM reflects the fair value of the capital invested in private funds and individual capital vehicles plus the capital that we are entitled to call from investors in those private funds and vehicles. The total portfolio value shown for our Asset Management & Other Services segment of $2.2 billion reflects the fair value of portfolio assets plus the undrawn commitments to portfolio assets, and also excludes the balance sheet’s interest in the Advantage Fund, which is reflected in the portfolio value for our Principal Finance segment.
Liquidity and capital resources
Overview
The table below sets forth our cash and cash equivalents and marketable securities as of the dates indicated.
| | | | | | | | | | | | | | | | | | | | | | | | | | | | | | | | | | | | | | |
| | December 31, 2024 | | December 31, 2023 |
| | | | | | Total | | | | | | Total |
| | | | Third-party | | segments | | | | Third-party | | segments |
| ($ in thousands) | | Consolidated | | interests | | (Burford-only) | | Consolidated | | interests | | (Burford-only) |
| Cash and cash equivalents | | $ | 469,930 | | | $ | (28,269) | | | $ | 441,661 | | | $ | 220,549 | | | $ | (24,634) | | | $ | 195,915 | |
| Marketable securities | | 79,020 | | | — | | | 79,020 | | | 107,561 | | | — | | | 107,561 | |
| Total | | 548,950 | | | (28,269) | | | 520,681 | | | 328,110 | | — | | (24,634) | | | 303,476 | |
On a consolidated basis, our cash and cash equivalents and marketable securities increased 67% as of December 31, 2024, while on a total segments (Burford-only) basis, our cash and cash equivalents and marketable securities increased 72% as of December 31, 2024. The net increase in cash and cash equivalents and marketable securities for both the consolidated and total segments (Burford-only) basis, primarily reflects the net proceeds from capital provision assets and the impact from the issuance of the Additional 2031 Notes (as defined below) in January 2024, partially offset by the impact of third-party net distribution, as well as by the impact from the partial redemption of the 6.125% bonds due 2025 and the payment of dividends.
Our marketable securities primarily consist of short-duration and generally investment-grade fixed income assets, the bulk of which are held in separately managed accounts, managed by a third-party asset manager that specializes in short-duration and money market investments.
Debt
During the year ended December 31, 2024, we issued an additional $275.0 million aggregate principal amount of the Additional 2031 Notes (as defined below) in January 2024 and purchased in open market transactions approximately $50.6 million in aggregate principal amount of the 2025 Bonds (as defined below). As of December 31, 2024, we had five series of debt securities outstanding, of which two series were listed on the Order Book for Retail Bonds of the London Stock Exchange and three series were issued through private placement transactions under Rule 144A and Regulation S under the Securities Act. See note 12 (Debt) to our consolidated financial statements contained in this 2024 Form 10-K for additional information with respect to our outstanding debt securities. We manage our business with relatively low levels of leverage and have laddered debt maturities with an overall weighted average maturity in excess of the expected weighted average life of our legal finance assets. As of December 31, 2024, the weighted average maturity of our outstanding debt securities of 4.5 years continued to be longer than the weighted average life of our concluded assets, weighted by realizations, of 2.6 years.
Going forward, we expect to continue to be an opportunistic issuer of debt securities and may issue new debt securities from time to time to fund our growth or refinance future debt maturities, among other things. In addition, from time to time, we may acquire our debt securities through open market purchases, redemptions, privately negotiated transactions, tender offers, exchange offers or otherwise, upon such terms and at such prices as we may from time to time determine, for cash or other consideration.
Our debt securities that are listed on the Order Book for Retail Bonds of the London Stock Exchange as of the date of this 2024 Form 10-K contain one significant financial covenant, which is a leverage ratio requirement that we maintain a level of Group Net Debt (as defined in the trust deeds governing such debt securities, and generally equivalent to our consolidated net debt, or our total principal amount of debt outstanding less cash and cash equivalents and marketable securities) that is less than 50% of our Group Total Assets (as defined in the trust deeds governing such debt securities, and generally equivalent to our consolidated tangible assets,
or our total assets less goodwill). As of December 31, 2024, and December 31, 2023, our consolidated net debt to consolidated tangible assets ratio was 20% and 22%, respectively. In addition, the indentures governing the 2028 Notes and the 2030 Notes contain certain restrictive covenants that, among other things, require us to have a Consolidated Indebtedness to Net Tangible Equity Ratio (as defined in the indentures governing the 2028 Notes and the 2030 Notes, as applicable) of less than 1.50 to 1.00, 1.75 to 1.00 or 2.00 to 1.00, as applicable, to use certain specified “baskets” in order to undertake specific actions, such as making restricted payments or permitted investments or incurring additional indebtedness. As of December 31, 2024, and December 31, 2023, our Consolidated Indebtedness to Net Tangible Equity Ratio was 0.8 to 1.00 and 0.7 to 1.00, respectively. Furthermore, the indenture governing the 2031 Notes contains certain restrictive covenants that, among other things, require us to have a Consolidated Indebtedness to Consolidated Equity Ratio (as defined in the indenture governing the 2031 Notes) of less than 1.50 to 1.00, 1.75 to 1.00 or 2.00 to 1.00, as applicable, to use certain specified “baskets” in order to undertake specific actions, such as making restricted payments or permitted investments or incurring additional indebtedness. As of December 31, 2024, and December 31, 2023, our Consolidated Indebtedness to Consolidated Equity Ratio was 0.7 to 1.00 and 0.6 to 1.00, respectively. See “—Reconciliations—Debt leverage ratio calculations” for the calculations of our debt leverage ratios. As of December 31, 2024, we were in compliance with all of the covenants under the trust deeds and the indentures, as applicable.
We are required to provide certain information pursuant to the indentures governing the 2028 Notes, the 2030 Notes and the 2031 Notes. The tables below set forth the total assets and third-party indebtedness as of the dates indicated and total revenues for the periods indicated, in each case, of (i) us and our Restricted Subsidiaries (as defined in the indentures governing the 2028 Notes, the 2030 Notes and the 2031 Notes, as applicable) and (ii) our Unrestricted Subsidiaries (as defined in the indentures governing the 2028 Notes, the 2030 Notes and the 2031 Notes, as applicable).
| | | | | | | | | | | | | | |
| | December 31, |
| ($ in thousands) | | 2024 | | 2023 |
| Burford Capital Limited and its Restricted Subsidiaries | | | | |
| Total assets | | $ | 5,335,289 | | | $ | 4,922,451 | |
| Third-party indebtedness | | 1,763,612 | | | 1,534,730 | |
| | | | |
| Unrestricted Subsidiaries | | | | |
| Total assets | | 839,736 | | | 914,943 | |
| Third-party indebtedness | | — | | | — | |
| | | | | | | | | | | | | | | | | | | | |
| | Years ended December 31, |
| (S in thousands) | | 2024 | | 2023 | | 2022 |
| Burford Capital Limited and its Restricted Subsidiaries | | | | | | |
| Total revenues | | $ | 460,352 | | | $ | 973,461 | | | $ | 245,383 | |
| | | | | | |
| Unrestricted Subsidiaries | | | | | | |
| Total revenues | | 85,735 | | | 113,441 | | | 73,844 | |
Cash flows
We believe our available cash and cash from operations, which include proceeds from our capital provision assets, will be adequate to fund our operations and future growth, satisfy our working capital requirements, meet obligations under our debt securities, pay dividends and meet other liquidity requirements for the foreseeable future.
Set forth below is a discussion of our cash flows for the periods indicated on a consolidated basis, unless noted otherwise.
The table below sets forth the components of our cash flows for the periods indicated.
| | | | | | | | | | | | | | |
| | Years ended December 31, |
| ($ in thousands) | | 2024 | | 2023 |
| Net cash provided by/(used in) operating activities | | $ | 216,725 | | | $ | (274,682) | |
| Net cash provided by/(used in) investing activities | | (661) | | | (3,212) | |
| Net cash provided by/(used in) financing activities | | 33,832 | | | 389,534 | |
| Net increase/(decrease) in cash and cash equivalents | | 249,896 | | | 111,640 | |
Net cash provided by/(used in) operating activities
The table below sets forth the components of our net cash provided/(used) by operating activities for the periods indicated.
| | | | | | | | | | | | | | |
| | Years ended December 31, |
| ($ in thousands) | | 2024 | | 2023 |
| Net cash provided by/(used in) operating activities before proceeds/(funding) of operating activities | | $ | (252,056) | | | $ | (186,488) | |
| Net proceeds from/(funding of) marketable securities | | 32,577 | | | 34,471 | |
| Proceeds from capital provision assets | | 991,292 | | | 559,362 | |
| Funding of capital provision assets | | (555,088) | | | (682,027) | |
| Net cash provided by/(used in) operating activities | | 216,725 | | | (274,682) | |
Net cash provided by operating activities was $216.7 million for the year ended December 31, 2024. The year-over-year change in net cash provided/(used) by operating activities reflects primarily an increase in proceeds received from capital provision assets to $991.3 million and a decrease in deployments on capital provision assets to $555.1 million.
Net cash provided by/(used in) investing activities
Net cash used by investing activities was $0.7 million for the year ended December 31, 2024. The decrease in net cash used by investing activities is primarily due to lower capital expenditures in 2024, as there was spending on leasehold improvements for the London office move in 2023.
Net cash provided by/(used in) financing activities
Net cash provided by financing activities was $33.8 million for the year ended December 31, 2024. The decrease in net cash provided by financing activities is primarily due to higher outflow from third-party net capital distributions and less debt issuance year-over-year, partially offset by lower debt extinguishments.
Cash receipts (non-GAAP financial measure)
Cash receipts represent cash generated during the reporting period from our capital provision assets, asset
management income and certain other items, before any deployments into financing existing or new assets. See “— Basis of presentation of financial information—KPIs and non-GAAP financial measures relating to our operating and financial performance—Non-GAAP financial measures—Cash receipts” for additional information with respect to our cash receipts. See “—Cash flows” for a discussion of our cash flows on a consolidated basis prepared in accordance with US GAAP.
The table below sets forth the components of our cash receipts for the periods indicated on a Burford-only basis.
| | | | | | | | | | | | | | |
| Burford-only (non-GAAP) | | Years ended December 31, |
| ($ in thousands) | | 2024 | | 2023 |
| Proceeds from capital provision assets | | $ | 648,477 | | | $ | 442,066 | |
| Proceeds from asset management income | | 26,491 | | | 32,321 | |
Proceeds from other items(1) | | 24,179 | | | 14,822 | |
| Cash receipts | | 699,147 | | | 489,209 | |
1. See “—Reconciliations—Cash receipts reconciliations” for additional information with respect to the components of this line item. |
On a Burford-only basis, our cash receipts increased 43% for the year ended December 31, 2024, reflecting primarily cash received from realizations during 2024 and collections on the due from settlement of capital
provision assets receivable that was outstanding as of December 31, 2023. Of the $185.3 million of due from settlement receivables as of December 31, 2023, 97% was collected in cash during 2024.
See “—Reconciliations—Cash receipts reconciliation” for a reconciliation of cash receipts to proceeds from capital provision assets, the most comparable measure calculated in accordance with US GAAP.
Dividends
The table below sets forth our dividend payments during the year ended December 31, 2024.
| | | | | | | | | | | | | | | | | | | | |
| ($ in cents) | | Cash dividend per ordinary share | | Payment Date | | Record Date |
| 2023 final dividend | | 6.25 | | | June 14, 2024 | | May 24, 2024 |
| 2024 interim dividend | | 6.25 | | | December 5, 2024 | | November 1, 2024 |
| Total dividend payments made during the year ended December, 31, 2024 | | 12.50 | | | | | |
On February 28, 2025, the Board of Directors has declared, subject to shareholder approval at the annual general meeting to be held on May 14, 2025, a final dividend of 6.25¢ per ordinary share to be paid on June 13, 2025 to shareholders of record on May 23, 2025.
Off-balance sheet arrangements
As of December 31, 2024, and December 31, 2023, we had off-balance sheet arrangements relating to legal finance assets with structured entities that aggregate claims from multiple parties in the amount of $4.8 million and $2.8 million, respectively. See note 15 (Variable interest entities) to our consolidated financial statements contained in this 2024 Form 10-K for additional information with respect to structured entities. Critical accounting estimates
The preparation of our consolidated financial statements in accordance with US GAAP requires our
management to make estimates, judgments and assumptions that affect the reported amounts of capital provision assets. Our management bases these estimates and judgments on available information, historical experience and other assumptions that we believe are reasonable under the circumstances. However, these estimates, judgments and assumptions are often subjective and may be impacted negatively based on changing circumstances or changes in our analyses. We believe that our critical accounting policies could potentially produce materially different results if we were to change underlying estimates, judgments and/or assumptions.
Set forth below are certain aspects of our critical accounting policy. For a full discussion of this critical accounting policy and other significant accounting policies, see note 2 (Summary of significant accounting policies) to our consolidated financial statements contained in this 2024 Form 10-K. Fair value of capital provision assets
The determination of fair value for capital provision assets and financial liabilities relating to third-party interests in capital provision assets involves significant estimates and judgments. While the potential range of outcomes for the assets is wide, our fair value estimation is our best assessment of the current fair value of each asset or liability. Such an estimate is inherently subjective, being based largely on management’s estimate of forecasted cash flows, an assigned discount rate and an assessment of how individual events have changed the possible outcomes of the asset and their relative probabilities and hence the extent to which the fair value has altered. The aggregate of the fair values selected falls within a wide range of reasonably possible estimates. In our management’s opinion, there is no useful alternative valuation that would better quantify the market risk inherent in the portfolio and there are no inputs or variables to which the values of the assets are correlated other than interest rates that impact the discount rates applied. See note 14 (Fair value of assets and liabilities) to our consolidated financial statements contained in this 2024 Form 10-K and “—Fair value of capital provision assets” for additional information with respect to fair value. As of December 31, 2024 and 2023, should management’s estimate of the value of those instruments have been 10% higher or lower, as applicable, than provided for in our fair value estimates, while all other variables remained constant, our consolidated income and net assets would have increased and decreased, respectively, by $466.3 million and $458.7 million, respectively.
Furthermore, as of December 31, 2024 and 2023, should interest rates have been 50 or 100 basis points lower or higher, as applicable, than the actual interest rates used in the fair value estimates, while all other variables remained constant, the Group’s consolidated income and net assets and the Principal Finance
segment’s income and net assets would have increased or decreased, respectively, by the amounts set forth below.
| | | | | | | | | | | | | | |
| Consolidated | | December 31, |
| ($ in thousands) | | 2024 | | 2023 |
| +100 bps interest rates | | $ | (153,241) | | | $ | (161,110) | |
| +50 bps interest rates | | (77,644) | | | (81,745) | |
| -50 bps interest rates | | 78,514 | | 82,724 |
| -100 bps interest rates | | 159,169 | | 167,944 |
| | | | | | | | | | | | | | |
| Principal Finance segment | | December 31, |
| ($ in thousands) | | 2024 | | 2023 |
| +100 bps interest rates | | $ | (109,132) | | | $ | (112,951) | |
| +50 bps interest rates | | (55,276) | | | (57,283) | |
| -50 bps interest rates | | 56,046 | | 58,124 |
| -100 bps interest rates | | 113,583 | | 117,946 |
As of December 31, 2024 and 2023, should duration have been six or 12 months lower or higher, as applicable, than the actual duration used in the fair value estimates, while all other variables remained constant, the Group’s consolidated income and net assets and the Principal Finance segment’s income and net assets would have increased or decreased, respectively, by the amounts set forth below.
| | | | | | | | | | | | | | |
| Consolidated | | December 31, |
| ($ in thousands) | | 2024 | | 2023 |
+12 months duration(1) | | $ | (396,845) | | | $ | (363,901) | |
+6 months duration(1) | | (200,908) | | | (188,718) | |
-6 months duration(1) | | 196,721 | | 203,442 |
-12 months duration(1) | | 405,926 | | 393,248 |
1. Duration refers to the expected timing of a favorable outcome. See note 2 (Summary of significant accounting policies—Fair value of financial instruments) to the Group’s consolidated financial statements contained in this 2024 Form 10-K for additional information with respect to the valuation methodology for Level 3 assets. |
|
| | | | | | | | | | | | | | |
| Principal Finance segment | | December 31, |
| ($ in thousands) | | 2024 | | 2023 |
+12 months duration(1) | | $ | (268,484) | | | $ | (244,518) | |
+6 months duration(1) | | (135,827) | | | (126,583) | |
-6 months duration(1) | | 133,446 | | 136,794 |
-12 months duration(1) | | 280,636 | | 266,701 |
1. Duration refers to the expected timing of a favorable outcome. See note 2 (Summary of significant accounting policies—Fair value of financial instruments) to the Group’s consolidated financial statements contained in this 2024 Form 10-K for additional information with respect to the valuation methodology for Level 3 assets. |
|
The sensitivity impact has been provided on a pre-tax basis for both our consolidated income and net assets because the fluctuation in our effective tax rate from period to period could indicate changes in sensitivity not driven by the valuation that we consider difficult to follow and detract from the comparability of this information.
Contractual obligations
Our material contractual obligations consist of financial liabilities relating to (i) definitive commitments to financing arrangements, (ii) debt securities and related interest payments, (iii) operating leases and (iv) third-party interests in capital provision assets. See note 20 (Financial commitments and contingent liabilities) to our consolidated financial statements contained in this 2024 Form 10-K for additional information with respect to our contractual obligations. See “—Segments—Principal Finance segment—Undrawn commitments – Principal Finance segment” and “—Segments—Asset Management and Other Services segment—Portfolio value – Asset Management and Other Services segment” for information with respect to our undrawn commitments.
Recent accounting standards updates
See note 2 (Summary of significant accounting policies—Recently issued or adopted accounting pronouncements) to our consolidated financial statements contained in this 2024 Form 10-K for further information. Reconciliations
The tables below set forth the reconciliations of the consolidated statements of financial condition to total segments (Burford-only) statements of financial condition as of the dates indicated. See “—Basis of presentation of financial information—Non-GAAP financial measures relating to our business structure” for additional information.
The first column in the tables below sets forth our results of operations on a consolidated basis as reported in our consolidated financial statements prepared in accordance with US GAAP. These results of operations include investments in a number of entities that are not wholly owned subsidiaries of Burford Capital Limited and, therefore, contain third-party capital, including BOF-C, the Advantage Fund, Colorado and, prior to its liquidation in the fourth quarter of 2023, the Strategic Value Fund. The presentation of our results of operations on a consolidated basis requires a line-by-line consolidation of 100% of each non-wholly owned entity’s assets and liabilities. The portion of the net assets that is attributable to the third-party interests are then presented separately as single line items within the consolidated statements of financial condition. We believe it is helpful to exclude the interests of investors other than Burford in our discussion of our results of operations, and we have therefore, as an alternative presentation, excluded from our presentation of our results of operations the non-Burford portion of the individual assets and liabilities relating to such third-party capital. The reconciliations eliminate the line-by-line consolidation of all the applicable entities’ individual assets and liabilities required by US GAAP to present Burford’s investment in the non-wholly owned entities and Burford’s share of the gain or loss earned on such investment.
Reconciliations of consolidated statements of financial condition to total segments (Burford-only) statements of financial condition
The tables below set forth the reconciliations of consolidated statements of financial condition to total segments (Burford-only) statements of financial condition as of the dates indicated.
| | | | | | | | | | | | | | | | | | | | |
| | December 31, 2024 |
| ($ in thousands) | | Consolidated | | Third-party interests | | Total segments (Burford-only) |
| Assets | | | | | | |
| Cash and cash equivalents | | $ | 469,930 | | | $ | (28,269) | | | $ | 441,661 | |
| Marketable securities | | 79,020 | | | — | | | 79,020 | |
| Other assets | | 61,006 | | | 114,475 | | | 175,481 | |
| Due from settlement of capital provision assets | | 183,858 | | | (207) | | | 183,651 | |
| Capital provision assets | | 5,243,917 | | | (1,672,693) | | | 3,571,224 | |
| Goodwill | | 133,948 | | | — | | | 133,948 | |
| Deferred tax asset | | 3,346 | | | — | | | 3,346 | |
| Total assets | | 6,175,025 | | | (1,586,694) | | | 4,588,331 | |
| | | | | | |
| Liabilities | | | | | | |
| Debt interest payable | | 12,097 | | | — | | | 12,097 | |
| Other liabilities | | 141,973 | | | (2,238) | | | 139,735 | |
| Long-term incentive compensation payable | | 217,552 | | | — | | | 217,552 | |
| Debt payable | | 1,763,612 | | | — | | | 1,763,612 | |
| Financial liabilities relating to third-party interests in capital provision assets | | 747,053 | | | (747,053) | | | — | |
| Deferred tax liability | | 35,903 | | | — | | | 35,903 | |
| Total liabilities | | 2,918,190 | | | (749,291) | | | 2,168,899 | |
| Total shareholders' equity | | 3,256,835 | | | (837,403) | | | 2,419,432 | |
| | | | | | | | | | | | | | | | | | | | |
| | December 31, 2023 |
| ($ in thousands) | | Consolidated | | Third-party interests | | Total segments (Burford-only) |
| Assets | | | | | | |
| Cash and cash equivalents | | $ | 220,549 | | | $ | (24,634) | | | $ | 195,915 | |
| Marketable securities | | 107,561 | | | — | | | 107,561 | |
| Other assets | | 63,464 | | | 96,653 | | | 160,117 | |
| Due from settlement of capital provision assets | | 265,540 | | | (80,273) | | | 185,267 | |
| Capital provision assets | | 5,045,388 | | | (1,613,276) | | | 3,432,112 | |
| Goodwill | | 133,965 | | | — | | | 133,965 | |
| Deferred tax asset | | 927 | | | — | | | 927 | |
| Total assets | | 5,837,394 | | | (1,621,530) | | | 4,215,864 | |
| | | | | | |
| Liabilities | | | | | | |
| Debt interest payable | | 34,416 | | | — | | | 34,416 | |
| Other liabilities | | 122,199 | | | (412) | | | 121,787 | |
| Long-term incentive compensation payable | | 183,134 | | | — | | | 183,134 | |
| Debt payable | | 1,534,730 | | | — | | | 1,534,730 | |
| Financial liabilities relating to third-party interests in capital provision assets | | 704,196 | | | (704,196) | | | — | |
| Deferred tax liability | | 50,939 | | | — | | | 50,939 | |
| Total liabilities | | 2,629,614 | | | (704,608) | | | 1,925,006 | |
| Total shareholders' equity | | 3,207,780 | | | (916,922) | | | 2,290,858 | |
Reconciliations of capital provision assets
The tables below set forth the reconciliations of components of the consolidated capital provision assets as of the beginning and end of period and unrealized fair value as of the end of period to total segments (Burford-only) capital provision assets as of the beginning and end of period and unrealized fair value as of the end of period, in each case, for the periods indicated.
| | | | | | | | | | | | | | | | | | | | |
| | Year ended December 31, 2024 |
| ($ in thousands) | | Consolidated | | Third-party interests | | Total segments (Burford-only) |
| Beginning of period | | $ | 5,045,388 | | | $ | (1,613,276) | | | $ | 3,432,112 | |
| Deployments | | 555,088 | | | (155,776) | | | 399,312 | |
| Realizations | | (907,042) | | | 260,166 | | | (646,876) | |
| Income for the period | | 567,646 | | | (164,471) | | | 403,175 | |
| Foreign exchange gains/(losses) | | (17,163) | | | 664 | | | (16,499) | |
| End of period | | 5,243,917 | | | (1,672,693) | | | 3,571,224 | |
| | | | | | |
| | | | | | |
| Deployed cost, end of period | | 2,341,377 | | | (668,784) | | | 1,672,593 | |
| Unrealized fair value, end of period | | 2,902,540 | | | (1,003,909) | | | 1,898,631 | |
| Capital provision assets | | 5,243,917 | | | (1,672,693) | | | 3,571,224 | |
| | | | | | | | | | | | | | | | | | | | |
| | Year ended December 31, 2023 |
| ($ in thousands) | | Consolidated | | Third-party interests | | Total segments (Burford-only) |
| Beginning of period | | $ | 3,735,556 | | | $ | (1,099,116) | | | $ | 2,636,440 | |
| Deployments | | 682,027 | | | (270,234) | | | 411,793 | |
| Realizations | | (708,293) | | | 195,638 | | | (512,655) | |
| Income for the period | | 1,333,262 | | | (445,048) | | | 888,214 | |
| Foreign exchange gains/(losses) | | 2,836 | | | 5,484 | | | 8,320 | |
| End of period | | 5,045,388 | | | (1,613,276) | | | 3,432,112 | |
| | | | | | |
| Deployed cost, end of period | | 2,280,563 | | | (668,281) | | | 1,612,282 | |
| Unrealized fair value, end of period | | 2,764,825 | | | (944,995) | | | 1,819,830 | |
| Capital provision assets | | 5,045,388 | | | (1,613,276) | | | 3,432,112 | |
Reconciliations of capital provision income
The tables below set forth the reconciliations of components of the consolidated capital provision income to total segments (Burford-only) capital provision income for the periods indicated.
| | | | | | | | | | | | | | | | | | | | |
| | Year ended December 31, 2024 |
| ($ in thousands) | | Consolidated | | Third-party interests | | Total segments (Burford-only) |
| Net realized gains/(losses) | | $ | 439,665 | | | $ | (112,491) | | | $ | 327,174 | |
| Fair value adjustment during the period, net of previously recognized unrealized gains/(losses) transferred to realized gains/(losses) | | 127,981 | | | (51,980) | | | 76,001 | |
| Income/(loss) on capital provision assets | | 567,646 | | | (164,471) | | | 403,175 | |
| Foreign exchange gains/(losses) | | (15,701) | | | 529 | | | (15,172) | |
| Net income/(loss) on due from settlement of capital provision assets | | 2,704 | | | — | | | 2,704 | |
| Net gains/(losses) on financial liabilities at fair value through profit and loss | | (2,583) | | | — | | | (2,583) | |
| Total capital provision income | | 552,066 | | | (163,942) | | | 388,124 | |
| | | | | | | | | | | | | | | | | | | | |
| | Year ended December 31, 2023 |
| ($ in thousands) | | Consolidated | | Third-party interests | | Total segments (Burford-only) |
| Net realized gains/(losses) | | $ | 251,618 | | | $ | (64,242) | | | $ | 187,376 | |
| Fair value adjustment during the period, net of previously recognized unrealized gains/(losses) transferred to realized gains/(losses) | | 1,081,644 | | | (380,806) | | | 700,838 | |
| Income/(loss) on capital provision assets | | 1,333,262 | | | (445,048) | | | 888,214 | |
| Interest and other income | | 650 | | | — | | | 650 | |
| Foreign exchange gains/(losses) | | 8,012 | | | (505) | | | 7,507 | |
| Net income/(loss) on due from settlement of capital provision assets | | (1) | | | 1 | | | — | |
| Total capital provision income | | 1,341,923 | | | (445,552) | | | 896,371 | |
Reconciliations of due from settlement of capital provision assets
The tables below set forth the reconciliations of components of the consolidated due from settlement of capital provision assets as of the beginning and end of period to total segments (Burford-only) due from settlement of capital provision assets as of the beginning and end of period for the periods indicated.
| | | | | | | | | | | | | | | | | | | | |
| | Year ended December 31, 2024 |
| ($ in thousands) | | Consolidated | | Third-party interests | | Total segments (Burford-only) |
| Beginning of period | | $ | 265,540 | | | $ | (80,273) | | | $ | 185,267 | |
| Transfer of realizations from capital provision assets | | 907,042 | | | (260,166) | | | 646,876 | |
| Other income/(loss) | | 2,704 | | | — | | | 2,704 | |
| Proceeds from capital provision assets | | (991,292) | | | 340,232 | | | (651,060) | |
| Foreign exchange gains/(losses) | | (136) | | | — | | | (136) | |
| End of period | | 183,858 | | | (207) | | | 183,651 | |
| | | | | | | | | | | | | | | | | | | | |
| | Year ended December 31, 2023 |
| ($ in thousands) | | Consolidated | | Third-party interests | | Total segments (Burford-only) |
| Beginning of period | | $ | 116,582 | | | $ | (1,932) | | | $ | 114,650 | |
| Transfer of realizations from capital provision assets | | 708,293 | | | (195,638) | | | 512,655 | |
Net realized gains/(losses)(1) | | (11,330) | | | 11,330 | | | — | |
| Unrealized gains/(losses) on due from settlement of capital provision assets, net of previously recognized unrealized gains/(losses) transferred to realized gains/(losses) | | 11,329 | | | (11,329) | | | — | |
| Proceeds from capital provision assets | | (559,362) | | | 117,296 | | | (442,066) | |
| Foreign exchange gains/(losses) | | 28 | | | — | | | 28 | |
| End of period | | 265,540 | | | (80,273) | | | 185,267 | |
| 1. The net realized loss of $11.3 million represents the realization of a previously recognized $11.3 million unrealized loss as described in the 2023 Annual Report. The net impact for the year ended December 31, 2024, is $1,000 reported as net loss on due from settlement of capital provision assets in note 6 (Capital provision assets). |
|
Reconciliations of capital provision undrawn commitments
The tables below set forth the reconciliations of the consolidated capital provision undrawn commitments to total segments (Burford-only) capital provision undrawn commitments as of the dates indicated.
| | | | | | | | | | | | | | | | | | | | |
| | December 31, 2024 |
| ($ in thousands) | | Consolidated | | Third-party interests | | Total segments (Burford-only) |
| Definitive | | $ | 962,808 | | | $ | (189,135) | | | $ | 773,673 | |
| Discretionary | | 1,032,433 | | | (214,568) | | | 817,865 | |
| Legal risk (definitive) | | 41,318 | | | — | | | 41,318 | |
| Total capital provision undrawn commitments | | 2,036,559 | | | (403,703) | | | 1,632,856 | |
| | | | | | | | | | | | | | | | | | | | |
| | December 31, 2023 |
| ($ in thousands) | | Consolidated | | Third-party interests | | Total segments (Burford-only) |
| Definitive | | $ | 839,973 | | | $ | (248,031) | | | $ | 591,942 | |
| Discretionary | | 977,733 | | | (211,196) | | | 766,537 | |
| Legal risk (definitive) | | 55,583 | | | (6,057) | | | 49,526 | |
| Total capital provision undrawn commitments | | 1,873,289 | | | (465,284) | | | 1,408,005 | |
Reconciliations of asset management income
The tables below set forth the reconciliations of components of the consolidated asset management income to total segments (Burford-only) asset management income for the periods indicated.
| | | | | | | | | | | | | | | | | | | | | | | | | | | | | | | | | | | | | | |
| | Year ended December 31, 2024 | | Year ended December 31, 2023 |
| ($ in thousands) | | Consolidated | | Third-party interests | | Total segments (Burford-only) | | Consolidated | | Third-party interests | | Total segments (Burford-only) |
| Management fee income | | $ | 6,840 | | | $ | — | | | $ | 6,840 | | | $ | 7,642 | | | $ | 108 | | | $ | 7,750 | |
| Performance fee income | | 1,500 | | | — | | | 1,500 | | | — | | | — | | | — | |
| Profit sharing income from funds | | — | | | 36,287 | | | 36,287 | | | — | | | 55,962 | | | 55,962 | |
| Total asset management income | | 8,340 | | | 36,287 | | | 44,627 | | | 7,642 | | | 56,070 | | | 63,712 | |
Deployments reconciliations
The table below sets forth the reconciliations of the components of consolidated deployments to Burford-only deployments for the periods indicated.
| | | | | | | | | | | | | | |
| | Years ended December 31, |
| ($ in thousands) | | 2024 | | 2023 |
| Consolidated deployments | | $ | 555,088 | | | $ | 682,027 | |
| Plus/(Less): Third-party interests | | (155,776) | | | (270,234) | |
| Total segments (Burford-only) total deployments | | 399,312 | | | 411,793 | |
| Plus/(Less): Capital deployed to fund level but not yet invested | | (709) | | | (5,240) | |
| Plus/(Less): Capital deployed in prior years and invested in the current year | | 50 | | | 3,727 | |
| Plus/(Less): Case-related expenditures ineligible for inclusion in asset cost | | 1,549 | | | 988 | |
| Plus/(Less): Deployments on behalf of subparticipations | | 512 | | | 283 | |
| Adjusted Burford-only total deployments | | 400,714 | | | 411,551 | |
See “—Basis of presentation of financial information—KPIs and non-GAAP financial measures relating to our operating and financial performance—KPIs” and “Certain terms used in this 2024 Form 10-K” for additional information with respect to certain terms useful for the understanding of our deployments information and “—Segments—Principal Finance segment—Portfolio value – Principal Finance segment” for additional information with respect to our deployments.
Realizations reconciliations
The table below sets forth the reconciliations of the components of consolidated realizations to Burford-only realizations for the periods indicated.
| | | | | | | | | | | | | | |
| | Years ended December 31, |
| ($ in thousands) | | 2024 | | 2023 |
| Consolidated realizations | | $ | 907,042 | | | $ | 708,293 | |
| Plus/(Less): Third-party interests | | (260,166) | | | (195,638) | |
| Total segments (Burford-only) total realizations | | 646,876 | | | 512,655 | |
| Plus/(Less): Realizations from other income on due from settlement of capital provision assets | | 2,704 | | | — | |
| Plus/(Less): Loss from financial liabilities at fair value through profit or loss | | (2,583) | | | — | |
| Plus/(Less): Realizations from investment subparticipations | | — | | | 199 | |
| Plus/(Less): Reported realizations held at joint venture and not yet distributed | | 6,520 | | | 10,702 | |
| Plus/(Less): Reported realizations held at fund level and not yet distributed | | 840 | | | 7,070 | |
| Plus/(Less): Prior period realizations held at fund level and distributed in the current period | | (13,233) | | | — | |
| Adjusted Burford-only total realizations | | 641,124 | | | 530,626 | |
See “—Basis of presentation of financial information—KPIs and non-GAAP financial measures relating to our operating and financial performance—KPIs” and “Certain terms used in this 2024 Form 10-K” for additional information with respect to certain terms useful for the understanding of our realizations information and “—
Segments—Principal Finance segment—Portfolio value – Principal Finance segment” for additional information with respect to our realizations.
Cash receipts reconciliations
The table below sets forth the reconciliations of Burford-only cash receipts to consolidated cash receipts, the most comparable measure calculated in accordance with US GAAP, for the periods indicated.
| | | | | | | | | | | | | | |
| | Years ended December 31, |
| ($ in thousands) | | 2024 | | 2023 |
| Consolidated proceeds from capital provision assets | | $ | 991,292 | | | $ | 559,362 | |
| Less: Third-party interests | | (340,232) | | | (117,296) | |
| Total segments (Burford-only) proceeds from capital provision assets | | 651,060 | | | 442,066 | |
| Plus: Loss on financial liabilities at fair value through profit or loss | | (2,583) | | | — | |
| Burford-only proceeds from capital provision assets | | 648,477 | | | 442,066 | |
| Consolidated asset management income | | 8,340 | | | 7,642 | |
| Plus: Eliminated income from funds | | 36,287 | | | 56,070 | |
| Total segments (Burford-only) asset management income | | 44,627 | | | 63,712 | |
Less: Non-cash adjustments(1) | | (18,136) | | | (31,391) | |
| Burford-only proceeds from asset management income | | 26,491 | | | 32,321 | |
| Burford-only proceeds from marketable securities interest and dividends | | 20,554 | | | 6,297 | |
| Burford-only proceeds from other income | | 3,625 | | | 8,525 | |
| Burford-only proceeds from other items | | 24,179 | | | 14,822 | |
| Cash receipts | | 699,147 | | | 489,209 | |
| 1. Adjustments for the change in asset management receivables accrued during the applicable period but not yet received as of the end of such period. |
See “—Basis of presentation of financial information—KPIs and non-GAAP financial measures relating to our operating and financial performance—Non-GAAP financial measures” and “—Liquidity and capital resources—Cash receipts” for additional information with respect to cash receipts.
Tangible book value attributable to Burford Capital Limited and tangible book value attributable to Burford Capital Limited per ordinary share reconciliations
The table below sets forth the reconciliations of tangible book value attributable to Burford Capital Limited and tangible book value attributable to Burford Capital Limited per ordinary share to total Burford Capital Limited equity, the most comparable measure calculated in accordance with US GAAP, as of the dates indicated.
| | | | | | | | | | | | | | |
| | December 31, |
| ($ in thousands, except share data) | | 2024 | | 2023 |
| Burford Capital Limited equity | | $ | 2,419,432 | | | $ | 2,290,858 | |
| Less: Goodwill | | (133,948) | | | (133,965) | |
| Tangible book value attributable to Burford Capital Limited | | 2,285,484 | | | 2,156,893 | |
| | | | |
| Basic ordinary shares outstanding | | 219,421,904 | | | 218,962,441 | |
| | | | |
| Tangible book value attributable to Burford Capital Limited per ordinary share | | 10.42 | | | 9.85 | |
See “—Basis of presentation of financial information—KPIs and non-GAAP financial measures relating to our operating and financial performance—Non-GAAP financial measures” for additional information with respect to tangible book value attributable to Burford Capital Limited and tangible book value attributable to Burford Capital Limited per ordinary share.
Debt leverage ratio calculations
Consolidated net debt to consolidated tangible assets ratio calculation
The table below sets forth the calculations of consolidated net debt to consolidated tangible assets ratio as of the dates indicated.
| | | | | | | | | | | | | | |
| | December 31, |
| ($ in thousands) | | 2024 | | 2023 |
Total principal amount of debt outstanding(1) | | $ | 1,783,690 | | | $ | 1,563,073 | |
| Less: Cash and cash equivalents | | (469,930) | | | (220,549) | |
| Less: Marketable securities | | (79,020) | | | (107,561) | |
| Consolidated net debt | | 1,234,740 | | | 1,234,963 | |
| | | | |
| Total assets | | 6,175,025 | | | 5,837,394 | |
| Less: Goodwill | | (133,948) | | | (133,965) | |
| Consolidated tangible assets | | 6,041,077 | | | 5,703,429 | |
| | | | |
| Consolidated net debt to consolidated tangible assets ratio | | 20 | % | | 22 | % |
1. Represents the total principal amount of debt outstanding as set forth in note 12 (Debt) to our condensed consolidated financial statements contained in this 2024 Form 10-K. Debt securities denominated in pound sterling have been converted to US dollar using GBP/USD exchange rates of $1.2529 and $1.2747 as of December 31, 2024 and 2023, respectively. |
|
See “—Liquidity and capital resources—Debt” for additional information with respect to our debt securities.
Consolidated Indebtedness to Net Tangible Equity Ratio calculation
The table below sets forth the calculations of Consolidated Indebtedness to Net Tangible Equity Ratio (as defined in the indentures governing the 2028 Notes and the 2030 Notes, as applicable) as of the dates indicated.
| | | | | | | | | | | | | | |
| | December 31, |
| ($ in thousands) | | 2024 | | 2023 |
| Debt payable | | $ | 1,763,612 | | | $ | 1,534,730 | |
| Less: Debt attributable to Unrestricted Subsidiaries | | — | | | — | |
| Consolidated Indebtedness | | 1,763,612 | | | 1,534,730 | |
| | | | |
| Total equity | | 3,256,835 | | | 3,207,780 | |
| Less: Equity attributable to Unrestricted Subsidiaries | | (822,492) | | | (901,146) | |
| Less: Goodwill | | (133,948) | | | (133,965) | |
| Net Tangible Equity | | 2,300,395 | | | 2,172,669 | |
| | | | |
| Consolidated Indebtedness to Net Tangible Equity Ratio | | 0.77x | | 0.71x |
See “—Liquidity and capital resources—Debt” for additional information with respect to our debt securities.
Consolidated Indebtedness to Consolidated Equity Ratio calculation
The table below sets forth the calculations of Consolidated Indebtedness to Consolidated Equity Ratio (as defined in the indenture governing the 2031 Notes) as of the dates indicated.
| | | | | | | | | | | | | | |
| | December 31, |
| ($ in thousands) | | 2024 | | 2023 |
| Debt payable | | $ | 1,763,612 | | | $ | 1,534,730 | |
| Less: Debt attributable to Unrestricted Subsidiaries | | — | | | — | |
| Less: The lesser of specified cash and cash equivalents or $100 million | | (100,000) | | | (100,000) | |
| Consolidated Indebtedness | | 1,663,612 | | | 1,434,730 | |
| | | | |
| Total equity | | 3,256,835 | | | 3,207,780 | |
| Less: Equity attributable to Unrestricted Subsidiaries | | (822,492) | | | (901,146) | |
| Consolidated Equity | | 2,434,343 | | | 2,306,634 | |
| | | | |
| Consolidated Indebtedness to Consolidated Equity Ratio | | 0.68x | | 0.62x |
See “—Liquidity and capital resources—Debt” for additional information with respect to our debt securities.
Item 7A. Quantitative and qualitative disclosures about market risk
Market and asset risk
We are exposed to market and asset risk with respect to our marketable securities, due from settlement of capital provision assets, capital provision assets and financial liabilities relating to third-party interests in capital provision assets. With respect to our marketable securities, which primarily consist of government securities, investment grade corporate bonds, asset-backed securities and mutual funds, market risk is the risk that the fair value of marketable securities will fluctuate due to changes in market variables, such as interest rates, credit risk, security and bond prices and foreign exchange rates. As of December 31, 2024 and 2023, should the prices of the investments in corporate bonds and investment funds have been 10% higher or lower, while all other variables remained constant, our consolidated income and net assets would have increased or decreased, respectively, by $7.9 million and $10.8 million, respectively.
We only finance capital provision assets upon undertaking an in-house due diligence process. However, capital provision assets involve high risk, and there can be no assurance of a particular realization on any individual capital provision asset. Certain of our capital provision assets are comprised of a portfolio of assets thereby mitigating the impact of the outcome of any single capital provision asset. While the claims underlying our capital provision assets are generally diverse, we monitor and manage the portfolio for related exposures that finance different clients relative to the same or very similar claims, such that the outcomes on those related exposures are likely to be correlated. Capital provision assets include a portfolio with equity risk where the price of a listed equity security is a determinant of the ultimate amount of the realization upon the resolution of the litigation risk. As of December 31, 2024 and 2023, should the prices of the due from settlement of capital provision assets, capital provision assets and financial liabilities relating to third-party interests in capital provision assets have been 10% higher or lower, while all other variables remained constant, our consolidated income and net assets would have increased or decreased, respectively, by $468.1 million and $460.7 million respectively.
The sensitivity impacts have been provided on a pre-tax basis for both our consolidated income and net assets as we consider the fluctuation in our effective tax rate from period to period could indicate changes in sensitivity not driven by the valuation that are difficult to follow and detract from the comparability of this information.
Liquidity risk
We are exposed to liquidity risk. Our financing of capital provision assets requires capital to meet commitments, as described in note 20 (Financial commitments and contingent liabilities) to our consolidated financial statements contained in this 2024 Form 10-K, and for settlement of operating liabilities. Our capital provision assets typically require significant capital contributions with little or no immediate return and no guarantee of return or repayment. To manage liquidity risk, we finance assets with a range of anticipated lives and hold marketable securities which can be readily realized to meet those liabilities and commitments. Marketable securities primarily consist of government securities, investment grade corporate bonds, asset-backed securities and mutual funds, all of which can be redeemed on short notice or be sold on an active trading market.
As of December 31, 2024 and 2023, we had $1.8 billion and $1.6 billion aggregate principal amount of our debt securities outstanding, respectively, which were issued primarily for the purpose of raising sufficient capital to help mitigate liquidity risk. As of December 31, 2024 and 2023, the future interest payments on our outstanding debt securities amounted to $690.5 million and $625.3 million, respectively, until their respective maturities in August 2025, December 2026, April 2028, April 2030 and July 2031, at which point the respective aggregate principal amounts will be required to be repaid. See note 12 (Debt) and note 20 (Financial commitments and contingent liabilities) to our consolidated financial statements contained in this 2024 Form 10-K for additional information with respect to our debt securities, including a schedule of maturities. Credit risk
We are exposed to credit risk in various asset structures as described in note 2 (Summary of significant accounting policies) to our consolidated financial statements contained in this 2024 Form 10-K, most of which involve financing sums recoverable only out of successful capital provision assets with a concomitant risk of loss of deployed cost. Upon becoming contractually entitled to proceeds, depending on the structure of the particular capital provision asset, we could be a creditor of, and subject to direct or indirect credit risk from, a claimant, a defendant and/or other parties, or a combination thereof. Moreover, we may be indirectly subject to credit risk to the extent a defendant does not pay a claimant immediately, notwithstanding successful adjudication of a claim in the claimant’s favor. Our credit risk is uncertain given that our entitlement pursuant to our assets is generally not established until a successful resolution of claims, and our potential credit risk is mitigated by the diversity of our counterparties and indirect creditors, and due to a judgment creditor (in contrast to a conventional debtholder and in the absence of an actual bankruptcy of the counterparty) having immediate and unfettered rights of action to, for example, seize assets and garnish cash flows. See “Management's discussion and analysis of financial condition and results of operations—Economic and market conditions—Party solvency” for additional information with respect to when a claimant or defendant in a matter we are financing becomes insolvent. We are also exposed to credit risk in respect of the marketable securities and cash and cash equivalents. The credit risk of the cash and cash equivalents is mitigated as all cash is placed with reputable banks with a sound credit rating. Marketable securities primarily consist of government securities, investment grade corporate bonds, asset-backed securities and mutual funds, all of which can be redeemed on short notice or be sold on an active trading market. The maximum credit risk exposure represented by cash and cash equivalents, marketable securities, due from settlement of capital provision assets and capital provision assets is specified in our consolidated statements of financial condition.
In addition, we are exposed to credit risk on financial assets and receivables in other assets, all of which are held at amortized cost. The maximum credit exposure for such amounts was the carrying value of $17.1 million and $17.8 million as of December 31, 2024 and 2023, respectively. We review the lifetime expected credit loss based on historical collection performance, the specific provisions of any settlement agreement and a forward-looking assessment of macroeconomic factors. Based on this review, we have not identified any material expected credit loss relating to the financial assets held at amortized cost. We recognized no impairments for the years ended December 31, 2024, 2023 and 2022.
Currency risk
We hold assets denominated in currencies other than US dollar, our functional currency, including pound sterling, Euro and Australian dollar. In addition, we issued debt securities denominated in pound sterling in 2017 that remained outstanding as of the date of this 2024 Form 10-K. We are therefore exposed to currency risk, as values of the assets and liabilities denominated in other currencies will fluctuate due to changes in exchange rates. We may use forward exchange contracts from time to time to mitigate currency risk.
As of December 31, 2024 and 2023, should pound sterling, Euro and Australian dollar have strengthened or weakened by 10% against US dollar, while all other variables remained constant, our capital provision assets and other assets/(liabilities) would have increased and decreased, respectively, as set forth in the tables below.
| | | | | | | | | | | | | | | | | | | | |
| | December 31, 2024 |
| ($ in thousands) | | Capital provision assets | | Other assets/ (liabilities) | | Currency risk
exposure of 10 % |
| US dollar | | 4,987,457 | | | (1,828,220) | | | — | |
| Pound sterling | | 9,582 | | | (178,431) | | | (16,885) | |
| Euro | | 192,988 | | 14,659 | | 20,765 |
| Australian dollar | | 22,558 | | | 50 | | | 2,261 | |
| Canadian dollar | | 28,745 | | 4,646 | | 3,339 |
| Singapore dollar | | 2,587 | | 214 | | 280 |
| Total | | 5,243,917 | | (1,987,082) | | | 9,760 | |
| | | | | | | | | | | | | | | | | | | | |
| | December 31, 2023 |
| ($ in thousands) | | Capital provision assets | | Other assets/ (liabilities) | | Currency risk
exposure of 10 % |
| US dollar | | 4,846,759 | | (1,603,260) | | | — |
| Pound sterling | | 10,921 | | (235,052) | | | (22,413) | |
| Euro | | 131,922 | | 735 | | 13,266 |
| Australian dollar | | 21,863 | | (150) | | | 2,171 | |
| Canadian dollar | | 31,376 | | 119 | | 3,150 |
| Singapore dollar | | 2,547 | | — | | 255 |
| Total | | 5,045,388 | | (1,837,608) | | | (3,571) | |
Interest rate risk
Interest rate risk is the risk that the fair value of future cash flows of a financial instrument will fluctuate because of changes in market interest rates. Our exposure to market risk for changes in floating interest rates relates primarily to our cash and cash equivalents, capital provision assets and certain marketable securities. All cash and cash equivalents bear interest at floating rates. There are certain capital provision assets, due from settlement of capital provision assets and marketable securities that earn interest based on fixed rates, but those assets do not have interest rate risk as they are not exposed to changes in market interest rates. While not interest bearing, the fair value of our capital provision assets is sensitive to changes in interest rates that impact the discount rates applied in measuring fair value. See “Management's discussion and analysis of financial condition and results of operations—Critical accounting estimates—Fair value of capital provision assets” for additional information with respect to such interest rate sensitivity. Our outstanding debt securities incur interest at a fixed rate and, therefore, are not exposed to changes in market interest rates.
The interest-bearing floating rate assets and liabilities are denominated in both US dollar and pound sterling. If interest rates increased and decreased by 25 basis points while all other variables remained constant, the net income/(loss) for the year ended December 31, 2024 and net assets as of December 31, 2024, would increase and decrease by $1.2 million, the net income/(loss) for the year ended December 31, 2023 and net assets as of December 31, 2023, would increase and decrease by $0.7 million, and the net income for the year ended December 31, 2022 and net assets as of December 31, 2022, would increase and decrease by $0.3 million. For fixed rate assets and liabilities, we estimated that there would be no material impact on net income or net assets. Fixed rate liabilities include our outstanding indebtedness as described in note 12 (Debt) to our consolidated financial statements contained in this 2024 Form 10-K.
The tables below set forth respective maturity periods of our floating and fixed rate assets and liabilities as of the dates indicated.
| | | | | | | | | | | | | | | | | | | | |
| | December 31, 2024 |
| ($ in thousands) | | Floating | | Fixed | | Total |
| Assets | | | | | | |
| Less than 3 months | | 469,930 | | 22,881 | | 492,811 |
| 3 to 6 months | | — | | 23,057 | | 23,057 |
| 6 to 12 months | | — | | 8,544 | | 8,544 |
| 1 to 2 years | | — | | 12,009 | | 12,009 |
| Greater than 2 years | | — | | 678,110 | | 678,110 |
| Liabilities | | | | | | |
| 6 to 12 months | | — | | 129,432 | | 129,432 |
| 1 to 2 years | | — | | 219,257 | | 219,257 | |
| Greater than 2 years | | — | | 1,435,000 | | 1,435,000 | |
| Net asset/(liabilities) | | 469,930 | | (1,039,088) | | (569,158) |
| | | | | | | | | | | | | | | | | | | | |
| | December 31, 2023 |
| ($ in thousands) | | Floating | | Fixed | | Total |
| Assets | | | | | | |
| Less than 3 months | | 220,549 | | 11,571 | | 232,120 |
| 3 to 6 months | | — | | 16,795 | | 16,795 |
| 6 to 12 months | | — | | 29,830 | | 29,830 |
| 1 to 2 years | | — | | 12,272 | | 12,272 |
| Greater than 2 years | | 76,887 | | 163,296 | | 240,183 |
| Liabilities | | | | | | |
| 1 to 2 years | | — | | 180,000 | | | 180,000 | |
| Greater than 2 years | | — | | 1,383,073 | | | 1,383,073 | |
| Net asset/(liabilities) | | 297,436 | | (1,329,309) | | | (1,031,873) | |
Item 8. Financial statements and supplementary data
Contents
Report of Independent Registered Public Accounting Firm
To the Shareholders and Board of Directors
Burford Capital Limited:
Opinion on the Consolidated Financial Statements
We have audited the accompanying consolidated statement of financial condition of Burford Capital Limited and subsidiaries (the Company) as of December 31, 2024, the related consolidated statements of operations, comprehensive income/(loss), changes in equity, and cash flows for the year then ended, and the related notes (collectively, the consolidated financial statements). In our opinion, the consolidated financial statements present fairly, in all material respects, the financial position of the Company as of December 31, 2024, and the results of its operations and its cash flows for the year then ended, in conformity with U.S. generally accepted accounting principles.
We also have audited, in accordance with the standards of the Public Company Accounting Oversight Board (United States) (PCAOB), the Company’s internal control over financial reporting as of December 31, 2024, based on criteria established in Internal Control – Integrated Framework (2013) issued by the Committee of Sponsoring Organizations of the Treadway Commission, and our report dated March 3, 2025 expressed an adverse opinion on the effectiveness of the Company’s internal control over financial reporting.
Basis for Opinion
These consolidated financial statements are the responsibility of the Company’s management. Our responsibility is to express an opinion on these consolidated financial statements based on our audit. We are a public accounting firm registered with the PCAOB and are required to be independent with respect to the Company in accordance with the U.S. federal securities laws and the applicable rules and regulations of the Securities and Exchange Commission and the PCAOB.
We conducted our audit in accordance with the standards of the PCAOB. Those standards require that we plan and perform the audit to obtain reasonable assurance about whether the consolidated financial statements are free of material misstatement, whether due to error or fraud. Our audit included performing procedures to assess the risks of material misstatement of the consolidated financial statements, whether due to error or fraud, and performing procedures that respond to those risks. Such procedures included examining, on a test basis, evidence regarding the amounts and disclosures in the consolidated financial statements. Our audit also included evaluating the accounting principles used and significant estimates made by management, as well as evaluating the overall presentation of the consolidated financial statements. We believe that our audit provides a reasonable basis for our opinion.
Critical Audit Matter
The critical audit matter communicated below is a matter arising from the current period audit of the consolidated financial statements that was communicated or required to be communicated to the audit committee and that: (1) relates to accounts or disclosures that are material to the consolidated financial statements and (2) involved our especially challenging, subjective, or complex judgments. The communication of a critical audit matter does not alter in any way our opinion on the consolidated financial statements, taken as a whole, and we are not, by communicating the critical audit matter below, providing a separate opinion on the critical audit matter or on the accounts or disclosures to which it relates.
Fair value of capital provision assets
As discussed in Notes 2, 5, and 14 to the consolidated financial statements, the Company had capital provisions assets (CPAs) totaling $5,244 million as of December 31, 2024, a substantial portion of which related to CPAs using unobservable inputs (Level 3 CPAs) totaling $5,227 million. CPAs are held at fair value determined using an income approach. The income approach estimates fair value based on estimated, risk-adjusted future cash flows, using a discount rate to reflect the funding risk of deploying capital for financing capital provision assets. This fair value methodology includes certain assumptions used in the valuation model, such as the discount rate, the timing and amount of expected cash flows, and a risk-adjustment factor reflecting the uncertainty inherent in the cash flows primarily driven by litigation risk, which changes as a result of observable litigation events.
We identified the assessment of the measurement of fair value of Level 3 CPAs as a critical audit matter. A high degree of effort, including specialized skills and knowledge, and subjective and complex auditor judgment was involved in the assessment of the Level 3 CPA fair values due to measurement uncertainty. Specifically, the assessment encompassed the evaluation of the fair value methodology utilized, including significant assumptions used in the valuation model to estimate fair value. Significant assumptions include the discount rate, the timing and amount of expected cash flows, and a risk-adjustment factor reflecting
the uncertainty inherent in the cash flows. In addition, auditor judgment was required to evaluate the sufficiency of audit evidence obtained.
The following are the primary procedures we performed to address this critical audit matter.
We involved valuation professionals with specialized skills and knowledge, who assisted in:
•evaluating the Company’s fair value methodology for compliance with U.S. generally accepted accounting principles
•testing the mathematical accuracy of the valuation models in accordance with the Company’s valuation policy for a selection of Level 3 CPAs
•evaluating the reasonableness of the Company’s discount rates by comparing to an independently developed range of discount rates
•testing that the discount rate was applied correctly in the valuation model based on management’s discount rate determination for a selection of Level 3 CPAs.
We evaluated the knowledge, skills, and abilities of management’s external legal specialists, who were utilized to assess the reasonableness of percentage ranges to be applied against the risk-adjustment factor for observable litigation events based on their legal expertise. Additionally, we evaluated the sufficiency and appropriateness of the specialists' scope of work and report.
For a selection of Level 3 CPAs, we:
•confirmed the observable litigation events with external counterparties and compared to those identified by management
•evaluated the observable litigation events based on available court documents and other information in the public domain and compared to those identified by management
•agreed the cash outflows and inflows used in the valuation model to bank statements or confirmations with external counterparties
•recalculated the Company’s contractual entitlement based on the terms of the related capital provision agreements
•agreed estimated proceeds that were impacted by damages or settlements to court documents or inquired of management and inspected relevant supporting documentation to assess management’s proceeds determination
•evaluated the duration used in the valuation model by comparing to the Company’s duration policy, which was agreed to third-party data, or by inspecting relevant supporting documentation.
We evaluated the sufficiency of audit evidence obtained by assessing the results of the procedures performed, including the appropriateness of the nature and extent of such evidence.
/s/ KPMG LLP
We have served as the Company's auditor since 2024.
New York, New York
March 3, 2025
Report of Independent Registered Public Accounting Firm
To the Shareholders and the Board of Directors
Burford Capital Limited:
Opinion on Internal Control Over Financial Reporting
We have audited Burford Capital Limited and subsidiaries' (the Company) internal control over financial reporting as of December 31, 2024, based on criteria established in Internal Control – Integrated Framework (2013) issued by the Committee of Sponsoring Organizations of the Treadway Commission. In our opinion, because of the effect of the material weakness, described below, on the achievement of the objectives of the control criteria, the Company has not maintained effective internal control over financial reporting as of December 31, 2024, based on criteria established in Internal Control – Integrated Framework (2013) issued by the Committee of Sponsoring Organizations of the Treadway Commission.
We also have audited, in accordance with the standards of the Public Company Accounting Oversight Board (United States) (PCAOB), the consolidated statement of financial condition of the Company as of December 31, 2024, the related consolidated statements of operations, comprehensive income/(loss), changes in equity, and cash flows for the year then ended, and the related notes (collectively, the consolidated financial statements), and our report dated March 3, 2025 expressed an unqualified opinion on those consolidated financial statements.
A material weakness is a deficiency, or a combination of deficiencies, in internal control over financial reporting, such that there is a reasonable possibility that a material misstatement of the company’s annual or interim financial statements will not be prevented or detected on a timely basis. A material weakness related to a lack of available evidence to demonstrate the precision of management’s review of the controls to determine certain assumptions used in the measurement of the fair value of capital provision assets has been identified and included in management’s assessment. The material weakness was considered in determining the nature, timing, and extent of audit tests applied in our audit of the 2024 consolidated financial statements, and this report does not affect our report on those consolidated financial statements.
Basis for Opinion
The Company’s management is responsible for maintaining effective internal control over financial reporting and for its assessment of the effectiveness of internal control over financial reporting, included in the accompanying Management's annual report on internal control over financial reporting. Our responsibility is to express an opinion on the Company’s internal control over financial reporting based on our audit. We are a public accounting firm registered with the PCAOB and are required to be independent with respect to the Company in accordance with the U.S. federal securities laws and the applicable rules and regulations of the Securities and Exchange Commission and the PCAOB.
We conducted our audit in accordance with the standards of the PCAOB. Those standards require that we plan and perform the audit to obtain reasonable assurance about whether effective internal control over financial reporting was maintained in all material respects. Our audit of internal control over financial reporting included obtaining an understanding of internal control over financial reporting, assessing the risk that a material weakness exists, and testing and evaluating the design and operating effectiveness of internal control based on the assessed risk. Our audit also included performing such other procedures as we considered necessary in the circumstances. We believe that our audit provides a reasonable basis for our opinion.
Definition and Limitations of Internal Control Over Financial Reporting
A company’s internal control over financial reporting is a process designed to provide reasonable assurance regarding the reliability of financial reporting and the preparation of financial statements for external purposes in accordance with generally accepted accounting principles. A company’s internal control over financial reporting includes those policies and procedures that (1) pertain to the maintenance of records that, in reasonable detail, accurately and fairly reflect the transactions and dispositions of the assets of the company; (2) provide reasonable assurance that transactions are recorded as necessary to permit preparation of financial statements in accordance with generally accepted accounting principles, and that receipts and expenditures of the company are being made only in accordance with authorizations of management and directors of the company; and (3) provide reasonable assurance regarding prevention or timely detection of unauthorized acquisition, use, or disposition of the company’s assets that could have a material effect on the financial statements.
Because of its inherent limitations, internal control over financial reporting may not prevent or detect misstatements. Also, projections of any evaluation of effectiveness to future periods are subject to the risk
that controls may become inadequate because of changes in conditions, or that the degree of compliance with the policies or procedures may deteriorate.
/s/ KPMG LLP
New York, New York
March 3, 2025
Report of Independent Registered Public Accounting Firm
To the Shareholders and the Board of Directors of Burford Capital Limited
Opinion on the Financial Statements
We have audited the accompanying consolidated statement of financial condition of Burford Capital Limited (the "Company") as of December 31, 2023, the related consolidated statements of operations, comprehensive income, changes in equity and cash flows, for each of the two years in the period ended December 31, 2023, and the related notes (collectively referred to as the "consolidated financial statements"). In our opinion, the consolidated financial statements present fairly, in all material respects, the financial condition of the Company at December 31, 2023, and the results of its operations and its cash flows for each of the two years in the period ended December 31, 2023, in conformity with U.S. generally accepted accounting principles.
Basis for Opinion
These financial statements are the responsibility of the Company's management. Our responsibility is to express an opinion on the Company's financial statements based on our audits. We are a public accounting firm registered with the Public Company Accounting Oversight Board (United States) (PCAOB) and are required to be independent with respect to the Company in accordance with the U.S. federal securities laws and the applicable rules and regulations of the Securities and Exchange Commission and the PCAOB.
We conducted our audits in accordance with the standards of the PCAOB. Those standards require that we plan and perform the audit to obtain reasonable assurance about whether the financial statements are free of material misstatement, whether due to error or fraud. Our audits included performing procedures to assess the risks of material misstatement of the financial statements, whether due to error or fraud, and performing procedures that respond to those risks. Such procedures included examining, on a test basis, evidence regarding the amounts and disclosures in the financial statements. Our audits also included evaluating the accounting principles used and significant estimates made by management, as well as evaluating the overall presentation of the financial statements. We believe that our audits provide a reasonable basis for our opinion.
/s/ Ernst & Young LLP
We served as the Company's auditor from 2010 to 2024.
Guernsey, Channel Islands
March 28, 2024, except for the paragraph “Reclassifications” within Note 2 and the 2023 and 2022 segment information within Note 4, as to which the date is March 3, 2025
BURFORD CAPITAL LIMITED AND SUBSIDIARIES
CONSOLIDATED STATEMENTS OF OPERATIONS
($ IN THOUSANDS, EXCEPT SHARE DATA)
| | | | | | | | | | | | | | | | | | | | |
| | Years ended December 31, |
| | 2024 | | 2023 | | 2022 |
| Revenues | | | | | | |
| Capital provision income/(loss) | | $ | 552,066 | | | $ | 1,341,923 | | | $ | 319,108 | |
| Plus/(Less): Third-party interests in capital provision assets | | (42,384) | | | (279,263) | | | (494) | |
| Asset management income/(loss) | | 8,340 | | | 7,642 | | | 9,116 | |
| Marketable securities income/(loss) and interest | | 25,014 | | | 12,208 | | | (7,744) | |
| Other income/(loss) | | 3,051 | | | 4,392 | | | (759) | |
| Total revenues | | 546,087 | | | 1,086,902 | | | 319,227 | |
| | | | | | |
| Operating expenses | | | | | | |
| Compensation and benefits | | | | | | |
| Salaries and benefits | | 42,418 | | | 39,788 | | | 34,207 | |
| Annual incentive compensation | | 29,210 | | | 32,697 | | | 24,338 | |
| Share-based and deferred compensation | | 8,822 | | | 21,128 | | | 11,201 | |
| Long-term incentive compensation including accruals | | 43,209 | | | 127,471 | | | 16,600 | |
| General, administrative and other | | 31,025 | | | 33,656 | | | 29,681 | |
| Case-related expenditures ineligible for inclusion in asset cost | | 801 | | | 16,496 | | | 8,245 | |
| Total operating expenses | | 155,485 | | | 271,236 | | | 124,272 | |
| | | | | | |
| Operating income/(loss) | | 390,602 | | | 815,666 | | | 194,955 | |
| | | | | | |
| Other expenses | | | | | | |
| Finance costs | | 135,593 | | | 99,135 | | | 78,264 | |
| Foreign currency transactions (gains)/losses | | 1,421 | | | (21,752) | | | 7,674 | |
| Total other expenses | | 137,014 | | | 77,383 | | | 85,938 | |
| | | | | | |
| Income/(loss) before income taxes | | 253,588 | | | 738,283 | | | 109,017 | |
| | | | | | |
| Provision for/(benefit from) income taxes | | 24,005 | | | 20,084 | | | 11,558 | |
| Net income/(loss) | | 229,583 | | | 718,199 | | | 97,459 | |
| | | | | | |
| Net income/(loss) attributable to non-controlling interests | | 83,099 | | | 107,677 | | | 66,953 | |
| Net income/(loss) attributable to Burford Capital Limited shareholders | | 146,484 | | | 610,522 | | | 30,506 | |
| | | | | | |
| Net income/(loss) attributable to Burford Capital Limited shareholders per ordinary share | | | | | | |
| Basic | | $0.67 | | | $2.79 | | | $0.14 | |
| Diluted | | $0.66 | | | $2.74 | | | $0.14 | |
| | | | | | |
| Weighted average ordinary shares outstanding | | | | | | |
| Basic | | 219,231,837 | | 218,865,816 | | 218,757,232 |
| Diluted | | 223,231,672 | | 223,014,890 | | 221,802,486 |
See accompanying notes to the consolidated financial statements.
BURFORD CAPITAL LIMITED AND SUBSIDIARIES
CONSOLIDATED STATEMENTS OF COMPREHENSIVE INCOME/(LOSS)
($ IN THOUSANDS)
| | | | | | | | | | | | | | | | | | | | |
| | Years ended December 31, |
| | 2024 | | 2023 | | 2022 |
| Net income/(loss) | | $ | 229,583 | | $ | 718,199 | | $ | 97,459 |
| Other comprehensive income/(loss) | | | | | | |
| Foreign currency translation adjustment | | 2,808 | | | (39,737) | | 44,089 | |
| Comprehensive income/(loss) | | 232,391 | | 678,462 | | 141,548 |
| | | | | | |
| (Plus)/Less: Comprehensive income/(loss) attributable to non-controlling interests | | 83,099 | | 107,677 | | 66,953 |
| Comprehensive income/(loss) attributable to Burford Capital Limited shareholders | | 149,292 | | 570,785 | | 74,595 |
See accompanying notes to the consolidated financial statements.
BURFORD CAPITAL LIMITED AND SUBSIDIARIES
CONSOLIDATED STATEMENTS OF FINANCIAL CONDITION
($ IN THOUSANDS, EXCEPT SHARE DATA)
| | | | | | | | | | | | | | |
| | December 31, |
| | 2024 | | 2023 |
| Assets | | | | |
| Cash and cash equivalents | | $ | 469,930 | | | $ | 220,549 | |
| Marketable securities | | 79,020 | | | 107,561 | |
| Other assets | | 61,006 | | | 63,464 | |
| Due from settlement of capital provision assets | | 183,858 | | | 265,540 | |
| Capital provision assets | | 5,243,917 | | | 5,045,388 | |
| Goodwill | | 133,948 | | | 133,965 | |
| Deferred tax asset | | 3,346 | | | 927 | |
| Total assets | | 6,175,025 | | | 5,837,394 | |
| | | | |
| Liabilities | | | | |
| Debt interest payable | | 12,097 | | | 34,416 | |
| Other liabilities | | 141,973 | | | 122,199 | |
| Long-term incentive compensation payable | | 217,552 | | | 183,134 | |
| Debt payable | | 1,763,612 | | | 1,534,730 | |
| Financial liabilities relating to third-party interests in capital provision assets | | 747,053 | | | 704,196 | |
| Deferred tax liability | | 35,903 | | | 50,939 | |
| Total liabilities | | 2,918,190 | | | 2,629,614 | |
| | | | |
| Commitments and contingencies (Note 20) | | | | |
| | | | |
| Shareholders' equity | | | | |
| Ordinary shares, no par value; unlimited shares authorized; 220,091,851 ordinary shares issued and 219,421,904 ordinary shares outstanding as of December 31, 2024 and 219,313,388 ordinary shares issued and 218,962,441 ordinary shares outstanding as of December 31, 2023 | | 610,037 | | | 602,238 | |
| Additional paid-in capital | | 42,409 | | | 36,545 | |
| Accumulated other comprehensive income | | 10,120 | | | 7,312 | |
| Treasury shares; 669,947 ordinary shares at $14.28 cost as of December 31, 2024, and 350,947 ordinary shares at $12.76 cost as of December 31, 2023 | | (9,569) | | | (4,479) | |
| Retained earnings | | 1,766,435 | | | 1,649,242 | |
| Total Burford Capital Limited equity | | 2,419,432 | | | 2,290,858 | |
| Non-controlling interests | | 837,403 | | | 916,922 | |
| Total shareholders' equity | | 3,256,835 | | | 3,207,780 | |
| Total liabilities and shareholders' equity | | 6,175,025 | | | 5,837,394 | |
See accompanying notes to the consolidated financial statements.
BURFORD CAPITAL LIMITED AND SUBSIDIARIES
CONSOLIDATED STATEMENTS OF CASH FLOWS
($ IN THOUSANDS)
| | | | | | | | | | | | | | | | | | | | |
| | Years ended December 31, |
| | 2024 | | 2023 | | 2022 |
| Cash flows from operating activities: | | | | | | |
| Net income/(loss) | | $ | 229,583 | | | $ | 718,199 | | | $ | 97,459 | |
| | | | | | |
| Adjustments to reconcile net income/(loss) to net cash provided/(used) by operating activities: | | | | | | |
| Capital provision (income)/loss | | (552,066) | | | (1,341,923) | | | (319,108) | |
| (Income)/loss on marketable securities | | (4,069) | | | (5,599) | | | 10,736 | |
| Other (income)/loss | | (3,051) | | | (4,392) | | | 759 | |
| Share-based and deferred compensation | | 8,686 | | | 8,747 | | | 7,782 | |
| Deferred tax (benefit)/expense | | (16,877) | | | 5,863 | | | 9,356 | |
| Other | | 8,331 | | | (7,624) | | | 17,991 | |
| Changes in operating assets and liabilities: | | | | | | |
| Proceeds from capital provision assets | | 991,292 | | | 559,362 | | | 387,786 | |
| (Funding) of capital provision assets | | (555,088) | | | (682,027) | | | (727,298) | |
| Net proceeds/(funding) of marketable securities | | 32,577 | | | 34,471 | | | 27,866 | |
| Net proceeds/(funding) from financial liabilities at fair value through profit or loss | | (2,583) | | | — | | | 3,333 | |
| Proceeds from other income | | 3,625 | | | 7,875 | | | 3,186 | |
| Proceeds from break fee income | | — | | | 650 | | | — | |
| (Increase)/decrease in other assets | | (1,502) | | | (3,613) | | | (5,511) | |
| Increase/(decrease) in other liabilities | | 35,010 | | | 156,338 | | | 19,088 | |
| Net increase/(decrease) on financial liability to third-party investment | | 42,857 | | | 278,991 | | | 471 | |
| Net cash provided by/(used in) operating activities | | 216,725 | | | (274,682) | | | (466,104) | |
| | | | | | |
| Cash flows from investing activities: | | | | | | |
| Purchases of property and equipment | | (661) | | | (3,212) | | | (407) | |
| Net cash provided by/(used in) investing activities | | (661) | | | (3,212) | | | (407) | |
| | | | | | |
| Cash flows from financing activities: | | | | | | |
| Debt issuance, including original issue premium | | 284,969 | | | 394,464 | | | 357,271 | |
| Debt issuance costs | | (6,283) | | | (8,461) | | | (7,912) | |
| Debt extinguishment | | (49,819) | | | (129,970) | | | (79,911) | |
| Dividends paid on ordinary shares | | (27,327) | | | (27,499) | | | (27,665) | |
| Acquisition of ordinary shares held in treasury | | (5,090) | | | (3,759) | | | (3,749) | |
| Acquisition of ordinary shares to meet share-based payment obligations | | — | | | — | | | (4,291) | |
| Third-party net capital contribution/(distribution) | | (162,618) | | | 164,759 | | | 165,388 | |
| Net cash provided by/(used in) financing activities | | 33,832 | | | 389,534 | | | 399,131 | |
| | | | | | |
| Net increase/(decrease) in cash and cash equivalents | | 249,896 | | | 111,640 | | | (67,380) | |
| Cash and cash equivalents at beginning of period | | 220,549 | | | 107,658 | | | 180,255 | |
| Effect of exchange rate changes on cash and cash equivalents | | (515) | | | 1,251 | | | (5,217) | |
| Cash and cash equivalents at end of period | | 469,930 | | | 220,549 | | | 107,658 | |
The table below sets forth supplemental disclosures to our statement of consolidated cash flows.
| | | | | | | | | | | | | | | | | | | | |
| | Years ended December 31, |
| ($ in thousands) | | 2024 | | 2023 | | 2022 |
| Cash received from interest and dividend income | | $ | 20,992 | | | $ | 6,438 | | | $ | 3,462 | |
| Cash paid for debt interest | | (154,093) | | | (77,210) | | | (70,781) | |
| Cash received from income tax refund | | 229 | | | 729 | | | 1,199 | |
| Cash paid for income taxes | | (19,504) | | | (14,050) | | | (1,840) | |
See accompanying notes to the consolidated financial statements.
BURFORD CAPITAL LIMITED AND SUBSIDIARIES
CONSOLIDATED STATEMENTS OF CHANGES IN EQUITY
($ IN THOUSANDS, EXCEPT SHARE DATA)
| | | | | | | | | | | | | | | | | | | | | | | | | | | | | | | | | | | | | | | | | | | | | | | | | | | | | | | | | | | | | | |
| | Year ended December 31, 2024 |
| | Shares | | Amount | | | | | | | | | | | | |
| | Ordinary
shares | | Treasury
shares | | Ordinary
shares | | Treasury
shares | | Additional
paid-in
capital | | Retained
earnings | | Accumulated
other
comprehensive
income/(loss) | | Total Burford
Capital Limited
equity | | Non-controlling
interests | | Total
shareholders’
equity |
| At beginning of period | | 219,313,388 | | (350,947) | | $ | 602,238 | | | $ | (4,479) | | | $ | 36,545 | | | $ | 1,649,242 | | | $ | 7,312 | | | $ | 2,290,858 | | | $ | 916,922 | | | $ | 3,207,780 | |
| Net income/(loss) | | — | | | — | | | — | | | — | | | — | | | 146,484 | | | — | | | 146,484 | | | 83,099 | | | 229,583 | |
| Foreign currency translation adjustment | | — | | | — | | | — | | | — | | | — | | | — | | | 2,808 | | | 2,808 | | | — | | | 2,808 | |
| Issuance of new ordinary shares to satisfy vested share-based awards | | 569,772 | | | — | | | 4,786 | | | — | | | (4,786) | | | — | | | — | | | — | | | — | | | — | |
| Issuance of new ordinary shares to satisfy distributions under the NQDC Plan | | 208,691 | | | — | | | 3,013 | | | — | | | — | | | — | | | — | | | 3,013 | | | — | | | 3,013 | |
| Acquisition of ordinary shares held in treasury | | — | | | (319,000) | | | — | | | (5,090) | | | — | | | — | | | — | | | (5,090) | | | — | | | (5,090) | |
| Transfer of share-based awards on vesting | | — | | | — | | | — | | | — | | | (2,376) | | | (1,964) | | | — | | | (4,340) | | | — | | | (4,340) | |
| Share-based and deferred compensation | | — | | | — | | | — | | | — | | | 13,026 | | | — | | | — | | | 13,026 | | | — | | | 13,026 | |
| Dividends paid | | — | | | — | | | — | | | — | | | — | | | (27,327) | | | — | | | (27,327) | | | — | | | (27,327) | |
| Third-party net capital contribution/(distribution) | | — | | | — | | | — | | | — | | | — | | | — | | | — | | | — | | | (162,618) | | | (162,618) | |
| At end of period | | 220,091,851 | | (669,947) | | 610,037 | | (9,569) | | 42,409 | | 1,766,435 | | 10,120 | | 2,419,432 | | 837,403 | | 3,256,835 |
| | | | | | | | | | | | | | | | | | | | | | | | | | | | | | | | | | | | | | | | | | | | | | | | | | | | | | | | | | | | | | |
| | Year ended December 31, 2023 |
| | Shares | | Amount | | | | | | | | | | | | |
| | Ordinary
shares | | Treasury
shares | | Ordinary
shares | | Treasury
shares | | Additional
paid-in
capital | | Retained
earnings | | Accumulated
other
comprehensive
income/(loss) | | Total Burford
Capital Limited
equity | | Non-controlling
interests | | Total
shareholders’
equity |
| At beginning of period | | 219,049,877 | | (468,000) | | | $ | 598,813 | | | $ | (3,749) | | | $ | 26,305 | | | $ | 1,074,166 | | | $ | 47,049 | | | $ | 1,742,584 | | | $ | 644,486 | | | $ | 2,387,070 | |
| Net income/(loss) | | — | | | — | | | — | | | — | | | — | | | 610,522 | | | — | | | 610,522 | | | 107,677 | | | 718,199 | |
| Foreign currency translation adjustment | | — | | | — | | | — | | | — | | | — | | | — | | | (39,737) | | | (39,737) | | | — | | | (39,737) | |
| Issuance of new ordinary shares to satisfy vested share-based awards | | 263,511 | | | — | | | 3,425 | | | — | | | (3,425) | | | — | | | — | | | — | | | — | | | — | |
| Acquisition of ordinary shares held in treasury | | — | | | (261,000) | | | — | | | (3,759) | | | — | | | — | | | — | | | (3,759) | | | — | | | (3,759) | |
| Distribution of ordinary shares for vested share-based awards | | — | | | 378,053 | | | — | | | 3,029 | | | (3,029) | | | — | | | — | | | — | | | — | | | — | |
| Transfer of share-based awards on vesting | | — | | | — | | | — | | | — | | | 2,589 | | | (7,947) | | | — | | | (5,358) | | | — | | | (5,358) | |
| Share-based and deferred compensation | | — | | | — | | | — | | | — | | | 14,105 | | | — | | | — | | | 14,105 | | | — | | | 14,105 | |
| Dividends paid | | — | | | — | | | — | | | — | | | — | | | (27,499) | | | — | | | (27,499) | | | — | | | (27,499) | |
| Third-party net capital contribution/(distribution) | | — | | | — | | | — | | | — | | | — | | | — | | | — | | | — | | | 164,759 | | | 164,759 | |
| At end of period | | 219,313,388 | | (350,947) | | | 602,238 | | | (4,479) | | | 36,545 | | | 1,649,242 | | | 7,312 | | | 2,290,858 | | | 916,922 | | | 3,207,780 | |
| | | | | | | | | | | | | | | | | | | | | | | | | | | | | | | | | | | | | | | | | | | | | | | | | | | | | | | | | | | | | | |
| | Year ended December 31, 2022 |
| | Shares | | Amount | | | | | | | | | | | | |
| | Ordinary
shares | | Treasury
shares | | Ordinary
shares | | Treasury
shares | | Additional
paid-in
capital | | Retained
earnings | | Accumulated
other
comprehensive
income/(loss) | | Total Burford
Capital Limited
equity | | Non-controlling
interests | | Total
shareholders’
equity |
| At beginning of period | | 219,049,877 | | — | | | $ | 598,813 | | | $ | — | | | $ | 26,366 | | | $ | 1,067,773 | | | $ | 2,920 | | | $ | 1,695,872 | | | $ | 412,145 | | | $ | 2,108,017 | |
| Net income/(loss) | | — | | | — | | | — | | | — | | | — | | | 30,506 | | | — | | | 30,506 | | | 66,953 | | | 97,459 | |
| Foreign currency translation adjustment | | — | | | — | | | — | | | — | | | — | | | — | | | 44,089 | | | 44,089 | | | — | | | 44,089 | |
| Acquisition of ordinary shares held in treasury | | — | | | (468,000) | | | — | | | (3,749) | | | — | | | — | | | — | | | (3,749) | | | — | | | (3,749) | |
| Ordinary shares purchased by the Burford Capital Employee Benefit Trust | | — | | | — | | | — | | | — | | | (4,291) | | | — | | | — | | | (4,291) | | | — | | | (4,291) | |
| Ordinary shares distributed by the Burford Capital Employee Benefit Trust | | — | | | — | | | — | | | — | | | — | | | (2,495) | | | — | | | (2,495) | | | — | | | (2,495) | |
| Transfer of share-based awards on vesting | | — | | | — | | | — | | | — | | | (6,047) | | | 6,047 | | | — | | | — | | | — | | | — | |
| Share-based and deferred compensation | | — | | | — | | | — | | | — | | | 10,277 | | | — | | | — | | | 10,277 | | | — | | | 10,277 | |
| Dividends paid | | — | | | — | | | — | | | — | | | — | | | (27,665) | | | — | | | (27,665) | | | — | | | (27,665) | |
| Third-party net capital contribution/(distribution) | | — | | | — | | | — | | | — | | | — | | | — | | | — | | | — | | | 165,388 | | | 165,388 | |
| Other | | — | | | — | | | — | | | — | | | — | | | — | | | 40 | | | 40 | | | — | | | 40 | |
| At end of period | | 219,049,877 | | (468,000) | | | 598,813 | | | (3,749) | | | 26,305 | | | 1,074,166 | | | 47,049 | | | 1,742,584 | | | 644,486 | | | 2,387,070 | |
See accompanying notes to the consolidated financial statements.
NOTES TO THE CONSOLIDATED FINANCIAL STATEMENTS
1. Organization
Burford Capital Limited (the “Company”) and its consolidated subsidiaries (collectively with the Company, the “Group”) provide legal finance products and services and are engaged in the asset management business.
The Company was incorporated as a company limited by shares under the Guernsey Companies Law on September 11, 2009. The Company has a single class of ordinary shares, which commenced trading on AIM in October 2009 and on the NYSE in October 2020, in each case, under the symbol “BUR”. The Company’s subsidiaries have issued bonds that are traded on the Main Market of the London Stock Exchange and unregistered senior notes in private placement transactions pursuant to Rule 144A and Regulation S under the Securities Act.
2. Summary of significant accounting policies
Basis of presentation
The Group’s audited consolidated financial statements as of and for the year ended December 31, 2024, and comparative periods have been prepared in accordance with US GAAP.
Use of estimates
The preparation of the Group’s consolidated financial statements requires management to make estimates that affect the reported amounts of assets and liabilities and the disclosure of contingent assets and liabilities, in each case, as of the date of the consolidated financial statements and the reported amounts of revenues and expenses during the reporting periods. Such estimates include, among others, the valuation of capital provision assets (which requires the use of Level 3 valuation inputs) and other financial instruments, the measurement of deferred tax balances (including valuation allowances) and the accounting for goodwill. Actual results could differ from those estimates, and such differences could be material.
Consolidation
The consolidated financial statements include the accounts of (i) the Company, (ii) its wholly owned or majority owned subsidiaries, (iii) the consolidated entities that are considered to be variable interest entities (“VIEs”) and for which the Company is considered the primary beneficiary and (iv) certain entities that are not considered VIEs but that the Company controls through a majority voting interest.
In connection with private funds and other related entities where the Group does not own 100% of the relevant entity, the Group makes judgments about whether it is required to consolidate such entities by applying the factors set forth in US GAAP for VIEs or voting interest entities under Accounting Standards Codification (“ASC”) 810—Consolidation.
VIEs are entities that, by design, either (i) lack sufficient equity to permit the entity to finance its activities without additional subordinated financial support from other parties, (ii) have equity investors that (A) do not have the ability to make significant decisions relating to the entity’s operations through voting rights, (B) do not have the obligation to absorb the expected losses or (C) do not have the right to receive the residual returns of the entity or (iii) have equity investors’ voting rights that are not proportional to the economics, and substantially all of the activities of the entity either involve or are conducted on behalf of an investor that has disproportionately few voting rights. An entity is deemed to be the primary beneficiary of the VIE if such entity has both (i) the power to direct the activities that most significantly impact the VIE’s economic performance and (ii) the right to receive benefits from the VIE or the obligation to absorb losses of the VIE that could be significant to the VIE.
In determining whether the Group is the primary beneficiary of a VIE, the Group considers both qualitative and quantitative factors regarding the nature, size and form of its involvement with the VIE, such as its role establishing the VIE and its ongoing rights and responsibilities, the design of the VIE, its economic interests, servicing fees and servicing responsibilities and certain other factors. The Group performs ongoing reassessments to evaluate whether changes in the entity’s capital structure or changes in the nature of the Group’s involvement with the entity result in a change to the VIE designation or a change to the Group’s consolidation conclusion.
The most significant judgments relate to the assessment of the Group’s exposure or rights to variable returns in Burford Opportunity Fund C LP (“BOF-C”), Burford Advantage Master Fund LP (the “Advantage Fund”), Colorado Investments Limited (“Colorado”) and, prior to its liquidation in the fourth quarter of 2023, BCIM Strategic Value Master Fund, LP (the “Strategic Value Fund”). The Group has assessed that its economic interest in the income generated from BOF-C and its investment as a limited partner in the Strategic Value Fund and the Advantage Fund, coupled with its power over the relevant activities as the fund manager, require the consolidation of BOF-C, the Strategic Value Fund and the Advantage Fund in the consolidated financial statements. Similarly, the Group has assessed that its shareholding in Colorado, coupled with its power over the relevant activities of Colorado through contractual agreements, require the consolidation of Colorado in the consolidated financial statements.
The Group is deemed to have a controlling financial interest in VIEs in which it is the primary beneficiary and in other entities in which it owns more than 50% of the outstanding voting shares and other shareholders do not have substantive rights to participate in management. The assets of these consolidated VIEs are not available to the Company, and the creditors of these consolidated VIEs do not have recourse to the Company.
For entities the Group controls but does not wholly own, the Group generally records a non-controlling interest within shareholders’ equity for the portion of the entity’s equity attributed to the non-controlling ownership interests. Accordingly, third-party share of net income or loss relating to non-controlling interests in consolidated entities is treated as a reduction or increase, respectively, of net income or loss in the consolidated statements of operations. With respect to Colorado, an entity the Group controls but does not wholly own, the Group records a financial liability within financial liabilities relating to third-party interests in capital provision assets for the portion of Colorado’s equity held by third parties. The third-party share of income or loss is included in third-party interests in capital provision assets in the consolidated statements of operations. All significant intercompany balances, transactions and unrealized gains and losses on such transactions are eliminated on consolidation.
Third-party interests in capital provision assets
Third-party interests in capital provision assets include the financial liability relating to third-party interests in Colorado as well as financial liabilities relating to third-party interests resulting from capital provision asset subparticipations recognized at fair value. Colorado holds a single financial asset and does not have any other business activity. Accordingly, Colorado does not meet the definition of a business, and the third-party interests in Colorado are accounted for as a collateralized borrowing rather than non-controlling interests in shareholders’ equity. Amounts included in the consolidated statements of financial condition represent the fair value of the third-party interests in the related capital provision assets, and the amounts included in the consolidated statements of operations represent the third-party share of any gain or loss during the reporting period. Gains in the underlying capital provision asset result in increased financial liabilities to third-party interests in capital provision assets in the consolidated statement of financial condition and negative adjustments in the consolidated statement of operations, presented as “(Less): Third-party interests in capital provision assets”. Conversely, losses in the underlying capital provision asset result in decreased financial liabilities to third-party interests in capital provision assets in the consolidated statement of financial condition and positive adjustments in the consolidated statement of operations, presented as “Plus: Third-party interests in capital provision assets”.
During the year ended December 31, 2023, the Group has renamed the line item in the consolidated statements of operations from “Gain/(loss) relating to third-party interests in capital provision assets” to “Plus/(Less): Third-party interests in capital provision assets” and has changed the order to include this line item directly beneath the line item “Capital provision income/(loss)”.
Reclassifications
Certain reclassifications of the amounts for the prior periods have been made to conform to the presentation of the current period, such as incorporating the “Legacy asset recovery incentive compensation including accruals” line item into the “Long-term incentive compensation including accruals” line item within the consolidated statements of operations and moving the legacy asset recovery incentive compensation payable out of the “Other liabilities” line item into the “Long-term incentive compensation payable” line item within the consolidated statements of financial condition. In addition, within the consolidated statements of operations, we also incorporated the deferred compensation expense from the "Salaries and benefits" line item into the "Share-based and deferred compensation" line item, the "(Gains)/losses on debt
extinguishment" line item into the "Finance costs" line item and combined the “Insurance income/(loss)” and “Services income/(loss)” line items under the “Other income/(loss)” line item. These reclassifications have no effect on previously reported results of operations or total shareholders’ equity.
Covid-19 pandemic and global economic market conditions
The Covid-19 pandemic and restrictions on certain non-essential businesses have caused disruption in the United States and global economies. Although the clearing of court backlogs is underway, it continues to be gradual, uneven and characterized by meaningful dispersion across sectors and regions. The estimates and assumptions underlying the consolidated financial statements as of December 31, 2024 and 2023, and for the years ended December 31, 2024, 2023 and 2022, include judgments about the financial markets and economic conditions, which may change over time. Among estimates and assumptions, certain inputs to the valuation of the Group’s capital provision assets were impacted as a result of the Covid-19 pandemic, including expected timing and amount of cash flows in the Group’s cash flow forecasts and applicable discount rates.
As a result of the Russian Federation’s invasion of Ukraine in February 2022 (the “Ukraine War”), various nations, including the United States, have instituted economic sanctions and other responsive measures, which have resulted in an increased level of global economic and political uncertainty. As of and for the years ended December 31, 2024, 2023 and 2022, the effects of the Ukraine War, including international sanctions imposed on Russian businesses and individuals, have not had a material impact on the Group’s consolidated financial statements.
In addition, in October 2023, an armed conflict began in Israel, Gaza and surrounding areas, which has resulted in an increased level of global economic and political uncertainty. As of and for the year ended December 31, 2024, the effects of the conflict in Israel and Gaza have not had a material impact on the Group’s consolidated financial statements.
Cash and cash equivalents
Cash and cash equivalents include funds held by depository institutions, money market funds and government securities with original maturities of three months or less when purchased. Interest income from cash and cash equivalents is recorded in marketable securities income/(loss) and interest in the consolidated statements of operations. The fair values of the money market funds included in cash and cash equivalents were $319.9 million and $13.0 million as of December 31, 2024 and 2023, respectively, which represented their fair values due to their short-term nature and were categorized as Level 1 within the fair value hierarchy. Substantially all of the Group’s cash on deposit is in interest bearing accounts with major financial institutions that exceed insured limits.
Statement of cash flows
The core business purpose of the Group is the provision of capital and expertise, to clients or as a principal, in connection with (i) the underlying asset value of litigation claims and the enforcement of settlements, judgments and awards, (ii) the amount paid to law firms as legal fees and expenses and (iii) the value of assets affected by litigation. These contractual arrangements are presented as capital provision assets in the consolidated statements of financial condition, and the returns on those capital provision assets form the principal source of revenue earned by the Group. The cash flows associated with capital provision assets are reported within cash flows from operating activities because the ongoing management of the capital provision assets is a key operating activity for the Group.
Marketable securities
Marketable securities primarily consist of government securities, investment grade corporate bonds, asset-backed securities and mutual funds. Marketable securities are recorded at fair value. Interest income on marketable securities is included in the overall change in fair value which is recognized in marketable securities income/(loss) and interest in the consolidated statements of operations.
Dividend and interest
Dividend and interest is recognized on an accruals basis and included in marketable securities income/(loss) and interest.
Fair value of financial instruments
The Group’s capital provision assets meet the definition of a financial instrument under ASC 825—Financial instruments. Single case, portfolio, portfolio with equity risk and legal risk management capital provision assets meet the definition of a derivative instrument under ASC 815—Derivatives and hedging and are accounted for at fair value.
The Group has elected the fair value option for the Group’s equity method investments, marketable securities, due from settlement of capital provision assets and financial liabilities relating to third-party interests in capital provision assets to provide a consistent fair value measurement approach for all capital provision related activity. Such election is irrevocable and is applied to financial instruments on an individual basis at initial recognition.
Financial instruments are recorded at fair value. The fair value of a financial instrument is the price that would be received to sell an asset or paid to transfer a liability in an orderly transaction between market participants at the measurement date under current market conditions.
Fair value hierarchy
US GAAP establishes a hierarchical disclosure framework that prioritizes and ranks the level of market price observability used in measuring financial instruments at fair value. Market price observability is affected by a number of factors, including the type of financial instrument, the characteristics specific to the financial instrument and the state of the marketplace, including the existence and transparency of transactions between market participants. Financial instruments with readily available quoted prices in active markets generally will have a higher degree of market price observability and a lesser degree of judgment used in measuring fair value.
Financial instruments measured and reported at fair value are classified and disclosed based on the observability of inputs used in the determination of fair values as follows:
▪Level 1—quoted prices (unadjusted) in active markets for identical assets or liabilities that the reporting entity can access at the measurement date
▪Level 2—inputs other than quoted prices included within Level 1 that are observable for the asset or liability, either directly or indirectly
▪Level 3—unobservable inputs for the asset or liability
All transfers into and out of these levels are recognized as if they have taken place as of the beginning of each reporting period.
Valuation processes
The Group’s senior professionals are responsible for developing the policies and procedures for fair value measurement of assets and liabilities. Following origination and as of each reporting date, the movements in the values of assets and liabilities are required to be reassessed in accordance with the Group’s accounting policies. For this analysis, the reasonableness of material estimates and assumptions underlying the valuation is discussed and the major inputs applied are verified by comparing the information in the valuation computation to contracts, asset status and progress information and other relevant documents.
Valuation methodology for Level 1 assets and liabilities
Level 1 assets and liabilities are comprised of listed instruments, including equities, fixed income securities and investment funds. All Level 1 assets and liabilities are valued at the quoted market price as of the reporting date.
Valuation methodology for Level 2 assets and liabilities
Level 2 assets and liabilities are comprised of debt and equity securities that are not actively traded and are generally valued at the last quoted or traded price as of the reporting date, provided there is evidence that the price is not assessed as significantly stale to warrant a Level 3 classification.
Valuation methodology for Level 3 assets and liabilities
Fair value represents the price that would be received to sell an asset or paid to transfer a liability (an exit price) in an orderly transaction between market participants based on unobservable inputs as of the measurement date.
The methods and procedures to determine fair value of assets and liabilities may include, among others, (i) obtaining information provided by third parties when available, (ii) obtaining valuation-related information from the issuers or counterparties (or their respective advisors), (iii) performing comparisons of comparable or similar assets or liabilities, as applicable, (iv) calculating the present value of future cash flows, (v) assessing other analytical data and information relating to the asset or liability, as applicable, that is an indication of value, (vi) evaluating financial information provided by or otherwise available with respect to the counterparties or other relevant entities and (vii) entering into a market transaction with an arm’s-length counterparty.
The material estimates and assumptions used in the analyses of fair value include the status and risk profile of the underlying asset or liability and, as applicable, the timing and expected amount of cash flows based on the structure and agreement of the asset or liability, the appropriateness of any discount rates used and the timing of and estimated minimum proceeds from a favorable outcome. Discount rates and a discounted cash flow basis for estimating fair value are applied to assets and liabilities measured at fair value, as applicable, most notably the Group’s capital provision assets. Significant judgment and estimation go into the assumptions that underlie the analyses, and the actual values realized with respect to assets or liabilities, as applicable, could be materially different from values obtained based on the use of those estimates.
Capital provision assets are fair valued using an income approach. The income approach estimates fair value based on estimated, risk-adjusted future cash flows, using a discount rate to reflect the funding risk of deploying capital for financing capital provision assets. The income approach requires management to make a series of assumptions, such as discount rate, the timing and amount of both expected cash inflows and additional financings and a risk-adjustment factor reflecting the uncertainty inherent in the cash flows primarily driven by litigation risk, which changes as a result of observable litigation events. These assumptions are considered unobservable Level 3 inputs that reflect the Company's own assumptions about the inputs that a market participant would use.
A cash flow forecast is developed for each capital provision asset based on the anticipated financing commitments, damages or settlement estimates and the Group’s contractual entitlement. Cash flow forecasts incorporate management’s assumptions related to creditworthiness of the counterparty and collectability. In cases where cash flows are denominated in a foreign currency, forecasts are developed in the applicable foreign currency and translated to US dollars.
Capital provision assets are recorded at initial fair value, which is equivalent to the initial transaction price for a given capital provision asset, based on an assessment that it is an arm’s-length transaction between independent third parties and an orderly transaction between market participants. Using the cash flow forecast and a discount rate, an appropriate risk-adjustment factor is calculated to be applied to the forecast cash inflows to calibrate the valuation model to the initial transaction price. Each reporting period, the cash flow forecast is updated based on the best available information on damages or settlement estimates and it is determined whether there has been an objective event in the underlying litigation process, which would change the litigation risk and thus the risk-adjustment factor associated with the capital provision asset. The risk-adjustment factor as adjusted for any objective events in the underlying litigation process is referred to as the adjusted risk premium. For example, assume the risk premium at inception is calculated to be 65%, which is held constant until there is a milestone event. Assuming there is a favorable trial court ruling one year later for which the applicable milestone factor is 50%, then the risk premium would be adjusted to 32.5%, effectively releasing 50% of the original 65% risk premium haircut that was applied. Conversely, assuming there is a negative event one year later for which the applicable milestone factor is (50%) then the risk premium would be adjusted to 82.5%, effectively closing the gap between the original risk premium of 65% and 100% by 50%. These objective events could include, among others:
▪A significant positive ruling or other objective event prior to any trial court judgment
▪A favorable trial court judgment
▪A favorable judgment on the first appeal
▪The exhaustion of as-of-right appeals
▪In arbitration cases, where there are limited opportunities for appeal, issuance of a tribunal award
▪An objective negative event at various stages in the litigation process
Each reporting period, the updated risk-adjusted cash flow forecast is discounted at the then current discount rate to measure fair value. See note 14 (Fair value of assets and liabilities) to our consolidated financial statements for additional information.
In a small number of instances, the Group has the benefit of a secondary sale of a portion of an asset or liability. When this occurs, the market evidence is factored into the valuation process to maximize the use of relevant observable inputs. Secondary sales are evaluated for relevance, including whether such transactions are orderly, and weight is attributed to the market price accordingly, which may include calibrating the valuation model to observed market price.
Non-controlling interests
For entities that are consolidated, but not wholly owned, a portion of the income or loss and corresponding equity is allocated to owners other than the Company. The aggregate of the income or loss and corresponding equity that is not owned by the Company is included in non-controlling interests in the consolidated financial statements. Non-controlling interests also include ownership interests in certain consolidated private funds and VIEs. Non-controlling interests are presented as a separate component of shareholders’ equity in the consolidated statements of financial condition.
The primary components of non-controlling interests are separately presented in the consolidated statements of changes in equity to clearly distinguish the interest in the Group and other ownership interests in the consolidated entities. Net income/(loss) includes the net income/(loss) attributable to the holders of non-controlling interests in the consolidated statements of comprehensive income. Profits and losses are allocated to non-controlling interests in proportion to their relative ownership interests regardless of their basis. Non-controlling interests exclude the third-party interests in Colorado as it represents a consolidated entity that holds a single financial asset and does not have any other business activity.
Asset management income
Asset management income is derived from the governing agreements in place with the Group’s private funds. The rate or amount at which fees are charged, the basis on which such fees are calculated and the timing of payments vary across private funds and, as to a particular private fund, may also vary across investment options available to underlying investors in, or members of, the private fund. Management fees are generally based on an agreed percentage of a private fund’s commitments and/or amounts committed or deployed, depending on the private fund agreement. Management fees are recognized over time as the services are provided. In addition, the Group receives performance fees from its private funds, which are earned when contractually agreed performance levels are exceeded within specified performance measurement periods. The Group’s private funds (other than BOF-C and the Advantage Fund) use a so-called “European” structure for the payment of performance fees, whereby the manager is not paid any performance fees until private fund investors have had their entire capital investment repaid. This contrasts with a so-called “American” structure for the payment of performance fees, whereby the performance fees are paid on profitable resolutions as they occur. Performance fees are recognized when a reliable estimate of the performance fee can be made and it is probable that a significant reversal in the amount of cumulative revenue recognized will not occur. The maturity and the terms of the applicable distribution waterfall for each of our private funds impacts this timing.
Insurance activities
The Group (i) acts as an administrator in the sale of legal expenses insurance policies issued in the name of Great Lakes Reinsurance (UK) plc, a subsidiary of MunichRe, under a binding authority agreement, and (ii) underwrites legal expenses insurance policies through its wholly owned Guernsey insurer, Burford Worldwide Insurance Limited. Income earned from acting as insurance administrator and underwriting legal expenses insurance policies is included in “Other income”.
Leases
At the inception of any arrangement, the Group determines whether the arrangement is or contains a lease based on the unique facts and circumstances present in the arrangement. Leases are recognized as a right-of-use asset and a corresponding liability as of the date at which the leased asset is available for use by the Group. The Group recognizes lease liabilities measured at the present value of lease payments to be made over the lease term. In calculating the present value, the Group uses its incremental borrowing rate as of the lease commencement date as the interest rate implicit in the lease is not readily determinable.
The lease agreements generally contain lease and non-lease components. Non-lease components primarily include payments for maintenance and utilities. The Group combines fixed payments for non-lease components with its lease payments and accounts for them together as a single lease component which increases the amount of its lease assets and liabilities. Payments under the lease arrangements are primarily fixed. Variable rents, if any, are expensed as incurred.
Each lease payment is allocated between the liability and finance cost. The finance cost is charged to the consolidated statements of operations over the period so as to produce a constant periodic rate of interest on the remaining balance of the liability for each period. The right-of-use asset is depreciated over the shorter of the asset’s useful life and the lease term on a straight-line basis. The right-of-use asset and associated lease liability are derecognized upon the termination of a lease agreement.
The Group has elected to not recognize leases with an original term of one year or less in the consolidated statements of financial condition. The Group typically only includes an initial lease term in its assessment of a lease arrangement, whereas options to renew a lease are not included in this assessment unless there is a reasonable certainty that the lease will be renewed.
In the consolidated statements of financial condition, right-of-use assets are included within other assets, and lease liabilities are included in other liabilities.
Compensation and benefits
Salaries and benefits
Salaries and benefits include base salaries and employee benefits.
Annual incentive compensation
Annual incentive compensation includes discretionary and non-discretionary annual bonuses that are generally accrued over the related service period. Under certain non-discretionary arrangements, the Company may require that a portion of the incentive compensation distributed to its employees be allocated as RSUs under the LTIP. Such awards are recorded as share-based compensation expenses ratably over the relevant service period once granted.
Share-based and deferred compensation
Share-based compensation consists of RSUs with service-based conditions and PSUs with service-based conditions as well as performance- and/or market-based conditions. The fair value of PSUs is estimated using the Monte-Carlo model as of the grant date while the fair value of RSUs is estimated based on the share price as of the grant date. The Group recognizes share-based compensation expenses ratably over the relevant service period and accounts for forfeitures based on its estimates. Forfeiture estimates are estimated at issuance and are trued up as of the end of the vesting period to ensure that share-based compensation expense is recognized only for those share-based awards that ultimately vest. Upon vesting of a share-based award, ordinary shares (which are either purchased on the open market or newly issued) are released to employees net of any applicable income tax withholding.
Deferred compensation relates to certain non-employee directors and a specified group of employees electing to defer a portion of their compensation until a future date. In addition, the Group may in its sole discretion make a matching contribution to the participant’s deferral account to the extent cash deferrals are notionally invested in the Group’s ordinary shares. The Group records the compensation deferred including its matching contribution as an expense and adjusts for any movement in the fair value of the cash compensation deferred.
Long-term incentive compensation including accruals
Incentive compensation, which includes the “phantom carry pool” program, primarily consists of a portion of gains on capital provision assets or performance fees earned from certain of the Group’s private funds that are allocated to employees. Incentive compensation amounts are not paid until the related gains on capital provision assets or performance fees have been realized in cash by the Group. Incentive compensation amounts are recorded as the related fair value gains or losses on capital provision assets or performance fees are recognized. Accordingly, incentive compensation amounts can be reversed during periods when there is a decline in fair value or performance revenues that were previously recorded.
Business combinations
Business combinations are accounted for using the acquisition method. The cost of an acquisition is measured as the aggregate of the consideration transferred, which is measured at fair value on the acquisition date. Acquisition-related costs are expensed as incurred and included in the consolidated statements of operations. When the Group acquires a business, it assesses the financial assets and liabilities assumed for appropriate classification and designation in accordance with the contractual terms, economic circumstances and pertinent conditions as of the acquisition date.
Any contingent consideration to be transferred by the acquirer will be recognized at fair value as of the acquisition date. Subsequent changes in the fair value of contingent consideration classified as an asset or liability are reflected in the consolidated statements of operations. Contingent consideration classified as equity is not remeasured, and its subsequent settlement is accounted for within shareholders’ equity.
Goodwill
Goodwill arises as a result of the acquisition of subsidiaries and represents the excess of the purchase consideration over the fair value of the Group’s share of the assets acquired and the liabilities assumed on the acquisition date. After initial recognition, goodwill is measured at cost less any accumulated impairment losses. For the purposes of impairment testing, goodwill acquired in a business combination is, from the acquisition date, allocated to each of the Group’s reporting units that are expected to benefit from the combination, irrespective of whether other assets or liabilities of the acquiree are assigned to those units. The Group tests goodwill acquired in a business combination for impairment on an annual basis on October 1st.
Foreign currency translation
Functional and reporting currency
Items included in the financial statements of each of the Group’s entities are measured using the currency of the primary economic environment in which such entity operates (the “functional currency”). The functional currency of the Company, as determined in accordance with US GAAP, is the US dollar, because this is the currency that best reflects the economic substance of the underlying events and circumstances of the Company. The consolidated financial statements are presented in US dollar (the “reporting currency”).
Certain subsidiaries operate and prepare financial statements denominated in pound sterling and Australian dollar. For the purposes of preparing consolidated financial statements, those subsidiaries’ assets and liabilities are translated at exchange rates prevailing as of each applicable reporting date. Income and expense items are translated at average exchange rates for the reporting period. Non-monetary items are measured using the exchange rate as of the date of the initial transaction. Any exchange rate-related differences are recognized in other comprehensive income/(loss).
Transactions and balances
Foreign currency transactions are translated into the functional currency using the exchange rate prevailing at the transaction date. Foreign exchange gains and losses resulting from the settlement of such transactions and from the translation at period-end exchange rates of monetary assets and liabilities denominated in foreign currencies, including intragroup balances, are recognized in the consolidated statements of operations as part of the income or loss, as applicable, for the period. See note 5 (Capital provision assets) to the Group’s consolidated financial statements contained in this 2024 Form 10-K for additional information with respect to the treatment of capital provision assets.
Expenses
All expenses are accounted for on an accruals basis.
Finance costs
Finance costs represent interest and issuance expenses of outstanding indebtedness calculated using the effective interest rate method recognized in the consolidated statements of operations.
Gain/(loss) on debt extinguishment
Gain/(loss) on debt extinguishment represents a gain or loss arising from the difference between the amortized cost and the cost of extinguishing the debt on the extinguishment date and is recognized in the consolidated statements of operations.
Income taxes
The Group computes income taxes using the asset and liability method, under which deferred income taxes are recognized based on the differences between the carrying amounts and the respective tax bases of the Group’s assets and liabilities. Deferred tax assets and liabilities are measured using enacted tax rates expected to apply to taxable income in the periods in which the Group expects the temporary differences to reverse. The effect of a change in tax rates on deferred taxes is recognized in income/(loss) before income taxes in the consolidated statements of operations for the period that includes the enactment date.
The Group routinely evaluates the likelihood of realizing the benefit of its deferred tax assets and may record a valuation allowance if, based on all available evidence, it determines that a portion of the tax benefit will not be realized. In evaluating the Group’s ability to recover its deferred tax assets within the jurisdictions from which they arise, the Group considers all available positive and negative evidence, including scheduled reversals of deferred tax liabilities, projected future taxable income, tax-planning strategies and results of recent operations. If the Group determines that it would be able to realize its deferred tax assets in the future in excess of their net recorded amount, the Group would make an adjustment to the deferred tax asset valuation allowance, which would reduce the provision for income taxes.
The Group evaluates its exposures associated with its various tax filing positions and recognizes a tax benefit from an uncertain tax position only if it is more likely than not that the tax position will be sustained upon examination by the relevant tax authorities, including resolutions of any related appeals or litigation processes, based on the technical merits of the Group’s tax filing position. The tax benefits recognized in the consolidated financial statements from a tax filing position are measured based on the largest benefit that has a greater than 50% likelihood of being realized upon ultimate settlement. The Group adjusts its unrecognized tax benefit liability and income tax expense in the period in which the uncertain tax position is effectively settled, the statute of limitations expires for the relevant tax authority to examine the tax position or when new information becomes available.
Interest and penalties related to income tax matters are recorded in other expenses in the consolidated statements of operations. Accrued interest and penalties are included within the related tax balances in the consolidated statements of financial condition.
Dividends
Dividends paid during the period are recorded as a reduction to retained earnings in the consolidated statements of changes in equity.
Property and equipment
Property and equipment are recorded at cost less accumulated depreciation and provision for impairment and are included in other assets in the consolidated statements of financial condition. Depreciation is provided to write off the cost less estimated residual value in equal installments over the estimated useful lives of the assets.
The table below sets forth the expected useful lives of the Group’s various assets.
| | | | | | | | |
| Property and equipment | | Useful life |
| Leasehold improvements | | Life of lease |
| Fixtures, fittings and equipment | | 5 years |
| Computer hardware and software | | 3 years |
The gain or loss arising on the disposal or retirement of an asset is determined as the difference between the net sales proceeds and the carrying amount of the asset and is recognized in income/(loss) before income taxes in the consolidated statements of operations.
Prepayments and other payables
Prepayments and other payables are recognized at nominal value, are non-interest-bearing and are recorded in other assets and other liabilities, as applicable, in the consolidated statements of financial condition.
Shareholders’ equity
Ordinary shares are classified as equity in shareholders’ equity. Contingent shares are classified as equity in shareholders’ equity, where contingent shares will be issued and converted to ordinary shares only after the specified conditions have been satisfied. Additional paid-in capital includes the obligation for the issuance of ordinary shares to the Group’s employees under the LTIP. Incremental costs directly attributable to the issuance of new ordinary shares are deducted from equity in shareholders’ equity.
Net income/(loss) per ordinary share
The Group presents basic and diluted net income/(loss) per ordinary share. Basic net income/(loss) per ordinary share excludes potential dilution and is computed by dividing net income/(loss) attributable to ordinary shares by the weighted average number of ordinary shares issued and outstanding during the period. Diluted income/(loss) per ordinary share reflects the potential dilution that could occur if ordinary shares were issued pursuant to the Group’s share-based awards. The potential dilution from share-based awards is computed using the treasury stock method based on the average market value of ordinary shares during the period.
Recently issued or adopted accounting pronouncements
In October 2023, the Financial Accounting Standards Board (the “FASB”) issued Accounting Standards Update 2023-06, Disclosure Improvements (“ASU 2023-06”). ASU 2023-06 aims to clarify or improve disclosure and presentation requirements of a variety of topics and align the requirements in the FASB’s accounting standard codification with the SEC’s regulations. The amendments set forth in ASU 2023-06 will be effective on the date on which the related disclosures are removed from Regulation S-X or Regulation S-K by the SEC and will no longer be effective if the SEC has not removed the applicable disclosure requirement by June 30, 2027. The Group has evaluated the impact of ASU 2023-06 and expects the impact on the consolidated financial statements to be immaterial.
In December 2023, the FASB issued Accounting Standards Update 2023-09, Income Taxes (Topic 740) (“ASU 2023-09”). ASU 2023-09 relates to improvements in income tax disclosures to enhance their transparency and decision usefulness. ASU 2023-09 is effective for fiscal years beginning after December 15, 2024. Early adoption is permitted for annual financial statements that have not yet been issued or made available for issuance. The Group is currently evaluating the impact of ASU 2023-09 and expects the impact on the consolidated financial statements to be immaterial.
In March 2024, the FASB issued Accounting Standards Update 2024-01, Compensation—Stock Compensation (“ASU 2024-01”). ASU 2024-01 aims to clarify how an entity determines whether it is required to account for profits interest awards (and similar awards) in accordance with ASC 718 or other guidance. ASU 2024-01 provides specific examples on when a profits interest award should be accounted for as a share-based payment arrangement under ASC 718 or in a manner similar to a cash bonus or profit-sharing arrangement under ASC 710 or other ASC topics. ASU 2024-01 is effective for fiscal years beginning after December 15, 2024, and interim periods within those fiscal years. Early adoption is permitted for both interim and annual
financial statements that have not yet been issued or made available for issuance. The Group has evaluated the impact of ASU 2024-01 and expects no impact on the consolidated financial statements.
In November 2024, the FASB issued Accounting Standards Update 2024-03, Income Statement—Reporting Comprehensive Income—Expense Disaggregation Disclosures (“ASU 2024-03”). ASU 2024-03 aims to improve disclosures related to expenses and provide more detailed information about the types of expenses. ASU 2024-03 is effective for fiscal years beginning after December 15, 2026, and interim periods within fiscal years beginning after December 15, 2027. Early adoption is permitted. The Group is currently evaluating the impact of ASU 2024-03 on its consolidated financial statements.
In March 2024, the SEC adopted final rules under SEC Release No. 33-11275 and No. 34-99678, The Enhancement and Standardization of Climate-Related Disclosures for Investors (the “Final Rules”), which will require registrants to provide certain climate-related information in their registration statements and annual reports. The Final Rules will require, among other things, certain disclosures in the Group’s audited consolidated financial statements related to severe weather events and other natural conditions, subject to certain thresholds, as well as information related to carbon offsets and renewable energy credits. The financial statement disclosure requirements of the Final Rules will begin phasing in for the Group for the fiscal year ending December 31, 2025. In April 2024, the SEC stayed the effectiveness of the Final Rules. The Group is currently evaluating the impact of the Final Rules on its consolidated financial statements.
In November 2023, the FASB issued Accounting Standards Update 2023-07, Segment Reporting (Topic 280) (“ASU 2023-07”). ASU 2023-07 relates to improvements in disclosures about a public entity’s reportable segments and provision of more detailed information about a reportable segment’s expenses. The Group adopted ASU 2023-07 on January 1, 2024, on a retrospective basis with immaterial impact to the consolidated financial statements upon adoption.
3. Income taxes
The Company qualifies for exemption from income tax in Guernsey under the Income Tax (Exempt Bodies) (Guernsey) Ordinance, 1989, as amended. This exemption has to be applied for annually and has been applied for, and granted, with respect to the year ended December 31, 2024.
The Company’s operating subsidiaries in Australia, Ireland, Singapore, the United Kingdom and the United States are subject to taxation in such jurisdictions as determined in accordance with relevant tax legislation. In certain cases, an operating subsidiary of the Company may elect a transaction structure that could be subject to income tax in a country related to the transaction creating the capital provision asset.
The Group's effective tax rate was 9%, 3% and 11% for the years ended December 31, 2024, 2023 and 2022, respectively. The variability in the Group’s effective tax rate from period to period reflects the differing portions of the Group’s overall income and losses reported to each relevant taxing jurisdiction, and the differing tax rates in effect for such taxing jurisdictions at which such income and losses are taxed. During the year ended December 31, 2024, a substantial portion of the Group’s income was recognized in low tax jurisdictions. Another significant factor in the determination of the effective tax rate is the change in the Group’s valuation allowance against its deferred tax asset, largely arising from currently nondeductible interest expense.
The table below sets forth the domestic and foreign income/(loss) before income taxes for the periods indicated.
| | | | | | | | | | | | | | | | | | | | |
| | Years ended December 31, |
| ($ in thousands) | | 2024 | | 2023 | | 2022 |
| Domestic | | $ | 26,717 | | $ | 11,695 | | $ | 10,735 |
| Foreign | | 226,871 | | 726,588 | | 98,282 |
| Income/(loss) before income taxes | | 253,588 | | 738,283 | | 109,017 |
The table below sets forth the components of the tax charge reconciling the domestic statutory tax rate to the provision for/(benefit from) income taxes for the periods indicated.
| | | | | | | | | | | | | | | | | | | | |
| | Years ended December 31, |
| ($ in thousands) | | 2024 | | 2023 | | 2022 |
| Statutory rate | | $ | — | | | $ | — | | | $ | — | |
| Foreign rate differential | | (7,565) | | 4,800 | | 10,916 |
| Compensation | | 9,295 | | 23,848 | | 5,245 |
| Valuation allowance | | 13,478 | | | 446 | | | (3,918) | |
| Withholding tax | | 2,349 | | | 1,928 | | 1,082 |
| Non-deductible taxes | | — | | | — | | | (802) | |
| Prior period adjustments | | 6,413 | | | (468) | | | 129 |
| Impairment | | — | | | — | | | — | |
| Non-taxable income | | — | | | (1,984) | | | — | |
| Other, net | | 35 | | | (8,486) | | | (1,094) | |
| Provision for/(benefit from) income taxes | | 24,005 | | 20,084 | | 11,558 |
The table below sets forth a detailed analysis of the foreign tax differential for the periods indicated.
| | | | | | | | | | | | | | | | | | | | |
| | Years ended December 31, |
| ($ in thousands) | | 2024 | | 2023 | | 2022 |
| US subsidiaries at statutory tax rate | | $ | (4,726) | | $ | 1,884 | | $ | 12,428 |
| Singapore subsidiaries at statutory tax rate | | (590) | | | (570) | | | (586) | |
| Irish subsidiaries at statutory tax rate | | (2) | | 6 | | (11) | |
| UK subsidiaries at statutory tax rate | | (2,251) | | 3,487 | | (942) | |
| Other | | 4 | | | (7) | | | 27 |
| Total | | (7,565) | | 4,800 | | 10,916 |
The table below sets forth the current and deferred components of the provision for/(benefit from) income taxes for the periods indicated.
| | | | | | | | | | | | | | | | | | | | |
| | Years ended December 31, |
| ($ in thousands) | | 2024 | | 2023 | | 2022 |
| Current: | | | | | | |
| Domestic (Guernsey) | | $ | — | | | $ | — | | | $ | — | |
| Foreign - US federal and state | | 35,759 | | 12,417 | | 3,844 |
| Foreign - other and withholding | | 5,123 | | 1,804 | | (1,642) | |
| Total current provision for/(benefit from) income taxes | | 40,882 | | 14,221 | | 2,202 |
| | | | | | |
| Deferred: | | | | | | |
| Domestic (Guernsey) | | — | | | — | | | — | |
| Foreign - US federal and state | | (15,033) | | 8,982 | | 6,728 |
| Foreign - other | | (1,844) | | | (3,119) | | | 2,628 |
| Total deferred provision for/(benefit from) income taxes | | (16,877) | | 5,863 | | 9,356 |
| | | | | | |
| Total provision for/(benefit from) income taxes | | 24,005 | | 20,084 | | 11,558 |
The table below sets forth the tax effect of temporary tax-related differences and carryforwards that comprise significant portions of gross deferred tax assets and liabilities as of the dates indicated.
| | | | | | | | | | | | | | |
| | December 31, |
| ($ in thousands) | | 2024 | | 2023 |
| Deferred tax assets: | | | | |
| Compensation and benefit accruals | | $ | 20,699 | | $ | 22,443 |
| Net operating loss carryforwards | | 12,045 | | 3,692 |
| Non-deductible and excess interest | | 37,655 | | 32,260 |
| Unrealized loss | | 2,358 | | — | |
| Acquisition costs | | 359 | | 411 |
| Capital lease | | 157 | | 153 |
| Other | | 928 | | 1,236 |
Total deferred tax assets(1) | | 74,201 | | 60,195 |
| | | | |
| Deferred tax liabilities: | | | | |
| Compensation and benefit accruals | | — | | | — | |
| Depreciation and amortization | | (1,041) | | | (772) | |
| Goodwill | | (15,333) | | | (12,873) | |
| Unrealized gain | | (55,558) | | | (77,310) | |
Total deferred tax liabilities(1) | | (71,932) | | | (90,955) | |
| | | | |
| Net deferred tax position | | 2,269 | | | (30,760) | |
| Valuation allowance | | (34,826) | | | (19,252) | |
| Net deferred tax liabilities | | (32,557) | | | (50,012) | |
| 1. Total deferred tax assets and liabilities in this table are shown on a gross basis. Deferred tax assets and liabilities as shown in the consolidated statements of financial condition are offset within each tax jurisdiction, to the extent that they relate to the same taxable entity. |
The table below sets forth the net operating loss carryforwards as of the dates indicated. US net operating loss carryforwards reported in the Group’s consolidated financial statements reflect the US federal statutory tax rate and an estimated blended state tax rate. The actual effective state tax rate in a particular year may differ from the estimated blended state tax rate.
| | | | | | | | | | | | | | | | | | | | |
| | Years ended December 31, |
| ($ in thousands) | | 2024 | | 2023 | | 2022 |
US federal(1) | | $ | — | | | $ | — | | | $ | — | |
US state(2) | | 35,204 | | | 9,427 | | | 22,624 | |
Foreign(1) | | 24,119 | | | 3,692 | | | 17,018 | |
| 1. US federal and foreign net operating losses have indefinite carryforward periods. |
| 2. US state operating losses is comprised of amounts which will expire on various dates ranging from 2038 through 2042. |
The table below sets forth the valuation allowances as of the dates indicated.
| | | | | | | | | | | | | | |
| | December 31, |
| ($ in thousands) | | 2024 | | 2023 |
| US | | $ | 18,805 | | | $ | 6,319 | |
| UK | | 13,308 | | | 10,827 | |
| Singapore | | 2,521 | | | 1,932 | |
| Other | | 192 | | | 174 | |
| Total | | 34,826 | | | 19,252 | |
The Group’s valuation allowance against its deferred tax assets primarily relates to interest expense, foreign net operating loss carryforwards and other deferred tax assets. In determining its valuation allowance for its deferred assets, the Group has performed an assessment of positive and negative evidence, including the nature, frequency and severity of cumulative financial reporting losses in recent years, the future reversal of existing temporary differences, predictability of future taxable income exclusive of reversing temporary differences of the character necessary to realize the tax assets, relevant carryforward periods, taxable income in carryback periods if carryback is permitted under applicable tax laws and prudent and feasible tax planning strategies that would be implemented, if necessary, to protect against the loss of certain deferred tax assets that would otherwise expire (e.g., net operating losses). Although realization is not assured, based on the Group’s assessment, the Group has concluded that it is more likely than not that the remaining gross deferred tax assets will be realized and, as such, no additional valuation allowance has been provided.
The calculation of the Group’s global tax liabilities involves dealing with uncertainties in the application of case law, complex tax laws and regulations in a multitude of taxing jurisdictions across the Group’s global operations. ASC 740 states that a tax benefit from an uncertain tax position shall be recognized when it is more likely than not that the position will be sustained upon examination, including resolutions of any related appeals or litigation processes, based on the technical merits. In accordance with the guidelines established by ASC 740, the Group believes it does not have any uncertain tax positions for either the 2024 tax year or for any prior tax year which currently remains open under an applicable statute of limitations in the corresponding taxing jurisdiction. The Group continues to monitor its global tax positions and, if necessary, updates its position under ASC 740 regarding any uncertain tax positions based on any relevant case law, tax law and regulatory developments in an applicable taxing jurisdiction. The Group is not currently subject to audit by any tax authority. Certain affiliates of the Group file a US federal income tax return, along with various state and local income tax returns, which are subject to examination by the relevant taxing authorities for the years 2021 and onwards.
4. Segment reporting
ASC Subtopic 280-10, “Segment Reporting,” establishes standards for reporting information about operating segments. Operating segments are defined as components of an enterprise about which separate financial information is available. The chief operating decision maker (“CODM”), who is responsible for allocating resources and assessing performance of the operating segments, has been identified as the Chief Executive Officer and Chief Financial Officer, collectively.
The CODM assesses the performance of the operating segments based on segment income/(loss) before income taxes which consists of the significant measures of the reportable segments’ financial performance that includes segment revenues, consisting of capital provision income plus/ less third-party interests in capital provision income, asset management income, marketable securities income and interest and other income, less segment expenses, consisting of compensation and benefits, case related expenditures ineligible for inclusion in asset cost and general, administrative and other expenses. The CODM uses this metric to assess operating segment performance, for purposes of making operating decisions and assessing financial performance, which informs the CODMs allocation of resources. The Group excludes the proportional operating results that are attributable to third-party limited partners in our private funds, partners and minority investors, as the CODM does not consider them for the purposes of making decisions to allocate resources among segments or to assess segment performance. Although these amounts are excluded from segment income/(loss) before income taxes, they are included in reported consolidated income/(loss) before income taxes and are included in the reconciliation that follows.
The Group’s computation of segment income/(loss) before income taxes may not be comparable to other similarly titled measures computed by other companies because all companies do not calculate segment income/(loss) before income taxes in the same fashion.
Operating revenues directly associated with each segment are included in determining its operating results. Operating and other expenses that are not directly attributable to a particular segment are based upon allocation methodologies, including time estimates and other relevant usage measures. Due to the integrated structure of the Group’s business, certain costs incurred by one segment may benefit the other segment. A segment may use the information produced by another segment without incurring an intersegment charge or an intersegment income.
The CODM does not review information regarding total assets on an operating segment basis but rather on a total segments (Burford-only) basis. The accounting policies for segment reporting are the same as for the Group as a whole.
The Group has two operating segments which are also its reportable segments and provide legal finance products and services to its clients: (i) Principal Finance and (ii) Asset Management and Other Services. The Principal Finance segment allocates capital to legal finance assets from Burford’s balance sheet, primarily as capital provision assets, and in limited scope through interests in private funds managed by Burford. The Asset Management and Other Services segment manages legal finance assets on behalf of third-party investors, and Burford provides other services to the legal industry for both of which it receives fees.
Beginning for the year ended December 31, 2024, the Group renamed its Capital Provision segment to Principal Finance and allocated revenue, expenses and assets from other corporate to the Group’s two reportable segments with no change to the Group’s total segments (Burford-only) numbers. The change in our allocation methodology as of December 31, 2024, was due to the amounts relating to these operating and non-operating activities previously presented as other corporate forming part of what is used internally to measure and evaluate the performance of the reportable segments. As a result of this change, the Group also recast certain previously reported amounts to conform with the change in allocation of revenue, expenses and assets to each reportable segment as noted below.
The tables below set forth certain information with respect to the Group’s consolidated statements of operations by reportable segment for the periods indicated.
| | | | | | | | | | | | | | | | | | | | | | | | | | | | | | | | |
| | Year ended December 31, 2024 |
| | | | | | | | Reconciliation |
| ($ in thousands) | | Principal Finance | | Asset
Management and Other Services | | Total
segments
(Burford-only) | | Reconciling items(1) | | Total
consolidated |
| Capital provision income/(loss) | | $ | 388,124 | | | $ | — | | | $ | 388,124 | | | $ | 163,942 | | | $ | 552,066 | |
| Plus/(Less): Third-party interests in capital provision assets | | — | | | — | | | — | | | (42,384) | | | (42,384) | |
| Asset management income/(loss) | | — | | | 44,627 | | | 44,627 | | | (36,287) | | | 8,340 | |
| Marketable securities income/(loss) and interest | | 24,578 | | | — | | | 24,578 | | | 436 | | | 25,014 | |
| Other income/(loss) | | — | | | 3,051 | | | 3,051 | | | — | | | 3,051 | |
| Total revenues | | 412,702 | | | 47,678 | | | 460,380 | | | 85,707 | | | 546,087 | |
| | | | | | | | | | |
| Compensation and benefits | | 101,758 | | | 21,901 | | | 123,659 | | | — | | | 123,659 | |
| General, administrative and other | | 25,012 | | | 5,440 | | | 30,452 | | | 573 | | | 31,025 | |
| Case-related expenditures ineligible for inclusion in asset cost | | (1,057) | | | — | | | (1,057) | | | 1,858 | | | 801 | |
| Operating expenses | | 125,713 | | | 27,341 | | | 153,054 | | | 2,431 | | | 155,485 | |
| | | | | | | | | | |
| Other expenses | | | | | | | | | | |
| Finance costs | | 135,593 | | | — | | | 135,593 | | | — | | | 135,593 | |
| Foreign currency transactions (gains)/losses | | 1,244 | | | — | | | 1,244 | | | 177 | | | 1,421 | |
| Total other expenses | | 136,837 | | | — | | | 136,837 | | | 177 | | | 137,014 | |
| | | | | | | | | | |
| Income/(loss) before income taxes | | 150,152 | | | 20,337 | | | 170,489 | | | 83,099 | | | 253,588 | |
| 1. Reconciling items include the proportional operating results that are attributable to third-party limited partners and minority investors in consolidated entities, including BOF-C, the Strategic Value Fund, the Advantage Fund and Colorado. |
| | | | | | | | | | | | | | | | | | | | | | | | | | | | | | | | |
| | Year ended December 31, 2023 |
| | | | | | | | Reconciliation |
| ($ in thousands) | | Principal Finance | | Asset
Management and Other Services | | Total
segments
(Burford-only) | | Reconciling items(1) | | Total
consolidated |
| Capital provision income/(loss) | | $ | 896,371 | | | $ | — | | | $ | 896,371 | | | $ | 445,552 | | | $ | 1,341,923 | |
| Plus/(Less): Third-party interests in capital provision assets | | — | | | — | | | — | | | (279,263) | | | (279,263) | |
| Asset management income/(loss) | | — | | | 63,712 | | | 63,712 | | | (56,070) | | | 7,642 | |
| Marketable securities income/(loss) and interest | | 12,067 | | | — | | | 12,067 | | | 141 | | | 12,208 | |
| Other income/(loss) | | — | | | 4,392 | | | 4,392 | | | — | | | 4,392 | |
| Total revenues | | 908,438 | | | 68,104 | | | 976,542 | | | 110,360 | | | 1,086,902 | |
| | | | | | | | | | |
| Compensation and benefits | | 196,623 | | | 24,461 | | | 221,084 | | | — | | | 221,084 | |
| General, administrative and other | | 29,219 | | | 3,564 | | | 32,783 | | | 873 | | | 33,656 | |
| Case-related expenditures ineligible for inclusion in asset cost | | 14,671 | | | — | | | 14,671 | | | 1,825 | | | 16,496 | |
| Operating expenses | | 240,513 | | | 28,025 | | | 268,538 | | | 2,698 | | | 271,236 | |
| | | | | | | | | | |
| Other expenses | | | | | | | | | | |
| Finance costs | | 99,136 | | | — | | | 99,136 | | | (1) | | | 99,135 | |
| Foreign currency transactions (gains)/losses | | (21,737) | | | — | | | (21,737) | | | (15) | | | (21,752) | |
| Total other expenses | | 77,399 | | | — | | | 77,399 | | | (16) | | | 77,383 | |
| | | | | | | | | | |
| Income/(loss) before income taxes | | 590,526 | | | 40,079 | | | 630,605 | | | 107,678 | | | 738,283 | |
| 1. Reconciling items include the proportional operating results that are attributable to third-party limited partners and minority investors in consolidated entities, including BOF-C, the Strategic Value Fund, the Advantage Fund and Colorado. |
For the year ended December 31, 2023, the Group recast $12.1 million of marketable securities income/(loss) and interest, $43.0 million of operating expenses, $2.7 million of finance costs and $(21.7) million of foreign currency transactions (gains)/losses from other corporate to its Principal Finance segment. In addition, the Group also recast $9.3 million of operating expenses from other corporate to its Asset Management and Other Services segment and $1.8 million of finance costs from Asset Management and Other Services segment to its Principal Finance segment.
| | | | | | | | | | | | | | | | | | | | | | | | | | | | | | | | |
| | Year ended December 31, 2022 |
| | | | | | | | Reconciliation |
| ($ in thousands) | | Principal Finance | | Asset
Management and Other Services | | Total
segments
(Burford-only) | | Reconciling items(1) | | Total
consolidated |
| Capital provision income/(loss) | | $ | 202,878 | | $ | — | | | $ | 202,878 | | | $ | 116,230 | | $ | 319,108 | |
| Plus/(Less): Third-party interests in capital provision assets | | — | | | — | | | — | | | (494) | | | (494) | |
| Asset management income/(loss) | | — | | | 56,080 | | | 56,080 | | | (46,964) | | | 9,116 | |
| Marketable securities income/(loss) and interest | | (7,594) | | | — | | | (7,594) | | | (150) | | | (7,744) | |
| Other income/(loss) | | — | | | (759) | | | (759) | | | — | | | (759) | |
| Total revenues | | 195,284 | | | 55,321 | | | 250,605 | | | 68,622 | | | 319,227 | |
| | | | | | | | | | |
| Compensation and benefits | | 62,659 | | | 23,687 | | | 86,346 | | | — | | | 86,346 | |
| General, administrative and other | | 14,673 | | | 14,040 | | | 28,713 | | | 968 | | | 29,681 | |
| Case-related expenditures ineligible for inclusion in asset cost | | 7,637 | | | — | | | 7,637 | | | 608 | | | 8,245 | |
| Operating expenses | | 84,969 | | | 37,727 | | | 122,696 | | | 1,576 | | | 124,272 | |
| | | | | | | | | | |
| Other expenses | | | | | | | | | | |
| Finance costs | | 78,264 | | — | | | 78,264 | | | — | | | 78,264 | |
| Foreign currency transactions (gains)/losses | | 7,581 | | | — | | | 7,581 | | | 93 | | 7,674 | |
| Total other expenses | | 85,845 | | | — | | | 85,845 | | | 93 | | | 85,938 | |
| | | | | | | | | | |
| Income/(loss) before income taxes | | 24,470 | | | 17,594 | | | 42,064 | | | 66,953 | | | 109,017 | |
| 1. Reconciling items include the proportional operating results that are attributable to third-party limited partners and minority investors in consolidated entities, including BOF-C, the Strategic Value Fund, the Advantage Fund and Colorado. |
For the year ended December 31, 2022, the Group recast $(7.6) million of marketable securities income/(loss) and interest, $12.5 million of operating expenses, $3.9 million of finance costs and $7.6 million of foreign currency transactions (gains)/losses from other Corporate to its Principal Finance segment. In addition, the Group also recast $9.8 million of operating expenses from other Corporate to its Asset Management and Other Services segment and $1.8 million of finance costs from Asset Management and Other Services segment to its Principal Finance segment.
The table below sets forth specified line items with respect to the Group’s consolidated statements of financial condition by reportable segment as of the dates indicated.
| | | | | | | | | | | | | | | | | | | | | | | | | | | | | | | | |
| | Year ended December 31, 2024 |
| | | | | | | | Reconciliation |
| ($ in thousands) | | Principal Finance | | Asset
Management and Other Services | | Total
segments
(Burford-only) | | Reconciling items(1) | | Total
consolidated |
| Cash and cash equivalents and marketable securities | | $ | 508,031 | | | $ | 12,650 | | | $ | 520,681 | | | $ | 28,269 | | | $ | 548,950 | |
| Other assets | | $ | 23,711 | | | $ | 151,770 | | | $ | 175,481 | | | $ | (114,475) | | | $ | 61,006 | |
| Due from settlement of capital provision assets | | $ | 183,651 | | | $ | — | | | $ | 183,651 | | | $ | 207 | | | $ | 183,858 | |
| Capital provision assets | | $ | 3,571,224 | | | $ | — | | | $ | 3,571,224 | | | $ | 1,672,693 | | | $ | 5,243,917 | |
| Total assets | | $ | 4,397,954 | | | $ | 190,377 | | | $ | 4,588,331 | | | $ | 1,586,694 | | | $ | 6,175,025 | |
| 1. Reconciling items include the proportional operating results that are attributable to third-party limited partners and minority investors in consolidated entities, including BOF-C, the Strategic Value Fund, the Advantage Fund and Colorado. |
| | | | | | | | | | | | | | | | | | | | | | | | | | | | | | | | |
| | Year ended December 31, 2023 |
| | | | | | | | Reconciliation |
| ($ in thousands) | | Principal Finance | | Asset
Management and Other Services | | Total
segments
(Burford-only) | | Reconciling items(1) | | Total
consolidated |
| Cash and cash equivalents and marketable securities | | $ | 291,386 | | | $ | 12,090 | | | $ | 303,476 | | | $ | 24,634 | | | $ | 328,110 | |
| Other assets | | $ | 26,165 | | | $ | 133,952 | | | $ | 160,117 | | | $ | (96,653) | | | $ | 63,464 | |
| Due from settlement of capital provision assets | | $ | 185,267 | | | $ | — | | | $ | 185,267 | | | $ | 80,273 | | | $ | 265,540 | |
| Capital provision assets | | $ | 3,432,112 | | | $ | — | | | $ | 3,432,112 | | | $ | 1,613,276 | | | $ | 5,045,388 | |
| Total assets | | 4,043,848 | | | 172,016 | | | 4,215,864 | | | 1,621,530 | | | 5,837,394 | |
| 1. Reconciling items include the proportional operating results that are attributable to third-party limited partners and minority investors in consolidated entities, including BOF-C, the Strategic Value Fund, the Advantage Fund and Colorado. |
As of December 31, 2023, the Group recast total assets of $114.4 million and $0.9 million from other Corporate to its Principal Finance and Asset Management and Other Services segments, respectively. In addition, the Group also recast total assets of $96.5 million from its Principal Finance segment to its Asset Management and Other Services segment.
5. Capital provision assets
Capital provision assets are financial instruments that relate to the provision of capital in connection with legal finance, which include the Advantage Fund and, prior to its liquidation in the fourth quarter of 2023, equity securities and related claims in the Strategic Value Fund.
The table below sets forth the changes in capital provision assets as of the beginning and end of the relevant reporting periods.
| | | | | | | | | | | | | | |
| | Years ended December 31, |
| ($ in thousands) | | 2024 | | 2023 |
| Beginning of period | | $ | 5,045,388 | | | $ | 3,735,556 | |
| Deployments | | 555,088 | | | 682,027 | |
| Realizations | | (907,042) | | | (708,293) | |
| Income/(loss) for the period | | 567,646 | | | 1,333,262 | |
| Foreign exchange gains/(losses) | | (17,163) | | | 2,836 | |
| End of period | | 5,243,917 | | | 5,045,388 | |
| | | | |
| Deployed cost, end of period | | 2,341,377 | | | 2,280,563 | |
| Unrealized fair value, end of period | | 2,902,540 | | | 2,764,825 | |
| Capital provision assets | | 5,243,917 | | | 5,045,388 | |
The table below sets forth the components of the capital provision income/(loss) for the periods indicated.
| | | | | | | | | | | | | | | | | | | | |
| | Years ended December 31, |
| ($ in thousands) | | 2024 | | 2023 | | 2022 |
| Net realized gains/(losses) | | $ | 439,665 | | | $ | 251,618 | | | $ | 161,707 | |
| Fair value adjustment during the period, net of previously recognized unrealized gains/(losses) transferred to realized gains/(losses) | | 127,981 | | | 1,081,644 | | | 169,104 | |
| Income/(loss) on capital provision assets | | 567,646 | | | 1,333,262 | | | 330,811 | |
| Interest and other income/(loss) | | — | | | — | | | 2,651 | |
| Foreign exchange gains/(losses) | | (15,701) | | | 8,012 | | | (6,357) | |
| Net income/(loss) from due from settlement of capital provision assets | | 2,704 | | | (1) | | | (11,330) | |
| Net gains/(losses) on financial liabilities at fair value through profit or loss | | (2,583) | | | — | | | 3,333 | |
| Break fee income | | — | | | 650 | | | — | |
| Total capital provision income as reported in the consolidated statements of operations | | 552,066 | | | 1,341,923 | | | 319,108 | |
Exchange differences arising from capital provision assets denominated in a currency other than the functional currency of the entity in which such capital provision assets are held are recognized in capital provision income/(loss) in the consolidated statements of operations. All other foreign exchange translation differences arising from capital provision assets held by non-US dollar functional currency entities are recognized in other comprehensive income/(loss) in the consolidated statements of comprehensive income. The currency of the primary economic environment in which the Group’s entity operates is referred to as the “functional currency” of the Group’s entity.
6. Due from settlement of capital provision assets
Amounts due from settlement of capital provision assets relate to the realization of capital provision assets that have successfully concluded and where there is no longer any litigation risk remaining. The settlement terms and timing of realizations vary by capital provision asset. The majority of settlement balances are received shortly after the respective period ends in which the capital provision assets have concluded, and all settlement balances are generally expected to be received within 12 months after the capital provision assets have concluded.
The table below sets forth the changes in due from settlement of capital provision assets and the breakdown between current and non-current due from settlement of capital provision assets as of the beginning and end of the relevant reporting periods.
| | | | | | | | | | | | | | |
| | Years ended December 31, |
| ($ in thousands) | | 2024 | | 2023 |
| Beginning of period | | $ | 265,540 | | | $ | 116,582 | |
| Transfer of realizations from capital provision assets | | 907,042 | | | 708,293 | |
Net realized gains/(losses)(1) | | — | | | (11,330) | |
| Unrealized gains/(losses) on due from settlement of capital provision assets, net of previously recognized unrealized gains/(losses) transferred to realized gains/(losses) | | — | | | 11,329 | |
| Other income/(loss) | | 2,704 | | | — | |
| Proceeds from capital provision assets | | (991,292) | | | (559,362) | |
| Foreign exchange gains/(losses) | | (136) | | | 28 | |
| End of period | | 183,858 | | | 265,540 | |
| | | | |
| Current assets | | 170,570 | | | 260,370 | |
| Non-current assets | | 13,288 | | | 5,170 | |
| Total due from settlement of capital provision assets | | 183,858 | | | 265,540 | |
1. The net realized loss of $11.3 million represents the realization of a previously recognized $11.3 million unrealized loss as described in the 2023 Annual Report. The net impact for the year ended December 31, 2024 is $1,000 reported as net loss on due from settlement of capital provision assets in note 5 (Capital provision assets) to our consolidated financial statements contained in this 2024 Form 10-K. |
|
7. Asset management income
The table below sets forth the components of the asset management income for the periods indicated.
| | | | | | | | | | | | | | | | | | | | |
| | Years ended December 31, |
| ($ in thousands) | | 2024 | | 2023 | | 2022 |
| Management fee income | | $ | 6,840 | | | $ | 7,642 | | | $ | 7,321 | |
| Performance fee income | | 1,500 | | | — | | | 1,795 | |
Total asset management income(1) | | 8,340 | | | 7,642 | | | 9,116 | |
| 1. Relates to revenue from contracts with customers for services transferred over time. |
8. Long-term incentive compensation payable
The table below sets forth the changes in the long-term incentive compensation payable as of the beginning and end of the relevant reporting periods.
| | | | | | | | | | | | | | |
| | Years ended December 31, |
| ($ in thousands) | | 2024 | | 2023 |
| Beginning of period | | $ | 183,134 | | $ | 71,412 |
| Long-term incentive compensation including accruals | | 43,209 | | 127,471 |
| Transfer to short-term payable within general expenses payable | | — | | | (3,656) | |
| Cash paid | | (8,367) | | | (13,073) | |
| Foreign exchange gains/(losses) | | (424) | | | 980 | |
| End of period | | 217,552 | | 183,134 |
Aggregate employee carried interest on cash proceeds from net realized gains on capital provision assets will be approximately 8% for the 2015 to 2017 vintage years, approximately 9% for the 2018 vintage year, approximately 10% for the 2019 vintage year, approximately 11% for the 2020 to 2021 vintage years, approximately 12% for the 2022 to 2023 vintage years and approximately 11% for the 2024 vintage year. These percentages reflect the new employment agreements entered into on January 1, 2024 for Mr. Bogart, our Chief Executive Officer, and Mr. Molot, our Chief Investment Officer. Historically, Mr. Bogart’s and Mr.
Molot’s annual incentive compensation was entirely formulaic and based solely on the generation of cash proceeds, the majority of which was paid as an annual bonus. Under the new employment agreements, the amount of their compensation that is formulaic and tied to our income, excluding the impact of any fair value adjustments, will now be paid entirely through the carry plan.
9. Marketable securities
The table below sets forth the changes in marketable securities as of the beginning and end of the relevant reporting periods.
| | | | | | | | | | | | | | |
| | Years ended December 31, |
| ($ in thousands) | | 2024 | | 2023 |
| Beginning of period | | $ | 107,561 | | $ | 136,358 |
| Purchases | | 103,124 | | 40,404 |
| Proceeds on disposal | | (135,701) | | | (74,875) | |
| Net realized gains/(losses) on disposal | | 1,864 | | | (415) | |
| Fair value movement | | 2,158 | | | 6,185 | |
| Change in accrued interest | | 47 | | (171) |
| Foreign exchange gains/(losses) | | (33) | | | 75 | |
| End of period | | 79,020 | | 107,561 |
The table below sets forth the components of the total marketable securities income/(loss) and interest for the periods indicated.
| | | | | | | | | | | | | | | | | | | | |
| | Years ended December 31, |
| ($ in thousands) | | 2024 | | 2023 | | 2022 |
| Net realized gains/(losses) on disposal | | $ | 1,864 | | | $ | (415) | | | $ | (1,647) | |
| Changes in fair value | | 2,158 | | | 6,185 | | | (9,682) | |
| Interest and dividend income | | 2,986 | | | 2,453 | | | 2,812 | |
| Bank interest(1) | | 18,006 | | | 3,985 | | | 773 | |
| Total marketable securities income/(loss) and interest | | 25,014 | | | 12,208 | | | (7,744) | |
| 1. Bank interest is earned on cash and cash equivalents. |
10. Other assets
The table below sets forth the components of total other assets as of the dates indicated.
| | | | | | | | | | | | | | |
| | December 31 |
| ($ in thousands) | | 2024 | | 2023 |
| Reinsurance assets | | $ | 17,463 | | $ | 15,371 |
| Right-of-use assets | | 12,796 | | 13,851 |
| Property and equipment | | 3,426 | | 3,561 |
| Prepayments | | 10,220 | | 9,150 |
| Other receivables | | 17,101 | | 21,531 |
| Total other assets | | 61,006 | | 63,464 |
11. Other liabilities
The table below sets forth the components of total other liabilities as of the dates indicated.
| | | | | | | | | | | | | | |
| | December 31, |
| ($ in thousands) | | 2024 | | 2023 |
| General expenses payable | | $ | 66,966 | | | $ | 74,527 | |
| Insurance liabilities | | 21,991 | | | 22,465 | |
| Lease liabilities | | 14,821 | | | 15,853 | |
| Audit fees payable | | 2,996 | | | 2,163 | |
| Tax payable | | 21,144 | | | 4,226 | |
| Payable for capital provision assets | | 14,055 | | | 2,965 | |
| Total other liabilities | | 141,973 | | | 122,199 | |
12. Debt
The table below sets forth certain information with respect to the Group’s debt securities outstanding as of the dates indicated. Debt securities denominated in pound sterling have been converted to US dollar using GBP/USD exchange rates of $1.2529 and $1.2747 as December 31, 2024 and 2023, respectively.
| | | | | | | | | | | | | | | | | | | | | | | | | | | | | | | | |
| | Outstanding at | | Carrying value (at amortized cost) at | | Fair value(1) at |
| ($ in thousands) | | December 31,
2024 | | December 31,
2024 | | December 31,
2023 | | December 31,
2024 | | December 31,
2023 |
| Burford Capital PLC | | | | | | | | | | |
5.000% Bonds due December 1, 2026(22) | | $219,258 | | $ | 218,640 | | | $ | 222,117 | | | $ | 212,706 | | | $ | 209,048 | |
| | | | | | | | | | |
| Burford Capital Finance LLC | | | | | | | | | | |
6.125% Bonds due August 12, 2025(3) | | $129,432 | | $ | 129,275 | | | $ | 179,432 | | | $ | 129,641 | | | $ | 175,797 | |
| | | | | | | | | | |
| Burford Capital Global Finance LLC | | | | | | | | | | |
| 6.250% Senior Notes due April 15, 2028 | | $ | 400,000 | | | $ | 395,913 | | | $ | 394,672 | | | $ | 399,012 | | | $ | 384,228 | |
| 6.875% Senior Notes due April 15, 2030 | | $ | 360,000 | | | $ | 352,961 | | | $ | 351,631 | | | $ | 360,220 | | | $ | 352,350 | |
9.250% Senior Notes due July 1, 2031(4) | | $ | 675,000 | | | $ | 666,823 | | | $ | 386,878 | | | $ | 717,748 | | | $ | 424,568 | |
| Total debt | | $1,783,690 | | $1,763,612 | | $ | 1,534,730 | | $1,819,327 | | $1,545,991 |
| 1. The Group’s outstanding indebtedness is held at amortized cost in the consolidated financial statements and these values represent the fair value equivalent amounts. The Group’s debt securities are classified as Level 2 with in the fair value hierarchy. |
| 2. On June 1, 2017, Burford Capital PLC issued £175.0 million ($225.8 million) aggregate principal amount of 5.000% notes due 2026. |
3. During the year ended December 31, 2024, Burford Capital Finance LLC purchased in open market transactions approximately $50.6 million of the 2025 Bonds (as defined below). See “—Purchases of 2025 Bonds” for additional information with respect to the purchases of the 2025 Bonds. |
4. On January 30, 2024, Burford Capital Global Finance LLC issued $275.0 million aggregate principal amount of the Additional 2031 Notes (as defined below). See “—Issuance of Additional 2031 Notes” for additional information with respect to the issuance of the 2031 Additional Notes. |
The table below sets forth a summary of the changes in the outstanding indebtedness due to cash flows and non-cash changes as of the beginning and end of the relevant reporting periods.
| | | | | | | | | | | | | | |
| | Years ended December 31, |
| ($ in thousands) | | 2024 | | 2023 |
| Beginning of period | | $ | 1,569,146 | | | $ | 1,269,085 | |
| Debt issuance, including original issue premium | | 284,969 | | | 394,464 | |
| Debt issuance costs | | (6,283) | | | (8,461) | |
| Debt extinguishment | | (49,819) | | | (129,970) | |
| Finance costs | | 135,717 | | | 99,135 | |
| Interest paid | | (154,093) | | | (77,210) | |
| Foreign exchange (gain)/loss | | (3,928) | | | 22,103 | |
| End of period | | 1,775,709 | | | 1,569,146 | |
| | | | |
| Debt payable | | 1,763,612 | | | 1,534,730 | |
| Debt interest payable | | 12,097 | | | 34,416 | |
| Total debt and interest payable | | 1,775,709 | | | 1,569,146 | |
The table below sets forth unamortized issuance costs of the outstanding debt securities as of the dates indicated.
| | | | | | | | | | | | | | |
| | December 31, |
| ($ in thousands) | | 2024 | | 2023 |
| 6.125% Bonds due 2025 | | 157 | | | 568 | |
| 5.000% Bonds due 2026 | | 618 | | | 956 | |
| 6.250% Senior Notes due 2028 | | 4,087 | | | 5,328 | |
| 6.875% Senior Notes due 2030 | | 5,234 | | | 6,223 | |
| 9.250% Senior Notes due 2031 | | 12,319 | | | 7,932 | |
The table below sets forth the components of total finance costs of the outstanding indebtedness for the periods indicated.
| | | | | | | | | | | | | | | | | | | | |
| | Years ended December 31, |
| (S in thousands) | | 2024 | | 2023 | | 2022 |
Debt interest expense(1) | | $ | 131,022 | | | $ | 94,605 | | | $ | 74,991 | |
| Debt issuance costs incurred as finance costs | | 4,571 | | | 4,530 | | | 3,273 | |
| Total finance costs | | 135,593 | | | 99,135 | | | 78,264 | |
| 1. Includes (gains)/losses on debt extinguishment of $(0.1) million, $nil million and $0.9 million, for the years ended December 31, 2024, 2023 and 2022, respectively. |
Description of debt securities
All of the Group’s outstanding debt securities have a fixed interest rate payable semi-annually in arrears and are unsecured, unsubordinated obligations of the respective issuer that are fully and unconditionally guaranteed by the Company and certain of its wholly owned indirect subsidiaries. As of December 31, 2024, the Group was in compliance with the covenants set forth in the respective agreements governing its debt securities.
The Company is required to provide certain information pursuant to the indentures governing the 2028 Notes, the 2030 Notes and the 2031 Notes. The tables below set forth the total assets and third-party indebtedness as of the dates indicated and total revenues for the periods indicated, in each case, of (i) the Company and its Restricted Subsidiaries (as defined in the indentures governing the 2028 Notes, the 2030 Notes and the 2031 Notes, as applicable) and (ii) the Company’s Unrestricted Subsidiaries (as defined in the indentures governing the 2028 Notes, the 2030 Notes and the 2031 Notes, as applicable).
| | | | | | | | | | | | | | |
| | December 31, |
| ($ in thousands) | | 2024 | | 2023 |
| Company and its Restricted Subsidiaries | | | | |
| Total assets | | $ | 5,335,289 | | $ | 4,922,451 |
| Third-party indebtedness | | 1,763,612 | | 1,534,730 |
| | | | |
| Unrestricted Subsidiaries | | | | |
| Total assets | | 839,736 | | 914,943 |
| Third-party indebtedness | | — | | | — | |
| | | | | | | | | | | | | | | | | | | | |
| | Years ended December 31, |
| (S in thousands) | | 2024 | | 2023 | | 2022 |
| Company and its Restricted Subsidiaries | | | | | | |
| Total revenues | | $ | 460,352 | | | $ | 973,461 | | | $ | 245,383 | |
| | | | | | |
| Unrestricted Subsidiaries | | | | | | |
| Total revenues | | 85,735 | | | 113,441 | | | 73,844 | |
Issuance of Additional 2031 Notes
On January 30, 2024, Burford Capital Global Finance LLC issued $275.0 million aggregate principal amount of additional 9.250% Senior Notes due 2031 (the “Additional 2031 Notes”) at an offering price equal to 103.625% of the principal amount thereof, plus accrued interest from January 1, 2024. The Additional 2031 Notes were issued as “Additional Notes” under the indenture governing the $400.0 million aggregate principal amount of the 9.250% Senior Notes due 2031 (the “Initial 2031 Notes”), have identical terms to the Initial 2031 Notes (other than with respect to the date of issuance, the issue price and the first interest payment date) and are treated as a single class for all purposes under the indenture governing the Initial 2031 Notes.
Purchases of 2025 Bonds
During the year ended December 31, 2024, Burford Capital Finance LLC, a wholly owned indirect subsidiary of the Company, purchased in open market transactions and cancelled approximately $50.6 million in aggregate principal amount of the 6.125% Bonds due 2025 (the “2025 Bonds”), which resulted in a gain on early extinguishment of debt of $0.1 million.
13. Goodwill
Goodwill arises as a result of the acquisition of subsidiaries and represents the excess of the purchase consideration over the fair value of the Group’s share of the assets acquired and the liabilities assumed on the acquisition date. The Group’s goodwill primarily relates to the acquisition of BCIM Holdings LLC in December 2016.
The tables below set forth the allocation of the carrying value of goodwill to each of the Group’s reportable segments as of the beginning and end of the relevant reporting periods.
| | | | | | | | | | | | | | | | | | | | |
| ($ in thousands) | | Principal Finance | | Asset
Management and
Other Services | | Total |
| December 31, 2022 | | $ | 108,892 | | $ | 25,020 | | $ | 133,912 |
| Foreign exchange gains/(losses) | | 53 | | | — | | | 53 | |
| December 31, 2023 | | 108,945 | | 25,020 | | 133,965 |
| Foreign exchange gains/(losses) | | (17) | | | — | | | (17) | |
| December 31, 2024 | | 108,928 | | 25,020 | | 133,948 |
Management has determined there was no evidence of goodwill impairment as of December 31, 2024 and 2023.
14. Fair value of assets and liabilities
The tables below set forth the fair value of financial instruments grouped by the fair value level as of the dates indicated.
| | | | | | | | | | | | | | | | | | | | | | | | | | |
| | December 31, 2024 |
| ($ in thousands) | | Level 1 | | Level 2 | | Level 3 | | Total |
| Assets: | | | | | | | | |
| Capital provision assets | | | | | | | | |
| Derivative financial assets | | | | | | | | |
| Single case | | $ | — | | | $ | — | | | $ | 1,052,519 | | | $ | 1,052,519 | |
| Portfolio | | — | | | — | | | 3,053,800 | | | 3,053,800 | |
| Portfolio with equity risk | | — | | | — | | | 65,041 | | | 65,041 | |
| Legal risk management | | — | | | — | | | 6,442 | | | 6,442 | |
| Non-derivative financial assets | | | | | | | | |
| Joint ventures and equity method investments | | — | | | — | | | 154,220 | | | 154,220 | |
| Single case with equity risk | | 8,711 | | | — | | | — | | | 8,711 | |
| Assets of consolidated investment companies | | | | | | | | |
| Core legal finance (BOF-C) | | 8,581 | | | — | | | 705,315 | | | 713,896 | |
| Lower risk legal finance (Advantage Fund) | | — | | | — | | | 189,288 | | | 189,288 | |
| Due from settlement of capital provision assets | | — | | | — | | | 183,858 | | | 183,858 | |
| Marketable securities | | | | | | | | |
| Government securities | | — | | | 40,405 | | | — | | | 40,405 | |
| Corporate bonds | | — | | | 20,077 | | | — | | | 20,077 | |
| Asset-backed securities | | — | | | 1,971 | | | — | | | 1,971 | |
| Mutual funds | | 10,654 | | | — | | | — | | | 10,654 | |
| Certificates of deposit | | 5,913 | | | — | | | — | | | 5,913 | |
| Total assets | | 33,859 | | | 62,453 | | | 5,410,483 | | | 5,506,795 | |
| | | | | | | | |
| Liabilities: | | | | | | | | |
| Financial liabilities relating to third-party interests in capital provision assets | | — | | | — | | | 747,053 | | | 747,053 | |
| Total liabilities | | — | | | — | | | 747,053 | | | 747,053 | |
| Net total | | 33,859 | | | 62,453 | | | 4,663,430 | | | 4,759,742 | |
| | | | | | | | | | | | | | | | | | | | | | | | | | |
| | December 31, 2023 |
| ($ in thousands) | | Level 1 | | Level 2 | | Level 3 | | Total |
| Assets: | | | | | | | | |
| Capital provision assets | | | | | | | | |
| Derivative financial assets | | | | | | | | |
| Single case | | $ | — | | | $ | — | | | $ | 934,131 | | $ | 934,131 |
| Portfolio | | — | | | — | | | 2,875,881 | | 2,875,881 |
| Portfolio with equity risk | | — | | | — | | | 142,659 | | 142,659 |
| Legal risk management | | — | | | — | | | 3,523 | | 3,523 |
| Non-derivative financial assets | | | | | | | | |
| Joint ventures and equity method investments | | — | | | — | | | 178,628 | | 178,628 |
| Single case with equity risk | | 10,051 | | — | | | — | | | 10,051 |
| Assets of consolidated investment companies | | | | | | | | |
| Core legal finance (BOF-C) | | 9,914 | | — | | | 705,092 | | 715,006 |
| Lower risk legal finance (Advantage Fund) | | — | | | — | | | 185,509 | | 185,509 |
| Due from settlement of capital provision assets | | — | | | — | | | 265,540 | | 265,540 |
| Marketable securities | | | | | | | | |
| Government securities | | 8,004 | | 14,333 | | — | | | 22,337 |
| Corporate bonds | | — | | | 53,001 | | — | | | 53,001 |
| Asset-backed securities | | — | | | 20,047 | | — | | | 20,047 |
| Mutual funds | | 6,529 | | — | | | — | | | 6,529 |
| Certificates of deposit | | 5,647 | | — | | | — | | | 5,647 |
| Total assets | | 40,145 | | 87,381 | | 5,290,963 | | 5,418,489 |
| | | | | | | | |
| Liabilities: | | | | | | | | |
| Financial liabilities relating to third-party interests in capital provision assets | | — | | | — | | | 704,196 | | 704,196 |
| Total liabilities | | — | | | — | | | 704,196 | | 704,196 |
| Net total | | 40,145 | | 87,381 | | 4,586,767 | | 4,714,293 |
The Group has elected the fair value option for the Group’s equity method investments, marketable securities, due from settlement of capital provision assets and financial liabilities relating to third-party interests in capital provision assets to provide a consistent fair value measurement approach for all capital provision related activity. Realized gains and losses, unrealized gains and losses and interest and dividend income on these assets are recognized as income/(loss) and presented in the consolidated statements of operations when they are earned.
The key risk and sensitivity across all the capital provision assets relate to the underlying litigation associated with each case that is underwritten and financed. The sensitivity to this Level 3 input is therefore considered to be similar across the different types of capital provision assets and is expressed as a portfolio-wide stress.
Movements in Level 3 fair value assets and liabilities
The tables below set forth the analysis of the movements in the Level 3 financial assets and liabilities for the periods indicated.
| | | | | | | | | | | | | | | | | | | | | | | | | | | | | | | | | | | | | | | | | | | | | | | | | | |
| | Year ended December 31, 2024 |
| ($ in thousands) | | Beginning
of period | | Transfers
into Level 3 | | Transfers
between
types | | Deployments | | Realizations | | Income/(loss)
for the
period | | Foreign
exchange
gains/(losses) | | End of
period |
| Single case | | $ | 934,131 | | $ | — | | | $ | (4,132) | | | $ | 224,641 | | $ | (258,797) | | $ | 161,784 | | $ | (5,108) | | $ | 1,052,519 |
| Portfolio | | 2,875,881 | | — | | | 4,132 | | | 153,251 | | (240,566) | | 265,675 | | (4,573) | | 3,053,800 |
| Portfolio with equity risk | | 142,659 | | — | | | — | | | 363 | | (117,040) | | 39,059 | | — | | | 65,041 |
| Legal risk management | | 3,523 | | — | | | — | | | — | | | — | | | 3,275 | | (356) | | 6,442 |
| Joint ventures and equity method investments | | 178,628 | | — | | | — | | | 9,667 | | (1,660) | | (25,868) | | (6,547) | | 154,220 |
| Core legal finance (BOF-C) | | 705,092 | | — | | | — | | | 98,391 | | (180,406) | | 82,238 | | — | | | 705,315 |
| Lower risk legal finance (Advantage Fund) | | 185,509 | | — | | | — | | | 68,775 | | (99,196) | | 34,200 | | — | | | 189,288 |
| Total capital provision assets | | 5,025,423 | | — | | | — | | | 555,088 | | (897,665) | | 560,363 | | (16,584) | | 5,226,625 |
| Due from settlement of capital provision assets | | 265,540 | | — | | | — | | | 907,042 | | (991,292) | | 2,704 | | (136) | | 183,858 |
| Total Level 3 assets | | 5,290,963 | | — | | | — | | | 1,462,130 | | (1,888,957) | | 563,067 | | (16,720) | | 5,410,483 |
| | | | | | | | | | | | | | | | |
| Financial liabilities relating to third-party interests in capital provision assets | | 704,196 | | — | | | — | | | 513 | | (40) | | | 42,384 | | — | | | 747,053 |
| Total Level 3 liabilities | | 704,196 | | — | | | — | | | 513 | | (40) | | | 42,384 | | — | | | 747,053 |
| | | | | | | | | | | | | | | | | | | | | | | | | | | | | | | | | | | | | | | | | | | | | | | | | | |
| | Year ended December 31, 2023 |
| ($ in thousands) | | Beginning
of period | | Transfers
into Level 3 | | Transfers
between
types | | Deployments | | Realizations | | Income/(loss)
for the
period | | Foreign
exchange
gains/(losses) | | End of
period |
| Single case | | $ | 792,745 | | | $ | — | | | $ | (403) | | | $ | 111,958 | | | $ | (184,998) | | | $ | 215,707 | | | $ | (878) | | | $ | 934,131 | |
| Portfolio | | 2,022,406 | | | — | | | 403 | | | 261,853 | | | (301,610) | | | 893,113 | | | (284) | | | 2,875,881 | |
| Portfolio with equity risk | | 99,406 | | | — | | | — | | | 361 | | | — | | | 42,892 | | | — | | | 142,659 | |
| Legal risk management | | 3,201 | | | — | | | — | | | — | | | (944) | | | 115 | | | 1,151 | | | 3,523 | |
| Joint ventures and equity method investments | | 159,225 | | | — | | | — | | | 5,556 | | | (10,440) | | | 22,007 | | | 2,280 | | | 178,628 | |
| Complex strategies (Strategic Value Fund) | | 12,657 | | | — | | | — | | | — | | | (15,000) | | | 2,343 | | | — | | | — | |
| Core legal finance (BOF-C) | | 526,575 | | | — | | | — | | | 126,164 | | | (66,499) | | | 118,852 | | | — | | | 705,092 | |
| Lower risk legal finance (Advantage Fund) | | 100,596 | | | — | | | — | | | 176,135 | | | (128,802) | | | 37,580 | | | — | | | 185,509 | |
| Total capital provision assets | | 3,716,811 | | | — | | | — | | | 682,027 | | | (708,293) | | | 1,332,609 | | | 2,269 | | | 5,025,423 | |
| Due from settlement of capital provision assets | | 116,582 | | | — | | | — | | | 708,293 | | | (559,362) | | | (1) | | | 28 | | | 265,540 | |
| Total Level 3 assets | | 3,833,393 | | | — | | | — | | | 1,390,320 | | | (1,267,655) | | | 1,332,608 | | | 2,297 | | | 5,290,963 | |
| | | | | | | | | | | | | | | | |
| Financial liabilities relating to third-party interests in capital provision assets | | 425,205 | | | — | | | — | | | 230 | | | (502) | | | 279,263 | | | — | | | 704,196 | |
| Total Level 3 liabilities | | 425,205 | | | — | | | — | | | 230 | | | (502) | | | 279,263 | | | — | | | 704,196 |
All transfers into and out of Level 3 are recognized as if they have taken place as of the beginning of each reporting period. There were no transfers into or out of Level 3 during the years ended December 31, 2024 and 2023.
Key unobservable inputs for Level 3 valuations
The Group’s valuation policy for capital provision assets provides for ranges of percentages to be applied against the risk-adjustment factor to more than 70 discrete objective litigation events across five principal different types of litigation in order to calculate the adjusted risk premium. The range for each event is ten percentage points. The Company typically marks assets at the middle of that range unless there are specific factors that cause the Group’s valuation committee to select a different point in the range and, on an exceptional basis, the Group’s valuation committee may also select a point outside the range. To decide which percentage to apply to a given asset, the Group’s valuation committee considers the kind and degree of legal, procedural or other investment-specific circumstances that may be present. See note 2 (Summary of significant accounting policies—Fair value of financial instruments) to the Group’s consolidated financial statements for additional information with respect to the Group’s valuation approach. The tables below set forth each of the key unobservable inputs used to value the Group’s capital provision assets and the applicable ranges and weighted average by relative fair value for such inputs as of the dates indicated.
| | | | | | | | | | | | | | | | | | | | | | | | | | | | | | | | | | | | | | |
| ($ in thousands) | | December 31, 2024 |
| Type: | | Single case, Portfolio, Joint ventures and equity method investments, Legal risk management, Core legal finance (BOF-C)(1), Financial liabilities relating to third party interests in capital provision assets |
| Principal value technique: | | Discounted cash flow | | | | | | | | |
| Unobservable input: | | Cost | | Unrealized | | Fair value | | Minimum | | Maximum | | Weighted average |
| Discount rate | | | | | | | | 4.8% | | 7.6% | | 6.9% |
Duration(2) (years) | | | | | | | | 0.2 | | 14.0 | | 2.9 |
| Adjusted risk premium | | | | | | | | 0% | | 100.0% | | 31.4% |
| Positive case milestone factor: | | | | | | | | | | | | |
| Significant ruling or other objective event prior to trial court judgment | | $ | 184,540 | | | $ | 109,991 | | | $ | 294,531 | | | 5% | | 50% | | 23% |
| Trial court judgment or tribunal award | | 86,880 | | | 98,453 | | | 185,333 | | | 25% | | 60% | | 54% |
| Appeal judgment | | 61,192 | | | 67,177 | | | 128,369 | | | 69% | | 80% | | 70% |
| Asset freeze | | 2,401 | | | 512 | | | 2,913 | | | 4% | | 4% | | 4% |
| Exhaustion of all appeals | | 78,093 | | | 66,664 | | | 144,757 | | | 100% | | 100% | | 100% |
| Settlement | | 1,911 | | | 4,889 | | | 6,800 | | | 40% | | 80% | | 60% |
| Portfolios with multiple factors | | 555,828 | | | 424,005 | | | 979,833 | | | 0% | | 100% | | 23% |
| Other | | 307 | | | (165) | | | 142 | | | 100% | | 100% | | 100% |
| Negative case milestone factor: | | | | | | | | | | | | |
| Significant ruling or other objective event prior to trial court judgment | | 17,209 | | | (16,343) | | | 866 | | | (50) | % | | (60) | % | | (57) | % |
| Trial court judgment or tribunal award | | 44,973 | | | (24,439) | | | 20,534 | | | (10) | % | | (60) | % | | (57) | % |
| Appeal judgment | | 11,825 | | | (11,506) | | | 319 | | | (80) | % | | (100) | % | | (80) | % |
| Portfolios with multiple factors | | 59,877 | | | (28,404) | | | 31,473 | | | (10) | % | | (60) | % | | (39) | % |
| No case milestone: | | 924,530 | | | 28,112 | | | 952,642 | | | | | | | |
| YPF-related assets: | | 69,576 | | | 1,395,899 | | | 1,465,475 | | | | | | | |
| | 2,099,142 | | | 2,114,845 | | | 4,213,987 | | | | | | | |
| | | | | | | | | | | | |
| Type: | | Lower risk legal finance (Advantage Fund) |
| Principal value technique: | | Discounted cash flow | | | | | | | | |
| Unobservable input: | | Cost | | Unrealized | | Fair value | | Minimum | | Maximum | | Weighted average |
| Discount rate | | 159,816 | | | 29,472 | | | 189,288 | | | 12.1% | | 21.0% | | 17.2% |
Duration(2) (years) | | | | | | | | 0.2 | | 4.0 | | 1.3 |
| | | | | | | | | | | | |
| Type: | | Portfolio with equity risk, Core legal finance (BOF-C)(1) |
| Principal value technique: | | Discounted cash flow | | | | | | | | |
| Unobservable input: | | Cost | | Unrealized | | Fair value | | Minimum | | Maximum | | Weighted average |
| Discount rate | | 45,741 | | | 30,556 | | | 76,297 | | | 14.0% | | 14.0% | | 14.0% |
| Resolution timing (years) | | | | | | | | 0.8 | | 3.8 | | 1.4 |
| Conversion ratio | | | | | | | | 1.0 | | 1.0 | | 1.0 |
| | | | | | | | | | | | |
| Type: | | Due from settlement of capital provision assets |
| Principal value technique: | | Discounted cash flow | | | | | | | | |
| Unobservable input: | | Cost | | Unrealized | | Fair value | | Minimum | | Maximum | | Weighted average |
| Discount rate | | 182,657 | | | 1,201 | | | 183,858 | | | 6.8% | | 6.8% | | 6.8% |
| Collection risk | | | | | | | | 0.0% | | 0.0% | | 0.0% |
| | | | | | | | | | | | |
| Level 3 assets and liabilities, net | | 2,487,356 | | | 2,176,074 | | | 4,663,430 | | | | | | | |
| 1. Includes the proportional participation in these capital provision assets held by BOF-C. |
2. Duration refers to the expected timing of a favorable outcome. See note 2 (Summary of significant accounting policies—Fair value of financial instruments) to the Group’s consolidated financial statements for additional information with respect to the valuation methodology for Level 3 assets. |
|
| | | | | | | | | | | | | | | | | | | | | | | | | | | | | | | | | | | | | | |
| ($ in thousands) | | December 31, 2023 |
| Type: | | Single case, Portfolio, Joint ventures and equity method investments, Legal risk management, Core legal finance (BOF-C)(1), Financial liabilities relating to third party interests in capital provision assets |
| Principal value technique: | | Discounted cash flow | | | | | | | | |
| Unobservable input: | | Cost | | Unrealized | | Fair value | | Minimum | | Maximum | | Weighted average |
| Discount rate | | | | | | | | 5.3% | | 7.3% | | 7.0% |
Duration(2) (years) | | | | | | | | 0.5 | | 7.2 | | 3.4 |
| Adjusted risk premium | | | | | | | | 0.0% | | 100.0% | | 30.2% |
| Positive case milestone factor: | | | | | | | | | | | | |
| Significant ruling or other objective event prior to trial court judgment | | $81,244 | | $50,667 | | $131,911 | | 5% | | 40% | | 23% |
| Trial court judgment or tribunal award | | 130,529 | | 61,175 | | 191,704 | | 25% | | 60% | | 54% |
| Appeal judgment | | 60,402 | | 57,472 | | 117,874 | | 71% | | 80% | | 72% |
| Asset freeze | | 16,621 | | 10,528 | | 27,149 | | 20% | | 20% | | 20% |
| Exhaustion of as-of-right appeals | | 34,318 | | 61,828 | | 96,146 | | 80% | | 80% | | 80% |
| Exhaustion of all appeals | | 76,872 | | 66,039 | | 142,911 | | 100% | | 100% | | 100% |
| Settlement | | 5,877 | | 17,380 | | 23,257 | | 40% | | 80% | | 49% |
| Portfolios with multiple factors | | 498,296 | | 405,078 | | 903,374 | | 1% | | 100% | | 22% |
| Other | | 338 | | (171) | | | 167 | | 100% | | 100% | | 100% |
| Negative case milestone factor: | | | | | | | | | | | | |
| Significant ruling or other objective event prior to trial court judgment | | 34,305 | | (28,057) | | | 6,248 | | (10) | % | | (60) | % | | (43) | % |
| Trial court judgment or tribunal award | | 41,950 | | (23,577) | | | 18,373 | | (10) | % | | (60) | % | | (59) | % |
| Appeal judgment | | 7,989 | | (7,989) | | | — | | | (100) | % | | (100) | % | | (100) | % |
| Portfolios with multiple factors | | 29,636 | | (13,479) | | | 16,157 | | (13) | % | | (60) | % | | (43) | % |
| No case milestone: | | 865,568 | | 55,868 | | 921,436 | | | | | | |
| YPF-related assets: | | 60,338 | | 1,311,319 | | 1,371,657 | | | | | | |
| | 1,944,283 | | 2,024,081 | | 3,968,364 | | | | | | |
| | | | | | | | | | | | |
| Type: | | Lower risk legal finance (Advantage Fund) |
| Principal value technique: | | Discounted cash flow | | | | | | | | |
| Unobservable input: | | Cost | | Unrealized | | Fair value | | Minimum | | Maximum | | Weighted average |
| Discount rate | | 164,259 | | 21,250 | | 185,509 | | 12.4% | | 21.4% | | 17.5% |
Duration(2) (years) | | | | | | | | 1.0 | | 2.7 | | 1.9 |
| | | | | | | | | | | | |
| Type: | | Portfolio with equity risk, Core legal finance (BOF-C)(2) |
| Principal value technique: | | Discounted cash flow | | | | | | | | |
| Unobservable input: | | Cost | | Unrealized | | Fair value | | Minimum | | Maximum | | Weighted average |
| Discount rate | | 123,069 | | 44,285 | | | 167,354 | | 15.0% | | 15.0% | | 15.0% |
| Resolution timing (years) | | | | | | | | 0.8 | | 4.8 | | 1.7 |
| Conversion ratio | | | | | | | | 2.6 | | 2.6 | | 2.6 |
| | | | | | | | | | | | |
| Type: | | Due from settlement of capital provision assets |
| Principal value technique: | | Discounted cash flow | | | | | | | | |
| Unobservable input: | | Cost | | Unrealized | | Fair value | | Minimum | | Maximum | | Weighted average |
| Collection risk | | 265,540 | | — | | | 265,540 | | 0% | | 100% | | 0% |
| | | | | | | | | | | | |
| Level 3 assets and liabilities, net | | 2,497,151 | | 2,089,616 | | 4,586,767 | | | | | | |
| 1. Includes the proportional participation in these capital provision assets held by BOF-C. |
2. Duration refers to the expected timing of a favorable outcome. See note 2 (Summary of significant accounting policies—Fair value of financial instruments) to the Group’s consolidated financial statements contained in this 2024 Form 10-K for additional information with respect to the valuation methodology for Level 3 assets. |
Sensitivity of Level 3 valuations
Following origination, the Group engages in a review of each capital provision asset’s fair value in connection with the preparation of the consolidated financial statements. Should the prices of the Level 3 due from settlement of capital provision assets, capital provision assets and financial liabilities relating to third-party interests in capital provision assets have been 10% higher or lower, while all other variables remained constant, the Group’s consolidated income and net assets would have increased or decreased, respectively, by $466.3 million and $458.7 million as of December 31, 2024 and 2023, respectively (the comparative data as of December 31, 2023, has been amended for immaterial differences).
In addition, as of December 31, 2024 and 2023, should interest rates have been 50 or 100 basis points lower or higher, as applicable, than the actual interest rates used in the fair value estimates, while all other variables remained constant, the Group’s consolidated income and net assets would have increased or decreased, respectively, by the following amounts.
| | | | | | | | | | | | | | |
| | December 31, |
| ($ in thousands) | | 2024 | | 2023 |
| +100 bps interest rates | | $ | (153,241) | | | $ | (161,110) | |
| +50 bps interest rates | | (77,644) | | | (81,745) | |
| -50 bps interest rates | | 78,514 | | 82,724 |
| -100 bps interest rates | | 159,169 | | 167,944 |
Furthermore, as of December 31, 2024 and 2023, should duration have been six or 12 months shorter or longer, as applicable, than the actual durations used in the fair value estimates, while all other variables remained constant, the Group’s consolidated income and net assets would have decreased or increased, respectively, by the following amounts.
| | | | | | | | | | | | | | |
| | December 31, |
| ($ in thousands) | | 2024 | | 2023 |
+12 months duration(1) | | $ | (396,845) | | | $ | (363,901) | |
+6 months duration(1) | | (200,908) | | | (188,718) | |
-6 months duration(1) | | 196,721 | | 203,442 |
-12 months duration(1) | | 405,926 | | 393,248 |
1. Duration refers to the expected timing of a favorable outcome. See note 2 (Summary of significant accounting policies—Fair value of financial instruments) to the Group’s consolidated financial statements contained in this 2024 Form 10-K for additional information with respect to the valuation methodology for Level 3 assets. |
|
The sensitivity impact has been provided on a pre-tax basis for both the Group’s consolidated income and net assets as the Group considers the fluctuation in its effective tax rate from period to period could indicate changes in sensitivity not driven by the valuation that are difficult to follow and detract from the comparability of this information.
Reasonably possible alternative assumptions
The determination of fair value for capital provision assets, due from settlement of capital provision assets and financial liabilities relating to third-party interests in capital provision assets involves significant judgments and estimates. While the potential range of outcomes for the assets is wide, the Group’s fair value estimation is its best assessment of the current fair value of each asset or liability, as applicable. Such estimate is inherently subjective, being based largely on an assessment of how individual events have changed the possible outcomes of the asset or liability, as applicable, and their relative probabilities and hence the extent to which the fair value has altered. The aggregate of the fair values selected falls within a wide range of reasonably possible estimates. In the Group’s opinion, there is no useful alternative valuation that would better quantify the market risk inherent in the portfolio and there are no inputs or variables to which the values of the assets are correlated other than interest rates which impact the discount rates applied.
15. Variable interest entities
Consolidated VIEs
Pursuant to US GAAP consolidation guidance, the Group consolidates certain VIEs for which it is considered the primary beneficiary, either directly or indirectly, through a consolidated entity or affiliate. See note 2 (Summary of significant accounting policies) to the Group’s consolidated financial statements contained in this 2024 Form 10-K for additional information with respect to the Group’s consolidation. Consolidated VIEs include entities relating to the Group’s private funds (e.g., BOF-C, the Advantage Fund and, prior to its liquidation in the fourth quarter of 2023, the Strategic Value Fund), investment vehicles for sale and resale of the participation interests (e.g., Colorado) and acquisition of interests in secured promissory notes (e.g., Mellor Investments LLC, formerly known as Forest Hills Investments LLC).
The purpose of the private funds is to provide strategy-specific investment opportunities for investors in exchange for management-based and performance-based fees. The investment strategies of the private funds differ by product, but the fundamental risks are similar.
Colorado is an exempted company established to receive a portion of the Group’s interest in the YPF-related Petersen claims and provide a vehicle for the sale and resale of the participation interests.
The Group, together with BCIM Partners III, LP and COLP, acquired interest in certain secured promissory notes through Mellor Investments LLC. The secured promissory notes are legal finance investments with proceeds payable out of two underlying litigation matters. This structure provides for the sharing of the economics, interest payments and settlement cash flows among the Group, BCIM Partners III, LP and COLP.
The Group provides revolving credit facilities to certain of its private funds for capital calls as required. These revolving credit facilities are entirely discretionary insofar as the Group is not obligated to fund under the revolving credit facilities. There were no amounts outstanding under the revolving credit facilities as of December 31, 2024 and 2023, respectively.
The table below sets forth assets and liabilities of the consolidated VIEs as of the dates indicated.
| | | | | | | | | | | | | | |
| | December 31, |
| ($ in thousands) | | 2024 | | 2023 |
| Total assets | | $ | 1,833,592 | | | $ | 1,865,344 | |
| Total liabilities | | 8,711 | | | 4,716 | |
The table below sets forth the total revenues and certain information relating to cash flows of the consolidated VIEs for the periods indicated.
| | | | | | | | | | | | | | | | | | | | |
| | Years ended December 31, |
| ($ in thousands) | | 2024 | | 2023 | | 2022 |
| Total revenues | | $ | 141,994 | | $ | 470,216 | | $ | 73,480 |
| | | | | | |
| Cash flows | | | | | | |
| Proceeds | | 369,144 | | 150,775 | | 92,080 |
| (Funding) | | (170,358) | | | (304,348) | | | (291,046) | |
| | | | | | |
| Cash balance as of period end | | 30,828 | | 24,613 | | 32,966 |
Unconsolidated VIEs
The Group’s maximum exposure to loss from the unconsolidated VIEs is the sum of capital provision assets, fee receivables, accrued income and loans to the unconsolidated VIEs.
The table below sets forth the Group’s maximum exposure to loss from the unconsolidated VIEs as of the dates indicated.
| | | | | | | | | | | | | | |
| | December 31, |
| ($ in thousands) | | 2024 | | 2023 |
| On-balance sheet exposure | | $ | 26,603 | | | $ | 22,426 | |
| Off-balance sheet exposure - undrawn commitments | | 4,788 | | | 2,768 | |
| Maximum exposure to loss | | 31,391 | | | 25,194 | |
16. Joint ventures and equity method investments
The Group holds certain of its capital provision assets through joint ventures that are accounted for at fair value through profit or loss. See note 14 (Fair value of assets and liabilities) to the Group’s consolidated financial statements contained in this 2024 Form 10-K for additional information with respect to the Group’s valuation of its capital provision assets. The table below sets forth the fair value of the Group’s interest in joint ventures and equity method investments, which are included in capital provision assets in the Group’s consolidated statements of financial condition as of the dates indicated.
| | | | | | | | | | | | | | |
| | December 31, |
| ($ in thousands) | | 2024 | | 2023 |
| Interest in joint ventures | | $ | 152,347 | | | $ | 172,958 | |
| Interest in equity method investments | | — | | | 468 | |
None of these joint ventures or equity method investments is individually material to the Group, and there are no significant restrictions on the ability of the joint ventures to make cash distributions or repayment of advances to the Group.
The table below sets forth the fair value of the Group’s share of commitments for the joint ventures and equity method investments, which are included in the commitment amounts relating to asset agreements, as of the dates indicated. See note 20 (Financial commitments and contingent liabilities) to the Group’s consolidated financial statements contained in this 2024 Form 10-K for additional information with respect to the Group’s commitments and contingencies. | | | | | | | | | | | | | | |
| | December 31, |
| ($ in thousands) | | 2024 | | 2023 |
| Commitments for joint ventures | | $ | 112,679 | | | $ | 139,753 | |
| Commitments for equity method investments | | 15,248 | | | 15,513 | |
17. Shareholders' equity
Shareholder rights
All the Company’s issued and outstanding ordinary shares are fully paid. Holders of the Company’s ordinary shares do not have conversion or redemption rights. There are no provisions in the Company’s memorandum of incorporation or articles of incorporation discriminating against a shareholder as a result of such shareholder’s ownership of a particular number of the Company’s ordinary shares.
Each holder of the Company’s ordinary shares who is present in person (including any corporation by its duly authorized representative) or by proxy at a general meeting will have one vote on a show of hands and, on a poll, if present in person or by proxy, will have one vote for every ordinary share held by such holder. Ordinary resolutions require approval by a simple majority of the votes at a general meeting at which a quorum is present.
The Board of Directors may provide for classes of shares other than ordinary shares, including series of preferred shares. If any preferred shares are issued, the rights, preferences and privileges of the Company’s
ordinary shares will be subject to, and may be adversely affected by, the rights of holders of the Company’s preferred shares.
The rights attached to any class of shares may be varied only with the consent in writing of the holders of a majority of the issued shares of such class or with the sanction of an ordinary resolution passed by a majority of the votes cast at a separate meeting of the holders of the shares of such class.
If the Company is liquidated, the liquidator may, with the authority of a special resolution, divide among the shareholders, in the form specified, the whole or any part of the Company’s assets. For such purpose, the liquidator may set the value of any assets and determine how the division will be carried out between the shareholders or different classes of shareholders.
The Company’s memorandum of incorporation and articles of incorporation do not impose limitations on the rights of persons to own the Company’s securities, including rights of non-resident or foreign shareholders to hold or exercise voting rights with respect to the Company’s securities.
There are no provisions in the Company’s memorandum of incorporation or articles of incorporation that would have the effect of delaying, deferring or preventing a change in control of the Company and that would operate only with respect to a merger, acquisition or corporate restructuring involving the Company or any of its subsidiaries.
Share repurchases
On July 5, 2023, the Group's shareholders approved a resolution for the purchase of up to 21,895,721 ordinary shares of the Company on the open market, which authority expired as of the close of the Group's annual general meeting held on May 15, 2024. The Group's shareholders approved a new resolution on May 15, 2024 for the purchase of up to 21,864,608 ordinary shares of the Company on the open market, which authority is set to expire the earlier of (i) the close of the Group's annual general meeting to be held in 2025 and (ii) September 26, 2025. As of December 31, 2024, there were 21,845,323 ordinary shares of available authorization remaining.
Dividends
Dividends on the Company’s issued and outstanding ordinary shares are payable at the discretion of the Board of Directors. Each year, once the prior year’s results of operations are known, the Board of Directors reviews the Company’s revenues, net income/(loss), cash generation and cash needs and recommends a dividend level to shareholders for consideration at the Company’s annual general meeting. The Company may declare dividends by ordinary resolution at a general meeting in accordance with the respective rights of any class of shares. No dividend may exceed the amount recommended by the Board of Directors. Subject to the provisions of the Guernsey Companies Law, the Board of Directors may, if it thinks fit, from time to time pay interim dividends if it appears to the Board of Directors they are justified by the assets of the Company. Subject to rights which may attach to any other class of shares, holders of the Company’s ordinary shares are entitled to receive ratably all dividends, if any, that are declared. Dividends may be paid in any currency that the Board of Directors determines. The declaration and payment of dividends and distributions, if any, is subject to the discretion of the Board of Directors and the requirements of Guernsey law (including, among others, satisfaction of a statutory solvency test). The timing and amount of any dividends or distributions declared depends on, among others, the Company’s cash flows from operations and available liquidity, its results of operations and financial condition and any applicable contractual restrictions. Any dividend that has not been claimed after a period of 12 years from the date it became due for payment will, if the Board of Directors so resolves, be forfeited.
The table below sets forth dividends and their respective record dates for the periods indicated.
| | | | | | | | | | | | | | |
| ($ in cents) | | Cash dividend per ordinary share | | Record date |
| 2024 year | | | | |
| First half | | $ | 6.25 | | November 1, 2024 |
| Second half | | 6.25 | | May 23, 2025 |
| Total for the year ended December 31, 2024 | | 12.50 | | |
| | | | |
| 2023 year | | | | |
| First half | | 6.25 | | November 10, 2023 |
| Second half | | 6.25 | | May 24, 2024 |
| Total for the year ended December 31, 2023 | | 12.50 | | |
| | | | |
| 2022 year | | | | |
| First half | | 6.25 | | November 4, 2022 |
| Second half | | 6.25 | | May 26, 2023 |
| Total for the year ended December 31, 2022 | | 12.50 | | |
On February 28, 2025, the Board of Directors has declared, subject to shareholder approval at the annual general meeting to be held on May 14, 2025, a final dividend of 6.25¢ per ordinary share to be paid on June 13, 2025 to shareholders of record on May 23, 2025.
Burford Capital Employee Benefit Trust
The Burford Capital Employee Benefit Trust was established for the purpose of holding the Company’s ordinary shares in connection with the LTIP. It was treated as being controlled by the Group for accounting purposes and, therefore, was consolidated. The Company’s ordinary shares held in the Burford Capital Employee Benefit Trust as of the period end were included in issued and outstanding share capital and were deducted from shareholders’ equity. No gain or loss was recognized on the purchase, sale, cancellation or issue of such ordinary shares and any consideration paid or received was recognized directly in shareholders’ equity. As of December 31, 2024, the Company no longer used the Burford Capital Employee Benefit Trust in connection with administration of the LTIP, and the Burford Capital Employee Benefit Trust was liquidated on May 2, 2024.
Contingent share capital
The acquisition of BCIM Holdings LLC in December 2016 included contingent equity consideration. 2,461,682 ordinary shares will be issued after BCIM Holdings LLC’s private funds contribute more than $100.0 million in performance fee income (and, in certain instances, fee income from new private funds or other capital provision income) to the Group. If the $100.0 million income target is not achieved, no contingent equity consideration will be payable.
18. Share-based and deferred compensation
Share-based awards granted to the employees as compensation consist of RSUs with service-based conditions and PSUs with service-based conditions as well as performance- and/or market-based conditions. All share-based awards are measured based on the grant date fair value of the award. Share-based awards that do not require future service are expensed immediately. Share-based awards subject to service- or performance-based conditions are expensed over the relevant service period to the extent the performance conditions are met or deemed probable to be met. PSUs with service-based and market-based conditions are expensed over the relevant service period regardless of whether the market condition is met.
LTIP
In 2016, the Company’s shareholders approved the LTIP, which was amended and extended by shareholder approval on May 13, 2020. The LTIP creates alignment between participants in the LTIP and public shareholders and creates a long-term retention vehicle. All of the Group’s employees may be granted awards
under the LTIP, and the Group typically makes an initial grant to each new employee and periodic grants thereafter.
The LTIP is administered by the compensation committee of the Board of Directors (the “Compensation Committee”). The Compensation Committee has discretion to select plan participants, determine the type and the number of awards and set the performance targets or adjust them, in certain circumstances; provided that, in the period from 2016 to 2030, awards may not be granted under the LTIP if such grant (together with any other grant made at the same time) would cause the number of ordinary shares that have been issued or could be issued under the LTIP or any other equity-based plan adopted by the Group to exceed 10% of the Company’s issued ordinary share capital at the proposed date of grant.
Awards under the LTIP are granted in the form of share-based awards, which are treated as phantom awards for tax and legal purposes. Both RSU and PSU awards are subject to satisfaction of service-based conditions, requiring that the participant remains employed by the Group through the date of vesting, and PSUs also require satisfaction of performance-based conditions determined by the Compensation Committee at the time of grant, including total shareholder return over different measuring periods. Share-based awards granted prior to January 1, 2021 included both service-based and performance-based conditions. Share-based awards granted on and after January 1, 2021, have continued to have service-based conditions, while at least 50% of share-based awards granted to the Company’s senior management must also have a performance-based condition. Share-based awards generally vest in full on the third anniversary of the grant date (which is the maximum contractual term), and for PSUs, each performance-based condition (as applicable) is measured over the three individual financial years beginning with the financial year in which the relevant PSUs were granted as well as over the entire three financial years as a whole.
In the event of a participant’s termination of employment for any reason prior to vesting, other than death, disability or retirement, all outstanding share-based awards will be forfeited. In the event of the participant’s death, disability, retirement or, in certain circumstances, at the discretion of the Compensation Committee (e.g., good leavers), outstanding share-based awards will continue to be eligible to vest as of the end of the service period and, if applicable, the performance period and may be prorated (other than in the case of retirement) based on the number of full months the participant was employed during the service and, if applicable, performance period. In special circumstances, the Compensation Committee has the discretion to accelerate vesting of awards or alter proration or performance targets for outstanding awards.
Certain awards granted under the LTIP are subject to clawback provisions in accordance with applicable law and pursuant to, and in accordance with, the Company’s clawback policy for incentive-based executive compensation, effective October 2, 2023, which is intended to meet the scope of the SEC Rule 10D-1 and the associated NYSE listing exchange rules. Awards granted under the LTIP are also subject to clawback at the discretion of the Compensation Committee in accordance with the terms of the LTIP for up to five years from the vesting date in the following circumstances: (i) a material financial misstatement or miscalculation of the Group’s audited financial statements; (ii) the assessment of any performance-based condition on vesting which was based on error, misleading information or inaccurate assumptions; or (iii) the gross misconduct of a participant.
During the period since the LTIP’s inception through December 31, 2024, the Group has issued share-based awards in respect of approximately 4.2% of the Company’s issued and outstanding ordinary share capital and, as of December 31, 2024, there was a total of approximately 9.3 million share-based awards issued under the LTIP since its inception. Share-based awards may be satisfied with newly issued ordinary shares, a transfer of treasury shares or ordinary shares purchased on the open market. As of December 31, 2024, approximately 13.8 million ordinary shares remained available for future grants under the LTIP through 2030.
The table below sets forth the grant, vesting and forfeiture of share-based awards for the year ended December 31, 2024, and the number of unvested share-based awards as of the beginning and end of the relevant period.
| | | | | | | | | | | | | | |
| (Ordinary shares in thousands) | | Number of
ordinary
shares | | Weighted average
grant date fair value
per ordinary share |
| Unvested share-based awards as of December 31, 2023 | | 4,672 | | $ | 8.09 |
Granted(1) | | 1,077 | | $ | 14.34 |
Vested(2) | | (1,684) | | $ | 8.66 |
| Forfeited | | (413) | | $ | 8.49 |
| Unvested share-based awards as of December 31, 2024 | | 3,652 | | $ | 9.61 |
1.The aggregate grant date fair value of share-based awards granted during the years ended December 31, 2024, 2023 and 2022 was $15.4 million, $11.9 million and $12.2 million, respectively. The associated weighted average grant date fair value per ordinary share for share-based awards granted during the years ended December 31, 2024, 2023 and 2022, was $14.34, $6.89 and $8.90, respectively.
2.The aggregate fair value of share-based awards that vested during the years ended December 31, 2024, 2023 and 2022, was $14.6 million, $6.9 million and $9.9 million, respectively.
The Group used the Monte-Carlo model to estimate the fair value of PSUs granted during the years ended December 31, 2024, 2023 and 2022. If applicable, the Group would adjust the grant date fair value of PSUs for material nonpublic information existing at the grant date that could affect the fair value of PSUs, consistent with ASC 718 and the SEC staff guidance in SAB 120. The weighted average remaining contractual term of the unvested share-based awards was 1.2 years and 1.3 years as of December 31, 2024 and 2023, respectively. The compensation cost related to the unvested share-based awards not yet recognized was $17.0 million, $15.4 million and $16.5 million as of December 31, 2024, 2023 and 2022, respectively.
The table below separately sets forth the key assumptions used for valuing PSUs as well as share-based awards granted as of the dates indicated.
| | | | | | | | | | | | | | | | | | | | |
| | December 31, |
| | 2024 | | 2023 | | 2022 |
| PSUs | | | | | | |
| Dividend yield | | 0.82% | | 0.72% | | 0.72% |
| Expected volatility | | 25.35% | | 46.70% | | 52.90% |
| Risk-free interest rate | | 4.36% | | 3.67% | | 2.65% |
| Expected term (years) | | 3.0 | | 3.0 | | 3.0 |
| Share-based awards | | | | | | |
| Weighted average fair value per ordinary share ($) | | 14.34 | | 6.89 | | 8.90 |
| Weighted average price per ordinary share ($) | | 15.05 | | 7.19 | | 9.37 |
The expected volatility reflects the assumption that the historical volatility over a period similar to the life of PSUs is indicative of future trends, which may not necessarily be the actual outcome.
NQDC Plan
In 2021, the Group established the NQDC Plan, under which the non-employee directors and a specified group of employees can elect to defer a portion of their compensation until a future date. Participants may elect to defer base salary, bonuses, payments under the “phantom carry pools” program and share-based awards granted under the LTIP. The deferral period is a minimum of three years (five years following grant in the case of share-based awards granted under the LTIP), and deferral distributions may be elected to be received in a lump sum or in annual installments. During the deferral period, the participant elects for their deferral account to be notionally invested in various mutual funds or the Company’s ordinary shares. In addition, the Company may in its sole discretion make a matching contribution to the participant’s deferral account to the extent cash deferrals are notionally invested in the Company’s ordinary shares. The Company’s matching contribution is accounted for as share-based compensation and vests after a two-year service period. Distributions from the NQDC Plan will be made in accordance with the timing and form selected by the individual participant when the deferral is first elected. The NQDC Plan is administered and maintained by an independent third party.
For the years ended December 31, 2024 and 2023, the Group granted 127,193 matching contributions of notional shares at a weighted average grant date fair value of $15.13 per ordinary share and 77,281 matching
contributions of notional shares at a weighted average grant date fair value of $13.14 per ordinary share, respectively. The weighted average remaining contractual term of matched notional shares under the NQDC Plan was 0.6 years and 0.8 years as of December 31, 2024 and 2023, respectively. The compensation cost related to matched notional shares under the NQDC Plan not yet recognized was $1.5 million and $1.0 million as of December 31, 2024 and 2023, respectively. From time to time, we may purchase mutual fund investments or the Company’s ordinary shares to minimize our exposure resulting from the elections of the participants in the NQDC Plan.
The outstanding deferred compensation liability to participants was $24.4 million and $19.4 million as of December 31, 2024 and 2023, respectively. The outstanding deferred compensation liability includes amounts notionally invested in the Company’s ordinary shares from both employee deferrals and matching contributions by the Company.
NED Plan
In 2021, the Group established the NED Plan, under which non-executive directors are eligible to receive grants of the Company’s ordinary shares in connection with their service on the Board of Directors, subject to transfer and sale restrictions until the earlier of (i) the third anniversary of the grant date or (ii) the date on which the director no longer serves as a member of the Board of Directors. Employee directors are not eligible for grants under the NED Plan. For the years ended December 31, 2024, 2023 and 2022, the Group purchased on the open market on AIM 19,285, 17,403 and 23,066, respectively of the Company's ordinary shares to satisfy grants of awards under the NED Plan.
19. Earnings per ordinary share
Basic earnings per ordinary share is computed by dividing net income/(loss) attributable to Burford Capital Limited shareholders by the weighted average number of ordinary shares issued and outstanding during the period. Diluted earnings per ordinary share was computed using the treasury stock method which reflects the assumed conversion of all dilutive securities, including, when applicable, RSUs and PSUs. There were 358,199, 17,631 and 88,330 potential ordinary shares related to the Company’s share-based awards excluded from diluted weighted average ordinary shares for each of the years ended December 31, 2024, 2023 and 2022, respectively, as their inclusion would have had an anti-dilutive effect.
The table below sets forth the computation for basic and diluted net income/(loss) attributable to Burford Capital Limited per ordinary share for the periods indicated.
| | | | | | | | | | | | | | | | | | | | |
| | Years ended December 31, |
| ($ in thousands, except share data) | | 2024 | | 2023 | | 2022 |
| Net income/(loss) attributable to Burford Capital Limited shareholders | | $ | 146,484 | | $ | 610,522 | | $ | 30,506 |
| | | | | | |
| Net income/(loss) attributable to Burford Capital Limited shareholders per ordinary share: | | | | | | |
| Basic | | $0.67 | | | $2.79 | | | $0.14 | |
| Diluted | | $0.66 | | | $2.74 | | | $0.14 | |
| | | | | | |
| Weighted average ordinary shares outstanding: | | | | | | |
| Basic | | 219,231,837 | | 218,865,816 | | 218,757,232 |
| Dilutive effect of share-based awards | | 3,999,835 | | 4,149,074 | | 3,045,254 | |
| Diluted | | 223,231,672 | | 223,014,890 | | 221,802,486 |
20. Financial commitments and contingent liabilities
The table below sets forth the maturity profile of the Group’s financial liabilities based on contractual undiscounted payments as of the date indicated.
| | | | | | | | | | | | | | | | | | | | | | | | | | | | | | | | | | | | | | |
| | December 31, 2024 |
| ($ in thousands) | | Leases | | Debt payable | | Debt interest payable | | Other liabilities | | Long-term incentive
compensation payable | | Financial liabilities relating to third-party
interests in capital provision assets |
| 2025 | | $ | 3,011 | | | $ | 129,432 | | | $ | 131,078 | | | $ | 83,822 | | | $ | — | | | $ | — | |
| 2026 | | 2,913 | | | 219,258 | | | 123,150 | | | 8,611 | | | — | | | — | |
| 2027 | | 1,862 | | | — | | | 112,188 | | | 4,761 | | | — | | | — | |
| 2028 | | 1,743 | | | 400,000 | | | 99,688 | | | 5,506 | | | — | | | — | |
| 2029 | | 1,751 | | | — | | | 87,188 | | | 804 | | | — | | | — | |
| Thereafter | | 4,137 | | | 1,035,000 | | | 137,250 | | | 1,657 | | | — | | | — | |
| No contractual maturity date | | — | | | — | | | — | | | — | | | 217,552 | | | 747,053 | |
| Total undiscounted cash flows | | 15,417 | | | 1,783,690 | | | 690,542 | | | 105,161 | | | 217,552 | | | 747,053 | |
| Lease present value adjustment | | (596) | | | | | | | | | | | |
| Lease liabilities | | 14,821 | | | | | | | | | | | |
Commitments to financing arrangements
As a normal part of its business, the Group routinely enters into financing agreements that may require the Group to provide continuing financing over time, whereas other financing agreements provide for immediate financing of the total commitment. The terms of the former type of financing agreements vary widely—e.g., in cases of discretionary commitments, the Group is not contractually obligated to advance capital and generally would not suffer adverse financial consequences from not doing so and, therefore, has broad discretion as to each incremental financing of a continuing capital provision asset, while in cases of definitive commitments, the Group is contractually obligated to advance incremental capital and failure to do so would typically result in adverse contractual consequences (such as a dilution in the Group’s returns or the loss of the Group’s deployed capital in a case).
The Group’s commitments are capped at a fixed amount in its financing agreements. In addition, as of December 31, 2024 and 2023, the Group had exposure to assets where the Group provided some form of legal risk arrangement pursuant to which the Group does not generally expect to deploy the full committed capital unless there is a failure of the claim, such as providing an indemnity for adverse legal costs. The table below sets forth the components of undrawn commitments as of the dates indicated (assuming the GBP/USD exchange rate of $1.2529 and $1.2747 as of December 31, 2024 and 2023, respectively).
| | | | | | | | | | | | | | |
| | December 31, |
| ($ in thousands) | | 2024 | | 2023 |
| Definitive | | $ | 962,808 | | $ | 839,973 |
| Discretionary | | 1,032,433 | | 977,733 |
| Legal risk (definitive) | | 41,318 | | 55,583 |
| Total capital provision undrawn commitments | | 2,036,559 | | 1,873,289 |
Leases
Leases consist primarily of the Group’s leased office space in (i) New York, New York, United States, (ii) Chicago, Illinois, United States, (iii) London, United Kingdom, (iv) Dubai, United Arab Emirates and (v) Singapore, Singapore, which the Group has determined to be operating leases under US GAAP.
The table below sets forth the components of lease costs for the periods indicated.
| | | | | | | | | | | | | | | | | | | | |
| | Years ended December 31, |
| ($ in thousands) | | 2024 | | 2023 | | 2022 |
| Operating lease cost | | $ | 2,678 | | | $ | 2,729 | | | $ | 2,280 | |
| Cash paid for amounts included in the measurement of operating lease liabilities | | 2,564 | | | 2,175 | | | 2,384 | |
The table below sets forth right-of-use assets, lease liabilities, weighted average remaining lease term and weighted average discount rate for the operating leases as of the dates indicated.
| | | | | | | | | | | | | | |
| | December 31, |
| ($ in thousands) | | 2024 | | 2023 |
| Right-of-use assets | | $ | 12,796 | | $ | 13,851 |
| Operating lease liabilities | | 14,821 | | 15,853 |
| Weighted average remaining lease term (years) | | 6.7 | | 7.8 |
| Weighted average discount rate | | 6.6% | | 6.7% |
The Group’s leases have remaining lease terms of up to approximately 8 years. None of these leases have options to extend. One of these leases has an option for early termination which, if exercised, would shorten the remaining lease term by up to 3 years. The Group does not currently intend to early terminate this lease.
Legal proceedings
From time to time, the Group may be involved in various legal (including judicial, regulatory, administrative or arbitration) proceedings, lawsuits and claims incidental to the conduct of its business. Some of these proceedings, lawsuits or claims may be material and involve highly complex issues that are subject to substantial uncertainties and could result in damages, fines, penalties, non-monetary sanctions or relief. In addition, the Group’s business and operations are subject to extensive regulation, which may result in regulatory proceedings against the Group.
At the date of this 2024 Form 10-K, having considered the legal merits of any relevant proceedings, lawsuits or claims and having received relevant legal advice (including any legal advice from outside counsel), the Group considers there to be no material contingent liability in respect of any such proceedings, lawsuits or claims requiring disclosure in the Group’s consolidated financial statements. However, given the potentially large and/or indeterminate relief that may be sought and the inherent unpredictability of legal proceedings, lawsuits or claims, it is possible that an adverse outcome in certain matters could have a material adverse effect on the Group’s business, financial condition, results of operations or liquidity in any future period. In addition, there can be no assurance that material losses will not be incurred from claims that have not yet been asserted or those where potential losses have not yet been determined to be probable or possible and reasonably estimable.
21. Related party transactions
The Group has interests in joint ventures and equity method investments. See note 16 (Joint ventures and equity method investments) to the Group’s consolidated financial statements contained in this 2024 Form 10-K for additional information with respect to the balances held with joint ventures and equity method investments. The table below sets forth the fundings and proceeds from joint ventures and equity method investments for the periods indicated.
| | | | | | | | | | | | | | | | | | | | |
| | Years ended December 31, |
| ($ in thousands) | | 2024 | | 2023 | | 2022 |
| Fundings of joint ventures and equity method investments | | $ | 9,717 | | $ | 9,285 | | $ | 7,864 |
| Proceeds from joint ventures and equity method investments | | 7,164 | | 16,141 | | 5,917 |
22. Credit risk from financial instruments
The Group is exposed to credit risk in various asset structures that are set forth in note 2 (Summary of significant accounting policies) to the Group’s consolidated financial statements contained in this 2024 Form 10-K, most of which involve financing sums recoverable only out of successful capital provision assets with a concomitant risk of loss of deployed cost. Upon becoming contractually entitled to proceeds, depending on the structure of the particular capital provision asset, the Group could be a creditor of, and subject to direct or indirect credit risk from, a claimant, a defendant and/or other parties, or a combination thereof. Moreover, the Group may be indirectly subject to credit risk to the extent a defendant does not pay a claimant immediately, notwithstanding successful adjudication of a claim in the claimant’s favor. The Group’s credit risk is uncertain given that its entitlement pursuant to its assets is generally not established until a successful resolution of claims, and its potential credit risk is mitigated by the parties and indirect creditors, and due to a judgment creditor (in contrast to a conventional debtholder and in the absence of an actual bankruptcy of the counterparty) having immediate and unfettered rights of action to, for example, seize assets and garnish cash flows. The Group is also exposed to credit risk in respect of the cash and cash equivalents and marketable securities. The credit risk of the cash and cash equivalents is mitigated as all cash is placed with reputable banks with a sound credit rating. Marketable securities primarily consist of government securities, investment grade corporate bonds, asset-backed securities and mutual funds, all of which can be redeemed on short notice or be sold on an active trading market. The maximum credit risk exposure represented by cash, cash equivalents, marketable securities, due from settlement of capital provision assets and capital provision assets is specified in the consolidated statements of financial condition.
In addition, the Group is exposed to credit risk on financial assets and receivables in other assets, all of which are held at amortized cost. The maximum credit exposure for such amounts was the carrying value of $17.1 million and $17.8 million as of December 31, 2024 and 2023, respectively. The Group reviews the lifetime expected credit loss based on historical collection performance, the specific provisions of any settlement agreement and a forward-looking assessment of macroeconomic factors. Based on this review, the Group has not identified any material expected credit loss relating to the financial assets held at amortized cost. The Group recognized no impairment for the years ended December 31, 2024, 2023 and 2022.
The Group is not exposed to concentration of credit risk from a particular region or customer.
23. Subsequent events
There have been no events since December 31, 2024 to the date of this 2024 Form 10-K that require recognition or disclosure in the consolidated financial statements.
Item 9. Changes in and disagreements with accountants on accounting and financial disclosure
On July 1, 2024, the Audit Committee approved, and the Board of Directors ratified, the dismissal of Ernst & Young LLP as our independent registered public accounting firm, effective immediately following the issuance of our condensed consolidated financial statements for the three and six months ended June 30, 2024. In addition, on and effective as of July 1, 2024, the Audit Committee approved, and the Board of Directors ratified, the appointment of KPMG LLP as our independent registered public accounting firm for the three and nine months ended September 30, 2024, and for the fiscal year ended December 31, 2024.
See our report on Form 6-K furnished to the SEC on July 9, 2024, for additional information with respect to the change in accountants.
Item 9A. Controls and procedures
Evaluation of disclosure controls and procedures
We maintain disclosure controls and procedures, as defined in Rules 13a-15(e) and 15d-15(e) under the Exchange Act, that are designed to ensure that the information required to be disclosed in the reports we file or furnish under the Exchange Act is recorded, processed, summarized and reported within the time periods specified in the SEC’s rules and forms and that such information is accumulated and communicated to management, including our Chief Executive Officer and Chief Financial Officer, as appropriate, to allow timely decisions regarding required disclosure.
In designing and evaluating our disclosure controls and procedures, our management necessarily is required to apply its judgment. The design of our disclosure controls and procedures also is based in part upon certain assumptions about the likelihood of future events, and there can be no assurance that any design will succeed in achieving its stated goals under all potential future conditions. Thus, in designing and evaluating our disclosure controls and procedures, our management, including our Chief Executive Officer and Chief Financial Officer, recognizes that any controls and procedures, no matter how well designed and operated, can provide only reasonable, not absolute, assurance of achieving the desired objectives of the disclosure controls and procedures.
Our management, with the participation of our Chief Executive Officer and Chief Financial Officer, has evaluated the effectiveness of our disclosure controls and procedures pursuant to Rule 13a-15(b) under the Exchange Act as of December 31, 2024. Based on such evaluation, including third-party input from industry professionals, our Chief Executive Officer and Chief Financial Officer have concluded that, as of December 31, 2024, we have not yet fully remediated the material weakness previously disclosed in our 2023 Form 20-F relating to a lack of available evidence to demonstrate the precision of management’s review of the controls to determine certain assumptions used in the measurement of the fair value of capital provision assets and thus our disclosure controls and procedures were not effective. This material weakness did not result in misstatements to our consolidated financial statements for any of the periods presented. As outlined below, as of December 31, 2024, certain remediation measures were implemented and operating but were not in place for a sufficient amount of time for the material weakness to be considered remediated. See “—Management’s annual report on internal control over financial reporting” for additional information with respect to such material weakness.
Management’s annual report on internal control over financial reporting
Our management is responsible for establishing and maintaining adequate internal control over financial reporting. Internal control over financial reporting, as defined in Rules 13a-15(f) and 15d-15(f) under the Exchange Act, is a process designed by, or under the supervision of, a company’s principal executive officer and principal financial officer to provide reasonable assurance regarding the reliability of financial reporting and the preparation of consolidated financial statements for external purposes in accordance with generally accepted accounting principles and includes those policies and procedures that:
▪Pertain to the maintenance of records that in reasonable detail, accurately and fairly reflect the transactions and dispositions of the assets of the company
▪Provide reasonable assurance that transactions are recorded as necessary to permit preparation of financial statements in accordance with generally accepted accounting principles, and that receipts
and expenditures of the company are being made only in accordance with authorizations of management and directors of the company
▪Provide reasonable assurance regarding prevention or timely detection of unauthorized acquisition, use or disposition of the company’s assets that could have a material effect on the financial statements
Because of its inherent limitations, internal control over financial reporting may not prevent or detect misstatements. In addition, projections of any evaluation of effectiveness to future periods are subject to the risk that controls may become inadequate because of changes in conditions or that the degree of compliance with the policies or procedures may deteriorate.
Our management conducted an assessment of the effectiveness of our internal control over financial reporting as of December 31, 2024. In conducting this assessment, our management used the criteria set forth by the Committee of Sponsoring Organizations of the Treadway Commission in Internal Control—Integrated Framework (2013). Based on such assessment, including third-party input from industry professionals, our management has concluded that, as of December 31, 2024, we have not yet fully remediated the material weakness previously disclosed in our 2023 Form 20-F relating to a lack of available evidence to demonstrate the precision of management’s review of the controls to determine certain assumptions used in the measurement of the fair value of capital provision assets and thus the Company’s internal control over financial reporting was not effective. This ongoing material weakness did not result in misstatements to our consolidated financial statements for any of the periods presented.
Remediation efforts to address the material weakness
The aforementioned material weakness was previously disclosed in our 2023 Form 20-F. While the Company has improved its policies and procedures with respect to evidencing the precision of management’s review of the controls to determine certain assumptions used in the measurement of the fair value of capital provision assets, the material weakness will not be considered remediated until management designs and implements controls that operate for a sufficient period of time and management has concluded, through testing, that these controls are operating effectively. Accordingly, the Company will continue to assess its remediation measures during the year ending December 31, 2025, to confirm effective remediation of the identified material weakness.
During the year ended December 31, 2024, management engaged in implementing the following remedial actions:
•Adopted new policies relating to the precision of management’s review controls
•Implemented new procedures to retain documentary evidence of the operation of that review in accordance with the new policies
•Provided training and guidance to the control operators on the new policies and procedures to enhance the evidence of management review
The remediation steps we are implementing are subject to ongoing management review and Audit Committee oversight to ensure they remain in place and continue to operate in order to be deemed effective.
Attestation report of independent registered public accounting firm
KPMG LLP, our independent registered public accounting firm that audited our consolidated financial statements included in this 2024 Form 10-K, has issued its attestation report included in this 2024 Form 10-K on the effectiveness of our internal control over financial reporting.
Changes in internal control over financial reporting
Other than with respect to the material weakness referenced above, there were no changes in our internal control over financial reporting, as defined in Rules 13a-15(f) and 15d-15(f) under the Exchange Act, during the year ended December 31, 2024 that have materially affected, or are reasonably likely to materially affect, our internal control over financial reporting.
Item 9B. Other information
No “Rule 10b5-1 trading arrangements” or “non-Rule 10b5-1 trading arrangements” (each, as defined by Item 408(a) and Item 408(c), respectively, of Regulation S-K) were adopted, modified or terminated by our
directors or officers (as defined in Rule 16a-1(f) of the Exchange Act) during the three months ended December 31, 2024.
The information required for insider trading policies and procedures (as defined by Item 408(b) of Regulation S-K) is incorporated herein by reference to the definitive proxy statement relating to the annual general meeting of shareholders to be held in 2025, which definitive proxy statement shall be filed with the US Securities and Exchange Commission within 120 days of December 31, 2024 (the “2025 Proxy Statement”).
Item 9C. Disclosure regarding foreign jurisdictions that prevent inspections
None.
Part III
Item 10. Directors, executive officers and corporate governance
The information required by this Item 10 is incorporated herein by reference to the 2025 Proxy Statement.
Item 11. Executive compensation
The information required by this Item 11 is incorporated herein by reference to the 2025 Proxy Statement.
Item 12. Security ownership of certain beneficial owners and management and related stockholder matters
The table below sets forth information with respect to our equity compensation plans as of December 31, 2024.
| | | | | | | | | | | | | | | | | | | | |
| Plan category | | Number of securities to be issued upon exercise of outstanding options, warrants and rights
(a) | | Weighted-average exercise price of outstanding options, warrants and rights(2) (b) | | Number of securities remaining available for future issuance under equity compensation plans (excluding securities reflected in column (a))(3) (c) |
Equity compensation plans approved by security holders(1) | | | | | | |
| LTIP | | | | | | |
| RSUs | | 2,814,140 | | | N/A | | |
PSUs(4) | | 837,675 | | | N/A | | |
| Total LTIP | | 3,651,815 | | | N/A | | 13,780,081 | |
| NED Plan | | — | | | N/A | | 176,459 | |
Equity compensation plans not approved by security holders(5) | | 1,912,473 | | | N/A | | — | |
| Total | | 5,564,288 | | | N/A | | 13,956,540 | |
| 1. Reflects the aggregate number of outstanding securities as of December 31, 2024 granted under (i) the LTIP, which was approved by our shareholders at the annual general meeting on May 13, 2020 and (ii) the NED Plan, which was approved by our shareholders at the annual general meeting on May 18, 2021. |
| 2. The securities included in column (a) do not have an exercise price. |
3. See note 18 (Share-based and deferred compensation) to our consolidated financial statements contained in this 2024 Form 10-K for information related to the LTIP, the NED Plan and the NQDC Plan. |
| 4. The numbers included for PSUs in column (a) reflect the maximum payout upon satisfaction of certain conditions. |
5. The amount shown includes 733,904 ordinary shares held as notional investments by participants, 140,074 vested and 204,474 unvested notional shares related to our matching contribution and 834,021 vested share-based awards, all of which have been deferred under our NQDC Plan. See note 18 (Share-based and deferred compensation) to our consolidated financial statements contained in this 2024 Form 10-K for additional information of our NQDC Plan. |
The remaining information required by this Item 12 is incorporated herein by reference to the 2025 Proxy
Statement.
Item 13. Certain relationships and related transactions, and director independence
The information required by this Item 13 is incorporated herein by reference to the 2025 Proxy Statement.
Item 14. Principal accounting fees and services
The information required by this Item 14 is incorporated herein by reference to the 2025 Proxy Statement.
Part IV
Item 15. Exhibits and financial statement schedules
(a)(1) Financial statements
The consolidated financial statements are provided under Part II, Item 8. “Financial statements and supplementary data” of this 2024 Form 10-K.
(a)(2) Financial statement schedules
No financial statement schedules are provided because the information called for is not applicable or not required or is included in the consolidated financial statements or the notes thereto provided under Part II, Item 8. “Financial statements and supplementary data” of this 2024 Form 10-K.
(a)(3) Exhibits
The information required by this Item is set forth below.
| | | | | |
Exhibit
No. | Description |
| 3.1 | |
|
| 3.2* | |
| 4.1* | |
| 4.2 | |
| 4.3 | |
| 4.4 | Indenture, dated as of April 5, 2021, by and among Burford Capital Global Finance LLC, as issuer, Burford Capital Limited, as parent guarantor, the other guarantors party thereto from time to time and U.S. Bank Trust Company, National Association, as successor to U.S. Bank National Association, as trustee (incorporated by reference to Exhibit 99.1 to the Report on Form 6-K of Burford Capital Limited (File No. 001-39511) as filed with the SEC on April 6, 2021). |
| 4.5 | Indenture, dated as of April 11, 2022, by and among Burford Capital Global Finance LLC, as issuer, Burford Capital Limited, as parent guarantor, the other guarantors party thereto from time to time and U.S. Bank Trust Company, National Association, as trustee (incorporated by reference to Exhibit 99.1 to the Report on Form 6-K of Burford Capital Limited (File No. 001-39511) as filed with the SEC on April 12, 2022). |
| 4.6 | Indenture, dated as of June 26, 2023, by and among Burford Capital Global Finance LLC, as issuer, Burford Capital Limited, as parent guarantor, the other guarantors party thereto from time to time and U.S. Bank Trust Company, National Association, as trustee (incorporated by reference to Exhibit 99.1 to the Report on Form 6-K of Burford Capital Limited (File No. 001-39511) as filed with the SEC on June 26, 2023). |
10.1‡ | |
10.2*‡ | |
10.3*‡ | |
10.4*‡ | |
10.5*‡ | |
10.6*‡ | |
| | | | | |
Exhibit
No. | Description |
10.7‡ | |
10.8*‡ | |
10.9*‡ | |
10.10*‡ | |
10.11*‡ | |
10.12*‡ | |
10.13*‡ | |
10.14*‡ | |
10.15*‡ | |
10.16*‡ | |
10.17*‡ | |
| 19.1* | |
| 21.1* | |
| 23.1* | |
| 23.2* | |
| 31.1* | |
| 31.2* | |
| 32.1** | |
| 32.2** | |
| 97.1 | |
| 101.INS* | XBRL Instance Document - the instance document does not appear in the Interactive Data File because its XBRL tags are embedded within the Inline XBRL document. |
| 101.SCH* | XBRL Taxonomy Extension Schema Document. |
| 101.CAL* | XBRL Taxonomy Extension Calculation Linkbase Document. |
| 101.LAB* | XBRL Taxonomy Extension Label Linkbase Document. |
| 101.PRE* | XBRL Taxonomy Extension Presentation Linkbase Document. |
| 101.DEF* | XBRL Taxonomy Extension Definition Linkbase Document. |
| 104* | Cover Page Interactive Data File (formatted as Inline XBRL and contained in Exhibit 101). |
| * | Filed herewith. |
| ** | Furnished herewith. |
| ‡ | Management contract or compensatory plan or arrangement in which executive officers or directors are eligible to participate. |
The agreements and other documents filed as exhibits to this 2024 Form 10-K are not intended to provide factual information or other disclosures other than with respect to the terms of the agreements or other documents themselves, and you should not rely on them for that purpose. In particular, any representations and warranties made by us in these agreements or other documents were made solely within the specific
context of the relevant agreement or document and may not describe the actual state of affairs as of the date they were made or at any other time.
Item 16. Form 10-K summary
None.
Signatures
Pursuant to the requirements of Section 13 or 15(d) of the Exchange Act, the registrant has duly caused this Annual Report on Form 10-K to be signed on its behalf by the undersigned, thereunto duly authorized.
| | | | | | | | | | | |
| BURFORD CAPITAL LIMITED |
| | | |
| | By: | /s/ Jordan D. Licht |
| | | Name: Jordan D. Licht |
| | | Title: Principal Financial Officer |
| | | |
| | | |
| Dated: March 3, 2025 | | | |
Pursuant to the requirements of the Exchange Act, this Annual Report on Form 10-K has been signed below by the following persons on behalf of the registrant and in the capacities and on the dates indicated.
| | | | | | | | | | | | | | |
| Signature | | Title | | Date |
| | | | |
| /s/ Christopher P. Bogart | | Principal Executive Officer and Director | | March 3, 2025 |
| Christopher P. Bogart | | | | |
| | | | |
| /s/ Jordan D. Licht | | Principal Financial Officer | | March 3, 2025 |
| Jordan D. Licht | | | | |
| | | | |
| /s/ Charles E. Utley | | Principal Accounting Officer | | March 3, 2025 |
| Charles E. Utley | | | | |
| | | | |
| /s/ John Sievwright | | Chair of the Board of Directors | | March 3, 2025 |
| John Sievwright | | | | |
| | | | |
| /s/ Christopher Halmy | | Vice Chair of the Board of Directors | | March 3, 2025 |
| Christopher Halmy | | | | |
| | | | |
| /s/ Rukia Baruti Dames | | Director | | March 3, 2025 |
| Rukia Baruti Dames | | | | |
| | | | |
| /s/ Pamela Corrie | | Director | | March 3, 2025 |
| Pamela Corrie | | | | |
| | | | |
| /s/ Robert Gillespie | | Director | | March 3, 2025 |
| Robert Gillespie | | | | |