UNITED STATES SECURITIES AND EXCHANGE COMMISSION
Washington, D.C. 20549
____________
Form 10-K
| [X] | ANNUAL REPORT PURSUANT TO SECTION 13 OR 15(d) OF THE SECURITIES EXCHANGE ACT OF 1934 | ||||
For the fiscal year ended December 31, 2018
or
| [ ] | TRANSITION REPORT PURSUANT TO SECTION 13 OR 15(d) OF THE SECURITIES EXCHANGE ACT OF 1934 | ||||
For the transition period from _____to_____
Commission file number: 000-55864

Kinder Morgan Canada Limited
(Exact name of registrant as specified in its charter)
| Alberta, Canada | N/A | |||||||
(State or other jurisdiction of incorporation or organization) | (I.R.S. Employer Identification No.) | |||||||
Suite 3000, 300 - 5th Avenue S.W. Calgary, Alberta T2P 5J2
(Address of principal executive offices) (zip code)
Registrant’s telephone number, including area code: 403-514-6780
____________
Securities registered pursuant to Section 12(b) of the Act: None
Securities registered pursuant to Section 12(g) of the Act: Restricted Voting Shares
Indicate by check mark if the registrant is a well-known seasoned issuer, as defined in Rule 405 of the Securities Act of 1933. Yes o No þ
Indicate by check mark if the registrant is not required to file reports pursuant to Section 13 or Section 15(d) of the Securities Exchange Act of 1934.
Yes o No þ
Indicate by check mark whether the registrant (1) has filed all reports required to be filed by Section 13 or 15(d) of the Securities Exchange Act of 1934 during the preceding 12 months (or for such shorter period that the registrant was required to file such reports), and (2) has been subject to such filing requirements for the past 90 days. Yes þ o No o
Indicate by check mark whether the registrant has submitted electronically and posted on its corporate Website, if any, every Interactive Data File required to be submitted and posted pursuant to Rule 405 of Regulation S-T (§232.405 of this chapter) during the preceding 12 months (or for such shorter period that the registrant was required to submit and post such files). Yes þ No o
Indicate by check mark if disclosure of delinquent filers pursuant to Item 405 of Regulation S-K (§229.405 of this chapter) is not contained herein, and will not be contained, to the best of registrant’s knowledge, in definitive proxy or information statements incorporated by reference in Part III of this Form 10-K or any amendment to this Form 10-K. o
Indicate by check mark whether the registrant is a large accelerated filer, an accelerated filer, a non-accelerated filer, a smaller reporting company or an emerging growth company. See the definitions of “large accelerated filer,” “accelerated filer,” “smaller reporting company,” and “emerging growth company” (in Rule 12b-2 of the Exchange Act).
Large accelerated filer o Accelerated filer o Non-accelerated filer þ Smaller reporting company o Emerging growth company þ
If an emerging growth company, indicate by check mark if the registrant has elected not to use the extended transition period for complying with any new or revised financial accounting standards provided pursuant to Section 13(a) of the Exchange Act. þ
Indicate by check mark whether the registrant is a shell company (as defined in Rule 12b-2 of the Securities Exchange Act of 1934). Yes o No þ
Aggregate market value of the voting and non-voting common equity held by non-affiliates of the registrant, based on closing prices in the daily composite list for transactions on the Toronto Stock Exchange on June 29, 2018 was approximately CAD$1,653,298,600. As of February 15, 2019, the registrant had 34,944,993 Restricted Voting Shares and 81,353,820 Special Voting Shares outstanding.
DOCUMENTS INCORPORATED BY REFERENCE
Portions of the Registrant’s definitive proxy statement for the 2019 Annual Meeting of Stockholders, which shall be filed no later than April 30, 2019, are incorporated into PART III, as specifically set forth in PART III.
KINDER MORGAN CANADA LIMITED
TABLE OF CONTENTS
Page Number | ||||||||
KINDER MORGAN CANADA LIMITED
TABLE OF CONTENTS
EXPLANATORY NOTE
Capitalized terms used throughout this document are defined in the “Glossary” below. References to “we,” “us,” “our” and the “Company” are to Kinder Morgan Canada Limited and its majority-owned and/or controlled subsidiaries. We state our financial statements in Canadian dollars. References in this document to “dollars,” “$” or “CAD$” are to the currency of Canada, and references to “U.S.$” or “U.S. dollar” are to the currency of the U.S.
| GLOSSARY | |||||||||||||||||
| Company Abbreviations | |||||||||||||||||
| Class A Units | = | the Class A limited partnership units of the Limited Partnership | |||||||||||||||
| Class B Units | = | the Class B limited partnership units of the Limited Partnership | |||||||||||||||
| Cochin | = | U.S. and Canadian Cochin pipeline system | |||||||||||||||
Cooperation Agreement | = | the cooperation agreement, between the Company, the General Partner, the Limited Partnership, KMCC, KMCT and Kinder Morgan (in respect to certain provisions only) entered into in connection with the IPO | |||||||||||||||
| General Partner | = | Kinder Morgan Canada GP Inc. | |||||||||||||||
| IPO | = | Initial Public Offering of KML’s Restricted Voting Shares in May 2017 | |||||||||||||||
| Jet Fuel | = | Jet Fuel pipeline system | |||||||||||||||
| KMCC | = | Kinder Morgan Canada Company | |||||||||||||||
| KMCI | = | Kinder Morgan Canada Inc. | |||||||||||||||
| KMCSI | = | Kinder Morgan Canada Services Inc. | |||||||||||||||
| KMCT | = | Kinder Morgan Canada Terminals ULC | |||||||||||||||
| KMCU | = | Kinder Morgan Cochin ULC | |||||||||||||||
| KML | = | Kinder Morgan Canada Limited and its majority-owned and/or controlled subsidiaries | |||||||||||||||
| Kinder Morgan or KMI | = | Kinder Morgan, Inc. | |||||||||||||||
Kinder Morgan Canada Group | = | collectively, the Company, the General Partner, the Limited Partnership, and each person that any of the Company, the General Partner or the Limited Partnership controls from time to time | |||||||||||||||
| Kinder Morgan Group | = | Kinder Morgan and each person that Kinder Morgan directly or indirectly controls from time to time, other than any member of the Kinder Morgan Canada Group | |||||||||||||||
| Limited Partnership | = | Kinder Morgan Canada Limited Partnership | |||||||||||||||
| Limited Partnership Agreement | = | the limited partnership agreement of the Limited Partnership, as amended from time to time | |||||||||||||||
| LP Units | = | collectively, the Class A Units and the Class B Units | |||||||||||||||
| Preferred LP Units | = | the preferred limited partnership units in the Limited Partnership | |||||||||||||||
| Preferred Shares | = | collectively all outstanding preferred shares in the capital of KML | |||||||||||||||
| Puget Sound | = | Puget Sound pipeline system | |||||||||||||||
| Restricted Voting Shares | = | the restricted voting shares in the capital of KML | |||||||||||||||
| Series 1 Preferred Shares | = | the 12,000,000 cumulative redeemable minimum rate reset Preferred Shares, Series 1 in the capital of KML | |||||||||||||||
| Series 3 Preferred Shares | = | the 10,000,000 cumulative redeemable minimum rate reset Preferred Shares, Series 3 in the capital of KML | |||||||||||||||
| Special Voting Shares | = | the special voting shares in the capital of KML | |||||||||||||||
| TMEP | = | Trans Mountain Expansion Project | |||||||||||||||
| TMPL | = | Trans Mountain pipeline system | |||||||||||||||
| Trans Mountain Asset Group | = | the assets sold; collectively, TMPL, along with its associated Puget Sound, the TMEP, and KMCI (the Canadian employer of the staff that operates those businesses sold) | |||||||||||||||
| Trans Mountain | = | Trans Mountain Pipeline ULC | |||||||||||||||
| Common Industry and Other Terms | |||||||||||||||||
| /d | = | per day | |||||||||||||||
| Adjusted EBITDA | = | adjusted earnings before interest expense, taxes, depreciation and amortization | |||||||||||||||
| B.C. | = | the Province of British Columbia | |||||||||||||||
| BCUC | = | British Columbia Utilities Commission | |||||||||||||||
| bpd | = | barrels per day | |||||||||||||||
1
| BC OGC | = | British Columbia Oil and Gas Commission | |||||||||
| DCF | = | distributable cash flow | |||||||||
| D&A | = | depreciation and amortization | |||||||||
| EBDA | = | earnings before depreciation and amortization expenses | |||||||||
| FASB | = | Financial Accounting Standards Board | |||||||||
| FERC | = | Federal Energy Regulatory Commission | |||||||||
| GAAP or U.S. GAAP | = | United States Generally Accepted Accounting Principles | |||||||||
| MBbl | = | thousand barrels | |||||||||
| MMBbl | = | million barrels | |||||||||
| MMtonnes | = | million metric tonnes | |||||||||
| NEB | = | National Energy Board | |||||||||
| SEC | = | United States Securities and Exchange Commission | |||||||||
| TSX | = | Toronto Stock Exchange | |||||||||
| U.S. | = | United States of America | |||||||||
2
Information Regarding Forward-Looking Statements
This report includes forward-looking statements. These forward-looking statements are identified as any statement that does not relate strictly to historical or current facts. They use words such as “anticipate,” “believe,” “intend,” “plan,” “projection,” “forecast,” “strategy,” “position,” “continue,” “estimate,” “expect,” “may,” or the negative of those terms or other variations of them or comparable terminology. In particular, expressed or implied statements concerning future actions, conditions or events, future operating results or the ability to generate sales, income or cash flow or to pay dividends are forward-looking statements. In particular, but without limitation, this document contains forward-looking statements pertaining to the following:
• expectations regarding our ability to generate certain targeted Adjusted EBITDA and DCF and to declare and pay dividends, including amounts thereof;
•the future commercial viability of our business;
•expectations regarding expansion projects, including our ability to complete such projects, anticipated costs, scheduling and in-service dates, future benefits and utilization, anticipated project returns and the impacts of such projects;
•the realization of benefits deriving from future growth projects;
•the potential growth opportunities and anticipated competitive position of our business segments;
•the anticipated results of our pipeline tolls and toll structure and our ability to recover certain costs and earn returns as a result of such tolls;
•performance by our counterparties of their obligations to us;
•expectations respecting our ability to generate predictable and growing cash available for distribution;
•expectations and intentions respecting distributions from the Limited Partnership, the payout of DCF and our payment of quarterly dividends to our shareholders, as well as the amounts of those dividends;
•the impact of commodity pricing;
•anticipated future capital and operating expenditures;
•expectations respecting the ongoing financing of our business and operations;
•anticipated decommissioning and abandonment costs;
•operational (including marine) safety levels and standards;
•future pipeline capacity and tolls; and
•future supply of and demand for the products we handle and demand for the services we provide.
The foregoing list should not be construed to be exhaustive. We believe the forward-looking statements in this document are reasonable. However, there is no assurance that any of the actions, events or results of the forward-looking statements will occur, or if any of them do, of their timing or what impact they will have on our results of operations or financial condition. Because of these uncertainties, investors should not put undue reliance on any forward-looking statements.
Forward-looking statements are not guarantees of performance. They involve risks, uncertainties and assumptions. Future actions, conditions or events and future results of operations may differ materially from those expressed in these forward-looking statements. Many of the factors that will determine these results are beyond our ability to control or predict. Any “financial outlook” set out in this document has been included for the purpose of providing information relating to management’s current expectations and plans for the future, is based on a number of significant assumptions and may not be appropriate, and should not be used, for purposes other than those for which such forward-looking statements are disclosed herein.
Our business, financial condition and results of operations, including our ability to pay cash dividends, are substantially dependent on our financial condition and results of operations. As a result, factors or events that impact our business are likely to have a commensurate impact on us, the market price and value of the Restricted Voting Shares, the Preferred Shares, and our ability to pay dividends.
See Item 1A “Risk Factors” and Item 7 “Management’s Discussion and Analysis of Financial Condition and Results of Operations—Outlook” included in this report for a more detailed description of factors that may affect the forward-looking statements. You should keep these risk factors in mind when considering forward-looking statements. These risk factors could cause our actual results to differ materially from those contained in any forward-looking statement. Because of these risks and uncertainties, you should not place undue reliance on any forward-looking statement. Any financial outlook or other forward-looking statements included in this report are included for the purpose of providing information relating to
3
management’s current expectations and plans for the future, are based on a number of significant assumptions and may not be appropriate, and should not be used, for any purpose other than those for which such forward-looking statements are disclosed herein.
Forward-looking statements in this report are given only as of the date of this report and we disclaim any obligation to update or revise any forward-looking statements included in this report, except as required by law.
4
PART I
Items 1 and 2. Business and Properties.
Overview
We manage and are the holder of an approximate 30% minority equity interest in a portfolio of strategic energy infrastructure assets across Western Canada. Kinder Morgan, Inc. (NYSE: KMI) holds an approximate 70% majority voting interest in us and a corresponding 70% equity interest in our business and assets. We focus on stable, fee-based energy transportation and storage assets that are central to the energy infrastructure of Western Canada.
Business Organization
The Company was incorporated on April 7, 2017. On May 30, 2017, the Company completed an IPO of 102,942,000 Restricted Voting Shares (number of shares issued is before our January 4, 2019 Share Consolidation; see “—Recent Business Developments—2019 Return of Capital and Share Consolidation” below) on the TSX at a price to the public of $17.00 per Restricted Voting Share for total gross proceeds of approximately $1.75 billion. The IPO number of shares issued is before our January 4, 2019 Share Consolidation. We used our IPO proceeds to indirectly acquire from Kinder Morgan an approximate 30% economic interest in the Limited Partnership, while Kinder Morgan indirectly retained the remaining approximate 70% economic interest.
Concurrent with the closing of our IPO, the Limited Partnership acquired an interest in the Operating Entities from KMCC and KMCT, each a wholly owned subsidiary of Kinder Morgan, in exchange for the issuance to KMCC and KMCT of Class B Units of the Limited Partnership. In addition, KMCC and KMCT were issued Special Voting Shares in the Company for nominal consideration. See Note 1 “General” to our consolidated financial statements for a list of Operating Entities.
Immediately following the closing of our IPO, we used the proceeds from our IPO to indirectly subscribe for Class A Units representing an approximate 30% economic interest in the Limited Partnership while the Class B Units held by KMCC and KMCT represented, in the aggregate, an approximate 70% economic interest in the Limited Partnership. After the IPO, we issued an aggregate of $550 million of Series 1 Preferred Shares and Series 3 Preferred Shares; as a result, our and Kinder Morgan’s respective interests in the Limited Partnership are subject to the preferred shareholders’ priority on distributions and upon liquidation.
5
The intercorporate relationships of the Company, the Limited Partnership, and our Operating Entities are as follows:
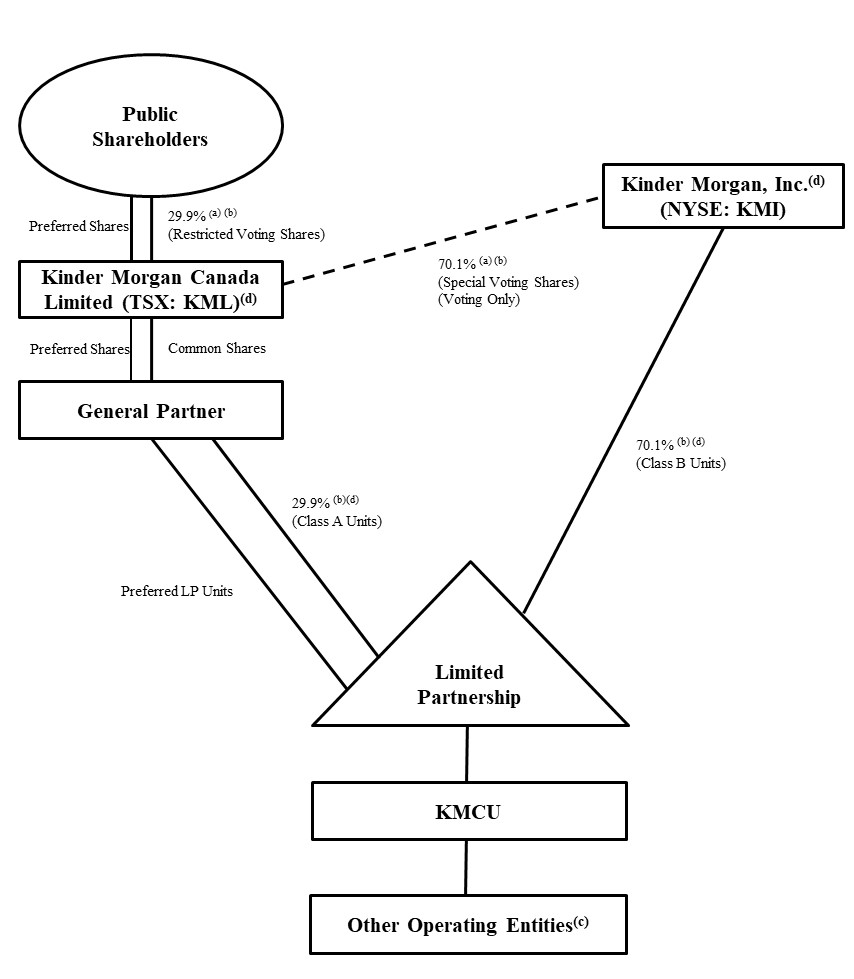 _______________
a. Approximate percentages based on ownership of total outstanding Company Voting Shares as of December 31, 2018, and are unchanged after our January 4, 2019 Share Consolidation.
b. Approximate percentages based on ownership of total outstanding Class A Units and Class B Units as of December 31, 2018.
c. Other operating entities include the Operating Entities other than KMCU.
d. KML owns (indirectly through the General Partner) 100% of the Class A Units. Kinder Morgan owns (indirectly through KMCC and KMCT) 100% of our outstanding Special Voting Shares and 100% of the Class B Units.
6
Recent Business Developments
Trans Mountain Transaction
On August 31, 2018, we closed on the sale of the Trans Mountain Asset Group, which was indirectly acquired by the Government of Canada through Trans Mountain Corporation (a subsidiary of the Canada Development Investment Corporation) for cash consideration of approximately $4.43 billion, which is the contractual purchase price of $4.5 billion net of a preliminary working capital adjustment (the “Trans Mountain Transaction”). As of December 31, 2018, we accrued for an additional $37 million for the final working capital adjustment that was subsequently settled in cash. The underlying assets in the Trans Mountain Asset Group were primarily within our Pipelines business segment and the operating results for the Trans Mountain Asset Group are presented as Discontinued Operations within Income from operations of the Trans Mountain Asset Group, net of tax in the accompanying consolidated statements of income for all periods presented in this report, and assets and liabilities are presented as held for sale as of December 31, 2017, though these assets were not actually being held for sale at that point in time.
Subsequent to our announced preliminary 2018 earnings on January 16, 2019, (i) we increased the accrual for the final working capital adjustment from $35 million to $37 million that resulted in a reduction to the Trans Mountain Transaction gain, net of tax, by $1.8 million, which were recorded in the accompanying consolidated balance sheet and consolidated income statement, respectively, as of and for the year ended December 31, 2018 and (ii) we reclassified approximately $4.5 million of tax expense from Income Tax Expense to Income from Operations of the Trans Mountain Asset Group, net of tax in the accompanying consolidated statement of income for the year ended December 31, 2017.
2019 Return of Capital and Share Consolidation
Pursuant to our voting shareholders’ approval on November 29, 2018, a distribution of approximately $1.2 billion was made as a return of capital to holders of our Restricted Voting Shares ($11.40 per Restricted Voting Share) and approximately $2.8 billion to KMI as the indirect holder of our Special Voting Shares on January 3, 2019 (the “Return of Capital”). To facilitate the Return of Capital and provide flexibility for dividends going forward, our voting shareholders also approved (i) the reduction of the stated capital of our Restricted Voting Shares by $1.45 billion (the “Stated Capital Reduction”) and (ii) a “reverse stock split” of our Restricted Voting Shares and Special Voting Shares on a one-for-three basis (three shares consolidating to one share) (the “Share Consolidation”), which was effected on January 4, 2019. In accordance with U.S. GAAP, the Restricted Voting Shares and Special Voting Shares outstanding and earnings per share information in this report reflect the Share Consolidation for all periods presented unless otherwise noted.
Suspension of Dividend Reinvestment Plan (DRIP)
Effective January 16, 2019, our board of directors suspended our DRIP until further notice. Accordingly, dividends in respect of the fourth quarter of 2018, paid on February 15, 2019 to holders of Restricted Voting Shares of record as of the close of business on January 31, 2019, were not reinvested through the DRIP. Shareholders who were enrolled in the program will automatically receive dividend payments in the form of cash. We elected to suspend our DRIP in light of our reduced need for additional capital following the Trans Mountain Transaction. If we elect to reinstate the DRIP in the future, shareholders who were enrolled in the DRIP at suspension and remained enrolled at reinstatement will automatically resume participation in the DRIP. Kinder Morgan’s participation in the distribution reinvestment plan for Class B Units of the Limited Partnership has been suspended since July 18, 2018, and the plan itself was automatically suspended effective January 16, 2019 pursuant to the terms of the Limited Partnership Agreement.
Also, see Item 7 “Management's Discussion and Analysis of Financial Condition and Results of Operations—Outlook.”
Review of Strategic Alternatives
In light of the completion of the Trans Mountain Transaction, we continue to evaluate all options in order to maximize value to our shareholders. These options include, among others, continuing to operate as a standalone enterprise, a disposition by sale, or a strategic combination with another company.
7
Business and Segments
We focus on providing fee-based services to customers from an asset portfolio consisting of energy-related pipelines and liquid and bulk terminaling facilities. Our two business segments are: (i) Terminals, which is comprised of the Vancouver Wharves Terminal and the terminals located in the Edmonton, Alberta area, and (ii) Pipelines, which is comprised of Cochin and Jet Fuel.
Our key strategies are to:
•focus on stable, fee-based energy transportation and storage assets that are central to the energy infrastructure of Western Canada;
•increase utilization of our existing assets while controlling costs, operating safely, and employing environmentally sound operating practices;
•leverage economies of scale from expansions of existing assets and potential incremental acquisitions that fit within our strategy and are accretive to cash flow; and
•maintain a strong balance sheet and maximize value for our investors.
| Overview of Assets | |||||||||||||||||||||||||||||
| Asset | Design [Storage] Capacity | Description | |||||||||||||||||||||||||||
| Terminals | |||||||||||||||||||||||||||||
| Vancouver Wharves Terminal | 6.0+ MMtonnes bulk + [250 MBbl] | Bulk commodity marine terminal provides handling, storage, loading and unloading services. | |||||||||||||||||||||||||||
| Edmonton South Terminal | [5,100 MBbl] | 15 tanks currently leased from Trans Mountain; tanks sub-leased to third parties in unregulated service (merchant tanks). | |||||||||||||||||||||||||||
| North 40 Terminal | [2,150 MBbl] | Merchant crude oil storage and blending services. | |||||||||||||||||||||||||||
| Edmonton Rail Terminal | 210 MBbl/d | Operated 50/50 joint venture with Imperial Oil (largest origination crude-by-rail terminal in North America).(b) | |||||||||||||||||||||||||||
| Alberta Crude Terminal | 40 MBbl/d | Non-operated 50/50 joint venture with Keyera Corporation (Keyera).(b) | |||||||||||||||||||||||||||
| Base Line Terminal | [4,800 MBbl] | Operated 50/50 joint venture with Keyera with 12 tanks placed in service throughout 2018.(b) | |||||||||||||||||||||||||||
| Pipelines | |||||||||||||||||||||||||||||
| Cochin(a) | ~110 MBbl/d | Transports condensate from the Canada/U.S. border near Maxbass, North Dakota to Fort Saskatchewan, Alberta. | |||||||||||||||||||||||||||
| Jet Fuel | 45 MBbl | Transports jet fuel from refinery in Burnaby and the Westridge Marine Terminal to Vancouver International Airport. | |||||||||||||||||||||||||||
_________
a.Cochin is part of the Cochin pipeline system, which transports condensate from Kankakee County, Illinois to Fort Saskatchewan, Alberta. Capacity on the U.S. portion of the Cochin pipeline system, which is fully-owned by KMI, is approximately 95 MBbl/d.
b.The 50-50 joint ventures are proportionally consolidated into our consolidated financial statements.
For financial information on our two reportable business segments, see Note 19 “Reportable Segments” to our consolidated financial statements.
Terminals Business
Vancouver Wharves Terminal
Located in North Vancouver, B.C., the Vancouver Wharves Terminal is a 125-acre bulk marine terminal facility that annually transfers over 4.0 million tons of bulk cargo and 1.5 MMBbl of liquids predominantly to offshore export markets. The Vancouver Wharves Terminal, which has been in operation since 1959, was acquired by Kinder Morgan in 2007. This acquisition included securing a 40-year operating lease and asset ownership agreement with the B.C. Railway Company for the
8
terminal uplands. Vancouver Wharves also holds a corresponding water lot lease agreement with Port Metro Vancouver to support the terminal vessel loading and unloading operations with the same 40-year term.
Over the last five years Kinder Morgan has completed a number of projects designed to improve and expand the terminal, including: (i) the construction of a zinc concentrate truck load out facility; (ii) expansion of the terminal’s lead concentrate interior shed walls; (iii) upgrading of the terminal’s sulphur load out facility; and (iv) upgrading of the terminal’s grain handling facility. The Vancouver Wharves Terminal currently has 1.0 million tons of bulk storage capacity, 250,000 barrels of petroleum storage capacity and facilities that can house up to 325 rail cars. The terminal assets include four berths capable of handling Panamax-size vessels. The main export products at Vancouver Wharves are sulphur, copper concentrates, diesel, jet fuel, bio-diesel, wheat and canola seed, while the most significant import products at Vancouver Wharves are zinc and lead concentrate. With good connectivity through the recently expanded Vancouver North Shore rail gateway corridor and connections with three Class 1 rail companies serving the area (the Canadian National Railway (“CN”), the Canadian Pacific Railway (“CP”) and the BNSF Railway) as well as all major highway routes in western Canada, Vancouver Wharves continues to provide a safe and efficient link for customers’ supply chain connectivity for water borne trade to global markets.
Edmonton South Terminal
The Edmonton South Terminal is a merchant tank terminal located in Sherwood Park, Alberta. As noted above, the assets currently making up the Edmonton South Terminal are embedded within the Edmonton Terminal, are owned by our former subsidiary, TMPL, and are operated by KMCI, for and on behalf of KM Canada North 40. The merchant use of the tanks by KM Canada North 40 is governed by a long-term leasing arrangement with TMPL, the initial term of which expires in 2038 followed thereafter with five-year evergreen auto-renewal periods subject to mutual termination rights. The first phase of the Edmonton South Terminal, comprised of nine merchant tanks, was put into service throughout 2013 and 2014. As part of a phase two expansion, an additional four tanks and associated infrastructure were constructed and placed in service in 2014. In connection with the Edmonton Rail Terminal project, a final two tanks were brought into service at the Edmonton South Terminal at the end of 2014. In total, the assets comprising this facility consist of 15 tanks with a total storage capacity of approximately 5.1 MMBbl along with associated outbound pumps, meters and pipe connections to other facilities. TMPL currently expects to recall two of the tanks in merchant service at the Edmonton South Terminal upon the completion of TMEP for use in TMPL's regulated service, comprising between approximately 700,000 and 800,000 barrels of total storage capacity. The NEB-approved agreement specifies that if Edmonton Terminal is fully built-out and additional tanks are identified as needed for TMPL for regulated purposes, more tanks can be recalled upon 24-months’ notice. As the use of the recalled tanks will be included in the overall tolls charged on the expanded TMPL, such tanks will no longer generate the incremental revenue realized through leases to merchant customers. As such, the recall is expected to result in a decrease in the net cash earnings attributable to the Edmonton South Terminal, see Item 7 “Management's Discussion and Analysis of Financial Condition and Results of Operations—Outlook—Terminals Matters.”
The Edmonton South Terminal provides significant optionality for customers through its diverse suite of inbound and outbound pipeline connections, including access to the vast majority of crude types in Alberta. All tanks at the terminal are in crude oil service and each tank has the flexibility to handle all products that are connected to the terminal, including in-tank mixing and outbound blending of multiple products. In addition to its connection to the Edmonton Rail Terminal and the North 40 Terminal, the Edmonton South Terminal has significant pipeline connectivity. The Edmonton South Terminal has 15 major inbound pipeline connections from throughout Alberta and two major outbound pipeline connections, which allow customers to ship their products west, east or south. In addition to its position within the larger Trans Mountain Edmonton Terminal, the Edmonton South Terminal is, similarly, adjacent, or in close proximity, to the starting point of the Enbridge Inc. cross-continent crude oil pipeline system, the North 40 Terminal, the Suncor Energy Inc. Edmonton refinery, the Keyera Edmonton terminal, the Keyera Alberta EnviroFuels plant, the Gibson Energy Inc. Edmonton terminal, the Plains Midstream Canada Edmonton Strathcona terminal and the Imperial Oil Strathcona refinery. Customers utilizing the Edmonton South Terminal tanks have the option of direct injection into the TMPL mainline or utilizing any of the other outbound connections available at the terminal.
North 40 Terminal
Located in Sherwood Park, Alberta, immediately adjacent to the Edmonton South Terminal, the nine-tank North 40 Terminal facility, in service since March 2008, provides merchant storage for crude oil products. This approximately 2.15 million barrel facility is comprised of eight 250,000 barrel tanks and one 150,000 barrel tank. The North 40 Terminal has a highly diverse suite of ten inbound pipeline connections, including access to the vast majority of crude types in Alberta, and five outbound connections. In addition to its pipeline connections, including TMPL and Enbridge Mainline, which allow customers to ship their products west, east or south, the North 40 Terminal is connected to the Alberta Crude Terminal (as described below), the Base Line Terminal (as described below), a local refinery and a third-party midstream facility. All tanks at the terminal are in crude oil service and have the flexibility to handle all products that are connected to the terminal, including
9
in-tank mixing of multiple products. Following the Trans Mountain Transaction, the North 40 Terminal operations are being transitioned from KMCSI to an affiliate of KM Canada North 40 in the second quarter of 2019.
Edmonton Rail Terminal
In December 2013, Kinder Morgan and Imperial Oil announced the formation of a 50-50 unincorporated joint venture to build the Edmonton Rail Terminal on land leased from Imperial Oil with an initial capacity of 100,000 bpd. By August 2014, the joint venture had entered into firm take-or-pay agreements with strong, creditworthy major oil companies. These contracted commitments allowed for an expansion of the Edmonton Rail Terminal to add incremental capacity of 110,000 bpd, for a total of 210,000 bpd. The terminal was constructed by Kinder Morgan, placed in service in April 2015 and is currently operated by an affiliate of KM Canada North 40.
The Edmonton Rail Terminal capacity at start-up in 2015 was approximately 210,000 bpd, making the terminal the largest origination crude-by-rail loading facility in North America. The terminal is connected via pipeline to the Edmonton South Terminal and the Baseline Terminal and is capable of sourcing all crude streams that are handled there for delivery by rail to North American markets and refineries. The terminal connects to both the CN and CP railway networks and can hold up to four unit trains on-site (two loading and two staged), load unit trains of up to 150 rail cars per train and load two trains with the same or differing products simultaneously. Trains are loaded at the Edmonton Rail Terminal through a 38-spot dual-sided rack (76 loading spots in total). Edmonton Rail Terminal, through its connections with the Edmonton South Terminal and the Base Line Terminal, has access to the approximately 9.9 MMBbl of crude oil capable of being stored at such terminals.
Alberta Crude Terminal
An unincorporated 50-50 joint venture between an affiliate of KM Canada North 40 and Keyera, the Alberta Crude Terminal is a crude oil rail loading facility located on land leased from Keyera in Edmonton, Alberta. The Alberta Crude Terminal construction project was sanctioned in July 2013 and placed in service in November 2014. The terminal is served by the CN and CP railway networks and is connected via pipeline to the North 40 Terminal and the Base Line Terminal. The terminal, which is fully-contracted to a single customer and operated by Keyera, has approximately 40,000 bpd of manifest crude oil rail loading capacity as well as capacity for 250 rail car storage spots, which assist in the efficient manifest movement of the railcars loaded at the facility. The Alberta Crude Terminal, through its connections with the North 40 Terminal and the Base Line Terminal, has access to the approximately 7.0 MMBbl of crude oil capable of being stored at such terminals.
Base Line Terminal
Announced in March 2015, the Base Line Terminal is a second 50-50 unincorporated joint venture between an affiliate of KM Canada North 40 and Keyera. The Base Line Terminal is a merchant crude oil storage terminal located on leased land at the Keyera Alberta EnviroFuels facility in Sherwood Park, Alberta. Construction on the 12-tank 4.8 MMBbl initial build commenced in the second half of 2015, and the tanks were placed into service throughout 2018. This project is supported by multiple long-term customer contracts that will draw revenue streams and associated risks that are similar in nature to those for the existing terminals near Edmonton.
The Base Line Terminal has some of the best tank terminal connectivity in Western Canada, with a diverse suite of ten inbound pipeline connections, including access to the vast majority of crude types in Alberta, and six outbound connections, including both pipeline and rail. This terminal leverages off of the existing North 40 Terminal by using transfer lines to facilitate product transfer between terminals via a pipeline bridge over a highway in Strathcona County. In addition to its pipeline access, the Base Line Terminal is also connected to the Alberta Crude Terminal and Edmonton Rail Terminal. All tanks at the terminal are in crude oil service and have the flexibility to handle all products that are connected to the terminal, including in-tank mixing and outbound blending of multiple products. With the completion of the Base Line Terminal in 2018, we now have more than 12.0 MMBbl of total merchant storage capacity (8/8ths) in the Edmonton area.
Customers and Contractual Relationships
The Terminals business services over 20 liquids customers, made up of a diverse mix of production, refining, marketing and integrated companies, and over 12 bulk customers at any given point in time. Approximately 75% (by revenue dollar amount) of these customers have, or their parent entity has, an investment grade credit rating; however, parent entities may not be guarantors. Our top three Terminals customers account for approximately 36% of total Terminals revenue and the top ten Terminals customers account for approximately 67% of total Terminals revenue.
10
The majority of the Vancouver Wharves Terminal capacity is contracted under long-term, take-or-pay terminal service agreements. For the most part, the terminal service agreements contain annual minimum volume guarantees and/or service exclusivity arrangements under which customers are required to utilize the terminal for all or a specified percentage of their production for exports. Our contractual arrangements at Vancouver Wharves have an average remaining term of three years. The majority of the Vancouver Wharves revenue originates from customers that have been using our terminal services for over five years and, including term extension options, a number of our major long-term contracts at the Vancouver Wharves Terminal could be extended out through 2039 and 2045.
Our Edmonton South, North 40, Edmonton Rail, Alberta Crude and Base Line Terminals are contracted under take-or-pay agreements with an average remaining contract term of four years. The rates charged for the Terminals business segment terminals’ services are market-based and the majority of the fees charged at the Alberta-based terminals are fixed, regardless of the volumes actually handled. 90% of the total revenue of the Edmonton South, North 40, Edmonton Rail, Alberta Crude and Base Line Terminals is take-or-pay in nature, while the remaining revenue is derived from throughput in excess of contracted minimums as well as ancillary terminaling and connection services delivered, which are driven by the demand for the crude oil that is being handled and stored. One of the current contractual arrangements, which accounts for a significant source of revenue at the Edmonton Rail Terminal, will expire in 2020. This contract is subject to a right of renewal on very favorable terms for the customer and, as a result, revenue from the Edmonton Rail Terminal is expected to decline significantly following such renewal, see Item 7 “Management's Discussion and Analysis of Financial Condition and Results of Operations—Outlook—Terminals Matters.”
Competition
Vancouver Wharves is currently the largest mineral concentrate export and import facility on the west coast of North America. With respect to its liquids operations, Vancouver Wharves is the only merchant terminal for import and export distillates in Port Metro Vancouver. Competing liquids facilities are significantly smaller than Vancouver Wharves and Vancouver Wharves enjoys a superior and highly flexible dock, better storage, berth depth and ship loading capacity and unsurpassed rail access, when compared to the assets of the liquids terminal competitors. In terms of bulk products handling competition, significant capital investment and regulatory approval requirements are barriers to entry for new bulk handling terminals on the West Coast. While there are currently a number of potential competitive grain terminal projects contemplated or underway which may increase the competitive pressures on the Vancouver Wharves grain business, as a result of the Vancouver Wharves berth depth, rail access and location, we believe that our grain business will be able to maintain its strong competitive position. In addition, Vancouver Wharves enjoys a distinct advantage in the mineral concentrates business as it is one of only three facilities on the west coast of North America that is currently permitted to handle these commodities. Given this fact, along with its strategic location, Vancouver Wharves is well positioned to retain its current business and attract new concentrate business dependent on mine location. Additionally, sulphur competition is limited as there is only one other sulphur terminal in Vancouver Harbour.
Edmonton and Hardisty, Alberta are the two primary crude oil hubs in Canada, with a significant majority of crude gathering pipelines feeding into the Edmonton area, and the TMPL system and the Enbridge Mainline System originating from Sherwood Park. While limited land availability and the significant capital investment required to enter this business are significant barriers to entry, the Alberta-based Terminals are subject to competition from other truck and rail terminals and storage facilities which are either in the general vicinity of the facilities or have gathering systems that are, or could potentially extend into, areas served by the Alberta-based terminals. The Alberta-based Terminals currently enjoy a leading market position in the Edmonton hydrocarbon storage and rail transporting business. The Terminals’ assets located in Alberta have excellent inbound and outbound connectivity, both in terms of the facilities to which these terminals are connected and the diversity of product that may be stored and transported by them. In addition to the considerable market access offered to customers via pipeline, through its Alberta Crude Terminal and Edmonton Rail Terminal origination crude-by-rail loading facilities, the Alberta-based Terminals are able to offer customers the flexibility to move crude oil to markets without pipeline access, supplement deliveries to markets with constrained pipeline capacity and supply different or unique crude types to refineries looking to maintain quality. Revenues from the Terminals business are largely fixed and generally not subject to short term fluctuations in oil and gas market prices; however, as with the rest of the business, as the long-term terminals contracts expire, while fees for tankage are generally expected to increase on renewal, the storage and handling services of the Terminals business segment’s terminals will have additional exposure to the longer-term trends in supply and demand for oil and gas products.
See Item 1A “Risk Factors—Risks Relating to Our Business.”
11
Pipelines Business
Cochin
Cochin consists of a 12-inch (305 millimeters) diameter pipeline which spans from Kankakee County, Illinois to Fort Saskatchewan, Alberta, totaling approximately 2,452 kilometers. Cochin, which transports light hydrocarbon liquids (primarily to be used as diluent to facilitate bitumen transportation), traverses two provinces in Canada and four states in the U.S. The Canadian portion of Cochin is comprised of approximately 1,000 kilometers of pipeline and includes 38 block valves and ten pump stations. While the U.S. portion of Cochin is not part of our business, the U.S. portion of Cochin and the Canadian portion of Cochin are interdependent (including with respect to volumes shipped and financial and contractual obligations) and, as the bulk of the tariffs on Cochin are governed by a joint international tariff, revenue is shared between the U.S. portion of Cochin and the Canadian portion of Cochin. The U.S. portion of this pipeline system is wholly owned by an indirect subsidiary of Kinder Morgan.
In 2014, Kinder Morgan reversed the western leg of Cochin (which was previously used primarily to ship propane into the U.S.) to begin moving light condensate westbound from the Kinder Morgan Cochin terminal in Kankakee County, Illinois, to terminal facilities near Fort Saskatchewan, Alberta (the “Cochin Reversal Project”). Cochin is currently capable of transporting approximately 95,000 bpd of light condensate (constrained by the U.S. portion of the Cochin pipeline system). If additional receipt points in Canada are established, and future demand supports it, throughput on the Cochin pipeline has the potential to reach approximately 110,000 bpd. This additional volume would most likely come from the Bakken oil play in North Dakota.
KMCU is the operator of Cochin, which is operated and maintained by Canadian staff located at the KMCU regional and local offices in Wainwright, Alberta and Regina, Saskatchewan. KMCU is also the holder of the NEB certificates for Cochin.
Customers and Contractual Relationships
Cochin has three primary customers who, among them, have total contractual take-or-pay commitments of 85,000 bpd. These customers have investment grade credit ratings and financial capacity that supports their long-term contractual commitments, which expire in 2024. The take-or-pay commitments obligate the committed shippers to make payments based on their contractual volume commitments, regardless of actual throughput. The joint international tariff rate is adjusted annually in accordance with the standard FERC methodology for escalating indexed rates for petroleum products pipelines. Cochin also offers transportation under: (i) a volumes incentive rate (available to certain committed shippers who ship above their contractual commitments in a calendar year), (ii) an uncommitted joint rate, as well as (iii) local uncommitted U.S. and Canadian rates.
The Canadian portion of Cochin receives its portion of monthly revenues from the above three shippers in U.S. dollars, which are converted to Canadian dollars at the monthly average U.S. dollar to Canadian dollar exchange rate.
Jet Fuel
Jet Fuel transports jet fuel from a Burnaby, B.C. refinery and the Westridge Marine Terminal to the Vancouver International Airport. The 41-kilometer pipeline system has been in operation since 1969. It includes operational storage tanks at the Vancouver International Airport with capacity of approximately 45,000 barrels. British Columbia Oil and Gas Commission regulates the integrity and safety of the pipeline and BCUC regulates Jet Fuel’s tolls. Jet Fuel is currently being operated pursuant to a BCUC conditionally approved contract.
Competition
Diluent used in Canada is primarily supplied by local production in Canada (both conventional and unconventional condensates, as well as refinery light naphtha) and imports from the U.S. Historically, as production of bitumen in Canada increased, local Canadian diluent sources were insufficient to meet demand. First imports to Canada were by rail; however, rail transport of diluent has a higher cost basis than transport via pipeline and is thus limited to areas that do not have access to pipeline transportation. In 2014, the Cochin Reversal Project came online, bringing in an additional 95,000 bpd of pipeline import capacity and offering a low all-in cost for transportation of diluent to the Alberta oil sands. While Cochin is exposed to competition from other pipeline systems that are capable of transporting significant volumes of diluent, Cochin’s delivery point in Fort Saskatchewan has a low gravity diluent pool and a high level of connectivity, thereby making Cochin an attractive mode of shipping diluent. As evidence of this, Cochin had an approximate 85% utilization rate for 2018.
12
Historically, Jet Fuel has transported a significant proportion of the jet fuel used at the Vancouver International Airport. However, the airport also receives jet fuel through other means including trucks and an approved, and yet to be constructed, jet fuel barge-receiving terminal near the airport. Jet Fuel’s supplying refinery was sold in 2017. As a result of that sale, we are unable to predict whether, and to what extent, that refinery will continue to supply jet fuel to Jet Fuel. These developments have made it unclear how much jet fuel will continue to be available for shipment to the Vancouver International Airport by way of Jet Fuel in the future. We continue to assess our options relating to our Jet Fuel assets.
See Item 1A “Risk Factors—Risks Relating to Our Business.”
Major Customer
For the years ended December 31, 2018 and 2017, revenues from Imperial Oil represented 31% of our total revenue from continuing operations for each year. For the year ended December 31, 2016, revenues from Imperial Oil represented 23% of our total revenue.
Operations Management
Safety, compliance and environmental protection are the key components of our Operations Management System (“OMS”), a management system capturing important operational expectations in areas such as physical operations, engineering, environmental compliance, asset integrity, efficiency, quality, and project management.
Across our operations, we strive to provide for the safety of the public, our employees and contractors; protect the environment; comply with applicable laws, rules, regulations and permit requirements; and operate and expand efficiently and safely to serve our customers. The OMS plays a critical role in setting the objectives and expectations for all these activities, and individual business unit operations, maintenance procedures, and site-specific procedures are designed to meet these objectives and expectations.
We are committed to our operational goals, which include risk reduction, efficiency and productivity, effective expansion and integration, quality assurance, and a culture of excellence. These goals are embedded into our operations. The operations of each business unit are as unique as the regulatory and commercial environments in which they operate.
As federally regulated businesses, Cochin and the Edmonton South Terminal are regularly audited by the NEB. Concerns identified in NEB audits are addressed through a comprehensive Corrective Action Plan approved by the NEB that remains in place until all items are completed. We are committed to continually improving pipeline and facility integrity to protect the safety of the public, the environment, and company employees. We are dedicated to being a good corporate citizen by incorporating responsible business practices and conducting our business in an ethical manner.
Additionally, we have implemented an Integrated Safety and Loss Management System (“ISLMS”) that is designed for establishing, implementing and continually improving our processes and controls to conduct business in a safe, secure, environmentally responsible and sustainable manner. The ISLMS applies to activities involving the design, construction, operations and abandonment of certain pipelines and terminals systems, including Jet Fuel and certain Terminals assets in Alberta. Through our procedures, this system helps provide for appropriate compliance with NEB regulations and efficient, safe operations in an integrated, systematic and comprehensive manner.
Safety and Emergency Management
Our operators maintain programs designed to safeguard the health and safety of employees, contractors and the general public, including through comprehensive health and safety programs that address risk assessment and monitoring, capability, development, emergency response plans, systems for incident investigation and tracking, and employee evaluation. We believe these safety programs meet or exceed the standards set by the Canadian energy infrastructure industry and applicable government regulations. We have a strong operating and safety track record, with no reportable right of way releases since 2013.
The integrity of Cochin is regularly monitored using in-line inspection tools. These devices inspect the pipeline from the inside and can identify potential anomalies or changes to the condition of the pipe. The collected data is analyzed to find locations where further investigation is required. If necessary, a section of the pipe is exposed and assessed by qualified technicians so that it can be repaired or replaced.
13
Both Cochin and Jet Fuel have their own control center wherein Control Center Operators (“CCOs”) monitor pipeline operations and operating conditions 24 hours a day, seven days a week using a sophisticated Supervisory Control and Data Acquisition (“SCADA”) computer system. This electronic surveillance system gathers and displays such data as pipeline pressures, volume and flow rates and the status of pumping equipment and valves. Alarms notify CCOs if parameters deviate from prescribed operating limits. Both automated and manual valves are strategically located along the pipeline system to enable the pipeline to be shut down immediately and sections to be isolated quickly, if necessary. In the event of a precautionary shutdown of the pipeline, there is a formal protocol related to restarting the pipeline. This protocol includes analysis of SCADA and leak detection system data, aerial or foot patrols of the pipeline as appropriate, completion of any inspections or repairs, notifications to regulators, and development of a restart plan. All restarts must be approved by the appropriate Operations Director.
Similarly, our terminals have been built with sophisticated technology and incorporate safety and environmental protection features. In Alberta, the Strathcona District Mutual Assistance Program, assists with emergency planning and tests of the emergency preparedness of our terminals in the Edmonton area. Each of the terminals facilities, as described under “—Terminals Business” above, is staffed with trained personnel 24 hours a day, seven days a week.
Pipeline rights-of-way are regularly patrolled by both land and air. Any observed unauthorized activity or encroachment is reported and investigated. We have a public awareness program for each of our pipelines that is designed to create awareness about pipelines, provide important safety information, increase knowledge of the regulations for working around pipelines, and educate first responders and the public on emergency preparedness response activities.
Operations staff are trained to maintain our pipelines and to respond in the event of a spill or other safety related incident along each pipeline route.
We maintain comprehensive emergency management plans and actively maintain emergency response capabilities across our operations. We take an all-hazards approach to preparedness and use the Incident Command System (“ICS”) to manage incident response. ICS is widely used by the public safety agencies with whom we may need to coordinate a response. It provides a standardized management structure that allows ready integration of public safety agencies and regulators into a unified response organization.
While we do not own, operate or control the vessels that call at the Vancouver Wharves Terminal, we are an active member of the maritime community and work with maritime agencies to promote safe business practices and facilitate improvements to provide for the safety and efficiency of tanker traffic in the Salish Sea.
In addition to our own rigorous screening process and terminal procedures, vessels calling at Vancouver Wharves must operate according to rules established by the International Maritime Organization, the Government of Canada through Transport Canada, the Pacific Pilotage Authority, and Port Metro Vancouver. Under this regime, there is a well-established system to provide for maritime safety in the Salish Sea, including established shipping lanes and aids to navigation, various inspection methodologies, coordinated vessel traffic monitoring, mandatory tug escort for laden tankers and mandatory pilotage with two pilots on the bridge of laden tankers. In addition, such vessels must maintain their membership in a mandatory spill response regime.
Discontinued Operations
The assets sold in the Trans Mountain Transaction were TMPL, its expansion project, TMEP, TMPL’s associated Puget Sound, and KMCI, the Canadian employer of the staff that operates those businesses, collectively referred to as “Trans Mountain Asset Group.” As the Trans Mountain Asset Group operations qualify for Discontinued Operations accounting treatment under Accounting Standards Codification (“ASC”) 205-20, they are presented herein as such to allow a transparent understanding of our ongoing operations.
The TMPL is a 1,150 kilometers long common carrier pipeline regulated by the NEB, beginning in Edmonton, Alberta and terminating on the west coast of B.C. in Burnaby. The TMPL system has posted tariff rates, which are available to all shippers based on a monthly contract, that vary according to the type of product being shipped as well as receipt and delivery points. As such, it provides service to producers, marketers, refineries and terminals who sell or resell products to domestic markets, oil marketers and international shippers moving oil to such places as California, Washington State and Asia.
See Note 3 “Trans Mountain Transaction” to our consolidated financial statements for more financial information about the Trans Mountain Asset Group.
14
Regulation
Terminals
Our Alberta bulk petroleum storage and transloading facilities are provincially regulated by Alberta Environment and Parks and the Alberta Energy Regulator. Our transloading facilities are also regulated by the Railway branch of the Alberta Transportation. Our Vancouver Wharves Terminal is regulated through a combination of laws, regulations and requirements of the Canadian government, B.C. government and the Vancouver Fraser Port Authority.
Pipelines
NEB
Cochin is an international pipeline regulated by the NEB. The NEB, pursuant to the terms of the NEB Act, regulates the tolls and tariffs governing these pipeline systems, as well as the physical construction, operation and abandonment of the associated pipelines and facilities. Tolls are either determined on a contested application to the NEB or through a negotiated toll settlement between the operator and interested parties, which settlement must subsequently be approved by the NEB. Cochin currently operates under a negotiated toll settlement for its transportation services.
In addition to rate regulation, the NEB regulates all phases of a pipeline’s operational life-cycle, from the planning and application phase through to the deactivation, decommissioning or abandonment. Where necessary, the NEB can issue mandatory compliance or remediation orders or use other appropriate tools to enforce its requirements, including, among other things, issuing fines and monetary penalties.
As part of its operational oversight, the NEB will hold compliance meetings with regulated companies, conduct audits of management and protection programs and systems, inspect facilities to assess compliance with requirements, review and approve key documents and evaluate regulated company emergency response exercises for the ability to respond to an emergency. The NEB requires pipeline companies to have integrity management programs in place to ensure the physical condition of the asset is monitored and maintained so that releases do not occur. In addition, pipeline companies must have an emergency management plan that anticipates, prevents, manages and mitigates conditions during an emergency that could adversely affect property, the environment, or the safety of workers or the public, as well as incident first-responders. In the case of a pipeline emergency, the NEB will monitor and assess a company’s emergency response, investigate the incident, initiate enforcement actions as necessary and oversee remediation actions.
In the deactivation, decommissioning or abandonment of a project, the NEB will assess whether the applied-for plan can be conducted safely and whether risks to people or the environment can be reduced or avoided. The NEB currently requires holders of an authorization to operate a pipeline under the NEB Act to file a proposed process and mechanism to set aside funds to pay for future abandonment costs in respect of the sites in Canada used for the operation of a pipeline and associated facilities. While a pipeline company bears the ultimate responsibility for the full cost of the abandonment attributable to its assets, upon receipt of approval from the NEB, companies are able to recover certain of these abandonment costs from users of the applicable pipelines. As at the date hereof, Kinder Morgan has received approval to recover its estimated future abandonment costs from shippers on Cochin.
In June 2016, the Pipeline Safety Act, which enshrines in law the “polluter pays” principle, came into force in Canada. Under the Pipeline Safety Act, in the event an environmental incident occurs with respect to one of our pipeline assets, we will have unlimited liability if we are determined to be at fault or negligent. Further, in the event of any environmental incident, regardless of whether there is proof of fault or negligence by us, we will be liable for up to $300 million in costs and damages. In connection with this “absolute liability” of up to $300 million, we are required to demonstrate that we have the financial resources to meet these responsibilities (and a portion of our resources must be readily accessible to help ensure rapid incident response). Further, in connection with the Pipeline Safety Act requirements, among other things: (i) the government has the ability to pursue pipeline operators for the costs of environmental damages; (ii) the NEB is authorized to order reimbursement of costs and expenses incurred by others in taking actions related to an incident; and (iii) the NEB is permitted to take control of incident response in exceptional circumstances, if a company operating a pipeline is unwilling or unable to shoulder its responsibilities. The Pipeline Safety Act also provides that a pipeline company remains liable indefinitely for any pipelines that are abandoned in place.
15
Recent NEB Developments
On February 6 and 8, 2018, the Canadian government introduced Bills C-68 and Bill C-69 (the “Bills”), respectively, which will introduce several major changes to Canada’s federal regime for the assessment of federally regulated projects and regulation of waterways. The Bills will repeal and replace the Canadian Environmental Assessment Act, 2012 and the National Energy Board Act, while making several significant changes to the Fisheries Act and the Navigation Protection Act. The Bills are not likely to be passed into legislation until the middle of 2019, and resulting changes in regulations are not likely to be implemented until 2020. When passed, these acts would not be expected to impact the Cochin federal certificates because Cochin has been approved under prior legislation.
B.C. Regulations
Jet Fuel is wholly situated within B.C. Its operations are regulated by BC OGC and its tolls are regulated by BCUC. The financial regulation of Jet Fuel tolls is undertaken by BCUC on a complaints basis, meaning that pipeline-related matters are generally dealt with between Jet Fuel pipeline operator and the party using its services, subject to the ability to make complaint to BCUC where a dispute cannot be resolved. Jet Fuel is currently being operated pursuant to a BCUC conditionally approved contract.
Climate Change and GHG Regulation
Through our operations, we generate greenhouse gas (“GHG”) emissions, which are below regulatory reporting thresholds except at the Edmonton South Rail Terminal. In Alberta, facilities that emit less than 100,000 metric tons of carbon dioxide equivalent (CO2e) per annum as well as all residents are subject to a carbon tax of $30 per metric ton of carbon emitted. Similarly, B.C. has a broad-based, revenue-neutral carbon tax applicable to the purchase and use of fuels. The B.C. tax is currently set at $30 per metric ton of CO2e and will increase by $5 per metric ton annually. The B.C. tax began on April 1, 2018 and will escalate to a maximum of $50 per metric ton on April 1, 2021. The imposition of carbon pricing requirements in either province is not expected to have a material direct effect on our Canadian operations.
Canada has committed to reduce its GHG emissions by 30% below 2005 levels by 2030. In December of 2015, Canada, along with 194 other countries, reached an historic agreement to maintain global temperature increases to below two degrees celsius above pre-industrial levels (“Paris Agreement”). Canada subsequently entered into the Pan-Canadian Framework on Clean Growth and Climate Change (“Framework”) with most of its provincial and territorial governments. The Framework is the blueprint by which Canada will attempt to meet its commitment under the Paris Agreement. The Greenhouse Gas Pollution Pricing Act (“GGPPA”) is Canada’s legislative proposal for implementing the Framework and is intended to serve as a regulatory back-stop in the event a province does not otherwise implement an adequate provincial GHG regime. Saskatchewan opposes both the Framework and the GGPPA and has launched a constitutional legal challenge to the validity of the GGPPA. Ontario has launched a similar challenge. Regardless of the results of these court challenges, any application of the GGPPA is not expected to have a material direct effect on our operations.
Many climate models indicate that global warming is likely to result in rising sea levels, increased intensity of weather, and increased frequency of extreme precipitation and flooding. We may experience increased insurance premiums and deductibles, or a decrease in available coverage, for our assets in areas subject to severe weather. These climate related changes could damage our physical assets, especially operations located in low-lying areas near coasts and river banks, and facilities situated in rain-susceptible regions. However, the timing, severity and location of these climate change impacts are not known with certainty, and these impacts are expected to manifest themselves over varying time horizons.
Environmental Matters
Our business operations are subject to federal, provincial and local laws, regulations and potential liabilities arising under or relating to the protection or preservation of the environment (including with respect to climate change), natural resources and human health and safety. Such laws, regulations and obligations affect many aspects of our business’ present and future operations, and generally require us to obtain and comply with various environmental registrations, licenses, permits, inspections and other approvals, including with respect to its expansion and new build projects. Liability for the remediation of contaminated areas under such laws and regulations may be incurred without regard to fault. Private parties, including the owners of properties through which our pipelines pass, also may have the right to pursue legal actions to enforce compliance as well as to seek damages for non-compliance with such laws and regulations or for personal injury or property damage.
16
Failure to comply with these laws and regulations also may expose us to civil, criminal and administrative fines, penalties and/or interruptions in operations that could harm our business, financial position, or results of operations. For example, if an accidental leak, release or spill of liquid petroleum products, chemicals or other hazardous substances occurs at or from our pipelines or storage or other facilities, we may experience significant operational disruptions and we may have to pay a significant amount to clean up or otherwise respond to the leak, release or spill, pay government penalties, address natural resource damage, compensate for human exposure, property damage or economic loss, install costly pollution control equipment or undertake a combination of these and other measures. The resulting costs and liabilities could materially and negatively affect earnings and cash flows. In addition, emission controls required under provincial laws could require significant capital expenditures at our facilities.
We own and/or operate numerous properties and assets that have been used for many years in connection with our business activities. While we believe we have utilized operating, handling, and disposal practices that were consistent with industry practices at the time, hydrocarbons or other hazardous substances may have been released at or from properties owned, operated or used by us or our predecessors, or at or from properties where our or our predecessors’ wastes have been taken for disposal. In addition, many of these properties and assets have been owned and/or operated by third parties whose management, operation, handling and disposal of hydrocarbons or other hazardous substances were not under our or our predecessors’ control. These properties and the hazardous substances released and wastes disposed on them may be subject to laws which impose joint and several liability, without regard to fault or the legality of the original conduct. In addition, we could be required to remove or remediate previously disposed wastes or property contamination, including contamination caused by prior owners or operators. Imposition of such liability schemes could have a material adverse impact on our operations and financial position.
We cannot ensure that existing laws and regulations will not be revised or that new laws or regulations will not be adopted or become applicable to our business. There can be no assurance as to the amount or timing of future expenditures for environmental compliance or remediation, and actual future expenditures may be different from the amounts currently anticipated. Revised or additional regulations that result in increased compliance costs or additional operating restrictions, particularly if those costs are not fully recoverable from customers, could have a material adverse effect on our business, financial position, results of operations and prospects. In addition to revised or additional regulations affecting our customers and/or shippers, including those related to the protection or preservation of the environment (including with respect to climate change), natural resources and human health or safety may have significant negative impacts on the business and operations of such customers and/or shippers that result in such customers and/or shippers defaulting on their contractual obligations to us (including with respect to take-or-pay obligations). We are exposed to the risk of loss in the event of non-performance by such customers and/or shippers, which could have a material adverse effect on our business, and consequently, the Company.
An environmental incident could have lasting reputational impacts to the Company, our business or Kinder Morgan and could impact their ability to work with various stakeholders. In addition to the cost of remediation activities (to the extent not covered by insurance), environmental incidents may lead to an increased cost of operating and insuring our assets, thereby negatively impacting earnings and DCF.
Although we have OMS and EMP programs in place, there remains a chance that an environmental incident could occur. Kinder Morgan also seeks to mitigate the severity of a potential environmental incident through continued process improvements and enhancements in leak detection processes and alarm analysis procedures. We have also invested significant resources to enhance our emergency response plans, operator training and landowner education programs to address potential environmental incidents. However, the mitigation efforts are incapable of guarding against all environmental risks, including in the event that there is significant damage to our assets as a result of catastrophic events (including natural disasters, other significant weather-related events or adverse sea conditions) or the actions of third parties acting outside of our control.
We maintain an insurance program which is renewed annually and has $300 million worth of financial capacity for spill events in accordance with the Pipeline Safety Act (see“—Regulation” above). The insurance program includes coverage for commercial liability that is considered customary for the industry in which we operate and includes coverage for operational and environmental incidents. However, the insurance program may not cover all environmental risks and costs and/or may not provide sufficient coverage in the event an environmental claim is made against us. The total insurance coverage will be allocated on an equitable basis among the members of the Kinder Morgan Canada Group in the event multiple insurable incidents exceeding our coverage limits within the same insurance period are experienced.
17
Other
Employees
We employed 153 full-time personnel as of December 31, 2018. Our Vancouver Wharves operations utilizes International Longshore and Warehouse Union (“ILWU”) labor. While KML does not employ these individuals directly, as a member company of the British Columbia Maritime Employers’ Association, we are party to a collective bargaining agreement with the ILWU.
Financial Information about Geographic Areas
Our ongoing assets are located in the Canadian provinces of B.C., Alberta and Saskatchewan. See Note 19 “Reportable Segments” to our consolidated financial statements for further discussion of the financial information about geographic areas.
Available Information
For this annual report on Form 10-K and future reporting periods, we will make available free of charge on or through our internet website, at www.kindermorgancanadaltd.com, our annual reports on Form 10-K, quarterly reports on Form 10-Q, current reports on Form 8-K, and amendments to those reports filed or furnished pursuant to Section 13(a) or 15(d) of the Securities Exchange Act of 1934 as soon as reasonably practicable after we electronically file such material with, or furnish it to, the SEC. The information contained on or connected to our internet website is not incorporated by reference into this Form 10-K and should not be considered part of this or any other report that we file with or furnish to the SEC.
Item 1A. Risk Factors.
You should carefully consider the risks described below, in addition to the other information contained in this document. Realization of any of the following risks could have a material adverse effect on our business, financial condition, cash flows, results of operations and ability to pay dividends. Similarly, given the nature of our relationship with Kinder Morgan, factors or events that impact Kinder Morgan may have consequences for us.
Risks Relating to Our Business
We are dependent on the supply of and demand for the commodities we handle.
Our terminals, pipelines and other assets and facilities depend in large part on continued production of crude oil and other products in the geographic areas that they serve, and the ability and willingness of our customers to supply such products. Without additions to oil and gas reserves, production will decline over time as reserves are depleted, and production costs may rise. Producers may reduce or shut down production during times of lower product prices or higher production costs, to the extent they become uneconomic. Producers in the areas we serve may not be successful in exploring for and developing additional reserves, and our facilities may not be able to maintain existing volumes of throughput. Commodity prices and tax allowances may not remain at levels that encourage producers to explore for and develop additional reserves, produce existing marginal reserves or renew terminaling or transportation contracts as they expire.
Changes in the business environment, an increase in production costs, supply disruptions, or higher development costs, could result in a slowing of supply to our terminals, pipelines and other assets. In addition, changes in the overall demand for hydrocarbons, the regulatory environment or applicable governmental policies (including in relation to climate change or other environmental concerns) may have a negative impact on the supply of crude oil and other products. In recent years, a number of initiatives and regulatory changes relating to reducing GHG emissions have been undertaken by federal, provincial and municipal governments and oil and gas industry participants (including, for example, the targets set forth in the Paris Agreement). In addition, emerging technologies and public opinion have resulted in an increased demand for energy provided from renewable energy sources rather than fossil fuels. These factors could result not only in increased costs for producers of hydrocarbons but also an overall decrease in the global demand for hydrocarbons. Each of the foregoing circumstances could negatively impact our business directly as well as the customers that are using our terminals or shipping through our pipelines, which in turn could negatively impact our prospects for new contracts for transportation or terminaling, renewals of existing contracts or the ability of our customers and shippers to honor their contractual commitments. See “—Financial distress experienced by our customers or other counterparties could have an adverse impact on us in the event they are unable to pay us for the products or services we provide or otherwise fulfill their obligations to us” below.
18
Our terminals and pipelines are largely dependent on supply and demand for the crude oil and other products originating in the Western Canada Sedimentary Basis (“WCSB”). There is significant competition for WCSB supply from several pipelines and terminals within the WCSB, and significant competition from other pipelines and modes of transportation for the delivery of the diluent required by producers in the WCSB. An overall decrease in production and/or competing demand for supply could impact throughput on WCSB-connected pipelines that, in turn, could negatively impact overall revenues generated. The WCSB has considerable reserves, but the amount actually produced depends on many variables, including commodity prices, basin-on-basin competition, pipeline tolls, demand for these products and the overall value of the reserves.
We cannot predict the impact of any of the risks set out above, all of which could reduce the production of and/or demand for crude oil, refined petroleum products and other hydrocarbons which in turn would reduce the demand for the pipeline and terminaling services we provide.
We face significant competition from other terminals, pipelines and other forms of transportation and storage.
Any current or future terminal or pipeline facilities that serve the same markets as our facilities could offer services that are more desirable to customers than those we provide, because of price, location, facilities or other factors. Likewise, other forms of transportation (such as barge, rail or truck) or other storage options may become more attractive to our customers. Additionally, many of our crude and petroleum product terminals are dependent on the third-party pipelines to which they are connected. Competition that negatively impacts these third-party pipelines could result in a decline in customer demand for services at our terminals. We also could experience competition for the supply of crude oil, refined petroleum products or other hydrocarbons from both existing and proposed pipeline systems. Any current or future terminal hub, pipeline system or other form of transportation that delivers crude oil, refined petroleum products or other hydrocarbons from the areas served by our terminals and pipelines (or by such third-party pipelines), could offer shippers more desirable market access, which may reduce demand for access to the markets we serve.
To the extent that an excess of supply into, or a decline in production from, the areas directly or indirectly served by our terminals and pipelines is created and persists, our ability to re-contract for expiring terminaling and transportation capacity at favorable rates or otherwise to retain existing customers could be impaired. We are party to numerous contracts of varying durations. Certain of the contracts associated with our services comprise a mixture of firm and non-firm commitments, varying tenures and varying renewal terms, among other differences. There can be no guarantee that, upon the expiry of our contracts, we will be able to renew such contracts on terms as favorable to us, or at all. In particular, a material contractual arrangement at the Edmonton Rail Terminal, will expire in 2020. This contract is subject to a right of renewal on very favorable terms for the customer and, as a result, revenue from the Edmonton Rail Terminal will decline significantly following such renewal. Such a revenue decline could have a significant negative impact on our financial position. See Item 7 “Management’s Discussion and Analysis of Financial Condition and Results of Operations—Outlook—Terminals Matters.”
Our operating results may be adversely affected by unfavorable economic and market conditions including, in particular, the volatility of commodity prices and changes in the overall demand for fossil fuels.
Disadvantageous economic conditions worldwide have from time to time contributed to slowdowns in several industries, including the energy infrastructure industry, and in the specific segments and markets in which we operate, resulting in reduced demand and increased price competition for our services. Our operating results also may be affected by uncertain or changing economic conditions within a particular region. Volatility in commodity prices or changes in markets for a given commodity might also have a negative impact on many of our customers, which in turn could have a negative impact on their ability to meet their obligations to us. Prices for crude oil are subject to large fluctuations in response to relatively minor changes in the supply of and demand for crude oil, uncertainties within the market and a variety of other factors beyond our control. These factors include, among other things: (i) weather conditions or significant weather-related events (including storms and rising sea levels on the West Coast of B.C. or other environmental events potentially related to climate change); (ii) domestic and global economic conditions; (iii) the activities of the Organization of Petroleum Exporting Countries; (iv) governmental regulation; (v) political changes in North America or political instability in oil-producing countries; (vi) the foreign supply of and demand for crude oil; (vii) the price of foreign imports; and (viii) the availability and prices of alternative fuel sources. If global economic and market conditions (including volatility in commodity markets), or economic conditions in the WCSB or other key markets, remain uncertain or persist, spread or deteriorate further, we may experience material impacts on our business, financial condition and results of operations.
19
Commodity transportation and storage activities involve numerous risks that may result in accidents or otherwise adversely affect our operations.
There are a variety of hazards and operating risks inherent in the storage and transportation of the products that we handle, such as leaks; releases; the breakdown, underperformance or failure of equipment or facilities, information systems or processes; the compromise of information and control systems; spills at terminals and hubs; spills associated with the loading and unloading of harmful substances at rail facilities; adverse sea conditions (including storms and rising sea levels) and releases or spills from shipping vessels loaded at our marine terminal; operator error; labor disputes/work stoppages; disputes with interconnected facilities and carriers; operational disruptions or apportionment on third-party systems or refineries on which our assets depend; and catastrophic events such as natural disasters, fires, floods, explosions, earthquakes, acts of terrorists and saboteurs, cyber security breaches, and other similar events, many of which are beyond our control.
The occurrence of any of the risks set out above could result in serious injury and loss of human life, significant damage to property and natural resources, environmental pollution, significant reputational damage, impairment or suspension of operations, fines or other regulatory penalties, and revocation of regulatory approvals or imposition of new requirements, any of which also could result in substantial financial losses. For storage and pipeline assets located near populated areas, including residential areas, commercial business centers, industrial sites and other public gathering areas, the level of damage resulting from these risks may be greater. In addition, the consequences of any operational incident (including as a result of adverse sea conditions) at our Vancouver Wharves Terminal or involving a vessel receiving products from our Vancouver Wharves Terminal, may be even more significant as a result of the complexities involved in addressing leaks and releases occurring in the ocean or along coastlines and/or the repair of marine terminals. Any leaks, releases or other incidents involving such vessels, or other similar operators along the West Coast, could result in significant harm to the environment, curtailment of, or disruptions of and/or delays in, offshore shipping activity in the affected areas, including our ability to effectively carry on operations at our Vancouver Wharves Terminal. Our inability to facilitate the movement of our customers’ products to offshore markets, or a significant delay in such services, could have a material adverse effect on our business.
We are subject to reputational risks and risks relating to public opinion.
Our business, operations or financial condition generally may be negatively impacted as a result of negative public opinion. Public opinion may be influenced by negative portrayal of the industry in which we operate as well as opposition to development projects. In addition, market events specific to us could result in the deterioration of our reputation with key stakeholders. Potential impacts of negative public opinion or reputational issues may include delays or stoppages in expansion projects, legal or regulatory actions or challenges, blockades, increased regulatory oversight, reduced support from regulatory authorities, challenges to regulatory approvals, difficulty securing financing for and cost overruns affecting expansion projects and the degradation of our business generally.
Reputational risk cannot be managed in isolation from other forms of risk. Credit, market, operational, insurance, regulatory and legal risks, among others, must all be managed effectively to safeguard our reputation. Our reputation and public opinion could also be impacted by the actions and activities of other companies operating in the energy industry, particularly other energy infrastructure providers, over which we have no control. In particular, our reputation could be impacted by negative publicity related to pipeline incidents or unpopular expansion projects and due to opposition to development of hydrocarbons and energy infrastructure, particularly projects involving resources that are considered to increase GHG emissions and contribute to climate change. Negative impacts from a compromised reputation or changes in public opinion (including with respect to the production, transportation and use of hydrocarbons generally) could include revenue loss, reduction in customer base, delays in obtaining, or challenges to, regulatory approvals with respect to growth projects, and decreased value of our securities and our business.
Financial distress experienced by our customers or other counterparties could have an adverse impact on us in the event they are unable to pay us for the products or services we provide or otherwise fulfill their obligations to us.
We are exposed to the risk of loss in the event of non-performance by our customers or other counterparties, such as, joint venture partners and suppliers. Our counterparties are subject to their own operating, market, financial and regulatory risks, and some are experiencing, or may experience in the future, severe financial problems that have had or may have a significant impact on their creditworthiness. Further, while certain of our customers are subsidiaries of an entity that has an investment grade credit rating, in many cases the parent entity has not guaranteed the obligations of the subsidiary and, therefore, the parent’s credit ratings may have no bearing on such customers’ ability to pay us for the services we provide or otherwise fulfill their obligations to us. Furthermore, in the case of financially distressed customers, such events might force such customers to reduce or curtail their future use of our services, which could have a material adverse effect on our results of operations, financial condition and cash flows.
20
We cannot provide any assurance that such customers and key counterparties will not become financially distressed or that such financially distressed customers or counterparties will not default on their obligations to us or file for bankruptcy protection. If one of such customers or counterparties files for bankruptcy protection, we likely would be unable to collect all, or even a significant portion, of amounts owed to us. Significant customer and other counterparty defaults and bankruptcy filings could have a material adverse effect on our business, financial position, results of operations or cash flows.
We rely on leased facilities, third-party pipelines, refineries and other third-party facilities in providing service to our customers. To the extent that these facilities or pipelines become capacity-constrained or unavailable, our cash flows, results of operations and financial condition could be adversely affected.
Our ability to provide service to our customers depends in part on the availability, proximity and capacity of third-party pipelines, rail, refinery and other facilities, and because we do not own or operate these facilities, their continuing operation or availability is not within our control. For example, we rely on the Trans Mountain pipeline to transport crude oil from the WCSB to our Edmonton terminal facilities.
Like us, third-party service providers are subject to risks inherent in the midstream business, including capacity constraints, changes in business ownership, natural disasters and operational, mechanical or other hazards, as well as service interruptions for scheduled maintenance. The curtailments arising from these and similar circumstances may last from a few days to several months, and these interruptions could have a material adverse effect on our cash flows, results of operations and financial condition.
For example, Jet Fuel’s supplying refinery was sold in 2017. As a result of that sale, we are unable to predict whether, and to what extent, that refinery will continue to supply jet fuel to Jet Fuel. These developments have made it unclear how much jet fuel will continue to be available for shipment to the Vancouver International Airport by way of Jet Fuel in the future.
Some of our leased facilities also may become unavailable pursuant a contractual right of recall. We provide service at our Edmonton South Terminal using tanks and facilities that we lease from Trans Mountain. Our lease is subject to a right of recall, which is exercisable by Trans Mountain in the event that the Edmonton Terminal is fully built out and Trans Mountain requires the tanks for its regulated service. In connection with the completion of TMEP, we expect that Trans Mountain will exercise recall rights under the leasing arrangement in respect of two of the tanks at the Edmonton South Terminal, which will reduce our net cash earnings attributable to the Edmonton South Terminal. See Item 7 “Management’s Discussion and Analysis of Financial Condition and Results of Operations—Outlook—Terminals Matters.”
Failure of one or more key information technology or operational (IT) systems, or those of third parties, or a breach of information security may adversely affect our business, results of operations or business reputation.
Our business depends upon our operational systems to process large amounts of data and complex transactions. The various uses of these IT systems, networks and services include, but are not limited to, controlling our terminals and pipelines with industrial control systems, collecting and storing information and data, processing transactions, and handling other processing necessary to manage our business.
If any of our systems fail to function properly, sustain damage or otherwise become unavailable, we may incur substantial costs to repair or replace them and may experience loss or corruption of critical data as well as interruptions or delays in our ability to perform critical functions, which could adversely affect our business and results of operations. The occurrence of a significant compromise, failure, breach or interruption of our systems could result in a disruption of our operations, customer dissatisfaction, loss of customers or revenues, and damage to our reputation. Our and our vendors’ efforts to develop, implement and maintain security measures may not be successful in preventing these events from occurring, and any network and information systems-related events could require us to expend significant resources to remedy such event. In the future, we may be required to expend additional resources to continue to enhance our information security measures and/or to investigate and remediate information security vulnerabilities.
Attacks, including acts of terrorism or cyber sabotage, or the threat of such attacks, may adversely affect our business or our reputation.
The U.S. and Canadian governments have issued public warnings that indicate that pipelines and other infrastructure assets might be specific targets of terrorist organizations or “cyber sabotage” events. For example, in 2018, a cyber-attack on a shared data network forced four U.S. natural gas pipeline operators to temporarily shut down computer communications with their customers. Potential targets include our pipeline systems, terminals, processing plants or operating systems. The
21
occurrence of an attack could cause a substantial decrease in revenues and cash flows, increased costs to respond or other financial loss, damage to our reputation, increased regulation or litigation or inaccurate information reported from our operations. There is no assurance that adequate cyber sabotage and terrorism insurance will be available at rates we believe are reasonable in the near future. These developments may subject our operations to increased risks, as well as increased costs, and, depending on their ultimate magnitude, could have a material adverse effect on our business, results of operations and financial condition or could harm our business reputation.
We may be subject to abandonment costs.
We are responsible for compliance with all applicable laws and regulations regarding the abandonment of our pipeline systems and other assets at the end of their economic life, and these abandonment costs may be substantial. The proceeds of the disposition of certain assets, including in respect of certain pipeline systems and line fill, may be available to offset abandonment costs. While we estimate future abandonment costs and receive (through tolls) future abandonment costs based on such estimates, actual abandonment costs may be higher than the amounts received through tolls. We may, in the future, determine it to be prudent or required by applicable laws or regulations to establish and fund additional reclamation trusts to provide for payment of our future abandonment costs. Such reserves could decrease cash flow available for dividends to shareholders and to service our obligations under any applicable debt obligations.
To date, we have complied with the NEB's requirements on Cochin, our NEB-regulated pipeline, for the creation of abandonment trusts and have completed the compliance-based filings that are required under the applicable NEB rules and regulations regarding its abandonment. While we collect abandonment surcharges from our shippers and deposit such amounts in our abandonment trust for our NEB-regulated pipelines, there is a risk that abandonment costs and post-abandonment liabilities could exceed the amounts held in trust. Further, and unlike our approach to Cochin, we do not maintain dedicated abandonment trusts for our Jet Fuel or terminals assets. Additional or unexpected expenditures incurred in respect of abandonment costs could have a material adverse effect on our business, results of operations and financial condition.
We require a skilled workforce, and difficulties recruiting and retaining our workforce could result in a failure to implement our business plans.
The operation and management of our business requires the recruitment and retention of a skilled workforce, including engineers, technical personnel and other professionals, and the loss of key members of such workforce, or a substantial portion of the workforce as a whole, could result in the failure to implement our business plans. We compete with other companies in the energy infrastructure industry for this skilled workforce. In addition, many of our current employees are retirement eligible and have significant institutional knowledge that must be transferred to other employees. If we are unable to (i) retain current employees; (ii) successfully complete effective knowledge transfers; and/or (iii) recruit new employees with comparable knowledge and experience, we could be negatively impacted. In addition, we could experience increased allocated costs to retain and recruit these professionals.
Expanding our existing assets and constructing new assets is part of our growth strategy. Our ability to begin and complete construction on expansion and new-build projects may be inhibited by difficulties in obtaining, or our inability to obtain, permits and rights-of-way, as well as public opposition, increases in costs of construction materials, cost overruns, inclement weather and other delays. Should we pursue expansion of or construction of new projects through joint ventures with others, we will share control and benefits from those projects.
We regularly undertake major construction projects to expand our existing assets and to construct new assets. Any new growth projects will be subject to, among other things, the receipt of regulatory approvals, feasibility and cost analyses, funding availability and industry, market and demand conditions. If we pursue joint ventures with third parties, those parties may share approval rights over major decisions, and may act in their own interests. Their views may differ from our own or our views of the interests of the venture, which could result in operational delays or impasses, which in turn could affect the financial expectations of the venture and our benefits therefrom. Our expansion and construction projects can be affected by a variety of factors outside of our control, such as difficulties in obtaining permits and rights-of-way or other regulatory approvals, have caused, and may continue to cause, delays in or cancellations of our construction projects. These factors can be exacerbated by public opposition to our projects. See “—We are subject to reputational risks and risks relating to public opinion.” Additionally, events such as inclement weather or significant weather-related events (including storms and rising sea levels (potentially resulting from climate change) impacting our marine terminals), natural disasters, unforeseen geological conditions and delays in performance by third-party contractors have also resulted in, and may continue to result in, increased costs or delays in construction. Significant cost overruns or delays, or our inability to obtain a required permit or right-of-way, could have a material adverse effect on our return on investment, results of operations and cash flows, and could result in project cancellations or limit our ability to pursue other growth opportunities.
22
Climate change impacts may adversely affect our operations.
Many climatic models indicate that global warming is likely to result in rising sea levels, increased intensity of weather, and increased frequency of extreme precipitation and flooding. These climate related changes could damage physical assets, especially operations located near rivers, and facilities situated in rain-susceptible regions. In addition, we may experience increased insurance premiums and deductibles, or a decrease in available coverage, for our assets in areas subject to severe weather. If resulting losses exceed our insurance coverage, our business, financial condition and results of operations could be adversely impacted. See Items 1 and 2 “Business and Properties—Regulation—Climate Change and GHG Regulation.”
We may require access to external capital.
We have limited amounts of internally generated cash flows to fund growth capital expenditures and acquisitions. If we undertake significant projects or acquisitions, we expect that we will have to rely on external financing sources, including commercial borrowings and issuances of debt and equity securities (including preferred securities) and potential joint venture arrangements, to fund such capital expenditures. Adverse changes to the availability, terms and cost of capital or interest rates affecting our ability to meet the requirements to borrow under our credit facility could cause our cost of doing business to increase by limiting our access to capital, limiting our ability to pursue expansion opportunities or additional acquisitions and reducing our cash flows. Also, disruptions and volatility in the global financial markets may lead to an increase in interest rates or a contraction in credit availability impacting our ability to finance our operations on satisfactory terms.
Limitations on access to external financing sources, whether due to tightened capital markets, more expensive capital or otherwise, or any significant reduction in the availability of credit would significantly impair our ability to execute our growth strategy, which could have a material adverse effect on our business, financial condition and results of operations. To the extent that we are required to issue additional equity, including preferred shares, or the Limited Partnership issues additional securities, including preferred units, to raise funds that are required to continue operating our business or complete expansion projects, the dilutive impact on existing shareholders would be increased and the market price of the Restricted Voting Shares could decline. Delays or cost overruns affecting key projects could result in depressed market prices or values of the Restricted Voting Shares, and the issuance of additional equity, including preferred shares, at such depressed prices may be required.
We could be adversely affected by future substantial levels of debt.
As of December 31, 2018, we had no debt outstanding. A significant increase in our debt levels could have significant negative consequences, including: (i) limiting our ability to obtain additional financing to fund our working capital, capital expenditures, debt service requirements or potential growth, or for other purposes; (ii) increasing the cost of our future borrowings; (iii) limiting our ability to use operating cash flow in other areas of our business or to pay dividends or distributions because we must dedicate a substantial portion of these funds to make payments on our debt; (iv) placing us at a competitive disadvantage compared to competitors with less debt; and (v) increasing our vulnerability to adverse economic and industry conditions.
Our ability to service debt will depend upon, among other things, our future financial and operating performance, which will be affected by prevailing economic conditions and financial, business, regulatory and other factors, many of which are beyond our control. If cash flow is not sufficient to service our debt, we will be forced to take actions such as reducing or eliminating dividends or distributions, reducing or delaying business activities (including our expansion projects), acquisitions, investments and/or capital expenditures, selling assets or seeking additional equity capital. We may not be able to effect any of these actions on satisfactory terms or at all. See also “—We may require access to external capital” above and “—Risks Relating to Ownership of Restricted Voting Shares and Preferred Shares—There are limitations on voting power of the holders of Restricted Voting Shares” below.
The terms of our credit facility, and any debt we may incur in the future, may prevent us or the Limited Partnership from engaging in certain transactions, including paying dividends or distributions, as applicable, that might have otherwise been beneficial to us and the holders of Restricted Voting Shares.
23
Our insurance policies do not cover all losses, costs or liabilities that we may experience, and insurance companies that currently insure companies in the energy industry may cease to do so or substantially increase premiums.
Our insurance program may not cover all operational risks and costs and may not provide sufficient coverage in the event of a claim. We do not maintain insurance coverage against all potential losses and could suffer losses for uninsurable or uninsured risks or in amounts in excess of existing insurance coverage. Losses in excess of our insurance coverage could have a material adverse effect on our business, financial condition and results of operations. The total insurance coverage will be allocated among the Kinder Morgan Canada Group on an equitable basis in the event multiple insurable incidents exceeding our coverage limits within the same insurance period are experienced.
Changes in the insurance markets have made it more difficult and more expensive to obtain certain types of coverage. The occurrence of an event that is not fully covered by insurance, or failure by one of our insurers to honor its coverage commitments for an insured event, could have a material adverse effect on our business, financial condition and results of operations. Insurance companies may reduce the insurance capacity they are willing to offer or may demand significantly higher premiums or deductibles to cover our assets. If significant changes in the number or financial solvency of insurance underwriters for the energy industry occur, we may be unable to obtain and maintain adequate insurance at a reasonable cost. There is no assurance that our insurers will renew their insurance coverage on acceptable terms, if at all, or that we will be able to arrange for adequate alternative coverage in the event of non-renewal. The unavailability of full insurance coverage to cover events in which we suffer significant losses could have a material adverse effect on our business, financial condition and results of operations.
Risks Relating to Regulation
New laws, policies, regulations, rule-making and oversight, as well as changes to those currently in effect, could adversely impact our earnings, cash flows and operations.
Our assets and operations are subject to regulation and oversight by federal, state, provincial and municipal regulatory authorities. Regulatory actions taken by these agencies have the potential to adversely affect our profitability and/or the profitability of our business. Regulation affects almost every part of our business and extends to such matters as: (i) the certification and construction of expansion projects and new facilities; (ii) tariff rates, operating terms and conditions of service; (iii) the types of services we may offer to our customers; (iv) the contracts for service entered into with customers; (v) the integrity, safety and security of facilities and operations; (vi) the acquisition of other businesses; (vii) the acquisition, extension, disposition or abandonment of services or facilities; (viii) reporting and information posting requirements; (ix) the maintenance of accounts and records; and (x) relationships with affiliated companies involved in various aspects of the oil and gas industry.
Should we fail to comply with any applicable statutes, rules, regulations, and orders of such regulatory authorities, we could be subject to substantial penalties and fines and potential revocation of permits. Furthermore, new laws or regulations sometimes arise from unexpected sources. New laws or regulations, or different interpretations of existing laws or regulations, including unexpected policy changes, could have a material adverse impact on our business, financial condition and results of operations.
Environmental, health and safety laws and regulations could expose us to significant costs and liabilities.
Our business operations are subject to federal, provincial and local laws, regulations and potential liabilities arising under or relating to the protection or preservation of the environment (including with respect to climate change), natural resources and human health and safety. Such laws, regulations and obligations affect many aspects of our present and future operations, and generally require us to obtain and comply with various environmental registrations, licenses, permits, inspections and other approvals, including with respect to our expansion and new build projects. Liability under such laws and regulations may be incurred without regard to fault for the remediation of contaminated areas. Private parties, including the owners of properties through which our pipelines pass, also may have the right to pursue legal actions to enforce compliance as well as to seek damages for non-compliance with such laws and regulations or for personal injury or property damage.
Failure to comply with these laws and regulations also may expose us to civil, criminal and administrative fines, penalties and/or interruptions in operations that could harm our business, financial position, results of operations or prospects. The resulting costs and liabilities could materially and negatively affect our earnings and cash flows. Also, we own and/or operate numerous properties and assets that have been used for many years in connection with our business activities or those of our predecessors or third parties, or at or from properties where our or our predecessors’ wastes have been taken for disposal. These properties and the hazardous substances released and wastes disposed on them could subject us to liability schemes that
24
could have a material adverse impact on our operations and financial position. See Items 1 and 2 “Business and Properties— Environmental Matters.”
We cannot ensure that existing laws and regulations will not be revised or that new laws or regulations will not be adopted or become applicable to our business. There can be no assurance as to the amount or timing of future expenditures for environmental compliance or remediation, and actual future expenditures may be different from the amounts currently anticipated. Revised or additional regulations that result in increased compliance costs or additional operating restrictions, particularly if those costs are not fully recoverable from customers, could have a material adverse effect on our business, financial position, results of operations and prospects. In addition, such revised or additional regulations may have significant negative impacts on the business and operations of our customers and/or shippers that could result in such customers and/or shippers defaulting on their contractual obligations to us. See “—Risks Relating to Our Business—Financial distress experienced by our customers or other counterparties could have an adverse impact on us in the event they are unable to pay us for the products or services we provide or otherwise fulfill their obligations to us” above.
In addition to the cost of remediation activities (to the extent not covered by insurance), environmental incidents may lead to an increased cost of operating and insuring our assets, thereby negatively impacting earnings and DCF. See Items 1 and 2 “Business and Properties—Regulation—Climate Change and GHG Regulations.”
Although we have OMS and EMP programs in place and have invested significant resources in emergency response plans, training and education programs, our prevention and mitigation efforts are incapable of guarding against all environmental risks, including the risk of significant damage to our assets as a result of catastrophic events (including natural disasters, other significant weather-related events or adverse sea conditions), or the actions of third parties acting outside of our control. In addition, our insurance may not cover all environmental risks and costs and/or may not provide sufficient coverage in the event an environmental claim is made against us.
Changes in tax laws and reassessments could adversely impact future DCF.
Income tax returns filed by entities forming part of our business remain subject to reassessment by applicable taxation authorities, and it is possible that the taxation authorities could successfully challenge prior transactions and tax filings of such entities. In the event of a successful reassessment, we could be subject to higher than expected past or future income tax liability as well as, potentially, interest and/or penalties, which could result in a material reduction in DCF or cash available for dividends.
Income tax laws, including income tax laws applicable to the energy infrastructure industry, may in the future be changed or interpreted in a manner that adversely affects us. Furthermore, tax authorities having jurisdiction over us may disagree with how those entities calculate income for tax purposes or could change administrative practices to the detriment of those entities. A change in applicable tax laws, or the administrative interpretation thereof, in a manner adverse to us could result in a material reduction in DCF or cash available for dividends.
Changes in pipeline tariff rates may have a negative impact on our operating results.
Regulatory bodies having jurisdiction over us may establish pipeline tariff rates or requirements that could have a negative impact on our business. In addition, such regulatory bodies or our customers could file complaints challenging the tariff rates charged by us, and a successful complaint could have an adverse impact on us. The profitability of our regulated pipelines is influenced by fluctuations in costs and our ability to recover any increases in our costs in the rates charged to our shippers. To the extent that those costs increase in an amount greater than what we are permitted by the regulators to recover in our rates, or to the extent that there is a lag before we can file for and obtain rate increases, such events can have a negative impact upon our operating results.
Certain existing rates may also be challenged by complaint. Shippers on our pipelines have rights to challenge the rates that are charged under certain circumstances prescribed by applicable regulations, and regulators have discretion to deny proposed rates. We may face challenges to the rates charged on our pipelines. Any successful challenge to our rates could materially adversely affect our future earnings, DCF and financial condition.
25
Our Cochin pipeline is subject to Canadian dollar/ U.S. dollar exchange rate fluctuations.
We are a Canadian dollar reporting company. As a result of the operations of our Cochin pipeline in the U.S., a portion of our consolidated assets, liabilities, revenues, cash flows and expenses are denominated in U.S. dollars. Fluctuations in the exchange rate between Canadian and U.S. dollars could expose us to reductions in the Canadian dollar value of our earnings and cash flows and a reduction in our shareholders’ equity under applicable accounting rules.
Risks Relating to Our Relationship with Kinder Morgan
Kinder Morgan’s shareholdings in the Company may give rise to conflicts of interest.
Kinder Morgan, indirectly through its wholly owned subsidiaries KMCC and KMCT, holds the controlling voting interest in us, including with respect to the right to vote for the election of directors to the board of directors. In addition, we are the sole shareholder of the General Partner and, as such, Kinder Morgan indirectly, through controlling the Company Voting Shares, has the ability to influence elections of the directors to the board of directors of the General Partner. In its capacity as general partner of the Limited Partnership, the General Partner is authorized to manage, administer and operate the business and affairs of the Limited Partnership, to make all decisions regarding the business of the Limited Partnership and to bind the Limited Partnership in respect of any such decisions, subject to certain limitations contained in the Limited Partnership Agreement. As a result of the foregoing, Kinder Morgan, indirectly through its controlling voting interest in us and corresponding ability to influence the elections of directors, has the ability to influence the management of our business. See Item 13 “Certain Relationships and Related Transactions, and Director Independence” and “—Risks Relating to Ownership of Restricted Voting Shares and Preferred Shares—There are limitations on voting power of the holders of Restricted Voting Shares” below.
Our relationship with Kinder Morgan, as our majority shareholder, does not impose any duty on Kinder Morgan or its affiliates to act in our best interest and, other than as set out in the Cooperation Agreement, Kinder Morgan is not prohibited from engaging in other business activities that may compete with us. Our ownership structure involves a number of relationships that may give rise to conflicts of interest between us and the holders of Restricted Voting Shares and our preferred shares, on the one hand, and Kinder Morgan, on the other hand. In certain instances, the interests of Kinder Morgan may differ from our interests and the interests of our shareholders, including with respect to future acquisitions or strategic decisions. It is possible that conflicts of interest may arise between us and Kinder Morgan, and that such conflicts may not be resolved in a manner that is in our best interests or in the best interests of our shareholders. Additionally, Kinder Morgan and its affiliates have access to material confidential information about us. Although some of these entities are subject to confidentiality obligations pursuant to confidentiality agreements or pursuant to duties of confidence or applicable codes of conduct, neither the Services Agreement nor the Cooperation Agreement contains general confidentiality provisions. See Item 13 “Certain Relationships and Related Transactions, and Director Independence.”
Future changes in our relationship with Kinder Morgan may negatively impact our business.
Our arrangements with Kinder Morgan do not require Kinder Morgan, either directly or indirectly, to maintain any ownership level in us or the Limited Partnership. Accordingly, Kinder Morgan may transfer all or a substantial portion of its interest in the Limited Partnership (together with the Special Voting Shares) to a third party, including in a merger or consolidation or sale of its Class B Units and Special Voting Shares, without our consent or the consent of our shareholders, but subject to compliance with applicable “coattail” provisions of the Limited Partnership Agreement and our articles, market conditions, Kinder Morgan’s requirements for capital or other circumstances that may arise in the future. The interests of a transferee of the Class B Units and Special Voting Shares may be different from Kinder Morgan’s and may not align with those of other shareholders. We cannot predict with any certainty the effect that any such transfer would have on the trading price of the Restricted Voting Shares or our ability to raise capital in the future. As a result, our future would be uncertain and our business and financial condition may suffer.
We rely on KMI for management, financial reporting, accounting, administrative and legal services.
Certain of our officers and directors also serve as officers and directors of KMI, and we receive significant financial reporting, accounting, administrative and legal support and other services from KMI. KMI is subject to its own financial reporting and other obligations that place significant demands on its management, administrative, operational, legal, internal audit and accounting resources who provide services to us. Demands associated with KMI’s reporting and other obligations may divert our management’s attention from other business concerns and may adversely affect our business, financial condition and results of operations. The demands on these personnel may be intensified as a result of the management and personnel departures and related transition following the Trans Mountain Transaction.
26
Risks Relating to Ownership of Restricted Voting Shares and Preferred Shares
There are limitations on voting power of the holders of Restricted Voting Shares.
Each Restricted Voting Share and each Special Voting Share entitles the holder thereof to one vote per share held at all meetings of our shareholders, except meetings at which or in respect of matters on which only the holders of another class of shares are entitled to vote separately as a class pursuant to applicable laws. Unless otherwise required by law, the holders of Restricted Voting Shares and Special Voting Shares vote together as a single class. Holders of Restricted Voting Shares are entitled to approximately 30% of the votes held by all our shareholders and Kinder Morgan, the indirect holder of the Special Voting Shares, is entitled to approximately 70% of the votes held by all our shareholders.
As a result, Kinder Morgan has a controlling interest in the combined voting power of the Company Voting Shares, including with respect to the election of the board of directors. This level of ownership of Special Voting Shares indirectly by Kinder Morgan will limit the ability of holders of the Restricted Voting Shares to influence corporate and partnership matters for the foreseeable future, including the election of directors (both with respect to the Company and the General Partner) as well as with respect to decisions regarding the amendment of our share capital or the Limited Partnership Agreement, creating and issuing additional Company Voting Shares or classes of shares or limited partnership units, making significant acquisitions, selling significant assets or parts of our business, merging with other companies, significant joint ventures, the payment or non-payment of dividends or limited partnership distributions and undertaking other significant transactions. The market price of the Restricted Voting Shares could be adversely affected due to the significant voting power of Kinder Morgan. Additionally, the significant voting interest of Kinder Morgan may discourage transactions involving a change of control, including transactions in which a holder of the Restricted Voting Shares might otherwise receive a premium for their Restricted Voting Shares over the then-current market price, or discourage competing proposals if a going private transaction is proposed or undertaken by Kinder Morgan. See Item 13 “Certain Relationships and Related Transactions, and Director Independence.”
Cash dividend payments are not guaranteed.
The payment of dividends is not guaranteed under our dividend policy or under the terms of our Preferred Shares, and amounts of such dividends could fluctuate with the performance of our business. Additionally, the Series 1 Preferred Shares and Series 3 Preferred Shares are and, if and when issued, the Series 2 Preferred Shares and Series 4 Preferred Shares, and any preferred shares issued by us in the future may be, senior to the Restricted Voting Shares with respect to priority in payment of dividends and the distribution of assets in the event of liquidation. The terms of the Series 1 Preferred Shares, Series 2 Preferred Shares, Series 3 Preferred Shares and Series 4 Preferred Shares as issued prohibit us from declaring or paying dividends on the Restricted Voting Shares unless all dividends on then outstanding preferred shares of the Company have been paid.
The board of directors has the discretion to determine the amount of dividends, if any, to be declared and paid to shareholders. The board of directors may alter our dividend policy at any time, and the payment of dividends may be affected by, among other things, changes in: commodity prices; the financial condition of our business; current and expected future levels of earnings; capital and liquidity requirements; market opportunities; income taxes; debt repayments; legal and regulatory requirements, including the solvency requirements of the Business Corporations Act (Alberta) and the regulations thereunder, as amended from time to time (“ABCA”); contractual constraints; tax laws; and other relevant factors. There can be no guarantee as to the amount of distributions from the Limited Partnership and any number of factors could cause the General Partner to revise its policies and/or strategies respecting distributions. Certain terms of the Credit Facility (described below) also indirectly restricts our ability to pay dividends or the ability of the Limited Partnership to pay distributions.
Over time, our capital and other cash needs may change significantly from our current needs, which could affect whether we pay dividends and the amount of dividends, if any, we may pay in the future. If we experience a significant downturn, the currently anticipated level of distributions by the Limited Partnership (and funding for Company dividends) could leave us with insufficient cash to finance growth opportunities, meet any large unanticipated liquidity requirements or fund our activities. The board of directors may amend, revoke or suspend our dividend policy or elect not to declare Preferred Share dividends, or both, in response to such circumstances or for other reasons. A decline in the market price or liquidity, or both, of the Restricted Voting Shares or our Preferred Shares could result if we reduce or eliminate the payment of dividends, which could result in losses to shareholders.
27
There can be volatility in the market price of Restricted Voting Shares.
The market price for Restricted Voting Shares may be volatile and subject to wide fluctuations in response to numerous factors, many of which are beyond our control, and the possibility and extent of such volatility may be increased as a result of our recent share consolidation. Factors that could cause volatility include the following: (i) anticipated fluctuations in our financial results; (ii) recommendations by securities research analysts; (iii) changes in the economic performance or market valuations of other companies that investors deem comparable to us or Kinder Morgan; (iv) the loss or resignation of directors, officers and other key personnel of the Company; (v) sales or anticipated sales of additional Restricted Voting Shares; (vi) significant acquisitions or business combinations or other strategic transactions involving us from which we do not realize the anticipated benefits; (vii) trends, concerns, technological or competitive developments, regulatory changes and other related issues in the energy infrastructure industry; and (viii) actual or anticipated fluctuations in interest rates.
Financial markets have experienced significant price and volume fluctuations in recent years that have particularly affected the market prices of equity securities of companies and that have, in many cases, been unrelated to the operating performance, underlying asset values or prospects of such companies. Accordingly, the market price of the Restricted Voting Shares may decline even if our operating results, underlying asset values or prospects have not changed. Additionally, these factors, as well as other related factors, may cause decreases in asset values which may result in impairment losses. Certain institutional investors may base their investment decisions on consideration of our environmental, governance and social practices and performance against such institutions’ respective investment guidelines and criteria, and failure to meet such criteria may result in a limited or no investment in the Restricted Voting Shares by those institutions, which could adversely affect the trading price of the Restricted Voting Shares.
Non-Canadian holders of Restricted Voting Shares face foreign exchange risk on dividends.
Our cash dividends will be declared in Canadian dollars. As a consequence, non-resident shareholders, and shareholders who calculate their return in currencies other than the Canadian dollar, will be subject to foreign exchange risk. To the extent that the Canadian dollar strengthens with respect to their currency, the amount of the dividend will be reduced when converted to their home currency.
Item 1B. Unresolved Staff Comments.
None.
Item 3. Legal Proceedings.
See Note 20 “Litigation, Commitments and Contingencies” to our consolidated financial statements.
Item 4. Mine Safety Disclosures.
Not applicable.
PART II
Item 5. Market for Registrant’s Common Equity, Related Stockholder Matters and Issuer Purchases of Equity Securities.
Restricted Voting Shares
On November 29, 2018, our shareholders approved a proposal from our board of directors to reduce the stated capital of the Restricted Voting Shares, primarily to enable a return of capital to distribute the net proceeds (after capital gains taxes, customary purchase price adjustments and repayment of our debt) from the Trans Mountain Transaction. The return of capital of $11.40 per Restricted Voting Share (the “Return of Capital”) was paid on January 3, 2019 to shareholders of record as of December 14, 2018.
Preferred Shares
Our Series 1 Preferred Shares and Series 3 Preferred Shares are listed on the TSX under the symbol “KML.PR.A” and “KML.PR.C”, respectively. As of February 14, 2019, there were 12,000,000 and 10,000,000 Series 1 Preferred Shares and Series 3 Preferred Shares outstanding, respectively. See “—Ownership Interests—Preferred Shares” below.
28
Related Stockholder Matters
On November 29, 2018, our shareholders also approved a proposal from our board of directors to effect a consolidation, or “reverse stock split”, of Restricted Voting Shares and Special Voting Shares on a one-for-three basis (three shares consolidating into one share) (the “Share Consolidation”). The Share Consolidation was effected January 4, 2019 and the Restricted Voting Shares commenced trading on a post-consolidation basis on January 8, 2019.
On January 4, 2019, in accordance with the equivalency provisions in the Limited Partnership Agreement and contemporaneously with the Share Consolidation, the Class A Units and Class B Units were consolidated on a one-for-three basis (three units consolidating into one unit) and the common shares of the General Partner were consolidated on a one-for-three basis (three common shares consolidating into one common share).
After giving effect to the Share Consolidation, as of February 14, 2019, there were 34,944,993 Restricted Voting Shares, 81,353,820 Special Voting Shares, 12,000,000 Series 1 Preferred Shares and 10,000,000 Series 3 Preferred Shares outstanding, and there was one holder of record of our Restricted Voting Shares, two holders of record of our Special Voting Shares, one holder of record of our Series 1 Preferred Shares and one holder of record of our Series 3 Preferred Shares. These holders of record do not include beneficial owners whose shares are held by a nominee, such as a broker or bank.
Also, see Preferred Share, Restricted Voting Share, and Special Voting Share dividends and distributions for and during 2018 in Item 7 “Management’s Discussion and Analysis of Financial Condition and Results of Operations—Equity, Dividends and Distributions.”
Tax Matters Applicable to Ownership of Restricted Voting Shares
Holders Resident in the U.S.
The following discussion is applicable to a holder of Restricted Voting Shares who, for the purposes of the Canadian Income Tax Act (the “Tax Act”) and the Canada-United States Tax Convention (1980), as amended (the “Treaty”), at all relevant times, is not resident or deemed to be resident in Canada, is a resident of the United States for the purposes of the Treaty and qualifies for the full benefits thereunder, and who does not use or hold (and is not deemed to use or hold) the Restricted Voting Shares in connection with a business carried on in Canada (a “U.S. Resident Holder”). This discussion is not applicable to a U.S. Resident Holder that is an insurer that carries on an insurance business in Canada.
This discussion is not applicable to a U.S. Resident Holder whose Restricted Voting Shares are or are deemed to be “taxable Canadian property” for purposes of the Tax Act. Provided that the Restricted Voting Shares are listed on a designated stock exchange (which includes the TSX) at a particular time, the Restricted Voting Shares generally will not constitute taxable Canadian property to a U.S. Resident Holder at that time unless, at any time during the five-year period immediately preceding that time: (i) 25% or more of the issued shares of any class or series of the Company’s capital stock were owned by any combination of (a) the U.S. Resident Holder, (b) persons with whom the U.S. Resident Holder did not deal at arm’s length, and (c) partnerships in which the U.S. Resident Holder or a person described in (b) holds a membership interest directly or indirectly through one or more partnerships; and (ii) more than 50% of the value of the Restricted Voting Shares was derived, directly or indirectly, from one or any combination of (a) real or immoveable property situated in Canada, (b) Canadian resource properties, (c) timber resource properties, and (d) options in respect of, or an interest in, any such property (whether or not the property exists), all for purposes of the Tax Act. A U.S. Resident Holder’s Restricted Voting Shares can also be deemed to be taxable Canadian property in certain circumstances set out in the Tax Act.
Taxation of Dividends
Dividends paid or credited or deemed to be paid or credited by the Company to a non-resident of Canada will generally be subject to Canadian withholding tax at the rate of 25%, subject to any applicable reduction in the rate of such withholding under an income tax treaty between Canada and the country where the holder is resident. Under the Treaty, the withholding tax rate in respect of a dividend paid to a U.S. Resident Holder that beneficially owns such dividends is generally reduced to 15%, unless the U.S. Resident Holder is a company which owns at least 10% of the voting shares of the Company at that time, in which case the withholding tax rate is reduced to 5%.
29
Disposition of Restricted Voting Shares
A U.S. Resident Holder will not be subject to tax under the Tax Act in respect of any capital gain realized on the disposition of Restricted Voting Shares.
Recent Sales of Unregistered Securities
Since January 1, 2018, we have issued 125,095 restricted voting shares in settlement of vesting RSU awards, after giving effect to the Share Consolidation. See Note 11 “Share-based Compensation and Benefit Plans—Share-based Compensation” to our consolidated financial statements.
Ownership Interests
The following description of our capital stock is a summary only and is qualified in its entirety by reference to our Articles and By-laws, each as amended, and to the Limited Partnership Agreement, which are included as Exhibits 3.2, 3.4, 3.6 and 3.8 hereto, respectively.
We are authorized to issue an unlimited number of Restricted Voting Shares, an unlimited number of Special Voting Shares and an unlimited number of preferred shares issuable in series. After giving effect to the Share Consolidation, as of February 14, 2019, there were 34,944,993 Restricted Voting Shares, 81,353,820 Special Voting Shares, 12,000,000 Series 1 Preferred Shares and 10,000,000 Series 3 Preferred Shares outstanding.
Restricted Voting Shares
Holders of Restricted Voting Shares are entitled to one vote for each Restricted Voting Share held at all meetings of our shareholders, except meetings at which or in respect of matters on which only holders of another class of shares are entitled to vote separately as a class. Except as otherwise provided by our Articles or required by law, the holders of Restricted Voting Shares will vote together with the holders of Special Voting Shares as a single class.
The holders of Restricted Voting Shares are entitled to receive, subject to the rights of the holders of another class of shares, any dividend we declare, and the remaining property of the Company upon the liquidation, dissolution or winding-up of the Company, whether voluntary or involuntary.
The terms of the Preferred Shares prohibit us from declaring or paying dividends on the Restricted Voting Shares unless all dividends on the Preferred Shares have been paid. See Item 7 “Management’s Discussion and Analysis of Financial Condition and Results of Operations—Equity, Dividends and Distributions.”
The payment of dividends on Restricted Voting Shares is not guaranteed, and the amount and timing of any dividends payable will be at the discretion of the board of directors. See Item 1A “Risk Factors—Risks Relating to Ownership of Restricted Voting Shares and Preferred Shares—Cash dividend payments are not guaranteed.”
We may not issue or distribute to all or to substantially all of the holders of the Restricted Voting Shares either (i) Restricted Voting Shares, or (ii) rights or securities of the Company exchangeable for or convertible into or exercisable to acquire Restricted Voting Shares, unless contemporaneously therewith, we issue or distribute Special Voting Shares or rights or securities of the Company exchangeable for or convertible into or exercisable to acquire Special Voting Shares on substantially similar terms (having regard to the specific attributes of the Special Voting Shares) and in the same proportion.
None of the Restricted Voting Shares will be subdivided, consolidated, reclassified or otherwise changed unless contemporaneously therewith the Special Voting Shares are subdivided, consolidated, reclassified or otherwise changed in the same proportion or same manner (having regard to the specific attributes of the classes of securities comprising the Company Voting Shares). In addition, under the Cooperation Agreement, we will make equivalent changes to the Restricted Voting Shares in the event any adjustments are made to the LP Units, in order to preserve the general alignment of the LP Units and the Company Voting Shares. See “—Special Voting Shares” below and Item 13 “Certain Relationships and Related Transactions, and Director Independence—Agreements between the Company and Kinder Morgan—Cooperation Agreement.”
We may not modify or remove any of the rights, privileges, conditions or restrictions of the Restricted Voting Shares without the approval by special resolution of the holders of Restricted Voting Shares.
30
Special Voting Shares
All of our outstanding Special Voting Shares are held by Kinder Morgan, indirectly through KMCC and KMCT, for the purpose of providing voting rights with respect to the Company. Under our Articles, we are prohibited from issuing any Special Voting Shares unless a corresponding number of associated Class B Units are concurrently issued by the Limited Partnership. In addition, holders of Special Voting Shares are prohibited from transferring their Special Voting Shares separately from the related Class B Units except for certain permitted transfers among affiliates.
Holders of Special Voting Shares are entitled to one vote for each Special Voting Share held at all meetings of shareholders of the Company, except meetings at which or in respect of matters on which only holders of another class of shares are entitled to vote separately as a class. Except as otherwise provided by our Articles or required by law, the holders of Special Voting Shares will vote together with the holders of Restricted Voting Shares as a single class.
The holders of Special Voting Shares are entitled to receive, subject to the rights of the holders of preferred shares and in priority to the holders of Restricted Voting Shares, an amount per Special Voting Share equal to $0.000001 on the liquidation, dissolution or winding up of the Company, whether voluntary or involuntary.
The holders of Special Voting Shares, as such, are not entitled to receive any dividends or other distributions except for such dividends payable in Special Voting Shares, as may be declared by the board of directors from time to time. Notwithstanding the foregoing, we may not issue or distribute to all or to substantially all of the holders of the Special Voting Shares either (i) Special Voting Shares, or (ii) rights or securities of the Company exchangeable for or convertible into or exercisable to acquire Special Voting Shares, unless contemporaneously therewith, we issue or distribute Restricted Voting Shares, or rights or securities of the Company exchangeable for or convertible into or exercisable to acquire Restricted Voting Shares on substantially similar terms (having regard to the specific attributes of the Restricted Voting Shares) and in the same proportion.
The Special Voting Shares are subject to anti-dilution provisions, which provide that adjustments will be made to the Special Voting Shares in the event of a change to the Restricted Voting Shares in order to preserve the voting equivalency of such shares. In addition, pursuant to the Cooperation Agreement, we will make equivalent changes to the Special Voting Shares in the event of any adjustments made to the LP Units, in order to preserve the general alignment of the LP Units and the Company Voting Shares. See Item 13 “Certain Relationships and Related Transactions, and Director Independence—Agreements between the Company and Kinder Morgan—Cooperation Agreement.” The Special Voting Shares are also subject to “coattail” provisions which restrict the transfer of Special Voting Shares in certain circumstances. See “—Takeover Bid Protection—Coattail Arrangements” below.
We may not modify or remove any of the rights, privileges, conditions or restrictions of the Special Voting Shares without the approval by special resolution of the holders of Special Voting Shares.
Preferred Shares
We are authorized to issue an unlimited number of preferred shares and we may issue preferred shares in one or more series with such terms as the board of directors may fix, subject to the ABCA. Any such additional preferred shares shall rank on a parity with the preferred shares of every other series and shall be entitled to preference over the Restricted Voting Shares and the Special Voting Shares, in each case with respect to priority in payment of dividends and the distribution of assets in the event of the liquidation, dissolution or winding up of the Company.
Series 1 Preferred Shares
On August 15, 2017, we issued 12,000,000 Series 1 Preferred Shares at a price of $25.00 per share. The holders of Series 1 Preferred Shares are entitled to receive dividends at an annual rate of $1.3125 per share, payable quarterly, up to but excluding November 15, 2022. as and when declared by our board of directors. For each five-year period following November 15, 2022, the holders of Series 1 Preferred Shares shall be entitled to receive dividends, as and when declared, in the amount per share determined by multiplying one-quarter of the “Annual Fixed Dividend Rate” by $25.00. The Annual Fixed Dividend Rate for the applicable period will be equal to the sum of the five-year Government of Canada bond yield (“Government of Canada Yield”) on such date plus 3.65%, provided that, in any event, such rate shall not be less than 5.25%. This spread will remain unchanged over the life of the Series 1 Preferred Shares.
31
The Series 1 Preferred Shares are not entitled to vote or attend meetings of the holders of Company Voting Shares (except as otherwise provided by law and except for meetings of the holders of Preferred Shares as a class and meetings of the holders of Series 1 Preferred Shares as a series) unless dividends on the Series 1 Preferred Shares have not been paid for eight quarters, whether or not consecutive, whether or not such dividends have been declared and whether or not we have sufficient cash properly applicable to the payment of such dividends. Until all such arrears of dividends have been paid, holders of Series 1 Preferred Shares will be entitled to one vote per Series 1 Preferred Share with respect to resolutions to elect directors.
The Series 1 Preferred Shares are not redeemable prior to November 15, 2022. Subject to certain conditions, on November 15, 2022, and on November 15 in every fifth year thereafter, we may, at our option, upon not less than 30 days and not more than 60 days prior written notice, redeem for cash all or any part of the outstanding Series 1 Preferred Shares by the payment of $25.00 per Series 1 Preferred Share plus all accrued and unpaid dividends.
Prior to November 15, 2022, the Series 1 Preferred Shares are not convertible. The holders of the Series 1 Preferred Shares will have the right to convert all or any of their Series 1 Preferred Shares into Series 2 Preferred Shares, subject to certain conditions, on November 15, 2022 and on November 15 in every fifth year thereafter. Other than redemption rights and dividends, the Series 2 Preferred Shares are identical to the Series 1 Preferred Shares.
The holders of the Series 2 Preferred Shares will be entitled to receive, as and when declared by the board of directors of the Company, quarterly cash dividends calculated using a floating rate of interest. Holders of Series 2 Preferred Shares have the right to convert their Series 2 Preferred Shares back into Series 1 Preferred Shares under certain circumstances.
In the event of the liquidation, dissolution or winding-up of the Company, the holders of the Series 1 Preferred Shares and Series 2 Preferred Shares are entitled to receive $25.00 per share plus all accrued and unpaid dividends thereon before any amount is paid or any property or assets of the Company are distributed to the holders of the Restricted Voting Shares, Special Voting Shares or to the holders of any other shares ranking junior to the Series 1 Preferred Shares or Series 2 Preferred Shares in any respect.
The terms of the Series 1 Preferred Shares and the Series 2 Preferred Shares prohibit the Company from declaring or paying dividends on the Restricted Voting Shares unless all dividends on the Series 1 Preferred Shares and the Series 2 Preferred Shares have been paid.
Series 3 Preferred Shares
On December 15, 2017, we issued 10,000,000 Series 3 Preferred Shares at a price of $25.00 per share. The holders of Series 3 Preferred Shares are entitled to receive dividends at an annual rate of $1.3000 per share, payable quarterly, up to but excluding February 15, 2023 as and when declared by our board of directors. For each five-year period following February 15, 2023, the holders of Series 3 Preferred Shares shall be entitled to receive dividends, as and when declared, in the amount per share determined by multiplying one-quarter of the “Annual Fixed Dividend Rate” by $25.00. The Annual Fixed Dividend Rate for the applicable period will be equal to the sum of the Government of Canada Yield on such date plus 3.51%, provided that, in any event, such rate shall not be less than 5.20%. This spread will remain unchanged over the life of the Series 3 Preferred Shares.
The Series 3 Preferred Shares are not entitled to vote or attend meetings of the holders of Company Voting Shares (except as otherwise provided by law and except for meetings of the holders of Preferred Shares as a class and meetings of the holders of Series 3 Preferred Shares as a series) unless dividends on the Series 3 Preferred Shares have not been paid for eight quarters, whether or not consecutive, whether or not such dividends have been declared and whether or not we have sufficient cash properly applicable to the payment of such dividends. Until all such arrears of dividends have been paid, holders of Series 3 Preferred Shares will be entitled to one vote per Series 3 Preferred Share with respect to resolutions to elect directors.
The Series 3 Preferred Shares are not redeemable prior to February 15, 2023. Subject to certain conditions, on February 15, 2023, and on February 15 in every fifth year thereafter, we may, at our option, upon not less than 30 days and not more than 60 days prior written notice, redeem for cash all or any part of the outstanding Series 3 Preferred Shares by the payment of $25.00 per Series 3 Preferred Share plus all accrued and unpaid dividends.
Prior to February 15, 2023, the Series 3 Preferred Shares are not convertible. The holders of the Series 3 Preferred Shares will have the right to convert all or any of their Series 3 Preferred Shares into Series 4 Preferred Shares, subject to certain conditions, on February 15, 2023 and on February 15 in every fifth year thereafter. Other than redemption rights and dividends, the Series 4 Preferred Shares are identical to the Series 3 Preferred Shares.
32
The holders of the Series 4 Preferred Shares will be entitled to receive, as and when declared by the board of directors of the Company, quarterly cash dividends calculated using a floating rate of interest. Holders of Series 4 Preferred Shares have the right to convert their Series 4 Preferred Shares back into Series 3 Preferred Shares under certain circumstances.
In the event of the liquidation, dissolution or winding-up of the Company, the holders of the Series 3 Preferred Shares and Series 4 Preferred Shares are entitled to receive $25.00 per share plus all accrued and unpaid dividends thereon before any amount is paid or any property or assets of the Company are distributed to the holders of the Restricted Voting Shares, Special Voting Shares or to the holders of any other shares ranking junior to the Series 3 Preferred Shares or Series 4 Preferred Shares in any respect.
The terms of the Series 3 Preferred Shares and the Series 4 Preferred Shares prohibit the Company from declaring or paying dividends on the Restricted Voting Shares unless all dividends on the Series 3 Preferred Shares and the Series 4 Preferred Shares have been paid.
Limited Partnership Units
The Limited Partnership is a limited partnership existing under the laws of the Province of Alberta and holds our business and engages in such activities from time to time as the General Partner may, in its discretion, determine.
On November 29, 2018, the board of directors of the General Partner, in its capacity as general partner of the Limited Partnership, and in accordance with the Limited Partnership Agreement, approved a consolidation of the Class A Units and Class B Units on a one-for-three basis (three units consolidating into one unit) contemporaneously with the Share Consolidation (the “Unit Consolidation”). The Unit Consolidation was effective January 4, 2019.
After giving effect to the Share Consolidation, as of February 14, 2019, the Limited Partnership had issued and outstanding two GP Units held by the General Partner, 34,944,993 Class A Units held by the Company (indirectly through the General Partner) representing an approximate 30% equity interest in the Limited Partnership, 81,353,820 Class B Units held by Kinder Morgan (indirectly through KMCC and KMCT) representing an approximate 70% equity interest in the Limited Partnership and 22,000,000 Preferred LP Units held by the General Partner.
The GP Units, Class A Units, Class B Units and Preferred LP Units are entitled to participate in distributions of the Limited Partnership on the terms set out in the Limited Partnership Agreement. See “—Distributions” below. In certain circumstances, the General Partner may be required to make changes to the attributes of the LP Units to maintain the equivalency among the related securities in the manner contemplated by the Limited Partnership Agreement and the Cooperation Agreement. See Item 13 “Certain Relationships and Related Transactions, and Director Independence—Agreements Between the Company and Kinder Morgan—Cooperation Agreement.”
Each Class B Unit is accompanied by a Special Voting Share, which entitles the holder of such Special Voting Share to receive notice of, to attend and to vote at meetings of our shareholders. Under our Articles and the Limited Partnership Agreement, as applicable, the transfer of the Special Voting Shares separately from the Class B Units to which they relate, as well as the transfer of Class B Units separately from the related Special Voting Shares, is prohibited except for certain permitted transfers among affiliates. See “—Special Voting Shares” above.
Distributions
Under the Limited Partnership Agreement, the Limited Partnership may make distributions to (i) the Company, indirectly through the General Partner, and (ii) Kinder Morgan, indirectly through KMCC and KMCT, on a quarterly basis, and on or before any scheduled date for payment by the Company of any declared dividends. The Company will be entirely dependent on indirectly receiving distributions from the Limited Partnership in order to pay any dividends on the Restricted Voting Shares and any then outstanding preferred shares of the Company, which dividends shall in any event be declared only at the discretion of the board of directors.
Distributions by the Limited Partnership are not guaranteed and will be at the discretion of the General Partner. The General Partner will, in its sole discretion, determine the amount of the distribution from the Limited Partnership. See Item 1A “Risk Factors—Risks Relating to Ownership of Restricted Voting Shares and Preferred Shares—Cash dividend payments are not guaranteed.”
33
The Limited Partnership will make its distributions in the following order and priority: (i) the reimbursement of costs and expenses to the General Partner pursuant to the Limited Partnership Agreement; (ii) an amount to the holders of GP Units (being the General Partner) sufficient to allow the Company to pay its expenses (including, without limitation, any fees or commissions payable to agents or underwriters in connection with the sale of securities by the Company, listing fees of applicable stock exchanges and fees of the Company’s counsel and auditors) on a timely basis (the “Priority Distribution”); (iii) an amount to the holders of Preferred LP Units in accordance with the terms of the Preferred LP Units; (iv) an amount to the General Partner equal to 0.001% of the balance of the distributable cash of the Limited Partnership; and (v) an amount equal to the remaining distribution to the holders of Class A Units and the holders of Class B Units in accordance with their respective holdings of Class A Units and Class B Units. The General Partner may, in addition to the distributions described above, make a distribution in cash or other property to holders of GP Units or LP Units, provided that such distribution is paid or distributed to the holders of LP Units in accordance with their pro rata entitlements as holders of LP Units.
A holder of Class B Units has the right to elect to reinvest all distributions payable on its Class B Units in Class B Units on the same economic terms as a holder of Restricted Voting Shares that participates in the DRIP. See “—Dividend Reinvestment Plan” below. If a holder of Class B Units elects to reinvest its distributions, such distributions will be used to purchase additional Class B Units at the same price per unit as Restricted Voting Shares are issued by the Company under the DRIP (generally being the weighted average trading price of the Restricted Voting Shares on the TSX for the five trading days preceding the dividend payment date) at a discount of between 0% and 5%, as determined from time to time by the board of directors of the General Partner, in its sole discretion. Pursuant to the terms of the DRIP and pursuant to the Limited Partnership Agreement, the Company and the Limited Partnership may concurrently suspend the DRIP and the distribution reinvestment plan, respectively, at their discretion. Effective January 16, 2019, the board of directors of the Company elected to suspend the DRIP; the Limited Partnership’s distribution reinvestment plan was also automatically suspended effective the same date pursuant to the terms of the Limited Partnership Agreement.
Allocation of Net Income and Losses
The net income of the Limited Partnership, determined in accordance with the provisions of the Income Tax Act (Canada) and the regulations thereunder, as amended from time to time, is generally allocated in respect of each fiscal year in the following manner: (i) first, to the General Partner in an amount equal to (a) the Priority Distribution, and (b) the aggregate of reimbursement of costs and expenses to the General Partner pursuant to the Limited Partnership Agreement and the distributions paid on the GP Units; (ii) second, to holders of Preferred LP Units based on their proportionate share of distributions on the Preferred LP Units received or receivable for such fiscal year; and (iii) the balance, among the holders of Class A Units and Class B Units based on their proportionate share of distributions received or receivable for such fiscal year. The amount of income for tax purposes allocated to a partner may be more or less than the amount of cash distributed by the Limited Partnership to that partner. Income and loss of the Limited Partnership for accounting purposes is allocated to each partner in the same proportion as income or loss is allocated for tax purposes.
If, with respect to a given fiscal year, no distribution is paid or payable or allocated to the partners, or the Limited Partnership has a loss for tax purposes, the taxable income or loss, as the case may be, for tax purposes of the Limited Partnership for that fiscal year will be allocated to the holders of LP Units in that fiscal year in the proportion to the percentage of LP Units held by each holder of LP Units at each of those dates. The fiscal year end of the Limited Partnership will initially be December 31.
Functions and Powers of the General Partner
In its capacity as general partner of the Limited Partnership, the General Partner is authorized to manage, administer and operate the business and affairs of the Limited Partnership, to make all decisions regarding the business and affairs of the Limited Partnership and to bind the Limited Partnership in respect of any such decisions, subject to certain limitations contained in the Limited Partnership Agreement. The General Partner is required to exercise its powers and discharge its duties honestly, in good faith with a view to the best interests of the Limited Partnership and to exercise the care, diligence and skill that a reasonably prudent person would exercise in comparable circumstances. The board of directors of the General Partner is the same as the board of directors of the Company. Similarly, the executive officers of the General Partner are the same as the executive officers of the Company.
The authority and power vested in the General Partner to manage the business and affairs of the Limited Partnership includes all authority to do any act, take any proceeding, make any decision and execute and deliver any instrument, deed, agreement or document necessary or incidental to carrying out the objects, purposes and business of the Limited Partnership, including, without limitation, the ability to engage other persons to assist the General Partner to carry out its management obligations and administrative functions in respect of the Limited Partnership and its business. Pursuant to the terms of the
34
Services Agreement, the General Partner has contracted with KMCSI for certain services relating to the operation of the Operating Entities. See Item 13 “Certain Relationships and Related Transactions, and Director Independence—Agreements between the Company and Kinder Morgan—Services Agreement.”
Restrictions on the Authority of the General Partner
The authority of the General Partner, as general partner, is limited in certain respects under the Limited Partnership Agreement. Certain matters must be approved by special resolution of the holders of Class A Units (all of which is held indirectly by the Company and voted in accordance with the instructions of the Company), including: (i) the removal of the general partner, (ii) the dissolution, termination, wind-up or other discontinuance of the Limited Partnership, (iii) the sale, exchange or other disposition of all or substantially all of the business or assets of the Limited Partnership, (iv) amendments to the Limited Partnership Agreement, and (v) a merger or consolidation involving the Limited Partnership. Certain other matters must be approved by special resolution of the holders of the Class A Units and Class B Units voting together as a class, including: (i) a consolidation, subdivision or reclassification of LP Units (except for the purposes of preserving the alignment of the LP Units and the Company Voting Shares pursuant to the Limited Partnership Agreement and the Cooperation Agreement), and (ii) a waiver of a default by the general partner or release of the general partner from any claims in respect thereof.
Transfer of Partnership Units
No limited partner may transfer any of the LP Units owned by it except to persons and in the manner expressly permitted in the Limited Partnership Agreement. LP Units may not be transferred to a person who is not an Eligible Person (as defined in the Limited Partnership Agreement). In addition, the Class B Units are subject to “coattail” provisions which restrict the transfer of Class B Units in certain circumstances. See “—Takeover Bid Protection—Coattail Arrangements” below.
The General Partner
The authorized capital of the General Partner consists of an unlimited number of common shares and an unlimited number of preferred shares issuable in series. The Company holds all of the issued and outstanding common shares of the General Partner. Pursuant to the Cooperation Agreement, the board of directors of the General Partner is the same as the board of directors. Similarly, the executive officers of the General Partner is the same as the executive officers of the Company.
Preferred Units
Concurrently with the issuance of the Series 1 Preferred Shares and the Series 3 Preferred Shares by the Company, 12,000,000 and 10,000,000 Preferred LP Units, respectively, were issued by the Limited Partnership to the General Partner. The terms of the Preferred LP Units are substantially similar to the terms of the Preferred Shares. Pursuant to the terms of the Limited Partnership Agreement, the General Partner, as the holder of the Preferred LP Units, will have priority over the holders of LP Units (being, indirectly, the Company and Kinder Morgan) on any distributions, and in the event of dissolution, of the Limited Partnership. In addition, no amendments to the provisions of the Preferred LP Units or the priority of distributions or in the event of dissolution may be made unless such amendments receive approval of two-thirds of then outstanding Preferred Shares and, if required, the approval of the TSX.
Takeover Bid Protection - Coattail Arrangements
Under applicable securities laws in Canada, an offer to purchase Special Voting Shares or Class B Units would not necessarily require that an offer be made to purchase Restricted Voting Shares. In accordance with the rules of the TSX designed to ensure that, in the event of a takeover, the holders of Restricted Voting Shares will be entitled to participate on an equal footing with holders of Special Voting Shares or Class B Units, each of the Company’s Articles and the Limited Partnership Agreement contain customary coattail provisions.
Pursuant to the Articles of the Company, no holder of Special Voting Shares is permitted to transfer such Special Voting Shares unless either: (i) such transfer would not require that the transferee make an offer to holders of Restricted Voting Shares to acquire Restricted Voting Shares on the same terms and conditions under applicable securities laws, if such Special Voting Shares were outstanding as Restricted Voting Shares; or (ii) if such transfer would require that the transferee make such an offer to holders of Restricted Voting Shares to acquire Restricted Voting Shares on the same terms and conditions under applicable securities laws, the transferee acquiring such Special Voting Shares makes a contemporaneous identical offer for Restricted Voting Shares (in terms of price, timing, proportion of securities sought to be acquired and conditions) and does not acquire such Special Voting Shares unless the transferee also acquires a proportionate number of Restricted Voting Shares actually tendered to such identical offer.
35
In addition, pursuant to the terms of the Limited Partnership Agreement, no holder of Class B Units is permitted to transfer such Class B Units, unless: (i) such transfer would not require the transferee to make an offer to holders of Restricted Voting Shares to acquire Restricted Voting Shares on the same terms and conditions under applicable securities laws if such Class B Units, and all other outstanding Class B Units, were instead outstanding as Restricted Voting Shares; or (ii) the offeror acquiring such Class B Units makes a contemporaneous identical offer for the Restricted Voting Shares (in terms of price, timing, proportion of securities sought to be acquired and conditions) and acquires such Class B Units along with a proportionate number of Restricted Voting Shares actually tendered to such identical offer.
Dividend Reinvestment Plan
Effective January 16, 2019, the board of directors of the Company elected to suspend the DRIP; the Limited Partnership’s distribution reinvestment plan was automatically suspended effective the same date.
If we elect to reinstate the DRIP, holders of Restricted Voting Shares will be able to elect to have all cash dividends of the Company payable to any such shareholder automatically reinvested in additional Restricted Voting Shares at a price per share calculated by reference to the weighted average trading price of the Restricted Voting Shares on the stock exchange on which the Restricted Voting Shares are then listed for the five trading days preceding the relevant dividend payment date, less a discount of between 0% and 5% (as determined from time to time by the board of directors, in its sole discretion). Cash undistributed by the Company upon the issuance of additional Restricted Voting Shares under the DRIP will be invested in the Company and/or the Limited Partnership to be used for general corporate purposes and working capital. Holders of Restricted Voting Shares who are non-residents of Canada are not entitled to participate in the DRIP as a result of foreign securities law restrictions.
The Limited Partnership Agreement provides for a similar distribution reinvestment plan for the holders of Class B Units such that they may elect to have all of the cash distributions on the Class B Units payable to any such person automatically reinvested in additional Class B Units on the same basis and at the same price per Class B Unit as a holder of Restricted Voting Shares purchases Restricted Voting Shares pursuant to the DRIP. See “—Limited Partnership Units—Distributions” above.
36
Item 6. Selected Historical Financial Information.
The following table sets forth, for the periods and at the dates indicated, our summary historical financial data. The table is derived from our consolidated financial statements and notes thereto, and should be read in conjunction with those audited consolidated financial statements. See also Item 7 “Management’s Discussion and Analysis of Financial Condition and Results of Operations” in this report for more information.
| As at and for the Year Ended December 31, | 2018 | 2017 | 2016 | ||||||||||||||
| (In millions of Canadian dollars) | |||||||||||||||||
| GAAP Income Statement Information | |||||||||||||||||
| Revenues | 383.8 | 358.9 | 347.8 | ||||||||||||||
| Operating income | 110.8 | 83.7 | 97.6 | ||||||||||||||
| Income from Continuing Operations, net of tax | 100.0 | 50.5 | 70.4 | ||||||||||||||
| Income from Discontinued Operations, net of tax(a) | 1,318.2 | 110.2 | 131.4 | ||||||||||||||
| Net income | 1,418.2 | 160.7 | 201.8 | ||||||||||||||
| Non-GAAP Financial Measures(b) | |||||||||||||||||
| DCF from continuing operations | 161.5 | 120.9 | 131.3 | ||||||||||||||
| DCF | 312.8 | 322.7 | 318.2 | ||||||||||||||
| Adjusted EBITDA from continuing operations | 189.1 | 153.8 | 163.3 | ||||||||||||||
| Adjusted EBITDA | 352.5 | 388.3 | 395.5 | ||||||||||||||
| Allocation of Earnings to Ownership Interests | |||||||||||||||||
| Preferred share dividends | 28.8 | 6.6 | — | ||||||||||||||
| Net income attributable to Kinder Morgan interest(c) | 973.2 | 126.2 | 201.8 | ||||||||||||||
| Net income available to Restricted Voting Stockholders | 416.2 | 27.9 | — | ||||||||||||||
| DCF from continuing operations to Kinder Morgan interest(b)(c) | 113.5 | 90.2 | 131.3 | ||||||||||||||
| DCF from continuing operations for Restricted Voting Stockholders(b) | 48.0 | 30.7 | — | ||||||||||||||
| GAAP Balance Sheet Information (at end of period) | |||||||||||||||||
| Total Property, plant and equipment, net - continuing operations | 981.3 | 988.4 | 865.0 | ||||||||||||||
| Total assets - continuing operations | 5,369.6 | 1,209.6 | 998.5 | ||||||||||||||
| Total assets - discontinued operations | — | 3,243.1 | 2,740.9 | ||||||||||||||
| Outstanding debt(d) - continuing operations | — | — | 1,362.1 | ||||||||||||||
| Total equity(e) | 892.5 | 3,637.6 | 1,436.0 | ||||||||||||||
_________
a.2018 includes a gain on the Trans Mountain Transaction of $1,278.4, net of tax.
b.See Item 7 “Management’s Discussion and Analysis of Financial Condition and Results of Operations—Results of Operations—Non-GAAP Financial Measures.”
c.Prior to our May 2017 IPO, net income and DCF were attributable only to Kinder Morgan interest.
d.Prior to our May 2017 IPO outstanding debt represented the Long-term debt-affiliates (“KMI Loans”).
e.2018 amount reflects an accrual for the shareholder approved January 3, 2019 Return of Capital of $3,977.4 million.
Item 7. Management’s Discussion and Analysis of Financial Condition and Results of Operations.
The following discussion and analysis should be read in conjunction with our consolidated financial statements and the notes thereto. We prepared our consolidated financial statements in accordance with GAAP. Additional sections in this report that should be helpful to the reading of our discussion and analysis include the following: (i) a description of our business strategy, found in Items 1 and 2 “Business and Properties—Business and Segments;” (ii) a description of developments during 2018, found in Items 1 and 2 “Business and Properties—Recent Business Developments;” and (iii) a description of risk factors affecting us and our business, found in Item 1A “Risk Factors.”
In as much as the discussion below and the other sections to which we have referred you pertain to management’s comments on financial resources, capital spending, our business strategy and the outlook for our business, such discussions contain forward-looking statements. These forward-looking statements reflect the expectations, beliefs, plans and objectives of management about future financial performance and assumptions underlying management’s judgment concerning the matters discussed, and accordingly, involve estimates, assumptions, judgments and uncertainties. Our actual results could differ materially from those discussed in the forward-looking statements. Factors that could cause or contribute to any differences
37
include, but are not limited to, those discussed below and elsewhere in this report, particularly in Item 1A “Risk Factors” and at the beginning of this report in “Information Regarding Forward-Looking Statements.”
Subsequent to our IPO, Kinder Morgan retained control of us and the Limited Partnership. As a result we accounted for our acquisition of an approximate 30% equity interest in the Limited Partnership as a transfer of net assets among entities under common control. Therefore, our consolidated financial statements presented herein were derived from the consolidated financial statements and accounting records of Kinder Morgan. The assets and liabilities in these consolidated financial statements have been reflected at historical carrying value of the immediate parents within the Kinder Morgan organization structure. Prior to May 30, 2017, our historical financial statements were presented as combined consolidated financial statements derived from information included within the consolidated financial statements and accounting records of Kinder Morgan. All significant intercompany balances between the companies included in our accompanying consolidated financial statements have been eliminated. For all periods presented in this report, Kinder Morgan's economic interest in the Limited Partnership is reflected within “Net Income Attributable to Kinder Morgan Interest” in our consolidated statements of income.
Recent Business Developments
Trans Mountain Transaction
On August 31, 2018, we closed on the sale of the Trans Mountain Asset Group, which was indirectly acquired by the Government of Canada through Trans Mountain Corporation (a subsidiary of the Canada Development Investment Corporation) for cash consideration of approximately $4.43 billion, which is the contractual purchase price of $4.5 billion net of a preliminary working capital adjustment (the “Trans Mountain Transaction”). As of December 31, 2018 we have accrued for an additional $37 million for a final working capital adjustment that was subsequently settled in cash. The underlying assets in the Trans Mountain Asset Group were primarily within our Pipelines business segment and the operating results for the Trans Mountain Asset Group are presented as Discontinued Operations within Income from operations of the Trans Mountain Asset Group, net of tax in the accompanying consolidated statements of income for all periods presented in this report, and assets and liabilities are presented as held for sale as of December 31, 2017 and for prior periods, though these assets were not actually being held for sale at that point in time.
We have recorded a Gain on sale of the Trans Mountain Asset Group, net of tax, of $1,278.4 million as presented in the accompanying consolidated statement of income for year ended December 31, 2018. The gain included a tax benefit of approximately $81.4 million comprised of the release of deferred income taxes of approximately $389.0 million, which were partially offset by an adjustment to accrued taxes of approximately $307.6 million on the accompanying consolidated balance sheet as of December 31, 2018.
Subsequent to our announced preliminary 2018 earnings on January 16, 2019, (i) we increased the accrual for the final working capital adjustment from $35 million to $37 million that resulted in a reduction to the Trans Mountain Transaction gain, net of tax, by $1.8 million, which were recorded in the accompanying consolidated balance sheet and consolidated income statement, respectively, as of and for the year ended December 31, 2018 and (ii) we reclassified approximately $4.5 million of tax expense from Income Tax Expense to Income from Operations of the Trans Mountain Asset Group, net of tax in the accompanying consolidated statement of income for the year ended December 31, 2017.
2019 Return of Capital and Share Consolidation
Pursuant to our voting shareholders’ approval on November 29, 2018, a distribution of approximately $1.2 billion were made as a return of capital to holders of our Restricted Voting Shares ($11.40 per Restricted Voting Share) and approximately $2.8 billion to KMI as the indirect holder of our Special Voting Shares on January 3, 2019 (the “Return of Capital”). To facilitate the Return of Capital and provide flexibility for dividends going forward, our voting shareholders also approved (i) the reduction of the stated capital of our Restricted Voting Shares by $1.45 billion (the “Stated Capital Reduction”) (ii) a “reverse stock split” of our Restricted Voting Shares and Special Voting Shares on a one-for-three basis (three shares consolidating to one share) (the “Share Consolidation”), which occurred on January 4, 2019. In accordance with U.S. GAAP, the Restricted Voting Shares and Special Voting Shares outstanding and earnings per share information in this report reflect the Share Consolidation for all periods presented unless otherwise noted.
Suspension of Dividend Reinvestment Plan (DRIP)
Effective January 16, 2019 our board of directors suspended our DRIP until further notice. Accordingly, dividends in respect of the fourth quarter of 2018, paid on February 15, 2019 to holders of Restricted Voting Shares of record as of the close of business on January 31, 2019, were not reinvested through the DRIP. Shareholders who were enrolled in the program will
38
automatically receive dividend payments in the form of cash. We elected to suspend our DRIP in light of our reduced need for additional capital following the Trans Mountain Transaction. If we elect to reinstate the DRIP in the future, shareholders who were enrolled in the DRIP at suspension and remained enrolled at reinstatement will automatically resume participation in the DRIP. Kinder Morgan’s participation in the distribution reinvestment plan for Class B Units of the Limited Partnership has been suspended since July 18, 2018, and the plan itself was automatically suspended effective January 16, 2019 pursuant to the terms of the Limited Partnership Agreement.
Review of Strategic Alternatives
In light of the completion of the Trans Mountain Transaction, we continue to evaluate all options in order to maximize value to our shareholders. These options include, among others, continuing to operate as a standalone enterprise, a disposition by sale, or a strategic combination with another company.
Outlook
Below is a summary of our expectations for 2019:
•Generate $213 million of Adjusted EBITDA, $109 million of DCF and DCF of $0.90 per split-adjusted restricted voting share;
•Declare a 2019 dividend of $0.65 (annualized) per split-adjusted restricted voting share;
•Invest $32 million in expansion projects; and
•End 2019 with a net debt-to-Adjusted EBITDA ratio of approximately 1.3 times, after treating 50% of the outstanding preferred equity balance as debt.
Net Income to Adjusted EBITDA and DCF reconciliations for 2018 are below in “—Results of Operations—Non-GAAP Financial Measures.’’ We do not provide budgeted net income attributable to common stockholders and net income, the GAAP financial measures most directly comparable to the non-GAAP financial measures DCF and Adjusted EBITDA, respectively, due to the impracticality of quantifying certain components required by GAAP such as: realized and unrealized gains or losses on foreign currency transactions and potential changes in estimates for certain contingent liabilities.
Terminals Matters
With the final tanks placed in service early in the fourth quarter of 2018, construction of all major facilities at the Base Line Terminal in Edmonton, Alberta, Canada, is complete. The 12-tank, 4.8 million barrel facility is fully contracted with long-term, firm take-or-pay agreements with creditworthy customers. The 50-50 joint venture crude oil merchant storage terminal developed by KML and Keyera Corp. was completed on time and under budget, with Kinder Morgan investing approximately $357 million.
Permitting efforts continue on the distillate storage expansion project at our Vancouver Wharves Terminal in North Vancouver, B.C. The $43 million capital project includes the construction of two new distillate tanks with combined storage capacity of 200,000 barrels and enhancements to the railcar unloading capabilities. The project is supported by a 20-year initial term, take-or-pay contract with an affiliate of a large international integrated energy company and is expected to be placed in service in the first quarter of 2021.
As previously disclosed in prior reports, a material contractual arrangement at the Edmonton Rail Terminal expires in April 2020 and includes a right of renewal on favorable terms for our customer related to rail terminal and associated pipeline connection service fees. We expect this will result in lower revenues of approximately $43.0 million and $11.0 million on an annual basis for rail terminal fees and associated pipeline connection fees, respectively. We expect this revenue reduction will be partially offset by expansion projects as well as favorable renewal rates on expiring contracts at our other terminal facilities.
In addition, at our Edmonton South Terminal, two of our 15 leased tanks, which generate approximately $6.5 million of annual Adjusted EBITDA, net of associated tank lease costs, are expected to be recalled into regulated service upon the in-service date of the TMEP.
39
General
Our reportable business segments are based on the way our management organizes our enterprise. Each of our reportable business segments represents a component of the enterprise that engages in a separate business activity and for which discrete financial information is available. Our reportable business segments consist of:
•Terminals - the ownership and operations of liquid product storage and rail terminals in the Edmonton, Alberta market as well as a predominantly dry cargo import/export facility in North Vancouver, B.C.; and
•Pipelines - the ownership and operations of Cochin and Jet Fuel.
Critical Accounting Policies and Estimates
Accounting standards require information in financial statements about the risks and uncertainties inherent in significant estimates, and the application of GAAP involves the exercise of varying degrees of judgment. Certain amounts included in or affecting our consolidated financial statements and related disclosures must be estimated, requiring us to make certain assumptions with respect to values or conditions that cannot be known with certainty at the time such financial statements are prepared. These estimates and assumptions affect the amounts we report for our assets and liabilities, our revenues and expenses during the reporting period, and our disclosure of contingent assets and liabilities at the date of our financial statements. We routinely evaluate these estimates, utilizing historical experience, consultation with experts and other methods we consider reasonable in the particular circumstances. Nevertheless, actual results may differ significantly from our estimates, and any effects on our business, financial position or results of operations resulting from revisions to these estimates are recorded in the period in which the facts that give rise to the revision become known. Significant estimates and judgments made by management in the preparation of our consolidated financial statements are outlined below.
Impairment of Long-lived Assets
We evaluate long-lived assets for impairment whenever events or changes in circumstances indicate that our carrying amount of an asset may not be recoverable. Impairment losses may be recognized on long-lived assets when estimated future cash flows expected to result from use of the asset and its eventual disposition is less than its carrying amount. We had no long-lived asset impairments during the years ended December 31, 2018, 2017 and 2016.
Depreciation
Depreciation of our assets, except Cochin, is recorded on a straight-line basis over their estimated useful lives. For Cochin assets, we apply a composite depreciation rate to the total cost of the composite group until the net book value equals the salvage value. The computation of depreciation requires the use of management estimates of our assets' useful lives. When it is determined that the estimated service life of an asset no longer reflects the expected remaining period of benefit, prospective changes are made to the estimated service life.
Income Taxes
The calculation of income tax assets or liabilities is based on assumptions about the timing of many taxable events and the enacted or substantively enacted rates anticipated to be applicable to income in the years in which temporary differences are expected to be realized or reversed.
Contingent Liabilities
Provisions recognized are based on management’s judgment about assessing contingent liabilities and timing, scope and amount of liabilities including liabilities relating to legal and environmental matters. Management uses judgment in determining the likelihood of realization of contingent liabilities to determine the outcome of contingencies.
Transactions with Affiliates
We have transactions with Kinder Morgan and its subsidiaries. Refer to accompanying consolidated balance sheets for the amounts due to or from affiliates and Note 14 “Transactions with Related Parties” to our consolidated financial statements for the identification of revenue and expenses with affiliated parties included in the accompanying consolidated statements of income. Accounts receivable-affiliate and accounts payable-affiliate are non-interest-bearing and are settled on demand, and subsequent to our IPO, settled monthly.
40
Other Risk Management Activities
For a further discussion of the risks and trends that could affect our financial performance and the steps that we take to mitigate these risks, see Note 17 “Risk Management and Financial Instruments” to our consolidated financial statements.
Results of Operations
We evaluate the performance of our reportable business segments by evaluating the EBDA of each segment (“Segment EBDA”). We believe that Segment EBDA is a useful measure of our operating performance because it measures segment operating results before D&A and certain expenses that are generally not controllable by our business segment operating managers, such as certain general and administrative expense, interest expense, net, and income tax expense, and prior to their pay off in the second quarter of 2017, the foreign exchange losses (or gains) on the KMI Loans. Our general and administrative expenses include such items as employee benefits, insurance, rentals, certain litigation, and shared corporate services including accounting, information technology, human resources and legal services. See Note 19 “Reportable Segments” to our consolidated financial statements for further discussion of our reportable business segments.
Consolidated Earnings Results
| Year Ended December 31, | 2018 | 2017 | 2016 | ||||||||||||||
| (In millions of Canadian dollars) | |||||||||||||||||
| Segment EBDA(a) | |||||||||||||||||
| Terminals(b) | 193.2 | 162.8 | 159.2 | ||||||||||||||
| Pipelines | 39.0 | 19.1 | 29.8 | ||||||||||||||
| Total segment EBDA(a) | 232.2 | 181.9 | 189.0 | ||||||||||||||
| D&A | (82.6) | (71.7) | (64.2) | ||||||||||||||
| Foreign exchange gain on the KMI Loans(c) | — | 0.2 | 13.2 | ||||||||||||||
| General and administrative expenses(d) | (39.0) | (30.9) | (25.7) | ||||||||||||||
| Interest income (expense), net(e) | 27.2 | (8.2) | (18.5) | ||||||||||||||
| Income from continuing operations before income taxes | 137.8 | 71.3 | 93.8 | ||||||||||||||
| Income tax expense | (37.8) | (20.8) | (23.4) | ||||||||||||||
| Income from continuing operations | 100.0 | 50.5 | 70.4 | ||||||||||||||
| Income from discontinued operations, net of tax(f) | 1,318.2 | 110.2 | 131.4 | ||||||||||||||
| Net income | 1,418.2 | 160.7 | 201.8 | ||||||||||||||
| Preferred share dividends | (28.8) | (6.6) | — | ||||||||||||||
| Net income attributable to Kinder Morgan interest | (973.2) | (126.2) | (201.8) | ||||||||||||||
| Net income available to Restricted Voting Stockholders | 416.2 | 27.9 | — | — | |||||||||||||
_________
a.Represents Segment EBDA from continuing operations. Includes revenues and other (income) expense less operating expenses and other, net. Operating expenses primarily include operations and maintenance expenses, and taxes, other than income taxes. Segment EBDA for the year ended December 31, 2018, 2017 and 2016 include $0.1 million, $(5.3) million and $1.4 million, respectively, of foreign exchange gain (losses) due to changes in exchange rates between the Canadian dollar and the U.S. dollar on U.S. dollar denominated balances.
b.Segment EBDA for the year ended December 31, 2018 includes an increase to earnings of $9.6 million for a certain item described in footnote (a) to the “—Segment Earnings Results—Terminal Segment” table below.
c.The KMI Loans, which represented U.S. dollar denominated long-term notes payable with Kinder Morgan, were settled with proceeds from our IPO. The foreign exchange gain on the KMI Loans represents a certain item.
d.General and administrative expenses for the year ended December 31, 2018 and 2017 includes increases to expense of $5.5 million and $2.8 million, respectively, for certain items described in footnote (a) to the “—Segment Earnings Results—General and Administrative Expense” table below.
e.Interest income (expenses), net for the year ended December 31, 2018 includes a decrease to interest income of $1.0 million for a certain item described in footnote (a) to the “—Segment Earnings Results—Interest (income) expense, net” table below.
f.Includes certain items summarized in footnote (b) to the “—Segment Earnings Results—Income from Discontinued Operations, Net of Tax” table below.
41
Year Ended December 31, 2018 vs 2017
The certain items described in footnotes (b) through (e) to the table above accounted for a $5.7 million increase in income from continuing operations before income taxes for the year ended December 2018 as compared to the prior year period. After giving effect to these certain items, the $60.8 million increase from prior year in income from continuing operations before income taxes is primarily attributable to higher interest income due to deposits of the proceeds from the Trans Mountain Transaction in interest bearing cash equivalent accounts and increased earnings from both of our segments.
Year Ended December 31, 2017 vs 2016
The certain items described in footnotes (b) through (e) to the table above accounted for a $15.8 million decrease in income from continuing operations before income taxes for the year ended December 31, 2017 as compared to the same prior year period. After giving effect to these certain items, the $6.7 million decrease from 2016 in income from continuing operations before income taxes is primarily attributable to lower earnings from our Pipelines segment, increased D&A expense from assets being placed in service, and increased general and administrative expense driven by legal and audit fees related to Company financing activities, partially offset by lower interest expense primarily due to the 2017 settlement of the KMI Loans.
Non-GAAP Financial Measures
In addition to using measures prescribed by GAAP, we use DCF (both in the aggregate and per share), net income before interest expense, taxes, D&A and adjusted for certain items (“Adjusted EBITDA”), which are financial measures that do not have any standardized meaning as prescribed by GAAP (“non-GAAP measures”). DCF and Adjusted EBITDA should not be considered alternatives to GAAP net cash provided by operating activities or net income, computed under GAAP or any other GAAP measures, and such non-GAAP measures have important limitations as analytical tools. The computations of DCF and Adjusted EBITDA may differ from similarly titled measures used by others. Accordingly, the use of such terms may not be comparable to similarly defined measures presented by other entities and investors should not consider these non-GAAP measures in isolation or as a substitute for an analysis of results reported under GAAP. Management compensates for the limitations of these non-GAAP measures by reviewing our comparable GAAP measures, understanding the differences between the measures and taking this information into account in its analysis and its decision-making processes.
DCF is net income before D&A adjusted for (i) income tax expense and cash income taxes (paid) refunded; (ii) sustaining capital expenditures; and (iii) certain items that are items that are required by GAAP to be reflected in net income, but typically either (a) do not have a cash impact (for example, unrealized and realized foreign exchange gains and losses on the KMI loans and asset impairments), or (b) by their nature are separately identifiable from our normal business operations and in our view are likely to occur only sporadically (for example, certain gains or losses on asset sales, divestiture costs, legal
settlements and casualty losses).
DCF is an important performance measure used by us and by external users of our financial statements to evaluate our performance and to measure and estimate our ability to generate cash earnings after servicing our debt and preferred stock dividends, paying cash taxes and expending sustaining capital, that could be used for discretionary purposes such as distributions or expansion capital expenditures. We use this performance measure and believe it provides users of our financial statements a useful performance measure reflective of our ability to generate cash earnings to supplement the comparable GAAP measure. DCF should not be used as an alternative to net cash provided by operating activities computed under GAAP. We believe the GAAP measure most directly comparable to DCF is net income. DCF per split-adjusted restricted voting share is DCF divided by average outstanding split-adjusted restricted voting shares, including stock awards that participate in dividends.
Discontinued Operations are included in our non-GAAP measures in the accompanying tables for the years ended December 31, 2017 and 2018 (which includes those discontinued operations for period from January 1, 2018 to the close of the Trans Mountain Transaction on August 31, 2018). The non-GAAP measures, DCF from discontinued operations and Adjusted EBITDA from discontinued operations, are reconciled to income from discontinued operations, the most directly comparable GAAP measure in note (d) to the following tables.
Non-GAAP measures from continuing operations reflect our ongoing operations and have been presented as DCF from continuing operations and Adjusted EBITDA from continuing operations. In addition, DCF per restricted voting share presented herein reflects our January 4, 2019 one-for-three reverse stock split and is presented as DCF from continuing operations per split-adjusted restricted voting share for all periods presented. The most comparable GAAP measure to the these two non-GAAP measures from continuing operations is income from continuing operations and the following tables include reconciliations of the these two non-GAAP measures to income from continuing operations. In addition, our aggregate DCF and Adjusted EBITDA are presented in the following tables.
42
Reconciliation of Income from continuing operations to DCF
| Year Ended December 31, | 2018 | 2017 | 2016 | ||||||||||||||
| (In millions of Canadian dollars, except per share amounts) | |||||||||||||||||
| Income from continuing operations | 100.0 | 50.5 | 70.4 | ||||||||||||||
| Continuing operations - reconciling items - add/(subtract): | |||||||||||||||||
| Certain items before book tax(a) | (3.1) | 2.6 | (13.2) | ||||||||||||||
| Book tax certain items(b) | 0.9 | (0.7) | |||||||||||||||
| D&A | 82.6 | 71.7 | 64.2 | ||||||||||||||
| Total book taxes before certain items | 36.9 | 21.5 | 23.4 | ||||||||||||||
| Cash taxes | (8.5) | (0.2) | (0.8) | ||||||||||||||
| Preferred share dividends | (28.8) | (6.6) | — | ||||||||||||||
| Sustaining capital expenditures | (18.5) | (17.9) | (12.7) | ||||||||||||||
| DCF from continuing operations | 161.5 | 120.9 | 131.3 | ||||||||||||||
| DCF from discontinued operations(d) | 151.3 | 201.8 | 186.9 | ||||||||||||||
| DCF | 312.8 | 322.7 | 318.2 | ||||||||||||||
| DCF from continuing operations to KMI interest | 113.5 | 90.2 | — | ||||||||||||||
| DCF from continuing operation to Restricted Voting Stockholders | 48.0 | 30.7 | — | ||||||||||||||
| Weighted average split-adjusted Restricted Voting Shares outstanding for dividends (in millions)(c) | 34.9 | 34.6 | — | ||||||||||||||
| DCF from continuing operations per split-adjusted Restricted Voting Share | 1.38 | 0.89 | — | ||||||||||||||
Adjusted EBITDA is used by us and by external users of our financial statements, in conjunction with outstanding debt, net of cash, to evaluate certain leverage metrics. We do not allocate Adjusted EBITDA amongst equity interest holders as we view total Adjusted EBITDA as a measure against our overall leverage.
Reconciliation of Net Income to Adjusted EBITDA
| Year Ended December 31, | 2018 | 2017 | 2016 | ||||||||||||||
| (In millions of Canadian dollars) | |||||||||||||||||
| Income from continuing operations | 100.0 | 50.5 | 70.4 | ||||||||||||||
| Continuing operations - reconciling items - add/(subtract): | |||||||||||||||||
| Total certain items, net of tax(a) | (2.2) | 1.9 | (13.2) | ||||||||||||||
| D&A | 82.6 | 71.7 | 64.2 | ||||||||||||||
| Total book taxes before certain items | 36.9 | 21.5 | 23.4 | ||||||||||||||
| Interest (income) expense, net before certain items | (28.2) | 8.2 | 18.5 | ||||||||||||||
| Adjusted EBITDA from continuing operations | 189.1 | 153.8 | 163.3 | ||||||||||||||
| Adjusted EBITDA from discontinued operations(d) | 163.4 | 234.5 | 232.2 | ||||||||||||||
| Adjusted EBITDA | 352.5 | 388.3 | 395.5 | ||||||||||||||
_________
a.Consists of certain items summarized in footnotes (b) through (e) to the “—Consolidated Earnings Results” table included above, and described in more detail below in the footnotes to tables included in our management’s discussion and analysis of segment results, “—Segment Earnings Results,” “—Segment Earnings Results—General and Administrative,” “—Segment Earnings Results—Interest (income) expense, net. ”
b.Represents income tax provision on certain items.
c.Includes stock awards of restricted voting shares that participate in dividends. Also, the 2017 weighted average Restricted Voting Shares outstanding for dividends calculation is based on the actual days in which the shares were outstanding for the period from May 30, 2017 to June 30, 2017. Therefore, the amounts differ from the GAAP weighted average Restricted Voting Shares outstanding from the date of our formation.
43
d.DCF from discontinued operations and Adjusted EBITDA from discontinued operations reconciliations are as follows:
DCF from discontinued operations:
| Year Ended December 31, | 2018 | 2017 | 2016 | ||||||||||||||
| (In millions of Canadian dollars) | |||||||||||||||||
| Income from discontinued operations, net of tax | 1,318.2 | 110.2 | 131.4 | ||||||||||||||
| Discontinued operations reconciling items - add/(subtract): | |||||||||||||||||
| Certain items before book tax(1) | (1,129.2) | 2.6 | (16.5) | ||||||||||||||
| Book tax certain items(1) | (101.4) | (0.7) | |||||||||||||||
| D&A | 46.8 | 70.7 | 73.0 | ||||||||||||||
| Total book taxes before certain items | 35.5 | 44.1 | 32.9 | ||||||||||||||
| Cash taxes | — | — | (0.4) | ||||||||||||||
| Sustaining capital expenditures | (18.6) | (25.1) | (33.5) | ||||||||||||||
| DCF from discontinued operations | 151.3 | 201.8 | 186.9 | ||||||||||||||
Adjusted EBITDA from discontinued operations:
| Year Ended December 31, | 2018 | 2017 | 2016 | ||||||||||||||
| (In millions of Canadian dollars) | |||||||||||||||||
| Income from discontinued operations, net of tax | 1,318.2 | 110.2 | 131.4 | ||||||||||||||
| Discontinued operations reconciling items - add/(subtract): | |||||||||||||||||
| Total certain items(1) | (1,230.6) | 1.9 | (16.5) | ||||||||||||||
| D&A | 46.8 | 70.7 | 73.0 | ||||||||||||||
| Total book taxes before certain items | 35.5 | 44.1 | 32.9 | ||||||||||||||
| Interest, net before certain items | (6.5) | 7.6 | 11.4 | ||||||||||||||
| Adjusted EBITDA from discontinued operations | 163.4 | 234.5 | 232.2 | ||||||||||||||
_________
1. Described in more detail below in the footnotes to tables included in our management’s discussion and analysis of segment results “—Segment Earnings Results —Income from Discontinued Operations, Net of Tax” below.
Segment EBDA Before Certain Items
Segment EBDA before certain items (a non-GAAP measure) is used by management in its analysis of segment performance and management of our business. General and administrative expenses are generally not under the control of our segment operating managers, and therefore, are not included when we measure business segment operating performance. We believe Segment EBDA before certain items is a significant performance metric because it provides us and external users of our financial statements additional insight into the ability of our segments to generate segment cash earnings on an ongoing basis. We believe it is useful to investors because it is a performance measure that management uses to allocate resources to our segments and assess each segment’s performance. We believe the GAAP measure most directly comparable to Segment EBDA before certain items is Segment EBDA.
In the tables for each of our business segments under “—Segment Earnings Results” below, Segment EBDA before certain Items is calculated by adjusting the Segment EBDA for the applicable certain item amounts, which are totaled in the tables and described in the footnotes to those tables (if any).
Segment EBDA and Segment EBDA before certain items excludes discontinued operations for all periods presented, see “—Segment Earnings Results—Income from Discontinued Operations, Net of Tax” below.
44
Segment Earnings Results
Terminals Segment
| Year Ended December 31, | 2018 | 2017 | 2016 | ||||||||||||||||||||||||||
| (In millions of Canadian dollars, except operating statistics) | |||||||||||||||||||||||||||||
| Revenues | 321.6 | 298.6 | 287.5 | ||||||||||||||||||||||||||
| Operating expenses, except D&A | (137.6) | (136.9) | (129.6) | ||||||||||||||||||||||||||
| Other income (expense), net | 9.3 | (3.1) | (0.2) | ||||||||||||||||||||||||||
| Other, net and unrealized foreign exchange gain (loss) | (0.1) | 4.2 | 1.5 | ||||||||||||||||||||||||||
| Segment EBDA | 193.2 | 162.8 | 159.2 | ||||||||||||||||||||||||||
| Certain items(a) | (9.6) | — | — | ||||||||||||||||||||||||||
| Segment EBDA before certain items | 183.6 | 162.8 | 159.2 | ||||||||||||||||||||||||||
| Change from prior period | Increase/(Decrease) | ||||||||||||||||||||||||||||
| Revenues | 23.0 | 11.1 | |||||||||||||||||||||||||||
| Segment EBDA before certain items | 20.8 | 3.6 | |||||||||||||||||||||||||||
| Operating statistics | 2018 | 2017 | 2016 | ||||||||||||||||||||||||||
| Bulk transload tonnage (MMtonnes) | 4.1 | 4.5 | 4.3 | ||||||||||||||||||||||||||
| Liquids tankage capacity available for service (MMBbl)(b) | 9.6 | 7.3 | 7.3 | ||||||||||||||||||||||||||
| Liquids utilization %(c) | 100 | % | 100 | % | 100 | % | |||||||||||||||||||||||
________
a.Represents the gain on sale of certain assets.
b.Includes our share of joint venture capacity.
c.The ratio of our tankage capacity in service to tankage capacity available for service.
In the two following tables are the changes in both Segment EBDA before certain items and revenues between 2018 and 2017, and between 2017 and 2016:
| Year Ended December 31, 2018 versus Year Ended December 31, 2017 | ||||||||||||||||||||||||||||||||||||||||||||
Segment EBDA before certain items increase/(decrease) | Revenues increase/(decrease) | |||||||||||||||||||||||||||||||||||||||||||
| (In millions of Canadian dollars, except percentages) | ||||||||||||||||||||||||||||||||||||||||||||
| Base Line Terminal joint venture | 24.9 | n/a | 28.0 | n/a | ||||||||||||||||||||||||||||||||||||||||
| Edmonton South Terminal | 6.5 | 23 | % | 2.4 | 3 | % | ||||||||||||||||||||||||||||||||||||||
| North 40 Terminal | 5.2 | 16 | % | 5.9 | 16 | % | ||||||||||||||||||||||||||||||||||||||
| Vancouver Wharves Terminal | (2.2) | (6) | % | (4.7) | (5) | % | ||||||||||||||||||||||||||||||||||||||
| Edmonton Rail Terminal joint venture | (12.5) | (19) | % | (8.8) | (12) | % | ||||||||||||||||||||||||||||||||||||||
| All others (including eliminations) | (1.1) | 24 | % | 0.2 | 2 | % | ||||||||||||||||||||||||||||||||||||||
| Total Terminals | 20.8 | 12.8 | % | 23.0 | 7.7 | % | ||||||||||||||||||||||||||||||||||||||
________
n/a - not applicable
45
The changes in Segment EBDA before certain items for our Terminals business segment are further explained by the following discussion of the significant factors driving Segment EBDA before certain items in the comparable years of 2018 and 2017:
•increase of $24.9 million from Base Line Terminal joint venture as a result of the new tanks being placed into service in 2018;
•increase of $6.5 million (23%) from Edmonton South Terminal primarily due to higher rates on re-contracted tank leases and a decline in tank lease costs;
•increase of $5.2 million (16%) from North 40 Terminal primarily from increase in revenues due to higher rates on re-contracted tank leases;
•decrease of $2.2 million (6%) from Vancouver Wharves Terminal primarily due to lower agricultural product volumes and a 2017 contract buyout; and
•decrease of $12.5 million (19%) from Edmonton Rail Terminal joint venture primarily due to expiration of a third party rail terminaling contract and a 2017 adjustment in terminal fees in connection with a favorable arbitration ruling.
| Year Ended December 31, 2017 versus Year Ended December 31, 2016 | ||||||||||||||||||||||||||||||||||||||||||||
Segment EBDA before certain items increase/(decrease) | Revenues increase/(decrease) | |||||||||||||||||||||||||||||||||||||||||||
| (In millions of Canadian dollars, except percentages) | ||||||||||||||||||||||||||||||||||||||||||||
| Edmonton Rail Terminal joint venture | 8.0 | 14 | % | 5.4 | 8 | % | ||||||||||||||||||||||||||||||||||||||
| Edmonton South Terminal | 1.3 | 5 | % | 3.9 | 5 | % | ||||||||||||||||||||||||||||||||||||||
| North 40 Terminal | 0.4 | 1 | % | 1.9 | 5 | % | ||||||||||||||||||||||||||||||||||||||
| Vancouver Wharves Terminal | (0.3) | (1) | % | 6.1 | 7 | % | ||||||||||||||||||||||||||||||||||||||
| Alberta Crude Terminal joint venture | (5.4) | (64) | % | (6.2) | (43) | % | ||||||||||||||||||||||||||||||||||||||
| All others (including eliminations) | (0.4) | (200) | % | — | — | % | ||||||||||||||||||||||||||||||||||||||
| Total Terminals | 3.6 | 2.3 | % | 11.1 | 3.9 | % | ||||||||||||||||||||||||||||||||||||||
The changes in Segment EBDA for our Terminals business segment are further explained by the following discussion of the significant factors driving Segment EBDA in the comparable years of 2017 and 2016:
•increase of $8.0 million (14%) from Edmonton Rail Terminal joint venture primarily due to an adjustment in terminal fees in connection with a favorable arbitration ruling and an increase in unrealized foreign exchange gains primarily related to U.S. dollar denominated accounts payable to Kinder Morgan;
•increase of $1.3 million (5%) from Edmonton South Terminal primarily due to higher ancillary service fees driven by escalations in fixed and take-or-pay terminaling contract rates and higher throughput volumes in 2017, partially offset by tank lease costs;
•increase of $0.4 million (1%), from North 40 Terminal primarily due to increase in revenues due to higher throughput volumes and ancillary service fees partially offset by a decrease in unrealized foreign exchange gains primarily related to a U.S. dollar denominated payable to Kinder Morgan;
•decrease of $0.3 million (1%) from Vancouver Wharves Terminal primarily due to lower margins associated with bulk handling operations partially offset by an increase in earnings related to a customer contract buy-out, net of associated project write-off costs; and
•decrease of $5.4 million (64%) from Alberta Crude Terminal joint venture which was primarily driven by a contracted throughput fee reduction.
46
Pipelines Segment
| Year Ended December 31, | 2018 | 2017 | 2016 | ||||||||||||||||||||||||||
| (In millions of Canadian dollars, except operating statistics) | |||||||||||||||||||||||||||||
| Revenues | 62.2 | 60.3 | 60.3 | ||||||||||||||||||||||||||
| Operating expenses, except D&A | (23.1) | (32.3) | (30.5) | ||||||||||||||||||||||||||
| Other income (expense), net | — | (0.3) | — | ||||||||||||||||||||||||||
| Other, net and unrealized foreign exchange loss | (0.1) | (8.6) | — | ||||||||||||||||||||||||||
| Segment EBDA | 39.0 | 19.1 | 29.8 | ||||||||||||||||||||||||||
| Change from prior period | Increase/(Decrease) | ||||||||||||||||||||||||||||
| Revenues | 1.9 | — | |||||||||||||||||||||||||||
| Segment EBDA | 19.9 | (10.7) | |||||||||||||||||||||||||||
| Operating statistics | 2018 | 2017 | 2016 | ||||||||||||||||||||||||||
| Cochin transport volumes (MBbl/d) | 83 | 86 | 84 | ||||||||||||||||||||||||||
In the two following tables are the changes in both Segment EBDA before certain items and revenues between 2018 and 2017, and between 2017 and 2016:
| Year Ended December 31, 2018 versus Year Ended December 31, 2017 | ||||||||||||||||||||||||||||||||||||||||||||
Segment EBDA before certain items increase/(decrease) | Revenues increase/(decrease) | |||||||||||||||||||||||||||||||||||||||||||
| (In millions of Canadian dollars, except percentages) | ||||||||||||||||||||||||||||||||||||||||||||
| Cochin | 19.2 | 124 | % | 1.8 | 3 | % | ||||||||||||||||||||||||||||||||||||||
| Jet Fuel and others (including eliminations) | 0.7 | 19 | % | 0.1 | 1 | % | ||||||||||||||||||||||||||||||||||||||
| Total Pipelines | 19.9 | 104.2 | % | 1.9 | 3.2 | % | ||||||||||||||||||||||||||||||||||||||
The changes in Segment EBDA for our Pipelines business segment are further explained by the following discussion of the significant factors driving Segment EBDA in the comparable years of 2018 and 2017:
•increase of $19.2 million (124%) from Cochin primarily due to a 2017 unrealized foreign exchange loss on intercompany receivables, cash, and payable balances, and a reduction in pipeline integrity expenses and outside services costs in 2018, and higher revenue due to timing on the recognition of deficiency revenue.
| Year ended December 31, 2017 versus Year ended December 31, 2016 | ||||||||||||||||||||||||||||||||||||||||||||
| Segment EBDA before certain items increase/(decrease) | Revenues increase/(decrease) | |||||||||||||||||||||||||||||||||||||||||||
| (In millions of Canadian dollars, except percentages) | ||||||||||||||||||||||||||||||||||||||||||||
| Cochin | (10.3) | (40) | % | (0.1) | — | % | ||||||||||||||||||||||||||||||||||||||
| Jet Fuel and others (including eliminations) | (0.4) | (10) | % | 0.2 | 3 | % | ||||||||||||||||||||||||||||||||||||||
| Total Pipelines | (10.7) | (35.9) | % | 0.1 | — | % | ||||||||||||||||||||||||||||||||||||||
The changes in Segment EBDA for our Pipelines business segment are further explained by the following discussion of the significant factors driving Segment EBDA in the comparable years of 2017 and 2016:
•decrease of $10.3 million (40%) from Cochin primarily resulting from unrealized foreign exchange loss on the net balance of intercompany receivables, cash, and payable balances, and higher fuel and power costs as a result of higher volumes.
47
Foreign Exchange Gain on the Long-term Debt - Affiliates (KMI Loans)
During June 2017 we repaid the principal on the KMI Loans utilizing proceeds from our IPO, and the associated notes payable were terminated. The exchange rate at the time of repayment of the notes was 1.3470 U.S. dollar per Canadian dollar. Prior to then, we were exposed to foreign currency risk related to the U.S. dollar denominated KMI Loans.
The $13.0 million unfavorable change between the year ended December 31, 2017 and 2016 on foreign exchange rate gains associated with the KMI Loans was primarily due to less strengthening of the Canadian dollar against the U.S. dollar during the 2017 period prior to the KMI Loans pay off in June 2017.
General and Administrative Expense
| Year Ended December 31, | 2018 | 2017 | 2016 | ||||||||||||||
| (In millions of Canadian dollars) | |||||||||||||||||
| General and administrative | 39.0 | 30.9 | 25.7 | ||||||||||||||
| Certain items(a) | (5.5) | (2.8) | — | ||||||||||||||
| General and administrative before certain items | 33.5 | 28.1 | 25.7 | ||||||||||||||
________
a.2018 amount represents labor expenses related to the Trans Mountain Transaction.
The $5.4 million increase in general and administrative expense before certain items of $5.5 million in 2018 as compared to the prior year was primarily driven by increased labor and insurance costs, and increased legal and audit fees, most of which related to Company financing activities.
The $2.4 million increase in general and administrative expense before certain items of $2.8 million in 2017 as compared to 2016 was primarily driven by increased benefits costs, and increased legal and audit fees related to Company financing activities.
Interest (income) expense, net
| Year Ended December 31, | 2018 | 2017 | 2016 | ||||||||||||||
| (In millions of Canadian dollars) | |||||||||||||||||
| Interest (income) expense, net | (27.2) | 8.2 | 18.5 | ||||||||||||||
| Certain items(a) | (1.0) | — | — | ||||||||||||||
| Interest (income) expense, net before certain items | (28.2) | 8.2 | 18.5 | ||||||||||||||
________
a.2018 amount represents costs associated with debt refinancing of the 2018 Credit Facility, see Note 10 “Debt” to the accompanying consolidated financial statements. Interest (income) expense is presented as net of interest income and capitalized interest.
The $36.4 million decrease in Interest (income) expense, net before certain items in 2018 as compared to 2017 was primarily driven by $29.7 million higher interest income from deposits of the Trans Mountain Transaction proceeds into interest bearing cash equivalent accounts in 2018 and $10.0 million decrease in interest expense due to the repayment of the KMI Loans, partially offset by a $3.0 million decrease of capitalized debt financing costs in 2018.
The $10.3 million decrease in Interest (income) expense, net in 2017 as compared to the prior year was primarily driven by a $11.3 million decrease in interest expense due to the 2017 repayment of the KMI Loans with proceeds from our IPO, partially offset by an increase in interest expense, including interest, commitment fees and amortization of debt issuance costs associated with our 2017 Credit Facility.
48
Income Taxes from Continuing Operations
Year Ended December 31, 2018 vs. 2017
Income tax expense for the year ended December 31, 2018 was $37.8 million as compared with the prior year income tax expense of $20.8 million. The $17.0 million increase in income tax expense was primarily due to an increase in earnings from continuing operations.
Year Ended December 31, 2017 vs. 2016
Income tax expense for the year ended December 31, 2017 was $20.8 million, as compared with the prior year income tax expense of $23.4 million. The $2.6 million decrease in income tax expense was primarily due to a decrease in pre-tax earnings from continuing operations, partially offset by capital gain tax benefits and release of valuation allowance related to exchange rate fluctuations in respect of the KMI loans in 2016.
Income from Discontinued Operations, Net of Tax
| Year Ended December 31, | 2018 | 2017 | 2016 | ||||||||||||||
| (In millions of Canadian dollars) | |||||||||||||||||
| Income from discontinued operations, net of tax(a) | 1,318.2 | 110.2 | 131.4 | ||||||||||||||
| Certain items(b)(c) | (1,230.6) | 1.9 | (16.5) | ||||||||||||||
| Income from discontinued operations, net of tax, before certain items | 87.6 | 112.1 | 114.9 | ||||||||||||||
________
a.See Note 3 “Trans Mountain Transaction” to the accompanying consolidated financial statements for the income statement line item components of income from discontinued operations.
b.The year ended December 31, 2018 includes $1,278.4 million for the gain on the Trans Mountain Transaction, (net of income tax gain of $81.4 million), approximately $42.6 million of deferred costs, net of tax, associated with our 2017 Credit Facility that were being amortized as interest expense over its term were written off and have been included as a certain item from discontinued operations, and Trans Mountain Transaction related expenses of approximately $5.2 million, net of tax.
c.The year ended December 31, 2017 and 2016 includes foreign exchange loss and (gain) on the KMI Loans allocated to the liabilities held for sale.
The $24.5 million decrease in Income from discontinued operations, net of tax before certain items for the comparable years ended 2018 and 2017 is primarily due to four less months of operations for the Trans Mountain Asset Group in 2018.
The $2.8 million decrease in Income from discontinued operations, net of tax before certain items for the comparable years ended 2017 and 2016 was primarily due to an increase in operating expenses largely due to timing of when such expenses were incurred, partially offset by an increase in capitalized equity financing costs associated with TMEP construction.
Net Income Attributable to Kinder Morgan Interest
Net income attributable to Kinder Morgan interest represents the allocation of our consolidated net income attributable to the outstanding ownership interest in our consolidated subsidiaries that are owned by Kinder Morgan's wholly owned subsidiaries. The increase in net income attributable to Kinder Morgan interest for the year ended December 31, 2018 as compared to the same period in 2017 is primarily due to the gain on the Trans Mountain Transaction. See Note 3 “Trans Mountain Transaction” to the accompanying consolidated financial statements. The decrease in net income attributable to Kinder Morgan interest for the year ended December 31, 2017 as compared to the respective prior year was primarily due to our IPO and associated reduction in Kinder Morgan's interest in us.
49
Liquidity and Capital Resources
Short-term Liquidity
As of December 31, 2018, we had $4,338.1 million of “Cash and cash equivalents” and $489.0 million of available borrowing capacity under our 2018 Credit Facility, after reducing the $500 million capacity for the $11.0 million in letters of credit issued. Of the total $11.0 million of letters of credit issued, approximately $8.0 million are issued on behalf of Trans Mountain for which it has issued a backstop letter of credit to us. Approximately $3,977.4 million of our December 31, 2018 “Cash and cash equivalents” were distributed on January 3, 2019 to holders of our Restricted Voting Shares and Special Voting Shares as a Return of Capital. We had an offsetting accrual for the shareholder approved Return of Capital within “Current liabilities—Distributions payable” and “Current liabilities-affiliates—Distributions payable” within the accompanying December 31, 2018 consolidated balance sheet. See Note 3 “Trans Mountain Transaction” to the accompanying consolidated financial statements.
As of December 31, 2018 and 2017, our principal source of short-term liquidity was our cash from operating activities of our continuing operations and our Credit Facility. We had a working capital (defined as current assets less current liabilities) deficit of $27.2 million and excess of $42.3 million as of December 31, 2018 and 2017, respectively. The $69.5 million unfavorable change from year end 2017 was primarily due to the increase in accrued taxes from the gain on the Trans Mountain Transaction, partially offset by the remaining cash proceeds from the Transaction net of accrued dividend. Generally, our working capital balance varies due to factors such as timing differences in the collection and payment of receivables and payables.
Our operations generated cash flows from operating activities of $382.0 million and $250.5 million, which included $182.3 million and $58.1 million of cash flows from operating activities from our discontinued operations, for the year ended December 31, 2018 and 2017, respectively. Also, see ‘‘—Cash Flows — Operating Activities’’ below.
We believe our cash position (net of the January 3, 2019 Return of Capital distributions of approximately $4.0 billion and accrued income taxes payable of approximately $308 million that is expected to be paid at the end of February 2019) remaining borrowing capacity on our 2018 Credit Facility, and our cash flows from operating activities from our continuing operations are adequate to allow us to manage our day-to-day cash requirements and anticipated obligations including the proposed special dividend as discussed further below.
Long-term Financing
Preferred Share Offerings
On August 15, 2017, we issued 12,000,000 Series 1 Preferred Shares to the public in Canada at a price of $25.00 per share for gross proceeds of $300.0 million. In addition, on December 15, 2017, we issued 10,000,000 Series 3 Preferred Shares to the public in Canada at a price of $25.00 per share for gross proceeds of $250.0 million. In each case, we used the proceeds to subscribe for a corresponding number of Preferred LP Units of the Limited Partnership, which then, directly or indirectly, used such proceeds to repay then outstanding indebtedness incurred to, directly or indirectly, finance the development, construction and completion, as applicable, of TMEP, which we subsequently sold in 2018, and the Base Line Terminal project.
2018 Credit Facility
Upon the closing of the Trans Mountain Transaction on August 31, 2018, we established a four-year, $500 million unsecured revolving credit facility (the “2018 Credit Facility”) for working capital purposes, replacing a temporary credit facility that was put in place following the announcement of the Trans Mountain Transaction on May 30, 2018 (the “Temporary Credit Facility”). The $132.6 million of outstanding borrowings under the Temporary Credit Facility were paid off, prior to its termination, with a portion of the Trans Mountain Transaction proceeds. As of December 31, 2018, we had no outstanding borrowings under our 2018 Credit Facility.
Material terms of the 2018 Credit Facility are described below and such description is subject to, and qualified in its entirety by, the terms of such agreements.
50
Depending on the type of loan requested, interest on the loans outstanding are calculated based on (i) a Canadian prime rate of interest; (ii) a U.S. base rate; (iii) LIBOR; or (iv) bankers' acceptance fees, plus (A) in the case of Canadian prime rate or U.S. base rate loans, an applicable margin of up to 1.25% per annum; or (B) in the case of LIBOR loans or bankers' acceptance, an applicable margin ranging from 1.00% to 2.25% per annum, with such margin determined by our then applicable debt credit rating. Standby fees for the unused portion of the 2018 Credit Facility are calculated at a rate ranging from 0.20% to 0.45% per annum based on our then applicable debt credit rating.
For the year ended December 31, 2018, we incurred, in aggregate, $1.1 million in standby fees on our available credit facilities. The 2018 Credit Facility's credit agreement contains various financial and other covenants that apply to KMCU and its subsidiaries and that are common in such agreements, including a maximum ratio of consolidated total funded debt to consolidated earnings before interest, income taxes, D&A, and non-cash adjustments as defined in the credit agreement, of 5.00:1.00, and restrictions on KMCU's ability to incur debt, grant liens, make dispositions, engage in transactions with affiliates, make restricted payments (including distributions), amend our organizational documents and engage in corporate reorganization transactions.
Credit Ratings and Capital Market Liquidity
We believe that our capital structure will continue to allow us to achieve our business objectives. We expect that our short-term liquidity needs will be met primarily through retained cash from operations or short-term borrowings. The following credit ratings information is provided as it relates to our short-term financing costs and liquidity. Specifically, credit ratings affect our ability to obtain continued financing and the cost of availability for that financing and outstanding borrowings.
The following table represents our corporate credit rating of KMCU (and the Company). KMCU is a wholly owned subsidiary of the Limited Partnership and is the borrower under the Credit Facility.
| Rating agency | Senior debt rating | Outlook | ||||||||||||
| Standard and Poor’s Rating Service | BBB | Stable | ||||||||||||
| DBRS Limited | BBB (high) | Negative | ||||||||||||
DBRS Limited also assigned a Pfd-3 (high) negative rating to our preferred shares. Moody’s Investors Service withdrew their rating following the Trans Mountain Transaction.
These securities ratings are not recommendations to purchase, hold or sell the securities in as much as such ratings do not comment as to market price or suitability for a particular investor. There is no assurance that any rating will remain in effect for any given period of time or that any rating will not be revised or withdrawn entirely by a rating agency in the future if, in its judgment, circumstances so warrant.
Capital Expenditures
We account for our capital expenditures in accordance with GAAP. We also distinguish between capital expenditures that are maintenance/sustaining capital expenditures and those that are expansion capital expenditures. Expansion capital expenditures are those expenditures that increase throughput or capacity from that which existed immediately prior to the addition or improvement, and are not deducted in calculating DCF. Sustaining capital expenditures are those which maintain throughput or capacity. The distinction between maintenance and expansion capital expenditures is a physical determination rather than an economic one, irrespective of the amount by which the throughput or capacity is increased.
Budgeting of sustaining capital expenditures is done annually on a bottom-up basis. For each of our assets, we budget for and make those sustaining capital expenditures that are necessary to maintain safe and efficient operations, meet customer needs and comply with our operating policies and applicable law. We may budget for and make additional sustaining capital expenditures that we expect will produce economic benefits such as increasing efficiency and/or lowering future expenses. Budgeting and approval of expansion capital expenditures are generally made periodically throughout the year on a project-by-project basis in response to specific investment opportunities identified by our business segments from which we generally expect to receive sufficient returns to justify the expenditures. Generally, the determination of whether a capital expenditure is classified as sustaining or as expansion capital expenditures is made on a project level. The classification of capital expenditures as expansion capital expenditures or as sustaining capital expenditures is made consistent with our accounting policies and is generally a straightforward process, but in certain circumstances can be a matter of management judgment and discretion. The classification of capital expenditures has an impact on DCF because capital expenditures that are classified as expansion capital
51
expenditures are not deducted from DCF, while those classified as sustaining capital expenditures are.
Our capital expenditures for the year ended December 31, 2018, and the amount that is expected to be spent to sustain and grow our business in 2019 are as follows:
| 2018(a) | Expected 2019 | ||||||||||
| (In millions of Canadian dollars) | |||||||||||
| Sustaining capital expenditures(b) | 18.5 | 22.1 | |||||||||
| Expansion capital expenditures(c) | 67.3 | 32.2 | |||||||||
________
a.2018 includes $16.0 million of net changes from accrued capital expenditures, contractor retainage, capitalized equity financing costs and other.
b.2018 excludes $18.6 million of TMPL sustaining capital expenditures prior to the August 31, 2018 Trans Mountain Transaction close date.
c.2018 excludes $408.0 million of TMEP expansion capital expenditures prior to the August 31, 2018 Trans Mountain Transaction close date, net of changes from accrued capital expenditures, contractor retainage, capitalized equity financing costs and other.
Off Balance Sheet Arrangements
As at December 31, 2018, we had no off balance sheet arrangements other than those included below under “—Contractual Obligations and Commercial Commitments.”
Contractual Obligations and Commercial Commitments
| Payments due by period | |||||||||||||||||||||||||||||||||||||||||||||||||||||
| Total | Less than 1 year | 1 - 3 years | 3 - 5 years | More than 5 years | |||||||||||||||||||||||||||||||||||||||||||||||||
| (In millions of Canadian dollars) | |||||||||||||||||||||||||||||||||||||||||||||||||||||
| Contractual obligations: | |||||||||||||||||||||||||||||||||||||||||||||||||||||
| Leases and rights-of-way obligations(a) | 292.3 | 61.8 | 118.9 | 102.2 | 9.4 | ||||||||||||||||||||||||||||||||||||||||||||||||
| Pension and postretirement welfare plans(b) | 1.8 | — | — | 0.1 | 1.7 | ||||||||||||||||||||||||||||||||||||||||||||||||
| Total | 294.1 | 61.8 | 118.9 | 102.3 | 11.1 | ||||||||||||||||||||||||||||||||||||||||||||||||
| Other commercial commitments: | |||||||||||||||||||||||||||||||||||||||||||||||||||||
| Standby letters of credit(c) | 11.0 | 8.0 | 3.0 | — | — | ||||||||||||||||||||||||||||||||||||||||||||||||
| Capital expenditures(d) | 20.2 | 20.2 | — | — | — | ||||||||||||||||||||||||||||||||||||||||||||||||
________
a.Represents commitments pursuant to the terms of operating lease agreements and liabilities for rights-of-way.
b.The payments by period include estimated benefit payments for unfunded plans.
c.Includes $8.0 million of Trans Mountain outstanding letters of credit for which it has issued us a backstop letter of credit and $3 million of letters for credit for our continuing operations.
d.Represents commitments for the purchase of plant, property and equipment as of December 31, 2018 including $13.8 million of our proportional share of commitments through joint ownership of a joint venture.
52
Cash Flows
The following table summarizes our net cash flows from operating, investing and financing activities for each period presented:
| Year Ended December 31, | 2018 | 2017 | 2016 | ||||||||||||||
| (In millions of Canadian dollars) | |||||||||||||||||
| Net cash provided by (used in): | |||||||||||||||||
| Operating activities | 382.0 | 250.5 | 309.9 | ||||||||||||||
| Investing activities | 3,391.7 | (635.1) | (283.2) | ||||||||||||||
| Financing activities | 324.4 | 464.9 | 59.8 | ||||||||||||||
| Change in cash, cash equivalents and restricted deposits held by the Trans Mountain Asset Group | 128.3 | (78.3) | (28.9) | ||||||||||||||
| Effect of exchange rate changes on cash, cash equivalents and restricted deposits | 1.0 | (1.1) | 0.1 | ||||||||||||||
| Net increase in Cash, Cash Equivalents and Restricted Deposits | 4,227.4 | 0.9 | 57.7 | ||||||||||||||
Operating Activities
The net increase of $131.5 million (52%) in cash provided by operating activities, including cash flows associated with the Trans Mountain Asset Group, in the year ended December 31, 2018 compared to the 2017 period was primarily attributable to:
•a $431.4 million net increase in cash associated with net changes in operating assets and liabilities, primarily attributable to the following: (i) an increase in cash associated with current income tax liabilities driven by the gain on the Trans Mountain Transaction; (ii) greater collections than refunds of Westridge Marine Terminal dock premiums; and (iii) an increase in cash due to interest payments made on the KMI Loans that were paid off in the 2017; partially offset by,
•a $299.9 million decrease in operating cash flow resulting from the combined effects of adjusting the $1,257.5 million increase in net income for the period-to-period changes in non-cash items primarily consisting of the following: (i) a $1,197.0 million before-tax gain on the Trans Mountain Transaction in 2018; (ii) deferred income taxes, including the deferred tax benefit related to the gain on the Trans Mountain Transaction in 2018; (iii) capitalized equity financing costs; (iv) unrealized changes in the foreign exchange rate; (v) D&A expense; (vi) the 2018 write-off of unamortized debt issuance costs; and (vii) other non-cash items.
The net decrease of $59.4 million (19%) in cash provided by operating activities in the year ended December 31, 2017 compared to the same period in 2016 was primarily attributable to:
•a $66.9 million net decrease in cash associated with net changes in operating assets and liabilities, primarily due to the timing of the collection of trade and affiliate receivables and payables, and due to interest payments made to Kinder Morgan subsidiaries related to the KMI Loans we paid off in 2017. These decreases were partially offset by an increase in cash due to favorable changes from the reduction in net refunds of dock premiums and toll collections related to our Westridge Marine Terminal dock customers; partially offset by,
•a $7.5 million increase in operating cash flow resulting from the combined effects of adjusting the $41.1 million decrease in net income for the period-to-period increase in non-cash items primarily consisting of the following: (i) the change in the foreign exchange rate on the KMI Loans; (ii) D&A expense; (iii) deferred income taxes; (iv) capitalized equity financing costs; and (v) other non-cash items.
53
Investing Activities
The net increase of $4,026.8 million in cash provided by investing activities in the year ended December 31, 2018 compared to the 2017 period was primarily attributable to:
•the $3,913.4 million of proceeds received from the Trans Mountain Transaction, net of cash disposed in the 2018 period;
•a $90.1 million decrease in capital expenditures primarily related to the Base Line Terminal expansion project and, to a lesser extent, the TMEP as the 2018 period includes expenditures only through the Trans Mountain Transaction in August 2018;
•a $16.2 million increase in cash due to higher proceeds received from the sales of certain assets in the 2018 period compared to the 2017 period; and
•a $7.1 million decrease in cash used due to lower contributions made to our reclamation trusts and the change in Other, net in the 2018 period compared to the 2017 period.
The $351.9 million net increase in cash used in investing activities in the year ended December 31, 2017 compared to the same period in 2016 was primarily attributable to a $349.4 million increase in capital expenditures for the TMEP, Base Line Terminal expansion project and other expansion projects.
Financing Activities
The net decrease of $140.5 million in cash provided by financing activities in the year ended December 31, 2018 compared to the 2017 period was primarily attributable to:
•a $1,671.0 million decrease in cash reflecting proceeds received from our IPO, net of fees paid, in the 2017 period;
•a $537.3 million decrease in cash reflecting proceeds received from the preferred shares issuances, net of fees paid;
•a $100.2 million increase in distributions paid to the Kinder Morgan interest in the 2018 period compared to the 2017 period;
•a $33.9 million increase in dividends paid to Restricted Voting Stockholders in the 2018 period compared to the 2017 period;
•a $23.7 million increase in dividends paid to preferred shareholders in the 2018 period compared to the 2017 period; and
•$6.0 million of payments made related to taxes withheld on vested employee restricted share unit awards in the 2018 period; partially offset by,
•a $1,606.3 million decrease in cash used reflecting repayments of the KMI Loans in the 2017 period using proceeds from our IPO;
•a $559.9 million increase in net borrowings under the Trans Mountain Non-recourse Credit Agreement in the 2018 period. See Note 10 “Debt” to the accompanying consolidated financial statements for further information; and
•a $65.4 million decrease in cash used associated with a reduction in debt issuance costs in the 2018 period compared to the 2017 period.
The net increase of $405.1 million in cash provided by financing activities in the year ended December 31, 2017, compared to the same period in 2016 was primarily attributable to:
•$1,671.0 million of proceeds from our IPO, net of fees paid;
•$536.8 million of proceeds from the preferred share issuances, net of fees paid in 2017; and
•a $21.1 million increase in cash due to the distributions we paid to Kinder Morgan in 2016 when it held 100% interest in us; partially offset by,
•a $1,676.5 million decrease in cash related to the long-term affiliate debt activity primarily due to a $1,606.3 million decrease in cash in 2017 as we paid off the KMI Loans using proceeds from our IPO;
•$74.7 million of debt issue costs paid in 2017;
•a $61.9 million decrease in cash due to the combined dividends and distributions we paid after our May 2017 IPO consisting of: (i) $41.8 million as cash distributions paid to the Kinder Morgan interest; (ii) $16.1 million as cash dividends paid to Restricted Voting Stockholders; and (iii) $4.0 million paid to preferred shareholders; and
•a $10.7 million decrease in cash due to the contribution received from Kinder Morgan in 2016.
54
Equity, Dividends and Distributions
The Limited Partnership currently makes quarterly cash distributions to the Company (as an indirect holder of Class A Units and Preferred LP Units, through the General Partner) and to Kinder Morgan (as an indirect holder of Class B Units) in accordance with the terms of the Limited Partnership Agreement. Distributions are not guaranteed and subject to the approval of the General Partner. To the extent distributions are approved, all distributions on the Class A Units and Preferred LP Units are immediately distributed by the General Partner to the Company, which then uses such to pay dividends to the holders of (i) then outstanding preferred shares of the Company (currently being Series 1 Preferred Shares and Series 3 Preferred Shares) pursuant to the terms of such preferred shares, and (ii) Restricted Voting Shares pursuant to the Company's dividend policy.
See Item 5 “Market for Registrant’s Common Equity, Related Stockholder Matters and Issuer Purchases of Equity Securities—Ownership Interests.”
Dividends on Series 1 Preferred Shares and Series 3 Preferred Shares
Dividends on the Series 1 Preferred Shares and Series 3 Preferred Shares are fixed, cumulative, preferential and $1.3125 per share and $1.3000 per share, respectively, annually, payable quarterly on the 15th day of February, May, August and November, as and when declared by our board of directors, for the initial fixed rate period to but excluding November 15, 2022 and February 15, 2023, respectively. Declared, or paid, as applicable, preferred share dividends for the year ended December 31, 2018 were as follows:
| Period | Total Series 1 quarterly dividend per share for the period | Total Series 3 quarterly dividend per share for the period(a) | Date of declaration | Date of record | Date of dividend | Total amount of dividends paid in cash | |||||||||||||||||||||||||||||||||||||||||
| (In millions of Canadian dollars, except per share amounts) | |||||||||||||||||||||||||||||||||||||||||||||||
| November 15, 2017 to February 14, 2018 (a) | 0.328125 | 0.22082 | January 17, 2018 | January 31, 2018 | February 15, 2018 | 6.1 | |||||||||||||||||||||||||||||||||||||||||
| February 15, 2018 to May 14, 2018 | 0.328125 | 0.325 | April 18, 2018 | April 30, 2018 | May 15, 2018 | 7.2 | |||||||||||||||||||||||||||||||||||||||||
| May 15, 2018 to August 14, 2018 | 0.328125 | 0.325 | July 18, 2018 | July 31, 2018 | August 15, 2018 | 7.2 | |||||||||||||||||||||||||||||||||||||||||
| August 15, 2018 to November 14, 2018 | 0.328125 | 0.325 | October 10, 2018 | October 31, 2018 | November 15, 2018 | 7.2 | |||||||||||||||||||||||||||||||||||||||||
| November 15, 2018 to February 14, 2019 | 0.328125 | 0.325 | January 16, 2019 | January 31, 2019 | February 15, 2019 | 7.2 | |||||||||||||||||||||||||||||||||||||||||
_________
a. Series 3 per share amount reflects that the shares were outstanding for 62 days during the period ended February 14, 2018.
Dividends on Restricted Voting Shares
We have established a dividend policy pursuant to which we may pay a quarterly dividend on our Restricted Voting Shares in an amount based on our portion of DCF for our business. Consistent with the annualized dividend rate we paid out for 2018, for 2019 we are targeting a declared dividend in the amount of $0.65 per Restricted Voting Share (after the January 4, 2019 Share Consolidation one-for-three basis reverse stock split) assuming the payout of substantially all of our portion of DCF excluding capitalized equity financing costs. The payment of dividends to the holders of Restricted Voting Shares is not guaranteed and the amount and timing of any dividends payable will be at the discretion of our board of directors. The actual amount of cash dividends paid to shareholders, if any, will depend on numerous factors including: (i) our results of operations; (ii) our financial requirements, including the funding of current and future growth projects; (iii) the amount of distributions paid indirectly by the Limited Partnership to us through the general partner of the Limited Partnership, including any contributions from the completion of our growth projects; (iv) the satisfaction by us and the General Partner of certain liquidity and solvency tests; (v) any agreements relating to our indebtedness or the Limited Partnership; and (vi) the cost and timely completion of current and future growth projects. Pursuant to the terms of our Preferred Shares, no dividends may be declared or paid on the Restricted Voting Shares unless all dividends on the Preferred Shares have been paid. It is expected that any quarterly dividends will be payable on or about the 45th day (or the next business day) following the end of each calendar quarter to holders of our Restricted Voting Shares of record as of the close of business on or about the last business day of the month following the end of each calendar quarter. Any dividends paid on the Restricted Voting Shares will continue to be designated as
55
“eligible dividends” for Canadian income tax purposes, unless otherwise notified, and our website includes disclosure to this effect.
In 2017, we implemented a DRIP pursuant to which Canadian-resident holders of Restricted Voting Shares were able to elect to have all cash dividends of the Company payable to any such shareholder automatically reinvested in additional Restricted Voting Shares at a price per share calculated by reference to the weighted average trading price of the Restricted Voting Shares on the TSX for the five trading days preceding the relevant dividend payment date, less a discount of between 0% and 5% (as determined from time to time by the board of directors, in its sole discretion).
Effective January 16, 2019, our board of directors suspended our DRIP until further notice. Accordingly, dividends in respect of the fourth quarter of 2018, paid on February 15, 2019 to holders of Restricted Voting Shares of record as of the close of business on January 31, 2019, were not reinvested through the DRIP. Shareholders who were enrolled in the program will automatically receive dividend payments in the form of cash. We elected to suspend our DRIP in light of our reduced need for additional capital following the Trans Mountain Transaction. If we elect to reinstate the DRIP in the future, shareholders who were enrolled in the DRIP at suspension and remained enrolled at reinstatement will automatically resume participation in the DRIP.
The following table provides information regarding dividends declared and paid, as applicable, on our Restricted Voting Shares during the year ended December 31, 2018.
| For the three month period ended | Dividend rate | Date of declaration | Date of record | Date of dividend | Total amount of dividends paid in cash(a) | Total amount of dividends paid in form of additional shares | ||||||||||||||||||||||||||||||||||||||||||||||||||
| (In millions of Canadian dollars, except per share amounts) | ||||||||||||||||||||||||||||||||||||||||||||||||||||||||
| December 31, 2017 | 0.1625 | January 17, 2018 | January 31, 2018 | February 15, 2018 | 11.8 | 5.1 | ||||||||||||||||||||||||||||||||||||||||||||||||||
| March 31, 2018 | 0.1625 | April 18, 2018 | April 30, 2018 | May 15, 2018 | 11.1 | 5.9 | ||||||||||||||||||||||||||||||||||||||||||||||||||
| June 30, 2018 | 0.1625 | July 18, 2018 | July 31, 2018 | February 15, 2018 | 13.9 | 3.1 | ||||||||||||||||||||||||||||||||||||||||||||||||||
| September 30, 2018 | 0.1625 | October 17, 2018 | October 31, 2018 | November 15, 2018 | 13.2 | 3.9 | ||||||||||||||||||||||||||||||||||||||||||||||||||
| December 31, 2018 | 0.1625 | January 16, 2019 | January 31, 2019 | February 15, 2019 | 5.7 | — | ||||||||||||||||||||||||||||||||||||||||||||||||||
_______
a.Amount includes notional dividends on outstanding restricted stock awards of $0.4 million during 2018. see Note 11 “Share-based Compensation and Benefit Plans” to the accompanying consolidated financial statements.
Distributions on the Kinder Morgan Interest
As the sole indirect holder of Class B Units, Kinder Morgan is entitled to quarterly distributions from the Limited Partnership in accordance with the terms of the Limited Partnership Agreement. Kinder Morgan also has the right to elect to reinvest all distributions payable on its Class B Units in Class B Units on the same economic terms as a holder of Restricted Voting Shares that participates in the DRIP. For a portion of 2018, KMI participated in the DRIP at a rate of 25% to provide a portion of TMEP's capital funding, but given that TMEP is no longer relevant, since July 18, 2018 KMI has ceased its participation.
56
The following table provides information regarding distributions declared and paid, as applicable, to Kinder Morgan during the year ended December 31, 2018.
| For the three month period ended | Dividend rate | Date of declaration | Date of distribution | Total amount of distribution paid in cash(a) | Total amount of distribution paid in form of additional shares | |||||||||||||||||||||||||||||||||||||||||||||
| (In millions of Canadian dollars, except per share amounts) | ||||||||||||||||||||||||||||||||||||||||||||||||||
| December 31, 2017 | 0.1625 | January 17, 2018 | February 15, 2018 | 31.0 | 9.9 | |||||||||||||||||||||||||||||||||||||||||||||
| March 31, 2018 | 0.1625 | April 18, 2018 | May 15, 2018 | 31.0 | 9.9 | |||||||||||||||||||||||||||||||||||||||||||||
| June 30, 2018 | 0.1625 | July 18, 2018 | August 15, 2018 | 40.3 | — | |||||||||||||||||||||||||||||||||||||||||||||
| September 30, 2018 | 0.1625 | October 17, 2018 | November 15, 2018 | 39.7 | — | |||||||||||||||||||||||||||||||||||||||||||||
| December 31, 2018 | 0.1625 | January 16, 2019 | February 15, 2019 | 13.2 | — | |||||||||||||||||||||||||||||||||||||||||||||
_______
a.Distributions paid in cash include U.S. income tax reimbursements related to Puget Sound earnings of $3.4 million during 2018.
Recent Accounting Pronouncements
Please refer to Note 21 “Recent Accounting Pronouncements” to our consolidated financial statements for information concerning recent accounting pronouncements.
Item 7A. Quantitative and Qualitative Disclosures About Market Risk.
Risk management is integral to the successful operation of the Company. The strategy of the Company is to align risks and related exposures with its business objectives and risk tolerance. Our financial results are subject to a number of risks as set out in Item 1A “Risk Factors.” Also, see Item 7 “Management’s Discussion and Analysis of Financial Condition and Results of Operations—Critical Accounting Policies and Estimates” above, as well as Note 17 “Risk Management and Financial Instruments” and Note 20 “Litigation, Commitments and Contingencies” to the accompanying consolidated financial statements.
Interest Rate Risk
During the year ended December 31, 2018 we incurred approximately $2.1 million of interest expense on borrowings under our credit facilities. As of December 31, 2018 and 2017 we had no debt outstanding. We are exposed to interest rate risk attributed to floating rate debt on our 2018 Credit Facility, which is used for working capital purposes. The changes in interest rates may impact future cash flows and the fair value of our financial instruments.
Foreign Currency Transactions and Translation
Foreign currency transaction gains or losses result from a change in exchange rates between the functional currency of an entity, and the currency in which a transaction is denominated. Unrealized and realized gains and losses are recorded in Foreign exchange gain (loss) in the accompanying consolidated statements of income and include:
•As a result of the Trans Mountain Transaction, we released foreign currency translation gains previously held within Accumulated other comprehensive loss to the Gain on sale of the Trans Mountain Asset Group, net of tax in the accompanying consolidated statement of income of $10.1 million for the year ended December 31, 2018.
•Prior to repayment of the KMI Loans utilizing proceeds from our IPO, we were exposed to foreign currency risk related to the U.S. dollar denominated KMI Loans. For the years ended December 31, 2017 and 2016, our continuing operations had unrealized foreign exchange gain of $0.2 million and $13.2 million, respectively, and our discontinued operations had unrealized foreign exchange (loss) and gain of $(2.6) million and $16.5 million, respectively, related to the KMI Loans.
57
•Our continuing operations unrealized foreign exchange (loss) and gain for the years ended December 31, 2018, 2017 and 2016 were $1.0 million, $(5.6) million and $1.4 million, respectively, due to changes in exchange rates between the Canadian dollar and the U.S. dollar on U.S. dollar denominated balances. These currency exchange rate fluctuations affect the expected Canadian dollar cash flows on unsettled U.S. dollar denominated transactions, primarily related to cash bank accounts that are denominated in U.S. dollars and affiliate receivables or payables that are denominated in U.S. dollars. Prior to the closing of the Trans Mountain Transaction, we translated the assets and liabilities of Puget Sound that has the U.S. dollar as its functional currency to Canadian dollars at period-end exchange rates.
•Cochin earns its revenues in U.S. dollars. Therefore, fluctuations in the U.S. dollar to Canadian dollar exchange rate can affect the earnings contributed by Cochin to our overall results. Our continuing operations had realized foreign exchange (loss) and gain of $(0.9) million and $0.3 million for the years ended December 31, 2018 and 2017. The net realized foreign exchange gains and losses were nominal in 2016.
Item 8. Financial Statements and Supplementary Data.
The information required in this Item 8 is in this report as set forth in the “Index to Financial Statements” on page 64.
Item 9. Changes in and Disagreements with Accountants on Accounting and Financial Disclosure.
None.
Item 9A. Controls and Procedures.
Conclusion Regarding the Effectiveness of Disclosure Controls and Procedures
As of December 31, 2018, our management, including our Chief Executive Officer and Chief Financial Officer, has evaluated the effectiveness of the design and operation of our disclosure controls and procedures pursuant to Rule 13a-15(b) under the Securities Exchange Act of 1934. There are inherent limitations to the effectiveness of any system of disclosure controls and procedures, including the possibility of human error and the circumvention or overriding of the controls and procedures. Accordingly, even effective disclosure controls and procedures can only provide reasonable assurance of achieving their control objectives. Based upon and as of the date of the evaluation, our Chief Executive Officer and our Chief Financial Officer concluded that the design and operation of our disclosure controls and procedures were effective to provide reasonable assurance that information required to be disclosed in the reports we file and submit under the Securities Exchange Act of 1934 is recorded, processed, summarized and reported as and when required, and is accumulated and communicated to our management, including our Chief Executive Officer and Chief Financial Officer, as appropriate, to allow timely decisions regarding required disclosure.
Management’s Report on Internal Control Over Financial Reporting
Our management is responsible for establishing and maintaining adequate internal control over financial reporting, as such term is defined in Exchange Act Rule 13a-15(f). Because of its inherent limitations, internal control over financial reporting may not prevent or detect misstatements. Projections of any evaluation of effectiveness to future periods are subject to the risk that controls may become inadequate because of changes in conditions, or that the degree of compliance with the policies or procedures may deteriorate. Under the supervision and with the participation of our management, including our Chief Executive Officer and Chief Financial Officer, we conducted an assessment of the effectiveness of our internal control over financial reporting based on the framework in Internal Control – Integrated Framework (2013) issued by the Committee of Sponsoring Organizations of the Treadway Commission. Based on this assessment, our management concluded that our internal control over financial reporting was effective as of December 31, 2018.
Changes in Internal Control Over Financial Reporting
No changes in our internal control over financial reporting occurred during the year ended December 31, 2018 that have materially affected, or are reasonably likely to materially affect, our internal control over financial reporting.
Item 9B. Other Information.
None.
58
PART III
Item 10. Directors, Executive Officers and Corporate Governance.
The information required by this item is incorporated by reference from KML’s definitive proxy statement for the 2019 Annual Meeting of Stockholders, which shall be filed no later than April 30, 2019.
Item 11. Executive Compensation.
The information required by this item is incorporated by reference from KML’s definitive proxy statement for the 2019 Annual Meeting of Stockholders, which shall be filed no later than April 30, 2019.
Item 12. Security Ownership of Certain Beneficial Owners and Management, and Related Stockholder Matters.
The information required by this item is incorporated by reference from KML’s definitive proxy statement for the 2019 Annual Meeting of Stockholders, which shall be filed no later than April 30, 2019.
Item 13. Certain Relationships and Related Transactions, and Director Independence.
Agreements between the Company and Kinder Morgan
This section provides a description of the material terms of the principal agreements among the Company, Kinder Morgan, the General Partner and/or the Limited Partnership. The description of each agreement is subject to, and qualified in its entirety by, the terms of such agreement, which is filed as an exhibit hereto. See Note 14 “Transactions with Related Parties” to our consolidated financial statements attached hereto and Item 1A “Risk Factors—Risks Relating to Our Relationship with Kinder Morgan.” For description of the material provisions of the Limited Partnership Agreement, see Item 5 “Market for Registrant’s Common Equity, Related Stockholder Matters and Issuer Purchases of Equity Securities—Ownership Interests.”
Cooperation Agreement
The Cooperation Agreement provides for certain matters among the Company, the Limited Partnership, the General Partner, Kinder Morgan (in respect of certain matters only), KMCC and KMCT. The Cooperation Agreement does not in any way limit the ability of either KMCC or KMCT to exercise its rights attached to the Special Voting Shares.
The Cooperation Agreement includes an acknowledgement by the parties that the Class A Units and the Restricted Voting Shares on the one hand and the Class B Units and the Special Voting Shares on the other hand (collectively, the “Related Securities”) are intended to convey, on a per security basis, equivalent rights to participate, directly or indirectly, in distributions of the Limited Partnership (subject to applicable taxes), the exercise of rights of limited partners and voting rights at the Company level. To the extent that any Related Securities, or any securities convertible into, or exchangeable or exercisable for, Related Securities, are issued, sold or distributed, the parties will determine whether any adjustments are required to ensure that the equivalency noted above is maintained, and in the event that an adjustment is required and subject to applicable laws, additional Related Securities, or securities convertible into or exchangeable or exercisable for Related Securities, may be issued or distributed on substantially equivalent terms, having regard to the particular attributes of the different classes of the Related Securities. In the event that any class of Related Security is subdivided, consolidated, reclassified or otherwise changed, an equivalent change will be made to the other classes of Related Securities if such a change is required to maintain the equivalency noted above. Subject to applicable laws, if there is a dispute among the parties as to whether an adjustment or change is required in order to maintain equivalency, any adjustment must be approved on behalf of the General Partner or the Company, as applicable, by both the board of directors of the General Partner or the Company, as applicable, as a whole, and the independent directors not affiliated with the Kinder Morgan Group.
Pursuant to the Cooperation Agreement, the parties thereto agreed that any acquisition or investing activity that would be material to the Company, on a consolidated basis, will only be undertaken through the Limited Partnership. In addition, Kinder Morgan has agreed that it will first offer to the Company, on behalf of the Kinder Morgan Canada Group, any crude oil, natural gas liquids or refined product infrastructure development opportunities and/or acquisition opportunities (individually an “Opportunity” and collectively the “Opportunities”) which currently have or are expected to have a majority of their physical assets and/or infrastructure within the provinces of B.C. and Alberta, except in the event of an Opportunity involving an acquisition of all or any portion of the equity of a publicly traded company or entity or an acquisition of all or substantially all of the assets of a publicly traded company or entity, in which cases Kinder Morgan, in its sole discretion, may determine to pursue the Opportunity on its own behalf. In the event there is a conflict of interest (or potential conflict of interest) between
59
one or more members of the Kinder Morgan Group and the Kinder Morgan Canada Group with respect to any matter or transaction (including a transaction involving the transfer of assets and/or liabilities from a member of the Kinder Morgan Group to a member of the Kinder Morgan Canada Group), the independent directors of the board of directors shall be responsible to take all such actions and make all such decisions (such decision to be approved, subject to applicable laws, by the majority of the independent directors of the board of directors) relating to such conflict as it pertains to the applicable member of the Kinder Morgan Canada Group.
Subject to the applicable provisions in the Cooperation Agreement described above, the Company, the General Partner and the Limited Partnership expressly consent in the Cooperation Agreement to Kinder Morgan and its affiliates that are members of the Kinder Morgan Group and their respective officers, directors and employees engaging in any business or activities whatsoever, including those that may be in competition or conflict with the business and/or the interests of, the Company.
Unless terminated earlier by written agreement of the parties, the Cooperation Agreement will terminate when no Special Voting Shares or Class B Units remain outstanding. No party to the Cooperation Agreement may assign its rights or interest thereunder without the express prior written consent of the other parties, which, in the case of the consent of KMCC or KMCT, may be granted or withheld in their sole discretion, and, in the case of the consent of any other party, will not be unreasonably withheld or delayed. Notwithstanding the foregoing, KMCC or KMCT may assign any or all of its rights or interest under the Cooperation Agreement to any affiliate of Kinder Morgan without the consent of the Company. The Cooperation Agreement may be amended from time to time by the parties, provided that if any amendment constitutes, or could reasonably be expected to constitute, a conflict of interest or potential conflict of interest between the Kinder Morgan Canada Group and the Kinder Morgan Group, subject to applicable law, such amendment must be approved on behalf of the Company or the General Partner, as applicable, by both the board of directors and the board of directors of the General Partner, as applicable, as a whole and the independent directors of each entity, as applicable, not affiliated with the Kinder Morgan Group.
Services Agreement
KMCSI assumed KMCI's rights and obligations under the Services Agreement at the closing of the Trans Mountain Transaction, whereby, the Company, the General Partner and the Limited Partnership are party to the Services Agreement pursuant to which KMCSI, an Alberta corporation which is an indirect subsidiary of the Company, provides certain operational and administrative services in connection with the management of the business and affairs of the Kinder Morgan Canada Group, or where requested, will coordinate on behalf of entities in the Kinder Morgan Canada Group to procure assistance and/or support in providing such services from its affiliates. KMCSI’s activities under the Services Agreement are subject to the supervision of the executive officers of the Company and the board of directors.
The operational and administrative services provided by KMCSI to the Company, the General Partner and the Limited Partnership under the Services Agreement include certain services to: (i) enable the Company to comply with its continuous disclosure and other obligations under applicable laws; (ii) coordinate financing and investing activities of the Company, including through the Company, the General Partner, the Limited Partnership or other entities in the Kinder Morgan Canada Group; (iii) assist with development, implementation and monitoring of operational plans for the Company; (iv) assist in implementing any dividend or distribution reinvestment plans, and any incentive plans of the Company and the Limited Partnership, as applicable; (v) facilitate performance of required acts and responsibilities in connection with the acquisition and disposition of assets and property by entities in the Kinder Morgan Canada Group; (vi) provide accounting and bookkeeping services, including for the preparation of the annual and interim financial statements of the Company and the preparation and filing of all tax returns; and (vii) arrange for audit, legal and other third party professional and non-professional services. Any support and/or assistance with any services provided by an affiliate of KMCSI outside of the Kinder Morgan Canada Group will be reimbursed at cost, unless otherwise required by applicable laws.
The Services Agreement shall continue in effect until terminated by mutual agreement of the parties. The Services Agreement may be amended from time to time by the parties, provided that if any amendment constitutes, or could reasonably be expected to constitute, a conflict of interest or potential conflict of interest between the Kinder Morgan Canada Group and the Kinder Morgan Group, subject to applicable law, such amendment must be approved on behalf of the Company or the General Partner by both the board of directors and the board of directors of the General Partner, as applicable, as a whole, and the independent directors not affiliated with the Kinder Morgan Group.
60
Independence of the Board of Directors
The board of directors is comprised of six directors, of whom Daniel P.E. Fournier, Gordon M. Ritchie and Brooke N. Wade are “independent” when applying the definition of independence under the rules of both the TSX and the NYSE.
The board of directors does not have an independent director as Chair of the Board. Rather, it has a Lead Director and has developed a procedure for the independent directors to function independently of management and, where necessary, Kinder Morgan. The board of directors has adopted a fixed in camera agenda item for each board and committee meeting, during which independent directors, under the direction of the Lead Director or committee chair, may meet without any members of management or non-independent directors present. Gordon M. Ritchie, one of our independent directors, has been appointed as Lead Director. In his role as Lead Director, Mr. Ritchie is responsible for moderating the in camera board of directors meetings held by the independent directors and acting as principal liaison between the independent directors and the Chair of the Board on matters dealt with in such in camera sessions. In the absence of the Chair of the Board, the Lead Director shall preside at meetings of the board of the directors.
Additional information required by this item is incorporated by reference from KML’s definitive proxy statement for the 2019 Annual Meeting of Stockholders, which shall be filed no later than April 30, 2019.
Item 14. Principal Accounting Fees and Services.
The information required by this item is incorporated by reference from KML’s definitive proxy statement for the 2019 Annual Meeting of Stockholders, which shall be filed no later than April 30, 2019.
On August 31, 2018, we completed the sale of the Trans Mountain Asset Group. As a result of the transaction, most of our accounting functions have been managed out of Houston, Texas. Accordingly, as previously disclosed, on October 24, 2018, we changed our principal independent registered public accountant from PricewaterhouseCoopers LLP (Canada) (“PWC Canada”) to PricewaterhouseCoopers LLP (United States) (“PWC U.S.”). This change constituted a resignation by PWC Canada and the engagement of PWC U.S. because PWC Canada and PWC U.S. are separate legal entities. The decision to change independent registered public accountants was approved by the audit committee of our board of directors on October 24, 2018.
61
PART IV
Item 15. Exhibits, Financial Statement Schedules.
a.(1) Financial Statements and (2) Financial Statement Schedules
(3) Exhibits
Exhibit
Number Description
| 2.1 | * | |||||||
| 3.1 | * | |||||||
| 3.2 | * | |||||||
| 3.3 | * | |||||||
| 3.4 | ||||||||
| 3.5 | * | |||||||
| 3.6 | * | |||||||
| 3.7 | * | |||||||
| 3.8 | * | |||||||
| 3.9 | * | |||||||
| 3.10 | * | |||||||
| 3.11 | ||||||||
| 10.1 | * | |||||||
| 10.2 | * | |||||||
| 10.3 | * | |||||||
| 10.4 | * | First Amending Agreement to the Credit Agreement, dated January 23, 2018, by and among Kinder Morgan Cochin ULC, Trans Mountain Pipeline ULC and the lenders party thereto (filed as exhibit 10.1 to the current report on Form 8-K/A of Kinder Morgan Canada Limited filed on January 23, 2018 and incorporated herein by reference) | ||||||
62
| 10.5 | * | |||||||
| 10.6 | * | |||||||
| 10.7 | * | |||||||
| 10.8 | * | |||||||
| 10.9 | * | |||||||
| 21.1 | ||||||||
| 31.1 | ||||||||
| 31.2 | ||||||||
| 32.1 | ||||||||
| 32.2 | ||||||||
101 Interactive data files pursuant to Rule 405 of Regulation S-T: (i) our Consolidated Statements of Income for the years ended December 31, 2018, 2017 and 2016; (ii) our Consolidated Statements of Comprehensive Income for the years ended December 31, 2018, 2017 and 2016; (iii) our Consolidated Balance Sheets as of December 31, 2018 and 2017; (iv) our Consolidated Statements of Cash Flows for the years ended December 31, 2018 and 2017; (v) our Consolidated Statements of Equity for the years ended December 31, 2018, 2017 and 2016; and (vi) the notes to our Consolidated Financial Statements.
_______
*Asterisk indicates exhibits incorporated by reference as indicated; all other exhibits are filed herewith, except as noted otherwise.
63
KINDER MORGAN CANADA LIMITED
INDEX TO FINANCIAL STATEMENTS
Page Number | |||||
| Consolidated Statements of Comprehensive Income for the years ended December 31, 2018, 2017 and 2016 | |||||
64
Report of Independent Registered Public Accounting Firm
To the shareholders and board of directors of Kinder Morgan Canada Limited
Opinion on the Financial Statements
We have audited the accompanying consolidated balance sheet of Kinder Morgan Canada Limited and its subsidiaries (the “Company”) as of December 31, 2018, and the related consolidated statement of income, comprehensive income, cash flows, and equity for the year then ended, including the related notes (collectively referred to as the “consolidated financial statements”). In our opinion, the consolidated financial statements present fairly, in all material respects, the financial position of the Company as of December 31, 2018, and the results of its operations and its cash flows for the year then ended in conformity with accounting principles generally accepted in the United States of America.
Basis for Opinion
These consolidated financial statements are the responsibility of the Company’s management. Our responsibility is to express an opinion on the Company’s consolidated financial statements based on our audit. We are a public accounting firm registered with the Public Company Accounting Oversight Board (United States) (PCAOB) and are required to be independent with respect to the Company in accordance with the U.S. federal securities laws and the applicable rules and regulations of the Securities and Exchange Commission and the PCAOB.
We conducted our audit of these consolidated financial statements in accordance with the standards of the PCAOB. Those standards require that we plan and perform the audit to obtain reasonable assurance about whether the consolidated financial statements are free of material misstatement, whether due to error or fraud. The Company is not required to have, nor were we engaged to perform, an audit of its internal control over financial reporting. As part of our audit we are required to obtain an understanding of internal control over financial reporting but not for the purpose of expressing an opinion on the effectiveness of the Company's internal control over financial reporting. Accordingly, we express no such opinion.
Our audit included performing procedures to assess the risks of material misstatement of the consolidated financial statements, whether due to error or fraud, and performing procedures that respond to those risks. Such procedures included examining, on a test basis, evidence regarding the amounts and disclosures in the consolidated financial statements. Our audit also included evaluating the accounting principles used and significant estimates made by management, as well as evaluating the overall presentation of the consolidated financial statements. We believe that our audit provides a reasonable basis for our opinion.
/s/PricewaterhouseCoopers LLP
| Houston, Texas February 18, 2019 | ||
We have served as the Company's auditor since 2018.
65
Report of Independent Registered Public Accounting Firm
To the shareholders and board of directors of Kinder Morgan Canada Limited
Opinion on the Financial Statements
We have audited the accompanying consolidated balance sheet of Kinder Morgan Canada Limited and its subsidiaries (together, the “Company”) as of December 31, 2017, and the related consolidated statements of income, comprehensive income, cash flows and equity for each of the two years in the period ended December 31, 2017, including the related notes (collectively referred to as the “consolidated financial statements”). In our opinion, the consolidated financial statements present fairly, in all material respects, the financial position of the Company as of December 31, 2017, and the results of its operations and its cash flows for each of the two years in the period ended December 31, 2017 in conformity with accounting principles generally accepted in the United States of America.
Basis for Opinion
These consolidated financial statements are the responsibility of the Company’s management. Our responsibility is to express an opinion on the Company’s consolidated financial statements based on our audits. We are a public accounting firm registered with the Public Company Accounting Oversight Board (United States) (PCAOB) and are required to be independent with respect to the Company in accordance with the U.S. federal securities laws and the applicable rules and regulations of the Securities and Exchange Commission and the PCAOB.
We conducted our audits of these consolidated financial statements in accordance with the standards of the PCAOB. Those standards require that we plan and perform the audit to obtain reasonable assurance about whether the consolidated financial statements are free of material misstatement, whether due to error or fraud.
Our audits included performing procedures to assess the risks of material misstatement of the consolidated financial statements, whether due to error or fraud, and performing procedures that respond to those risks. Such procedures included examining, on a test basis, evidence regarding the amounts and disclosures in the consolidated financial statements. Our audits also included evaluating the accounting principles used and significant estimates made by management, as well as evaluating the overall presentation of the consolidated financial statements. We believe that our audits provide a reasonable basis for our opinion.
/s/PricewaterhouseCoopers LLP
Chartered Professional Accountants
| Calgary, Canada February 20, 2018, except for the effects of discontinued operations discussed in Note 3 and the effects of the reverse stock split discussed in Note 13 to the consolidated financial statements, as to which the date is February 18, 2019. | ||
We served as the Company's auditor from 2016 to 2018.
66
KINDER MORGAN CANADA LIMITED
CONSOLIDATED STATEMENTS OF INCOME
(In millions of Canadian dollars, except per share amounts)
| Year Ended December 31, | 2018 | 2017 (Note 3) | 2016 (Note 3) | ||||||||||||||
| Revenues | |||||||||||||||||
| Services | 322.6 | 294.8 | 288.5 | ||||||||||||||
| Services-affiliate | 61.2 | 63.7 | 59.1 | ||||||||||||||
| Product sales and other | — | 0.4 | 0.2 | ||||||||||||||
| Total Revenues | 383.8 | 358.9 | 347.8 | ||||||||||||||
| Operating Costs, Expenses and Other | |||||||||||||||||
| Operations and maintenance | 154.5 | 162.5 | 152.8 | ||||||||||||||
| Depreciation and amortization(Note 6) | 82.6 | 71.7 | 64.2 | ||||||||||||||
| General and administrative | 39.0 | 30.9 | 25.7 | ||||||||||||||
| Taxes, other than income taxes | 6.2 | 6.7 | 7.3 | ||||||||||||||
| Other (income) expense, net | (9.3) | 3.4 | 0.2 | ||||||||||||||
| Total Operating Costs, Expenses and Other | 273.0 | 275.2 | 250.2 | ||||||||||||||
| Operating Income | 110.8 | 83.7 | 97.6 | ||||||||||||||
| Other Income (Expense) | |||||||||||||||||
| Interest income (expense), net(Note 15) | 27.2 | (8.2) | (18.5) | ||||||||||||||
| Foreign exchange gain (loss)(Note 17) | 0.1 | (5.1) | 14.6 | ||||||||||||||
| Other, net | (0.3) | 0.9 | 0.1 | ||||||||||||||
| Total Other Income (Expense) | 27.0 | (12.4) | (3.8) | ||||||||||||||
| Income from Continuing Operations Before Income Taxes | 137.8 | 71.3 | 93.8 | ||||||||||||||
| Income Tax Expense(Note 4) | (37.8) | (20.8) | (23.4) | ||||||||||||||
| Income from Continuing Operations | 100.0 | 50.5 | 70.4 | ||||||||||||||
| Discontinued Operations(Note 3) | |||||||||||||||||
| Income from operations of the Trans Mountain Asset Group, net of tax | 39.8 | 110.2 | 131.4 | ||||||||||||||
| Gain on sale of the Trans Mountain Asset Group, net of tax | 1,278.4 | — | — | ||||||||||||||
| Income from Discontinued Operations, Net of Tax | 1,318.2 | 110.2 | 131.4 | ||||||||||||||
| Net Income | 1,418.2 | 160.7 | 201.8 | ||||||||||||||
| Preferred share dividends | (28.8) | (6.6) | — | ||||||||||||||
| Net Income Attributable to Kinder Morgan Interest | (973.2) | (126.2) | (201.8) | ||||||||||||||
| Net Income Available to Restricted Voting Stockholders | 416.2 | 27.9 | — | ||||||||||||||
| Restricted Voting Shares(Note 13) | |||||||||||||||||
| Basic and Diluted Earnings Per Restricted Voting Share from Continuing Operations | 0.62 | 0.31 | — | ||||||||||||||
| Basic and Diluted Earnings Per Restricted Voting Share from Discontinued Operations | 11.37 | 0.69 | — | ||||||||||||||
| Basic and Diluted Weighted Average Restricted Voting Shares Outstanding | 34.7 | 27.6 | — | ||||||||||||||
The accompanying notes are an integral part of these consolidated financial statements.
67
KINDER MORGAN CANADA LIMITED
CONSOLIDATED STATEMENTS OF COMPREHENSIVE INCOME
(In millions of Canadian dollars)
| Year Ended December 31, | 2018 | 2017 | 2016 | ||||||||||||||
| Net income | 1,418.2 | 160.7 | 201.8 | ||||||||||||||
| Other comprehensive income (loss) | |||||||||||||||||
| Benefit plans(Note 3) | 37.5 | — | (4.7) | ||||||||||||||
| Foreign currency translation adjustments(Note 3) | (8.2) | (3.5) | (1.7) | ||||||||||||||
| Total other comprehensive income (loss) | 29.3 | (3.5) | (6.4) | ||||||||||||||
| Comprehensive income | 1,447.5 | 157.2 | 195.4 | ||||||||||||||
| Comprehensive income attributable to Kinder Morgan interest | (993.7) | (124.0) | (195.4) | ||||||||||||||
| Comprehensive income attributable to Kinder Morgan Canada Limited | 453.8 | 33.2 | — | ||||||||||||||
The accompanying notes are an integral part of these consolidated financial statements.
68
KINDER MORGAN CANADA LIMITED
CONSOLIDATED BALANCE SHEETS
(In millions of Canadian dollars, except share amounts)
| December 31, | 2018 | 2017 (Note 3) | |||||||||
| ASSETS | |||||||||||
| Current assets | |||||||||||
| Cash and cash equivalents | 4,338.1 | 110.7 | |||||||||
| Accounts receivable | 26.2 | 23.3 | |||||||||
| Inventories | 7.5 | 7.3 | |||||||||
| Current assets held for sale(Note 3) | — | 192.7 | |||||||||
| Other current assets(Note 5) | 5.9 | 6.6 | |||||||||
| Total current assets | 4,377.7 | 340.6 | |||||||||
| Property, plant and equipment, net(Note 6) | 981.3 | 988.4 | |||||||||
| Long-term assets held for sale(Note 3) | — | 3,050.4 | |||||||||
| Deferred charges and other assets(Note 7) | 10.6 | 73.3 | |||||||||
| Total Assets | 5,369.6 | 4,452.7 | |||||||||
| LIABILITIES AND EQUITY | |||||||||||
| Current liabilities | |||||||||||
| Credit facility(Note 10) | — | — | |||||||||
| Accounts payable(Note 8) | 49.4 | 54.5 | |||||||||
| Distribution payable | 1,195.1 | — | |||||||||
| Distribution payable-affiliates | 2,782.3 | — | |||||||||
| Accrued taxes | 310.6 | 8.7 | |||||||||
| Current liabilities held for sale(Note 3) | — | 207.3 | |||||||||
| Other current liabilities(Note 9) | 63.2 | 27.8 | |||||||||
| Total current liabilities | 4,400.6 | 298.3 | |||||||||
| Long-term liabilities and deferred credits | |||||||||||
| Deferred income taxes(Note 4) | 0.1 | 348.9 | |||||||||
| Contract liabilities | 67.5 | 53.5 | |||||||||
| Long-term liabilities held for sale(Note 3) | — | 113.6 | |||||||||
| Other deferred credits(Note 12) | 8.9 | 0.8 | |||||||||
| Total long-term liabilities and deferred credits | 76.5 | 516.8 | |||||||||
| Total Liabilities | 4,477.1 | 815.1 | |||||||||
| Commitments and contingencies(Notes 10 and 20) | |||||||||||
| Equity | |||||||||||
| Preferred share capital, 12,000,000 shares of Series 1 and 10,000,000 shares of Series 3, issued and outstanding(Note 13) | 537.2 | 537.2 | |||||||||
| Restricted Voting Share capital, 34,944,993 and 34,455,635 Restricted Voting Shares, respectively, issued and outstanding(Note 13) | 278.1 | 1,707.5 | |||||||||
| Retained deficit | (165.8) | (770.0) | |||||||||
| Accumulated other comprehensive loss | — | (8.8) | |||||||||
| Total Kinder Morgan Canada Limited equity | 649.5 | 1,465.9 | |||||||||
| Kinder Morgan interest, 81,353,820 and 80,960,966 Special Voting Shares, respectively, issued and outstanding(Note 13) | 243.0 | 2,171.7 | |||||||||
| Total Equity | 892.5 | 3,637.6 | |||||||||
| Total Liabilities and Equity | 5,369.6 | 4,452.7 | |||||||||
The accompanying notes are an integral part of these consolidated financial statements.
69
KINDER MORGAN CANADA LIMITED
CONSOLIDATED STATEMENTS OF CASH FLOWS
(In millions of Canadian dollars)
| Year Ended December 31, | 2018 | 2017 | 2016 | ||||||||||||||
| Operating Activities | |||||||||||||||||
| Net income | 1,418.2 | 160.7 | 201.8 | ||||||||||||||
| Non-cash items: | |||||||||||||||||
| Depreciation and amortization | 129.4 | 142.4 | 137.2 | ||||||||||||||
| Deferred income taxes | (339.9) | 57.2 | 55.1 | ||||||||||||||
| Capitalized equity financing costs | (34.8) | (29.1) | (17.9) | ||||||||||||||
| Unrealized foreign exchange (gain) loss | (0.8) | 5.6 | (32.6) | ||||||||||||||
| Write-off of unamortized debt issuance costs | 60.5 | — | — | ||||||||||||||
| Gain on sale of the Trans Mountain Asset Group(Note 3) | (1,197.0) | — | — | ||||||||||||||
| Other non-cash items | 9.4 | 8.1 | (6.2) | ||||||||||||||
| Change in operating assets and liabilities(Note 16) | 337.0 | (94.4) | (27.5) | ||||||||||||||
| Cash provided by operating activities(Note 3) | 382.0 | 250.5 | 309.9 | ||||||||||||||
| Investing Activities | |||||||||||||||||
| Capital expenditures | (528.4) | (618.5) | (269.1) | ||||||||||||||
| Contributions to trusts | (9.9) | (16.4) | (13.7) | ||||||||||||||
| Sales of property, plant and equipment, net of removal costs | 16.0 | (0.2) | (0.4) | ||||||||||||||
| Proceeds from the sale of the Trans Mountain Asset Group, net of cash disposed(Note 3) | 3,913.4 | — | — | ||||||||||||||
| Other, net | 0.6 | — | — | ||||||||||||||
| Cash provided by (used in) investing activities(Note 3) | 3,391.7 | (635.1) | (283.2) | ||||||||||||||
| Financing Activities | |||||||||||||||||
| Issuances of debt | 792.6 | 337.3 | — | ||||||||||||||
| Repayments of debt | (232.7) | (337.3) | — | ||||||||||||||
| Proceeds received from IPO, net | — | 1,671.0 | — | ||||||||||||||
| Issuances of preferred shares, net | (0.5) | 536.8 | — | ||||||||||||||
| Proceeds from debt with affiliates | — | — | 70.2 | ||||||||||||||
| Repayments of debt with affiliates | — | (1,606.3) | — | ||||||||||||||
| Cash dividends - restricted shares | (50.0) | (16.1) | — | ||||||||||||||
| Dividends - preferred shares | (27.7) | (4.0) | — | ||||||||||||||
| Distributions - Kinder Morgan interest | (142.0) | (41.8) | — | ||||||||||||||
| Debt issuance costs | (9.3) | (74.7) | — | ||||||||||||||
| Contributions from Kinder Morgan - pre-IPO | — | — | 10.7 | ||||||||||||||
| Distributions to Kinder Morgan - pre-IPO | — | — | (21.1) | ||||||||||||||
| Other, net | (6.0) | — | — | ||||||||||||||
| Cash provided by financing activities | 324.4 | 464.9 | 59.8 | ||||||||||||||
| Change in Cash, Cash Equivalents and Restricted Deposits held by the Trans Mountain Asset Group | 128.3 | (78.3) | (28.9) | ||||||||||||||
| Effect of exchange rate changes on cash, cash equivalents and restricted deposits | 1.0 | (1.1) | 0.1 | ||||||||||||||
| Net increase in Cash, Cash Equivalents and Restricted Deposits | 4,227.4 | 0.9 | 57.7 | ||||||||||||||
| Cash, Cash Equivalents and Restricted Deposits, beginning of period | 111.2 | 110.3 | 52.6 | ||||||||||||||
| Cash, Cash Equivalents and Restricted Deposits, end of period | 4,338.6 | 111.2 | 110.3 | ||||||||||||||
| Cash and Cash Equivalents, beginning of period | 110.7 | 109.8 | 52.2 | ||||||||||||||
| Restricted Deposits, beginning of period | 0.5 | 0.5 | 0.4 | ||||||||||||||
| Cash, Cash Equivalents, and Restricted Deposits, beginning of period | 111.2 | 110.3 | 52.6 | ||||||||||||||
| Cash and Cash Equivalents, end of period | 4,338.1 | 110.7 | 109.8 | ||||||||||||||
| Restricted Deposits, end of period | 0.5 | 0.5 | 0.5 | ||||||||||||||
| Cash, Cash Equivalents, and Restricted Deposits, end of period | 4,338.6 | 111.2 | 110.3 | ||||||||||||||
| Net increase in Cash, Cash Equivalents and Restricted Deposits | 4,227.4 | 0.9 | 57.7 | ||||||||||||||
| Supplemental Disclosures of Cash Flow Information | |||||||||||||||||
| Cash paid including to affiliates during the period for interest (net of capitalized interest) | — | 59.2 | 31.2 | ||||||||||||||
| Cash paid during the period for income taxes | 9.4 | 2.3 | 1.1 | ||||||||||||||
| Non-cash Investing and Financing Activities | |||||||||||||||||
| Increase in property, plant and equipment from both accruals and contractor retainage | 38.1 | 26.0 | |||||||||||||||
| Increase (decrease) in property, plant and equipment due to foreign currency translation adjustments | 1.5 | (2.8) | (4.0) | ||||||||||||||
| Distribution accruals | 3,977.4 | — | — | ||||||||||||||
The accompanying notes are an integral part of these consolidated financial statements.
70
KINDER MORGAN CANADA LIMITED
CONSOLIDATED STATEMENTS OF EQUITY
| Canadian dollars (in millions) | |||||||||||||||||||||||||||||||||||||||||||||||
| Equity attributable to Kinder Morgan pre-IPO | Retained deficit | Accumulated other comprehensive loss | Total | ||||||||||||||||||||||||||||||||||||||||||||
| Balance at December 31, 2015 | 1,464.3 | (193.8) | (19.5) | 1,251.0 | |||||||||||||||||||||||||||||||||||||||||||
| Net income | 201.8 | 201.8 | |||||||||||||||||||||||||||||||||||||||||||||
| Contributions | 10.7 | 10.7 | |||||||||||||||||||||||||||||||||||||||||||||
| Distributions | (21.1) | (21.1) | |||||||||||||||||||||||||||||||||||||||||||||
| Other comprehensive income | (6.4) | (6.4) | |||||||||||||||||||||||||||||||||||||||||||||
| Balance at December 31, 2016 | 1,475.0 | (13.1) | (25.9) | 1,436.0 | |||||||||||||||||||||||||||||||||||||||||||
| Issued shares (in millions) | Canadian dollars (in millions) | ||||||||||||||||||||||||||||||||||||||||||||||||||||||||||||||||||||||||||||||||||||||||||||||||||||||||||
| Preferred Shares | Restricted Voting Shares | Kinder Morgan Interest - Special Voting Shares | Equity attributable to Kinder Morgan pre-IPO | Preferred Share Capital | Restricted Voting Share capital | Retained deficit | Accumulated other comprehensive loss | Kinder Morgan interest | Total | ||||||||||||||||||||||||||||||||||||||||||||||||||||||||||||||||||||||||||||||||||||||||||||||||||
| Balance at December 31, 2016 | — | — | — | 1,475.0 | — | — | (13.1) | (25.9) | — | 1,436.0 | |||||||||||||||||||||||||||||||||||||||||||||||||||||||||||||||||||||||||||||||||||||||||||||||||
| Activity attributable to Kinder Morgan prior to IPO: | |||||||||||||||||||||||||||||||||||||||||||||||||||||||||||||||||||||||||||||||||||||||||||||||||||||||||||
| Equity interests issued | 126.9 | 126.9 | |||||||||||||||||||||||||||||||||||||||||||||||||||||||||||||||||||||||||||||||||||||||||||||||||||||||||
| Distribution | (261.7) | (261.7) | |||||||||||||||||||||||||||||||||||||||||||||||||||||||||||||||||||||||||||||||||||||||||||||||||||||||||
| Issuance of restricted voting shares | 34.3 | 1,750.0 | 1,750.0 | ||||||||||||||||||||||||||||||||||||||||||||||||||||||||||||||||||||||||||||||||||||||||||||||||||||||||
| Issuance of special voting shares and reallocation of Kinder Morgan pre-IPO carrying basis | 80.7 | (1,340.2) | 13.1 | 25.9 | 1,301.2 | — | |||||||||||||||||||||||||||||||||||||||||||||||||||||||||||||||||||||||||||||||||||||||||||||||||||||
| Reallocation of equity on common control transaction | (777.7) | (7.5) | 785.2 | — | |||||||||||||||||||||||||||||||||||||||||||||||||||||||||||||||||||||||||||||||||||||||||||||||||||||||
| Equity issuance fees | (13.9) | (69.9) | (83.8) | ||||||||||||||||||||||||||||||||||||||||||||||||||||||||||||||||||||||||||||||||||||||||||||||||||||||||
| Issuance of preferred shares | 22.0 | 550.0 | 550.0 | ||||||||||||||||||||||||||||||||||||||||||||||||||||||||||||||||||||||||||||||||||||||||||||||||||||||||
| Net income | 34.5 | 126.2 | 160.7 | ||||||||||||||||||||||||||||||||||||||||||||||||||||||||||||||||||||||||||||||||||||||||||||||||||||||||
| Preferred share dividend | (4.0) | (4.0) | |||||||||||||||||||||||||||||||||||||||||||||||||||||||||||||||||||||||||||||||||||||||||||||||||||||||||
| Restricted voting share dividends | (22.8) | (22.8) | |||||||||||||||||||||||||||||||||||||||||||||||||||||||||||||||||||||||||||||||||||||||||||||||||||||||||
| Special voting share distributions | (55.1) | (55.1) | |||||||||||||||||||||||||||||||||||||||||||||||||||||||||||||||||||||||||||||||||||||||||||||||||||||||||
| Dividend/Distribution reinvestment plan | 0.2 | 0.3 | 6.7 | 13.3 | 20.0 | ||||||||||||||||||||||||||||||||||||||||||||||||||||||||||||||||||||||||||||||||||||||||||||||||||||||
| Stock-based compensation | 2.2 | 2.2 | |||||||||||||||||||||||||||||||||||||||||||||||||||||||||||||||||||||||||||||||||||||||||||||||||||||||||
| Deferred tax liability adjustment | 1.1 | 18.8 | 2.8 | 22.7 | |||||||||||||||||||||||||||||||||||||||||||||||||||||||||||||||||||||||||||||||||||||||||||||||||||||||
| Other | (0.3) | 0.3 | — | ||||||||||||||||||||||||||||||||||||||||||||||||||||||||||||||||||||||||||||||||||||||||||||||||||||||||
| Other comprehensive loss | (1.3) | (2.2) | (3.5) | ||||||||||||||||||||||||||||||||||||||||||||||||||||||||||||||||||||||||||||||||||||||||||||||||||||||||
| Balance at December 31, 2017 | 22.0 | 34.5 | 81.0 | — | 537.2 | 1,707.5 | (770.0) | (8.8) | 2,171.7 | 3,637.6 | |||||||||||||||||||||||||||||||||||||||||||||||||||||||||||||||||||||||||||||||||||||||||||||||||
71
KINDER MORGAN CANADA LIMITED
CONSOLIDATED STATEMENTS OF EQUITY
| Issued shares (in millions) | Canadian dollars (in millions) | ||||||||||||||||||||||||||||||||||||||||||||||||||||||||||||||||||||||||||||||||||||||||||||||||||||
| Preferred shares | Restricted Voting Shares | Kinder Morgan Interest - Special Voting Shares | Preferred share capital | Restricted Voting Share capital | Retained deficit | Accumulated other comprehensive loss | Kinder Morgan interest | Total | |||||||||||||||||||||||||||||||||||||||||||||||||||||||||||||||||||||||||||||||||||||||||||||
| Balance at December 31, 2017 | 22.0 | 34.5 | 81.0 | 537.2 | 1,707.5 | (770.0) | (8.8) | 2,171.7 | 3,637.6 | ||||||||||||||||||||||||||||||||||||||||||||||||||||||||||||||||||||||||||||||||||||||||||||
| Net income | 445.0 | 973.2 | 1,418.2 | ||||||||||||||||||||||||||||||||||||||||||||||||||||||||||||||||||||||||||||||||||||||||||||||||||
| Preferred share dividend | (27.7) | (27.7) | |||||||||||||||||||||||||||||||||||||||||||||||||||||||||||||||||||||||||||||||||||||||||||||||||||
| Restricted voting share dividends | (68.0) | (68.0) | |||||||||||||||||||||||||||||||||||||||||||||||||||||||||||||||||||||||||||||||||||||||||||||||||||
| Special voting share distributions | (161.8) | (161.8) | |||||||||||||||||||||||||||||||||||||||||||||||||||||||||||||||||||||||||||||||||||||||||||||||||||
| Return of Capital(Note 3) | (1,195.1) | (2,782.3) | (3,977.4) | ||||||||||||||||||||||||||||||||||||||||||||||||||||||||||||||||||||||||||||||||||||||||||||||||||
| Dividend/Distribution reinvestment plan | 0.4 | 0.4 | 18.0 | 19.8 | 37.8 | ||||||||||||||||||||||||||||||||||||||||||||||||||||||||||||||||||||||||||||||||||||||||||||||||
| Stock-based compensation | 4.5 | 4.5 | |||||||||||||||||||||||||||||||||||||||||||||||||||||||||||||||||||||||||||||||||||||||||||||||||||
| Stated Capital Reduction(Note 3) | (1,450.0) | 1,450.0 | — | ||||||||||||||||||||||||||||||||||||||||||||||||||||||||||||||||||||||||||||||||||||||||||||||||||
| Other | (1.9) | 1.9 | — | ||||||||||||||||||||||||||||||||||||||||||||||||||||||||||||||||||||||||||||||||||||||||||||||||||
| Other comprehensive income | 8.8 | 20.5 | 29.3 | ||||||||||||||||||||||||||||||||||||||||||||||||||||||||||||||||||||||||||||||||||||||||||||||||||
| Balance at December 31, 2018 | 22.0 | 34.9 | 81.4 | 537.2 | 278.1 | (165.8) | — | 243.0 | 892.5 | ||||||||||||||||||||||||||||||||||||||||||||||||||||||||||||||||||||||||||||||||||||||||||||
The accompanying notes are an integral part of these consolidated financial statements.
72
KINDER MORGAN CANADA LIMITED
NOTES TO CONSOLIDATED FINANCIAL STATEMENTS
1. General
The Company was incorporated under the Business Corporations Act (Alberta) on April 7, 2017. On May 30, 2017, we completed an IPO of our Restricted Voting Shares and used the net proceeds of $1,671.0 million to acquire an approximate 30% indirect equity interest in the Limited Partnership from certain affiliates of Kinder Morgan, who retained an approximate 70% equity ownership of the limited partnership units in the Limited Partnership. When we refer to “us,” “we,” “our,” “ours,” “the Company,” or “KML,” we are describing Kinder Morgan Canada Limited.
The Limited Partnership and Kinder Morgan Canada GP Inc. (the “General Partner”), were formed under the laws of the Province of Alberta in conjunction with the IPO. After the sale of the Trans Mountain Asset Group further discussed in Note 3 , the Limited Partnership, through its ownership of KMCU, indirectly consolidates KMCSI and all or its proportion of the following operating entities (collectively the “Operating Entities”):
•KMCU
•KM Canada Marine Terminal Limited Partnership
•KM Canada North 40 Limited Partnership
•KM Canada Rail Holdings GP Limited
•KM Canada (Jet Fuel) Inc.
•KM Canada Terminals GP ULC
•KM Canada Edmonton South Rail Terminal Limited Partnership(a)
•KM Canada Edmonton North Rail Terminal Limited Partnership(a)
•Base Line Terminal East Limited Partnership(a)
_______
a.Through these wholly owned partnerships we own a 50% undivided interest in joint venture operations with unaffiliated entities that are proportionality consolidated.
The Limited Partnership is a variable interest entity because a simple majority or lower threshold of the limited partnership interests do not possess substantive “kick-out” rights (i.e., the right to remove the general partner or to dissolve (liquidate) the entity without cause) or substantive participation rights. The General Partner is the primary beneficiary because it has the power to direct the activities that most significantly impact the Limited Partnership’s performance and the right to receive benefits, and obligation to absorb losses, that could be significant to the Limited Partnership. As a result, the General Partner consolidates the Limited Partnership. The General Partner is a wholly owned subsidiary of the Company. Consequently, we indirectly consolidate the Limited Partnership and the Operating Entities in our consolidated financial statements.
Business Description
We have two business segments: (i) the Terminals segment which includes the ownership and operation of liquid product merchant storage and rail terminals in the Edmonton, Alberta market as well as a predominantly dry cargo import/export facility in Vancouver, B.C. and (ii) the Pipelines segment which owns and operates Cochin and Jet Fuel.
Our Reorganization and IPO
On May 30, 2017, we completed an IPO of 102,942,000 Restricted Voting Shares (number of shares is before our January 4, 2019 Share Consolidation, see Note 3) on the TSX at a price of $17.00 per Restricted Voting Share for total gross proceeds of approximately $1.75 billion. We used our IPO proceeds to indirectly acquire from Kinder Morgan an approximate 30% equity interest in the Limited Partnership, with Kinder Morgan retaining the remaining approximate 70% equity interest.
Concurrent with closing of our IPO, the Limited Partnership acquired an interest in the Operating Entities from KMCC and KMTU, each wholly owned subsidiaries of Kinder Morgan, in exchange for the issuance to KMCC and KMCT of Class B Units of the Limited Partnership. In addition, KMCC and KMCT were issued Special Voting Shares in the Company for nominal consideration.
73
Immediately following the closing of our IPO, we used the proceeds from our IPO to indirectly subscribe for Class A Units representing an approximate 30% economic interest in the Limited Partnership while the Class B Units held by KMCC and KMCT represent, in the aggregate, an approximate 70% economic interest in the Limited Partnership. Following the issuance of the Series 1 Preferred Shares and Series 3 Preferred Shares, the Company’s and Kinder Morgan’s respective interests in the Limited Partnership are subject to the preferred shareholders’ priority on distributions and upon liquidation.
After the completion of our IPO and the reorganization transaction described above and as of December 31, 2017, the issued and outstanding Restricted Voting Shares comprises approximately 30% of the votes attached to all outstanding Company voting shares, and the Kinder Morgan interest, which represents its indirect ownership of 100% of the Special Voting Shares, comprises approximately 70% of the votes attached to all outstanding Company voting shares.
Subsequent to our IPO, Kinder Morgan retained control of us and the Limited Partnership, and as a result we accounted for our acquisition of an approximate 30% equity interest in the Limited Partnership as a transfer of net assets among entities under common control. Therefore, our consolidated financial statements presented herein were derived from the consolidated financial statements and accounting records of Kinder Morgan. The assets and liabilities in these consolidated financial statements have been reflected at historical carrying value of the immediate parents within the Kinder Morgan organizational structure including goodwill and purchase price assigned amounts, as applicable. Prior to May 30, 2017, our historical financial statements were presented as combined consolidated financial statements derived from information included within the consolidated financial statements and accounting records of Kinder Morgan. All significant intercompany balances between the companies included in our accompanying consolidated financial statements have been eliminated.
In addition, as of and for the reporting periods after May 30, 2017, Kinder Morgan’s economic interest in the Limited Partnership is reflected within “Kinder Morgan interest” in our consolidated statements of equity and consolidated balance sheets and earnings attributable to Kinder Morgan’s economic ownership interest in the Limited Partnership is presented in “Net Income Attributable to Kinder Morgan Interest” in our consolidated statements of income.
Kinder Morgan retained control of us, therefore, the amounts recorded to “Restricted Voting Share capital,” “Retained deficit,” “Accumulated other comprehensive loss” and “Kinder Morgan interest” presented in the consolidated statement of equity for the year ended December 31, 2017 include (i) the “Issuance of special voting shares and reallocation of Kinder Morgan pre-IPO carrying basis” which represents Kinder Morgan’s pre-IPO 100% ownership interest in us including net income for the period January 1 through May 29, 2017 and (ii) the “Reallocation of equity on common control transaction” which represents the difference between our book value prior to our IPO and the proportionate ownership percentages in the book value in our net assets after our IPO.
2. Summary of Significant Accounting Policies
Basis of Presentation
In January 2018, we completed the registration of our Restricted Voting Shares pursuant to Section 12(g) of the United States Securities Exchange Act of 1934 (the “Exchange Act”) and are subject to the reporting requirements of Section 13(a) of the Exchange Act.
We have prepared the accompanying consolidated financial statements in accordance with the accounting principles contained in the FASB Accounting Standards Codification, the single source of U.S. GAAP and referred to in this report as the Codification. U.S. GAAP means generally accepted accounting principles that the SEC has identified as having substantial authoritative support, as supplemented by Regulation S-X under the U.S. Securities Exchange Commission Act of 1934, as amended from time to time. Under such rules and regulations, all significant intercompany items have been eliminated in consolidation.
Amounts are stated in Canadian dollars unless otherwise noted which is the functional currency of most of our operations. Additionally, certain amounts from prior years have been reclassified to conform to the current presentation.
Adoption of New Accounting Pronouncements
On January 1, 2018, we adopted Accounting Standards Updates (ASU) No. 2014-09, “Revenue from Contracts with Customers” and a series of related accounting standard updates designed to create improved revenue recognition and disclosure
comparability in financial statements. For more information, see “—Revenue Recognition” below and Note 18.
74
On January 1, 2018, we retroactively adopted ASU No. 2016-18, “Statement of Cash Flows (Topic 230): Restricted Cash (a consensus of the FASB Emerging Issues Task Force).” This ASU requires the statements of cash flows to present the change during the period in the total of cash, cash equivalents, and amounts generally described as restricted cash or restricted cash equivalents. Therefore, amounts generally described as restricted cash and restricted cash equivalents are now included with cash and cash equivalents when reconciling the beginning of period and end of period amounts presented on the statements of cash flows. The retrospective application of this new accounting guidance resulted in a net increase of $0.6 million and a net decrease of $0.3 million in the total consolidated cash, cash equivalents and restricted deposits, which is the included both at “Cash, Cash Equivalents and Restricted Deposits, beginning (end) of period” and at “Change in Cash and Cash Equivalents, and Restricted Deposits held by the Trans Mountain Asset Group” within our consolidated statements of cash flows, and a decrease of $0.6 million and an increase of $0.3 million in “Cash used in investing activities,” for the years ended December 2017 and 2016, respectively, from what was previously presented in our consolidated statements of cash flows in our Annual Report on Form 10-K for the year ended December 31, 2017.
Use of Estimates
Certain amounts included in or affecting our financial statements and related disclosures must be estimated, requiring us to make certain assumptions with respect to values or conditions which cannot be known with certainty at the time our financial statements are prepared. These estimates and assumptions affect the amounts we report for assets and liabilities, our revenues and expenses during the reporting period, and our disclosures, including as it relates to contingent assets and liabilities at the date of our financial statements. We evaluate these estimates on an ongoing basis, utilizing historical experience, consultation with experts and other methods considered reasonable in the particular circumstances. Nevertheless, actual results may differ significantly from our estimates. Any effects on our business, financial position or results of operations resulting from revisions to these estimates are recorded in the period in which the facts that give rise to the revision become known.
Certain accounting policies are of more significance in our financial statement preparation process than others, and set out below are the principal accounting policies we apply in the preparation of our consolidated financial statements.
Cash Equivalents and Restricted Cash
We define cash equivalents as all highly liquid short-term investments with original maturities of three months or less. Restricted cash of approximately $0.5 million as of both December 31, 2018 and 2017, is included in “Other current assets” on our accompanying consolidated balance sheets.
Accounts Receivable
We establish provisions for losses on accounts receivable due from customers if it is determined that all or part of the outstanding balance is probable of not being collected. We review collectability regularly and establish an allowance or record adjustments as necessary using the specific identification method. We had no allowance for doubtful accounts as of December 31, 2018 and 2017.
Inventories
Our inventories, which consist of materials and supplies, are valued at weighted-average cost, and we periodically review for physical deterioration and obsolescence.
Property, Plant and Equipment, net
We record property, plant and equipment at historical cost. We capitalize expenditures for construction, expansion, major renewals and betterments. We expense maintenance and repair costs as incurred. We capitalize expenditures for project development if they are expected to have future benefit. We capitalize Interest Incurred During Construction (“IDC”) for our assets.
Our assets require the use of management estimates of the useful lives of assets. Our Terminal business segment assets are depreciated on a straight-line basis over their estimated useful lives. For Cochin we apply a composite depreciation rate to the total cost of the composite group until the net book value equals the salvage value. In applying the composite method, we generally charge the original cost of property sold or retired to accumulated depreciation and amortization, plus cost of removal and less salvage value.
75
Asset Retirement Obligations (“ARO”)
We record liabilities for obligations related to the retirement and removal of long-lived assets used in our businesses. We record, as liabilities, the fair value of asset retirement obligations on a discounted basis when they are incurred and can be reasonably estimated, which is typically at the time the assets are installed or acquired. Amounts recorded for the related assets are increased by the amount of these obligations. Over time, the liabilities increase due to the change in their present value, and the initial capitalized costs are depreciated over the useful lives of the related assets. The liabilities are eventually extinguished when the asset is taken out of service.
Due to the lack of information that can be derived from past experience or industry practice, the timing and fair value of future removal and site restoration costs for our assets is not currently determinable. We have not recognized an ARO in these consolidated financial statements. Also, see Note 7 regarding the Cochin Pipeline Reclamation Trust Securities.
Long-lived Asset Impairments
We evaluate long-lived assets and investments for impairment whenever events or changes in circumstances indicate that our carrying amount of an asset or investment may not be recoverable. We recognize impairment losses when estimated future cash flows expected to result from our use of the asset and its eventual disposition is less than its carrying amount.
To the extent triggering events exist, we complete a review of the carrying value of our long-lived assets, including property, plant and equipment as well as other intangibles, and record, as applicable, the appropriate impairments. Because the impairment test for long-lived assets held in use is based on undiscounted cash flows, there may be instances where an asset or asset group is not considered impaired, even when its fair value may be less than its carrying value, because the asset or asset group is recoverable based on the cash flows to be generated over the estimated life of the asset or asset group. Our fair value estimates are generally based on assumptions market participants would use, including market data obtained through the sale process or an analysis of expected discounted future cash flows. We did not record any impairments to long-lived assets in the years ended December 31, 2018, 2017 and 2016.
Jointly controlled operations
Jointly controlled operations are assets over which we have joint ownership with unaffiliated entities and are not held in a partnership, corporation or other legal entity. We have three joint ventures that undertake terminaling activities through jointly controlled operations. We account for jointly controlled operations using the proportionate consolidation method for which (i) our consolidated balance sheets include our share of the assets that we control jointly with third parties and the liabilities for which we are jointly responsible and (ii) our consolidated statements of income include our share of the income and expenses generated by the jointly controlled operations.
Revenue Recognition
Adoption of Topic 606
Effective January 1, 2018, we adopted ASU No. 2014-09, “Revenue from Contracts with Customers” and the series of related accounting standard updates that followed (collectively referred to as “Topic 606”). We utilized the modified retrospective method to adopt Topic 606, which required us to apply the new revenue standard to (i) all new revenue contracts entered into after January 1, 2018, and (ii) revenue contracts that were not completed as of January 1, 2018. In accordance with this approach, our consolidated revenues for periods prior to January 1, 2018 were not revised. The cumulative effect of the adoption of Topic 606 as of January 1, 2018 and the impact to the financial statement line items for the current year was not material.
76
Revenue from Contracts with Customers
Beginning in 2018, we account for revenue from contracts with customers in accordance with Topic 606. The unit of account in Topic 606 is a performance obligation, which is a promise in a contract to transfer to a customer either a distinct good or service (or bundle of goods or services) or a series of distinct goods or services provided over a period of time. Topic 606 requires that a contract’s transaction price, which is the amount of consideration to which an entity expects to be entitled in exchange for transferring promised goods or services to a customer, is to be allocated to each performance obligation in the contract based on relative standalone selling prices and recognized as revenue when (point in time) or as (over time) control of the goods or services transfers to the customer and the performance obligation is satisfied.
Our customer service contracts primarily include terminaling service and transportation service contracts, as described
below. Generally, for the majority of these contracts: (i) our promise is to transfer (or stand ready to transfer) a series of distinct integrated services over a period of time, which is a single performance obligation; (ii) the transaction price includes fixed and/ or variable consideration, which amount is determinable at contract inception and/or at each month end based on our right to invoice at month end for the value of services provided to the customer that month; and (iii) the transaction price is recognized as revenue over the service period specified in the contract (which can be a day, including each day in a series of promised daily services, a month, a year, or other time increment, including a deficiency makeup period) as the services are rendered using a time-based (passage of time) or units-based (units of service transferred) output method for measuring the transfer of control of the services and satisfaction of our performance obligation over the service period, based on the nature of the promised service (e.g., firm or non-firm) and the terms and conditions of the contract (e.g., contracts with or without makeup rights).
Firm Services
Firm services (also called uninterruptible services) are services that are promised to be available to the customer at all times during the period(s) covered by the contract, with limited exceptions. Our firm service contracts are typically structured with take-or-pay or minimum volume provisions, which specify minimum service quantities a customer will pay for even if it chooses not to receive or use them in the specified service period (referred to as “deficiency quantities”). We typically recognize the portion of the transaction price associated with such provisions, including any deficiency quantities, as revenue depending on whether the contract prohibits the customer from making up deficiency quantities in subsequent periods, or the contract permits this practice, as follows:
•Contracts without Makeup Rights: If contractually the customer cannot make up deficiency quantities in future periods, our performance obligation is satisfied, and revenue associated with any deficiency quantities is generally recognized as each service period expires. Because a service period may exceed a reporting period, we determine at inception of the contract and at the beginning of each subsequent reporting period if we expect the customer to take the minimum volume associated with the service period. If we expect the customer to make up all deficiencies in the specified service period (i.e., we expect the customer to take the minimum service quantities), the minimum volume provision is deemed not substantive and we will recognize the transaction price as revenue in the specified service period as the promised units of services are transferred to the customer. Alternatively, if we expect that there will be any deficiency quantities that the customer cannot or will not make up in the specified service period (referred to as “breakage”), we will recognize the estimated breakage amount (subject to the constraint on variable consideration) as revenue ratably over such service period in proportion to the revenue that we will recognize for actual units of service transferred to the customer in the service period. For certain take-or-pay contracts where we make the service, or a part of the service, continuously available over the service period, we typically recognize the take-or-pay amount as revenue ratably over such period based on the passage of time.
77
•Contracts with Makeup Rights: If contractually the customer can acquire the promised service in a future period and make up the deficiency quantities in such future period (the “deficiency makeup period”), we have a performance obligation to deliver those services at the customer’s request (subject to contractual and/or capacity constraints) in the deficiency makeup period. At inception of the contract, and at the beginning of each subsequent reporting period, we estimate if we expect that there will be deficiency quantities that the customer will or will not make up. If we expect the customer will make up all deficiencies it is contractually entitled to, any non-refundable consideration received relating to temporary deficiencies that will be made up in the deficiency makeup period will be deferred as a contract liability, and we will recognize that amount as revenue in the deficiency makeup period when either of the following occurs: (i) the customer makes up the volumes; or (ii) the likelihood that the customer will exercise its right for deficiency volumes then becomes remote (e.g., there is insufficient capacity to make up the volumes, the deficiency makeup period expires). Alternatively, if we expect at inception of the contract, or at the beginning of any subsequent reporting period, that there will be any deficiency quantities that the customer cannot or will not make up (i.e., breakage), we will recognize the estimated breakage amount (subject to the constraint on variable consideration) as revenue ratably over the specified service periods in proportion to the revenue that we will recognize for actual units of service transferred to the customer in those service periods.
Non-Firm Services
Non-firm services (also called interruptible services) are the opposite of firm services in that such services are provided to a customer on an “as available” basis. Generally, we do not have an obligation to perform these services until we accept a customer’s periodic request for service. For the majority of our non-firm service contracts, the customer will pay only for the actual quantities of services it chooses to receive or use, and we typically recognize the transaction price as revenue as those units of service are transferred to the customer in the specified service period (typically a daily or monthly period).
Revenue Recognition Policy prior to January 1, 2018
We recognized revenue as services were rendered or goods were delivered and, if applicable, risk of loss had passed.
We recognized transportation revenues when our customers’ products were delivered and services had been provided and adjusted according to terms prescribed by the relevant toll settlements with shippers as approved by the regulator. To the extent a customer did not meet its minimum volume commitment, we generally recognized revenue when we had no further performance obligation at the contractual rate applicable to such committed volumes. If such minimum volume commitments contained make up rights, we deferred revenue until the expiration of the make-up right or when our obligation to the customer had otherwise ceased. We recognized differences between transportation revenue and actual toll receipts as regulatory assets or liabilities which were settled through future tolls.
We generally recognized bulk terminal transfer service revenues based on volumes handled. Liquids terminal warehousing revenue was generally recognized ratably over the contract period. We generally recognized liquids terminal throughput revenue based on volumes received and volumes delivered. We generally deferred revenue within the Terminals business segment related to capital improvements paid for in advance by certain customers, which we then amortized over the initial term of the related customer contracts.
Environmental Matters
We capitalize or expense, as appropriate, environmental expenditures. We capitalize certain environmental expenditures required in obtaining rights-of-way, regulatory approvals or permitting as part of construction. We accrue and expense environmental costs that relate to an existing condition caused by past operations, which do not contribute to current or future revenue generation. We generally do not discount environmental liabilities to a net present value, and we record environmental liabilities when environmental assessments and/or remedial efforts are probable and we can reasonably estimate the costs. Generally, our recording of these accruals coincides with completion of a feasibility study or our commitment to a formal plan of action. We recognize receivables for anticipated associated insurance recoveries when such recoveries are deemed to be probable. We record at estimated fair value, where appropriate, environmental liabilities assumed in a business combination.
We routinely conduct reviews of potential environmental issues and claims that could impact our assets or operations. These reviews assist us in identifying environmental issues and estimating the costs and timing of remediation efforts. We also routinely adjust our environmental liabilities to reflect changes in previous estimates. In making environmental liability estimations, we consider the material effect of environmental compliance, pending legal actions against us, and potential third-party liability claims. Often, as the remediation evaluation and effort progresses, additional information is
78
obtained, requiring revisions to estimated costs. These revisions are reflected in income in the period in which they are reasonably determinable. As of December 31, 2018, we had $0.1 million accrued for our outstanding environmental matters and no accrual at December 31, 2017.
Pension and Other Postretirement Benefits
We recognize the differences between the fair value of each of our pension and other postretirement benefit plans’ assets and the benefit obligations as either assets or liabilities on our consolidated balance sheet. We record deferred plan costs and income—unrecognized losses and gains, unrecognized prior service costs and credits, and any remaining unamortized transition obligations—in “Accumulated other comprehensive loss,” with the proportionate share associated with less than wholly owned subsidiaries allocated and included within “Kinder Morgan interest” or as a regulatory asset or liability for certain of our regulated operations, until they are amortized as a component of benefit expense. See Note 11 for additional information regarding our other postretirement benefit plans.
Kinder Morgan Interest
Kinder Morgan Interest represents the interest in our consolidated subsidiaries that are not owned by us. In our accompanying consolidated income statements, the Kinder Morgan Interest in the net income of our consolidated subsidiaries is shown as an allocation of our consolidated net income and is presented separately as “Net Income Attributable to Kinder Morgan Interest.” In our accompanying consolidated balance sheets, the Kinder Morgan interest is presented separately as “Kinder Morgan interest” within “Equity.”
Income Taxes
We record income tax expense based on an estimate of the effective tax rate in effect or to be in effect during the relevant periods. We include changes in tax legislation in the relevant computations in the period in which such changes are enacted. We do business in a number of provinces with differing laws concerning how income subject to each province’s tax regime is measured and at what effective rate such income is taxed, requiring us to estimate how our income will be apportioned among the various provinces in order to arrive at an overall effective tax rate. Changes in our effective rate, including any effect on previously recorded deferred taxes, are recorded in the period in which the need for such change is identified.
Deferred income tax assets and liabilities are recognized for temporary differences between the basis of assets and liabilities for financial reporting and tax purposes. Deferred tax assets are reduced by a valuation allowance for the amount that is, more likely than not, to not be realized. While we have considered estimated future taxable income and prudent and feasible tax planning strategies in determining the amount of our valuation allowance, any change in the amount that we expect to ultimately realize will be included in income in the period in which such a determination is reached.
Foreign Currency
Transactions in foreign currencies are initially recorded at the exchange rate in effect at the time of the transactions. Monetary assets and liabilities denominated in foreign currencies are translated to Canadian dollars using the closing exchange rate at the balance sheet date. The resulting exchange rate differences are included in the consolidated statements of income.
3. Trans Mountain Transaction
On August 31, 2018, we closed on the sale of the Trans Mountain Asset Group, which were indirectly acquired by the Government of Canada, through Trans Mountain Corporation (a subsidiary of the Canada Development Investment Corporation) for cash consideration of approximately $4.43 billion, which is the contractual purchase price of $4.5 billion net of a preliminary working capital adjustment (the “Trans Mountain Transaction”). As of December 31, 2018, we accrued for an additional $37.0 million for a final working capital adjustment that was subsequently settled in cash. The August 31, 2018 Trans Mountain Asset Group balance sheet included $502.4 million of cash and cash equivalents, along with $559.8 million of debt and $26.2 million of accumulated other comprehensive loss (which was realized as other comprehensive income, net, in our consolidated statement of comprehensive income for the year ended December 31, 2018).
Pursuant to our voting shareholders’ approval on November 29, 2018, a distribution of approximately $1.2 billion were made as a return of capital to holders of our Restricted Voting Shares ($11.40 per Restricted Voting Share) and approximately $2.8 billion to KMI as the indirect holder of our Special Voting Shares on January 3, 2019 (the “Return of Capital”). To facilitate the Return of Capital and provide flexibility for dividends going forward, our voting shareholders also
79
approved (i) the reduction of the stated capital of our Restricted Voting Shares by $1.45 billion (the “Stated Capital Reduction”) (ii) a “reverse stock split” of our Restricted Voting Shares and Special Voting Shares on a one-for-three basis (three shares consolidating to one share) (the “Share Consolidation”), which was effected on January 4, 2019. In accordance with U.S. GAAP, the Restricted Voting Shares and Special Voting Shares outstanding and earnings per share information in this report reflect the Share Consolidation for all periods presented unless otherwise noted.
We have recorded a Gain on sale of the Trans Mountain Asset Group, net of tax of $1,278.4 million as presented in the accompanying consolidated statement of income for year ended December 31, 2018. The gain included a tax benefit of approximately $81.4 million comprised of the release of deferred income taxes of approximately $389.0 million, which was partially offset by an adjustment to accrued taxes of approximately $307.6 million on the accompanying consolidated balance sheet as of December 31, 2018.
The underlying assets in the Trans Mountain Asset Group were primarily within our Pipelines business segment and the operating results for the Trans Mountain Asset Group are included in Income from operations of the Trans Mountain Asset Group, net of tax in the accompanying consolidated statements of income for the years ended December 31, 2018, 2017 and 2016. Major income and expense line items associated with the Trans Mountain Asset Group that have been presented within the caption Discontinued Operations in the accompanying consolidated statements of income were as follows:
| Year Ended December 31, | 2018(a) | 2017 | 2016 | ||||||||||||||
| (In millions of Canadian dollars) | |||||||||||||||||
| Revenues | 214.3 | 324.9 | 328.3 | ||||||||||||||
| Depreciation and amortization | (46.8) | (70.7) | (73.0) | ||||||||||||||
| Operating expenses, including general and administrative | (89.8) | (122.0) | (115.5) | ||||||||||||||
| Interest and other income (expense)(b) | (22.4) | 21.4 | 24.5 | ||||||||||||||
| Income from operations of the Trans Mountain Asset Group before income taxes | 55.3 | 153.6 | 164.3 | ||||||||||||||
| Gain on sale of the Trans Mountain Asset Group before income taxes | 1,197.0 | — | — | ||||||||||||||
| Income from Discontinued Operations before income taxes | 1,252.3 | 153.6 | 164.3 | ||||||||||||||
| Income tax benefit (expense) | 65.9 | (43.4) | (32.9) | ||||||||||||||
| Income from Discontinued Operations, Net of Tax | 1,318.2 | 110.2 | 131.4 | ||||||||||||||
The Trans Mountain Asset Group’s carrying value of assets and liabilities have been presented as held for sale in the accompanying consolidated balance sheet as of December 31, 2017 and include:
| December 31, | 2017 | |||||||
| (In millions of Canadian dollars) | ||||||||
| Cash and cash equivalents | 128.1 | |||||||
| Accounts receivable | 46.0 | |||||||
| Other current assets | 18.6 | |||||||
| Property, plant and equipment, net | 2,719.6 | |||||||
| Goodwill(c) | 248.0 | |||||||
| Non-current regulatory assets | 29.1 | |||||||
| Other non-current assets | 53.7 | |||||||
| Total assets of the Trans Mountain Asset Group | 3,243.1 | |||||||
| Credit Facility | — | |||||||
| Accounts payable | 97.6 | |||||||
| Current regulatory liabilities | 103.1 | |||||||
| Other current liabilities | 6.6 | |||||||
| Pension and postretirement benefits | 75.4 | |||||||
| Other non-current liabilities | 38.1 | |||||||
| Total liabilities of the Trans Mountain Asset Group | 320.8 | |||||||
80
Our net cash flows from operating and investing activities from the Trans Mountain Asset Group included in the accompanying consolidated statements of cash flows were as follows:
| Year Ended December 31, | 2018(a) | 2017 | 2016 | ||||||||||||||
| (Net cash provided by (used in) in millions of Canadian dollars) | |||||||||||||||||
| Operating activities | 182.3 | 58.1 | 25.5 | ||||||||||||||
| Investing activities | (507.3) | (462.6) | (190.3) | ||||||||||||||
______
a.Amounts are for the period January 1, 2018 to August 31, 2018, the closing of the Trans Mountain Transaction.
b.2018 includes approximately $60.5 million pre-tax write off of deferred financing costs, see Note 10. 2017 and 2016 amounts also include interest expenses from our credit facilities and KMI Loans that were allocated to discontinued operations for borrowings that were directly related to the Trans Mountain Asset Group.
c.Goodwill was evaluated for impairment on May 31 of each year and no impairments were recorded in 2018, 2017 and 2016.
Also, see Note 10 for information on our 4-year, $500.0 million unsecured revolving credit facility.
4. Income Taxes
Income from continuing operations before income taxes for years ended December 31, 2018, 2017, and 2016 were $137.8 million, $71.3 million, and $93.8 million, respectively.
Components of our income tax provision are as follows:
| Year Ended December 31, | 2018 | 2017 | 2016 | ||||||||||||||
| (In millions of Canadian dollars) | |||||||||||||||||
| Current tax expense (benefit) | 43.1 | 6.8 | 0.4 | ||||||||||||||
| Deferred tax expense | (5.3) | 14.0 | 23.0 | ||||||||||||||
| Total tax provision | 37.8 | 20.8 | 23.4 | ||||||||||||||
The difference between the statutory income tax rate and our effective income tax rate is summarized as follows:
| Year Ended December 31, | 2018 | 2017 | 2016 | ||||||||||||||||||||||||||||||||||||||||||||||||||
| (In millions of Canadian dollars, except percentages) | |||||||||||||||||||||||||||||||||||||||||||||||||||||
| Statutory income tax | 37.2 | 27.0 | % | 19.2 | 27.0 | % | 25.3 | 27.0 | % | ||||||||||||||||||||||||||||||||||||||||||||
| Increase (decrease) as a result of: | |||||||||||||||||||||||||||||||||||||||||||||||||||||
| Capital gains deduction | — | — | % | — | — | % | (2.0) | (2.1) | % | ||||||||||||||||||||||||||||||||||||||||||||
| Valuation allowance | (0.2) | (0.1) | % | — | — | % | (2.0) | (2.1) | % | ||||||||||||||||||||||||||||||||||||||||||||
| Tax impact on the future tax rate change | — | — | % | 0.8 | 1.1 | % | 1.9 | 2.0 | % | ||||||||||||||||||||||||||||||||||||||||||||
| Inter-corporate charges not tax deducted | 2.4 | 1.7 | % | 2.2 | 3.1 | % | (0.3) | (0.3) | % | ||||||||||||||||||||||||||||||||||||||||||||
| Other | (1.6) | (1.2) | % | (1.4) | (2.0) | % | 0.5 | 0.5 | % | ||||||||||||||||||||||||||||||||||||||||||||
| Total | 37.8 | 27.4 | % | 20.8 | 29.2 | % | 23.4 | 25.0 | % | ||||||||||||||||||||||||||||||||||||||||||||
81
Deferred tax assets and liabilities result from the following:
| December 31, | 2018 | 2017 | |||||||||
| (In millions of Canadian dollars) | |||||||||||
| Deferred tax assets | |||||||||||
| Non capital losses | 0.1 | — | |||||||||
| Reserves | 35.8 | 43.0 | |||||||||
| Capital losses | 0.2 | 27.2 | |||||||||
| Investment in partnerships | 144.4 | 117.4 | |||||||||
| Valuation allowances | (144.6) | (144.5) | |||||||||
| Total deferred tax assets | 35.9 | 43.1 | |||||||||
| Deferred tax liabilities | |||||||||||
| Property, plant and equipment | (36.0) | (392.0) | |||||||||
| Total deferred tax liabilities | (36.0) | (392.0) | |||||||||
| Net non-current deferred tax liability | (0.1) | (348.9) | |||||||||
Deferred Tax Assets and Valuation Allowances: We have deferred tax assets of $0.1 million related to non-capital loss carryovers, $0.2 million capital loss carryovers and $0.2 million of valuation allowances related to these deferred tax assets as of December 31, 2018. As of December 31, 2017, we had deferred tax assets of $27.2 million for capital loss carryovers and $27.1 million of valuation allowances related to these deferred tax assets.
Expiration Periods for Deferred Tax Assets: As of December 31, 2018, we have non-capital loss carryforwards of $0.3 million which will expire in 2038 and capital loss carryforwards of $1.8 million which can be carried forward indefinitely.
Unrecognized Tax Benefits: We had no unrecognized tax benefits as of December 31, 2018 and 2017.
As a result of our IPO and subsequent revaluation (or rebalancing) of our investment in the Limited Partnership, our tax basis exceeds our accounting basis in our investment in the Limited Partnership by approximately $1.1 billion. This excess tax basis results in a deferred tax asset of approximately $144.4 million. A full valuation allowance was recorded against this deferred tax asset as we determined it was more likely than not to not be realized.
Income Tax Expense on Discontinued Operations: Income tax expense in respect of our Discontinued Operations, includes income tax expense on the Trans Mountain Asset Group earnings for the periods presented until August 31, 2018, and the Trans Mountain Transaction gain. As of December 31, 2018 and 2017, our effective tax rate on income from Discontinued Operations was (5.2)%, and 28.3%, respectively. The 2018 effective tax rate on our income from Discontinued Operations is lower than the statutory federal and provincial rate due to the taxable gain being eligible for a 50.0% capital gains deduction along with the release of the non-cash deferred tax liabilities attributable to the Trans Mountain Asset Group.
5. Other Current Assets
| December 31, | 2018 | 2017 | |||||||||
| (In millions of Canadian dollars) | |||||||||||
| Prepaid expenses and deposits | 3.5 | 3.9 | |||||||||
| Contract Asset(Note 18) | 1.6 | 2.1 | |||||||||
| Restricted cash(a) | 0.5 | 0.5 | |||||||||
| Other current deferred assets | 0.3 | 0.1 | |||||||||
| 5.9 | 6.6 | ||||||||||
_______
a.Represents restricted cash in the Trusts that is to be used solely for the purposes of satisfying NEB’s Land Matters Consultation Initiative (“LMCI”) liabilities. Also, see Note 7.
82
6. Property, Plant and Equipment, net
Classes and Depreciation
As of December 31, 2018 and 2017, our property, plant and equipment, net consisted of the following:
| December 31, | 2018 | 2017 | Useful Life in Years(a) | |||||||||||
| (In millions of Canadian dollars, except years) | ||||||||||||||
| Tanks and Station equipment (primarily storage of crude oil and other refined products) | 1,040.9 | 703.4 | 5-40 | |||||||||||
| Pipelines (primarily transportation of crude oil and other refined products) | 143.7 | 151.9 | 30-64 | |||||||||||
| Other(b) | 195.4 | 173.5 | 5-35 | |||||||||||
| Accumulated depreciation and amortization | (413.1) | (330.7) | ||||||||||||
| 966.9 | 698.1 | |||||||||||||
| Land | 0.3 | 0.1 | ||||||||||||
| Construction work in process | 14.1 | 290.2 | ||||||||||||
| Property, plant and equipment, net | 981.3 | 988.4 | ||||||||||||
_______
a.For Cochin, the composite depreciation rate is included in the equivalent number of years for Pipelines.
b.Includes vehicles, docks, shiploaders, rail and other.
Depreciation and amortization expense charged against property, plant and equipment was $82.6 million, $71.7 million, and $64.2 million for the years ended December 31, 2018, 2017, and 2016, respectively.
7. Deferred Charges and Other Assets
| December 31, | 2018 | 2017 | |||||||||
| (In millions of Canadian dollars) | |||||||||||
| Cochin Pipeline Reclamation Trust Securities(a) | 6.1 | 4.3 | |||||||||
| Unamortized debt issue costs | 0.6 | 67.2 | |||||||||
| Other | 3.9 | 1.8 | |||||||||
| 10.6 | 73.3 | ||||||||||
_______
a.Represents restricted investments in Canadian government bonds. Restricted long-term investments by the Cochin Pipeline Reclamation Trust (the “Trust”) are to be used solely for the purposes of satisfying LMCI liabilities as further described in Note 20. We have related LMCI short-term and long-term obligations of an amount approximately equal to our restricted cash and restricted investments recorded in Other current liabilities and Other deferred credits, respectively, on our accompanying consolidated balance sheets. The restricted assets are measured at fair value with offsetting adjustments recorded to the LMCI liabilities. Fair values for the restricted asset investments were determined based on observable prices and inputs for similar instruments available in the market, utilizing widely accepted cash flow models to value such instruments. Such techniques represent a Level 2 fair value measurement, see Note 17.
8. Accounts Payable
| December 31, | 2018 | 2017 | |||||||||
| (In millions of Canadian dollars) | |||||||||||
| Accounts payable-trade | 25.0 | 19.7 | |||||||||
| Property, plant and equipment accrued liabilities | 24.4 | 34.8 | |||||||||
| 49.4 | 54.5 | ||||||||||
83
9. Other Current Liabilities
| December 31, | 2018 | 2017 | |||||||||
| (In millions of Canadian dollars) | |||||||||||
| Contract liabilities(Note 18) | 12.8 | 14.7 | |||||||||
| Trust liability(Note 7) | 0.4 | 4.8 | |||||||||
| Environmental capital recovery surcharge | 4.1 | 3.8 | |||||||||
| Employee compensation | 4.8 | 1.1 | |||||||||
| Final working capital adjustment for Trans Mountain Transaction | 37.0 | — | |||||||||
| Other | 4.1 | 3.4 | |||||||||
| 63.2 | 27.8 | ||||||||||
10. Debt
Credit Facilities
In conjunction with the announcement of the Trans Mountain Transaction described in Note 3, on May 30, 2018 and concurrently with the termination of our June 16, 2017 revolving credit facility (“2017 Credit Facility”), we established a $500.0 million revolving credit facility (the “Temporary Credit Facility”), for general corporate purposes, including working capital during the period from June 1, 2018 through the closing of the Trans Mountain Transaction. The approximate $100.0 million of borrowings outstanding under the terminated 2017 Credit Facility were repaid pursuant to an initial drawdown under the Temporary Credit Facility and approximately $60.5 million of deferred costs associated with the 2017 Credit Facility that were being amortized as interest expense over its term were written off.
On June 14, 2018, our former subsidiary, Trans Mountain, as the borrower, entered into a non-revolving, unsecured construction credit agreement (the “Trans Mountain Non-recourse Credit Agreement”) in an aggregate principal amount of up to approximately $1.0 billion to facilitate the resumption of the TMEP planning and construction work until the close of the Transaction. The $559.8 million of outstanding borrowings under the Trans Mountain Non-recourse Credit Agreement were included in the Trans Mountain Asset Group’s assets and liabilities as part of the Trans Mountain Transaction.
Upon the closing of the Trans Mountain Transaction on August 31, 2018, the Temporary Credit Facility was replaced with a new 4-year, $500.0 million unsecured revolving credit facility (“2018 Credit Facility”) for working capital purposes under a credit agreement with the Royal Bank of Canada, as agent (the “Credit Agreement”). In addition, the $132.6 million of outstanding borrowings under the Temporary Credit Facility were paid off prior to its termination with a portion of the proceeds from the Trans Mountain Transaction.
Depending on the type of loan requested, interest on loans outstanding will be calculated based on: (i) a Canadian prime rate of interest; (ii) a U.S. base rate; (iii) LIBOR; or (iv) bankers’ acceptance fees, plus (A) in the case of Canadian prime rate or U.S. base rate loans, an applicable margin of up to 1.25% per annum; or (B) in the case of LIBOR loans or banker’s acceptances, an applicable margin ranging from 1.00% to 2.25% per annum, with such margin determined by our then applicable debt credit rating. Standby fees for the unused portion of the 2018 Credit Facility will be calculated at a rate ranging from 0.20% to 0.45% per annum based upon our then applicable debt credit rating.
The Credit Agreement contains various financial and other covenants that apply to KMCU and its subsidiaries and that are common in such agreements, including a maximum ratio of consolidated total funded debt to consolidated earnings before interest, income taxes, D&A, and non-cash adjustments as defined in the Credit Agreement, of 5.00:1.00 and restrictions on KMCU's ability to incur debt, grant liens, make dispositions, engage in transactions with affiliates, make restricted payments(including distributions), amend our organizational documents and engage in corporate reorganization transactions.
In addition, the Credit Agreement contains customary events of default, including non-payment; non-compliance with covenants (in some cases, subject to grace periods); payment default under, or acceleration events affecting, certain other indebtedness; bankruptcy or insolvency events involving KMCU or certain of its subsidiaries; and changes of control. If an event of default under the Credit Agreement exists and is continuing, the lenders could terminate their commitments and accelerate the maturity of our outstanding obligations under the Credit Agreement.
As of December 31, 2018, we had no outstanding borrowings under our 2018 Credit Facility, and had $489.0 million available under the 2018 Credit Facility, after reducing the $500.0 million capacity for $11.0 million in letters of credit. Of the
84
total $11.0 million of letters of credit issued, approximately $7.9 million are issued on behalf of Trans Mountain for which it has issued a backstop letter of credit to us. As of December 31, 2018, we were in compliance with all required covenants. As of December 31, 2017, we had no borrowings outstanding under our 2017 Credit Facility. For the years ended December 31, 2018 and 2017, we incurred $1.1 million and $0.7 million, respectively, in standby fees.
11. Share-based Compensation and Benefit Plans
Share-based Compensation
Restricted Share Unit Plan for Non-Employee Directors
We have adopted the Restricted Share Unit Plan for Non-Employee Directors, in which our eligible non-employee directors participate. The plan recognizes that the compensation paid to each eligible non-employee director is fixed by our board of directors, generally annually, and that the compensation is payable in cash. Pursuant to the plan, in lieu of receiving some or all of the cash compensation, each eligible non-employee director may elect to receive RSUs. Each election will be generally at or around the first board of directors meeting in January of each calendar year and will be effective for the entire calendar year. An eligible director may make a new election each calendar year. The total number of Restricted Voting Shares authorized under the plan is 156,140, after giving effect to the Return of Capital and Share Consolidation in accordance with board of directors approval and guidelines within the RSU plan.
During 2018 and 2017, we issued RSUs to our non-employee directors of 20,000 and 11,580, respectively (number of shares issued is before our January 4, 2019 Share Consolidation). These RSUs were valued at the time of issuance at $0.4 million and $0.2 million, respectively.
Restricted Share Unit Plan for Employees
We have adopted the Restricted Share Unit Plan for Employees (the “RSU Plan”) for our eligible employees. The RSU Plan provides that the number of Restricted Voting Shares that may be issued or issuable by the Company pursuant to RSU awards shall not exceed 1,345,093, after giving effect to the Return of Capital and Share Consolidation in accordance with board of directors approval and guidelines within the RSU plan. The purpose of the RSU Plan is to provide incentive to our employees for our future endeavors, to advance our and our shareholders’ interests and to enable us to compete effectively for the services of employees. The RSU Plan is administered by our board of directors, which will have authority to construe and interpret the RSU Plan, including any questions in respect of any RSU awards granted thereunder.
The following table sets forth a summary of activity and related balances of our RSU awards, excluding those issued to our non-employee directors:
| Year Ended December 31, 2018 | May 30, 2017 to December 31, 2017 | ||||||||||||||||||||||||||||||||||
| (Per share amount in Canadian dollars) | |||||||||||||||||||||||||||||||||||
| Shares | Weighted Average Grant Date Fair Value per share | Shares | Weighted Average Grant Date Fair Value per share | ||||||||||||||||||||||||||||||||
| Outstanding at beginning of period | 781,307 | 15.99 | — | — | |||||||||||||||||||||||||||||||
| Granted | 85,104 | 16.63 | 784,621 | 15.99 | |||||||||||||||||||||||||||||||
| Vested(a) | (703,505) | 15.99 | — | — | |||||||||||||||||||||||||||||||
| Forfeited | (8,771) | 16.19 | (3,314) | 15.99 | |||||||||||||||||||||||||||||||
| Outstanding prior to Return of Capital and Share Consolidation | 154,135 | 16.33 | 781,307 | 15.99 | |||||||||||||||||||||||||||||||
| Effect of Return of Capital and Share Consolidation | 25,167 | 16.33 | — | — | |||||||||||||||||||||||||||||||
| Outstanding at end of period | 179,302 | 16.33 | 781,307 | 15.99 | |||||||||||||||||||||||||||||||
________
a.RSU awards vested upon August 31, 2018 closing of the Trans Mountain Transaction.
85
RSU awards under the RSU Plan have vesting periods that may range from one-year with variable to three years. Following is a summary of the future vesting of our outstanding RSUs under the RSU Plan:
| For the Year Ended December 31, 2018 | ||||||||
| 2019 | — | |||||||
| 2020 | 83,444 | |||||||
| 2021 | 95,858 | |||||||
| Total Outstanding | 179,302 | |||||||
The compensation costs related to our RSU awards is generally recognized ratably over the vesting period of the RSU awards. Upon vesting, the grants will be paid in our split-adjusted Restricted Voting Shares.
During the year ended December 31, 2018 and 2017, we recognized $7.9 million, which included $6.5 million of expense related to the Trans Mountain Transaction, and $0.7 million, respectively, of expense related to the RSU Plan, and we capitalized $2.1 million and $1.4 million, respectively, related to the RSU Plan. At December 31, 2018, unrecognized compensation costs associated with the RSU awards was approximately $3.5 million with a weighted average remaining amortization period of 2.1 years.
Benefit Plans
The benefit plans that were provided to our employees prior to the closing of the Trans Mountain Transaction were included in the assets and liabilities held for sale, and we no longer have any obligations for those benefit plans. For our remaining employees, new pension and other postretirement benefit (“OPEB”) plans became effective after the closing of the Trans Mountain Transaction that provide value similar to the prior benefit plans. Our pension benefits provided prior to the close of the Trans Mountain Transaction were under a defined benefit pension formula and are now provided under a registered defined contribution pension plan (“DCPP”) and a supplemental unfunded arrangement (“SPP”) which provides pension benefits in excess of Income Tax Act limits. Our new OPEB plan benefits are relatively consistent with the prior OPEB plan. As a result of the Trans Mountain Transaction, we released $36.3 million of benefit plan losses.
Pension benefits
Our pension benefits cover eligible employees and are provided under the DCPP and SPP. We contribute a percentage of eligible compensation based on a combination of age and years of service. The total cost for our DCPP was approximately $0.5 million for the period from September 1, 2018 to December 31, 2018.
The SPP benefits are unfunded and annual expense is recorded on an accrual basis based on an independent actuarial determination. No employees have accrued a benefit under the SPP as of December 31, 2018; therefore, no information on the SPP is provided in the tables below.
Other postretirement benefits
Our OPEB plan benefits are provided to eligible current and future retirees and their spouses in the form of a healthcare spending account. Postretirement benefits are unfunded and annual expense is recorded on an accrual basis based on independent actuarial determination. The most recent actuarial valuation for accounting purposes was completed as of December 31, 2018.
86
Benefit Obligation, Plan Assets and Funded Status
The following table provides information about our OPEB plan.
| For the Periods Ended December 31, 2018 | ||||||||
| (In millions of Canadian dollars) | ||||||||
| Change in benefit obligation | ||||||||
| Benefit obligation at September 1, 2018 | 1.8 | |||||||
| Service cost | 0.1 | |||||||
| Interest cost | — | |||||||
| Actuarial loss (gain) | (0.1) | |||||||
| Benefits paid | — | |||||||
| Benefit obligation at December 31, 2018 | 1.8 | |||||||
| Presented as follows: | ||||||||
Current benefit liability(a) | — | |||||||
Non-current benefit liability(b) | (1.8) | |||||||
| (1.8) | ||||||||
________
a. Amount included in Other current liabilities on our consolidated balance sheets.
b. Amount included in Other deferred credits on our consolidated balance sheets as of December 31, 2018.
Components of Accumulated Other Comprehensive Loss
We include the amounts of pre-tax accumulated other comprehensive loss related to the OPEB plans on our accompanying balance sheets. These balances exclude amounts recoverable through tolls and are immaterial.
Actuarial gains and losses deferred in accumulated other comprehensive loss are amortized into income over the period of expected future service of active participants.
Expected Payment of Future Benefits and Employer Contributions
Following are the expected future benefit payments as of December 31, 2018:
| For the Year Ended December 31, | |||||||||||
| (In millions of Canadian dollars) | |||||||||||
| 2019 | — | ||||||||||
| 2020 | — | ||||||||||
| 2021 | — | ||||||||||
| 2022 | — | ||||||||||
| 2023 | 0.1 | ||||||||||
| 2024-2028 | 0.4 | ||||||||||
In 2019, we expect the contribution to our OPEB plan to be inconsequential.
87
Actuarial Assumptions and Sensitivity Analysis
Benefit obligations and net benefit cost are based on actuarial estimates and assumptions. The following table details the weighted-average actuarial assumptions used in determining the benefit obligation and net benefit costs of our OPEB plan:
| For the Year Ended December 31, | 2018 | ||||||||||
| Assumptions related to benefit obligations: | |||||||||||
| Discount rate | 3.91% | ||||||||||
| Assumptions related to benefit costs: | |||||||||||
| Discount rate for benefit obligations | 3.76% | ||||||||||
| Discount rate for interest on benefit obligations | 3.67% | ||||||||||
| Discount rate for service cost | 3.78% | ||||||||||
| Discount rate for interest on service cost | 3.74% | ||||||||||
12. Other Deferred Credits
| December 31, | 2018 | 2017 | |||||||||
| (In millions of Canadian dollars) | |||||||||||
| Trust liability(Note 7) | 6.1 | ||||||||||
| Postretirement benefit liability | 1.8 | — | |||||||||
| Environmental liabilities | 0.1 | — | |||||||||
| Other | 0.9 | 0.8 | |||||||||
| 8.9 | 0.8 | ||||||||||
13. Equity
We are authorized to issue an unlimited number of Restricted Voting Shares, an unlimited number of Special Voting Shares and an unlimited number of preferred shares issuable in series. As of December 31, 2018, we had (i) 34.9 million and 81.4 million of split-adjusted Restricted Voting Shares and Special Voting Shares outstanding, respectively, with no par value, for an aggregate of 116.3 million voting shares outstanding, (ii) 12.0 million and 10.0 million of Series 1 Preferred Shares and Series 3 Preferred Shares outstanding, respectively, and (iii) 0.2 million of restricted stock awards outstanding.
Return of Capital, Stated Capital Reduction and Share Consolidation
Pursuant to our Voting Shareholders’ approval on November 29, 2018, Return of Capital disbursements of approximately $1.2 billion were made to holders of our Restricted Voting Shares ($11.40 per Restricted Voting Share) and approximately $2.8 billion to KMI as the indirect holder of our Special Voting Shares on January 3, 2019. To facilitate the Return of Capital distributions and provide flexibility for dividends going forward, our Voting Shareholders also approved (i) a Stated Capital Reduction to our stated Restricted Voting Share capital by $1.45 billion and (ii) a Share Consolidation, a “reverse stock split” of our Restricted Voting Shares and Special Voting Shares on a one-for-three basis (one-for-three basis, three shares consolidating to one), which was effected on January 4, 2019.
Preferred Share Dividends
On August 15, 2017, we completed an offering of 12.0 million Series 1 Preferred Shares on the TSX at a price to the public of $25.00 per Series 1 Preferred Share for total gross proceeds of $300.0 million. The net proceeds of $292.9 million from the offering were used to indirectly subscribe for preferred units in the Limited Partnership, which in turn were used by the Limited Partnership to repay indebtedness outstanding under our revolving credit facility and for general corporate purposes. We have the option to redeem the Series 1 Preferred Shares on November 15, 2022 and on November 15 in every fifth year thereafter by payment of $25.00 per Series 1 Preferred Share plus all accrued and unpaid dividends. The holders of the Series 1 Preferred Shares will have the right to convert all or any of their Series 1 Preferred Shares into cumulative redeemable floating rate Preferred Shares, Series 2 (Series 2 Preferred Shares), subject to certain conditions, on November 15, 2022 and on November 15 in every fifth year thereafter. The Series 1 Preferred Shares and the Series 2 Preferred Shares are series of shares in the same class. The conversion right entitles holders to elect periodically which of the two series they wish to hold and does not entitle holders to receive a different class or type of security.
88
In the event of our liquidation, the holders of Series 1 Preferred Shares shall be entitled to receive $25.00 per Series 1 Preferred Share plus all accrued and unpaid dividends thereon before any amount shall be paid or any property or assets of the Company shall be distributed to the holders of the Restricted Voting Shares, Special Voting Shares and holders of any other shares ranking junior to the Series 1 Preferred Shares.
Dividends on the Series 1 Preferred Shares are fixed, cumulative, preferential and $1.3125 per share annually, payable quarterly on the 15th day of February, May, August and November, as and when declared by our board of directors, for the initial fixed rate period to but excluding November 15, 2022.
On December 15, 2017, we completed an offering of 10.0 million Series 3 Preferred Shares on the TSX at a price to the public of $25.00 per Series 3 Preferred Share for total gross proceeds of $250.0 million. The net proceeds of $243.2 million (net of fees paid and accrued) from the offering were used to indirectly subscribe for preferred units in the Limited Partnership, which in turn were used by the Limited Partnership to repay indebtedness outstanding under our revolving credit facility and for general corporate purposes. We have the option to redeem the Series 3 Preferred Shares on February 15, 2023 and on February 15 in every fifth year thereafter by payment of $25.00 per Series 3 Preferred Share plus all accrued and unpaid dividends. The holders of the Series 3 Preferred Shares will have the right to convert all or any of their Series 3 Preferred Shares into cumulative redeemable floating rate Preferred Shares, Series 4 (Series 4 Preferred Shares), subject to certain conditions, on February 15, 2023 and on February 15 in every fifth year thereafter. The Series 3 Preferred Shares and the Series 4 Preferred Shares are series of shares in the same class. The conversion right entitles holders to elect periodically which of the two series they wish to hold and does not entitle holders to receive a different class or type of security.
In the event of our liquidation, the holders of Series 3 Preferred Shares shall be entitled to receive $25.00 per Series 3 Preferred Share plus all accrued and unpaid dividends thereon before any amount shall be paid or any property or assets shall be distributed to the holders of the Restricted Voting Shares, Special Voting Shares and holders of any other shares ranking junior to the Series 3 Preferred Shares.
Dividends on the Series 3 Preferred Shares are fixed, cumulative, preferential and $1.3000 per share annually, payable quarterly on the 15th day of February, May, August and November, as and when declared by our board of directors, for the initial fixed rate period to but excluding February 15, 2023.
The following table provides information regarding dividends declared, or paid, as applicable, on our Preferred Shares during the year ended December 31, 2018:
| Period | Total Series 1 quarterly dividend per share for the period | Total Series 3 quarterly dividend per share for the period | Date of declaration | Date of record | Date of dividend | Total amount of dividends paid in cash | |||||||||||||||||||||||||||||||||||||||||
| (In millions of Canadian dollars, except per share amounts) | |||||||||||||||||||||||||||||||||||||||||||||||
| November 15, 2017 to February 14, 2018 (a) | 0.328125 | 0.22082 | January 17, 2018 | January 31, 2018 | February 15, 2018 | 6.1 | |||||||||||||||||||||||||||||||||||||||||
| February 15, 2018 to May 14, 2018 | 0.328125 | 0.325 | April 18, 2018 | April 30, 2018 | May 15, 2018 | 7.2 | |||||||||||||||||||||||||||||||||||||||||
| May 15, 2018 to August 14, 2018 | 0.328125 | 0.325 | July 18, 2018 | July 31, 2018 | August 15, 2018 | 7.2 | |||||||||||||||||||||||||||||||||||||||||
| August 15, 2018 to November 14, 2018 | 0.328125 | 0.325 | October 10, 2018 | October 31, 2018 | November 15, 2018 | 7.2 | |||||||||||||||||||||||||||||||||||||||||
| November 15, 2018 to February 14, 2019 | 0.328125 | 0.325 | January 16, 2019 | January 31, 2019 | February 15, 2019 | 7.2 | |||||||||||||||||||||||||||||||||||||||||
________
(a) Series 3 per share amount reflects that the shares were outstanding for 62 days during the period ended February 14, 2018.
Suspension of Dividend Reinvestment Plan (DRIP)
Effective January 16, 2019, our board of directors suspended our DRIP until further notice. Shareholders who were enrolled in the program will receive dividend payments in the form of cash, including dividends paid on February 15, 2019. We elected to suspend our DRIP in light of KML's reduced need for capital following the Trans Mountain Transaction. If KML elects to reinstate the DRIP in the future, shareholders who were enrolled in the DRIP at suspension and remained enrolled at reinstatement will automatically resume participation in the DRIP. Kinder Morgan’s participation in the distribution reinvestment in Class B Units of the Limited Partnership has been suspended since July 18, 2018.
89
Shortly after our IPO, we had implemented a DRIP pursuant to which holders (excluding holders not resident in Canada) of Restricted Voting Shares could elect to have all cash dividends of the Company payable to any such shareholder automatically reinvested in additional Restricted Voting Shares at a price per share calculated by reference to the weighted average trading price of the Restricted Voting Shares on the stock exchange on which the Restricted Voting Shares then listed for the five trading days preceding the relevant dividend payment date, less a discount of between 0% and 5% (as determined from time to time by the board of directors, in its sole discretion). Kinder Morgan had participated in a DRIP under the same general terms as described for the Restricted Voting Stockholders. In addition, KML's suspension of its DRIP on January 16, 2019 also suspended the Limited Partnership's distribution reinvestment plan under the terms of the Limited Partnership Agreement.
Restricted Voting Share Dividends
Restricted Voting Shares were issued to the public pursuant to our IPO. Holders of Restricted Voting Shares are entitled to one vote for each Restricted Voting Share held at all our meetings of shareholders, except meetings at which or in respect of matters on which only holders of another class of shares are entitled to vote separately as a class. Except as otherwise provided by our articles or required by law, the holders of Restricted Voting Shares will vote together with the holders of Special Voting Shares as a single class.
The holders of Restricted Voting Shares are entitled to receive, subject to the rights of the holders of another class of shares, any dividend we declare and the remaining property of the Company on the liquidation, dissolution or winding up of the Company, whether voluntary or involuntary. Notwithstanding the foregoing, we may not issue or distribute to all or to substantially all of the holders of the Restricted Voting Shares either (i) Restricted Voting Shares, or (ii) rights or securities of the Company exchangeable for or convertible into or exercisable to acquire Restricted Voting Shares, unless contemporaneously therewith, we issue or distribute Special Voting Shares or rights or securities of the Company exchangeable for or convertible into or exercisable to acquire Special Voting Shares on substantially similar terms (having regard to the specific attributes of the Special Voting Shares) and in the same proportion.
The following table provides information regarding dividends declared, or paid, as applicable, on our Restricted Voting Shares during the year ended December 31, 2018.
| For the three month period ended | Dividend rate per share | Date of declaration | Date of record | Date of dividend | Total amount of dividends paid in cash(a) | Total amount of dividends paid in form of additional shares | ||||||||||||||||||||||||||||||||||||||||||||||||||||||||
| (In millions of Canadian dollars, except per share amounts) | ||||||||||||||||||||||||||||||||||||||||||||||||||||||||||||||
| December 31, 2017 | 0.1625 | January 17, 2018 | January 31, 2018 | February 15, 2018 | 11.8 | 5.1 | ||||||||||||||||||||||||||||||||||||||||||||||||||||||||
| March 31, 2018 | 0.1625 | April 18, 2018 | April 30, 2018 | May 15, 2018 | 11.1 | 5.9 | ||||||||||||||||||||||||||||||||||||||||||||||||||||||||
| June 30, 2018 | 0.1625 | July 18, 2018 | July 31, 2018 | August 15, 2018 | 13.9 | 3.1 | ||||||||||||||||||||||||||||||||||||||||||||||||||||||||
| September 30, 2018 | 0.1625 | October 17, 2018 | October 31, 2018 | November 15, 2018 | 13.2 | 3.9 | ||||||||||||||||||||||||||||||||||||||||||||||||||||||||
| December 31, 2018 | 0.1625 | January 16, 2019 | January 31, 2019 | February 15, 2019 | 5.7 | — | ||||||||||||||||||||||||||||||||||||||||||||||||||||||||
________
a.Amount includes notional dividends on outstanding restricted stock awards of $0.4 million during 2018.
Kinder Morgan Interest Distributions
The Kinder Morgan interest consists of Class B Units in the Limited Partnership which are owned by indirect wholly owned subsidiaries of Kinder Morgan. Each Class B Unit is accompanied by a Special Voting Share, which entitles the holder of such Special Voting Share to one vote for each Special Voting Share held at all our meetings of shareholders, except meetings at which or in respect of matters on which only holders of another class of shares are entitled to vote separately as a class. The holders of Special Voting Shares are entitled to receive, subject to the rights of the holders of preferred shares and in priority to the holders of Restricted Voting Shares, an amount per Special Voting Share equal to $.000001 on the liquidation, dissolution or winding-up of the Company, whether voluntary or involuntary. The Special Voting Shares are subject to anti-dilution
90
provisions, which provide that adjustments will be made to the Special Voting Shares in the event of a change to the Restricted Voting Shares in order to preserve the voting equivalency of such shares.
The Limited Partnership makes quarterly distributions, when and if declared by the board of directors, to holders of Class A Units (being the Company, through the General Partner) and Class B Units (being Kinder Morgan) on a pro rata basis subject to limitations described above for the Restricted Voting Shares. Kinder Morgan then receives its pro rata share of declared distributions from the Limited Partnership through its ownership interest in the Limited Partnership Class B Units.
The following table provides information regarding distributions declared, or paid, as applicable, to Kinder Morgan during the year ended December 31, 2018.
| For the three month period ended | Dividend rate per share | Date of declaration | Date of distribution | Total amount of distribution paid in cash(a) | Total amount of distribution paid in form of additional shares | |||||||||||||||||||||||||||||||||||||||||||||||||||
| (In millions of Canadian dollars, except per share amounts) | ||||||||||||||||||||||||||||||||||||||||||||||||||||||||
| December 31, 2017 | 0.1625 | January 17, 2018 | February 15, 2018 | 31.0 | 9.9 | |||||||||||||||||||||||||||||||||||||||||||||||||||
| March 31, 2018 | 0.1625 | April 18, 2018 | May 15, 2018 | 31.0 | 9.9 | |||||||||||||||||||||||||||||||||||||||||||||||||||
| June 30, 2018 | 0.1625 | July 18, 2018 | August 15, 2018 | 40.3 | — | |||||||||||||||||||||||||||||||||||||||||||||||||||
| September 30, 2018 | 0.1625 | October 17, 2018 | November 15, 2018 | 39.7 | — | |||||||||||||||||||||||||||||||||||||||||||||||||||
| December 31, 2018 | 0.1625 | January 16, 2019 | February 15, 2019 | 13.2 | — | |||||||||||||||||||||||||||||||||||||||||||||||||||
_______
a.Distributions paid in cash include U.S. income tax reimbursements related to Puget Sound earnings of $3.4 million during 2018.
Earnings per Restricted Voting Share
We calculate earnings per share from continuing and discontinued operations using the two-class method. Earnings were allocated to Restricted Voting Shares and participating securities based on the amount of dividends paid in the current period plus an allocation of the undistributed earnings or excess distributions over earnings to the extent that each security participates in earnings or excess distributions over earnings. Our unvested restricted stock awards, which may be settled in Restricted Voting Shares issued to employees and non-employee directors and include dividend equivalent payments, do not participate in excess distributions over earnings.
The following table sets forth the allocation of income from continuing operations and net income available to shareholders of Restricted Voting Shares and participating securities:
| Year ended December 31, | 2018 | 2017 | |||||||||
| (In millions of Canadian dollars, except per share amounts) | |||||||||||
| Income from Continuing Operations Available to Restricted Voting Stockholders | 21.8 | 8.9 | |||||||||
| Participating securities: | |||||||||||
| Less: Income from Continuing Operations allocated to restricted stock awards(a) | (0.4) | (0.2) | |||||||||
| Income from Continuing Operations Allocated to Restricted Voting Stockholders | 21.4 | 8.7 | |||||||||
| Basic Weighted Average Restricted Voting Shares Outstanding | 34.7 | 27.6 | |||||||||
| Basic Earnings from Continuing Operations Per Restricted Voting Share | 0.62 | 0.31 | |||||||||
91
The following table sets forth the allocation of income from discontinued operations and net income available to shareholders of Restricted Voting Shares and participating securities:
| Year ended December 31, | 2018 | 2017 | |||||||||
| (In millions of Canadian dollars, except per share amounts) | |||||||||||
| Income from Discontinued Operations Available to Restricted Voting Stockholders | 394.4 | 19.0 | |||||||||
| Participating securities: | |||||||||||
| Less: Income from Discontinued Operations allocated to restricted stock awards(a) | (0.4) | (0.2) | |||||||||
| Income from Discontinued Operations Allocated to Restricted Voting Stockholders | 394.0 | 18.8 | |||||||||
| Basic Weighted Average Restricted Voting Shares Outstanding | 34.7 | 27.6 | |||||||||
| Basic Earnings from Discontinued Operations Per Restricted Voting Share | 11.37 | 0.69 | |||||||||
_______
a.As of December 31, 2018 and 2017, there were approximately 0.2 million and 0.3 million, respectively, unvested restricted stock awards.
For the both years ended December 31, 2018 and 2017, the weighted average maximum number of potential Restricted Voting Share equivalents of 0.2 million unvested restricted stock awards are antidilutive and, accordingly, are excluded from the determination of diluted earnings per Restricted Voting Share.
14. Transactions with Related Parties
Affiliate Activities
The following table summarizes our related party income statement activity. Revenues, operating costs and capitalized costs are under normal trade terms.
| Year ended December 31, | 2018 | 2017 | 2016 | ||||||||||||||
| (In millions of Canadian dollars) | |||||||||||||||||
| Income Statement location | |||||||||||||||||
| Revenues-Services(a) | 61.2 | 63.7 | 59.1 | ||||||||||||||
| Operations and maintenance and general and administrative expenses | 6.8 | 0.5 | 1.0 | ||||||||||||||
| Interest expense(b) | — | 10.0 | 21.3 | ||||||||||||||
| Other | |||||||||||||||||
| Capitalized costs from affiliates in property, plant and equipment | 0.1 | 6.5 | 19.1 | ||||||||||||||
_________
a.Amounts represent sales to a customer who is a related party through joint ownership of a joint venture.
b.2017 and 2016 amounts primarily represent interest on long-term debt with affiliates (“KMI Loans”) that was repaid with proceeds from our IPO.
Accounts receivable and payable
Accounts receivable-affiliate and accounts payable-affiliate are non-interest bearing and are settled on demand and, since our IPO, primarily settled monthly. The following table summarizes our affiliate balances:
| December 31, | 2018 | 2017 | |||||||||
| (In millions of Canadian dollars) | |||||||||||
| Accounts receivable(a) | 0.2 | 9.0 | |||||||||
| Contract accounts receivable(b) | 0.7 | 1.2 | |||||||||
| Accounts payable(c) | 4.7 | 0.7 | |||||||||
________
92
a.Included in “Accounts receivable” on our accompanying consolidated balance sheets.
b.Included in “Other current assets” on our accompanying consolidated balance sheets.
c.Included in “Accounts payable” on our accompanying consolidated balance sheets.
15. Interest (Income) Expense, net
| Year ended December 31, | 2018 | 2017 | 2016 | ||||||||||||||
| (In millions of Canadian dollars) | |||||||||||||||||
| Interest expense on KMI Loans | — | 10.0 | 21.3 | ||||||||||||||
| Interest expense on credit facilities(a) | 2.1 | 0.9 | — | ||||||||||||||
| Amortization expense of debt issuance costs | 0.6 | 0.5 | — | ||||||||||||||
| Interest expense, other | 0.4 | 0.4 | — | ||||||||||||||
| Interest income | (29.7) | — | — | ||||||||||||||
| Capitalized debt financing costs | (0.6) | (3.6) | (2.8) | ||||||||||||||
| (27.2) | 8.2 | 18.5 | |||||||||||||||
_________
a.2018 and 2017 amounts include $1.1 million and $0.7 million, respectively, of standby fees.
16. Change in Operating Assets and Liabilities
The following amounts represent consolidated changes in operating assets and liabilities, which include changes for the Trans Mountain Asset Group. See Note 3 for a summary of operating and investing cash flows related to the Trans Mountain Asset Group.
| Year ended December 31, | 2018 | 2017 | 2016 | ||||||||||||||||||||||||||
| (In millions of Canadian dollars) | Cash inflow (outflow) | ||||||||||||||||||||||||||||
| Accounts receivable | 25.0 | (3.8) | 25.9 | ||||||||||||||||||||||||||
| Inventories | (0.2) | (0.7) | (1.5) | ||||||||||||||||||||||||||
| Other current assets | (4.0) | 4.1 | (3.2) | ||||||||||||||||||||||||||
| Deferred charges and other assets | (5.6) | (12.4) | (4.2) | ||||||||||||||||||||||||||
| Accounts payable | (48.0) | (21.3) | 35.3 | ||||||||||||||||||||||||||
| Accrued taxes | 303.8 | 10.2 | (0.5) | ||||||||||||||||||||||||||
| Other current liabilities | 3.6 | (55.5) | 3.5 | ||||||||||||||||||||||||||
| Other deferred credits | 62.4 | (15.0) | (82.8) | ||||||||||||||||||||||||||
| 337.0 | (94.4) | (27.5) | |||||||||||||||||||||||||||
17. Risk Management and Financial Instruments
Credit risk
We are exposed to credit risk, which is the risk that a customer or other counterparty will fail to perform an obligation or settle a liability, resulting in a financial loss to our business, which is primarily concentrated in the crude oil and refined products transportation industry and is dependent upon the ability of our customers to pay for these services. A majority of our customers operate in the oil and gas exploration and development, or energy marketing or transportation industries. Our customers may be exposed to long-term downturns in energy commodity prices, including the price for crude oil, or other credit events impacting these industries. We limit our exposure to credit risk by requiring shippers who fail to maintain specified credit ratings or a suitable financial position to provide acceptable security, generally in the form of guarantees from credit worthy parties or letters of credit from well rated financial institutions. Our cash and cash equivalents are held with major financial institutions, minimizing the risk of non-performance by counter parties.
93
Interest Rate Risk
We are exposed to interest rate risk attributed to floating rate debt, which is used to finance capital expansion projects, and general corporate operations. The changes in interest rates may impact future cash flows and the fair value of our financial instruments.
Foreign Currency Transactions and Translation
Foreign currency transaction gains or losses result from a change in exchange rates between the functional currency of an entity and the currency in which a transaction is denominated. Unrealized and realized gains and losses generated from these transactions are recorded in foreign exchange loss in the accompanying consolidated statements of income and include:
•As a result of the Trans Mountain Transaction, we released foreign currency translation gains previously held within Accumulated other comprehensive loss to the Gain on sale of the Trans Mountain Asset Group, net of tax in the accompanying consolidated statement of income of $10.1 million for the year ended December 31, 2018.
•Prior to repayment of the KMI Loans utilizing proceeds from our IPO, we were exposed to foreign currency risk related to the U.S. dollar denominated KMI Loans. For the years ended December 31, 2017 and 2016, our continuing operations had unrealized foreign exchange gain of $0.2 million and $13.2 million, respectively, and our discontinued operations had unrealized foreign exchange (loss) and gain of $(2.6) million and $16.5 million, respectively, related to the KMI Loans.
•Our continuing operations unrealized foreign exchange (loss) and gain for the years ended December 31, 2018, 2017 and 2016 were $1.0 million, $(5.6) million and $1.4 million, respectively, due to changes in exchange rates between the Canadian dollar and the U.S. dollar on U.S. dollar denominated balances. These currency exchange rate fluctuations affect the expected Canadian dollar cash flows on unsettled U.S. dollar denominated transactions, primarily related to cash bank accounts that are denominated in U.S. dollars and affiliate receivables or payables that are denominated in U.S. dollars. Prior to the closing of the Trans Mountain Transaction, we translated the assets and liabilities of Puget Sound that has the U.S. dollar as its functional currency to Canadian dollars at period-end exchange rates.
•Cochin earns its revenues in U.S. dollars. Therefore, fluctuations in the U.S. dollar to Canadian dollar exchange rate can affect the earnings contributed by Cochin to our overall results. Our continuing operations had realized foreign exchange (loss) and gain of $(0.9) million and $0.3 million for the years ended December 31, 2018 and 2017. The net realized foreign exchange gains and losses were nominal in 2016.
Liquidity risk
Liquidity risk is the risk that we will not be able to meet our financial obligations, including commitments, as they become due. We manage our liquidity risk by ensuring access to sufficient funds to meet our obligations. We forecast cash requirements to ensure funding is available to settle financial liabilities when they become due. Our primary sources of liquidity and capital resources are funds generated from operations and our 2018 Credit Facility.
Fair value measurements
We do not carry any financial assets or liabilities measured at fair value on a recurring basis, other than the Trusts described in Note 7. We disclose the fair value of other financial instruments not measured at fair value. The fair value of financial instruments reflects our best estimate of market value based on generally accepted valuation techniques or models and are supported by observable market prices and rates. When such values are not available, we use discounted cash flow analysis from applicable yield curves based on observable market inputs to estimate fair value.
Fair value of financial instruments
Fair value represents the price at which a financial instrument could be exchanged in an orderly market, in an arm’s length transaction between knowledgeable and willing parties who are under no compulsion to act. We classify the fair value of the financial instruments according to the following hierarchy based on the observable inputs used to value the instrument:
•Level 1— inputs to the valuation methodology are quoted prices unadjusted for identical assets or liabilities in active markets;
94
•Level 2— inputs other than quoted prices included in Level 1 that are observable for the asset or liability either directly (as prices) or indirectly (i.e. derived from prices); and
•Level 3 — inputs to the valuation model are not based on observable market data.
Fair value measurements are classified in the fair value hierarchy based on the lowest level input that is significant to that fair value measurement. This assessment requires judgment considering factors specific to an asset or liability and may affect placement within the fair value hierarchy. Level 1 and Level 2 are used for the fair value of cash and cash equivalents and restricted investments, respectively.
Due to the short-term or on demand nature of cash and cash equivalents, restricted cash, accounts receivable, accounts receivable from affiliates, accounts payable, accounts payable to affiliates and accrued interest, we have determined that the carrying amounts for these balances approximate fair value.
18. Revenue Recognition
Nature of Revenue by Segment
Terminals Segment
We provide various types of liquid tank and bulk terminal services. These services are generally comprised of inbound, storage and outbound handling of customer products.
Our liquid tank storage and handling service contracts generally include a promised tank storage capacity provision and prepaid volume throughput of the stored product. In these contracts, we have a stand-ready obligation to perform this contracted service each day over the life of the contract. The customer pays a transaction price typically in the form of a fixed monthly charge and is obligated to pay whether or not it uses the storage capacity and throughput service (i.e., a take-or-pay payment obligation). These contracts generally include a per-unit rate for any quantities we handle at the request of the customer in excess of the prepaid volume throughput amount and also typically include per-unit rates for additional, ancillary services that may be periodically requested by the customer.
Our bulk storage and handling contracts generally include inbound handling of our customers’ dry bulk material product into our storage facility and outbound handling of these products from our storage facility. These services are provided on both a firm and non-firm basis. In our firm bulk storage and handling contracts, we are committed to handle and store on a stand-ready basis the minimum throughput quantity of bulk materials contracted by the customer. The customer is obligated to pay for its minimum volume commitment amount, regardless of whether or not it uses the storage and handling service. The customer pays a transaction price typically based on a per-unit rate for quantities handled, including amounts attributable to deficiency quantities. For non-firm storage and handling services, the customer pays a transaction price typically based on a per-unit rate for quantities handled on an as requested, non-guaranteed basis.
Pipelines Segment
We transport light hydrocarbon liquids (primarily to be used as diluent to facilitate bitumen transportation) on a firm or non-firm contractual basis, and jet fuel on a non-firm contractual basis. The regulated tariff for Cochin is designed to provide revenues sufficient to recover the costs of providing transportation to shippers, including a return on invested capital. The majority of Cochin’s transportation service is provided on a firm basis under its current contracts.
We typically promise to transport on a stand-ready basis the shipper’s minimum volume commitment amount. The shipper is obligated to pay for its volume commitment amount, regardless of whether or not it flows quantities in Cochin’s pipeline. The shipper pays a transaction price typically based on a per-unit rate for quantities transported, including amounts attributable to deficiency quantities.
Our non-firm, interruptible transportation services are provided on Cochin’s pipeline when and to the extent we determine capacity is available in this pipeline system. The shippers typically pay a per-unit rate for actual quantities of product transported.
95
Disaggregation of Revenues
The following table presents our revenues disaggregated by revenue source and type of revenue for each revenue source:
| Year Ended December 31, 2018 | |||||||||||||||||
| Pipelines | Terminals | Total | |||||||||||||||
| (In millions of Canadian dollars) | |||||||||||||||||
| Revenue from contracts with customers | |||||||||||||||||
| Services | |||||||||||||||||
| Firm services(a) | 54.0 | 229.4 | 283.4 | ||||||||||||||
| Fee-based services | 1.3 | 79.2 | 80.5 | ||||||||||||||
| Total services revenues | 55.3 | 308.6 | 363.9 | ||||||||||||||
| Other revenues(b) | 6.9 | 13.0 | 19.9 | ||||||||||||||
| Total revenues | 62.2 | 321.6 | 383.8 | ||||||||||||||
________
a. Includes non-cancellable firm service customer contracts with take-or-pay or minimum volume commitment elements, including those contracts where both the price and quantity amount are fixed. In these arrangements, the customer is obligated to pay for the rendered service whether or not the customer chooses to utilize the service. Excludes service contracts with indexed-based pricing, which along with revenues from other contracts are reported as Fee-based services.
b. Amounts recognized as revenue under guidance prescribed in Topics of the Accounting Standards Codification other than in Topic 606 and primarily include regulatory-based adjustments and leases.
Contract Balances
Contract assets and contract liabilities are the result of timing differences between revenue recognition, billings and cash collections. We recognize contract assets in those instances where billing occurs subsequent to revenue recognition and our right to invoice the customer is conditioned on something other than the passage of time. Our contract liabilities are substantially related to (i) capital improvements paid for in advance by certain customers generally in our non-regulated businesses, which we subsequently recognize as revenue on a straight-line basis over the initial term of the related customer contracts, and (ii) consideration received from customers for temporary deficiency quantities under minimum volume contracts that we expect will be made up in a future period, which we subsequently recognize as revenue when the customer makes up the volumes or the likelihood that the customer will exercise its right for deficiency volumes becomes remote (e.g., there is insufficient capacity to make up the volumes, the deficiency makeup period expires).
The following table presents the activity in our contract assets and liabilities:
| (In millions of Canadian dollars) | |||||
| Contract Assets | |||||
| Balance at January 1, 2018 | 2.1 | ||||
| Additions | 17.9 | ||||
| Transfer to Accounts receivable | (18.4) | ||||
| Balance at December 31, 2018(a) | 1.6 | ||||
| Contract Liabilities | |||||
| Balance at January 1, 2018 | 68.2 | ||||
| Additions | 154.5 | ||||
| Transfer to Revenues | (143.1) | ||||
| Other (b) | 0.7 | ||||
| Balance at December 31, 2018(c) | 80.3 | ||||
______
a. Includes current balances reported within “Other current assets” in our accompanying consolidated balance sheets at December 31, 2018.
b. Includes 2018 foreign currency translation adjustments associated with the balances at December 31, 2017.
96
c. Includes current balances and non-current balances of $12.8 million and $67.5 million reported within “Other current liabilities” and “Contract liabilities,” respectively, in our accompanying consolidated balance sheets at December 31, 2018.
Revenue Allocated to Remaining Performance Obligations
The following table presents our estimated revenue allocated to remaining performance obligations for contracted revenue that has not yet been recognized, representing our “contractually committed” revenue as of December 31, 2018 that we will invoice or transfer from contract liabilities and recognize in future periods:
| Year | Estimated Revenue | ||||
| (In millions of Canadian dollars) | |||||
| 2019 | 313.4 | ||||
| 2020 | 250.0 | ||||
| 2021 | 193.3 | ||||
| 2022 | 183.9 | ||||
| 2023 | 171.3 | ||||
| Thereafter | 533.1 | ||||
| Total | 1,645.0 | ||||
Our contractually committed revenue for purposes of the tabular presentation above is generally limited to service customer contracts which have fixed pricing and fixed volume terms and conditions, generally including contracts with take-or-pay or minimum volume commitment payment obligations. Our contractually committed revenue amounts generally exclude, based on the following practical expedients that we elected to apply, remaining performance obligations for: (i) contracts with index-based pricing or variable volume attributes in which such variable consideration is allocated entirely to a wholly unsatisfied performance obligation or to a wholly unsatisfied promise to transfer a distinct service that forms part of a series of distinct services; (ii) contracts with an original expected duration of one year or less; and (iii) contracts for which we recognize revenue at the amount for which we have the right to invoice for services performed.
Major Customer
For the years ended December 31, 2018 and 2017, revenues from Imperial Oil represented 31% of our total revenue from continuing operations for each year. For the year ended December 31, 2016, revenues from Imperial Oil represented 23% of our total revenue.
19. Reportable Segments
Our reportable business segments are based on the way management organizes the enterprise. Each of our reportable business segments represent a component of the enterprise that engages in a separate business activity and for which discrete financial information is available.
Our reportable business segments are:
•Terminals - the ownership and operation of liquid product merchant storage and rail terminals in the Edmonton, Alberta market as well as a predominantly dry cargo import/export facility in North Vancouver, B.C. Certain Edmonton South Terminal tanks that are owned by TMPL were included in the Trans Mountain Asset Group and continue to be leased to Terminals segment; and
•Pipelines - the ownership and operation of Cochin, a 12-inch diameter multi-product pipeline which spans approximately 1,000 kilometers in Saskatchewan and Alberta and Jet Fuel serving Vancouver International Airport.
We evaluate the performance of our reportable business segments by evaluating our Segment earnings before depreciation and amortization expenses (“Segment EBDA”). We believe that Segment EBDA is a useful measure of our operating performance because it measures segment operating results before D&A and certain expenses that are generally not controllable by the operating managers of our respective business segments, such as general and administrative expense, interest expense, income tax expense and prior to May 2017, the foreign exchange losses (or gains) on the KMI Loans. Our
97
general and administrative expenses include such items as employee benefits, insurance, rentals, certain litigation and shared corporate services including accounting, information technology, human resources and legal services.
We consider each period’s earnings before all non-cash D&A expenses to be an important measure of business segment performance for our reporting segments. We account for intersegment sales at market prices, while we account for asset transfers at either market value or, in some instances, book value. Intercompany transactions are eliminated in consolidation.
Financial information by segment for continuing operations is as follows:
| Year Ended December 31, | 2018 | 2017 | 2016 | ||||||||||||||
| (In millions of Canadian dollars) | |||||||||||||||||
| Revenues | |||||||||||||||||
| Terminals | 321.6 | 298.6 | 287.5 | ||||||||||||||
| Pipelines | 62.2 | 60.3 | 60.3 | ||||||||||||||
| Total consolidated revenues | 383.8 | 358.9 | 347.8 | ||||||||||||||
| Year Ended December 31, | 2018 | 2017 | 2016 | ||||||||||||||
| (In millions of Canadian dollars) | |||||||||||||||||
Operating expenses(a) | |||||||||||||||||
| Terminals | 137.6 | 136.9 | 129.6 | ||||||||||||||
| Pipelines | 23.1 | 32.3 | 30.5 | ||||||||||||||
| Total consolidated operating expenses | 160.7 | 169.2 | 160.1 | ||||||||||||||
| Year Ended December 31, | 2018 | 2017 | 2016 | ||||||||||||||
| (In millions of Canadian dollars) | |||||||||||||||||
| Other operating expense (income) | |||||||||||||||||
| Terminals | (9.3) | 3.1 | 0.2 | ||||||||||||||
| Pipelines | — | 0.3 | — | ||||||||||||||
| Total consolidated other expense (income) | (9.3) | 3.4 | 0.2 | ||||||||||||||
| Year Ended December 31, | 2018 | 2017 | 2016 | ||||||||||||||
| (In millions of Canadian dollars) | |||||||||||||||||
| D&A | |||||||||||||||||
| Terminals | 78.5 | 65.7 | 60.2 | ||||||||||||||
| Pipelines | 4.1 | 6.0 | 4.0 | ||||||||||||||
| Total consolidated D&A | 82.6 | 71.7 | 64.2 | ||||||||||||||
| Year Ended December 31, | 2018 | 2017 | 2016 | ||||||||||||||
| (In millions of Canadian dollars) | |||||||||||||||||
Other expense (income) net of foreign exchange loss, net(b) | |||||||||||||||||
| Terminals | 0.1 | (4.2) | (1.5) | ||||||||||||||
| Pipelines | 0.1 | 8.6 | — | ||||||||||||||
| Total consolidated other expense (income) net of foreign exchange loss | 0.2 | 4.4 | (1.5) | ||||||||||||||
98
| Year Ended December 31, | 2018 | 2017 | 2016 | ||||||||||||||
| (In millions of Canadian dollars) | |||||||||||||||||
Segment EBDA(a)(b) | |||||||||||||||||
| Terminals | 193.2 | 162.8 | 159.2 | ||||||||||||||
| Pipelines | 39.0 | 19.1 | 29.8 | ||||||||||||||
| Total Segment EBDA | 232.2 | 181.9 | 189.0 | ||||||||||||||
| D&A | (82.6) | (71.7) | (64.2) | ||||||||||||||
| Foreign exchange gain on KMI Loans(c) | — | 0.2 | 13.2 | ||||||||||||||
| General and administrative | (39.0) | (30.9) | (25.7) | ||||||||||||||
| Interest income (expense), net | 27.2 | (8.2) | (18.5) | ||||||||||||||
| Income tax expense | (37.8) | (20.8) | (23.4) | ||||||||||||||
| Income from Continuing Operations | 100.0 | 50.5 | 70.4 | ||||||||||||||
| Income from Discontinued Operations, Net of Tax | 1,318.2 | 110.2 | 131.4 | ||||||||||||||
| Net Income | 1,418.2 | 160.7 | 201.8 | ||||||||||||||
| Year Ended December 31, | 2018 | 2017 | 2016 | ||||||||||||||
| (In millions of Canadian dollars) | |||||||||||||||||
| Capital expenditures | |||||||||||||||||
| Terminals | 100.4 | 172.9 | 97.4 | ||||||||||||||
| Pipelines | 1.4 | 7.1 | 6.3 | ||||||||||||||
| Discontinued Operations | 426.6 | 438.5 | 165.4 | ||||||||||||||
| Total consolidated capital expenditures | 528.4 | 618.5 | 269.1 | ||||||||||||||
| December 31, | 2018 | 2017 | |||||||||
| (In millions of Canadian dollars) | |||||||||||
| Assets | |||||||||||
| Terminals | 974.2 | 863.0 | |||||||||
| Pipelines | 4,395.4 | 346.6 | |||||||||
| Assets Held for Sale | — | 3,243.1 | |||||||||
| Total consolidated assets | 5,369.6 | 4,452.7 | |||||||||
_______
a.Includes revenues less operations and maintenance expense, and taxes, other than income taxes and other, net.
b.Segment EBDA for the years ended December 31, 2018, 2017 and 2016 includes $0.1 million, $(5.3) million and $1.4 million, respectively, of foreign exchange gain (losses) due to changes in exchange rates between our Canadian dollar and the U.S. dollar on U.S. dollar denominated balances.
c.The KMI Loans, which represented U.S. dollar denominated long-term notes payable to Kinder Morgan, were settled with proceeds from our IPO.
We do not allocate interest, net, general and administrative, income taxes and foreign currency exchange losses and gains associated with short and long-term debt-affiliates to any of our reportable business segments.
20. Litigation, Commitments and Contingencies
Litigation
We and our subsidiaries are parties to various legal, regulatory and other matters arising from the day-to-day operations of our businesses or certain predecessor operations that may result in claims against the Company. Although no assurance can be given, we believe, based on our experiences to date and taking into account established reserves and insurance, that the ultimate resolution of such items will not have a material adverse impact on our business, financial position, results of operations, cash flows, or dividends to our shareholders. We believe we have meritorious defenses to the matters to which we are a party and intend to vigorously defend the Company. When we determine a loss is probable of occurring and is reasonably estimable, we accrue an undiscounted liability for such contingencies based on our best estimate using information available at that time. If the estimated loss is a range of potential outcomes and there is no better estimate within the range, we accrue the amount at the low end of the range. We disclose contingencies where an adverse outcome may be material, or in the
99
judgment of management, we conclude the matter should otherwise be disclosed. We had no accruals for any outstanding legal proceedings as of December 31, 2018 and 2017.
Base Line Terminal Project Litigation
On March 2, 2018, Arnett & Burgess Oilfield Construction Limited (“A&B”) filed a statement of claim and certificate of lis pendens, in the Court of Queen’s Bench of Alberta, against Alberta Envirofuels Inc. (“AEF”) and Base Line Terminal East Limited Partnership, by its general partner, KM Canada Rail Holdings GP Limited (“BLTELP”). A&B was a contractor on the Base Line Terminal Project (the “BTT Project”) and has claimed it is owed $21.2 million, inclusive of goods and services tax, asserting that BLTELP failed to pay A&B for work performed on the BTT Project under a construction services agreement.
On March 26, 2018, A&B filed a separate statement of claim, in the Court of Queen’s Bench of Alberta, against BLTELP solely, asserting that BLTELP failed to pay for work performed under a separate construction services agreement also related to the BTT Project. With respect to the second claim, A&B has claimed it is owed approximately $1.0 million, inclusive of goods and services tax. We dispute both claims and intend to defend against them vigorously.
On June 5, 2018, Barrier Coating Inc. (“Barrier”) filed a statement of claim and certificate of lis pendens in the Court of Queen’s Bench of Alberta against Enbridge Pipelines Inc., AEF, Strathcona County, BLTELP, KM Canada Rail Holdings GP Limited, Keyera Energy Ltd., Trans Mountain Pipeline ULC and Fabricom Inc. (“Fabricom”). Barrier is a subcontractor on the BTT Project and has a construction agreement with Fabricom (the “Fabricom Agreement”). In its claim, Barrier asserts that Fabricom has breached its obligations under the Fabricom Agreement and, as such, Fabricom owes damages to Barrier. The remaining defendants, including BLTELP, KM Canada Rail Holdings GP Limited and Trans Mountain Pipeline ULC, have been named in the claim as parties with registered interests on lands affected by the work performed by Barrier under the Fabricom Agreement. Barrier asserts that these parties were, collectively, unjustly enriched in the amount of $2.5 million. This matter has been resolved and dismissed without any payment from any Kinder Morgan affiliate.
On September 6, 2018, Fabricom Inc. (“Fabricom”) filed a statement of claim and certificate of lis pendens in the Court of Queen’s Bench of Alberta, against KM Canada Terminals ULC, BLTELP, Trans Mountain Pipeline ULC, AEF, Doran Stewart Oilfield Services (1990) Ltd., Alberta Envirofuels Inc., Enbridge Pipelines Inc., and Strathcona County. Fabricom was a contractor on the BTT Project, and claims that it is owed $30.4 million by BLTELP above the contract value for work performed on the BTT Project under a construction services agreement. Fabricom subsequently sent a notice of arbitration incorporating its claim. Pursuant to a provision in the construction services agreement, the dispute will be resolved by arbitration and the Court of Queen’s Bench matter will be stayed. We dispute this claim and intend to defend against it vigorously.
Commitments
Capital Commitments
As of December 31, 2018, we have commitments for purchases of property, plant, and equipment of $20.2 million which includes approximately $13.8 million of our proportional share of commitments through joint ownership of a joint venture.
Leases and Rights-of-Way Obligations
The table below depicts future gross minimum rental commitments under our operating leases and rights-of-way obligations as of December 31, 2018:
| Commitment | ||||||||
| (In millions of Canadian dollars) | ||||||||
| 2019 | 61.8 | |||||||
| 2020 | 59.9 | |||||||
| 2021 | 59.0 | |||||||
| 2022 | 59.0 | |||||||
| 2023 | 43.2 | |||||||
| Thereafter | 9.4 | |||||||
| Total minimum payments | 292.3 | |||||||
100
The remaining terms on our operating leases range from one to twenty-five years. Total lease and rental expenses were $66.2 million, $69.8 million and $66.5 million for the years ended December 31, 2018, 2017 and 2016, respectively.
Contingencies
We and our subsidiaries are subject to various legal and regulatory actions and proceedings which arise in the normal course of business. While the final outcome of such actions and proceedings cannot be predicted with certainty, we believe that the resolution of such actions and proceedings will not have a material impact on our financial position or results of operations.
We and our subsidiaries are also subject to environmental cleanup and enforcement actions from time to time. Although we believe our operations are in substantial compliance with applicable environmental law and regulations, risks of additional costs and liabilities are inherent in pipeline and terminal operations, and there can be no assurance that we will not incur significant costs and liabilities. Moreover, it is possible that other developments, such as increasingly stringent environmental laws, regulations and enforcement policies under the terms of authority of those laws, and claims for damages to property or persons resulting from our operations, could result in substantial costs and liabilities to us.
Although it is not possible to predict the ultimate outcomes, we believe that the resolution of the environmental matters to which we and our subsidiaries are a party will not have a material adverse effect on our business, financial position, results of operations or cash flows. As of December 31, 2018, we had $0.1 million accrued for our outstanding environment matters and no accrual as of December 31, 2017.
Land Matters Consultation Initiative Trust
On January 30, 2015 Kinder Morgan established the Trust, a required regulatory liability in relation to the NEB's LMCI. The Trust was created to set aside funds collected through abandonment surcharges over a collection period established by the NEB. The NEB approved the amounts to be collected by the company in respect of future pipeline abandonment. Funds are transferred to the Trust account each billing cycle. As of December 31, 2018 and 2017, our Trust liability balance was $6.5 million and $4.8 million, respectively and we had Trust assets of $6.1 million and $4.3 million. The Trust liability amounts are included within Other Current Liabilities and Other Deferred Credits, and the Trust asset amount is recorded in Deferred Charges and Other Assets, on our accompanying consolidated balance sheet.
21. Recent Accounting Pronouncements
Topic 842
On February 25, 2016, the FASB issued ASU No. 2016-02, “Leases” followed by a series of related accounting standard updates (collectively referred to as “Topic 842”). Topic 842 establishes a new lease accounting model for leases. The most significant changes include the clarification of the definition of a lease, the requirement for lessees to recognize for all leases a right-of-use asset and a lease liability in the consolidated balance sheet, and additional quantitative and qualitative disclosures that are designed to give financial statement users information on the amount, timing, and uncertainty of cash flows arising from leases. Expenses are recognized in the consolidated statement of income in a manner similar to current accounting guidance. Lessor accounting under the new standard is substantially unchanged. The new standard will become effective for us beginning with the first quarter 2019. We will adopt the accounting standard using a prospective transition approach, which applies the provisions of the new guidance at the effective date without adjusting the comparative periods presented. We have elected the package of practical expedients permitted under the transition guidance within the new standard, which among other things, allows us to carry forward the historical accounting relating to lease identification and as well as no reassessment of lease identification and classification for existing leases upon adoption. We have also elected the optional practical expedient permitted under the transition guidance within the new standard related to land easements that allows us to carry forward our historical accounting treatment for land easements on existing agreements upon adoption. We have made an accounting policy election to keep leases with an initial term of 12 months or less off of the consolidated balance sheet. We are finalizing our evaluation of the impacts that the adoption of this accounting guidance will have on the consolidated financial statements, and estimate approximately $300 million of additional right-of-use assets and liabilities will be recognized in our consolidated balance sheet upon adoption.
ASU No. 2016-13
On June 16, 2016, the FASB issued ASU No. 2016-13, “Financial Instruments - Credit Losses (Topic 326): Measurement of Credit Losses on Financial Instruments.” This ASU modifies the impairment model to utilize an expected loss
101
methodology in place of the currently used incurred loss methodology, which will result in the more timely recognition of losses. ASU No. 2016-13 will be effective for us as of January 1, 2020, and earlier adoption is permitted. We are currently reviewing the effect of this ASU to our financial statements.
ASU No. 2018-14
On August 28, 2018, the FASB issued ASU No. 2018-14, “Compensation - Retirement Benefits - Defined Benefit Plans - General (Subtopic 715-20): Disclosure Framework - Changes to the Disclosure Requirements for Defined Benefit Plans.” This ASU amends existing annual disclosure requirements applicable to all employers that sponsor defined benefit pension and other postretirement plans by adding, removing, and clarifying certain disclosures. ASU No. 2018-14 will be effective for us for the fiscal year ending December 31, 2020, and earlier adoption is permitted. We are currently reviewing the effect of this ASU to our financial statements.
Supplemental Selected Quarterly Financial Data (Unaudited)
| 2018 | 2017 | |||||||||||||||||||||||||||||||||||||||||||||||||
| Q4(a) | Q3(a) | Q2 | Q1 | Q4 | Q3 | Q2 | Q1 | |||||||||||||||||||||||||||||||||||||||||||
(In millions of Canadian dollars, except for per share amounts) | ||||||||||||||||||||||||||||||||||||||||||||||||||
| Revenues | 105.2 | 94.3 | 95.7 | 88.6 | 95.0 | 85.9 | 89.0 | 89.0 | ||||||||||||||||||||||||||||||||||||||||||
| Operating Income | 31.4 | 26.4 | 32.4 | 20.6 | 28.8 | 17.5 | 20.0 | 17.4 | ||||||||||||||||||||||||||||||||||||||||||
| Foreign exchange gain (loss) | 0.5 | (0.6) | 0.5 | (0.3) | 0.2 | (2.0) | (18.3) | 15.0 | ||||||||||||||||||||||||||||||||||||||||||
| Income from Continuing Operations | 40.3 | 22.2 | 23.5 | 14.0 | 22.5 | 9.8 | 5.9 | 12.3 | ||||||||||||||||||||||||||||||||||||||||||
| Income (loss) from Discontinued Operations, net of tax | — | 19.2 | (9.8) | 30.4 | 23.9 | 32.6 | 19.2 | 34.5 | ||||||||||||||||||||||||||||||||||||||||||
| (Loss) gain on sale of the Trans Mountain Asset Group, net of tax | (29.6) | 1,308.0 | — | — | — | — | — | — | ||||||||||||||||||||||||||||||||||||||||||
| Net Income | 10.7 | 1,349.4 | 13.7 | 44.4 | 46.4 | 42.4 | 25.1 | 46.8 | ||||||||||||||||||||||||||||||||||||||||||
| Net Income Available to Restricted Voting Stockholders | 2.1 | 401.5 | 1.8 | 10.8 | 12.0 | 11.7 | 4.2 | |||||||||||||||||||||||||||||||||||||||||||
| Basic and Diluted Earnings Per Restricted Voting Share from Continuing Operations | 0.30 | 0.14 | 0.13 | 0.05 | 0.14 | 0.06 | 0.11 | |||||||||||||||||||||||||||||||||||||||||||
| Basic and Diluted (Loss) Earnings Per Restricted Voting Share from Discontinued Operations | (0.23) | 11.42 | (0.08) | 0.26 | 0.20 | 0.28 | 0.21 | |||||||||||||||||||||||||||||||||||||||||||
_______
a.The three months ended December 31, 2018 (Q4) include an approximately $6.3 million out of period adjustment that decreased the loss on sale of the Trans Mountain Asset Group, net of tax, and increased net income in Q4. The adjustment relates to a correction on the amount released for deferred income taxes that resulted in a tax benefit from the sale of the Trans Mountain Asset Group for the three months ended September 30, 2018 (Q3), see Note 3. The impact of recognizing the adjustment in Q4 and not in Q3 was not significant to either individual period and did not impact the accompanying consolidated financial statements for the year ended and as of December 31, 2018. Management believes this adjustment between Q4 and Q3 is immaterial to the unaudited supplemental selected quarterly financial data presented above and to the previously issued unaudited consolidated financial statements for Q3.
Item 16. Form 10-K Summary.
Not Applicable.
102
SIGNATURES
Pursuant to the requirements of the Securities Exchange Act of 1934, the Registrant has duly caused this report to be signed on its behalf by the undersigned thereunto duly authorized.
KINDER MORGAN CANADA LIMITED Registrant | ||||||||
| By: /s/ Dax A. Sanders | ||||||||
Dax A. Sanders Chief Financial Officer (principal financial and accounting officer) | ||||||||
| Date: | February 18, 2019 | |||||||
103
Pursuant to the requirements of the Securities Exchange Act of 1934, this report has been signed below by the following persons in the capacities and on the dates indicated.
| Signature | Title | Date | ||||||||||||
| /s/ DAX A. SANDERS | Chief Financial Officer (principal financial officer and principal accounting officer); Director | |||||||||||||
| Dax A. Sanders | February 18, 2019 | |||||||||||||
| /s/ STEVEN J. KEAN | Chief Executive Officer and Chairman (principal executive officer); Director | |||||||||||||
| Steven J. Kean | February 18, 2019 | |||||||||||||
| /s/ KIMBERLY A. DANG | Director | |||||||||||||
| Kimberly A Dang | February 18, 2019 | |||||||||||||
| /s/ DANIEL P. E. FOURNIER | Director | |||||||||||||
| Daniel P. E. Fournier | February 18, 2019 | |||||||||||||
| /s/ GORDON M. RITCHIE | Director | |||||||||||||
| Gordon M. Ritchie | February 18, 2019 | |||||||||||||
| /s/ BROOKE N. WADE | Director | |||||||||||||
| Brooke N. Wade | February 18, 2019 | |||||||||||||
104