UNITED STATES
SECURITIES AND EXCHANGE COMMISSION
Washington, D.C. 20549
Form 10-K
☒ ANNUAL REPORT PURSUANT TO SECTION 13 OR 15(d) OF THE
SECURITIES EXCHANGE ACT OF 1934
For the fiscal year ended December 31, 2024
Commission file number 001-38661
Elanco Animal Health Incorporated
(Exact name of Registrant as specified in its charter) | | | | | | | | |
| INDIANA | | 82-5497352 |
| (State or other jurisdiction of | | (I.R.S. Employer |
| incorporation or organization) | | Identification No.) |
2500 INNOVATION WAY, GREENFIELD, INDIANA 46140
(Address and zip code of principal executive offices)
Registrant’s telephone number, including area code (877) 352-6261
Securities registered pursuant to Section 12(b) of the Act: | | | | | | | | | | | | | | |
| Title of each class | | Trading Symbol(s) | | Name of each exchange on which registered |
| Common Stock, no par value | | ELAN | | New York Stock Exchange |
Securities registered pursuant to Section 12(g) of the Act:
None.
Indicate by check mark if the registrant is a well-known seasoned issuer, as defined in Rule 405 of the Securities Act.
Yes ☐ No ☒
Indicate by check mark if the registrant is not required to file reports pursuant to Section 13 or Section 15(d) of the Act.
Yes ☐ No ☒
Indicate by check mark whether the registrant (1) has filed all reports required to be filed by Section 13 or 15(d) of the Securities Exchange Act of 1934 during the preceding 12 months (or for such shorter period that the registrant was required to file such reports), and (2) has been subject to such filing requirements for the past 90 days.
Yes ☒ No ☐
Indicate by check mark whether the registrant has submitted electronically every Interactive Data File required to be submitted pursuant to Rule 405 of Regulation S-T (§232.405 of this chapter) during the preceding 12 months (or for such shorter period that the registrant was required to submit such files).
Yes ☒ No ☐
Indicate by check mark whether the registrant is a large accelerated filer, an accelerated filer, a non-accelerated filer, a smaller reporting company, or an emerging growth company. See the definitions of a “large accelerated filer,” “accelerated filer,” “smaller reporting company” and "emerging growth company" in Rule 12b-2 of the Exchange Act.
| | | | | | | | | | | | | | | | | | | | | | | |
| Large accelerated filer | ☒ | | | | | Accelerated filer | ☐ |
| Non-accelerated filer | ☐ | | | Smaller reporting company | ☐ |
| | | | | | Emerging growth company | ☐ |
If an emerging growth company, indicate by check mark if the registrant has elected not to use the extended transition period for complying with any new or revised financial accounting standards provided pursuant to Section 13(a) of the Exchange Act. ☐
Indicate by check mark whether the registrant has filed a report on and attestation to its management’s assessment of the effectiveness of its internal control over financial reporting under Section 404(b) of the Sarbanes-Oxley Act (15 U.S.C. 7262(b)) by the registered public accounting firm that prepared or issued its audit report. ☒
If securities are registered pursuant to Section 12(b) of the Act, indicate by check mark whether the financial statements of the registrant included in the filing reflect the correction of an error to previously issued financial statements. ☐
Indicate by check mark whether any of those error corrections are restatements that required a recovery analysis of incentive-based compensation received by any of the registrant’s executive officers during the relevant recovery period pursuant to §240.10D-1(b). ☐
Indicate by check mark whether the registrant is a shell company (as defined in Rule 12b-2 of the Act).
Yes ☐ No ☒
Aggregate market value of the common equity held by non-affiliates computed by reference to the price at which the common equity was last sold as of June 30, 2024, the last business day of the Registrant’s most recently completed second fiscal quarter, was approximately $7.1 billion. The registrant has no non-voting common stock.
The number of shares of common stock outstanding as of February 20, 2025 was 494,613,940.
DOCUMENTS INCORPORATED BY REFERENCE
Portions of the registrant's definitive proxy materials for its 2025 Annual Meeting of Shareholders are incorporated by reference into Part III hereof.
ELANCO ANIMAL HEALTH INCORPORATED
FORM 10-K
FOR THE YEAR ENDED DECEMBER 31, 2024
TABLE OF CONTENTS | | | | | | | | | | | | | | |
| | | | |
| | | | |
| Item 1. | | | | |
| Item 1A. | | | | |
| Item 1B. | | | | |
| Item 1C. | | | | |
| Item 2. | | | | |
| Item 3. | | | | |
| Item 4. | | | | |
| | | |
|
| | | | |
| Item 5. | | | | |
| Item 6. | | | | |
| Item 7. | | | | |
| Item 7A. | | | | |
| Item 8. | | | | |
| Item 9. | | | | |
| Item 9A. | | | | |
| Item 9B. | | | | |
| Item 9C. | | | | |
| | | | |
| | | | |
| Item 10. | | | | |
| Item 11. | | | | |
| Item 12. | | | | |
| Item 13. | | | | |
| Item 14. | | | | |
| | | | |
| | | |
|
| Item 15. | | | | |
| Item 16. | | | | |
| | | | |
| | | | |
FORWARD-LOOKING STATEMENTS AND RISK FACTOR SUMMARY
This Annual Report on Form 10-K (Form 10-K) includes forward-looking statements within the meaning of the federal securities laws. These forward-looking statements include, without limitation, statements concerning the impact on Elanco Animal Health Incorporated and its subsidiaries (collectively, Elanco, the Company, we, us or our) caused by the integration of business acquisitions, expected synergies and cost savings, product launches, global macroeconomic conditions, expectations relating to liquidity and sources of capital, our expected compliance with debt covenants, cost savings, expenses and reserves relating to restructuring actions, our industry and our operations, performance and financial condition, and including, in particular, statements relating to our business, growth strategies, distribution strategies, product development efforts and future expenses.
Forward-looking statements are based on our current expectations and assumptions regarding our business, the economy and other future conditions. Because forward-looking statements relate to the future, by their nature, they are subject to inherent uncertainties, risks and changes in circumstances that are difficult to predict. As a result, our actual results may differ materially from those contemplated by the forward-looking statements. Important risk factors that could cause actual results to differ materially from those in the forward-looking statements include regional, national or global political, economic, business, competitive, market and regulatory conditions, including but not limited to the following:
•operating in a highly competitive industry;
•the success of our research and development (R&D), regulatory approval and licensing efforts;
•the impact of disruptive innovations and advances in veterinary medical practices, animal health technologies and alternatives to animal-derived protein;
•competition from generic products that may be viewed as more cost-effective;
•changes in regulatory restrictions on the use of antibiotics in farm animals;
•an outbreak of infectious disease carried by farm animals;
•risks related to the evaluation of animals;
•consolidation of our customers and distributors;
•the impact of increased or decreased sales into our distribution channels resulting in fluctuations in our revenues;
•our dependence on the success of our top products;
•our ability to complete acquisitions and divestitures and to successfully integrate the businesses we acquire;
•our ability to implement our business strategies or achieve targeted cost efficiencies and gross margin improvements;
•manufacturing problems and capacity imbalances, including at our contract manufacturers;
•fluctuations in inventory levels in our distribution channels;
•risks related to the use of artificial intelligence (AI) in our business;
•our dependence on sophisticated information technology systems and infrastructure, including the use of third-party, cloud-based technologies, and the impact of outages or breaches of the information technology systems and infrastructure we rely on;
•the impact of weather conditions, including those related to climate change, and the availability of natural resources;
•demand, supply and operational challenges associated with the effects of a human disease outbreak, epidemic, pandemic or other widespread public health concern;
•the loss of key personnel or highly skilled employees;
•adverse effects of labor disputes, strikes and/or work stoppages;
•the effect of our substantial indebtedness on our business, including restrictions in our debt agreements that limit our operating flexibility and changes in our credit ratings that lead to higher borrowing expenses and restrict access to credit;
•changes in interest rates that adversely affect our earnings and cash flows;
•risks related to the write-down of goodwill or identifiable intangible assets;
•the lack of availability or significant increases in the cost of raw materials;
•risks related to foreign and domestic economic, political, legal and business environments;
•risks related to foreign currency exchange rate fluctuations;
•risks related to underfunded pension plan liabilities;
•our current plan not to pay dividends and restrictions on our ability to pay dividends;
•the potential impact that actions by activist shareholders could have on the pursuit of our business strategies;
•risks related to tax expense or exposures;
•actions by regulatory bodies, including as a result of their interpretation of studies on product safety;
•the possible slowing or cessation of acceptance and/or adoption of our farm animal sustainability initiatives;
•the impact of increased regulation or decreased governmental financial support related to the raising, processing or consumption of farm animals;
•risks related to tariffs, trade protection measures or other modifications of foreign trade policy;
•the impact of litigation, regulatory investigations and other legal matters, including the risk to our reputation and the risk that our insurance policies may be insufficient to protect us from the impact of such matters;
•challenges to our intellectual property rights or our alleged violation of rights of others;
•misuse, off-label or counterfeiting use of our products;
•unanticipated safety, quality or efficacy concerns and the impact of identified concerns associated with our products;
•insufficient insurance coverage against hazards and claims;
•compliance with privacy laws and security of information;
•risks related to environmental, health and safety laws and regulations; and
•inability to achieve goals or meet expectations of stakeholders with respect to environmental, social and governance matters.
See "Item 1A. Risk Factors" in Part I of this Form 10-K for a further description of these and other factors. Although we have attempted to identify important risk factors, there may be other risk factors not presently known to us or that we presently believe are not material that could cause actual results and developments to differ materially from those made in or suggested by the forward-looking statements contained in this Form 10-K. If any of these risks materialize, or if any of the above assumptions underlying forward-looking statements prove incorrect, actual results and developments may differ materially from those made in or suggested by the forward-looking statements contained in this Form 10-K. We caution you against relying on any forward-looking statements, which should also be read in conjunction with the other cautionary statements that are included elsewhere in this Form 10-K. Any forward-looking statement made by us in this Form 10-K speaks only as of the date hereof. Factors or events that could cause our actual results to differ may emerge from time to time, and it is not possible for us to predict all of them. We undertake no obligation to publicly update or to revise any forward-looking statement, whether as a result of new information, future developments or otherwise, except as may be required by law.
PART I
Overview
Elanco Animal Health Incorporated and its subsidiaries (collectively, Elanco, the Company, we, us, or our) is a global leader in animal health, dedicated to innovating and delivering products and services to prevent and treat disease in farm animals and pets. We partner with farmers, pet owners, veterinarians and society to create value and help our customers improve the health of animals in their care, while also making a meaningful impact on the communities we serve. Our diverse, durable product portfolio is sold in more than 90 countries and serves animals across many species, primarily: dogs and cats (collectively, pet health) and cattle, poultry, swine, sheep and, prior to the divestiture of our aqua business in July 2024, aqua (collectively, farm animal). With this ability to reach the world's animals, we are committed to fulfilling our customer promise: To be your advocate and continually earn your trust, improving the health of animals and creating value through innovative products, expertise and service. Through our customer promise and our commitment to excellence, we strive to advance the well-being of animals, people and the planet, enabling us to realize our vision of Food and Companionship Enriching Life.
With a heritage dating back to 1954, we were formerly a business unit of Eli Lilly and Company (Lilly), becoming an independently incorporated company on September 18, 2018. We finalized our separation from Lilly in March 2019. In August 2020 we acquired Bayer Animal Health, marking the largest acquisition in industry history. This acquisition enabled us to become a more diverse, durable and global company with greater reach and scale. This acquisition also helped us expand our portfolio, creating a better balance between our pet health and farm animal products and between the United States (U.S.) and international markets, while also expanding our omnichannel presence in both the veterinary clinic and in retail markets, including e-commerce.
We have continuously strengthened and expanded our three-pronged strategy: Innovation, Portfolio and Productivity, which remains our foundation for sustained growth and profitability. Over time, we expect to achieve revenue growth and improved profitability by delivering consistent, high-impact Innovation and prioritizing large market opportunities in major geographies. We consistently innovate to improve the health of animals and to benefit our customers. Our focused strategy prioritizes certain assets, including late-stage potential blockbusters, while maximizing life cycle management and refilling the early-stage pipeline to achieve a consistent flow of innovation. We also continue to optimize our diverse Portfolio to grow, leveraging our deep, established customer relationships and expanding product offerings. We will also continue to drive geographic and channel expansion, to reach more of the world's animals. Further, we continue to focus on our strategic Productivity initiatives to improve earnings and cash flows.
In addition, we continue to enhance our approach to sustainability and environmental, social and governance (ESG) principles, focusing on the four interconnected pillars below, which we refer to as Elanco's Healthy Purpose™, designed to create a meaningful impact today and for years to come:
Healthier Animals: We are helping pets and farm animals live healthy, high-quality lives by continuously expanding our portfolio and identifying new and innovative animal care products, practices and services to support animal health and well-being.
Healthier People: We help improve people's lives and livelihoods by promoting animal companionship and enabling healthier and more plentiful and environmentally friendly production of meat, milk, fish and eggs.
Healthier Planet: We are committed to minimizing our environmental footprint while leveraging product and service innovations to help our customers advance their own sustainability efforts.
Healthier Enterprise: We are committed to growing our business with integrity and excellence with respect to all stakeholders, fostering an inclusive, cause-driven culture where employees can make a difference – encouraging ownership, growth and well-being.
Commercial Operations
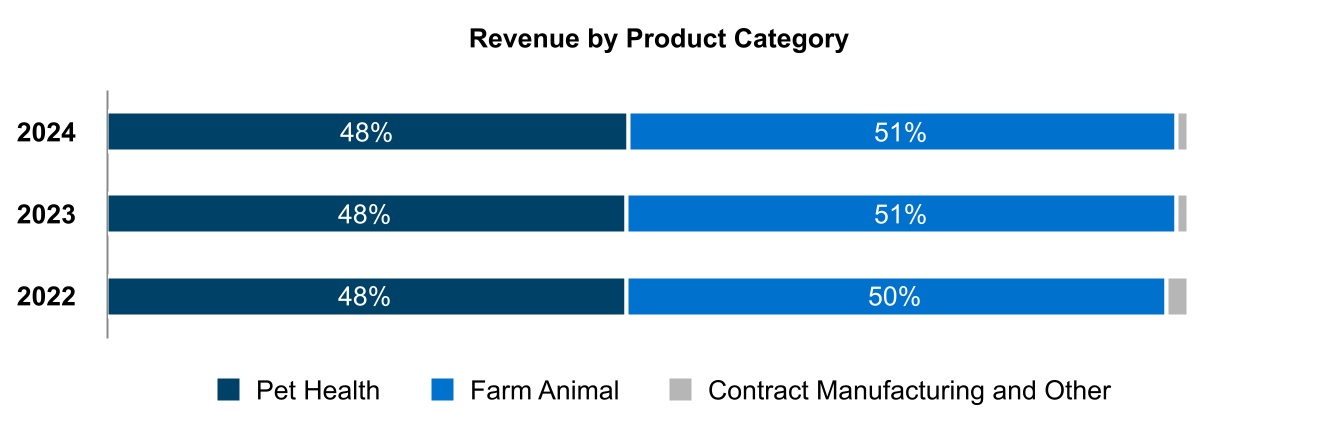
We operate our business as a single segment within the animal health industry, dedicated to fulfilling our vision of Food and Companionship Enriching Life. We advance this vision by offering a comprehensive portfolio of products in the pet health and farm animal product categories. Our reported revenue by product category was as follows:
Contract manufacturing and other represents revenue from arrangements in which we manufacture products on behalf of a third party and royalty revenue.
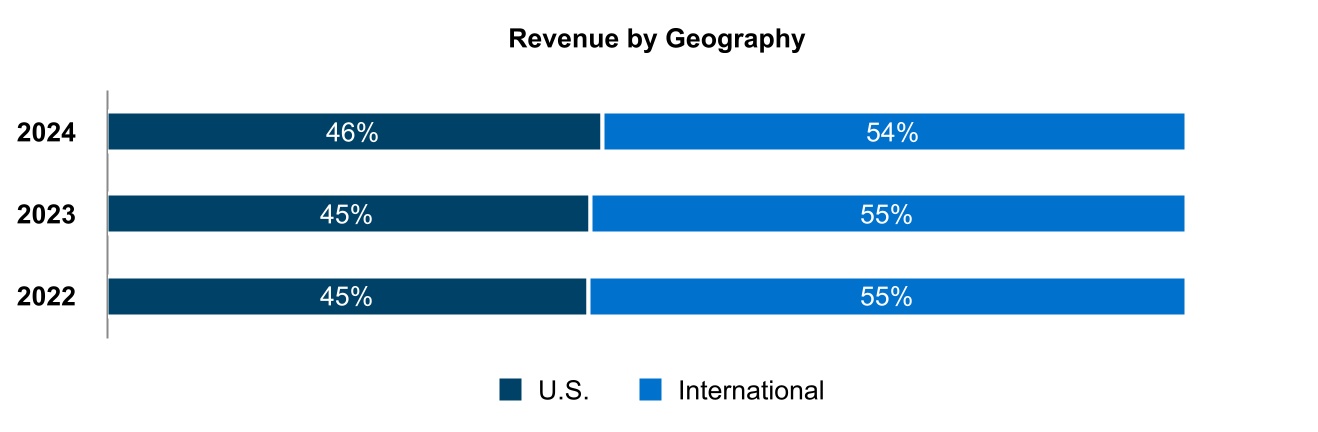
International Operations
Our operations are conducted globally. The U.S. is our largest market, accounting for 46% of our total revenue in 2024. By total revenue, China, Brazil and the United Kingdom (U.K.) are our largest markets outside the U.S. Our reported revenue by geographic region was as follows:
Products
We have a diverse portfolio of products marketed under approximately 200 brands, including products for both pets and farm animals.
| | | | | |
| Pet Health: Our pet health products help pets live longer, healthier and more active lives. Our global pet health portfolio is focused on parasiticides, vaccines and therapeutics. We have one of the broadest parasiticide portfolios in the pet health market based on indications, species and formulations, with products that protect pets from fleas, ticks and internal parasites. Our Advantage Family of brands (Advantage™, K-9 Advantix™, Advocate™, AdTab™, among others) and Seresto™ products are over-the-counter treatments for the prevention and elimination of fleas and ticks and complement our prescription parasiticide products, which include our Credelio Family of brands (Credelio™, Credelio Cat™, Credelio Plus™), Interceptor Plus™, Drontal Family of brands (Doncit™, Drontal™, Drontal Plus™) and Trifexis™. Our vaccines portfolio provides differentiated prevention coverage for a number of important pet health risks and is available in the U.S. only. In therapeutics, we have a broad pain portfolio for dogs and cats across modes of action, indications and disease stages. Pet owners are increasingly treating osteoarthritis in their pets, and our Galliprant™ product offers a convenient at home solution for pet owners. Additionally, we have products that offer treatment for otitis (ear infections) and treatments for certain cardiovascular and dermatology indications. |
| | | | | |
| Farm Animal: Our farm animal products help farmers improve animal health and wellbeing and raise livestock more sustainably, delivering more food while using fewer resources and enhancing the integrity of the food supply. Our farm animal portfolio of products for cattle (beef and dairy), swine and poultry is primarily focused on: 1) efficiency and performance; 2) disease prevention and treatment; 3) food safety; and 4) sustainability. Our products include medicated feed additives, injectable antibiotics, vaccines, insecticides and enzymes, among others. Key farm animal products Rumensin™, Baytril™ and Experior® are used extensively in cattle, while our Maxiban™ and Monteban™ products are valuable offerings for the control and prevention of intestinal disease in poultry. |
In 2024, our top five selling products and/or product families were our Advantage Family (cats and dogs), Seresto (cats and dogs), Rumensin (cattle), Maxiban / Monteban (poultry) and our Credelio Family (cats and dogs). These products and product families combined to represent approximately 36% of our total revenue in 2024, with our largest product family, Advantage Family, representing approximately 10% of total revenue. Information regarding our principal products and product families, those that represented approximately 1% or more of our revenue in 2024, is as follows:
Pet Health Products
| | | | | | | | | | | | | | |
| | | | |
| Product | | Description | | Primary Species |
| | | | |
| Advantage Family | | Family of topical applications that provide broad-spectrum protection against and treatment of fleas, ticks, mosquitoes, lice and biting flies. Certain products within the Advantage Family also provide protection against heartworm, lungworm and other gastrointestinal worm infections, including roundworms, whipworms and hookworms. | | Cats, Dogs |
| | | | |
| Atopica™ | | Controls atopic dermatitis. | | Dogs |
| | | | |
| | | | |
| | | | |
| Credelio Family | | Family of oral products that kills adult fleas, treats flea infestations and treats and controls tick infestations. The introduction of Credelio Quattro™ in January 2025 adds a monthly chewable tablet for dogs that protects against fleas, ticks, heartworms, roundworms, hookworms and three different species of tapeworms. | | Cats, Dogs |
| Drontal Family | | Family of injectable and oral tablet dewormers indicated for the removal of tapeworms, hookworms, roundworms and whipworms. | | Cats, Dogs |
| Galliprant | | Controls pain and inflammation associated with osteoarthritis. | | Dogs |
| | | | |
| | | | |
| | | | |
| Interceptor Plus | | Prevents heartworm disease and helps treat and control roundworm, hookworm, whipworm and tapeworm infections. | | Dogs |
| Milbemax™ | | Treats and controls parasitic infections due to common intestinal worms. | | Cats, Dogs |
| Onsior™ | | Controls postoperative pain and inflammation associated with certain surgeries. | | Cats, Dogs |
| Seresto | | Flea and tick collar with a patented low dose, slow-release technology that kills and repels fleas and ticks which may transmit vector-borne diseases and kills lice for up to 8 months. | | Cats, Dogs |
| Trifexis | | Prevents heartworm disease, kills fleas, helps prevent flea infestations and also helps treat and control hookworms, roundworms and whipworms. | | Dogs |
TruCan™ (vaccines) | | Includes multiple products that collectively protect against distemper, adenovirus, parvovirus, corona, parainfluenza, leptospira canicola and other diseases. | | Dogs |
Farm Animal Products
| | | | | | | | | | | | | | |
| | | | |
| Product | | Description | | Primary Species |
AviPro™ (vaccines) | | Includes multiple products that collectively protect against Newcastle disease, infectious bronchitis, fowl cholera, paramyxovirus Type 3, Bursal Disease, other diseases and foodborne pathogens like Salmonella. | | Poultry |
| | | | |
| Baytril | | Injectable antibiotic active against bacterial respiratory disease pathogens. Baytril is a shared-class antibiotic. | | Cattle, Swine |
| Catosal™ | | Injectable for prevention or treatment of deficiencies of vitamin B12 and phosphorus. | | Cattle |
| | | | |
| | | | |
| Denagard™ | | Treats swine dysentery. Denagard is a shared-class antibiotic. | | Swine |
| Experior | | Reduces ammonia gas emissions from an animal or its waste. | | Cattle |
| | | | | | | | | | | | | | |
| | | | |
| Product | | Description | | Primary Species |
| Hemicell | | Enzyme supplement for poultry and swine feeds. | | Poultry, Swine |
| Maxiban / Monteban | | Prevents coccidiosis in broiler chickens. Maxiban and Monteban are animal-only antibiotics and ionophores. | | Poultry |
| | | | |
| Pulmotil™ | | Controls swine respiratory disease and bovine respiratory disease (BRD). Pulmotil is a shared-class antibiotic. | | Cattle, Swine |
| Rumensin | | Improves feed and milk production efficiency and increases rate of weight gain in cows. Also prevents and controls coccidiosis for cows, calves (excluding veal calves) and goats. Rumensin is an animal-only antibiotic and an ionophore. | | Cattle |
| Surmax™ | | Prevents necrotic enteritis in broiler chickens. Surmax is an animal-only antibiotic. | | Poultry |
| | | | |
| | | | |
| | | | |
A key element of our targeted value creation strategy is to drive revenue growth through portfolio development and product innovation. We continue to pursue the development of new chemical and biological molecules, as well as additional registrations and indications for current products. Our future growth depends on both our pipeline of new products, including new products we develop internally, develop with partners or that we are able to obtain through licenses or acquisitions, and the life cycle management of our existing products. We believe we are an industry leader in animal health R&D, with a track record of successful product innovation, business development and commercialization. New product development and regulatory highlights during 2024 included the following:
Bovaer: In May 2024, the U.S. Food and Drug Administration (FDA) completed its comprehensive, multi-year review of Bovaer® (3-NOP), a first-in-class methane-reducing feed ingredient for use in lactating dairy cattle. Producers began feeding the product to cattle in the U.S. during the third quarter of 2024.
Zenrelia: We received final FDA approval for Zenrelia®, a JAK inhibitor targeting control of pruritus and atopic dermatitis in dogs, in September 2024. We launched Zenrelia shortly after final approval, with the first sales occurring in late September. We have also received approval for Zenrelia in Brazil, Canada and Japan. Additional reviews are ongoing in other key markets, including Europe, U.K. and Australia.
Credelio Quattro: In October 2024, we received final approval from the FDA for Credelio Quattro, a monthly chewable tablet for dogs that protects against fleas, ticks, heartworms, roundworms, hookworms and three different species of tapeworms. Credelio Quattro was launched, with the first commercial sale occurring in January 2025.
Experior: In October 2024, we received multiple combination clearance approvals from the FDA for Experior to be used in combination with other farm animal products, allowing for broader use in heifers, which represent nearly 40% of the fed cattle population in the U.S.
Seasonality
While many of our products are sold consistently throughout the year, we do experience seasonality in our pet health business due to increased demand for certain parasiticide product offerings in the first half of the year. For example, in 2024 approximately 70% and 55% of total annual revenue generated by our higher-margin parasiticide products Seresto and Advantage Family, respectively, occurred during the first half of the year, which is reflective of the flea and tick season in the Northern Hemisphere.
Sales and Marketing
Through our global sales force of over 2,200 sales representatives, our veterinary consultants and our key distributors, we seek to build strong customer relationships and fulfill demand for our products. Our sales representatives visit our customers, including consultants, veterinarians, farm animal producers and resellers, to inform, promote and sell our products and to support customers. Our veterinary consultants are available to provide scientific consulting focused on disease management and herd management, training and education on diverse topics, including responsible product use, and generally have advanced degrees in veterinary medicine, veterinary nutrition or other agriculture-related fields. These direct relationships with customers allow us to better understand their needs and provide us access to customer decision makers. Additionally, our sales representatives and veterinary consultants focus on collaborating with our customers to educate and support them on topics such as local disease awareness and to help them adopt new and more sophisticated animal health solutions, which may include the use of our products. In addition, our sales and marketing organization provides enhanced value by supporting farm animal producers to maximize their yields and reduce their costs. Furthermore, our expertise and data analytics help our customers analyze large amounts of health and production data in order to improve production efficiency and business performance.
Customers
We primarily sell our pet health products to third-party distributors and retailers, as well as directly to veterinarians who typically then sell our products to pet owners. We primarily sell our farm animal products to third-party distributors and directly to a diverse set of farm animal producers, including beef, dairy, pork and poultry operations. Our omnichannel presence allows us to sell into both the veterinary clinic and retail markets, including e-commerce. Certain top selling pet health products, including the Advantage Family and Seresto, are offered through these channels. Our largest customer, an affiliate of Cencora, Inc., is a third-party veterinary distributor and represented approximately 11% of our total revenue in 2024. Our second largest customer, which is also a third-party distributor, represented approximately 6% of revenue in 2024, while no other customer represented greater than 5% of revenue during 2024.
Research and Development
Our R&D efforts focus on delivering consistent, high-impact innovation. Our R&D team is a project driven organization, with our R&D projects executed and led by highly experienced individuals with deep technical knowledge and substantial experience in discovery research, clinical sciences, technological development and regulatory expertise across our pet health and farm animal product categories. We believe this approach allows us to consistently progress our multi-year innovation projects toward regulatory approvals, while ensuring clear visibility to the innovation portfolio composition, value and progress. As of December 31, 2024, we employed over 1,000 employees in our global R&D and Regulatory Affairs organizations.
Our R&D organization utilizes a fully integrated global network of labs, service centers and development sites supported by a network of third-party partners. We also have a significant international regulatory operation that manages new product submissions and ensures ongoing compliance for our existing commercial portfolio. Our global R&D sites are comprised of the following:
| | | | | | | | | | | |
| R&D Centers of Excellence with a Global Scope | | Major Regional Centers for Key Markets |
| Kemps Creek, Australia | Speke, U.K. | | Sao Paulo, Brazil |
| Monheim, Germany | Fort Dodge, Iowa | | Shanghai, China |
| Bangalore, India | Greenfield, Indiana (R&D headquarters) | | |
| Basel, Switzerland | | | |
Our R&D efforts focus on products that prevent and treat disease, improve and extend quality of life, improve the type of care received by animals and reduce the environmental impact of raising livestock. We seek to concentrate our resources on projects that match our strategy and where we can leverage our broad technical and commercial capabilities. In addition to supporting our existing product portfolio, new product innovation is a core part of our business strategy. Our approach is a build, buy or partner strategy to develop compelling innovations that originate from our scientists and innovators, academia, agribusiness or external partners including human pharmaceutical, agriculture and biotechnology organizations. We focus our R&D investments on projects that target novel product introductions with new active ingredients, as well as products leveraging known active ingredients in new indications, presentations, combinations and species expansion.
Our R&D efforts are balanced across species, development phases and technology platforms. We apply large and small molecule approaches for both farm animals and pets. Additionally, we employ various delivery strategies for products, including in-feed, injectable, oral and topical formulations developed in conjunction with our manufacturing team to assure reliable and consistent production that leverages the capabilities within our internal and external manufacturing network.
Portfolio investment decisions and prioritization are influenced by the probability of technical success, economic value, time to market, portfolio fit and balance. R&D expenses totaled $344 million in 2024, $327 million in 2023 and $321 million in 2022.
Manufacturing and Supply Chain
We have a global manufacturing network of 17 sites comprised of the following:
| | | | | | | | | | | | | | |
| International | | | | U.S. |
| Barueri, Brazil | | Santa Clara, Mexico | | Clinton, Indiana |
| Chengdu, China | | Manukau, New Zealand(1) | | Terre Haute, Indiana |
| Wusi, China | | Banwol, South Korea | | Fort Dodge, Iowa |
| Huningue, France | | Chungli, Taiwan | | Elwood, Kansas |
| Cuxhaven, Germany | | Speke, United Kingdom(2) | | Kansas City, Kansas |
| Kiel, Germany | | | | Winslow, Maine |
(1)In October 2024, we entered into an agreement to sell our manufacturing facility in Manukau, New Zealand. This transaction is expected to close in the first half of 2025 pending regulatory approvals and subject to other closing conditions.
(2)In November 2024, we acquired the manufacturing facility and related assets in Speke, U.K. from a previous contract manufacturing partner. See Note 4. Acquisitions, Divestitures and Other Arrangements to the consolidated financial statements for further information.
Our products are manufactured both at the sites listed above that are operated by us and across a network of approximately 130 contract manufacturing organizations (CMOs). Our external manufacturing team centrally governs and provides oversight to our global CMO relationships. We select CMOs based on several factors, including: (1) their ability to reliably supply products or materials that meet our quality standards at an optimized cost; (2) their access to specialty products and technologies; (3) capacity; (4) financial analyses; and (5) local presence. Our external manufacturing team seeks to ensure that all CMOs we use adhere to our standards of manufacturing quality.
Pharmaceutical production processes are complex, highly regulated and can vary widely from product to product. Shifting or adding manufacturing capacity can be a lengthy process requiring significant capital expenditures, process modifications and regulatory approvals. We have in the past invested in, and will continue to invest in, improvements to our existing manufacturing facilities. For example, in 2024 we announced a planned $130 million expansion of our biologics manufacturing facility in Elwood, Kansas to enable further growth of our monoclonal antibody portfolio. We also intend to continue our efficiency improvement programs in our manufacturing and supply chain organization. Our strong quality control and quality assurance programs are managed and coordinated globally and are in place at all internal manufacturing sites and external manufacturing hubs. We also regularly inspect and audit our internal sites and CMO locations.
To maintain supply of our products, we use a variety of techniques, including comprehensive quality and planning and inventory management systems. We generally seek to develop an appropriate inventory strategy to fill market demand until an alternative source of supply can be implemented, in the event a supplier becomes unable to provide the required materials or product. However, various developments have led, and in the future may lead, to interruption or shortages in supply until we establish new sources, implement alternative processes, bring new manufacturing facilities online or pause or discontinue product sales in one or more markets. For example, in September 2024 one of our contract manufacturing supply partners, TriRx Speke Ltd (TriRx Speke), entered into trading administration in the U.K. Although we minimized supply disruption through our acquisition of this site in November 2024, additional manufacturing or supply chain challenges could occur in the future.
Raw Materials
We purchase certain raw materials and active pharmaceutical ingredients (API) necessary for the commercial production of our products from a variety of third-party suppliers. Principal materials used in our manufacturing operations for key brands are typically available from more than one source; however, we may in some instances obtain certain raw or intermediate materials from only a single source. Our active ingredients for biologics are manufactured primarily in internal facilities, while chemically derived active ingredients are sourced from external partners.
Competition
We face intense competition globally. Competition may vary depending on the particular region, species, product category or individual product. We compete principally on the basis of product quality, price, cost-effectiveness, promotional effectiveness, new product development and product differentiation. Certain Elanco products, both existing and new, may compete with other branded or generic products already on the market or that are later developed by competitors. When competitors introduce new products with ease-of-use, therapeutic or cost advantages, our products may become subject to decreased sales and/or price reductions.
Our primary competitors include animal health medicines and vaccines companies such as Zoetis Inc., Boehringer Ingelheim Vetmedica, Inc., the animal health division of Boehringer Ingelheim GmbH, and Merck Animal Health, the animal health division of Merck & Co., Inc. We also compete with numerous other producers of animal health products throughout the world, including start-up companies working in the animal health area. In addition, we also face competition globally from manufacturers of generic drugs and producers of nutritional health products.
Intellectual Property
Our technology, brands and other intellectual property are important elements of our business. We rely on patent, trademark, copyright and trade secret laws, as well as regulatory exclusivity periods and non-disclosure agreements to protect our intellectual property rights. Our policy is to vigorously protect, enforce and defend our rights to our intellectual property.
Our product portfolio and certain product candidates enjoy the protection of approximately 6,700 patents and applications, filed in over 90 countries, with a concentration in our major markets as well as other markets with strong patent laws and protections. While many of the patents and patent applications in our portfolio are the result of our own work, others have been developed in collaboration with partners, acquired through business transactions
or licensed to us by third parties. A subset of our current products or product candidates are covered by patents and patent applications.
Patents for individual products expire at different times based on the date of the patent filing (or occasionally, the date of patent grant) and the legal term of patents in the countries where such patents are obtained. Some of our principal products, including certain products within our Advantage Family, Rumensin and Maxiban / Monteban do not have patent protection. Other products are protected by patents that expire over the next several years. Below is a summary of our recent and upcoming key patent expirations:
•Galliprant is protected by patents in the U.S., Europe, Canada, Japan and other key markets. While patents covering the active ingredient, grapiprant, expired in 2021 in all markets except Japan, patents covering the physical form of the active ingredient remain in force and will expire between 2026 and 2031, depending on jurisdiction. Patent coverage relating to methods of use and formulation will expire in 2035 in most jurisdictions.
•The Seresto formulation patent will expire in the U.S. in September 2027. In Europe, the formulation patents will expire in June 2025, but in some countries, including Spain, Italy and the U.K., supplementary protection certificates (SPCs) have been granted that expire in August 2026.
•Patent coverage for Milbemax/Interceptor chewable products expired in July 2024 in Europe and other key markets. Patent coverage for Interceptor Plus extends through October 2028 in the U.S.
•The U.S. patent for Experior's active ingredient, lubabegron, will expire in April 2025. Coverage for Experior methods of use will expire in 2037 in the U.S. and 2035 in other key markets.
Additionally, many of our vaccine products, including the TruCan family of vaccines, are based on proprietary or patented master seeds and formulations. We actively seek to protect our proprietary information, including our trade secrets and proprietary know-how, through a variety of means, including by seeking to require our employees, consultants, advisors and partners to enter into confidentiality agreements and other arrangements upon the commencement of their employment or engagement.
We seek to file and maintain trademarks around the world based on commercial activities in most regions where we have, or desire to have, a business presence for a particular product. We currently maintain more than 12,800 trademark applications and registrations in major regions, primarily identifying products dedicated to the care of livestock and pets.
Regulatory Matters
The sale of animal health products is governed by the laws and regulations specific to each country in which we sell our products. To maintain compliance with these regulatory requirements, we have established processes, systems and dedicated resources with end-to-end involvement from product concept to launch and maintenance in the market. Our regulatory function is Elanco's key interface with the relevant authorities and is responsible for applying for and obtaining the necessary registrations and post-approvals, extending them if appropriate (e.g., developing claims in additional species), updating (e.g., changes to shelf-life or manufacturing site) and ongoing monitoring of safety and efficacy through our global pharmacovigilance system. In this way, the regulatory function ensures registrations remain valid and our products can continue to be sold. To effectively do this, our regulatory function actively engages in dialogue with the relevant authorities regarding policies that relate to animal health products. In most of our markets, the relevant authority is separate from those governing human medicinal products.
United States
FDA. The regulatory body that is responsible for the regulation of animal health pharmaceuticals in the U.S. is the Center for Veterinary Medicine (CVM), a division of the FDA. All manufacturers of animal health pharmaceuticals must demonstrate their products to be safe, effective and produced by a consistent method of manufacture as defined under the Federal Food, Drug and Cosmetic Act (FFDCA). The FDA’s basis for approving a new animal drug application is documented in a Freedom of Information Summary. Post-approval monitoring of products is required by law, with reports being provided to the CVM’s Office of Surveillance and Compliance. Reports of product quality defects, adverse events or unexpected results are maintained and submitted in accordance with the law. Additionally, as part of the drug experience report, we are required to submit all new information pertaining to the safety or effectiveness of a product, regardless of the source.
U.S. Department of Agriculture (USDA). The regulatory body in the U.S. for veterinary biologicals is the USDA. The Center for Veterinary Biologics within the Animal and Plant Health Inspection Service in the USDA is responsible for the regulation of animal health biologicals, which includes but is not limited to vaccines, bacterins, allergens, certain antibodies, antitoxins, toxoids, immunostimulants, certain cytokines, antigenic or immunizing components of live microorganisms and diagnostic components of natural or synthetic origin, or that are derived from synthesizing or altering various substances or components of substances such as microorganisms, genes or genetic sequences, carbohydrates, proteins, antigens, allergens or antibodies. All manufacturers of animal health biologicals must show their products to be pure, safe, effective and produced by a consistent method of manufacture as defined under the
Virus Serum Toxin Act. Post-approval monitoring of products is also required. Reports of product quality defects, adverse events or unexpected results are maintained and submitted in accordance with the agency requirements.
Environmental Protection Agency (EPA). The main regulatory body in the U.S. for veterinary pesticides is the EPA. The EPA’s Office of Pesticide Programs is responsible for the regulation of most pesticide products applied to animals in accordance with a memorandum of understanding between the FDA and the EPA for products that are subject to regulation under both the FFDCA and the Federal Insecticide, Fungicide and Rodenticide Act (FIFRA). All manufacturers of animal health pesticides must show their products will not cause unreasonable adverse effects to humans or the environment as stated in the act. Within the U.S., individual state pesticide authorities must also approve pesticide products that have been approved by the EPA before distribution in that state. Post-approval monitoring of products is required, with reports provided to the EPA and some state regulatory agencies.
European Union (EU)
The European Medicines Agency (EMA) is a centralized agency of the EU responsible for the scientific evaluation of many of the Veterinary Medicinal Products (VMP) developed by pharmaceutical companies for use in the EU. The agency has a veterinary review section distinct from the medical review section for human products. The Committee for Veterinary Medicinal Products (CVMP) is responsible for scientific review of the submissions for VMP, including immunological products. If the CVMP concludes that all requirements for quality, safety and efficacy are met and the product benefits outweigh the risks, it issues a positive opinion that is forwarded to the European Commission, which takes the final decision following the European comitology procedure. The centralized marketing authorization is valid in all of the EU and in Northern Ireland. All countries that are not part of the EU but belong to the European Economic Area (EEA), such as Norway, Iceland and Liechtenstein, have been part of the scientific assessment done by the CVMP. These countries issue a national marketing approval in accordance with the European Commission's decision.
If approval is sought for products that either cannot or do not need to follow the centralized procedure, approval can also be achieved by national approval in an EEA country agency. This national authorization can be mutually recognized by other EEA countries/EU member states (Mutual Recognition Procedure). In addition, national and mutual recognition can be done in a combined procedure (Decentralized Procedure).
A series of regulations, directives, guidelines, EU Pharmacopeia Monographs and other legislation provide the requirements for approval in the EU. In general, these requirements are similar to those in the U.S., requiring demonstrated evidence of purity, safety, efficacy and consistency of manufacturing processes.
The European Food Safety Authority (EFSA) is the agency of the EU that provides scientific advice and communicates with respect to existing and emerging risks associated with the food chain. Based on EFSA’s mandate, it evaluates applications for feed additives, including coccidiostats, enzymes and several nutritionals for animals.
The European Chemicals Agency (ECHA) is the agency of the EU for the safe use of chemicals. Based on the ECHA’s mandate, it conducts the evaluation of biocides for the EU.
We are also governed by each of the national regulatory bodies in the EU.
United Kingdom
The Veterinary Medicines Directorate (VMD) is the main regulatory body in the U.K. responsible for regulating and controlling veterinary pharmaceuticals. A trade agreement between the U.K. and the EU includes regulatory and customs cooperation mechanisms, as well as provisions supporting open and fair competition. The Northern Ireland protocol, which is part of the trade deal, requires that VMD follow EU rules in Northern Ireland. Laws applying to the rest of the U.K. remain largely aligned.
Brazil
The Ministry of Agriculture, Livestock Production and Supply (MAPA) is the regulatory body in Brazil that is responsible for the regulation and control of pharmaceuticals, biologicals and medicinal feed additives for animal use. MAPA’s regulatory activities are conducted through the Secretary of Agricultural Defense and its Livestock Products Inspection Department. In addition, regulatory activities are conducted at a local level through the Federal Agriculture Superintendence. These activities include the inspection and licensing of both manufacturing and commercial establishments for veterinary products, as well as the submission, review and approval of pharmaceuticals, biologicals and medicinal feed additives. MAPA is one of the most active regulatory agencies in Latin America, having permanent seats at several international animal health forums, such as Codex Alimentarius, World Organization for Animal Health and Committee of Veterinary Medicines for the Americas.
China
The Ministry of Agriculture and Rural Affairs (MARA) is the regulatory body that is responsible for the regulation and control of pharmaceuticals, biologicals, disinfectants, medicinal feed additives, pesticides and feed/feed additives for animal use. There are three organizations under the MARA that regulate animal health:
•The Institute of Veterinary Drug Control (IVDC) is responsible for the evaluation of new applications, renewals, variations, manufacturers, quality methods and tissue residue methods for pharmaceuticals, biologicals, disinfectants and medicinal feed additives.
•The feed/feed additive office is responsible for the registration and renewal of feed and feed additives.
•The pesticide bureau is responsible for the registration and renewal of pesticide products.
Rest of World
Country-specific regulatory laws typically have provisions that include requirements for certain labeling, safety, efficacy and manufacturers’ quality control procedures (to assure the consistency of the products), manufacturing site standards, as well as company records and reports. Many other countries’ regulatory agencies either refer to some or all of the requirements of the U.S. or EU and may have additional specific local requirements. Most authorities also consider the standards set by international animal health entities, including the World Organization for Animal Health (WOAH), Codex Alimentarius and the International Cooperation on Harmonization of Technical Requirements for Registration of Veterinary Medicinal Products (VICH).
Joint FAO/WHO Expert Committee on Food Additives. The Joint FAO/WHO Expert Committee on Food Additives is an international expert scientific committee that is administered jointly by the Food and Agriculture Organization of the United Nations (FAO) and the World Health Organization (WHO). It provides a risk assessment/safety evaluation of residues of veterinary drugs in animal products, exposure and residue definition and maximum residue limit proposals for veterinary drugs. Similarly, the Joint FAO/WHO Meeting on Pesticide Residues (JMPR) is an international expert scientific group administered jointly by the FAO and WHO. JMPR reviews residues and analytical aspects of the pesticides, estimates the maximum residue levels, reviews toxicological data and estimates acceptable daily intakes for humans of the pesticides under consideration. Elanco works with this committee to establish acceptably safe levels of residual substances in food-producing animals after treatment with veterinary drugs or pesticides. This in turn enables the calculation of appropriate withdrawal times for our products prior to an animal entering the food chain.
Advertising and Promotion Review. Promotion of animal health products is controlled by regulations in many countries. These rules generally restrict advertising and promotion to those claims and uses that have been reviewed and endorsed by the applicable agency. We conduct a review of promotion material for compliance with the local and regional requirements in the markets where we sell animal health products.
Import and Export of Products. The importation and exportation of animal health products is controlled by regulations in many countries. In some jurisdictions this may include obtaining separate permits or licenses by product or by company or filing notices with applicable regulatory agencies prior to import or export of product. We ensure compliance with local, regional and global regulations in the markets where we import/export our animal health products.
International Cooperation on Harmonization of Technical Requirements for Registration of Veterinary Medicinal Products. VICH is a trilateral (EU-Japan-U.S.) program launched in 1996 aimed at harmonizing technical requirements for veterinary product registration. Several other countries have obtained observer status, for example, Canada, New Zealand, Australia, South Africa and the U.K., or are linked to VICH on the basis of the VICH Outreach Forum, a VICH initiative with the main objective of providing a basis for wider international harmonization of technical requirements. In addition, the World Organization for Animal Health is an associate member of VICH.
Environmental, Health and Safety
In addition to the laws and regulations discussed above, we are also subject to various federal, state, local and foreign laws and regulations, both within and outside the U.S., relating to environmental, health and safety (EHS) and sustainability matters. These laws and regulations govern matters such as the emission and discharge of hazardous materials into the ground, air or water; the generation, use, storage, handling, treatment, packaging, transportation, exposure to and disposal of hazardous and biological materials, including recordkeeping, reporting and registration requirements; and the health and safety of our employees. Due to our operations, these laws and regulations also require us to obtain and comply with permits, registrations and other authorizations issued by governmental authorities. These authorities can modify or revoke our permits, registrations or other authorizations and can enforce compliance through fines and injunctions.
Certain environmental laws impose joint and several liability, without regard to fault, for clean-up costs related to the disposal or release of hazardous substances into the environment, including at third-party sites or offsite disposal locations, or at sites that are currently owned or operated (or were formerly owned or operated) where such a disposal or release occurred. Although our current reserves for environmental remediation obligations are not material, we could be subject to liability for the investigation and remediation of legacy environmental contamination caused by historical industrial activity at sites we own or on which we operate. We are also monitoring and investigating environmental contamination from past industrial activity at certain sites. In connection with past divestitures, we have undertaken certain indemnification obligations that may require us, in the future, to conduct or
finance environmental clean-ups at sites that we no longer own or operate. We have also entered into indemnification agreements in connection with certain of our past acquisitions, pursuant to which we are, or may be, indemnified for various environmental clean-ups. However, such indemnities are limited in both time and scope and may be further limited in the presence of new information or may not be available at all.
In addition to clean-up actions brought by federal, state, local and foreign governmental entities, private parties could raise personal injury or other claims against us due to the presence of, or exposure to, hazardous materials on, from or otherwise relating to such a property. We have made, and intend to continue to make, necessary expenditures for compliance with applicable EHS laws and regulations.
Human Capital
Employees. As of December 31, 2024, we employed approximately 9,000 full time employees and approximately 450 fixed-duration employees, which are individuals hired for a pre-defined length of time (typically one to four years). Approximately 30% of our global workforce is U.S.-based, while slightly more than 10% of our global employees are members of unions, works councils, trade associations or are otherwise subject to collective bargaining agreements, primarily in Germany and the U.S.
Our Culture. At Elanco, we are committed to fostering an inclusive culture where employees can make a difference, encouraging ownership, growth and well-being. We are committed to creating a culture built on the foundation of the three following values that guide our decisions and the four following behavioral pillars that guide our actions:
Values:
Integrity – Do the right thing in the right way.
Respect – Respect people, our customers and the animals in their care.
Excellence – Be accountable. Continuously improve. Deliver with discipline.
Behavioral Pillars:
Involve – We seek participation and input to gain commitment and passionate performance and create an engaged community. We act with humility as One Elanco, collaborating for the best outcomes for the entire company.
Deliver – We focus on the essential, build mastery and diligently deliver on our commitments to our colleagues, customers and shareholders.
Own – We are accountable and empowered. We ask questions and raise concerns. We are fully invested in Elanco's success.
Innovate – We bring an innovative mindset that drives continuous improvement of our processes, products and services.
At Elanco, this culture drives employee performance, and our employees are driven by these values and behavioral pillars. Leadership and employees are encouraged to evaluate performance with these values and behavioral pillars in mind.
Inclusion, Diversity, Equity and Accessibility (IDEA). Our comprehensive IDEA strategy includes talent acquisition efforts focused on attracting high-quality candidates from a variety of sources and learning, mentoring and development opportunities for all employees. We also support the continued needs of our workforce through the evolution of our benefits, including paid time off and parental leave.
Our Global IDEA Council is an employee-led and leadership-supported group that influences the strategic direction of IDEA efforts at Elanco and represents our sites and affiliates from around the world. Additionally, nine Elanco Employee Resources Groups (ERGs) are essential to delivering our promise to employees to foster an inclusive culture and are key to the success of our IDEA strategy. ERGs are unique communities of employees from historically under-recognized groups, and their allies, offering support and professional development opportunities. Any employee is eligible to join any ERG.
Total Rewards. We invest in our workforce by offering competitive salaries, incentives and benefits. Our pay-for-performance philosophy is designed to create ownership and to help ensure we attract and retain talent, as well as reward and recognize top-performing employees through merit increases and other rewards. We benchmark our total rewards annually to ensure our compensation and benefit programs remain competitive with our peers. Our benefits are one way we support our employees’ well-being and deliver on our employee promise.
Development. We offer employees opportunities to advance their careers at Elanco and are committed to equipping employees with relevant skills and development opportunities to help them thrive and meet the ever-changing needs of customers and stakeholders across our dynamic and growing industry.
Beyond professional growth and development, Elanco employees actively engage in initiatives aligned to Elanco's Healthy Purpose to advance the well-being of animals, people, the planet and our enterprise, enabling us to realize our vision of Food and Companionship Enriching Life.
Available Information
Our website address is www.elanco.com. On our website, specifically within the "Investor Relations" section, we make available, free of charge, our annual, quarterly and current reports, including amendments to such reports, as soon as reasonably practicable after we electronically file such material with, or furnish such material to, the U.S. Securities and Exchange Commission (the SEC). In addition, the SEC maintains an internet site that contains reports, proxy and information statements, and other information regarding issuers, including Elanco, that file electronically with the SEC at www.sec.gov.
Information relating to corporate governance at Elanco, including our Corporate Governance Guidelines, Code of Conduct, Financial Code of Ethics, Articles of Incorporation, Bylaws, Committee Charters; information concerning our executive officers and members of our Board of Directors; and ways to communicate are also available on our website, www.elanco.com. We will provide any of the foregoing information without charge upon written request to Elanco’s Corporate Secretary, Elanco, 2500 Innovation Way, Greenfield, Indiana 46140. Information relating to shareholder services is also available on our website.
Information contained on our website is not part of, or incorporated by reference, in this Form 10-K.
Our business, financial condition and results of operations are subject to various risks, including but not limited to the risks described below. If any of such risks actually materializes, our business, financial condition and results of operations could be materially adversely affected.
Risks Related to the Animal Health Industry
The animal health industry is highly competitive.
The animal health industry is highly competitive. Our competitors include standalone animal health businesses, the animal health businesses of large pharmaceutical companies, specialty animal health businesses and companies that mainly produce generic products. Several start-up companies also compete in the animal health industry. We believe many of our competitors are conducting R&D activities in areas served by our products and in areas in which we are developing products. We also face competition from producers of nutritional health products. These competitors may have access to greater financial, marketing, technical and other resources. As a result, they may be able to devote more resources to developing, manufacturing, marketing and selling their products, initiating or withstanding substantial price competition or more readily taking advantage of acquisitions or other opportunities. Further, consolidation in the animal health industry could result in existing competitors realizing additional efficiencies or improving portfolio bundling opportunities, thereby potentially increasing their market share and pricing power, which could lead to a decrease in our revenue and profitability. For example, many of our competitors have relationships with key distributors and, because of their size, an ability to offer attractive pricing incentives, which may negatively impact or hinder our relationships with these distributors. In addition to competition from established market participants, new entrants to the animal health industry could substantially reduce our market share, render our products obsolete or disrupt our business model.
Competitive pressures could arise from, among other things, differences in safety and efficacy product profiles, limited demand growth or a significant number of additional competitive products being introduced into a particular market, price reductions by competitors, the ability of competitors to capitalize on their economies of scale, the ability of competitors to produce or otherwise procure animal health products at lower costs than we can and the ability of competitors to access more or newer technology than we can. To the extent any of our competitors are more successful with respect to any key competitive factor, or we are forced to reduce, or are unable to raise, the price of any of our products in order to remain competitive, our business, financial condition and results of operations could be materially adversely affected.
Our R&D, acquisition and licensing efforts may fail to generate commercially successful new products or to expand the use of our existing products.
Our future success depends on both our existing product portfolio and our pipeline of new products, including new products that we develop internally or through joint ventures and products we obtain through licenses or acquisitions. We commit substantial effort, funds and other resources to R&D, primarily through our own dedicated resources but also through collaborations with third parties. We also have acquired or partnered with a number of smaller animal health businesses, and we intend to continue to do so in the future. There are significant risks and uncertainties involved with the execution of these partnerships, many of which are outside our control, including the inability to develop, license or otherwise acquire product candidates or products and insufficient access to capital to fund such investments. We also cannot predict whether any products, once launched, will be commercially successful or will achieve revenue that is consistent with our expectations.
The animal health industry is subject to regional and local trends and regulations and, as a result, products that are successful in some markets may not achieve similar success when introduced into other markets. Furthermore, the timing and cost of our R&D may increase, and our R&D may become less predictable as, among other things, regulations applicable to our industry make it more time-consuming and/or costly to research, develop and register products. If we are unable to generate commercially successful new products or expand the use of our existing products, our business, financial condition and results of operations could be materially adversely affected.
Additionally, as part of our development strategy, we often hire clinical research organizations to perform preclinical testing and clinical trials for drug candidates. Clinical trials and procedures are inherently uncertain and there can be no assurance that these trials or procedures will be enrolled or completed in a timely or cost-effective manner or result in a commercially viable product or indication. Failure to achieve positive clinical trial and/or testing results could have a material adverse effect on our prospects. Furthermore, unfavorable or inconsistent clinical data from current or future clinical trials or procedures conducted by us, our competitors or third parties, or perceptions regarding this clinical data, could adversely affect our ability to obtain necessary approvals and the market’s view of our future prospects.
Lastly, new products may appear promising in development but fail to reach the market within the expected or optimal timeframe, or at all. We may be unable to predict with precision when, if or subject to what conditions any of
our products now under development will be approved and/or launched, or if approved, whether limitations to a product or the specific circumstances for which a product is approved, will match our expectations. For example, in the second quarter of 2024, the FDA determined that our Zenrelia product label would be required to include a boxed warning on safety. We believe the inclusion of this warning has slowed the product adoption curve, although the extent of any such effect cannot be definitely determined. In addition, product extensions or additional indications may not be approved. Developing and commercializing new products subjects us to inherent risks and uncertainties, including (i) delayed or denied regulatory approvals, (ii) delays or challenges with producing products in accordance with regulatory requirements, on a commercial scale and at a reasonable cost; (iii) failure to accurately predict the market for new products; and (iv) efficacy and safety concerns, any of which could lead to a slower or more limited commercial adoption of one of our products than initially estimated. In addition, a failure to continue to identify and develop products, both internally and through external sources, could impact our future success. Once necessary regulatory approvals are obtained, the commercial success of any new product depends upon, among other things, its acceptance by veterinarians and end customers, and on our ability to successfully manufacture, market and distribute products in sufficient quantities to meet demand. If we are unable to successfully bring a product to market, our business, financial condition and results of operations could be materially adversely affected.
Disruptive innovation and advances in veterinary medical practices, animal health technologies and alternatives to animal-derived protein could negatively affect the markets for our products.
The markets for our products are regularly impacted by the introduction and/or broad market acceptance of newly developed or alternative products that address the diseases and conditions for which we sell products. For example, the market for our pet health therapeutics has been particularly affected by innovation in new molecules and delivery formulations in recent years. Separately, there has been an increased focus in certain markets to seek replacements for animal-derived protein with alternative, plant-based or other natural or synthetic protein sources. Technological breakthroughs by others may render our products obsolete and reduce or eliminate the market for our products. Introduction or acceptance of competing animal health products and innovation or disruptive protein alternatives could materially adversely affect our business, financial condition and results of operations.
Generic products may be viewed as more cost-effective than our products.
In certain markets, we face competition from generic alternatives to our products. We depend on patents and related rights to enable our exclusive sale of certain products. Patents for individual products expire at different times based on a variety of factors, including the date of the patent filing (or sometimes the date of patent grant) and the legal term of patents in the jurisdictions where such patents are obtained. The extent of protection afforded by our patents varies from jurisdiction to jurisdiction and is limited by the scope of the claimed subject matter of our patents, the term of the patent and the availability and enforcement of legal remedies in the applicable jurisdiction. Some of our principal products, including certain products within our Advantage Family, Rumensin and Maxiban / Monteban do not have patent protection. Other products are protected by patents that expire over the next several years. As the patents for a brand name product expire, competitors may begin to introduce generic or other alternatives, and as a result, we may face competition from lower-priced alternatives to many of our products. For further information, see "Item 1. Business – Intellectual Property."
Generic competitors are becoming more aggressive in terms of launching products before patent rights expire, and, because of attractive pricing, sales of generic products are an increasing percentage of overall animal health sales in certain regions. If animal health customers increase their use of new or existing generic products, we may be forced to lower our prices and/or provide discounts or rebates in order to compete with generic products. In such event, our business, financial condition and results of operations could be materially adversely affected.
Regulatory restrictions and bans on the use of antibiotics and productivity products in farm animals, as well as changing market demand, may continue to negatively affect demand for certain of our farm animal products.
Our operational results have been, and may continue to be, affected by regulations and changing market demand. In certain markets, including the U.S., sales of certain of our farm animal products have been negatively affected by changes in consumer sentiment for proteins and dairy products produced without the use of antibiotics or other products intended to increase animal production. There are two classes of antibiotics used in animal health: shared-class, or medically important, antibiotics, which are used to treat, control and/or prevent infectious diseases caused by pathogens that occur in both humans and animals; and animal-only antibiotics, which are used to treat, control and/or prevent infectious diseases in animals, and in some instances, promote animal growth performance. Concerns that the use of antibiotics in farm animal production may lead to increased antibiotic resistance of human pathogens have resulted in regulation and changing market demand. For example, in 2022 the EU began restricting the use of preventative antibiotics to farm animals through feed. Similar bans and restrictions in other countries could result in a material adverse effect on our sales of antibiotic products.
In recent years, the percentage of our total revenue from sales of shared-class antibiotics has declined, driven primarily by changing regulations in many markets, as well as market demand and our tiered approach to antibiotic stewardship, which has included removing growth promotion from labels and requiring veterinary oversight in the U.S. and other markets. Globally, during 2024, our revenue from shared-class antibiotics decreased 8% in comparison to 2023 and represented 9% of total revenue, while our revenue from animal-only antibiotics increased 4% in comparison to 2023 and represented 15% of total revenue. In 2024, 89% of our revenue from animal-only antibiotics resulted from the sale of ionophores. Ionophores are a special class of animal-only antimicrobials, and because of their animal-only designation, mode of action and spectrum of activity, to date their use has not been materially impacted by regulations or changing market demand in many international markets.
The impact of changes in regulations and market preferences regarding the use of antibiotics and productivity products in farm animals could have a material adverse effect on our business, financial condition and results of operations. If there is an increased public perception that consumption of food derived from animals that utilize our products poses a risk to human health, there may be a further decline in the production of those food products and, in turn, demand for our products. In addition, antibiotic resistance concerns will likely result in additional restrictions or bans, expanded regulations or public pressure to further reduce the use of antibiotics in farm animals, increased demand for antibiotic-free protein or changes in the market acceptance or regulatory treatment of ionophores, any of which could materially adversely affect our business, financial condition and results of operations.
An outbreak of infectious disease carried by farm animals could negatively affect the demand for, and sale and production of, our farm animal products.
Sales of our farm animal products could be materially adversely affected by a general outbreak of infectious disease, or an outbreak of disease carried by farm animals, which could lead to the widespread death or precautionary destruction of farm animals as well as the reduced consumption and demand for animal-derived protein. In addition, outbreaks of disease carried by farm animals may reduce regional or global sales of particular animal-derived food products or result in reduced exports of such products, either due to heightened export restrictions or import prohibitions, which may reduce demand for our farm animal products due to reduced herd or flock sizes.
In recent years, outbreaks of various diseases, including African Swine Fever, avian influenza, foot-and-mouth disease, bovine spongiform encephalopathy (otherwise known as BSE or “mad cow” disease) and porcine epidemic diarrhea virus (otherwise known as PEDV) have negatively impacted sales of our animal health products. The discovery of additional cases of any of these, or other diseases, may result in additional restrictions on animal-derived protein, reduced herd or flock sizes or reduced demand for animal-derived protein, any of which may have a material adverse effect on our business, financial condition and results of operations. In addition, the outbreak of any highly contagious disease near our main production sites could require us to immediately halt production of our products at such sites or force us to incur substantial expenses in procuring raw materials or products elsewhere.
Our R&D relies on evaluations of animals, which may become subject to bans, additional restrictive regulations or increased attention from activism movements.
As an animal health company dedicated to innovating and delivering products and services to prevent and treat diseases in animals, we are required to evaluate the effect of our existing and new products in animals in order to register such products. Animal testing in certain industries has been the subject of controversy and adverse publicity. Some organizations and individuals have attempted to ban animal testing or encourage the adoption of new regulations applicable to animal testing. To the extent the activities of such organizations and individuals are successful, our R&D, and by extension our business, financial condition and results of operations, could be materially adversely affected. In addition, negative publicity about us or our industry could impact our R&D efforts, and/or cause reputational harm to those in our industry, including us. Any reputational harm to the farm animal industry may also extend to companies in related industries, including us, potentially resulting in a decrease in the use of our products.
Consolidation of our customers and distributors could negatively affect the pricing of our products.
We primarily sell our pet health products to third-party distributors and retailers, as well as directly to veterinarians. We primarily sell our farm animal products to third-party distributors and directly to a diverse set of farm animal producers, including beef, dairy, pork and poultry operations. In recent years, there has been a trend toward the concentration of veterinarians in large clinics and hospitals. We have also seen recent consolidation among farm animal producers, particularly swine and poultry producers, and among our distributors. Furthermore, we have seen the expansion of larger cross-border corporate customers and an increase in the consolidation of buying groups (cooperatives of veterinary practices that leverage volume to pursue discounts from manufacturers). If these trends toward consolidation continue, our customers could attempt to improve their profitability by leveraging their buying power to obtain favorable pricing. The resulting decrease in our prices could have a material adverse effect on our business, financial condition and results of operations.
For our pet health products, increased use of alternative distribution channels, or changes within existing distribution channels, could negatively impact our market share, margins and distribution of our products.
In most markets, pet owners have historically purchased their animal health products directly from veterinarians. However, pet owners increasingly have the option to purchase animal health products from sources other than veterinarians, such as online retailers, “big-box” retail stores, specialty pet shops via telemedicine distributors, or other distribution channels. This trend has been demonstrated by the significant shift away from the veterinarian distribution channel in the sale of flea and tick products and has been accelerated by the increased consumer preferences toward e-commerce in recent years. Pet owners also could decrease their reliance on, and visits to, veterinarians as they rely more on internet-based animal health information and telemedicine. Because we market our pet health prescription products primarily through the veterinarian distribution channel, in the event of a significant decrease in visits to veterinarians by pet owners, our market share for such products could be reduced, materially adversely affecting our business, financial condition and results of operations.
Legislation has been proposed in the U.S. Congress and may be proposed in the U.S. states or abroad in the future, that could impact the distribution channels for our pet health products. For example, such legislation may require veterinarians to provide pet owners with written prescriptions and disclosure that the pet owner may fill prescriptions through a third party, which may further reduce the number of pet owners who purchase their animal health products, or fill their prescriptions, directly from veterinarians. Legislation may also be advanced that would allow for greater access to pet health products via telemedicine channels, potentially impacting our mix of distribution. These changes could lead to increased use of generic alternatives to our products or the increased substitution of our pet health products with other animal health or human health products if such other products are deemed to be lower-cost alternatives. Many countries and states already have regulations requiring veterinarians to provide prescriptions to pet owners upon request.
Over time, these and other competitive conditions may further increase our use of online retailers, “big-box” retail stores, specialty pet shops, telemedicine or other distribution channels outside of the veterinary clinic to sell our pet health products. If we or our major retail customers are not successful in navigating the shifting consumer preferences to distribution channels such as e-commerce, our expected future revenues may be negatively impacted. We may also realize lower margins on sales through retail distribution channels than we do on sales through veterinarians. Any of these events could materially adversely affect our business, financial condition and results of operations. In addition, if one or more of our pet health distributors discontinues or modifies their relationship with us, our business, financial condition and results of operations may be materially adversely affected.
Strategic and Operational Risks
Our results of operations are dependent upon the success of our top products.
If any of our top products experience issues, such as disruptive innovations or the introduction of more effective competitive products, negative publicity, changes in veterinarian or customer preferences, loss of patent protection, material product liability litigation, new or unexpected side effects, manufacturing disruptions and/or regulatory proceedings, our revenue could be negatively impacted, perhaps significantly. Our top five products and/or product families, Advantage Family, Seresto, Rumensin, Maxiban / Monteban and Credelio Family represented approximately 36% of our total revenue in 2024, with our largest product family, Advantage Family, representing approximately 10% of total revenue. Any issues with these top products could have a material adverse effect on our business, financial condition and results of operations.
We may not be able to successfully complete favorable transactions or successfully integrate acquired businesses when we pursue acquisitions, divestitures, joint ventures or other significant transactions.
From time to time, we evaluate potential acquisitions, divestitures or joint ventures to further our strategic objectives. The completion of such transactions is often subject to conditions that may be outside our control, including obtaining the requisite approval of the shareholders of the target company and/or government antitrust/competition approvals. Accordingly, we may not be able to complete announced and signed transactions, and therefore, may not realize the anticipated benefits therefrom.
In the event of a material acquisition or divestiture, we may be required to devote significant management attention and resources to integrating the portfolio and operations of an acquired company or carving out a divested business. Potential difficulties we may encounter in the integration or carve out process include:
•the inability to realize the anticipated value from various assets of the acquired company;
•the potential for stranded costs, loss of scale and/or inefficiencies in a post-divestiture cost structure;
•the inability to combine the business of an acquired company with ours in a manner that permits us to achieve the cost savings or other synergies anticipated as a result of the transaction or to achieve such cost savings or other anticipated synergies in a timely manner, which could result in us not realizing some anticipated benefits of the transaction in the time frame anticipated, or at all;
•the loss of key employees;
•potential unknown liabilities and unforeseen increased expenses, delays or unfavorable conditions in connection with the closing of the transaction and the subsequent integration or carve out; and
•performance shortfalls at our or the acquired company as a result of the diversion of management’s attention from ongoing business activities.
For example, as a result of our acquisition of Bayer Animal Health, we integrated each business' distinct enterprise resource planning (ERP) systems into one primary platform, a process that was substantially completed in 2023. ERP integrations have inherent risks, which can complicate our business operations and potentially lead to breakdowns in data integrity and may preclude our ability to supply products for a period of time, as was the case with this aforementioned ERP integration in April 2023. To the extent future ERP or other integration or carve-out activities are required for future acquisitions, divestitures or joint ventures, we could be required to deploy significant resources and attention to these efforts. If we are unable to successfully integrate or carve-out our systems to support critical business operations of acquired or divested businesses or to produce information for business decision-making activities, we could experience a material adverse impact on our business, including increased costs, data integrity and/or cybersecurity risks and an inability to timely and accurately report our financial results.
Future acquisitions could also result in potentially dilutive issuances of equity securities, the incurrence of debt, contingent liabilities, increased amortization expenses related to acquired intangible assets and increased operating expenses, any of which could adversely affect our financial condition and results of operations. Furthermore, if we issue equity or debt securities to raise additional funds, our existing shareholders may experience significant dilution, and the new equity or debt securities may have rights, preferences and privileges senior to those of our existing shareholders. Furthermore, if we sell a substantial number of shares of common stock in the public markets, the availability of those shares for sale could adversely affect the market price of our common stock. Such sales, or the perception in the market that holders of a large number of shares intend to sell shares, could depress the market price of our common stock and impair our ability to raise capital through the sale of additional equity securities.
We may not be able to successfully implement future restructuring activities or other significant organizational changes.
We have, from time to time, restructured or made other adjustments to our workforce and manufacturing footprint. For example, in 2024 we implemented a restructuring plan to improve operational efficiencies and better align our organizational structure with current business needs, top strategic priorities and key growth opportunities (see Note 5. Asset Impairment, Restructuring and Other Special Charges to the consolidated financial statements for further information).
There are significant costs involved with the execution of restructuring programs or other significant organizational changes, including expenses related to severance, asset impairments and other potential charges. There are also significant risks involved with such changes, including the potential for significant business disruption, diversion of management's time and attention from ongoing operations, loss of human capital talent, temporarily reduced productivity and the risk of failing to achieve some or all of the anticipated benefits of the restructuring or organizational changes. We may need to implement additional restructuring plans or other strategic initiatives in the future in response to market or product changes, performance issues, changes in strategy, acquisitions and/or other internal or external considerations. If we are unable to successfully manage and implement any future restructuring plan, we may not achieve or sustain the expected growth or cost savings benefits of these activities, or do so within the expected timeframe, and in such instance, our financial condition and results of operations could be materially adversely impacted.
Manufacturing problems and capacity imbalances, including at our contract manufacturers, have caused, and may in the future cause, product launch delays, inventory shortages, recalls and/or unanticipated costs.
In order to sell our products, we must be able to produce and ship sufficient quantities to our customers. We own and operate 17 internal manufacturing sites across 10 countries and also employ a network of approximately 130 third-party CMOs. Many of our products involve complex manufacturing processes, are highly regulated and can be, or rely on, inputs that are sole sourced from certain manufacturing sites. Shifting or adding manufacturing capacity can be a lengthy process requiring significant capital expenditures, process modifications and regulatory approvals. Accordingly, unplanned plant shutdowns, manufacturing or quality assurance difficulties, failure or refusal of a supplier or CMO to supply contracted quantities or difficulties in predicting or variability in demand for our products have caused, and may in the future cause, interruption or higher costs in the supply of certain products, product shortages or pauses or discontinuations of product sales in one or more markets. Further, minor deviations in our manufacturing or logistical processes, such as temperature excursions or improper package sealing, could result, and have in the past resulted in, delays, inventory shortages, unanticipated costs, product recalls, product liability and/or regulatory action. In addition, a number of factors could cause production interruptions, including:
•the failure of us or any of our CMOs, vendors or suppliers, including logistical service providers, to comply with applicable regulations and quality assurance guidelines;
•mislabeling;
•construction delays;
•equipment malfunctions;
•shortages of materials;
•labor problems;
•delays in receiving required governmental authorizations or regulatory approvals;
•natural disasters and/or adverse weather conditions;
•power outages;
•criminal and terrorist activities;
•changes in manufacturing production sites and limits to manufacturing capacity due to regulatory requirements, changes in types of products produced, shipping distributions or physical limitations; and
•the outbreak of any highly contagious diseases.
These interruptions could result in launch delays, inventory shortages, recalls, unanticipated costs or issues with our agreements under which we supply third parties, which may materially adversely affect our business, financial condition and results of operations. Further, global transportation and logistics challenges, cost inflation and tight labor markets have caused, and in the future may cause, delays in and/or increased costs related to the distribution of our products, the construction or acquisition of manufacturing capacity, procurement activity and supplier or contract manufacturer arrangements.
For example, in September 2024 one of our contract manufacturing supply partners, TriRx Speke, entered into trading administration, a formal insolvency process in the U.K. In November 2024, in an effort to minimize supply disruption, we acquired this manufacturing site from TriRx Speke for approximately $36 million (see Note 4. Acquisitions, Divestitures and Other Arrangements to the consolidated financial statements for further information). In addition to this unanticipated capital outlay, we also expect increased integration and operational costs in 2025 related to operating this site.
In addition, volatility in the overall demand for animal health products in different markets and distribution channels has had, and may continue to have, a number of impacts on our business, including increased costs and disruptions in the supply of our products. Our manufacturing network may be unable to meet the demand for our products, or we may have excess capacity if demand for our products changes. For example, in 2023 we experienced increasing levels of inventory on-hand, in part due to volatility in demand across different markets and distribution channels. In addition to the negative impact on our cash flows, if we are not able to effectively manage the purchase and production of our inventories to match the timing of customer demand, we may face increased costs and the potential for our inventories to become unusable or obsolete.
We have also in the past invested in, and will continue to invest in, improvements to our existing manufacturing facilities and may also invest in new manufacturing plants in the future. For example, we have recently announced a planned $130 million expansion of our biologics manufacturing facility in Elwood, Kansas to enable further growth of our monoclonal antibody portfolio. These types of projects are subject to risks of delay or cost overruns inherent in any large construction project and require licensing by or approvals from various regulatory authorities. The unpredictability of a product’s regulatory or commercial success or failure, the lead time necessary to construct highly technical and complex manufacturing sites and shifting customer demand (including as a result of market conditions or entry of branded or generic competition) increase the potential for capacity imbalances. In addition, construction of sites is expensive, and our ability to recover costs will depend on the market acceptance and success of the products produced at the new sites, which is uncertain. Significant cost overruns or delays in completing these projects could have a material adverse effect on our financial condition and results of operations.
Increased or decreased inventory levels in our distribution channels can lead to fluctuations in our revenues and levels of inventory on-hand.
We sell many of our products to distributors and retailers who, in turn, sell these products to third parties. Inventory levels at our distributors and retailers increase or decrease as a result of various factors, including end customer demand, new customer contracts, heightened competition, required minimum inventory levels, our ability to renew distribution contracts with expected terms, our ability to implement commercial strategies, regulatory restrictions, unexpected customer behavior, proactive measures taken by us in response to shifting market dynamics and procedures and environmental factors beyond our control. These increases and decreases can lead, and have led, to variations in our quarterly and annual revenues. Failure to appropriately anticipate inventory levels in our distribution channels could materially adversely affect our financial condition and results of operations.
We use machine learning and artificial intelligence (AI) in our business, and challenges with properly managing its use could result in operational, competitive or reputational harm and legal liability.
We use AI in multiple ways in our business and continue to expand the use of AI in our operations. Machine learning and AI are new and rapidly evolving technologies, and their use presents a number of operational, compliance and reputational risks. AI algorithms are currently known to sometimes produce unexpected results or behave in unpredictable ways that can generate irrelevant, nonsensical, deficient, factually inaccurate or biased content and results. Accordingly, AI presents emerging operational, legal and ethical issues. If our use of AI becomes controversial, we may experience reputational harm to our brand, competitive harm or legal liability. At the same time, our competitors may incorporate AI into their operations more quickly than we do or with more successful outcomes, which would also harm our business. We also expect there will be new laws or regulations concerning the use of AI technology, which might be burdensome to comply with and may limit our ability to use this technology. We might not be able to attract and retain the talent necessary to support our AI technology initiatives and maintain our systems. Any disruption or failure in our AI systems or those of third parties on whom we rely could result in delays and operational challenges, and the various operational, compliance and reputational issues could materially adversely affect our business, financial condition and results of operations.
We depend on sophisticated information technology (IT) and infrastructure.
We are continuing to enhance a number of our business processes, including our financial reporting and supply chain processes and from whom we obtain IT systems. We have made, and will continue to make, significant configuration, process and data changes within many of the IT systems we use. If our IT systems and processes are not sufficient to support our business and financial reporting functions, or if we fail to properly implement our new business processes, our financial reporting may be delayed or inaccurate and, as a result, our business, financial condition and results of operations may be materially adversely affected. Even if we are able to successfully configure and change our systems, all technology systems, even with implementation of security measures, are vulnerable to disability, failures and cybersecurity risks, including unauthorized access. If our IT systems or our service providers' IT systems were to fail or be breached, this could materially adversely affect our reputation and our ability to perform critical business functions, and sensitive and confidential data could be compromised.
Our business may be negatively affected by weather conditions and the availability of natural resources.
The animal health industry and demand for many of our products in a particular region are affected by weather conditions, including those related to climate change, varying weather patterns and weather-related pressures from pests, such as ticks. As a result, we may experience regional and seasonal fluctuations in our results of operations. For example, in 2024 approximately 70% and 55% of the total revenue for our higher-margin parasiticide products Seresto and Advantage Family, respectively, was generated in the first half of the year, reflective of the flea and tick season in the Northern Hemisphere. As such, fluctuations in our revenue due to seasonality and/or weather or climate-related factors, many of which are beyond our control, may mean period-to-period comparisons of our results of operations will not necessarily be meaningful.
Farm animal producers depend on the availability of natural resources, including large supplies of fresh water. Their animals’ health and their ability to operate could be adversely affected if they experience a shortage of fresh water due to human population growth or floods, droughts or other weather conditions. In the event of adverse weather conditions or a shortage of fresh water, veterinarians or farm animal producers may purchase less of our products. Further, heat waves may cause stress in animals and lead to increased vulnerability to disease, reduced fertility rates and reduced milk production. Droughts may threaten pasture and feed supplies by reducing the quality and amount of forage available to grazing livestock, while climate change may increase the prevalence of parasites and diseases that affect farm animals.
In addition, veterinary hospitals and practitioners depend on visits from, and access to, the animals under their care. Veterinarians’ patient volume and ability to operate could be adversely affected if they experience prolonged snow, ice or other severe weather conditions, particularly in regions not accustomed to sustained inclement weather.
We could experience demand, supply and operational challenges associated with the effects of a human disease outbreak, epidemic, pandemic or other widespread public health concern.
Our business has been, and could in the future be, negatively impacted by human disease outbreaks, epidemics, pandemics or other widespread public health concerns. These impacts may include:
•Reductions in demand or significant volatility in demand for one or more of our products, caused by, among other things: the temporary inability of our customers to purchase our products due to illness, quarantine, travel restrictions and/or financial hardship; decreased veterinary visits; farm animal processing plant shutdowns; shifts in demand by trading down to lower priced products; or stockpiling activity;
•Inability to meet customer needs and achieve cost targets due to disruptions in our manufacturing and supply chains caused by labor constraints or an inability to obtain key raw materials, increased transportation costs or other manufacturing and distribution disruptions;
•Failure of third parties on which we rely, including our suppliers, CMOs, distributors, contractors and other external business partners, to meet their obligations, which may be caused by their own financial or operational challenges;
•Limited ability to access the global financial market, which could negatively impact our short-term and long-term liquidity; or
•Significant changes in the political environments in the markets in which we manufacture, sell or distribute our products, including lockdowns, import/export restrictions or other governmental mandates that limit or close operating and manufacturing facilities, restrict travel to perform necessary business functions or otherwise prevent us or our third-party partners, suppliers or customers from sufficiently staffing operations, including operations necessary for the production, distribution and sale of our products.
Despite our efforts to manage and limit these impacts, they will likely ultimately be dependent on factors beyond our control, including the duration and severity of any such outbreak, as well as third-party actions taken to contain its spread and mitigate its effects.
A loss of key personnel or highly skilled employees could disrupt our operations.
Our future success depends partly on the continued service of our highly qualified and well-trained key research, engineering, sales, marketing, manufacturing, executive and administrative personnel. We face intense competition for these qualified personnel from our competitors and others, particularly for certain highly technical specialties in geographic areas where we recruit. Due to this intense competition, we may be unable to continue to attract and retain qualified personnel necessary for the development of our business, or to recruit or identify suitable replacement personnel. If we are unsuccessful in our recruitment and retention efforts, our business may be harmed. In addition, if we fail to effectively manage organizational and/or strategic changes, our financial condition, results of operations and reputation, as well as our ability to successfully attract, motivate and retain key employees, could be harmed.
Our business could be materially adversely affected by labor disputes, strikes or work stoppages.
Some of our employees are members of unions, works councils, trade associations or are otherwise subject to collective bargaining agreements. As a result, we are subject to the risk of labor disputes, strikes, work stoppages and other labor-relations matters in certain jurisdictions. We may be unable to negotiate new collective bargaining agreements on similar or more favorable terms, and we may experience work stoppages, higher ongoing labor costs or other labor problems in the future at our sites. We may also experience difficulty or delays in implementing changes to our workforce in certain markets. Further, labor-related issues, including at our suppliers or CMOs, could cause a disruption of our operations, potentially resulting in cancelled orders by customers or unanticipated inventory accumulation or shortages, which could have a material adverse effect on our business, financial condition and results of operations.
Economic, Market and Financial Risks
We have substantial indebtedness.
We had approximately $4.3 billion of outstanding indebtedness at December 31, 2024. A significant amount of our cash flows from operations is dedicated to servicing this indebtedness and will not be available for other purposes, including our operating, investing or financing needs. Our ability to make scheduled payments or to refinance our debt obligations depends on our financial condition and operating performance, which are subject to prevailing economic and competitive conditions, and to certain financial, business, legislative, regulatory or other factors beyond our control. If our cash flows and capital resources are insufficient to fund our debt service obligations, or we are unable to access capital markets for additional financing on terms acceptable to us, we may be forced to reduce or delay investments and capital expenditures, sell assets, seek additional debt or equity financing or seek to restructure or refinance our indebtedness. These alternative measures may not be successful and may not permit us to meet our scheduled debt service obligations. In such event, we may not be able to execute any such measures on commercially reasonable terms or at all and, even if successful, could still face substantial liquidity problems and might be required to sell material assets or operations to attempt to meet our debt service and other obligations. Further, our debt instruments may restrict our ability to dispose of assets, the use of proceeds from those dispositions and/or our ability to raise debt or equity financing to be used to repay other indebtedness when it becomes due. We may not be able to consummate those dispositions or to obtain proceeds in an amount sufficient to meet any debt service obligations when due.
In addition, repayment of our indebtedness will depend on the generation of cash flow by our subsidiaries, including certain international subsidiaries, and their ability to make such cash available to us, by dividend, debt repayment or otherwise. Our subsidiaries may not be able to, or may not be permitted to, make adequate distributions to enable us to make required debt repayments. Each subsidiary is a distinct legal entity and, under certain circumstances, legal, tax and contractual restrictions may limit our ability to obtain cash from them. In the event we are not able to
receive distributions from our subsidiaries, we may be unable to make required principal and interest payments on our indebtedness.
Our high level of indebtedness could have other important consequences, including:
•limiting our ability to obtain additional financing to fund future working capital, capital expenditures, business development or other general corporate requirements;
•increasing our vulnerability to general adverse economic and industry conditions;
•making us more highly leveraged than some of our competitors, which may place us at a competitive disadvantage;
•restricting us from making strategic acquisitions, engaging in development activities or exploiting business opportunities; and
•limiting our flexibility in planning for and reacting to changes in the animal health industry.
Our debt agreements contain restrictions that will limit our flexibility in operating our business.
Our credit facilities contain, and any other existing or future indebtedness of ours would likely contain, a number of covenants that impose significant operating and financial restrictions on us, including restrictions on our ability to, among other things:
•incur additional debt, guarantee indebtedness or issue certain preferred shares;
•prepay, redeem or repurchase certain debt;
•pay dividends on or make distributions in respect of, or repurchase or redeem, our capital stock or make other restricted payments;
•make loans or certain investments;
•sell certain assets;
•create liens on certain assets;
•consolidate, merge, sell or otherwise dispose of all or substantially all of our assets;
•enter into certain transactions with our affiliates; and
•substantially alter the businesses we conduct.
In addition, certain of our credit facilities require us to comply with a net total leverage ratio and a minimum fixed charge coverage ratio under certain circumstances (see Note 8. Debt to the consolidated financial statements for further discussion and descriptions of debt covenants). As a result of these covenants, we are limited in the manner in which we conduct our business, and we may be unable to engage in favorable business activities or finance future operations or capital needs. A failure to comply with the covenants under the indenture that governs the senior unsecured notes and credit facilities, or any of our other existing or future indebtedness could result in an event of default, which, if not cured or waived, could have a material adverse effect on our business, financial condition and results of operations. In an event of default under our credit facilities, it is expected that the lenders:
•will not be required to lend any additional amounts to us;
•could elect to declare all borrowings outstanding, together with accrued and unpaid interest and fees, to be due and payable and terminate all commitments to extend further credit;
•could require us to apply all of our available cash to repay these borrowings; or
•could effectively prevent us from making debt service payments on our senior unsecured notes (due to a cash sweep feature).
Such actions by the lenders could cause cross defaults under our other indebtedness, including our senior unsecured notes. If we were unable to cure any covenant noncompliance, the lenders under our credit facilities and any of our other existing or future secured indebtedness could proceed against the collateral granted to them to secure our credit facilities or such other indebtedness. We have pledged a significant portion of our assets as collateral under our credit facilities.
Changes in our credit ratings could increase our interest expense and restrict our access to, and negatively impact the terms of, current or future financings or trade credit.
Credit rating agencies continually revise their ratings for the companies they follow, including us. Credit rating agencies also evaluate our industry as a whole and may change their credit ratings for us based on their overall view of our industry. We cannot be sure that credit rating agencies will maintain their ratings for us or for certain of our debt. The substantial indebtedness we incurred related to our acquisition of Bayer Animal Health had a negative impact on our credit ratings, leading to higher borrowing expenses. Additionally, S&P, Moody's and Fitch downgraded our credit ratings in 2023. Because the ratings of certain of our senior unsecured notes have been downgraded, we have been required to pay additional interest under these senior unsecured notes. Any further
downgrades could result in requirements to pay additional interest under the 4.900% Senior Notes due 2028. Moreover, any decision to downgrade our ratings could restrict our access to, and negatively impact the terms of, current or future financings and trade credit extended by our suppliers of raw materials or other vendors.
Changes in interest rates may adversely affect our earnings and/or cash flows.
Certain of our credit facilities bear variable interest at the Term SOFR reference rate. Term SOFR measures the cost of borrowing cash overnight, collateralized by U.S. Treasury securities, and is based on directly observable U.S. Treasury-backed repurchase transactions. Our variable-rate indebtedness is exposed to the risk of rising interest rates. Additionally, the increased interest rate environment, particularly for long-term treasury rates, played a critical role in the goodwill impairment charge we recorded in 2023. Increases in Term SOFR or other benchmark rates, including long-term treasury rates, would expose us to additional interest rate risk, additional expense and the potential for additional future impairments. We are also exposed to the risk of rising interest rates to the extent we fund our operations with short-term or variable-rate borrowings. See Part II, Item 7A. Quantitative and Qualitative Disclosures About Market Risk for further discussion around our exposure to changes in interest rates.
We may be required to write down goodwill or identifiable intangible assets.
At December 31, 2024, the net carrying value of goodwill and other indefinite-lived intangible assets on our consolidated balance sheet was $4,414 million and $291 million, respectively. Other indefinite-lived intangible assets primarily consist of in-process R&D (IPR&D) projects acquired as a part of past business combinations. Under accounting principles generally accepted in the United States (GAAP), we are required to annually assess our goodwill and other indefinite-lived assets for impairment, and more frequently whenever events or changes in circumstances indicate an impairment may have occurred. Determining whether an impairment exists or may have occurred, and the amount of the potential impairment, involves qualitative criteria and quantitative data based on management’s estimates and assumptions, which require significant judgment and could change given a change in circumstances, future events or as new information becomes available.
Due principally to the sharp increase in long-term treasury rates in 2023, which led to an increased discount rate assumption relative to prior assessments, we recorded a $1,042 million pre-tax impairment charge. Future changes in our discount rate assumption, whether driven by increases in long-term treasury rates or other factors, or future changes in other significant assumptions or the use of alternative estimates and assumptions, could expose us to further goodwill impairment losses. Any impairment of goodwill or other indefinite-lived intangible assets could have a material adverse effect on our results of operations in the period(s) when recognized.
We rely on third parties to provide us with products and materials and are subject to increased material costs and potential disruptions in supply.
Feed, fuel, transportation and other key costs for farm animal producers may continue to increase, or animal-derived protein prices or sales may decrease. Either of these trends could cause deterioration in the financial condition of our farm animal product customers, potentially inhibiting their ability to purchase our products or pay us for products delivered. Our farm animal product customers may offset rising costs by reducing spending on our products, including by switching to lower-cost alternatives. In addition, concerns about the financial resources of pet owners could cause veterinarians to alter their treatment recommendations in favor of lower-cost alternatives to our products, which could result in a decrease in sales of our pet health products, especially in countries with higher rates of pet ownership. Rising costs or reduced income for our customers could have a material adverse effect on our business, financial condition and results of operations.
We also rely on third parties to source many of our raw materials and to manufacture products that we distribute. Principal materials used in our manufacturing operations for key brands are typically available from more than one source; however, in certain instances we obtain raw or intermediate materials from a single source. We generally seek to develop an appropriate inventory strategy to fill market demand until an alternative source of supply can be implemented, in the event a supplier becomes unable to provide the required materials or product. However, various developments have led, and may in the future lead, to interruption or shortages in supply (for example, the financial difficulties experienced in 2024 by our contract manufacturing supply partner, TriRx Speke. See "Item 1. Business – Manufacturing and Supply Chain" for further information) until we establish new sources, implement alternative processes, bring new manufacturing facilities online or pause or discontinue product sales in one or more markets. Additionally, we have and may continue to experience cost increases for certain raw materials or other components required to manufacture our products due to increased shipping costs and other inflationary pressures. This may have a material adverse impact on our financial results if we cannot pass on such increases to our customers. Further, the unavailability or delivery delays of raw materials has affected and could continue to affect our ability to ship the related products timely, more severely impacting high-volume or high-margin products.
Our operations are subject to the economic, political, legal and business environments of the countries in which we do business.
Our operations could be limited or disrupted by any of the following:
•volatility in financial markets;
•compliance with governmental controls and sanctions;
•difficulties enforcing contractual and intellectual property rights given variability in the laws of individual countries and their respective practices with respect to enforcement of contractual and intellectual property rights;
•parallel trade in our products (importation of our products from EU countries where our products are sold at lower prices into EU countries where the products are sold at higher prices);
•compliance with a wide variety of laws and regulations, such as the U.S. Foreign Corrupt Practices Act (the FCPA) and similar non-U.S. laws and regulations;
•compliance with labor laws;
•compliance with local, regional and global restrictions on banking and commercial activities in emerging markets;
•burdens to comply with multiple and potentially conflicting foreign laws and regulations, including those relating to EHS requirements and those in emerging markets;
•changes in laws, regulations, government controls or enforcement practices with respect to our business and the businesses of our customers, including the imposition of limits on our profitability;
•political and social instability, including crime, civil disturbance, terrorist activities and armed conflicts and the related government and other entity responses;
•trade restrictions and restrictions on direct investments by foreign entities, including restrictions administered by the Office of Foreign Assets Control of the U.S. Department of the Treasury and the EU, in relation to our products or the products of farmers and other customers;
•government limitations on foreign ownership;
•government takeover or nationalization of business;
•changes in tax laws and tariffs;
•imposition of anti-dumping and countervailing duties or other trade-related sanctions;
•costs and difficulties and compliance risks in staffing, managing and monitoring international operations, including in the use of overseas third-party goods and service providers;
•corruption risk inherent in business arrangements and regulatory contacts with foreign government entities;
•longer payment cycles in certain foreign countries and increased exposure to counterparty risk; and
•additional limitations on transferring personal information between countries or other restrictions on the processing of personal information.
In addition, international transactions may involve increased financial and legal risks due to differing legal systems and customs, as well as restrictions and sanctions that may be imposed on one or more jurisdiction. Compliance with these requirements may prohibit the import or export of certain products and technologies or may require us to obtain a license before importing or exporting certain products or technologies. A failure to comply with any of these laws, regulations or requirements could result in civil or criminal legal proceedings, monetary or non-monetary penalties, or both, disruptions to our business, limitations on our ability to import and export products and damage to our reputation. In addition, variations in the pricing of our products between jurisdictions may result in the unauthorized importation or unauthorized re-importation of our products between jurisdictions and may also result in the imposition of anti-dumping and countervailing duties or other trade-related sanctions. While the impact of these factors is difficult to predict, any of them could materially adversely affect our business, financial condition and results of operations. Further, changes in any of these laws, regulations or requirements, or the political environment in a particular country, may affect our ability to engage in business transactions in certain markets, including investment, procurement and repatriation of earnings.
Our results of operations may be adversely affected by foreign currency exchange rate fluctuations.
We operate on a global basis and are exposed to the risk that our earnings, cash flows and equity could be adversely impacted by fluctuations in foreign exchange rates. Because our results are reported in U.S. dollars, we are exposed to foreign currency exchange risk, as the functional currency financial statements of non-U.S. subsidiaries are translated to U.S. dollars for reporting purposes. We are primarily exposed to foreign exchange risk with respect to net assets denominated in the Euro, British pound, Swiss franc, Brazilian real, Australian dollar, Japanese yen, Canadian dollar and Chinese yuan. To the extent revenue and expense transactions are not
denominated in the functional currency, we are also subject to the risk of transaction losses. Given the volatility of exchange rates and despite the mitigating impact of foreign currency forward or option derivative contracts we enter into to reduce the effect of fluctuating currency exchange rates, there is no guarantee we will be able to effectively manage currency transaction and/or translation risks, which could adversely affect our results of operations. See Part II, Item 7A. Quantitative and Qualitative Disclosures About Market Risk for further discussion around our exposure to potential changes in foreign currency exchange rates.
We have underfunded pension plan liabilities. We will require current and future operating cash flows to fund these shortfalls, reducing the cash available for other uses.
We have certain defined benefit pension plans, predominantly in Germany and Switzerland (see Note 17. Retirement Benefits to the consolidated financial statements for additional discussion around our defined benefit plans). The funded status and net periodic pension cost for these plans can be materially affected by the discount rate used to measure pension obligations, the longevity and actuarial profile of our workforce, the level of plan assets available to fund those obligations and the actual and expected long-term rate of return on plan assets. Significant changes in investment performance or a change in the portfolio mix of invested assets can result in corresponding increases and decreases in the valuation of plan assets or in a change in the expected rate of return on plan assets. As of December 31, 2024, for pension plans with projected benefit obligations in excess of plan assets, the projected benefit obligation was $334 million with plan assets of $165 million. Any changes in the discount rate could result in a significant increase or decrease in the valuation of pension obligations, affecting the reported funded status of our pension plans as well as the net periodic pension cost in the following years. Similarly, changes in the expected or actual return on plan assets can result in significant changes in the net periodic pension cost in the following years. In the event we need to make additional cash contributions to these plans, this will divert resources from our operations and may have a material adverse effect on our business, financial condition and results of operations.
We do not anticipate paying dividends on our common stock in the foreseeable future.
We do not anticipate paying any dividends in the foreseeable future on our common stock. We intend to retain all future earnings for the operation and expansion of our business and the repayment of outstanding debt. Certain of our credit facilities contain restrictive covenants that impose significant operating and financial restrictions on us, including restrictions on our ability to pay dividends or to make other restricted payments. As a result, capital appreciation, if any, of our common stock may be our shareholders' major source of gain for the foreseeable future. While we may change this policy at some point in the future, we cannot assure you we will make such a change.
We could be negatively impacted by being a target of shareholder activism, causing us to incur significant expense and hinder or disrupt the execution of our business strategy.
While we value constructive input from our investors and regularly engage in dialogue with our shareholders regarding our business strategy and performance, shareholder activism, which takes many forms and arises in a variety of situations, has been increasingly prevalent among publicly traded companies. For example, in 2024 we entered into a cooperation agreement with an investor, pursuant to which we expanded our board of directors by two seats, added two directors originally nominated by the investor and agreed to certain other governance matters. If we become the subject of new or additional forms of shareholder activism, such as proxy contests or hostile bids, the attention of our management and our Board of Directors may be diverted from executing our strategy. Such shareholder activism could give rise to perceived uncertainties as to our future strategy, adversely affect our relationships with business partners and make it more difficult to attract and retain qualified personnel. Responding to unwanted stockholder activism has resulted in and could in the future result in substantial costs, including significant legal fees and other expenses. Our stock price could be subject to significant fluctuation or otherwise be adversely affected by the events, risks and uncertainties of any shareholder activism.
We may incur additional tax expense or become subject to additional tax exposure.
We are subject to income taxes in the U.S. and numerous other jurisdictions. Future results of operations could be adversely affected by changes in our effective tax rate as a result of a change in the mix of earnings between U.S. and non-U.S. jurisdictions or among jurisdictions with differing statutory tax rates, changes in our overall profitability, changes in tax laws or treaties or in their application or interpretation, changes in tax rates, changes in GAAP, changes in the valuation of deferred tax assets and liabilities, the results of audits and examinations of previously filed tax returns and continuing assessments of our tax exposures. In connection with the Base Erosion and Profit Shifting (BEPS) Integrated Framework provided by the Organization for Economic Cooperation and Development (OECD), the OECD introduced a framework to implement a global minimum corporate tax of 15%, referred to as Pillar Two or the minimum tax directive. Many aspects of the minimum tax directive went into effect in 2024, with certain remaining impacts to become effective in 2025. While it is uncertain whether the U.S. will enact legislation to adopt the minimum tax directive, certain countries in which we operate have adopted legislation, and other countries are in the process of introducing legislation to implement the minimum tax directive. Our analysis is ongoing as the OECD continues to release additional guidance and countries implement legislation. While the adoption of Pillar
Two did not have a material impact to income taxes in 2024, to the extent additional changes take place in the countries in which we operate, it is possible these legislative changes may have an adverse impact on our effective tax rates and the amount of income tax we are required to pay.
We are also subject to the examination of our tax returns and other tax matters by the Internal Revenue Service and other tax authorities and governmental bodies. We regularly assess the likelihood of an adverse outcome resulting from these examinations to determine the adequacy of our provision for taxes. There can be no assurance as to the outcome of these examinations. If our effective tax rates were to increase, particularly in the U.S. or other material foreign jurisdictions, or if the ultimate determination of taxes owed is greater than amounts previously accrued, our operating results, cash flows and financial condition could be adversely affected.
Legal and Regulatory Compliance Risks
Our business is subject to substantial regulation.
As a global company, we are subject to various state, federal and international laws and regulations, including regulations relating to the development, quality assurance, manufacturing, importation, distribution, marketing and sale of our products. In addition, our manufacturing facilities, including the manufacturing facilities operated by our CMOs, are subject to periodic inspections by regulatory agencies. An inspection may report conditions or practices that indicate possible violations of regulatory requirements. Our failure, or the failure of third parties we rely on, including CMOs, to comply with applicable regulatory requirements, allegations of such non-compliance or the discovery of previously unknown problems with a product or manufacturer could result in, among other things, inspection observation notices, warning letters or similar regulatory correspondence, fines, a partial or total shutdown of production in one or more of our facilities while an alleged violation is remediated, withdrawals or suspensions of current products from the market and civil or criminal prosecution, as well as decreased sales as a result of negative publicity and product liability claims. Any one of these consequences could materially adversely affect our business, financial condition and results of operations.
In addition, we will not be able to market new products unless and until we have obtained all required regulatory approvals or equivalent notices in each jurisdiction where we plan to market those products. Even after a product reaches market, we may be subject to re-review and may lose our approvals. For example, pending claims have been asserted in a lawsuit against the FDA's approval of Experior, a product launched in 2021. Our failure to obtain approvals, delays in the approval process or our failure to maintain approvals in any jurisdiction, may prevent us from selling products in that jurisdiction until approval or re-approval is obtained, if ever.
In the EU, the Veterinary Medicinal Products Regulation updated the rules related to the authorization and use of veterinary medicines effective January 28, 2022. The updated rules limit the use of antibiotics, tighten importation rules and impose stricter pharmacovigilance standards. This regulation must still be implemented at the member state level and as such, additional requirements may be adopted by individual member states, which would have the effect of increasing the compliance requirements for our business in the EU, with resulting costs.
If the acceptance and/or adoption of our farm animal sustainability initiatives do not continue, our future results may be materially impacted.
We have made significant progress in recent years in gaining acceptance of farm animal sustainability products. However, the degree of acceptance for these products is uncertain, and one or more markets may resist the adoption of new products for the sole purpose of sustainability or in the absence of government subsidies incentivizing such adoption. As a result, there can be no assurance we will be able to expand the use of our sustainability products in these or other markets.
Increased regulation or decreased governmental financial support relating to the raising, processing or consumption of farm animals could reduce demand for our farm animal products.
Companies in the farm animal sector are subject to extensive and increasingly stringent regulations. If farm animal producers are adversely affected by new regulations or changes to existing regulations, they may reduce herd or flock sizes or become less profitable and, as a result, they may reduce their use of our products, which may materially adversely affect our business, financial condition and results of operations. Also, many farm animal producers benefit from governmental subsidies, and if such subsidies were to be reduced or eliminated, these companies may become less profitable and, as a result, may reduce their use of our farm animal products. More stringent regulation of the farm animal sector, including regarding the use of farm animal products, could have a material adverse effect on our business, financial condition and results of operations.
Tariffs, trade protection measures or other modifications of foreign trade policy may harm us or our customers.
Meaningful changes in laws, tariffs, agreements and policies governing international trade in the territories and countries where we and our customers do business could negatively impact us and our customers’ businesses and adversely affect our results of operations. Significant trade disruptions, or the establishment or increase of tariffs, trade protection measures or restrictions and/or any retaliatory actions from foreign governments, could result in lost
sales and increased costs. Given the international nature of our supply chain, in certain instances we, our customers or other key business partners depend on suppliers and service providers based in China, Canada, Mexico and other foreign jurisdictions. Tariffs, trade protection measures, import or export regulations or other restrictions imposed or maintained on our current or future products, customers or other key business partners by the United States, China, Canada, Mexico or other countries could have a material adverse effect on our business, financial condition and results of operations.
Additionally, a number of our customers, including customers of our farm animal products, rely on zero or minimal duty benefits provided by trade agreements, such as the U.S.-Mexico-Canada Agreement or most favored nation (MFN) level duties for trans-Atlantic and trans-Pacific trade. However, there is increasing concern that existing trade partnerships, unilateral duties, retaliation and treaties may be modified, which could result in new or increased tariffs or non-tariff barriers to commerce. Additionally, countries are becoming increasingly protectionist in an effort to protect local industries, to advance other policy objectives or to ensure domestic supply chain continuity for key products, such as medicines and nutritional feed additives. Finally, as global security challenges increase, more countries may use sanctions and export controls as a method to deal with such insecurity, which could result in decreased markets for our products or make it more costly to supply our customers.
We may incur substantial costs and receive adverse outcomes in litigation, regulatory investigations and other legal matters.
Litigation matters and regulatory investigations, regardless of their merits or ultimate outcomes, are costly, divert management’s attention and may materially adversely affect our reputation and the sale of and demand for our products. We cannot predict with certainty the eventual outcome of pending or future legal matters. An adverse outcome of litigation or legal matters could result in us being responsible for significant damages. Our business, financial condition and results of operations could be materially adversely affected by unfavorable results in pending or future litigation, regulatory investigations and other legal matters including the cost of their defense. These matters may include, among other things, allegations of violation of U.S. and/or foreign competition laws, labor laws, securities laws and regulations, consumer protection laws and environmental laws and regulations, as well as claims or litigation relating to product liability, intellectual property, securities, breach of contract, tort and tax liabilities. For example, shareholder class action lawsuits filed against us in 2020 allege, in part, that we and certain of our executives made materially false and/or misleading statements and/or failed to disclose certain facts about our supply chain, inventory, revenue, projections and our relationships with third party distributors and revenue attributable to those distributors. A new putative securities class action was also filed against us in 2024, along with a related shareholder derivative securities claim, alleging material misstatements or omissions concerning the safety and labeling of Zenrelia and the approval and launch timelines for Zenrelia and Credelio Quattro along with the breach of fiduciary duties regarding those allegations, respectively. We are vigorously defending against the claims made in these and other lawsuits; however, the ultimate resolution cannot be predicted, and the claims raised in these lawsuits may result in further legal matters or actions against us, including, but not limited to, government enforcement actions or additional private litigation.
In addition, changes in the interpretations of laws and regulations to which we are subject, or in legal standards in one or more of the jurisdictions in which we operate, could increase our exposure to liability. For example, in the U.S., attempts have been made to allow damages for emotional distress and pain and suffering in connection with the loss of, or injury to, a pet. If such attempts were successful, our exposure with respect to product liability claims could increase materially.
The actual or purported intellectual property rights of third parties may negatively affect our business.
A third party may sue us, or our distributors or licensors, or otherwise make a claim alleging infringement or other violation of such third-party’s patents, trademarks, trade dress, copyrights, trade secrets, domain names or other intellectual property rights. If our distributors, licensors or we do not prevail in this type of litigation, we may be required to:
•pay monetary damages;
•obtain a license in order to continue manufacturing or marketing the affected products, which may not be available on commercially reasonable terms, or at all; and/or
•stop activities, including any commercial activities, relating to the affected products, which could include a recall of the affected products and/or a cessation of sales in the future.
The costs of defending an intellectual property claim could be substantial and could materially adversely affect our business, financial condition and results of operations, even if we successfully defend against such claim. Moreover, even if we believe that we do not infringe a validly existing third-party patent, we may choose to license such patent, which would result in associated costs and obligations. We may also incur costs in connection with an obligation to indemnify a distributor, licensor or other third party.
The intellectual property positions of animal health businesses frequently involve complex legal and factual questions, and an issued patent does not guarantee us the right to practice the patented technology or develop, manufacture or commercialize the patented product. For example, while we generally enter into proprietary information agreements with our employees and third parties, which assign intellectual property rights to us, these agreements may not be honored or may not effectively assign intellectual property rights to us under the local laws of some countries or jurisdictions. We cannot be certain that a competitor or other third party does not have, or will not obtain rights to, intellectual property that may prevent us from manufacturing, developing or marketing certain products, regardless of whether we believe such intellectual property rights are valid and enforceable or we believe we would otherwise be able to develop a more commercially successful product, which may materially adversely affect our business, financial condition and results of operations.
If our intellectual property rights are challenged or circumvented, competitors may be able to take advantage of our R&D efforts or harm the value of our brands.
Our long-term success depends on our ability to market innovative and competitive products. We rely and expect to continue to rely on a combination of intellectual property, including patent, trademark, trade dress, copyright, trade secret and domain name protection, as well as confidentiality and license agreements with our employees and others, to protect our intellectual property and proprietary rights. If we fail to obtain and maintain adequate intellectual property protection, we may not be able to prevent third parties from using our proprietary technologies or from marketing products that are very similar or identical to ours.
Our currently pending or future patent applications may not result in issued patents, or may not be approved on a timely basis, if at all. Similarly, any term extensions we seek may not be approved on a timely basis, if at all. In addition, our issued patents, or any patents that may be issued in the future, may not contain claims sufficiently broad to protect us against third parties with similar technologies or products or provide us with any competitive advantage, including exclusivity in a particular product area.
The validity and scope of our patent claims also may vary between countries, as individual countries have their own patent laws. For example, some countries only permit the issuance of patents covering a novel chemical compound itself, and its first use, and thus further methods of use for the same compound may not be patentable. The validity, enforceability, scope and effective term of patents can be highly uncertain and often involve complex legal and factual questions and proceedings that vary based on the local law of the relevant jurisdiction. Our ability to enforce our patents also depends on the laws of individual countries and each country’s practice with respect to enforcement of intellectual property rights. Patent protection must be obtained on a jurisdiction-by-jurisdiction basis, and we only pursue patent protection in countries where we think it makes commercial sense for the given product. In addition, if we are unable to maintain our existing license agreements or other agreements pursuant to which third parties grant us rights to intellectual property, including because such agreements terminate, our business, financial condition and results of operations could be materially adversely affected.
Patent law reform in the U.S. and other countries may also weaken our ability to enforce our patent rights or make such enforcement financially unattractive. Such reforms could result in increased costs to protect our intellectual property or limit our ability to obtain and maintain patent protection for our products in these jurisdictions. Additionally, patent reforms may include compulsory licensing that may be granted by governments in the case of national emergencies, which could diminish or eliminate sales and profits from those regions and materially adversely affect our financial condition and results of operations.
Our trademarks and brands may provide us with a competitive advantage in the market as they may be known or trusted by consumers. In order to maintain the value of such brands, we must be able to enforce and defend our trademarks. We have pursued, and will continue to pursue, the registration of trademarks and service marks in the U.S. and internationally; however, enforcing rights against those who knowingly or unknowingly dilute or infringe our brands can be difficult. Effective trademark, service mark, trade dress or related protections may not be available in every country in which our products and services are available. Enforcement is especially difficult in first-to-file countries where “trademark squatters” can prevent us from obtaining adequate protections for our brands. There can be no assurance that the steps we have taken and will take to protect our proprietary rights in our brands and trademarks will be adequate or that third parties will not infringe, dilute or misappropriate our brands, trademarks, trade dress or other similar proprietary rights.
Many of our products are based on or incorporate proprietary information. We actively seek to protect our proprietary information, including our trade secrets and proprietary know-how, by generally requiring our employees, consultants, other advisors and other third parties to execute proprietary information and confidentiality agreements upon the commencement of their employment, engagement or other relationship. Despite these efforts and precautions, we may be unable to prevent a third party from copying or otherwise obtaining and using our trade secrets or other intellectual property without authorization, and legal remedies may not adequately compensate us for the damages caused by such unauthorized use. Further, others may independently and lawfully develop substantially similar or identical products that circumvent our intellectual property by means of alternative designs or processes or otherwise.
The illegal distribution and sale by third parties of counterfeit or illegally compounded versions of our products or of stolen, diverted or relabeled products could have a negative impact on our reputation and business.
Third parties may illegally distribute and sell counterfeit or illegally compounded versions of our products that do not meet the exacting standards of our development, manufacturing and distribution processes. Counterfeit or illegally compounded medicines pose a significant risk to animal health and safety because of the conditions under which they are manufactured and the lack of regulation of their contents. Counterfeit or illegally compounded products are frequently unsafe or ineffective and can be potentially life-threatening to animals. Our reputation and business could suffer harm as a result of counterfeit or illegally compounded products which are alleged to be equivalent and/or which are sold under our brand name(s). In addition, products stolen or unlawfully diverted from inventory, warehouses, plants or while in transit; products which are not properly stored or which have an expired shelf life; and/or products which have been repackaged or relabeled and sold through unauthorized channels, could adversely impact animal health and safety, our reputation and our business. In recent years we have expanded our business more into direct to retailer and e-commerce channels, which may increase the risk of counterfeiting of our products. Public loss of confidence in the integrity of vaccines and/or pharmaceutical products as a result of counterfeiting, illegal compounding or theft could have a material adverse effect on our business, financial condition and results of operations.
The misuse or off-label use of our products may harm our reputation or result in financial or other damages.
Our products have been approved for use under specific circumstances for the treatment of certain diseases and conditions in specific species. There may be increased risk of product liability claims if veterinarians, farm animal producers, pet owners or others attempt to use our products off-label, including the use of our products in species (including humans) for which they have not been approved. Furthermore, the use of our products for indications other than those for which our products have been approved may not be effective, which could harm our reputation and lead to an increased risk of litigation. If we are deemed by a governmental or regulatory agency to have engaged in the promotion of any of our products for off-label use, such agency could request that we modify our training or promotional materials and practices, and we could be subject to significant fines and penalties. The imposition of these sanctions could also affect our reputation and position within the industry. Any of these events could materially adversely affect our business, financial condition and results of operations.
Unanticipated safety, quality or efficacy concerns or identified concerns associated with our products may harm our reputation and have an adverse impact on our performance.
Unanticipated safety, quality or efficacy concerns arise from time to time with respect to animal health products, whether or not scientifically or clinically supported, potentially leading to product recalls, withdrawals or suspended or declining sales, as well as product liability and other claims. Regulatory actions based on these types of safety, quality or efficacy concerns could impact all, or a significant portion, of a product’s sales. For example, in May 2024 the EMA's CVMP recommended suspending the marketing authorization for our Kexxtone™ product for cattle, with the VMD (U.K.) similarly following this recommendation in July. Since this time we have been working on corrective measures to regain market authorization in these jurisdictions; however, we have not yet done so, and will be unable to sell Kexxtone again in these markets until we do.
Additionally, lawsuits seeking actual damages, injunctive relief and/or restitution for allegedly deceptive marketing were filed against us arising out of the use of Seresto, a non-prescription flea and tick collar for cats and dogs, based on media reports alleging that the collar caused injury and death to pets. In 2023, the EPA announced the completion of its comprehensive, multi-year review of the Seresto flea and tick collar and confirmed the continued registration of the collar. However, if any similar claims with respect to our products are resolved adversely to us, or if a regulatory agency determines that a recall or cancellation of registrations of any of our products is necessary, such action could cause harm to our reputation, reduce our product sales, result in monetary penalties and other costly remedies against us, and could therefore have a material adverse effect on our business, financial condition and results of operations.
We also depend on positive perceptions of the safety, quality and efficacy of our products, and animal health products in general, by food producers, veterinarians and pet owners. Any concern as to the safety, quality or efficacy of our products, whether actual or perceived, may harm our reputation. These concerns and the related harm to our reputation could materially adversely affect our business, financial condition and results of operations, regardless of whether such reports are accurate.
Our insurance policies may be insufficient to protect against all potential hazards or litigation claims.
We rely on a combination of insurance and self-insurance, and changes in predictions, assumptions and interpretations could affect our operations. Insurance policies include limits and may be insufficient to protect against all potential hazards and risks or litigation claims. Our product liability insurance policy may not fully cover
our potential liabilities. In addition, we may determine that we should increase our coverage, and this insurance may be prohibitively expensive to us, our collaborators or our licensees and may not fully cover our potential liabilities.
Breaches of our IT systems or improper disclosure of confidential company or personal data, or a failure to comply with privacy laws, regulations and our contractual obligations concerning data privacy or the security of certain information, could have a material adverse effect on our reputation and operations.
We rely on IT systems to process, transmit and store electronic information in our day-to-day operations, including customer, employee and company data. The secure processing, maintenance and transmission of this information is critical to our operations. In addition, the legal environment surrounding information security, storage, use, processing, transmission, maintenance, disclosure and privacy is demanding with the frequent imposition of new and changing regulatory requirements.
We store, process and transmit certain information with third parties, including the use of cloud technologies. Our information systems and those of our third-party vendors are subject to computer viruses or other malicious codes, unauthorized access attempts, phishing and other cyber-attacks and are also vulnerable to improper or inadvertent staff behavior and an increasing threat of continually evolving cybersecurity risks, including through the use of rapidly evolving AI technology to identify and exploit vulnerabilities. Any potential cyber breach could result in the unauthorized access, public disclosure, loss or theft of confidential data, or unauthorized access to, disruption of or interference with our operations that rely on information systems. Such breach could also have negative consequences, such as increased costs for security measures or remediation costs, and diversion of management attention (see Item 1C. Cybersecurity for further discussion of our risk management, strategy and governance policies and procedures related to cybersecurity).
We are increasingly dependent on our IT systems as many of our office workers who work partially or primarily remotely, rely on third-party applications to perform their job duties and are processing information through our network via their home networks, which may be less secure. As such, our ability to effectively manage our business depends on the security, reliability and adequacy of our technology systems and data and the ability of our employees to follow our cybersecurity policies and protocols.
Any actual or perceived access, disclosure or other loss of information or any significant breakdown, intrusion, interruption, cyber-attack or corruption of customer, employee or company data, or our failure to comply with federal, state, local and foreign privacy laws or contractual obligations with customers, vendors, payment processors and other third parties, could result in legal claims or proceedings, liability under laws or contracts that protect the privacy of personal information, regulatory penalties, disruption of our operations and damage to our reputation, all of which could materially adversely affect our business, financial condition and results of operations. While we will continue to implement additional protective measures to reduce the risk of and detect cyber-incidents, cyber-attacks are becoming more sophisticated and frequent, and the techniques used in such attacks change rapidly. Our protective measures may not protect us against attacks, and such attacks could have a significant impact on our business and reputation. The costs imposed on us as a result of a cyber-attack or network disruption could be significant. Among others, such costs could include increased expenditures on cybersecurity measures, litigation, regulatory investigations, fines and sanctions, lost revenues from business interruption, damage to our reputation and public perception and significant remediation costs. As a result, a cyber-attack or network disruption could have a material adverse effect on our business, financial condition and results of operations.
We are subject to complex EHS laws and regulations.
We are subject to various federal, state, local and foreign EHS laws and regulations. These laws and regulations govern matters such as the emission and discharge of hazardous materials into the ground, air or water; the generation, use, storage, handling, treatment, packaging, transportation, exposure to and disposal of hazardous and biological materials, including recordkeeping, reporting and registration requirements; and the health and safety of our employees. Due to our operations, these laws and regulations also require us to obtain and comply with, permits, registrations or other authorizations issued by governmental authorities. These authorities can modify or revoke our permits, registrations or other authorizations and can enforce compliance through fines and injunctions.
Given the nature of our business, we have incurred, are currently incurring and may in the future incur liabilities for the investigation and remediation of contaminated land under the U.S. Comprehensive Environmental Response, Compensation and Liability Act of 1980, as amended, or under other federal, state, local and foreign environmental cleanup laws, with respect to our current or former sites, adjacent or nearby third-party sites or offsite disposal locations. We could be subject to liability for the investigation and remediation of legacy environmental contamination caused by historical industrial activity at sites we own or on which we operate. The costs associated with future cleanup activities that we may be required to conduct or finance could be material. Additionally, we may become liable to third parties for damages, including for personal injury, property damage and natural resource damages, resulting from the disposal or release of hazardous materials into the environment. Such liability could materially adversely affect our business, financial condition and results of operations.
Our failure to comply with the EHS laws and regulations to which we are subject, including any permits issued thereunder, may result in environmental remediation costs, loss of permits, fines, penalties or other adverse governmental or private actions, including regulatory or judicial orders enjoining or curtailing operations or requiring corrective measures, installation of pollution control equipment or remedial measures. We could also be held liable for any and all consequences arising out of human exposure to hazardous materials, environmental damage or significant EHS issues that might arise at a manufacturing or R&D facility. Environmental laws and regulations are complex, change frequently, have tended to become more stringent and stringently enforced over time and may be subject to new interpretation. It is possible that our costs of complying with current and future EHS laws, and our liabilities arising from past or future releases of, or exposure to, hazardous materials could materially adversely affect our business, financial condition and results of operations.
We may be unable to achieve our goals and aspirations set forth in our ESG report(s), particularly with respect to the reduction of greenhouse gas (GHG) emissions, or otherwise meet the expectations of our stakeholders with respect to ESG matters.
Regulatory agencies have shown concern over the impact of animal health products and farm animal operations on the environment. This regulatory scrutiny has in the past and may in the future necessitate that additional time and resources be spent to address these concerns in both new and existing products. Additionally, there has been a focus from our shareholders, as well as regulatory authorities both within the U.S. and internationally, on ESG practices and disclosures, including expanding mandatory and voluntary reporting of GHG emissions and other sustainability metrics, such as waste reduction, use of natural resources including energy, human capital and risk oversight.
We have announced certain aspirations and goals related to ESG matters, such as our intention to reduce certain GHG emissions over time. Achievement of these aspirations, plans and goals is subject to numerous risks and uncertainties, many of which are outside of our control. It is possible we may be unsuccessful in the achievement of our ESG goals, on a timely basis or at all, or that the costs to achieve our goals become prohibitively expensive. Further, some jurisdictions have adopted laws and other regulations that may subject companies operating in those jurisdictions to legal liability for failing to meet published goals. At the same time, our stakeholders have evolving, varied and sometimes conflicting expectations regarding many aspects of our business, including our operations and ESG-related matters. If we fail or are perceived to fail, in any number of ESG matters, such as environmental stewardship, IDEA, good corporate governance, workplace conduct and support for local communities, or to effectively respond to changes in, or new, legal, regulatory or reporting requirements concerning climate change or other sustainability concerns, we may be subject to regulatory fines and penalties, and our reputation may suffer.
ITEM 1B. UNRESOLVED STAFF COMMENTS None.
Our business relies on IT systems to process, transmit and store electronic information, including customer, employee and company data. The secure processing, maintenance and transmission of this information, including information housed both within an internal IT system or with a third-party and cloud-based environments, is critical to our operations. Each of the systems utilized in our business operations is subject to continually evolving cybersecurity risks and threats that present a risk to the continuity of our business operations, potential financial losses and damage to our reputation, including a loss of public trust.
Risk Management, Strategy and Governance
Given the importance of the integrity and security of the information and data utilized in our day-to-day operations, our processes for assessing, identifying and managing material risks from cybersecurity threats is incorporated into our overall enterprise risk management framework. We evaluate cybersecurity risks on an ongoing basis, and both our executive management and Board of Directors have an overall responsibility for assessing and managing risks from cybersecurity threats. We have established an information security team which is structured into three areas, that all report directly to our Chief Information Security Officer (CISO): 1) Governance, Risk and Compliance; 2) Architecture; and 3) Operations (Detect and Respond). Our information security team is responsible for the design and execution of our cybersecurity risk management and helps executive management and our Board of Directors stay informed about and monitor the prevention, detection, mitigation and remediation of cybersecurity risks and incidents through various means, including but not limited to, briefings with internal security team members, threat intelligence obtained from public and private sources and alerts and reports produced by security tools deployed within our IT environment. Our current CISO, who reports directly to our Chief Information Officer (CIO), has over 17
years of experience in various roles involving information technology governance and compliance, including cybersecurity, engineering and enterprise architecture, while our CIO has over 25 years of IT and cybersecurity experience. Our information security team includes professionals with relevant industry, educational and cybersecurity experience.
Governance, Risk and Compliance: Our approach to cybersecurity governance, risk and compliance is based on overarching guidelines, standards and best practices developed by the U.S. National Institute of Standards and Technology (NIST), a department of the U.S. Department of Commerce. Our information security governance oversees the process of coordinating the cybersecurity team(s) responsible for the mitigating of business risks posed by IT-related resources. Our governance framework of authority and accountability ensures prioritized initiatives have the required structure, sponsorship and funding to appropriately address the foreseen risks. Risk management includes an assessment of the risks posed to us by an IT solution, including cloud hosted and/or other third-party environments and systems. Our processes also address cybersecurity risks associated with our use of third-party service providers, including those in our supply chain or who have access to our client or employee data on our systems. In addition, cybersecurity considerations affect the selection and oversight of third-party service providers. We perform diligence on third parties, particularly those that have access to our systems, data or facilities that house such systems or data, and continually monitor cybersecurity threat risks identified through such diligence.
Our risk management process assesses both the probable frequency and probable magnitude of future loss based on a variety of potential risks and cyber events. The information security team also periodically engages third-party vendors to assist with our cyber threat detection and response actions, as well as to ensure our processes related to information security and defense against cybersecurity threats are appropriately designed and implemented to best prevent, detect and/or respond to a cyber threat or event.
Architecture: Our information security architecture is focused on designing IT-related solutions that are foundationally secure. Our information security architecture assumes that internal and external threats always exist, and that all networks are inherently hostile. Accordingly, all connections accessing business assets must first be authenticated and authorized. Where viable, IT services are individually secured and monitored at the source, following the principle of least privilege.
Operations (Detect and Respond): In the event of a cybersecurity incident, the Elanco Information Security Incident Response Plan (ISIRP) defines the roles, responsibilities, procedures and reporting processes required to respond effectively to cybersecurity incidents. Responses to information security incidents are led by two teams: 1) the Security Operations Center (SOC) team, which conducts the initial technical triage and analysis, and 2) a cross-functional team of leaders from the IT, Legal, Human Resources and Finance functions (the Cyber Lead team), which is engaged by the CISO on an as needed basis, based on incident severity. The Cyber Lead team is tasked with confirming the severity of a cybersecurity incident and bringing together the proper resources to lead the corporate-wide response to such incidents, including engaging the Company’s Disclosure Committee, in the event an incident may rise to a level deemed material to us. In the event an incident is escalated by the Cyber Lead team, the Disclosure Committee, led by our Chief Financial Officer and General Counsel, would evaluate all estimable quantitative and qualitative factors, to determine if a Current Report on Form 8-K would be required under Item 1.05, “Material Cybersecurity Incidents.”
For the year ended December 31, 2024, we have not identified any cybersecurity threats that have materially affected or are reasonably likely to materially affect our business strategy, results of operations, or financial condition. For more information on potential risks related to cybersecurity threats and incidents, please see "Item 1A. Risk Factors – Breaches of our IT systems or improper disclosure of confidential company or personal data, or a failure to comply with privacy laws, regulations and our contractual obligations concerning data privacy or the security of certain information, could have a material adverse effect on our reputation and operations."
Management’s Responsibilities
Management is responsible for executing the Cybersecurity Risk Management, Strategy and Governance policies outlined above. This is done, in part, by both establishing systems, processes and controls to minimize the risk of a high severity cybersecurity incident as much as possible, as well as ensuring there is a formal process designed to identify, investigate and appropriately respond to potential cybersecurity incidents. As noted, we have established our ISIRP as a response tool in the event of a cybersecurity incident. The ISIRP documents the actionable steps the SOC team, information security leadership and cross-functional stakeholders and partners take when a cybersecurity incident is identified. The ISIRP covers the preparation, detection and analysis, containment, eradication, recovery and post-incident activities required to effectively respond to an incident.
Once a cybersecurity incident has been identified, the SOC team performs an initial investigation to determine if the incident is deemed high or low severity, based upon the business and operational impacts. Any incident deemed high severity would result in notification by the CISO to the Cyber Lead team to determine the appropriate actions to be taken. This determination would be made by the Cyber Lead team based on both qualitative and quantitative
factors regarding the extent and magnitude of the incident. If the incident is then escalated to the Disclosure Committee and determined to be material, a disclosure via a Current Report on Form 8-K would be made within four business days of the incident being identified as such. Our Board of Directors would also be notified of any high severity incidents that are determined to be material, concurrently with the notification to the Disclosure Committee, and would be kept apprised of actions taken in response to such incidents.
Our information security team is also responsible for cybersecurity awareness and education across the company, including our Board of Directors. Awareness empowers users, including our employees and contractors, to be mindful of cybersecurity in day-to-day situations. Our cybersecurity education practices help ensure specific users have the appropriate security skills and competencies to help prevent and/or detect and respond to a cyber threat. Formal training is delivered and measured throughout our organization on a routine, ongoing basis, and dedicated training is delivered to all new employees and contractors through our onboarding process. Targeted and company-wide communications, as well as simulated phishing campaigns and tabletop exercises are also routinely executed to promote ongoing awareness, preparation and education about cyber threats.
Board of Directors’ Responsibilities
Our Board of Directors actively oversees our cybersecurity management processes, including appropriate risk mitigation strategies, systems, processes and controls. Our CISO meets with the Audit Committee of the Board of Directors and separately with the full Board of Directors at least twice annually to discuss the status of policies and procedures related to information security. Discussions with the Audit Committee and the full Board of Directors focus on any notable incidents and incident responses, updates on known or perceived cyber threats and the information security team's recent actions taken in response to such incidents and threats. In addition, our Board of Directors and the Audit Committee also receive updates from the CISO and/or our CIO on an ad-hoc or as-requested basis. Any incidents or changes to our process of identifying and responding to potential cybersecurity incidents would be included within these materials. According to our ISIRP, our Board of Directors would also be notified of any high severity incidents deemed material, simultaneously with the notification to the Disclosure Committee, and would be kept apprised of actions taken in response to such incidents.
The address of our global headquarters is currently 2500 Innovation Way, Greenfield, IN 46140. We plan to relocate our global headquarters to a new office building in Indianapolis, Indiana, with occupancy expected in 2025.
Our global manufacturing network is comprised of 17 manufacturing sites. Our largest manufacturing site is located in Clinton, Indiana. Our global manufacturing network is also supplemented by approximately 130 CMOs.
We have R&D operations co-located with certain of our manufacturing sites to facilitate the efficient transfer of production processes from our laboratories to manufacturing. In addition, we maintain R&D operations at non-manufacturing locations in the U.S., Germany, Australia, Brazil, China, India and Switzerland. Our R&D headquarters is currently located in Greenfield, Indiana and will relocate to Indianapolis, Indiana when we relocate our global headquarters, expected in 2025.
We own or lease various additional properties for other business purposes, including office space, warehouses and logistics centers. We believe our existing properties, as supplemented by CMOs, are adequate for our current requirements and our operations in the near future.
ITEM 3. LEGAL PROCEEDINGS
Information pertaining to certain legal proceedings is provided in "Item 8. Financial Statements and Supplementary Data — Note 16: Commitments and Contingencies" and is incorporated by reference herein.
ITEM 4. MINE SAFETY DISCLOSURES
Not applicable.
PART II
ITEM 5. MARKET FOR REGISTRANT'S COMMON EQUITY, RELATED STOCKHOLDER MATTERS AND ISSUER PURCHASES OF EQUITY SECURITIES
Market Information
On September 20, 2018, our common stock began trading on the New York Stock Exchange under the symbol “ELAN.”
Holders
There were 184 holders of record of our common stock as of February 20, 2025. This does not include the number of shareholders who hold shares of our common stock through banks, brokers or other financial institutions.
Dividend Policy
We do not anticipate paying dividends on our common stock in the foreseeable future; however, we may change our dividend policy at any time.
Performance Graph
The following graph compares the return on Elanco's common stock with that of the S&P 500 Stock Index and the S&P 500 Pharmaceuticals Index over the five-year period ended on December 31, 2024. The graph assumes that $100 was invested on December 31, 2019, in Elanco common stock, the S&P 500 Index and the S&P 500 Pharmaceuticals Index. The graph measures total shareholder return, which takes into account both stock price and dividends. It assumes that dividends paid by a company are reinvested in that company’s stock.
| | | | | | | | | | | | | | | | | | | | | | | | | | | | | | | | | | | | | | | | | | |
| | | | | | December 31, 2019 | | December 31, 2020 | | December 31, 2021 | | December 31, 2022 | | December 31, 2023 | | December 31, 2024 |
| Elanco Animal Health Inc. | | | | | | $ | 100.00 | | | $ | 104.14 | | | $ | 96.37 | | | $ | 41.49 | | | $ | 50.59 | | | $ | 41.12 | |
| S&P 500 Index | | | | | | 100.00 | | | 118.39 | | | 152.34 | | | 124.73 | | | 157.48 | | | 196.88 | |
| S&P 500 Pharmaceuticals Index | | | | | | 100.00 | | | 107.53 | | | 135.21 | | | 146.65 | | | 147.13 | | | 159.21 | |
ITEM 6. (RESERVED)
Not applicable.
ITEM 7. MANAGEMENT'S DISCUSSION AND ANALYSIS OF FINANCIAL CONDITION AND RESULTS OF OPERATIONS
Introduction
Management’s discussion and analysis of financial condition and results of operations (MD&A) is intended to assist the reader in understanding and assessing significant changes and trends related to our results of operation and financial position. This discussion and analysis should be read in conjunction with the consolidated financial statements and accompanying footnotes in Item 8 of Part II of this Form 10-K. Certain statements in this Item 7 of Part II of this Form 10-K constitute forward-looking statements. Various risks and uncertainties, including those discussed in "Forward-Looking Statements and Risk Factor Summary" and Item 1A. “Risk Factors,” may cause our actual results, financial position and cash flows to differ materially from these forward-looking statements.
Business Overview
Elanco is a global leader in animal health, dedicated to innovating and delivering products and services to prevent and treat disease in farm animals and pets. Our diverse, durable product portfolio is sold in more than 90 countries and serves animals across many species, primarily: dogs and cats (collectively, pet health) and cattle, poultry, swine, sheep and, prior to the divestiture of our aqua business in July 2024 (see below), aqua (collectively, farm animal). With a heritage dating back to 1954, we consistently innovate to improve the health of animals and to benefit our customers while fostering an inclusive, cause-driven culture for our employees. We operate our business in a single segment, directed at advancing the well-being of animals, people and the planet, enabling us to realize our vision of Food and Companionship Enriching Life.
Our diverse product portfolio of approximately 200 brands helps make us a trusted partner to pet owners, veterinarians and farm animal producers. Our products are generally sold worldwide to third-party distributors and independent retailers and directly to farm animal producers and veterinarians. In recent years, we have expanded our omnichannel presence in both the veterinary clinic and in retail markets, including e-commerce.
Product Development and Regulatory Update
A key element of our targeted value creation strategy is to drive revenue growth through portfolio development and product innovation. We continue to pursue the development of new chemical and biological molecules, as well as additional registrations and indications for current products. Our future growth and success depend on both our pipeline of new products, including new products we develop internally, develop with partners or that we obtain through licenses or acquisitions, and the life cycle management of our existing products. We believe we are an industry leader in animal health R&D, with a track record of successful product innovation, business development and commercialization. New product development and regulatory highlights during 2024 included the following:
Bovaer: In May 2024, the FDA completed its comprehensive, multi-year review of Bovaer (3-NOP), a first-in-class methane-reducing feed ingredient for use in lactating dairy cattle. Producers began feeding the product to cattle in the U.S. during the third quarter of 2024.
Zenrelia: We received final FDA approval for Zenrelia, a JAK inhibitor targeting control of pruritus and atopic dermatitis in dogs, in September 2024. We launched Zenrelia shortly after final approval, with the first sales occurring in late September. We have also received approval for Zenrelia in Brazil, Canada and Japan. Additional reviews are ongoing in other key markets, including Europe, U.K. and Australia.
Credelio Quattro: In October 2024, we received final approval from the FDA for Credelio Quattro, a monthly chewable tablet for dogs that protects against fleas, ticks, heartworms, roundworms, hookworms and three different species of tapeworms. Credelio Quattro was launched, with the first commercial sale occurring in January 2025.
Experior: In October 2024, we received multiple combination clearance approvals from the FDA for Experior to be used in combination with other farm animal products, allowing for broader use in heifers, which represent nearly 40% of the fed cattle population in the U.S.
Other Key Trends and Factors Affecting Our Results of Operations
Aqua Business Divestiture: On July 9, 2024, we closed the sale of our aqua business to a subsidiary of Merck Animal Health, for $1,294 million in cash. We utilized a vast majority of these proceeds to repay previously outstanding term loan debt, thereby reducing our leverage and expected future interest expense. Our aqua business included products across both warm-water and cold-water species and generated revenue of $81 million in 2024, through the divestiture date, and $175 million in 2023. Strategically, this divestiture has allowed us to prioritize our investments in larger markets with greater long-term earnings potential.
Assets sold included inventories, real property and equipment, including our manufacturing sites in Canada and Vietnam, and certain intellectual property, technology and other intangible assets, including marketed products.
Along with these assets, approximately 280 commercial and manufacturing employees were transferred to Merck Animal Health as part of this divestiture. We recorded a pre-tax gain on divestiture of $640 million, while income tax expense associated with this gain was approximately $170 million, a majority of which is payable in 2025. See Note 4. Acquisitions, Divestitures and Other Arrangements to the consolidated financial statements for further information.
Acquisition and Integration Activity: In November 2024, we acquired a manufacturing facility in Speke, U.K., including its workforce and related assets such as inventory and property and equipment, from a former contract manufacturing supply partner, TriRx Speke Ltd (TriRx Speke), for $36 million.
In 2023, we acquired certain U.S. marketed products, pipeline products, inventory and an assembled workforce from NutriQuest, LLC (NutriQuest) and certain assets including inventory and distribution rights for certain marketed products from NutriQuest Nutricao Animal Ltda (NutriQuest Brazil). Additionally, we successfully completed the integration of the Bayer Animal Health business into our ERP system, including the build out of processes and systems to support our global organization. See Note 4. Acquisitions, Divestitures and Other Arrangements and Note 5. Asset Impairment, Restructuring and Other Special Charges to the consolidated financial statements for further information on these acquisition and integration activities.
Restructuring Activities: In February 2024, our Board of Directors authorized a restructuring plan (the restructuring plan) to improve operational efficiencies and better align our organizational structure with current business needs, top strategic priorities and key growth opportunities. Specifically, the restructuring plan was intended to reallocate resources by shifting international resources from farm animal to pet health as we plan for the global launches of certain potential blockbuster products. Further, the restructuring plan impacted how we operate in and sell into the Argentina market, among others, reducing our foreign currency exposure in those markets.
We incurred $44 million of charges associated with the restructuring plan in 2024, the majority relating to cash-based severance costs. The restructuring plan is expected to result in annualized net savings of $30 to $35 million. See Note 5. Asset Impairment, Restructuring and Other Special Charges to the consolidated financial statements for further information.
Results of Operations
The following discussion and analysis of the consolidated statements of operations should be read along with the consolidated financial statements and the notes thereto included in Item 8. Financial Statements and Supplementary Data. For results of operations discussions related to the years ended December 31, 2023 and 2022, refer to Item 7 of Part II in our Annual Report on Form 10-K for the year ended December 31, 2023, filed with the SEC on February 26, 2024. Our results of operations for the periods presented below may not be comparable with prior periods or with our results of operations in the future due to many factors, including but not limited to the factors identified in the "Product Development and Regulatory Update" and "Other Key Trends and Factors Affecting Our Results of Operations" discussions above. | | | | | | | | | | | | | | | | | | | | |
| | Year Ended December 31, |
| (Dollars in millions) | | 2024 | | 2023 | | % Change |
| Revenue | | $ | 4,439 | | | $ | 4,417 | | | —% |
| Costs, expenses and other: | | | | | | |
| Cost of sales | | 2,003 | | | 1,931 | | | 4% |
| % of revenue | | 45 | % | | 44 | % | | |
| Research and development | | 344 | | | 327 | | | 5% |
| % of revenue | | 8 | % | | 7% | | |
| Marketing, selling and administrative | | 1,314 | | | 1,285 | | | 2% |
| % of revenue | | 30 | % | | 29% | | |
| Amortization of intangible assets | | 527 | | | 548 | | | (4)% |
| Asset impairment, restructuring and other special charges | | 150 | | | 127 | | | 18% |
| Goodwill impairment | | — | | | 1,042 | | | NM |
| Gain on divestiture | | (640) | | | — | | | NM |
| Interest expense, net of capitalized interest | | 235 | | | 277 | | | (15)% |
| Other expense, net | | 18 | | | 75 | | | (76)% |
| Income (loss) before income taxes | | 488 | | | (1,195) | | | NM |
| Income tax expense | | 150 | | | 36 | | | NM |
| Net income (loss) | | $ | 338 | | | $ | (1,231) | | | NM |
Certain amounts and percentages may reflect rounding adjustments.
NM - Not meaningful
Revenue
Our products are sold in more than 90 countries, and as a result, a significant portion of our revenue is recorded in currencies other than the U.S. dollar. Because of this, our revenue is influenced by changes in foreign currency exchange rates. For the years ended December 31, 2024 and 2023, approximately 53% and 51%, respectively, of our revenue was denominated in foreign currencies.
Further, increases or decreases in inventory levels in our distribution channels can positively or negatively impact our periodic revenue results, leading to variations in revenue. This can be a result of various factors, such as end customer demand, new customer contracts, heightened and generic competition, the need for certain inventory levels, our ability to renew distribution contracts with expected terms, our ability to implement commercial strategies, regulatory restrictions, unexpected customer behavior, proactive measures taken by us in response to shifting market dynamics, payment terms we extend, which are subject to internal policies, blackout shipping periods due to system downtime, implementations and integrations and procedures and environmental factors beyond our control.
Our revenue by product category for the years ended December 31, 2024 and 2023, was as follows:
| | | | | | | | | | | | | | | | | | | | | | | | | | | | | | | | | | | | | | | | | | |
| | Revenue | % of Total Revenue | |
| (Dollars in millions) | | 2024 | | 2023 | | 2024 | | 2023 | | $ Change | | % Change | | | | |
| Pet Health | | $ | 2,143 | | | $ | 2,104 | | | 48 | % | | 48 | % | | $ | 39 | | | 2 | % | | | | |
| Farm Animal | | 2,250 | | | 2,271 | | | 51 | % | | 51 | % | | (21) | | | (1) | % | | | | |
Contract Manufacturing and Other (1) | | 46 | | | 42 | | | 1 | % | | 1 | % | | 4 | | | 10 | % | | | | |
| Total | | $ | 4,439 | | | $ | 4,417 | | | 100 | % | | 100 | % | | $ | 22 | | | — | % | | | | |
Note: Numbers may not add due to rounding
(1)Represents revenue from arrangements in which we manufacture products on behalf of a third party and royalty revenue.
The effects of price, foreign currency exchange rates, volume changes and the impact of the divestiture of our aqua business on changes in revenue for the year ended December 31, 2024, as compared to the prior year, were as follows:
| | | | | | | | | | | | | | | | | | | | | | | | | | | | | | | | | | | | | | | | | | |
(Dollars in millions) | | | | | | Revenue | | Price | | FX Rate | | Volume | | Divestiture | | Total |
| Pet Health | | | | | | $ | 2,143 | | | 3% | | —% | | (1)% | | —% | | 2% |
| Farm Animal | | | | | | 2,250 | | | 2% | | (1)% | | 2% | | (4)% | | (1)% |
| Contract Manufacturing and Other | | | | | | 46 | | | | | | | | | | | 10% |
| Total | | | | | | $ | 4,439 | | | 3% | | (1)% | | —% | | (2)% | | —% |
Pet health revenue increased $39 million, or 2%, driven by a 3% increase in pricing, partially offset by slightly lower volumes. Volume decreases were primarily due to competitive pressure on certain products in the U.S. veterinary channel and purchasing patterns of certain over-the-counter (OTC) products by U.S. retailers. These decreases were partially offset by revenue from new products and improved demand for retail parasiticide products in certain European markets, including Spain.
Farm animal revenue decreased $21 million, or 1%, driven by the divestiture of our aqua business in July 2024, which we estimate resulted in a decrease of $84 million in revenues year-over-year, and to a lesser degree the impact of foreign currency exchange rates. Partially offsetting these decreases were a 2% increase in pricing and higher volumes for our non-aqua products. Volume increases of non-aqua products were driven by strength in U.S. cattle, led by Experior and Rumensin, and strength in poultry sales globally, partially offset by weakness in global swine markets, volume declines associated with our previous strategic decisions to change how we operate in and sell into certain international markets, including Argentina, and the impact from the European recall of Kexxtone, which occurred during the second quarter of 2024.
Cost of Sales
| | | | | | | | | | | | | | | | | | | | |
| | Year Ended December 31, |
| (Dollars in millions) | | 2024 | | 2023 | | % Change |
| Cost of sales | | $ | 2,003 | | | $ | 1,931 | | | 4 | % |
| % of revenue | | 45 | % | | 44 | % | | |
Cost of sales increased $72 million in 2024 as compared to 2023, and cost of sales as a percentage of revenue increased from 44% to 45% year-over-year. These increases were due to a combination of inflation, planned reduced throughput at certain manufacturing sites and product mix associated with the divestiture of our aqua business, partially offset by increased pricing.
Research and Development
| | | | | | | | | | | | | | | | | | | | |
| | Year Ended December 31, |
| (Dollars in millions) | | 2024 | | 2023 | | % Change |
| Research and development | | $ | 344 | | | $ | 327 | | | 5 | % |
| % of revenue | | 8 | % | | 7 | % | | |
R&D expenses increased $17 million, or 5%, in 2024 compared to 2023, primarily driven by higher employee-related expenses and timing of project costs.
Marketing, Selling and Administrative
| | | | | | | | | | | | | | | | | | | | |
| | Year Ended December 31, |
| (Dollars in millions) | | 2024 | | 2023 | | % Change |
| Marketing, selling and administrative | | $ | 1,314 | | | $ | 1,285 | | | 2 | % |
| % of revenue | | 30 | % | | 29 | % | | |
Marketing, selling and administrative expenses increased $29 million, or 2%, in 2024 compared to 2023, primarily driven by higher advertising and employee-related expenses and investments supporting our global pet health business, partially offset by cost savings associated with the completion of our ERP system integration in the second quarter of 2023 and the restructuring plan that was authorized and initiated in the first quarter of 2024.
Amortization of Intangible Assets
| | | | | | | | | | | | | | | | | | | | |
| | Year Ended December 31, |
| (Dollars in millions) | | 2024 | | 2023 | | % Change |
| Amortization of intangible assets | | $ | 527 | | | $ | 548 | | | (4) | % |
Amortization of intangible assets decreased $21 million in 2024 compared to 2023. This decrease was primarily driven by changes in foreign currency exchange rates and the elimination of amortization related to our aqua business intangible assets, which met the criteria to be classified as held for sale on February 1, 2024, at which date amortization of these intangible assets ceased. See Note 4. Acquisitions, Divestitures and Other Arrangements to the consolidated financial statements for further information.
Asset Impairment, Restructuring and Other Special Charges
| | | | | | | | | | | | | | | | | | | | |
| | Year Ended December 31, |
| (Dollars in millions) | | 2024 | | 2023 | | % Change |
| Asset impairment, restructuring and other special charges | | $ | 150 | | | $ | 127 | | | 18 | % |
Amounts recorded to asset impairment, restructuring and other special charges during the year ended December 31, 2024, included a $53 million impairment charge related to the write-off of a pet health IPR&D asset, $44 million of costs associated with the restructuring plan discussed above, $18 million of acquisition and divestiture-related charges, primarily associated with our aqua business divestiture, and $15 million of asset impairments tied to the financial difficulties of our former contract manufacturing supply partner, TriRx, the largest of which was a $12 million impairment of a contract asset related to a favorable supply agreement.
Amounts recorded to asset impairment, restructuring and other special charges during the year ended December 31, 2023, primarily represented $93 million of costs associated with the implementation of new systems, programs and processes due to the integration of Bayer Animal Health and $32 million of asset impairment charges. For additional information regarding our asset impairment, restructuring and other special charges, see Note 5. Asset Impairment, Restructuring and Other Special Charges to the consolidated financial statements.
Goodwill Impairment
| | | | | | | | | | | | | | | | | | | | |
| | Year Ended December 31, |
| (Dollars in millions) | | 2024 | | 2023 | | % Change |
| Goodwill impairment | | $ | — | | | $ | 1,042 | | | NM |
As previously disclosed, there was a sharp increase in long-term treasury rates during the third quarter of 2023, and as a result, we assessed our long-lived assets, including goodwill, for impairment. Due principally to an increased discount rate assumption, which was driven by the sharp increase in long-term treasury rates, our quantitative goodwill impairment test resulted in a $1,042 million pre-tax impairment charge. For additional information, see Note 11. Goodwill and Intangibles to the consolidated financial statements.
Gain on divestiture
| | | | | | | | | | | | | | | | | | | | |
| | Year Ended December 31, |
| (Dollars in millions) | | 2024 | | 2023 | | % Change |
| Gain on divestiture | | $ | (640) | | | $ | — | | | NM |
As discussed above, we recorded a pre-tax gain of $640 million on the divestiture of our aqua business during the third quarter of 2024. For additional information, see Note 4. Acquisitions, Divestitures and Other Arrangements to the consolidated financial statements.
Interest Expense, Net of Capitalized Interest
| | | | | | | | | | | | | | | | | | | | |
| | Year Ended December 31, |
| (Dollars in millions) | | 2024 | | 2023 | | % Change |
| Interest expense, net of capitalized interest | | $ | 235 | | | $ | 277 | | | (15) | % |
Interest expense, net of capitalized interest decreased $42 million in 2024 compared to 2023, primarily due to lower average outstanding debt balances given our debt repayment activity in the current year (see Note 8. Debt to the consolidated financial statements for further information), as well as increased interest income from our net investment hedges, which we record as contra-interest expense, net of capitalized interest (see Note 9. Financial Instruments to the consolidated financial statements for further information). These decreases were partially offset by a $12 million non-cash charge in 2024 related to the write-off of previously deferred financing costs, given our early debt repayments.
Other Expense, Net
| | | | | | | | | | | | | | | | | | | | |
| | Year Ended December 31, |
| (Dollars in millions) | | 2024 | | 2023 | | % Change |
| Other expense, net | | $ | 18 | | | $ | 75 | | | (76) | % |
Other expense, net for the year ended December 31, 2024, primarily consisted of foreign currency exchange losses and an $8 million write-down of the retained equity interest in our previously divested BiomEdit R&D platform (see Note 4. Acquisitions, Divestitures and Other Arrangements to the consolidated financial statements for further information). Other expense, net for the year ended December 31, 2023, primarily consisted of foreign currency exchange losses of $50 million and settlement provisions of $15 million related to the Seresto class action lawsuit and $12.5 million for a possible resolution or settlement with the SEC related to potential disclosure claims, which was ultimately settled in 2024 for $15 million, with the increase in the provision recorded within other expense, net in 2024 (see Note 16. Commitments and Contingencies to the consolidated financial statements for further information).
Foreign currency exchange losses were lower in 2024 in large part due to the restructuring plan actions in the current year, which impacted how we operate in and sell into the Argentina market, among others, reducing our foreign currency exposure in these markets.
Income Tax Expense
| | | | | | | | | | | | | | | | | | | | |
| | Year Ended December 31, |
| (Dollars in millions) | | 2024 | | 2023 | | % Change |
| Income tax expense | | 150 | | 36 | | NM |
| Effective tax rate | | 31 | % | | (3) | % | | |
Income tax expense was $150 million in 2024 compared to $36 million in 2023. Income tax expense in 2024 included approximately $170 million related to income tax associated with the taxable gain on the divestiture of our aqua business. Our effective tax rate of 31% in 2024 differed from the statutory income tax rate primarily due to the income tax associated with the gain on the divestiture of our aqua business, jurisdictional earnings mix of income in higher tax jurisdictions and losses for which no tax benefit was recognized. These factors were partially offset by our ability to realize certain net operating loss carryforwards and other tax attributes, which had historically been offset by a valuation allowance, due to the gain on the sale of our aqua business, and the recognition of certain state tax credits.
The negative effective tax rate in 2023 differed from the statutory income tax rate primarily due to the recognition of the goodwill impairment charge recognized in 2023 that was non-deductible for income tax purposes in most of the impacted jurisdictions, as well as an increase in our valuation allowance, primarily attributable to the likelihood of not realizing the benefit of U.S. federal and state deferred tax assets due to pre-tax losses.
Liquidity and Capital Resources
Our primary sources of liquidity are cash on hand, cash flows from operations and funds available under our credit facilities. As a significant portion of our business is conducted internationally, we hold a significant portion of cash outside the U.S. We monitor and adjust the amount of foreign cash based on projected cash flow requirements. Our ability to use foreign cash to fund cash flow requirements in the U.S. may be impacted by local regulations and, to a lesser extent, the income taxes associated with transferring cash to the U.S. We intend to indefinitely reinvest substantially all foreign earnings for continued use in our foreign operations. As our business evolves, we may change that strategy, particularly to the extent we identify tax efficient reinvestment alternatives for our foreign earnings or change our cash management strategy.
We believe our primary sources of liquidity are sufficient to fund our short-term and long-term existing and planned capital requirements, which include working capital obligations, funding existing marketed and pipeline products, capital expenditures, business development in our targeted areas, short-term and long-term debt obligations, including both principal and interest payments, as well as interest rate swaps, operating lease payments, purchase obligations and costs associated with mergers, acquisitions, divestitures, business integrations and/or restructuring activities. As of December 31, 2024, we had cash and cash equivalents of $468 million and unused borrowing capacity on our Revolving Credit Facility of approximately $750 million. In addition, our Securitization Facility provides for additional borrowing capacity based on our U.S. Net Eligible Receivables Balances. As of December 31, 2024, we had $125 million in undrawn borrowing capacity on this facility. We also have the ability to access capital markets to obtain debt financing for longer-term funding, if required. Further, we believe we have sufficient cash flow and liquidity to remain in compliance with our debt covenants.
We made $1,600 million of term loan debt repayments during the year ended December 31, 2024, utilizing the vast majority of the proceeds from the sale of our aqua business, a portion of the proceeds from our new $350 million Incremental Term Facility due 2031 and available cash on hand. We also repaid $200 million, net on our Revolving Credit Facility and $25 million, net on our Securitization Facility. Combined, these net repayments of $1,475 million during 2024 have significantly reduced our leverage and anticipated future interest expense.
Our ability to meet future funding requirements may be impacted by macroeconomic, business and financial volatility. As market conditions change, we will continue to monitor our liquidity position. However, a challenging economic environment or an economic downturn may impact our liquidity or ability to obtain future financing. See "Item 1A. Risk Factors - We have substantial indebtedness."
Cash Flows
The following table provides a summary of cash flows from operating, investing and financing activities for the years ended December 31, 2024 and 2023:
| | | | | | | | | | | | | | | | | |
| (in millions) | |
| Net cash provided by (used for): | 2024 | | 2023 | | $ Change |
| Operating activities | $ | 541 | | | $ | 271 | | | $ | 270 | |
| Investing activities | 1,158 | | | (169) | | | 1,327 | |
| Financing activities | (1,492) | | | (83) | | | (1,409) | |
| Effect of exchange rate changes on cash and cash equivalents | (91) | | | (12) | | | (79) | |
| Net increase in cash and cash equivalents | $ | 116 | | | $ | 7 | | | $ | 109 | |
Operating Activities
Cash provided by operating activities increased $270 million to $541 million for the year ended December 31, 2024, compared to $271 million for the year ended December 31, 2023. The increase in cash provided by operating activities was driven by year-over-year improvements in changes in operating assets and liabilities, partially offset by a decrease of $52 million of cash proceeds from interest rate swap settlements year-over-year.
Investing Activities
Cash provided by investing activities was $1,158 million for the year ended December 31, 2024, and was driven by cash proceeds of $1,294 million from the sale of our aqua business in July 2024, and to a lesser extent, the collection of a $66 million receivable related to the previous divestiture of our Shawnee and Speke facilities. These proceeds from investing activities were partially offset by $147 million of net purchases of property and equipment and software and $36 million of cash paid for the acquisition of the Speke facility (see Note 4. Acquisitions, Divestitures and Other Arrangements to the consolidated financial statements for additional information on current and prior year acquisition and divestiture activities). Cash used for investing activities of $169 million during the year ended December 31, 2023, primarily related to $140 million of cash paid for property and equipment and software and $19 million paid for our acquisitions of NutriQuest and NutriQuest Brazil.
Financing Activities
Cash used for financing activities was $1,492 million for the year ended December 31, 2024, compared to $83 million for the year ended December 31, 2023. In 2024, we repaid $1,600 million of term loan debt, $200 million, net on our Revolving Credit Facility and $25 million, net on our Securitization Facility. These debt repayments were partially offset by proceeds of $350 million from the issuance of our Incremental Term Facility due 2031 in August 2024. Cash used for financing activities during 2023 primarily reflected the repayment of our previously outstanding 4.272% Senior Notes due 2023, partially offset by $200 million of net borrowings on our Revolving Credit Facility and $125 million of net borrowings on our Securitization Facility. See Note 8. Debt to the consolidated financial statements for further information related to our debt related borrowing and repayment activity.
Capital Expenditures
Capital expenditures, which we define as cash paid for property and equipment and software, were $147 million during 2024, an increase of $7 million compared to 2023. We anticipate capital expenditures in 2025 to be approximately $225 million to $255 million. This anticipated increase in capital expenditures in 2025 compared to recent years is due, in part, to expected capital spend associated with the expansion of our monoclonal antibody manufacturing facility in Elwood, Kansas.
Description of Indebtedness
For a complete description of our debt and available credit facilities as of December 31, 2024, see Note 8. Debt to the consolidated financial statements.
Contractual Obligations
Our contractual obligations and commitments as of December 31, 2024, are primarily comprised of long-term debt obligations, operating leases, including a 25-year lease commitment that will commence in 2025 for our new corporate headquarters in Indianapolis, Indiana, and purchase obligations. Our long-term debt obligations are comprised of our expected principal and interest obligations. Purchase obligations consist of open purchase orders as of December 31, 2024, and contractual payment obligations with significant vendors which are noncancelable and not contingent. These obligations are primarily short-term in nature. See Note 13. Leases to the consolidated financial statements for further discussion regarding our contractual obligations related to leases, including for our new corporate headquarters in Indianapolis, Indiana.
Critical Accounting Estimates
The preparation of financial statements in accordance with GAAP requires us to make estimates and judgments that affect the reported amounts of assets, liabilities, revenues, expenses and related disclosures at the date of the financial statements and during the reporting period. Certain of our accounting estimates are considered critical because they are the most important to the fair presentation of our financial statements, including the disclosures thereto, and often require significant, difficult or complex judgments, probabilities and assumptions. While we believe our critical accounting estimates to be reasonable based on all relevant information available, given their inherent uncertainty, if our estimates and assumptions are not representative of actual outcomes, our results could be materially impacted. We regularly evaluate our estimates and assumptions and adjust them when facts and circumstances indicate the need for change, and such changes generally would be reflected in our consolidated financial statements in the period they are determined. We apply estimation methodologies consistently from year to year. The following is a summary of accounting estimates that we consider critical to our consolidated financial statements.
Revenue Recognition
Our gross product revenue is subject to reductions that are generally estimated and recorded in the same period the revenue is recognized and primarily represent revenue incentives (rebates and discounts). For estimates related to revenue incentives, we use our historical experience with similar incentives programs, current sales data and estimates of inventory levels at our channel distributors to estimate the impact of such programs on revenue and continually monitor the impact of this experience and adjust as necessary.
Although the amounts recorded for revenue reductions are dependent on estimates and assumptions, historically our adjustments to actual results have not been material. The sensitivity of our estimates can vary by program, type of customer and geographic location. Amounts recorded for revenue reductions can result from a complex series of judgments about future events and uncertainties and can rely on estimates and assumptions. If any of our ratios, factors, assessments, experiences or judgments are not indicative or accurate predictors of our future experience, our results could be materially affected.
See Note 2. Summary of Significant Accounting Policies and Note 3. Revenue to the consolidated financial statements for further discussion regarding our revenue recognition policy and quantitative information regarding our rebate programs, respectively.
Acquisitions and Divestitures
Acquisitions
We account for assets acquired and liabilities assumed in a business combination based on their respective fair values as of the acquisition date. The excess of the purchase price over the fair value of the acquired net assets, where applicable, is recorded as goodwill. The judgments made in determining estimated fair values assigned to assets acquired and liabilities assumed, as well as estimated asset lives, can materially affect our consolidated results of operations. The fair values of intangible assets are determined using information available at the acquisition date based on expectations and assumptions that are deemed reasonable by management. These fair value estimates require significant judgment with respect to future revenues and earnings before interest and taxes (EBIT) margins, use of working capital, the selection of appropriate discount rates, product mix, income tax rates and other assumptions and estimates. Such estimates and assumptions are determined based upon our business plans and, when applicable, market participants' views of us and similar companies. We often utilize an income approach, which is a valuation technique that provides an estimate of fair value based on market participant expectations of the cash flows an asset would generate over its remaining useful life. For significant acquisitions, we normally engage an independent valuation specialist to assist in valuing significant assets and liabilities.
Divestitures
Determining the gain or loss on the divestiture of a business under GAAP requires us to allocate a portion of our single reporting unit's goodwill to the divested business' carrying value (the disposal group). The determination of how much goodwill to allocate to a disposal group is based on the relative fair value of the business being sold and the fair value of the remaining reporting unit being retained, which in the case of Elanco, is our remaining consolidated business.
In determining the amount of goodwill to be included in our aqua business disposal group, we compared the fair value of the disposal group, which we determined corresponded with the agreed upon sales price, to the estimated fair value of our single reporting unit as a whole. We estimated the fair value of our single reporting unit using the income approach. Significant management judgment was required in estimating the fair value of our single reporting unit, including, but not limited to, estimates and assumptions regarding future cash flows of our single reporting unit, revenue growth and other profitability measures, such as gross margin and earnings before interest, taxes, depreciation and amortization (EBITDA) margin and the determination of an appropriate discount rate. While we believe the estimates and assumptions underlying our fair value estimates were reasonable in view of all available information, significant changes to any of these significant judgments could have resulted in a different amount of goodwill allocated to our aqua business disposal group, and if so, would have impacted the amount of the pre-tax gain recognized.
Impairment of Goodwill and Indefinite-Lived Assets
Goodwill is not amortized but is reviewed at least annually for impairment during the fourth quarter, or more frequently if there is a significant change in events or circumstances that indicates the fair value of our single reporting unit is more likely than not less than its carrying amount (a "triggering event"). When required, a comparison of fair value to the carrying amount of our reporting unit is performed to determine the amount of impairment, if any. We begin by assessing qualitative factors to determine whether it is more likely than not that the fair value of our single reporting unit is less than its carrying value. Based on that qualitative assessment, if we conclude it is more likely than not that the fair value is less than its carrying value, we conduct a quantitative impairment test, which involves comparing the estimated fair value of our single reporting unit to its carrying value. For quantitative goodwill impairment tests, when required, we estimate the fair value of our single reporting unit using an income approach. If the carrying value of the reporting unit exceeds its estimated fair value, we recognize an impairment loss for the difference. Significant management judgment is required in estimating our reporting unit’s fair value and in the creation of forecasts of future operating results to be used in the discounted cash flow method of the income approach valuation. These include, but are not limited to, estimates and assumptions regarding our future cash flows, revenue growth rates and other profitability measures such as gross margin and EBITDA margin; and the determination of an appropriate discount rate.
Given the sharp increase in long-term treasury rates in the third quarter of 2023, we assessed our long-lived assets for impairment, concluding that a triggering event existed for certain indefinite-lived assets, including goodwill. Accordingly, we performed interim quantitative impairment tests of our goodwill and other indefinite-lived assets, which resulted in a $1,042 million pre-tax goodwill impairment charge. We have closely monitored for additional triggering events since this impairment charge, and the results of our most recent annual review indicated that the estimated fair value of our single reporting unit more likely than not exceeded its carrying amount.
While we believe the estimates and assumptions underlying our annual goodwill impairment review in the fourth quarter of 2024 were reasonable in view of all available information, these assumptions are subject to change in future periods because of, among other things, reductions in our estimates of future cash flows, revenue growth or other profitability measures, and/or an increase in the discount rate, which is highly correlated with long-term
treasury rates. We have observed long-term treasury rates increase since our annual goodwill impairment review. While we believe, as of December 31, 2024, the current rate environment does not represent a triggering event, based on our best estimates we believe a further 50 basis-point increase in long-term treasury rates could result in a triggering event, and therefore, a quantitative goodwill impairment test. While we cannot say with certainty whether or not such a quantitative test would result in a goodwill impairment, we do believe a 100 basis-point increase, absent any other changes, would likely result in a goodwill impairment charge.
Similar to goodwill, indefinite-lived intangible assets are also reviewed for impairment at least annually during the fourth quarter, or more frequently if there is a triggering event. We also typically use an income approach when estimating the fair value of our indefinite-lived intangible assets, which primarily represent IPR&D acquired from prior business combinations. During the years ended December 31, 2024, 2023 and 2022, we recorded asset impairments related to our indefinite-lived intangibles of $56 million, $6 million and $59 million, respectively. For more information related to our indefinite-lived asset impairment charges, see Note 5. Asset Impairment, Restructuring and Other Special Charges and Note 11. Goodwill and Intangibles to the consolidated financial statements.
Deferred Tax Asset Valuation Allowances
We maintain valuation allowances unless it is more likely than not that all of the deferred tax asset will be realized. Changes in valuation allowances are typically included in our tax provision in the period of change. In determining whether a valuation allowance is warranted, we evaluate factors such as prior earnings history, expected future earnings, carryback and carryforward periods of tax attributes, availability of taxable temporary differences and tax strategies that could potentially enhance the likelihood of realization of a deferred tax asset. The realizability assessments made at a given balance sheet date are subject to change in the future, particularly if earnings of a subsidiary are significantly higher or lower than expected, or if we take operational or tax planning actions that could impact the future taxable earnings of a subsidiary. A change in these assumptions may result in an increase or decrease in the realizability of our existing deferred tax assets, and therefore a change in the valuation allowance, in future periods. In making such judgments, significant weight is given to evidence that can be objectively verified.
As of December 31, 2024 and 2023, we had valuation allowances of $269 million and $363 million, respectively. In recent years we have incurred pre-tax losses in the U.S. primarily as a result of impairments and transaction, restructuring, integration and other costs. As a result, we have concluded that it is “more likely than not” that a portion of the U.S. deferred assets will not be utilized, and have recorded valuation allowances of $218 million and $289 million, respectively, against these deferred tax assets. Under current tax laws, the valuation allowance will not limit our ability to utilize U.S. deferred tax assets provided we can generate sufficient future taxable income in the U.S. We anticipate we will continue to record a valuation allowance against the losses until such time as we are able to determine it is “more likely than not” that the deferred tax asset will be realized.
Recently Issued Accounting Pronouncements
For discussion of our new accounting standards, see "Item 8. Financial Statements and Supplementary Data — Note 2. Summary of Significant Accounting Policies."
ITEM 7A. QUANTITATIVE AND QUALITATIVE DISCLOSURES ABOUT MARKET RISK Foreign Exchange Risk
We operate on a global basis and are exposed to the risk that our earnings, cash flows and equity could be adversely impacted by fluctuations in foreign currency exchange rates. We are exposed to foreign currency exchange risk as the functional currency financial statements of non-U.S. subsidiaries are translated to U.S. dollars. We are also subject to foreign currency transaction gains and losses to the extent revenue and expense transactions are not denominated in the functional currency of a subsidiary. We are primarily exposed to foreign currency exchange risk with respect to net assets denominated in the Euro, British pound, Swiss franc, Brazilian real, Australian dollar, Japanese yen, Canadian dollar and Chinese yuan.
Additionally, we generally identify hyperinflationary markets as those markets whose cumulative inflation rate over a three-year period exceeds 100%. We have applied hyperinflationary accounting for our Argentina and Turkey subsidiaries since 2018 and 2022, respectively, and as a result, have changed their functional currencies to the U.S. dollar. During the years ended December 31, 2024 and 2023, revenue in Argentina and Turkey each represented less than 1% of our consolidated revenue, and assets held in Argentina and Turkey at December 31, 2024 and 2023, each represented less than 1% of our consolidated assets.
In February 2024 our Board of Directors authorized a restructuring plan that, among other strategic decisions, resulted in a change in how we operate in and sell into the Argentina market, reducing our foreign currency exposure with respect to the Argentine peso. In spite of this, and while the application of hyperinflationary accounting for our subsidiaries in Argentina and Turkey did not have a material impact on our business during the year ended December 31, 2024, we may in the future incur significant currency devaluations, which could have a material adverse impact on our results of operations.
We frequently enter into foreign exchange forward or option contracts to reduce the effect of fluctuating currency exchange rates. Gains and losses on these instruments are recorded within other expense, net, and offset, in part, the impact of currency fluctuations on the underlying foreign currency denominated assets and liabilities. A hypothetical 10 percent adverse change in exchange rates applied to the fair values of our outstanding foreign exchange forward and option contracts as of December 31, 2024, would result in an additional unrealized loss of approximately $55 million.
We also have a series of cross-currency fixed interest rate swaps to help mitigate the impact of currency fluctuations on our operations in Switzerland. Gains or losses related to these instruments due to spot rate fluctuations are recorded as cumulative translation adjustments (CTA) as a component of other comprehensive income (loss). Gains and losses will remain in accumulated other comprehensive income (loss) until either the sale or substantial liquidation of the hedged subsidiary. If the U.S. dollar were to weaken against the Swiss franc by 10%, the amount of unrealized loss recorded in CTA related to these cross-currency fixed interest rate swaps as of December 31, 2024, would increase by approximately $125 million. This hypothetical unrealized loss would be expected to be offset by a corresponding foreign currency translation gain from our investment in our Swiss subsidiary.
Interest Risk
At December 31, 2024, we held interest rate swap agreements with a notional value of $2,800 million that had the economic effect of modifying this amount of our variable-rate debt to fixed-rate. We also held forward-starting interest rate swap agreements with a combined notional amount of $850 million, which will become effective in 2026. When including the variable-rate converted to fixed-rate through the use of interest rate swaps, as of December 31, 2024, approximately 82% of our long-term indebtedness bore interest at a fixed rate. We estimate that a hypothetical 1.0% increase in the applicable Term SOFR benchmark rates throughout 2024 would have resulted in an increase in our interest expense, net of capitalized interest, of approximately $12 million.
ITEM 8. FINANCIAL STATEMENTS AND SUPPLEMENTARY DATA
Elanco Animal Health Incorporated
Consolidated Statements of Operations
(in millions, except per-share data) | | | | | | | | | | | | | | | | | |
| | Year Ended December 31, |
| | 2024 | | 2023 | | 2022 |
| | | | | |
| Revenue | $ | 4,439 | | | $ | 4,417 | | | $ | 4,411 | |
| Costs, expenses and other: | | | | | |
| Cost of sales | 2,003 | | | 1,931 | | | 1,913 | |
| Research and development | 344 | | | 327 | | | 321 | |
| Marketing, selling and administrative | 1,314 | | | 1,285 | | | 1,265 | |
| Amortization of intangible assets | 527 | | | 548 | | | 528 | |
| Asset impairment, restructuring and other special charges | 150 | | | 127 | | | 183 | |
| Goodwill impairment | — | | | 1,042 | | | — | |
| Gain on divestiture | (640) | | | — | | | — | |
| Interest expense, net of capitalized interest | 235 | | | 277 | | | 241 | |
| Other expense, net | 18 | | | 75 | | | 32 | |
| 3,951 | | | 5,612 | | | 4,483 | |
| Income (loss) before income taxes | 488 | | | (1,195) | | | (72) | |
| Income tax expense | 150 | | | 36 | | | 6 | |
| Net income (loss) | $ | 338 | | | $ | (1,231) | | | $ | (78) | |
| | | | | |
| Earnings (loss) per share: | | | | | |
| Basic | $ | 0.68 | | | $ | (2.50) | | | $ | (0.16) | |
| Diluted | $ | 0.68 | | | $ | (2.50) | | | $ | (0.16) | |
| Weighted-average shares outstanding: | | | | | |
| Basic | 494.0 | | | 492.3 | | | 488.3 | |
| Diluted | 497.3 | | | 492.3 | | | 488.3 | |
See notes to consolidated financial statements.
Elanco Animal Health Incorporated
Consolidated Statements of Comprehensive Loss
(in millions) | | | | | | | | | | | | | | | | | |
| Year Ended December 31, |
| 2024 | | 2023 | | 2022 |
| | | | | |
| Net income (loss) | $ | 338 | | | $ | (1,231) | | | $ | (78) | |
| Other comprehensive (loss) income: | | | | | |
| Cash flow hedges, net of taxes | (20) | | | (125) | | | 157 | |
| Foreign currency translation, net of taxes | (487) | | | 293 | | | (419) | |
| Defined benefit plans, net of taxes | 2 | | | (42) | | | 79 | |
| Other comprehensive (loss) income, net of taxes | (505) | | | 126 | | | (183) | |
| Comprehensive loss | $ | (167) | | | $ | (1,105) | | | $ | (261) | |
See notes to consolidated financial statements.
Elanco Animal Health Incorporated
Consolidated Balance Sheets
(in millions, except share data) | | | | | | | | | | | |
| December 31, 2024 | | December 31, 2023 |
| Assets | | | |
| Current Assets | | | |
| Cash and cash equivalents | $ | 468 | | | $ | 352 | |
| Accounts receivable, net | 805 | | | 842 | |
| Other receivables | 81 | | | 168 | |
| Inventories | 1,574 | | | 1,735 | |
| Prepaid expenses and other | 287 | | | 310 | |
| | | |
| Total current assets | 3,215 | | | 3,407 | |
| Noncurrent Assets | | | |
| | | |
| Goodwill | 4,414 | | | 5,094 | |
| Other intangibles, net | 3,681 | | | 4,494 | |
| Other noncurrent assets | 311 | | | 341 | |
| Property and equipment, net | 993 | | | 1,026 | |
| Total assets | $ | 12,614 | | | $ | 14,362 | |
| Liabilities and Equity | | | |
| Current Liabilities | | | |
| Accounts payable | $ | 296 | | | $ | 270 | |
| Employee compensation | 177 | | | 157 | |
| Sales rebates and discounts | 332 | | | 367 | |
| | | |
| Current portion of long-term debt | 44 | | | 38 | |
| | | |
| Other current liabilities | 466 | | | 409 | |
| | | |
| Total current liabilities | 1,315 | | | 1,241 | |
| Noncurrent Liabilities | | | |
| Long-term debt | 4,277 | | | 5,736 | |
| Accrued retirement benefits | 175 | | | 184 | |
| Deferred taxes | 449 | | | 567 | |
| Other noncurrent liabilities | 302 | | | 411 | |
| Total liabilities | 6,518 | | | 8,139 | |
| Commitments and Contingencies | | | |
| Equity | | | |
| | | |
| Common stock, 5,000,000,000 shares authorized, no par value; 494,445,839 and 492,845,216 shares issued and outstanding as of December 31, 2024 and 2023, respectively | — | | | — | |
| Additional paid-in capital | 8,817 | | | 8,777 | |
| Accumulated deficit | (1,950) | | | (2,288) | |
| Accumulated other comprehensive loss | (771) | | | (266) | |
| Total equity | 6,096 | | | 6,223 | |
| Total liabilities and equity | $ | 12,614 | | | $ | 14,362 | |
See notes to consolidated financial statements.
Elanco Animal Health Incorporated
Consolidated Statements of Equity
(in millions) | | | | | | | | | | | | | | | | | | | | | | | | | | | | | | | | | | | | | | | | | | | | | | | | | | | | | | | |
| Common Stock | | | | | | | | Accumulated Other Comprehensive Loss | | |
| Shares | | Amount | | Additional Paid-in Capital | | | | Accumulated Deficit | | Cash Flow Hedges | | Foreign Currency Translation | | Defined Benefit Plans | | Total | | Total Equity |
| December 31, 2021 | 473.1 | | | $ | — | | | $ | 8,696 | | | | | $ | (979) | | | $ | 25 | | | $ | (253) | | | $ | 19 | | | $ | (209) | | | $ | 7,508 | |
| Net loss | — | | | — | | | — | | | | | (78) | | | — | | | — | | | — | | | — | | | (78) | |
| Other comprehensive income (loss), net of taxes | — | | | — | | | — | | | | | — | | | 157 | | | (419) | | | 79 | | | (183) | | | (183) | |
| Stock-based compensation activity, net | 1.1 | | | — | | | 42 | | | | | — | | | — | | | — | | | — | | | — | | | 42 | |
| December 31, 2022 | 474.2 | | | — | | | 8,738 | | | | | (1,057) | | | 182 | | | (672) | | | 98 | | | (392) | | | 7,289 | |
| Net loss | — | | | — | | | — | | | | | (1,231) | | | — | | | — | | | — | | | — | | | (1,231) | |
| Other comprehensive income (loss), net of taxes | — | | | — | | | — | | | | | — | | | (125) | | | 293 | | | (42) | | | 126 | | | 126 | |
| Stock-based compensation activity, net | 1.4 | | | — | | | 39 | | | | | — | | | — | | | — | | | — | | | — | | | 39 | |
| Conversion of tangible equity units (TEUs) into common stock | 17.2 | | | — | | | — | | | | | — | | | — | | | — | | | — | | | — | | | — | |
| December 31, 2023 | 492.8 | | | — | | | 8,777 | | | | | (2,288) | | | 57 | | | (379) | | | 56 | | | (266) | | | 6,223 | |
| Net income | — | | | — | | | — | | | | | 338 | | | — | | | — | | | — | | | — | | | 338 | |
| Other comprehensive (loss) income, net of taxes | — | | | — | | | — | | | | | — | | | (20) | | | (487) | | | 2 | | | (505) | | | (505) | |
| Stock-based compensation activity, net | 1.6 | | | — | | | 40 | | | | | — | | | — | | | — | | | — | | | — | | | 40 | |
| December 31, 2024 | 494.4 | | | $ | — | | | $ | 8,817 | | | | | $ | (1,950) | | | $ | 37 | | | $ | (866) | | | $ | 58 | | | $ | (771) | | | $ | 6,096 | |
See notes to consolidated financial statements.
Elanco Animal Health Incorporated
Consolidated Statements of Cash Flows
(in millions) | | | | | | | | | | | | | | | | | |
| Year Ended December 31, |
| 2024 | | 2023 | | 2022 |
| Cash Flows from Operating Activities | | | | | |
| Net income (loss) | $ | 338 | | | $ | (1,231) | | | $ | (78) | |
| Adjustments to reconcile net income (loss) to cash flows from operating activities: | | | | | |
| Depreciation and amortization | 662 | | | 694 | | | 682 | |
| Goodwill impairment | — | | | 1,042 | | | — | |
| Deferred income taxes | (112) | | | (80) | | | (57) | |
| Stock-based compensation expense | 55 | | | 46 | | | 59 | |
| Asset impairment and write-down charges | 81 | | | 32 | | | 81 | |
| | | | | |
| Gain on divestiture | (640) | | | — | | | — | |
| | | | | |
| Loss on extinguishment of debt | — | | | — | | | 20 | |
| Proceeds from interest rate swap settlements | 5 | | | 57 | | | 207 | |
| Other non-cash operating activities, net | 3 | | | 11 | | | — | |
| Other changes in operating assets and liabilities, net of acquisitions and divestitures: | | | | | |
| Receivables | 12 | | | (40) | | | 14 | |
| Inventories | 44 | | | (160) | | | (269) | |
| Other assets | 11 | | | (6) | | | (109) | |
| Accounts payable and other liabilities | 82 | | | (94) | | | (98) | |
| | | | | |
| Net Cash Provided by Operating Activities | 541 | | | 271 | | | 452 | |
| Cash Flows from Investing Activities | | | | | |
| Net purchases of property and equipment and software | (147) | | | (140) | | | (171) | |
| Purchases of intangible assets | (14) | | | (14) | | | (13) | |
| Cash paid for acquisitions | (41) | | | (19) | | | — | |
| Proceeds from aqua business divestiture | 1,294 | | | — | | | — | |
| Proceeds from sale of Shawnee and Speke facilities | 66 | | | — | | | 13 | |
| Other investing activities, net | — | | | 4 | | | (8) | |
| Net Cash Provided by (Used for) Investing Activities | 1,158 | | | (169) | | | (179) | |
| Cash Flows from Financing Activities | | | | | |
| Proceeds from Revolving Credit Facility | 50 | | | 350 | | | 563 | |
| Repayments of Revolving Credit Facility | (250) | | | (150) | | | (813) | |
| Proceeds from Securitization Facility | 170 | | | 250 | | | — | |
| Repayments of Securitization Facility | (195) | | | (125) | | | — | |
| Proceeds from issuance of long-term debt | 350 | | | — | | | 425 | |
| Repayments of long-term borrowings | (1,600) | | | (402) | | | (677) | |
| | | | | |
| Funding related to construction of corporate headquarters | — | | | — | | | (15) | |
| Other financing activities, net | (17) | | | (6) | | | (32) | |
| | | | | |
| Net Cash Used for Financing Activities | (1,492) | | | (83) | | | (549) | |
| Effect of exchange rate changes on cash and cash equivalents | (91) | | | (12) | | | (17) | |
| Net increase (decrease) in cash and cash equivalents | 116 | | | 7 | | | (293) | |
| Cash and cash equivalents at January 1 | 352 | | | 345 | | | 638 | |
| Cash and cash equivalents at December 31 | $ | 468 | | | $ | 352 | | | $ | 345 | |
See notes to consolidated financial statements.
Elanco Animal Health Incorporated
Notes to Consolidated Financial Statements
(Tables present dollars and shares in millions, except per-share and per-unit data)
Note 1. Background and Basis of Presentation
Elanco Animal Health Incorporated (collectively, Elanco, the Company, we, us, or our) is a global animal health company that innovates, develops, manufactures and markets products for pets and farm animals. Elanco was incorporated in Indiana on September 18, 2018, and prior to that was a business unit of Eli Lilly and Company (Lilly). Our diverse, durable product portfolio of approximately 200 brands is sold in more than 90 countries and serves animals across many species, primarily: dogs and cats (collectively, pet health) and cattle, poultry, swine, sheep and prior to the divestiture of our aqua business in July 2024 (see Note 4. Acquisitions, Divestitures and Other Arrangements), aqua (collectively, farm animal). Our products are generally sold worldwide to third-party distributors and independent retailers and directly to farm animal producers and veterinarians. In recent years, we have expanded our omnichannel presence in both the veterinary clinic and in retail markets, including e-commerce.
We have prepared the accompanying consolidated financial statements in accordance with accounting principles generally accepted in the United States (GAAP). In our opinion, the financial statements reflect all adjustments (including those that are normal and recurring) that are necessary for fair presentation of the results of operations for the periods shown. All intercompany balances and transactions have been eliminated. We issued our financial statements by filing with the Securities and Exchange Commission (SEC) and have evaluated subsequent events up to the time of filing.
Note 2. Summary of Significant Accounting Policies
The following is a summary of significant accounting policies used in the preparation of the accompanying consolidated financial statements.
Estimates and Assumptions
The preparation of financial statements in accordance with GAAP requires us to make estimates and judgments that affect the reported amounts of assets, liabilities, revenues, expenses and related disclosures at the date of the financial statements and during the reporting period. These estimates and underlying assumptions can impact all elements of our consolidated financial statements. Our estimates are often based on several factors, including the facts and circumstances available at the time the estimates are made, historical experience, risk of loss, general economic conditions and trends and the assessment of the probable future outcome. Some of our estimates require significant, difficult or complex judgments, probabilities and assumptions that we believe to be reasonable but that can be inherently uncertain and unpredictable. If our estimates and assumptions are not representative of actual outcomes, our results could be materially impacted. We regularly evaluate our estimates and assumptions and adjust them when facts and circumstances indicate the need for change. Such changes generally would be reflected in our consolidated financial statements in the period they are determined. We apply estimation methodologies consistently from year to year.
Revenue
We recognize revenue primarily from product sales to customers. Revenue from sales of products is recognized at the point where the customer obtains control of the goods and we satisfy our performance obligation, which is generally once the goods have shipped and the customer has assumed title. For contract manufacturing organization (CMO) arrangements, we recognize revenue over time or at a point in time depending on our evaluation of when the customer obtains control of the promised goods or service.
Revenue reflects the total consideration to which we expect to be entitled (i.e., the transaction price), in exchange for products sold, after considering various types of variable consideration, such as rebates, sales allowances, product returns and discounts. Provisions for rebates and discounts, as well as returns, are established in the same period the related sales are recognized. Significant judgments must be made in determining the transaction price for sales of products related to anticipated rebates, discounts and returns. The following describe the most significant of these judgments:
Sales Rebates and Discounts
•Many of our products are sold and initially invoiced at contractual list prices. Contracts with customers often provide for various rebates and discounts that may differ in each contract. As a consequence, to determine the appropriate transaction price for our product sales, we must estimate any rebates or discounts that will ultimately be due to the customer under the terms of our contracts. The rebate and discount amounts are recorded as a reduction to revenue in the period in which the related revenue is recognized to arrive at net product sales. Significant judgment is involved in determining the rebate and discount amounts expected to be payable to a customer. In determining the appropriate accrual amount, we consider our historical experience with similar incentives programs and current sales data and estimates of inventory levels at our
channel distributors to evaluate the impact of such programs on revenue. We continually monitor the impact of this experience and adjust our accrual amounts as necessary.
Sales Returns
•We estimate a reserve for future product returns based on several factors, including local returns policies and practices, historical returns as a percentage of revenue, an understanding of the reasons for past returns, estimated shelf life by product and estimates of the amount of time between shipment and return. Reserves for sales returns are estimated and recorded as a reduction to revenue and as a liability in the same period as the underlying revenue is recognized to arrive at net product sales.
Payment terms differ by jurisdiction and customer, but typically range from 30 to 120 days from date of shipment in most of our major jurisdictions. Revenue for our product sales has not been adjusted for the effects of a financing component, as we expect the period between when we transfer control of the product and when we receive payment will be one year or less. Any exceptions are either not material or we collect interest for payments made after the due date. Shipping and handling activities are considered fulfillment activities and are not considered to be a separate performance obligation. We exclude from the measurement of the transaction price all taxes assessed by a governmental authority that are imposed on our sales of product and collected from a customer.
Allowance for Doubtful Accounts
We provide for an allowance for doubtful accounts, which represents our best estimate of expected lifetime credit losses inherent in our accounts and other receivables portfolios. Our estimates include a continuing credit evaluation of customers' financial condition, trade accounts and other receivables aging and historical loss experience, as well as reasonable and supportable forecasts of future economic conditions. As of December 31, 2024 and 2023, we had an allowance for doubtful accounts of $13 million and $18 million, respectively.
Inventories
We state all inventories at the lower of cost and net realizable value. We value a majority of our inventories using the first-in-first-out (FIFO) method, although at December 31, 2024 and 2023, $301 million and $295 million, respectively, of our total inventories were valued using the last-in, first-out (LIFO) method.
Research and Development Expenses
Research and development (R&D) costs are expensed as incurred and relate to the effort associated with the discovery of new knowledge that will be useful in developing a new product or in significantly improving an existing product and the implementation of research findings. R&D costs include, but are not limited to, compensation and benefits, facilities and overhead expenses, clinical trial expenses and fees paid to contract research organizations.
We may also enter into licensing arrangements with third parties to acquire the rights to in-process R&D (IPR&D). These arrangements typically do not meet the definition of a business combination. In such arrangements, prior to regulatory approval of a product, we record upfront and milestone payments to third parties as expense when the event requiring the upfront or milestone payment occurs.
Goodwill and Indefinite-lived Intangible Assets
Goodwill represents the excess of the consideration transferred in a business combination over the assigned fair value of the net assets of the acquired business. Goodwill is not amortized, but is reviewed at least annually for impairment during the fourth quarter, or more frequently if there is a significant change in events or circumstances that indicate the fair value of our single reporting unit is more likely than not less than its carrying amount (a "triggering event"). When required, a comparison of fair value to the carrying amount of our single reporting unit is performed to determine the amount of impairment, if any. We begin by assessing qualitative factors to determine whether it is more likely than not that the fair value of our single reporting unit is less than its carrying value. Based on that qualitative assessment, if we conclude it is more likely than not that the fair value of our single reporting unit is less than its carrying value, we conduct a quantitative goodwill impairment test, which involves comparing the estimated fair value of our single reporting unit to its carrying value, including goodwill. We estimate the fair value of our single reporting unit using an income approach, which is a valuation technique that provides an estimate of the fair value of an asset based on market participant expectations of the cash flows an asset would generate over its remaining useful life. If the carrying value of the reporting unit exceeds its estimated fair value, we recognize an impairment loss for the difference.
The income approach represents a Level 3 fair value measurement in the fair value hierarchy (see Note 10. Fair Value for further information). When a quantitative goodwill impairment test is required, significant management judgment is involved in estimating our single reporting unit’s fair value, including in the creation of forecasts of future operating results to be used in the income approach valuation. These significant judgments include, but are not limited to, estimates and assumptions regarding our future cash flows, revenue growth rates, profitability measures such as gross margin and earnings before interest, taxes, depreciation and amortization (EBITDA) margin and the determination of an appropriate discount rate.
Similar to goodwill, indefinite-lived intangible assets, which primarily represent IPR&D acquired from prior business combinations, are not amortized, but rather are reviewed annually for impairment during the fourth quarter, or more frequently in the event of a triggering event. We utilize an income approach for determining the estimated fair value of indefinite-lived intangible assets upon acquisition and as needed for our evaluations of potential impairment. For valuation of IPR&D assets, we apply a probability weighting that considers the risk of development and commercialization to the estimated future net cash flows from the asset. These projections are based on factors such as relevant market size, patent protection, historical pricing of similar products and expected industry trends. The estimated future net cash flows are then discounted to present value using an appropriate discount rate. Acquired IPR&D assets are treated as indefinite-lived intangible assets until completion or abandonment of the projects, at which time the assets are tested for impairment and, if not impaired, are transferred to marketed products (see Other Long-Lived Assets discussion below) and amortized over their estimated economic life.
Other Long-lived Assets
We have a substantial amount of long-lived assets on our consolidated balance sheets related to both property and equipment and finite-lived intangible assets.
Property and equipment:
•Property and equipment assets are stated at cost less accumulated depreciation. Assets placed in service are recorded at cost and depreciated using the straight-line method over the estimated useful life of the asset (12 to 50 years for buildings and 3 to 25 years for equipment), except for leasehold improvements, which are depreciated over the shorter of their economic useful life or their remaining lease term. Repair and maintenance costs that do not extend the useful life of the asset are expensed as incurred. Major replacements and significant improvements that either increase asset values or extend useful lives are capitalized. We assess the recoverability of the carrying value of the property and equipment asset or asset group whenever events or changes in circumstances indicate the carrying amount may not be fully recoverable. When such indications of a potential impairment exist, we compare the projected undiscounted cash flows to be generated by the asset (or asset group) to its carrying value. If the carrying amount is found to be greater, an impairment charge is recorded equal to the excess of the asset's carrying value over its fair value. In such an event, we also re-evaluate the remaining useful lives of the assets (or asset groups) and modify them, as appropriate.
Finite-lived intangible assets:
•Finite-lived intangible assets primarily relate to marketed products acquired or licensed from third parties and software. Marketed products consist of the amortized cost of the rights to assets acquired in business combinations and approved for marketing in a significant global jurisdiction. The cost basis of marketed products includes both the initial assigned IPR&D value, as well as any associated milestone payments subsequent to the marketed products receiving regulatory approval in a significant global jurisdiction. Software consists of certain costs incurred in connection with obtaining or developing internal-use software, including payroll and payroll-related costs for employees directly associated with the internal-use software projects and direct costs of external resources. Other finite-lived intangible assets consist primarily of the amortized cost of licensed platform technologies, manufacturing technologies and customer relationships. Intangible assets with finite lives are capitalized and amortized over their estimated economic lives, typically ranging from 3 to 20 years. We assess the recoverability of the carrying value of finite-lived intangible assets in the same manner as property and equipment, as described above.
Financial Instruments
We have various financial instruments to help manage our exposures to market risks, such as changes in foreign currency exchange rates and variable interest rates. We formally assess, designate and document, as a hedge of an underlying exposure, each qualifying derivative instrument that will be accounted for as an accounting hedge at inception. We also assess at least quarterly thereafter whether the financial instruments used in the hedging transaction are effective at offsetting changes in either the fair values or cash flows of the underlying exposures. Derivative cash flows are principally classified in the operating activities section of the consolidated statements of cash flows, consistent with the underlying hedged item. Our financial instruments are recorded at their fair values on our consolidated balance sheets, and we do not offset derivative assets and liabilities. Fair values are estimated based on quoted market values for similar instruments and are classified as Level 2 in the fair value hierarchy. As of December 31, 2024 and 2023, we held the following types of financial instruments:
Derivatives Not Designated as Hedges
•Foreign currency derivatives used for hedging our exposure to fluctuating currency exchange rates are put in place using the same or like currencies and duration as the underlying exposures and are recorded at fair value, with the gain or loss recognized in other expense, net in the consolidated statements of operations. These instruments generally have maturities not exceeding 12 months.
Derivatives Designated as Hedges – Net investment hedges
•Cross-currency fixed interest rates swaps determined to be effective economic hedges of net investments in foreign denominated net assets are designated as net investment hedges. Gains or losses on our net investment hedges due to spot rate fluctuations are recorded as cumulative translation adjustments as a component of other comprehensive income (loss). Gains and losses will remain in accumulated other comprehensive income (loss) until either the sale or substantial liquidation of the hedged subsidiary.
Derivatives Designated as Hedges – Interest rate swaps
•Interest rate swap contracts are used to effectively convert a portion of our variable-rate debt into fixed-rate debt. Differences between the variable interest rate payments and the fixed interest rate settlements with the swap counterparties are recorded as an adjustment to interest expense, net of capitalized interest over the life of the swaps. Changes in the fair value of interest rate swaps are recognized in other comprehensive income (loss) and reclassified into earnings through interest expense, net of capitalized interest at the time earnings are affected by the hedged transaction.
Advertising Expenses
Costs associated with advertising, including costs for TV, radio and other electronic media and publications, are generally expensed when the related advertising occurs, and are included in marketing, selling and administrative expenses in the consolidated statements of operations. Advertising expenses for the years ended December 31, 2024, 2023 and 2022, approximated $236 million, $207 million and $201 million, respectively.
Foreign Currency Translation
Operations in our subsidiaries outside the U.S. are recorded in the functional currency of each subsidiary, which is determined by a review of the environment where each subsidiary primarily generates and expends cash. The results of operations for our subsidiaries outside the U.S., where the U.S. dollar is not the functional currency, are translated from functional currencies into U.S. dollars using the exchange rates in effect as of the date of the transactions, or a reasonable approximation thereof, such as the weighted-average currency rate for the period. Assets and liabilities are translated using the period-end exchange rates. The U.S. dollar effects that arise from translating the net assets of these subsidiaries are recorded in other comprehensive income (loss).
Foreign currency transaction gains and losses are due to the effect of exchange rate changes on transactions denominated in currencies other than a subsidiary's functional currency and are recognized in other expense, net, in the consolidated statements of operations in the period incurred. Transaction losses of $12 million, $40 million and $28 million were recorded during the years ended December 31, 2024, 2023 and 2022, respectively.
We generally identify hyperinflationary markets as those markets whose cumulative inflation rate over a three-year period exceeds 100%. Translation adjustments resulting from the application of hyperinflationary accounting are also recognized in other expense, net, in the consolidated statements of operations in the period incurred.
Recently Adopted Accounting Pronouncements
In November 2023, the FASB issued ASU 2023-07, Segment Reporting (Topic 280): Improvements to Reportable Segment Disclosures, which is intended to improve disclosures related to reportable segments, primarily through enhanced disclosures about significant segment expenses that are regularly provided to the chief operating decision maker for purposes of assessing a segment's profit or loss and deciding how to allocate resources. This new standard applies to all public entities, including entities like us with a single reportable segment. We adopted this standard for the year ended December 31, 2024, on a retrospective basis. See Note 19. Business Segment Information for further details.
Recently Issued Accounting Pronouncements
In December 2023, the FASB issued ASU 2023-09, Income Taxes (Topic 740): Improvements to Income Tax Disclosures, which is intended to enhance the transparency and usefulness of income tax disclosures by providing incremental and disaggregated income tax disclosures pertaining to the effective tax rate reconciliation and income taxes paid by jurisdiction. This standard is effective for fiscal years beginning after December 31, 2024, with early adoption permitted. The standard allows for prospective or retrospective application upon adoption. We are currently assessing the impact ASU 2023-09 will have on our consolidated financial statements, including our Income Taxes footnote disclosure.
In November 2024, the FASB issued ASU 2024-03, Income Statement—Reporting Comprehensive Income—Expense Disaggregation Disclosures (Subtopic 220-40): Disaggregation of Income Statement Expenses, which is intended to provide more detailed and disaggregated information about significant expense categories, such as purchases of inventory, employee compensation, depreciation and amortization and selling expenses. This new standard, including related updates, is effective for fiscal years beginning after December 15, 2026, and interim periods within fiscal years beginning after December 15, 2027. Early adoption is permitted, and the amendments may be applied either prospectively or retrospectively. We are currently assessing the impact ASU 2024-03 will have on our consolidated financial statements, including our footnote disclosures.
Other Significant Accounting Policies
Our other significant accounting policies are described in the remaining appropriate notes to the consolidated financial statements.
Note 3. Revenue
The following table summarizes the activity in our global sales rebates and discounts liability for the years ended December 31:
| | | | | | | | | | | | | | |
| | |
| | 2024 | | 2023 |
| Beginning balance | | $ | 367 | | | $ | 324 | |
| Reduction of revenue | | 799 | | | 722 | |
| Payments | | (824) | | | (683) | |
| Foreign currency translation adjustments | | (10) | | | 4 | |
| Ending balance | | $ | 332 | | | $ | 367 | |
Adjustments to revenue recognized as a result of changes in estimates during the years ended December 31, 2024, 2023 and 2022, for product shipped in previous periods were not material. Actual global product returns approximated 1% of net revenue in each of the years ended December 31, 2024, 2023 and 2022.
Disaggregation of Revenue
The following table summarizes our revenue disaggregated by product category for the years ended December 31:
| | | | | | | | | | | | | | | | | | | | |
| | 2024 | | 2023 | | 2022 |
| Pet Health | | $ | 2,143 | | | $ | 2,104 | | | $ | 2,138 | |
| Farm Animal: | | | | | | |
| Cattle | | 1,007 | | | 949 | | | 944 | |
| Poultry | | 796 | | | 765 | | | 716 | |
| Swine | | 366 | | | 382 | | | 384 | |
| Aqua | | 81 | | | 175 | | | 175 | |
| Total Farm Animal | | 2,250 | | | 2,271 | | | 2,219 | |
Contract Manufacturing and Other (1) | | 46 | | | 42 | | | 54 | |
| Revenue | | $ | 4,439 | | | $ | 4,417 | | | $ | 4,411 | |
(1)Represents revenue from arrangements in which we manufacture products on behalf of a third party and royalty revenue.
The following table summarizes our revenue disaggregated by geographic area for the years ended December 31:
| | | | | | | | | | | | | | | | | | | | |
| | 2024 | | 2023 | | 2022 |
| United States | | $ | 2,036 | | | $ | 1,983 | | | $ | 1,965 | |
| International | | 2,403 | | | 2,434 | | | 2,446 | |
| Revenue | | $ | 4,439 | | | $ | 4,417 | | | $ | 4,411 | |
We have a single customer that accounted for approximately 11%, 10% and 11% of revenue for the years ended December 31, 2024, 2023 and 2022, respectively. Product sales with this customer resulted in accounts receivable of $90 million and $78 million as of December 31, 2024 and 2023, respectively.
Note 4. Acquisitions, Divestitures and Other Arrangements
Acquisitions
In November 2024, we acquired a manufacturing facility in Speke, United Kingdom (U.K.), including its workforce and related assets such as inventory and property and equipment (Speke), from a former contract manufacturing supply partner, TriRx Speke Ltd (TriRx Speke). During 2023, we completed the acquisitions of certain U.S. marketed products, pipeline products, inventory and an assembled workforce from NutriQuest, LLC (NutriQuest) and certain assets including inventory and distribution rights for certain marketed products from NutriQuest Nutricao Animal Ltda (NutriQuest Brazil). These transactions were all accounted for as business combinations under the acquisition method of accounting. The acquisition method requires, among other things, that assets acquired and liabilities assumed be recognized at their fair values as of the acquisition date. The determination of estimated fair value requires management to make significant estimates and assumptions. The excess of the purchase price over the fair value of the acquired net assets, where applicable, has been recorded as goodwill.
Speke
Speke was previously owned by Elanco, prior to our sale of it to TriRx Speke in February 2022 (see below discussion within the Divestitures section of this footnote). Concurrent with this initial sale of the facility to TriRx Speke, we entered into a long-term supply agreement with them for a number of farm animal product lines. In September 2024, TriRx Speke entered into trading administration, a formal insolvency process in the U.K., and on November 15, 2024, we acquired Speke for $36 million in order to minimize supply disruption for our impacted product lines. The purchase price included $25 million in cash paid at closing and our forgiveness of $11 million related to a loan made to support the interim funding of the site during the trading administration period.
The following table summarizes the fair values of assets acquired as of the acquisition date:
| | | | | |
| |
| Inventories | $ | 20 | |
| Prepaid expenses and other | 2 | |
| Property and equipment | 14 | |
| |
| |
| |
| |
| |
| Total consideration transferred | $ | 36 | |
NutriQuest
On January 3, 2023, we acquired NutriQuest for total purchase consideration of $59 million. NutriQuest is a provider of swine, poultry and cattle nutritional health products to animal producers. This acquisition helped us expand our existing nutritional health offerings and further our efforts to explore innovative antibiotic alternatives. The composition of the purchase price was as follows:
| | | | | | | | |
| Up-front cash consideration | | $ | 16 | |
| Deferred cash consideration paid January 4, 2024 | | 5 | |
| Fair value of contingent consideration | | 38 | |
| Total purchase consideration | | $ | 59 | |
Contingent consideration for this acquisition included up to $85 million of cash consideration payable if specific development, sales and geographic expansion milestones are achieved, as outlined in the asset purchase agreement. The initial fair value of this contingent consideration liability of $38 million was estimated at the acquisition date using a Monte Carlo simulation model, which represented a Level 3 measurement under the fair value measurement hierarchy.
The following table summarizes the fair value of assets acquired as of the acquisition date:
| | | | | |
| |
| Inventories | $ | 3 | |
| Intangible assets: | |
| Marketed products | 29 | |
| Acquired IPR&D | 9 | |
| Other intangible assets | 15 | |
| |
| Total identifiable assets | 56 | |
| Goodwill | 3 | |
| Total consideration transferred | $ | 59 | |
Other intangible assets consisted of customer relationships and trade names. The acquired finite-lived intangible assets are being amortized over a weighted-average useful life of approximately 12 years on a straight-line basis.
NutriQuest Brazil
On August 1, 2023, we acquired NutriQuest Brazil for total purchase consideration of $19 million. The composition of the purchase price included cash paid on the closing date of approximately $3 million, with additional consideration payable through 2026 valued at approximately $16 million, a portion of which is contingent upon the continuation of certain terms and conditions set forth in the asset purchase agreement. The following table summarizes the fair values of assets acquired as of the acquisition date:
| | | | | |
| |
| Inventories | $ | 3 | |
| Finite-lived intangible assets | 15 | |
| |
| |
| |
| |
| Total identifiable assets | 18 | |
| Goodwill | 1 | |
| Total consideration transferred | $ | 19 | |
The acquired finite-lived intangible assets are being amortized over a weighted-average useful life of approximately nine years on a straight-line basis.
Divestitures
Aqua business
On July 9, 2024, we closed the sale of our aqua business to Intervet International B.V., a Dutch subsidiary of Merck Animal Health, for $1,294 million in cash, the vast majority of which was utilized to repay outstanding term loan debt following the close of the transaction (see Note 8. Debt for further information). Our aqua business included products across both warm-water and cold-water species and generated revenues of $81 million in 2024, through the divestiture date, and $175 million in both 2023 and 2022. Given that we operate our business as a single reporting unit, we are unable to reasonably determine stand-alone costs and related earnings or loss before income taxes attributable to our aqua business. We also determined that the sale did not qualify for reporting as a discontinued operation, as it did not represent a strategic shift that will have a major effect on our operations and/or financial results. Assets sold included inventories, real property and equipment, including our manufacturing sites in Canada and Vietnam, and certain intellectual property, technology and other intangible assets, including marketed products. Additionally, approximately 280 commercial and manufacturing employees were transferred to Merck Animal Health as part of this divestiture.
As of the disposal date, the carrying amounts of the following major assets were derecognized from our consolidated balance sheet:
| | | | | |
| Inventories | $ | 43 | |
| Goodwill | 458 | |
| Other intangibles, net | 51 | |
| Property and equipment, net | 68 | |
| Other assets | 14 | |
| Total assets | $ | 634 | |
Based on the aggregate carrying value of our aqua business and $20 million of costs to sell, we recorded a pre-tax gain on divestiture of $640 million. We also recognized income tax expense of approximately $170 million related to the taxable gain. In determining the amount of goodwill to include in our aqua business disposal group, a portion of our single reporting unit’s goodwill was allocated to it on a relative fair value basis by comparing the fair value of the disposal group to the estimated fair value of our single reporting unit as a whole. We estimated the fair value of our single reporting unit using the income approach, which is a valuation technique that provides an estimate of fair value based on market participant expectations of the cash flows an asset would generate over its remaining useful life. Significant management judgment was required in estimating the fair value of our single reporting unit, including, but not limited to, estimates and assumptions regarding future cash flows of our single reporting unit, revenue growth and other profitability measures, such as gross margin and EBITDA margin, and the determination of an appropriate discount rate. We consider this valuation approach to be a Level 3 measurement under the fair value hierarchy.
Microbiome R&D platform carve-out
In April 2022, we signed an agreement to transfer assets associated with our microbiome R&D platform to a newly created, independent biopharmaceutical company, BiomEdit, focused on developing solutions for animal and human health. As part of the agreement, we retained a non-voting, minority stake in the company. Assets transferred included intellectual property and laboratory equipment. During the year ended December 31, 2022, we recorded a gain on disposal of $3 million. In the fourth quarter of 2024, while performing our qualitative assessment for impairment for our equity investments without readily determinable fair value, we determined our retained investment in BiomEdit was impaired and recorded an $8 million charge. Both the 2024 charge and the initial gain on disposal in 2022 were recorded within other expense, net in the consolidated statements of operations.
Shawnee and Speke
In August 2021 and February 2022, we completed the sales of our Shawnee, Kansas and Speke, U.K. sites, respectively, to TriRx Pharmaceuticals (TriRx). We received cash proceeds from the sale of these sites of $13 million from TriRx in 2022 and $66 million, in addition to accrued interest, in February 2024. As discussed above, upon our initial sale of the Speke site to TriRx, we concurrently entered into a long-term supply agreement with their subsidiary, TriRx Speke. Because we determined this supply agreement was on terms favorable to us, we recorded a contract asset associated with it. In 2023, due to a forecasted decline in cash flows associated with this contract asset, we determined the asset was partially impaired, and we recorded a $26 million impairment charge. We impaired the remaining $12 million value of this contract asset when TriRx Speke entered into trading administration in September 2024. These impairment charges were included within asset impairment, restructuring and other special charges within our consolidated statements of operations for the years ended December 31, 2024 and 2023.
BexCaFe Arrangement
In June 2022, we signed a license agreement with BexCaFe, LLC (BexCaFe) for the development and commercialization of products related to Bexacat, an oral treatment intended to reduce glucose levels in diabetic cats. We determined that BexCaFe represented a variable interest entity and that we are the primary beneficiary because the terms of the license give us the power to direct the activities that most significantly impact BexCaFe's economic performance. As a result, we consolidated BexCaFe, a development-stage company with no employees that did not meet the definition of a business, as of the date we signed the license agreement. Upon initial consolidation of BexCaFe, we measured an IPR&D asset at its fair value of $59 million and recorded liabilities totaling $59 million, which included contingent consideration of $49 million based on the fair value of estimated future milestone payments and sales royalties owed under the license agreement. There is no minimum payout due on the contingent consideration and the maximum payout related to sales royalties is unlimited. Remaining contingent consideration liabilities of $32 million were included in other current liabilities and other noncurrent liabilities on our consolidated balance sheet as of December 31, 2024. Since BexCaFe did not meet the definition of a business, no goodwill was recorded, and immediately after initial consolidation, we expensed the IPR&D asset because we concluded it did not have an alternative future use.
Note 5. Asset Impairment, Restructuring and Other Special Charges
In recent years, we have incurred substantial costs associated with restructuring programs and cost-reduction initiatives designed to achieve a flexible and competitive cost structure. Restructuring activities have primarily included charges associated with business and facility rationalizations and workforce reductions. We have also incurred costs associated with executing acquisition, divestiture and other significant transactions and related integration and/or separation activities. Components of asset impairment, restructuring and other special charges for the years ended December 31 were as follows:
| | | | | | | | | | | | | | | | | |
| 2024 | | 2023 | | 2022 |
Restructuring charges (credits) (1) | $ | 44 | | | $ | — | | | $ | (7) | |
| | | | | |
Acquisition and divestiture-related charges(2) | 18 | | | 93 | | | 105 | |
| | | | | |
| Non-cash and other items: | | | | | |
Asset impairment (3) | 81 | | | 32 | | | 81 | |
| Other special charges | 7 | | | 2 | | | 4 | |
| | | | | |
| Total expense | $ | 150 | | | $ | 127 | | | $ | 183 | |
(1)Restructuring charges in 2024 primarily related to cash-based severance costs associated with a restructuring program approved and announced in February 2024 intended to reallocate resources by shifting international resources from farm animal to pet health. This restructuring program also resulted in changes in how we operate in and sell into the Argentina market, among others.
(2)Acquisition and divestiture-related charges in 2024 consisted of transaction costs directly related to the divestiture of our aqua business (see Note 4. Acquisitions, Divestitures and Other Arrangements for further information). Acquisition and divestiture-related charges in 2023 and 2022 primarily represented costs associated with the implementation of new systems, programs and processes due to the integration of Bayer Animal Health.
(3)Asset impairments in 2024 principally included the write-off of our IL-4R IPR&D asset ($53 million) and $15 million of asset impairments tied to the financial difficulties of TriRx Speke, the largest of which was a $12 million impairment of a contract asset related to a favorable supply agreement (see Note 4. Acquisitions, Divestitures and Other Arrangements for further information). Asset impairments in 2023 principally included a $26 million partial write-down of the contract asset with TriRx Speke. Asset impairments during 2022 included a charge of $59 million related to the write-off of an IPR&D asset with no alternative future use licensed from BexCaFe and a $22 million charge related to the finalization of the write-down upon the sale of our Speke, U.K. site to TriRx.
The following table summarizes the activity in our reserves established in connection with restructuring activities:
| | | | | | | | | |
| | | | | |
| Balance at December 31, 2022 | | | $ | 36 | | | |
| | | | | |
| | | | | |
| | | | | |
| Cash paid | | | (29) | | | |
| | | | | |
| Balance at December 31, 2023 | | | 7 | | | |
| Charges | | | 44 | | | |
| Cash paid | | | (32) | | | |
| Non-cash items and other | | | (3) | | | |
| Balance at December 31, 2024 | | | $ | 16 | | | |
Timing of when the restructuring reserve obligations are expected to be paid can vary due to certain country-specific negotiations and regulations. Of the total reserve, $9 million was included within other current liabilities on our consolidated balance sheet at December 31, 2024, with the remainder included within other noncurrent liabilities.
Note 6. Inventories
Inventories at December 31 consisted of the following:
| | | | | | | | | | | |
| 2024 | | 2023 |
| Finished products | $ | 754 | | | $ | 857 | |
| Work in process | 783 | | | 814 | |
| Raw materials and supplies | 98 | | | 128 | |
| Total | 1,635 | | | 1,799 | |
| Decrease to LIFO cost | (61) | | | (64) | |
| Inventories | $ | 1,574 | | | $ | 1,735 | |
Note 7. Equity
Elanco had 5.0 billion ordinary shares authorized, with approximately 494.4 million issued and outstanding as of December 31, 2024. Elanco also had 1.0 billion preferred shares, no par value, authorized (with none issued or outstanding) as of December 31, 2024.
Tangible Equity Unit (TEU) Offering
In January 2020 we issued 11 million in TEUs at the stated amount of $50 per unit. The TEU prepaid stock purchase contracts were converted into shares of our common stock on February 1, 2023. Holders of our TEUs received 1.5625 shares of our common stock based on the maximum settlement rate for the applicable market value being below $32.00. In total, we issued approximately 17 million shares to holders in connection with the settlement.
Note 8. Debt
Long-term debt as of December 31 consisted of the following:
| | | | | | | | | | | |
| 2024 | | 2023 |
| Incremental Term Facility due 2025 | $ | — | | | $ | 175 | |
| Incremental Term Facility due 2028 | 370 | | | 489 | |
| Incremental Term Facility due 2029 | 187 | | | 247 | |
| Incremental Term Facility due 2031 | 349 | | | — | |
| Term Loan B due 2027 | 2,593 | | | 3,838 | |
| Revolving Credit Facility | — | | | 200 | |
| Securitization Facility | 100 | | | 125 | |
4.900% Senior Notes due 2028 (1) | 750 | | | 750 | |
| | | |
| Unamortized debt issuance costs | (28) | | | (50) | |
| 4,321 | | | 5,774 | |
| Less current portion of long-term debt | 44 | | | 38 | |
| Total long-term debt | $ | 4,277 | | | $ | 5,736 | |
(1)Subsequent to issuance in August 2018, our 4.900% Senior Notes due 2028 have been subject to interest rate increases related to credit rating agency downgrades. As of December 31, 2024, these notes bear interest at a rate of 6.650%.
Term Loan B due 2027 and Revolving Credit Facility
In 2020, we entered into our Term Loan B due 2027 facility, which bears interest at a floating rate of Term SOFR plus 175 basis points and is payable in quarterly installments through its maturity on August 1, 2027. We simultaneously entered into our Revolving Credit Facility, which provides us with a source of liquidity for certain operating activities and for additional flexibility to finance capital investments, business development activities, repayments of debt and other cash requirements. On July 3, 2024, we amended our Revolving Credit Facility, which extended its maturity through July 2029. Our Revolving Credit Facility provides up to $750 million in borrowing capacity and bears interest at Term SOFR plus a spread, dependent on our Net Total Leverage Ratio, as defined within the amended agreement, which was 1.60% at December 31, 2024. Our Term Loan B due 2027 and Revolving Credit Facility are secured by a significant portion of our assets.
There are two financial maintenance covenants which are solely for the benefit of the lenders under our Revolving Credit Facility. There are no financial maintenance covenants for the benefit of our Term Loan B due 2027, and the lenders under our Term Loan B due 2027 have no enforcement rights with respect to the financial maintenance covenants for our Revolving Credit Facility. The first financial maintenance covenant for our Revolving Credit Facility
requires us to maintain a net total leverage ratio level (which is not subject to step-downs) as of the end of each quarter. The required level of this covenant is based on closing date pro forma net leverage and pro forma adjusted EBITDA not to exceed 7.71 to 1.00 of our pro forma adjusted EBITDA for the preceding four fiscal quarters. The second financial maintenance covenant for the Revolving Credit Facility requires us to maintain a ratio of pro forma adjusted EBITDA to cash interest expense of no less than 2.00 to 1.00, tested as of the end of each fiscal quarter. We were in compliance with all of our debt covenants as of December 31, 2024.
During the year ended December 31, 2024, we repaid $1,245 million on our Term Loan B due 2027 and $200 million on our Revolving Credit Facility, primarily utilizing the proceeds from the divestiture of our aqua business in July 2024 (see Note 4. Acquisitions, Divestitures and Other Arrangements for further information), as well as cash generated by operations. In conjunction with these principal repayments, as well as principal payments made on our Incremental Term Facilities (see below for further details), we recognized charges of $12 million for the write-off of previously deferred financing costs, which were included in interest expense, net of capitalized interest in the consolidated statement of operations for the year ended December 31, 2024.
Incremental Term Facilities
Incremental Term Facility due 2028: Our Incremental Term Facility due 2028 bears interest at Term SOFR plus 175 basis points and is payable in quarterly installments of principal and interest with a final balloon payment due at scheduled maturity on August 12, 2028. During the year ended December 31, 2024, we repaid $119 million on our Incremental Term Facility due 2028, primarily utilizing the proceeds from the divestiture of our aqua business in July 2024. The terms of the Incremental Term Facility due 2028 are generally consistent with the terms of our Term Loan B due 2027 and Revolving Credit Facility.
Incremental Term Facility due 2029: Our Incremental Term Facility due 2029 bears interest at Term SOFR, including a credit spread adjustment, plus 175 basis points and is payable in quarterly installments of principal and interest with a final balloon payment due at scheduled maturity on April 19, 2029. During the year ended December 31, 2024, we repaid $60 million on our Incremental Term Facility due 2029, primarily utilizing the proceeds from the divestiture of our aqua business in July 2024. The terms of the Incremental Term Facility due 2029 are generally consistent with the terms of our Term Loan B due 2027 and Revolving Credit Facility.
Incremental Term Facility due 2031: On August 13, 2024, we entered into an incremental assumption agreement, supplementing and amending our existing credit agreement dated August 1, 2020, related to our senior secured credit facility. The incremental assumption agreement provides for an incremental term facility (the Incremental Term Facility due 2031) with an aggregate principal amount of $350 million and is scheduled to mature on August 13, 2031. The Incremental Term Facility due 2031 bears interest at Term SOFR, including a spread adjustment, plus 175 basis points and will be payable in quarterly installments of principal and interest with a final balloon payment due on August 13, 2031. The proceeds were used to repay the remaining outstanding balance on our Incremental Term Facility due 2025 and for general corporate purposes. Accordingly, upon repayment all obligations and commitments related to the Incremental Term Facility due 2025 were satisfied in full. The terms of the Incremental Term Facility due 2031, including pledged collateral and financing maintenance covenants, are generally consistent with the terms of our Term Loan B due 2027 and Revolving Credit Facility.
Securitization Facility
In August 2023, we entered into a secured term facility (the Securitization Facility), which is secured and collateralized by our U.S. accounts receivable, subject to certain adjustments (defined as the Net Eligible Receivables Balance within the applicable agreement). The terms of the agreement result in an amount of our U.S. accounts receivable, equivalent to the outstanding balance of the Securitization Facility at any point in time, being pledged to the lender as collateral for the borrowings. Our borrowing capacity under our Securitization Facility is subject to monthly fluctuation, based on the level of our borrowing base as reported to the lender, which is correlated to our U.S. Net Eligible Receivables Balances, with a maximum borrowing capacity not to exceed $300 million. The Securitization Facility requires monthly interest payments over its term at a variable rate based on Term SOFR plus 125 basis points. The full, outstanding balance of the Securitization Facility is due on July 31, 2026. The Securitization Facility includes various covenants specific to the underlying composition of our U.S. accounts receivables portfolio, all of which we were in compliance with as of December 31, 2024. During the year ended December 31, 2024, we repaid $25 million on our Securitization Facility.
Senior Notes
In August 2018, we issued $750 million of 4.272% Senior Notes due August 28, 2023 and $750 million of 4.900% Senior Notes due August 28, 2028. In April 2022, we completed a tender offer and retired $406 million in aggregate principal amount of our 4.272% Senior Notes due 2023, resulting in a debt extinguishment loss of approximately $17 million, which was recognized in interest expense, net of capitalized interest in the consolidated statements of operations. On August 7, 2023, we redeemed in full the remaining outstanding 4.272% Senior Notes due 2023.
The interest rate payable on the 4.900% Senior Notes due 2028 is subject to adjustment in the event of credit rating agency downgrades, which last occurred in April 2023. The indenture that governs these senior notes contains
covenants that limit our ability to incur liens or engage in sale-leaseback transactions. The indenture also contains restrictions on our ability to consolidate, merge or sell substantially all of our assets, in addition to other customary terms. We were in compliance with all such covenants under the indenture governing the 4.900% Senior Notes due 2028 as of December 31, 2024.
Scheduled Repayments
Future required principal payments on our outstanding indebtedness for each of the next five years and thereafter, as of December 31, 2024, were as follows:
| | | | | | | | |
| | |
| 2025 | | $ | 54 | |
| 2026 | | 154 | |
| 2027 | | 2,518 | |
| 2028 | | 1,111 | |
| 2029 | | 180 | |
| 2030 and thereafter | | 332 | |
| Total obligations and commitments | | 4,349 | |
| Unamortized debt issuance costs | | (28) | |
| Total debt | | $ | 4,321 | |
As of December 31, 2024, approximately 82% of our long-term indebtedness bore interest at a fixed rate, including variable-rate debt converted to fixed-rate through the use of interest rate swaps (see Note 9. Financial Instruments for further information).
Cash payments for interest during the years ended December 31 were as follows:
| | | | | | | | | | | | | | | | | |
| 2024 | | 2023 | | 2022 |
Interest paid (1) | $ | 296 | | | $ | 379 | | | $ | 266 | |
(1)Reflected within the above totals are $31 million and $4 million of cash interest received from our net investment hedges during the years ended December 31, 2024 and 2023, respectively. See Note 9. Financial Instruments for further information on our net investment hedges.
Note 9. Financial Instruments
To manage our exposure to market risks, such as changes in foreign currency exchange rates and variable interest rates, we have entered into various derivative transactions. Our outstanding positions are discussed below.
Derivatives Not Designated as Hedges
We may enter into foreign currency exchange forward or option contracts to reduce the effects of fluctuating currency exchange rates. As of December 31, 2024 and 2023, we had outstanding foreign currency exchange contracts with aggregate notional amounts of $1,016 million and $891 million, respectively. The amounts of net gains (losses) on our derivative instruments not designated as hedging instruments, recorded in other expense, net for the years ended December 31, were as follows:
| | | | | | | | | | | | | | | | | |
| |
| 2024 | | 2023 | | 2022 |
Foreign exchange forward contracts (1) | $ | (22) | | | $ | 7 | | | $ | (12) | |
(1)These amounts were substantially offset in other expense, net by the effect of changing exchange rates on the underlying foreign currency exposures.
Derivatives Designated as Hedges – Net investment hedges
As of December 31, 2024 and 2023, we had a series of cross-currency fixed interest rate swaps to help mitigate the impact of currency fluctuations on our operations in Switzerland with a combined 1,000 million CHF notional amount with tenors in 2026 and 2027. These instruments were determined to be, and were designated as, effective economic hedges of net investments in our CHF denominated net assets. The amount of gains (losses) on net investment hedges, net of tax, recorded in accumulated other comprehensive loss for the years ended December 31, were as follows:
| | | | | | | | | | | | | | | |
| |
| 2024 | | 2023 | | | | |
| Cross-currency fixed interest rate swaps | $ | 59 | | | $ | (72) | | | | | |
For the years ended December 31, 2024 and 2023, these instruments also generated $31 million and $9 million of interest income, respectively, which was included as a contra interest expense, net of capitalized interest in our consolidated statements of operations. In January 2025, we took advantage of market opportunities to restructure our net investment hedges, paying $10 million to early settle these instruments while also collecting $5 million of accrued interest. We simultaneously entered into new cross-currency fixed interest rate swaps with the same
1,000 million CHF notional amounts and covering the same tenors. The new instruments were determined to be, and have been designated as, effective economic hedges of net investments in our CHF denominated net assets.
Derivatives Designated as Hedges – Interest rate swaps
We had outstanding interest rate swaps with aggregate notional amounts of $2,800 million and $3,800 million as of December 31, 2024 and 2023, respectively. Following the sale of our aqua business and the associated debt pay down (see Note 4. Acquisitions, Divestitures and Other Arrangements and Note 8. Debt for further information), in July 2024 we settled $1,000 million of existing interest rate swaps. We received cash proceeds of approximately $5 million upon these settlements, which was recorded in accumulated other comprehensive loss and will be amortized to interest expense, net of capitalized interest in future periods. As of December 31, 2024, all of our outstanding interest rate swap instruments had scheduled maturities in 2026.
Additionally, in August 2024 we entered into new forward-starting interest rate swap agreements with a combined notional amount of $850 million, which will become effective on August 1, 2026, and mature in line with the applicable Incremental Term Facility maturities, which range between 2028 and 2031.
The amounts of gains on interest rate swap contracts, net of tax, recorded in accumulated other comprehensive loss for the years ended December 31, were as follows:
| | | | | | | | | | | | | | | | | |
| |
| 2024 | | 2023 | | 2022 |
| Forward-starting interest rate swaps | $ | 84 | | | $ | — | | | $ | 209 | |
The amounts of gains reclassified out of accumulated other comprehensive loss and recognized into earnings through interest expense, net of capitalized interest for the years ended December 31, were as follows:
| | | | | | | | | | | | | | | | | |
| |
| 2024 | | 2023 | | 2022 |
| Forward-starting interest rate swaps | $ | 104 | | | $ | 125 | | | $ | 35 | |
Over the next 12 months, we expect to reclassify a gain of $29 million out of accumulated other comprehensive loss and into interest expense, net of capitalized interest related to our interest rate swaps.
At various points throughout 2023 and 2022, we restructured our interest rate swap portfolio by unwinding certain existing swaps and simultaneously entering into new agreements with the same notional amounts and tenors. As a result, we received aggregate cash settlement proceeds of $57 million and $207 million in 2023 and 2022, respectively, which were included in net cash provided by operating activities in the consolidated statements of cash flows. Additionally, as a result of one of the 2022 interest rate swap settlements, we reclassified $17 million of a stranded tax benefit from accumulated other comprehensive loss to income tax expense, based on our policy to reclassify income tax effects from accumulated other comprehensive loss using the portfolio approach.
As of December 31, 2024, when factoring in the impact from our interest rate swaps, the weighted-average effective interest rate on our outstanding indebtedness was 6.27% (excluding the expected future reclassifications to interest expense, net of capitalized interest related to past interest rate swap settlements).
Note 10. Fair Value
Fair value is defined as the exchange price that would be received to sell an asset or paid to transfer a liability (an exit price) in the principal or most advantageous market for the asset or liability in an orderly transaction between market participants on the measurement date. Fair value measurements are based on a framework that utilizes the inputs market participants use to determine the fair value of an asset or liability and establishes a fair value hierarchy to prioritize those inputs. Level 1 fair value measurements are based on quoted prices in active markets for identical assets or liabilities. We determine our Level 2 fair value measurements based on a market approach using quoted market values or significant other observable inputs for identical or comparable assets or liabilities. Our Level 3 fair value measurements are based on unobservable inputs based on little or no market activity. As of December 31, 2024 and 2023, liabilities measured using Level 3 inputs consisted of contingent consideration liabilities stemming from our acquisitions of NutriQuest and NutriQuest Brazil in 2023 (see Note 4. Acquisitions, Divestitures and Other Arrangements for further information). The fair values of these liabilities were estimated using a Monte Carlo simulation model, consisting of inputs not observable in the market, including estimates relating to revenue forecasts, discount rates and volatility.
The following table summarizes the fair value information at December 31, 2024 and 2023, for assets and liabilities measured at fair value on a recurring basis in the respective balance sheet line items, as well as long-term debt, for which fair value is disclosed on a recurring basis:
| | | | | | | | | | | | | | | | | | | | | | | | | | | | | | | | |
| | | | | Fair Value Measurements Using | | |
| Financial statement line item | | Carrying Amount | | Quoted Prices in Active Markets for Identical Assets (Level 1) | | Significant Other Observable Inputs
(Level 2) | | Significant Unobservable Inputs
(Level 3) | | Fair Value |
| December 31, 2024 | | | | | | | | | | |
| Recurring fair value measurements | | | | | | | | | | |
| Prepaid expenses and other - derivative instruments | | $ | 32 | | | $ | — | | | $ | 32 | | | $ | — | | | $ | 32 | |
| | | | | | | | | | |
| | | | | | | | | | |
| Other current liabilities - derivative instruments | | (54) | | | — | | | (54) | | | — | | | (54) | |
| Other current liabilities - contingent consideration | | (21) | | | — | | | — | | | (21) | | | (21) | |
| Other noncurrent liabilities - derivative instruments | | (18) | | | — | | | (18) | | | — | | | (18) | |
| Other noncurrent liabilities - contingent consideration | | (16) | | | — | | | — | | | (16) | | | (16) | |
| Financial instruments not carried at fair value | | | | | | | | | | |
| Long-term debt, including current portion | | (4,349) | | | — | | | (4,362) | | | — | | | (4,362) | |
| | | | | | | | | | |
| December 31, 2023 | | | | | | | | | | |
| Recurring fair value measurements | | | | | | | | | | |
| Prepaid expenses and other - derivative instruments | | $ | 65 | | | $ | — | | | $ | 65 | | | $ | — | | | $ | 65 | |
| | | | | | | | | | |
| | | | | | | | | | |
| Other current liabilities - derivative instruments | | (63) | | | — | | | (63) | | | — | | | (63) | |
| Other current liabilities - contingent consideration | | (9) | | | — | | | — | | | (9) | | | (9) | |
| Other noncurrent liabilities - derivative instruments | | (132) | | | — | | | (132) | | | — | | | (132) | |
| Other noncurrent liabilities- contingent consideration | | (31) | | | — | | | — | | | (31) | | | (31) | |
| Financial instruments not carried at fair value | | | | | | | | | | |
| Long-term debt, including current portion | | (5,824) | | | — | | | (5,825) | | | — | | | (5,825) | |
Cash and cash equivalents include cash on hand and all highly liquid investments with original maturities at the time of purchase of three months or less. The carrying values of cash and cash equivalents, accounts and other receivables, accounts payable, employee compensation and other current liabilities are a reasonable estimate of their fair values due to the short-term nature of these assets and liabilities. We also had investments without readily determinable fair values and equity method investments, which were classified as other noncurrent assets on the consolidated balance sheets totaling $17 million and $26 million as of December 31, 2024 and 2023, respectively. These investments are not recorded at fair value on a recurring basis, and as such, are not included in the fair value table above.
Note 11. Goodwill and Intangibles
Goodwill
The following table summarizes the changes in the carrying amount of goodwill:
| | | | | |
| December 31, 2022 | $ | 5,993 | |
| Acquisitions | 4 | |
| Impairment charge | (1,042) | |
| Foreign currency translation | 139 | |
| December 31, 2023 | 5,094 | |
| |
Divestiture(1) | (458) | |
| |
| Foreign currency translation and other adjustments | (222) | |
| December 31, 2024 | $ | 4,414 | |
(1)We derecognized $458 million of goodwill in connection with the divestiture of our aqua business in July 2024. See Note 4. Acquisitions, Divestitures and Other Arrangements for further information.
As previously disclosed, due to the sharp increase in long-term treasury rates during the third quarter of 2023, we assessed our long-lived assets, including goodwill, for impairment, concluding that a triggering event existed. Due
principally to an increased discount rate assumption, which was driven by the increase in long-term treasury rates, our quantitative goodwill impairment test resulted in a $1,042 million pre-tax impairment charge. No impairments to the carrying value of goodwill were recorded during either of the years ended December 31, 2024 or 2022.
While no goodwill impairment charges were recorded during 2024, future changes in our discount rate, whether driven by increases in long-term treasury rates or other factors, or future changes in other significant assumptions or the use of alternative estimates and assumptions, could have a significant impact on the estimated fair value of our reporting unit, exposing us to future goodwill impairment losses.
Other Intangible Assets
The gross amount of intangible assets and related accumulated amortization, as of December 31, were as follows:
| | | | | | | | | | | | | | | | | | | | | | | | | | | | | | | | | | | | | | |
| | 2024 | | 2023 |
| Description | | Carrying Amount, Gross | | Accumulated Amortization | | Carrying Amount, Net | | Carrying Amount, Gross | | Accumulated Amortization | | Carrying Amount, Net |
| Finite-lived intangible assets: | | | | | | | | | | | | |
| Marketed products | | $ | 6,402 | | | $ | (3,151) | | | $ | 3,251 | | | $ | 6,947 | | | $ | (2,982) | | | $ | 3,965 | |
| | | | | | | | | | | | |
| Software | | 260 | | | (144) | | | 116 | | | 257 | | | (111) | | | 146 | |
| Other | | 52 | | | (29) | | | 23 | | | 71 | | | (35) | | | 36 | |
| Total finite-lived intangible assets | | 6,714 | | | (3,324) | | | 3,390 | | | 7,275 | | | (3,128) | | | 4,147 | |
| Indefinite-lived intangible assets: | | | | | | | | | | | | |
| Acquired IPR&D | | 283 | | | — | | | 283 | | | 339 | | | — | | | 339 | |
| Trade names | | 8 | | | — | | | 8 | | | 8 | | | — | | | 8 | |
| Total intangible assets: | | $ | 7,005 | | | $ | (3,324) | | | $ | 3,681 | | | $ | 7,622 | | | $ | (3,128) | | | $ | 4,494 | |
Intangible assets with finite lives are capitalized and amortized over their estimated economic lives. As of December 31, 2024, the remaining weighted-average amortization periods for finite-lived intangible assets were as follows:
| | | | | | | | |
| | Weighted-Average Life (Years) |
| Marketed products | | 7 |
| Software | | 5 |
| Other | | 6 |
The estimated amortization expense for each of the next five years associated with our finite-lived intangible assets, as of December 31, 2024, is as follows:
| | | | | | | | | | | | | | | | | | | | | | | | | | | | | | | | |
| | 2025 | | 2026 | | 2027 | | 2028 | | 2029 |
| Estimated amortization expense | | $ | 512 | | | $ | 512 | | | $ | 477 | | | $ | 473 | | | $ | 452 | |
For the years ended December 31, 2024, 2023 and 2022, amortization expense related to software was $40 million, $54 million and $65 million, respectively.
As discussed in Note 2. Summary of Significant Accounting Policies, acquired IPR&D is not amortized, but rather is reviewed for impairment at least annually, or more frequently in the event of a triggering event. Acquired IPR&D assets are treated as indefinite-lived assets until completion or abandonment of the projects, at which time they are tested for impairment and, if not impaired, are transferred to marketed products and amortized over their estimated economic life. Amortization expense that will be incurred related to assets currently classified as acquired IPR&D upon their future transfer to marketed products, is not included in the future amortization expense table presented above, as we are not able to predict with certainty the period in which such related amortization will begin.
Impairment charges related to acquired IPR&D assets for the years ended December 31, were as follows:
| | | | | | | | | | | | | | | | | | | | |
| | 2024 | | 2023 | | 2022 |
| Acquired IPR&D impairment | | $ | 56 | | | $ | 6 | | | $ | 59 | |
These charges were included within asset impairment, restructuring and other special charges within our consolidated statements of operations (see Note 5. Asset Impairment, Restructuring and Other Special Charges, for further discussion).
Note 12. Property and Equipment
At December 31, property and equipment consisted of the following:
| | | | | | | | | | | | | | |
| | 2024 | | 2023 |
| Land | | $ | 40 | | | $ | 40 | |
| Buildings | | 600 | | | 630 | |
| Equipment | | 990 | | | 985 | |
| Construction in progress | | 221 | | | 186 | |
| | | | |
| | 1,851 | | | 1,841 | |
| Less accumulated depreciation | | (858) | | | (815) | |
| Property and equipment, net | | $ | 993 | | | $ | 1,026 | |
Property and equipment, net by geographic area as of December 31, was as follows:
| | | | | | | | | | | | | | |
| | 2024 | | 2023 |
| United States | | $ | 610 | | | $ | 555 | |
| Germany | | 230 | | | 245 | |
| France | | 56 | | | 59 | |
| Other foreign countries | | 97 | | | 167 | |
| Property and equipment, net | | $ | 993 | | | $ | 1,026 | |
The reduction in property and equipment, net in other foreign countries during 2024 was primarily due to the divestiture of our manufacturing facilities in Vietnam and Canada as part of our aqua business divestiture in July 2024 (see Note 4. Acquisitions, Divestitures and Other Arrangements). Additionally, the increase in property and equipment, net in 2024 in the U.S. primarily related to $42 million recorded within construction in progress related to the expansion of our monoclonal antibody manufacturing facility in Elwood, Kansas.
Depreciation expense related to property and equipment for the years ended December 31, was as follows:
| | | | | | | | | | | | | | | | | | | | |
| | 2024 | | 2023 | | 2022 |
| Depreciation expense | | $ | 95 | | | $ | 92 | | | $ | 89 | |
Note 13. Leases
We have operating leases for corporate offices, research and development facilities, vehicles and equipment with lease terms generally ranging from one to 15 years, some of which have options to extend or terminate the leases. We determine if an arrangement is a lease at inception, and if so, whether it represents an operating or finance lease. Right-of-use (ROU) assets relating to our operating leases are included in noncurrent assets, while lease liabilities relating to operating leases are included in other current liabilities and other noncurrent liabilities within the consolidated balance sheets. As of December 31, 2024 and 2023, finance leases were not material.
ROU assets represent our right to use an underlying asset for the lease term, while lease liabilities represent our obligation to make lease payments arising from the lease. ROU assets and lease liabilities are recognized at the lease commencement date based on the present value of lease payments over the lease term. As most of our leases do not provide an implicit rate, we use our incremental borrowing rate based on the information available at lease commencement in determining the present value of lease payments. We use the implicit rate if it is readily determinable. Our lease terms may include options to extend or terminate the lease, and when it is reasonably certain we will exercise that option, these extensions are included in the lease term used to calculate the ROU assets and operating lease liabilities. We do not include leases with a lease term of 12 months or less within the determination of our ROU assets or lease liabilities.
Operating lease expense is recognized on a straight-line basis over the lease term. Variable lease payments, which represent lease payments that vary due to changes in facts or circumstances occurring after the commencement date, are expensed in the period in which the obligation for these payments is incurred.
The impact of operating leases on the consolidated financial statements for the years ended December 31, was as follows:
| | | | | | | | | | | | | | | | | | | | |
| | 2024 | | 2023 | | 2022 |
| | | | | | |
| Operating lease cost | | $ | 49 | | | $ | 42 | | | $ | 45 | |
| Short-term and variable lease cost | | 6 | | | 5 | | | 6 | |
| | | | | | |
| Total lease cost | | $ | 55 | | | $ | 47 | | | $ | 51 | |
| | | | | | |
| Other information | | | | | | |
| Operating cash outflows from operating leases | | $ | 35 | | | $ | 35 | | | $ | 33 | |
| ROU assets obtained in exchange for new operating lease liabilities | | 33 | | | 28 | | | 32 | |
| Weighted-average remaining lease term - operating leases | | 6 years | | 7 years | | 7 years |
| Weighted-average discount rate - operating leases | | 5.0 | % | | 4.8 | % | | 4.0 | % |
| | | | | | |
Supplemental balance sheet information related to our operating leases is as follows:
| | | | | | | | | | | | | | | | | | | | |
| Asset/Liability | | Balance Sheet Classification | | December 31, 2024 | | December 31, 2023 |
| Right-of-use assets | | Other noncurrent assets | | $ | 122 | | | $ | 140 | |
| Current operating lease liabilities | | Other current liabilities | | 31 | | | 32 | |
| Non-current operating lease liabilities | | Other noncurrent liabilities | | 92 | | | 110 | |
| | | | | | |
| | | | | | |
| | | | | | |
| | | | | | |
| | | | | | |
| | | | | | |
| | | | | | |
As of December 31, 2024, the minimum lease payments for our operating lease liabilities for each of the next five years and thereafter were as follows:
| | | | | |
| 2025 | $ | 37 | |
| 2026 | 30 | |
| 2027 | 22 | |
| 2028 | 13 | |
| 2029 | 9 | |
| 2030 and thereafter | 31 | |
| Total lease payments | 142 | |
| Less imputed interest | (19) | |
| Total operating lease liabilities | $ | 123 | |
Lease contracts that have been executed but have not yet commenced are excluded from the tables above. As of December 31, 2024, we have a lease commitment that has not yet commenced for our new corporate headquarters in Indianapolis, Indiana. Total minimum lease payments are estimated to be approximately $378 million over a term of 25 years, excluding extensions. Final lease payments may vary depending on the actual cost of certain construction activities. Lease commencement is expected in 2025.
Note 14. Stock-Based Compensation
The Amended and Restated 2018 Elanco Stock Plan (Plan) provides long-term incentives to attract, motivate and retain employees and non-employee directors. The types of stock-based awards available include, but are not limited to, restricted stock units (RSUs), performance-based awards (PAs) and stock options. Our practices and policies specify that stock-based compensation awards are approved by the Compensation and Human Capital Committee of the Board of Directors. As of December 31, 2024, the total number of shares authorized for stock-based compensation awards under the plan was 40 million, out of which the aggregate number of remaining shares available for future grant was 22.4 million.
Stock-Based Compensation Expense
We measure compensation expense for stock-based awards based on grant date fair value and the estimated number of awards that are expected to vest. For purposes of measuring stock-based compensation expense, we consider whether an adjustment to the observable market price is necessary to reflect material nonpublic information that is known to us at the time the award is granted. Adjustments during the years ended December 31, 2024, 2023 and 2022, were not material. Forfeitures are estimated based on historical experience at the time of grant and are revised in subsequent periods if actual forfeitures differ from those estimates.
A majority of our stock-based compensation expense relates to RSUs and PAs. The associated tax benefit from stock-based compensation expense was offset by a valuation allowance. Stock-based compensation expense for the years ended December 31, 2024, 2023 and 2022, was $55 million, $46 million and $59 million, respectively.
Restricted Stock Units
RSUs are granted to certain employees and are settled in shares of our common stock. RSUs are accounted for at fair value based upon the closing stock price on the date of grant. The corresponding expense is amortized over the vesting period, which is typically three years. RSUs granted to employees for the years ended December 31 were as follows:
| | | | | | | | | | | | | | | | | | | | |
| (Units in millions) | | 2024 | | 2023 | | 2022 |
| Granted units | | 2.4 | | | 3.2 | | | 1.3 | |
| Weighted-average grant date fair value | | $ | 15.89 | | | $ | 11.15 | | | $ | 28.17 | |
Changes in the nonvested portion of RSUs for 2024 are summarized below:
| | | | | | | | | | | | | | |
| (Shares in millions) | | Shares | | Weighted-Average Grant Date Fair Value |
| Nonvested units at January 1, 2024 | | 3.9 | | | $ | 15.49 | |
| Granted | | 2.4 | | | 15.89 | |
| Vested | | (1.6) | | | 17.94 | |
| Forfeited | | (0.3) | | | 14.70 | |
| Nonvested units at December 31, 2024 | | 4.4 | | 14.85 | |
The fair market value of RSUs vesting in 2024, 2023 and 2022 was $29 million, $12 million and $29 million, respectively. As of December 31, 2024, the total remaining unrecognized stock-based compensation expense related to nonvested RSUs was $20 million, which is expected to be amortized over a weighted-average remaining requisite service period of 16 months.
Performance-Based Awards
PAs, which are granted to eligible officers and management, represent the right to receive a share of our common stock and are subject to forfeiture until restrictions lapse, including continued employment through the end of the vesting period and achievement of certain pre-established metrics. Payouts can vary depending on achievement. PAs are accounted for at fair value based upon the closing stock price on the date of grant and fully vest at the end of the measurement period. Stock-based compensation expense for PAs is recognized only if it is deemed probable that the performance condition will be achieved.
PA activity during the year ended December 31, 2024, is summarized below:
| | | | | | | | | | | | | | |
| (Shares in millions) | | Shares | | Weighted-Average Grant Date Fair Value |
| Nonvested awards at January 1, 2024 | | 1.3 | | | $ | 11.25 | |
| Granted | | 1.5 | | | 15.99 | |
| Vested | | (0.3) | | | 28.88 | |
| | | | |
| Nonvested awards at December 31, 2024 | | 2.5 | | | 13.37 | |
The fair market value of PAs vesting in 2024, 2023 and 2022 was $10 million, $8 million and $23 million, respectively. As of December 31, 2024, the total remaining unrecognized stock-based compensation expense related to nonvested PAs was $9 million, which is expected to be amortized over a weighted-average remaining requisite service period of 12 months.
Stock Options
Stock options represent the right to purchase shares of our common stock within a specified period of time at a specified price. Stock options are granted to our officers and management at exercise prices equal to the fair market value of our stock at the date of the grant. Options fully vest three years from the grant date and have a term of 10 years. We value stock options at grant date using a Black-Scholes-Merton valuation model, and the corresponding expense is generally amortized on a straight-line basis over the vesting period. The weighted-average fair value of stock options granted during the years ended December 31, 2024, 2023 and 2022 was estimated to be $7.35, $4.93, and $10.89 respectively. The Black-Scholes-Merton model incorporates a number of valuation assumptions, which are noted in the following table, shown at their weighted-average values for the years ended December 31:
| | | | | | | | | | | | | | | | | | | | |
| | 2024 | | 2023 | | 2022 |
Expected dividend yield (1) | | — | % | | — | % | | — | % |
Risk-free interest rate (2) | | 4.19 | % | | 4.08 | % | | 1.59 | % |
Expected stock price volatility (3) | | 40.7 | % | | 38.2 | % | | 36.5 | % |
Expected term (4) (years) | | 6 | | 6 | | 6 |
(1)We have never declared nor paid any dividends on our common stock, nor do we anticipate paying dividends on our common stock for the foreseeable future.
(2)Determined using the term-matched, zero-coupon risk-free rate from the Treasury Constant Maturity yield curve, continuously compounded.
(3)Determined using a leverage-adjusted historical volatility of peer companies.
(4)Determined using SEC safe harbor approach, based on a 3-year cliff vesting schedule and 10-year contractual term.
Stock option activity during the year ended December 31, 2024, is summarized below:
| | | | | | | | | | | | | | | | | | | | | | | | | | |
| (Shares in millions) | | Shares of Common Stock Attributable to Options | | Weighted-Average Exercise Price of Options | | Weighted-Average Remaining Contractual Term (Years) | | Aggregate Intrinsic Value (in millions) |
| Outstanding at January 1, 2024 | | 1.6 | | | $ | 17.92 | | | | | |
| Granted | | 0.9 | | | 16.03 | | | | | |
| | | | | | | | |
| | | | | | | | |
| Outstanding at December 31, 2024 | | 2.5 | | | $ | 17.27 | | | 8.0 | | $ | 0.9 | |
| Exercisable at December 31, 2024 | | 0.8 | | | 21.87 | | | 6.8 | | 0.3 | |
As of December 31, 2024, there was approximately $4 million of unrecognized stock-based compensation expense related to nonvested stock options, which is expected to amortize over an expected remaining weighted-average period of 17 months.
Note 15. Income Taxes
Our income tax provision for the years ended December 31, 2024, 2023 and 2022, included income tax costs and benefits such as valuation allowances, uncertain tax positions, audit settlements and other items. We were included in Lilly's U.S. tax examinations by the Internal Revenue Service (IRS) through the full separation date of March 11, 2019. Pursuant to the tax matters agreement we executed with Lilly in connection with the IPO, the potential liabilities or potential refunds attributable to pre-IPO periods in which Elanco was included in a Lilly consolidated or combined tax return remain with Lilly. The U.S. examination by the IRS of tax years 2016 to 2018 began in 2019 and is ongoing. Final resolution of certain matters is dependent upon several factors, including the potential for formal administrative proceedings.
Deferred taxes are recognized for the future tax effects of temporary differences between financial and income tax reporting based on enacted tax laws and rates. The tax benefit from an uncertain tax position is recognized only if it is more likely than not that the tax position will be sustained on examination by the taxing authorities, based on the technical merits of the position. The tax benefits recognized in the financial statements from such a position are measured based on the largest benefit that has a greater than 50% likelihood of being realized upon ultimate resolution. Deferred taxes are not provided on substantially all of the unremitted earnings of subsidiaries outside of the U.S., except where required, because it is expected that these earnings will be reinvested indefinitely. Deferred taxes, including U.S. or foreign withholding taxes, would be provided when we no longer consider our subsidiary earnings to be permanently reinvested.
We treat taxes due on future Global Intangible Low-Taxed Income (GILTI) inclusions in U.S. taxable income as a current period expense when incurred. Certain countries in which we have operations have adopted legislation influenced by the Organization for Economic Co-operation and Development (OECD) Pillar Two rules, including a minimum tax rate of 15%. As of December 31, 2024, the U.S. has not yet enacted legislation to adopt the Pillar Two framework. We are continuing to evaluate additional guidance released by the OECD and the pending legislative adoption by additional individual countries. The adoption of Pillar Two was not material to income tax expense for the year ended December 31, 2024.
The composition of income (loss) before income tax expense for the years ended December 31, was as follows:
| | | | | | | | | | | | | | | | | |
| 2024 | | 2023 | | 2022 |
| Federal | $ | (376) | | | $ | (669) | | | $ | (350) | |
| Foreign | 864 | | | (526) | | | 278 | |
| Income (loss) before income taxes | $ | 488 | | | $ | (1,195) | | | $ | (72) | |
The composition of income tax expense for the years ended December 31, was as follows:
| | | | | | | | | | | | | | | | | |
| 2024 | | 2023 | | 2022 |
| Current: | | | | | |
| Federal | $ | 5 | | | $ | (8) | | | $ | 11 | |
| Foreign | 274 | | | 122 | | | 51 | |
| State | (17) | | | 2 | | | 1 | |
| Total current tax expense | 262 | | | 116 | | | 63 | |
| Deferred: | | | | | |
| Federal | 1 | | | (3) | | | (20) | |
| Foreign | (114) | | | (66) | | | (36) | |
| State | 1 | | | (11) | | | (1) | |
| | | | | |
| Total deferred tax benefit | (112) | | | (80) | | | (57) | |
| Income tax expense | $ | 150 | | | $ | 36 | | | $ | 6 | |
Significant components of our deferred tax assets and liabilities as of December 31 were as follows:
| | | | | | | | | | | |
| 2024 | | 2023 |
| Deferred tax assets: | | | |
| Compensation and benefits | $ | 42 | | | $ | 37 | |
| Accruals and reserves | 48 | | | 55 | |
| Tax credit carryovers | 43 | | | 57 | |
| Tax loss carryovers | 180 | | | 314 | |
| Business interest deduction limitation | 198 | | | 196 | |
| Inventories | 40 | | | 24 | |
| | | |
| R&D capitalized assets | 78 | | | 68 | |
| Operating lease liabilities | 47 | | | 52 | |
| | | |
| Other assets | 13 | | | 12 | |
| Total gross deferred tax assets | 689 | | | 815 | |
| Valuation allowances | (269) | | | (363) | |
| Total deferred tax assets | 420 | | | 452 | |
| Deferred tax liabilities: | | | |
| Right-of-use assets | (45) | | | (50) | |
| Intangibles | (700) | | | (837) | |
| Property and equipment | (62) | | | (74) | |
| | | |
| Other liabilities | (6) | | | (5) | |
| Total deferred tax liabilities | (813) | | | (966) | |
| Deferred tax liabilities, net | $ | (393) | | | $ | (514) | |
The deferred tax assets and related valuation allowance amounts for net operating losses and tax credits shown above have been adjusted for differences between prior provisional estimates and tax return filings.
At December 31, 2024, we had tax credit carryovers of $43 million available to reduce future income taxes. This amount was comprised of foreign, U.S. federal and state credits. The foreign credits totaled $2 million and if unused, will begin to expire in 2034. The U.S. federal credits totaled $28 million and if unused, will begin to expire in 2029. The state credits totaled $13 million and if unused, will begin to expire in 2027. The U.S. federal credits were subject to a partial valuation allowance and the state credits were subject to a full valuation allowance.
At December 31, 2024, we had net operating loss carryovers for foreign, U.S. federal and state income tax purposes of $180 million. Of this total, $79 million will expire between 2025 and 2036, and $101 million of the carryovers had an indefinite carryforward period. Net operating losses and other carryovers for foreign, U.S. federal and state income tax purposes were subject to full and partial valuation allowances.
Movements in the valuation allowance for the years ended December 31, are summarized as follows:
| | | | | | | | | | | |
| 2024 | | 2023 |
| January 1 | $ | (363) | | | $ | (228) | |
| Increase | (2) | | | (141) | |
| Release | 96 | | | 6 | |
| December 31 | $ | (269) | | | $ | (363) | |
The decrease in the valuation allowance during 2024 was primarily attributable to the sale of our aqua business, which generated U.S. federal taxable income, allowing us to realize certain net operating loss carryforwards and other tax attributes which were historically offset by a valuation allowance. The total net decrease in the valuation allowance recorded in income tax expense in the consolidated statements of operations was $77 million in 2024, with the remaining change in the balance primarily recorded through accumulated other comprehensive loss. The total net increase in the valuation allowance recorded in income tax expense in 2023 and 2022 was $93 million and $80 million, respectively, with the remaining change in balance primarily recorded through accumulated other comprehensive loss.
Cash payments of income taxes during the years ended December 31, were as follows:
| | | | | | | | | | | | | | | | | |
| 2024 | | 2023 | | 2022 |
| Cash payments of income taxes | $ | 140 | | | $ | 95 | | | $ | 93 | |
Income taxes receivable of $121 million and $149 million, respectively, were included in prepaid expenses and other on our consolidated balance sheets as of December 31 2024 and 2023. Income taxes payable of $127 million and $26 million, respectively, were included within other current liabilities on our consolidated balance sheets as of December 31 2024 and 2023.
The following is a reconciliation of the income tax expense applying the U.S. federal statutory rate to income (loss) before income taxes to reported income tax expense:
| | | | | | | | | | | | | | | | | |
| 2024 | | 2023 | | 2022 |
| Income tax expense (benefit) at the U.S. federal statutory tax rate | $ | 102 | | | $ | (251) | | | $ | (15) | |
| Add (deduct): | | | | | |
| Taxation of international operations | 98 | | | 3 | | | (43) | |
| State taxes | (21) | | | (12) | | | (11) | |
| Income tax credits | (11) | | | (10) | | | (13) | |
| Non-deductible employee compensation | 5 | | | 15 | | | 7 | |
| Divestitures and impairments of goodwill and other intangible assets | 38 | | | 164 | | | — | |
| Other permanent adjustments | 7 | | | 19 | | | (2) | |
| Change in uncertain tax positions | 9 | | | 15 | | | 3 | |
| Change in valuation allowance | (77) | | | 93 | | | 80 | |
| | | | | |
| | | | | |
| | | | | |
| Income tax expense | $ | 150 | | | $ | 36 | | | $ | 6 | |
A reconciliation of the beginning and ending amount of gross unrecognized tax benefits for the years ended December 31, was as follows:
| | | | | | | | | | | | | | | | | |
| 2024 | | 2023 | | 2022 |
| Beginning balance at January 1 | $ | 31 | | | $ | 16 | | | $ | 6 | |
| Additions based on tax positions related to the current year | 7 | | | 2 | | | 3 | |
| Changes for tax positions of prior years | 2 | | | 13 | | | — | |
| Additions related to acquisitions | — | | | — | | | 7 | |
| | | | | |
| | | | | |
| Ending balance at December 31 | $ | 40 | | | $ | 31 | | | $ | 16 | |
The total amount of unrecognized tax benefits that, if recognized, would affect tax expense was $40 million and $31 million at December 31, 2024 and 2023, respectively. We recognize both accrued interest and penalties related to unrecognized tax benefits in income tax expense. Interest and penalties related to income tax matters were not material for the years ended December 31, 2024, 2023 and 2022.
Note 16. Commitments and Contingencies
Legal Matters
We are party to various legal actions that arise in the normal course of business. The most significant matters are described below. Under GAAP, loss contingency provisions are recorded when we deem it probable that we will incur a loss and we are able to formulate a reasonable estimate of that loss.
Seresto Class Action Lawsuits
Claims seeking actual damages, injunctive relief and/or restitution for allegedly deceptive marketing were made against Elanco Animal Health Inc. and Bayer HealthCare LLC, along with other Elanco and Bayer entities, arising out of the use of Seresto™, a non-prescription flea and tick collar for cats and dogs. During 2021, putative class action lawsuits were filed in federal courts in the U.S. alleging that the Seresto collars contain pesticides that can cause serious injury and death to cats and/or dogs wearing the product. In August 2021, the lawsuits were consolidated by the Judicial Panel on Multidistrict Litigation, and the cases were transferred to the Northern District of Illinois. In June 2023, the parties agreed on the monetary terms of a potential settlement of the consolidated class action lawsuits, and at that time, we recorded a charge of $15 million, which was included within other expense, net in our consolidated statements of operations. During the fourth quarter of 2023, the parties agreed on the non-monetary terms which, in addition to the monetary terms, were approved by the court in January 2025. The previously accrued $15 million was paid in February 2025.
Additional Legal Matters
For the legal matters discussed below, we either believe loss is not probable or are unable to estimate the possible loss or range of loss, if any. The process of resolving these matters is inherently uncertain and may develop over an extended period of time; therefore, at this time, the ultimate resolutions cannot be predicted. As of December 31, 2024 and 2023, we had no material liabilities established related to the legal matters discussed below.
On October 7, 2024, a putative securities class action lawsuit captioned Joseph Barpar v. Elanco Animal Health Inc., et al. (Barpar) was filed in the United States District Court for the District of Maryland against Elanco and two of its executives. Barpar alleges claims under Sections 10(b) and 20(a) of the Securities Exchange Act of 1934, and specifically alleges that Elanco and the two executives made materially false and/or misleading statements and/or failed to disclose certain facts about the safety of and labeling for our Zenrelia® product, as well as the approval and launch timelines for Zenrelia and our Credelio Quattro™ product. The plaintiff purports to represent purchasers of Elanco securities between November 7, 2023 and June 26, 2024. On November 1, 2024, a shareholder derivative action captioned Lawrence Hollin v. Lawrence E. Kurzius, et al. was filed in the United States District Court for the District of Maryland against current members of Elanco's Board of Directors and senior management, alleging claims under Sections 10(b) and 20(a) of the Securities Exchange Act of 1934 and state law claims for breach of fiduciary duty, aiding and abetting breach of fiduciary duty, unjust enrichment and waste of corporate assets, based on allegations substantially similar to the allegations in the putative class action complaint in Barpar. We are vigorously defending our positions in connection with both actions. The process of resolving these matters is inherently uncertain and may develop over an extended period of time; therefore, at this time, the ultimate resolution cannot be predicted.
On May 20, 2020, a shareholder class action lawsuit captioned Hunter v. Elanco Animal Health Inc., et al. (Hunter) was filed in the United States District Court for the Southern District of Indiana against Elanco and certain executives. On September 3, 2020, the court appointed a lead plaintiff, and on November 9, 2020, the lead plaintiff filed an amended complaint adding additional claims against Elanco, certain executives and other individuals. The lawsuit alleged, in part, that Elanco and certain of its executives made materially false and/or misleading statements and/or failed to disclose certain facts about Elanco’s supply chain, inventory, revenue and projections. The lawsuit sought unspecified monetary damages and purports to represent purchasers of Elanco securities between September 30, 2018 and May 6, 2020, and purchasers of Elanco common stock issued in connection with Elanco's acquisition of Aratana Therapeutics, Inc. On January 13, 2021, we filed a motion to dismiss, and on August 17, 2022, the Court issued an order granting our motion to dismiss the case without prejudice. On October 14, 2022, the plaintiffs filed a motion for leave to amend the complaint. On December 7, 2022, we filed an opposition to the plaintiffs' motion, and on September 27, 2023, the court denied the plaintiffs' motion for leave, issuing final judgment in favor of Elanco. On October 25, 2023, the plaintiffs filed a notice of appeal to the United States Court of Appeals for the Seventh Circuit. We continue to believe the claims made in the case are meritless, and we intend to continue to vigorously defend our position.
On October 16, 2020, a shareholder class action lawsuit captioned Safron Capital Corporation v. Elanco Animal Health Inc., et al. was filed in the Marion Superior Court of Indiana against Elanco, certain executives and other individuals and entities. On December 23, 2020, the plaintiffs filed an amended complaint adding an additional plaintiff. The lawsuit alleges, in part, that Elanco and certain of its executives made materially false and/or misleading statements and/or failed to disclose certain facts about Elanco’s relationships with third-party distributors and revenue attributable to those distributors within the registration statement on Form S-3 dated January 21, 2020,
and accompanying prospectus filed in connection with Elanco’s public offering which closed on or about January 27, 2020. The lawsuit seeks unspecified monetary damages and purports to represent purchasers of Elanco common stock or TEUs issued in connection with the public offering. From February 2021 to August 2022, this case was stayed in deference to Hunter. On October 24, 2022, we filed a motion to dismiss. On December 23, 2022, the plaintiffs filed their opposition to the motion to dismiss. Prior to the ruling on the motion to dismiss, on June 8, 2023, the plaintiffs filed a motion for leave to file a second amended complaint, which is now the operative complaint. We filed a motion to dismiss the second amended complaint on August 7, 2023, to which the plaintiffs filed their opposition on October 13, 2023. On April 17, 2024, our motion to dismiss was granted. The dismissal is without prejudice to plaintiffs' right to re-file a claim, and it is possible the plaintiffs will attempt to file a third amended complaint. We continue to believe the claims made in the case are meritless, and we intend to vigorously defend our position.
In the third quarter of 2019, Tevra Brands, LLC (Tevra) filed a complaint in the U.S. District Court of the Northern District of California, alleging that Bayer Animal Health (acquired by us in August 2020) had been involved in unlawful, exclusive dealing and tying of its flea and tick products Advantage, Advantix and Seresto and maintained a monopoly in the market. The complaint was amended in March 2020 and then dismissed in September 2020 with leave to amend. A second amended complaint was filed in March 2021 and realleged claims of unlawful exclusive dealing related to Advantage and Advantix and monopoly maintenance. A motion to dismiss the second amended complaint was denied in January 2022. Tevra’s demands included both actual and treble damages. On April 16, 2024, the court granted our motion for summary judgment to exclude all damages subsequent to our acquisition of Bayer Animal Health in August 2020. A jury trial was held in July 2024, and on August 1, 2024, the jury returned a verdict in favor of Bayer Animal Health. In January 2025, Tevra's motion for a new trial was denied, and in February 2025, Tevra filed their notice of appeal. Following the initial Tevra trial, three additional matters have been filed against us, both in the Northern District of California and in the Southern District of Indiana, most recently in January 2025: Tracy Spradlin v. Elanco Animal Health, Inc. (Spradlin), Tevra Brands, LLC v. Elanco Animal Health, Inc., and Susan Kraus-Silfen v. Elanco Animal Health, Inc. et. al. (Kraus-Silfen). While there are substantive and statutory differences, the allegations underpinning these matters are similar in some respects to the initial Tevra matter including, but not limited to, the family of pet health products and sales tactics and agreements alleged to drive a monopoly within the market. Two of the new matters, Spradlin and Kraus-Silfen, are putative class actions, and all three matters seek injunctive relief and an unspecified amount of monetary relief. We are vigorously defending against the claims made in these matters. However, the process of resolving these matters is inherently uncertain and may develop over an extended period of time; therefore, at this time, the ultimate resolutions cannot be predicted.
Regulatory Matters
On July 1, 2021, we received a subpoena from the SEC relating to our channel inventory and sales practices prior to mid-2020. During the fourth quarter of 2023, we accrued a liability of $12.5 million for the possible settlement of this matter. In November 2024, we reached an agreement with the SEC and, without admitting to or denying the underlying allegations, settled the matter for $15 million. The initial charge in 2023 and the incremental amount in 2024 were recorded within other expense, net within the consolidated statements of operations. Payment of this amount was reflected within cash from operating activities in our consolidated statement of cash flows for the year ended December 31, 2024.
Other Commitments
As of December 31, 2024, we had a lease commitment that has not yet commenced for our new corporate headquarters in Indianapolis, Indiana. See Note 13. Leases for further information regarding this lease commitment.
The land for our new corporate headquarters is located in a Tax Increment Finance District, and the project is, in part, funded through Tax Incremental Financing (TIF) through an incentive agreement between the City of Indianapolis and us. The agreement provides for an estimated total incentive of $64 million to be funded by the City of Indianapolis in connection with the future tax increment revenue generated from the developed property. In December 2021, as part of a funding and development agreement entered into between the developer and us, we made a commitment to use the expected TIF proceeds towards the cost of developing and constructing the headquarters. In exchange, the developer reimbursed us up to the $64 million commitment in 2021. During 2022, we refunded approximately $15 million of the TIF proceeds to the developer. As a result, it is our expectation that our future lease payments will be reduced. The remaining accrued incentive was included in other noncurrent liabilities on our consolidated balance sheets and will be amortized over the lease term beginning on the commencement date and offset future rent expense.
Note 17. Retirement Benefits
Pension Plans
We sponsor various defined benefit pension plans, which cover certain employees worldwide. Our plans in Switzerland and Germany represent approximately 92% of our global benefit obligation. We use a measurement date of December 31 to develop the change in benefit obligation, change in plan assets, funded status and amounts recorded on the consolidated balance sheets at December 31 for our defined benefit pension plans, which were as follows:
| | | | | | | | | | | | | | |
| | |
| Change in benefit obligation: | 2024 | | 2023 | | | |
| | | | | | |
| Benefit obligation at beginning of year | $ | 366 | | | $ | 324 | | | | |
| Service cost | 9 | | | 9 | | | | |
| Interest cost | 9 | | | 11 | | | | |
| | | | | | |
| Actuarial loss | 6 | | | 17 | | | | |
| Benefits paid | (12) | | | (14) | | | | |
| | | | | | |
| | | | | | |
| Settlements | (6) | | | — | | | | |
| Foreign currency exchange rate changes and other adjustments | (20) | | | 19 | | | | |
| | | | | | |
| Benefit obligation at end of year | 352 | | | 366 | | | | |
| | | | | | | | | | | | | | |
| Change in plan assets: | | | | | | |
| Fair value of plan assets at beginning of year | 192 | | | 175 | | | | |
| Actual return on plan assets | 11 | | | 8 | | | | |
| Employer contribution | 10 | | | 11 | | | | |
| | | | | | |
| Benefits paid | (12) | | | (14) | | | | |
| Settlements | (6) | | | — | | | | |
| Foreign currency exchange rate changes and other adjustments | (11) | | | 12 | | | | |
| | | | | | |
| Fair value of plan assets at end of year | 184 | | | 192 | | | | |
| | | | | | | | | | | | | | |
| Funded status | (168) | | | (174) | | | | |
| Unrecognized net actuarial gain | (56) | | | (63) | | | | |
| Unrecognized prior service cost | (21) | | | (28) | | | | |
| Net amount recognized | $ | (245) | | | $ | (265) | | | | |
| | | | | | | | | | | | | | |
| Amounts recognized in the consolidated balance sheets as of December 31, consisted of: | 2024 | | 2023 | | | |
| Other noncurrent assets | $ | 1 | | | $ | 1 | | | | |
| Other current liabilities | (2) | | | (1) | | | | |
| Accrued retirement benefits | (167) | | | (174) | | | | |
| Accumulated other comprehensive loss before income taxes | (77) | | | (91) | | | | |
| Net amount recognized | $ | (245) | | | $ | (265) | | | | |
The unrecognized net actuarial gain and unrecognized prior service cost for these pension plans have not yet been recognized in net periodic pension expense and were included in accumulated other comprehensive loss at December 31, 2024. We do not expect any plan assets to be returned to us in 2025.
The following represents our weighted-average assumptions related to these pension plans as of and for the years ended December 31:
| | | | | | | | | | | | | | | | | | | | | | | | | |
| (Percentages) | | 2024 | | 2023 | | 2022 | | | | | |
| Discount rate for benefit obligation | | 2.6 | % | | 2.8 | % | | 3.4 | % | | | | | |
| Discount rate for net benefit costs | | 2.8 | | | 3.4 | | | 1.1 | | | | | | |
| Rate of compensation increase for benefit obligation | | 2.8 | | | 2.9 | | | 3.0 | | | | | | |
| Rate of compensation increase for net benefit costs | | 2.9 | | | 3.0 | | | 2.7 | | | | | | |
| Expected return on plan assets for net benefit costs | | 4.2 | | | 4.4 | | | 3.1 | | | | | | |
The assumptions above were used both to estimate our pension benefit obligations at year-end, as well as in the determination of applicable pension benefit costs for the years presented. These assumptions are reviewed on at least an annual basis and are revised based on a yearly evaluation of long-term trends and market conditions that
may impact the cost of providing retirement benefits. The weighted-average discount rates for our defined benefit plans are set by benchmarking against investment grade corporate bonds where available, including, when there is sufficient data, a yield curve approach. For countries that lack a sufficient corporate bond market, a government bond index is used to establish the discount rate. In evaluating the expected rate of return, we consider many factors, with a primary analysis of current and projected market conditions, asset returns and asset allocations and the views of leading financial advisers and economists. We may also review our historical assumptions compared with actual results, as well as the assumptions and trend rates utilized by similar plans, where applicable.
Future benefit payments as of December 31, 2024, which reflect expected future service, as appropriate, are expected to be as follows:
| | | | | | | | | | | | | | | | | | | | | | | | | | | | | | | | | | | |
| 2025 | | 2026 | | 2027 | | 2028 | | 2029 | | 2030-2034 |
| Benefit payments | $ | 14 | | | $ | 15 | | | $ | 16 | | | $ | 15 | | | $ | 16 | | | $ | 92 | |
| | | | | | | | | | | |
We also expect to contribute $11 million to our pension plans in 2025.
Amounts relating to pension plans with projected benefit obligations in excess of plan assets at December 31, were as follows:
| | | | | | | | | | | |
| | 2024 | | 2023 |
| Projected benefit obligation | $ | 334 | | | $ | 343 | |
| Fair value of plan assets | 165 | | | 168 | |
Amounts relating to pension plans with accumulated benefit obligations in excess of plan assets at December 31, were as follows:
| | | | | | | | | | | | | | |
| | |
| | 2024 | | 2023 | | | |
| Accumulated benefit obligation | $ | 323 | | | $ | 332 | | | | |
| Fair value of plan assets | 165 | | | 168 | | | | |
The total accumulated benefit obligation for our defined benefit pension plans was $340 million and $354 million at December 31, 2024 and 2023, respectively.
Net pension benefit expense for the years ended December 31, included the following components:
| | | | | | | | | | | | | | | | | | | | | | |
| | |
| | 2024 | | 2023 | | 2022 | | | | | |
| Service cost | $ | 9 | | | $ | 9 | | | $ | 14 | | | | | | |
| Interest cost | 9 | | | 11 | | | 4 | | | | | | |
| Expected return on plan assets | (7) | | | (8) | | | (6) | | | | | | |
| Amortization of prior service cost | (5) | | | (5) | | | (5) | | | | | | |
| Amortization of net actuarial (gain) loss | (3) | | | (3) | | | 1 | | | | | | |
| | | | | | | | | | |
| | | | | | | | | | |
| | | | | | | | | | |
| Net pension benefit expense | $ | 3 | | | $ | 4 | | | $ | 8 | | | | | | |
The above components, with the exception of service cost, were included within other expense, net in the consolidated statements of operations.
The following represents the pre-tax amounts recognized for defined benefit plans in other comprehensive (loss) income for the years ended December 31:
| | | | | | | | | | | | | | | | | | | | | | |
| | |
| 2024 | | 2023 | | 2022 | | | | | |
| Actuarial (loss) gain arising during period | $ | (1) | | | $ | (17) | | | $ | 92 | | | | | | |
| | | | | | | | | | |
| Amortization of prior service cost | (5) | | | (5) | | | (5) | | | | | | |
| Amortization of net actuarial (gain) loss | (3) | | | (3) | | | 1 | | | | | | |
| | | | | | | | | | |
| Foreign currency exchange rate changes and other | (5) | | | 5 | | | 2 | | | | | | |
| | | | | | | | | | |
| Total other comprehensive (loss) income during period | $ | (14) | | | $ | (20) | | | $ | 90 | | | | | | |
We recognized $4 million, $3 million, and $11 million of income tax expense in other comprehensive (loss) income, respectively, related to our defined benefit plans during the years ended December 31, 2024 and 2023, and 2022.
Benefit Plan Investments
Our benefit plan investment policies are set with specific consideration of return and risk requirements in relationship to the respective liabilities. Our plan assets related to our pension plans in Switzerland and Germany represent approximately 90% of our total plan assets for all pension plans. Given the long-term nature of our liabilities, our plans have the flexibility to manage an above-average degree of risk in the asset portfolios. At the investment-policy level, there are no specifically prohibited investments; however, individual investment manager
mandates, restrictions and limitations are contractually set to align with our investment objectives, ensure risk control and limit concentrations.
We manage our portfolio to minimize concentration of risk by allocating funds within asset categories. In addition, within a category we use different managers with various management objectives to eliminate any significant concentration of risk. Our investment strategy is to diversify our plan assets with a designated percentage invested in fixed-income securities, equity securities, real estate and other alternative investments.
Each category is diversified and comprised of the following:
•Fixed-income securities – Swiss bonds, global aggregates, global aggregate corporates, global government bonds, emerging market local currencies and emerging markets hard currencies.
•Equity securities – Swiss equities, global equities, low volatility equities (to reduce risk) and emerging market equities.
•Real estate – Swiss real estate and global real estate funds.
•Other alternative investments – cash, cash equivalents and investments in senior secured loans.
We determine the fair value of our plan investments based on a market approach using quoted market values and/or significant other observable inputs for identical or comparable assets or liabilities.
Real estate is mostly comprised of public holdings. Real estate investments in registered investment companies that trade on an exchange are classified as Level 1 in the fair value hierarchy. Other real estate investments are marked to fair value using models that are supported by observable market-based data (Level 2).
The fair values of pension plan assets as of December 31, 2024, by asset category were as follows:
| | | | | | | | | | | | | | | | | | | | | | | | | | | | | | | | |
| | | | | Fair Value Measurements Using | | |
| Asset Class | | Total | | Quoted Prices in Active Markets for Identical Assets
(Level 1) | | Significant Observable
Inputs
(Level 2) | | Significant Unobservable Inputs
(Level 3) | | Investments Valued at NAV(1) |
| | | | | | | | | | |
| Public equity securities | | $ | 60 | | | $ | 56 | | | $ | — | | | $ | — | | | $ | 4 | |
| Fixed income: | | | | | | | | | | |
| Developed markets | | 65 | | | 64 | | | — | | | — | | | 1 | |
| | | | | | | | | | |
| Emerging markets | | 6 | | | 6 | | | — | | | — | | | — | |
| | | | | | | | | | |
| | | | | | | | | | |
| | | | | | | | | | |
| Real estate | | 17 | | | 10 | | | 7 | | | — | | | — | |
| Other | | 36 | | | 27 | | | 9 | | | — | | | — | |
| Total | | $ | 184 | | | $ | 163 | | | $ | 16 | | | $ | — | | | $ | 5 | |
(1)Certain investments measured at fair value using the Net Asset Value (NAV) per share, or its equivalent, as a practical expedient have not been classified in the fair value hierarchy.
The fair values of pension plan assets as of December 31, 2023, by asset category were as follows:
| | | | | | | | | | | | | | | | | | | | | | | | | | | | | | | | |
| | | | Fair Value Measurements Using | | |
| Asset Class | | Total | | Quoted Prices in Active Markets for Identical Assets
(Level 1) | | Significant Observable
Inputs
(Level 2) | | Significant Unobservable Inputs
(Level 3) | | Investments Valued at NAV |
| | | | | | | | | | |
| Public equity securities | | $ | 58 | | | $ | 55 | | | $ | — | | | $ | — | | | $ | 3 | |
| Fixed income: | | | | | | | | | | |
| Developed markets | | 72 | | | 71 | | | — | | | — | | | 1 | |
| | | | | | | | | | |
| Emerging markets | | 12 | | | 12 | | | — | | | — | | | — | |
| | | | | | | | | | |
| | | | | | | | | | |
| | | | | | | | | | |
| Real estate | | 18 | | | 11 | | | 7 | | | — | | | — | |
| Other | | 32 | | | 28 | | | 4 | | | — | | | — | |
| Total | | $ | 192 | | | $ | 177 | | | $ | 11 | | | $ | — | | | $ | 4 | |
| | | | | | | | | | |
No material transfers between Level 1, Level 2 or Level 3 occurred during the years ended December 31, 2024 or 2023.
Defined Contribution Plans
Elanco has defined contribution savings plans that include certain employees worldwide. Our contributions to these plans are based on our employee contributions and the level of our match. Expenses under the plans totaled $36 million, $40 million and $34 million for the years ended December 31, 2024, 2023 and 2022, respectively.
Multiemployer Plans
We also participate in certain multiemployer plan arrangements which provide basic pension benefits to the majority of our employees in Germany. Up to a certain salary level, the benefit obligations are covered by our contributions and the contributions from employees to the plans. The Company-specific plan information for these plans is not publicly available, and the plans are not subject to a collective-bargaining agreement. The plans provide fixed, monthly retirement payments on the basis of the credits earned by the participating employees. To the extent these plans become underfunded, our future required contributions may increase and may be used to fund retirement benefits for employees related to other employers, although as of December 31, 2023 and 2022, the plans' total assets exceeded the total actuarial present value of accumulated plan benefits. Our plan contributions to these plans are expensed as incurred and were not material in any of the years ended December 31, 2024, 2023 and 2022, nor did they exceed 5% of the total contributions to the plans.
Contributing to these types of plans creates risk that differs from providing benefits under our sponsored plans, in that if another participating employer ceases to contribute to a multiemployer plan, additional unfunded obligations may need to be funded over time by remaining participating employers.
Note 18. Earnings Per Share
We compute basic earnings (loss) per share by dividing net income (loss) by the weighted-average number of common shares outstanding for the reporting period. Elanco has variable common stock equivalents relating to certain equity awards in stock-based compensation arrangements. We also had variable common stock equivalents related to the TEU prepaid stock purchase contracts through their settlement date of February 1, 2023 (see Note 7. Equity for further discussion). Diluted earnings per share reflects the potential dilution that could have occurred if holders of the unvested equity awards converted their holdings into common stock and that could have occurred if holders of unsettled TEUs had converted their holdings into common stock prior to the February 1, 2023, settlement date. The weighted-average number of potentially dilutive shares outstanding was calculated using the treasury stock method. Potential common shares that would have had the effect of increasing diluted earnings per share (or reducing loss per share) were considered to be anti-dilutive and as such, these shares were not included in the calculation of diluted earnings (loss) per share.
Basic and diluted weighted-average shares outstanding for the years ended December 31, were as follows:
| | | | | | | | | | | | | | | | | | | | |
| | 2024 | | 2023 | | 2022 |
| | | | | | |
Basic weighted-average common shares outstanding (1) | | 494.0 | | | 492.3 | | 488.3 | |
Assumed conversion of dilutive common stock equivalents (2) | | 3.3 | | | — | | | — | |
| Diluted weighted-average shares outstanding | | 497.3 | | | 492.3 | | 488.3 | |
(1)The TEU prepaid stock purchase contracts were convertible into a minimum of 14.3 million shares or a maximum of 17.2 million shares. The minimum 14.3 million shares were included in the calculation of basic weighted-average shares from January 22, 2020 to February 1, 2023. The 17.2 million shares that were ultimately issued have been included in the calculation of basic weighted-average shares subsequent to the settlement date of February 1, 2023.
(2)For the years ended December 31, 2024, 2023 and 2022, approximately 1.4 million, 2.9 million, and 3.3 million, respectively, of potential common shares were excluded from the calculation of diluted earnings per share because their effect was anti-dilutive.
Note 19. Business Segment Information
We operate our business as a single segment engaged in the development, manufacturing, marketing and sales of animal health products for both pets and farm animals. Consistent with our operational structure, our Chief Executive Officer (CEO), as the chief operating decision maker, makes resource allocation and business process decisions globally across our consolidated business. Strategic and resource allocation decisions are managed globally, with global functional leaders responsible for determining significant costs and investments and with regional leaders responsible for overseeing the execution of our global strategy. Managing and allocating resources at the global corporate level enables our CEO to assess the overall level of resources available and how to best deploy these resources across functions, product types, regional commercial organizations and R&D projects in line with our overarching long-term corporate-wide strategic goals, rather than on a product or geographic basis. Consistent with this decision-making process, our CEO considers consolidated net income (loss), which is our single segment’s principal measure of segment profit and loss, when evaluating performance. Our CEO also considers these measures, as well as other factors, such as an assessment of a new product’s future market potential, when determining how to allocate company-wide resources.
Significant expenses are amounts that are regularly provided to our CEO and included in consolidated net income (loss), our primary measure of our single segment’s profit or loss. Our CEO regularly reviews reported consolidated revenues, significant expenses and consolidated net income (loss), in addition to forecasted revenues, significant expenses and net income (loss) amounts for future periods. A summary of our consolidated net income for the years ended December 31, 2024, 2023 and 2022 is as follows, including the significant expenses provided to and
regularly reviewed by our CEO, as well as other expenses, which are included in consolidated net income (loss), but are not regularly provided to and/or reviewed by our CEO:
| | | | | | | | | | | | | | | | | |
| 2024 | | 2023 | | 2022 |
| Revenue | $ | 4,439 | | | $ | 4,417 | | | $ | 4,411 | |
| Cost of sales | 2,003 | | | 1,931 | | | 1,913 | |
| Gross margin | 2,436 | | | 2,486 | | | 2,498 | |
| | | | | |
| Other significant segment expenses: | | | | | |
| Research and development | 344 | | | 327 | | | 321 | |
| Marketing and selling | 809 | | | 783 | | | 770 | |
| General and administrative | 505 | | | 502 | | | 495 | |
| Interest expense, net of capitalized interest | 235 | | | 277 | | | 241 | |
| Other expense, net | 18 | | | 75 | | | 32 | |
| Income tax expense | 150 | | | 36 | | | 6 | |
| Total other significant segment expenses | 2,061 | | | 2,000 | | | 1,865 | |
Other expenses (1) | 37 | | | 1,717 | | | 711 | |
| Net income (loss) | $ | 338 | | | $ | (1,231) | | | $ | (78) | |
(1)Other expenses include amortization of intangible assets; asset impairment, restructuring and other special charges; goodwill impairment; and gain on divestiture.
Given our single reporting segment structure, we manage our assets on a total company basis. Cash paid for acquisitions, intangible assets and property and equipment and software, as well as cash proceeds from divestitures, are summarized in the Investing Activities section of our consolidated statements of cash flows.
Report of Independent Registered Public Accounting Firm
To the Shareholders and the Board of Directors of Elanco Animal Health Incorporated
Opinion on the Financial Statements
We have audited the accompanying consolidated balance sheets of Elanco Animal Health Incorporated (the Company) as of December 31, 2024 and 2023, the related consolidated statements of operations, comprehensive loss, equity and cash flows for each of the three years in the period ended December 31, 2024, and the related notes (collectively referred to as the “consolidated financial statements”). In our opinion, the consolidated financial statements present fairly, in all material respects, the financial position of the Company at December 31, 2024 and 2023, and the results of its operations and its cash flows for each of the three years in the period ended December 31, 2024, in conformity with U.S. generally accepted accounting principles.
We also have audited, in accordance with the standards of the Public Company Accounting Oversight Board (United States) (PCAOB), the Company’s internal control over financial reporting as of December 31, 2024, based on criteria established in Internal Control-Integrated Framework issued by the Committee of Sponsoring Organizations of the Treadway Commission (2013 framework), and our report dated February 25, 2025, expressed an unqualified opinion thereon.
Basis for Opinion
These financial statements are the responsibility of the Company's management. Our responsibility is to express an opinion on the Company’s financial statements based on our audits. We are a public accounting firm registered with the PCAOB and are required to be independent with respect to the Company in accordance with the U.S. federal securities laws and the applicable rules and regulations of the Securities and Exchange Commission and the PCAOB.
We conducted our audits in accordance with the standards of the PCAOB. Those standards require that we plan and perform the audit to obtain reasonable assurance about whether the financial statements are free of material misstatement, whether due to error or fraud. Our audits included performing procedures to assess the risks of material misstatement of the financial statements, whether due to error or fraud, and performing procedures that respond to those risks. Such procedures included examining, on a test basis, evidence regarding the amounts and disclosures in the financial statements. Our audits also included evaluating the accounting principles used and significant estimates made by management, as well as evaluating the overall presentation of the financial statements. We believe that our audits provide a reasonable basis for our opinion.
Critical Audit Matters
The critical audit matters communicated below are matters arising from the current period audit of the financial statements that were communicated or required to be communicated to the audit committee and that: (1) relate to accounts or disclosures that are material to the financial statements and (2) involved our especially challenging, subjective or complex judgments. The communication of critical audit matters does not alter in any way our opinion on the consolidated financial statements, taken as a whole, and we are not, by communicating the critical audit matters below, providing separate opinions on the critical audit matters or on the accounts or disclosures to which they relate.
| | | | | | | | |
| | United States (US) sales rebates and discounts |
| Description of the matter | | At December 31, 2024, the Company’s sales rebates and discounts liability totaled $332 million. As explained in Note 2 and 3 to the consolidated financial statements, the Company estimates a sales rebates and discounts liability for customers in the distribution chain under the terms of their contracts. The sales rebates and discounts are recorded as a reduction to revenue in the same period that the Company recognizes a sale to a customer. A large portion of the sales rebates and discounts liability is related to rebates and discounts associated with sales in the US.
Auditing the US sales rebates and discounts liability is complex because of the level of subjectivity involved in management’s assumptions used in the measurement process and the volume and variety of rebate programs offered. For example, the estimate of the US sales rebate and discount liability is based on historical experience with similar incentive programs, current sales data and estimates of inventory levels at channel distributors. |
| How we addressed the matter in our audit | | We tested the Company’s internal controls over the US sales rebates and discounts liability process. This included testing controls over management’s review of the significant inputs and assumptions in the estimation of US sales rebates and discounts, including rebate rates, sales in to and out of the distribution channel, and channel inventory levels.
To test the Company’s US sales rebates and discounts liability, our audit procedures included, among others, evaluating the inputs and assumptions discussed above and testing the completeness and accuracy of the underlying data used in management’s estimate of the US sales rebates and discounts liability. For example, we inspected the underlying rebate programs for customers and compared the rebate percentages used in the Company’s analyses with the program percentages. In addition, we confirmed product remaining in the distribution channel at period end with third parties. We assessed the historical accuracy of management’s US sales rebates and discounts estimates by comparing the prior period US sales rebates and discounts liability to the amount of actual payments made in subsequent periods. We also performed independent calculations of the rebate accruals and a sensitivity analysis of certain significant assumptions to evaluate the change in the US sales rebates and discounts liability resulting from changes in the assumptions.
|
| | | | | | | | |
| | Valuation of goodwill in divestiture |
| Description of the matter | | For the year ended December 31, 2024, the Company allocated goodwill of $458 million to the aqua business disposal group. As described in Note 4 to the consolidated financial statements, goodwill was allocated to the aqua business disposal group on a relative fair value basis by comparing the fair value of the disposal group to the estimated fair value of the Company’s single reporting unit as a whole. The Company estimated the fair value of the single reporting unit as of July 9, 2024, the date of the disposal.
Auditing management’s estimate of the fair value of the single reporting unit was complex and judgmental because the estimate underlying the determination of fair value of the reporting unit involves management’s judgments on significant assumptions. In particular, management estimates fair value using the income approach which is sensitive to certain significant assumptions, such as future revenues, gross margins, certain components of earnings before interest, taxes, depreciation and amortization (EBITDA) margin and the discount rate commensurate with the risks involved.
|
| How we addressed the matter in our audit | | We tested the Company's internal controls over its assessment of the fair value of the reporting unit. This included testing controls over management’s review of the significant assumptions used in the valuation model including future revenues, gross margins, certain components of EBITDA margin and the discount rate.
To test the estimated fair value of the Company’s reporting unit, our audit procedures included, among others, assessing the valuation methodology and testing the significant assumptions discussed herein. For example, we compared the significant assumptions in the prospective financial information used by management to current industry and economic trends and historical performance. We assessed the reasonableness of the future revenues, gross margins and certain components of EBITDA margin by comparing the forecasts to historical results and analyst expectations. We performed sensitivity analyses of certain significant assumptions to evaluate the change in the fair value resulting from changes in the significant assumptions. We also involved our valuation specialists to assist in the evaluation of the fair value methodology and significant assumptions in the fair value estimate. In addition, we tested management’s reconciliation of the fair value of the reporting unit to the market capitalization of the Company.
|
/s/ Ernst & Young LLP
We have served as the Company’s auditor since 2017.
Indianapolis, Indiana
February 25, 2025
Report of Independent Registered Public Accounting Firm
To the Shareholders and the Board of Directors of Elanco Animal Health Incorporated
Opinion on Internal Control Over Financial Reporting
We have audited Elanco Animal Health Incorporated’s internal control over financial reporting as of December 31, 2024, based on criteria established in Internal Control – Integrated Framework issued by the Committee of Sponsoring Organizations of the Treadway Commission (2013 framework) (the COSO criteria). In our opinion, Elanco Animal Health Incorporated (the Company) maintained, in all material respects, effective internal control over financial reporting as of December 31, 2024, based on the COSO criteria.
We also have audited, in accordance with the standards of the Public Company Accounting Oversight Board (United States) (PCAOB), the consolidated balance sheets of the Company as of December 31, 2024 and 2023, the related consolidated statements of operations, comprehensive loss, equity and cash flows for each of the three years in the period ended December 31, 2024, and the related notes and our report dated February 25, 2025, expressed an unqualified opinion thereon.
Basis for Opinion
The Company’s management is responsible for maintaining effective internal control over financial reporting and for its assessment of the effectiveness of internal control over financial reporting included in the accompanying Management’s Report on Internal Control over Financial Reporting. Our responsibility is to express an opinion on the Company’s internal control over financial reporting based on our audit. We are a public accounting firm registered with the PCAOB and are required to be independent with respect to the Company in accordance with the U.S. federal securities laws and the applicable rules and regulations of the Securities and Exchange Commission and the PCAOB.
We conducted our audit in accordance with the standards of the PCAOB. Those standards require that we plan and perform the audit to obtain reasonable assurance about whether effective internal control over financial reporting was maintained in all material respects.
Our audit included obtaining an understanding of internal control over financial reporting, assessing the risk that a material weakness exists, testing and evaluating the design and operating effectiveness of internal control based on the assessed risk, and performing such other procedures as we considered necessary in the circumstances. We believe that our audit provides a reasonable basis for our opinion.
Definition and Limitations of Internal Control Over Financial Reporting
A company’s internal control over financial reporting is a process designed to provide reasonable assurance regarding the reliability of financial reporting and the preparation of financial statements for external purposes in accordance with generally accepted accounting principles. A company’s internal control over financial reporting includes those policies and procedures that (1) pertain to the maintenance of records that, in reasonable detail, accurately and fairly reflect the transactions and dispositions of the assets of the company; (2) provide reasonable assurance that transactions are recorded as necessary to permit preparation of financial statements in accordance with generally accepted accounting principles, and that receipts and expenditures of the company are being made only in accordance with authorizations of management and directors of the company; and (3) provide reasonable assurance regarding prevention or timely detection of unauthorized acquisition, use, or disposition of the company’s assets that could have a material effect on the financial statements.
Because of its inherent limitations, internal control over financial reporting may not prevent or detect misstatements. Also, projections of any evaluation of effectiveness to future periods are subject to the risk that controls may become inadequate because of changes in conditions, or that the degree of compliance with the policies or procedures may deteriorate.
/s/ Ernst & Young LLP
Indianapolis, Indiana
February 25, 2025
ITEM 9. CHANGES IN AND DISAGREEMENTS WITH ACCOUNTANTS ON ACCOUNTING AND FINANCIAL DISCLOSURE None.
ITEM 9A. CONTROLS AND PROCEDURES Disclosure Controls and Procedures
Our management, with the participation of our Chief Executive Officer (CEO) and Chief Financial Officer (CFO), has evaluated the effectiveness of our disclosure controls and procedures (as defined in Rule 13a-15(e) under the Securities Exchange Act of 1934, as amended (the Exchange Act)) as of the end of the period covered by this report. Based on the evaluation, our CEO and CFO have concluded that, as of the end of such period, our disclosure controls and procedures were effective in recording, processing, summarizing and reporting, on a timely basis, information required to be disclosed by us in the reports we file or submit under the Exchange Act, and that information is accumulated and communicated to the CEO and CFO, as appropriate, to allow timely discussions regarding required disclosure.
Management's Report on Internal Control over Financial Reporting
Our management is responsible for establishing and maintaining adequate internal control over financial reporting (as defined in Exchange Act Rule 13a-15(f)). Our management, with the participation of our CEO and CFO, has evaluated the effectiveness of our internal control over financial reporting based on the Internal Control-Integrated Framework issued by the Committee of Sponsoring Organizations of the Treadway Commission (2013 framework). Based on this evaluation, our management has concluded that, as of December 31, 2024, our internal control over financial reporting was effective.
Because of its inherent limitations, internal control over financial reporting may not prevent or detect misstatements. In addition, projections of any evaluation of effectiveness to future periods are subject to risk that controls may become inadequate because of changes in conditions, or that the degree of compliance with the policies or procedures may deteriorate.
Ernst & Young LLP, an independent registered public accounting firm, has audited the effectiveness of our internal controls over financial reporting as of December 31, 2024, as stated in their report, which is included herein.
Changes in Internal Control
There were no changes in our internal control over financial reporting (as defined in Exchange Act Rule 13a-15(f)), that have materially affected, or are reasonably likely to materially affect, our internal control over financial reporting during the quarter ended December 31, 2024.
ITEM 9B. OTHER INFORMATION During the three months ended December 31, 2024, no director or officer of the Company adopted, modified or terminated a "Rule 10b5-1 trading arrangement" or "non-Rule 10b5-1 trading arrangement," as each term is defined in Item 408(a) of Regulation S-K.
ITEM 9C. DISCLOSURE REGARDING FOREIGN JURISDICTIONS THAT PREVENT INSPECTIONS Not applicable.
PART III
ITEM 10. DIRECTORS, EXECUTIVE OFFICERS AND CORPORATE GOVERNANCE Information on Directors, Executive Officers and Corporate Governance can be found in the Proxy Statement under "Proposal No. 1: Election of Directors," "Corporate Governance," "Executive Officers," and "Delinquent Section 16(a) Reports." That information is incorporated in this report by reference.
ITEM 11. EXECUTIVE COMPENSATION Information on director compensation, executive compensation and compensation committee matters can be found in the Proxy Statement under “Non-Employee Director Compensation,” "Corporate Governance – Board and Committee Information – Board Committees," "Corporate Governance – Insider Trading Policy," "Compensation Discussion and Analysis," and “Executive Compensation Tables.” That information is incorporated in this report by reference.
ITEM 12. SECURITY OWNERSHIP OF CERTAIN BENEFICIAL OWNERS AND MANAGEMENT AND RELATED STOCKHOLDER MATTERS Security Ownership of Certain Beneficial Owners and Management
Information relating to ownership of the company’s common stock by management and by persons known by the company to be the beneficial owners of more than five percent of the outstanding shares of common stock is found in the Proxy Statement under “Stock Ownership Information.” That information is incorporated in this report by reference.
Securities Authorized for Issuance Under Equity Compensation Plans
Information about our compensation plans under which shares of our common stock have been authorized for issuance as of December 31, 2024, can be found in the Proxy Statement under “Equity Compensation Plan Information” and is incorporated in this report by reference.
ITEM 13. CERTAIN RELATIONSHIPS AND RELATED TRANSACTIONS, AND DIRECTOR INDEPENDENCE Related Person Transactions
Information relating to related person transactions and the board’s policies and procedures for approval of related person transactions can be found in the Proxy Statement under “Corporate Governance – Related Party Transactions.” That information is incorporated in this report by reference.
Director Independence
Information relating to director independence can be found in the Proxy Statement under “Corporate Governance – Director Independence” and is incorporated in this report by reference.
ITEM 14. PRINCIPAL ACCOUNTANT FEES AND SERVICES Information related to the fees and services of our principal independent accountants, Ernst & Young LLP, Auditor Firm ID: 42, can be found in the Proxy Statement under “Proposal No. 2: Ratification of Selection of Independent Auditor.” That information is incorporated in this report by reference.
PART IV
ITEM 15. EXHIBITS AND FINANCIAL STATEMENT SCHEDULES 1. Financial Statements
The following consolidated financial statements of the company and its subsidiaries are found at Item 8:
•Consolidated Statements of Operations—Years Ended December 31, 2024, 2023 and 2022
•Consolidated Statements of Comprehensive Loss—Years Ended December 31, 2024, 2023 and 2022
•Consolidated Balance Sheets—December 31, 2024 and 2023
•Consolidated Statements of Equity—Years Ended December 31, 2024, 2023 and 2022
•Consolidated Statements of Cash Flows—Years Ended December 31, 2024, 2023 and 2022
•Notes to Consolidated Financial Statements
2. Financial Statement Schedules
The consolidated financial statement schedules of the company and its subsidiaries have been omitted because they are not required, are inapplicable or are adequately explained in the financial statements.
Financial statements of interests of 50 percent or less, which are accounted for by the equity method, have been omitted because they do not, considered in the aggregate as a single subsidiary, constitute a significant subsidiary.
3. Exhibits
The following exhibits are either filed or furnished herewith (as applicable) or, if so indicated, incorporated by reference to the documents indicated in parentheses, which have previously been filed or furnished with the Securities and Exchange Commission.
| | | | | | | | | | |
| Exhibit Number | | Description | |
| | | | |
| | | | |
| | | | |
| | | | |
| | | | |
| | | | |
| | | | |
| | | | |
| | | Asset Purchase Agreement by and between Elanco Animal Health Incorporated as Seller and Intervet International B.V. as Buyer dated as of February 5, 2024 (incorporated by reference to Exhibit 2.1 of the Current Report on Form 8-K filed with the SEC on February 5, 2024)** | |
| | | Amendment No. 1, dated as of July 1, 2024, to the Asset Purchase Agreement by and between Elanco Animal Health Incorporated as Seller and Intervet International B.V. as Buyer dated as of February 5, 2024 (incorporated by reference to Exhibit 2.1 of the Quarterly Report on Form10-Q filed with the SEC on August 8, 2024) | |
| | | | |
| | | | |
| | | Amended and Restated Articles of Incorporation of Elanco Animal Health Incorporated, effective May 30, 2024 (incorporated by reference to Exhibit 3.1 of the Current Report on Form 8-K filed with the SEC on June 4, 2024) | |
| | | Elanco Animal Health Incorporated Amended and Restated Bylaws, effective May 30, 2024 (incorporated by reference to Exhibit 3.2 of the Current Report on Form 8-K filed with the SEC on June 4, 2024) | |
| | | Form of Certificate of Common Stock (incorporated by reference to Exhibit 4.1 of Amendment No. 1 to Registration Statement on Form S-1 (Registration No. 333-226536) filed with the SEC on August 28, 2018) | |
| | | Indenture, dated August 28, 2018, between Elanco Animal Health Incorporated and Deutsche Bank Trust Company Americas, as trustee (incorporated by reference to Exhibit 4.2 of Amendment No. 1 to Registration Statement on Form S-1 (Registration No. 333-226536) filed with the SEC on August 28, 2018) | |
| | | First Supplemental Indenture, dated August 28, 2018, between Elanco Animal Health Incorporated and Deutsche Bank Trust Company Americas, as trustee (incorporated by reference to Exhibit 4.3 of Amendment No. 1 to Registration Statement on Form S-1 (Registration No. 333-226536) filed with the SEC on August 28, 2018) | |
| | | Second Supplemental Indenture, dated as of January 27, 2020, between Elanco Animal Health Incorporated and Deutsche Bank Trust Company Americas, as trustee, including the form of amortizing note (incorporated by reference to Exhibit 4.4 of Current Report on Form 8-K filed with the SEC on January 27, 2020) | |
| | | | |
| | | Description of Securities (filed herewith) | |
| | | | |
| | | | | | | | | | |
| | | Amendment No. 2, dated as of July 3, 2024, to the Credit Agreement, dated as of August 1, 2020, by and among Elanco Animal Health Incorporated, as borrower, Elanco US Inc., as co-borrower, the subsidiary loan parties party thereto, the lenders and issuing banks party thereto from time to time, Goldman Sachs Bank USA, as term facility agent, collateral agent, and security trustee, and JPMorgan Chase Bank, N.A., as revolving facility agent (incorporated by reference to Exhibit 10.1 of the Current Report on Form 8-K filed with the SEC on July 3, 2024) | |
| | | Incremental Assumption Agreement, dated August 12, 2021, by and among Elanco Animal Health Incorporated, Elanco US Inc., the subsidiary loan parties party thereto, Farm Credit Mid-America, PCA, as incremental term lender, and Goldman Sachs Bank USA, as the term facility agent (incorporated by reference to Exhibit 10.1 of the Current Report on Form 8-K filed with the SEC on August 12, 2021) | |
| | | Incremental Assumption Agreement, dated April 19, 2022, by and among Elanco Animal Health Incorporated, Elanco US Inc., the subsidiary loan parties party thereto, Farm Credit Mid-America, PCA, as incremental term lender, and Goldman Sachs Bank USA, as the term facility agent (incorporated by reference to Exhibit 10.1 of the Current Report on Form 8-K filed with the SEC on April 20, 2022) | |
| | | | |
| | | Incremental Assumption Agreement dated August 13, 2024, by and among Elanco Animal Health Incorporated, Elanco US Inc., the subsidiary loan parties party thereto, Farm Credit Mid-America, PCA, as incremental term lender, and Goldman Sachs Bank USA, as the term facility agent (incorporated by reference to Exhibit 10.1 of the Current Report on Form 8-K filed with the SEC on August 13, 2024) | |
| | | Receivables Loan Agreement among Elanco SPEAR LLC, Elanco US Inc., The Various Lenders and Lender Agents from Time to Time Party Thereto and Coöperatieve Rabobank U.A., New York Branch, dated as of August 3, 2023 (incorporated by reference to Exhibit 10.1 of the Current Report on Form 8-K filed with the SEC on August 7, 2023) | |
| | | Elanco Animal Health Incorporated Directors’ Deferral Plan as amended (incorporated by reference to Exhibit 10.1 of the Quarterly Report on Form 10-Q filed with the SEC on May 14, 2019)* | |
| | | | |
| | | Form of 2018 Change in Control Severance Pay Plan for Select Employees (incorporated by reference to Exhibit 10.20 of Amendment No. 1 to Elanco Animal Health Incorporated's registration statement on Form S-1 (File No. 333-226536) filed with the SEC on August 28, 2018)* | |
| | | Form of Elanco Animal Health Incorporated Nonqualified Stock Option Award Agreement (incorporated by reference to Exhibit 10.22 of Amendment No. 1 to Elanco Animal Health Incorporated's registration statement on Form S-1 (File No. 333-226536) filed with the SEC on August 28, 2018)* | |
| | | | |
| | | | |
| | | Employment Offer Letter with Mr. Todd S. Young, dated October 15, 2018, by and between Elanco US Inc. and Todd S. Young (incorporated by reference to Exhibit 10.1 to Elanco Animal Health Incorporated's Report on Form 8-K filed with the SEC on October 30, 2018)* | |
| | | | |
| | | | |
| | | | |
| | | | |
| | | | |
| | | Form of Elanco Animal Health Incorporated Restricted Stock Unit Award Agreement for non-employee directors with respect to annual awards (incorporated by reference to Exhibit 10.2 of the Quarterly Report on Form 10-Q with the SEC on May 14, 2019)* | |
| | | Form of Elanco Animal Health Incorporated Restricted Stock Unit Award Agreement for non-employee directors with respect to one-time founder award (incorporated by reference to Exhibit 10.3 of the Quarterly Report on Form 10-Q filed with the SEC on May 14, 2019)* | |
| | | | |
| | | Elanco Animal Health Incorporated Executive Deferral and Stock Match Plan (filed herewith)* | |
| | | | |
| | | | |
| | | Form of Elanco Animal Health Incorporated Sign-On Restricted Stock Unit Award Agreement for executives with respect to awards commencing 2024 (filed herewith)* | |
| | | Elanco Executive Severance Pay Plan and Summary (filed incorporated by reference to Exhibit 10.31 of the Annual Report on Form 10-K filed with the SEC on March 1, 2021)* | |
| | | Form of Elanco Animal Health Incorporated Restricted Stock Unit Award Agreement for executives with respect to 2021 annual awards (incorporated by reference to Exhibit 10.1 of the Quarterly Report on Form 10-Q filed with the SEC on May 7, 2021)* | |
| | | | |
| | | Elanco Animal Health Incorporated Amended and Restated Corporate Bonus Plan (filed herewith)* | |
| | | Elanco Animal Health Incorporated Amended and Restated 2018 Elanco Stock Plan (incorporated by reference to Appendix C to the Definitive Proxy Statement for the 2023 Annual Meeting of Shareholders filed with the SEC on April 6, 2023)* | |
| | | Form of Elanco Animal Health Incorporated Restricted Stock Unit Award Agreement for executives with respect to annual awards (incorporated by reference to Exhibit 10.25 of the Annual Report on Form 10-K filed with the SEC on March 1, 2023)* | |
| | | | | | | | | | |
| | | Form of Elanco Animal Health Incorporated Performance-Based Award Agreement for executives with respect to annual awards (incorporated by reference to Exhibit 10.26 of the Annual Report on Form 10-K filed with the SEC on March 1, 2023)* | |
| | | Form of Elanco Animal Health Incorporated Nonqualified Stock Option Award Agreement for executives with respect to annual awards (incorporated by reference to Exhibit 10.27 of the Annual Report on Form 10-K filed with the SEC on March 1, 2023)* | |
| | | Elanco Animal Health Incorporated Amended and Restated Employee Stock Purchase Plan (incorporated by reference to Appendix B to the Definitive Proxy Statement for the 2023 Annual Meeting of Shareholders filed with the SEC on April 6, 2023)* | |
| | | | |
| | | | |
| | | Form of Elanco Animal Health Incorporated Nonqualified Stock Option Award Agreement with respect to awards commencing 2024 (filed herewith)* | |
| | | Form of Restricted Stock Unit Award Agreement with respect to awards commending 2024 (filed herewith)* | |
| | | Form of Elanco Animal Health Incorporated Performance-Based Award Agreement for executives with respect to awards commencing 2024 (filed herewith)* | |
| | | Elanco Animal Health Incorporated 2018 Elanco Stock Plan Omnibus Amendment to Stock Option Agreements dated March 29, 2024 (filed herewith)* | |
| | | Elanco Insider Trading and Regulation FD Policy (filed herewith) | |
| | | Subsidiaries of Elanco Animal Health Incorporated (filed herewith) | |
| | | Consent of Ernst & Young LLP (filed herewith) | |
| | | Section 302 Certification of the Chief Executive Officer pursuant to Rule 13a-14(a) of the Securities Exchange Act of 1934, as adopted pursuant to Section 302 of the Sarbanes-Oxley Act of 2002 (filed herewith) | |
| | | Section 302 Certification of the Chief Financial Officer pursuant to Rule 13a-14(a) of the Securities Exchange Act of 1934, as adopted pursuant to Section 302 of the Sarbanes-Oxley Act of 2002 (filed herewith) | |
| | | Certification of the Chief Executive Officer and the Chief Financial Officer pursuant to 18 U.S.C. Section 1350, as adopted pursuant to Section 906 of the Sarbanes-Oxley Act of 2002 (filed herewith) | |
| | | Elanco Animal Health Incorporated Required Compensation Recovery Policy (incorporated by reference to Exhibit 97 of the Annual Report on Form 10-K filed with the SEC on February 26, 2024)* | |
| 101 | | Interactive Data Files (Inline XBRL) | |
| 104 | | The cover page from the Company's Annual Report on Form 10-K for the year ended December 31, 2024, formatted in Inline XBRL and included in Exhibit 101 | |
*Management contracts or compensatory plans or arrangements
**Schedules and exhibits have been omitted pursuant to Item 601(b)(2) of Regulation S-K. The company will furnish copies of any such schedules to the U.S. Securities and Exchange Commission upon request.
ITEM 16. FORM 10-K SUMMARY Not applicable.
Signatures
Pursuant to the requirements of Section 13 or 15(d) of the Securities Exchange Act of 1934, the Registrant has duly caused this Report to be signed on its behalf by the undersigned thereunto duly authorized.
| | | | | | | | |
| | ELANCO ANIMAL HEALTH INCORPORATED |
| | (Registrant) |
| | |
| Date: | February 25, 2025 | /s/ Jeffrey N. Simmons |
| | Jeffrey N. Simmons |
| | President and Chief Executive Officer |
| | |
| | |
| | |
| | |
Pursuant to the requirements of the Securities Exchange Act of 1934, this report has been signed below by the following persons on behalf of the Registrant and in the capacities and on the dates indicated.
| | | | | | | | |
| | |
| /s/ Jeffrey N. Simmons | Date: | February 25, 2025 |
| Jeffrey N. Simmons | | |
| President and Chief Executive Officer (principal executive officer) and Director | | |
| | |
| /s/ Todd S. Young | Date: | February 25, 2025 |
| Todd S. Young | | |
| Executive Vice President, Chief Financial Officer (principal financial officer) | | |
| | |
| /s/ James M. Meer | Date: | February 25, 2025 |
| James M. Meer | | |
| Senior Vice President, Chief Accounting Officer (principal accounting officer) | | |
| | |
| /s/ Lawrence E. Kurzius | Date: | February 25, 2025 |
| Lawrence E. Kurzius | | |
| Chairman of the Board | | |
| | |
| /s/ Kapila Kapur Anand | Date: | February 25, 2025 |
| Kapila Kapur Anand | | |
| Director | | |
| | |
| /s/ John P. Bilbrey | Date: | February 25, 2025 |
| John P. Bilbrey | | |
| Director | | |
| | |
| /s/ William F. Doyle | Date | February 25, 2025 |
| William F. Doyle | | |
| Director | | |
| | | | | | | | |
| | |
| /s/ Art A. Garcia | Date: | February 25, 2025 |
| Art A. Garcia | | |
| Director | | |
| | |
| /s/ Michael J. Harrington | Date: | February 25, 2025 |
| Michael J. Harrington | | |
| Director | | |
| | |
| /s/ Paul Herendeen | Date: | February 25, 2025 |
| Paul Herendeen | | |
| Director | | |
| | |
| /s/ R. David Hoover | Date: | February 25, 2025 |
| R. David Hoover | | |
| Director | | |
| | |
| /s/ Deborah T. Kochevar Ph.D., DVM | Date: | February 25, 2025 |
| Deborah T. Kochevar Ph.D., DVM | | |
| Director | | |
| | |
| /s/ Stacey Ma Ph.D. | Date: | February 25, 2025 |
| Stacey Ma Ph.D. | | |
| Director | | |
| | |
| /s/ Kirk McDonald | Date: | February 25, 2025 |
| Kirk McDonald | | |
| Director | | |
| | |
| /s/ Denise Scots-Knight Ph.D. | Date: | February 25, 2025 |
| Denise Scots-Knight Ph.D. | | |
| Director | | |
| | |
| /s/ Kathy Turner | Date: | February 25, 2025 |
| Kathy Turner | | |
| Director | | |
| | |
| /s/ Craig Wallace | Date: | February 25, 2025 |
| Craig Wallace | | |
| Director | | |