UNITED STATES
SECURITIES AND EXCHANGE COMMISSION
Washington, D.C. 20549
FORM 10-K
☒ ANNUAL REPORT PURSUANT TO SECTION 13 OR 15 (d) OF THE SECURITIES EXCHANGE ACT OF 1934
For the fiscal year ended December 31, 2024
☐ TRANSITION REPORT PURSUANT TO SECTION 13 OR 15 (d) OF THE SECURITIES EXCHANGE ACT OF 1934
Commission File Number: 814-01363
Kayne Anderson BDC, Inc.
(Exact name of registrant as specified in its charter)
| Delaware | | 83-0531326 |
(State or Other Jurisdiction of
Incorporation or Organization) | | (I.R.S. Employer
Identification No.) |
| 717 Texas Avenue, Suite 2200, Houston, TX | | 77002 |
| (Address of Principal Executive Offices) | | (Zip Code) |
(713) 493-2020
(Registrant’s telephone number, including area code)
Securities registered pursuant to Section 12(b) of the Act:
| Title of each class | | Trading Symbol(s) | | Name of each exchange on which registered |
| Common Stock, par value $0.001 per share | | KBDC | | NYSE |
Indicate by check mark if the registrant is a well-known seasoned issuer, as defined in Rule 405 of the Securities Act. Yes ☒ No ☐
Indicate by check mark if the registrant is not required to file reports pursuant to Section 13 or Section 15(d) of the Act. Yes ☐ No ☒
Indicate by check mark whether the registrant (1) has filed all reports required to be filed by Section 13 or 15(d) of the Securities Exchange Act of 1934 during the past 12 months (or for such shorter period that the registrant was required to file such reports), and (2) has been subject to such filing requirements for the past 90 days. Yes ☒ No ☐
Indicate by check mark whether the registrant has submitted electronically every Interactive Data File required to be submitted pursuant to Rule 405 of Regulation S-T (§ 232.405 of this chapter) during the preceding 12 months (or for such shorter period that the registrant was required to submit such files). Yes ☐ No ☐
Indicate by check mark whether the registrant is a large accelerated filer, an accelerated filer, a non-accelerated filer, a smaller reporting company or an emerging growth company. See the definitions of “large accelerated filer”, “accelerated filer”, “smaller reporting company” and “emerging growth company” in Rule 12b-2 of the Exchange Act.
| Large accelerated filer | ☒ | Accelerated filer | ☐ |
| Non-accelerated filer | ☐ | Smaller reporting company | ☐ |
| Emerging growth company | ☐ | |
If an emerging growth company, indicate by check mark if the registrant has elected not to use the extended transition period for complying with any new or revised financial accounting standards provided pursuant to Section 13(a) of the Exchange Act. ☐
Indicate by check mark whether the registrant has filed a report on and attestation to its management’s assessment of the effectiveness of its internal control over financial reporting under Section 404(b) of the Sarbanes-Oxley Act (15 U.S.C. 7262(b)) by the registered public accounting firm that prepared or issued its audit report. ☒
If securities are registered pursuant to Section 12(b) of the Act, indicate by check mark whether the financial statements of the registrant included in the filing reflect the correction of an error to previously issued financial statements. ☐
Indicate by check mark whether any of those error corrections are restatements that required a recovery analysis of incentive-based compensation received by any of the registrant’s executive officers during the relevant recovery period pursuant to §240.10D-1(b). ☐
Indicate by check mark whether the registrant is a shell company (as defined in Rule 12b-2 of the Exchange Act). Yes ☐ No ☒
As of February 21, 2025, the registrant had 71,059,689 shares of common stock, $0.001 par value per share, issued and outstanding and there was no public market for the registrant’s shares.
Documents Incorporated by Reference
Kayne Anderson BDC, Inc. will file with the Securities and Exchange Commission, not later than 120 days after the close of its fiscal year ended December 31, 2024, a definitive proxy statement containing the information required to be disclosed under Part III of Form 10-K.
TABLE OF CONTENTS
PART I
The following discussion and analysis should be read in conjunction with our financial statements and related notes and other financial information appearing elsewhere in this Annual Report on Form 10-K. Except as otherwise specified, references to “we,” “us,” “our,” or the “Company” refer to Kayne Anderson BDC, Inc., a Delaware corporation. We refer to KA Credit Advisors, LLC, our investment adviser, as our “Advisor.” The Advisor also serves as our administrator (the “Administrator”). We refer generally to Kayne Anderson Capital Advisors, L.P., an affiliate of the Advisor, as “Kayne Anderson.”
Forward Looking Statements
This Annual Report on Form 10-K contains forward-looking statements that involve substantial known and unknown risks, uncertainties and other factors. Undue reliance should not be placed on such statements. These forward-looking statements are not historical facts, but rather are based on current expectations, estimates and projections about the company, current and prospective portfolio investments, the industry, beliefs and assumptions. Words such as “anticipates,” “expects,” “intends,” “plans,” “will,” “may,” “continue,” “believes,” “seeks,” “estimates,” “would,” “could,” “should,” “targets,” “projects,” and variations of these words and similar expressions are intended to identify forward-looking statements. These statements are not guarantees of future performance and are subject to risks, uncertainties and other factors, some of which are beyond control of the Company and difficult to predict and could cause actual results to differ materially from those expressed or forecasted in the forward-looking statements, including:
| ● | future operating results; |
| | ● | business prospects and the prospects of portfolio companies in which we invest; |
| | | |
| | ● | the ability of our portfolio companies to achieve their objectives; |
| | ● | changes in political, economic or industry conditions, the interest rate environment or conditions affecting the financial and capital markets; |
| | ● | the ability of our Advisor to locate suitable investments and to monitor and administer investments; |
| | ● | the ability of the Advisor and its affiliates to attract and retain highly talented professionals; |
| | ● | risk associated with possible disruptions in operations or the economy generally; |
| | | |
| | ● | the adequacy of our cash resources, financing sources and working capital; |
| | ● | the timing of cash flows, interest, distributions and dividends, if any, from the operations of the companies in which the Company invests; |
| | ● | the ability to maintain qualification as a business development company (“BDC”) and as a regulated investment company (“RIC”) under the Internal Revenue Code of 1986, as amended (the “Code”); |
| | ● | the use of borrowings under our credit facilities and issuances of senior unsecured notes to finance a portion of the Company’s investments; |
| | ● | the adequacy, availability and pricing of financing sources and working capital for the Company; |
| | ● | actual or potential conflicts of interest with the Advisor and its affiliates; |
| | ● | contractual arrangements and relationships with third parties; |
| | ● | the risk associated with an economic downturn, increased inflation, political instability, interest rate volatility, loss of key personnel, and the illiquid nature of investments of the Company; and |
| | ● | the risks, uncertainties and other factors the Company identifies under “Part I – Item 1A. Risk Factors” and elsewhere in this Annual Report on Form 10-K. |
We have based the forward-looking statements included in this report on information available to us on the date of this report. We assume no obligation to update or revise publicly any forward-looking statements, whether as a result of new information, future events or otherwise, except as required by law. Although we undertake no obligation to revise or update any forward-looking statements, you are advised to consult any additional disclosures that we may make directly to you or through reports that we have filed or in the future may file with the United States Securities and Exchange Commission (the “SEC”), including annual reports on Form 10-K, registration statements on Form N-2, quarterly reports on Form 10-Q and current reports on Form 8-K.
Item 1. Business
Overview
Kayne Anderson BDC, Inc. is a Delaware corporation formed to make investments in middle-market companies and commenced operations on February 5, 2021. We are an externally managed, closed-end, non-diversified management investment company that has elected to be regulated as a BDC under the 1940 Act. In addition, for U.S. federal income tax purposes, we intend to qualify, annually, as a RIC under Subchapter M of the Code.
We are a business development company (“BDC”) that invests primarily in first lien senior secured loans, with a secondary focus on unitranche and split-lien loans to private middle market companies. We are managed by our investment advisor KA Credit Advisors, LLC (the “Advisor”), an indirect controlled subsidiary of Kayne Anderson Capital Advisors, L.P. (“Kayne Anderson”), a prominent alternative investment management firm. Our Advisor operates within Kayne Anderson’s middle market private credit platform (“KAPC” or “Kayne Anderson Private Credit”). Our Advisor is registered with the United States Securities and Exchange Commission (the “SEC”) under the Investment Advisers Act of 1940, as amended (the “Advisers Act”).
On May 24, 2024, we completed our initial public offering (“IPO”), issuing 6,000,000 shares of common stock at a public offering price of $16.63 per share. Net of underwriting fees and offering expenses, we received net cash proceeds of $92.4 million. The Company’s common stock began trading on the New York Stock Exchange (“NYSE”) under the ticker symbol “KBDC” on May 22, 2024.
We generally intend to distribute, out of assets legally available for distribution, 90% to 100% of our available earnings, on a quarterly or annual basis, as determined by our Board of Directors (the “Board”) in its sole discretion. The distributions we pay to our stockholders in a year may exceed our taxable income for that year and, accordingly, a portion of such distributions equal to such excess of distributions over taxable income may constitute a return of invested capital for federal income tax purposes. Such a return of capital (i.e., a distribution that represents a return of an investor’s original investment) would be nontaxable to the stockholder and would reduce its basis in its shares. As a result, income tax related to the portion of such distributions treated as return of capital would be deferred until any subsequent sale of shares of common stock. The specific tax characteristics of our distributions will be reported to stockholders after the end of the calendar year.
Investment Objective, Principal Strategy and Investment Structures
Our investment objective is to generate current income and, to a lesser extent, capital appreciation. We intend to have nearly all of our debt investments in private middle market companies. We use “private” to refer to companies that are not traded on a securities exchange and define “middle market companies” as companies that, in general, generate between $10 million and $150 million of annual earnings before interest, taxes, depreciation and amortization, or EBITDA. Further, we refer to companies that generate between $10 million and $50 million of annual EBITDA as “core middle market companies” and companies that generate between $50 million and $150 million of annual EBITDA as “upper middle market companies.” We typically adjust EBITDA for non-recurring and/or normalizing items to assess the financial performance of our borrowers over time.
We intend to achieve our investment objective by investing primarily in first lien senior secured loans, with a secondary focus on unitranche and split-lien loans to middle market companies. Under normal market conditions, we expect at least 90% of our portfolio (including investments purchased with proceeds from borrowings under credit facilities and issuances of senior unsecured notes) to be invested in first lien senior secured, unitranche and split-lien loans. Our investment decisions are made on a case-by-case basis. We expect the remainder of our portfolio to be invested in second-lien loans, subordinated debt or equity securities (including those purchased in conjunction with other cred investments). We expect that a majority of these debt investments will be made in core middle market companies and will generally have stated maturities of three to six years. We expect that the loans in which we principally invest will be to companies that are located in the United States. We determine the location of a company as being in the United States by (i) such company being organized under the laws of one of the states in the United States; or (ii) during its most recent fiscal year, such company derived at least 50% of its revenues or profits from goods produced or sold, investments made, or services performed in the United States or has at least 50% of its assets in the United States.
The Advisor executes on our investment objective by (1) accessing the established loan sourcing channels developed by KAPC, which includes an extensive network of private equity firms, other middle market lenders, financial advisors, intermediaries and management teams, (2) selecting investments within our middle market company focus, (3) implementing KAPC’s underwriting process and (4) drawing upon its experience and resources and the broader Kayne Anderson network. KAPC was established in 2011 and manages (directly and through affiliates) assets under management (“AUM”) of approximately $7.1 billion related to middle market private credit as of December 31, 2024. See “Risk Factors—Risks Relating to Our Business and Structure—We depend upon our Advisor and Administrator for our success and upon their access to the investment professionals and partners of Kayne Anderson and its affiliates. Any inability of the Advisor or the Administrator to maintain or develop these relationships, or the failure of these relationships to generate investment opportunities, could adversely affect our business,” and “— Risks Relating to Our Investments — Limitations of investment due diligence expose us to investment risk.”
We intend to principally invest in the following types of debt securities:
| | ● | First lien debt: Typically senior on a lien basis to the other liabilities in the issuer’s capital structure with a first priority lien against substantially all assets of the borrower and often including a pledge of the capital stock of the business. The security interest ranks above the security interest of second lien lenders on those assets. These securities are typically floating rate investments priced with a spread to the reference rate (typically SOFR); |
| | ● | Split-lien debt: Typically includes (i) a first lien on fixed and intangible assets of the borrower and often including a pledge of the capital stock of the business and (ii) a second lien on working capital assets. Used in conjunction with an asset based lender who has a first lien on the borrower’s working capital assets. These securities are typically floating rate investments priced with a spread to the reference rate (typically SOFR). |
| | ● | Unitranche debt: Combines features of first lien, second lien and subordinated debt, generally in a first lien position. These securities can generally be thought of as first lien investments beyond what may otherwise be considered “typical” first lien leverage levels, effectively representing a greater portion of the overall capitalization of the underlying business. These securities are typically structured as floating rate investments priced with a spread to the reference rate (typically SOFR). |
Senior secured debt often has restrictive covenants for the purpose of pursuing principal protection and repayment before junior creditors as covenants provide opportunities for lenders to take action following a covenant breach. The loans in which we principally invest have financial maintenance covenants, which require borrowers to maintain certain financial performance criteria and financial ratios on a monthly or quarterly basis. We do not expect to principally invest in “covenant-lite” loans; we use the term “covenant lite” to refer generally to loans that do not have a customary set of financial maintenance covenants.
Subject to our Advisor’s discretion, based on its belief about the pace and amount of investment activity in middle market companies, a portion of our portfolio may be comprised of liquid credit investments (i.e., broadly syndicated loans). The percentage of our portfolio allocated to the liquid investment strategy will be at the discretion of our Advisor. See “Risk Factors—Risks Relating to Our Investments—We are subject to risks associated with our investment and trading of liquid credit (i.e., broadly syndicated loans).”
We invest in debt that is typically not rated by any rating agency, but we believe that if such investments were rated, they would be below investment grade, which are sometimes referred to as “high yield bonds” or “junk bonds.” See “Risk Factors — Risks Relating to Our Investments — We invest in highly leveraged companies, which could cause us to lose all or a part of our investment in those companies,” In addition, we have a maturity policy between three to six years for our debt investments. See “Risk Factors — Risks Relating to Our Investments — Our portfolio companies may be unable to repay or refinance outstanding principal on their loans at or prior to maturity.”
Investment Portfolio
Our portfolio is currently comprised of a broad mix of loans, with diversity among investment size and industry focus. The Advisor’s team of professionals conducts due diligence on prospective investments during the underwriting process and is involved in structuring the credit terms of our private middle market investments. Once an investment has been made, our Advisor closely monitors each portfolio investment and takes a proactive approach to identify and address sector or company specific risks. The Advisor seeks to maintain a regular dialogue with portfolio company management teams (as well as their owners, the majority of whom are private equity firms, where applicable), reviews detailed operating and financial results on a regular basis (typically monthly or quarterly) and monitors current and projected liquidity needs, in addition to other portfolio management activities. There are no assurances that we will achieve our investment objectives.
Listed below are our top ten portfolio companies and industries represented as a percentage of total long-term investments as of December 31, 2024:
| Portfolio Company | | Industry | | Fair Value
($ in millions) | | | Percentage of
long-term
investments | |
| 1 | | Silk Holdings III Corp. (Suave) | | Personal care products | | $ | 41.0 | | | | 2.0 | % |
| 2 | | Dusk Acquisition II Corporation (Motors & Armatures, Inc. – MARS) | | Trading companies & distributors | | $ | 39.9 | | | | 2.0 | % |
| 3 | | BR PJK Produce, LLC (Keany) | | Food products | | $ | 39.5 | | | | 2.0 | % |
| 4 | | M2S Group Intermediate Holdings, Inc. | | Containers & packaging | | $ | 37.7 | | | | 1.9 | % |
| 5 | | American Equipment Holdings LLC | | Commercial services & supplies | | $ | 37.3 | | | | 1.9 | % |
| 6 | | Vitesse Systems Parent, LLC | | Aerospace & defense | | $ | 35.5 | | | | 1.8 | % |
| 7 | | IF&P Foods, LLC (FreshEdge) | | Food products | | $ | 35.1 | | | | 1.7 | % |
| 8 | | AIDC Intermediate Co 2, LLC (Peak Technologies) | | Trading companies & distributors | | $ | 34.1 | | | | 1.7 | % |
| 9 | | Genuine Cable Group, LLC | | Trading companies & distributors | | $ | 34.1 | | | | 1.7 | % |
| 10 | | Improving Acquisition LLC | | IT services | | $ | 33.6 | | | | 1.7 | % |
| | | | | | | $ | 367.8 | | | | 18.4 | % |
As a BDC, at least 70% of our assets must be the type of “qualifying” assets listed in Section 55(a) of the 1940 Act, as described herein, which are generally privately-offered securities issued by U.S. private or thinly-traded companies. We may also invest up to 30% of our portfolio opportunistically in “non-qualifying” portfolio investments. As of December 31, 2024, 9.0% of the Company’s total assets were in non-qualifying investments.
Market Opportunity
We believe that our investments represent attractive opportunities as these investments (i) generate what we believe are attractive yields (based on our Advisor’s assessment of the relative risk profile of these investments), (ii) make interest payments to us and (iii) typically rank ahead of other debt instruments in the borrower’s capital structure (98.0% of our portfolio consisted of first lien senior secured loans as of December 31, 2024), as described above in “—Investment Objective, Principal Strategy and Investment Structures”.
Long-Term Demand Drivers in the U.S. Middle Market
We expect that a number of factors will continue to drive strong demand for middle market senior credit, both by private equity owned and non-private equity owned companies, for the foreseeable future, including: (i) the sheer scale of the U.S. middle market and (ii) a significant amount of un-invested middle market private equity capital.
The universe of U.S. middle market companies (as defined by the National Center for the Middle Market and including all businesses with revenues from $10.0 million to $1.0 billion) consists of nearly 200,000 potential borrowers, a substantial portion of which we believe will continue to require access to debt capital to refinance existing debt, support growth and finance acquisitions. Together, these businesses represent approximately one-third of the U.S. private sector gross domestic product (“GDP”) making them equivalent to the size of the third largest economy in the world on a standalone basis. (Source: National Center for The Middle Market’s Mid-Year 2024 Middle Market Indicator).
Private equity firms investing in these businesses held more than $1.5 trillion in un-invested capital (“dry powder”) as of February 2025. We expect these private equity firms will continue to pursue acquisitions and will seek to fund a portion of these transactions with debt. (Source: Preqin).
Long-Term Shift to Private, Non-Bank Financings in the U.S. Middle Market
We believe that the supply of capital to middle market borrowers and private equity firms acquiring these businesses has shifted substantially to private, non-bank lenders such as ourselves due to (i) a long-term regulatory trend that has significantly reduced bank participation in leveraged finance due to stricter federal leveraged lending guidelines, (ii) consolidation of commercial banks over the last two decades and (iii) direct lending increasing share relative to broadly syndicated financings. We believe that some of this shift away from banks and broadly syndicated financings can be attributed to borrowers valuing specific qualities of non-bank lenders including: (i) a focus on ongoing partnership as opposed to transactional arrangements, (ii) more sophisticated underwriting and originations teams and (iii) a lack of reliability exhibited by banks and more liquid market segments during periods of distress.
In sum, we believe there is (a) a substantial demand for loans, and (b) a substantial marketplace shift towards private, non-bank lenders. We anticipate that these trends should benefit direct lenders such as ourselves.
Middle Market Attractiveness
We intend to have nearly all of our debt investments in private middle market companies. We believe that lending to middle market companies (particularly in senior-focused portions of the capital structure) presents a compelling investment opportunity.
First, senior debt investments are made at the top of the capital structure and are repaid before unsecured creditors and equity investors. Additionally, the types of investments in which we participate will typically include anywhere from one to five lenders in a given debt financing thereby potentially limiting consensus risk, which is important for swift action and potential recovery to lenders in distressed scenarios.
Second, we believe that these markets are underserved by traditional banking sources. We believe that this lack of financing sources leads middle market companies to offer attractive (i) economic terms such as pricing, fees and prepayment premiums and (ii) structural terms such as stricter covenants and more fulsome collateral packages than debt investments in public or much larger private companies.
Competitive Strengths
Our Advisor utilizes KAPC’s direct lending platform to pursue investment opportunities. The leadership team of KAPC has invested this market across multiple platforms (e.g., not only as part of KAPC) and economic cycles, working directly together as a team for the better part of three decades. This experience over multiple decades allows KAPC to focus on transactions in markets where it has substantial experience and where it can bring its expertise in negotiating and structuring investments. Other specific competitive strengths of KAPC which inure to the benefit of KBDC include:
Leading U.S. Core Middle Market Debt Platform. We have benefited and expect to continue to benefit from our relationship with KAPC’s large direct lending platform through our Advisor. Since its inception through December 31, 2024, KAPC has deployed nearly $12.7 billion of capital across 426 investments in 207 portfolio companies. Our Advisor (or an affiliate thereof) has been lead agent or co-agent in approximately 76% of investments since the inception of KAPC.
Experienced Credit Investors with Long Track Record. Core middle market direct lending is led by Ken Leonard (Co-CEO of the Company), Doug Goodwillie (Co-CEO of the Company) and Andy Marek (Managing Partner of KAPC), who have a combined 90+ years of lending experience, having collectively completed transactions representing over $17.2 billion in underwritten middle market loan commitments across multiple credit cycles since 2000. These three individuals are primarily responsible for the day-to-day operations of KAPC and have worked together directly since 2002 while Ken Leonard and Andy Marek have worked together since the late 1980’s. Ken Leonard and Doug Goodwillie are primarily responsible for the day-to-day operations of KBDC.
The Advisor’s investment committee consists of four members (Terry Quinn, Paul Blank, Doug Goodwillie and Ken Leonard) with average experience in credit investing in excess of 30 years. The Advisor’s investment committee has overall responsibility for evaluating and unanimously approving the Company’s investments and portfolio allocations, subject to the oversight of our Board.
Sourcing Advantage and Well-Established Direct Relationship Model. We believe that KAPC’s relationship-based sourcing model provides strong access to proprietary transaction flow, allowing us to be highly selective in the transactions that we pursue. For the period 2021 through December 31, 2024 (and excluding investments in broadly syndicated loans), approximately 63% of opportunities sourced by our Advisor and 88% of opportunities executed by our Advisor were done so without the presence of a financial intermediary, a fact pattern placing specific emphasis on long-term relationships, reputation and certainty of execution with transaction counterparties. Importantly, we believe (based on KAPC’s experience) that our existing portfolio will continue to be an engine of new investment opportunities and will support investment flows even when broader M&A markets may have slowed.
We believe that our direct sourcing model creates repeat business and sticky relationships. Under this model, since inception (and excluding investments in broadly syndicated loans), (i) greater than 90% of KAPC’s investments are in companies sponsored by private equity firms (approximately 99% of the Company’s investments as of December 31, 2024), (ii) approximately 58% of KAPC’s investments were made with repeat private equity sponsors and (iii) over 110 private equity sponsors have partnered with KAPC to provide debt financing to their portfolio companies.
Focus on Investing in Core Middle Market. With extensive market knowledge and experience, we believe we are well positioned to capitalize on the current market conditions in which many middle market companies and private equity sponsors need trusted sources of financing.
Value-Lending Philosophy. We intend to avoid high-growth markets as, in our management’s experience, that growth profile attracts substantial capital formation and, in turn, new competition, leading to the potential for longer-term uncertainty and industry upheaval.
Disciplined Diligence Processes, Regimented Portfolio Monitoring and Active Management. Our Advisor completes substantial hands-on diligence throughout its investment process, which is centered around addressing a potential portfolio company’s industry trends, competitive dynamics, customer base, economic drivers, historical financial performance, financial projections, other factors such as legal and environmental assessments as well as the strengths and weaknesses of management and / or the private equity sponsor or ownership. We target a lead or co-lead agent role in a majority of our investments (KAPC has been lead or co-lead agent in approximately 76% of investments since inception), typically enabling us to lead the diligence, documentation and workout processes. Since inception, KAPC has reported realized loss rates of approximately 0.2% of average outstanding investments on an annualized basis.
Competition
We compete with a number of BDCs and investment funds (both public and private), commercial and investment banks, commercial financing companies and, to the extent they provide an alternative form of financing, private equity and hedge funds. Many of our competitors are substantially larger and have considerably greater financial and marketing resources than we do. We believe we are able to compete with these entities primarily on the basis of the experience and contacts of our management team, our responsive and efficient investment analysis and decision-making processes, the investment terms we offer, and our model of investing in companies participating in industries which we know well.
We believe that some of our competitors may make loans with interest rates that will be lower than the rates that we offer. We do not seek to compete solely on the interest rates that we offer to potential portfolio companies. For additional information concerning competitive risks, see “Item 1A – Risk Factors.”
Corporate Structure
We are a Delaware corporation and commenced operations on February 5, 2021. The following chart depicts our ownership structure:
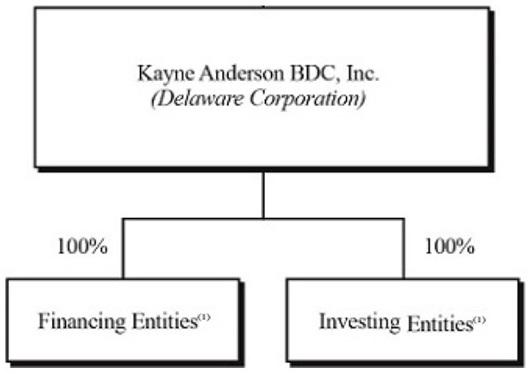
| (1) | From time to time we may form wholly-owned subsidiaries to facilitate our normal course of business investing activities. |
Private Offering
Between February 2021 and December 2023, we executed subscription agreements with investors on sixteen occasions as part of one continuous private placement offering obligating those investors to purchase shares of common stock representing total aggregate capital commitments of $1.047 billion. The execution of the subscription agreements were effected as part of one continuous private placement offering exempt from the registration requirements of the Securities Act pursuant to Section 4(a)(2) thereunder. Pursuant to the private placement offering that began on February 5, 2021, we called capital under the terms of those subscription agreements, and we issued shares of common stock to investors on thirteen funding occasions between February 2021 and April 2024 in an aggregate amount of $1.047 billion.
On March 22, 2024, we delivered the final capital drawdown notice to our stockholders relating to the sale of shares of common stock in the private placement. Following this capital call, we did not have any remaining undrawn capital commitments and the investors’ obligations to purchase additional shares of common stock were exhausted. This final capital drawdown notice completed our pre-initial public offering capital raise private placement offering exempt from the registration requirements of the Securities Act of 1933, as amended (the “Securities Act”), pursuant to Section 4(a)(2) thereunder.
Initial Public Offering
On May 24, 2024, we completed our initial public offering (“IPO”), issuing 6,000,000 shares of our common stock at a public offering price of $16.63 per share. Net of underwriting fees and offering expenses, we received net cash proceeds, before offering expenses, of $92.4 million. The Company’s common stock began trading on the New York Stock Exchange (“NYSE”) under the ticker symbol “KBDC” on May 22, 2024.
Stock Repurchase Plan
On May 21, 2024, the Company entered into a share repurchase plan, or the Company 10b5-1 Plan, to acquire up to $100 million in the aggregate of the Company’s Common Stock at prices below the Company’s net asset value per share over a specified period, in accordance with the guidelines specified in Rule 10b5-1 and Rule 10b-18 of the Securities Exchange Act of 1934, as amended (the “Exchange Act”). The Company 10b5-1 Plan was approved by the Board of Directors on March 6, 2024. Our 10b5-1 Plan requires Morgan Stanley Corporation as the Company’s agent, to repurchase Common Stock on its behalf when the market price per share is below the most recently reported net asset value per share (including any updates, corrections or adjustments publicly announced by the Company to any previously announced net asset value per share, including any distributions declared). Under the Company 10b5-1 Plan, the volume of purchases would be expected to increase as the price of the Company’s Common Stock declines, subject to volume restrictions. The timing and amount of any share repurchases will depend on the terms and conditions of the Company 10b5-1 Plan, the market price of the Company’s Common Stock and trading volumes, and no assurance can be given that Common Stock be repurchased in any particular amount or at all. The repurchase of shares pursuant to the Company 10b5-1 Plan is intended to satisfy the conditions of Rule 10b5-1 and Rule 10b-18 under the Exchange Act, and will otherwise be subject to applicable law, including Regulation M, which may prohibit repurchases under certain circumstances. The Company 10b5-1 Plan commenced beginning 60 calendar days following the end of the “restricted period” under Regulation M and will terminate upon the earliest to occur of (i) the close of business on May 24, 2025, (ii) the end of the trading day on which the aggregate purchase price for all shares purchased under the Company 10b5-1 Plan equals $100 million and (iii) the occurrence of certain other events described in the Company 10b5-1 Plan.
The “restricted period” under Regulation M ended upon the closing of the Company’s IPO and, therefore, the Common Stock repurchases described above began on July 23, 2024.
During the year ended December 31, 2024, the Company repurchased 94,613 shares under our 10b5-1 Plan for a total of $1.5 million.
Kayne Anderson, Kayne Anderson Private Credit and The Advisor
Kayne Anderson
Founded in 1984, Kayne Anderson is a prominent alternative investment management firm which is registered with the SEC under the Advisers Act, focused on real estate, credit and infrastructure/energy. Kayne Anderson provides corporate and management services (such as information technology, human resources, compliance and legal services) to the Advisor.
As of December 31, 2024, investment vehicles managed or advised by Kayne Anderson had over $36 billion in assets under management (“AUM”) for institutional investors, family offices, high net worth and retail clients. Kayne Anderson has approximately 350 professionals located across five offices across the U.S. The firm has approximately 150 investment professionals, approximately 33 of whom are dedicated to credit investing.
Kayne Anderson Private Credit
KAPC is Kayne Anderson’s line of business focused on private credit that operates various fund vehicles targeting middle market first lien senior secured, unitranche, and split-lien loans. KAPC was established in 2011 and manages (indirectly through affiliates) AUM of approximately $7.1 billion related to middle market private credit as of December 31, 2024.
KAPC’s integrated and scaled platform combines direct loan origination, strong fundamental credit analysis and relative-value perspective.
The Advisor – KA Credit Advisors, LLC
Our investment activities are managed by our Advisor, an indirect controlled subsidiary of Kayne Anderson, and the Advisor operates within KAPC’s line of business. The Advisor is an investment advisor registered with the SEC under the Advisers Act pursuant to the Investment Advisory Agreement. In accordance with the Advisors Act, our Advisor is responsible for originating prospective investments, conducting research and due diligence investigations on potential investments, analyzing investment opportunities, negotiating and structuring investments and monitoring our investments and portfolio companies on an ongoing basis. The Advisor benefits from the scale and resources of Kayne Anderson and specifically KAPC. While we do not have any employees, the Advisor and its affiliates have a team of approximately 33 investment professionals who are primarily focused on credit investments. The investment team is supported by a team of finance, legal, compliance, operations and administrative professionals.
The Advisor executes on our investment objective by (1) accessing the established loan sourcing channels developed by KAPC, which includes an extensive network of private equity firms, other middle market lenders, financial advisors, intermediaries and management teams, (2) selecting investments within our middle market company focus, (3) implementing KAPC’s underwriting process and (4) drawing upon its experience and resources and the broader Kayne Anderson network.
The Advisor’s investment committee has overall responsibility for evaluating and unanimously approving the Company’s investments, and its portfolio allocations, subject to the oversight of our Board. The Advisor’s investment committee review process is intended to bring the diverse experience and perspectives of the Advisor’s investment committee members to the analysis and consideration of every investment. The Advisor’s investment committee currently consists of Terrence J. Quinn, Vice Chairman of Kayne Anderson and Vice Chair of the Company; Paul S. Blank, President and Chief Operating Officer of Kayne Anderson; Douglas L. Goodwillie, Co-Head of Private Credit at Kayne Anderson and Co-Chief Executive Officer of the Company; and Kenneth B. Leonard, Co-Head of Private Credit at Kayne Anderson and Co-Chief Executive Officer of the Company. The Advisor’s investment committee also determines appropriate investment sizing and mandates ongoing monitoring requirements. Douglas L. Goodwillie and Kenneth B. Leonard, each a Co-Chief Executive Officer of the Company, are jointly and primarily responsible for the day-to-day management of the Company’s portfolio.
In addition to reviewing investments, the Advisor’s investment committee meetings serve as a forum to discuss credit views and outlooks. The Advisor’s investment committee also reviews potential transactions and deal flow on a regular basis. Members of the investment team are encouraged to share information and views on credit with the committee early in their analysis. We believe this process improves the quality of the analysis and enables investment team members to work more efficiently.
We make investments alongside certain entities and accounts advised by our Advisor and its affiliates. Under the 1940 Act, we are prohibited from knowingly participating in certain joint transactions with our affiliates without the prior approval of the independent directors and, in some cases, prior approval by the SEC. However, we generally make investments alongside affiliated entities and accounts pursuant to exemptive relief granted by the SEC to us, our Advisor, and certain of our affiliates on August 10, 2023. Pursuant to such exemptive relief, and subject to certain conditions, we are permitted to co-invest in the same security with our affiliates in a manner that is consistent with our investment objective, investment strategy, regulatory consideration and other relevant factors. If opportunities arise that would otherwise be appropriate for us and an affiliate to purchase different securities in the same issuer, our Advisor will need to decide which account will proceed with such investment. Our Advisor’s investment allocation policy incorporates the conditions of exemptive relief to seek to ensure that investment opportunities are allocated in a manner that is fair and equitable. See “Risk Factors — Risks Relating to Our Business and Structure — We generally may make investments that could give rise to a conflict of interest and our ability to enter into transactions with our affiliates will be restricted.”
The principal executive offices of our Advisor are located at 717 Texas Avenue, Suite 2200, Houston, Texas, 77002.
Investment Advisory Agreement
On March 6, 2024, the Company entered into an amended and restated investment advisory agreement with the Advisor (the “Amended Investment Advisory Agreement”), which became effective when we closed our initial public offering (“IPO”). Under the Amended Investment Advisory Agreement, the base management fee calculated at an annual rate of 1.00% and the incentive fee on income is subject to a twelve-quarter lookback quarterly hurdle rate of 1.50% and is subject to an Incentive Fee Cap (as defined below) based on the Company’s Cumulative Pre-Incentive Fee Net Return (as defined below).
The cost of both the management fee and the incentive fee under the Amended Investment Advisory Agreement are ultimately borne by common stockholders. The Amended Investment Advisory Agreement was approved by the Board on March 6, 2024. Unless earlier terminated, the Amended Investment Advisory Agreement will renew automatically for successive annual periods, provided that such continuance is specifically approved at least annually by our Board including a majority of Independent Directors or the vote of a majority of our outstanding voting securities.
As discussed in more detail below, on March 6, 2024, the Advisor entered into the Amended Investment Advisory Agreement (effective upon the closing of the IPO) to include a three-year total return lookback feature on the income incentive fee. This lookback feature provides that the Advisor’s income incentive fee may be reduced if the Company’s portfolio experiences aggregate write-downs or net capital losses during the applicable Trailing Twelve Quarters (as defined below). On March 6, 2024, the Advisor also entered into a fee waiver agreement (the “Fee Waiver Agreement”) for the waivers of (i) the income incentive fee for three calendar quarters commencing in the calendar quarter the IPO was completed and (ii) a portion of the base management fee for one year following the completion of the IPO. The Fee Waiver Agreement became effective upon the closing of the IPO. Amounts waived by the Advisor pursuant to the Fee Waiver Agreement are not subject to recoupment by the Advisor. The waivers of the base management fee and incentive income fee pursuant to the Fee Waiver Agreement may only be terminated by the Board and may not be terminated by the Advisor. The Fee Waiver Agreement is contractual in nature.
Base Management Fee
Effective upon the closing of the IPO, the base management fee pursuant to the Amended Investment Advisory Agreement is calculated at an annual rate of 1.00% of the fair market value of the Company’s investments. Since the IPO occurred on a date other than the first day of a calendar quarter, the base management fee was calculated for such calendar quarter at a weighted rate based on the fee rates applicable before and after the closing of the IPO based on the number of days in such calendar quarter before and after the closing of the IPO. Pursuant to the Fee Waiver Agreement, effective upon the closing of the IPO, the Advisor entered into an agreement for the contractual waiver of the base management fee at an annual rate of 0.25% for one year following the completion of the IPO.
The base management fee under the Amended Investment Advisory Agreement is payable quarterly in arrears and calculated based on the average of the Company’s fair market value of investments, at the end of the two most recently completed calendar quarters, including, in each case, assets purchased with borrowings under credit facilities and issuances of senior unsecured notes, but excluding cash, U.S. government securities and commercial paper instruments maturing within one year of purchase. Base management fees for any partial quarter will be appropriately pro-rated.
Incentive Fee
The Company will also pay the Advisor an incentive fee. The incentive fee will consist of two parts — an incentive fee on income and an incentive fee on capital gains. Described in more detail below, these components of the incentive fee will be largely independent of each other with the result that one component may be payable even if the other is not.
Incentive Fee on Income
The incentive fee based on income (the “income incentive fee”) under the Amended Investment Advisory Agreement is determined and paid quarterly in arrears in cash (subject to the limitations described in “Payment of Incentive Fees” below).
Under the Amended Investment Advisory Agreement, the first part of the income incentive fee is calculated and payable quarterly in arrears based on the Company’s pre-incentive fee net investment income as defined in the Amended Investment Advisory Agreement. Pre-incentive fee net investment income means, as the context requires, either the dollar value of, or percentage rate of return on the value of, the Company’s net assets at the beginning of each applicable calendar quarter from interest income, dividend income and any other income (including any other fees (other than fees for providing managerial assistance), such as commitment, origination, structuring, diligence and consulting fees or other fees that the Company receives from portfolio companies) accrued during the calendar quarter, minus the Company’s operating expenses accrued for the quarter (including the management fee, expenses payable under the Administration Agreement (as defined below), and any interest expense or fees on any credit facilities or senior unsecured notes and dividends paid on any issued and outstanding preferred shares, but excluding the incentive fee). Pre-incentive fee net investment income includes, in the case of investments with a deferred interest feature (such as original issue discount, debt instruments with pay in kind (“PIK”) interest and zero coupon securities), accrued income that the Company has not yet received in cash. Pre-incentive fee net investment income excludes any realized capital gains, realized capital losses or unrealized capital appreciation or depreciation.
Following the closing of the IPO, the Company is required to pay an income incentive fee of 15.0%, with a 1.50% quarterly hurdle and 100% catch-up. Pursuant to the Fee Waiver Agreement, the Advisor waived its right to receive an income incentive fee during the three calendar quarters commencing with the calendar quarter in which the IPO was completed and amounts waived by the Advisor pursuant to the Fee Waiver Agreement are not subject to recoupment by the Advisor.
Effective upon the closing of the IPO, the Company will pay the Advisor an income incentive fee based on its aggregate pre-incentive fee net investment income (as described above), with respect to (i) the calendar quarter ending June 30, 2024 (the “First Calendar Quarter”) and (ii) each subsequent calendar quarter, with the then, current calendar quarter and the eleven preceding calendar quarters beginning with the calendar quarter after the First Calendar Quarter (or the appropriate portion thereof in the case of any of the Company’s first eleven calendar quarters that commence after the First Calendar Quarter) (those calendar quarters after the First Calendar Quarter, the “Trailing Twelve Quarters”).
For the First Calendar Quarter, pre-incentive fee net investment income in respect of the First Calendar Quarter was compared to a hurdle rate of 1.50% (6.00% annualized). The income incentive fee for the First Calendar Quarter was determined as follows:
| | ● | no income incentive fee is payable to the Advisor if the aggregate pre-incentive fee net investment income for the First Calendar Quarter does not exceed that hurdle rate; |
| | | |
| | ● | 100% of the aggregate pre-incentive fee net investment income with respect to that portion of such pre-incentive fee net investment income, if any, that exceeds that hurdle rate, but is less than a quarterly rate of 1.6667% for the portion of the First Calendar Quarter before the IPO and a quarterly rate of 1.7647% for the portion of the First Calendar Quarter after the IPO, referred to the “catch-up.” The “catch-up” is meant to provide the Advisor with 10.0% of the Company’s pre-incentive fee net investment income for the portion of the First Calendar Quarter before the IPO and 15.0% for the balance of that First Calendar Quarter, as if the hurdle rate did not apply; and |
| | | |
| | ● | 10.0% of the aggregate pre-incentive fee net investment income, if any, that exceeds a quarterly rate of 1.6667% for the portion of the First Calendar Quarter before the IPO and 15.0% of the aggregate pre-incentive fee net investment income, if any, that exceeds a quarterly rate of 1.7647% for the balance of the First Calendar Quarter. |
Commencing with the calendar quarter beginning immediately after the First Calendar Quarter, subject to the Incentive Fee Cap (described below), the pre-incentive fee net investment income in respect of the relevant Trailing Twelve Quarters is compared to a “Hurdle Rate” equal to the product of (i) the hurdle rate of 1.50% per quarter (6.00% annualized) and (ii) the sum of our net assets at the beginning of each applicable calendar quarter comprising the relevant Trailing Twelve Quarters. The income incentive fee for each calendar quarter will be determined as follows:
| ● | no income incentive fee is payable to the Advisor in any calendar quarter in which aggregate pre-incentive fee net investment income in respect of the relevant Trailing Twelve Quarters does not exceed the Hurdle Rate; |
| | | |
| ● | 100% of the aggregate pre-incentive fee net investment income in respect of the Trailing Twelve Quarters with respect to that portion of such pre-incentive fee net investment income, if any, that exceeds the Hurdle Rate, but is less than or equal to an amount, which we refer to as the “Catch-up Amount,” determined on a quarterly basis by multiplying 1.7647% by the Company’s net asset value at the beginning of each applicable calendar quarter comprising the relevant Trailing Twelve Quarters (after making appropriate adjustments to the Company’s net asset value at the beginning of each applicable calendar quarter for all issuances by the Company of shares of its common stock, including issuances pursuant to its dividend reinvestment plan, and distributions during the applicable calendar quarter); and |
| | | |
| ● | 15.0% of the aggregate pre-incentive fee net investment income in respect of the Trailing Twelve Quarters that exceeds the Catch-up Amount. |
Commencing with the quarter that begins immediately after the First Calendar Quarter, each income incentive fee became subject to an “Incentive Fee Cap” that in respect of any calendar quarter is an amount equal to 15.0% of the Cumulative Pre-Incentive Fee Net Return (as defined herein) during the Trailing Twelve Quarters less the aggregate income incentive fees that were paid to the Advisor in the preceding eleven calendar quarters (or portion thereof) comprising the relevant Trailing Twelve Quarters. In the event the Incentive Fee Cap is zero or a negative value then no income incentive fee shall be payable and if the Incentive Fee Cap is less than the amount of income incentive fee that would otherwise be payable, the amount of income incentive fee shall be reduced to an amount equal to the Incentive Fee Cap.
“Cumulative Pre-Incentive Fee Net Return” means (x) with respect to the First Calendar Quarter, the sum of pre-incentive fee net investment income in respect of the First Calendar Quarter, (y) with respect to the relevant Trailing Twelve Quarters, the pre-incentive fee net investment income in respect of the relevant Trailing Twelve Quarters minus any Net Capital Loss (as defined below), if any, in respect of the relevant Trailing Twelve Quarters. If, in any quarter, the Incentive Fee Cap is zero or a negative value, the Company will pay no income incentive fee to the Advisor for such quarter. If, in any quarter, the Incentive Fee Cap for such quarter is a positive value but is less than the income incentive fee that is payable to the Advisor for such quarter (before giving effect to the Incentive Fee Cap) calculated as described above, the Company will pay an income incentive fee to the Advisor equal to the Incentive Fee Cap for such quarter. If, in any quarter, the Incentive Fee Cap for such quarter is equal to or greater than the income incentive fee that is payable to the Advisor for such quarter (before giving effect to the Incentive Fee Cap) calculated as described above, the Company will pay an income incentive fee to the Advisor equal to the incentive fee calculated as described above for such quarter without regard to the Incentive Fee Cap.
“Net Capital Loss” in respect of a particular period means the difference, if positive, between (i) aggregate capital losses, whether realized or unrealized, in such period and (ii) aggregate capital gains, whether realized or unrealized, in such period.
These calculations are prorated for any period of less than three months and adjusted for any share issuances or repurchases during the relevant quarter. In no event will the amendments to the income incentive fee to include the three year income and total return lookback features allow the Advisor to receive greater cumulative income incentive fees under the Amended Investment Advisory Agreement than it would have under the Investment Advisory Agreement. Amounts waived by the Advisor pursuant to the Fee Waiver Agreement are not subject to recoupment by the Advisor.
The following is a graphical representation of the calculations of the income incentive fee:
Quarterly Incentive Fee on
Pre-Incentive Fee Net Investment Income
Prior to the IPO
(expressed as a percentage of the value of net assets)
| Pre-Incentive Fee Net Investment Income | | 0% | | 1.50% | | 1.6667% |
| Quarterly Incentive Fee | | ← 0% → | | ← 100% → | | ← 10% → |
Quarterly Incentive Fee on
Pre-Incentive Fee Net Investment Income
After to the IPO
(expressed as a percentage of the value of net assets)
| Pre-Incentive Fee Net Investment Income | | 0% | | 1.50% | | 1.7647% |
| Quarterly Incentive Fee | | ← 0% → | | ← 100% → | | ← 15% → |
Incentive Fee on Capital Gains
The incentive fee on capital gains (the “capital gains incentive fee”) is calculated and payable in arrears in cash as follows:
| ● | 15.0% of the Company’s realized capital gains, if any, on a cumulative basis from formation through the end of a given calendar year or upon termination of the Investment Advisory Agreement, computed net of all realized capital losses and unrealized capital depreciation on a cumulative basis, less the aggregate amount of any previously paid capital gain incentive fees. |
Payment of Incentive Fees
Prior to the IPO, any incentive fees earned by the Advisor accrued as earned but only became payable in cash to the Advisor upon closing of the IPO. The Company incurred incentive fees on income of $16.8 million that became payable upon closing of the IPO.
Administration Agreement
On February 5, 2021, we entered into an administration agreement (the “Administration Agreement”) with our Advisor, which serves as our administrator (the “Administrator”) and provides or oversees the performance of its required administrative services and professional services rendered by others, which will include (but are not limited to) accounting, payment of our expenses, legal, compliance, operations, technology and investor relations, preparation and filing of its tax returns, and preparation of financial reports provided to our stockholders and filed with the SEC.
On February 19, 2025, the Board approved an additional one-year term of the Administration Agreement through March 15, 2026.
We reimburse the Administrator for its costs and expenses incurred in performing its obligations under the Administration Agreement, which may include its allocable portion of office facilities, overhead, and compensation paid to or compensatory distributions received by its officers (including our Chief Compliance Officer and Chief Financial Officer) and its respective staff who provide services to the Company. As the Company reimburses the Administrator for its expenses, such costs (including the costs of sub-administrators) will be ultimately borne by common stockholders. The Administrator does not receive compensation from the Company other than reimbursement of its expenses. The Administration Agreement may be terminated by either party with 60 days’ written notice.
Since the inception of the Company, the Administrator has engaged sub-administrators to assist the Administrator in performing certain of its administrative duties. During this period, the Administrator has not sought reimbursement of its expenses other than expenses incurred by the sub-administrators. However, the Administrator has a contractual right to seek reimbursement for its costs and expenses incurred in performing its obligations under the Administration Agreement and may do so in the future. On March 28, 2023, the Administrator engaged Ultimus Fund Solutions, LLC under a sub-administration agreement. Under the terms of the sub-administration agreement, Ultimus Fund Solutions, LLC provides fund administration and fund accounting services. Since March 28, 2023, the Company has paid fees to Ultimus Fund Solutions, LLC, which constitute reimbursable expenses under the Administration Agreement. The Administrator may enter into additional sub-administration agreements with third parties to perform other administrative and professional services on behalf of the Administrator.
Risk Management
Broad Diversification. We diversify our investments by company, asset type, investment size and industry focus. Furthermore, we must meet certain diversification tests in order to qualify as a RIC for U.S. federal income tax purposes (the “Diversification Tests”). See “Item 1. Business — Material U.S. Federal Income Tax Considerations.”
Hedging. We may hedge against interest rate fluctuations by using standard hedging instruments such as futures, options and forward contracts subject to the requirements of the 1940 Act and to applicable CFTC regulations. While hedging activities may insulate us against adverse changes in interest rates, they may also limit our ability to participate in benefits of such changes with respect to our portfolio of investments. The Advisor will claim relief from CFTC registration and regulation as a commodity pool operator with respect to our operations, with the result that we will be limited in our ability to use futures contracts or options on futures contracts or engage in swap transactions. Specifically, we will be subject to strict limitations on using such derivatives other than for hedging purposes, whereby the use of derivatives not used solely for hedging purposes is generally limited to situations where (i) the aggregate initial margin and premiums required to establish such positions do not exceed five percent of the liquidation value of our portfolio, after taking into account unrealized profits and unrealized losses on any such contracts we have entered into; or (ii) the aggregate net notional value of such derivatives does not exceed 100% of the liquidation value of our portfolio.
Regulation as a Business Development Company
General
A BDC is a specialized investment vehicle that elects to be regulated under the 1940 Act as an investment company but is generally subject to less onerous requirements than other registered investment companies under a regime designed to encourage lending to U.S.-based small and mid-sized businesses. Unlike many similar types of investment vehicles that are restricted to being private entities, the stock of a BDC is permitted to trade in the public equity markets. BDCs are also eligible to elect to be treated as a RIC under Subchapter M of the Code. A RIC typically does not incur significant entity-level income taxes, because it is generally entitled to deduct distributions made to its stockholders.
Qualifying Assets
Under the 1940 Act, a BDC may not acquire any asset other than assets of the type listed in Section 55(a) of the 1940 Act, which are referred to as qualifying assets, unless, at the time the acquisition is made, qualifying assets represent at least 70% of the BDC’s total assets. The principal categories of qualifying assets relevant to our proposed business are the following:
| | (1) | Securities purchased in transactions not involving any public offering from the issuer of such securities, which issuer (subject to certain limited exceptions) is an eligible portfolio company, or from any person who is, or has been during the preceding 13 months, an affiliated person of an eligible portfolio company, or from any other person, subject to such rules as may be prescribed by the SEC. An eligible portfolio company is defined in the 1940 Act as any issuer which: |
| (a) | is organized under the laws of, and has its principal place of business in, the United States; |
| (b) | is not an investment company (other than a small business investment company wholly owned by the BDC) or a company that would be an investment company but for certain exclusions under the 1940 Act; and |
| (c) | satisfies either of the following: |
| (i) | does not have any class of securities listed on a national securities exchange or has any class of securities listed on a national securities exchange subject to a $250 million market capitalization maximum; or |
| (ii) | is controlled by a BDC or a group of companies including a BDC, the BDC actually exercises a controlling influence over the management or policies of the eligible portfolio company, and, as a result, the BDC has an affiliated person who is a director of the eligible portfolio company. |
| | (2) | Securities of any eligible portfolio company which we control. |
| | (3) | Securities purchased in a private transaction from a U.S. issuer that is not an investment company or from an affiliated person of the issuer, or in transactions incident thereto, if the issuer is in bankruptcy and subject to reorganization or if the issuer, immediately prior to the purchase of its securities, was unable to meet its obligations as they came due without material assistance other than conventional lending or financing arrangements. |
| | (4) | Securities of an eligible portfolio company purchased from any person in a private transaction if there is no ready market for such securities and we already own 60% of the outstanding equity of the eligible portfolio company. |
| | (5) | Securities received in exchange for or distributed on or with respect to securities described in (1) through (4) above, or pursuant to the exercise of warrants or rights relating to such securities. |
| | (6) | Cash, cash equivalents, U.S. government securities or high-quality debt securities maturing in one year or less from the time of investment. |
We may invest up to 30% of our portfolio opportunistically in “non-qualifying assets.”
Managerial Assistance to Portfolio Companies
In addition, a BDC must be organized and have its principal place of business in the United States and must be operated for the purpose of making investments in the types of securities described in (1), (2), or (3) above under “—Regulation as a Business Development Company—Qualifying Assets.” However, in order to count portfolio securities as qualifying assets for the purpose of the 70% test, the BDC must either control the issuer of the securities or must offer to make available to the issuer of the securities significant managerial assistance. However, when the BDC purchases securities in conjunction with one or more other persons acting together, one of the other persons in the group may make available such managerial assistance. Making available managerial assistance means, among other things, any arrangement whereby the BDC, through its directors, officers or employees, offers to provide, and, if accepted, does so provide, significant guidance and counsel concerning the management, operations or business objectives and policies of a portfolio company.
Temporary Investments
Pending investment in other types of “qualifying assets,” as described above, our investments may consist of cash, cash equivalents, U.S. government securities or high-quality debt securities maturing in one year or less from the time of investment, which we refer to, collectively, as temporary investments, so that 70% of our assets are qualifying assets.
Senior Securities and Indebtedness
We partially finance our investments with leverage in the form of borrowings under credit facilities and issuances of senior unsecured notes. We intend to further borrow under credit facilities and/or issue senior unsecured notes in the future in order to finance our investments. As of December 31, 2024, we had $858 million of indebtedness outstanding under our credit facilities and senior unsecured notes. See “Risk Factors — Risks Relating to Our Business and Structure — Provisions in our credit facilities and our senior unsecured notes contain various covenants, which, if not complied with, could accelerate our repayment obligations under such facilities, thereby materially and adversely affecting our liquidity, financial condition, results of operations and ability to pay distributions.”
We will be permitted, under specified conditions, to issue multiple classes of indebtedness and one class of stock senior to our shares of common stock if our asset coverage, as defined in the 1940 Act, is at least equal to 150% immediately after each such issuance. We are required to meet an asset coverage ratio of total assets (less total liabilities other than indebtedness) to total borrowings and other senior securities of at least 150%. If this ratio declines below 150%, we cannot incur additional leverage and could be required to sell a portion of our investments to repay some leverage when it is disadvantageous to do so. As defined in the 1940 Act, asset coverage of 150% means that for every $100 of net assets we hold, we may raise $200 from borrowing and issuing senior securities.
We currently intend to target asset coverage of 200% to 180% (which equates to a debt-to-equity ratio of 1.0x to 1.25x) but may alter this target based on market conditions. In addition, while any senior securities remain outstanding, we must make provisions to prohibit any distribution to our stockholders or the repurchase of such securities or shares unless we meet the applicable asset coverage ratios at the time of the distribution or repurchase. We may also borrow amounts up to 5% of the value of our total assets for temporary or emergency purposes without regard to asset coverage. Regulations governing our operations as a BDC will affect our ability to raise, and the method of raising, additional capital, which may expose us to risks.
Codes of Ethics
We and our Advisor have adopted a code of ethics pursuant to Rule 17j-1 under the 1940 Act that establishes procedures for personal investments and restricts certain personal securities transactions. Personnel subject to the joint code may invest in securities for their personal investment accounts, including securities that may be purchased or held by us, so long as such investments are made in accordance with the code’s requirements. In addition, we have adopted a code of ethics applicable to our Principal Executive Officer, Principal Accounting Officer and senior financial officers pursuant to Section 406 of the Sarbanes-Oxley Act of 2002. You may review or download the codes of ethics from the SEC’s Edgar database as part of our filings under www.sec.gov, or by written request to the following: Chief Compliance Officer, Kayne Anderson, 717 Texas Avenue, Suite 2200, Houston, TX 77002.
Compliance Policies and Procedures
We make investments alongside certain entities and accounts advised by our Advisor and its affiliates. Under the 1940 Act, we are prohibited from knowingly participating in certain joint transactions with our affiliates without the prior approval of the independent directors and, in some cases, prior approval by the SEC. However, we generally make investments alongside affiliated entities and accounts pursuant to exemptive relief granted by the SEC to us, our Advisor, and certain of our affiliates on August 10, 2023. Pursuant to such exemptive relief, and subject to certain conditions, we are permitted to co-invest in the same security with our affiliates in a manner that is consistent with our investment objective, investment strategy, regulatory consideration and other relevant factors. If opportunities arise that would otherwise be appropriate for us and an affiliate to purchase different securities in the same issuer, our Advisor will need to decide which account will proceed with such investment. Our Advisor’s investment allocation policy incorporates the conditions of exemptive relief to seek to ensure that investment opportunities are allocated in a manner that is fair and equitable.
We will be periodically examined by the SEC for compliance with the 1940 Act.
We are required to provide and maintain a bond issued by a reputable fidelity insurance company to protect us against larceny and embezzlement. Furthermore, as a BDC, we will be prohibited from protecting any director or officer against any liability to us or our stockholders arising from willful misfeasance, bad faith, gross negligence or reckless disregard of the duties involved in the conduct of such person’s office.
We and our Advisor have adopted and implemented written policies and procedures reasonably designed to detect and prevent violation of the federal securities laws and will be required to review these compliance policies and procedures annually for their adequacy and the effectiveness of their implementation and designate a chief compliance officer to be responsible for administering the policies and procedures.
Sarbanes-Oxley Act
The Sarbanes-Oxley Act of 2002, as amended, or the Sarbanes-Oxley Act, imposes a variety of regulatory requirements on companies with a class of securities registered under the Exchange Act and their insiders. Many of these requirements affect us. For example:
| | ● | pursuant to Rule 13a-14 under the Exchange Act our principal executive officer and principal financial officer must certify the accuracy of the financial statements contained in our periodic reports; |
| | ● | pursuant to Item 307 under Regulation S-K under the Securities Act our periodic reports must disclose our conclusions about the effectiveness of our disclosure controls and procedures; |
| | ● | pursuant to Rule 13a-15 of the Exchange Act, our management must prepare an annual report regarding its assessment of our internal control over financial reporting and must obtain an audit of the effectiveness of internal control over financial reporting performed by our independent registered public accounting firm; and |
| | ● | pursuant to Item 308 of Regulation S-K under the Securities Act and Rule 13a-15 under the Exchange Act, our periodic reports must disclose whether there were significant changes in our internal controls over financial reporting or in other factors that could significantly affect these controls subsequent to the date of their evaluation, including any corrective actions with regard to significant deficiencies and material weaknesses. |
The Sarbanes-Oxley Act requires us to review our current policies and procedures to determine whether we comply with the Sarbanes-Oxley Act and the regulations promulgated under such act. We will continue to monitor our compliance with all regulations that are adopted under the Sarbanes-Oxley Act and will take actions necessary to ensure that we comply with that act in the future.
Commodities Exchange Act
The Commodity Futures Trading Commission (“CFTC”) and the SEC have issued final rules establishing that certain swap transactions are subject to CFTC regulation. Engaging in such swap transactions may cause us to fall within the definition of “commodity pool” under the Commodity Exchange Act and related CFTC regulations. The Advisor will rely on an exclusion from the definition of a CPO under CFTC Rule 4.5 because of our limited trading in commodity interests, and the Advisor will operate us as if we were not registered as a CPO, so that unlike a registered CPO, with respect to us, the Advisor is not required to deliver a Disclosure Document or an Annual Report (as those terms are used in the CFTC’s rules) to shareholders.
Proxy Voting Policies and Procedures
We have delegated our proxy voting responsibility to our Advisor. A summary of the Proxy Voting Policies and Procedures of our Advisor are set forth below. These policies and procedures will be reviewed periodically by our Advisor and, subsequent to our election to be regulated as a BDC, our non-interested directors, and, accordingly, are subject to change. For purposes of these Proxy Voting Policies and Procedures described below, “we” “our” and “us” refers to our Advisor.
An investment advisor registered under the Advisers Act has a fiduciary duty to act solely in the best interests of its clients. As part of this duty, we recognize that we must vote the Company’s securities in a timely manner free of conflicts of interest and in the best interests of the Company and its stockholders.
These policies and procedures for voting proxies for our investment advisory clients are intended to comply with Section 206 of, and Rule 206(4)-6 under, the Advisers Act.
We will vote proxies relating to our portfolio securities in what we believe to be the best interest of our stockholders. To ensure that our vote is not the product of a conflict of interest, we will require that: (1) anyone involved in the decision making process disclose to our chief compliance officer any potential conflict that he or she is aware of and any contact that he or she has had with any interested party regarding a proxy vote; and (2) employees involved in the decision making process or vote administration are prohibited from revealing how we intend to vote on a proposal in order to reduce any attempted influence from interested parties.
You may obtain information about how we voted proxies by making a written request for proxy voting information to: KA Credit Advisors, LLC, 717 Texas Avenue, Suite 2200, Houston, TX 77002, Attention: Chief Compliance Officer.
Employees
We do not have any employees. Our day-to-day investment operations are managed by our Advisor and the Administrator. Any compensation paid for services relating to our financial reporting and compliance functions will be paid by our Administrator, subject to reimbursement by us of an allocable portion of office facilities, overhead, and compensation paid to or compensatory distributions received by our officers (including our Chief Compliance Officer and Chief Financial Officer) and their respective staff who provide services to us. As we reimburse the Administrator for its expenses, we will indirectly bear such cost.
Our Administrator engaged Ultimus Fund Solutions, LLC under a sub-administration agreement to assist the Administrator in performing certain of its administrative duties. The Administrator may enter into additional sub-administration agreements with third-parties to perform other administrative and professional services on behalf of the Administrator. We will pay the fees associated with such functions on a direct basis without profit to our Administrator.
Privacy Principles
We are committed to maintaining the privacy of our investors and to safeguarding their non-public personal information. The following information is provided to help you understand what personal information we collect, how we protect that information and why, in certain cases, we may share information with select other parties.
We do not disclose any non-public personal information about our stockholders or a former stockholder to anyone, except as permitted by law or as is necessary in order to service stockholder accounts (for example, to a transfer agent or third-party administrator).
We restrict access to non-public personal information about our stockholders to employees of our Advisor and its affiliates with a legitimate business need for the information. We will maintain physical, electronic and procedural safeguards designed to protect the non-public personal information of our stockholders.
Reporting Obligations
As a BDC, we make available on our website (www.kaynebdc.com) our annual reports on Form 10-K, quarterly reports on Form 10-Q and our current reports on Form 8-K. Shareholders and the public may also read and copy any materials we file with the SEC at the SEC’s Public Reference Room, 100 F Street, N.E., Washington, D.C. 20549 and on the SEC’s website at www.sec.gov. Information on the operation of the SEC’s public reference room may be obtained by calling the SEC at (202) 551-8090 or (800) SEC-0330. The reference to our website and the SEC’s website is an inactive textual reference only, and the information should not be considered a part of this Form 10-K.
Material U.S. Federal Income Tax Considerations
The following discussion is a general summary of the material U.S. federal income tax considerations applicable to us and to an investment in our shares of common stock. This summary does not purport to be a complete description of the U.S. federal income tax considerations applicable to such an investment. For example, we have not described certain considerations that may be relevant to certain types of holders subject to special treatment under U.S. federal income tax laws, including persons who hold our common stock as part of a straddle or hedging, integrated or constructive sale transaction, stockholders subject to the alternative minimum tax, tax-exempt organizations, insurance companies, brokers or dealers in securities, traders in securities that elect to mark-to-market their securities holdings, pension plans and trusts, persons that have a functional currency (as defined in Section 985 of the Code) other than the U.S. dollar, U.S. expatriates, regulated investment companies, real estate investment trusts, personal holding companies, persons who acquire an interest in the Company in connection with the performance of services and financial institutions. Such persons should consult with their own tax advisers as to the U.S. federal income tax consequences of an investment in our shares of common stock, which may differ substantially from those described herein. This summary assumes that investors hold our shares of common stock as capital assets (within the meaning of Section 1221 of the Code).
The discussion is based upon the Code, Treasury regulations, and administrative and judicial interpretations, each as of the date of the filing of this annual report on Form 10-K and all of which are subject to change, possibly retroactively, which could affect the continuing validity of this discussion. We have not sought and will not seek any ruling from the Internal Revenue Service, or the IRS, regarding any offering of our shares of common stock. This summary does not discuss any aspects of U.S. estate or gift tax or foreign, state or local tax. It does not discuss the special treatment under U.S. federal income tax laws that could result if we invested in tax-exempt securities or certain other investment assets. For purposes of this discussion, references to “dividends” are to dividends within the meaning of the U.S. federal income tax laws and associated regulations and may include amounts subject to treatment as a return of capital under section 19(a) of the 1940 Act. A return of capital distribution is a return to stockholders of a portion of their original investment in the Company and does not represent income or capital gains.
A “U.S. stockholder” is a beneficial owner of our shares of common stock that is for U.S. federal income tax purposes:
| | ● | a citizen or individual resident of the United States; |
| | ● | a corporation, or other entity treated as a corporation for U.S. federal income tax purposes, created or organized in or under the laws of the United States or any state thereof or the District of Columbia; |
| | ● | an estate, the income of which is subject to U.S. federal income taxation regardless of its source; or |
| | ● | a trust if either a U.S. court can exercise primary supervision over its administration and one or more U.S. persons have the authority to control all of its substantial decisions or the trust was in existence on August 20, 1996, was treated as a U.S. person prior to that date, and has made a valid election to be treated as a U.S. person. |
A “non-U.S. stockholder” is a beneficial owner of our shares of common stock that is neither a U.S. stockholder nor a partnership for U.S. federal income tax purposes.
If a partnership (including an entity treated as a partnership for U.S. federal income tax purposes) holds shares of common stock, the tax treatment of a partner in the partnership will generally depend upon the status of the partner and the activities of the partnership. A prospective investor that is a partner in a partnership that will hold shares of common stock should consult its tax advisors with respect to the purchase, ownership and disposition of shares of common stock.
Tax matters are very complicated and the tax consequences to an investor of an investment in our shares of common stock will depend on the facts of his, her or its particular situation. We encourage investors to consult their own tax advisors regarding the specific consequences of such an investment, including tax reporting requirements, the applicability of U.S. federal, state, local and foreign tax laws, eligibility for the benefits of any applicable tax treaty, and the effect of any possible changes in the tax laws.
Election to Be Taxed as a RIC
We intend to elect to be treated as a RIC under Subchapter M of the Code. As a RIC, we generally will not have to pay corporate-level U.S. federal income taxes on any net ordinary income or capital gains that we timely distribute to our stockholders as dividends. To qualify as a RIC, we must, among other things, meet certain source-of-income and asset diversification requirements (as described below). In addition, to qualify for RIC treatment, we must distribute to our stockholders, for each taxable year, dividends of an amount at least equal to the sum of 90% of our “investment company taxable income,” which is generally our net ordinary income plus the excess of realized net short-term capital gains over realized net long-term capital losses and determined without regard to any deduction for dividends paid, and 90% of our net tax-exempt interest income, if any (the “Annual Distribution Requirement”). Although not required for us to maintain our RIC tax status, in order to preclude the imposition of a 4% nondeductible federal excise tax imposed on RICs, we must distribute to our stockholders in respect of each calendar year dividends of an amount at least equal to the sum of (1) 98% of our net ordinary income (taking into account certain deferrals and elections) for the calendar year, (2) 98.2% of the excess (if any) of our realized capital gains over our realized capital losses, or capital gain net income (adjusted for certain ordinary losses), generally for the one-year period ending on October 31 of the calendar year and (3) the sum of any net ordinary income plus capital gains net income for preceding years that were not distributed during such years and on which we paid no federal income tax (the “Excise Tax Avoidance Requirement”).
Taxation as a RIC
If we:
| | ● | satisfy the Annual Distribution Requirement; |
then we will not be subject to U.S. federal income tax on the portion of our investment company taxable income and net capital gain, defined as net long-term capital gains in excess of net short-term capital losses, we distribute to stockholders. As a RIC, we will be subject to U.S. federal income tax at regular corporate rates on any net income or net capital gain not distributed (or deemed distributed) as dividends to our stockholders.
In order to qualify as a RIC for U.S. federal income tax purposes, we must, among other things:
| | ● | have in effect an election to be treated as a BDC under the 1940 Act at all times during each taxable year; |
| | ● | derive in each taxable year at least 90% of our gross income from dividends, interest, payments with respect to certain securities loans, gains from the sale of stock or other securities, or other income derived with respect to our business of investing in such stock or securities, or currencies, other income derived with respect to its business of investing in such stock, securities or currencies and net income derived from interests in “qualified publicly traded partnerships” (partnerships that are traded on an established securities market or tradable on a secondary market, other than partnerships that derive 90% of their income from interest, dividends and other permitted RIC income) (the “90% Income Test”); and |
| | ● | diversify our holdings so that at the end of each quarter of the taxable year: |
| | ● | at least 50% of the value of our assets consists of cash, cash equivalents, U.S. government securities, securities of other RICs, and other securities if such other securities of any one issuer do not represent more than 5% of the value of our assets or more than 10% of the outstanding voting securities of the issuer; and |
| | ● | no more than 25% of the value of our assets is invested in the securities, other than U.S. government securities or securities of other RICs, of one issuer or of two or more issuers that are controlled, as determined under applicable tax rules, by us and that are engaged in the same or similar or related trades or businesses or in the securities of one or more qualified publicly traded partnerships. |
We may be required to recognize taxable income in circumstances in which we do not receive cash. For example, if we hold debt obligations that are treated under applicable tax rules as having original issue discount (such as debt instruments with PIK interest or, in certain cases, increasing interest rates or issued with warrants), we must include in income each year a portion of the original issue discount that accrues over the life of the obligation, regardless of whether cash representing such income is received by us in the same taxable year. We may also have to include in income other amounts that we have not yet received in cash, such as PIK interest and deferred loan origination fees that are paid after origination of the loan. Because any original issue discount or other amounts accrued will be included in our investment company taxable income for the year of accrual, we may be required to make a distribution to our shareholders in order to satisfy the Annual Distribution Requirement, even though we will not have received the corresponding cash amount.
We may invest in partnerships, including qualified publicly traded partnerships, which may result in our being subject to state, local or foreign income, franchise or other tax liabilities.
In addition, as a RIC, we are subject to ordinary income and capital gain distribution requirements under U.S. federal excise tax rules for each calendar year (as discussed above). If we do not meet the required distributions, we will be subject to a 4% nondeductible federal excise tax on the undistributed amount. The failure to meet U.S. federal excise tax distribution requirements will not cause us to lose our RIC status. Although we currently intend to make sufficient distributions each taxable year to satisfy the U.S. federal excise tax requirements, under certain circumstances, we may choose to retain taxable income or capital gains in excess of current year distributions into the next tax year in an amount less than what would trigger payments of federal income tax under Subchapter M of the Code. We may then be required to pay a 4% excise tax on such income or capital gains.
A RIC is limited in its ability to deduct expenses in excess of its investment company taxable income. If our deductible expenses in a given taxable year exceed our investment company taxable income, we may incur a net operating loss for that taxable year. However, a RIC is not permitted to carry forward net operating losses to subsequent taxable years and such net operating losses do not pass through to its stockholders. In addition, deductible expenses can be used only to offset investment company taxable income, not net capital gain. A RIC may not use any net capital losses (that is, the excess of realized capital losses over realized capital gains) to offset its investment company taxable income, but may carry forward such net capital losses, and use them to offset future capital gains, indefinitely. Due to these limits on deductibility of expenses and net capital losses, we may for tax purposes have aggregate taxable income for several taxable years that we are required to distribute and that is taxable to our stockholders even if such taxable income is greater than the net income we actually earn during those taxable years.
Any underwriting fees paid by us with respect to our own stock are not deductible. We may be required to recognize taxable income in circumstances in which we do not receive cash. For example, if we hold debt obligations that are treated under applicable tax rules as having OID (such as debt instruments with PIK interest or, in certain cases, with increasing interest rates or issued with warrants), we must include in income each year a portion of the OID that accrues over the life of the obligation, regardless of whether cash representing such income is received by us in the same taxable year. Because any OID accrued will be included in our investment company taxable income for the taxable year of accrual, we may be required to make a distribution to our stockholders in order to satisfy the Annual Distribution Requirement, even though we will not have received any corresponding cash amount. Furthermore, a portfolio company in which we hold equity or debt instruments may face financial difficulty that requires us to work out, modify, or otherwise restructure such equity or debt instruments. Any such restructuring could, depending upon the terms of the restructuring, cause us to incur unusable or nondeductible losses or recognize future non-cash taxable income.
Certain of our investment practices may be subject to special and complex U.S. federal income tax provisions that may, among other things, (1) treat dividends that would otherwise constitute qualified dividend income as non-qualified dividend income, (2) treat dividends that would otherwise be eligible for the corporate dividends received deduction as ineligible for such treatment, (3) disallow, suspend or otherwise limit the allowance of certain losses or deductions, (4) convert lower-taxed long-term capital gain into higher-taxed short-term capital gain or ordinary income, (5) convert an ordinary loss or a deduction into a capital loss (the deductibility of which is more limited), (6) cause us to recognize income or gain without a corresponding receipt of cash, (7) adversely affect the time as to when a purchase or sale of stock or securities is deemed to occur, (8) adversely alter the characterization of certain complex financial transactions and (9) produce income that will not be qualifying income for purposes of the 90% Income Test. We intend to monitor our transactions and may make certain tax elections to mitigate the effect of these provisions and prevent our ability to be subject to tax as a RIC.
Gain or loss realized by us from warrants acquired by us as well as any loss attributable to the lapse of such warrants generally will be treated as capital gain or loss. Such gain or loss generally will be long term or short term, depending on how long we held a particular warrant.
Although we do not presently expect to do so, we are authorized to borrow funds and to sell assets in order to satisfy distribution requirements. However, under the 1940 Act, we are not permitted to make distributions to our stockholders while our debt obligations and other senior securities are outstanding unless certain “asset coverage” tests are met. See “Item 1. Business — Regulation as a Business Development Company — Senior Securities and Indebtedness.” Moreover, our ability to dispose of assets to meet our distribution requirements may be limited by (1) the illiquid nature of our portfolio and/or (2) other requirements relating to our qualification as a RIC, including the Diversification Tests. If we dispose of assets in order to meet the Annual Distribution Requirement or the Excise Tax Avoidance Requirement, we may make such dispositions at times that, from an investment standpoint, are not advantageous.
Some of the income and fees that we may recognize, such as fees for providing managerial assistance, certain fees earned with respect to our investments, income recognized in a work-out or restructuring of a portfolio investment, or income recognized from an equity investment in an operating partnership, will not satisfy the 90% Income Test. In order to manage the risk that such income and fees might disqualify us as a RIC for a failure to satisfy the 90% Income Test, we may be required to recognize such income and fees indirectly through one or more entities treated as corporations for U.S. federal income tax purposes (therefore, received amounts treated as dividends of such corporations). Such corporations will be required to pay U.S. corporate income tax on their earnings, which ultimately will reduce our return on such income and fees.
Failure to Qualify as a RIC
If we were unable to qualify for treatment as a RIC and are unable to cure the failure, for example, by disposing of certain investments quickly or raising additional capital to prevent the loss of RIC status, we would be subject to tax on all of our taxable income at regular corporate rates. The Code provides some relief from RIC disqualification due to failures to comply with the 90% Income Test and the Diversification Tests, although there may be additional taxes due in such cases. We cannot assure you that we would qualify for any such relief should we fail the 90% Income Test or the Diversification Tests.
Should failure occur, not only would all our taxable income be subject to tax at regular corporate rates, we would not be able to deduct dividend distributions to stockholders, nor would they be required to be made. Distributions, including distributions of net long-term capital gain, would generally be taxable to our stockholders as ordinary dividend income to the extent of our current and accumulated earnings and profits. Subject to certain limitations under the Code, certain corporate stockholders would be eligible to claim a dividends received deduction with respect to such dividends and non-corporate stockholders would generally be able to treat such dividends as “qualified dividend income,” which is subject to reduced rates of U.S. federal income tax. Distributions in excess of our current and accumulated earnings and profits would be treated first as a return of capital to the extent of the stockholder’s tax basis, and any remaining distributions would be treated as a capital gain. If we fail to qualify as a RIC, we may be subject to regular corporate tax on any net built-in gains with respect to certain of our assets (i.e., the excess of the aggregate gains, including items of income, over aggregate losses that would have been realized with respect to such assets if we had been liquidated) that we elect to recognize on requalification or when recognized over the next five taxable years.
The remainder of this discussion assumes that we qualify as a RIC and have satisfied the Annual Distribution Requirement for each taxable year.
Taxation of U.S. Stockholders
Distributions by us generally are taxable to U.S. stockholders as ordinary income or capital gains. Distributions of our “investment company taxable income” (which is, generally, our net ordinary income plus net short-term capital gains in excess of net long-term capital losses) will be taxable as ordinary income to U.S. stockholders to the extent of our current or accumulated earnings and profits, whether paid in cash or reinvested in additional shares of common stock. To the extent such distributions paid by us to non-corporate stockholders (including individuals) are attributable to dividends from U.S. corporations and certain qualified foreign corporations and if certain holding period requirements are met, such distributions generally will be treated as qualified dividend income and generally eligible for a maximum U.S. federal tax rate of either 15% or 20%, depending on whether the individual stockholder’s income exceeds certain threshold amounts, and if other applicable requirements are met, such distributions generally will be eligible for the corporate dividends received deduction to the extent such dividends have been paid by a U.S. corporation. In this regard, it is anticipated that distributions paid by us will generally not be attributable to dividends and, therefore, generally will not qualify for the preferential maximum U.S. federal tax rate applicable to non-corporate stockholders as well as will not be eligible for the corporate dividends received deduction.
Distributions of our net capital gains (which is generally our realized net long-term capital gains in excess of realized net short-term capital losses) properly reported by us as “capital gain dividends” will be taxable to a U.S. stockholder as long-term capital gains (currently generally at a maximum rate of either 15% or 20%, depending on whether the individual stockholder’s income exceeds certain threshold amounts) in the case of individuals, trusts or estates, regardless of the U.S. stockholder’s holding period for his, her or its shares of common stock and regardless of whether paid in cash or reinvested in additional shares of common stock. Distributions in excess of our earnings and profits first will reduce a U.S. stockholder’s adjusted tax basis in such stockholder’s shares of common stock and, after the adjusted basis is reduced to zero, will constitute capital gains to such U.S. stockholder. Stockholders receiving dividends or distributions in the form of additional shares of common stock purchased in the market should be treated for U.S. federal income tax purposes as receiving a distribution in an amount equal to the amount of money that the stockholders receiving cash dividends or distributions will receive, and should have a cost basis in the shares received equal to such amount. Stockholders receiving dividends in newly issued shares of common stock will be treated as receiving a distribution equal to the value of the shares received and should have a cost basis of such amount.
Although we currently intend to distribute any net capital gains at least annually, we may in the future decide to retain some or all of our net capital gains but designate the retained amount as a “deemed distribution.” In that case, among other consequences, we will pay tax on the retained amount, each U.S. stockholder will be required to include their share of the deemed distribution in income as if it had been distributed to the U.S. stockholder, and the U.S. stockholder will be entitled to claim a credit or refund equal to their allocable share of the tax paid on the deemed distribution by us. The amount of the deemed distribution net of such tax will be added to the U.S. stockholder’s tax basis for their shares of common stock. Since we expect to pay tax on any retained net capital gains at our regular corporate tax rate, and since that rate is in excess of the maximum rate currently payable by individuals on long-term capital gains, the amount of tax that individual stockholders will be treated as having paid and for which they will receive a credit or refund will exceed the tax they owe on the retained net capital gain. Such excess generally may be claimed as a credit against the U.S. stockholder’s other U.S. federal income tax obligations or may be refunded to the extent it exceeds a stockholder’s liability for U.S. federal income tax. A stockholder that is not subject to U.S. federal income tax or otherwise required to file a U.S. federal income tax return would be required to file a U.S. federal income tax return on the appropriate form in order to claim a refund for the taxes we paid. In order to utilize the deemed distribution approach, we must provide written notice to our stockholders prior to the expiration of 60 days after the close of the relevant taxable year. We cannot treat any of our investment company taxable income as a “deemed distribution.”
For purposes of determining (1) whether the Annual Distribution Requirement is satisfied for any tax year and (2) the amount of capital gain dividends paid for that tax year, we may, under certain circumstances, elect to treat a dividend that is paid during the following tax year as if it had been paid during the tax year in question. If we make such an election, the U.S. stockholder will still be treated as receiving the dividend in the tax year in which the distribution is made. However, any dividend declared by us in October, November or December of any calendar year, payable to stockholders of record on a specified date in such a month and actually paid during January of the following calendar year, will be treated as if it had been received by our U.S. stockholders on December 31 of the calendar year in which the dividend was declared.
With respect to the reinvestment of dividends, if a U.S. Shareholder owns shares of common stock registered in its own name, the U.S. Shareholder will have all cash distributions automatically reinvested in additional shares of common stock unless the U.S. Shareholder opts out of the reinvestment of dividends by delivering a written notice to our dividend paying agent prior to the record date of the next dividend or distribution. Any distributions reinvested will nevertheless remain taxable to the U.S. Shareholder. The U.S. Shareholder will have an adjusted basis in the additional shares of common stock purchased through the reinvestment equal to the amount of the reinvested distribution. The additional shares of common stock will have a new holding period commencing on the day following the day on which the shares are credited to the U.S. Shareholder’s account.
If an investor purchases shares of common stock shortly before the record date of a distribution, the price of the shares of common stock will include the value of the distribution and the investor will be subject to tax on the distribution even though it represents a return of their investment.
A stockholder generally will recognize taxable gain or loss if the stockholder sells or otherwise disposes of their shares of common stock. Any gain arising from such sale or disposition generally will be treated as long-term capital gain or loss if the stockholder has held their shares of common stock for more than one year. Otherwise, it would be classified as short-term capital gain or loss. However, any capital loss arising from the sale or disposition of shares of common stock held for six months or less will be treated as long-term capital loss to the extent of the amount of capital gain dividends received, or undistributed capital gain deemed received, with respect to such shares of common stock. In addition, all or a portion of any loss recognized upon a disposition of shares of common stock may be disallowed if other shares of common stock are purchased (whether through reinvestment of distributions or otherwise) within 30 days before or after the disposition. In such a case, the basis of shares of common stock acquired will be increased to reflect the disallowed loss.
In general, individual U.S. stockholders are subject to a maximum U.S. federal income tax rate of either 15% or 20% (depending on whether the individual U.S. stockholder’s income exceeds certain threshold amounts) on their net capital gain, i.e., the excess of realized net long-term capital gain over realized net short-term capital loss for a taxable year, including a long-term capital gain derived from an investment in our shares of common stock. Such rate is lower than the maximum federal income tax rate on ordinary taxable income currently payable by individuals. Corporate U.S. stockholders currently are subject to U.S. federal income tax on net capital gain at the maximum 21% rate also applied to ordinary income. Non-corporate stockholders incurring net capital losses for a tax year (i.e., net capital losses in excess of net capital gains) generally may deduct up to $3,000 of such losses against their ordinary income each tax year; any net capital losses of a non-corporate stockholder in excess of $3,000 generally may be carried forward and used in subsequent tax years as provided in the Code. Corporate stockholders generally may not deduct any net capital losses for a tax year, but may carry back such losses for three tax years or carry forward such losses for five tax years.
We will send to each of our U.S. stockholders, as promptly as possible after the end of each calendar year, a notice detailing, on a per share and per distribution basis, the amounts includible in such U.S. stockholder’s taxable income for such year as ordinary income and as long-term capital gain. In addition, the U.S. federal tax status of each calendar year’s distributions generally will be reported to the IRS. Distributions may also be subject to additional state, local and foreign taxes depending on a U.S. stockholder’s particular situation. Dividends distributed by us generally will not be eligible for the dividends-received deduction or the lower tax rates applicable to certain qualified dividends.
Backup withholding, currently at a rate of 24%, may be applicable to all taxable distributions to any non-corporate U.S. stockholder (1) who fails to furnish us with a correct taxpayer identification number or a certificate that such stockholder is exempt from backup withholding or (2) with respect to whom the IRS notifies us that such stockholder has failed to properly report certain interest and dividend income to the IRS and to respond to notices to that effect. An individual’s taxpayer identification number is his or her social security number. Any amount withheld under backup withholding is allowed as a credit against the U.S. stockholder’s U.S. federal income tax liability and may entitle such stockholder to a refund, provided that proper information is timely provided to the IRS.
If a U.S. stockholder recognizes a loss with respect to shares of common stock of $2 million or more for an individual stockholder or $10 million or more for a corporate stockholder, the stockholder must file with the IRS a disclosure statement on Form 8886. Direct stockholders of portfolio securities are in many cases exempted from this reporting requirement, but under current guidance, stockholders of a RIC are not exempted. The fact that a loss is reportable under these regulations does not affect the legal determination of whether the taxpayer’s treatment of the loss is proper. U.S. stockholders should consult their tax advisors to determine the applicability of these regulations in light of their specific circumstances.
A U.S. Shareholder that is a tax-exempt organization for U.S. federal income tax purposes and therefore generally exempt from U.S. federal income taxation may nevertheless be subject to taxation to the extent that it is considered to derive unrelated business taxable income (“UBTI”). The direct conduct by a tax-exempt U.S. Shareholder of the activities we propose to conduct could give rise to UBTI. However, a BDC (and RIC) is a corporation for U.S. federal income tax purposes and its business activities generally will not be attributed to its shareholders for purposes of determining their treatment under current law. Therefore, a tax-exempt U.S. Shareholder generally should not be subject to U.S. taxation solely as a result of the shareholder’s ownership of our shares of common stock and receipt of dividends with respect to such common stock. Moreover, under current law, if we incur indebtedness, such indebtedness will not be attributed to a tax-exempt U.S. Shareholder. Therefore, a tax-exempt U.S. Shareholder should not be treated as earning income from “debt-financed property” and dividends we pay should not be treated as “unrelated debt-financed income” solely as a result of indebtedness that we incur. Legislation has been introduced in Congress in the past, and may be introduced again in the future, which would change the treatment of “blocker” investment vehicles interposed between tax-exempt investors and non-qualifying investments if enacted. In the event that any such proposals were to be adopted and applied to BDCs (and RICs), the treatment of dividends payable to tax-exempt investors could be adversely affected. In addition, special rules would apply if we were to invest in certain real estate mortgage investment conduits, which we do not currently plan to do, that could result in a tax-exempt U.S. Shareholder recognizing income that would be treated as UBTI.
An additional 3.8% federal tax is imposed on certain net investment income (including ordinary dividends and capital gain distributions received from us and net gains from redemptions or other taxable dispositions of our shares) of U.S. individuals, estates and trusts to the extent that such person’s “modified adjusted gross income” (in the case of an individual) or “adjusted gross income” (in the case of an estate or trust) exceed certain threshold amounts.
Taxation of Non-U.S. Stockholders
The following discussion only applies to certain non-U.S. stockholders. Whether an investment in the shares of common stock is appropriate for a non-U.S. stockholder will depend upon that person’s particular circumstances. An investment in the shares of common stock by a non-U.S. stockholder may have adverse tax consequences. Non-U.S. stockholders should consult their tax advisors before investing in our shares of common stock.
Subject to the discussion below, distributions of our “investment company taxable income” to non-U.S. stockholders (including interest income, net short-term capital gain or foreign-source dividend and interest income, which generally would be free of withholding if paid to non-U.S. stockholders directly) will be subject to withholding of U.S. federal tax at a 30% rate (or lower rate provided by an applicable treaty) to the extent of our current and accumulated earnings and profits unless the distributions are effectively connected with a U.S. trade or business of the non-U.S. stockholder (and, if treaty applies, are attributable to a U.S. permanent establishment of the non-U.S. stockholder), in which case the distributions will generally be subject to U.S. federal income tax at the rates applicable to U.S. persons. In that case, we will not be required to withhold U.S. federal tax if the non-U.S. stockholder complies with applicable certification and disclosure requirements such as providing IRS Form W-8ECI). Special certification requirements apply to a non-U.S. stockholder that is a foreign partnership or a foreign trust, and such entities are urged to consult their own tax advisors.
Certain properly reported dividends received by a non-U.S. stockholder generally are exempt from U.S. federal withholding tax when they (1) are paid in respect of our “qualified net interest income” (generally, our U.S. source interest income, other than certain contingent interest and interest from obligations of a corporation or partnership in which we are at least a 10% stockholder, reduced by expenses that are allocable to such income), or (2) are paid in connection with our “qualified short-term capital gains” (generally, the excess of our net short-term capital gain over our long-term capital loss for a tax year) as well as if certain other requirements are satisfied. Nevertheless, it should be noted that in the case of shares of our stock held through an intermediary, the intermediary may have withheld U.S. federal income tax even if we reported the payment as an interest-related dividend or short-term capital gain dividend. Moreover, depending on the circumstances, we may report all, some or none of our potentially eligible dividends as derived from such qualified net interest income or as qualified short-term capital gains, or treat such dividends, in whole or in part, as ineligible for this exemption from withholding.
Actual or deemed distributions of our net capital gains to a non-U.S. stockholder, and gains realized by a non-U.S. stockholder upon the sale of our shares of common stock, will not be subject to U.S. federal withholding tax and generally will not be subject to U.S. federal income tax unless the distributions or gains, as the case may be, are effectively connected with a U.S. trade or business of the non-U.S. stockholder and, if an income tax treaty applies, are attributable to a permanent establishment maintained by the non-U.S. stockholder in the United States or, in the case of an individual non-U.S. stockholder, the stockholder is present in the United States for 183 days or more during the year of the sale or capital gain dividend and certain other conditions are met.
If we distribute our net capital gains in the form of deemed rather than actual distributions (which we may do in the future), a non-U.S. stockholder will be entitled to a U.S. federal income tax credit or tax refund equal to the stockholder’s allocable share of the tax we pay on the capital gains deemed to have been distributed. In order to obtain the refund, the non-U.S. stockholder must obtain a U.S. taxpayer identification number and file a U.S. federal income tax return even if the non-U.S. stockholder would not otherwise be required to obtain a U.S. taxpayer identification number or file a U.S. federal income tax return. For a corporate non-U.S. stockholder, distributions (both actual and deemed), and gains realized upon the sale of our shares of common stock that are effectively connected with a U.S. trade or business may, under certain circumstances, be subject to an additional “branch profits tax” at a 30% rate (or at a lower rate if provided for by an applicable treaty).
A non-U.S. stockholder who is a non-resident alien individual, and who is otherwise subject to withholding of U.S. federal income tax, may be subject to information reporting and backup withholding of U.S. federal income tax on dividends unless the non-U.S. stockholder provides us or the dividend paying agent with a U.S. nonresident withholding tax certification (e.g., an IRS Form W-8BEN, IRS Form W-8BEN-E, or an acceptable substitute form) or otherwise meets documentary evidence requirements for establishing that it is a non-U.S. stockholder or otherwise establishes an exemption from backup withholding.
Withholding of U.S. tax (at a 30% rate) is required by the Foreign Account Tax Compliance Act, or FATCA, provisions of the Code with respect to payments of dividends made to certain non-U.S. entities that fail to comply (or be deemed compliant) with extensive new reporting and withholding requirements designed to inform the U.S. Department of the Treasury of U.S.-owned foreign investment accounts. Under proposed U.S. Treasury regulations, which may be relied upon until final U.S. Treasury regulations are published, there is no FATCA withholding on gross proceeds from the sale of disposition of shares of common stock or on certain capital gain distributions. Stockholders may be requested to provide additional information to enable the applicable withholding agent to determine whether withholding is required.
An investment in shares by a non-U.S. person may also be subject to U.S. federal estate tax. Non-U.S. persons should consult their own tax advisors with respect to the U.S. federal income tax, U.S. federal estate tax, withholding tax, and state, local and foreign tax consequences of acquiring, owning or disposing of our shares of common stock.
Item 1A. Risk Factors
Investing in our shares of common stock involves a number of significant risks. Before you invest in our shares of common stock, you should be aware of various risks, including those described below. The risks set out below are not the only risks we face. Additional risks and uncertainties not presently known to us or not presently deemed material by us may also impair our business, operations and performance. If any of the following events occur, our business, financial condition, results of operations and cash flows could be materially and adversely affected. In such case, our NAV and the trading price of our securities could decline, and you may lose all or part of your investment. The risk factors described below are the principal risk factors associated with an investment in us as well as those factors generally associated with an investment company with investment objectives, investment policies, capital structure or trading markets similar to ours.
Summary of Principal Risk Factors
Investing in our shares of common stock involves a number of significant risks. You should carefully consider information found in the section entitled “Risk Factors” and elsewhere in this annual report on Form 10-K. Some of the risks involved in investing in our shares of common stock include:
Principal Risks Relating to Our Business and Structure
| ● | We have a limited operating history and our Advisor and its affiliates have limited experience advising BDCs and may not replicate the historical results achieved by other entities managed by members of the Advisor’s investment committee, the Advisor or its affiliates. |
| ● | We use leverage pursuant to borrowings under credit facilities and issuances of senior unsecured notes to finance our investments and changes in interest rates will affect our cost of capital and net investment income. |
| ● | We depend upon our Advisor and Administrator for our success and upon their access to the investment professionals and partners of Kayne Anderson and its affiliates. Any inability of the Advisor or the Administrator to maintain or develop these relationships, or the failure of these relationships to generate investment opportunities, could adversely affect our business. |
| ● | Our financial condition, results of operations and cash flows depend on our ability to manage our business and future growth effectively. |
| ● | There are significant potential conflicts of interest that could affect our investment returns, including conflicts related to obligations the Advisor’s investment committee, the Advisor or its affiliates have to other clients and conflicts related to fees and expenses of such other clients. |
| ● | We generally may make investments that could give rise to a conflict of interest and our ability to enter into transactions with our affiliates will be restricted. |
| ● | We operate in a highly competitive market for investment opportunities, which could reduce returns and result in losses. |
| ● | We will be subject to corporate-level income tax if we are unable to continue to qualify as a RIC. |
| ● | We finance our investments with borrowings under credit facilities and issuances of senior unsecured notes, which will magnify the potential for gain or loss on amounts invested and may increase the risk of investing in us. |
| ● | Adverse developments in the credit markets may impair our ability to enter into new credit facilities or our ability to issue senior unsecured notes. |
| ● | The majority of our portfolio investments are recorded at fair value as determined in good faith by our Advisor and, as a result, there may be uncertainty as to the value of our portfolio investments. |
| ● | Our Board may change our investment objective, operating policies and strategies without prior notice or stockholder approval, and we may temporarily deviate from our regular investment strategy. |
| ● | Efforts to comply with the Exchange Act and the Sarbanes-Oxley Act will involve significant expenditures, and non-compliance would adversely affect us and the value of our shares of common stock. |
| ● | We are highly dependent on information systems, and cybersecurity risks and cyber incidents may adversely affect our business or the business of our portfolio companies, which may, in turn, negatively affect the value of our shares of common stock and our ability to pay distributions. |
| ● | Purchases of shares of our common stock by us under our open market repurchase program, including the Company Rule 10b5-1 Plan, may result in the price of shares of our common stock being higher than the price that otherwise might exist in the open market and are subject to our ability to finance such repurchases. |
Principal Risks Relating to Our Investments
| ● | We are subject to risks associated with the current interest rate environment, and rising interest rates could affect the value of our investments and make it more difficult for portfolio companies to make periodic payments on their loans. |
| ● | Our business is dependent on bank relationships and recent strain on the banking system may adversely impact us. |
| ● | We invest in highly leveraged companies, which could cause us to lose all or a part of our investment in those companies. |
| ● | We are subject to risks associated with our investments in unitranche secured loans and securities, including the potential loss of all or part of such investments. |
| ● | Our investments in securities that are rated below investment grade (i.e. “junk bonds”) may be risky and we could lose all or part of our investments. |
| | ● | Defaults by our portfolio companies, including defaults relating to collateral, will harm our operating results. |
| | | |
| | ● | The lack of liquidity in our investments may adversely affect our business. |
| ● | Our portfolio companies may prepay loans, which may reduce our yields if capital returned cannot be invested in transactions with equal or greater expected yields. |
| ● | Our portfolio companies may be unable to repay or refinance outstanding principal on their loans at or prior to maturity. |
| ● | Our portfolio may be concentrated in a limited number of portfolio companies and industries, which will subject us to a risk of significant loss if any of these companies defaults on its obligations under any of its debt instruments or if there is a downturn in a particular industry. |
| ● | There is no assurance that portfolio company management will be able to operate their companies in accordance with our expectations. |
| ● | Our investments in the Trading Companies & Distributors industry face considerable uncertainties including significant regulatory challenges. |
Risks Relating to Our Common Stock
| ● | Prior to the IPO, there has been no public market for our shares of common stock, and we cannot assure you that a market for our shares of common stock will develop or remain active, or that the market price of our shares of common stock will not decline at some point following the IPO. Our share of common stock price may be volatile and may fluctuate substantially. |
| ● | Sales of substantial amounts of our shares of common stock in the public market may have an adverse effect on the market price of our shares of common stock. |
| ● | Trading and liquidity in our shares may be limited and our shares may trade below their NAV. |
| ● | During extended periods of capital market disruption and instability, there is a risk that you may not receive distributions or that our distributions may not grow over time and a portion of our distributions may be a return of capital. |
| ● | Our stockholders may experience dilution in their ownership percentage. |
Risks Relating to Our Business and Structure
We have a limited operating history and may not replicate the historical results achieved by other entities managed by members of the Advisor’s investment committee, the Advisor or its affiliates.
We commenced operations in February 2021 with private investors as shareholders, and then we completed our IPO in 2024. We are subject to all of the business risks and uncertainties associated with any new business, including the risk that we will not achieve our investment objective, that we will not qualify or maintain our qualification to be treated as a RIC, and that the value of your investment could decline substantially.
The 1940 Act and the Code impose numerous constraints on the operations of BDCs and RICs that do not apply to certain other investment vehicles managed by our Advisor and its affiliates. BDCs are required, for example, to invest at least 70% of their total assets primarily in securities of U.S. private or thinly traded public companies, cash, cash equivalents, U.S. government securities and other high-quality debt instruments that mature in one year or less from the date of investment. Moreover, qualification for taxation as a RIC requires satisfaction of source-of-income, asset diversification and distribution requirements. Our Advisor has a limited operating history under these constraints, which may hinder our ability to take advantage of attractive investment opportunities and to achieve our investment objective.
Furthermore, our investments may differ from those of existing accounts that are or have been managed by members of the Advisor’s investment committee, the Advisor or affiliates of the Advisor. We cannot assure you that we will replicate the historical results achieved for other KAPC funds managed by members of the Advisor’s investment committee, and we caution you that our investment returns could be substantially lower than the returns achieved by them in prior periods. Additionally, all or a portion of the prior results may have been achieved in particular market conditions, which may never be repeated. Moreover, current or future market volatility and regulatory uncertainty may have an adverse impact on our future performance.
We use leverage pursuant to borrowings under credit facilities and issuances of senior unsecured notes to finance our investments and changes in interest rates will affect our cost of capital and net investment income.
We use leverage pursuant to borrowings under credit facilities and issuances of senior unsecured notes and intend to further borrow under credit facilities and/or issue senior unsecured notes in the future in order to finance our investments. As a result, our net investment income will depend, in part, upon the difference between the rate at which we borrow under credit facilities and senior unsecured notes and the rate at which we invest these funds. In addition, we anticipate that many of our debt investments and borrowings under credit facilities will have floating interest rates that reset on a periodic basis, and many of our investments will be subject to interest rate floors. As a result, a significant change in market interest rates could have a material adverse effect on our net investment income. See “Risks Relating to Our Investments—We are subject to risks associated with the current interest rate environment, and rising interest rates could affect the value of our investments and make it more difficult for portfolio companies to make periodic payments on their loans.”
In periods of rising interest rates, our cost of funds will increase because we expect that the interest rates on the majority of amounts we borrow will be floating, which could reduce our net investment income to the extent any of our debt investments have fixed interest rates. We may use interest rate risk management techniques in an effort to limit our exposure to interest rate fluctuations. Such techniques may include various interest rate hedging activities to the extent permitted by the 1940 Act and applicable commodities laws. These activities may limit our ability to benefit from lower interest rates with respect to hedged borrowings. Adverse developments resulting from changes in interest rates or hedging transactions could have a material adverse effect on our business, financial condition and results of operations. See “Risks Relating to Our Investments—We are subject to risks under hedging transactions and our ability to enter into transactions involving derivatives and financial commitment transactions may be limited.”
Downgrades of the U.S. credit rating, impending automatic spending cuts or government shutdowns could negatively impact our liquidity, financial condition and earnings.
The U.S. debt ceiling and budget deficit concerns have increased the possibility of credit-rating downgrades or a recession in the United States. Although U.S. lawmakers passed legislation to raise the federal debt ceiling on multiple occasions, including, most recently, in June 2023, ratings agencies have lowered, and threatened to lower the long-term sovereign credit rating on the United States. The legislation suspends the debt ceiling through early 2025 unless Congress takes legislative action to further extend or defer it.
The impact of the increased debt ceiling and/or downgrades to the U.S. government’s sovereign credit rating or its perceived creditworthiness could adversely affect the U.S. and global financial markets and economic conditions. Absent further quantitative easing by the U.S. Federal Reserve, these developments could cause interest rates and borrowing costs to rise, which may negatively impact our ability to access the debt markets on favorable terms. In addition, disagreement over the federal budget has caused the U.S. federal government to shut down for periods of time. Continued adverse political and economic conditions could have a material adverse effect on our business, financial condition and results of operations.
We depend upon our Advisor and Administrator for our success and upon their access to the investment professionals and partners of Kayne Anderson and its affiliates. Any inability of the Advisor or the Administrator to maintain or develop these relationships, or the failure of these relationships to generate investment opportunities, could adversely affect our business.
Our portfolio is subject to management risk because it is actively managed. Our Advisor applies investment techniques and risk analyses in making investment decisions for us, but there can be no guarantee that they will produce the desired results. We depend upon, and intend to rely significantly on, the Advisor’s and its affiliates’ relationships with private equity sponsors, financial intermediaries, direct lending institutions and other counterparties that are active in our markets.
We do not have any internal management capacity or employees. We depend upon Kayne Anderson’s key personnel for our future success and upon their access to certain individuals and investment opportunities to execute on our investment objective. In particular, we depend on the diligence, skill and network of business contacts of our portfolio managers, who evaluate, negotiate, structure, close and monitor our investments. These individuals manage a number of investment vehicles on behalf of Kayne Anderson and, as a result, do not devote all of their time to managing us, which could negatively impact our performance. Furthermore, these individuals do not have long-term employment contracts with Kayne Anderson, although they do have equity interests and other financial incentives to remain with Kayne Anderson. We also depend on the senior management of Kayne Anderson. The departure of any of our portfolio managers or the senior management of Kayne Anderson could have a material adverse effect on our ability to achieve our investment objective. In addition, we can offer no assurance that our Advisor will remain our investment advisor or that we will continue to have access to Kayne Anderson’s industry contacts and deal flow. Furthermore, if the Advisor fails to maintain such relationships, or to develop new relationships with other sources of investment opportunities, we will not be able to grow our investment portfolio. This could have a material adverse effect on our financial condition, results of operations and cash flows.
We depend on the diligence, skill and network of business contacts of the professionals available to our Administrator to carry out the administrative functions necessary for us to operate, including the ability to select and engage sub-administrators and third-party service providers. We can offer no assurance, however, that the professionals of the Administrator will continue to provide administrative services to us. This could have a material adverse effect on our financial condition, results of operations and cash flows.
Our financial condition, results of operations and cash flows depend on our ability to manage our business and future growth effectively.
Our ability to achieve our investment objective depends on our ability to manage and grow our business, which depends, in turn, on the Advisor’s ability to identify, invest in and monitor companies that meet our investment selection criteria. Accomplishing this result on a cost-effective basis is largely a function of the Advisor’s structuring of the investment process, its ability to provide competent, attentive and efficient services to us and our access to financing on acceptable terms. The management team of the Advisor has substantial responsibilities under our Investment Advisor Agreement. We can offer no assurance that any current or future employees of the Advisor will contribute effectively to the work of, or remain associated with, the Advisor. We caution you that the principals of our Advisor or Administrator may also be called upon to provide and currently do provide managerial assistance to portfolio companies and other investment vehicles, including other BDCs, which are managed by affiliates of the Advisor. Such demands on their time may distract them or slow our rate of investment. Any failure to manage our future growth effectively could have a material adverse effect on our business, financial condition and results of operations.
The Advisor may frequently be required to make investment analyses and decisions on an expedited basis in order to take advantage of investment opportunities, and our Advisor may not have knowledge of all circumstances that could impact an investment by the Company.
Investment analyses and decisions by the Advisor may frequently be required to be undertaken on an expedited basis to take advantage of investment opportunities, and the Advisor may not have knowledge of all circumstances that could adversely affect an investment by us. Moreover, there can be no assurance that our due diligence processes will uncover all relevant facts that would be material to an investment decision. Before making an investment, we will assess the strength of the underlying assets and other factors that we believe are material to the performance of the investment. In making the assessment and otherwise conducting customary due diligence, we will rely on the resources available to us and, in some cases, an investigation by third parties. This process is particularly important and highly subjective.
We may make investments in, or loans to, companies that are not subject to public company reporting requirements including requirements regarding preparation of financial statements, and our portfolio companies may utilize divergent reporting standards that may make it difficult for the Advisor to accurately assess the prior performance of a portfolio company. We will, therefore, depend upon the compliance by investment companies with their contractual reporting obligations. As a result, the evaluation of potential investments and our ability to perform due diligence on and effectively monitor investments may be impeded, and we may not realize the returns that we expect on any particular investment. In the event of fraud by any company in which we invest or with respect to which we make a loan, we may suffer a partial or total loss of the amounts invested in that company.
There are significant potential conflicts of interest that could affect our investment returns, including conflicts related to obligations the Advisor’s investment committee, the Advisor or its affiliates have to other clients and conflicts related to fees and expenses of such other clients, the valuation process for certain portfolio holdings of ours, other arrangements with the Advisor or its affiliates, and the Advisor’s recommendations given to us may differ from those rendered to their other clients.
As a result of our arrangements with the Advisor and its affiliates and the Advisor’s investment committee, there may be times when the Advisor or such persons have interests that differ from those of our stockholders, giving rise to a conflict of interest.
In particular, the following conflicts of interest may arise, among others:
| ● | the members of the Advisor’s investment committee serve or may serve as officers, directors or principals of entities that operate in the same or a related line of business as we do or of accounts sponsored or managed by the Advisor or its affiliates; |
| ● | the Advisor, its affiliates and its personnel may have obligations to other clients or investors in entities they manage, the fulfilment of which may not be in the best interests of us or our stockholders; |
| ● | our investment objective may overlap with the investment objectives of such affiliated accounts; |
| ● | certain of the Advisor’s other accounts may provide for higher management or incentive fees, greater expense reimbursements or overhead allocations, or permit affiliates of the Advisor to receive origination and other transaction fees; |
| ● | members of Kayne Anderson and its affiliates may serve on the boards of directors of and advise companies that may compete with our portfolio investments. Moreover, other funds, separate accounts and other vehicles managed by Kayne Anderson and its affiliates may pursue investment opportunities that may also be suitable for us; and |
| ● | the participation of the Advisor’s investment professionals in our valuation process could result in a conflict of interest as the Advisor’s base management fee is based, in part, on our fair market value of investments including assets purchased with borrowings under credit facilities and issuances of senior unsecured notes, excluding cash, U.S. government securities and commercial paper instruments maturing within one year of purchase, and our incentive fees will be based, in part, on unrealized gains and losses. |
Additionally, the incentive fee payable by us to the Advisor may create an incentive for the Advisor to cause us to realize capital gains or losses that may not be in the best interests of us or our stockholders. Under the incentive fee structure, the Advisor benefits when we recognize capital gains and, because the Advisor determines when an investment is sold, the Advisor controls the timing of the recognition of such capital gains. Our Board is charged with protecting our stockholders’ interests by monitoring how the Advisor addresses these and other conflicts of interest associated with its management services and compensation.
The part of the management and incentive fees payable to Advisor that relates to our net investment income is computed and paid on income that may include interest income that has been accrued but not yet received in cash, such as market discount, debt instruments with paid-in-kind (“PIK”) interest, preferred stock with PIK dividends, zero coupon securities, and other deferred interest instruments and may create an incentive for the Advisor to make investments on our behalf that are riskier or more speculative than would be the case in the absence of such compensation arrangements. This fee structure may be considered to give rise to a conflict of interest for the Advisor to the extent that it may encourage the Advisor to favor debt financings that provide for deferred interest, rather than current cash payments of interest. Under these investments, we will accrue the interest over the life of the investment, but we will not receive the cash income from the investment until the end of the term. Our net investment income used to calculate the income portion of our investment fee, however, includes accrued interest. The Advisor may have an incentive to invest in deferred interest securities in circumstances where it would not have done so but for the opportunity to continue to earn the fees even when the issuers of the deferred interest securities would not be able to make actual cash payments to us on such securities. This risk could be increased because the Advisor is not obligated to reimburse us for any fees received even if we subsequently incur losses or never receive in cash the deferred income that was previously accrued.
The Advisor seeks to allocate investment opportunities among eligible accounts in a manner that is fair and equitable over time and consistent with its allocation policy. However, we can offer no assurance that such opportunities will be allocated to us fairly or equitably in the short term, and there can be no assurance that we will be able to participate in all investment opportunities that are suitable to us.
The Advisor’s investment committee, the Advisor or its affiliates may, from time to time, possess material non-public information, limiting our investment discretion.
Principals of the Advisor and its affiliates and members of the Advisor’s investment committee may serve as directors of, or in a similar capacity with, companies in which we invest, the securities of which are purchased or sold on our behalf. In the event that material nonpublic information is obtained with respect to such companies, or we become subject to trading restrictions under the internal trading policies of those companies or as a result of applicable law or regulations (for example, the antifraud provisions for the federal securities laws), we could be prohibited for a period of time from purchasing or selling the securities of such companies, and this prohibition may have an adverse effect on us.
The Investment Advisory Agreement and the Administration Agreement were not negotiated on an arm’s-length basis and may not be as favorable to us as if they had been negotiated with an unaffiliated third party.
The Investment Advisory Agreement and the Administration Agreement were negotiated between related parties. Consequently, their terms, including fees payable to the Advisor, may not be as favorable to us as if they had been negotiated with an unaffiliated third party. For example, certain accounts managed by the Advisor have lower management, incentive or other fees than those charged under the Investment Advisory Agreement and/or a reduced ability to recover expenses and overhead than may be recovered by the Administrator under the Administration Agreement. In addition, we may choose not to enforce, or to enforce less vigorously, our rights and remedies under these agreements because of our desire to maintain our ongoing relationship with the Advisor, the Administrator and their respective affiliates. Any such decision, however, would breach our fiduciary obligations to our stockholders.
We generally may make investments that could give rise to a conflict of interest and our ability to enter into transactions with our affiliates will be restricted.
We, along with our Advisor and certain of its affiliates, have obtained exemptive relief from the SEC to permit us to invest alongside certain entities and accounts advised by the Advisor and its affiliates subject to certain conditions.
Pursuant to such exemptive relief, and subject to certain conditions, we are permitted to co-invest in the same security with our affiliates in a manner that is consistent with our investment objective, investment strategy, regulatory consideration and other relevant factors. If opportunities arise that would otherwise be appropriate for us and an affiliate to purchase different securities in the same issuer, our Advisor will need to decide which account will proceed with such investment. Our Advisor’s investment allocation policy incorporates the conditions of exemptive relief to seek to ensure that investment opportunities are allocated in a manner that is fair and equitable. However, although the Advisor endeavors to fairly allocate investment opportunities in the long run, we can offer no assurance that investment opportunities will be allocated to us fairly or equitably in the short term.
We do not expect to invest in, or hold securities of, companies that are controlled by our affiliates’ other clients. If our affiliates’ other client or clients gain control over one of our portfolio companies, this may create conflicts of interest and subject us to certain restrictions under the 1940 Act. As a result of these conflicts and restrictions our Advisor may be unable to implement our investment strategies as effectively as it could have in the absence of such conflicts or restrictions. For example, as a result of a conflict or restriction, our Advisor may be unable to engage in certain transactions that it would otherwise pursue. In order to avoid these conflicts and restrictions, our Advisor may choose to exit these investments prematurely and, as a result, we may forgo positive returns associated with such investments. In addition, to the extent that another client holds a different class of securities than us as a result of such transactions, our interests may not be aligned. Our ability to enter into transactions with our affiliates may be restricted.
In situations where co-investment with affiliates’ other clients is not permitted under the 1940 Act and related rules, existing or future staff guidance, or the terms and conditions of exemptive relief that have been granted to our Advisor and its affiliates by the SEC, our Advisor will need to decide which client or clients will proceed with the investment. Generally, we will not have an entitlement to make a co-investment in these circumstances and, to the extent that another client elects to proceed with the investment, we will not be permitted to participate. Moreover, except in certain circumstances, we will be unable to invest in any issuer in which an affiliate’s other client holds a controlling interest. These restrictions may limit the scope of investment opportunities that would otherwise be available to us.
We will be prohibited under the 1940 Act from participating in certain transactions with certain affiliates of ours without the prior approval of a majority of our independent directors and, in some cases, the SEC. Any person that owns, directly or indirectly, 5% or more of our outstanding voting securities will be our affiliate for purposes of the 1940 Act, and we will generally be prohibited from buying or selling any securities from or to such affiliate on a principal basis, absent the prior approval of our Board and, in some cases, the SEC. The 1940 Act also prohibits certain “joint” transactions with certain affiliates of ours, which in certain circumstances could include investments in the same portfolio company (whether at the same or different times to the extent the transaction involves a joint investment), without prior approval of our Board and, in some cases, the SEC. If a person acquires more than 25% of our voting securities, we will be prohibited from buying or selling any security from or to such person or certain of that person’s affiliates, or entering into prohibited joint transactions with such persons, absent the prior approval of the SEC. Similar restrictions limit our ability to transact business with our officers or directors or their affiliates.
The SEC has interpreted the BDC regulations governing transactions with affiliates to prohibit certain “joint transactions” involving entities that share a common investment advisor. As a result of these restrictions, we may be prohibited from buying or selling any security from or to any portfolio company that is controlled by a fund managed by the Advisor or their respective affiliates except under certain circumstances or without the prior approval of the SEC, which may limit the scope of investment opportunities that would otherwise be available to us.
We operate in a highly competitive market for investment opportunities, which could reduce returns and result in losses.
There will be competition for investments from numerous other potential investors, many of which will have significant financial resources. As a result, there can be no guarantee that a sufficient quantity of suitable investment opportunities for us will be found, that investments on favorable terms can be negotiated, or that we will be able to fully realize the value of our investments. Competition for investments may have the effect of increasing our costs and expenses or otherwise decreasing returns generated on underlying investments, thereby reducing our investment returns.
A number of entities compete with us to make the types of investments that we plan to make in middle market companies, including BDCs, traditional commercial banks, private investment funds, regional banking institutions, small business investment companies, investment banks and insurance companies. Additionally, with increased competition for investment opportunities, alternative investment vehicles such as hedge funds may seek to invest in areas they have not traditionally invested in or from which they had withdrawn during the economic downturn, including investing in middle market companies. We will compete with public and private funds, commercial and investment banks, commercial financing companies and, to the extent they provide an alternative form of financing, private equity and hedge funds. Many of our competitors are substantially larger and have considerably greater financial, technical and marketing resources than we do. For example, we believe some of our competitors may have access to funding sources that are not available to us. In addition, some of our competitors may have higher risk tolerances or different risk assessments, which could allow them to consider a wider variety of investments and establish more relationships than we do. Furthermore, many of our competitors are not subject to the regulatory restrictions that the 1940 Act imposes on us as a BDC or the source of income, asset diversification and distribution requirements we must satisfy to qualify and maintain our qualification as a RIC. As a result of this competition, we may from time to time not be able to take advantage of attractive investment opportunities, and we may not be able to identify and make investments that are consistent with our investment objective.
With respect to the investments we make, we do not seek to compete based primarily on the interest rates we offer, and we believe that some of our competitors may make loans with interest rates that will be lower than the rates we offer. With respect to all investments, we may lose some investment opportunities if we do not match our competitors’ pricing, terms and structure. However, if we match our competitors’ pricing, terms and structure, we may experience decreased net interest income, lower yields and increased risk of credit loss. Although our Advisor allocates opportunities in accordance with its allocation policy, allocations to other accounts managed or sponsored by our Advisor or its affiliates reduce the amount and frequency of opportunities available to us and may not be in the best interests of us and our stockholders.
The competitive pressures we face may have a material adverse effect on our business, financial condition and results of operations.
We will be subject to corporate-level income tax if we are unable to continue to qualify as a RIC.
We have elected, and intend to qualify annually thereafter, to be treated for U.S. federal income tax purposes as a RIC under Subchapter M of the Code; however, no assurance can be given that we will be able to qualify for and maintain RIC tax treatment. In order to qualify, and maintain qualification, as a RIC under the Code, we must meet certain source-of-income, asset diversification and distribution requirements. The distribution requirement for a RIC is satisfied if we distribute to our stockholders dividends for U.S. federal income tax purposes of an amount generally at least equal to the sum of 90% of our investment company taxable income, which is generally our net ordinary income plus the excess of our net short-term capital gains in excess of our net long-term capital losses, determined without regard to any deduction for dividends paid, and 90% of our net tax-exempt interest income, if any, to our stockholders on an annual basis. We are subject, to the extent we use debt financing, to certain asset coverage ratio requirements under the 1940 Act and financial covenants under loan and credit agreements that could, under certain circumstances, restrict us from making distributions necessary to continue to qualify as a RIC. If we are unable to obtain cash from other sources, we may fail to be subject to tax as a RIC and, thus, may be subject to corporate-level income tax. To continue to qualify as a RIC, we must also meet certain asset diversification requirements at the end of each quarter of our taxable year. Failure to meet these requirements may result in our having to dispose of certain investments quickly in order to prevent the loss of our qualification as a RIC. Because a significant portion of our investments are in private or thinly traded public companies, any such dispositions could be made at disadvantageous prices and may result in substantial losses. If we fail to qualify as a RIC for any reason and become subject to corporate-level income tax, the resulting corporate taxes could substantially reduce our net assets, the amount of income available for distributions to stockholders and the amount of our distributions and the amount of funds available for new investments. Such a failure would have a material adverse effect on us and our stockholders.
We may be subject to risks that may arise in connection with the rules under ERISA related to investment by ERISA Plans.
We intend to operate so that we will be an appropriate investment for employee benefit plans subject to Employee Retirement Income Security Act of 1974, as amended (“ERISA”). We will use reasonable efforts to conduct our affairs so that our assets will not be deemed to be “plan assets” for purposes of ERISA. Accordingly, there may be constraints on our ability to make or dispose of investments at optimal times (or to make certain investments at all).
We may have difficulty paying our required distributions if we recognize income before, or without, receiving cash representing such income.
For U.S. federal income tax purposes, we include in income certain amounts that we have not yet received in cash, such as the accretion of original issue discount (“OID”). This may arise if we receive warrants in connection with the making of a loan and in other circumstances, or through contracted PIK interest, which represents contractual interest added to the loan balance and due at the end of the loan term. Such OID, which could be significant relative to our overall investment activities or increases in loan balances as a result of contracted PIK arrangements, is included in income before we receive any corresponding cash payments. We also may be required to include in income certain other amounts that we do not receive in cash. We may be also subject to the following risks associated with PIK and OID investments:
| ● | The interest payments deferred on a PIK loan are subject to the risk that the borrower may default when the deferred payments are due in cash at the maturity of the loan; |
| ● | The interest rates on PIK loans are higher to reflect the time-value of money on deferred interest payments and the higher credit risk of borrowers who may need to defer interest payments; |
| ● | Market prices of OID instruments are more volatile because they are affected to a greater extent by interest rate changes than instruments that pay interest periodically in cash; |
| ● | PIK instruments may have unreliable valuations because the accruals require judgments about ultimate collectability of the deferred payments and the value of the associated collateral; |
| ● | Use of PIK and OID securities may provide certain benefits to our Advisor including increasing management fees; |
| ● | We may be required under the tax laws to make distributions of OID income to stockholders without receiving any cash. Such required cash distributions may have to be paid from borrowings, offering proceeds or the sale of our assets; and |
| ● | The required recognition of OID, including PIK, interest for U.S. federal income tax purposes may have a negative impact on liquidity, because it represents a non-cash component of our taxable income that must, nevertheless, be distributed in cash to investors to avoid it being subject to corporate level taxation. |
Part of the incentive fee payable by us that relates to our net investment income is computed and paid on income that may include interest that has been accrued but not yet received in cash, such as market discount, debt instruments with PIK interest, preferred stock with PIK dividends and zero coupon securities. If a portfolio company defaults on a loan that is structured to provide accrued interest, it is possible that accrued interest previously used in the calculation of the incentive fee will become uncollectible, and the Advisor will have no obligation to refund any fees it received in respect of such accrued income.
Since in certain cases we may recognize income before or without receiving cash representing such income, we may have difficulty meeting the requirement in a given taxable year to distribute to our stockholders dividends for U.S. federal income tax purposes an amount at least equal to the sum of 90% of our investment company taxable income, determined without regard to any deduction for dividends paid, and 90% of our net tax-exempt interest income, if any, to our stockholders to qualify and maintain our ability to be subject to tax as a RIC. In such a case, we may have to sell some of our investments at times we would not consider advantageous, raise additional debt or equity capital or reduce new investment originations to meet these distribution requirements. If we are not able to obtain such cash from other sources, we may fail to qualify as a RIC and thus be subject to corporate-level income tax.
Regulations governing our operation as a BDC affect our ability to, and the way in which we, raise additional capital. As a BDC, the necessity of raising additional capital exposes us to risks, including the typical risks associated with leverage.
We intend to further borrow under credit facilities and/or issue senior unsecured notes and, may issue preferred stock in the future (although we do not anticipate issuing preferred stock in the next 12 months), which we refer to collectively as “senior securities,” up to the maximum amount permitted by the 1940 Act. Under the provisions of the 1940 Act, we are currently permitted to issue “senior securities,” including borrowing money from banks or other financial institutions, only in amounts such that our asset coverage, as defined in the 1940 Act, equals at least 150% of gross assets less all liabilities and indebtedness not represented by senior securities, after each issuance of senior securities. If we fail to comply with certain disclosure requirements, our asset coverage ratio under the 1940 Act would be 200%, which would decrease the amount of leverage we are able to incur.
Nevertheless, if the value of our assets declines, we may be unable to satisfy this ratio. If that happens, we may be required to sell a portion of our investments and, depending on the nature of our leverage, repay a portion of our indebtedness at a time when such sales may be disadvantageous. Also, any amounts that we use to service our indebtedness would not be available for distributions to holders of our shares of common stock. If we issue senior securities, we will be exposed to typical risks associated with leverage, including an increased risk of loss. In addition, if the value of our assets decreases, leverage will cause our net asset value to decline more sharply than it otherwise would have without leverage or with lower leverage. Similarly, any decrease in our revenue would cause its net income to decline more sharply than it would have if we had not borrowed or had borrowed less under the credit facilities.
In the absence of an event of default, no person or entity from which we borrow money has a veto right or voting power over our ability to set policy, make investment decisions or adopt investment strategies. If we issue preferred stock, which is another form of leverage, the preferred stock would rank “senior” to common stock in our capital structure, preferred stockholders would have separate voting rights on certain matters and might have other rights, preferences or privileges more favorable than those of our common stockholders, and the issuance of preferred stock could have the effect of delaying, deferring or preventing a transaction or a change of control that might involve a premium price for holders of our common stock or otherwise be in the best interest of our common stockholders. Holders of our common stock will directly or indirectly bear all of the costs associated with offering and servicing any preferred stock that we issue. In addition, any interests of preferred stockholders may not necessarily align with the interests of holders of our shares of common stock, and the rights of holders of shares of preferred stock to receive distributions would be senior to those of holders of shares of common stock. We do not, however, anticipate issuing preferred stock in the next 12 months.
We are not generally able to issue and sell our shares of common stock at a price below NAV per share. We may, however, sell our shares of common stock, or warrants, options or rights to acquire our shares of common stock, at a price below the then-current NAV per share of our common stock if our Board determines that such sale is in the best interests of us and our stockholders, and if our stockholders approve such sale. In any such case, the price at which our securities are to be issued and sold may not be less than a price that, in the determination of our Board, closely approximates the market value of such securities (less any distributing commission or discount). If we raise additional funds by issuing common stock or senior securities convertible into, or exchangeable for, our common stock, then the percentage ownership of our stockholders at that time will decrease, and holders of our common stock might experience dilution.
We finance our investments with borrowings under credit facilities and issuances of senior unsecured notes, which will magnify the potential for gain or loss on amounts invested and may increase the risk of investing in us.
The use of leverage magnifies the potential for gain or loss on amounts invested. The use of leverage is generally considered a speculative investment technique and increases the risks associated with investing in our securities. The amount of leverage that we employ will depend on the Advisor’s and our Board’s assessment of market and other factors at the time of any proposed borrowing. We cannot assure you that we will be able to obtain credit at all or on terms acceptable to us. For example, due to the interplay of the 1940 Act restrictions on principal and joint transactions and the U.S. risk retention rules adopted pursuant to Section 941 of the Dodd-Frank Wall Street Reform and Consumer Protection Act (“Dodd-Frank”), as a BDC we are currently unable to enter into any securitization transactions. We cannot assure you that the SEC or any other regulatory authority will modify such regulations or provide administrative guidance that would permit us to enter into securitizations, whether on a timely basis or at all. We may issue senior debt securities to banks, insurance companies and other lenders. Lenders of these senior securities will have fixed dollar claims on our assets that are superior to the claims of our common stockholders, and we would expect such lenders to seek recovery against our assets in the event of a default. We may pledge up to 100% of our assets and may grant a security interest in all of our assets under the terms of any debt instruments we may enter into with lenders. In addition, under the terms of our credit facilities or future credit facilities we enter into, we are likely to be required by its terms to use the net proceeds of any investments that we sell to repay a portion of the amount borrowed under such facility or instrument before applying such net proceeds to any other uses. If the value of our assets decreases, leveraging would cause our NAV to decline more sharply than it otherwise would have had we not leveraged, thereby magnifying losses or eliminating our equity stake in a leveraged investment. Similarly, any decrease in our net investment income will cause our net income to decline more sharply than it would have had we not borrowed. Such a decline would also negatively affect our ability to make distributions on our common stock or any outstanding preferred stock. Our ability to service our debt depends largely on our financial performance and is subject to prevailing economic conditions and competitive pressures. Our common stockholders bear the burden of any increase in our expenses as a result of our use of leverage, including interest expenses and any increase in the base management fee payable to the Advisor.
As a BDC, we generally are required to meet a coverage ratio of total assets to total borrowings and other senior securities, which include our borrowings under our credit facilities and issuances of senior unsecured notes and any preferred stock that we may issue in the future (although we do not anticipate issuing preferred stock in the next 12 months). The current asset coverage ratio applicable to the Company is 150%. If this ratio were to decline below the then applicable minimum asset coverage ratio, we would be unable to incur additional debt and could be required to sell a portion of our investments to repay some debt when it is disadvantageous to do so. This could have a material adverse effect on our operations, and we may not be able to make distributions in amounts sufficient to maintain our status as a RIC, or at all.
Provisions in our credit facilities and our senior unsecured notes contain various covenants, which, if not complied with, could accelerate our repayment obligations under such facilities, thereby materially and adversely affecting our liquidity, financial condition, results of operations and ability to pay distributions.
Our Credit Facilities (as defined herein) are backed by all or a portion of our loans and securities on which the lenders have a security interest. We may pledge up to 100% of our assets and may grant a security interest in all of our assets under the terms of any debt instrument we enter into with the lenders pursuant to our Credit Facilities. We expect that any security interests we grant will be set forth in a pledge and security agreement or other collateral arrangement and evidenced by the filing of financing statements by the agent for the lenders. In addition, we expect that the custodian for our securities serving as collateral for such loan would include in its electronic systems notices indicating the existence of such security interests and, following notice of occurrence of an event of default, if any, and during its continuance, will only accept transfer instructions with respect to any such securities from the lender or its designee. If we default under the terms of our Credit Facilities, the agent for the applicable lenders would be able to assume control of the timing of disposition of any or all of our assets securing such debt, which would have a material adverse effect on our business, financial condition, results of operations and cash flows.
In addition, any security interests and/or negative covenants contained in our Credit Facilities limit our ability to create liens on assets to secure additional debt and make it difficult for us to restructure or refinance indebtedness at or prior to maturity. If our borrowing base under a credit facility decreases, we may be required to secure additional assets in an amount sufficient to cure any borrowing base deficiency. In the event that all of our assets are secured at the time of such a borrowing base deficiency, we could be required to repay indebtedness under our Credit Facilities or make deposits to a collection account, either of which could have a material adverse impact on our ability to fund future investments and to make distributions. We have made customary representations and warranties and are required to comply with various covenants, reporting requirements (including requirements relating to portfolio performance, required minimum portfolio yield and limitations on delinquencies and charge-offs) and other customary requirements for similar credit facilities.
Our 8.65% Series A Notes due June 2027 (the “Series A Notes”) and 8.74% Series B Notes due June 2028 (the “Series B Notes”, and collectively with the Series A Notes, the “Notes”) were issued under a note purchase agreement, dated June 29, 2023 (the “Note Purchase Agreement”). The Note Purchase Agreement contains certain representations and warranties, and various covenants and reporting requirements customary for agreements of this type, including, without limitation, information reporting, maintenance of our status as a BDC within the meaning of the 1940 Act, and certain restrictions with respect to transactions with affiliates, fundamental changes, changes of line of business and permitted liens. In addition, the Note Purchase Agreement contains the following financial covenants, which are measured as of each fiscal quarter-end: (a) maintaining a minimum shareholders’ equity and (b) maintaining a minimum asset coverage ratio.
Our continued compliance with the covenants contained under the Credit Facilities and the Note Purchase Agreement depends on many factors, some of which are beyond our control, and there can be no assurances that we will continue to comply with such covenants. Our failure to satisfy the respective covenants could result in foreclosure by the lenders under the applicable credit facility or governing instrument or acceleration by the applicable lenders or noteholders, which would accelerate our repayment obligations under the relevant agreement and thereby have a material adverse effect on our business, liquidity, financial condition, results of operations and ability to pay distributions to our stockholders. Because the Credit Facilities and the Note Purchase Agreement have, and any future credit facilities and documents governing the issuance of senior unsecured notes will likely have, customary cross-default provisions, if the indebtedness under the Credit Facilities or represented by the Series A Notes or the Series B Notes or under any future credit facility or senior unsecured note, is accelerated, we may be unable to repay or finance the amounts due.
Adverse developments in the credit markets may impair our ability to enter into new credit facilities or our ability to issue senior unsecured notes.
Following the passage of Dodd-Frank, many commercial banks and other financial institutions stopped lending or significantly curtailed their lending activity. In addition, in an effort to stem losses and reduce their exposure to segments of the economy deemed to be high risk, some financial institutions limited routine refinancing and loan modification transactions and even reviewed the terms of existing facilities to identify bases for accelerating the maturity of existing lending facilities. To the extent these circumstances arise again in the future, it may be difficult for us to finance the growth of our investments on acceptable economic terms, or at all, and one or more of our credit facilities could be accelerated by the lenders.
If we do not invest a sufficient portion of our assets in qualifying assets, we could fail to qualify as a BDC or be precluded from investing according to our current business strategy and such failure would decrease our operating flexibility.
As a BDC, we may not acquire any assets other than “qualifying assets” unless, at the time of and after giving effect to such acquisition, at least 70% of our total assets are qualifying assets.
In the future, we believe that most of our investments will constitute qualifying assets. However, we may be precluded from investing in what we believe are attractive investments if such investments are not qualifying assets for purposes of the 1940 Act. If we do not invest a sufficient portion of our assets in qualifying assets, we could violate the 1940 Act provisions applicable to BDCs. As a result of such violation, specific rules under the 1940 Act would significantly decrease our operating flexibility and could prevent us, for example, from making follow-on investments in existing portfolio companies (which could result in the dilution of our position) or could require us to dispose of investments at inappropriate times in order to come into compliance with the 1940 Act. If we need to dispose of such investments quickly, it could be difficult to dispose of such investments on favorable terms. We may not be able to find a buyer for such investments and, even if we do find a buyer, we may have to sell the investments at a substantial loss. Any such outcomes would have a material adverse effect on our business, financial condition, results of operations and cash flows.
The majority of our portfolio investments are recorded at fair value as determined in good faith by our Advisor and, as a result, there may be uncertainty as to the value of our portfolio investments.
The majority of our portfolio investments take the form of securities for which no market quotations are readily available. The fair value of securities and other investments that are not publicly traded may not be readily determinable, and we value these securities at fair value as determined in good faith by our Advisor, including to reflect significant events affecting the value of our securities. As discussed in more detail under “Management’s Discussion and Analysis of Financial Condition and Results of Operations – Contractual Obligations – Investment Valuation,” most, if not all, of our investments (other than cash and cash equivalents) are classified as Level 3 under ASC Topic 820. This means that our portfolio valuations are based on unobservable inputs and our own assumptions about how market participants would price the asset or liability in question. Inputs into the determination of fair value of our portfolio investments require significant management judgment or estimation. Even if observable market data are available, such information may be the result of consensus pricing information or broker quotes, which may include a disclaimer that the broker would not be held to such a price in an actual transaction. The non-binding nature of consensus pricing and/or quotes accompanied by disclaimers materially reduces the reliability of such information.
Our Level 3 investments will typically consist of instruments for which a liquid trading market does not exist. The fair value of these instruments may not be readily determinable. We will value these instruments in accordance with valuation procedures adopted by our Advisor. We intend to use the services of an independent valuation firm to review the fair value of certain instruments prepared by our Advisor. At least once annually, the valuation for each portfolio investment for which a market quote is not readily available will be reviewed by an independent valuation firm. The types of factors that the Advisor may consider in fair value pricing of our investments include, where relevant: the nature and realizable value of any collateral; the company’s ability to make interest payments, amortization payments (if any) and other fixed charges; the company’s historical and projected financial results; the markets in which the company does business; the estimated enterprise value of the company based on comparisons to publicly-traded securities, on discounted cash flows and other valuation methodologies; changes in the interest rate environments and the credit markets generally that may affect the price at which similar investments may be made; and other relevant factors. Because such valuations, and particularly valuations of non-traded instruments and private companies, are inherently uncertain, they may fluctuate over short periods of time and may be based on estimates. The determination of fair value by our Advisor may differ materially from the values that would have been used if a liquid trading market for these instruments existed. Our NAV could be adversely affected if the determinations regarding the fair value of our investments were materially higher than the values that we ultimately realize upon the disposal of such investments.
We adjust quarterly (or as otherwise may be required by the 1940 Act in connection with the issuance of our shares) the valuation of our portfolio to reflect our Advisor’s determination of the fair value of each investment in our portfolio. Any changes in fair value are recorded in our consolidated statement of operations as net change in unrealized appreciation or depreciation.
New or modified laws or regulations governing our operations and government intervention in the credit markets generally may adversely affect our business.
We and our portfolio companies are subject to regulation by laws at the U.S. federal, state and local levels. These laws and regulations, as well as their interpretation, may change from time to time, including as the result of interpretive guidance or other directives from the U.S. President and others in the executive branch, and new laws, regulations and interpretations may also come into effect. Any such new or changed laws or regulations could have a material adverse effect on our business. In particular, Dodd-Frank has impacted many aspects of the financial services industry, and it requires the development and adoption of many implementing regulations over several years. The SEC has adopted final rules for over 60 mandatory rulemaking provisions under Dodd-Frank, with several additional rules proposed but not yet adopted. While the ultimate impact of Dodd-Frank on us and our portfolio companies may not be known for an extended period of time, Dodd-Frank, including the interpretation of the rules implementing its provisions and any future rules that may be adopted, along with other legislative and regulatory proposals directed at the financial services industry or affecting taxation that may be proposed in the future, may negatively impact the operations, cash flows or financial condition of us or our portfolio companies, impose additional costs on us or our portfolio companies, intensify the regulatory supervision of us or our portfolio companies or otherwise adversely affect our business or the business of our portfolio companies.
In addition, the central banks and, in particular, the U.S. Federal Reserve, have taken unprecedented steps since the financial crises of 2008-2009 and the COVID-19 global pandemic and in response to inflationary pressures. On the other hand, recent governmental intervention could mean that the willingness of governmental bodies to take additional extraordinary action is diminished. It is impossible to predict if, how, and to what extent the United States and other governments would further intervene in credit markets. As a result, in the event of near-term major market disruptions, like those caused by the COVID-19 pandemic, there might be only limited additional government intervention, resulting in correspondingly greater market dislocation and materially greater market risk.
Additionally, changes to the laws and regulations governing our operations, including those associated with RICs, may cause us to alter our investment strategy in order to avail ourselves of new or different opportunities or result in the imposition of corporate-level taxes on us. Such changes could result in material differences to our strategies and plans and may shift our investment focus from the areas of expertise of the Advisor to other types of investments in which the Advisor may have little or no expertise or experience. Any such changes, if they occur, could have a material adverse effect on our results of operations and the value of your investment. If we invest in commodity interests in the future, the Advisor may determine not to use investment strategies that trigger additional regulation by the U.S. Commodity Futures Trading Commission (the “CFTC”), or may determine to operate subject to CFTC regulation, if applicable. If we or the Advisor were to operate subject to CFTC regulation, we may incur additional expenses and would be subject to additional regulation.
In addition, certain regulations applicable to debt securitizations implementing credit risk retention requirements that have taken effect in both the U.S. and in Europe may adversely affect or prevent us from entering into any future securitization transaction. The impact of these risk retention rules on the loan securitization market are uncertain, and such rules may cause an increase in our cost of funds under or may prevent us from completing any future securitization transactions. On October 21, 2014, U.S. risk retention rules adopted pursuant to Section 941 of Dodd-Frank, or the U.S. Risk Retention Rules, were issued. The U.S. Risk Retention Rules require the sponsor (directly or through a majority-owned affiliate) of a debt securitization subject to such rules, such as collateralized loan obligations, in the absence of an exemption, to retain an economic interest in the credit risk of the assets being securitized in the form of an eligible horizontal residual interest, an eligible vertical interest, or a combination thereof, in accordance with the requirements of the U.S. Risk Retention Rules. The U.S. Risk Retention Rules became effective December 24, 2016. Given the more attractive financing costs associated with these types of debt securitization as opposed to other types of financing available (such as traditional senior secured facilities), this would, in turn, increase our financing costs. Any associated increase in financing costs would ultimately be borne by our common stockholders.
On May 24, 2018, the Economic Growth, Regulatory Relief, and Consumer Protection Act was enacted, which left the architecture and core features of Dodd-Frank intact but significantly recalibrated applicability thresholds, revised various post-crisis regulatory requirements, and provided targeted regulatory relief to certain financial institutions. Among the most significant of its amendments to Dodd-Frank were a substantial increase in the $50 billion asset threshold to $250 billion for automatic regulation of bank holding companies (“BHCs”) as “systemically important financial institutions,” an exemption from the Volcker Rule for insured depository institutions with less than $10 billion in consolidated assets and lower levels of trading assets and liabilities, and amendments to the liquidity leverage ratio and supplementary leverage ratio requirements. In addition, effective October 1, 2020, the U.S. Federal Reserve, SEC and other federal agencies modified their regulations under the Volcker Rule to loosen the restrictions on financial institutions. The effects of these and any further rules or regulations that may be enacted by the federal government are and could be complex and far-reaching, and the change and any future laws or regulations or changes thereto could negatively impact our operations, cash flows or financial condition, impose additional costs on us, intensify the regulatory supervision of us or otherwise adversely affect our business, financial condition and results of operations.
Over the last several years, there also has been an increase in regulatory attention to the extension of credit outside of the traditional banking sector, raising the possibility that some portion of the non-bank financial sector will be subject to new regulation. While it cannot be known at this time whether any regulation will be implemented or what form it will take, increased regulation of non-bank credit extension could negatively impact our operations, cash flows or financial condition, impose additional costs on us, intensify the regulatory supervision of us or otherwise adversely affect our business, financial condition and results of operations.
Ongoing implementation of, or changes in, including changes in interpretation or enforcement of, laws and regulations could impose greater costs on us and on financial services companies and impact the value of assets we hold and our business, financial condition and results of operations. In addition, uncertainty regarding legislation and regulations affecting the financial services industry or taxation could also adversely impact our business or the business of our portfolio companies. If we do not comply with applicable laws and regulations, we could lose any licenses that we then hold for the conduct of our business and may be subject to civil fines and criminal penalties.
Our Board may change our investment objective, operating policies and strategies without prior notice or stockholder approval, and we may temporarily deviate from our regular investment strategy.
Our Board has the authority, except as otherwise provided in the 1940 Act, to modify or waive our investment objective and certain of our operating policies and strategies without prior notice and without stockholder approval. However, absent stockholder approval, we may not change the nature of our business so as to cease to be, or withdraw our election as, a BDC. We cannot predict the effect any changes to our current investment objective, operating policies and strategies would have on our business, operating results and the price value of our common stock. Nevertheless, any such changes could adversely affect our business and impair our ability to make distributions.
The Advisor can resign on 60 days’ notice, and we may not be able to find a suitable replacement within that time, resulting in a disruption in our operations that could adversely affect our financial condition, business and results of operations.
The Advisor has the right to resign under the Investment Advisory Agreement at any time upon not less than 60 days’ written notice, whether we have found a replacement or not. If the Advisor resigns, we may not be able to find a new investment advisor or hire internal management with similar expertise and ability to provide the same or equivalent services on acceptable terms within 60 days, or at all. If we are unable to do so quickly, our operations are likely to experience a disruption, our business, financial condition, results of operations and cash flows as well as our ability to pay distributions are likely to be adversely affected and the value of our shares may decline. In addition, the coordination of our internal management and investment activities is likely to suffer if we are unable to identify and reach an agreement with a single institution or group of executives having the expertise possessed by the Advisor and its affiliates. Even if we are able to retain comparable management, whether internal or external, the integration of such management and their lack of familiarity with our investment objective may result in additional costs and time delays that may adversely affect our business, financial condition, results of operations and cash flows.
We incur significant costs as a result of being registered under the Exchange Act.
We incur legal, accounting and other expenses, including costs associated with the periodic reporting requirements applicable to a company whose securities are registered under the Exchange Act, as well as additional corporate governance requirements, including requirements under the Sarbanes-Oxley Act and other rules implemented by the SEC.
Efforts to comply with the Exchange Act and the Sarbanes-Oxley Act will involve significant expenditures, and non-compliance will adversely affect us and the value of our shares of common stock.
As a public entity, we are subject to the reporting requirements of the Exchange Act and requirements of the Sarbanes-Oxley Act. These requirements may place a strain on our systems and resources. The Exchange Act requires that we file annual, quarterly and current reports with respect to our business and financial condition. The Sarbanes-Oxley Act requires that we maintain effective disclosure controls and procedures and internal controls over financial reporting, which are discussed below.
We have implemented procedures, processes, policies and practices for the purpose of addressing such standards and requirements applicable to public companies. Our management will be required to report on our internal control over financial reporting pursuant to Section 404 of the Sarbanes-Oxley Act. We will be required to review on an annual basis our internal control over financial reporting, and on a quarterly and annual basis to evaluate and disclose changes in our internal control over financial reporting. As a result, we expect to incur significant additional annual expenses related to these steps and, among other things, directors’ and officers’ liability insurance, director fees, reporting requirements of the SEC, expenses associated with corporate governance requirements, transfer agent fees, additional administrative expenses payable to the Administrator to compensate them for hiring additional accounting, legal and administrative personnel, increased auditing and legal fees and similar expenses. This process will also result in a diversion of management’s time and attention. We do not know when our evaluation, testing and remediation actions will be completed or its impact on our operations. In addition, we may be unable to ensure that the process is effective or that our internal control over financial reporting is or will be effective. In the event that we are unable to come into and maintain compliance with the Sarbanes-Oxley Act and related rules, we and the value of our securities would be adversely affected.
Our independent registered public accounting firm will not be required to attest to the effectiveness of our internal control over financial reporting until the date we are no longer an emerging growth company under the JOBS Act. Because we do not currently have comprehensive documentation of our internal control and have not yet tested our internal control in accordance with Section 404 of the Sarbanes-Oxley Act, we cannot conclude, as required by Section 404, that we do not have a material weakness in our internal control or a combination of significant deficiencies that could result in the conclusion that we have a material weakness in our internal control. If we are not able to implement the applicable requirements of Section 404 of the Sarbanes-Oxley Act in a timely manner or with adequate compliance, our operations, financial reporting or financial results could be adversely affected. Matters impacting our internal controls may cause us to be unable to report our financial information on a timely basis and thereby subject us to adverse regulatory consequences, including sanctions by the SEC, and result in a breach of the covenants under the agreements governing any of our financing arrangements. There could also be a negative reaction in the financial markets due to a loss of investor confidence in us and the reliability of our financial statements. Confidence in the reliability of our financial statements could also suffer if we or our independent registered public accounting firm were to report a material weakness in our internal controls over financial reporting. This could materially adversely affect us.
Our internal control over financial reporting may not prevent or detect misstatements because of its inherent limitations, including the possibility of human error, the circumvention or overriding of controls, or fraud. Even effective internal controls can provide only reasonable assurance with respect to the preparation and fair presentation of financial statements. If we fail to maintain the adequacy of our internal controls, including any failure to implement required new or improved controls, or if we experience difficulties in their implementation, our business and operating results could be harmed and we could fail to meet our financial reporting obligations.
We are highly dependent on information systems, and cybersecurity risks and cyber incidents may adversely affect our business or the business of our portfolio companies, which may, in turn, negatively affect the value of our shares of common stock and our ability to pay distributions.
Our business depends on the communications and information systems of our Advisor and its affiliates, our portfolio companies and third-party service providers. These systems are subject to potential cybersecurity attacks and incidents, including through adverse events that threaten the confidentiality, integrity or availability of our information resources. Cyber hacking could also cause significant disruption and harm to the companies in which we invest. Additionally, digital and network technologies might be at risk of cyberattacks that could potentially seek unauthorized access to digital systems for purposes such as misappropriating sensitive information, corrupting data or causing operational disruption. Cyberattacks might potentially be carried out by persons using techniques that could range from efforts to electronically circumvent network security or overwhelm websites to intelligence gathering and social engineering functions aimed at obtaining information necessary to gain access. These attacks could involve gaining unauthorized access to our information systems for purposes of misappropriating assets, stealing confidential information, corrupting data or causing operational disruption and result in disrupted operations, misstated or unreliable financial data, liability for stolen assets or information, increased cybersecurity protection and insurance costs, litigation and damage to our business relationships, any of which could, in turn, have a material adverse effect on our operating results and negatively affect the value of our securities and our ability to pay distributions to our stockholders.
As our reliance on technology has increased, so have the risks posed to our information systems, both internal and those provided by the Advisor and third-party service providers. In addition, we and the Advisor currently or in the future are expected to routinely transmit and receive personal, confidential and proprietary information by email and other electronic means. We and the Advisor may not be able to ensure secure capabilities with all of our clients, vendors, service providers, counterparties and other third parties to protect the confidentiality of the information.
In addition, we, the Advisor and many of our third-party service providers currently have work from home policies. Such a policy of remote working could strain our technology resources and introduce operational risks, including heightened cybersecurity risks and other risks described above. Remote working environments may be less secure and more susceptible to hacking attacks, including phishing and social engineering attempts. There is no assurance that any efforts to mitigate cybersecurity risks undertaken by us or our Advisor will be effective. Network, system, application and data breaches as a result of cybersecurity risks or cyber incidents could result in operational disruptions or information misappropriation that could have a material adverse effect on our business, results of operations and financial condition of us and of our portfolio companies.
Purchases of shares of our common stock by us under our open market repurchase program, including the Company Rule 10b5-1 Plan, may result in the price of shares of our common stock being higher than the price that otherwise might exist in the open market and are subject to our ability to finance such repurchases.
Our Board has authorized us to repurchase shares of our common stock through an open-market share repurchase program for up to $100 million in the aggregate of shares of our common stock within one year of the closing of the IPO. Pursuant to such authorization and concurrently with the closing of the IPO, we entered into the Company 10b5-1 Plan to acquire up to $100 million in the aggregate of shares of our Common Stock, in accordance with the guidelines specified in Rule 10b-18 and Rule 10b5-1 of the Exchange Act, and will otherwise be subject to applicable law, including Regulation M, which may prohibit purchases under certain circumstances. These activities may have the effect of maintaining the market price of shares our Common Stock or retarding a decline in the market price of the shares of our Common Stock, and, as a result, the price of our shares of Common Stock may be higher than the price that otherwise might exist in the open market.
In addition, we may further borrow under credit facilities and/or issue senior unsecured notes in the future in order to finance repurchases of shares. We can offer no assurance that we will be successful in obtaining suitable debt investments to finance purchases under the Company 10b5-1 Plan. Whether purchases will be made under the Company 10b5-1 Plan and how much will be purchased at any time is uncertain, dependent on prevailing market prices, trading volumes and our ability to finance repurchases, all of which we cannot predict.
There may be trademark risk, as we do not own the Kayne Anderson name.
We do not own the Kayne Anderson name, but we are permitted to use it as part of our corporate name pursuant to a license agreement with the Advisor. Use of the name by other parties or the termination of the license agreement may harm our business.
Risks Relating to Our Investments
We are subject to risks associated with the current interest rate environment, and rising interest rates could affect the value of our investments and make it more difficult for portfolio companies to make periodic payments on their loans.
Interest rate risk refers to the risk of market changes in interest rates. Interest rate changes affect the value of debt. In general, rising interest rates will negatively impact the price of fixed rate debt, and falling interest rates will have a positive effect on price. Adjustable-rate debt also reacts to interest rate changes in a similar manner, although generally to a lesser degree. Interest rate sensitivity is generally larger and less predictable in debt with uncertain payment or prepayment schedules. Further, rising interest rates make it more difficult for borrowers to repay debt, which could increase the risk of payment defaults. Any failure of one or more portfolio companies to repay or refinance its debt at or prior to maturity or the inability of one or more portfolio companies to make ongoing payments following an increase in contractual interest rates could have a material adverse effect on our business, financial condition, results of operations and cash flows.
During any period of higher-than-normal levels of inflation, such as the current inflationary environment, interest rates typically increase. Higher interest rates will increase the cost of our borrowings and may reduce returns to stockholders (including resulting in lower dividend payments by us). Further, in response to rising risk-free interest rates, market participants could require higher rates of interest on the types of loans and credit investments that we own, which would decrease the value of those investments.
In an effort to control inflation, the U.S. Federal Reserve Board (the “Fed”) has sharply raised interest rates in recent years, and they remain near their highest levels in over twenty years. Other central banks globally have implemented similar rate increases. A wide variety of factors can cause interest rates to rise (e.g., central bank monetary policies, inflation rates, or general economic conditions). Although recently both the Fed and other central banks globally have begun lowering rates, there is no certainty that further reductions will occur. There is no assurance that the actions being taken by the Fed will improve the outlook for long-term inflation or whether they might result in a recession. A recession could lead to declined employment, global demand destruction and/or business failures, which may result in a decline in the value of our portfolio. In addition, increased interest rates could increase our cost of borrowing and reduce the return on leverage to common stockholders.
Our business is dependent on bank relationships and recent strain on the banking system may adversely impact us.
The financial markets recently have encountered volatility associated with concerns about the balance sheets of banks, especially small and regional banks, which may have significant losses associated with investments that make it difficult to fund demands to withdraw deposits and other liquidity needs. Although the federal government has announced measures to assist these banks and protect depositors, some banks have already been impacted and others may be materially and adversely impacted. Our business is dependent on bank relationships and we are proactively monitoring the financial health of such bank relationships. Continued strain on the banking system may adversely impact our business, financial condition and results of operations. To the extent that our portfolio companies work with banks that are negatively impacted by the foregoing, such portfolio companies’ ability to access their own cash, cash equivalents and investments may be threatened. In addition, such affected portfolio companies may not be able to enter into new banking arrangements or credit facilities or receive the benefits of their existing banking arrangements or facilities. Any such developments could harm our business, financial condition, and operating results, and prevent us from fully implementing our investment plan. Continued strain on the banking system may adversely impact our business, financial condition and results of operations.
Limitations of investment due diligence expose us to investment risk.
Our due diligence may not reveal all of a portfolio company’s liabilities and may not reveal other weaknesses in its business. We can offer no assurance that our due diligence processes will uncover all relevant facts that would be material to an investment decision. Before making an investment in, or a loan to, a company, the Advisor will assess the strength and skills of a company’s management and other factors that it believes are material to the performance of the investment.
In making the assessment and otherwise conducting customary due diligence, the Advisor will rely on the resources available to it and, in some cases, an investigation by third parties. This process is particularly important and highly subjective with respect to newly organized entities because there may be little or no information publicly available about those entities.
We may make investments in, or loans to, companies that are not subject to public company reporting requirements including requirements regarding preparation of financial statements, and our portfolio companies may utilize divergent reporting standards that may make it difficult for the Advisor to accurately assess the prior performance of a portfolio company. We will, therefore, depend upon the compliance by investment companies with their contractual reporting obligations. As a result, the evaluation of potential investments and our ability to perform due diligence on and effectively monitor investments may be impeded, and we may not realize the returns which we expect on any particular investment. In the event of fraud by any company in which we invest or with respect to which we make a loan, we may suffer a partial or total loss of the amounts invested in that company.
We invest in highly leveraged companies, which could cause us to lose all or a part of our investment in those companies.
Investment in leveraged companies involves a number of significant risks. Leveraged companies in which we invest may have limited financial resources and may be unable to meet their obligations under their debt securities that we hold. Such developments may be accompanied by a deterioration in the value of any collateral and a reduction in the likelihood of our realizing any guarantees that we may have obtained in connection with our investment. In addition, leveraged companies may experience bankruptcy or similar financial distress that may adversely and permanently affect the issuer, in addition to risks associated with the duration and administrative costs of bankruptcy proceedings.
Smaller leveraged companies and middle market companies also may have less predictable operating results and may require substantial additional capital to support their operations, finance their expansion or maintain their competitive position. Middle market companies may have limited financial resources, may have difficulty accessing the capital markets to meet future capital needs and may be unable to meet their obligations under their debt securities that we hold, which may be accompanied by a deterioration in the value of any collateral and a reduction in the likelihood of our realizing any guarantees we may have obtained in connection with our investment. In addition, such companies typically have shorter operating histories, narrower product lines and smaller market shares than larger businesses, which tend to render them more vulnerable to competitors’ actions and market conditions, as well as general economic downturns. Middle market companies are also more likely to depend on the management talents and efforts of a small group of persons, and the death, disability, resignation or termination of one or more of these persons could have a material adverse impact on our portfolio company and, in turn, on us.
The debt that we invest in is typically not rated by any rating agency, but we believe that if such investments were rated, they would be below investment grade (rated lower than “Baa3” by Moody’s Investors Service, lower than “BBB-” by Fitch Ratings or lower than “BBB-” by Standard & Poor’s Ratings Services), which under the guidelines established by these rating entities is an indication of having predominantly speculative characteristics with respect to the issuer’s capacity to pay interest and repay principal. Bonds that are rated below investment grade are sometimes referred to as “high yield bonds” or “junk bonds.” Therefore, our investments will result in an above average amount of risk and volatility or loss of principal.
We are subject to risks associated with our investments in unitranche secured loans and securities, including the potential loss of all or part of such investments.
We invest in unitranche secured loans, which are a combination of senior secured and junior secured debt in the same facility. Unitranche secured loans provide all of the debt needed to finance a leveraged buyout or other corporate transaction, both senior and junior, but generally in a first-lien position, while the borrower generally pays a blended, uniform interest rate rather than different rates for different tranches. Unitranche secured debt generally requires payments of both principal and interest throughout the life of the loan. Generally, we expect these securities to carry a blended yield that is between senior secured and junior debt interest rates. Unitranche secured loans provide a number of advantages for borrowers, including the following: simplified documentation, greater certainty of execution and reduced decision-making complexity throughout the life of the loan. In some cases, a portion of the total interest may accrue or be paid in kind. Because unitranche secured loans combine characteristics of senior and junior financing, unitranche secured loans have risks similar to the risks associated with senior secured and second-lien loans and junior debt in varying degrees according to the combination of loan characteristics of the unitranche secured loan.
Our investments in securities that are rated below investment grade (i.e. “junk bonds”) may be risky and we could lose all or part of our investments.
We invest in securities that are rated below investment grade by rating agencies or that would be rated below investment grade if they were rated. Below investment grade securities, which are often referred to as “junk,” have predominantly speculative characteristics with respect to the issuer’s capacity to pay interest and repay principal. They may also be difficult to value and illiquid. The major risks of below investment grade securities include:
Below investment grade securities may be issued by less creditworthy issuers. Issuers of below investment grade securities may have a larger amount of outstanding debt relative to their assets than issuers of investment grade securities. In the event of an issuer’s bankruptcy, claims of other creditors may have priority over the claims of holders of below investment grade securities, leaving few or no assets available to repay holders of below investment grade securities.
Prices of below investment grade securities are subject to extreme price fluctuations. Adverse changes in an issuer’s industry and general economic conditions may have a greater impact on the prices of below investment grade securities than on other higher-rated fixed-income securities.
Issuers of below investment grade securities may be unable to meet their interest or principal payment obligations because of an economic downturn, specific issuer developments, or the unavailability of additional financing.
Below investment grade securities frequently have redemption features that permit an issuer to repurchase the security from us before it matures. If the issuer redeems below investment grade securities, we may have to invest the proceeds in securities with lower yields and may lose income.
Below investment grade securities may be less liquid than higher-rated fixed-income securities, even under normal economic conditions. There are fewer dealers in the below investment grade securities market, and there may be significant differences in the prices quoted by the dealers. Judgment may play a greater role in valuing these securities and we may be unable to sell these securities at an advantageous time or price.
We may incur expenses to the extent necessary to seek recovery upon default or to negotiate new terms with a defaulting issuer.
Defaults by our portfolio companies, including defaults relating to collateral, will harm our operating results.
A portfolio company’s failure to satisfy financial or operating covenants imposed by us or other lenders could lead to defaults and, potentially, termination of its loans and foreclosure on its assets, which could trigger cross-defaults under other agreements and jeopardize such company’s ability to meet its obligations under the debt securities that we hold. We may incur expenses to the extent necessary to seek recovery upon default or to negotiate new terms with a defaulting portfolio company. In addition, lenders in certain cases can be subject to lender liability claims for actions taken by them when they become too involved in the borrower’s business or exercise control over a borrower. It is possible that we could become subject to a lender’s liability claim, including as a result of actions taken if we render managerial assistance to the borrower. Moreover, some of the loans in which we may invest may be “covenant-lite” loans. We use the term “covenant-lite” loans to refer generally to loans that do not have a complete set of financial maintenance covenants. Generally, “covenant-lite” loans provide borrower companies more freedom to negatively impact lenders because their covenants are incurrence-based, which means they are only tested and can only be breached following an affirmative action of the borrower, rather than by a deterioration in the borrower’s financial condition. Accordingly, to the extent we invest in “covenant-lite” loans, we may have fewer rights against a borrower and may have a greater risk of loss on such investments as compared to investments in or exposure to loans with financial maintenance covenants.
Certain debt investments that we make in portfolio companies will be secured on a second priority basis by the same collateral securing senior debt of such companies. The first priority liens on the collateral will secure the portfolio company’s obligations under any outstanding senior debt and may secure certain other future debt that may be permitted to be incurred by the portfolio company under the agreements governing the debt. The holders of obligations secured by the first priority liens on the collateral will generally control the liquidation of and be entitled to receive proceeds from any realization of the collateral to repay their obligations in full before us. In addition, the value of the collateral in the event of liquidation will depend on market and economic conditions, the availability of buyers and other factors. There can be no assurance that the proceeds, if any, from the sale or sales of all of the collateral would be sufficient to satisfy the debt obligations secured by the second priority liens after payment in full of all obligations secured by the first priority liens on the collateral. If such proceeds are not sufficient to repay amounts outstanding under the debt obligations secured by the second priority liens, then we, to the extent not repaid from the proceeds of the sale of the collateral, will only have an unsecured claim against the portfolio company’s remaining assets, if any.
We may also make unsecured debt investments in portfolio companies in the form of borrowings under credit facilities or issuances of senior unsecured notes, meaning that such investments will not benefit from any interest in collateral of such companies. Liens on such portfolio companies’ collateral, if any, will secure the portfolio company’s obligations under its outstanding secured debt and may secure certain future debt that is permitted to be incurred by the portfolio company under its secured debt agreements. The holders of obligations secured by such liens will generally control the liquidation of, and be entitled to receive proceeds from, any realization of such collateral to repay their obligations in full before us. In addition, the value of such collateral in the event of liquidation will depend on market and economic conditions, the availability of buyers and other factors. There can be no assurance that the proceeds, if any, from sales of such collateral would be sufficient to satisfy our unsecured debt obligations after payment in full of all secured debt obligations. If such proceeds were not sufficient to repay the outstanding secured debt obligations, then our unsecured claims would rank equally with the unpaid portion of such secured creditors’ claims against the portfolio company’s remaining assets, if any.
The rights we may have with respect to the collateral securing any junior priority loans we make in our portfolio companies may also be limited pursuant to the terms of one or more intercreditor agreements that we enter into with the holders of senior debt. Under such an intercreditor agreement, at any time that senior obligations are outstanding, we may forfeit certain rights with respect to the collateral to the holders of these senior obligations. These rights may include the right to commence enforcement proceedings against the collateral, the right to control the conduct of such enforcement proceedings, the right to approve amendments to collateral documents, the right to release liens on the collateral and the right to waive past defaults under collateral documents. We may not have the ability to control or direct such actions, even if as a result our rights as junior lenders are adversely affected.
The lack of liquidity and price decline in our investments may adversely affect our business, including by reducing our NAV through increased net unrealized depreciation.
We may invest in companies that are experiencing financial difficulties, which difficulties may never be overcome. Our investments will be illiquid in most cases, and there can be no assurance that we will be able to realize on such investments in a timely manner. A substantial portion of our investments in leveraged companies are and will be subject to legal and other restrictions on resale or will otherwise be less liquid than more broadly traded public securities. The illiquidity of these investments may make it difficult for us to sell such investments if the need arises.
As a BDC, we are required to carry our investments at market value or, if no market value is ascertainable, at fair value as determined in good faith by our Advisor. As part of the valuation process, we may take into account the following types of factors, if relevant, in determining the fair value of our investments:
| ● | the enterprise value of the portfolio company; |
| ● | the nature and realizable value of any collateral; |
| ● | the company’s ability to make interest payments, amortization payments (if any) and other fixed charges; |
| ● | call features, put features and other relevant terms of the debt security; |
| ● | the company’s historical and projected financial results; |
| ● | the markets in which the portfolio company does business; and |
| ● | changes in the interest rate environment and the credit markets generally that may affect the price at which similar investments may be made in the future and other relevant factors. |
In addition, if we are required to liquidate all or a portion of our portfolio quickly, we may realize significantly less than the value at which we have previously recorded our investments. We may also face other restrictions on our ability to liquidate an investment in a portfolio company to the extent that we, the Advisor or any of its affiliates have material nonpublic information regarding such portfolio company.
In addition, we generally expect to invest in securities, instruments and assets that are not, and are not expected to become, publicly traded. We will generally not be able to sell securities publicly unless the sale is registered under applicable securities laws, or unless an exemption from such registration requirements is available.
In certain cases, we may also be prohibited by contract from selling an investment for a period of time or otherwise be restricted from disposing of the investment. Furthermore, certain types of investments expected to be made may require a substantial length of time to realize a return or fully liquidate.
When an external event such as a purchase transaction, public offering or subsequent equity sale occurs, we use the pricing indicated by the external event to corroborate our valuation. We record decreases in the market values or fair values of our investments as unrealized depreciation. Declines in prices and liquidity in the corporate debt markets may result in significant net unrealized depreciation in our portfolio. The effect of all of these factors on our portfolio may reduce our NAV by increasing net unrealized depreciation in our portfolio. Depending on market conditions, we could incur substantial realized losses and may suffer additional unrealized losses in future periods, which could have a material adverse effect on our business, financial condition, results of operations and cash flows.
Further, in connection with the disposition of an investment in a portfolio company, we may be required to make representations about the business and financial affairs of the portfolio company, or we may be responsible for the contents of disclosure documents under applicable securities laws. We may also be required to indemnify the purchasers of such investment or underwriters to the extent that any such representations or disclosure documents turn out to be incorrect, inaccurate or misleading. These arrangements may result in contingent liabilities, for which we may establish reserves or escrows. However, we can offer no assurance that we will adequately reserve for our contingent liabilities and that such liabilities will not have an adverse effect on us. Such contingent liabilities might ultimately have to be funded by proceeds, including the return of capital, from our other investments.
Our portfolio companies may prepay loans, which may reduce our yields if capital returned cannot be invested in transactions with equal or greater expected yields.
The loans in our investment portfolio may be prepaid at any time, generally with little advance notice. Whether a loan is prepaid will depend both on the continued positive performance of the portfolio company and the existence of favorable financing market conditions that allow such company the ability to replace existing financing with less expensive capital. As market conditions change, we do not know when, and if, prepayment may be possible for each portfolio company. In some cases, the prepayment of a loan may reduce our achievable yield if the capital returned cannot be invested in transactions with equal or greater expected yields, which could have a material adverse effect on our business, financial condition and results of operations.
Our portfolio companies may be unable to repay or refinance outstanding principal on their loans at or prior to maturity.
We have a maturity policy between three to six years for our debt investments. The portfolio companies in which we invest may be unable to repay or refinance outstanding principal on their loans at or prior to maturity. This risk and the risk of default are increased to the extent that the loan documents do not require the portfolio companies to pay down the outstanding principal of such debt prior to maturity. As a result, once our investments mature, we will need to seek new investments for such capital.
Any failure of one or more portfolio companies to repay or refinance its debt at or prior to maturity or the inability of one or more portfolio companies to make ongoing payments following an increase in contractual interest rates could have a material adverse effect on our business, financial condition, results of operations and cash flows.
Our investments in portfolio companies may expose us to environmental risks.
We may invest in companies engaged in the ownership (direct or indirect), operation, management or development of real properties that may contain hazardous or toxic substances, and, therefore, may be potentially liable for removal or remediation costs, as well as certain other costs, including governmental fines and liabilities for injuries to persons and property. The existence of any such material environmental liability could have a material adverse effect on the results of operations, cash flow and share price of any such portfolio company. As a result, our investment performance could suffer substantially.
There can be no guarantee that all costs and risks regarding compliance with environmental laws and regulations can be identified. New and more stringent environmental and health and safety laws, regulations and permit requirements or stricter interpretations of current laws or regulations could impose substantial additional costs on portfolio investment or potential investments. Compliance with such current or future environmental requirements does not ensure that the operations of the portfolio investments will not cause injury to the environment or to people under all circumstances or that the portfolio investments will not be required to incur additional unforeseen environmental expenditures. Moreover, failure to comply with any such requirements could have a material adverse effect on an investment, and we can offer no assurance that the portfolio investments will at all times comply with all applicable environmental laws, regulations and permit requirements.
We are a non-diversified investment company within the meaning of the 1940 Act, and therefore we are not limited with respect to the proportion of our assets that may be invested in securities of a single issuer.
We are classified as a non-diversified investment company within the meaning of the 1940 Act, which means that we are not limited by the 1940 Act with respect to the proportion of our assets that we may invest in securities of a single issuer. To the extent that we assume large positions in the securities of a small number of issuers, our NAV may fluctuate to a greater extent than that of a diversified investment company as a result of changes in the financial condition or the market’s assessment of the issuer. We may also be more susceptible to any single economic or regulatory occurrence than a diversified investment company. Beyond our asset diversification requirements as a RIC under the Code, we do not have fixed guidelines for diversification, and our investments could be concentrated in relatively few portfolio companies.
Our portfolio may be concentrated in a limited number of portfolio companies and industries, which will subject us to a risk of significant loss if any of these companies defaults on its obligations under any of its debt instruments or if there is a downturn in a particular industry.
Our portfolio may be concentrated in a limited number of portfolio companies and industries. As a result, the aggregate returns we realize may be significantly and adversely affected if a small number of investments perform poorly or if we need to write down the value of any one investment. Additionally, while we are not targeting any specific industries, our investments may be concentrated in relatively few industries. For example, although we may classify the industries of our portfolio companies by end-market (such as health market or business services) and not by the products or services (such as software) directed to those end-markets, some of our portfolio companies may principally provide software products or services, which exposes us to downturns in that sector. As a result, a downturn in any particular industry in which we are invested could also significantly impact the aggregate returns we realize.
Our failure to make follow-on investments in our portfolio companies could impair the value of our portfolio.
Following an initial investment in a portfolio company, we may make additional investments in that portfolio company as “follow-on” investments, in seeking to:
| ● | increase or maintain in whole or in part our position as a creditor or equity ownership percentage in a portfolio company; |
| ● | exercise warrants, options or convertible securities that were acquired in the original or subsequent financing; or |
| ● | preserve or enhance the value of our investment. |
We have discretion to make follow-on investments, subject to the availability of capital resources. Failure on our part to make follow-on investments may, in some circumstances, jeopardize the continued viability of a portfolio company and our initial investment, or may result in a missed opportunity for us to increase our participation in a successful portfolio company. Even if we have sufficient capital to make a desired follow-on investment, we may elect not to make a follow-on investment because we may not want to increase our level of risk, because we prefer other opportunities or because of regulatory or other considerations. Our ability to make follow-on investments may also be limited by the Advisor’s allocation policy.
Because we generally do not hold controlling equity interests in our portfolio companies, we may not be able to exercise control over our portfolio companies or to prevent decisions by management of our portfolio companies that could decrease the value of our investments and there is no assurance that portfolio company management will be able to operate their companies in accordance with our expectations.
To the extent that we do not hold controlling equity interests in portfolio companies, we will have a limited ability to protect our position in such portfolio companies. We may also co-invest with third parties through partnerships, joint ventures or other entities. Such investments may involve risks in connection with such third-party involvement, including the possibility that a third-party co-investor may have economic or business interests or goals that are inconsistent with ours or may be in a position to take (or block) action in a manner contrary to our investment objective. In those circumstances where such third parties involve a management group, such third parties may receive compensation arrangements relating to such investments, including incentive compensation arrangements.
Furthermore, the day-to-day operations of each portfolio company in which we invest will be the responsibility of that portfolio company’s management team. Although we will be responsible for monitoring the performance of each investment and generally intend to invest in portfolio companies operated by strong management, there can be no assurance that the existing management team, or any successor, will be able to operate any such portfolio company in accordance with our expectations. There can be no assurance that a portfolio company will be successful in retaining key members of its management team, the loss of whom could have a material adverse effect on us. Although we generally intend to invest in companies with strong management, there can be no assurance that the existing management of such companies will continue to operate a company successfully.
Our portfolio companies may incur debt that ranks equally with, or senior to, our investments in such companies and such portfolio companies may not generate sufficient cash flow to service their debt obligations to us.
We may invest a portion of our capital in second lien and subordinated loans issued by our portfolio companies. Our portfolio companies may have, or be permitted to incur, other debt that ranks equally with, or senior to, the debt securities in which we invest. Such subordinated investments are subject to greater risk of default than senior obligations as a result of adverse changes in the financial condition of the obligor or in general economic conditions. If we make a subordinated investment in a portfolio company, the portfolio company may be highly leveraged, and its relatively high debt-to-equity ratio may create increased risks that its operations might not generate sufficient cash flow to service all of its debt obligations. By their terms, such debt instruments may provide that the holders are entitled to receive payment of interest or principal on or before the dates on which we are entitled to receive payments in respect of the securities in which we invest. These debt instruments would usually prohibit the portfolio companies from paying interest on or repaying our investments in the event of and during the continuance of a default under such debt. Also, in the event of insolvency, liquidation, dissolution, reorganization or bankruptcy of a portfolio company, holders of securities ranking senior to our investment in that portfolio company would typically be entitled to receive payment in full before we receive any distribution in respect of our investment. After repaying senior creditors, the portfolio company may not have any remaining assets to use for repaying its obligation to us where we are junior creditor. In the case of debt ranking equally with debt securities in which we invest, we would have to share any distributions on an equal and ratable basis with other creditors holding such debt in the event of an insolvency, liquidation, dissolution, reorganization or bankruptcy of the relevant portfolio company.
Additionally, certain loans that we make to portfolio companies may be secured on a second priority basis by the same collateral securing senior secured debt of such companies. The first priority liens on the collateral will secure the portfolio company’s obligations under any outstanding senior debt and may secure certain other future debt that may be permitted to be incurred by the portfolio company under the agreements governing the loans. The holders of obligations secured by first priority liens on the collateral will generally control the liquidation of, and be entitled to receive proceeds from, any realization of the collateral to repay their obligations in full before us. In addition, the value of the collateral in the event of liquidation will depend on market and economic conditions, the availability of buyers and other factors. There can be no assurance that the proceeds, if any, from sales of all of the collateral would be sufficient to satisfy the loan obligations secured by the second priority liens after payment in full of all obligations secured by the first priority liens on the collateral. If such proceeds were not sufficient to repay amounts outstanding under the loan obligations secured by the second priority liens, then we, to the extent not repaid from the proceeds of the sale of the collateral, will only have an unsecured claim against the portfolio company’s remaining assets, if any.
We may make unsecured loans to portfolio companies, meaning that such loans will not benefit from any interest in collateral of such companies. Liens on a portfolio company’s collateral, if any, will secure the portfolio company’s obligations under its outstanding secured debt and may secure certain future debt that is permitted to be incurred by the portfolio company under its secured loan agreements. The holders of obligations secured by such liens will generally control the liquidation of, and be entitled to receive proceeds from, any realization of such collateral to repay their obligations in full before us. In addition, the value of such collateral in the event of liquidation will depend on market and economic conditions, the availability of buyers and other factors. There can be no assurance that the proceeds, if any, from sales of such collateral would be sufficient to satisfy our unsecured loan obligations after payment in full of all loans secured by collateral. If such proceeds were not sufficient to repay the outstanding secured loan obligations, then our unsecured claims would rank equally with the unpaid portion of such secured creditors’ claims against the portfolio company’s remaining assets, if any.
The rights we may have with respect to the collateral securing any junior priority loans we make to our portfolio companies may also be limited pursuant to the terms of one or more intercreditor agreements that we enter into with the holders of senior debt. Under a typical intercreditor agreement, at any time that obligations that have the benefit of the first priority liens are outstanding, any of the following actions that may be taken in respect of the collateral will be at the direction of the holders of the obligations secured by the first priority liens:
| ● | the ability to cause the commencement of enforcement proceedings against the collateral; |
| ● | the ability to control the conduct of such proceedings; |
| ● | the approval of amendments to collateral documents; |
| ● | releases of liens on the collateral; and |
| ● | waivers of past defaults under collateral documents. |
We may not have the ability to control or direct such actions, even if our rights as junior lenders are adversely affected.
The disposition of our investments may result in contingent liabilities.
A significant portion of our investments will involve private securities. In connection with the disposition of an investment in private securities, we may be required to make representations about the business and financial affairs of the portfolio company typical of those made in connection with the sale of a business. We may also be required to indemnify the purchasers of such investment to the extent that any such representations turn out to be inaccurate or with respect to potential liabilities. These arrangements may result in contingent liabilities that ultimately result in funding obligations that we must satisfy through our return of distributions previously made to us.
The Advisor’s and Administrator’s liability is limited, and we have agreed to indemnify each against certain liabilities, which may lead them to act in a riskier manner on our behalf than it would when acting for its own account.
Under the Investment Advisory Agreement, the Advisor does not assume any responsibility to us other than to render the services called for under that agreement, and it is not responsible for any action of our Board in following or declining to follow the Advisor’s advice or recommendations. Under the terms of the Investment Advisory Agreement, the Advisor, its officers, members, personnel and any person controlling or controlled by the Advisor are not liable to us, any subsidiary of ours, our directors, our stockholders or any subsidiary’s stockholders or partners for acts or omissions performed in accordance with and pursuant to the Investment Advisory Agreement, except those resulting from acts constituting willful misfeasance, bad faith, gross negligence or reckless disregard of the Advisor’s duties under the Investment Advisory Agreement. In addition, we have agreed to indemnify the Advisor and each of its officers, directors, members, managers and employees from and against any claims or liabilities, including reasonable legal fees and other expenses reasonably incurred, arising out of or in connection with our business and operations or any action taken or omitted on our behalf pursuant to authority granted by the Investment Advisory Agreement, except where attributable to willful misfeasance, bad faith, gross negligence or reckless disregard of such person’s duties under the Investment Advisory Agreement. Similarly, the Administrator and certain specified parties providing administrative services pursuant to the relevant agreement are not liable to us or our stockholders for, and we have agreed to indemnify them for, any claims or losses arising out of the good faith performance of their duties or obligations, except where attributable to willful misfeasance, bad faith, gross negligence or reckless disregard of the Administrator’s duties. These protections may lead the Advisor or the Administrator to act in a riskier manner when acting on our behalf than it would when acting for its own account.
We are subject to risks under hedging transactions and our ability to enter into transactions involving derivatives and financial commitment transactions may be limited.
Although we do not engage in hedging transactions as a principal investment strategy, we may engage in hedging transactions in the form of interest rate swaps, caps, collars and floors, intended to limit our exposure to interest rate fluctuations to the limited extent such transactions are permitted under the 1940 Act and applicable commodities laws. Engaging in hedging transactions would entail additional risks to our stockholders.
In addition, we are subject to legislation that may limit our ability to enter into such transactions. For example, in August 2022, Rule 18f-4 under the 1940 Act, regarding the ability of a BDC (or a registered investment company) to use derivatives and other transactions that create future payment or delivery obligations (except reverse repurchase agreements and similar financing transactions), became effective. Under the rule, BDCs that make significant use of derivatives are required to operate subject to a value-at-risk leverage limit, adopt a derivatives risk management program and appoint a derivatives risk manager, and comply with various testing and board reporting requirements. These requirements apply unless the BDC qualifies as a “limited derivatives user,” as defined under the adopted rules. Under the rule, a BDC may enter into an unfunded commitment agreement that is not a derivatives transaction, such as an agreement to provide financing to a portfolio company, if the BDC has, among other things, a reasonable belief, at the time it enters into such an agreement, that it will have sufficient cash and cash equivalents to meet its obligations with respect to all of its unfunded commitment agreements, in each case as it becomes due. We intend to operate under the limited derivatives user exemption of Rule 18f-4 and have adopted written policies and procedures reasonably designed to manage our derivatives risk pursuant to Rule 18f-4. Collectively, these requirements may limit our ability to use derivatives and/or enter into certain other financial contracts. We qualify as a “limited derivatives user,” and as a result the requirements applicable to us under Rule 18f-4 may limit our ability to use derivatives and enter into certain other financial contracts. However, if we fail to qualify as a limited derivatives user and become subject to the additional requirements under Rule 18f-4, compliance with such requirements may increase cost of doing business, which could have a material adverse effect on our business, financial condition, results of operations, and cash flows. Future legislation or rules may modify how we treat derivatives and other financial arrangements for purposes of our compliance with the leverage limitations of the 1940 Act and, therefore, may increase or decrease the amount of leverage currently available to us under the 1940 Act, which may be materially adverse to us and our stockholders.
In each such case, we generally would seek to hedge against fluctuations of the relative values of our portfolio positions from changes in market interest rates. Hedging against a decline in the values of our portfolio positions would not eliminate the possibility of fluctuations in the values of such positions or prevent losses if the values of the positions declined. However, such hedging could establish other positions designed to gain from those same developments, thereby offsetting the decline in the value of such portfolio positions. Such hedging transactions could also limit the opportunity for gain if the values of the underlying portfolio positions increased. Moreover, it might not be possible to hedge against an exchange rate or interest rate fluctuation that was so generally anticipated that we would not be able to enter into a hedging transaction at an acceptable price. Use of a hedging transaction could involve counterparty credit risk.
The success of any hedging transactions we may enter into will depend on our ability to correctly predict movements in interest rates. Therefore, while we may enter into hedging transactions to seek to reduce interest rate risks, unanticipated changes in interest rates could result in poorer overall investment performance than if we had not engaged in any such hedging transactions. In addition, the degree of correlation between price movements of the instruments used in a hedging strategy and price movements in the portfolio positions being hedged could vary. Moreover, for a variety of reasons, we might not seek to (or be able to) establish a perfect correlation between the hedging instruments and the portfolio holdings being hedged. Any such imperfect correlation could prevent us from achieving the intended hedge and expose us to risk of loss. Our ability to engage in hedging transactions may also be adversely affected by rules adopted by the CFTC.
We may not realize gains from our equity investments.
When we invest in loans, we may acquire warrants or other equity securities of portfolio companies as well. We may also invest in equity securities directly. To the extent we hold equity investments, we will seek to dispose of them and realize gains upon our disposition of them. However, the equity interests we receive may not appreciate in value and may decline in value. As a result, we may not be able to realize gains from our equity interests, and any gains that we do realize on the disposition of any equity interests may not be sufficient to offset any other losses we experience.
To the extent that we borrow under credit facilities and issue senior unsecured notes, the potential for gain or loss on amounts invested in us will be magnified and may increase the risk of investing in us. Borrowings under credit facilities and issuances of senior unsecured notes may also adversely affect the return on our assets, reduce cash available to service our debt or for distribution to our stockholders, and result in losses.
The use of leverage in the form of borrowings under credit facilities and issuances of senior unsecured notes increases the volatility of investments by magnifying the potential for gain or loss on invested equity capital. Since we use leverage in the form of borrowings under credit facilities and issuances of senior unsecured notes to partially finance our investments, you will experience increased risks of investing in our securities. If the value of our assets decreases, leveraging will cause NAV to decline more sharply than it otherwise would if we had not borrowed under the credit facilities and issued senior unsecured notes. Similarly, any decrease in our income would cause net income to decline more sharply than it would have if we had not borrowed under the credit facilities and issued senior unsecured notes. Such a decline could negatively affect our ability to service our debt or make distributions to our stockholders. In addition, our stockholders will bear the burden of any increase in our expenses as a result of our use of leverage, including interest expenses and any increase in the management or incentive fees payable to our Advisor.
The amount of borrowings under credit facilities and issuances of senior unsecured notes depends on our Advisor’s and our Board’s assessment of market and other factors at the time of any proposed borrowing under credit facilities and issuances of senior unsecured notes. We can offer no assurance that leveraged financing will be available to us on favorable terms or at all. However, to the extent that we use leverage to finance our assets, our financing costs will reduce cash available for servicing our debt or distributions to stockholders. Moreover, we may not be able to meet our financing obligations and, to the extent that we cannot, we risk the loss of some or all of our assets to liquidation or sale to satisfy the obligations. In such an event, we may be forced to sell assets at significantly depressed prices due to market conditions or otherwise, which may result in losses.
We are subject to risks associated with our investment and trading of liquid credit (i.e., broadly syndicated loans).
From time to time, we may invest in liquid credit (i.e., broadly syndicated loans) that may be traded in public or institutional financial markets for which there is a more active market than some of our other investments. These investments may expose us to various risks, including with respect to liquidity, price volatility, interest rate risk, ability to restructure in the event of distress, credit risks and less protective issuing documentation, than is the case with the loans to middle market companies that comprise nearly all of our debt investments. Certain of these instruments may be fixed rate assets, thereby exposing us to interest rate risk in the valuation of such investments. Additionally, the financial markets in which these assets may be traded are subject to significant volatility (including due to macroeconomic conditions), which may impact the value of such investments and our ability to sell such instruments without incurring losses. The foregoing may result in volatility in the valuation of our liquid credit investments, which would, in turn, impact our NAV. Similarly, a sudden and significant increase in market interest rates may increase the risk of payment defaults and cause a decline in the value of these investments and in our NAV. We may sell our liquid credit investments from time to time in order to generate proceeds for use in our investment program, and we may suffer losses in connection with any such sales, due to the foregoing factors. We may not realize gains from our liquid credit investments and any gains that we realize may not be sufficient to offset any other losses we experience.
Our investments in the Trading Companies & Distributors industry face considerable uncertainties including significant regulatory challenges.
Our investments in portfolio companies that operate in the Trading Companies & Distributors industry represent approximately 15.1% of our total portfolio as of December 31, 2024. Portfolio companies in the Trading Companies & Distributors industry are subject to many risks, including the negative impact of regulation, a competitive marketplace, decreased consumer demand and supply-chain disruptions. In recent years, supply-chain disruptions and global trade policies have had a negative impact on these industries and as Trading Companies & Distributors represent a significant portion of our investments, such adverse business and/or economic conditions have also impacted our portfolio. Adverse economic, business, or regulatory developments affecting the Trading Companies & Distributors industry, including trade policies, treaties and tariffs between the United States and other countries, could have a negative impact on the value of our investments in portfolio companies operating in this industry, and therefore could negatively impact our business and results of operations.
Risks Relating to Our Common Stock
Prior to the IPO, there was no public market for our shares of common stock, and we cannot assure you that a market for our shares of common stock will develop or continue, or that the market price of our shares of common stock will not decline at some point following the IPO. Our share of common stock price may be volatile and may fluctuate substantially.
Our shares of common stock are listed on the New York Stock Exchange under the symbol “KBDC.” We cannot assure you that a trading market will develop for our shares of common stock or, if one develops, that the trading market can be sustained. In addition, we cannot predict the prices at which our shares of common stock will trade. Shares of companies offered in an initial public offering often trade at a discount to the initial offering price due to underwriting discounts and commissions and related offering expenses. Also, shares of closed-end investment companies, including BDCs, frequently trade at a discount from their net asset value and our shares may also be discounted in the market. This characteristic of closed-end investment companies is separate and distinct from the risk that our net asset value per share may decline. We cannot predict whether our shares of common stock will trade at, above or below net asset value. The risk of loss associated with this characteristic of closed-end management investment companies may be greater for investors expecting to sell shares of common stock purchased in this offering soon after the IPO. In addition, if our shares of common stock trade below its net asset value per share, we will generally not be able to sell additional shares of common stock to the public at its market price without first obtaining the approval of a majority of our stockholders (including a majority of our unaffiliated stockholders) and our independent directors for such issuance.
The market price and liquidity of the market for our shares of common stock may be significantly affected by numerous factors, some of which are beyond our control and may not be directly related to our operating performance. These factors include:
| ● | significant volatility in the market price and trading volume of securities of BDCs or other companies in the sector in which we operate, which are not necessarily related to the operating performance of these companies; |
| ● | changes in regulatory policies or tax guidelines, particularly with respect to RICs or BDCs; |
| ● | changes in earnings or variations in operating results; |
| ● | changes in the value of our portfolio of investments; |
| ● | any shortfall in revenue or net income or any increase in losses from levels expected by investors or securities analysts; |
| ● | departure of key personnel from our Advisor; |
| ● | operating performance of companies comparable to us; |
| ● | general economic trends and other external factors; and |
| ● | loss of a major funding source. |
Sales of substantial amounts of our shares of common stock in the public market may have an adverse effect on the market price of our shares of common stock.
Upon completion of the IPO, we had 71,116,459 shares of common stock outstanding. The shares of common stock sold in the IPO are freely tradable without restriction or limitation under the Securities Act.
Any shares purchased in the IPO or owned by our affiliates, as defined in the Securities Act, are subject to the public information, manner of sale and volume limitations of Rule 144 under the Securities Act. The remaining shares of common stock outstanding upon the completion of the IPO are “restricted securities” under the meaning of Rule 144 promulgated under the Securities Act and may only be sold if such sale is registered under the Securities Act or exempt from registration, including the exemption under Rule 144.
In addition, shares owned by certain of our stockholders are subject to lock-up restrictions.
Following the IPO and the expiration of applicable lock-up periods, subject to applicable securities laws, sales of substantial amounts of our shares of common stock, or the perception that such sales could occur, could adversely affect the prevailing market prices for our shares of common stock. If this occurs, it could impair our ability to raise additional capital through the sale of equity securities should we desire to do so. We cannot predict what effect, if any, future sales of securities, or the availability of securities for future sales, will have on the market price of our shares of common stock prevailing from time to time.
Trading and liquidity in our shares may be limited and our shares may trade below our NAV.
We cannot assure you that a public trading market can be sustained. Shares of companies offered in an initial public offering often trade at a discount to the initial offering price due to underwriting discounts and related offering expenses. Also, shares of closed-end investment companies and BDCs frequently trade at a discount from their NAV. This characteristic of closed-end investment companies is separate and distinct from the risk that our NAV per share may decline. We cannot predict whether our shares of common stock will trade at, above or below NAV.
Certain provisions of the DGCL, our certificate of incorporation, bylaws, and actions of our Board could deter takeover attempts and have an adverse impact on the value of common stock.
The General Corporation Law of the State of Delaware, as amended (the “DGCL”), contains provisions that may discourage, delay or make more difficult a change in control of us or the removal of our directors. Our certificate of incorporation and bylaws contain provisions that limit liability and provide for indemnification of our directors and officers. These provisions and others which we may adopt also may have the effect of deterring hostile takeovers or delaying changes in control or management. We are subject to Section 203 of the DGCL, the application of which is subject to any applicable requirements of the 1940 Act. This section generally prohibits us from engaging in mergers and other business combinations with stockholders that beneficially own 15% or more of our voting stock, either individually or together with their affiliates, unless our directors or stockholders approve the business combination in the prescribed manner. Section 203 of the DGCL may discourage third parties from trying to acquire control of us and increase the difficulty of consummating such an offer.
We have also adopted measures that may make it difficult for a third party to obtain control of us, including provisions of our certificate of incorporation that classify our Board of Directors in three classes serving staggered three-year terms, and provisions of our certificate of incorporation authorizing our Board of Directors to classify or reclassify shares of our preferred stock in one or more classes or series, and to cause the issuance of additional shares of our stock. These provisions, as well as other provisions in our certificate of incorporation and bylaws, may delay, defer or prevent a transaction or a change in control in circumstances that could give our stockholders the opportunity to realize a premium of the NAV of our shares of common stock.
During extended periods of capital market disruption and instability, there is a risk that you may not receive distributions or that our distributions may not grow over time and a portion of our distributions may be a return of capital.
We intend to make periodic distributions to our stockholders out of assets legally available for distribution. We cannot assure you that we will achieve investment results that will allow us to make a specified level of cash distributions or year-to-year increases in cash distributions. Our ability to pay distributions might be adversely affected by the impact of one or more of the risk factors described in this Annual Report on Form 10-K. Due to the asset coverage test applicable to us under the 1940 Act as a BDC, we may be limited in our ability to make distributions. If we declare a distribution and if more stockholders opt to receive cash distributions rather than participate in our dividend reinvestment plan (“DRIP”), we may be forced to sell some of our investments in order to make cash distribution payments. To the extent we make distributions to stockholders that include a return of capital, such portion of the distribution essentially constitutes a return of the stockholder’s investment. Although such return of capital may not be taxable, such distributions may increase an investor’s tax liability for capital gains upon the future sale of our Common Stock.
A return of capital distribution may cause a stockholder to recognize a capital gain from the sale of our Common Stock even if the stockholder sells its shares for less than the original purchase price.
Investing in our Common Stock may involve an above average degree of risk.
The investments we make in accordance with our investment objective may result in a higher amount of risk than alternative investment options and a higher risk of volatility or loss of principal. Our investments in portfolio companies involve higher levels of risk, and therefore, an investment in our shares may not be suitable for someone with lower risk tolerance. In addition, our Common Stock is intended for long-term investors who can accept the risks of investing primarily in illiquid loans and other debt or debt-like instruments and should not be treated as a trading vehicle.
A stockholder’s interest in us will be diluted if we issue additional shares, which could reduce the overall value of an investment in us.
Our stockholders do not have preemptive rights to any shares of common stock we issue in the future. To the extent that we issue additional equity interests at or below NAV your percentage ownership interest in us may be diluted. In addition, depending upon the terms and pricing of any future and the value of our investments, you may also experience dilution in the book value and fair value of your shares of common stock.
Under the 1940 Act, we generally are prohibited from issuing or selling our shares of common stock at a price below NAV per share, which may be a disadvantage as compared with certain public companies. We may, however, sell our shares of common stock, or warrants, options, or rights to acquire our shares of common stock, at a price below the current NAV of our shares of common stock if our Board of Directors determines that such sale is in our best interests and the best interests of our stockholders, and our stockholders, including a majority of those stockholders that are not affiliated with us, approve such sale. In any such case, the price at which our securities are to be issued and sold may not be less than a price that, in the determination of our Board of Directors, closely approximates the fair value of such securities (less any distributing commission or discount). If we raise additional funds by issuing our shares of common stock or senior securities convertible into, or exchangeable for, our shares of common stock, then the percentage ownership of our stockholders at that time will decrease and you will experience dilution.
In addition, distributions declared in cash payable to stockholders that are participants in our DRIP will generally be automatically reinvested in our shares of common stock. As a result, stockholders that do not participate in our DRIP may experience dilution over time.
We may be subject to risks that arise from newly enacted federal tax legislation and our stockholders may receive our shares of Common Stock as dividends, which could result in adverse tax consequences to them.
The Inflation Reduction Act of 2022, among other things, introduced a 15% book minimum tax on larger corporations, a 1% excise tax on stock buybacks and increased investment in the Internal Revenue Service (the “IRS”) to aid in the enforcement of tax laws. The impact of such legislation, as well as federal tax legislation proposed but not yet enacted, on us, our stockholders and entities in which we may invest is uncertain. Prospective investors are urged to consult their tax advisors regarding the effects of the new legislation on an investment in us.
In order to satisfy the annual distribution requirement applicable to RICs, we will have the ability to declare a large portion of a dividend in our shares of common stock instead of in cash. As long as a portion of such dividend is paid in cash (which portion may be as low as 20% of such dividend) and certain requirements are met, the entire distribution will be treated as a dividend for U.S. federal income tax purposes. As a result, a stockholder generally would be subject to tax on 100% of the fair market value of the dividend on the date the dividend is received by the stockholder in the same manner as a cash dividend, even though most of the dividend was paid in our shares of common stock. We currently do not intend to pay dividends in our shares of common stock.
We may in the future determine to issue preferred stock, which could adversely affect the value of shares of Common Stock.
The issuance of preferred stock with dividend or conversion rights, liquidation preferences or other economic terms favorable to the holders of preferred stock could make an investment in shares of Common Stock less attractive. In addition, the dividends on any preferred stock we issue must be cumulative. Payment of dividends and repayment of the liquidation preference of preferred stock must take preference over any distributions or other payments to holders of Common Stock, and holders of preferred stock are not subject to any of our expenses or losses and are not entitled to participate in any income or appreciation in excess of their stated preference (other than convertible preferred stock that converts into shares of Common Stock). In addition, under the 1940 Act, preferred stock would constitute a “senior security” for purposes of the 150% asset coverage test. We do not currently anticipate issuing preferred stock.
General Risk Factors
Global economic, political and market conditions, including uncertainty about the financial stability of the United States, could have a significant adverse effect on our business, financial condition and results of operations.
The current worldwide financial markets situation, as well as various social and political tensions in the United States and around the world (including wars and other forms of conflict, terrorist acts, security operations and catastrophic events such as fires, floods, earthquakes, tornadoes, hurricanes and global health epidemics), may contribute to increased market volatility, may have long term effects on the United States and worldwide financial markets, and may cause economic uncertainties or deterioration in the United States and worldwide.
For example, ongoing armed conflicts between Russia and Ukraine in Europe and among Israel, Hamas and other militant groups in the Middle East, have caused and could continue to cause significant market disruptions and volatility within the markets in Russia, Europe, the Middle East and the United States. In addition, the current political climate has intensified concerns about trade tariffs and a potential trade war between the United States and certain foreign countries, including China, Mexico and Canada, among others. These consequences may trigger a significant reduction in international trade, shortages or oversupply of certain manufactured goods, substantial price increases or decreases of goods, inflationary pressures, and possible failure of individual companies and/or large segments of the foreign export industry with a potentially negative impact on the value of our investments.
In addition, the political reunification of China and Taiwan, over which China continues to claim sovereignty, is a highly complex issue that has included threats of invasion by China. Any escalation of hostility between China and/or Taiwan would likely have a significant adverse impact not only on the value of investments in both countries, but also on economies and financial markets globally.
We do not currently have portfolio investments with direct exposure to the Middle East, China, Taiwan, Russia or Ukraine, but because of the increasing interconnectedness of global economies and financial markets, events in these regions could negatively affect the value of our investments.
Political, social and economic uncertainty creates and exacerbates risks.
Social, political, economic and other conditions and events (such as natural disasters, epidemics and pandemics, terrorism, conflicts and social unrest) will occur that create uncertainty and have significant impacts on issuers, industries, governments and other systems, including the financial markets, to which companies and their investments are exposed. As global systems, economies and financial markets are increasingly interconnected, events that once had only local impact are now more likely to have regional or even global effects. Events that occur in one country, region or financial market will, more frequently, adversely impact issuers in other countries, regions or markets, including in established markets such as the U.S. Such risks include the large-scale invasion of Ukraine by Russia that began in February 2022, heightened tensions between China and Taiwan, the recent outbreak of hostilities in the Middle East, or the effect on world leaders and governments of global health pandemics, such as the COVID-19 pandemic. These impacts can be exacerbated by failures of governments and societies to adequately respond to an emerging event or threat. We do not currently have portfolio investments with direct exposure to the Middle East, China, Taiwan, Russia or Ukraine, but because of the increasing interconnectedness of global economies and financial markets, events in these regions could negatively affect the value of our investments.
Uncertainty can result in or coincide with, among other things: increased volatility in the financial markets for securities, derivatives, loans, credit and currency; a decrease in the reliability of market prices and difficulty in valuing assets (including portfolio company assets); greater fluctuations in spreads on debt investments and currency exchange rates; increased risk of default (by both government and private obligors and issuers); further social, economic, and political instability; nationalization of private enterprise; greater governmental involvement in the economy or in social factors that impact the economy; changes to governmental regulation and supervision of the loan, securities, derivatives and currency markets and market participants and decreased or revised monitoring of such markets by governments or self-regulatory organizations and reduced enforcement of regulations; limitations on the activities of investors in such markets; controls or restrictions on foreign investment, capital controls and limitations on repatriation of invested capital; the significant loss of liquidity and the inability to purchase, sell and otherwise fund investments or settle transactions (including, but not limited to, a market freeze); unavailability of currency hedging techniques; substantial, and in some periods extremely high, rates of inflation, which can last many years and have substantial negative effects on credit and securities markets as well as the economy as a whole; recessions; and difficulties in obtaining and/or enforcing legal judgments.
For example, the COVID-19 pandemic led to disruptions in local, regional, national and global markets and economies. With respect to the U.S. credit markets (in particular for middle market loans), this outbreak resulted in the following among other things: (i) significant disruption to the businesses of many middle market loan borrowers including supply chains, demand and practical aspects of their operations, as well as lay-offs of employees; (ii) increased draws by borrowers on revolving lines of credit; (iii) increased requests by borrowers for amendments and waivers of their credit agreements to avoid default, increased defaults by such borrowers and/or increased difficulty in obtaining refinancing at the maturity dates of their loans; (iv) volatility and disruption of these markets including greater volatility in pricing and spreads and difficulty in valuing loans during periods of increased volatility, and liquidity issues; and (v) rapidly evolving proposals and/or actions by state and federal governments to address problems experienced by the markets and by businesses and the economy in general which were not necessarily adequate to address the problems faced by the loan market and middle market businesses. Although many of these conditions have resolved, similar consequences could occur in the future as a result of new variants of the virus or other infectious diseases. Any future outbreaks of infectious diseases could have an adverse impact on the markets and the economy in general, which could have a material adverse impact on, among other things, the ability of lenders to originate loans, the volume and type of loans originated, and the volume and type of amendments and waivers granted to borrowers and remedial actions taken in the event of a borrower default, each of which could negatively impact the amount and quality of loans available for investment by us and returns to us, among other things. It is impossible to determine the scope of any future outbreaks, how long any such outbreak, market disruption or uncertainties may last, the effect any governmental actions will have or the full potential impact on us and our portfolio companies in which we invest.
Although it is impossible to predict the precise nature and consequences of these events, or of any political or policy decisions and regulatory changes occasioned by emerging events or uncertainty on applicable laws or regulations that impact us and our targeted investments, it is clear that these types of events are impacting and will, for at least some time, continue to impact us and our targeted investments and, in certain instances, the impact will be adverse and profound.
If public health uncertainties and market disruptions continue for an extended period of time, loan delinquencies, loan non-accruals, problem assets, and bankruptcies may increase. In addition, collateral for our loans may decline in value, which could cause loan losses to increase and the net worth and liquidity of loan guarantors could decline, impairing their ability to honor commitments to us. An increase in loan delinquencies and non-accruals or a decrease in loan collateral and guarantor net worth could result in increased costs and reduced income which would have a material adverse effect on our business, financial condition or results of operations.
We will also be negatively affected if the operations and effectiveness of us or a portfolio company (or any of the key personnel or service providers of the foregoing) is compromised or if necessary or beneficial systems and processes are disrupted.
We are subject to risks related to corporate responsibility.
Our business faces increasing public scrutiny related to environmental, social and governance (“ESG”) activities. We risk damage to our brand and reputation if we fail to act responsibly in a number of areas, such as environmental stewardship, corporate governance and transparency and considering ESG factors in our investment processes. Adverse incidents with respect to ESG activities could impact the value of our brand, the cost of our operations and relationships with investors, all of which could adversely affect our business and results of operations. Additionally, new regulatory initiatives related to ESG could adversely affect our business.
ITEM 1B. UNRESOLVED STAFF COMMENTS
None.
ITEM 1C. CYBERSECURITY
The Company’s Board of Directors (the “Board”) is responsible for overseeing the Company’s risk management program and cybersecurity is a critical element of this program. Management is responsible for the day-to-day administration of the Company’s risk management program and its cybersecurity policies, processes, and practices. The Company’s cybersecurity policies, standards, processes, and practices are based on recognized frameworks established by the National Institute of Standards and Technology, the International Organization for Standardization and other applicable industry standards and are fully integrated into the Company’s overall risk management processes. In general, the Company seeks to address material cybersecurity threats through a company-wide approach that addresses the confidentiality, integrity, and availability of the Company’s information systems or the information that the Company collects and stores, by assessing, identifying and managing cybersecurity issues as they occur.
Cybersecurity Risk Management and Strategy
The Company’s cybersecurity risk management strategy focuses on several areas:
| | ● | Identification and Reporting: The Company has implemented a comprehensive, cross-functional approach to assessing, identifying and managing material cybersecurity threats and incidents. The Company’s program includes controls and procedures to properly identify, classify and escalate certain cybersecurity incidents to provide management visibility and obtain direction from management as to the public disclosure and reporting of material incidents in a timely manner. |
| | ● | Technical Safeguards: The Company implements technical safeguards that are designed to protect the Company’s information systems from cybersecurity threats, including firewalls, intrusion prevention and detection systems, anti-malware functionality, and access controls, which are evaluated and improved through vulnerability assessments and cybersecurity threat intelligence, as well as assistance from third party experts where necessary. |
| | ● | Incident Response and Recovery Planning: The Company has established and maintains comprehensive incident response, business continuity, and disaster recovery plans designed to address the Company’s response to a cybersecurity incident. The Company conducts regular tabletop exercises to test these plans and ensure personnel are familiar with their roles in a response scenario. |
| | ● | Third-Party Risk Management: The Company maintains a comprehensive, risk-based approach to identifying and overseeing material cybersecurity threats presented by third parties, including vendors, service providers, and other external users of the Company’s systems, as well as the systems of third parties that could adversely impact our business in the event of a material cybersecurity incident affecting those third-party systems, including any outside consultants who advise on the Company’s cybersecurity systems. |
| | ● | Education and Awareness: The Company provides regular, mandatory training for all levels of employees regarding cybersecurity threats as a means to equip the Company’s employees with effective tools to address cybersecurity threats, and to communicate the Company’s evolving information security policies, standards, processes, and practices. |
The Company conducts periodic assessment and testing of the Company’s policies, standards, processes, and practices in a manner intended to address cybersecurity threats and events. This includes penetration testing of network infrastructure and phishing tests targeting the Adviser’s employees. The results of such assessments and reviews are evaluated by management and reported to the Board, and the Company adjusts its cybersecurity policies, standards, processes, and practices as necessary based on the information provided by these assessments and reviews.
Governance
The Board, in coordination with the Adviser, oversees the Company’s risk management program, including the management of cybersecurity threats. The Board receives regular updates and reports on developments in the cybersecurity space, including risk management practices, recent developments, vulnerability assessments, third-party and independent reviews, the threat environment, and information security issues encountered by the Company’. The Board also receives prompt and timely information regarding any cybersecurity risk that meets pre-established reporting thresholds, as well as ongoing updates regarding any such risk. On an annual basis, the Board and the Adviser discuss the Company’s approach to overseeing cybersecurity threats.
The Adviser has established an internal working group that includes relevant representation from senior management including the CCO, CFO, and CISO, and CTO who work collaboratively to implement a program designed to protect the Company’s information systems from cybersecurity threats and to promptly respond to any material cybersecurity incidents in accordance with the Company’s incident response and recovery plans. Through ongoing communication with these teams, the CISO, CTO and senior management are informed about and monitor the prevention, detection, mitigation and remediation of cybersecurity threats and incidents in real time, and report such threats and incidents to the Board when appropriate.
Members of the internal working group have multiple decades of experience in information security and risk management, including assessing cybersecurity threats. Furthermore, the CTO and CISO have educational backgrounds and hold professional experience and certifications relevant to management of cybersecurity.
Material Effects of Cybersecurity Incidents
Risks from cybersecurity threats, including as a result of any previous cybersecurity incidents, have not materially affected and are not reasonably likely to materially affect the Company, including its business strategy, results of operations, or financial condition.
ITEM 2. PROPERTIES
The headquarters of KA Credit Advisors, LLC is located at 717 Texas Avenue, Suite 2200, Houston, TX 77002.
ITEM 3. LEGAL PROCEEDINGS
Neither we nor our Advisor is currently subject to any material legal proceedings, nor, to our knowledge, is any material legal proceeding threatened against us, or against our Advisor.
From time to time, we, or our Advisor, may be a party to certain legal proceedings in the ordinary course of business, including proceedings relating to the enforcement of our rights under contracts with our portfolio companies. While the outcome of these legal proceedings cannot be predicted with certainty, we do not expect that these proceedings will have a material effect upon our financial condition or results of operations.
From time to time we are involved in various legal proceedings, lawsuits and claims incidental to the conduct of our business. Our businesses are also subject to extensive regulation, which may result in regulatory proceedings against us.
ITEM 4. MINE SAFETY DISCLOSURES
Not applicable.
PART II
ITEM 5. MARKET FOR REGISTRANT’S COMMON EQUITY, RELATED STOCKHOLDER MATTERS AND ISSUER PURCHASES OF EQUITY SECURITIES
Price Range of Common Stock
Our common stock commenced trading on the NYSE under the symbol “KBDC” on May 22, 2024. Prior to our IPO, the shares of our common stock were offered and sold in transactions exempt from registration under the Securities Act. As such there was no public market for shares of our common stock prior to May 22, 2024.
The following table sets forth, for each fiscal quarter since our common stock commenced trading on the NYSE, (i) the NAV per share of our common stock as of the applicable period end, (ii) the range of high and low closing sales prices of our common stock as reported on the NYSE during the applicable period, and (iii) the closing high and low sales prices as a premium (discount) to NAV during the relevant period.
| | | | | | | | Closing Sales Price | (2) | | | Premium
(Discount) of
High Sales
Price to | | | | Premium
(Discount) of
Low Sales
Price to | |
| | | | NAV(1) | | | | High | | | | Low | | | | NAV(3) | | | | NAV(3) | |
| Year Ending December 31, 2024 | | $ | 16.70 | | | $ | 17.00 | | | $ | 15.85 | | | | 1.8 | % | | | (5.1 | )% |
| Third Quarter | | $ | 16.70 | | | $ | 16.40 | | | $ | 15.70 | | | | (1.8 | )% | | | (6.0 | )% |
| Second Quarter (from May 22, 2024 through June 30, 2024) | | $ | 16.57 | | | $ | 16.55 | | | $ | 15.95 | | | | (0.1 | )% | | | (3.7 | )% |
| (1) | NAV per share is determined as of the last day in the relevant quarter and therefore may not reflect the NAV per share on the date of the high and low sales prices. The NAVs shown are based on outstanding shares at the end of each period. |
| (2) | Closing sales price as provided by the NYSE. |
| (3) | Calculated as of the respective high or low closing sales price divided by the quarter end NAV and subtracting 1. |
On February 21, 2025, the reported closing sales price of our common stock was $17.40 per share.
Holders
Please see “Part III—Item 12. Security Ownership of Certain Beneficial Owners and Management and Related Stockholder Matters” for disclosure regarding the holders.
As of February 21, 2025, we had 504 holders of record of our common stock, which did not include stockholders for whom shares are held in “nominee” or “street name”.
Distributions
The following table reflects the distributions declared and payable for the year ended December 31, 2024 (dollars in thousands, except per share amounts).
| | | | | | | Dividend | | | Total | |
| Date Declared | | Record Date | | Payment Date | | per Share | | | Dividend | |
| March 6, 2024 | | March 29, 2024 | | April 17, 2024 | | $ | 0.40 | | | $ | 19,516 | |
| May 8, 2024 | | June 28, 2024 | | July 15, 2024 | | | 0.40 | | | | 28,447 | |
| August 7, 2024 | | September 30, 2024 | | October 15, 2024 | | | 0.40 | | | | 28,419 | |
| May 8, 2024 | | December 5, 2024 | | December 20, 2024 | | | 0.10 | | | | 7,102 | |
| November 6, 2024 | | December 31, 2024 | | January 15, 2025 | | | 0.40 | | | | 28,424 | |
| | | | | | | $ | 1.70 | | | $ | 111,908 | |
Dividend Reinvestment Plan
The following table summarizes the amounts received and shares of common stock issued to shareholders pursuant to our dividend reinvestment plan during the year ended December 31, 2024 (dollars in thousands, except per share amounts).
| Dividend | | Dividend | | DRIP | | | | |
| record | | payment | | shares | | | DRIP | |
| date | | date | | issued | | | value | |
| December 29, 2023 | | January 16, 2024 | | | 95,791 | | | $ | 1,573 | |
| March 29, 2024 | | April 17, 2024 | | | 94,816 | | | | 1,577 | |
| June 28, 2024 | | July 15, 2024 | | | - | | | | - | |
| September 30, 2024 | | October 15, 2024 | | | - | | | | - | |
| December 5, 2024 | | December 20, 2024 | | | 37,843 | | | | 632 | |
| | | | | | 228,450 | | | $ | 3,782 | |
All of the dividends declared during the year ended December 31, 2024 were derived from ordinary income, determined on a tax basis.
Recent Sales of Unregistered Securities
As set forth in the table below (dollars in thousands, except per share amounts), during the year ended December 31, 2024, we issued and sold 23,322,186 shares of common stock at an aggregate offering amount of approximately $388,634. The issuance of the shares of common stock was exempt from the registration requirements of the Securities Act, pursuant to Section 4(a)(2) and Rule 506(b) of Regulation D thereof and previously reported by us on our current reports on Form 8-K. The Company relied, in part, upon representations from the investors in the subscription agreements that each investor was an accredited investor as defined in Regulation D under the Securities Act.
| Common stock issue date | | Offering
price per
share | | | Common stock
shares issued | | | Aggregate
offering
amount | |
| February 14, 2024 | | $ | 16.74 | | | | 7,089,771 | | | $ | 118,689 | |
| April 2, 2024 | | $ | 16.63 | | | | 16,232,415 | | | | 269,945 | |
| Total common stock issued | | | | | | | 23,322,186 | | | $ | 388,634 | |
Stock Repurchase Plan (dollars in thousands, except share amounts)
On May 21, 2024, the Company entered into a share repurchase plan, or the Company 10b5-1 Plan, to acquire up to $100,000 in the aggregate of the Company’s Common Stock at prices below the Company’s net asset value per share over a specified period, in accordance with the guidelines specified in Rule 10b5-1 and Rule 10b-18 of the Securities Exchange Act of 1934, as amended (the “Exchange Act”). The Company 10b5-1 Plan was approved by the Board of Directors on March 6, 2024. The Company 10b5-1 Plan requires Morgan Stanley Corporation as the Company’s agent, to repurchase Common Stock on its behalf when the market price per share is below the most recently reported net asset value per share (including any updates, corrections or adjustments publicly announced by the Company to any previously announced net asset value per share, including any distributions declared). Under the Company 10b5-1 Plan, the volume of purchases would be expected to increase as the price of the Company’s Common Stock declines, subject to volume restrictions. The timing and amount of any share repurchases will depend on the terms and conditions of the Company 10b5-1 Plan, the market price of the Company’s Common Stock and trading volumes, and no assurance can be given that Common Stock be repurchased in any particular amount or at all. The repurchase of shares pursuant to the Company 10b5-1 Plan is intended to satisfy the conditions of Rule 10b5-1 and Rule 10b-18 under the Exchange Act, and will otherwise be subject to applicable law, including Regulation M, which may prohibit repurchases under certain circumstances. The Company 10b5-1 Plan commenced beginning 60 calendar days following the end of the “restricted period” under Regulation M and will terminate upon the earliest to occur of (i) the close of business on May 24, 2025, (ii) the end of the trading day on which the aggregate purchase price for all shares purchased under the Company 10b5-1 Plan equals $100,000 and (iii) the occurrence of certain other events described in the Company 10b5-1 Plan.
The “restricted period” under Regulation M ended upon the closing of the Company’s IPO and, therefore, the Common Stock repurchases/purchases described above began on July 23, 2024.
During the year ended December 31, 2024, the Company repurchase 94,613 shares under the Company’s 10b5-1 Plan for a total of $1,525.
Stock Performance Graph
This graph compares the stockholder return on our common stock from May 22, 2024 (the first date that our common stock began trading on the NYSE) to December 31, 2024 with that of the Standard & Poor’s 500 Stock Index and the Standard & Poor’s BDC Index. This graph assumes that on May 22, 2024, $100 was invested in our common stock, the Standard & Poor’s 500 Stock Index and the Standard & Poor’s BDC Index. The graph also assumes the reinvestment of all cash distributions prior to any tax effect. The graph and other information furnished under this Part II Item 5 of this annual report on Form 10-K shall not be deemed to be “soliciting material” or to be “filed” with the SEC or subject to Regulation 14A or 14C under, or to the liabilities of Section 18 of, the Exchange Act. The stock price performance included in the below graph is not necessarily indicative of future stock performance.
COMPARISON OF CUMULATIVE TOTAL RETURN AMONG KAYNE ANDERSON BDC, INC.
S&P 500 INDEX AND S&P BDC INDEX
Total Return Performance
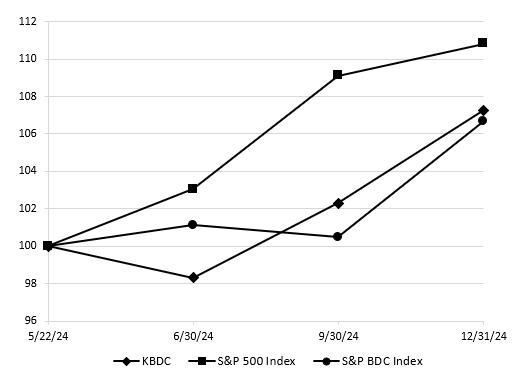
Fees and Expenses
The following table is being provided to update, as of December 31, 2024, certain information in our registration statement on Form N-2 (File No. 333-283316) that was filed on January 29, 2025. The following table is intended to assist you in understanding the costs and expenses that an investor in shares of our common stock will bear directly or indirectly. We caution you that some of the percentages indicated in the table below are estimates and may vary. The expenses shown in the table under “Annual Expenses” assume a debt-to-equity ratio of 1.00x (which equates to asset coverage of 200%). The following table should not be considered a representation of our future expenses. Actual expenses may be greater or less than shown.
| Stockholder Transaction Expenses: | | | |
| Sales Load (as a percentage of offering price)(1) | | — | |
| Offering expenses (as a percentage of offering price)(2) | | — | |
| Dividend Reinvestment Plan Fees(3) | | $ | 15.00 | |
| Total Stockholder Transaction Expenses (as a percentage of offering price) | | | — | |
| Annual Expenses (as a percentage of net assets attributable to common stock)(4) | | | |
| Management Fees(5) | | | 2.00 | % |
| Incentive Fees(6) | | | 1.73 | % |
| Interest Payments and fees paid on Borrowed Funds(7) | | | 7.28 | % |
| Other Expenses(8) | | | 0.38 | % |
| Total Annual Expenses | | | 11.39 | % |
| (1) | In the event that the securities to which any applicable prospectus relates are sold or through underwriters or agents, a corresponding prospectus supplement will disclose the applicable sales load (underwriting discount and commission). |
| (2) | Any related prospectus supplement will disclose the estimated amount of offering expenses, the offering price and the estimated amount of offering expenses borne by us as a percentage of the offering price. |
| (3) | Participants in the dividend reinvestment plan may withdraw at any time by giving notice to the DRIP administrator. There is no brokerage charge for reinvestment of dividends or distributions in common stock. However, all participants will pay a pro rata share of brokerage commissions incurred by the DRIP administrator when it makes open market purchases. If a DRIP participant elects to have the DRIP Administrator sell its shares in connection with a withdrawal from the DRIP, the DRIP administrator is authorized to deduct a $15 transaction fee plus a $0.10 per share brokerage commission from the proceeds. |
| | |
| | The expenses of the dividend reinvestment plan are included in “other expenses” in the table above. Our common stockholders will ultimately bear indirectly the DRIP administrator’s fees. For additional information, see “Dividend Reinvestment Plan.” |
| (4) | Net assets employed as the denominator for expense ratio computation is $1,186 million. |
| (5) | Includes management fees paid by Kayne Anderson BDC Financing, LLC (“KABDCF”) and Kayne Anderson BDC Financing II, LLC (“KABDCF II”), respectively. |
| | |
| | The base management fee is calculated at an annual rate of 1.00% of the fair market value of our investments including, in each case, assets purchased with borrowings under credit facilities and issuances of senior unsecured notes, but excluding cash, U.S. government securities and commercial paper instruments maturing within one year of purchase. |
| (6) | The Incentive Fee will consist of two components that are independent of each other, with the result that one component may be payable even if the other is not. A portion of the Incentive Fee is based on our income and a portion is based on our capital gains. The table reflects each incentive fee calculated at a rate of 15.0%. |
| (7) | Interest payments on borrowed funds represents an estimate of our annualized interest expense based on borrowings under credit facilities and issuances of senior unsecured notes. The assumed weighted average interest rate outstanding under our credit facilities and senior unsecured notes was 7.28%. We intend to further borrow under credit facilities and/or issue senior unsecured notes in the future in order to finance our investments and may issue preferred stock, subject to our compliance with applicable requirements under the 1940 Act. |
| (8) | “Other Expenses” includes estimated general and administrative expenses, professional fees and director fees and is based on amounts estimated for the current fiscal year. Includes expenses paid by KABDCF and KABCF II, respectively. |
Example
The following example demonstrates the projected dollar amount of total cumulative expenses over various periods with respect to a hypothetical investment in our shares of common stock. In calculating the following expense amounts, we have assumed that our annual operating expenses would remain at the levels set forth in the table above. Transaction expenses are excluded from the table below. In the event that the securities to which any applicable prospectus relates are sold to or through underwriters or agents, a corresponding prospectus supplement will disclose any transaction expenses.
| | | 1 Year | | | 3 Years | | | 5 Years | | | 10 Years | |
| You would pay the following expenses on a $1,000 investment, assuming a 5% annual return resulting entirely from net realized capital gains(1) | | $ | 110 | | | $ | 310 | | | $ | 485 | | | $ | 834 | |
| You would pay the following expenses on a $1,000 investment, assuming a 5% annual return resulting entirely from net investment income(2) | | $ | 94 | | | $ | 270 | | | $ | 430 | | | $ | 768 | |
| (1) | Assumes no unrealized capital depreciation or realized capital losses and 5% annual return on our portfolio resulting entirely from net realized capital gains (and therefore subject to the capital gains incentive fee). Because our investment strategy involves investments that primarily generate current income, we believe that a 5% annual return resulting from realized capital gains is unlikely. |
| (2) | The income based incentive fee is subject to a 6.00% hurdle. Accordingly, no incentive fee would be payable in this example. |
While the example assumes, as required by the SEC, a 5% annual return, our performance will vary and may result in a return greater or less than 5%. There is no incentive compensation either on income or on capital gains under our Investment Advisory Agreement assuming a 5% annual return and therefore it is not included in the example. If we achieve sufficient returns on our investments, including through the realization of capital gains, to trigger an incentive compensation of a material amount, our distributions to our stockholders and our expenses would likely be higher. In addition, while the example assumes reinvestment of all dividends and distributions at NAV, under certain circumstances, reinvestment of dividends and other distributions under our dividend reinvestment plan may occur at a price per share that differs from NAV. See “Dividend Reinvestment Plan” for additional information regarding our DRIP.
Senior Securities
Information about the Company’s senior securities is shown as of the dates indicated in the below table. The report of our independent registered public accounting firm, PricewaterhouseCoopers LLP, as of December 31, 2024, is included within “Item 8. Consolidated Financial Statements and Supplementary Data.”
Class and Period | | Total Amount
Outstanding
Exclusive of
Treasury
Securities(1)
($ in millions) | | | Asset Coverage
per Unit(2)
($ in millions) | | | Involuntary
Liquidating
Preference
per Unit(3) | | | Average Market
Value
per Unit(4) |
| Corporate Credit Facility | | | | | | | | | | | |
| December 31, 2024 | | $ | 250 | | | $ | 2,380 | | | | — | | | N/A |
| September 30, 2024 (unaudited) | | $ | 221 | | | $ | 2,510 | | | | — | | | N/A |
| June 30, 2024 (unaudited) | | $ | 75 | | | $ | 2,890 | | | | — | | | N/A |
| March 31, 2024 (unaudited) | | $ | 198 | | | $ | 2,230 | | | | — | | | N/A |
| December 31, 2023 | | $ | 234 | | | $ | 1,980 | | | | — | | | N/A |
| September 30, 2023 (unaudited) | | $ | 192 | | | $ | 2,140 | | | | — | | | N/A |
| June 30, 2023 (unaudited) | | $ | 237 | | | $ | 2,010 | | | | — | | | N/A |
| December 31, 2022 | | $ | 269 | | | $ | 2,030 | | | | — | | | N/A |
| December 31, 2021 | | | — | | | | — | | | | — | | | N/A |
| | | | | | | | | | | | | | | |
| Revolving Funding Facility | | | | | | | | | | | | | | |
| December 31, 2024 | | $ | 420 | | | $ | 2,380 | | | | — | | | N/A |
| September 30, 2024 (unaudited) | | $ | 409 | | | $ | 2,510 | | | | — | | | N/A |
| June 30, 2024 (unaudited) | | $ | 389 | | | $ | 2,890 | | | | — | | | N/A |
| March 31, 2024 (unaudited) | | $ | 319 | | | $ | 2,230 | | | | — | | | N/A |
| December 31, 2023 | | $ | 306 | | | $ | 1,980 | | | | — | | | N/A |
| September 30, 2023 (unaudited) | | $ | 306 | | | $ | 2,140 | | | | — | | | N/A |
| June 30, 2023 (unaudited) | | $ | 320 | | | $ | 2,010 | | | | — | | | N/A |
| December 31, 2022 | | $ | 200 | | | $ | 2,030 | | | | — | | | N/A |
| December 31, 2021 | | | — | | | | — | | | | — | | | N/A |
| | | | | | | | | | | | | | | |
| Revolving Funding Facility II(5) | | | | | | | | | | | | | | |
| December 31, 2024 | | $ | 113 | | | $ | 2,380 | | | | — | | | N/A |
| September 30, 2024 (unaudited) | | $ | 83 | | | $ | 2,510 | | | | — | | | N/A |
| June 30, 2024 (unaudited) | | $ | 83 | | | $ | 2,890 | | | | — | | | N/A |
| March 31, 2024 (unaudited) | | $ | 67 | | | $ | 2,230 | | | | — | | | N/A |
| December 31, 2023 | | $ | 70 | | | $ | 1,980 | | | | — | | | N/A |
| September 30, 2023 (unaudited) | | | — | | | | — | | | | — | | | N/A |
| June 30, 2023 (unaudited) | | | — | | | | — | | | | — | | | N/A |
| December 31, 2022 | | | — | | | | — | | | | — | | | N/A |
| December 31, 2021 | | | — | | | | — | | | | — | | | N/A |
| Class and Period | | Total Amount
Outstanding (1)
($ in millions) | | | Asset Coverage
per Unit(2)
($ in millions) | | | Involuntary
Liquidating
Preference
per Unit(3) | | | Average Market
Value
per Unit(4) |
| Subscription Credit Agreement(6) | | | | | | | | | | | | | | |
| December 31, 2024 | | | — | | | | — | | | | — | | | N/A |
| September 30, 2024 (unaudited) | | | — | | | | — | | | | — | | | N/A |
| June 30, 2024 (unaudited) | | | — | | | | — | | | | — | | | N/A |
| March 31, 2024 (unaudited) | | | — | | | | — | | | | — | | | N/A |
| December 31, 2023 | | $ | 10.8 | | | $ | 1,980 | | | | — | | | N/A |
| September 30, 2023 (unaudited) | | $ | 25 | | | $ | 2,140 | | | | — | | | N/A |
| June 30, 2023 (unaudited) | | $ | 9 | | | $ | 2,010 | | | | — | | | N/A |
| December 31, 2022 | | $ | 108 | | | $ | 2,030 | | | | — | | | N/A |
| December 31, 2021 | | $ | 105 | | | $ | 2,170 | | | | — | | | N/A |
| | | | | | | | | | | | | | | |
| Loan and Security Agreement (LSA)(7) | | | | | | | | | | | | | | |
| December 31, 2024 | | | — | | | | — | | | | — | | | N/A |
| September 30, 2024 (unaudited) | | | — | | | | — | | | | — | | | N/A |
| June 30, 2024 (unaudited) | | | — | | | | — | | | | — | | | N/A |
| March 31, 2024 (unaudited) | | | — | | | | — | | | | — | | | N/A |
| December 31, 2023 | | | — | | | | — | | | | — | | | N/A |
| September 30, 2023 (unaudited) | | | — | | | | — | | | | — | | | N/A |
| June 30, 2023 (unaudited) | | | — | | | | — | | | | — | | | N/A |
| December 31, 2022 | | | — | | | | — | | | | — | | | N/A |
| December 31, 2021 | | $ | 162 | | | $ | 2,170 | | | | — | | | N/A |
| | | | | | | | | | | | | | | |
| Notes | | | | | | | | | | | | | | |
| December 31, 2024 | | $ | 75 | | | $ | 2,380 | | | | — | | | N/A |
| September 30, 2024 (unaudited) | | $ | 75 | | | $ | 2,510 | | | | — | | | N/A |
| June 30, 2024 (unaudited) | | $ | 75 | | | $ | 2,890 | | | | — | | | N/A |
| March 31, 2024 (unaudited) | | $ | 75 | | | $ | 2,230 | | | | — | | | N/A |
| December 31, 2023 | | $ | 75 | | | $ | 1,980 | | | | — | | | N/A |
| September 30, 2023 (unaudited) | | $ | 75 | | | $ | 2,140 | | | | — | | | N/A |
| June 30, 2023 (unaudited) | | $ | 75 | | | $ | 2,010 | | | | — | | | N/A |
| December 31, 2022 | | | — | | | | — | | | | — | | | N/A |
| December 31, 2021 | | | — | | | | — | | | | — | | | N/A |
| (1) | Total amount of senior securities outstanding at the end of the period presented. |
| (2) | Asset coverage per unit is the ratio of the carrying value of our total assets, less all liabilities excluding indebtedness represented by senior securities in this table, to the aggregate amount of senior securities representing indebtedness. Asset coverage per unit is expressed in terms of dollar amounts per $1,000 of indebtedness and is calculated on a consolidated basis. |
| (3) | The amount to which such class of senior security would be entitled upon our involuntary liquidation in preference to any security junior to it. |
| (4) | Not applicable because the senior securities are not registered for public trading. |
| (5) | The Revolving Funding Facility II was entered into on December 22, 2023. |
| (6) | The Subscription Credit Agreement was terminated on April 1, 2024. |
| (7) | The Loan and Security Agreement (“LSA”) was terminated on February 18, 2022. |
ITEM 6. [RESERVED]
The selected financial data previously required by Item 301 of Regulation S-K has been omitted in reliance on SEC Release No. 33-10890, Management’s Discussion and Analysis, Selected Financial Data, and Supplementary Financial Information.
ITEM 7. MANAGEMENT’S DISCUSSION AND ANALYSIS OF FINANCIAL CONDITION AND RESULTS OF OPERATIONS
The following discussion and analysis should be read in conjunction with our consolidated financial statements and related notes and other financial information appearing elsewhere in this Annual Report on Form 10-K. Except as otherwise specified, references to “we,” “us,” “our,” or the “Company” refer to Kayne Anderson BDC, Inc.
Investment Objective, Principal Strategy and Investment Structure
Kayne Anderson BDC, Inc. is a Delaware corporation that commenced operations on February 5, 2021. We are an externally managed, closed-end, non-diversified management investment company that has elected to be regulated as a BDC under the 1940 Act, as amended. In addition, for U.S. federal income tax purposes, we intend to qualify, annually, as a RIC under Subchapter M of the Code.
On May 24, 2024, we completed our initial public offering (“IPO”), issuing 6,000,000 shares of our common stock at a public offering price of $16.63 per share. Net of underwriting fees and offering expenses, we received net cash proceeds, before offering expenses, of $92.4 million. The Company’s common stock began trading on the New York Stock Exchange (“NYSE”) under the ticker symbol “KBDC” on May 22, 2024.
Our investment activities are managed by KA Credit Advisors, LLC (the “Advisor”), an indirect controlled subsidiary of Kayne Anderson Capital Advisors, L.P. (“Kayne Anderson”), and the Advisor operates within Kayne Anderson’s middle market private credit platform (“KAPC” or “Kayne Anderson Private Credit”). The Advisor is an investment advisor registered with the United States Securities and Exchange Commission (the “SEC”) under the Investment Advisers Act of 1940, as amended. In accordance with the Investment Advisers Act of 1940, as amended, our Advisor is responsible for originating prospective investments, conducting research and due diligence investigations on potential investments, analyzing investment opportunities, negotiating and structuring investments, and monitoring our investments and portfolio companies on an ongoing basis. The Advisor benefits from the scale and resources of Kayne Anderson and specifically KAPC.
Our investment objective is to generate current income and, to a lesser extent, capital appreciation. We intend to have nearly all of our debt investments in private middle market companies. We use “private” to refer to companies that are not traded on a securities exchange and define “middle market companies” as companies that, in general, generate between $10 million and $150 million of annual earnings before interest, taxes, depreciation and amortization, or EBITDA. Further, we refer to companies that generate between $10 million and $50 million of annual EBITDA as “core middle market companies” and companies that generate between $50 million and $150 million of annual EBITDA as “upper middle market companies.” We typically adjust EBITDA for non-recurring and/or normalizing items to assess the financial performance of our borrowers over time.
We intend to achieve our investment objective by investing primarily in first lien senior secured loans, with a secondary focus on unitranche and split-lien loans to middle market companies. Under normal market conditions, we expect at least 90% of our portfolio (including investments purchased with proceeds from borrowings under credit facilities and issuances of senior unsecured notes) to be invested in first lien senior secured, unitranche and split-lien loans. Our investment decisions are made on a case-by-case basis. We expect the remainder of our portfolio to be invested in second-lien loans, subordinated debt or equity securities (including those purchased in conjunction with other credit investments). We expect that a majority of these debt investments will be made in core middle market companies and will generally have stated maturities of three to six years. We expect that the loans in which we principally invest will be to companies that are located in the United States. We determine the location of a company as being in the United States by (i) such company being organized under the laws of one of the states in the United States; or (ii) during its most recent fiscal year, such company derived at least 50% of its revenues or profits from goods produced or sold, investments made, or services performed in the United States or has at least 50% of its assets in the United States.
The Advisor executes on our investment objective by (1) accessing the established loan sourcing channels developed by KAPC, which includes an extensive network of private equity firms, other middle market lenders, financial advisors, intermediaries and management teams, (2) selecting investments within our middle market company focus, (3) implementing KAPC’s underwriting process and (4) drawing upon its experience and resources and the broader Kayne Anderson network. KAPC was established in 2011 and manages (directly and through affiliates) assets under management (“AUM”) of approximately $7.1 billion related to middle market private credit as of December 31, 2024.
Recent Developments
On January 15, 2025, we paid a regular dividend of $0.40 per share to each common stockholder of record as of December 31, 2024. The total dividend was $28.4 million and, of this amount, $3.9 million was DRIP.
On February 5, 2025, we and KABDCF II entered into an amendment of our Revolving Funding Facility II (as defined below). Under the terms of the amendment, the lender increased its commitment from $150 million to $250 million and decreased the interest rate on borrowings outstanding from 3-month term SOFR plus 2.70% to 3-month term SOFR plus 2.25%. Additionally, the maturity date of the facility was extended one year to December 22, 2029. All other terms of the Revolving Funding Facility II remain substantially the same.
On February 13, 2025, we and KABDCF entered into an amendment of our Revolving Funding Facility (as defined below). Under the terms of the amendment, the lenders increased their commitments from $600 million to $675 million and decreased the interest rate on borrowings outstanding from daily SOFR plus 2.375% - 2.50%, depending upon the mix of loans, to daily SOFR plus 2.15%. Additionally, the maturity date of the facility was extended to February 13, 2030. All other terms of the Revolving Funding Facility remain substantially the same.
On February 14, 2025, we reduced the size of our Corporate Credit Facility from $475 million to $400 million. This commitment reduction was done in conjunction with the $75 million increase to our Revolving Funding Facility from $600 million to $675 million.
On February 19, 2025, our Board of Directors declared a regular dividend to common stockholders in the amount of $0.40 per share. The regular dividend of $0.40 per share will be paid on April 15, 2025 to stockholders of record as of the close of business on March 31, 2025, payable in cash or shares of our common stock pursuant to our Dividend Reinvestment Plan, as amended.
Portfolio and Investment Activity
Our portfolio is currently comprised of a broad mix of loans, with diversity among investment size and industry focus. The Advisor’s team of professionals conducts due diligence on prospective investments during the underwriting process and is involved in structuring the credit terms of our private middle market investments. Once an investment has been made, our Advisor closely monitors that portfolio investment and takes a proactive approach to identify and address sector or company specific risks. The Advisor seeks to maintain a regular dialogue with portfolio company management teams (as well as their owners, the majority of whom are private equity firms, where applicable), reviews detailed operating and financial results on a regular basis (typically monthly or quarterly) and monitors current and projected liquidity needs, in addition to other portfolio management activities. There are no assurances that we will achieve our investment objectives.
As of December 31, 2024, we had investments in 110 portfolio companies with an aggregate fair value of approximately $1,995 million, and unfunded commitments to these portfolio companies of $186 million, and our portfolio consisted of 98.0% first lien senior secured loans, 0.9% subordinated debt and 1.1% equity investments.
As of December 31, 2024, we held investments in broadly syndicated loans in 21 portfolio companies with an aggregate principal amount of $253 million. Our investments in broadly syndicated loans were made in anticipation of the receipt of proceeds from our final capital call and our IPO which closed during the second quarter of 2024. Prior to these investments, we had not held broadly syndicated loans since 2022. Consistent with our strategy at that time, we expect to rotate out of these investments over coming quarters to invest in private middle market loans consistent with our principal strategy. We have presented certain portfolio-related information below for our private middle market loans and broadly syndicated loans separately and on a combined basis for ease of reference.
As of December 31, 2024, 100% of our debt investments had floating interest rates. Our weighted average yields for debt investments were as follows:
| | ● | private middle market loans at fair value and amortized cost weighted average yields were 11.1% and 11.3%, respectively |
| | ● | broadly syndicated loans at fair value and amortized cost weighted average yields were 7.1% and 7.1%, respectively; and |
| | ● | total debt investments at fair value and amortized cost weighted average yields were 10.6% and 10.7%, respectively |
As of December 31, 2024, our portfolio was invested across 30 different industries (Global Industry Classification “GICS”, Level 3 – Industry). The largest industries in our portfolio as of December 31, 2024 were Trading Companies & Distributors, Commercial Services & Supplies, Food Products and Health Care Providers & Services, which represented, as a percentage of our portfolio of long-term investments, 15.1%, 11.7%, 10.0% and 8.4%, respectively, based on fair value. We are generalist investors and the mix of industries represented by our portfolio companies will vary over time.
As of December 31, 2024, our average position size based on commitment of private credit investments (at the portfolio company level) was $20.0 million.
As of December 31, 2024, the weighted average and median last twelve months (“LTM”) EBITDA of our portfolio companies were as follows:
| | ● | private middle market loans were $58.1 million and $34.3 million, respectively, based on fair value1 |
| | ● | broadly syndicated loans were $2,138.3 million and $1,306.7 million, respectively, based on fair value; and |
| | ● | total investments were $335.0 million and $39.6 million, respectively, based on fair value1 |
As of December 31, 2024, the weighted average loan-to-enterprise-value (“LTEV”) of our debt investments at the time of our initial investment was as follows:
| | ● | private middle market loans was 43.0%, based on par1 |
| | ● | broadly syndicated loans was 34.0%, based on par |
| | ● | total investments was 41.8%, based on par1 ; and |
| | ● | LTEV represents the total par value of our debt investment relative to our estimate of the enterprise value of the underlying borrower |
As of December 31, 2024, we had three debt investments on non-accrual status, which represented 1.3% and 1.6% of total debt investments at fair value and cost, respectively.
As of December 31, 2024, our portfolio companies’ weighted average leverage ratios and weighted average interest coverage ratios (the calculations of which are based on the most recent quarter end or latest available information from the portfolio companies) were as follows:
| | ● | private middle market loans were 4.3x and 3.0x, respectively, based on fair value1 |
| | ● | broadly syndicated loans were 3.2x and 4.2x, respectively, based on fair value; and |
| | ● | total investments were 4.2x and 3.1x, respectively, based on fair value1 |
As of December 31, 2024, the percentage of our debt investments including at least one financial maintenance covenant was as follows:
| | ● | private middle market loans was 100.0% based on fair value2 |
| | ● | broadly syndicated loans was 0%, based on fair value; and |
| | ● | total investments was 86.9%, based on fair value2 |
| 1 | Excludes investments on watch list, which represent 3.5% of the total fair value of debt investments as of December 31, 2024. |
| 2 | Excludes opportunistic deals, which represent 1.9% of the total fair value of debt investments as of December 31, 2024. |
Listed below are our top ten portfolio companies and industries represented as a percentage of total long-term investments as of December 31, 2024:
| Portfolio Company | | Industry | | Fair Value
($ in millions) | | | Percentage of
long-term
investments | |
| 1 | | Silk Holdings III Corp. (Suave) | | Personal care products | | $ | 41.0 | | | | 2.0 | % |
| 2 | | Dusk Acquisition II Corporation (Motors & Armatures, Inc. – MARS) | | Trading companies & distributors | | $ | 39.9 | | | | 2.0 | % |
| 3 | | BR PJK Produce, LLC (Keany) | | Food products | | $ | 39.5 | | | | 2.0 | % |
| 4 | | M2S Group Intermediate Holdings, Inc. | | Containers & packaging | | $ | 37.7 | | | | 1.9 | % |
| 5 | | American Equipment Holdings LLC | | Commercial services & supplies | | $ | 37.3 | | | | 1.9 | % |
| 6 | | Vitesse Systems Parent, LLC | | Aerospace & defense | | $ | 35.5 | | | | 1.8 | % |
| 7 | | IF&P Foods, LLC (FreshEdge) | | Food products | | $ | 35.1 | | | | 1.7 | % |
| 8 | | AIDC Intermediate Co 2, LLC (Peak Technologies) | | Trading companies & distributors | | $ | 34.1 | | | | 1.7 | % |
| 9 | | Genuine Cable Group, LLC | | Trading companies & distributors | | $ | 34.1 | | | | 1.7 | % |
| 10 | | Improving Acquisition LLC | | IT services | | $ | 33.6 | | | | 1.7 | % |
| | | | | | | $ | 367.8 | | | | 18.4 | % |
Our investment activity for the years ended December 31, 2024 and 2023 is presented below (information presented herein is at par value unless otherwise indicated).
| | | For the years ended
December 31, | |
| | | 2024
($ in millions) | | | 2023
($ in millions) | |
| | | | | | | |
| New investments: | | | | | | |
| Gross new investments commitments | | $ | 1,043.9 | | | $ | 329.2 | |
| Less: investment commitments sold down, exited or repaid(1) | | | (371.3 | ) | | | (123.0 | ) |
| Net investment commitments | | $ | 672.6 | | | | 206.2 | |
| | | | | | | | | |
| Principal amount of investments funded(2): | | | | | | | | |
| Private credit investments | | $ | 673.0 | | | $ | 404.2 | |
| Broadly syndicated loans | | | 328.1 | | | | - | |
| Preferred equity investments | | | - | | | | - | |
| Common equity investments | | | 3.8 | | | | 0.6 | |
| Total principal amount of investments funded | | $ | 1,004.9 | | | $ | 404.8 | |
| | | | | | | | | |
| Principal amount of investments sold / repaid (2): | | | | | | | | |
| Private credit investments | | $ | (294.8 | ) | | $ | (196.6 | ) |
| Broadly syndicated loans | | | (74.7 | ) | | | - | |
| Common equity investments | | | (0.3 | ) | | | - | |
| Total principal amount of investments sold or repaid | | $ | (369.8 | ) | | $ | (196.6 | ) |
| | | | | | | | | |
| Number of new private credit investment commitments | | | 61 | | | | 43 | |
| Average new private credit investment commitment amount | | $ | 11.7 | | | $ | 7.7 | |
| Number of new broadly syndicated loan commitments | | | 26 | | | | - | |
| Average new broadly syndicated loan commitment amount | | $ | 12.6 | | | $ | - | |
| Weighted average maturity for new investment commitments(3) | | | 4.3 years | | | | 3.9 years | |
| Percentage of new debt investment commitments at floating rates | | | 100.0 | % | | | 100.0 | % |
| Percentage of new debt investment commitments at fixed rates | | | 0.0 | % | | | 0.0 | % |
| Weighted average interest rate of new private credit investment commitments(4) | | | 10.1 | % | | | 11.7 | % |
| Weighted average interest rate of new broadly syndicated loan commitments(4) | | | 7.4 | % | | | - | |
| Weighted average interest rate on investments sold or paid down(5) | | | 10.8 | % | | | 11.9 | % |
| (1) | Does not include repayments on revolving loans, which may be redrawn. |
| (2) | Does not include restructured activity. For common equity investments, amount represents cost. |
| (3) | For undrawn delayed draw term loans, the maturity date used is that of the associated term loan. |
| (4) | Based on the rate in effect at December 31st of each year per our Consolidated Schedule of Investments for new commitments entered into during the year. |
| (5) | Based on the underlying rate if still held at December 31st of each year. For those investments sold or paid down in full during the year, based on the rate in effect at the time of sale or paid down. |
Portfolio Internal Performance Ratings
In general, we employ a strategy designed to ensure early detection of potential issues at underlying borrowers, including monthly financial reviews internal tracking memoranda, weekly “watch list” discussions and other like activities. We have designed a risk rating system to aid in our portfolio management efforts where each investment is rated level 1-9, where Level 1 is the “least risky” and Level 9 is the “most risky.” This risk-rating system is quantitative in nature and aggregates criteria such as LTEV, leverage levels and fixed charge coverage ratios (“FCCR”) (each measured at point-in-time and as relates to levels at the close of the investment).
The table below sets forth our fair value of debt investments and number of portfolio companies, including percentage of each total, that are on watch list as of December 31, 2024 and 2023. This table excludes equity investments.
| As of December 31, 2024 | | | As of December 31, 2023 | |
Fair Value
($ in millions) | | | % | | | Number of
Companies | | | % | | | Fair Value
($ in millions) | | | % | | | Number of
Companies | | | % | |
| $ | 69.4 | | | | 3.5 | % | | | 5 | | | | 4.5 | % | | $ | 74.0 | | | | 5.5 | % | | | 5 | | | | 6.6 | % |
We use Global Industry Classification Standards (GICS), Level 3 – Industry, for classifying the industry groupings of our portfolio companies. The table below describes long-term investments by industry composition based on fair value as of December 31, 2024 and 2023:
| | | December 31,
2024 | | | December 31,
2023 | |
| | | | | | | |
| Trading companies & distributors | | | 15.1 | % | | | 15.3 | % |
| Commercial services & supplies | | | 11.7 | % | | | 9.4 | % |
| Food products | | | 10.0 | % | | | 11.5 | % |
| Health care providers & services | | | 8.4 | % | | | 7.4 | % |
| Containers & packaging | | | 7.5 | % | | | 7.2 | % |
| Professional services | | | 4.7 | % | | | 4.5 | % |
| Aerospace & defense | | | 4.4 | % | | | 6.3 | % |
| Machinery | | | 3.7 | % | | | 3.8 | % |
| Personal care products | | | 3.7 | % | | | 3.0 | % |
| Automobile components | | | 3.6 | % | | | 2.0 | % |
| Leisure products | | | 3.2 | % | | | 3.3 | % |
| Building products | | | 2.3 | % | | | 2.0 | % |
| Textiles, apparel & luxury goods | | | 2.1 | % | | | 3.3 | % |
| Specialty retail | | | 2.1 | % | | | 0.7 | % |
| Insurance | | | 2.0 | % | | | 2.2 | % |
| Pharmaceuticals | | | 1.8 | % | | | 0.5 | % |
| IT services | | | 1.7 | % | | | 3.8 | % |
| Diversified telecommunication services | | | 1.5 | % | | | 0.4 | % |
| Wireless telecommunication services | | | 1.5 | % | | | 2.1 | % |
| Health care equipment & supplies | | | 1.4 | % | | | 1.5 | % |
| Hotels, restaurants & leisure | | | 1.4 | % | | | - | % |
| Chemicals | | | 1.1 | % | | | 3.1 | % |
| Household durables | | | 1.0 | % | | | 1.5 | % |
| Media | | | 0.8 | % | | | - | % |
| Household products | | | 0.8 | % | | | 1.2 | % |
| Construction materials | | | 0.7 | % | | | - | % |
| Biotechnology | | | 0.6 | % | | | 0.9 | % |
| Semiconductors & semiconductor equipment | | | 0.6 | % | | | - | % |
| Electrical equipment | | | 0.5 | % | | | - | % |
| Diversified consumer services | | | 0.1 | % | | | - | % |
| Software | | | - | % | | | 2.5 | % |
| Capital markets | | | - | % | | | 0.6 | % |
| | | | 100.0 | % | | | 100.0 | % |
Results of Operations
The comparison for the years ended December 31, 2023 and 2022 can be found in “Item 7: Management’s Discussion and Analysis of Financial Condition and Results of Operations” in our Form 10-K for the fiscal year ended December 31, 2023.
For the years ended December 31, 2024 and 2023, our total investment income was derived from our portfolio of investments.
The following table represents the operating results for the years ended December 31, 2024 and 2023.
| | | For the years ended
December 31, | |
| | | 2024 | | | 2023 | |
| | | | ($ in millions) | | | | ($ in millions) | |
| Total investment income | | $ | 213.1 | | | $ | 161.0 | |
| Less: Net expenses | | | (83.8 | ) | | | (76.2 | ) |
| Net investment income | | | 129.3 | | | | 84.8 | |
| Net realized gains (losses) on investments | | | 0.5 | | | | (10.7 | ) |
| Net change in unrealized gains (losses) on investments | | | 2.8 | | | | 2.9 | |
| Deferred income tax expense | | | (0.7 | ) | | | - | |
| | | | | | | | | |
| Net increase (decrease) in net assets resulting from operations | | $ | 131.9 | | | $ | 77.0 | |
Investment Income
Investment income for the years ended December 31, 2024 and 2023 totaled $213.1 million and $161.0 million, respectively, and consisted primarily of interest income on our debt investments. For the years ended December 31, 2024 and 2023, we had $2.7 million and $1.7 million, respectively, of PIK interest included in interest income. As of December 31, 2024, we had three debt investments on non-accrual status. As of December 31, 2023, we had one debt investment on non-accrual status.
Expenses
Operating expenses for the years ended December 31, 2024 and 2023, were as follows:
| | | For the years ended
December 31, | |
| | | 2024 | | | 2023 | |
| | | ($ in millions) | | | ($ in millions) | |
| Interest and debt financing expenses | | $ | 61.5 | | | $ | 52.3 | |
| Management fees | | | 17.5 | | | | 11.4 | |
| Incentive fees | | | 17.4 | | | | 9.4 | |
| Directors fees | | | 0.6 | | | | 0.6 | |
| Excise taxes | | | 0.8 | | | | 0.1 | |
| Other operating expenses | | | 3.7 | | | | 2.4 | |
| Total expenses | | | 101.5 | | | | 76.2 | |
| Management fee waiver (Note 3) | | | (2.9 | ) | | | - | |
| Incentive fee waiver (Note 3) | | | (14.8 | ) | | | - | |
| Net expenses | | $ | 83.8 | | | $ | 76.2 | |
Net Realized Gains (Losses) on Investments
During the year ended December 31, 2024, we had realized gains of $0.5 million on our investments. In November 2023, we completed a restructure of our investment in Arborworks Acquisition LLC whereby the existing term loan and revolver were restructured to a new term loan and preferred and common equity. The Company recognized a $10.7 million realized loss due to the debt restructure.
Net Unrealized Gains (Losses) on Investments
We fair value our portfolio investments quarterly and any changes in fair value are recorded as unrealized gains or losses. During the years ended December 31, 2024 and 2023, net unrealized gains (losses) on our investment portfolio were comprised of the following:
| | | For the years ended
December 31, | |
| | | 2024 | | | 2023 | |
| | | ($ in millions) | | | ($ in millions) | |
| Unrealized gains on investments | | $ | 19.2 | | | $ | 13.4 | |
| Unrealized (losses) on investments | | | (16.4 | ) | | | (10.5 | ) |
| Net change in unrealized gains (losses) on investments | | $ | 2.8 | | | $ | 2.9 | |
For these years ended December 31, 2024 and 2023, the top five largest contributors to the change in unrealized gains and change in unrealized losses on investments are presented in the following tables.
| | | For the year ended | |
| | | December 31,
2024 | |
| | | ($ in millions) | |
| Portfolio Company | | | | |
| Arborworks Acquisition LLC | | $ | 1.8 | |
| M2S Group Intermediate Holdings, Inc. | | | 1.3 | |
| American Soccer Company, Incorporated (SCORE) | | | 1.1 | |
| CCFF Buyer, LLC (California Custom Fruits & Flavors, LLC) | | | 1.0 | |
| WAM CR Acquisition, Inc. (Wolverine) | | | 0.9 | |
| Other portfolio companies unrealized gains | | | 13.1 | |
| Other portfolio companies unrealized (losses) | | | (9.0 | ) |
| LSL Industries, LLC (LSL Healthcare) | | | (0.6 | ) |
| Gulf Pacific Holdings, LLC | | | (0.7 | ) |
| Siegel Egg Co., LLC | | | (1.6 | ) |
| Trademark Global LLC(1) | | | (2.0 | ) |
| Sundance Holdings Group, LLC | | | (2.5 | ) |
| Total Change in Unrealized Gain (Loss), net | | $ | 2.8 | |
| (1) | Portfolio company is non-controlled affiliated investment. |
| | | For the year ended | |
| | | December 31,
2023 | |
| | | ($ in millions) | |
| Portfolio Company | | | |
| Arborworks Acquisition LLC | | $ | 2.5 | |
| BLP Buyer, Inc. (Bishop Lifting Products) | | | 0.9 | |
| Silk Holdings III Corp. (Suave) | | | 0.9 | |
| Engineered Fastener Company, LLC (EFC International) | | | 0.8 | |
| Vitesse Systems Parent, LLC | | | 0.8 | |
| Other portfolio companies unrealized gains | | | 7.5 | |
| Other portfolio companies unrealized (losses) | | | (4.6 | ) |
| Trademark Global LLC | | | (0.4 | ) |
| LSL Industries, LLC (LSL Healthcare) | | | (0.5 | ) |
| Siegel Egg Co., LLC | | | (1.4 | ) |
| American Soccer Company, Incorporated (SCORE) | | | (1.5 | ) |
| Centerline Communications, LLC | | | (2.1 | ) |
| Total Change in Unrealized Gain (Loss), net | | $ | 2.9 | |
Financial Condition, Liquidity and Capital Resources
Our liquidity and capital resources are generated primarily from the net proceeds of any offering of our shares of common stock, proceeds from borrowing on our credit facilities, proceeds from the issuance of senior unsecured notes and from cash flows from interest and fees earned from our investments and principal repayments and proceeds from sales of our investments. Our primary use of cash will be investments in portfolio companies, payments of our expenses, repayments of borrowings under credit facilities and senior unsecured notes, and payment of cash distributions to our stockholders.
We finance our investments with leverage in the form of borrowings under credit facilities and issuances of senior unsecured notes. We also intend to further borrow under credit facilities and/or issue senior unsecured notes in the future in order to finance our investments. In accordance with the 1940 Act, we are required to meet a coverage ratio of total assets (less total liabilities other than indebtedness) to total borrowings and other senior securities (and any preferred stock that we may issue in the future) of at least 150%. If this ratio declines below 150%, we cannot incur additional leverage and could be required to sell a portion of our investments to repay some leverage when it is disadvantageous to do so. As of December 31, 2024 and December 31, 2023, our asset coverage ratios were 238% and 198%, respectively. We currently intend to target asset coverage of 200% to 180% (which equates to a debt-to-equity ratio of 1.0x to 1.25x) but may alter this target based on market conditions.
Over the next twelve months, we expect that cash and cash equivalents, taken together with our available capacity under our credit facilities, will be sufficient to conduct anticipated investment activities. Beyond twelve months, we expect that our cash and liquidity needs will continue to be met by cash generated from our ongoing operations as well as financing activities.
As of December 31, 2024, we had $75 million Notes outstanding, $783 million borrowed under our credit facilities and cash and cash equivalents of $71.1 million (including short-term investments). As of that date, we had $442 million of undrawn commitments available on our credit facilities (subject to borrowing base restrictions and other conditions). As of February 21, 2025, we had $75 million Notes outstanding, $882.5 million borrowed under our credit facilities and cash and cash equivalents of $12.3 million (including short-term investments).
IPO and Capital Contributions
On May 24, 2024, we completed our IPO, issuing 6,000,000 shares of our common stock at a public offering price of $16.63 per share. Net of underwriting fees and offering expenses, we received net cash proceeds, of $92.4 million. The Company’s common stock began trading on the New York Stock Exchange (“NYSE”) under the ticker symbol “KBDC” on May 22, 2024.
On April 2, 2024, we issued 16,232,415 shares of our common stock related to capital called at an aggregate purchase price of $269.9 million. Following the final close on April 2, 2024, we had called all of our capital relating to our $1,046.9 million in existing subscription agreements that we had entered into with investors through a private offering, and we do not have any remaining undrawn capital commitments.
Senior Unsecured Notes
As of December 31, 2024, we have $75 million of senior unsecured notes outstanding, with $25 million of 8.65% Series A Notes due June 2027 (the “Series A Notes”) and $50 million of 8.74% Series B Notes due June 2028 (the “Series B Notes”, and collectively with the Series A Notes, the “Notes”).
Credit Facilities
Corporate Credit Facility: We are party to a senior secured revolving credit facility (the “Corporate Credit Facility”), that has a total commitment of $400 million with a maturity date of November 22, 2029. The facility’s commitment termination date and the final maturity date are November 22, 2028 and November 22, 2029, respectively. The Corporate Credit Facility also provided for a feature that allows us, under certain circumstances, to increase the overall size of the Corporate Credit Facility to a maximum of $600 million. The interest rate on the Corporate Credit Facility is equal to Term SOFR (a forward-looking rate based on SOFR futures) plus an applicable spread of 2.10% per annum or an “alternate base rate” (as defined in the agreements governing the Corporate Credit Facility) plus an applicable spread of 1.00%. We are also required to pay a commitment fee of 0.375% per annum on any unused portion of the Corporate Credit Facility.
Revolving Funding Facility: We and our wholly owned, special purpose financing subsidiary, Kayne Anderson BDC Financing, LLC (“KABDCF”), are party to a senior secured revolving funding facility (the “Revolving Funding Facility”). We and KABDCF have a commitment of $675 million. The Revolving Funding Facility is secured by all of the assets held by, and the membership interest in, KABDCF. The end of the reinvestment period is April 2, 2027 and the maturity date is February 13, 2030. The interest rate on the Revolving Funding Facility is daily SOFR plus 2.15% per annum.
KABDCF is also required to pay a commitment fee of between 0.50% and 1.50% per annum depending on the size of the unused portion of the Revolving Funding Facility.
Revolving Funding Facility II: We and our wholly owned, special purpose financing subsidiary, Kayne Anderson BDC Financing II, LLC (“KABDCF II”), are party to a senior secured revolving credit facility (the “Revolving Funding Facility II”). The Revolving Funding Facility II has an initial commitment of $250 million which, under certain circumstances, can be increased up to $500 million. The Revolving Funding Facility II is secured by all of the assets held by KABDCF II and we have agreed that it will not grant or allow a lien on the membership interest of KABDCF II. The end of the reinvestment period and the stated maturity date for the Revolving Funding Facility II are December 22, 2026, and December 22, 2029, respectively. The interest rate on the Revolving Funding Facility II is equal to 3-month term SOFR plus 2.25% per annum. KABDCF II is also required to pay a commitment fee of 0.75%.
Contractual Obligations
A summary of our significant contractual principal payment obligations related to the repayment of our outstanding indebtedness at December 31, 2024 is as follows:
| | | Payments Due by Period ($ in millions) | |
| | | Total | | | Less than
1 year | | | 1-3 years | | | 3-5 years | | | After 5 years | |
| Senior Unsecured Notes | | $ | 75.0 | | | $ | - | | | $ | 25.0 | | | $ | 50.0 | | | $ | - | |
| Corporate Credit Facility | | | 250.0 | | | | - | | | | - | | | | 250.0 | | | | - | |
| Revolving Funding Facility | | | 420.0 | | | | - | | | | - | | | | 420.0 | | | | - | |
| Revolving Funding Facility II | | | 113.0 | | | | - | | | | - | | | | 113.0 | | | | - | |
| Total contractual obligations | | $ | 858.0 | | | $ | - | | | $ | 25.0 | | | $ | 833.0 | | | $ | - | |
Off-Balance Sheet Arrangements
As of December 31, 2024 and 2023, we had an aggregate $186.3 million and $147.9 million, respectively, of unfunded commitments to provide debt financing to our portfolio companies. Such commitments are generally subject to the satisfaction of certain financial and nonfinancial covenants and involve, to varying degrees, elements of credit risk in excess of the amount recognized in our financial statements. Other than contractual commitments and other legal contingencies incurred in the normal course of our business, we do not have any other off-balance sheet financings or liabilities.
Critical Accounting Estimates
The preparation of our consolidated financial statements requires us to make estimates and assumptions that affect the reported amounts of assets, liabilities, revenues, and expenses. Changes in the economic environment, financial markets, and any other parameters used in determining such estimates could cause actual results to differ. Our critical accounting policies, including those relating to the valuation of our investment portfolio, are described below. The critical accounting policies should be read in conjunction with our risk factors in this Annual Report. See Note 2 to our consolidated financial statements for the years ended December 31, 2024 and 2023, for more information on our critical accounting policies.
Investment Valuation
Traded Investments (Level 1 or Level 2)
Investments for which market quotations are readily available will typically be valued at those market quotations. Traded investments such as corporate bonds, preferred stock, bank notes, broadly syndicated loans or loan participations are valued by using the bid price provided by an independent pricing service, by an independent broker, the agent bank, syndicate bank or principal market maker. When price quotes for investments are not available, or such prices are stale or do not represent fair value in the judgment of our Advisor, fair market value will be determined using our Advisor’s valuation process for investments that are privately issued or otherwise restricted as to resale.
We may also invest, to a lesser extent, in equity securities purchased in conjunction with debt investments. While we anticipate these equity securities to be issued by privately held companies, we may hold equity securities that are publicly traded. Equity securities listed on any exchange other than the NASDAQ Stock Market, Inc. (“NASDAQ”) are valued, except as indicated below, at the last sale price on the business day as of which such value is being determined. If there has been no sale on such day, the securities are valued at the mean of the most recent bid and ask prices on such day. Securities admitted to trade on the NASDAQ are valued at the NASDAQ official closing price. Equity securities traded on more than one securities exchange are valued at the last sale price on the business day as of which such value is being determined at the close of the exchange representing the principal market for such securities. Equity securities traded in the over-the-counter market, but excluding securities admitted to trading on the NASDAQ, are valued at the closing bid prices.
Non-Traded Investments (Level 3)
Investments that are privately issued or otherwise restricted as to resale, as well as any security for which (a) reliable market quotations are not available in the judgment of our Advisor, or (b) the independent pricing service or independent broker does not provide prices or provides a price that in the judgment of our Advisor is stale or does not represent fair value, shall each be valued in a manner that most fairly reflects fair value of the security on the valuation date. We expect that a significant majority of our investments will be Level 3 investments. Unless otherwise determined by the Advisor, the following valuation process is used for our Level 3 investments:
| | ● | Valuation Designee. The applicable investments will be valued no less frequently than quarterly by the Advisor, with new investments valued at the time such investment was made. The value of each Level 3 investment will be initially reviewed by the persons responsible for such portfolio company or investment. The Advisor will use a standardized template designed to approximate fair market value based on observable market inputs, updated credit statistics and unobservable inputs to determine a preliminary value. The Advisor will specify the titles of the persons responsible for determining the fair value of the Company’s investments, including by specifying the particular functions for which they are responsible, and will reasonably segregate fair value determinations from the portfolio management of the Company such that the portfolio manager(s) may not determine, or effectively determine by exerting substantial influence on, the fair values ascribed to portfolio investments. |
| | ● | Valuation Firm. Quarterly, a third-party valuation firm engaged by the Advisor reviews the valuation methodologies and calculations employed for each of the Company’s investments that the Advisor has placed on the “watch list” and approximately 25% of the Company’s remaining investments. The third-party valuation firm will review and independently value all of the Level 3 investments at least once per year, on a rolling twelve-month basis. The quarterly report issued by the third-party valuation firm will provide positive assurance on the fair values of the investments reviewed. |
| | ● | Oversight. The Board has appointed the Advisor as the valuation designee for the Company for purposes of making determinations of fair value as permitted by Rule 2a-5 under the 1940 Act. The Audit Committee shall aid the Board in overseeing the Advisor’s fair valuation of securities that are not publicly traded or for which current market values are not readily available. The Audit Committee shall meet quarterly to review the fair value determinations, processes and written reports of the Advisor as part of the Board’s oversight responsibilities. |
Refer to Note 5 – Fair Value – for more information on the Company’s valuation process.
Revenue Recognition
We record interest income on an accrual basis to the extent that we expect to collect such amounts. For loans and debt securities with contractual PIK interest, which represents contractual interest accrued and added to the principal balance, we generally will not accrue PIK interest for accounting purposes if the portfolio company valuation indicates that such PIK interest is not collectible. We do not accrue as a receivable interest on loans and debt securities for accounting purposes if we have reason to doubt our ability to collect such interest. OIDs, market discounts or premiums are accreted or amortized using the effective interest method as interest income. We record prepayment premiums on loans and debt securities as interest income.
Related Party Transactions
Investment Advisory Agreement. On February 5, 2021, we entered into the Investment Advisory Agreement with our Advisor. In addition, on March 6, 2024, the Board approved an amended and restated investment advisory agreement (the “Amended Investment Advisory Agreement”) and a fee waiver agreement (the “Fee Waiver Agreement”) between the Company and the Advisor, which became effective upon the completion of the initial public offering of shares of common stock on May 24, 2024 (the “IPO Date”). On February 19, 2025, the Board approved an additional one-year term of the Investment Advisory Agreement from March 15, 2025 to March 15, 2026.
For services rendered under the Investment Advisory Agreement, we pay a base management fee quarterly in arrears to our Advisor based on the of the fair market value of our investments including, in each case, assets purchased with borrowings under our credit facilities and issuances of senior unsecured notes, but excluding cash, U.S. government securities and commercial paper instruments maturing within one year of purchase. We also pay an incentive fee on income and an incentive fee on capital gains to our Advisor.
The Amended Investment Advisory Agreement is materially the same as the Investment Advisory Agreement except, following the IPO Date, the base management fee is calculated at an annual rate of 1.00% and the incentive fee on income is subject to a twelve-quarter lookback quarterly hurdle rate of 1.50% as opposed to a single quarter measurement and is subject to an Incentive Fee Cap based on our Cumulative Pre-Incentive Fee Net Return. This lookback feature provides that the Advisor’s income incentive fee may be reduced if our portfolio experiences aggregate write-downs or net capital losses during the applicable Trailing Twelve Quarters. Pursuant to the Fee Waiver Agreement, commencing on the IPO Date, the Advisor implemented waivers of (i) the income incentive fee for three calendar quarters commencing the quarter the initial public offering was completed and (ii) a portion of the base management fee for one year following the completion of the initial public offering. Amounts waived by the Advisor pursuant to the Fee Waiver Agreement are not subject to recoupment by the Advisor.
Administration Agreement. On February 5, 2021, we entered into the Administration Agreement with our Advisor, which serves as our Administrator and provides or oversees the performance of its required administrative services and professional services rendered by others, which include (but are not limited to) accounting, payment of our expenses, legal, compliance, operations, technology and investor relations, preparation and filing of its tax returns, and preparation of financial reports provided to its stockholders and filed with the SEC. On February 19, 2025, the Board approved an additional one-year term of the Administration Agreement through March 15, 2026.
We reimburse the Administrator for its costs and expenses incurred in performing its obligations under the Administration Agreement, which may include its allocable portion of office facilities, overhead, and compensation paid to or compensatory distributions received by its officers (including our Chief Compliance Officer and Chief Financial Officer) and its respective staff who provide services to the Company. As the Company reimburses the Administrator for its expenses, such costs (including the costs of sub-administrators) will be ultimately borne by common stockholders. The Administrator does not receive compensation from us other than reimbursement of its expenses. The Administration Agreement may be terminated by either party with 60 days’ written notice.
Since the inception of the Company, the Administrator has engaged sub-administrators to assist the Administrator in performing certain of its administrative duties. During this period, the Administrator has not sought reimbursement of its expenses other than expenses incurred by the sub-administrators. The Administrator has engaged Ultimus Fund Solutions, LLC under a sub-administration agreement. Under the terms of the sub-administration agreement, Ultimus Fund Solutions, LLC provides fund administration and fund accounting services. The Company pays fees to Ultimus Fund Solutions, LLC, which constitute reimbursable expenses under the Administration Agreement. The Administrator may enter into additional sub-administration agreements with third parties to perform other administrative and professional services on behalf of the Administrator.
Non-Controlled, Affiliated Investment. We hold Trademark Global LLC and TG Parent Newco LLC (Trademark Global LLC), both non-controlled, affiliated investments, as defined in the 1940 Act. See “Item 1. – Notes to Consolidated Financial Statements – Note 3. Agreements and Related Party Transactions” for further details.
ITEM 7A. QUANTITATIVE AND QUALITATIVE DISCLOSURES ABOUT MARKET RISK
We are subject to financial market risks, including changes in interest rates. Interest rate sensitivity refers to the change in our earnings that may result from changes in the level of interest rates. Because we fund a portion of our investments with borrowings, our net investment income will be affected by the difference between the rate at which we invest and the rate at which we borrow. As a result, there can be no assurance that a significant change in market interest rates will not have a material adverse effect on our net investment income.
Assuming that the consolidated statement of assets and liabilities as of December 31, 2024 were to remain constant and that we took no actions to alter our existing interest rate sensitivity, the following table shows the annualized impact ($ in millions) of hypothetical base rate changes in interest rate (considering interest rate floors for floating rate instruments). We do not include our debt investments on non-accrual status and non-incoming producing as of December 31, 2024 in this calculation.
| Change in Interest Rates | | Increase
(Decrease)
in Interest
Income | | | Increase
(Decrease)
in Interest
Expense | | | Net Increase
(Decrease) in
Net
Investment
Income | |
| Down 200 basis points | | $ | (39.1 | ) | | $ | (15.7 | ) | | $ | (23.4 | ) |
| Down 100 basis points | | $ | (19.5 | ) | | $ | (7.8 | ) | | $ | (11.7 | ) |
| Up 100 basis points | | $ | 19.5 | | | $ | 7.8 | | | $ | 11.7 | |
| Up 200 basis points | | $ | 39.1 | | | $ | 15.7 | | | $ | 23.4 | |
The data in the table is based on the Company’s current statement of assets and liabilities.
We may hedge against interest rate fluctuations by using standard hedging instruments such as futures, options and forward contracts subject to the requirements of the 1940 Act. While hedging activities may insulate us against adverse changes in interest rates, they may also limit our ability to participate in benefits of lower interest rates with respect to our portfolio of investments with fixed interest rates.
ITEM 8. CONSOLIDATED FINANCIAL STATEMENTS AND SUPPLEMENTARY DATA
Index to Consolidated Financial Statements
Report of Independent Registered Public Accounting Firm
To the Board of Directors and Shareholders of Kayne Anderson BDC, Inc.
Opinions on the Financial Statements and Internal Control over Financial Reporting
We have audited the accompanying consolidated statements of assets and liabilities, including the consolidated schedule of investments, of Kayne Anderson BDC, Inc. and its subsidiaries (the "Company") as of December 31, 2024 and 2023, and the related consolidated statements of operations, of changes in net assets and of cash flows for each of the three years in the period ended December 31, 2024, including the related notes (collectively referred to as the "consolidated financial statements"). We also have audited the Company's internal control over financial reporting as of December 31, 2024, based on criteria established in Internal Control - Integrated Framework (2013) issued by the Committee of Sponsoring Organizations of the Treadway Commission (COSO).
In our opinion, the consolidated financial statements referred to above present fairly, in all material respects, the financial position of the Company as of December 31, 2024 and 2023, and the results of its operations, changes in its net assets and its cash flows for each of the three years in the period ended December 31, 2024 in conformity with accounting principles generally accepted in the United States of America. Also in our opinion, the Company maintained, in all material respects, effective internal control over financial reporting as of December 31, 2024, based on criteria established in Internal Control - Integrated Framework (2013) issued by the COSO.
We have also previously audited, in accordance with the standards of the Public Company Accounting Oversight Board (United States), the consolidated statements of assets and liabilities, including the consolidated schedules of investments, of the Company as of December 31, 2022 and 2021, and the related consolidated statements of operations, changes in net assets and cash flows for the year ended December 31, 2021 (none of which are presented herein), and we expressed unqualified opinions on those consolidated financial statements. In our opinion, the information set forth in the Senior Securities table of the Company for each of the four years in the period ended December 31, 2024 is fairly stated, in all material respects, in relation to the consolidated financial statements from which it has been derived.
Basis for Opinions
The Company's management is responsible for these consolidated financial statements, for maintaining effective internal control over financial reporting, and for its assessment of the effectiveness of internal control over financial reporting, included in Management’s Annual Report on Internal Control over Financial Reporting appearing under Item 9A. Our responsibility is to express opinions on the Company’s consolidated financial statements and on the Company's internal control over financial reporting based on our audits. We are a public accounting firm registered with the Public Company Accounting Oversight Board (United States) (PCAOB) and are required to be independent with respect to the Company in accordance with the U.S. federal securities laws and the applicable rules and regulations of the Securities and Exchange Commission and the PCAOB.
We conducted our audits in accordance with the standards of the PCAOB. Those standards require that we plan and perform the audits to obtain reasonable assurance about whether the consolidated financial statements are free of material misstatement, whether due to error or fraud, and whether effective internal control over financial reporting was maintained in all material respects.
Our audits of the consolidated financial statements included performing procedures to assess the risks of material misstatement of the consolidated financial statements, whether due to error or fraud, and performing procedures that respond to those risks. Such procedures included examining, on a test basis, evidence regarding the amounts and disclosures in the consolidated financial statements. Our audits also included evaluating the accounting principles used and significant estimates made by management, as well as evaluating the overall presentation of the consolidated financial statements. Our procedures included confirmation of securities owned as of December 31, 2024 and 2023 by correspondence with the custodian and transfer agent. Our audit of internal control over financial reporting included obtaining an understanding of internal control over financial reporting, assessing the risk that a material weakness exists, and testing and evaluating the design and operating effectiveness of internal control based on the assessed risk. Our audits also included performing such other procedures as we considered necessary in the circumstances. We believe that our audits provide a reasonable basis for our opinions.
Definition and Limitations of Internal Control over Financial Reporting
A company’s internal control over financial reporting is a process designed to provide reasonable assurance regarding the reliability of financial reporting and the preparation of financial statements for external purposes in accordance with generally accepted accounting principles. A company’s internal control over financial reporting includes those policies and procedures that (i) pertain to the maintenance of records that, in reasonable detail, accurately and fairly reflect the transactions and dispositions of the assets of the company; (ii) provide reasonable assurance that transactions are recorded as necessary to permit preparation of financial statements in accordance with generally accepted accounting principles, and that receipts and expenditures of the company are being made only in accordance with authorizations of management and directors of the company; and (iii) provide reasonable assurance regarding prevention or timely detection of unauthorized acquisition, use, or disposition of the company’s assets that could have a material effect on the financial statements.
Because of its inherent limitations, internal control over financial reporting may not prevent or detect misstatements. Also, projections of any evaluation of effectiveness to future periods are subject to the risk that controls may become inadequate because of changes in conditions, or that the degree of compliance with the policies or procedures may deteriorate.
Critical Audit Matters
The critical audit matter communicated below is a matter arising from the current period audit of the consolidated financial statements that was communicated or required to be communicated to the audit committee and that (i) relates to accounts or disclosures that are material to the consolidated financial statements and (ii) involved our especially challenging, subjective, or complex judgments. The communication of critical audit matters does not alter in any way our opinion on the consolidated financial statements, taken as a whole, and we are not, by communicating the critical audit matter below, providing a separate opinion on the critical audit matter or on the accounts or disclosures to which it relates.
Valuation of Level 3 Debt Investments
As described in Note 5 to the consolidated financial statements, the Company held $1.74 billion of total level 3 investments at fair value as of December 31, 2024, with debt investments representing approximately $1.72 billion of this total. The fair values of the level 3 debt investments were determined by management using a discounted cash flow analysis and inputs that are unobservable and reflect management’s judgments about assumptions that market participants would use to determine a current transaction price. The significant unobservable input in the discounted cash flow analysis is the discount rate.
The principal considerations for our determination that performing procedures relating to the valuation of level 3 debt investments is a critical audit matter are (i) the significant judgment by management when developing the fair value estimate of the level 3 debt investments; (ii) a high degree of auditor judgment, subjectivity, and effort in performing procedures and evaluating audit evidence related to management’s significant unobservable inputs related to the discount rates; and (iii) the audit effort involved the use of professionals with specialized skill and knowledge.
Addressing the matter involved performing procedures and evaluating audit evidence in connection with forming our overall opinion on the consolidated financial statements. These procedures included testing the effectiveness of controls relating to the valuation of level 3 debt investments, including controls over the development of significant unobservable inputs related to discount rates. These procedures also included, among others, testing the completeness, accuracy, and reliability of the underlying data and either (i) testing management’s process for developing the fair value estimate of the level 3 debt investments, as well as the involvement of professionals with specialized skill and knowledge to assist in (a) evaluating the appropriateness of the discounted cash flow analysis and (b) evaluating the reasonableness of the significant unobservable inputs used by management related to the discount rates; or (ii) the involvement of professionals with specialized skill and knowledge to assist in evaluating the external market and industry data used in the discounted cash flow analysis and the reasonableness of management’s estimate by developing an independent fair value estimate range for level 3 debt investments using independently determined significant unobservable inputs for the discount rates and comparing the independent fair value estimate range to management’s estimates.
/s/ PricewaterhouseCoopers LLP
Los Angeles, California
March 3, 2025
We have served as the auditor of one or more investment companies in Kayne Anderson Funds Family since 2004.
Kayne Anderson BDC, Inc.
Consolidated Statements of Assets and Liabilities
(amounts in 000’s, except share and per share amounts)
| | | December 31,
2024 | | | December 31,
2023 | |
| Assets: | | | | | | |
| Investments, at fair value: | | | | | | |
| Non-controlled, non-affiliated Investments (amortized cost of $1,956,617 and $1,343,223) | | $ | 1,982,947 | | | $ | 1,363,498 | |
| Non-controlled, affiliated investments (amortized cost of $15,438 and $0, respectively) | | | 12,196 | | | | - | |
| Short-term investments (amortized cost of $48,683 and $12,802) | | | 48,683 | | | | 12,802 | |
| Cash and cash equivalents | | | 22,375 | | | | 34,069 | |
| Receivable for principal payments on investments | | | 540 | | | | 104 | |
| Interest receivable | | | 14,965 | | | | 12,874 | |
| Prepaid expenses and other assets | | | 958 | | | | 319 | |
| Total Assets | | $ | 2,082,664 | | | $ | 1,423,666 | |
| | | | | | | | | |
| Liabilities: | | | | | | | | |
| Corporate Credit Facility (Note 6) | | $ | 250,000 | | | $ | 234,000 | |
| Unamortized Corporate Credit Facility issuance costs | | | (3,235 | ) | | | (1,715 | ) |
| Revolving Funding Facility (Note 6) | | | 420,000 | | | | 306,000 | |
| Unamortized Revolving Funding Facility issuance costs | | | (4,746 | ) | | | (2,019 | ) |
| Revolving Funding Facility II (Note 6) | | | 113,000 | | | | 70,000 | |
| Unamortized Revolving Funding Facility II issuance costs | | | (1,251 | ) | | | (1,805 | ) |
| Subscription Credit Agreement (Note 6) | | | - | | | | 10,750 | |
| Unamortized Subscription Credit Facility issuance costs | | | - | | | | (41 | ) |
| Notes (Note 6) | | | 75,000 | | | | 75,000 | |
| Unamortized notes issuance costs | | | (643 | ) | | | (851 | ) |
| Distributions payable | | | 28,424 | | | | 22,050 | |
| Management fee payable (Note 3) | | | 3,712 | | | | 2,996 | |
| Incentive fee payable (Note 3) | | | - | | | | 14,195 | |
| Accrued expenses and other liabilities | | | 15,236 | | | | 11,949 | |
| Accrued excise tax expense | | | 825 | | | | 101 | |
| Total Liabilities | | $ | 896,322 | | | $ | 740,610 | |
| | | | | | | | | |
| Commitments and contingencies (Note 8) | | | | | | | | |
| | | | | | | | | |
| Net Assets: | | | | | | | | |
| Common Shares, $0.001 par value; 100,000,000 shares authorized; 71,059,689 and 41,603,666 as of December 31, 2024 and December 31, 2023, respectively, issued and outstanding | | $ | 71 | | | $ | 42 | |
| Additional paid-in capital | | | 1,152,396 | | | | 669,990 | |
| Total distributable earnings (deficit) | | | 33,875 | | | | 13,024 | |
| Total Net Assets | | $ | 1,186,342 | | | $ | 683,056 | |
| Total Liabilities and Net Assets | | $ | 2,082,664 | | | $ | 1,423,666 | |
| Net Asset Value Per Common Share | | $ | 16.70 | | | $ | 16.42 | |
See accompanying notes to consolidated financial statements.
Kayne Anderson BDC, Inc.
Consolidated Statements of Operations
(amounts in 000’s, except share and per share amounts)
| | | For the years ended December 31, | |
| | | 2024 | | | 2023 | | | 2022 | |
| Income: | | | | | | | | | |
| Investment income from investments: | | | | | | | | | |
| Interest income from non-controlled, non-affiliated investments | | $ | 210,884 | | | $ | 160,433 | | | $ | 74,829 | |
| Interest income from non-controlled, affiliated investments | | | 754 | | | | - | | | | - | |
| Dividend income | | | 1,468 | | | | 571 | | | | - | |
| Total Investment Income | | | 213,106 | | | | 161,004 | | | | 74,829 | |
| | | | | | | | | | | | | |
| Expenses: | | | | | | | | | | | | |
| Management fees | | | 17,487 | | | | 11,433 | | | | 7,147 | |
| Incentive fees | | | 17,449 | | | | 9,433 | | | | 4,698 | |
| Interest expense | | | 61,516 | | | | 52,314 | | | | 20,292 | |
| Professional fees | | | 1,503 | | | | 691 | | | | 645 | |
| Directors fees | | | 621 | | | | 611 | | | | 460 | |
| Offering costs | | | - | | | | - | | | | 29 | |
| Excise tax | | | 817 | | | | 101 | | | | - | |
| Other general and administrative expenses | | | 2,159 | | | | 1,604 | | | | 1,379 | |
| Total Expenses | | | 101,552 | | | | 76,187 | | | | 34,650 | |
| Less: Management fee waiver (Note 3) | | | (2,900 | ) | | | - | | | | - | |
| Less: Incentive fee waiver (Note 3) | | | (14,818 | ) | | | - | | | | - | |
| Net expenses | | | 83,834 | | | | 76,187 | | | | 34,650 | |
| Net Investment Income (Loss) | | | 129,272 | | | | 84,817 | | | | 40,179 | |
| | | | | | | | | | | | | |
| Realized and unrealized gains (losses) on investments | | | | | | | | | | | | |
| Net realized gains (losses): | | | | | | | | | | | | |
| Non-controlled, non-affiliated investments | | | 570 | | | | (10,686 | ) | | | 84 | |
| Total net realized gains (losses) | | | 570 | | | | (10,686 | ) | | | 84 | |
| Net change in unrealized gains (losses): | | | | | | | | | | | | |
| Non-controlled, non-affiliated investments | | | 4,783 | | | | 2,944 | | | | 5,502 | |
| Non-controlled, affiliated investments | | | (1,968 | ) | | | - | | | | - | |
| Deferred income tax expense | | | (717 | ) | | | - | | | | - | |
| Total net change in unrealized gains (losses) | | | 2,098 | | | | 2,944 | | | | 5,502 | |
| Total realized and unrealized gains (losses) | | | 2,668 | | | | (7,742 | ) | | | 5,586 | |
| | | | | | | | | | | | | |
| Net Increase (Decrease) in Net Assets Resulting from Operations | | $ | 131,940 | | | $ | 77,075 | | | $ | 45,765 | |
| | | | | | | | | | | | | |
| Per Common Share Data: | | | | | | | | | | | | |
| Basic and diluted net investment income per common share | | $ | 2.03 | | | $ | 2.16 | | | $ | 1.48 | |
| Basic and diluted net increase in net assets resulting from operations | | $ | 2.07 | | | $ | 1.96 | | | $ | 1.68 | |
| Weighted Average Common Shares Outstanding - Basic and Diluted | | | 63,762,377 | | | | 39,250,232 | | | | 27,184,302 | |
See accompanying notes to consolidated financial statements.
Kayne Anderson BDC, Inc.
Consolidated Statements of Changes in Net Assets
(amounts in 000’s)
| | | For the years ended December 31, | |
| | | 2024 | | | 2023 | | | 2022 | |
| Increase (Decrease) in Net Assets Resulting from Operations: | | | | | | | | | | | | |
| Net investment income (loss) | | $ | 129,272 | | | $ | 84,817 | | | $ | 40,179 | |
| Net realized gains (losses) on investments | | | 570 | | | | (10,686 | ) | | | 84 | |
| Net change in unrealized gains (losses) on investments, net of tax | | | 2,098 | | | | 2,944 | | | | 5,502 | |
| Net Increase (Decrease) in Net Assets Resulting from Operations | | | 131,940 | | | | 77,075 | | | | 45,765 | |
| | | | | | | | | | | | | |
| Decrease in Net Assets Resulting from Stockholder Dividends | | | | | | | | | | | | |
| Dividends to stockholders | | | (111,908 | ) | | | (81,617 | ) | | | (39,553 | ) |
| Net Decrease in Net Assets Resulting from Stockholder Dividends | | | (111,908 | ) | | | (81,617 | ) | | | (39,553 | ) |
| | | | | | | | | | | | | |
| Increase in Net Assets Resulting from Capital Share Transactions | | | | | | | | | | | | |
| Issuance of common shares, net of underwriting and offering costs | | | 480,997 | | | | 90,575 | | | | 268,218 | |
| Common stock purchased under the share repurchase program | | | (1,525 | ) | | | - | | | | - | |
| Reinvestment of dividends | | | 3,782 | | | | 4,982 | | | | 5,642 | |
| Net Increase in Net Assets Resulting from Capital Share Transactions | | | 483,254 | | | | 95,557 | | | | 273,860 | |
| Total Increase (Decrease) in Net Assets | | | 503,286 | | | | 91,015 | | | | 280,072 | |
| Net Assets, Beginning of Period | | | 683,056 | | | | 592,041 | | | | 311,969 | |
| Net Assets, End of Period | | $ | 1,186,342 | | | $ | 683,056 | | | $ | 592,041 | |
See accompanying notes to consolidated financial statements.
Kayne Anderson BDC, Inc.
Consolidated Statements of Cash Flows
(amounts in 000’s)
| | | For the years ended December 31, | |
| | | 2024 | | | 2023 | | | 2022 | |
| | | | | | | | | | |
| Cash Flows from Operating Activities: | | | | | | | | | |
| Net increase (decrease) in net assets resulting from operations | | $ | 131,940 | | | $ | 77,075 | | | $ | 45,765 | |
| Adjustments to reconcile net increase (decrease) in net assets resulting from | | | | | | | | | | | | |
| operations to net cash used in operating activities: | | | | | | | | | | | | |
| Net realized (gains)/losses on investments | | | (570 | ) | | | 10,686 | | | | (84 | ) |
| Net change in unrealized (gains)/losses on investments | | | (2,815 | ) | | | (2,944 | ) | | | (5,502 | ) |
| Net accretion of discount on investments | | | (12,472 | ) | | | (9,777 | ) | | | (4,819 | ) |
| Sales (purchases) of short-term investments, net | | | (35,881 | ) | | | (2,955 | ) | | | (6,173 | ) |
| Purchases of portfolio investments | | | (983,505 | ) | | | (391,341 | ) | | | (718,236 | ) |
| Proceeds from sales of investments and principal repayments | | | 370,423 | | | | 196,649 | | | | 142,118 | |
| Paid-in-kind interest from portfolio investments | | | (2,706 | ) | | | (1,652 | ) | | | (151 | ) |
| Amortization of deferred financing cost | | | 3,718 | | | | 2,694 | | | | 2,122 | |
| Increase/(decrease) in operating assets and liabilities: | | | | | | | | | | | | |
| (Increase)/decrease in interest and dividends receivable | | | (2,091 | ) | | | (2,430 | ) | | | (8,311 | ) |
| (Increase)/decrease in deferred offering costs | | | - | | | | - | | | | 29 | |
| (Increase)/decrease in receivable for principal payments on investments | | | (436 | ) | | | 7 | | | | (111 | ) |
| Increase/(decrease) in excise tax payable | | | 724 | | | | 101 | | | | - | |
| (Increase)/decrease in prepaid expenses and other assets | | | (639 | ) | | | 28 | | | | (199 | ) |
| Increase/(decrease) in payable for investments purchased | | | - | | | | (956 | ) | | | 956 | |
| Increase/(decrease) in management fees payable | | | 716 | | | | 581 | | | | 1,463 | |
| Increase/(decrease) in incentive fee payable | | | (14,195 | ) | | | 9,433 | | | | 4,697 | |
| Increase/(decrease) in accrued organizational and offering costs, net | | | - | | | | - | | | | (6 | ) |
| Increase/(decrease) in accrued expenses and other liabilities | | | 3,287 | | | | 4,748 | | | | 4,672 | |
| Net cash used in operating activities | | | (544,502 | ) | | | (110,053 | ) | | | (541,770 | ) |
| Cash Flows from Financing Activities: | | | | | | | | | | | | |
| Borrowings/(payments) on Corporate Credit Facility, net | | | 16,000 | | | | (35,000 | ) | | | 269,000 | |
| Borrowings on Revolving Funding Facility, net | | | 114,000 | | | | 106,000 | | | | 200,000 | |
| Borrowings on Revolving Funding Facility II, net | | | 43,000 | | | | 70,000 | | | | - | |
| (Payments)/Borrowings on Loan and Security Agreement, net | | | - | | | | - | | | | (162,000 | ) |
| Borrowings/(payments) on Subscription Credit Agreement, net | | | (10,750 | ) | | | (97,250 | ) | | | 3,000 | |
| Payments of debt issuance costs | | | (7,162 | ) | | | (3,716 | ) | | | (6,859 | ) |
| Dividends paid in cash | | | (101,752 | ) | | | (70,013 | ) | | | (23,098 | ) |
| Proceeds from issuance of common shares, net of underwriting & offering costs | | | 480,997 | | | | 90,575 | | | | 268,218 | |
| Proceeds from issuance of Notes | | | - | | | | 75,000 | | | | - | |
| Repurchase of common shares | | | (1,525 | ) | | | - | | | | - | |
| Net cash provided by financing activities | | | 532,808 | | | | 135,596 | | | | 548,261 | |
| Net increase (decrease) in cash and cash equivalents | | | (11,694 | ) | | | 25,543 | | | | 6,491 | |
| Cash and cash equivalents, beginning of period | | | 34,069 | | | | 8,526 | | | | 2,035 | |
| Cash and cash equivalents, end of period | | $ | 22,375 | | | $ | 34,069 | | | $ | 8,526 | |
| | | | | | | | | | | | | |
| Supplemental and Non-Cash Information: | | | | | | | | | | | | |
| Interest paid during the period | | $ | 55,014 | | | $ | 44,384 | | | $ | 14,211 | |
| Non-cash financing activities not included herein consisted of reinvestment of dividends | | $ | 3,782 | | | $ | 4,982 | | | $ | 5,642 | |
See accompanying notes to consolidated financial statements.
Kayne Anderson BDC, Inc.
Consolidated Schedule of Investments
As of December 31, 2024
(amounts in 000’s, except number of shares, units)
| Portfolio Company | | Footnotes (1)(2) | | Investment (3) | | Interest Rate | | | Spread | | | PIK Rate | | | Reference(4) | | Maturity
Date | | Principal /
Par | | | Amortized
Cost(5) | | | Fair
Value | | | Percentage of
Net Assets | |
| Debt and Equity Investments | | | | | | | | | | | | | | | | | | | | | | | | | | | | | |
| Debt Investments | | | | | | | | | | | | | | | | | | | | | | | | | | | | | |
| Aerospace & defense | | | | | | | | | | | | | | | | | | | | | | | | | | | | | |
| Basel U.S. Acquisition Co., Inc. (IAC) | | (6) | | First lien senior secured loan | | | 9.94 | % | | | 5.50 | % | | | - | | | SOFR(Q) | | 12/5/2028 | | $ | 18,308 | | | $ | 17,978 | | | $ | 18,570 | | | | 1.6 | % |
| | | | | First lien senior secured loan | | | 9.94 | % | | | 5.50 | % | | | - | | | SOFR(Q) | | 12/5/2028 | | | 3,697 | | | | 3,612 | | | | 3,750 | | | | 0.3 | % |
| | | | | First lien senior secured delayed draw loan | | | 9.94 | % | | | 5.50 | % | | | - | | | SOFR(Q) | | 7/8/2026 | | | - | | | | - | | | | - | | | | 0.0 | % |
| | | | | First lien senior secured revolving loan | | | 9.94 | % | | | 5.50 | % | | | - | | | SOFR(Q) | | 12/5/2028 | | | - | | | | - | | | | - | | | | 0.0 | % |
| Fastener Distribution Holdings, LLC | | | | First lien senior secured loan | | | 9.31 | % | | | 4.75 | % | | | - | | | SOFR(Q) | | 11/4/2031 | | | 20,067 | | | | 19,870 | | | | 20,067 | | | | 1.7 | % |
| | | | | First lien senior secured delayed draw loan | | | 9.31 | % | | | 4.75 | % | | | - | | | SOFR(S) | | 11/4/2031 | | | - | | | | - | | | | - | | | | 0.0 | % |
| TransDigm Inc | | (8) | | First lien senior secured loan | | | 6.83 | % | | | 2.50 | % | | | - | | | SOFR(Q) | | 2/28/2031 | | | 10,010 | | | | 10,055 | | | | 10,023 | | | | 0.8 | % |
| Vitesse Systems Parent, LLC | | | | First lien senior secured loan | | | 11.47 | % | | | 7.00 | % | | | - | | | SOFR(M) | | 12/22/2028 | | | 30,896 | | | | 30,249 | | | | 30,819 | | | | 2.6 | % |
| | | | | First lien senior secured revolving loan | | | 11.56 | % | | | 7.00 | % | | | - | | | SOFR(M) | | 12/22/2028 | | | 4,679 | | | | 4,578 | | | | 4,667 | | | | 0.4 | % |
| | | | | | | | | | | | | | | | | | | | | | | | 87,657 | | | | 86,342 | | | | 87,896 | | | | 7.4 | % |
| Automobile components | | | | | | | | | | | | | | | | | | | | | | | | | | | | | | | | | | | | |
| Clarios Global LP | | (6)(8) | | First lien senior secured loan | | | 6.86 | % | | | 2.50 | % | | | - | | | SOFR(M) | | 5/6/2030 | | | 10,060 | | | | 10,098 | | | | 10,090 | | | | 0.8 | % |
| Speedstar Holding LLC | | | | First lien senior secured loan | | | 10.59 | % | | | 6.00 | % | | | - | | | SOFR(Q) | | 7/22/2027 | | | 6,100 | | | | 6,040 | | | | 6,131 | | | | 0.5 | % |
| | | | | First lien senior secured delayed draw loan | | | 10.59 | % | | | 6.00 | % | | | - | | | SOFR(Q) | | 7/22/2027 | | | 666 | | | | 650 | | | | 669 | | | | 0.1 | % |
| Vehicle Accessories, Inc. | | | | First lien senior secured loan | | | 9.72 | % | | | 5.25 | % | | | - | | | SOFR(M) | | 11/30/2026 | | | 26,424 | | | | 26,179 | | | | 26,424 | | | | 2.2 | % |
| | | | | First lien senior secured revolving loan | | | 9.72 | % | | | 5.25 | % | | | - | | | SOFR(M) | | 11/30/2026 | | | - | | | | - | | | | - | | | | 0.0 | % |
| WAM CR Acquisition, Inc. (Wolverine) | | | | First lien senior secured loan | | | 10.58 | % | | | 6.25 | % | | | - | | | SOFR(Q) | | 7/23/2029 | | | 26,830 | | | | 26,327 | | | | 27,232 | | | | 2.3 | % |
| | | | | | | | | | | | | | | | | | | | | | | | 70,080 | | | | 69,294 | | | | 70,546 | | | | 5.9 | % |
| Biotechnology | | | | | | | | | | | | | | | | | | | | | | | | | | | | | | | | | | | | |
| Alcami Corporation (Alcami) | | | | First lien senior secured delayed draw loan | | | 11.55 | % | | | 7.00 | % | | | - | | | SOFR(M) | | 12/21/2028 | | | 846 | | | | 846 | | | | 855 | | | | 0.1 | % |
| | | | | First lien senior secured revolving loan | | | 11.44 | % | | | 7.00 | % | | | - | | | SOFR(M) | | 12/21/2028 | | | 117 | | | | 81 | | | | 119 | | | | 0.0 | % |
| | | | | First lien senior secured loan | | | 11.66 | % | | | 7.00 | % | | | - | | | SOFR(Q) | | 12/21/2028 | | | 11,501 | | | | 11,213 | | | | 11,616 | | | | 1.0 | % |
| | | | | | | | | | | | | | | | | | | | | | | | 12,464 | | | | 12,140 | | | | 12,590 | | | | 1.1 | % |
| Building products | | | | | | | | | | | | | | | | | | | | | | | | | | | | | | | | | | | | |
| Eastern Wholesale Fence, LLC | | | | First lien senior secured loan | | | 12.74 | % | | | 8.00 | % | | | - | | | SOFR(Q) | | 10/30/2025 | | | 2,828 | | | | 2,804 | | | | 2,828 | | | | 0.2 | % |
| | | | | First lien senior secured loan | | | 12.74 | % | | | 8.00 | % | | | - | | | SOFR(Q) | | 10/30/2025 | | | 15,678 | | | | 15,468 | | | | 15,678 | | | | 1.3 | % |
| | | | | First lien senior secured revolving loan | | | 12.74 | % | | | 8.00 | % | | | - | | | SOFR(Q) | | 10/30/2025 | | | 1,077 | | | | 1,074 | | | | 1,077 | | | | 0.1 | % |
| Ruff Roofers Buyer, LLC | | | | First lien senior secured loan | | | 9.86 | % | | | 5.50 | % | | | - | | | SOFR(M) | | 11/17/2029 | | | 7,115 | | | | 6,880 | | | | 7,115 | | | | 0.6 | % |
| | | | | First lien senior secured revolving loan | | | 10.11 | % | | | 5.75 | % | | | - | | | SOFR(M) | | 11/17/2029 | | | - | | | | - | | | | - | | | | 0.0 | % |
| | | | | First lien senior secured delayed draw loan | | | 10.11 | % | | | 5.75 | % | | | - | | | SOFR(M) | | 11/17/2029 | | | 3,818 | | | | 3,782 | | | | 3,818 | | | | 0.3 | % |
| US Anchors Group, Inc. (Mechanical Plastics Corp.) | | | | First lien senior secured loan | | | 9.33 | % | | | 5.00 | % | | | - | | | SOFR(Q) | | 7/15/2029 | | | 14,109 | | | | 13,800 | | | | 14,109 | | | | 1.2 | % |
| | | | | First lien senior secured revolving loan | | | 9.33 | % | | | 5.00 | % | | | - | | | SOFR(Q) | | 7/15/2029 | | | - | | | | - | | | | - | | | | 0.0 | % |
| | | | | | | | | | | | | | | | | | | | | | | | 44,625 | | | | 43,808 | | | | 44,625 | | | | 3.7 | % |
| Chemicals | | | | | | | | | | | | | | | | | | | | | | | | | | | | | | | | | | | | |
| Fralock Buyer LLC | | | | First lien senior secured loan | | | 10.75 | % | | | 6.00 | % | | | 0.50 | % | | SOFR(Q) | | 3/31/2025 | | | 9,286 | | | | 9,278 | | | | 9,263 | | | | 0.8 | % |
| | | | | First lien senior secured loan | | | 10.75 | % | | | 6.00 | % | | | 0.50 | % | | SOFR(Q) | | 3/31/2025 | | | 2,388 | | | | 2,385 | | | | 2,382 | | | | 0.2 | % |
| | | | | First lien senior secured revolving loan | | | 10.83 | % | | | 6.00 | % | | | 0.50 | % | | SOFR(Q) | | 3/31/2025 | | | 749 | | | | 747 | | | | 747 | | | | 0.1 | % |
| Nouryon USA, LLC (f/k/a AkzoNobel Specialty Chemicals) | | (8) | | First lien senior secured loan | | | 7.66 | % | | | 3.25 | % | | | - | | | SOFR(Q) | | 4/3/2028 | | | 9,854 | | | | 9,904 | | | | 9,913 | | | | 0.8 | % |
| | | | | | | | | | | | | | | | | | | | | | | | 22,277 | | | | 22,314 | | | | 22,305 | | | | 1.9 | % |
| Commercial services & supplies | | | | | | | | | | | | | | | | | | | | | | | | | | | | | | | | | | | | |
| Advanced Environmental Monitoring | | (7) | | First lien senior secured loan | | | 10.41 | % | | | 5.75 | % | | | - | | | SOFR(Q) | | 1/29/2027 | | | 3,651 | | | | 3,588 | | | | 3,651 | | | | 0.3 | % |
| | | | | First lien senior secured loan | | | 10.23 | % | | | 5.75 | % | | | - | | | SOFR(Q) | | 1/29/2026 | | | 7,372 | | | | 7,266 | | | | 7,372 | | | | 0.6 | % |
| | | | | First lien senior secured loan | | | 10.23 | % | | | 5.75 | % | | | - | | | SOFR(Q) | | 1/29/2026 | | | 2,787 | | | | 2,787 | | | | 2,787 | | | | 0.2 | % |
| Alight Solutions (Tempo Acquisition LLC) | | (8) | | First lien senior secured loan | | | 6.61 | % | | | 2.25 | % | | | - | | | SOFR(M) | | 8/31/2028 | | | 8,185 | | | | 8,213 | | | | 8,210 | | | | 0.7 | % |
| Allentown, LLC | | | | First lien senior secured loan | | | 11.66 | % | | | 6.00 | % | | | 1.00 | % | | SOFR(Q) | | 4/22/2027 | | | 7,584 | | | | 7,474 | | | | 7,318 | | | | 0.6 | % |
| | | | | First lien senior secured delayed draw loan | | | 11.66 | % | | | 6.00 | % | | | 1.00 | % | | SOFR(Q) | | 4/22/2027 | | | 1,370 | | | | 1,346 | | | | 1,322 | | | | 0.1 | % |
| | | | | First lien senior secured revolving loan | | | 12.50 | % | | | 5.00 | % | | | - | | | PRIME | | 4/22/2027 | | | 367 | | | | 357 | | | | 354 | | | | 0.0 | % |
See accompanying notes to consolidated financial statements.
Kayne Anderson BDC, Inc.
Consolidated Schedule of Investments
As of December 31, 2024
(amounts in 000’s, except number of shares, units)
| Portfolio Company | | Footnotes (1)(2) | | Investment (3) | | Interest Rate | | | Spread | | | PIK Rate | | | Reference(4) | | Maturity
Date | | Principal /
Par | | | Amortized
Cost(5) | | | Fair
Value | | | Percentage of
Net Assets | |
| American Equipment Holdings LLC | | | | First lien senior secured loan | | | 10.67 | % | | | 6.00 | % | | | - | | | SOFR(M) | | 11/5/2026 | | | 16,057 | | | | 15,908 | | | | 16,057 | | | | 1.4 | % |
| | | | | First lien senior secured loan | | | 10.67 | % | | | 6.00 | % | | | - | | | SOFR(M) | | 11/5/2026 | | | 1,720 | | | | 1,706 | | | | 1,720 | | | | 0.2 | % |
| | | | | First lien senior secured loan | | | 10.56 | % | | | 6.00 | % | | | - | | | SOFR(M) | | 11/5/2026 | | | 2,064 | | | | 2,044 | | | | 2,064 | | | | 0.2 | % |
| | | | | First lien senior secured loan | | | 10.45 | % | | | 6.00 | % | | | - | | | SOFR(M) | | 11/5/2026 | | | 561 | | | | 558 | | | | 561 | | | | 0.1 | % |
| | | | | First lien senior secured loan | | | 10.50 | % | | | 6.00 | % | | | - | | | SOFR(M) | | 11/5/2026 | | | 2,626 | | | | 2,588 | | | | 2,626 | | | | 0.2 | % |
| | | | | First lien senior secured delayed draw loan | | | 10.67 | % | | | 6.00 | % | | | - | | | SOFR(M) | | 11/5/2026 | | | 6,176 | | | | 6,110 | | | | 6,176 | | | | 0.5 | % |
| | | | | First lien senior secured delayed draw loan | | | 10.60 | % | | | 6.00 | % | | | - | | | SOFR(M) | | 11/5/2026 | | | 4,919 | | | | 4,878 | | | | 4,919 | | | | 0.4 | % |
| | | | | First lien senior secured revolving loan | | | 10.49 | % | | | 6.00 | % | | | - | | | SOFR(M) | | 11/5/2026 | | | 2,557 | | | | 2,481 | | | | 2,557 | | | | 0.2 | % |
| Arborworks Acquisition LLC | | (9)(10) | | First lien senior secured loan | | | - | | | | - | | | | - | | | - | | 11/6/2028 | | | 4,688 | | | | 4,688 | | | | 4,688 | | | | 0.4 | % |
| | | | | First lien senior secured revolving loan | | | - | | | | - | | | | - | | | - | | 11/6/2028 | | | 948 | | | | 948 | | | | 948 | | | | 0.1 | % |
| Bloomington Holdco, LLC (BW Fusion) | | | | First lien senior secured revolving loan | | | 10.05 | % | | | 5.50 | % | | | - | | | SOFR(Q) | | 5/1/2030 | | | 21,248 | | | | 20,830 | | | | 21,248 | | | | 1.8 | % |
| | | | | First lien senior secured loan | | | 10.05 | % | | | 5.50 | % | | | - | | | SOFR(Q) | | 5/1/2030 | | | 3,612 | | | | 3,417 | | | | 3,612 | | | | 0.3 | % |
| BLP Buyer, Inc. (Bishop Lifting Products) | | | | First lien senior secured loan | | | 10.34 | % | | | 6.00 | % | | | - | | | SOFR(M) | | 12/22/2029 | | | 25,969 | | | | 25,538 | | | | 26,163 | | | | 2.2 | % |
| | | | | First lien senior secured loan | | | 10.34 | % | | | 6.00 | % | | | - | | | SOFR(M) | | 12/22/2029 | | | 1,220 | | | | 1,198 | | | | 1,229 | | | | 0.1 | % |
| | | | | First lien senior secured delayed draw loan | | | 10.34 | % | | | 6.00 | % | | | - | | | SOFR(M) | | 12/22/2029 | | | 3,178 | | | | 3,123 | | | | 3,202 | | | | 0.3 | % |
| | | | | First lien senior secured revolving loan | | | 10.34 | % | | | 6.00 | % | | | - | | | SOFR(M) | | 12/22/2029 | | | 757 | | | | 692 | | | | 762 | | | | 0.1 | % |
| Connect America.com, LLC | | | | First lien senior secured loan | | | 9.83 | % | | | 5.50 | % | | | - | | | SOFR(Q) | | 10/11/2029 | | | 25,670 | | | | 25,298 | | | | 25,670 | | | | 2.2 | % |
| Diverzify Intermediate LLC | | | | First lien senior secured delayed draw loan | | | 10.53 | % | | | 5.75 | % | | | - | | | SOFR(M) | | 4/4/2026 | | | - | | | | - | | | | - | | | | 0.0 | % |
| | | | | First lien senior secured loan | | | 10.53 | % | | | 5.75 | % | | | - | | | SOFR(Q) | | 5/11/2027 | | | 6,033 | | | | 5,902 | | | | 5,957 | | | | 0.5 | % |
| Gusmer Enterprises, Inc. | | | | First lien senior secured loan | | | 11.47 | % | | | 7.00 | % | | | - | | | SOFR(M) | | 5/7/2027 | | | 3,688 | | | | 3,652 | | | | 3,688 | | | | 0.3 | % |
| | | | | First lien senior secured delayed draw loan | | | 11.47 | % | | | 7.00 | % | | | - | | | SOFR(M) | | 5/7/2027 | | | 4,828 | | | | 4,784 | | | | 4,828 | | | | 0.4 | % |
| | | | | First lien senior secured delayed draw loan | | | 11.47 | % | | | 7.00 | % | | | - | | | SOFR(M) | | 5/7/2027 | | | 1,349 | | | | 1,302 | | | | 1,349 | | | | 0.1 | % |
| | | | | First lien senior secured revolving loan | | | 11.47 | % | | | 7.00 | % | | | - | | | SOFR(Q) | | 5/7/2027 | | | - | | | | - | | | | - | | | | 0.0 | % |
| Superior Intermediate LLC (Landmark Structures) | | | | First lien senior secured loan | | | 10.35 | % | | | 6.00 | % | | | - | | | SOFR(M) | | 12/18/2029 | | | 18,257 | | | | 17,762 | | | | 18,257 | | | | 1.5 | % |
| | | | | First lien senior secured delayed draw loan | | | 10.35 | % | | | 6.00 | % | | | - | | | SOFR(M) | | 12/18/2029 | | | - | | | | - | | | | - | | | | 0.0 | % |
| | | | | First lien senior secured revolving loan | | | 10.38 | % | | | 6.00 | % | | | - | | | SOFR(M) | | 12/18/2029 | | | - | | | | - | | | | - | | | | 0.0 | % |
| PMFC Holding, LLC | | | | First lien senior secured loan | | | 12.74 | % | | | 8.00 | % | | | - | | | SOFR(Q) | | 12/19/2032 | | | 5,504 | | | | 5,435 | | | | 5,504 | | | | 0.5 | % |
| | | | | First lien senior secured delayed draw loan | | | 12.74 | % | | | 8.00 | % | | | - | | | SOFR(Q) | | 12/19/2032 | | | 2,760 | | | | 2,746 | | | | 2,760 | | | | 0.2 | % |
| | | | | First lien senior secured revolving loan | | | 12.74 | % | | | 8.00 | % | | | - | | | SOFR(Q) | | 12/19/2032 | | | 445 | | | | 443 | | | | 445 | | | | 0.0 | % |
| Regiment Security Partners LLC | | | | First lien senior secured loan | | | 12.50 | % | | | 8.00 | % | | | - | | | SOFR(Q) | | 9/15/2026 | | | 6,360 | | | | 6,298 | | | | 6,360 | | | | 0.5 | % |
| | | | | First lien senior secured delayed draw loan | | | 12.50 | % | | | 8.00 | % | | | - | | | SOFR(Q) | | 9/15/2026 | | | 2,602 | | | | 2,582 | | | | 2,602 | | | | 0.2 | % |
See accompanying notes to consolidated financial statements.
Kayne Anderson BDC, Inc.
Consolidated Schedule of Investments
As of December 31, 2024
(amounts in 000’s, except number of shares, units)
| Portfolio Company | | Footnotes (1)(2) | | Investment (3) | | Interest Rate | | | Spread | | | PIK Rate | | | Reference(4) | | Maturity
Date | | Principal /
Par | | | Amortized
Cost(5) | | | Fair
Value | | | Percentage of
Net Assets | |
| | | | | First lien senior secured revolving loan | | | 12.50 | % | | | 8.00 | % | | | - | | | SOFR(Q) | | 9/15/2026 | | | 1,452 | | | | 1,434 | | | | 1,452 | | | | 0.1 | % |
| Tapco Buyer LLC | | | | First lien senior secured loan | | | 9.52 | % | | | 5.00 | % | | | - | | | SOFR(Q) | | 11/15/2030 | | | 10,471 | | | | 10,316 | | | | 10,471 | | | | 0.9 | % |
| | | | | First lien senior secured delayed draw loan | | | 9.34 | % | | | 5.00 | % | | | - | | | SOFR(Q) | | 11/15/2030 | | | 603 | | | | 503 | | | | 603 | | | | 0.1 | % |
| | | | | First lien senior secured revolving loan | | | 9.34 | % | | | 5.00 | % | | | - | | | SOFR(Q) | | 11/15/2030 | | | - | | | | - | | | | - | | | | 0.0 | % |
| | | | | | | | | | | | | | | | | | | | | | | | 219,638 | | | | 216,195 | | | | 219,492 | | | | 18.5 | % |
| Construction materials | | | | | | | | | | | | | | | | | | | | | | | | | | | | | | | | | | | | |
| Quikrete Holdings Inc | | (8) | | First lien senior secured loan | | | 6.61 | % | | | 2.25 | % | | | - | | | SOFR(M) | | 3/19/2029 | | | 14,888 | | | | 14,888 | | | | 14,870 | | | | 1.3 | % |
| | | | | | | | | | | | | | | | | | | | | | | | | | | | | | | | | | | | | |
| Containers & packaging | | | | | | | | | | | | | | | | | | | | | | | | | | | | | | | | | | | | |
| Carton Packaging Buyer, Inc. (Century Box) | | | | First lien senior secured loan | | | 10.84 | % | | | 6.25 | % | | | - | | | SOFR(Q) | | 10/30/2028 | | | 24,018 | | | | 23,477 | | | | 23,778 | | | | 2.0 | % |
| | | | | First lien senior secured revolving loan | | | 10.84 | % | | | 6.25 | % | | | - | | | SOFR(S) | | 10/30/2028 | | | - | | | | - | | | | - | | | | 0.0 | % |
| Drew Foam Companies, Inc. | | (7) | | First lien senior secured loan | | | 10.48 | % | | | 6.00 | % | | | - | | | SOFR(Q) | | 12/5/2026 | | | 6,978 | | | | 6,835 | | | | 6,978 | | | | 0.6 | % |
| | | | | First lien senior secured loan | | | 10.78 | % | | | 6.00 | % | | | - | | | SOFR(Q) | | 12/5/2026 | | | 19,835 | | | | 19,685 | | | | 19,835 | | | | 1.7 | % |
| FCA, LLC (FCA Packaging) | | | | First lien senior secured loan | | | 10.13 | % | | | 5.00 | % | | | - | | | SOFR(S) | | 7/18/2028 | | | 18,673 | | | | 18,492 | | | | 18,673 | | | | 1.6 | % |
| | | | | First lien senior secured loan | | | 10.11 | % | | | 5.75 | % | | | - | | | SOFR(M) | | 7/18/2028 | | | 1,711 | | | | 1,658 | | | | 1,745 | | | | 0.1 | % |
| | | | | First lien senior secured revolving loan | | | 10.13 | % | | | 5.00 | % | | | - | | | SOFR(S) | | 7/18/2028 | | | - | | | | - | | | | - | | | | 0.0 | % |
| Innopak Industries, Inc. | | | | First lien senior secured loan | | | 10.75 | % | | | 6.25 | % | | | - | | | SOFR(M) | | 3/5/2027 | | | 7,241 | | | | 7,116 | | | | 7,241 | | | | 0.6 | % |
| | | | | First lien senior secured loan | | | 10.75 | % | | | 6.25 | % | | | - | | | SOFR(M) | | 3/5/2027 | | | 5,925 | | | | 5,821 | | | | 5,925 | | | | 0.5 | % |
| | | | | First lien senior secured loan | | | 10.69 | % | | | 6.25 | % | | | - | | | SOFR(M) | | 3/5/2027 | | | 14,775 | | | | 14,529 | | | | 14,775 | | | | 1.2 | % |
| M2S Group Intermediate Holdings, Inc. | | | | First lien senior secured loan | | | 9.09 | % | | | 4.75 | % | | | - | | | SOFR(M) | | 8/22/2031 | | | 39,080 | | | | 36,446 | | | | 37,713 | | | | 3.2 | % |
| The Robinette Company | | | | First lien senior secured loan | | | 10.52 | % | | | 6.00 | % | | | - | | | SOFR(Q) | | 5/10/2029 | | | 10,226 | | | | 10,042 | | | | 10,431 | | | | 0.9 | % |
| | | | | First lien senior secured revolving loan | | | 10.52 | % | | | 6.00 | % | | | - | | | SOFR(Q) | | 5/10/2029 | | | 2,414 | | | | 2,322 | | | | 2,462 | | | | 0.2 | % |
| | | | | First lien senior secured delayed draw loan | | | 10.52 | % | | | 6.00 | % | | | - | | | SOFR(M) | | 11/10/2025 | | | - | | | | - | | | | - | | | | 0.0 | % |
| | | | | | | | | | | | | | | | | | | | | | | | 150,876 | | | | 146,423 | | | | 149,556 | | | | 12.6 | % |
| Diversified consumer services | | | | | | | | | | | | | | | | | | | | | | | | | | | | | | | | | | | | |
| Fugue Finance B.V. | | (6)(8) | | First lien senior secured loan | | | 8.25 | % | | | 3.75 | % | | | - | | | SOFR(Q) | | 2/26/2031 | | | 2,985 | | | | 2,979 | | | | 3,001 | | | | 0.3 | % |
| | | | | | | | | | | | | | | | | | | | | | | | | | | | | | | | | | | | | |
| Diversified telecommunication services | | | | | | | | | | | | | | | | | | | | | | | | | | | | | | | | | | | | |
| Liberty Global/Vodafone Ziggo | | (6)(8) | | First lien senior secured loan | | | 7.01 | % | | | 2.50 | % | | | - | | | SOFR(M) | | 4/30/2028 | | | 10,060 | | | | 9,968 | | | | 10,006 | | | | 0.8 | % |
| Network Connex (f/k/a NTI Connect, LLC) | | | | First lien senior secured loan | | | 9.48 | % | | | 5.00 | % | | | - | | | SOFR(Q) | | 1/31/2026 | | | 3,552 | | | | 3,530 | | | | 3,552 | | | | 0.3 | % |
| Virgin Media Bristor LLC | | (8) | | First lien senior secured loan | | | 7.01 | % | | | 2.50 | % | | | - | | | SOFR(M) | | 1/31/2028 | | | 17,500 | | | | 17,343 | | | | 17,361 | | | | 1.5 | % |
| | | | | | | | | | | | | | | | | | | | | | | | 31,112 | | | | 30,841 | | | | 30,919 | | | | 2.6 | % |
| Electrical equipment | | | | | | | | | | | | | | | | | | | | | | | | | | | | | | | | | | | | |
| Westinghouse (Wec US Holdings LTD) | | (8) | | First lien senior secured loan | | | 6.80 | % | | | 2.25 | % | | | - | | | SOFR(M) | | 1/27/2031 | | | 10,035 | | | | 10,046 | | | | 10,033 | | | | 0.8 | % |
See accompanying notes to consolidated financial statements.
Kayne Anderson BDC, Inc.
Consolidated Schedule of Investments
As of December 31, 2024
(amounts in 000’s, except number of shares, units)
| Portfolio Company | | Footnotes (1)(2) | | Investment (3) | | Interest Rate | | | Spread | | | PIK Rate | | | Reference(4) | | Maturity
Date | | Principal /
Par | | | Amortized
Cost(5) | | | Fair
Value | | | Percentage of
Net Assets | |
| Food products | | | | | | | | | | | | | | | | | | | | | | | | | | | | | |
| BC CS 2, L.P. (Cuisine Solutions) | | (6)(11) | | - | | | 12.55 | % | | | 8.00 | % | | | - | | | SOFR(S) | | 7/8/2028 | | | 18,111 | | | | 17,788 | | | | 18,111 | | | | 1.5 | % |
| BR PJK Produce, LLC (Keany) | | | | First lien senior secured loan | | | 10.99 | % | | | 6.25 | % | | | - | | | SOFR(Q) | | 11/14/2027 | | | 29,340 | | | | 28,886 | | | | 29,340 | | | | 2.5 | % |
| | | | | First lien senior secured loan | | | 10.99 | % | | | 6.25 | % | | | - | | | SOFR(Q) | | 11/14/2027 | | | 4,338 | | | | 4,249 | | | | 4,338 | | | | 0.4 | % |
| | | | | First lien senior secured delayed draw loan | | | 10.99 | % | | | 6.25 | % | | | - | | | SOFR(Q) | | 11/14/2027 | | | 4,364 | | | | 4,263 | | | | 4,364 | | | | 0.4 | % |
| | | | | First lien senior secured delayed draw loan | | | 10.99 | % | | | 6.25 | % | | | - | | | SOFR(Q) | | 11/14/2027 | | | 1,418 | | | | 1,395 | | | | 1,418 | | | | 0.1 | % |
| CCFF Buyer, LLC (California Custom Fruits & Flavors, LLC) | | | | First lien senior secured loan | | | 9.77 | % | | | 5.25 | % | | | - | | | SOFR(Q) | | 2/26/2030 | | | 13,896 | | | | 13,587 | | | | 13,896 | | | | 1.2 | % |
| | | | | First lien senior secured delayed draw loan | | | 9.77 | % | | | 5.25 | % | | | - | | | SOFR(Q) | | 2/26/2030 | | | 7,926 | | | | 7,622 | | | | 7,926 | | | | 0.7 | % |
| | | | | First lien senior secured revolving loan | | | 9.77 | % | | | 5.00 | % | | | - | | | SOFR(Q) | | 2/26/2030 | | | - | | | | - | | | | - | | | | 0.0 | % |
| City Line Distributors, LLC | | | | First lien senior secured loan | | | 10.47 | % | | | 6.00 | % | | | - | | | SOFR(M) | | 8/31/2028 | | | 8,806 | | | | 8,634 | | | | 8,894 | | | | 0.7 | % |
| | | | | First lien senior secured delayed draw loan | | | 10.51 | % | | | 6.00 | % | | | - | | | SOFR(M) | | 8/31/2028 | | | 3,608 | | | | 3,550 | | | | 3,645 | | | | 0.3 | % |
| | | | | First lien senior secured revolving loan | | | 10.47 | % | | | 6.00 | % | | | - | | | SOFR(M) | | 8/31/2028 | | | - | | | | - | | | | - | | | | 0.0 | % |
| Gulf Pacific Holdings, LLC | | | | First lien senior secured loan | | | 10.46 | % | | | 6.00 | % | | | - | | | SOFR(M) | | 9/30/2028 | | | 19,976 | | | | 19,703 | | | | 19,576 | | | | 1.7 | % |
| | | | | First lien senior secured delayed draw loan | | | 10.55 | % | | | 6.00 | % | | | - | | | SOFR(M) | | 9/30/2028 | | | 1,684 | | | | 1,684 | | | | 1,651 | | | | 0.1 | % |
| | | | | First lien senior secured revolving loan | | | 10.46 | % | | | 6.00 | % | | | - | | | SOFR(M) | | 9/30/2028 | | | 4,195 | | | | 4,120 | | | | 4,111 | | | | 0.3 | % |
| IF&P Foods, LLC (FreshEdge) | | | | First lien senior secured loan | | | 10.05 | % | | | 5.63 | % | | | - | | | SOFR(Q) | | 7/23/2030 | | | 26,970 | | | | 26,511 | | | | 26,970 | | | | 2.3 | % |
| | | | | First lien senior secured loan | | | 10.43 | % | | | 6.00 | % | | | - | | | SOFR(Q) | | 7/23/2030 | | | 214 | | | | 210 | | | | 214 | | | | 0.0 | % |
| | | | | First lien senior secured loan | | | 10.05 | % | | | 5.63 | % | | | - | | | SOFR(Q) | | 7/23/2030 | | | 712 | | | | 684 | | | | 706 | | | | 0.1 | % |
| | | | | First lien senior secured delayed draw loan | | | 10.05 | % | | | 5.63 | % | | | - | | | SOFR(Q) | | 7/23/2030 | | | 4,004 | | | | 3,941 | | | | 4,004 | | | | 0.3 | % |
| | | | | First lien senior secured revolving loan | | | 10.05 | % | | | 5.63 | % | | | - | | | SOFR(Q) | | 7/23/2030 | | | 2,303 | | | | 2,248 | | | | 2,303 | | | | 0.2 | % |
| J&K Ingredients, LLC | | | | First lien senior secured loan | | | 10.83 | % | | | 6.50 | % | | | - | | | SOFR(Q) | | 11/16/2028 | | | 11,465 | | | | 11,230 | | | | 11,580 | | | | 1.0 | % |
| ML Buyer, LLC (Mama Lycha Foods, LLC) | | | | First lien senior secured loan | | | 9.68 | % | | | 5.25 | % | | | - | | | SOFR(Q) | | 9/9/2029 | | | 11,555 | | | | 11,262 | | | | 11,555 | | | | 1.0 | % |
| | | | | First lien senior secured revolving loan | | | 9.68 | % | | | 5.25 | % | | | - | | | SOFR(Q) | | 9/9/2029 | | | - | | | | - | | | | - | | | | 0.0 | % |
| Siegel Egg Co., LLC | | | | First lien senior secured loan | | | 13.19 | % | | | 6.50 | % | | | 2.00 | % | | SOFR(Q) | | 12/29/2026 | | | 14,651 | | | | 14,541 | | | | 12,600 | | | | 1.1 | % |
| | | | | First lien senior secured revolving loan | | | 13.19 | % | | | 6.50 | % | | | 2.00 | % | | SOFR(Q) | | 12/29/2026 | | | 2,629 | | | | 2,604 | | | | 2,261 | | | | 0.2 | % |
| Worldwide Produce Acquisition, LLC | | | | First lien senior secured delayed draw loan | | | 11.00 | % | | | 6.75 | % | | | - | | | SOFR(S) | | 1/18/2029 | | | 555 | | | | 542 | | | | 544 | | | | 0.0 | % |
| | | | | First lien senior secured delayed draw loan | | | 11.00 | % | | | 6.75 | % | | | - | | | SOFR(S) | | 1/18/2029 | | | 461 | | | | 437 | | | | 452 | | | | 0.0 | % |
| | | | | First lien senior secured revolving loan | | | 11.00 | % | | | 6.75 | % | | | - | | | SOFR(S) | | 1/18/2029 | | | - | | | | - | | | | - | | | | 0.0 | % |
| | | | | First lien senior secured loan | | | 11.00 | % | | | 6.75 | % | | | - | | | SOFR(S) | | 1/18/2029 | | | 2,831 | | | | 2,769 | | | | 2,775 | | | | 0.2 | % |
| | | | | | | | | | | | | | | | | | | | | | | | 196,012 | | | | 192,460 | | | | 193,234 | | | | 16.3 | % |
| Health care providers & services | | | | | | | | | | | | | | | | | | | | | | | | | | | | | | | | | | | | |
| Brightview, LLC | | | | First lien senior secured loan | | | 10.47 | % | | | 6.00 | % | | | - | | | SOFR(M) | | 12/14/2026 | | | 12,738 | | | | 12,729 | | | | 12,611 | | | | 1.1 | % |
| | | | | First lien senior secured delayed draw loan | | | 10.47 | % | | | 6.00 | % | | | - | | | SOFR(M) | | 12/14/2026 | | | 1,701 | | | | 1,699 | | | | 1,684 | | | | 0.1 | % |
| | | | | First lien senior secured revolving loan | | | 10.34 | % | | | 6.00 | % | | | - | | | SOFR(M) | | 12/14/2026 | | | 774 | | | | 771 | | | | 767 | | | | 0.1 | % |
See accompanying notes to consolidated financial statements.
Kayne Anderson BDC, Inc.
Consolidated Schedule of Investments
As of December 31, 2024
(amounts in 000’s, except number of shares, units)
| Portfolio Company | | Footnotes (1)(2) | | Investment (3) | | Interest Rate | | | Spread | | | PIK Rate | | | Reference(4) | | Maturity
Date | | Principal /
Par | | | Amortized
Cost(5) | | | Fair
Value | | | Percentage of
Net Assets | |
| Guardian Dentistry Partners | | | | First lien senior secured loan | | | 9.72 | % | | | 5.25 | % | | | - | | | SOFR(M) | | 8/20/2027 | | | 5,914 | | | | 5,829 | | | | 5,914 | | | | 0.5 | % |
| | | | | First lien senior secured delayed draw loan | | | 9.72 | % | | | 5.25 | % | | | - | | | SOFR(M) | | 8/20/2027 | | | 11,592 | | | | 11,433 | | | | 11,592 | | | | 1.0 | % |
| | | | | First lien senior secured delayed draw loan | | | 9.72 | % | | | 5.25 | % | | | - | | | SOFR(M) | | 8/20/2027 | | | 4,522 | | | | 4,503 | | | | 4,522 | | | | 0.4 | % |
| | | | | First lien senior secured revolving loan | | | 9.72 | % | | | 5.25 | % | | | - | | | SOFR(M) | | 8/20/2027 | | | - | | | | - | | | | - | | | | 0.0 | % |
| Guided Practice Solutions: Dental, LLC (GPS) | | | | First lien senior secured delayed draw loan | | | 10.72 | % | | | 6.25 | % | | | - | | | SOFR(M) | | 11/24/2026 | | | 16,654 | | | | 16,348 | | | | 16,654 | | | | 1.4 | % |
| | | | | First lien senior secured delayed draw loan | | | 10.72 | % | | | 6.25 | % | | | - | | | SOFR(M) | | 11/24/2026 | | | 3,980 | | | | 3,980 | | | | 3,980 | | | | 0.3 | % |
| | | | | First lien senior secured delayed draw loan | | | 10.72 | % | | | 6.25 | % | | | - | | | SOFR(M) | | 11/24/2026 | | | 9,734 | | | | 9,634 | | | | 9,734 | | | | 0.8 | % |
| Light Wave Dental Management LLC | | | | First lien senior secured revolving loan | | | 9.82 | % | | | 5.50 | % | | | - | | | SOFR(Q) | | 6/30/2029 | | | - | | | | - | | | | - | | | | 0.0 | % |
| | | | | First lien senior secured loan | | | 9.82 | % | | | 5.50 | % | | | - | | | SOFR(Q) | | 6/30/2029 | | | 22,198 | | | | 21,583 | | | | 22,198 | | | | 1.9 | % |
| | | | | First lien senior secured loan | | | 9.82 | % | | | 5.50 | % | | | - | | | SOFR(Q) | | 6/30/2029 | | | 494 | | | | 480 | | | | 494 | | | | 0.0 | % |
| | | | | First lien senior secured loan | | | 9.85 | % | | | 5.50 | % | | | - | | | SOFR(Q) | | 6/30/2029 | | | 2,288 | | | | 2,250 | | | | 2,288 | | | | 0.2 | % |
| MVP VIP Borrower, LLC | | | | First lien senior secured loan | | | 10.83 | % | | | 6.50 | % | | | - | | | SOFR(Q) | | 1/3/2029 | | | 19,480 | | | | 19,075 | | | | 19,675 | | | | 1.7 | % |
| | | | | First lien senior secured delayed draw loan | | | 10.83 | % | | | 6.50 | % | | | - | | | SOFR(Q) | | 1/3/2029 | | | 1,571 | | | | 1,539 | | | | 1,587 | | | | 0.1 | % |
| NMA Holdings, LLC (Neuromonitoring Associates) | | | | First lien senior secured loan | | | 9.60 | % | | | 5.25 | % | | | - | | | SOFR(Q) | | 12/18/2030 | | | 16,425 | | | | 16,046 | | | | 16,425 | | | | 1.4 | % |
| | | | | First lien senior secured revolving loan | | | 9.60 | % | | | 5.25 | % | | | - | | | SOFR(Q) | | 12/18/2030 | | | - | | | | - | | | | - | | | | 0.0 | % |
| | | | | First lien senior secured delayed draw loan | | | 9.60 | % | | | 5.25 | % | | | - | | | SOFR(Q) | | 12/18/2030 | | | - | | | | - | | | | - | | | | 0.0 | % |
| Redwood MSO, LLC (Smile Partners) | | | | First lien senior secured loan | | | 9.60 | % | | | 5.25 | % | | | - | | | SOFR(Q) | | 12/20/2029 | | | 11,216 | | | | 10,955 | | | | 11,216 | | | | 1.0 | % |
| | | | | First lien senior secured delayed draw loan | | | 9.60 | % | | | 5.25 | % | | | - | | | SOFR(Q) | | 12/20/2029 | | | - | | | | - | | | | - | | | | 0.0 | % |
| | | | | First lien senior secured revolving loan | | | 11.75 | % | | | 4.25 | % | | | - | | | PRIME | | 12/19/2030 | | | - | | | | - | | | | - | | | | 0.0 | % |
| Refocus Management Services, LLC | | | | First lien senior secured loan | | | 10.75 | % | | | 6.00 | % | | | - | | | SOFR(Q) | | 2/14/2029 | | | 18,221 | | | | 17,736 | | | | 18,221 | | | | 1.5 | % |
| | | | | First lien senior secured delayed draw loan | | | 10.75 | % | | | 6.00 | % | | | - | | | SOFR(Q) | | 2/14/2029 | | | 2,525 | | | | 2,380 | | | | 2,525 | | | | 0.2 | % |
| | | | | First lien senior secured revolving loan | | | 10.75 | % | | | 6.00 | % | | | - | | | SOFR(Q) | | 2/14/2029 | | | - | | | | - | | | | - | | | | 0.0 | % |
| Salt Dental Collective LLC | | | | First lien senior secured delayed draw loan | | | 11.21 | % | | | 6.75 | % | | | - | | | SOFR(Q) | | 2/15/2028 | | | 3,980 | | | | 3,980 | | | | 3,980 | | | | 0.3 | % |
| | | | | | | | | | | | | | | | | | | | | | | | 166,007 | | | | 162,950 | | | | 166,067 | | | | 14.0 | % |
| Health care equipment & supplies | | | | | | | | | | | | | | | | | | | | | | | | | | | | | | | | | | | | |
| LSL Industries, LLC (LSL Healthcare) | | | | First lien senior secured loan | | | 11.78 | % | | | 7.00 | % | | | - | | | SOFR(Q) | | 11/3/2027 | | | 19,084 | | | | 18,518 | | | | 18,655 | | | | 1.6 | % |
| | | | | First lien senior secured delayed draw loan | | | 11.78 | % | | | 7.00 | % | | | - | | | SOFR(Q) | | 11/3/2027 | | | - | | | | - | | | | - | | | | 0.0 | % |
| | | | | First lien senior secured revolving loan | | | 11.78 | % | | | 7.00 | % | | | - | | | SOFR(Q) | | 11/3/2027 | | | - | | | | - | | | | - | | | | 0.0 | % |
| Medline Borrower LP | | (8) | | First lien senior secured loan | | | 6.82 | % | | | 2.25 | % | | | - | | | SOFR(M) | | 10/23/2028 | | | 9,985 | | | | 10,024 | | | | 10,012 | | | | 0.8 | % |
| | | | | | | | | | | | | | | | | | | | | | | | 29,069 | | | | 28,542 | | | | 28,667 | | | | 2.4 | % |
| Hotels, restaurants & leisure | | | | | | | | | | | | | | | | | | | | | | | | | | | | | | | | | | | | |
| Inspire Brands | | (8) | | First lien senior secured loan | | | 6.86 | % | | | 2.50 | % | | | - | | | SOFR(M) | | 12/15/2027 | | | 10,010 | | | | 10,030 | | | | 10,012 | | | | 0.8 | % |
| Restaurant Brands (1011778 BC ULC) | | (6)(8) | | First lien senior secured loan | | | 6.11 | % | | | 1.75 | % | | | - | | | SOFR(M) | | 9/20/2030 | | | 17,369 | | | | 17,387 | | | | 17,264 | | | | 1.5 | % |
| | | | | | | | | | | | | | | | | | | | | | | | 27,379 | | | | 27,417 | | | | 27,276 | | | | 2.3 | % |
See accompanying notes to consolidated financial statements.
Kayne Anderson BDC, Inc.
Consolidated Schedule of Investments
As of December 31, 2024
(amounts in 000’s, except number of shares, units)
| Portfolio Company | | Footnotes (1)(2) | | Investment (3) | | Interest Rate | | | Spread | | | PIK Rate | | | Reference(4) | | Maturity
Date | | Principal /
Par | | | Amortized
Cost(5) | | | Fair
Value | | | Percentage of
Net Assets | |
| Household durables | | | | | | | | | | | | | | | | | | | | | | | | | | | | | |
| Curio Brands, LLC | | | | First lien senior secured loan | | | 9.48 | % | | | 5.00 | % | | | - | | | SOFR(Q) | | 12/21/2027 | | | 16,286 | | | | 16,060 | | | | 16,286 | | | | 1.4 | % |
| | | | | First lien senior secured revolving loan | | | 9.48 | % | | | 5.00 | % | | | - | | | SOFR(Q) | | 12/21/2027 | | | - | | | | - | | | | - | | | | 0.0 | % |
| | | | | First lien senior secured delayed draw loan | | | 9.48 | % | | | 5.00 | % | | | - | | | SOFR(Q) | | 12/21/2027 | | | 3,911 | | | | 3,911 | | | | 3,911 | | | | 0.3 | % |
| | | | | | | | | | | | | | | | | | | | | | | | 20,197 | | | | 19,971 | | | | 20,197 | | | | 1.7 | % |
| Household products | | | | | | | | | | | | | | | | | | | | | | | | | | | | | | | | | | | | |
| Home Brands Group Holdings, Inc. (ReBath) | | | | First lien senior secured loan | | | 9.49 | % | | | 4.75 | % | | | - | | | SOFR(Q) | | 11/8/2026 | | | 15,373 | | | | 15,238 | | | | 15,373 | | | | 1.3 | % |
| | | | | First lien senior secured revolving loan | | | 9.49 | % | | | 4.75 | % | | | - | | | SOFR(Q) | | 11/8/2026 | | | - | | | | - | | | | - | | | | 0.0 | % |
| | | | | | | | | | | | | | | | | | | | | | | | 15,373 | | | | 15,238 | | | | 15,373 | | | | 1.3 | % |
| Insurance | | | | | | | | | | | | | | | | | | | | | | | | | | | | | | | | | | | | |
| Allcat Claims Service, LLC | | | | First lien senior secured loan | | | 10.46 | % | | | 6.00 | % | | | - | | | SOFR(M) | | 7/7/2027 | | | 7,639 | | | | 7,552 | | | | 7,639 | | | | 0.6 | % |
| | | | | First lien senior secured delayed draw loan | | | 10.46 | % | | | 6.00 | % | | | - | | | SOFR(M) | | 7/7/2027 | | | 21,387 | | | | 20,960 | | | | 21,387 | | | | 1.8 | % |
| | | | | First lien senior secured revolving loan | | | 10.69 | % | | | 6.00 | % | | | - | | | SOFR(Q) | | 7/7/2027 | | | - | | | | - | | | | - | | | | 0.0 | % |
| AmWINS Group Inc | | (8) | | First lien senior secured loan | | | 6.72 | % | | | 2.25 | % | | | - | | | SOFR(M) | | 2/22/2028 | | | 9,956 | | | | 9,970 | | | | 9,982 | | | | 0.9 | % |
| | | | | | | | | | | | | | | | | | | | | | | | 38,982 | | | | 38,482 | | | | 39,008 | | | | 3.3 | % |
| IT services | | | | | | | | | | | | | | | | | | | | | | | | | | | | | | | | | | | | |
| Improving Acquisition LLC | | | | First lien senior secured loan | | | 11.00 | % | | | 6.50 | % | | | - | | | SOFR(Q) | | 7/26/2027 | | | 33,616 | | | | 33,198 | | | | 33,616 | | | | 2.8 | % |
| | | | | First lien senior secured revolving loan | | | 11.00 | % | | | 6.50 | % | | | - | | | SOFR(Q) | | 7/26/2027 | | | - | | | | - | | | | - | | | | 0.0 | % |
| | | | | | | | | | | | | | | | | | | | | | | | 33,616 | | | | 33,198 | | | | 33,616 | | | | 2.8 | % |
| Leisure products | | | | | | | | | | | | | | | | | | | | | | | | | | | | | | | | | | | | |
| MacNeill Pride Group Corp. | | | | First lien senior secured loan | | | 11.84 | % | | | 6.75 | % | | | 0.50 | % | | SOFR(Q) | | 4/22/2026 | | | 8,038 | | | | 8,003 | | | | 7,997 | | | | 0.7 | % |
| | | | | First lien senior secured delayed draw loan | | | 11.84 | % | | | 6.75 | % | | | 0.50 | % | | SOFR(Q) | | 4/22/2026 | | | 1,505 | | | | 1,499 | | | | 1,497 | | | | 0.1 | % |
| | | | | First lien senior secured delayed draw loan | | | 11.84 | % | | | 6.75 | % | | | 0.50 | % | | SOFR(Q) | | 4/22/2026 | | | 1,685 | | | | 1,664 | | | | 1,677 | | | | 0.1 | % |
| | | | | First lien senior secured revolving loan | | | 11.34 | % | | | 6.75 | % | | | | | | SOFR(Q) | | 4/22/2026 | | | 599 | | | | 585 | | | | 596 | | | | 0.1 | % |
| Pixel Intermediate, LLC | | (6) | | First lien senior secured loan | | | 10.92 | % | | | 6.50 | % | | | - | | | SOFR(S) | | 2/1/2029 | | | 20,723 | | | | 20,276 | | | | 20,931 | | | | 1.8 | % |
| | | | | First lien senior secured revolving loan | | | 10.83 | % | | | 6.50 | % | | | - | | | SOFR(Q) | | 2/1/2029 | | | 6,989 | | | | 6,810 | | | | 7,059 | | | | 0.6 | % |
| Spinrite, Inc. | | (6) | | First lien senior secured loan | | | 9.83 | % | | | 5.50 | % | | | - | | | SOFR(Q) | | 6/30/2025 | | | 5,118 | | | | 5,096 | | | | 5,118 | | | | 0.4 | % |
| | | | | First lien senior secured revolving loan | | | 9.83 | % | | | 5.50 | % | | | - | | | SOFR(Q) | | 6/30/2025 | | | 3,399 | | | | 3,399 | | | | 3,399 | | | | 0.3 | % |
| TG Parent Newco LLC (Trademark Global LLC) | | (9)(10)(12) | | First lien senior secured loan | | | - | | | | - | | | | - | | | - | | 7/30/2030 | | | 12,623 | | | | 12,623 | | | | 9,972 | | | | 0.8 | % |
| | | | | First lien senior secured revolving loan | | | - | | | | - | | | | - | | | - | | 7/30/2030 | | | 2,815 | | | | 2,815 | | | | 2,224 | | | | 0.2 | % |
| VENUplus, Inc. (f/k/a CTM Group, Inc.) | | | | First lien senior secured loan | | | 11.96 | % | | | 4.75 | % | | | 2.75 | % | | SOFR(Q) | | 11/30/2026 | | | 4,431 | | | | 4,359 | | | | 4,365 | | | | 0.4 | % |
| | | | | | | | | | | | | | | | | | | | | | | | 67,925 | | | | 67,129 | | | | 64,835 | | | | 5.5 | % |
| Machinery | | | | | | | | | | | | | | | | | | | | | | | | | | | | | | | | | | | | |
| MRC Keystone Acquisition LLC (Automated Handing Solutions) | | | | First lien senior secured loan | | | 10.85 | % | | | 6.50 | % | | | - | | | SOFR(Q) | | 12/18/2029 | | | 14,016 | | | | 13,660 | | | | 14,016 | | | | 1.2 | % |
| | | | | First lien senior secured revolving loan | | | 10.85 | % | | | 6.50 | % | | | - | | | SOFR(Q) | | 12/18/2029 | | | - | | | | - | | | | - | | | | 0.0 | % |
| Eppinger Technologies, LLC | | (6) | | First lien senior secured loan | | | 14.48 | % | | | 8.50 | % | | | 1.50 | % | | SOFR(Q) | | 2/4/2026 | | | 24,886 | | | | 24,606 | | | | 24,886 | | | | 2.1 | % |
| | | | | First lien senior secured revolving loan | | | 13.23 | % | | | 7.25 | % | | | 1.50 | % | | SOFR(Q) | | 2/4/2026 | | | 1,371 | | | | 1,332 | | | | 1,371 | | | | 0.1 | % |
| Luxium Solutions, LLC | | | | First lien senior secured loan | | | 10.58 | % | | | 6.25 | % | | | - | | | SOFR(Q) | | 12/1/2027 | | | 3,815 | | | | 3,766 | | | | 3,815 | | | | 0.3 | % |
| | | | | First lien senior secured loan | | | 10.58 | % | | | 6.25 | % | | | - | | | SOFR(Q) | | 12/1/2027 | | | 4,697 | | | | 4,637 | | | | 4,697 | | | | 0.4 | % |
| | | | | First lien senior secured delayed draw loan | | | 10.58 | % | | | 6.25 | % | | | - | | | SOFR(Q) | | 12/1/2027 | | | 1,233 | | | | 1,220 | | | | 1,233 | | | | 0.1 | % |
See accompanying notes to consolidated financial statements.
Kayne Anderson BDC, Inc.
Consolidated Schedule of Investments
As of December 31, 2024
(amounts in 000’s, except number of shares, units)
| Portfolio Company | | Footnotes (1)(2) | | Investment (3) | | Interest Rate | | | Spread | | | PIK Rate | | | Reference(4) | | Maturity
Date | | Principal /
Par | | | Amortized
Cost(5) | | | Fair
Value | | | Percentage of
Net Assets | |
| PVI Holdings, Inc | | | | First lien senior secured loan | | | 9.68 | % | | | 4.94 | % | | | - | | | SOFR(Q) | | 1/18/2028 | | | 23,653 | | | | 23,423 | | | | 23,653 | | | | 2.0 | % |
| | | | | | | | | | | | | | | | | | | | | | | | 73,671 | | | | 72,644 | | | | 73,671 | | | | 6.2 | % |
| Media | | | | | | | | | | | | | | | | | | | | | | | | | | | | | | | | | | | | |
| Directv Financing LLC | | (8) | | First lien senior secured loan | | | 9.85 | % | | | 5.00 | % | | | - | | | SOFR(Q) | | 8/2/2027 | | | 16,154 | | | | 16,244 | | | | 16,182 | | | | 1.4 | % |
| | | | | | | | | | | | | | | | | | | | | | | | | | | | | | | | | | | | | |
| Personal care products | | | | | | | | | | | | | | | | | | | | | | | | | | | | | | | | | | | | |
| DRS Holdings III, Inc. (Dr. Scholl's) | | | | First lien senior secured loan | | | 10.71 | % | | | 6.25 | % | | | - | | | SOFR(M) | | 11/1/2025 | | | 10,618 | | | | 10,596 | | | | 10,618 | | | | 0.9 | % |
| | | | | First lien senior secured revolving loan | | | 10.71 | % | | | 6.25 | % | | | - | | | SOFR(M) | | 11/1/2025 | | | - | | | | - | | | | - | | | | 0.0 | % |
| PH Beauty Holdings III, Inc. | | | | First lien senior secured loan | | | 10.17 | % | | | 5.00 | % | | | - | | | SOFR(S) | | 9/28/2025 | | | 10,496 | | | | 10,422 | | | | 10,496 | | | | 0.9 | % |
| Phoenix YW Buyer, Inc. (Elida Beauty) | | | | First lien senior secured loan | | | 9.33 | % | | | 5.00 | % | | | - | | | SOFR(Q) | | 5/31/2030 | | | 11,013 | | | | 10,747 | | | | 11,013 | | | | 0.9 | % |
| | | | | First lien senior secured revolving loan | | | 9.33 | % | | | 5.00 | % | | | - | | | SOFR(Q) | | 5/31/2030 | | | - | | | | - | | | | - | | | | 0.0 | % |
| Silk Holdings III Corp. (Suave) | | | | First lien senior secured loan | | | 9.83 | % | | | 5.50 | % | | | - | | | SOFR(Q) | | 5/1/2029 | | | 19,700 | | | | 18,899 | | | | 19,700 | | | | 1.7 | % |
| | | | | First lien senior secured loan | | | 9.83 | % | | | 5.50 | % | | | - | | | SOFR(Q) | | 5/1/2029 | | | 12,908 | | | | 12,674 | | | | 12,908 | | | | 1.1 | % |
| | | | | First lien senior secured revolving loan | | | 8.33 | % | | | 4.00 | % | | | - | | | SOFR(Q) | | 5/1/2029 | | | 8,333 | | | | 8,062 | | | | 8,333 | | | | 0.7 | % |
| | | | | | | | | | | | | | | | | | | | | | | | 73,068 | | | | 71,400 | | | | 73,068 | | | | 6.2 | % |
| Pharmaceuticals | | | | | | | | | | | | | | | | | | | | | | | | | | | | | | | | | | | | |
| Foundation Consumer Brands LLC | | | | First lien senior secured loan | | | 10.89 | % | | | 6.25 | % | | | - | | | SOFR(Q) | | 2/12/2027 | | | 6,358 | | | | 6,334 | | | | 6,358 | | | | 0.5 | % |
| | | | | First lien senior secured revolving loan | | | 10.89 | % | | | 6.25 | % | | | - | | | SOFR(Q) | | 2/12/2027 | | | - | | | | - | | | | - | | | | 0.0 | % |
| Jazz Pharmaceuticals Inc. | | (6)(8) | | First lien senior secured loan | | | 6.61 | % | | | 2.25 | % | | | - | | | SOFR(M) | | 5/5/2028 | | | 17,301 | | | | 17,407 | | | | 17,334 | | | | 1.5 | % |
| Organon & Co | | (6)(8) | | First lien senior secured loan | | | 6.60 | % | | | 2.25 | % | | | - | | | SOFR(Q) | | 5/19/2031 | | | 12,440 | | | | 12,411 | | | | 12,455 | | | | 1.0 | % |
| | | | | | | | | | | | | | | | | | | | | | | | 36,099 | | | | 36,152 | | | | 36,147 | | | | 3.0 | % |
| Professional services | | | | | | | | | | | | | | | | | | | | | | | | | | | | | | | | | | | | |
| 4 Over International, LLC | | | | First lien senior secured loan | | | 11.46 | % | | | 7.00 | % | | | - | | | SOFR(M) | | 12/7/2026 | | | 18,851 | | | | 18,376 | | | | 18,662 | | | | 1.6 | % |
| DISA Holdings Corp. (DISA) | | | | First lien senior secured delayed draw loan | | | 9.50 | % | | | 5.00 | % | | | - | | | SOFR(Q) | | 9/9/2028 | | | 8,320 | | | | 8,174 | | | | 8,320 | | | | 0.7 | % |
| | | | | First lien senior secured delayed draw loan | | | 9.40 | % | | | 5.00 | % | | | - | | | SOFR(Q) | | 9/9/2028 | | | 125 | | | | 83 | | | | 125 | | | | 0.0 | % |
| | | | | First lien senior secured revolving loan | | | 9.40 | % | | | 5.00 | % | | | - | | | SOFR(Q) | | 9/9/2028 | | | - | | | | - | | | | - | | | | 0.0 | % |
| | | | | First lien senior secured loan | | | 9.50 | % | | | 5.00 | % | | | - | | | SOFR(Q) | | 9/9/2028 | | | 1,311 | | | | 1,294 | | | | 1,311 | | | | 0.1 | % |
| | | | | First lien senior secured loan | | | 9.50 | % | | | 5.00 | % | | | - | | | SOFR(Q) | | 9/9/2028 | | | 21,953 | | | | 21,505 | | | | 21,953 | | | | 1.9 | % |
| Dun & Bradstreet Corp | | (8) | | First lien senior secured loan | | | 6.59 | % | | | 2.25 | % | | | - | | | SOFR(M) | | 1/18/2029 | | | 9,985 | | | | 9,995 | | | | 9,986 | | | | 0.8 | % |
| Envirotech Services, LLC | | | | First lien senior secured loan | | | 10.34 | % | | | 6.00 | % | | | - | | | SOFR(Q) | | 1/18/2029 | | | 33,046 | | | | 32,290 | | | | 33,046 | | | | 2.8 | % |
| | | | | First lien senior secured loan | | | 10.35 | % | | | 6.00 | % | | | - | | | SOFR(Q) | | 1/18/2029 | | | 124 | | | | 122 | | | | 124 | | | | 0.0 | % |
| | | | | First lien senior secured revolving loan | | | 10.34 | % | | | 6.00 | % | | | - | | | SOFR(Q) | | 1/18/2029 | | | - | | | | - | | | | - | | | | 0.0 | % |
| | | | | | | | | | | | | | | | | | | | | | | | 93,715 | | | | 91,839 | | | | 93,527 | | | | 7.9 | % |
| Semiconductors & semiconductor equipment | | | | | | | | | | | | | | | | | | | | | | | | | | | | | | | | | | | | |
| MKS Instruments Inc. | | (6)(8) | | First lien senior secured loan | | | 6.59 | % | | | 2.25 | % | | | - | | | SOFR(M) | | 8/17/2029 | | | 11,823 | | | | 11,871 | | | | 11,846 | | | | 1.0 | % |
| | | | | | | | | | | | | | | | | | | | | | | | | | | | | | | | | | | | | |
| Specialty retail | | | | | | | | | | | | | | | | | | | | | | | | | | | | | | | | | | | | |
| Great Outdoors Group, LLC | | (8) | | First lien senior secured loan | | | 8.22 | % | | | 3.75 | % | | | - | | | SOFR(M) | | 3/6/2028 | | | 17,321 | | | | 17,361 | | | | 17,382 | | | | 1.5 | % |
See accompanying notes to consolidated financial statements.
Kayne Anderson BDC, Inc.
Consolidated Schedule of Investments
As of December 31, 2024
(amounts in 000’s, except number of shares, units)
| Portfolio Company | | Footnotes (1)(2) | | Investment (3) | | Interest Rate | | | Spread | | | PIK Rate | | | Reference(4) | | Maturity
Date | | Principal /
Par | | | Amortized
Cost(5) | | | Fair
Value | | | Percentage of
Net Assets | |
| Harbor Freight Tools USA Inc | | (8) | | First lien senior secured loan | | | 6.86 | % | | | 2.75 | % | | | - | | | SOFR(M) | | 10/19/2027 | | | 17,456 | | | | 17,424 | | | | 17,198 | | | | 1.4 | % |
| Sundance Holdings Group, LLC | | (7)(9)(10) | | First lien senior secured loan | | | - | | | | - | | | | - | | | - | | 6/30/2025 | | | 9,414 | | | | 9,412 | | | | 6,590 | | | | 0.5 | % |
| | | | | First lien senior secured delayed draw loan | | | - | | | | - | | | | - | | | - | | 6/30/2025 | | | 444 | | | | 444 | | | | 657 | | | | 0.1 | % |
| | | | | | | | | | | | | | | | | | | | | | | | 44,635 | | | | 44,641 | | | | 41,827 | | | | 3.5 | % |
| Textiles, apparel & luxury goods | | | | | | | | | | | | | | | | | | | | | | | | | | | | | | | | | | | | |
| American Soccer Company, Incorporated (SCORE) | | | | First lien senior secured loan | | | 14.73 | % | | | 7.25 | % | | | 3.00 | % | | SOFR(Q) | | 7/20/2027 | | | 27,799 | | | | 26,870 | | | | 27,799 | | | | 2.3 | % |
| | | | | First lien senior secured revolving loan | | | 14.73 | % | | | 7.25 | % | | | 3.00 | % | | SOFR(Q) | | 7/20/2027 | | | 2,136 | | | | 1,986 | | | | 2,136 | | | | 0.2 | % |
| BEL USA, LLC | | | | First lien senior secured loan | | | 11.67 | % | | | 7.00 | % | | | - | | | SOFR(Q) | | 6/2/2026 | | | 5,503 | | | | 5,427 | | | | 5,379 | | | | 0.5 | % |
| | | | | First lien senior secured loan | | | 11.67 | % | | | 7.00 | % | | | - | | | SOFR(Q) | | 6/2/2026 | | | 90 | | | | 89 | | | | 88 | | | | 0.0 | % |
| YS Garments, LLC | | | | First lien senior secured loan | | | 12.25 | % | | | 7.50 | % | | | - | | | SOFR(Q) | | 8/9/2026 | | | 6,263 | | | | 6,210 | | | | 6,075 | | | | 0.5 | % |
| | | | | | | | | | | | | | | | | | | | | | | | 41,791 | | | | 40,582 | | | | 41,477 | | | | 3.5 | % |
| Trading companies & distributors | | | | | | | | | | | | | | | | | | | | | | | | | | | | | | | | | | | | |
AIDC Intermediate Co 2, LLC (Peak Technologies) | | | | First lien senior secured loan | | | 9.59 | % | | | 5.25 | % | | | - | | | SOFR(M) | | 7/22/2027 | | | 34,300 | | | | 33,591 | | | | 34,129 | | | | 2.9 | % |
| TL Alpine Holding Corp. (Air Distribution Technologies Inc.) | | | | First lien senior secured loan | | | 10.55 | % | | | 6.00 | % | | | - | | | SOFR(M) | | 8/1/2030 | | | 18,253 | | | | 17,905 | | | | 18,435 | | | | 1.5 | % |
| BCDI Meteor Acquisition, LLC (Meteor) | | | | First lien senior secured loan | | | 11.43 | % | | | 7.00 | % | | | - | | | SOFR(Q) | | 6/29/2028 | | | 16,133 | | | | 15,859 | | | | 16,133 | | | | 1.3 | % |
| | | | | First lien senior secured loan | | | 11.43 | % | | | 7.00 | % | | | - | | | SOFR(Q) | | 6/29/2028 | | | 2,223 | | | | 2,180 | | | | 2,223 | | | | 0.2 | % |
| CGI Automated Manufacturing, LLC | | | | First lien senior secured loan | | | 11.59 | % | | | 7.00 | % | | | - | | | SOFR(Q) | | 12/17/2026 | | | 16,979 | | | | 16,565 | | | | 16,979 | | | | 1.4 | % |
| | | | | First lien senior secured loan | | | 11.59 | % | | | 7.00 | % | | | - | | | SOFR(Q) | | 12/17/2026 | | | 3,104 | | | | 3,041 | | | | 3,104 | | | | 0.3 | % |
| | | | | First lien senior secured loan | | | 11.59 | % | | | 7.00 | % | | | - | | | SOFR(Q) | | 12/17/2026 | | | 6,542 | | | | 6,447 | | | | 6,542 | | | | 0.5 | % |
| | | | | First lien senior secured delayed draw loan | | | 11.59 | % | | | 7.00 | % | | | - | | | SOFR(Q) | | 12/17/2026 | | | 3,541 | | | | 3,467 | | | | 3,541 | | | | 0.3 | % |
| | | | | First lien senior secured revolving loan | | | 11.59 | % | | | 7.00 | % | | | - | | | SOFR(Q) | | 12/17/2026 | | | 479 | | | | 421 | | | | 479 | | | | 0.0 | % |
| Dusk Acquisition II Corporation (Motors & Armatures, Inc. – MARS) | | | | First lien senior secured loan | | | 10.33 | % | | | 6.00 | % | | | - | | | SOFR(Q) | | 7/12/2029 | | | 26,133 | | | | 25,663 | | | | 26,133 | | | | 2.2 | % |
| | | | | First lien senior secured loan | | | 10.33 | % | | | 6.00 | % | | | - | | | SOFR(Q) | | 7/12/2029 | | | 13,801 | | | | 13,500 | | | | 13,801 | | | | 1.2 | % |
| Energy Acquisition LP (Electrical Components International, Inc. - ECI) | | | | First lien senior secured loan | | | 11.28 | % | | | 6.50 | % | | | - | | | SOFR(Q) | | 5/10/2029 | | | 26,149 | | | | 25,672 | | | | 26,541 | | | | 2.2 | % |
| | | | | First lien senior secured delayed draw loan | | | 11.28 | % | | | 6.50 | % | | | - | | | SOFR(Q) | | 5/11/2026 | | | - | | | | - | | | | - | | | | 0.0 | % |
| Engineered Fastener Company, LLC (EFC International) | | | | First lien senior secured loan | | | 10.98 | % | | | 6.50 | % | | | - | | | SOFR(Q) | | 11/1/2027 | | | 23,366 | | | | 22,986 | | | | 23,471 | | | | 2.0 | % |
| Genuine Cable Group, LLC | | | | First lien senior secured loan | | | 10.21 | % | | | 5.75 | % | | | - | | | SOFR(M) | | 11/1/2026 | | | 28,763 | | | | 28,285 | | | | 28,691 | | | | 2.4 | % |
| | | | | First lien senior secured loan | | | 10.21 | % | | | 5.75 | % | | | - | | | SOFR(M) | | 11/1/2026 | | | 5,450 | | | | 5,348 | | | | 5,436 | | | | 0.5 | % |
See accompanying notes to consolidated financial statements.
Kayne Anderson BDC, Inc.
Consolidated Schedule of Investments
As of December 31, 2024
(amounts in 000’s, except number of shares, units)
| Portfolio Company | | Footnotes (1)(2) | | Investment (3) | | Interest Rate | | | Spread | | | PIK Rate | | | Reference(4) | | Maturity
Date | | Principal /
Par | | | Amortized
Cost(5) | | | Fair
Value | | | Percentage of
Net Assets | |
| I.D. Images Acquisition, LLC | | | | First lien senior secured loan | | | 10.11 | % | | | 5.75 | % | | | - | | | SOFR(M) | | 7/30/2027 | | | 5,652 | | | | 5,572 | | | | 5,652 | | | | 0.5 | % |
| | | | | First lien senior secured loan | | | 10.11 | % | | | 5.75 | % | | | - | | | SOFR(M) | | 7/30/2027 | | | 7,854 | | | | 7,792 | | | | 7,854 | | | | 0.7 | % |
| | | | | First lien senior secured loan | | | 10.11 | % | | | 5.75 | % | | | - | | | SOFR(M) | | 7/30/2027 | | | 4,474 | | | | 4,423 | | | | 4,474 | | | | 0.4 | % |
| | | | | First lien senior secured loan | | | 10.11 | % | | | 5.75 | % | | | - | | | SOFR(M) | | 7/30/2027 | | | 1,032 | | | | 1,024 | | | | 1,032 | | | | 0.1 | % |
| | | | | First lien senior secured delayed draw loan | | | 10.11 | % | | | 5.75 | % | | | - | | | SOFR(M) | | 7/30/2027 | | | 2,459 | | | | 2,407 | | | | 2,459 | | | | 0.2 | % |
| | | | | First lien senior secured revolving loan | | | 10.11 | % | | | 5.75 | % | | | - | | | SOFR(M) | | 7/30/2027 | | | - | | | | - | | | | - | | | | 0.0 | % |
| Krayden Holdings, Inc. | | | | First lien senior secured delayed draw loan | | | 9.11 | % | | | 4.75 | % | | | - | | | SOFR(M) | | 3/1/2029 | | | - | | | | - | | | | - | | | | 0.0 | % |
| | | | | First lien senior secured revolving loan | | | 9.11 | % | | | 4.75 | % | | | - | | | SOFR(M) | | 3/1/2029 | | | - | | | | - | | | | - | | | | 0.0 | % |
| | | | | First lien senior secured loan | | | 9.11 | % | | | 4.75 | % | | | - | | | SOFR(M) | | 3/1/2029 | | | 9,395 | | | | 9,110 | | | | 9,395 | | | | 0.8 | % |
| OAO Acquisitions, Inc. (BearCom) | | | | First lien senior secured loan | | | 9.98 | % | | | 5.50 | % | | | - | | | SOFR(M) | | 12/27/2029 | | | 21,210 | | | | 20,932 | | | | 21,210 | | | | 1.8 | % |
| | | | | First lien senior secured loan | | | 9.87 | % | | | 5.50 | % | | | - | | | SOFR(M) | | 12/27/2029 | | | 857 | | | | 849 | | | | 857 | | | | 0.1 | % |
| | | | | First lien senior secured delayed draw loan | | | 9.87 | % | | | 5.50 | % | | | - | | | SOFR(M) | | 12/27/2025 | | | 4,498 | | | | 4,420 | | | | 4,498 | | | | 0.4 | % |
| | | | | First lien senior secured revolving loan | | | 9.87 | % | | | 5.50 | % | | | - | | | SOFR(M) | | 12/27/2029 | | | - | | | | - | | | | - | | | | 0.0 | % |
| Univar (Windsor Holdings LLC) | | (8) | | First lien senior secured loan | | | 7.86 | % | | | 3.50 | % | | | - | | | SOFR(M) | | 8/1/2030 | | | 9,960 | | | | 10,018 | | | | 10,065 | | | | 0.8 | % |
| Workholding US Holdings, LLC (Forkardt Hardinge) | | | | First lien senior secured loan | | | 10.13 | % | | | 5.50 | % | | | - | | | SOFR(Q) | | 10/23/2029 | | | 7,377 | | | | 7,208 | | | | 7,377 | | | | 0.6 | % |
| | | | | First lien senior secured revolving loan | | | 10.09 | % | | | 5.50 | % | | | - | | | SOFR(Q) | | 10/23/2029 | | | 555 | | | | 484 | | | | 555 | | | | 0.1 | % |
| | | | | | | | | | | | | | | | | | | | | | | | 300,539 | | | | 295,169 | | | | 301,066 | | | | 25.4 | % |
| Wireless telecommunication services | | | | | | | | | | | | | | | | | | | | | | | | | | | | | | | | | | | | |
| Centerline Communications, LLC | | | | First lien senior secured loan | | | 12.12 | % | | | 6.00 | % | | | 1.50 | % | | SOFR(Q) | | 8/10/2027 | | | 5,884 | | | | 5,770 | | | | 5,413 | | | | 0.5 | % |
| | | | | First lien senior secured loan | | | 12.12 | % | | | 6.00 | % | | | 1.50 | % | | SOFR(Q) | | 8/10/2027 | | | 854 | | | | 835 | | | | 854 | | | | 0.1 | % |
| | | | | First lien senior secured loan | | | 12.12 | % | | | 6.00 | % | | | 1.50 | % | | SOFR(Q) | | 8/10/2027 | | | 9,109 | | | | 8,984 | | | | 8,380 | | | | 0.7 | % |
| | | | | First lien senior secured delayed draw loan | | | 12.12 | % | | | 6.00 | % | | | 1.50 | % | | SOFR(Q) | | 8/10/2027 | | | 7,066 | | | | 6,984 | | | | 6,501 | | | | 0.5 | % |
| | | | | First lien senior secured delayed draw loan | | | 12.15 | % | | | 6.00 | % | | | 1.50 | % | | SOFR(Q) | | 8/10/2027 | | | 6,220 | | | | 6,140 | | | | 5,722 | | | | 0.5 | % |
| | | | | First lien senior secured revolving loan | | | 12.00 | % | | | 6.00 | % | | | 1.50 | % | | SOFR(Q) | | 8/10/2027 | | | 1,824 | | | | 1,796 | | | | 1,678 | | | | 0.1 | % |
| | | | | First lien senior secured loan | | | 12.16 | % | | | 6.00 | % | | | 1.50 | % | | SOFR(Q) | | 8/10/2027 | | | 1,023 | | | | 1,000 | | | | 941 | | | | 0.1 | % |
| | | | | | | | | | | | | | | | | | | | | | | | 31,980 | | | | 31,509 | | | | 29,489 | | | | 2.5 | % |
| Total Debt Investments | | | | | | | | | | | | | | | | | | | | | | | 1,984,672 | | | | 1,952,708 | | | | 1,972,406 | | | | 166.3 | % |
See accompanying notes to consolidated financial statements.
Kayne Anderson BDC, Inc.
Consolidated Schedule of Investments
As of December 31, 2024
(amounts in 000’s, except number of shares, units)
| | | Footnotes (1)(2) | | Acquisition
Date | | Number of
Shares/Units | | | Cost | | | Fair
Value | | | Percentage of
Net Assets | |
| Equity Investments(10)(13) | | | | | | | | | | | | | | | | |
| Automobile components | | | | | | | | | | | | | | | | |
| Vehicle Accessories, Inc. - Class A common | | (14) | | 2/25/2022 | | | 128,250 | | | | - | | | | 589 | | | | 0.1 | % |
| Vehicle Accessories, Inc. - preferred | | (14) | | 2/25/2022 | | | 250,000 | | | | 250 | | | | 318 | | | | 0.0 | % |
| | | | | | | | | | | | 250 | | | | 907 | | | | 0.1 | % |
| Building Products | | | | | | | | | | | | | | | | | | | | |
| US Anchors Investor, LP - preferred | | (15) | | 7/15/2024 | | | 500,000 | | | | 500 | | | | 500 | | | | 0.0 | % |
| US Anchors Investor, LP - Class A Common | | (15) | | 7/15/2024 | | | 500,000 | | | | - | | | | - | | | | 0.0 | % |
| | | | | | | | | | | | 500 | | | | 500 | | | | 0.0 | % |
| Commercial services & supplies | | | | | | | | | | | | | | | | | | | | |
| American Equipment Holdings LLC - Class A units | | (16) | | 4/8/2022 | | | 426 | | | | 284 | | | | 570 | | | | 0.1 | % |
| Arborworks Acquisition LLC - Class A preferred units | | (15) | | 11/6/2023 | | | 21,716 | | | | 9,179 | | | | 11,114 | | | | 0.9 | % |
| Arborworks Acquisition LLC - Class B preferred units | | (15) | | 11/6/2023 | | | 21,716 | | | | - | | | | - | | | | 0.0 | % |
| Arborworks Acquisition LLC - Class A common units | | (15) | | 11/6/2023 | | | 2,604 | | | | - | | | | - | | | | 0.0 | % |
| Bloomington Holdings, LP (BW Fusion) - Class A1 common units | | (15) | | 11/5/2024 | | | 500 | | | | 500 | | | | 500 | | | | 0.0 | % |
| BLP Buyer, Inc. (Bishop Lifting Products) - Class A common | | (17) | | 2/1/2022 | | | 582,469 | | | | 652 | | | | 1,097 | | | | 0.1 | % |
| | | | | | | | | | | | 10,615 | | | | 13,281 | | | | 1.1 | % |
| Containers & packaging | | | | | | | | | | | | | | | | | | | | |
| Robinette Company Acquisition, LLC - Class A common units | | (15) | | 5/10/2024 | | | 9 | | | | - | | | | 83 | | | | 0.0 | % |
| Robinette Company Acquisition, LLC - Class A preferred units | | (15) | | 5/10/2024 | | | 500 | | | | 500 | | | | 515 | | | | 0.1 | % |
| | | | | | | | | | | | 500 | | | | 598 | | | | 0.1 | % |
| Food products | | | | | | | | | | | | | | | | | | | | |
| BC CS 2, L.P. (Cuisine Solutions) | | (6)(11) | | 7/8/2022 | | | 2,000,000 | | | | 2,000 | | | | 3,062 | | | | 0.3 | % |
| CCFF Parent, LLC (California Custom Fruits & Flavors, LLC) - Class A-1 units | | (15) | | 2/26/2024 | | | 750 | | | | 511 | | | | 936 | | | | 0.1 | % |
| City Line Distributors, LLC - Class A units | | (15) | | 8/31/2023 | | | 669,866 | | | | 670 | | | | 518 | | | | 0.0 | % |
| Gulf Pacific Holdings, LLC - Class A common | | (16) | | 9/30/2022 | | | 250 | | | | 250 | | | | 46 | | | | 0.0 | % |
| Gulf Pacific Holdings, LLC - Class C common | | (16) | | 9/30/2022 | | | 250 | | | | - | | | | - | | | | 0.0 | % |
| IF&P Foods, LLC (FreshEdge) - Class A preferred | | (16) | | 10/3/2022 | | | 773 | | | | 773 | | | | 908 | | | | 0.1 | % |
| IF&P Foods, LLC (FreshEdge) - Class B common | | (16) | | 10/3/2022 | | | 750 | | | | - | | | | - | | | | 0.0 | % |
| ML Buyer, LLC (Mama Lycha Foods, LLC) - Class A units | | (15) | | 9/9/2024 | | | 250 | | | | 250 | | | | 250 | | | | 0.0 | % |
| Siegel Parent, LLC - Common | | (18) | | 12/29/2021 | | | 250 | | | | 250 | | | | - | | | | 0.0 | % |
| Siegel Egg Co., LLC - Convertible Note | | (18) | | 1/19/2024 | | | 28 | | | | 28 | | | | 16 | | | | 0.0 | % |
| | | | | | | | | | | | 4,732 | | | | 5,736 | | | | 0.5 | % |
| Health care equipment & supplies | | | | | | | | | | | | | | | | | | | | |
| LSL Industries, LLC (LSL Healthcare) - common | | (16) | | 11/1/2022 | | | 7,500 | | | | 750 | | | | 274 | | | | 0.0 | % |
| | | | | | | | | | | | | | | | | | | | | |
| Health care providers & services | | | | | | | | | | | | | | | | | | | | |
| NMA Super Holdings, LLC (BW Fusion) - Class A membership interests | | (15) | | 12/18/2024 | | | 1,000,000 | | | | 1,000 | | | | 1,000 | | | | 0.1 | % |
| | | | | | | | | | | | | | | | | | | | | |
| Leisure products | | | | | | | | | | | | | | | | | | | | |
| TG Parent Newco LLC (Trademark Global LLC) – common | | (10)(12)(15) | | 9/16/2024 | | | 8 | | | | - | | | | - | | | | 0.0 | % |
| | | | | | | | | | | | | | | | | | | | | |
| Specialty retail | | | | | | | | | | | | | | | | | | | | |
| Sundance Direct Holdings, Inc. - common | | | | 10/27/2023 | | | 21,479 | | | | - | | | | - | | | | 0.0 | % |
| Textiles, apparel & luxury goods | | | | | | | | | | | | | | | | | | | | |
| American Soccer Company, Incorporated (SCORE) - common | | (18) | | 7/20/2022 | | | 1,000,000 | | | | 1,000 | | | | 441 | | | | 0.0 | % |
| Total Equity Investments | | | | | | | | | | | 19,347 | | | | 22,737 | | | | 1.9 | % |
| Total Debt and Equity Investments | | | | | | | | | | | 1,972,055 | | | | 1,995,143 | | | | 168.2 | % |
| | | | | | | | | | | | | | | | | | | | | |
| | | | | | | Number of Shares | | | Cost | | | Fair Value | | | Percentage of Net Assets | |
| Short-Term Investments | | | | | | | | | | | | | | | | |
| Morgan Stanley Institutional Liquidity Fund, Institutional Class, 4.24% | | (19) | | | | | 48,683,210 | | | | 48,683 | | | | 48,683 | | | | 4.1 | % |
| Total Short-Term Investments | | | | | | | 48,683,210 | | | | 48,683 | | | | 48,683 | | | | 4.1 | % |
| | | | | | | | | | | | | | | | | | | | | |
| Total Investments | | | | | | | | | | $ | 2,020,738 | | | $ | 2,043,826 | | | | 172.3 | % |
| | | | | | | | | | | | | | | | | | | | | |
| Liabilities in Excess of Other Assets | | | | | | | | | | | | | | | (857,484 | ) | | | (72.3 | )% |
| Net Assets | | | | | | | | | | | | | | $ | 1,186,342 | | | | 100.0 | % |
| (1) | As of December 31, 2024, unless otherwise noted, investments are non-controlled, non-affiliated investments. Non-controlled, non-affiliated investments are defined as investments in which the Company owns less than 5% of the portfolio company’s outstanding voting securities and does not have the power to exercise control over the management or policies of such portfolio company. As of December 31, 2024, the total value of the Company’s non-controlled, non-affiliated investments was $1,982,947. |
See accompanying notes to consolidated financial statements.
Kayne Anderson BDC, Inc.
Consolidated Schedule of Investments
As of December 31, 2024
(amounts in 000’s, except number of shares, units)
| (2) | Unless otherwise noted, security is a Level 3 holding. As of December 31, 2024, the aggregate value of Level 3 securities held by the Company was $1,741,919. See Note 5 – Fair Value. |
| (3) | Debt investments are pledged to the Company’s credit facilities, and a single debt investment may be divided into parts that are individually pledged to separate credit facilities. |
| (4) | Unless otherwise noted, all loans contain a variable rate structure, that may be subject to an interest rate floor. Variable rate loans bear interest at a rate that may be determined by reference to either the Secured Overnight Financing Rate (“SOFR”) (which can include one-(M), three-(Q) or six-month (S) SOFR), or an alternate base rate (which can include the Federal Funds Effective Rate or the Prime Rate). |
| (5) | The amortized cost represents the original cost adjusted for the amortization of discounts and premiums, as applicable, on debt investments using the effective interest method. |
| (6) | Non-qualifying investment as defined by Section 55(a) of the Investment Company Act of 1940. The Company may not acquire any non-qualifying asset unless, at the time of acquisition, qualifying assets represent at least 70% of the Company’s total assets. As of December 31, 2024, 9.0% of the Company’s total assets were in non-qualifying investments. |
| (7) | The Company may be entitled to receive additional interest as a result of an arrangement with other lenders in the syndication. In exchange for the higher interest rate, the “last-out” portion is at a greater risk of loss. Certain lenders represent a “first out” portion of the investment and have priority to the “last-out” portion with respect to payments of principal and interest. |
| (8) | Security is a Level 2 holding. As of December 31, 2024, the aggregate value of Level 2 securities held by the Company was $253,224. See Note 5 – Fair Value. |
| (9) | Debt investment on non-accrual status as of December 31, 2024. |
| (10) | Non-income producing investment. |
| (11) | The Company has a senior secured loan in an investment vehicle (BC CS 2, L.P.) that is collateralized by a preferred stock investment in Cuisine Solutions, Inc. This investment is characterized as subordinated debt. |
| (12) | In September 2024, the Company completed a restructure of the investment in Trademark Global LLC whereby the existing term loan and revolver became a restructured term loan and revolver and no debt was converted to equity. The Company did receive new common units in TG Parent Newco LLC for which it owns 6.23% of the overall business (Kayne Anderson entities as a whole own 20.77%). As of December 31, 2024, the amortized cost basis of Trademark Global LLC was $15,438 and was 0.8% of the total amortized cost basis of our debt investments of $1,952,708. The restructure extended the maturity from July 30, 2024 to July 30, 2030; the rate changed from S + 5.75% to S + 8.50%. |
See accompanying notes to consolidated financial statements.
Kayne Anderson BDC, Inc.
Consolidated Schedule of Investments
As of December 31, 2024
(amounts in 000’s, except number of shares, units)
As defined in the 1940 Act, the Company is deemed to be an “affiliated person” of this portfolio company as the Company owns more than 5% but less than 25% of the portfolio company’s voting securities or has the power to exercise control over management or policies of such portfolio company, including through a management agreement (“non-controlled affiliate”). As of December 31, 2024, the total value of the Company’s non-controlled affiliated investments was $12,196. Transactions related to the Company’s investment in a non-controlled affiliate for the period December 31, 2024 were as follows:
| Investment(1) | | Value at 12/30/2023 | | | Gross Additions(a) | | | Gross Reductions (b) | | | Net Change in Unrealized Gains(Losses) | | | Value at 12/31/2024 | | | Interest and PIK Income | | | Dividend Income | | | Other Income | |
| | | | | | | | | | | | | | | | | | | | | | | | | |
| Trademark Global, LLC | | $ | 13,129 | | | $ | 1,035 | | | $ | - | | | $ | (1,968 | ) | | $ | 12,196 | | | $ | 754 | | | $ | - | | | $ | - | |
| TG Parent Newco LLC (Trademark Global LLC) | | | - | | | | - | | | | - | | | | - | | | | - | | | | - | | | | - | | | | - | |
| Total | | $ | 13,129 | | | $ | 1,035 | | | $ | - | | | $ | (1,968 | ) | | $ | 12,196 | | | $ | 754 | | | $ | - | | | $ | - | |
| (a) | Gross additions may include increases in the cost basis of investments resulting from new investments, amounts related to payment-in-kind (“PIK”) interest capitalized and added to the principal balance of the respective loans, the accretion of discounts, the exchange of one or more existing investments for one or more new investments and the movement at fair value of an existing portfolio company into this controlled affiliated category from a different category. |
| (b) | Gross reductions may include decreases in the cost basis of investments resulting from principal collections related to investment repayments and sales, return of capital, the amortization of premiums and the exchange of one or more existing securities for one or more new securities. |
| (13) | Security is exempt from registration under the Securities Act of 1933, as amended (the “Securities Act”), and may be deemed to be “restricted securities” under the Securities Act. |
| (14) | The Company owns 0.19% of the common equity and 0.43% of the preferred equity of Vehicle Accessories, Inc. |
| (15) | KABDC Corp, LLC, a wholly owned subsidiary of the Company, owns common and/or preferred equity of Arborworks Acquisition LLC, Bloomington Holdings, LP (BW Fusion), City Line Distributors, LLC, CCFF Parent, LLC (California Custom Fruits & Flavors, LLC), ML Buyer, LLC (Mama Lycha Foods, LLC), NMA Super Holdings, LLC (Neuromonitoring Associates), Robinette Company Acquisition, LLC, TG Parent Newco LLC (Trademark Global LLC) and US Anchors, LP (Mechanical Plastics Corp.). |
| (16) | The Company owns 33.46% of a pass-through, taxable limited liability company, KSCF IV Equity Aggregator Blocker, LLC (the “Aggregator Blocker”), which holds the Company’s equity investments in American Equipment Holdings LLC, Gulf Pacific Holdings, LLC, IF&P Foods, LLC (FreshEdge) and LSL Industries, LLC (LSL Healthcare). Through the Company’s ownership of the Aggregator Blocker, the Company owns the respective units of each company listed above in the Schedule of Investments. |
| (17) | The Company owns 0.53% of the common equity BLP Buyer, Inc. (Bishop Lifting Products). |
| (18) | The Company owns 17.15% of a pass-through limited liability company, KSCF IV Equity Aggregator, LLC (the “Aggregator”), which holds the Company’s equity investments in Siegel Parent, LLC and American Soccer Company, Incorporated (SCORE). Through the Company’s ownership of the Aggregator, the Company owns the respective units of each company listed above in the Schedule of Investments. |
| (19) | The indicated rate is the yield as of December 31, 2024. |
See accompanying notes to consolidated financial statements.
Kayne Anderson BDC, Inc.
Consolidated Schedule of Investments
As of December 31, 2023
(amounts in 000’s, except number of shares, units)
| | | | | | | | | Maturity | | | Principal / | | | Amortized | | | Fair | | | Percentage of | |
| Portfolio Company(1) | | Footnotes | | Investment (2) | | Interest Rate | | Date | | | Par | | | Cost(3)(4) | | | Value | | | Net Assets | |
| Debt and Equity Investments | | | | | | | | | | | | | | | | | | | | | |
| Private Credit Investments(5) | | | | | | | | | | | | | | | | | | | | | |
| Aerospace & defense | | | | | | | | | | | | | | | | | | | | | |
| Basel U.S. Acquisition Co., Inc. (IAC) | | (6) | | First lien senior secured revolving loan | | 11.51% (S + 6.00%) | | | 12/5/2028 | | | $ | - | | | $ | - | | | $ | - | | | | 0.0 | % |
| | | | | First lien senior secured loan | | 11.51% (S + 6.00%) | | | 12/5/2028 | | | | 18,494 | | | | 18,066 | | | | 18,679 | | | | 2.7 | % |
| Fastener Distribution Holdings, LLC | | | | First lien senior secured loan | | 12.00% (S + 6.50%) | | | 10/1/2025 | | | | 20,494 | | | | 20,090 | | | | 20,494 | | | | 3.0 | % |
| | | | | First lien senior secured delayed draw loan | | 12.00% (S + 6.50%) | | | 10/1/2025 | | | | 9,098 | | | | 9,009 | | | | 9,098 | | | | 1.3 | % |
| Precinmac (US) Holdings, Inc. | | | | First lien senior secured loan | | 11.46% (S + 6.00%) | | | 8/31/2027 | | | | 5,352 | | | | 5,281 | | | | 5,272 | | | | 0.8 | % |
| | | | | First lien senior secured delayed draw loan | | 11.46% (S + 6.00%) | | | 8/31/2027 | | | | 1,102 | | | | 1,087 | | | | 1,086 | | | | 0.2 | % |
| Vitesse Systems Parent, LLC | | | | First lien senior secured loan | | 12.63% (S + 7.00%) | | | 12/22/2028 | | | | 31,208 | | | | 30,430 | | | | 31,208 | | | | 4.6 | % |
| | | | | | | | | | | | | | 85,748 | | | | 83,963 | | | | 85,837 | | | | 12.6 | % |
| Automobile components | | | | | | | | | | | | | | | | | | | | | | | | | | |
| Speedstar Holding LLC | | | | First lien senior secured loan | | 12.79% (S + 7.25%) | | | 1/22/2027 | | | | 6,012 | | | | 5,925 | | | | 5,982 | | | | 0.9 | % |
| | | | | First lien senior secured delayed draw loan | | 12.78% (S + 7.25%) | | | 1/22/2027 | | | | 271 | | | | 265 | | | | 270 | | | | 0.0 | % |
| Vehicle Accessories, Inc. | | | | First lien senior secured loan | | 10.72% (S + 5.25%) | | | 11/30/2026 | | | | 21,011 | | | | 20,770 | | | | 21,011 | | | | 3.1 | % |
| | | | | First lien senior secured revolving loan | | 10.72% (S + 5.25%) | | | 11/30/2026 | | | | - | | | | - | | | | - | | | | 0.0 | % |
| | | | | | | | | | | | | | 27,294 | | | | 26,960 | | | | 27,263 | | | | 4.0 | % |
| Biotechnology | | | | | | | | | | | | | | | | | | | | | | | | | | |
| Alcami Corporation (Alcami) | | | | First lien senior secured delayed draw loan | | 12.46% (S + 7.00%) | | | 6/30/2024 | | | | - | | | | - | | | | - | | | | 0.0 | % |
| | | | | First lien senior secured revolving loan | | 12.46% (S + 7.00%) | | | 12/21/2028 | | | | - | | | | - | | | | - | | | | 0.0 | % |
| | | | | First lien senior secured loan | | 12.46% (S + 7.00%) | | | 12/21/2028 | | | | 11,618 | | | | 11,197 | | | | 11,850 | | | | 1.7 | % |
| | | | | | | | | | | | | | 11,618 | | | | 11,197 | | | | 11,850 | | | | 1.7 | % |
| Building products | | | | | | | | | | | | | | | | | | | | | | | | | | |
| Ruff Roofers Buyer, LLC | | | | First lien senior secured loan | | 11.08% (S + 5.75%) | | | 11/19/2029 | | | | 7,186 | | | | 6,910 | | | | 7,186 | | | | 1.1 | % |
| | | | | First lien senior secured delayed draw loan | | 11.08% (S + 5.75%) | | | 11/17/2024 | | | | - | | | | - | | | | - | | | | 0.0 | % |
| | | | | First lien senior secured delayed draw loan | | 11.08% (S + 5.75%) | | | 11/17/2025 | | | | - | | | | - | | | | - | | | | 0.0 | % |
| | | | | First lien senior secured revolving loan | | 11.08% (S + 5.75%) | | | 11/19/2029 | | | | - | | | | - | | | | - | | | | 0.0 | % |
| Eastern Wholesale Fence | | | | First lien senior secured loan | | 13.50% (S + 8.00%) | | | 10/30/2025 | | | | 20,271 | | | | 19,875 | | | | 20,069 | | | | 2.9 | % |
| | | | | First lien senior secured revolving loan | | 13.50% (S + 8.00%) | | | 10/30/2025 | | | | 368 | | | | 364 | | | | 365 | | | | 0.0 | % |
| | | | | | | | | | | | | | 27,825 | | | | 27,149 | | | | 27,620 | | | | 4.0 | % |
| Capital markets | | | | | | | | | | | | | | | | | | | | | | | | | | |
| Atria Wealth Solutions, Inc. | | | | First lien senior secured loan | | 11.97% (S + 6.50%) | | | 5/31/2024 | | | | 5,087 | | | | 5,080 | | | | 5,087 | | | | 0.7 | % |
| | | | | First lien senior secured delayed draw loan | | 11.97% (S + 6.50%) | | | 5/31/2024 | | | | 3,218 | | | | 3,211 | | | | 3,218 | | | | 0.5 | % |
| | | | | | | | | | | | | | 8,305 | | | | 8,291 | | | | 8,305 | | | | 1.2 | % |
| Chemicals | | | | | | | | | | | | | | | | | | | | | | | | | | |
| FAR Technologies Holdings, Inc.(f/k/a Cyalume Technologies Holdings, Inc.) | | | | First lien senior secured loan | | 10.61% (S + 5.00%) | | | 8/30/2024 | | | | 1,274 | | | | 1,271 | | | | 1,274 | | | | 0.2 | % |
| Fralock Buyer LLC | | | | First lien senior secured loan | | 11.61% (S + 6.00%) | | | 4/17/2024 | | | | 11,654 | | | | 11,628 | | | | 11,567 | | | | 1.7 | % |
| | | | | First lien senior secured revolving loan | | 11.61% (S + 6.00%) | | | 4/17/2024 | | | | 449 | | | | 449 | | | | 446 | | | | 0.1 | % |
| Shrieve Chemical Company, LLC | | | | First lien senior secured loan | | 11.90% (S + 6.38%) | | | 12/2/2024 | | | | 8,720 | | | | 8,628 | | | | 8,720 | | | | 1.3 | % |
| USALCO, LLC | | | | First lien senior secured loan | | 11.61% (S + 6.00%) | | | 10/19/2027 | | | | 18,989 | | | | 18,684 | | | | 18,989 | | | | 2.8 | % |
| | | | | First lien senior secured revolving loan | | 11.47% (S + 6.00%) | | | 10/19/2026 | | | | 1,049 | | | | 1,021 | | | | 1,049 | | | | 0.1 | % |
| | | | | | | | | | | | | | 42,135 | | | | 41,681 | | | | 42,045 | | | | 6.2 | % |
| Commercial services & supplies | | | | | | | | | | | | | | | | | | | | | | | | | | |
| Advanced Environmental Monitoring | | (7) | | First lien senior secured loan | | 12.01% (S + 6.50%) | | | 1/29/2026 | | | | 10,158 | | | | 9,994 | | | | 10,158 | | | | 1.5 | % |
| Allentown, LLC | | | | First lien senior secured loan | | 11.46% (S + 6.00%) | | | 4/22/2027 | | | | 7,586 | | | | 7,535 | | | | 7,586 | | | | 1.1 | % |
| | | | | First lien senior secured delayed draw loan | | 11.46% (S + 6.00%) | | | 4/22/2027 | | | | 1,370 | | | | 1,354 | | | | 1,370 | | | | 0.2 | % |
| | | | | First lien senior secured revolving loan | | 13.50% (P + 5.00%) | | | 4/22/2027 | | | | 235 | | | | 234 | | | | 235 | | | | 0.0 | % |
| American Equipment Holdings LLC | | | | First lien senior secured loan | | 11.86% (S + 6.00%) | | | 11/5/2026 | | | | 20,045 | | | | 19,812 | | | | 19,945 | | | | 2.9 | % |
| | | | | First lien senior secured delayed draw loan | | 11.88% (S + 6.00%) | | | 11/5/2026 | | | | 6,239 | | | | 6,167 | | | | 6,208 | | | | 0.9 | % |
| | | | | First lien senior secured delayed draw loan | | 11.81% (S + 6.00%) | | | 11/5/2026 | | | | 4,969 | | | | 4,905 | | | | 4,944 | | | | 0.7 | % |
| | | | | First lien senior secured revolving loan | | 11.74% (S + 6.00%) | | | 11/5/2026 | | | | 2,736 | | | | 2,672 | | | | 2,723 | | | | 0.4 | % |
| Arborworks Acquisition LLC | | (8)(9)(10) | | First lien senior secured loan | | | | | 11/6/2028 | | | | 4,688 | | | | 4,688 | | | | 4,688 | | | | 0.7 | % |
| | | | | First lien senior secured revolving loan | | | | | 11/6/2028 | | | | 1,253 | | | | 1,253 | | | | 1,253 | | | | 0.2 | % |
| BLP Buyer, Inc. (Bishop Lifting Products) | | | | First lien senior secured loan | | 11.11% (S + 5.75%) | | | 12/22/2029 | | | | 26,099 | | | | 25,549 | | | | 26,099 | | | | 3.8 | % |
| | | | | First lien senior secured delayed draw loan | | 11.11% (S + 5.75%) | | | 12/22/2025 | | | | - | | | | - | | | | - | | | | 0.0 | % |
| | | | | First lien senior secured revolving loan | | 11.11% (S + 5.75%) | | | 12/22/2029 | | | | 273 | | | | 196 | | | | 273 | | | | 0.0 | % |
| Gusmer Enterprises, Inc. | | | | First lien senior secured loan | | 12.47% (S + 7.00%) | | | 5/7/2027 | | | | 4,747 | | | | 4,682 | | | | 4,735 | | | | 0.7 | % |
| | | | | First lien senior secured delayed draw loan | | 12.47% (S + 7.00%) | | | 5/7/2027 | | | | 7,951 | | | | 7,798 | | | | 7,931 | | | | 1.2 | % |
| | | | | First lien senior secured revolving loan | | 12.47% (S + 7.00%) | | | 5/7/2027 | | | | - | | | | - | | | | - | | | | 0.0 | % |
| PMFC Holding, LLC | | | | First lien senior secured loan | | 13.02% (S + 7.50%) | | | 7/31/2025 | | | | 5,561 | | | | 5,427 | | | | 5,561 | | | | 0.8 | % |
| | | | | First lien senior secured delayed draw loan | | 13.03% (S + 7.50%) | | | 7/31/2025 | | | | 2,789 | | | | 2,787 | | | | 2,789 | | | | 0.4 | % |
| | | | | First lien senior secured revolving loan | | 13.03% (S + 7.50%) | | | 7/31/2025 | | | | 547 | | | | 547 | | | | 547 | | | | 0.1 | % |
| Regiment Security Partners LLC | | | | First lien senior secured loan | | 13.52% (S + 8.00%) | | | 9/15/2026 | | | | 6,383 | | | | 6,309 | | | | 6,383 | | | | 1.0 | % |
| | | | | First lien senior secured delayed draw loan | | 13.52% (S + 8.00%) | | | 9/15/2026 | | | | 2,609 | | | | 2,588 | | | | 2,609 | | | | 0.4 | % |
| | | | | First lien senior secured revolving loan | | 13.52% (S + 8.00%) | | | 9/15/2026 | | | | 1,448 | | | | 1,427 | | | | 1,448 | | | | 0.2 | % |
| | | | | | | | | | | | | | 117,686 | | | | 115,924 | | | | 117,485 | | | | 17.2 | % |
See accompanying notes to consolidated financial statements.
Kayne Anderson BDC, Inc.
Consolidated Schedule of Investments
As of December 31, 2023
(amounts in 000’s, except number of shares, units)
| | | | | | | | | Maturity | | | Principal / | | | Amortized | | | Fair | | | Percentage of | |
| Portfolio Company(1) | | Footnotes | | Investment (2) | | Interest Rate | | Date | | | Par | | | Cost(3)(4) | | | Value | | | Net Assets | |
| Containers & packaging | | | | | | | | | | | | | | | | | | | | | | | | | | |
| Carton Packaging Buyer, Inc. (Century Box) | | | | First lien senior secured loan | | 11.39% (S + 6.00%) | | | 10/30/2028 | | | | 24,261 | | | | 23,605 | | | | 24,262 | | | | 3.6 | % |
| | | | | First lien senior secured revolving loan | | 11.39% (S + 6.00%) | | | 10/30/2028 | | | | - | | | | - | | | | - | | | | 0.0 | % |
| Drew Foam Companies, Inc. | | | | First lien senior secured loan | | 12.75% (S + 7.25%) | | | 11/5/2025 | | | | 7,052 | | | | 6,997 | | | | 6,999 | | | | 1.0 | % |
| | | | | First lien senior secured loan | | 12.80% (S + 7.25%) | | | 11/5/2025 | | | | 20,045 | | | | 19,789 | | | | 19,895 | | | | 2.9 | % |
| FCA, LLC (FCA Packaging) | | | | First lien senior secured loan | | 11.90% (S + 6.50%) | | | 7/18/2028 | | | | 18,673 | | | | 18,419 | | | | 19,047 | | | | 2.8 | % |
| | | | | First lien senior secured revolving loan | | 11.90% (S + 6.50%) | | | 7/18/2028 | | | | - | | | | - | | | | - | | | | 0.0 | % |
| Innopak Industries, Inc. | | | | First lien senior secured loan | | 11.71% (S + 6.25%) | | | 3/5/2027 | | | | 28,224 | | | | 27,564 | | | | 28,224 | | | | 4.1 | % |
| | | | | | | | | | | | | | 98,255 | | | | 96,374 | | | | 98,427 | | | | 14.4 | % |
| Diversified telecommunication services | | | | | | | | | | | | | | | | | | | | | | | | | | |
| Network Connex (f/k/a NTI Connect, LLC) | | | | First lien senior secured loan | | 11.00% (S + 5.50%) | | | 1/31/2026 | | | | 5,195 | | | | 5,140 | | | | 5,196 | | | | 0.8 | % |
| | | | | | | | | | | | | | 5,195 | | | | 5,140 | | | | 5,196 | | | | 0.8 | % |
| Food products | | | | | | | | | | | | | | | | | | | | | | | | | | |
| BC CS 2, L.P. (Cuisine Solutions) | | (6)(11) | | | | 13.55% (S + 8.00%) | | | 7/8/2028 | | | | 21,555 | | | | 21,063 | | | | 21,555 | | | | 3.2 | % |
| BR PJK Produce, LLC (Keany) | | | | First lien senior secured loan | | 11.50% (S + 6.00%) | | | 11/14/2027 | | | | 29,564 | | | | 28,973 | | | | 29,564 | | | | 4.3 | % |
| | | | | First lien senior secured delayed draw loan | | 11.46% (S + 6.00%) | | | 11/14/2027 | | | | 2,938 | | | | 2,812 | | | | 2,938 | | | | 0.4 | % |
| City Line Distributors, LLC | | | | First lien senior secured loan | | 11.47% (S + 6.00%) | | | 8/31/2028 | | | | 8,895 | | | | 8,576 | | | | 8,895 | | | | 1.3 | % |
| | | | | First lien senior secured delayed draw loan | | 11.47% (S + 6.00%) | | | 3/3/2025 | | | | - | | | | - | | | | - | | | | 0.0 | % |
| | | | | First lien senior secured revolving loan | | 11.47% (S + 6.00%) | | | 8/31/2028 | | | | - | | | | - | | | | - | | | | 0.0 | % |
| Gulf Pacific Holdings, LLC | | | | First lien senior secured loan | | 11.25% (S + 5.75%) | | | 9/30/2028 | | | | 20,180 | | | | 19,847 | | | | 20,079 | | | | 2.9 | % |
| | | | | First lien senior secured delayed draw loan | | 11.38% (S + 5.75%) | | | 9/30/2028 | | | | 1,701 | | | | 1,618 | | | | 1,693 | | | | 0.2 | % |
| | | | | First lien senior secured revolving loan | | 11.29% (S + 5.75%) | | | 9/30/2028 | | | | 2,697 | | | | 2,602 | | | | 2,683 | | | | 0.4 | % |
| IF&P Foods, LLC (FreshEdge) | | | | First lien senior secured loan | | 11.07% (S + 5.63%) | | | 10/3/2028 | | | | 27,245 | | | | 26,684 | | | | 26,904 | | | | 4.0 | % |
| | | | | First lien senior secured loan | | 11.48% (S + 6.00%) | | | 10/3/2028 | | | | 216 | | | | 211 | | | | 213 | | | | 0.0 | % |
| | | | | First lien senior secured delayed draw loan | | 11.07% (S + 5.63%) | | | 10/3/2028 | | | | 4,045 | | | | 3,969 | | | | 3,994 | | | | 0.6 | % |
| | | | | First lien senior secured revolving loan | | 10.91% (S + 5.63%) | | | 10/3/2028 | | | | 1,759 | | | | 1,690 | | | | 1,737 | | | | 0.3 | % |
| J&K Ingredients, LLC | | | | First lien senior secured loan | | 11.63% (S + 6.25%) | | | 11/16/2028 | | | | 11,581 | | | | 11,295 | | | | 11,581 | | | | 1.7 | % |
| Siegel Egg Co., LLC | | | | First lien senior secured loan | | 11.99% (S + 6.50%) | | | 12/29/2026 | | | | 15,466 | | | | 15,290 | | | | 14,616 | | | | 2.1 | % |
| | | | | First lien senior secured revolving loan | | 11.99% (S + 6.50%) | | | 12/29/2026 | | | | 2,594 | | | | 2,557 | | | | 2,451 | | | | 0.4 | % |
| Worldwide Produce Acquisition, LLC | | | | First lien senior secured delayed draw loan | | 11.60% (S + 6.25%) | | | 1/18/2029 | | | | 631 | | | | 587 | | | | 625 | | | | 0.1 | % |
| | | | | First lien senior secured delayed draw loan | | 11.60% (S + 6.25%) | | | 4/18/2024 | | | | - | | | | - | | | | - | | | | 0.0 | % |
| | | | | First lien senior secured revolving loan | | 11.60% (S + 6.25%) | | | 1/18/2029 | | | | 198 | | | | 190 | | | | 196 | | | | 0.0 | % |
| | | | | First lien senior secured loan | | 11.60% (S + 6.25%) | | | 1/18/2029 | | | | 2,860 | | | | 2,786 | | | | 2,832 | | | | 0.4 | % |
| | | | | | | | | | | | | | 154,125 | | | | 150,750 | | | | 152,556 | | | | 22.3 | % |
| Health care providers & services | | | | | | | | | | | | | | | | | | | | | | | | | | |
| Brightview, LLC | | | | First lien senior secured loan | | 11.47% (S + 6.00%) | | | 12/14/2026 | | | | 12,870 | | | | 12,855 | | | | 12,645 | | | | 1.9 | % |
| | | | | First lien senior secured delayed draw loan | | 11.47% (S + 6.00%) | | | 12/14/2026 | | | | 1,719 | | | | 1,714 | | | | 1,689 | | | | 0.3 | % |
| | | | | First lien senior secured revolving loan | | 11.47% (S + 6.00%) | | | 12/14/2026 | | | | 774 | | | | 774 | | | | 761 | | | | 0.1 | % |
| Guardian Dentistry Partners | | | | First lien senior secured loan | | 11.97% (S + 6.50%) | | | 8/20/2026 | | | | 8,057 | | | | 7,929 | | | | 8,057 | | | | 1.2 | % |
| | | | | First lien senior secured delayed draw loan | | 11.97% (S + 6.50%) | | | 8/20/2026 | | | | 15,682 | | | | 15,464 | | | | 15,682 | | | | 2.3 | % |
| | | | | First lien senior secured delayed draw loan | | 11.97% (S + 6.50%) | | | 8/20/2026 | | | | 5,808 | | | | 5,808 | | | | 5,808 | | | | 0.9 | % |
| Guided Practice Solutions: Dental, LLC (GPS) | | | | First lien senior secured delayed draw loan | | 11.72% (S + 6.25%) | | | 12/29/2025 | | | | 6,475 | | | | 6,056 | | | | 6,475 | | | | 0.9 | % |
| Light Wave Dental Management LLC | | | | First lien senior secured revolving loan | | 12.35% (S + 7.00%) | | | 6/30/2029 | | | | 2,181 | | | | 2,099 | | | | 2,181 | | | | 0.3 | % |
| | | | | First lien senior secured loan | | 12.35% (S + 7.00%) | | | 6/30/2029 | | | | 22,423 | | | | 21,834 | | | | 22,423 | | | | 3.3 | % |
| SGA Dental Partners Holdings, LLC | | | | First lien senior secured loan | | 11.67% (S + 6.00%) | | | 12/30/2026 | | | | 11,828 | | | | 11,683 | | | | 11,828 | | | | 1.7 | % |
| | | | | First lien senior secured loan | | 11.61% (S + 6.00%) | | | 12/30/2026 | | | | 1,681 | | | | 1,563 | | | | 1,681 | | | | 0.2 | % |
| | | | | First lien senior secured delayed draw loan | | 11.67% (S + 6.00%) | | | 12/30/2026 | | | | 11,024 | | | | 10,856 | | | | 11,024 | | | | 1.6 | % |
| | | | | First lien senior secured delayed draw loan | | 11.67% (S + 6.00%) | | | 4/19/2024 | | | | - | | | | - | | | | - | | | | 0.0 | % |
| | | | | First lien senior secured revolving loan | | 11.67% (S + 6.00%) | | | 12/30/2026 | | | | - | | | | - | | | | - | | | | 0.0 | % |
| | | | | | | | | | | | | | 100,522 | | | | 98,635 | | | | 100,254 | | | | 14.7 | % |
See accompanying notes to consolidated financial statements.
Kayne Anderson BDC, Inc.
Consolidated Schedule of Investments
As of December 31, 2023
(amounts in 000’s, except number of shares, units)
| | | | | | | | | Maturity | | | Principal / | | | Amortized | | | Fair | | | Percentage of | |
| Portfolio Company(1) | | Footnotes | | Investment (2) | | Interest Rate | | Date | | | Par | | | Cost(3)(4) | | | Value | | | Net Assets | |
| Health care equipment & supplies | | | | | | | | | | | | | | | | | | | | | | | | | | |
| LSL Industries, LLC (LSL Healthcare) | | | | First lien senior secured loan | | 12.15% (S + 6.50%) | | | 11/3/2027 | | | | 19,529 | | | | 18,911 | | | | 19,334 | | | | 2.8 | % |
| | | | | First lien senior secured delayed draw loan | | 12.15% (S + 6.50%) | | | 11/3/2024 | | | | - | | | | - | | | | - | | | | 0.0 | % |
| | | | | First lien senior secured revolving loan | | 12.15% (S + 6.50%) | | | 11/3/2027 | | | | - | | | | - | | | | - | | | | 0.0 | % |
| | | | | | | | | | | | | | 19,529 | | | | 18,911 | | | | 19,334 | | | | 2.8 | % |
| Household durables | | | | | | | | | | | | | | | | | | | | | | | | | | |
| Curio Brands, LLC | | | | First lien senior secured loan | | 10.96% (S + 5.50%) | | | 12/21/2027 | | | | 17,173 | | | | 16,859 | | | | 16,830 | | | | 2.5 | % |
| | | | | First lien senior secured revolving loan | | 10.96% (S + 5.50%) | | | 12/21/2027 | | | | - | | | | - | | | | - | | | | 0.0 | % |
| | | | | First lien senior secured delayed draw loan | | 10.96% (S + 5.50%) | | | 12/21/2027 | | | | 4,121 | | | | 4,121 | | | | 4,039 | | | | 0.6 | % |
| | | | | | | | | | | | | | 21,294 | | | | 20,980 | | | | 20,869 | | | | 3.1 | % |
| Household products | | | | | | | | | | | | | | | | | | | | | | | | | | |
| Home Brands Group Holdings, Inc. (ReBath) | | | | First lien senior secured loan | | 10.29% (S + 4.75%) | | | 11/8/2026 | | | | 17,052 | | | | 16,826 | | | | 16,967 | | | | 2.5 | % |
| | | | | First lien senior secured revolving loan | | 10.29% (S + 4.75%) | | | 11/8/2026 | | | | - | | | | - | | | | - | | | | 0.0 | % |
| | | | | | | | | | | | | | 17,052 | | | | 16,826 | | | | 16,967 | | | | 2.5 | % |
| Insurance | | | | | | | | | | | | | | | | | | | | | | | | | | |
| Allcat Claims Service, LLC | | | | First lien senior secured loan | | 11.53% (S + 6.00%) | | | 7/7/2027 | | | | 7,717 | | | | 7,551 | | | | 7,717 | | | | 1.1 | % |
| | | | | First lien senior secured delayed draw loan | | 11.53% (S + 6.00%) | | | 7/7/2027 | | | | 21,605 | | | | 21,266 | | | | 21,605 | | | | 3.2 | % |
| | | | | First lien senior secured revolving loan | | 11.53% (S + 6.00%) | | | 7/7/2027 | | | | - | | | | - | | | | - | | | | 0.0 | % |
| | | | | | | | | | | | | | 29,322 | | | | 28,817 | | | | 29,322 | | | | 4.3 | % |
| IT services | | | | | | | | | | | | | | | | | | | | | | | | | | |
| Domain Information Services Inc. (Integris) | | | | First lien senior secured loan | | 11.29% (S + 5.75%) | | | 9/30/2025 | | | | 20,444 | | | | 20,122 | | | | 20,342 | | | | 3.0 | % |
| Improving Acquisition LLC | | | | First lien senior secured loan | | 12.22% (S + 6.50%) | | | 7/26/2027 | | | | 31,650 | | | | 31,140 | | | | 31,492 | | | | 4.6 | % |
| | | | | First lien senior secured revolving loan | | 12.22% (S + 6.50%) | | | 7/26/2027 | | | | - | | | | - | | | | - | | | | 0.0 | % |
| | | | | | | | | | | | | | 52,094 | | | | 51,262 | | | | 51,834 | | | | 7.6 | % |
| Leisure products | | | | | | | | | | | | | | | | | | | | | | | | | | |
| BCI Burke Holding Corp. | | | | First lien senior secured loan | | 11.11% (S + 5.50%) | | | 12/14/2027 | | | | 15,373 | | | | 15,219 | | | | 15,603 | | | | 2.3 | % |
| | | | | First lien senior secured delayed draw loan | | 11.11% (S + 5.50%) | | | 12/14/2027 | | | | 578 | | | | 545 | | | | 586 | | | | 0.1 | % |
| | | | | First lien senior secured revolving loan | | 11.11% (S + 5.50%) | | | 6/14/2027 | | | | - | | | | - | | | | - | | | | 0.0 | % |
| VENUplus, Inc. (f/k/a CTM Group, Inc.) | | | | First lien senior secured loan | | 12.29% (S + 6.75%) | | | 11/30/2026 | | | | 4,420 | | | | 4,325 | | | | 4,398 | | | | 0.6 | % |
| MacNeill Pride Group | | | | First lien senior secured loan | | 11.86% (S + 6.25%) | | | 4/22/2026 | | | | 8,254 | | | | 8,198 | | | | 8,151 | | | | 1.2 | % |
| | | | | First lien senior secured delayed draw loan | | 11.86% (S + 6.25%) | | | 4/22/2026 | | | | 3,277 | | | | 3,221 | | | | 3,236 | | | | 0.5 | % |
| | | | | First lien senior secured revolving loan | | 11.86% (S + 6.25%) | | | 4/22/2026 | | | | - | | | | - | | | | - | | | | 0.0 | % |
| Trademark Global LLC | | | | First lien senior secured loan | | 12.97% (S +7.50%, 1.50% is PIK) | | | 7/30/2024 | | | | 11,798 | | | | 11,776 | | | | 10,736 | | | | 1.6 | % |
| | | | | First lien senior secured revolving loan | | 12.97% (S +7.50%, 1.50% is PIK) | | | 7/30/2024 | | | | 2,630 | | | | 2,627 | | | | 2,393 | | | | 0.3 | % |
| | | | | | | | | | | | | | 46,330 | | | | 45,911 | | | | 45,103 | | | | 6.6 | % |
| Machinery | | | | | | | | | | | | | | | | | | | | | | | | | | |
| Pennsylvania Machine Works, LLC | | | | First lien senior secured loan | | 11.61% (S + 6.00%) | | | 3/6/2027 | | | | 1,908 | | | | 1,896 | | | | 1,908 | | | | 0.3 | % |
| PVI Holdings, Inc | | | | First lien senior secured loan | | 12.16% (S + 6.77%) | | | 1/18/2028 | | | | 23,895 | | | | 23,602 | | | | 24,074 | | | | 3.5 | % |
| Techniks Holdings, LLC / Eppinger Holdings Germany GMBH | | (6) | | First lien senior secured loan | | 12.75% (S + 7.25%) | | | 2/4/2025 | | | | 24,812 | | | | 24,468 | | | | 24,688 | | | | 3.6 | % |
| | | | | First lien senior secured revolving loan | | 11.80% (S + 6.25%) | | | 2/4/2025 | | | | 1,050 | | | | 1,003 | | | | 1,045 | | | | 0.2 | % |
| | | | | | | | | | | | | | 51,665 | | | | 50,969 | | | | 51,715 | | | | 7.6 | % |
| Personal care products | | | | | | | | | | | | | | | | | | | | | | | | | | |
| DRS Holdings III, Inc. (Dr. Scholl’s) | | | | First lien senior secured loan | | 11.71% (S + 6.25%) | | | 11/1/2025 | | | | 11,004 | | | | 10,954 | | | | 11,004 | | | | 1.6 | % |
| | | | | First lien senior secured revolving loan | | 11.71% (S + 6.25%) | | | 11/1/2025 | | | | - | | | | - | | | | - | | | | 0.0 | % |
| PH Beauty Holdings III, Inc. | | | | First lien senior secured loan | | 10.65% (S + 5.00%) | | | 9/28/2025 | | | | 9,442 | | | | 9,278 | | | | 9,183 | | | | 1.3 | % |
| Silk Holdings III Corp. (Suave) | | | | First lien senior secured loan | | 13.10% (S + 7.75%) | | | 5/1/2029 | | | | 19,900 | | | | 19,351 | | | | 20,298 | | | | 3.0 | % |
| | | | | | | | | | | | | | 40,346 | | | | 39,583 | | | | 40,485 | | | | 5.9 | % |
| Pharmaceuticals | | | | | | | | | | | | | | | | | | | | | | | | | | |
| Foundation Consumer Brands | | | | First lien senior secured loan | | 11.79% (S + 6.25%) | | | 2/12/2027 | | | | 6,781 | | | | 6,744 | | | | 6,832 | | | | 1.0 | % |
| | | | | First lien senior secured revolving loan | | 11.79% (S + 6.25%) | | | 2/12/2027 | | | | - | | | | - | | | | - | | | | 0.0 | % |
| | | | | | | | | | | | | | 6,781 | | | | 6,744 | | | | 6,832 | | | | 1.0 | % |
See accompanying notes to consolidated financial statements.
Kayne Anderson BDC, Inc.
Consolidated Schedule of Investments
As of December 31, 2023
(amounts in 000’s, except number of shares, units)
| | | | | | | | | Maturity | | | Principal / | | | Amortized | | | Fair | | | Percentage | |
| Portfolio Company(1) | | Footnotes | | Investment (2) | | Interest Rate | | Date | | | Par | | | Cost(3)(4) | | | Value | | | of Net Assets | |
| Professional services | | | | | | | | | | | | | | | | | | | | | |
| 4 Over International, LLC | | | | First lien senior secured loan | | 12.46% (S + 7.00%) | | | 12/7/2026 | | | | 19,438 | | | | 18,757 | | | | 19,438 | | | | 2.8 | % |
| DISA Holdings Corp. (DISA) | | | | First lien senior secured delayed draw loan | | 10.84% (S + 5.50%) | | | 9/9/2028 | | | | 3,714 | | | | 3,578 | | | | 3,714 | | | | 0.5 | % |
| | | | | First lien senior secured revolving loan | | 10.84% (S + 5.50%) | | | 9/9/2028 | | | | 392 | | | | 347 | | | | 392 | | | | 0.1 | % |
| | | | | First lien senior secured loan | | 10.84% (S + 5.50%) | | | 9/9/2028 | | | | 22,177 | | | | 21,625 | | | | 22,177 | | | | 3.2 | % |
| Universal Marine Medical Supply International, LLC (Unimed) | | | | First lien senior secured loan | | 13.01% (S + 7.50%) | | | 12/5/2027 | | | | 13,527 | | | | 13,253 | | | | 13,527 | | | | 2.0 | % |
| | | | | First lien senior secured revolving loan | | 13.00% (S + 7.50%) | | | 12/5/2027 | | | | 2,544 | | | | 2,494 | | | | 2,544 | | | | 0.4 | % |
| | | | | | | | | | | | | | 61,792 | | | | 60,054 | | | | 61,792 | | | | 9.0 | % |
| Software | | | | | | | | | | | | | | | | | | | | | | | | | | |
| AIDC Intermediate Co 2, LLC (Peak Technologies) | | | | First lien senior secured loan | | 11.80% (S + 6.25%) | | | 7/22/2027 | | | | 34,650 | | | | 33,736 | | | | 34,650 | | | | 5.1 | % |
| Specialty retail | | | | | | | | | | | | | | | | | | | | | | | | | | |
| Sundance Holdings Group, LLC | | (7) | | First lien senior secured loan | | 15.03% (S + 9.50%, 1.50% is PIK) | | | 5/1/2024 | | | | 9,210 | | | | 9,022 | | | | 8,911 | | | | 1.3 | % |
| | | | | First lien senior secured delayed draw loan | | 15.03% (S + 9.50%, 1.50% is PIK) | | | 5/1/2024 | | | | - | | | | - | | | | - | | | | 0.0 | % |
| | | | | | | | | | | | | | 9,210 | | | | 9,022 | | | | 8,911 | | | | 1.3 | % |
| Textiles, apparel & luxury goods | | | | | | | | | | | | | | | | | | | | | | | | | | |
| American Soccer Company, Incorporated (SCORE) | | | | First lien senior secured loan | | 12.75% (S + 7.25%) | | | 7/20/2027 | | | | 29,816 | | | | 29,317 | | | | 29,145 | | | | 4.3 | % |
| | | | | First lien senior secured revolving loan | | 12.75% (S + 7.25%) | | | 7/20/2027 | | | | 2,128 | | | | 2,067 | | | | 2,080 | | | | 0.3 | % |
| BEL USA, LLC | | | | First lien senior secured loan | | 12.53% (S + 7.00%) | | | 6/2/2026 | | | | 5,804 | | | | 5,774 | | | | 5,804 | | | | 0.8 | % |
| | | | | First lien senior secured loan | | 12.53% (S + 7.00%) | | | 6/2/2026 | | | | 96 | | | | 95 | | | | 96 | | | | 0.0 | % |
| YS Garments, LLC | | | | First lien senior secured loan | | 13.00% (S + 7.50%) | | | 8/9/2026 | | | | 6,849 | | | | 6,758 | | | | 6,729 | | | | 1.0 | % |
| | | | | | | | | | | | | | 44,693 | | | | 44,011 | | | | 43,854 | | | | 6.4 | % |
| Trading companies & distributors | | | | | | | | | | | | | | | | | | | | | | | | | | |
| BCDI Meteor Acquisition, LLC (Meteor) | | | | First lien senior secured loan | | 12.45% (S + 7.00%) | | | 6/29/2028 | | | | 16,297 | | | | 15,955 | | | | 16,297 | | | | 2.4 | % |
| Broder Bros., Co. | | | | First lien senior secured loan | | 11.61% (S+ 6.00%) | | | 12/4/2025 | | | | 4,640 | | | | 4,439 | | | | 4,640 | | | | 0.7 | % |
| CGI Automated Manufacturing, LLC | | | | First lien senior secured loan | | 12.61% (S + 7.00%) | | | 12/17/2026 | | | | 20,510 | | | | 19,849 | | | | 20,459 | | | | 3.0 | % |
| | | | | First lien senior secured loan | | 12.61% (S + 7.00%) | | | 12/17/2026 | | | | 6,681 | | | | 6,559 | | | | 6,664 | | | | 1.0 | % |
| | | | | First lien senior secured delayed draw loan | | 12.61% (S + 7.00%) | | | 12/17/2026 | | | | 3,616 | | | | 3,510 | | | | 3,607 | | | | 0.5 | % |
| | | | | First lien senior secured revolving loan | | 12.61% (S + 7.00%) | | | 12/17/2026 | | | | 327 | | | | 244 | | | | 327 | | | | 0.0 | % |
| EIS Legacy, LLC | | | | First lien senior secured loan | | 11.24% (S + 5.75%) | | | 11/1/2027 | | | | 18,079 | | | | 17,838 | | | | 18,079 | | | | 2.6 | % |
| | | | | First lien senior secured loan | | 11.27% (S + 5.75%) | | | 11/1/2027 | | | | 9,666 | | | | 9,356 | | | | 9,666 | | | | 1.4 | % |
| | | | | First lien senior secured delayed draw loan | | 11.24% (S + 5.75%) | | | 4/20/2025 | | | | - | | | | - | | | | - | | | | 0.0 | % |
| | | | | First lien senior secured revolving loan | | 11.24% (S + 5.75%) | | | 11/1/2027 | | | | - | | | | - | | | | - | | | | 0.0 | % |
| Engineered Fastener Company, LLC (EFC International) | | | | First lien senior secured loan | | 12.00% (S + 6.50%) | | | 11/1/2027 | | | | 23,604 | | | | 23,113 | | | | 23,899 | | | | 3.5 | % |
| Genuine Cable Group, LLC | | | | First lien senior secured loan | | 10.96% (S + 5.50%) | | | 11/1/2026 | | | | 29,057 | | | | 28,336 | | | | 28,984 | | | | 4.2 | % |
| | | | | First lien senior secured loan | | 10.96% (S + 5.50%) | | | 11/1/2026 | | | | 5,506 | | | | 5,347 | | | | 5,492 | | | | 0.8 | % |
| I.D. Images Acquisition, LLC | | | | First lien senior secured loan | | 11.75% (S + 6.25%) | | | 7/30/2026 | | | | 13,651 | | | | 13,538 | | | | 13,651 | | | | 2.0 | % |
| | | | | First lien senior secured delayed draw loan | | 11.75% (S + 6.25%) | | | 7/30/2026 | | | | 2,486 | | | | 2,450 | | | | 2,486 | | | | 0.4 | % |
| | | | | First lien senior secured loan | | 11.70% (S + 6.25%) | | | 7/30/2026 | | | | 4,522 | | | | 4,457 | | | | 4,522 | | | | 0.7 | % |
| | | | | First lien senior secured loan | | 11.75% (S + 6.25%) | | | 7/30/2026 | | | | 1,043 | | | | 1,033 | | | | 1,043 | | | | 0.2 | % |
| | | | | First lien senior secured revolving loan | | 11.75% (S + 6.25%) | | | 7/30/2026 | | | | - | | | | - | | | | - | | | | 0.0 | % |
| Krayden Holdings, Inc. | | | | First lien senior secured delayed draw loan | | 11.20% (S + 5.75%) | | | 3/1/2025 | | | | - | | | | - | | | | - | | | | 0.0 | % |
| | | | | First lien senior secured delayed draw loan | | 11.20% (S + 5.75%) | | | 3/1/2025 | | | | - | | | | - | | | | - | | | | 0.0 | % |
| | | | | First lien senior secured revolving loan | | 11.20% (S + 5.75%) | | | 3/1/2029 | | | | - | | | | - | | | | - | | | | 0.0 | % |
| | | | | First lien senior secured loan | | 11.20% (S + 5.75%) | | | 3/1/2029 | | | | 9,491 | | | | 9,099 | | | | 9,491 | | | | 1.4 | % |
| OAO Acquisitions, Inc. (BearCom) | | | | First lien senior secured loan | | 11.61% (S + 6.25%) | | | 12/27/2029 | | | | 21,370 | | | | 20,979 | | | | 21,370 | | | | 3.1 | % |
| | | | | First lien senior secured delayed draw loan | | 11.61% (S + 6.25%) | | | 12/27/2025 | | | | - | | | | - | | | | - | | | | 0.0 | % |
| | | | | First lien senior secured revolving loan | | 11.61% (S + 6.25%) | | | 12/27/2029 | | | | - | | | | - | | | | - | | | | 0.0 | % |
| United Safety & Survivability Corporation (USSC) | | | | First lien senior secured loan | | 11.79% (S + 6.25%) | | | 9/30/2027 | | | | 12,436 | | | | 12,147 | | | | 12,436 | | | | 1.8 | % |
| | | | | First lien senior secured loan | | 11.79% (S + 6.25%) | | | 9/28/2027 | | | | 1,607 | | | | 1,490 | | | | 1,607 | | | | 0.3 | % |
| | | | | First lien senior secured delayed draw loan | | 11.79% (S + 6.25%) | | | 9/30/2027 | | | | 3,160 | | | | 3,110 | | | | 3,160 | | | | 0.5 | % |
| | | | | First lien senior secured revolving loan | | 11.79% (S + 6.25%) | | | 9/30/2027 | | | | 870 | | | | 860 | | | | 870 | | | | 0.1 | % |
| | | | | | | | | | | | | | 208,619 | | | | 203,709 | | | | 208,750 | | | | 30.6 | % |
| Wireless telecommunication services | | | | | | | | | | | | | | | | | | | | | | | | | | |
| Centerline Communications, LLC | | | | First lien senior secured loan | | 11.53% (S + 6.00%) | | | 8/10/2027 | | | | 14,945 | | | | 14,751 | | | | 13,936 | | | | 2.0 | % |
| | | | | First lien senior secured delayed draw loan | | 11.53% (S + 6.00%) | | | 8/10/2027 | | | | 7,044 | | | | 6,954 | | | | 6,568 | | | | 1.0 | % |
| | | | | First lien senior secured delayed draw loan | | 11.53% (S + 6.00%) | | | 8/10/2027 | | | | 6,202 | | | | 6,112 | | | | 5,783 | | | | 0.9 | % |
| | | | | First lien senior secured revolving loan | | 11.53% (S + 6.00%) | | | 8/10/2027 | | | | 1,800 | | | | 1,778 | | | | 1,679 | | | | 0.2 | % |
| | | | | First lien senior secured loan | | 11.53% (S + 6.00%) | | | 8/10/2027 | | | | 1,020 | | | | 996 | | | | 952 | | | | 0.1 | % |
| | | | | | | | | | | | | | 31,011 | | | | 30,591 | | | | 28,918 | | | | 4.2 | % |
| Total Private Credit Debt Investments | | | | | | | | | | | | | 1,353,096 | | | | 1,327,190 | | | | 1,346,174 | | | | 197.1 | % |
See accompanying notes to consolidated financial statements.
Kayne Anderson BDC, Inc.
Consolidated Schedule of Investments
As of December 31, 2023
(amounts in 000’s, except number of shares, units)
| | | Footnotes | | Number of
Shares/Units | | | Cost | | | Fair
Value | | | Percentage of
Net Assets | |
| Equity Investments(9) | | | | | | | | | | | | | | |
| Automobile components | | | | | | | | | | | | | | |
| Vehicle Accessories, Inc. - Class A common | | (12) | | | 128,250 | | | | - | | | | 326 | | | | 0.0 | % |
| Vehicle Accessories, Inc. - preferred | | (12) | | | 250,000 | | | | 250 | | | | 292 | | | | 0.1 | % |
| | | | | | 378,250 | | | | 250 | | | | 618 | | | | 0.1 | % |
| Commercial services & supplies | | | | | | | | | | | | | | | | | | |
| American Equipment Holdings LLC - Class A units | | (13) | | | 426 | | | | 284 | | | | 508 | | | | 0.1 | % |
| BLP Buyer, Inc. (Bishop Lifting Products) - Class A common | | (14) | | | 582,469 | | | | 652 | | | | 1,200 | | | | 0.1 | % |
| Arborworks Acquisition LLC – Class A preferred units | | (10) | | | 21,716 | | | | 9,179 | | | | 9,287 | | | | 1.4 | % |
| Arborworks Acquisition LLC – Class B preferred units | | (10) | | | 21,716 | | | | - | | | | - | | | | 0.0 | % |
| Arborworks Acquisition LLC – Class A common units | | (10) | | | 2,604 | | | | - | | | | - | | | | 0.0 | % |
| | | | | | 628,931 | | | | 10,115 | | | | 10,995 | | | | 1.6 | % |
| Food products | | | | | | | | | | | | | | | | | | |
| BC CS 2, L.P. (Cuisine Solutions) | | (6)(11) | | | 2,000,000 | | | | 2,000 | | | | 2,611 | | | | 0.4 | % |
| City Line Distributors, LLC - Class A units | | (15) | | | 418,416 | | | | 418 | | | | 418 | | | | 0.1 | % |
| Gulf Pacific Holdings, LLC - Class A common | | (13) | | | 250 | | | | 250 | | | | 189 | | | | 0.0 | % |
| Gulf Pacific Holdings, LLC - Class C common | | (13) | | | 250 | | | | - | | | | - | | | | 0.0 | % |
| IF&P Foods, LLC (FreshEdge) - Class A preferred | | (13) | | | 750 | | | | 750 | | | | 905 | | | | 0.1 | % |
| IF&P Foods, LLC (FreshEdge) - Class B common | | (13) | | | 750 | | | | - | | | | - | | | | 0.0 | % |
| Siegel Parent, LLC | | (16) | | | 250 | | | | 250 | | | | 72 | | | | 0.0 | % |
| | | | | | 2,420,666 | | | | 3,668 | | | | 4,195 | | | | 0.6 | % |
| Healthcare equipment & supplies | | | | | | | | | | | | | | | | | | |
| LSL Industries, LLC (LSL Healthcare) | | (13) | | | 7,500 | | | | 750 | | | | 552 | | | | 0.1 | % |
| IT services | | | | | | | | | | | | | | | | | | |
| Domain Information Services Inc. (Integris) | | | | | 250,000 | | | | 250 | | | | 344 | | | | 0.0 | % |
| Specialty retail | | | | | | | | | | | | | | | | | | |
| Sundance Direct Holdings, Inc. - common | | | | | 21,479 | | | | - | | | | - | | | | 0.0 | % |
| Textiles, apparel & luxury goods | | | | | | | | | | | | | | | | | | |
| American Soccer Company, Incorporated (SCORE) | | (16) | | | 1,000,000 | | | | 1,000 | | | | 620 | | | | 0.1 | % |
| Total Private Equity Investments | | | | | | | | | 16,033 | | | | 17,324 | | | | 2.5 | % |
| | | | | | | | | | | | | | | | | | | |
| Total Private Investments | | | | | | | | | 1,343,223 | | | | 1,363,498 | | | | 199.6 | % |
| | | | | Number of | | | | | | Fair | | | Percentage of | |
| | | Footnotes | | Shares | | | Cost | | | Value | | | Net Assets | |
| Short-Term Investments | | | | | | | | | | | | | | |
| First American Treasury Obligations Fund - Institutional Class Z, 5.21% | | (17) | | | 12,802,362 | | | | 12,802 | | | | 12,802 | | | | 1.9 | % |
| Total Short-Term Investments | | | | | 12,802,362 | | | | 12,802 | | | | 12,802 | | | | 1.9 | % |
| | | | | | | | | | | | | | | | | | | |
| Total Investments | | | | | | | | $ | 1,356,025 | | | $ | 1,376,300 | | | | 201.5 | % |
| Liabilities in Excess of Other Assets | | | | | | | | | | | | | (693,244 | ) | | | (101.5 | )% |
| Net Assets | | | | | | | | | | | | $ | 683,056 | | | | 100.0 | % |
| (1) | As of December 31, 2023, all investments are non-controlled, non-affiliated investments. Non-controlled, non-affiliated investments are defined as investments in which the Company owns less than 5% of the portfolio company’s outstanding voting securities and does not have the power to exercise control over the management or policies of such portfolio company. |
See accompanying notes to consolidated financial statements.
Kayne Anderson BDC, Inc.
Consolidated Schedule of Investments
As of December 31, 2023
(amounts in 000’s, except number of shares, units)
| (2) | Debt investments are pledged to the Company’s credit facilities, and a single debt investment may be divided into parts that are individually pledged to separate credit facilities. |
| (3) | The amortized cost represents the original cost adjusted for the amortization of discounts and premiums, as applicable, on debt investments using the effective interest method. |
| (4) | As of December 31, 2023, the tax cost of the Company’s investments approximates their amortized cost. |
| (5) | Loan contains a variable rate structure, that may be subject to an interest rate floor. Variable rate loans bear interest at a rate that may be determined by reference to either the Secured Overnight Funding Rate (“SOFR” or “S”) (which can include one-, three- or six-month SOFR), or an alternate base rate (which can include the Federal Funds Effective Rate or the Prime Rate or “P”). |
| (6) | Non-qualifying investment as defined by Section 55(a) of the Investment Company Act of 1940. The Company may not acquire any non-qualifying asset unless, at the time of acquisition, qualifying assets represent at least 70% of the Company’s total assets. As of December 31, 2023, 4.8% of the Company’s total assets were in non-qualifying investments. |
| (7) | The Company may be entitled to receive additional interest as a result of an arrangement with other lenders in the syndication. In exchange for the higher interest rate, the “last-out” portion is at a greater risk of loss. Certain lenders represent a “first out” portion of the investment and have priority to the “last-out” portion with respect to payments of principal and interest. |
| (8) | Debt investment on non-accrual status as of December 31, 2023. |
| (9) | Non-income producing investment. |
| (10) | In November 2023, the Company completed a restructure of the investment in Arborworks Acquisition LLC whereby the existing term loan and revolver were restructured to a new term loan and preferred and common equity. KABDC Corp II, LLC, a wholly owned subsidiary of the Company, holds the preferred and common equity of Arborworks Acquisition LLC that the Company owns following this restructure. |
| (11) | The Company has a senior secured loan in an investment vehicle (BC CS 2, L.P.) that is collateralized by a preferred stock investment in Cuisine Solutions, Inc.. |
| (12) | The Company owns 0.19% of the common equity and 0.43% of the preferred equity of Vehicle Accessories, Inc. |
| (13) | The Company owns 27.15% of a pass-through, taxable limited liability company, KSCF IV Equity Aggregator Blocker, LLC (the “Aggregator Blocker”), which holds the Company’s equity investments in American Equipment Holdings LLC, Gulf Pacific Holdings, LLC, IF&P Foods, LLC (FreshEdge) and LSL Industries, LLC (LSL Healthcare). Through the Company’s ownership of the Aggregator Blocker, the Company owns the respective units of each company listed above in the Schedule of Investments. |
| (14) | The Company owns 0.53% of the common equity BLP Buyer, Inc. (Bishop Lifting Products). |
| (15) | KABDC Corp, LLC, a wholly owned subsidiary of the Company, owns 0.62% of the common equity of City Line Distributors, LLC. |
| (16) | The Company owns 33.95% of a pass-through limited liability company, KSCF IV Equity Aggregator, LLC (the “Aggregator”), which holds the Company’s equity investments in Siegel Parent, LLC and American Soccer Company, Incorporated (SCORE). The Aggregator’s ownership of Siegel Parent, LLC is 1.1442%. Through the Company’s ownership of the Aggregator, the Company owns the respective units of each company listed above in the Schedule of Investments. |
| (17) | The indicated rate is the yield as of December 31, 2023. |
See accompanying notes to consolidated financial statements.
Kayne Anderson BDC, Inc.
Notes to Consolidated Financial Statements
(amounts in 000’s, except share and per share amounts)
Note 1. Organization
Organization
Kayne Anderson BDC, Inc. (the “Company”) is an externally managed, closed-end, non-diversified management investment company that has elected to be regulated as a business development company (“BDC”) under the Investment Company Act of 1940, as amended (the “1940 Act”). In addition, for U.S. federal income tax purposes, the Company intends to qualify as a regulated investment company (“RIC”) under Subchapter M of the Internal Revenue Code of 1986, as amended (the “Code”).
The Company is a Delaware corporation formed to make investments in middle-market companies and commenced operations on February 5, 2021.
The Company is managed by KA Credit Advisors, LLC (the “Advisor”), an indirect controlled subsidiary of Kayne Anderson Capital Advisors, L.P. (“Kayne Anderson”), a prominent alternative investment management firm. The Advisor operates within Kayne Anderson’s middle market private credit platform (“KAPC” or “Kayne Anderson Private Credit”). The Advisor is registered with the United States Securities and Exchange Commission (the “SEC”) under the Investment Advisory Act of 1940, as amended. Subject to the overall supervision of the Company’s board of directors (the “Board”), the Advisor is responsible for originating prospective investments, conducting research and due diligence investigations on potential investments, analyzing investment opportunities, negotiating and structuring investments, determining the value of the investments and monitoring its investments and portfolio companies on an ongoing basis. The Board consists of seven directors, four of whom are independent.
The Company’s investment objective is to generate current income and, to a lesser extent, capital appreciation primarily through debt investments in middle-market companies.
On May 24, 2024, the Company completed its initial public offering (“IPO”), issuing 6,000,000 shares of its common stock at a public offering price of $16.63 per share. Net of underwriting fees and offering expenses, the Company received net cash proceeds of $92,363. The Company’s common stock began trading on the New York Stock Exchange (“NYSE”) under the ticker symbol “KBDC” on May 22, 2024.
Prior to its IPO, the Company conducted private offerings of its common stock to investors in reliance on exemptions from the registration requirements of the Securities Act of 1933, as amended (the “Securities Act”). At the closing of any private offering, each investor made a capital commitment to purchase shares of its common stock pursuant to a subscription agreement entered into with the Company. From its initial closing of the private offering (the “Initial Closing”) on February 5, 2021 through its final capital call closing on April 2, 2024, the Company issued shares of its common stock equal to the aggregate capital commitment of $1,046,928. Following the final closing on April 2, 2024, the Company had no remaining undrawn capital commitments.
Kayne Anderson BDC, Inc.
Notes to Consolidated Financial Statements
(amounts in 000’s, except share and per share amounts)
Note 2. Significant Accounting Policies
A. Basis of Presentation—the accompanying financial statements have been prepared in accordance with accounting principles generally accepted in the United States of America (“GAAP”). The Company is an investment company and follows accounting and reporting guidance of the Financial Accounting Standards Board (FASB) Accounting Standards Codification (ASC) Topic 946 — “Financial Services — Investment Companies.” In the opinion of management, all adjustments, which are of a normal recurring nature, considered necessary for the fair statement of the consolidated financial statements for the periods presented, have been included.
B. Consolidation—As provided under Regulation S-X and ASC Topic 946 – “Financial Services – Investment Companies”, the Company will generally not consolidate its investment in a company other than a wholly-owned investment company or controlled operating company whose business consists of providing services to the Company.
Accordingly, the Company consolidated the accounts of the Company’s wholly-owned subsidiaries, Kayne Anderson BDC Financing, LLC, (“KABDCF”); Kayne Anderson BDC Financing II, LLC (“KABDCF II”), and KABDC Corp, LLC in its consolidated financial statements. All significant intercompany balances and transactions have been eliminated in consolidation. KABDC Corp, LLC is a Delaware LLC that has elected to be treated as a corporation for U.S. tax purposes and was formed to facilitate compliance with the requirements to be treated as a RIC under the Code by holding (directly or indirectly through subsidiaries) equity or equity related investments in portfolio companies organized as limited liability companies or limited partnerships.
C. Use of Estimates—the preparation of financial statements in conformity with GAAP requires management to make estimates and assumptions that affect the reported amount of assets and liabilities and disclosure of contingent assets and liabilities as of the date of the financial statements and the reported amounts of income and expenses during the period. Actual results could differ materially from those estimates.
D. Cash and Cash Equivalents—cash and cash equivalents include short-term, liquid investments with an original maturity of three months or less and include money market fund accounts. Cash equivalents, which are the Company’s investments in money market fund accounts, are presented on the Company’s consolidated schedule of investments, and within investments on the Company’s consolidated statement of assets and liabilities.
E. Investment Valuation, Fair Value—the Company conducts the valuation of its investments consistent with GAAP and the 1940 Act. The Company’s investments will be valued no less frequently than quarterly, in accordance with the terms of Topic 820 of the Financial Accounting Standards Board’s Accounting Standards Codification, Fair Value Measurement and Disclosures (“ASC 820”).
Pursuant to Rule 2a-5 under the 1940 Act, the Board of Directors has designated the Advisor as the “valuation designee” to perform fair value determinations of the Company’s portfolio holdings, subject to oversight by and periodic reporting to the Board. The valuation designee performs fair valuation of the Company’s portfolio holdings in accordance with the Advisor’s Valuation Program, as approved by the Board.
Traded Investments (Level 1 or Level 2)
Investments for which market quotations are readily available will typically be valued at those market quotations. Traded investments such as corporate bonds, preferred stock, bank notes, broadly syndicated loans or loan participations are valued by using the bid price provided by an independent pricing service, by an independent broker, the agent bank, syndicate bank or principal market maker. When price quotes for investments are not available, or such prices are stale or do not represent fair value in the judgment of the Company’s Advisor, fair market value will be determined using the Advisor’s valuation process for investments that are privately issued or otherwise restricted as to resale.
Kayne Anderson BDC, Inc.
Notes to Consolidated Financial Statements
(amounts in 000’s, except share and per share amounts)
The Company may also invest, to a lesser extent, in equity securities purchased in conjunction with debt investments. While the Company anticipates these equity securities to be issued by privately held companies, the Company may hold equity securities that are publicly traded. Equity securities listed on any exchange other than the NASDAQ Stock Market, Inc. (“NASDAQ”) are valued, except as indicated below, at the last sale price on the business day as of which such value is being determined. If there has been no sale on such day, the securities are valued at the mean of the most recent bid and ask prices on such day. Securities admitted to trade on the NASDAQ are valued at the NASDAQ official closing price. Equity securities traded on more than one securities exchange are valued at the last sale price on the business day as of which such value is being determined at the close of the exchange representing the principal market for such securities. Equity securities traded in the over-the-counter market, but excluding securities admitted to trading on the NASDAQ, are valued at the closing bid prices.
Non-Traded Investments (Level 3)
Investments that are privately issued or otherwise restricted as to resale, as well as any security for which (a) reliable market quotations are not available in the judgment of the Company’s Advisor, or (b) the independent pricing service or independent broker does not provide prices or provides a price that in the judgment of the Company’s Advisor is stale or does not represent fair value, shall each be valued in a manner that most fairly reflects fair value of the security on the valuation date. The Company expects that a significant majority of its investments will be Level 3 investments. Unless otherwise determined by the Advisor, the following valuation process is used for the Company’s Level 3 investments:
| | ● | Valuation Designee. The applicable investments will be valued no less frequently than quarterly by the Advisor, with new investments valued at the time such investment was made. The value of each Level 3 investment will be initially reviewed by the persons responsible for such portfolio company or investment. The Advisor will use a standardized template designed to approximate fair market value based on observable market inputs, updated credit statistics and unobservable inputs to determine a preliminary value. The Advisor will specify the titles of the persons responsible for determining the fair value of Company investments, including by specifying the particular functions for which they are responsible, and will reasonably segregate fair value determinations from the portfolio management of the Company such that the portfolio manager(s) may not determine, or effectively determine by exerting substantial influence on, the fair values ascribed to portfolio investments. |
| | ● | Valuation Firm. Quarterly, a third-party valuation firm engaged by the Advisor reviews the valuation methodologies and calculations employed for each of the Company’s investments that the Advisor has placed on the “watch list” and approximately 25% of the Company’s remaining investments. The third-party valuation firm will review and independently value all of the Level 3 investments at least once per year, on a rolling twelve-month basis. The quarterly report issued by the third-party valuation firm will provide positive assurance on the fair values of the investments reviewed. |
| | ● | Oversight. The Board has appointed the Advisor as the valuation designee for the Company for purposes of making determinations of fair value as permitted by Rule 2a-5 under the 1940 Act. The Audit Committee shall aid the Board in overseeing the Advisor’s fair valuation of securities that are not publicly traded or for which current market values are not readily available. The Audit Committee shall meet quarterly to review the fair value determinations, processes and written reports of the Advisor as part of the Board’s oversight responsibilities. |
Determination of fair value involves subjective judgments and estimates. Accordingly, the notes to the Company’s financial statements express the uncertainty with respect to the possible effect of such valuations, and any change in such valuations, on the Company’s financial statements.
F. Interest Income Recognition — Interest income is recorded on an accrual basis and includes the accretion of discounts, amortization of premiums and payment-in-kind (“PIK”) interest. Discounts from and premiums to par value on investments purchased are accreted/amortized into interest income over the life of the respective security using the effective yield method. To the extent loans contain PIK provisions, PIK interest, computed at the contractual rate specified in each applicable agreement, is accrued and recorded as interest income and added to the principal balance of the loan. PIK interest income added to the principal balance is generally collected upon repayment of the outstanding principal. The Company does not accrue PIK interest if, in the opinion of the Advisor, the portfolio company valuation indicates that the PIK interest is not likely to be collectible. If the Company believes PIK is not expected to be realized, the investment generating PIK will be placed on non-accrual status. When a PIK investment is placed on non-accrual status, the accrued, uncapitalized interest is generally reversed through PIK interest income. Previously capitalized PIK interest is not reversed when an investment is placed on non-accrual status. To maintain the Company’s status as a RIC, this non-cash source of income must be paid out to stockholders in the form of dividends for the year the income was earned, even though the Company has not yet collected the cash. The amortized cost of investments represents the original cost adjusted for any accretion of discounts, amortization of premiums and PIK interest. For the years ended December 31, 2024, 2023 and 2022, the Company had $2,706, $1,652 and $151, respectively, of PIK interest income included in interest income, which represents 1.3%, 1.0% and 0.2%, respectively, of aggregate interest income.
Kayne Anderson BDC, Inc.
Notes to Consolidated Financial Statements
(amounts in 000’s, except share and per share amounts)
Loans are generally placed on non-accrual status when it has been determined that a significant impairment in the financial condition and ability of the borrower to repay principal and interest has occurred and is expected to continue such that it is probable the collectability of full amount of the loan (principal and interest) is doubtful. Accrued and unpaid interest is generally reversed when a loan is placed on non-accrual status. If cash payments are received subsequent to a loan being placed on non-accrual status, these payments will first be applied to previously accrued but uncollected interest, then to recover the principal. Additionally, any original issue discount and market discount are no longer accreted to interest income as of the date the loan is placed on non-accrual status. Non-accrual loans are restored to accrual status when past due principal and interest are paid or there is no longer a reasonable doubt that such principal or interest will be collected in full and, in the Company’s judgment, principal and interest are likely to remain current. The Company may make exceptions to this policy if the loan has sufficient collateral value (i.e., typically measured as enterprise value of the portfolio company) or is in the process of collection. As of December 31, 2024, the Company had three debt investments on non-accrual status, which compromised 1.6% and 1.3%, respectively, of total debt investments at cost and fair value. As of December 31, 2023, the Company had one debt investment on non-accrual status, which represented 0.4% and 0.4% of total debt investments at cost and fair value, respectively. As of December 31, 2022, the Company did not have any debt investments in portfolio companies on non-accrual status.
G. Debt Issuance Costs — Costs incurred by the Company related to the issuance of its debt (credit facilities) are capitalized and amortized over the period the debt is outstanding. The Company has classified the costs incurred to issue its credit facilities as a deduction from the carrying value of the credit facilities on the Statement of Assets and Liabilities. For the purpose of calculating the Company’s asset coverage ratios pursuant to the 1940 Act, deferred issuance costs are not deducted from the carrying value of debt or preferred stock.
H. Dividends to Common Stockholders — Dividends to common stockholders are recorded on the record date. The amount to be paid out as a dividend is determined by the Company’s board of directors each quarter and is generally based upon the earnings estimated by management and considers the level of undistributed taxable income carried forward from the prior year for distribution in the current year. Net realized capital gains, if any, are generally distributed, although the Company may decide to retain such capital gains for investment.
I. Income Taxes — it is the Company’s intention to continue to be treated as and to qualify each year for special tax treatment afforded a RIC under the Code. As long as the Company meets certain requirements that govern its sources of income, diversification of assets and timely distribution of earnings to stockholders, the Company will not be subject to U.S. federal income tax.
The Company must pay distributions equal to 90% of its investment company taxable income (ordinary income and short-term capital gains) to qualify as a RIC and it must distribute all of its taxable income (ordinary income, short-term capital gains and long-term capital gains) to avoid federal income taxes. The Company will be subject to federal income tax on any undistributed portion of income. For purposes of the distribution test, the Company may elect to treat as paid on the last day of its taxable year all or part of any distributions that are declared after the end of its taxable year if such distributions are declared before the due date of its tax return, including any extensions.
All RICs are subject to a non-deductible 4% excise tax on income that is not distributed on a timely basis in accordance with the calendar year distribution requirements. To avoid the tax, the Company must distribute during each calendar year an amount at least equal to the sum of (i) 98% of its ordinary income for the calendar year, (ii) 98.2% of its net capital gains for the one-year period ending on December 31, the last day of our taxable year, and (iii) undistributed amounts from previous years on which the Company paid no U.S. federal income tax. A distribution will be treated as paid during the calendar year if it is paid during the calendar year or declared by the Company in October, November or December of such year, payable to stockholders of record on a date during such months and paid by the Company no later than January of the following year. Any such distributions paid during January of the following year will be deemed to be received by stockholders on December 31 of the year the distributions are declared, rather than when the distributions are actually received.
Kayne Anderson BDC, Inc.
Notes to Consolidated Financial Statements
(amounts in 000’s, except share and per share amounts)
The Company’s wholly owned subsidiary, KABDC Corp, LLC has elected to be a corporation and is obligated to pay federal and state income tax on its taxable income. KABDC Corp, LLC invests in partnerships and includes its allocable share of the taxable income or loss in computing its own taxable income. Deferred income taxes reflect (i) taxes on unrealized gains (losses), which are attributable to the difference between fair value and tax cost basis, (ii) the net tax effects of temporary differences between the carrying amounts of assets and liabilities for financial reporting purposes and the amounts used for income tax purposes and (iii) the net tax benefit of accumulated net operating and capital losses.
To the extent KABDC Corp, LLC has a deferred tax asset, consideration is given as to whether or not a valuation allowance is required. The need to establish a valuation allowance for deferred tax assets is assessed periodically based on the Income Tax Topic of the FASB Accounting Standards Codification (ASC 740), that it is more likely than not that some portion or all of the deferred tax asset will not be realized. In the assessment for a valuation allowance, consideration is given to all positive and negative evidence related to the realization of the deferred tax asset. This assessment considers, among other matters, the nature, frequency and severity of current and cumulative losses, forecasts of future profitability, the duration of statutory carryforward periods and the associated risk that certain loss carryforwards may expire unused.
KABDC Corp, LLC may rely to some extent on information provided by portfolio investments, which may not necessarily be timely, to estimate taxable income allocable to the units/shares of such companies held in the portfolio and to estimate the associated current and/or deferred tax liability.
The Company evaluates tax positions taken or expected to be taken in the course of preparing its financial statements to determine whether the tax positions are “more-likely-than-not” to be sustained by the applicable tax authority. Tax positions not deemed to meet the “more-likely-than-not” threshold are reserved and recorded as a tax benefit or expense in the current year. All penalties and interest associated with income taxes are included in income tax expense. Conclusions regarding tax positions are subject to review and may be adjusted at a later date based on factors including, but not limited to, on-going analyses of tax laws, regulations and interpretations thereof.
J. Commitments and Contingencies — in the normal course of business, the Company may enter into contracts that provide a variety of general indemnifications. Any exposure to the Company under these arrangements could involve future claims that may be made against the Company. Currently, no such claims exist or are expected to arise and, accordingly, the Company has not accrued any liability in connection with such indemnifications.
K. Recent Accounting Pronouncements — In November 2023, the FASB issued ASU 2023-07, Segment Reporting (Topic 280): Improvements to Reportable Segment Disclosures (“ASU 2023-07”), which enhances disclosure requirements about significant segment expenses that are regularly provided to the chief operating decision maker (the “CODM”). ASU 2023-07, among other things, (i) requires a single segment public entity to provide all of the disclosures as required by ASC 280, (ii) requires a public entity to disclose the title and position of the CODM and an explanation of how the CODM uses the reported measure(s) of segment profit or loss in assessing segment performance and deciding how to allocate resources and (iii) provides the ability for a public entity to elect more than one performance measure. ASU 2023-07 is effective for the fiscal years beginning after December 15, 2023, and interim periods beginning with the first quarter ended March 31, 2025. Early adoption is permitted and retrospective adoption is required for all prior periods presented. The Company has adopted ASU 2023-07 effective December 31, 2024, and concluded that the application of this guidance did not have any material impact on its consolidated financial statements. See Note 12 – Segment Reporting, for more information on the effects of the adoption of ASU 2023-07.
Note 3. Agreements and Related Party Transactions
A. Controlled / Affiliated Portfolio Companies — under the 1940 Act, the Company is required to separately identify non-controlled investments where it owns 5% or more of a portfolio company’s outstanding voting securities and/or has the power to exercise control over the management or policies of such portfolio company as investments in “affiliated” companies. In addition, under the 1940 Act, the Company is required to separately identify investments where it owns more than 25% of a portfolio company’s outstanding voting securities and/or has the power to exercise control over the management or policies of such portfolio company as investments in “controlled” companies. Under the 1940 Act, “non-affiliated investments” are defined as investments that are neither controlled investments nor affiliated investments. Detailed information with respect to the Company’s non-controlled, non-affiliated, and non-controlled, affiliated, investments is contained in the accompanying consolidated financial statements, including the consolidated schedule of investments.
B. Administration Agreement — on February 5, 2021, the Company entered into an Administration Agreement with its Advisor, which serves as its Administrator and will provide or oversee the performance of its required administrative services and professional services rendered by others, which will include (but are not limited to), accounting, payment of our expenses, legal, compliance, operations, technology and investor relations, preparation and filing of its tax returns, and preparation of financial reports provided to its stockholders and filed with the SEC. On February 19, 2025, the Board approved an additional one-year term of the Administration Agreement through March 15, 2026.
The Company will reimburse the Administrator for its costs and expenses incurred in performing its obligations under the Administration Agreement, which may include, after completion of its initial public offering, its allocable portion of office facilities, overhead, and compensation paid to or compensatory distributions received by its officers (including our Chief Compliance Officer and Chief Financial Officer) and its respective staff who provide services to the Company. As the Company reimburses the Administrator for its expenses, the Company will indirectly bear such cost. The Administration Agreement may be terminated by either party with 60 days’ written notice.
C. Investment Advisory Agreement — on February 5, 2021, the Company entered into an Investment Advisory Agreement with its Advisor. Pursuant to the Investment Advisory Agreement with its Advisor, the Company will pay its Advisor a fee for investment advisory and management services consisting of two components—a base management fee and an incentive fee. The Advisor may, from time-to-time, grant waivers on the Company’s obligations, including waivers of the base management fee and/or incentive fee, under the Investment Advisory Agreement. The Investment Advisory Agreement may be terminated by either party with 60 days’ written notice. On February 19, 2025, the Board approved an additional one-year term of the Investment Advisory Agreement from March 15, 2025 to March 15, 2026.
Kayne Anderson BDC, Inc.
Notes to Consolidated Financial Statements
(amounts in 000’s, except share and per share amounts)
In addition, on March 6, 2024, the Board approved an amended and restated investment advisory agreement (the “Amended Investment Advisory Agreement”) and a fee waiver agreement (the “Fee Waiver Agreement”) between the Company and the Advisor, which became effective upon the completion of the initial public offering of the Company’s shares of common stock on May 24, 2024 (the “IPO Date”).
The Amended Investment Advisory Agreement is materially the same as the Investment Advisory Agreement except, following the IPO Date, the base management fee is calculated at an annual rate of 1.00% and the incentive fee on income is subject to a twelve-quarter lookback quarterly hurdle rate of 1.50% as opposed to a single quarter measurement and is subject to an Incentive Fee Cap (as defined below) based on the Company’s Cumulative Pre-Incentive Fee Net Return (as defined below). This lookback feature provides that the Advisor’s income incentive fee may be reduced if the Company’s portfolio experiences aggregate write-downs or net capital losses during the applicable Trailing Twelve Quarters (as defined below). Pursuant to the Fee Waiver Agreement, commencing on the IPO Date, the Advisor implemented waivers of (i) the income incentive fee for three calendar quarters commencing the quarter the initial public offering was completed and (ii) a portion of the base management fee for one year following the completion of the initial public offering. Amounts waived by the Advisor pursuant to the Fee Waiver Agreement are not subject to recoupment by the Advisor.
Base Management Fee
Prior to the IPO Date, the base management fee was calculated at an annual rate of 0.90% of the fair market value of the Company’s investments including, in each case, assets purchased with borrowings under credit facilities and issuances of senior unsecured notes, but excluding cash, U.S. government securities and commercial paper instruments maturing within one year of purchase.
Commencing on the IPO Date, the base management fee is calculated at an annual rate of 1.00% of the fair market value of the Company’s investments. Since the IPO Date was on a date other than the first day of a calendar quarter, the management fee was calculated for the calendar quarter at a weighted rate based on the fee rates applicable before and after the IPO Date based on the number of days in such calendar quarter before and after the IPO Date. Pursuant to the Fee Waiver Agreement, commencing on the IPO Date, the Advisor has contractually agreed to waive the base management fee at an annual rate of 0.25% for one year following the IPO Date.
For the year ended December 31, 2024, the Company incurred base management fees of $14,587, net of waiver of $2,900. For the years ended December 31, 2023 and 2022, the Company incurred base management fees of $11,433 and $7,147, respectively.
Incentive Fee
The Company also pays the Advisor an incentive fee. The incentive fee consists of two parts—an incentive fee on income and an incentive fee on capital gains. Described in more detail below, these components of the incentive fee are largely independent of each other with the result that one component may be payable even if the other is not.
Incentive Fee on Income
The incentive fee based on income (the “income incentive fee”) is determined and paid quarterly in arrears in cash. The Company’s quarterly pre-incentive fee net investment income must exceed a preferred return of 1.50% of the Company’s net asset value (“NAV”) at the end of the immediately preceding calendar quarter (6.0% annualized but not compounded) (the “Hurdle Amount”) in order for the Company to receive an income incentive fee. Prior to the IPO Date, the income incentive fee is calculated as 100% of our pre-incentive fee net investment income for the immediately preceding calendar quarter in excess of 1.50% of the Company’s NAV at the end of the immediately preceding calendar quarter until the Advisor has received 10% of the total pre-incentive fee net income for that calendar quarter and, for pre-incentive fee net investment income in excess of 1.6667%, 10% of all remaining pre-incentive fee net investment income for that quarter. Pre-incentive fee net investment income excludes any realized capital gains, realized capital losses or unrealized capital appreciation or depreciation.
Kayne Anderson BDC, Inc.
Notes to Consolidated Financial Statements
(amounts in 000’s, except share and per share amounts)
Commencing on the IPO Date, the Company will pay the Advisor an income incentive fee based on its aggregate pre-incentive fee net investment income with respect to (i) the quarter ended June 30, 2024 (the “First Calendar Quarter”) and (ii) each subsequent calendar quarter, with the then-current calendar quarter and the eleven preceding calendar quarters beginning with the calendar quarter after the First Calendar Quarter (or the appropriate portion thereof in the case of any of the Company’s first eleven calendar quarters that commence after the First Calendar Quarter) (those calendar quarters after the First Calendar Quarter, the “Trailing Twelve Quarters”).
For the First Calendar Quarter, pre-incentive fee net investment income in respect of the First Calendar Quarter will be compared to a hurdle rate of 1.50% (6.00% annualized). The income incentive fee for the First Calendar Quarter will be determined as follows:
| | ● | no income incentive fee is payable to the Advisor if the aggregate pre-incentive fee net investment income for the First Calendar Quarter does not exceed that hurdle rate; |
| | ● | 100% of the aggregate pre-incentive fee net investment income with respect to that portion of such pre-incentive fee net investment income, if any, that exceeds that hurdle rate, but is less than a quarterly rate of 1.6667% for the portion of the First Calendar Quarter before the initial public offering and a quarterly rate of 1.7647% for the portion of the First Calendar Quarter after the initial public offering, referred to the “catch-up.” The “catch-up” is meant to provide the Advisor with 10.0% of the Company’s pre-incentive fee net investment income for the portion of the First Calendar Quarter before the initial public offering and 15.0% for the balance of that First Calendar Quarter, as if the hurdle rate did not apply; and |
| | ● | 10.0% of the aggregate pre-incentive fee net investment income, if any, that exceeds a quarterly rate of 1.6667% for the portion of the First Calendar Quarter before the initial public offering and 15.0% of the aggregate pre-incentive fee net investment income, if any, that exceeds a quarterly rate of 1.7647% for the balance of the First Calendar Quarter. |
Commencing with the calendar quarter beginning immediately after the First Calendar Quarter, subject to the Incentive Fee Cap (described below), the pre-incentive fee net investment income in respect of the relevant Trailing Twelve Quarters will be compared to a “Hurdle Rate” equal to the product of (i) the hurdle rate of 1.50% per quarter (6.00% annualized) and (ii) the sum of our net assets at the beginning of each applicable calendar quarter comprising the relevant Trailing Twelve Quarters. The Hurdle Rate will be calculated after making appropriate adjustments to the Company’s net asset value at the beginning of each applicable calendar quarter for all issuances by the Company of shares of its common stock, including issuances pursuant to its dividend reinvestment plan, and distributions during the applicable calendar quarter. The income incentive fee for each calendar quarter will be determined as follows:
| | ● | no income incentive fee is payable to the Advisor in any calendar quarter in which aggregate pre-incentive fee net investment income in respect of the relevant Trailing Twelve Quarters does not exceed the Hurdle Rate; |
| | ● | 100% of the aggregate pre-incentive fee net investment income in respect of the Trailing Twelve Quarters with respect to that portion of such pre-incentive fee net investment income, if any, that exceeds the Hurdle Rate, but is less than or equal to an amount, which we refer to as the “Catch-up Amount,” determined on a quarterly basis by multiplying 1.7647% by the Company’s net asset value at the beginning of each applicable calendar quarter comprising the relevant Trailing Twelve Quarters (after making appropriate adjustments to the Company’s net asset value at the beginning of each applicable calendar quarter for all issuances by the Company of shares of its common stock, including issuances pursuant to its dividend reinvestment plan, and distributions during the applicable calendar quarter); and |
| | ● | 15.0% of the aggregate pre-incentive fee net investment income in respect of the Trailing Twelve Quarters that exceeds the Catch-up Amount. |
Kayne Anderson BDC, Inc.
Notes to Consolidated Financial Statements
(amounts in 000’s, except share and per share amounts)
Commencing with the quarter that begins immediately after the First Calendar Quarter, each income incentive fee will be subject to an “Incentive Fee Cap” that in respect of any calendar quarter is an amount equal to 15.0% of the Cumulative Pre-Incentive Fee Net Return (as defined below) during the Trailing Twelve Quarters less the aggregate income incentive fees that were paid to the Advisor in the preceding eleven calendar quarters (or portion thereof) comprising the relevant Trailing Twelve Quarters. In the event the Incentive Fee Cap is zero or a negative value then no income incentive fee shall be payable and if the Incentive Fee Cap is less than the amount of income incentive fee that would otherwise be payable, the amount of income incentive fee shall be reduced to an amount equal to the Incentive Fee Cap.
“Cumulative Pre-Incentive Fee Net Return” means (x) with respect to the First Calendar Quarter, the sum of pre-incentive fee net investment income in respect of the First Calendar Quarter, (y) with respect to the relevant Trailing Twelve Quarters, the pre-incentive fee net investment income in respect of the relevant Trailing Twelve Quarters minus any Net Capital Loss (as defined below), if any, in respect of the relevant Trailing Twelve Quarters. If, in any quarter, the Incentive Fee Cap is zero or a negative value, the Company will pay no income incentive fee to the Advisor for such quarter. If, in any quarter, the Incentive Fee Cap for such quarter is a positive value but is less than the income incentive fee that is payable to the Advisor for such quarter (before giving effect to the Incentive Fee Cap) calculated as described above, the Company will pay an income incentive fee to the Advisor equal to the Incentive Fee Cap for such quarter. If, in any quarter, the Incentive Fee Cap for such quarter is equal to or greater than the income incentive fee that is payable to the Advisor for such quarter (before giving effect to the Incentive Fee Cap) calculated as described above, the Company will pay an income incentive fee to the Advisor equal to the incentive fee calculated as described above for such quarter without regard to the Incentive Fee Cap.
“Net Capital Loss” in respect of a particular period means the difference, if positive, between (i) aggregate capital losses, whether realized or unrealized, in such period and (ii) aggregate capital gains, whether realized or unrealized, in such period.
These calculations are prorated for any period of less than three months and adjusted for any share issuances or repurchases during the relevant quarter. Amounts waived by the Advisor pursuant to the Fee Waiver Agreement are not subject to recoupment by the Advisor.
Incentive Fee on Capital Gains
Prior to the IPO Date, the incentive fee on capital gains (the “capital gains incentive fee”) was calculated and payable in arrears in cash as 10% of the Company’s realized capital gains, if any, on a cumulative basis from formation through (a) the day before our initial public offering (“IPO”), (b) upon consummation of a Liquidity Event (as defined in the Investment Advisory Agreement) or (c) upon the termination of the Investment Advisory Agreement, computed net of all realized capital losses and unrealized capital depreciation on a cumulative basis, less the aggregate amount of any previously paid capital gain incentive fees. For the purpose of computing the capital gain incentive fee, the calculation methodology looked through derivative financial instruments or swaps as if the Company owned the reference assets directly.
Commencing on the IPO Date, the incentive fee on capital gains is calculated and payable in arrears in cash as 15.0% of the Company’s realized capital gains, if any, on a cumulative basis from formation through the end of a given calendar year or upon termination of the Investment Advisory Agreement, computed net of all realized capital losses and unrealized capital depreciation on a cumulative basis, less the aggregate amount of any previously paid capital gain incentive fees. In the event that the Investment Advisory Agreement terminates as of a date that is not a fiscal year end, the termination date will be treated as though it were a fiscal year end for purposes of calculating and paying a capital gain incentive fee.
For the year ended December 31, 2024, the Company incurred incentive fees on income of $2,631, net of waivers of $14,818, and no incentive fees on capital gains. For the years ended December 31, 2023 and 2022, the Company incurred incentive fees on income of $9,433 and $4,698, respectively, and no incentive fees on capital gains in either of these years.
Kayne Anderson BDC, Inc.
Notes to Consolidated Financial Statements
(amounts in 000’s, except share and per share amounts)
Payment of Incentive Fees Prior to the IPO Date
Prior to the Company’s IPO, incentive fees earned by the Advisor accrued as earned but only became payable in cash to the Advisor upon consummation the IPO. In June 2024, the Company paid $16,826 to the Advisor for these accrued as earned fees through the quarter ended March 31, 2024.
Note 4. Investments
The following table presents the composition of the Company’s investment portfolio at amortized cost and fair value as of December 31, 2024 and 2023:
| | | December 31, 2024 | | | December 31, 2023 | |
| | | Amortized | | | Fair | | | Amortized | | | Fair | |
| | | Cost | | | Value | | | Cost | | | Value | |
| First-lien senior secured debt investments(1) | | $ | 1,952,708 | | | $ | 1,972,406 | | | $ | 1,327,190 | | | $ | 1,346,174 | |
| Equity investments(2) | | | 19,347 | | | | 22,737 | | | | 16,033 | | | | 17,324 | |
| Short-term investments | | | 48,683 | | | | 48,683 | | | | 12,802 | | | | 12,802 | |
| Total Investments | | $ | 2,020,738 | | | $ | 2,043,826 | | | $ | 1,356,025 | | | $ | 1,376,300 | |
| (1) | Includes debt investment in Trademark Global LLC. |
| (2) | Includes equity investment in TG Parent Newco LLC (Trademark Global LLC). |
Kayne Anderson BDC, Inc.
Notes to Consolidated Financial Statements
(amounts in 000’s, except share and per share amounts)
As of December 31, 2024 and 2023, $188,253 and $68,578, respectively, of the Company’s total assets were non-qualifying assets, as defined by Section 55(a) of the 1940 Act.
The Company uses Global Industry Classification Standards (GICS), Level 3 – Industry, for classifying the industry groupings of its portfolio companies.
The industry composition of long-term investments based on fair value as of December 31, 2024 and 2023 was as follows:
| | | December 31,
2024 | | | December 31,
2023 | |
| | | | | | | |
| Trading companies & distributors | | | 15.1 | % | | | 15.3 | % |
| Commercial services & supplies | | | 11.7 | % | | | 9.4 | % |
| Food products | | | 10.0 | % | | | 11.5 | % |
| Health care providers & services | | | 8.4 | % | | | 7.4 | % |
| Containers & packaging | | | 7.5 | % | | | 7.2 | % |
| Professional services | | | 4.7 | % | | | 4.5 | % |
| Aerospace & defense | | | 4.4 | % | | | 6.3 | % |
| Machinery | | | 3.7 | % | | | 3.8 | % |
| Personal care products | | | 3.7 | % | | | 3.0 | % |
| Automobile components | | | 3.6 | % | | | 2.0 | % |
| Leisure products | | | 3.2 | % | | | 3.3 | % |
| Building products | | | 2.3 | % | | | 2.0 | % |
| Textiles, apparel & luxury goods | | | 2.1 | % | | | 3.3 | % |
| Specialty retail | | | 2.1 | % | | | 0.7 | % |
| Insurance | | | 2.0 | % | | | 2.2 | % |
| Pharmaceuticals | | | 1.8 | % | | | 0.5 | % |
| IT services | | | 1.7 | % | | | 3.8 | % |
| Diversified telecommunication services | | | 1.5 | % | | | 0.4 | % |
| Wireless telecommunication services | | | 1.5 | % | | | 2.1 | % |
| Health care equipment & supplies | | | 1.4 | % | | | 1.5 | % |
| Hotels, restaurants & leisure | | | 1.4 | % | | | - | % |
| Chemicals | | | 1.1 | % | | | 3.1 | % |
| Household durables | | | 1.0 | % | | | 1.5 | % |
| Media | | | 0.8 | % | | | - | % |
| Household products | | | 0.8 | % | | | 1.2 | % |
| Construction materials | | | 0.7 | % | | | - | % |
| Biotechnology | | | 0.6 | % | | | 0.9 | % |
| Semiconductors & semiconductor equipment | | | 0.6 | % | | | - | % |
| Electrical equipment | | | 0.5 | % | | | - | % |
| Diversified consumer services | | | 0.1 | % | | | - | % |
| Software | | | - | % | | | 2.5 | % |
| Capital markets | | | - | % | | | 0.6 | % |
| | | | 100.0 | % | | | 100.0 | % |
Kayne Anderson BDC, Inc.
Notes to Consolidated Financial Statements
(amounts in 000’s, except share and per share amounts)
Note 5. Fair Value
The Fair Value Measurement Topic of the FASB Accounting Standards Codification (ASC 820) defines fair value as the price at which an orderly transaction to sell an asset or to transfer a liability would take place between market participants under current market conditions at the measurement date. As required by ASC 820, the Company has performed an analysis of all investments measured at fair value to determine the significance and character of all inputs to their fair value determination. Inputs are the assumptions, along with considerations of risk, that a market participant would use to value an asset or a liability. In general, observable inputs are based on market data that is readily available, regularly distributed and verifiable that the Company obtains from independent, third-party sources. Unobservable inputs are developed by the Company based on its own assumptions of how market participants would value an asset or a liability.
The fair value hierarchy prioritizes the inputs to valuation techniques used to measure fair value into the following three broad categories.
| | Level 1 — Valuations based on quoted unadjusted prices for identical instruments in active markets traded on a national exchange to which the Company has access at the date of measurement. |
| | Level 2 — Valuations based on quoted prices for similar instruments in active markets; quoted prices for identical or similar instruments in markets that are not active; and model-derived valuations in which all significant inputs and significant value drivers are observable in active markets. Level 2 inputs are those in markets for which there are few transactions, the prices are not current, little public information exists or instances where prices vary substantially over time or among brokered market makers. |
| | Level 3 — Model derived valuations in which one or more significant inputs or significant value drivers are unobservable. Unobservable inputs are those inputs that reflect the Company’s own assumptions that market participants would use to price the asset or liability based on the best available information. |
In certain cases, the inputs used to measure fair value may fall into different levels of the fair value hierarchy. In such cases, the determination of which category within the fair value hierarchy is appropriate for any given financial instrument is based on the lowest level of input that is significant to the fair value measurement. Assessment of the significance of a particular input to the fair value measurement in its entirety requires judgment and considers factors specific to the financial instrument.
Kayne Anderson BDC, Inc.
Notes to Consolidated Financial Statements
(amounts in 000’s, except share and per share amounts)
The following tables present the fair value hierarchy of investments as of December 31, 2024 and December 31, 2023. Note that the valuation levels below are not necessarily an indication of the risk or liquidity associated with the underlying investment.
| | | Fair Value Hierarchy as of December 31, 2024 | |
| Investments: | | Level 1 | | | Level 2 | | | Level 3 | | | Total | |
| First-lien senior secured debt investments(1) | | $ | - | | | $ | 253,224 | | | $ | 1,719,182 | | | $ | 1,972,406 | |
| Equity investments(2) | | | - | | | | - | | | | 22,737 | | | | 22,737 | |
| Short-term investments | | | 48,683 | | | | - | | | | - | | | | 48,683 | |
| Total Investments | | $ | 48,683 | | | $ | 253,224 | | | $ | 1,741,919 | | | $ | 2,043,826 | |
| (1) | Includes debt investment in Trademark Global LLC. |
| (2) | Includes equity investment in TG Parent Newco LLC (Trademark Global LLC). |
| | | Fair Value Hierarchy as of December 31, 2023 | |
| Investments: | | Level 1 | | | Level 2 | | | Level 3 | | | Total | |
| First-lien senior secured debt investments | | $ | - | | | $ | - | | | $ | 1,346,174 | | | $ | 1,346,174 | |
| Equity investments | | | - | | | | - | | | | 17,324 | | | | 17,324 | |
| Short-term investments | | | 12,802 | | | | - | | | | - | | | | 12,802 | |
| Total Investments | | $ | 12,802 | | | $ | - | | | $ | 1,363,498 | | | $ | 1,376,300 | |
The following tables present changes in the fair value of investments for which Level 3 inputs were used to determine the fair value as of and for the years ended December 31, 2024 and 2023.
| For the year ended December 31, 2024 | | First-lien
senior secured
debt investments(1) | | | Private
equity
investments(2) | | | Total | |
| Fair value, beginning of period | | $ | 1,346,174 | | | $ | 17,324 | | | $ | 1,363,498 | |
| Purchases of investments, including PIK, if any | | | 653,938 | | | | 3,563 | | | | 657,501 | |
| Proceeds from sales of investments and principal repayments | | | (294,804 | ) | | | (958 | ) | | | (295,762 | ) |
| Net change in unrealized gain (loss) | | | 1,127 | | | | 2,100 | | | | 3,227 | |
| Net realized gain (loss) | | | - | | | | 708 | | | | 708 | |
| Net accretion of discount on investments | | | 12,747 | | | | - | | | | 12,747 | |
| Transfers into (out of) Level 3 | | | - | | | | - | | | | - | |
| Fair value, end of period | | $ | 1,719,182 | | | $ | 22,737 | | | $ | 1,741,919 | |
| (1) | Includes debt investment in Trademark Global LLC. |
| (2) | Includes equity investment in TG Parent Newco LLC (Trademark Global LLC). |
Kayne Anderson BDC, Inc.
Notes to Consolidated Financial Statements
(amounts in 000’s, except share and per share amounts)
| For the year ended December 31, 2023 | | First-lien
senior secured
debt investments | | | Private
equity
investments | | | Total | |
| Fair value, beginning of period | | $ | 1,157,971 | | | $ | 7,148 | | | $ | 1,165,119 | |
| Purchases of investments, including PIK, if any | | | 392,388 | | | | 605 | | | | 392,993 | |
| Proceeds from sales of investments and principal repayments | | | (196,649 | ) | | | - | | | | (196,649 | ) |
| Net change in unrealized gain (loss) | | | 2,552 | | | | 392 | | | | 2,944 | |
| Net realized gain (loss) | | | (10,686 | ) | | | - | | | | (10,686 | ) |
| Net accretion of discount on investments | | | 9,777 | | | | - | | | | 9,777 | |
| Other(1) | | | (9,179 | ) | | | 9,179 | | | | - | |
| Transfers into (out of) Level 3 | | | - | | | | - | | | | - | |
| Fair value, end of period | | $ | 1,346,174 | | | $ | 17,324 | | | $ | 1,363,498 | |
| (1) | Reflects non-cash conversions. These transactions represent non-cash investing activities. |
For the years ended December 31, 2024 and 2023, the Company did not recognize any transfers to or from Level 3. The increase in unrealized gain (loss) relates to investments that were held during the period. The Company includes these unrealized gains and losses on the Statement of Operations – Net Change in Unrealized Gains (Losses).
Valuation Techniques and Unobservable Inputs
Non-traded debt investments are typically valued using either a market yield analysis or an enterprise value analysis. For debt investments that are not considered to be credit impaired, the Advisor uses a market yield analysis to determine fair value. If the debt investment is considered to be credit impaired (which is determined by performing an enterprise value analysis), the Advisor will use the enterprise value analysis or a liquidation basis analysis to determine fair value.
To determine fair value using a market yield analysis, the Advisor discounts the contractual cash flows of each investment at an appropriate discount rate (the market yield). To determine the estimated market yield for its debt investments, the Advisor analyzes changes in the risk/reward (measured by yields and leverage) of middle market indices as compared to changes in risk/reward for the underlying investment and estimates the appropriate discount rate for such debt investment. In this context, the discount rate and the fair market value of the investment is impacted by the structure and pricing of the security relative to current market yields for similar investments in similar businesses as well as the financial performance of such business. In performing this analysis, the Advisor considers data sources including, but not limited to: (i) industry publications, such as S&P Global’s High-End Middle Market Lending Review; Thomson Reuter’s Refinitiv Middle Market Monthly Stats; CapitalIQ; Pitchbook News; The Lead Left, and other data sources; (ii) comparable investments reviewed or completed by affiliates of the Advisor, and (iii) information obtained and provided by the Advisor’s independent valuation managers.
To determine if a debt investment is credit impaired, the Advisor estimates the enterprise value of the business and compares such estimate to the outstanding indebtedness of such business. The Advisor utilizes the following valuation methodologies to determine the estimated enterprise value of the company: (i) analysis of valuations of publicly traded companies in a similar line of business (“public company comparable analysis”), (ii) analysis of valuations of M&A transaction valuations for companies in a similar line of business (“precedent transaction analysis”), (iii) discounted cash flows (“DCF analysis”) and (iv) other valuation methodologies.
Kayne Anderson BDC, Inc.
Notes to Consolidated Financial Statements
(amounts in 000’s, except share and per share amounts)
In determining the non-traded debt investment valuations, the following factors are considered, where relevant: the nature and realizable value of any collateral; the company’s ability to make interest payments, amortization payments (if any) and other fixed charges; call features, put features and other relevant terms of the debt security; the company’s historical and projected financial results; the markets in which the company does business; changes in the interest rate environment and the credit markets generally that may affect the price at which similar investments may be valued; and other relevant factors.
Equity investments in private companies are typically valued using one of or a combination of the following valuation techniques: (i) public company comparable analysis, (ii) precedent transaction analysis and (iii) DCF analysis.
Under all of these valuation techniques, the Advisor estimates operating results of the companies in which it invests, including earnings before interest expense, income tax expense, depreciation and amortization (“EBITDA”) and free cash flow. These estimates utilize unobservable inputs such as historical operating results, which may be unaudited, and projected operating results, which will be based on operating assumptions for such company. Investment performance data utilized will be the most recently available as of the measurement date which in many cases may reflect up to a one quarter lag in information. These estimates will be sensitive to changes in assumptions specific to such company as well as general assumptions for the industry. Other unobservable inputs utilized in the valuation techniques outlined above include: discounts for lack of marketability, selection of publicly traded companies, selection of similar precedent transactions, selected ranges for valuation multiples and expected required rates of return (discount rates).
Quantitative Table for Valuation Techniques
The following tables present quantitative information about the significant unobservable inputs of the Company’s Level 3 investments as of December 31, 2024 and December 31, 2023. The tables are not intended to be all-inclusive but instead capture the significant unobservable inputs relevant to the Advisor’s determination of fair value. The Company calculates weighted average, based on the value of the unobservable input of each investment relative to the fair value of the investment compared to the total fair value of all investments. First-lien senior secured debt investments include the Company’s senior secured loan in an investment vehicle (BC CS 2, L.P.), which is considered subordinated debt since it is collateralized by a preferred stock investment in Cuisine Solutions, Inc.
| | | As of December 31, 2024 | |
| | | Fair Value | | | Valuation
Technique | | Unobservable
Input | | Range | | | Weighted
Average | |
| First-lien senior secured debt investments | | $ | 1,719,182 | | | Discounted cash flow analysis | | Discount rate | | | 8.2% - 15.0 | % | | | 10.1 | % |
| Preferred equity investment | | | 11,114 | | | Discounted cash flow analysis | | Discount rate | | | 15.0 | % | | | 15.0 | % |
| Preferred equity investment | | | 500 | | | Precedent Transaction Analysis | | Original cost | | | 1.0 | | | | 1.0 | |
| Common equity investment | | | 1,750 | | | Precedent Transaction Analysis | | Original cost | | | 1.0 | | | | 1.0 | |
| Other equity investments | | | 9,373 | | | Comparable Multiples | | EV / EBITDA | | | 7.6 - 17.2 | | | | 11.3 | |
| | | $ | 1,741,919 | | | | | | | | | | | | | |
| | | As of December 31, 2023 | |
| | | | | | Valuation | | Unobservable | | | | | Weighted | |
| | | Fair Value | | | Technique | | Input | | Range | | | Average | |
| First-lien senior secured debt investments | | $ | 1,346,174 | | | Discounted cash flow analysis | | Discount rate | | | 8.3% – 15.0 | % | | | 10.2 | % |
| Preferred equity investment | | | 9,287 | | | Discounted cash flow analysis | | Discount rate | | | 15.0 | % | | | 15.0 | % |
| Other equity investments | | | 8,037 | | | Comparable Multiples | | EV / EBITDA | | | 7.1 – 17.2 | | | | 11.5 | |
| | | $ | 1,363,498 | | | | | | | | | | | | | |
Kayne Anderson BDC, Inc.
Notes to Consolidated Financial Statements
(amounts in 000’s, except share and per share amounts)
Note 6. Debt
Corporate Credit Facility
As of December 31, 2024, the Company had a senior secured revolving credit facility (the “Corporate Credit Facility”), that has a total commitment of $475,000, $400,000 of which has a maturity date of November 22, 2029 and the remaining $75,000 of which has a maturity date of February 18, 2027, following the Company’s amendment of the Corporate Credit Facility on November 22, 2024. The Corporate Credit Facility also provides for a feature that allows the Company, under certain circumstances, to increase the overall size of the Corporate Credit Facility to a maximum of $600,000. The interest rate on the Corporate Credit Facility is equal to Term SOFR (a forward-looking rate based on SOFR futures) plus an applicable spread of 2.10% per annum or an “alternate base rate” (as defined in the agreements governing the Corporate Credit Facility) plus an applicable spread of 1.00%. The Company is also required to pay a commitment fee of 0.375% per annum on any unused portion of the Corporate Credit Facility.
Under the Corporate Credit Facility, the Company is required to comply with various covenants, reporting requirements and other customary requirements for similar revolving credit facilities, including, without limitation, covenants related to: (a) limitations on the incurrence of additional indebtedness and liens, (b) limitations on certain investments, (c) limitations on certain restricted payments, (d) maintaining a certain minimum stockholders’ equity, and (e) maintaining a ratio of total assets (less total liabilities not representing indebtedness) to total indebtedness of the Company and its consolidated subsidiaries of not less than 1.5:1.0. These covenants are subject to important limitations and exceptions that are described in the agreements governing the Corporate Credit Facility. Amounts available to borrow under the Corporate Credit Facility are subject to compliance with a borrowing base that applies different advance rates to different types of assets (based on their value as determined pursuant to the Corporate Credit Facility) that are pledged as collateral. The Corporate Credit Facility is secured by certain assets in the Company’s portfolio and excludes investments held by Kayne Anderson BDC Financing LLC (“KABDCF”) under the Revolving Funding Facility and by Kayne Anderson BDC Financing II, LLC (“KABDCF II”) under the Revolving Funding Facility II (each as defined below).
For the years ended December 31, 2024 and 2023, the average amount of borrowings outstanding under the Corporate Credit Facility was $173,911 and $251,655, respectively, with a weighted average interest rate of 7.42% and 7.35%, respectively, for the Corporate Facility portion. As of December 31, 2024, the Company had $250,000 outstanding under the Corporate Credit Facility at a weighted average interest rate of 6.49%. See Note 13 – Subsequent Events.
Revolving Funding Facility
As of December 31, 2024, the Company had a senior secured revolving funding facility (the “Revolving Funding Facility”), that has a total commitment of $600,000. On April 3, 2024, the Company and its wholly owned, special purpose financing subsidiary, Kayne Anderson BDC Financing, LLC (“KABDCF”), amended the Revolving Funding Facility. Under the terms of the third amendment, the Company and KABDCF increased the commitment amount from $455,000 to $600,000. The end of the reinvestment period was extended to April 2, 2027, and the maturity date was extended to April 3, 2029. The interest rate on the Revolving Funding Facility was reduced from daily SOFR plus 2.75% per annum to SOFR plus 2.375% - 2.50% per annum depending on the mix of loans securing the Revolving Funding Facility. All other terms of the Revolving Funding Facility remained substantially the same. The Revolving Funding Facility is secured by all of the assets held by KABDCF and the Company has agreed that it will not grant or allow a lien on the membership interest of KABDCF.
KABDCF is also required to pay a commitment fee of between 0.50% and 1.50% per annum depending on the size of the unused portion of the Revolving Funding Facility. Amounts available to borrow under the Revolving Funding Facility are subject to a borrowing base that applies different advance rates to different types of assets held by KABDCF and is subject to limitations with respect to the loans securing the Revolving Funding Facility, including restrictions on, loan size, industry concentration, payment frequency and status, as well as restrictions on portfolio company leverage, all of which may also affect the borrowing base and therefore amounts available to borrow. The Company and KABDCF are also required to comply with various covenants, reporting requirements and other customary requirements for similar facilities. These covenants are subject to important limitations and exceptions that are described in the agreements governing the Revolving Funding Facility. See Note 13 – Subsequent Events.
Kayne Anderson BDC, Inc.
Notes to Consolidated Financial Statements
(amounts in 000’s, except share and per share amounts)
For the years ended December 31, 2024 and 2023, the average amount of borrowings outstanding under the Revolving Funding Facility was $371,041 and $290,890, respectively, with a weighted average interest rate of 7.67% and 7.74%, respectively. As of December 31, 2024, the Company had $420,000 outstanding under the Revolving Funding Facility at a weighted average interest rate of 6.72 %.
Revolving Funding Facility II
As of December 31, 2024, the Company and Kayne Anderson BDC Financing II, LLC (“KABDCF II”), a wholly-owned, special purpose financing subsidiary, had a senior secured revolving credit facility (the “Revolving Funding Facility II”). The Revolving Funding Facility II has an initial commitment of $150,000 which, under certain circumstances, can be increased up to $500,000. The Revolving Funding Facility II is secured by all of the assets held by KABDCF II and the Company has agreed that it will not grant or allow a lien on the membership interest of KABDCF II. The end of the reinvestment period and the stated maturity date for the Revolving Funding Facility II are December 22, 2026, and December 22, 2028, respectively. The interest rate on the Revolving Funding Facility II is equal to 3-month term SOFR plus 2.70% per annum. KABDCF II is also required to pay a commitment fee of 0.50% between December 22, 2023 and September 22, 2024 and 0.75% thereafter on the unused portion of the Revolving Funding Facility II.
Amounts available to borrow under the Revolving Funding Facility II are subject to a borrowing base that has limitations with respect to the loans securing the Revolving Funding Facility II, including limitations on, loan size, payment frequency and status, sector concentrations, as well as restrictions on portfolio company leverage, all of which may also affect the borrowing base and therefore amounts available to borrow. The Company and KABDCF II are also required to comply with various covenants, reporting requirements and other customary requirements for similar facilities. These covenants are subject to important limitations and exceptions that are described in the agreements governing the Revolving Funding Facility II.
For the year ended December 31, 2024, the average amount of borrowings outstanding under the Revolving Funding Facility was $82,432, with a weighted average interest rate of 7.84%. For the period ended December 22, 2023 through December 31, 2023, the average amount of borrowings outstanding under the Revolving Funding Facility II was $70,000, with a weighted average interest rate of 8.07%. As of December 31, 2024, the Company had $113,000 outstanding under the Revolving Funding Facility II at a weighted average interest rate of 7.29%. See Note 13 – Subsequent Events.
Subscription Credit Agreement
On April 1, 2024, the Company fully repaid all amounts outstanding and terminated the remaining commitment of $50,000 under its credit agreement (the “Subscription Credit Agreement”) that was scheduled to mature on December 31, 2024. The Subscription Credit Agreement permitted the Company to elect the commitment amount each quarter to borrow up to $50,000, subject to availability under the borrowing base which was calculated based on the unused capital commitments of the investors meeting various eligibility requirements. The interest rate under the Subscription Credit Agreement was equal to the Secured Overnight Financing Rate (“SOFR”) plus 2.25% (subject to a 0.275% SOFR floor). The Company was also required to pay a commitment fee of 0.25% per annum on any unused portion of the Subscription Credit Agreement. The Company also paid an extension fee of 0.075% per quarter on the elected commitment amount on the first day of each calendar quarter.
For the years ended December 31, 2024 and 2023, the average amount of borrowings outstanding under the Subscription Credit Agreement were $3,306 and $41,782, respectively, with a weighted average interest rate of 7.61% and 7.03%, respectively.
Senior Unsecured Notes
As of December 31, 2024, the Company had $75,000 aggregate principal amount of senior unsecured notes (the “Notes”).
Kayne Anderson BDC, Inc.
Notes to Consolidated Financial Statements
(amounts in 000’s, except share and per share amounts)
The table below sets forth a summary of the key terms of each series of Notes outstanding at December 31, 2024.
| Series | | Principal
Outstanding
December 31,
2024 | | | Unamortized
Issuance
Costs | | | Estimated
Fair Value
December 31,
2024 | | | Fixed
Interest
Rate | | | Maturity |
| A | | $ | 25,000 | | | $ | 196 | | | $ | 26,860 | | | | 8.65 | % | | 6/30/2027 |
| B | | | 50,000 | | | | 447 | | | | 54,580 | | | | 8.74 | % | | 6/30/2028 |
| | | $ | 75,000 | | | $ | 643 | | | $ | 81,440 | | | | | | | |
Holders of the Notes are entitled to receive cash interest payments semi-annually (on January 30 and July 30) at the fixed rate. As of December 31, 2024, the weighted average interest rate on the outstanding Notes was 8.71%.
As of December 31, 2024, the Notes were rated “BBB” by Kroll Bond Rating Agency (“KBRA”). The Company is required to maintain a current rating from one rating agency with respect to the Notes. In the event the Company does not maintain a current rating from a rating agency for a specified period of time or the credit rating on the Notes falls below “BBB-” (a “Below Investment Grade Event”), the interest rate per annum on the Notes will increase by 1.0% during the period the Notes are rated below “BBB-”. In the event the Company’s Secured Debt Ratio exceeds 55% (a “Secured Debt Ratio Event”), the interest rate per annum on the Notes will increase by 1.5% during the period the ratio is above stated percentage. If a Below Investment Grade Event and a Secured Debt Ratio Event is continuing at the same time the aggregate increase in interest rate per annum will not exceed 2.0%.
The Notes were issued in private placement offerings to institutional investors and are not listed on any exchange or automated quotation system. The Notes contain various covenants related to other indebtedness, liens and limits on the Company’s overall leverage. The Company must maintain a minimum amount of shareholder equity and the Company’s asset coverage ratio must be greater than 150% as of the last business day of each fiscal quarter. The Notes are redeemable in certain circumstances at the option of the Company and may be redeemed under certain circumstances to cure the asset coverage ratio covenant.
The Notes are unsecured obligations of the Company and, upon liquidation, dissolution or winding up of the Company, will rank: (1) senior to all of the Company’s outstanding common shares; (2) on parity with any unsecured creditors of the Company and any unsecured senior securities representing indebtedness of the Company; and (3) junior to any secured creditors of the Company.
At December 31, 2024, the Company was in compliance with all covenants under the Notes agreements.
Debt obligations consisted of the following as of December 31, 2024 and 2023.
| | | December 31, 2024 | |
| | | Aggregate
Principal Committed | | | Outstanding
Principal | | | Amount
Available(1) | | | Net
Carrying
Value(2) | |
| Notes | | $ | 75,000 | | | $ | 75,000 | | | $ | - | | | $ | 74,357 | |
| Corporate Credit Facility | | | 475,000 | | | | 250,000 | | | | 225,000 | | | | 246,765 | |
| Revolving Funding Facility | | | 600,000 | | | | 420,000 | | | | 180,000 | | | | 415,254 | |
| Revolving Funding Facility II | | | 150,000 | | | | 113,000 | | | | 37,000 | | | | 111,749 | |
| Total debt | | $ | 1,300,000 | | | $ | 858,000 | | | $ | 442,000 | | | $ | 848,125 | |
| (1) | The amounts available under the Company’s credit facilities do not reflect any limitations related to each borrowing base as of December 31, 2024. |
| | | |
| (2) | The carrying value of the Notes, Corporate Credit Facility, Revolving Funding Facility and Revolving Funding Facility II are presented net of deferred financing costs totaling $9,875. |
Kayne Anderson BDC, Inc.
Notes to Consolidated Financial Statements
(amounts in 000’s, except share and per share amounts)
| | | December 31, 2023 | |
| | | Aggregate
Principal
Committed | | | Outstanding Principal | | | Amount Available(1) | | | Net Carrying Value(2) | |
| Notes | | $ | 75,000 | | | $ | 75,000 | | | $ | - | | | $ | 74,149 | |
| Corporate Credit Facility | | | 400,000 | | | | 234,000 | | | | 166,000 | | | | 232,285 | |
| Revolving Funding Facility | | | 455,000 | | | | 306,000 | | | | 18,536 | | | | 303,981 | |
| Revolving Funding Facility II | | | 150,000 | | | | 70,000 | | | | 9,716 | | | | 68,195 | |
| Subscription Credit Agreement | | | 50,000 | | | | 10,750 | | | | 39,250 | | | | 10,709 | |
| Total debt | | $ | 1,130,000 | | | $ | 695,750 | | | $ | 233,502 | | | $ | 689,319 | |
| (1) | The amount available under the Company’s credit facilities reflects the assets held at KABDCF and KABDCF II and any limitations related to each borrowing base as of December 31, 2023. |
| (2) | The carrying value of the Notes, Corporate Credit Facility, Revolving Funding Facility, Revolving Funding Facility II and Subscription Credit Agreement are presented net of deferred financing costs totaling $6,431. |
For the years ended December 31, 2024, 2023 and 2022, the components of interest expense were as follows:
| | | For the years ended | |
| | | December 31,
2024 | | | December 31,
2023 | | | December 31,
2022 | |
| Interest expense | | $ | 57,798 | | | $ | 49,620 | | | $ | 18,170 | |
| Amortization of debt issuance costs | | | 3,718 | | | | 2,694 | | | | 2,122 | |
| Total interest expense | | $ | 61,516 | | | $ | 52,314 | | | $ | 20,292 | |
| Average interest rate | | | 8.6 | % | | | 8.4 | % | | | 5.5 | % |
| Average borrowings | | $ | 705,690 | | | $ | 624,464 | | | $ | 368,182 | |
Kayne Anderson BDC, Inc.
Notes to Consolidated Financial Statements
(amounts in 000’s, except share and per share amounts)
Note 7. Share Transactions
Common Stock Issuances
The following tables summarize the number of common stock shares issued and aggregate proceeds received from such issuances related to the Company’s capital call notices pursuant to subscription agreements with investors for the years ended December 31, 2024, 2023 and 2022. See Note 13 – Subsequent Events.
On May 24, 2024, the Company completed its IPO, issuing 6,000,000 shares of its common stock at a public offering price of $16.63 per share. Net of underwriting fees and offering expenses, the Company received net cash proceeds of $92,363. The Company’s common stock began trading on the NYSE under the ticker symbol “KBDC” on May 22, 2024.
| For the year ended December 31, 2024 |
| Common stock issue date | | Offering price per share | | | Common stock shares issued | | | Aggregate offering amount | |
| February 14, 2024 | | $ | 16.74 | | | | 7,089,771 | | | $ | 118,689 | |
| April 2, 2024 | | $ | 16.63 | | | | 16,232,415 | | | | 269,945 | |
| May 24, 2024 | | $ | 16.63 | | | | 6,000,000 | | | | 99,780 | |
| Total common stock issued | | | | | | | 29,322,186 | | | $ | 488,414 | |
| For the year ended December 31, 2023 | |
| | | Offering | | | | | | Aggregate | |
| | | price per | | | Common stock | | | offering | |
| Common stock issue date | | share | | | shares issued | | | amount | |
| April 4, 2023 | | $ | 16.61 | | | | 3,010,942 | | | $ | 50,000 | |
| August 8, 2023 | | $ | 16.82 | | | | 2,411,582 | | | | 40,575 | |
| Total common stock issued | | | | | | | 5,422,524 | | | $ | 90,575 | |
| For the year ended December 31, 2022 | |
| | | Offering | | | | | | Aggregate | |
| | | price per | | | Common stock | | | offering | |
| Common stock issue date | | share | | | shares issued | | | amount | |
| January 24, 2022 | | $ | 16.36 | | | | 4,191,292 | | | $ | 68,582 | |
| July 22, 2022 | | $ | 16.30 | | | | 7,666,830 | | | | 125,000 | |
| October 31, 2022 | | $ | 16.58 | | | | 1,485,844 | | | | 24,636 | |
| December 9, 2022 | | $ | 16.89 | | | | 2,961,068 | | | | 50,000 | |
| Total common stock issued | | | | | | | 16,305,034 | | | $ | 268,218 | |
Kayne Anderson BDC, Inc.
Notes to Consolidated Financial Statements
(amounts in 000’s, except share and per share amounts)
Share Repurchase Plan
On May 21, 2024, the Company entered into a share repurchase plan, or the Company 10b5-1 Plan, to acquire up to $100,000 in the aggregate of the Company’s Common Stock at prices below the Company’s net asset value per share over a specified period, in accordance with the guidelines specified in Rule 10b5-1 and Rule 10b-18 of the Securities Exchange Act of 1934, as amended. The Company 10b5-1 Plan was approved by the Board of Directors on March 6, 2024. The Company 10b5-1 Plan requires Morgan Stanley Corporation as the Company’s agent, to repurchase Common Stock on its behalf when the market price per share is below the most recently reported net asset value per share (including any updates, corrections or adjustments publicly announced by the Company to any previously announced net asset value per share, including any distributions declared). Under the Company 10b5-1 Plan, the volume of purchases would be expected to increase as the price of the Company’s Common Stock declines, subject to volume restrictions. The timing and amount of any share repurchases will depend on the terms and conditions of the Company 10b5-1 Plan, the market price of the Company’s Common Stock and trading volumes, and no assurance can be given that Common Stock be repurchased in any particular amount or at all. The repurchase of shares pursuant to the Company 10b5-1 Plan is intended to satisfy the conditions of Rule 10b5-1 and Rule 10b-18 under the Exchange Act, and will otherwise be subject to applicable law, including Regulation M, which may prohibit repurchases under certain circumstances. The Company 10b5-1 Plan commenced beginning 60 calendar days following the end of the “restricted period” under Regulation M and will terminate upon the earliest to occur of (i) the close of business on May 24, 2025, (ii) the end of the trading day on which the aggregate purchase price for all shares purchased under the Company 10b5-1 Plan equals $100,000 and (iii) the occurrence of certain other events described in the Company 10b5-1 Plan.
The “restricted period” under Regulation M ended upon the closing of the Company’s IPO and, therefore, the Common Stock repurchases/purchases described above began on July 23, 2024.
For the year ended December 31, 2024, the agent has repurchased shares of common stock pursuant to the Plan as follows:
| Period | | Total number of shares
repurchased | | | Average
price paid
per share | | | Approximate
dollar
value of
shares that
have been purchased
under the plan | | | Approximate
dollar
value of
shares that
may yet be
purchased
under the plan | |
| July 23 - 31, 2024 | | | 12,861 | | | $ | 16.20 | | | $ | 208 | | | $ | 99,792 | |
| August 1 - 31, 2024 | | | 38,271 | | | $ | 16.08 | | | | 615 | | | $ | 99,177 | |
| September 1 - 30, 2024 | | | 17,548 | | | $ | 16.16 | | | | 284 | | | $ | 98,893 | |
| October 1 - 31, 2024 | | | 19,810 | | | $ | 16.08 | | | | 319 | | | $ | 98,574 | |
| November 1 - 30, 2024 | | | 6,123 | | | $ | 16.24 | | | | 99 | | | $ | 98,475 | |
| Total stock repurchased | | | 94,613 | | | | | | | $ | 1,525 | | | | | |
Kayne Anderson BDC, Inc.
Notes to Consolidated Financial Statements
(amounts in 000’s, except share and per share amounts)
Dividends and Dividend Reinvestment
The following tables summarize the dividends declared and payable by the Company for the years ended December 31, 2024, 2023 and 2022. For the year ended December 31, 2024, the $0.10 per share dividend with a payment date of December 20, 2024 was one of three special dividends declared by the Board of Directors in conjunction with the Company’s IPO in May 2024. See Note 13 – Subsequent Events.
| For the year ended December 31, 2024 | |
| Dividend declaration date | | Dividend record date | | Dividend payment date | | Dividend
per share | |
| March 6, 2024 | | March 29, 2024 | | April 17, 2024 | | $ | 0.40 | |
| May 8, 2024 | | June 28, 2024 | | July 15, 2024 | | | 0.40 | |
| August 7, 2024 | | September 30, 2024 | | October 15, 2024 | | | 0.40 | |
| May 8, 2024 | | December 5, 2024 | | December 20, 2024 | | | 0.10 | |
| November 6, 2024 | | December 31, 2024 | | January 15, 2025 | | | 0.40 | |
| Total dividends declared | | | | | | $ | 1.70 | |
| For the year ended December 31, 2023 | |
| | | | | | | Dividend | |
| Dividend declaration date | | Dividend record date | | Dividend payment date | | per share | |
| March 7, 2023 | | March 31, 2023 | | April 14, 2023 | | $ | 0.47 | |
| May 10, 2023 | | June 30, 2023 | | July 14, 2023 | | | 0.53 | |
| August 10, 2023 | | September 29, 2023 | | October 13, 2023 | | | 0.53 | |
| November 9, 2023 | | December 29, 2023 | | January 16, 2024 | | | 0.53 | |
| Total dividends declared | | | | | | $ | 2.06 | |
| For the year ended December 31, 2022 | |
| | | | | | | Dividend | |
| Dividend declaration date | | Dividend record date | | Dividend payment date | | per share | |
| April 19, 2022 | | April 20, 2022 | | April 26, 2022 | | $ | 0.26 | |
| July 19, 2022 | | July 20, 2022 | | July 27, 2022 | | | 0.30 | |
| October 18, 2022 | | October 13, 2022 | | October 25, 2022 | | | 0.35 | |
| December 16, 2022 | | December 29, 2022 | | January 13, 2023 | | | 0.43 | |
| Total dividends declared | | | | | | $ | 1.34 | |
The following tables summarize the amounts received and shares of common stock issued to shareholders pursuant to the Company’s dividend reinvestment plan (“DRIP”) for the years ended December 31, 2024, 2023 and 2022. See Note 13 - Subsequent Events.
| For the year ended December 31, 2024 | |
| | | | DRIP | | | | |
| | | | shares | | | DRIP | |
| Dividend record date | | Dividend payment date | | issued | | | value | |
| December 29, 2023 | | January 16, 2024 | | | 95,791 | | | $ | 1,573 | |
| March 29, 2024 | | April 17, 2024 | | | 94,816 | | | | 1,577 | |
| June 28, 2024 | | July 15, 2024 | | | - | | | | - | |
| September 30, 2024 | | October 15, 2024 | | | - | | | | - | |
| December 5, 2024 | | December 20, 2024 | | | 37,843 | | | | 632 | |
| | | | | | 228,450 | | | $ | 3,782 | |
For the dividend paid on July 15, 2024, the DRIP value was $4,431 and fulfilled through open market purchases of common stock.
For the dividend paid on October 15, 2024, the DRIP value was $4,521 and was fulfilled through open market purchases of common stock.
Kayne Anderson BDC, Inc.
Notes to Consolidated Financial Statements
(amounts in 000’s, except share and per share amounts)
For the dividend paid on December 20, 2024, the DRIP value was $1,084. Of this DRIP amount, $452 was fulfilled through open market purchases of common stock and $632 was fulfilled with the issuance of 37,843 shares of common stock.
For the dividend paid on January 15, 2025, the DRIP value was $3,923. This DRIP is excluded from the table above, as the DRIP share activity was after December 31, 2024.
| For the year ended December 31, 2023 |
| | | | | DRIP | | | | |
| | | | | shares | | | DRIP | |
| Dividend record date | | Dividend payment date | | issued | | | value | |
| December 29, 2022 | | January 13, 2023 | | | 57,860 | | | $ | 955 | |
| March 31, 2023 | | April 14, 2023 | | | 65,733 | | | | 1,089 | |
| June 30, 2023 | | July 14, 2023 | | | 81,527 | | | | 1,352 | |
| September 29, 2023 | | October 13, 2023 | | | 96,731 | | | | 1,586 | |
| | | | | | 301,851 | | | $ | 4,982 | |
For the dividend paid on January 16, 2024, there were 95,791 shares issued with a DRIP value of $1,573. These shares are excluded from the table above, as the DRIP shares were issued after December 31, 2023.
| For the year ended December 31, 2022 |
| | | | | DRIP | | | | |
| | | | | shares | | | DRIP | |
| Dividend record date | | Dividend payment date | | issued | | | value | |
| December 29, 2021 | | January 18, 2022 | | | 55,590 | | | $ | 902 | |
| April 20, 2022 | | April 26, 2022 | | | 75,270 | | | | 1,222 | |
| July 20, 2022 | | July 27, 2022 | | | 88,081 | | | | 1,431 | |
| October 13, 2022 | | October 25, 2022 | | | 127,414 | | | | 2,087 | |
| | | | | | 346,355 | | | $ | 5,642 | |
For the dividend paid on January 13, 2023, there were 57,860 shares issued with a DRIP value of $955. These shares are excluded from the table above, as the DRIP shares were issued after December 31, 2022.
On May 10, 2024, in conjunction with the Company’s IPO, the Board of Directors declared the following special dividends:
| Record date | | Pay date | | Special Dividend | |
| December 5, 2024 | | December 20, 2024 | | $ | 0.10 | |
| March 3, 2025 | | March 18, 2025 | | $ | 0.10 | |
| June 9, 2025 | | June 24, 2025 | | $ | 0.10 | |
Note 8. Commitments and Contingencies
The Company had an aggregate of $186,282 and $147,928, respectively, of unfunded commitments to provide debt financing to its portfolio companies as of December 31, 2024 and December 31, 2023. Such commitments are generally subject to the satisfaction of certain financial and nonfinancial covenants and certain operational metrics. The commitment period for these amounts may be shorter than the maturity date if drawn or funded. These commitments are not reflected in the Company’s consolidated statement of assets and liabilities. Consequently, such commitments result in an element of credit risk in excess of the amount recognized in the Company’s consolidated statement of assets and liabilities.
Kayne Anderson BDC, Inc.
Notes to Consolidated Financial Statements
(amounts in 000’s, except share and per share amounts)
A summary of the composition of the unfunded commitments as of December 31, 2024 and 2023 is shown in the table below.
| | | As of | | | As of | |
| | | December 31,
2024 | | | December 31,
2023 | |
| Alcami Corporation (Alcami) | | $ | 1,447 | | | $ | 2,543 | |
| Allcat Claims Service, LLC | | | 10,803 | | | | 5,370 | |
| Allentown, LLC | | | 663 | | | | 785 | |
| American Equipment Holdings LLC | | | 2,922 | | | | 483 | |
| American Soccer Company, Incorporated (SCORE) | | | 2,601 | | | | 2,601 | |
| Arborworks Acquisition LLC | | | 1,792 | | | | 1,872 | |
| MRC Keystone Acquisition LLC (Automated Handing Solutions) | | | 3,864 | | | | - | |
| Basel U.S. Acquisition Co., Inc. (IAC) | | | 2,930 | | | | 1,622 | |
| BCI Burke Holding Corp. | | | - | | | | 4,659 | |
| OAO Acquisitions, Inc. (BearCom) | | | 2,482 | | | | 6,982 | |
| Bloomington Holdco, LLC (BW Fusion) | | | 6,421 | | | | - | |
| BLP Buyer, Inc. (Bishop Lifting Products) | | | 2,878 | | | | 6,548 | |
| BR PJK Produce, LLC (Keany) | | | - | | | | 2,870 | |
| Carton Packaging Buyer, Inc. | | | 2,848 | | | | 2,848 | |
| CCFF Buyer, Inc (California Custom Fruits & Flavors, LLC) | | | 9,812 | | | | - | |
| CGI Automated Manufacturing, LLC | | | 2,242 | | | | 2,390 | |
| City Line Distributors, LLC | | | 2,530 | | | | 5,322 | |
| Curio Brands, LLC | | | 1,719 | | | | 1,719 | |
| DISA Holdings Corp. (DISA) | | | 3,331 | | | | 6,142 | |
| Diverzify Intermediate, LLC | | | 3,155 | | | | - | |
| DRS Holdings III, Inc. (Dr. Scholl’s) | | | 310 | | | | 310 | |
| Eastern Wholesale Fence | | | 198 | | | | 1,332 | |
| EIS Legacy, LLC | | | - | | | | 6,922 | |
| Energy Acquisition LP (Electrical Components International, Inc. - ECI) | | | 1,442 | | | | - | |
| Envirotech Services, LLC | | | 6,746 | | | | - | |
| Eppinger Technologies, LLC | | | 1,145 | | | | 1,450 | |
| FCA, LLC (FCA Packaging) | | | - | | | | 2,670 | |
| Fastener Distribution Holdings, LLC | | | 7,502 | | | | - | |
| Foundation Consumer Brands | | | 577 | | | | 577 | |
| Fralock Buyer LLC | | | - | | | | 300 | |
| Guardian Dentistry Partners | | | 773 | | | | - | |
| Guided Practice Solutions: Dental, LLC (GPS) | | | - | | | | 10,299 | |
| Gulf Pacific Holdings, LLC | | | 1,798 | | | | 10,153 | |
| Gusmer Enterprises, Inc. | | | 3,676 | | | | 3,676 | |
| Home Brands Group Holdings, Inc. (ReBath) | | | 2,099 | | | | 2,099 | |
| I.D. Images Acquisition, LLC | | | 2,020 | | | | 2,020 | |
| IF&P Foods, LLC (FreshEdge) | | | 2,813 | | | | 1,656 | |
| Improving Acquisition LLC | | | 1,672 | | | | 1,672 | |
| Krayden Holdings, Inc. | | | 5,438 | | | | 5,438 | |
| Superior Intermediate LLC (Landmark Structures) | | | 10,006 | | | | - | |
| Light Wave Dental Management LLC | | | 4,171 | | | | 827 | |
| LSL Industries, LLC (LSL Healthcare) | | | 5,224 | | | | 15,224 | |
| MacNeill Pride Group | | | 1,798 | | | | 3,877 | |
| ML Buyer, LLC (Mama Lycha Foods, LLC) | | | 3,991 | | | | - | |
| NMA Holdings, LLC (Neuromonitoring Associates) | | | 7,459 | | | | - | |
| Phoenix YW Buyer, Inc. (Elida Beauty) | | | 1,960 | | | | - | |
| Pixel Intermediate, LLC | | | 1,482 | | | | - | |
| PMFC Holding, LLC | | | - | | | | 137 | |
| Redwood MSO, LLC | | | 2,784 | | | | - | |
| Refocus Management Services, LLC | | | 6,269 | | | | - | |
| Regiment Security Partners LLC | | | 104 | | | | 104 | |
| The Robinette Company | | | 5,047 | | | | - | |
| Ruff Roofers Buyer, LLC | | | 7,138 | | | | 10,966 | |
| SGA Dental Partners Holdings, LLC | | | - | | | | 5,087 | |
| Siegel Egg Co., LLC | | | 501 | | | | 537 | |
| Silk Holdings III Corp. (Suave) | | | 6,667 | | | | - | |
| Speedstar Holding LLC | | | 666 | | | | - | |
| Sundance Holdings Group, LLC | | | - | | | | 439 | |
| Tapco Buyer LLC | | | 9,435 | | | | - | |
| Trademark Global LLC | | | 480 | | | | 480 | |
| US Anchors Group, Inc. (Mechanical Plastics Corp.) | | | 2,819 | | | | - | |
| United Safety & Survivability Corporation (USSC) | | | - | | | | 469 | |
| USALCO, LLC | | | - | | | | 1,494 | |
| Vehicle Accessories, Inc. | | | 2,064 | | | | 1,671 | |
| Workholding US Holdings, LLC (Forkardt Hardinge) | | | 3,144 | | | | - | |
| Worldwide Produce Acquisition, LLC | | | 424 | | | | 1,286 | |
| Total unfunded commitments | | $ | 186,282 | | | $ | 147,928 | |
From time to time, the Company may become a party to certain legal proceedings incidental to the normal course of its business. As of December 31, 2024 and 2023, management was not aware of any material pending or threatened litigation that would require accounting recognition or financial statement disclosure.
Kayne Anderson BDC, Inc.
Notes to Consolidated Financial Statements
(amounts in 000’s, except share and per share amounts)
Note 9. Earnings Per Share
In accordance with the provisions of ASC Topic 260, Earnings per Share (“ASC 260”), basic earnings per share is computed by dividing earnings available to common stockholders by the weighted average number of shares outstanding during the period. Other potentially dilutive common shares, and the related impact to earnings, are considered when calculating earnings per share on a diluted basis. As of December 31, 2024, 2023 and 2022, there were no dilutive shares.
The following table sets forth the computation of basic and diluted earnings per share of common stock for the years ended December 31, 2024, 2023 and 2022.
| | | For the years ended | |
| | | December 31,
2024 | | | December 31,
2023 | | | December 31,
2022 | |
| | | | | | | | | | |
| Net increase (decrease) in net assets resulting from operations | | $ | 131,940 | | | $ | 77,075 | | | $ | 45,765 | |
| Weighted average shares of common stock outstanding - basic and diluted | | | 63,762,377 | | | | 39,250,232 | | | | 27,184,302 | |
| Earnings (loss) per share of common stock - basic and diluted | | $ | 2.07 | | | $ | 1.96 | | | $ | 1.68 | |
Note 10. Income Taxes
The Company has elected to be treated as a RIC under the Code beginning with the taxable year end December 31, 2021. As a RIC, the Company is not subject to a federal excise tax based on distributive requirements of its taxable income on a calendar year basis. Depending on the level of taxable income earned in a tax year, the Company may choose to carry forward taxable income in excess of current year distributions into the next tax year and pay a 4% excise tax on such income, to the extent required.
The Company makes certain adjustments to the classification of net assets as a result of permanent book-to-tax differences, which include differences in the book and tax basis of certain assets and liabilities, and nondeductible federal taxes or losses among other items. To the extent these differences are permanent, they are charged or credited to additional paid in capital, or total distributable earnings (losses), as appropriate.
The permanent differences for tax purposes from distributable earnings to additional paid in capital were reclassified for tax purposes for the tax years ended December 31, 2024, 2023 and 2022.
These reclassifications have no impact on net assets.
| | | For the years ended | |
| | | December 31,
2024 | | | December 31,
2023 | | | December 31,
2022 | |
| Increase (decrease) in distributable earnings | | $ | 819 | | | $ | 101 | | | $ | 29 | |
| Increase (decrease) in additional paid-in capital | | $ | (819 | ) | | $ | (101 | ) | | $ | (29 | ) |
Taxable income generally differs from the net increase in net assets resulting from operations for financial reporting purposes due to (1) unrealized appreciation (depreciation) on investments, as gains and losses are generally not included in taxable income until these are realized; (2) income or loss recognition on exited investments; (3) non-deductible U.S. federal excise taxes; and (4) other non-deductible expense.
The following reconciles net increase in net assets resulting from operations to taxable income for the years ended December 31, 2024, 2023 and 2022:
| | | For the years ended | |
| | | December 31,
2024 | | | December 31,
2023 | | | December 31,
2022 | |
| Net increase (decrease) in net assets resulting from operations | | $ | 131,940 | | | $ | 77,075 | | | $ | 45,765 | |
| Net change in unrealized losses (gains) from investments, net of deferred income tax expense, if any | | | (2,098 | ) | | | (2,944 | ) | | | (5,502 | ) |
| Net realized gains from investments(1) | | | (570 | ) | | | - | | | | - | |
| Non-deductible expenses, including excise taxes and offering costs disallowed | | | 819 | | | | 101 | | | | 29 | |
| Capital loss carryforward | | | - | | | | 10,686 | | | | - | |
| Other book tax differences | | | (66 | ) | | | (65 | ) | | | (67 | ) |
| Taxable income before deductions for distributions | | $ | 130,025 | | | $ | 84,853 | | | $ | 40,225 | |
| (1) | The realized gains of $570 are offset by capital losses generated for the year ended December 31, 2023 of $10,686. |
For income tax purposes, distributions made to stockholders are reported as ordinary income, capital gains, non-taxable return of capital, or a combination thereof.
Kayne Anderson BDC, Inc.
Notes to Consolidated Financial Statements
(amounts in 000’s, except share and per share amounts)
For the years ended December 31, 2024 and 2023, the Company incurred $817 and $101, respectively, of U.S. federal excise tax. There was no U.S. federal excise tax incurred for the year ended December 31, 2022.
The final determination of tax character will not be made until the Company files its tax return for each tax year and the tax characteristics of all distributions will be reported to stockholders on Form 1099 after the end of each calendar year. The tax character of distributions paid to stockholders during the tax years ended December 31, 2024, 2023 and 2022 were as follows.
| | | For the years ended | |
| | | December 31,
2024 | | | December 31,
2023 | | | December 31,
2022 | |
| | | | | | | | | | |
| Ordinary income | | $ | 111,908 | | | $ | 81,617 | | | $ | 39,553 | |
| Capital gains | | | - | | | | - | | | | - | |
| Return of capital | | | - | | | | - | | | | - | |
| Total | | $ | 111,908 | | | $ | 81,617 | | | $ | 39,553 | |
For the years ended December 31, 2024, 2023 and 2022, the components of accumulated earnings on a tax basis were as follows.
| | | For the years ended | |
| | | December 31,
2024 | | | December 31,
2023 | | | December 31,
2022 | |
| Undistributed net investment income (loss) | | $ | 22,345 | | | $ | 4,227 | | | $ | 991 | |
| Undistributed capital gains | | | - | | | | - | | | | - | |
| Capital loss carryforward | | | (13,357 | ) | | | (10,686 | ) | | | - | |
| Other accumulated gain (loss) | | | - | | | | - | | | | - | |
| Other temporary book / tax differences | | | (727 | ) | | | (792 | ) | | | (857 | ) |
| Net unrealized appreciation (depreciation), net of deferred income tax expense, if any | | | 25,614 | | | | 20,275 | | | | 17,331 | |
| Total | | $ | 33,875 | | | $ | 13,024 | | | $ | 17,465 | |
Capital losses can be carried forward indefinitely to offset future capital gains. As of December 31, 2024, the Company had a capital loss carryforward of $401, which was characterized as short-term, and $12,956, which was characterized as long-term. As of December 31, 2023, the Company had a capital loss carryforward of $263, which was characterized as short-term, and $10,423, which was characterized as long-term. As of December 31, 2022, the Company had no capital loss carryforwards.
As of December 31, 2024, 2023 and 2022, the Company’s aggregate unrealized appreciation and depreciation on investments based on cost for U.S. federal income tax purposes was as follows:
| | | For the years ended | |
| | | December 31,
2024 | | | December 31,
2023 | | | December 31,
2022 | |
| Tax cost | | $ | 2,017,154 | | | $ | 1,356,025 | | | $ | 1,157,635 | |
| | | | | | | | | | | | | |
| Gross unrealized appreciation | | | 36,977 | | | | 25,718 | | | | 21,476 | |
| Gross unrealized depreciation | | | (10,646 | ) | | | (5,443 | ) | | | (4,145 | ) |
| Net unrealized appreciation/(depreciation) on investments | | $ | 26,331 | | | $ | 20,275 | | | $ | 17,331 | |
KABDC Corp, LLC, a wholly owned subsidiary, has elected to be treated as a corporation for U.S. tax purposes. As such, KABDC Corp, LLC is subject to U.S. Federal, state and local taxes. For the Company’s tax year ended December 31, 2024, KABDC Corp, LLC had a deferred income tax expense and a net deferred tax liability of $717. The net deferred tax liability of $717 is included in accrued expense and other liabilities on the Company’s Consolidated Statement of Assets and Liabilities as of December 31, 2024. For the Company’s tax years ended December 31, 2023 and 2022, KABDC Corp, LLC did not have a material provision for income taxes.
FASB ASC Topic 740, Accounting for Uncertainty in Income Taxes (“ASC 740”) provides guidance for how uncertain tax positions should be recognized, measured, presented, and disclosed in the consolidated financial statements. ASC 740 requires the evaluation of tax positions taken or expected to be taken in the course of preparing the Company’s tax returns to determine whether the tax positions are “more-likely-than-not” of being sustained by the applicable tax authority. The Company recognizes the tax benefits of uncertain tax positions only where the position is “more likely than not” to be sustained assuming examination by tax authorities. As of December 31, 2024, 2023 and 2022, management has analyzed the Company’s tax positions, and has concluded that no liability for unrecognized tax benefits should be recorded related to uncertain tax positions taken in the Company’s current year tax return. The Company is not aware of any tax positions for which it is reasonably possible that the total amounts of unrecognized tax benefits will change materially in the next 12 months. Management’s determinations regarding ASC 740 may be subject to review and adjustment at a later date based upon factors including, but not limited to, an ongoing analysis of tax laws, regulations and interpretations thereof.
Kayne Anderson BDC, Inc.
Notes to Consolidated Financial Statements
(amounts in 000’s, except share and per share amounts)
Note 11. Financial Highlights
The following per share of common stock data has been derived from information provided in the audited financial statements. The following is a schedule of financial highlights for the years ended December 31, 2024, 2023, 2022 and 2021.
| | | For the years ended December 31, | |
| | | (amounts in thousands, except share and per share amounts) | |
| Per Common Share Operating Performance (1) | | 2024 | | | 2023 | | | 2022 | | | 2021 | |
| Net Asset Value, Beginning of Period(2) | | $ | 16.42 | | | $ | 16.50 | | | | 16.22 | | | $ | 14.86 | |
| | | | | | | | | | | | | | | | | |
| Results of Operations: | | | | | | | | | | | | | | | | |
| Net Investment Income | | | 2.03 | | | | 2.16 | | | | 1.48 | | | | 0.94 | |
| Net Realized and Unrealized Gain (Loss) on Investments(3) | | | 0.06 | | | | (0.18 | ) | | | 0.14 | | | | 1.28 | |
| Net Increase (Decrease) in Net Assets Resulting from Operations | | | 2.09 | | | | 1.98 | | | | 1.62 | | | | 2.22 | |
| | | | | | | | | | | | | | | | | |
| Distributions to Common Stockholders | | | | | | | | | | | | | | | | |
| Distributions | | | (1.70 | ) | | | (2.06 | ) | | | (1.34 | ) | | | (0.86 | ) |
| Net Decrease in Net Assets Resulting from Distributions | | | (1.70 | ) | | | (2.06 | ) | | | (1.34 | ) | | | (0.86 | ) |
| | | | | | | | | | | | | | | | | |
| Capital Share Transactions | | | | | | | | | | | | | | | | |
| Issuance of Common Stock, net of Underwriting and Offering Costs | | | (0.11 | ) | | | - | | | | - | | | | - | |
| Net Increase (Decrease) Resulting from Capital Share Transactions | | | (0.11 | ) | | | - | | | | - | | | | - | |
| Net Asset Value, End of Period | | $ | 16.70 | | | $ | 16.42 | | | $ | 16.50 | | | $ | 16.22 | |
| Per Share Market Value, End of Period | | $ | 16.54 | | | $ | N/A | | | | N/A | | | | N/A | |
| | | | | | | | | | | | | | | | | |
| Shares Outstanding, End of Period | | | 71,059,689 | | | | 41,603,666 | | | | 35,879,291 | | | | 19,227,902 | |
| | | | | | | | | | | | | | | | | |
| Ratio/Supplemental Data | | | | | | | | | | | | | | | | |
| Net assets, end of period | | $ | 1,186,342 | | | $ | 683,056 | | | | 592,041 | | | $ | 311,969 | |
| Weighted-average shares outstanding | | | 63,762,377 | | | | 39,250,232 | | | | 27,184,302 | | | | 10,718,083 | |
| Total Return based on net asset value(4) | | | 12.6 | % | | | 12.5 | % | | | 10.3 | % | | | 14.2 | % |
| Total Return based on market value(5) | | | 7.5 | % | | | N/A | | | | N/A | | | | N/A | |
| Portfolio turnover | | | 20.7 | % | | | 15.5 | % | | | 17.6 | % | | | 31.3 | % |
| Ratio of operating expenses to average net assets before waivers(6) | | | 10.1 | % | | | 11.9 | % | | | 7.9 | % | | | 5.8 | % |
| Ratio of operating expenses to average net assets with waiver(6) | | | 8.3 | % | | | 11.9 | % | | | 7.9 | % | | | 5.8 | % |
| Ratio of net investment income (loss) to average net assets(6) | | | 12.8 | % | | | 13.3 | % | | | 9.1 | % | | | 6.8 | % |
| (1) | The per common share data was derived by using weighted average shares outstanding. |
| (2) | On February 5, 2021, the initial offering price of $15.00 per share less $0.14 per share of organizational costs. |
| (3) | Realized and unrealized gains and losses per share in this caption are balancing amounts necessary to reconcile the change in net asset value per share for the period and may not reconcile with the aggregate gains and losses in the Consolidated Statement of Operations due to share transactions during the period. |
For the years ended December 31, 2024, 2023, 2022 and 2021, such share transactions include the effect of share issuances of $0.00, $0.00, $0.04 and $0.19 per share, respectively. During the period, shares were issued at prices that reflect the aggregate amount of the Company’s initial organizational and offering expenses. As a result, investors subscribing after the initial capital call are allocated organizational expenses consistently with all stockholders.
| (4) | Total return is calculated as the change in net asset value (“NAV”) per share during the period, plus distributions per share (if any), divided by the beginning NAV per share. The calculation also assumes reinvestment of dividends at actual prices pursuant to the Company’s dividend reinvestment plan. Total return is not annualized. |
Kayne Anderson BDC, Inc.
Notes to Consolidated Financial Statements
(amounts in 000’s, except share and per share amounts)
| (5) | Total return based on market value is calculated as the change in market value per share during the respective periods, plus distributions per share, if any, divided by the beginning market value per share. The calculation also assumes reinvestment of dividends at actual prices pursuant to the Company’s dividend reinvestment plan. The beginning market value per share is based on the initial public offering price of $16.63 per share and not annualized. |
| (6) | The ratios reflect an annualized amount, except in the case of non-recurring expenses (e.g. initial organizational expense of $175 for the period February 5, 2021 (commencement of operations) through December 31, 2021). |
Note 12. Segment Reporting
The Company operates through a single operating and reporting segment with an investment objective to generate both current income and capital appreciation through debt and equity investments. The CODM is comprised of the Company’s co-chief executive officers and these CODMs assess the performance and make operating decisions of the Company on a consolidated basis primarily based on the Company’s net increase in stockholders’ equity resulting from operations (“net income”). In addition to numerous other factors and metrics, the CODMs utilize net income as a key metric in determining the amount of dividends to be distributed to the Company’s stockholders. As the Company’s operations comprise of a single reporting segment, the segment assets are reflected on the accompanying consolidated balance sheet as “total assets” and the significant segment expenses are listed on the accompanying consolidated statement of operations.
Note 13. Subsequent Events
The Company’s management has evaluated subsequent events through the date of issuance of the financial statements included herein. There have been no subsequent events that require recognition or disclosure in these financial statements except as described below.
On January 15, 2025, the Company paid a regular dividend of $0.40 per share to each common stockholder of record as of December 31, 2024. The total dividend was $28,424 and $3,923 of the total was DRIP.
On February 5, 2025, the Company and KABDCF II entered into an amendment of its Revolving Funding Facility II. Under the terms of the amendment, the lender increased its commitment from $150,000 to $250,000 and decreased the interest rate on borrowings outstanding from 3-month term SOFR plus 2.70% to 3-month term SOFR plus 2.25%. Additionally, the maturity date of the facility was extended one year to December 22, 2029. All other terms of the Revolving Funding Facility II remain substantially the same.
On February 13, 2025, the Company and KABDCF entered into an amendment of its Revolving Funding Facility. Under the terms of the amendment, the lenders increased their commitments from $600,000 to $675,000 and decreased the interest rate on borrowings outstanding from daily SOFR plus 2.375% - 2.50%, depending upon the mix of loans, to daily SOFR plus 2.15%. Additionally, the maturity date of the facility was extended to February 13, 2030. All other terms of the Revolving Funding Facility remain substantially the same.
On February 14, 2025, the Company reduced the size of its Corporate Credit Facility from $475,000 to $400,000. This commitment reduction was done in conjunction with the $75,000 increase to its Revolving Funding Facility from $600,000 to $675,000.
On February 19, 2025, the Board of Directors of the Company declared a regular dividend to common stockholders in the amount of $0.40 per share. The regular dividend of $0.40 per share will be paid on April 15, 2025 to stockholders of record as of the close of business on March 31, 2025, payable in cash or shares of common stock of the Company pursuant to the Company’s Dividend Reinvestment Plan, as amended.
ITEM 9. CHANGES IN AND DISAGREEMENTS WITH ACCOUNTANTS ON ACCOUNTING AND FINANCIAL DISCLOSURE
There are not and have not been any disagreements between us and our accountant on any matter of accounting principles, practices or financial statement disclosure.
ITEM 9A. CONTROLS AND PROCEDURES
Evaluation of Disclosure Controls and Procedures
As of the end of the period covered by this report, our management carried out an evaluation, under the supervision and with the participation of our Co-Chief Executive Officers and Chief Financial Officer, of the effectiveness of the design and operation of our disclosure controls and procedures (as defined in Rules 13a-15(e) and 15d-15(e) under the Exchange Act). Based on that evaluation, our Co-Chief Executive Officers and Chief Financial Officer have concluded that our disclosure controls and procedures were effective at the reasonable assurance level as of December 31, 2024. In designing and evaluating our disclosure controls and procedures, management recognizes that any controls and procedures, no matter how well designed and operated, can provide only reasonable assurance of achieving their objectives, and management necessarily applies its judgment in evaluating the benefits of possible controls and procedures relative to their costs.
Report of Management on Internal Control Over Financial Reporting
Our management is responsible for establishing and maintaining adequate internal control over financial reporting (as defined in Rules 13a-15(f) and 15d-15(f) of the Exchange Act). Under the supervision and with the participation of management, including the Co-Chief Executive Officers and Chief Financial Officer, we conducted an evaluation of the effectiveness of our internal control over financial reporting based on the criteria established in “Internal Control—Integrated Framework” (2013) issued by the Committee of Sponsoring Organizations of the Treadway Commission. Because of its inherent limitations, internal control over financial reporting may not prevent or detect misstatements. Also, projections of any evaluation of effectiveness to future periods are subject to the risk that controls may become inadequate because of changes in conditions, or that the degree of compliance with the policies or procedures may deteriorate. Based on the evaluation, management concluded that the Company's internal control over financial reporting was effective as of December 31, 2024. The Company's independent registered public accounting firm, PricewaterhouseCoopers LLP, has audited the effectiveness of the Company's internal control over financial reporting as of December 31, 2024, as stated in their report which appears herein.
Attestation Report of the Registered Public Accounting Firm
Our independent registered public accounting firm, PricewaterhouseCoopers LLP, has audited the effectiveness of the Company’s internal control over financial reporting as of December 31, 2024, as stated in their report which is included herein.
Changes in Internal Control over Financial Reporting
There have been no changes in our internal control over financial reporting that occurred during our most recently completed fiscal quarter ended December 31, 2024 that have materially affected, or are reasonably likely to materially affect, our internal control over financial reporting.
ITEM 9B. OTHER INFORMATION
None.
ITEM 9C. DISCLOSURE REGARDING FOREIGN JURISDICTIONS THAT PREVENT INSPECTIONS
Not Applicable.
PART III
ITEM 10. DIRECTORS, EXECUTIVE OFFICERS AND CORPORATE GOVERNANCE
The information required by this item will be contained in the Company’s definitive Proxy Statement for its 2025 Annual Stockholder Meeting, to be filed with the SEC within 120 days after December 31, 2024 and is incorporated herein by reference.
ITEM 11. EXECUTIVE COMPENSATION
The information required by this item will be contained in the Company’s definitive Proxy Statement for its 2025 Annual Stockholder Meeting, to be filed with the SEC within 120 days after December 31, 2024 and is incorporated herein by reference.
ITEM 12. SECURITY OWNERSHIP OF CERTAIN BENEFICIAL OWNERS AND MANAGEMENT AND RELATED STOCKHOLDER MATTERS
The information required by this item will be contained in the Company’s definitive Proxy Statement for its 2025 Annual Stockholder Meeting, to be filed with the SEC within 120 days after December 31, 2024 and is incorporated herein by reference.
ITEM 13. CERTAIN RELATIONSHIPS AND RELATED TRANSACTIONS, AND DIRECTOR INDEPENDENCE
The information required by this item will be contained in the Company’s definitive Proxy Statement for its 2025 Annual Stockholder Meeting, to be filed with the SEC within 120 days after December 31, 2024 and is incorporated herein by reference.
ITEM 14. PRINCIPAL ACCOUNTING FEES AND SERVICES
The information required by this item will be contained in the Company’s definitive Proxy Statement for its 2025 Annual Stockholder Meeting, to be filed with the SEC within 120 days after December 31, 2024 and is incorporated herein by reference.
PART IV
ITEM 15. EXHIBITS AND FINANCIAL STATEMENT SCHEDULES
(a) DOCUMENTS FILED AS PART OF THIS REPORT
The following is a list of our consolidated financial statements included in this Annual Report on Form 10-K under Item 8 of Part II hereof:
1. CONSOLIDATED FINANCIAL STATEMENTS AND SUPPLEMENTAL DATA
Index to Consolidated Financial Statements
(b) EXHIBITS
| 3.1 | | Certificate of Formation (3) |
| 3.2 | | Initial Limited Liability Company Agreement (1) |
| 3.3 | | Certificate of Conversion (2) |
| 3.4 | | Certificate of Incorporation (2) |
| 3.5 | | Amended and Restated Bylaws (5) |
| 4.1 | | Description of Securities (3) |
| 10.1 | | Investment Advisory Agreement (1) |
| 10.2 | | Amendment to Investment Advisory Agreement (8) |
| 10.3 | | Amended and Restated Investment Advisory Agreement (13) |
| 10.4 | | Administration Agreement (1) |
| 10.5 | | License Agreement (1) |
| 10.6 | | Indemnification Agreement (1) |
| 10.7 | | Custody Agreement (1) |
| 10.8 | | Subscription Agreement (1) |
| 10.9 | | Loan and Security Agreement, dated as of February 5, 2021, by and between KA Credit Advisors, LLC, as collateral manager, Kayne Anderson BDC Financing, LLC, as borrower, certain lenders thereto, administrative agent for the lenders, and collateral agent for the lenders (2) |
| 10.10 | | Credit Agreement, dated February 5, 2021, by and between Kayne Anderson BDC, Inc., as borrower, lenders signatories thereto, and agent and the lead arranger (2) |
| 10.11 | | Second Amendment to Credit Agreement, dated December 3, 2021, by and between Kayne Anderson BDC, Inc., as borrower, lender signatories thereto, and agent and lead arranger (5) |
| 10.12 | | Third Amendment to the Credit Agreement, dated December 30, 2022, by and between Kayne Anderson BDC, Inc., as borrower, lenders, and City National Bank as administrative agent for the lenders (7) |
| 10.13 | | Fourth Amendment to the Credit Agreement, dated December 31, 2023, by and between Kayne Anderson BDC, Inc., as borrower, lenders, and City National Bank as administrative agent for the lenders (11) |
| 10.14 | | Senior Secured Revolving Credit Agreement (4) |
| 10.15 | | Second Amendment to Senior Secured Revolving Credit Agreement (14) |
| 10.16 | | Loan and Security Agreement (4) |
| 10.17 | | First Amendment to Loan and Security Agreement, dated November 17, 2022, by and between KA Credit Advisors, LLC, as collateral manager, Kayne Anderson BDC Financing, LLC, as borrower, certain lenders thereto, administrative agent for the lenders, and collateral agent for the lenders (6) |
| 10.18 | | Second Amendment to Loan and Security Agreement, dated June 29, 2023, by and between KA Credit Advisors, LLC, as collateral manager, Kayne Anderson BDC Financing, LLC, as borrower, certain lenders thereto, administrative agent for the lenders, and collateral agent for the lenders (9) |
| 10.19 | | Third Amendment to Loan and Security Agreement, dated April 3, 2024, by and between KA Credit Advisors, LLC, as collateral manager, Kayne Anderson BDC Financing, LLC, as borrower, certain lenders thereto, administrative agent for the lenders, and collateral agent for the lenders (12) |
| 10.20 | | Fourth Amendment to Loan and Security Agreement, dated December 13, 2024, by and between KA Credit Advisors, LLC, as collateral manager, Kayne Anderson BDC Financing, LLC, as borrower, certain lenders thereto, administrative agent for the lenders, and collateral agent for the lenders * |
| 10.21 | | Fifth Amendment to Loan and Security Agreement, dated February 13, 2025, by and between KA Credit Advisors, LLC, as collateral manager, Kayne Anderson BDC Financing, LLC, as borrower, certain lenders thereto, administrative agent for the lenders, and collateral agent for the lenders (16) |
| 10.22 | | Loan and Security Agreement, dated December 22, 2023, by and between KA Credit Advisors, LLC, as portfolio manager, Kayne Anderson BDC Financing II, LLC, as borrower, certain lenders thereto, collateral administrator for the lenders, collateral agent for the lenders, securities intermediary party, and administrative agent for the lenders (10) |
| 10.23 | | Amendment No. 2 to Loan and Security Agreement, dated December 22, 2023, by and between KA Credit Advisors, LLC, as portfolio manager, Kayne Anderson BDC Financing II, LLC, as borrower, certain lenders thereto, collateral administrator for the lenders, collateral agent for the lenders, securities intermediary party, and administrative agent for the lenders (15) |
| 10.24 | | Notes Purchase Agreement, dated June 29, 2023, by and among the Company and the Purchasers party thereto (9) |
| 14.1 | | Code of Ethics as amended November 9, 2023 * |
| 14.2 | | Supplemental Antifraud Code of Ethics for Principal Officers and Senior Financial Officers (8) |
| 21.1 | | Subsidiaries of Kayne Anderson BDC, Inc. (3) |
| 31.1* | | Certification of Chief Executive Officer pursuant to Securities Exchange Act Rule 13a-14(a), as adopted pursuant to Section 302 of the Sarbanes-Oxley Act of 2002 |
| 31.2* | | Certification of Chief Financial Officer pursuant to Securities Exchange Act Rule 13a-14(a), as adopted pursuant to Section 302 of the Sarbanes-Oxley Act of 2002 |
| 32.1* | | Certification of Chief Executive Officer pursuant to 18 U.S.C. Section 1350, as adopted pursuant to Section 906 of the Sarbanes-Oxley Act of 2002 |
| 32.2* | | Certification of Chief Financial Officer pursuant to 18 U.S.C. Section 1350, as adopted pursuant to Section 906 of the Sarbanes-Oxley Act of 2002 |
| 101.INS | | Inline XBRL Instance Document.* |
| 101.SCH | | Inline XBRL Taxonomy Extension Schema Document.* |
| 101.CAL | | Inline XBRL Taxonomy Extension Calculation Linkbase Document.* |
| 101.DEF | | Inline XBRL Taxonomy Extension Definition Linkbase Document.* |
| 101.LAB | | Inline XBRL Taxonomy Extension Label Linkbase Document.* |
| 101.PRE | | Inline XBRL Taxonomy Extension Presentation Linkbase Document.* |
| 104 | | Cover Page Interactive Data File (formatted as Inline XBRL and contained in Exhibit 101). |
| (1) | Incorporated by reference from the Company’s Amendment No. 2 to Form 10, as filed with the Securities and Exchange Commission on November 9, 2020. |
| (2) | Incorporated by reference from the Company’s Form 8-K, as filed with the Securities and Exchange Commission on February 9, 2021. |
| (3) | Incorporated by reference from the Company’s Form 10-K, as filed with the Securities and Exchange Commission on February 26, 2021. |
| (4) | Incorporated by reference from the Company’s Form 8-K, as filed with the Securities and Exchange Commission on February 25, 2022. |
| (5) | Incorporated by reference from the Company’s Quarterly Report on Form 10-Q for the quarter ended June 30, 2022, as filed with the Securities and Exchange Commission on August 15, 2022. |
| (6) | Incorporated by reference from the Company’s Form 8-K, as filed with the Securities and Exchange Commission on November 22, 2022. |
| (7) | Incorporated by reference from the Company’s Form 8-K, as filed with the Securities and Exchange Commission on January 6, 2023. |
| (8) | Incorporated by reference from the Company’s Form 10-K, as filed with the Securities and Exchange Commission on March 13, 2023. |
| (9) | Incorporated by reference from the Company’s Form 8-K, as filed with the Securities and Exchange Commission on July 5, 2023. |
| (10) | Incorporated by reference from the Company’s Form 8-K, as filed with the Securities and Exchange Commission on December 29, 2023. |
| (11) | Incorporated by reference from the Company’s Form 8-K, as filed with the Securities and Exchange Commission on January 5, 2024. |
| (12) | Incorporated by reference from the Company’s Form 8-K, as filed with the Securities and Exchange Commission on April 8, 2024. |
| (13) | Incorporated by reference from the Company’s Quarterly report on Form 10-Q for the quarter ended June 30, 2024, as filed with the Securities and Exchange Commission on August 13, 2024. |
| (14) | Incorporated by reference from the Company’s Form 8-K, as filed with the Securities and Exchange Commission on November 26, 2024. |
| (15) | Incorporated by reference from the Company’s Form 8-K, as filed with the Securities and Exchange Commission on February 10, 2025. |
| (16) | Incorporated by reference from the Company’s Form 8-K, as filed with the Securities and Exchange Commission on February 18, 2025. |
ITEM 16. FORM 10-K SUMMARY
None.
SIGNATURES
Pursuant to the requirements of the Securities Exchange Act of 1934, the registrant has duly caused this report to be signed on its behalf by the undersigned thereunto duly authorized.
| | Kayne Anderson BDC, Inc. |
| | |
| Date: March 3, 2025 | |
| | |
| | | /s/ Douglas L. Goodwillie |
| | Name: | Douglas L. Goodwillie |
| | Title: | Co-Chief Executive Officer |
| | | (Co-Principal Executive Officer) |
| | | |
| Date: March 3, 2025 | |
| | |
| | | /s/ Kenneth B. Leonard |
| | Name: | Kenneth B. Leonard |
| | Title: | Co-Chief Executive Officer |
| | | (Co-Principal Executive Officer) |
| | | |
| Date: March 3, 2025 | |
| | | /s/ Terry A. Hart |
| | Name: | Terry A. Hart |
| | Title: | Chief Financial Officer and Treasurer |
| | | (Principal Financial and Accounting Officer) |
82
0001747172 kbdc:AmericanSoccerCompanyIncorporatedSCOREMember kbdc:DebtAndEquityInvestmentsMember kbdc:TextilesApparelLuxuryGoodsMember kbdc:FirstLienSeniorSecuredLoanMember kbdc:PrivateCreditInvestmentsMember 2023-12-31 iso4217:USD xbrli:shares