0001751788us-gaap:ChangeDuringPeriodFairValueDisclosureMemberus-gaap:FairValueMeasurementsNonrecurringMemberdow:LeasedAssetsAndNonManufacturingFacilitiesMember2023-12-31
UNITED STATES
SECURITIES AND EXCHANGE COMMISSION
Washington, D.C. 20549
FORM 10-K
☑ ANNUAL REPORT PURSUANT TO SECTION 13 OR 15(d) OF THE SECURITIES EXCHANGE ACT OF 1934
For the fiscal year ended December 31, 2024
or
☐ TRANSITION REPORT PURSUANT TO SECTION 13 OR 15(d) OF THE SECURITIES EXCHANGE ACT OF 1934
For the transition period from __________to__________
| | | | | | | | | | | |
Commission File Number | Exact Name of Registrant as Specified in its Charter, Principal Office Address and Telephone Number | State of Incorporation or Organization | I.R.S. Employer Identification No. |
| 001-38646 | Dow Inc. | Delaware | 30-1128146 |
| 2211 H.H. Dow Way, Midland, MI 48674 | | |
| 989 636-1000 | | |
| 001-03433 | The Dow Chemical Company | Delaware | 38-1285128 |
| 2211 H.H. Dow Way, Midland, MI 48674 | | |
| 989 636-1000 | | |
Securities registered pursuant to Section 12(b) of the Act:
| | | | | | | | | | | |
| Registrant | Title of each class | Trading Symbol(s) | Name of each exchange on which registered |
| Dow Inc. | Common Stock, par value $0.01 per share | DOW | New York Stock Exchange |
| The Dow Chemical Company | 0.500% Notes due March 15, 2027 | DOW/27 | New York Stock Exchange |
| The Dow Chemical Company | 1.125% Notes due March 15, 2032 | DOW/32 | New York Stock Exchange |
| The Dow Chemical Company | 1.875% Notes due March 15, 2040 | DOW/40 | New York Stock Exchange |
| The Dow Chemical Company | 4.625% Notes due October 1, 2044 | DOW/44 | New York Stock Exchange |
Securities registered pursuant to Section 12(g) of the Act: None
Indicate by check mark if the registrant is a well-known seasoned issuer, as defined in Rule 405 of the Securities Act.
| | | | | | | | | | | | | | | | | |
| Dow Inc. | ☑ | Yes | ☐ | No |
| The Dow Chemical Company | ☑ | Yes | ☐ | No |
Indicate by check mark if the registrant is not required to file reports pursuant to Section 13 or Section 15(d) of the Act.
| | | | | | | | | | | | | | | | | |
| Dow Inc. | ☐ | Yes | ☑ | No |
| The Dow Chemical Company | ☐ | Yes | ☑ | No |
Indicate by check mark whether the registrant (1) has filed all reports required to be filed by Section 13 or 15(d) of the Securities Exchange Act of 1934 during the preceding 12 months (or for such shorter period that the registrant was required to file such reports), and (2) has been subject to such filing requirements for the past 90 days.
| | | | | | | | | | | | | | | | | |
| Dow Inc. | ☑ | Yes | ☐ | No |
| The Dow Chemical Company | ☑ | Yes | ☐ | No |
Indicate by check mark whether the registrant has submitted electronically every Interactive Data File required to be submitted pursuant to Rule 405 of Regulation S-T (§232.405 of this chapter) during the preceding 12 months (or for such shorter period that the registrant was required to submit such files).
| | | | | | | | | | | | | | | | | |
| Dow Inc. | ☑ | Yes | ☐ | No |
| The Dow Chemical Company | ☑ | Yes | ☐ | No |
Indicate by check mark whether the registrant is a large accelerated filer, an accelerated filer, a non-accelerated filer, a smaller reporting company, or an emerging growth company. See the definitions of “large accelerated filer,” “accelerated filer,” “smaller reporting company,” and "emerging growth company" in Rule 12b-2 of the Exchange Act.
| | | | | | | | | | | | | | | | | | | | | | | | | | | | | | | | | | | |
| Dow Inc. | Large accelerated filer | ☑ | Accelerated
filer | ¨ | Non-
accelerated filer | ¨ | Smaller reporting company | ¨ | Emerging growth company | ¨ |
| The Dow Chemical Company | Large accelerated filer | ¨ | Accelerated
filer | ¨ | Non-
accelerated filer | ☑ | Smaller reporting company | ¨ | Emerging growth company | ¨ |
If an emerging growth company, indicate by check mark if the registrant has elected not to use the extended transition period for complying with any new or revised financial accounting standards provided pursuant to Section 13(a) of the Exchange Act.
| | | | | | | | | | | |
| Dow Inc. | ☐ | |
| The Dow Chemical Company | ☐ | |
Indicate by check mark whether the registrant has filed a report on and attestation to its management's assessment of the effectiveness of its internal control over financial reporting under Section 404(b) of the Sarbanes-Oxley Act (15 U.S.C. 7262(b)) by the registered public accounting firm that prepared or issued its audit report.
| | | | | | | | | | | |
| Dow Inc. | ☑ | |
| The Dow Chemical Company | ☑ | |
If securities are registered pursuant to Section 12(b) of the Act, indicate by check mark whether the financial statements of the registrant included in the filing reflect the correction of an error to previously issued financial statements.
| | | | | | | | | | | |
| Dow Inc. | ☐ | |
| The Dow Chemical Company | ☐ | |
Indicate by check mark whether any of those error corrections are restatements that required a recovery analysis of incentive-based compensation received by any of the registrant's executive officers during the relevant recovery period pursuant to §240.10D-1(b).
| | | | | | | | | | | |
| Dow Inc. | ☐ | |
| The Dow Chemical Company | ☐ | |
Indicate by check mark whether the registrant is a shell company (as defined in Rule 12b-2 of the Act).
| | | | | | | | | | | | | | | | | |
| Dow Inc. | ☐ | Yes | ☑ | No |
| The Dow Chemical Company | ☐ | Yes | ☑ | No |
As of June 30, 2024, the aggregate market value of the common stock of Dow Inc. held by non-affiliates of Dow Inc. was approximately $37.1 billion based on the last reported closing price of $53.05 per share as reported on the New York Stock Exchange.
Dow Inc. had 703,831,931 shares of common stock, $0.01 par value, outstanding at January 15, 2025. The Dow Chemical Company had 100 shares of common stock, $0.01 par value, outstanding at January 15, 2025, all of which were held by the registrant’s parent, Dow Inc.
The Dow Chemical Company meets the conditions set forth in General Instruction I(1)(a) and (b) for Form 10-K and therefore is filing this form in the reduced disclosure format.
DOCUMENTS INCORPORATED BY REFERENCE
Dow Inc.: Portions of Dow Inc.'s Proxy Statement for the 2025 Annual Meeting of Stockholders are incorporated herein by reference in Part III of this Annual Report on Form 10-K to the extent stated herein. Such proxy statement will be filed with the Securities and Exchange Commission within 120 days of Dow Inc.'s fiscal year ended December 31, 2024.
The Dow Chemical Company: None.
Dow Inc. and Subsidiaries
The Dow Chemical Company and Subsidiaries
ANNUAL REPORT ON FORM 10-K
For the fiscal year ended December 31, 2024
TABLE OF CONTENTS
| | | | | | | | |
| | PAGE |
| |
| |
| | |
| | |
| | |
| | |
| | |
| | |
| | |
| |
| | |
| | |
| | |
| | |
| | |
| Dow Inc. and Subsidiaries: | |
| | |
| | |
| | |
| | |
| | |
| The Dow Chemical Company and Subsidiaries: | |
| | |
| | |
| | |
| | |
| | |
| Dow Inc. and Subsidiaries and The Dow Chemical Company and Subsidiaries: | |
| | |
| | |
| | |
| | |
| |
| | |
| | |
| | |
| | |
| | |
| |
| | |
| | |
| |
| | | | | | | | |
| Dow Inc. and Subsidiaries
The Dow Chemical Company and Subsidiaries | |
This Annual Report on Form 10-K is a combined report being filed by Dow Inc. and The Dow Chemical Company and its consolidated subsidiaries (“TDCC” and together with Dow Inc., “Dow” or the "Company"). This Annual Report on Form 10-K reflects the results of Dow and its consolidated subsidiaries. As a result of the parent/subsidiary relationship between Dow Inc. and TDCC, and considering that the financial statements and disclosures of each company are substantially similar, the companies are filing a combined report for this Annual Report on Form 10-K. The information reflected in this report is equally applicable to both Dow Inc. and TDCC, except where otherwise noted. Each of Dow Inc. and TDCC is filing information in this report on its own behalf and neither company makes any representation to the information relating to the other company.
CAUTIONARY STATEMENT REGARDING FORWARD-LOOKING STATEMENTS
Certain statements in this report are “forward-looking statements” within the meaning of the federal securities laws, including Section 27A of the Securities Act of 1933, as amended, and Section 21E of the Securities Exchange Act of 1934, as amended. Such statements often address expected future business and financial performance, financial condition, and other matters, and often contain words or phrases such as “anticipate,” “believe,” "could," “estimate,” “expect,” “intend,” “may,” “opportunity,” “outlook,” “plan,” “project,” “seek,” “should,” “strategy,” "target," “will,” “will be,” “will continue,” “will likely result,” “would,” and similar expressions, and variations or negatives of these words or phrases.
Forward-looking statements are based on current assumptions and expectations of future events that are subject to risks, uncertainties and other factors that are beyond Dow’s control, which may cause actual results to differ materially from those projected, anticipated or implied in the forward-looking statements and speak only as of the date the statements were made. These factors include, but are not limited to: sales of Dow’s products; Dow’s expenses, future revenues and profitability; any sanctions, export restrictions, supply chain disruptions or increased economic uncertainty related to the ongoing conflicts between Russia and Ukraine and in the Middle East; capital requirements and need for and availability of financing; unexpected barriers in the development of technology, including with respect to Dow's contemplated capital and operating projects; Dow's ability to realize its commitment to carbon neutrality on the contemplated timeframe, including the completion and success of its integrated ethylene cracker and derivatives facility in Alberta, Canada; size of the markets for Dow’s products and services and ability to compete in such markets; failure to develop and market new products and optimally manage product life cycles; the rate and degree of market acceptance of Dow’s products; significant litigation and environmental matters and related contingencies and unexpected expenses; the success of competing technologies that are or may become available; the ability to protect Dow’s intellectual property in the United States and abroad; developments related to contemplated restructuring activities and proposed divestitures or acquisitions such as workforce reduction, manufacturing facility and/or asset closure and related exit and disposal activities, and the benefits and costs associated with each of the foregoing; fluctuations in energy and raw material prices; management of process safety and product stewardship; changes in relationships with Dow’s significant customers and suppliers; changes in public sentiment and political leadership; increased concerns about plastics in the environment and lack of a circular economy for plastics at scale; changes in consumer preferences and demand; changes in laws and regulations, political conditions or industry development; global economic and capital markets conditions, such as inflation, market uncertainty, interest and currency exchange rates, and equity and commodity prices; business, logistics and supply disruptions; security threats, such as acts of sabotage, terrorism or war, including the ongoing conflicts between Russia and Ukraine and in the Middle East; weather events and natural disasters; disruptions in Dow’s information technology networks and systems, including the impact of cyberattacks; risks related to Dow’s separation from DowDuPont Inc. such as Dow’s obligation to indemnify DuPont de Nemours, Inc. and/or Corteva, Inc. for certain liabilities; and any global and regional economic impacts of a pandemic or other public health-related risks and events on Dow's business.
Where, in any forward-looking statement, an expectation or belief as to future results or events is expressed, such expectation or belief is based on the current plans and expectations of management and expressed in good faith and believed to have a reasonable basis, but there can be no assurance that the expectation or belief will result or be achieved or accomplished. A detailed discussion of principal risks and uncertainties which may cause actual results and events to differ materially from such forward-looking statements is included in the section of this Annual Report on Form 10-K titled “Risk Factors.” These are not the only risks and uncertainties that Dow faces. There may be other risks and uncertainties that Dow is unable to identify at this time or that Dow does not currently expect to have a material impact on its business. If any of those risks or uncertainties develops into an actual event, it could have a material adverse effect on Dow’s business. Dow Inc. and TDCC assume no obligation to update or revise publicly any forward-looking statements whether because of new information, future events, or otherwise, except as required by securities and other applicable laws.
Dow's website and its content are not deemed incorporated by reference into this report.
| | | | | | | | |
| Dow Inc. and Subsidiaries | |
| The Dow Chemical Company and Subsidiaries | |
| PART I | |
THE COMPANY
Dow Inc. was incorporated on August 30, 2018, under Delaware law, to serve as a holding company for The Dow Chemical Company and its consolidated subsidiaries ("TDCC" and together with Dow Inc., "Dow" or the "Company"). Dow Inc. operates all of its businesses through TDCC, a wholly owned subsidiary, which was incorporated in 1947 under Delaware law and is the successor to a Michigan corporation, of the same name, organized in 1897. The Company's principal executive offices are located at 2211 H.H. Dow Way, Midland, Michigan 48674.
Available Information
The Company's Annual Reports on Form 10-K, Quarterly Reports on Form 10-Q and Current Reports on Form 8-K, and amendments to those reports filed or furnished pursuant to Section 13(a) or 15(d) of the Securities Exchange Act of 1934, are available free of charge at www.dow.com/investors, as soon as reasonably practicable after the reports are electronically filed or furnished with the U.S. Securities and Exchange Commission ("SEC"). The SEC maintains a website that contains these reports as well as proxy statements and other information regarding issuers that file electronically. The SEC's website is www.sec.gov. Dow's website and its content are not deemed incorporated by reference into this report.
Except as otherwise indicated by the context, the term "Union Carbide" means Union Carbide Corporation and the term "Dow Silicones" means Dow Silicones Corporation, both wholly owned subsidiaries of the Company.
ABOUT DOW
Dow is one of the world’s leading materials science companies, serving customers in high-growth markets such as packaging, infrastructure, mobility and consumer applications. The Company's global breadth, asset integration and scale, focused innovation, leading business positions and commitment to sustainability enables the Company to achieve profitable growth and help deliver a sustainable future. Dow operates manufacturing sites in 30 countries and employs approximately 36,000 people. In 2024, Dow delivered sales of approximately $43 billion. Learn more about Dow's ambition to be the most innovative, customer-centric, inclusive and sustainable materials science company in the world by visiting www.dow.com.
BUSINESS SEGMENTS AND PRODUCTS
The Company conducts its worldwide operations through six global businesses which are organized into the following operating segments: Packaging & Specialty Plastics, Industrial Intermediates & Infrastructure and Performance Materials & Coatings. Corporate contains the reconciliation between the totals for the operating segments and the Company's totals. The Company did not aggregate any operating segments when determining its reportable segments. See Part II, Item 7. Management’s Discussion and Analysis of Financial Condition and Results of Operations and Note 25 to the Consolidated Financial Statements for additional information concerning the Company’s operating segments.
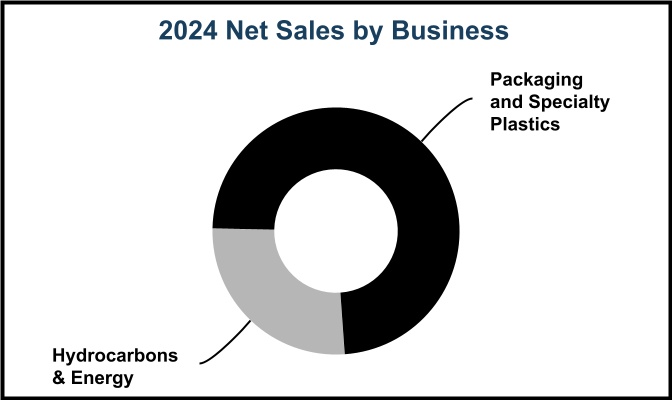
PACKAGING & SPECIALTY PLASTICS
The Packaging & Specialty Plastics operating segment consists of two highly integrated global businesses: Hydrocarbons & Energy and Packaging and Specialty Plastics. The segment employs the industry’s broadest polyolefin product portfolio, supported by the Company’s proprietary catalyst and manufacturing process technologies. These differentiators, plus collaboration at the customer’s design table, enable the segment to deliver more reliable, durable, higher-performing solutions designed for recyclability and enhanced plastics circularity and sustainability. The segment serves customers, brand owners and ultimately consumers in key markets including food and specialty packaging; industrial and consumer packaging; health and hygiene; caps, closures and pipe applications; consumer durables; mobility; and infrastructure.
The Company’s unique advantages compared with its competitors include extensive low-cost feedstock positions around the world; unparalleled scale, global footprint and market reach; world-class manufacturing sites in every geographic region; deep customer and brand owner understanding; portfolio of higher-value functional polymers, such as polyolefin elastomers, semiconductive and jacketing compound solutions and wire and cable insulation; and market-driven application development and technical support.
The segment remains agile by participating in the entire ethylene-to-polyethylene chain integration, enabling the Company to manage market swings with industry-leading feedstock and derivative flexibility, and therefore optimize returns while reducing long-term earnings volatility. The Company’s unrivaled value chain ownership is further strengthened by its Pack Studio locations in every geographic region, which help customers and brand owners deliver faster and more efficient packaging product commercialization through a global network of laboratories, technical experts and testing equipment.
Hydrocarbons & Energy
Hydrocarbons & Energy is a leading global producer of ethylene, a key chemical building block that the Company consumes primarily within the Packaging & Specialty Plastics segment. Ethylene is transferred to downstream derivative businesses at market-based prices, which are generally equivalent to prevailing market prices for large volume purchases. In addition to ethylene, the business is a leading producer of propylene and aromatics products that are used to manufacture materials consumers use every day. The business also produces and procures the power, steam and feedstocks used by the Company’s manufacturing sites.
Packaging and Specialty Plastics
Packaging and Specialty Plastics serves growing, high-value sectors using world-class technology, broad existing product lines, and a rich product pipeline that creates competitive advantages for the entire packaging value chain. The business is a recognized leader in the production, marketing and innovation of polyethylene. The business is also a leader in other ethylene derivatives, such as polyolefin elastomers, ethylene vinyl acetate and ethylene propylene diene monomer ("EPDM") rubber serving mobility; consumer; wire and cable; and construction end-markets. Market growth is expected to be driven by major shifts in population demographics; improving socioeconomic status in emerging geographic regions; consumer and brand owner demand for increased functionality including sustainable offerings through lower-carbon and circular solutions; global efforts to reduce food waste; growth in telecommunications networks; global development of electrical transmission and distribution infrastructure; and renewable energy applications such as wind power and solar (photovoltaic).
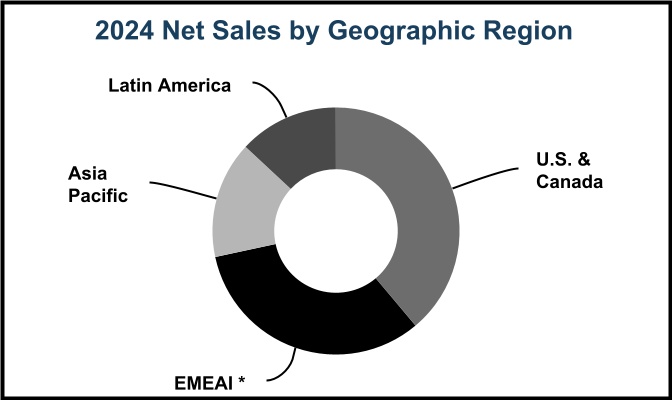
Details on Packaging & Specialty Plastics' 2024 net sales, by business and geographic region, are as follows:
* Europe, Middle East, Africa and India ("EMEAI")
Products
Major applications/market segments and products are listed below by business:
| | | | | | | | | | | | | | |
| Business | Applications/Market Segments | Major Products | Key Raw Materials | Key Competitors |
| Hydrocarbons & Energy | Purchaser of feedstocks; production of cost competitive hydrocarbon monomers utilized by Dow's derivative businesses; and energy, principally for use in Dow’s global operations | Ethylene, propylene, benzene, butadiene, octene, aromatics co-products, power, steam, other utilities | Butane, condensate, ethane, naphtha, natural gas, propane | Chevron Phillips Chemical, ExxonMobil, INEOS, LyondellBasell, SABIC, Shell, Sinopec |
| Packaging and Specialty Plastics | Adhesives; automotive; caps, closures and pipe applications; construction; cosmetics; electrical transmission and distribution; food and supply chain packaging; footwear; health and hygiene; housewares; industrial specialty applications using polyolefin elastomers, ethylene copolymers, and EPDM; irrigation pipe; mobility; photovoltaic encapsulants; sporting goods; telecommunications infrastructure; toys and infant products | Acrylics, bio-based plasticizers, copolymer, elastomers, ethylene copolymer resins, EPDM, ethylene vinyl acetate ("EVA"), methacrylic acid copolymer resins, polyethylene ("PE"), high-density polyethylene ("HDPE"), low-density polyethylene ("LDPE"), linear low-density polyethylene ("LLDPE"), polyolefin plastomers, resin additives and modifiers, semiconductive and jacketing compound solutions and wire and cable insulation | Aliphatic solvent, butene, ethylene, hexene, octene, propylene | Borealis, ExxonMobil, INEOS, Lanxess, LyondellBasell, Nova, SABIC |
Joint Ventures:
This segment includes a portion of the Company's share of the results of the following joint ventures:
•EQUATE Petrochemical Company K.S.C.C. (“EQUATE”) - a Kuwait-based company that manufactures ethylene, polyethylene and ethylene glycol, and manufactures and markets monoethylene glycol, diethylene glycol and polyethylene terephthalate resins; owned 42.5 percent by the Company.
•The Kuwait Olefins Company K.S.C.C. (“TKOC”) - a Kuwait-based company that manufactures ethylene and ethylene glycol; owned 42.5 percent by the Company.
•Map Ta Phut Olefins Company Limited (“Map Ta Phut”) - a Thailand-based company that manufactures propylene and ethylene; the Company has an effective ownership of 32.77 percent (of which 20.27 percent is owned directly by the Company and aligned with the Industrial Intermediates & Infrastructure segment and 12.5 percent is owned indirectly through the Company’s equity interest in Siam Polyethylene Company Limited, an entity that is part of The SCGC-Dow Group and aligned with the Packaging & Specialty Plastics segment).
•Sadara Chemical Company ("Sadara") - a Saudi Arabian company that manufactures chlorine, ethylene, propylene and aromatics for internal consumption and manufactures and sells polyethylene, ethylene oxide and propylene oxide derivative products, and isocyanates; owned 35 percent by the Company. The Company continues to be responsible for marketing a significant portion of Sadara’s products through the Company’s established sales channels. In 2021, Dow and the Saudi Arabian Oil Company agreed to a marketing rights transition plan. Execution of the transition plan is ongoing and progressing towards aligning marketing rights and responsibilities to levels more consistent with each partner's equity ownership. This transition will not impact equity earnings, but is expected to reduce the Company's sales of Sadara products over the transition period.
This segment also includes the Company's share of the results of the following joint ventures:
•The Kuwait Styrene Company K.S.C.C. - a Kuwait-based company that manufactures styrene monomer; owned 42.5 percent by the Company.
•The SCGC-Dow Group - a group of Thailand-based companies (consisting of Siam Polyethylene Company Limited; Siam Polystyrene Company Limited; Siam Styrene Monomer Company Limited; and Siam Synthetic Latex Company Limited) that manufactures polyethylene, polystyrene, styrene, latex and specialty elastomers; owned 50 percent by the Company.
Current and Future Investments
The Company has announced investments that are being progressed over the next several years and are expected to enhance competitiveness. These include:
•Construction of the world's first net-zero Scope 1 and 2 carbon dioxide equivalent ("CO2e") emissions integrated ethylene and derivatives complex in Alberta, Canada. This project is expected to deliver 2 million metric tons of organic growth in attractive, high-end markets while decarbonizing 20 percent of Dow's global ethylene capacity.
•Construction of a world-scale polyethylene unit on the U.S. Gulf Coast, based on Dow’s proprietary process technologies, to meet consumer-driven demand in specialty packaging, health and hygiene, and industrial and consumer packaging applications.
•Ongoing collaboration with Mura Technology (“Mura”) to help solve the global plastics waste challenge and advance circularity via circular feedstocks, which are converted into recycled plastics.
The Company's ambition includes becoming the most sustainable materials science company, with a strategy to advance the well-being of humanity by helping lead the transition to a sustainable planet and society. This includes lowering energy and greenhouse gas ("GHG") emissions and further enabling a shift to a circular economy for plastics by focusing on resource efficiency and integrating recycled content and renewable feedstocks into its production processes. Additionally, the Company's Transform the Waste target aims to transform plastic waste and other forms of alternative feedstock to commercialize 3 million metric tons of circular and renewable solutions annually by 2030. As part of that strategy, Dow completed or progressed the following investments in 2024:
•Dow acquired Circulus Holdings, LLC, a U.S. mechanical recycling company that converts plastic waste into post-consumer resin. This acquisition includes two facilities in the United States with a total recycling capacity of 50,000 metric tons per year and supports Dow's efforts towards the Transform the Waste target.
•Dow completed the sale of its flexible packaging laminating adhesives business in 2024 to Arkema, S.A. The completion of this sale exemplifies Dow's commitment to aligning the Company's portfolio with its growth strategy and circularity platforms.
•Dow signed a Memorandum of Understanding ("MOU") with Ambipar, a Brazilian multinational and global leader in environmental solutions, to expand the strategic alliance between Dow and Ambipar and help drive transformation of the plastic recycling market in Brazil. By 2030, Dow and Ambipar target leading polyethylene recycling in Brazil, increasing operations from 2,000 metric tons per year to 60,000 metric tons per year.
•Dow signed an additional MOU with SCG Chemicals in 2024 to expand its circularity partnership and transform 200,000 metric tons per year of plastic waste into circular products by 2030 in the Asia Pacific geographic region. The partnership supports Dow's efforts towards the Transform the Waste target.
•The first Mura plant in the United Kingdom commenced commissioning of its 20,000 metric ton advanced recycling facility in the fourth quarter of 2024 and will begin feedstock production in 2025. Dow will be the main recipient of the product produced at this site.
•Dow continued to collaborate with X-energy, a nuclear energy innovation company, to advance the design of the previously announced advanced small modular reactor nuclear project at the Seadrift Operations manufacturing site in Texas, which includes developing a construction permit application for submittal to the Nuclear Regulatory Commission. The project is expected to be funded 50 percent by the U.S. Department of Energy under the Advanced Reactor Demonstration Program and will be operated by a subsidiary of NextEra Energy, one of the nation’s major nuclear operators.
•Dow continued its collaboration with Hanseatic Energy Hub GmbH ("HEH") as a minority stakeholder and is working with HEH's current members to advance Germany's capabilities to import supplies of liquified natural gas, bio-liquified natural gas and synthetic natural gas through the construction of an import terminal. HEH and its shareholders approved the final investment decision for this project on March 4, 2024. The HEH consortium plans to build, own, and operate an import terminal for liquified gases onsite at Dow's Stade, Germany industrial park. The zero-emission terminal will be co-located with Dow's facilities in Stade. Dow is making land available for the construction of the terminal as well as infrastructure services, off-gas heat, site services and mutual harbor use rights.
•Dow and privately-held New Energy Blue reached a long-term supply agreement to produce bio-based ethylene from renewable agricultural residues. This is the first agreement in North America to generate plastic sourced materials from corn stover (stalks and leaves), and is the Company's first agreement in North America to utilize agriculture residues for plastic production. Under the terms of the supply agreement, Dow will support the
design of New Energy Freedom, a new facility in the United States that is expected to process corn stover and produce commercial quantities of second-generation ethanol and clean lignin, with nearly half of the ethanol to be turned into bio-based ethylene feedstock reducing CO2e emissions from plastic production, and using it in recyclable applications across transportation, footwear, and packaging.
•Dow and Reciclar S.A. joined forces to build an efficient model for plastic recycling in Argentina that will produce more than 6,500 metric tons of post-consumer plastic resin. This collaboration agreement with Reciclar S.A. spans three years and aims to improve the capacity of Reciclar S.A. to process waste on a larger scale and produce high-quality post-consumer plastic materials under the REVOLOOPTM brand.
•Dow has several renewable power agreements in place globally that continue to support progress toward its goal to reduce net annual Scope 1 and 2 CO2e emissions by 5 million metric tons by 2030.
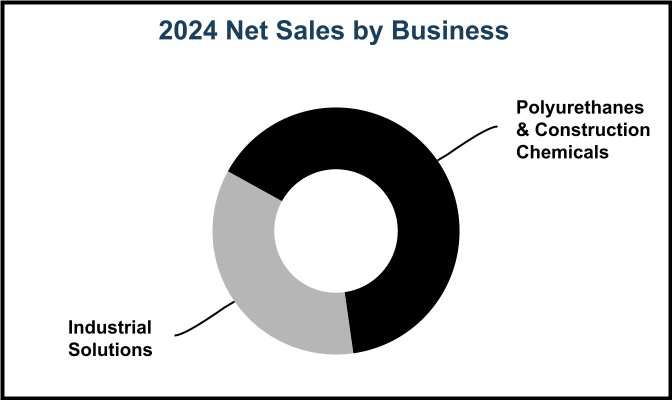
INDUSTRIAL INTERMEDIATES & INFRASTRUCTURE
The Industrial Intermediates & Infrastructure operating segment consists of two customer-centric global businesses - Industrial Solutions and Polyurethanes & Construction Chemicals - that develop important intermediate chemicals that are essential to manufacturing processes, as well as downstream, customized materials and formulations that use advanced development technologies. These businesses primarily produce and market ethylene oxide and propylene oxide derivatives that are aligned to market segments as diverse as appliances; coatings; furniture and bedding; building and construction; mobility; electronics; surfactants for cleaning and sanitization; infrastructure; and oil and gas. The businesses' global scale and reach, world-class technology, research and development capabilities and materials science expertise enable the Company to be a premier solutions provider offering customers value-added sustainable solutions to enhance comfort, energy efficiency, product effectiveness and durability.
Industrial Solutions
Industrial Solutions provides a broad portfolio of solutions that enable and improve the manufacture of consumer and industrial goods and services. The business’ solutions minimize friction and heat in mechanical processes; manage the oil and water interface; deliver ingredients for maximum effectiveness; facilitate dissolvability; enable product identification; decarbonize oil and gas products; reduce energy intensity, water use and increase efficacy in broad washing applications; and provide the foundational building blocks for the development of chemical technologies. The business supports manufacturers across a large variety of end-markets, notably coatings; detergents and cleaners; crop protection; consumer health; electronics; oil and gas; inks; lubricants and fluids. The business is a leading producer of purified ethylene oxide, amines, solvents and glycol ethers.
Polyurethanes & Construction Chemicals
Polyurethanes & Construction Chemicals consists of three businesses: Polyurethanes, Chlor-Alkali & Vinyl (“CAV”) and Construction Chemicals. The Polyurethanes business is the world’s largest producer of propylene oxide, propylene glycol and polyether polyols, a leading producer of aromatic isocyanates and fully formulated polyurethane systems for rigid, semi-rigid and flexible foams, as well as a leading producer of coatings, adhesives, sealants, elastomers and composites that serve consumers; industrial; building and construction; and mobility end-markets. This includes applications for appliances; furniture; bedding; refrigerated transport; building insulation panels; automotive seat cushions and acoustics; and aircraft deicing fluids. The CAV business provides chlorine and caustic soda supply and markets caustic soda, a valuable co-product of the chlor-alkali manufacturing process, ethylene dichloride and vinyl chloride monomer. The CAV business' assets are predominantly in Western Europe and Latin America and largely produce materials for internal consumption. The Construction Chemicals business provides cellulose ethers, redispersible latex powders, and acrylic emulsions used as key building blocks for differentiated building and construction materials across many market segments and applications ranging from roofing and flooring to gypsum-, cement-, concrete- and dispersion-based building materials. Both Polyurethanes and Construction Chemicals deliver sustainable products aligned toward green building markets yielding reduced environmental impacts and lower product intensity compared to traditional offerings.
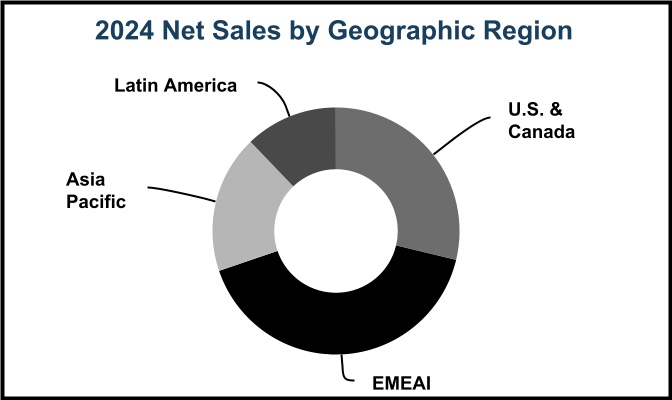
Details on Industrial Intermediates & Infrastructure's 2024 net sales, by business and geographic region, are as follows:
Products
Major applications/market segments and products are listed below by business:
| | | | | | | | | | | | | | |
| Business | Applications/Market Segments | Major Products | Key Raw Materials | Key Competitors |
| Industrial Solutions | Broad range of products for specialty applications including consumer health; agriculture crop protection offerings; aircraft deicing fluids; solvents for coatings; heat transfer fluids for concentrated solar power and data center cooling applications; solvents for electronics processing; food preservation; fuel markers; industrial and institutional cleaning; infrastructure applications; lubricant additives; products and services for energy markets including exploration, production, transmission, refining, mining, gas processing and carbon capture to optimize supply, improve efficiencies and manage emissions | Butyl glycol ethers, VERSENE™ Chelants, UCAR™ Deicing Fluids, UCARSOL™ Amines and related technology for carbon capture and gas treating, ethanolamines, ethylene oxide ("EO"), ethyleneamines, ELEVATE™ Additives for enhanced oil recovery, UCON™ Fluids, DOWANOL™ Glycol Ethers, DOWTHERM™ Heat Transfer Fluids, DOWFROST™ Fluids for data center cooling; higher glycols, isopropanolamines, low-VOC solvents, methoxypolyethylene glycol, methyl isobutyl, polyalkylene glycol, CARBOWAX™ SENTRY™ Polyethylene Glycol, TERGITOL™and TRITON™ brand surfactants, demulsifiers, drilling and completion fluids, rheology modifiers, scale inhibitors, shale inhibitors, specialty amine solvents, surfactants, water clarifiers, frothing separating agents | Ammonia, butene, ethylene, phenol, propylene | BASF, Eastman, Hexion, Huntsman, INEOS, LyondellBasell, SABIC, Sasol, Shell |
| Polyurethanes & Construction Chemicals | Aircraft deicing fluids; alumina; pulp and paper; appliances; automotive; bedding; building and construction; flooring; footwear; heat transfer fluids; hydraulic fluids; infrastructure; mobility; packaging; textiles and transportation; caulks and sealants; cement-based tile adhesives; concrete solutions; elastomeric roof coatings; industrial non-wovens; plasters and renders; roof tiles and siding; sport grounds and tape joint compounds | Aniline, caustic soda, ethylene dichloride ("EDC"), methylene diphenyl diisocyanate (“MDI”), polyether polyols, propylene glycol ("PG"), propylene oxide ("PO"), polyurethane systems, vinyl chloride monomer ("VCM"), AQUASET™ Acrylic Thermosetting Resins, DOW™ Latex Powder, RHOPLEX™ and PRIMAL™ Acrylic Emulsion Polymers, WALOCEL™ Cellulose Ethers
| Aniline, benzene, carbon monoxide, caustic soda, cell effluent, cellulose, chlorine, electric power, ethylene, hydrogen peroxide, propylene | Arkema, Ashland, BASF, Covestro, Eastman, Huntsman, Wanhua |
Joint Ventures
This segment includes a portion of the Company's share of the results of EQUATE, TKOC, Map Ta Phut and Sadara.
Current and Future Investments
The Company expects to make investments over the next several years to enhance competitiveness and increase underlying mid-cycle earnings in its Polyurethanes & Construction Chemicals and Industrial Solutions businesses. The investments will include alkoxylation capacity expansions and finishing capabilities, investments to support growth in polyurethane systems and efficiency improvements around the world.
In 2024, the Company benefited from the completion of an integrated MDI distillation and prepolymers facility along the U.S. Gulf Coast to increase distillation capabilities by 30 percent versus prior levels, which is expected to improve integrated margins for the portfolio. In addition, the Company completed the expansion of propylene glycol capacity at the existing joint venture facility in Map Ta Phut, Thailand by 80,000 metric tons per year, bringing total capacity to 250,000 metric tons per year, the largest propylene glycol plant in the region. This additional capacity came online in March 2024 and will support customer growth for food and pharma applications.
In 2024, the Industrial Solutions business continued to ramp up previously completed investments on the U.S. Gulf Coast and in Europe to expand capacity of specialty amines and alkoxylation chemistries to serve fast growing energy transition, pharmaceutical, home care, cleaning, and agriculture end-markets. The Company also further advanced applications in data center cooling with DOWFROSTTM LC Heat Transfer Fluid, which is specifically formulated for liquid-cooled, direct-to-chip applications and provides exceptional corrosion protection, freeze protection and ensures a long life-span of the system. The Company also announced its intent to invest in a new world-scale carbonate solvents facility in the United States to support domestic electric vehicle and energy storage markets in collaboration with the U.S. Department of Energy Office of Clean Energy Demonstrations.
In 2024, the Company also progressed the following:
•The Industrial Solutions business advanced investments to expand alkoxylation capacity in the United States and Europe. These investments build on previously announced capacity expansions, collectively increasing the Company's global alkoxylation capacity by 70 percent versus the 2020 baseline. The additional capacity is needed to support increasing demand across a wide range of fast-growing end-markets where the Company is delivering 10 percent to 15 percent annual growth rates, from home and personal care to industrial and institutional cleaning solutions and pharmaceuticals. The investments are backed by supply agreements with customers, including leading consumer brands, and are expected to come online in the United States and Europe within the next year.
•The Polyurethanes & Construction Chemicals business made significant progress in scaling key projects aligned with its long-term sustainability goals. Together with key industry partners and selected customers, Dow has created an innovative industry ecosystem, which pioneers the RENUVATM end-of-life mattress recycling program at an industrial scale, covering everything from collection and dismantling to re-polyol production and mattress manufacturing. Also, as part of its circular strategy, the Polyurethanes & Construction Chemicals business commercializes mass-balanced circular feedstock solutions, SPECFLEXTM CIR, for mobility applications.
•In support of customer requests to reduce Scope 3 emissions, the Polyurethanes & Construction Chemicals business successfully launched propylene glycol and CAV low-carbon offerings under Dow's DECARBIATM portfolio of reduced carbon materials, in which the decarbonization potential reaches from more than 40 percent to well above 90 percent depending on product grades.
•Dow announced a strategic review of select assets in Europe, primarily certain polyurethanes assets within the Industrial Intermediates & Infrastructure segment, as part of an effort to continue to optimize its global asset footprint. The strategic review is expected to be completed in 2025.
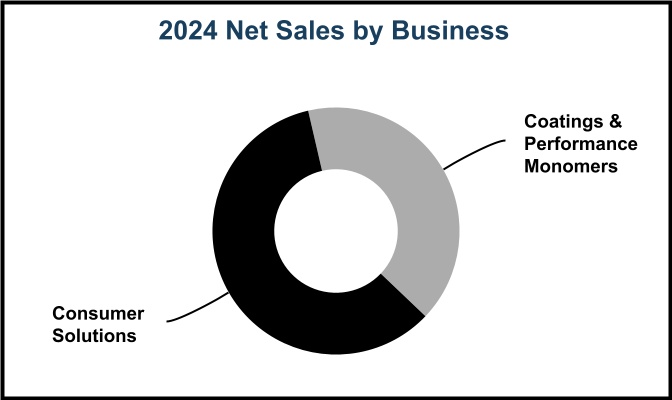
PERFORMANCE MATERIALS & COATINGS
The Performance Materials & Coatings operating segment includes industry-leading franchises that deliver a wide array of solutions into consumer, infrastructure and mobility end-markets. The segment consists of two global businesses: Coatings & Performance Monomers and Consumer Solutions. These businesses primarily utilize the Company's acrylics-, cellulosics- and silicone-based technology platforms to serve the needs of the architectural and industrial coatings; home and personal care; consumer and electronics; mobility; industrial and chemical processing; and infrastructure (including residential and commercial buildings) end-markets. Both businesses employ materials science capabilities, global reach and unique products and technology combining chemistry platforms to deliver differentiated, market-driven and sustainable innovations to customers.
Coatings & Performance Monomers
Coatings & Performance Monomers consists of two businesses: Coating Materials and Performance Monomers. The Coating Materials business makes critical ingredients and additives that help advance the performance of paints and coatings. The business offers innovative and sustainable products to accelerate paint and coatings performance across diverse market segments, including architectural paints and coatings, as well as industrial coatings applications used in maintenance and protective industries, wood, metal packaging, traffic markings, thermal paper and leather. These products enhance coatings by improving hiding and coverage characteristics, enhancing durability against nature and the elements, lowering or eliminating volatile organic compounds content, reducing maintenance and improving ease of application. The Performance Monomers business manufactures acrylics-based building blocks needed for the production of coatings, textiles, adhesives and home and personal care products.
Consumer Solutions
Consumer Solutions consists of two businesses: Performance Silicones & Specialty Materials and Silicone Feedstocks & Intermediates. The Performance Silicones & Specialty Materials business delivers an unmatched portfolio of performance-enhancing materials to meet the diverse needs of customers in fast-growing markets, including infrastructure; consumer and electronics; industrial and chemical processing; mobility; and home and personal care. It focuses resources on delivering valuable differentiation via market-driven innovations and sustainable solutions, which address lower-carbon footprint and circularity goals while enabling continued growth. The Silicone Feedstocks & Intermediates business focuses on maximizing productivity and optimizing margins by leveraging Dow’s scale and global reach. It is charged with producing silicon metal, siloxanes and intermediates, which are key materials to manufacture differentiated downstream silicone products.
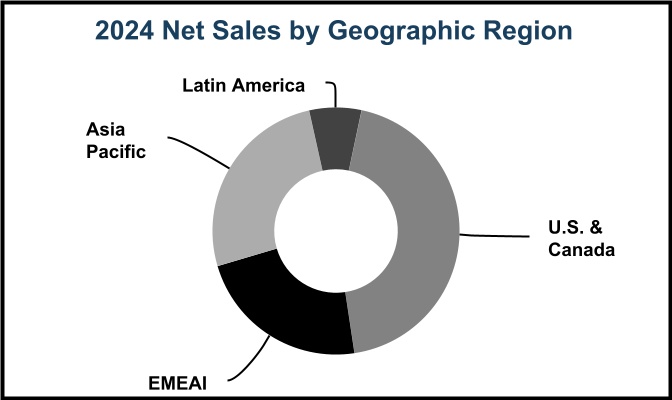
Details on Performance Materials & Coatings' 2024 net sales, by business and geographic region, are as follows:
Products
Major applications/market segments and products are listed below by business:
| | | | | | | | | | | | | | |
| Business | Applications/Market Segments | Major Products | Key Raw Materials | Key Competitors |
| Coatings & Performance Monomers | Acrylic binders for architectural paints and coatings, industrial coatings and paper; adhesives; dispersants; impact modifiers; inks and paints; opacifiers and surfactants for both architectural and industrial applications; plastics additives; processing aids; protective and functional coatings; rheology modifiers
| ACOUSTICRYL™ Liquid-Applied Sound Damping Technology; acrylates; ACRYSOL™ Rheology Modifiers; AVANSE™ Acrylic Binders; EVOQUE™ Pre-Composite Polymer; foam cell promoters; FORMASHIELD™ Acrylic Binder; high-quality impact modifiers; MAINCOTE™ Acrylic Epoxy Hybrid; methacrylates; processing aids; RHOPLEX™ Acrylic Resin; TAMOL™ Dispersants; FASTRACK™ Road Marking Resins; vinyl acetate monomers; weatherable acrylic capstock compounds for thermoplastic and thermosetting materials | Acetic acid, acetone, acrylic acid, ammonia, butanol, butyl acrylate, methanol, methyl methacrylate, propylene, styrene | Arkema, BASF, Celanese, Evonik, LyondellBasell, Wacker Chemie |
| Consumer Solutions | Personal and home care; mobility; infrastructure; consumer and electronics; industrial and chemical processing | Adhesives and sealants; antifoams and surfactants; coatings and controlled release; coupling agents and crosslinkers; fluids, emulsions and dispersions; formulating and processing aids; granulation and binders; oils; polymers and emollients; opacifiers; reagents; resins, gels and powders; rheology modifiers; rubber; solubility enhancers; aerospace composites; surfactants and solvents; encapsulants for solar photovoltaic applications; ACUSOL™ Prime 1 Polymer; AMPLIFY™ Si PE 1000 Polymer System; bio-based, readily biodegradable SunSpheres™ BIO SPF Booster; DOWSIL™ Silicone Products; SILASTIC™ Silicone Elastomers; SYL-OFF™ Silicone Release Coatings | Methanol, platinum, silica, silicon metal | Elkem, Momentive, Shin-Etsu, Wacker Chemie |
Current and Future Investments
In 2024, key growth capital projects in every major geographic region were brought online to meet customer needs in fast-growing markets. These include:
•Capacity expansions of silicone key intermediates enabling downstream growth globally across multiple end-markets, such as infrastructure; consumer and electronics; and mobility.
•Capacity expansions in Europe, Middle East, Africa and India ("EMEAI") to meet demand growth for sustainable silicone solutions in the personal care end-markets.
•Capacity expansions in Asia Pacific to meet growing demand for mobility, infrastructure, consumer and electronics end-markets.
•Capacity expansions in U.S. & Canada to accelerate growth in targeted applications within mobility, personal care, and infrastructure end-markets.
The Company continues to make targeted incremental investments strategically focused on higher-return and faster-payback projects that will require lower levels of capital investment in both the Coatings & Performance Monomers and Consumer Solutions businesses. These investments aim to expand manufacturing capacity, capabilities and efficiency, which further enhance competitiveness across end-markets.
Growth investments drive realization of the Company's broad product innovation portfolio where over 90 percent of projects deliver sustainability benefits. As part of this portfolio, the Coatings & Performance Monomers business continues to make significant strides in advancing architectural coatings innovations that provide both performance and sustainability benefits. The Company's capital strategy is aligned with industry trends to further expand investments focused on accelerating end-markets, including electronics, infrastructure and mobility. Debottlenecking investments allow the Company to fully leverage its global footprint and world-scale facilities to increase supply chain flexibility.
By leveraging global scale and a broad innovation portfolio, the Company is well-positioned to deliver differentiated solutions and sustainable materials in key end-markets, including infrastructure, electronics, industrial, mobility, and home and personal care.
CORPORATE
Corporate includes certain enterprise and governance activities (including insurance operations, environmental operations, etc.); non-business aligned joint ventures; non-business aligned litigation expenses; and discontinued or non-aligned businesses.
RAW MATERIALS
The Company operates in an integrated manufacturing environment. Basic raw materials are processed through many stages to produce a number of products that are sold as finished goods at various points in those processes. Hydrocarbon-based raw materials are the major raw material streams that feed the production of the Company's finished goods. The Company purchases hydrocarbon-based raw materials including ethane, propane, butane, naphtha and condensate as feedstocks. These raw materials are used in the production of both saleable products and energy. The Company also purchases and sells certain monomers, primarily ethylene and propylene, to balance internal production and internal consumption. The Company purchases natural gas, primarily to generate electricity, and purchases electric power to supplement internal generation. In addition, the Company produces a portion of its electricity needs in Louisiana and Texas; Alberta, Canada; The Netherlands; the United Kingdom; and Germany.
The Company's primary source of these raw materials are natural gas liquids ("NGLs"), which are derived from natural gas and crude oil production, and naphtha, which is produced during the processing and refining of crude oil. Given recent advancements in shale gas, shale oil and conventional drilling techniques, the Company expects these raw materials to be in abundant supply. The Company's suppliers of these raw materials include regional, international and national oil and gas companies.
The Company purchases raw materials on both short- and long-term contracts. The Company had adequate supplies of raw materials in 2024 and expects to continue to have adequate supplies of raw materials in 2025.
INDUSTRY SEGMENTS AND GEOGRAPHIC REGION RESULTS
See Note 25 to the Consolidated Financial Statements for information regarding Dow's chief operating decision maker, net sales, significant segment expenses, Operating EBIT and total assets by segment, as well as net sales and long-lived assets by geographic region.
SIGNIFICANT CUSTOMERS AND PRODUCTS
All products and services are marketed primarily through the Company’s sales force, although in some instances more emphasis is placed on sales through distributors. In 2024, no significant portion of the Company's sales was dependent upon a single customer.
PATENTS, LICENSES AND TRADEMARKS
The Company continually applies for and obtains U.S. and foreign patents and has a substantial number of pending patent applications throughout the world. At December 31, 2024, the Company owned approximately 4,000 active U.S. patents and 27,000 active foreign patents as follows:
| | | | | | | | |
| Remaining Life of Patents Owned at Dec 31, 2024 | United States | Rest of World |
| Within 5 years | 700 | | 4,200 | |
| 6 to 10 years | 1,400 | | 9,200 | |
| 11 to 15 years | 1,500 | | 12,200 | |
| 16 to 20 years | 400 | | 1,400 | |
| Total | 4,000 | | 27,000 | |
The Company’s primary purpose in obtaining patents is to protect the results of its research for use in operations and licensing. The Company is party to a substantial number of patent licenses, including intellectual property cross-license agreements and other technology agreements, and also has a substantial number of trademarks and
trademark registrations in the United States and in other countries, including the “Dow in Diamond” trademark. Although the Company considers that its patents, licenses and trademarks in the aggregate constitute a valuable asset, it does not regard its business as being materially dependent on any single or group of related patents, licenses or trademarks.
PRINCIPAL PARTLY OWNED COMPANIES
The Company’s principal nonconsolidated affiliates at December 31, 2024, including direct and indirect ownership interest for each, are listed below:
| | | | | | | | | | | |
| Principal Nonconsolidated Affiliate | Country | Ownership Interest | Business Description |
| EQUATE Petrochemical Company K.S.C.C. | Kuwait | 42.50 | % | Manufactures ethylene, polyethylene and ethylene glycol, and manufactures and markets monoethylene glycol, diethylene glycol and polyethylene terephthalate resins |
| | | |
| | | |
| | | |
| The Kuwait Olefins Company K.S.C.C. | Kuwait | 42.50 | % | Manufactures ethylene and ethylene glycol |
| The Kuwait Styrene Company K.S.C.C. | Kuwait | 42.50 | % | Manufactures styrene monomer |
Map Ta Phut Olefins Company Limited 1 | Thailand | 32.77 | % | Manufactures propylene and ethylene |
Sadara Chemical Company 2 | Saudi Arabia | 35.00 | % | Manufactures chlorine, ethylene, propylene and aromatics for internal consumption and manufactures and sells polyethylene, ethylene oxide and propylene oxide derivative products, and isocyanates |
| The SCGC-Dow Group: | | | |
| Siam Polyethylene Company Limited | Thailand | 50.00 | % | Manufactures polyethylene |
| Siam Polystyrene Company Limited | Thailand | 50.00 | % | Manufactures polystyrene |
| Siam Styrene Monomer Company Limited | Thailand | 50.00 | % | Manufactures styrene monomer |
| Siam Synthetic Latex Company Limited | Thailand | 50.00 | % | Manufactures latex and specialty elastomers |
1.The Company's effective ownership of Map Ta Phut is 32.77 percent, of which the Company directly owns 20.27 percent and indirectly owns 12.50 percent through its equity interest in Siam Polyethylene Company Limited.
2.The Company is responsible for marketing a significant portion of Sadara products outside of the Middle East zone through the Company's established sales channels. Under this arrangement, the Company purchases and sells Sadara products for a marketing fee. In 2021, Dow and the Saudi Arabian Oil Company agreed to a marketing rights transition plan. Execution of the transition plan is ongoing and progressing towards aligning marketing rights and responsibilities to levels more consistent with each partner's equity ownership.
See Note 11 to the Consolidated Financial Statements for additional information regarding nonconsolidated affiliates.
COMMITMENT TO SUSTAINABILITY
Dow believes its purpose is to deliver a sustainable future through its materials science and collaboration with its partners. That is why Dow is actively aligning its business and sustainability strategy, operational footprint, product offerings and technologies to unlock new sustainable growth opportunities within the markets it serves and deliver long-term value to its stakeholders.
The following four areas are critical for Dow to consistently deliver responsible, best-in-class performance and value growth:
Protecting the Climate
Climate change is a critical challenge to the world and Dow’s business. Dow embraces its responsibility to help reduce global GHG emissions and the impacts of climate change on natural ecosystems. Dow’s approach to climate protection includes efforts to both mitigate and adapt to climate change.
Advancing a Circular Economy and Safer Materials
Dow is continuously looking for better ways to make, use and reuse materials, to help keep them out of the environment and retain their value for as long as possible in support of a sustainable future. Dow believes in considering the total impact of a product over its life cycle, including factors such as demands and impacts on nature, GHG, performance, longevity and end of life, while also working to extend the lifespan of materials.
Dow is focused on utilizing its strong innovation pipeline to develop safer materials or reduce or eliminate priority substances in its products. The Company also invests in upstream manufacturing technologies to reduce facility emissions and, where necessary, restricts downstream uses of some substances.
Cultivating a Thriving Team and Community
Dow is committed to lead with inclusion, elevate its focus on diversity and embed equity into its practices, policies and processes for breakthrough results. The Company supports an innovative, sustainable and inclusive future where its communities can thrive, everyone has equitable access to careers in science, technology, engineering and math and skilled trades, and employees are empowered to accelerate change.
Driving Accountability and Best-in-Class Performance
Dow exercises strong corporate governance through transparency, risk management, effective leadership, ethical compliance and behavior, and stakeholder feedback and management. Dow’s approach to corporate governance is centered on its core values and helps create and maintain a culture that supports long-term success, strengthens decision-making and builds trust in the Company. Dow’s leadership starts with its experienced and highly skilled Board of Directors ("Board"). Among other duties, the Board oversees and guides the Company’s strategy, environmental, social and governance priorities, and risk management to help promote the creation of long-term value for its shareholders.
Dow has implemented and continues to expand on its multi-decade targets intended to put the Company on a path to achieve a sustainable future, which include the following:
•By 2030:
◦Dow will reduce its net annual Scope 1 and 2 CO2e emissions by 5 million metric tons compared with its 2020 baseline, representing a 15 percent reduction from 2020 and a 30 percent reduction in GHG emissions since 2005.
◦Dow will implement a robust land management strategy. Its top 20 water-dependent sites will have water stewardship plans, and 10 of those sites will be water-resilient.
◦Dow will transform plastic waste and other forms of alternative feedstock to commercialize 3 million metric tons of circular and renewable solutions annually.
•By 2035:
◦All Dow sites will have water stewardship plans.
•By 2050:
◦Dow intends to be carbon neutral (Scopes 1+2+3, plus product benefits).
◦Dow will partner to conserve 50,000 acres of habitat and its top 20 water-dependent sites will be water-resilient.
The Company's progress in achieving these targets is reviewed regularly by management and with the Environment, Health, Safety & Technology ("EHS&T") Committee of the Board.
Additional discussion of matters pertaining to sustainability, including the Company's actions related to sustainability, is included in Part I, Item 1A. Risk Factors; Part II, Item 7. Management's Discussion and Analysis of Financial Condition and Results of Operations; and Notes 1, 4 and 15 to the Consolidated Financial Statements. In addition, detailed information on the Company's performance regarding sustainability matters and goals, including the Company's annual INtersections Report, is accessible through Dow's Investors webpage at www.dow.com/investors. Dow's website and its content are not deemed incorporated by reference into this report.
HUMAN CAPITAL
Dow’s ambition – to be the most innovative, customer-centric, inclusive and sustainable materials science company in the world – starts with people. Dow employees create innovative and sustainable materials science solutions to advance the world. Every answer starts with asking the right questions, which is why the diverse, dedicated Dow team collaborates with customers and other stakeholders to find solutions to the world's toughest challenges. The Company's values of Respect for People, Integrity and Protecting Our Planet are fundamental beliefs that are ingrained in each action taken, can never be compromised and are the foundation of the Company's Code of Conduct.
The Company is dedicated to employee health and safety and is invested in fostering a culture of inclusion and continuous learning while supporting its employees through its Total Rewards plans and programs to ensure all Dow employees are respected, valued and encouraged to make their fullest contribution.
Safety, Employee Health and Well-Being
A commitment to safety and employee health is ingrained in Dow’s culture and central to how the Dow team works. Dow uses a comprehensive, integrated operating discipline management system that includes policies, requirements, best practices and procedures associated with health and safety. In 2024, the Company achieved an Occupational Safety and Health Administration Total Recordable Injury and Illness Rate of 0.18, based upon the number of incidents per 200,000 work hours for employees and contractors globally. This measure, along with a consistent set of globally applied, as well as locally defined, leading indicators of safety performance, are cornerstones of Dow's worker protection program. The Company maintains a robust, globally tracked near-miss program for situations that did not result in an injury, but could have been high consequence had circumstances been slightly different. This data is reviewed regularly by management and the EHS&T Committee of the Board, is visible to all employees and is built into digital dashboards that include actual injury information for every Dow location around the world.
As part of the Company’s total worker health strategy, employees have access to occupational health services at no cost through on-site, Company-managed clinics at its manufacturing locations or an offsite provider overseen by Dow Occupational Health. In addition to access for occupational health needs, the Company also has a comprehensive well-being strategy, which is framed across four dimensions – physical, mental, community and financial well-being – for an approach that is holistic, global, employee centered and outcome-driven. Key ambitions across the four dimensions focus on elements such as workplace stress, psychological safety, resiliency, workload, healthy eating and activities, and social community and inclusion opportunities.
Dow maintains active Crisis Management Teams at the corporate level and in each region where the Company operates to ensure appropriate plans are in place in the event of natural disasters or other emergencies.
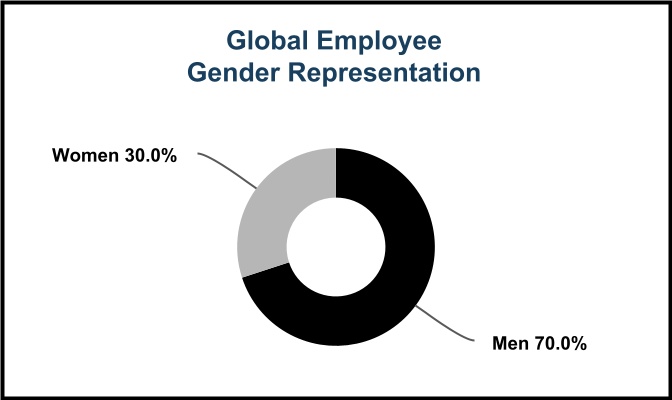
Inclusion, Diversity & Equity
At Dow, inclusion, diversity and equity (“ID&E”) is a business imperative evidenced by inclusion serving as a core pillar of the Company's ambition statement. A strategic and intentional focus on ID&E not only enhances the employee experience and satisfaction, but it also supports innovation, customer experience and understanding of the communities the Company serves. In 2024, Dow advanced to #3 on the Fair360 Top 50 Companies list, remaining in the top 10 for the second consecutive year. Additionally, for the fourth year in a row, Dow was recognized on the Fortune 100 Best Companies to Work For® list. These are significant accomplishments that represent only two of the many awards the Company received related to its efforts in ID&E.
Dow's strategic ID&E efforts are directed by its Chief Inclusion Officer and Office of Inclusion, which supports implementation throughout Dow’s businesses, functions and regions. Three Inclusion Councils drive the ID&E strategy from the top of the Company down and across the enterprise:
•The President’s Inclusion Council defines and supports Dow's ID&E strategy from the top.
•A Senior Leaders’ Inclusion Council influences change through senior and mid-level business, geographic and functional leaders.
•A Joint Inclusion Council collaborates to drive maximum employee engagement through Employee Resource Group (“ERG”) leadership.
Dow’s 10 ERGs represent a workforce rich in diversity of thought, perspectives and backgrounds. Dow’s ERGs help develop a high-performance workplace culture and cultivate a positive employee experience that supports business growth. ERG participation is voluntary and open to the Company's total workforce with strong allyship representation. Senior leaders serve as executive sponsors for each ERG. In addition, Dow has a Paid Time Off Policy which provides employees time off to volunteer and engage in ERG activities. In 2024, 61 percent of Dow’s workforce and 97 percent of Dow people leaders participated in at least one ERG.
Inclusion and diversity metrics, including global spend with certified diverse suppliers, global representation of women and U.S. ethnic minority representation, are embedded in the performance award bonus program for over 3,000 leaders. The results are published internally on a quarterly basis and reviewed regularly by management with the Compensation and Leadership Development Committee of the Board.
Global pay disparity studies have been conducted at Dow for over 20 years to assess fair treatment between genders and between U.S. ethnic minorities and non-minorities and to ensure Dow’s pay practices are being implemented as intended. The results have been publicly disclosed within the Company's annual INtersections Report. As part of Dow’s ID&E efforts, the Company will continue to conduct annual pay gap studies and actively engage with an external partner to further develop and continue to apply best practices.
Total Rewards
To achieve Dow’s ambition, the Company invests in its people, who are at the heart of the Company, through its Total Rewards plans and programs. The Total Rewards plans and programs are structured to attract, retain and motivate Dow’s employees. Dow’s Total Rewards are designed to support all aspects of its employees – their compensation, future, health, life and career. The Company is committed to aligning its strategy and culture with the needs of its employees and optimizing the investment Dow makes in Total Rewards.
As a global company with a diverse team, Dow aims to ensure employees have access to resources that allow them to meet their unique needs. That is why Dow has established three guiding principles that define its Total Rewards strategy: 1) ensuring programs are market competitive; 2) providing employees with offerings that align with their preferences to promote their financial, mental and physical well-being; and 3) offering programs that drive a performance-oriented, results-based culture that enables long-term shareholder value creation. Dow adapts its programs for geography-specific requirements, as well as cultural standards and expectations.
Employee Engagement, Learning and Development
Throughout an employee’s career, the Company supports development through a blend of learning approaches including in-person and virtual trainings, digital learning platforms, on-the-job training and a series of leadership development programs. The Company launched a new skills framework in 2024. The skills framework is aligned to enterprise competencies that support Dow's ambition. Additionally, the skills-valued focus increases the transparency of skills needed for current and future jobs and is embedded in talent practices to support employee growth, development and skill building for evolving business needs.
Annually, all employees have the opportunity to provide feedback on employee experience and offer insights into how to improve Dow’s working culture through a global employee opinion survey. A key component of the survey is an opportunity for employees to provide feedback on the effectiveness of their direct leader. In 2024, 73 percent of employees responded to the annual survey. The feedback received through this annual survey and additional quarterly checkpoint surveys is used to drive actions to improve the overall Dow experience for employees across the Company, as well as to support continuous improvement in leader effectiveness.
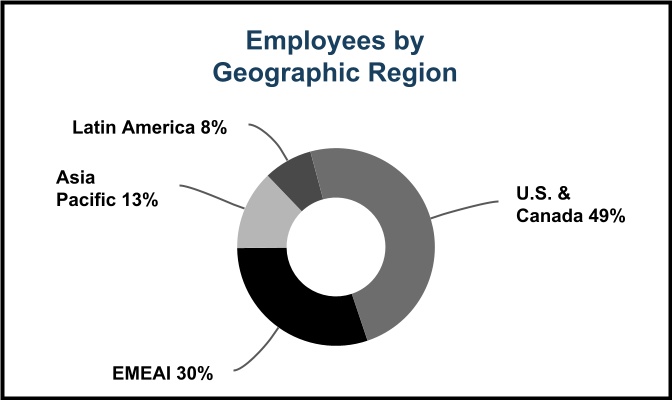
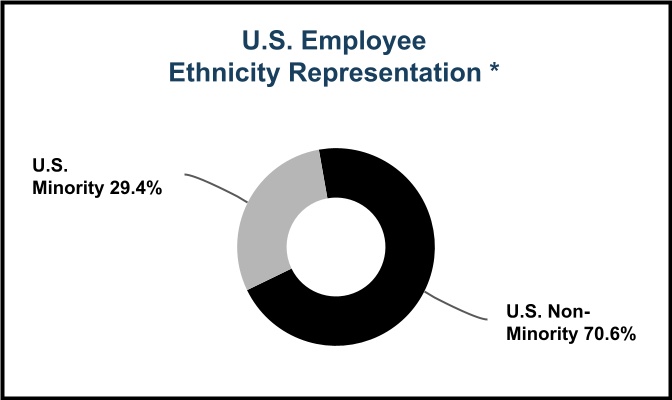
At December 31, 2024, the Company permanently employed approximately 36,000 people on a full-time basis.
| | | | | |
| * | U.S. ethnic minorities include employees who self-identify as American Indian or Alaskan Native, Asian, Black or African American, Hispanic or Latino, Native Hawaiian or other Pacific Islander, or two or more races. Employees who self-identify as White are considered U.S. Non-Minority. |
Additional information regarding Dow’s human capital measures can be found in the Company's annual INtersections Report, as well as Dow's U.S. Equal Employment Opportunity Report (EEO-1), accessible through the Inclusion and Diversity webpage at www.dow.com/diversity. Dow’s website and its content are not deemed incorporated by reference into this report.
OTHER ACTIVITIES
The Company engages in property and casualty insurance and reinsurance primarily through its Liana Limited subsidiaries.
EXECUTIVE OFFICERS OF THE REGISTRANT
Set forth below is information related to the Company's executive officers as of February 4, 2025:
| | | | | | | | | | | |
| Name, Age | Present Position with Registrant | Year Elected as Executive Officer of Dow Inc. | Other Business Experience since January 1, 2020 |
| Marco ten Bruggencate, 51 | President, Industrial Intermediates & Infrastructure | 2024 | DOW INC.: President, Industrial Intermediates & Infrastructure since December 2024. TDCC: President, Industrial Intermediates & Infrastructure since December 2024. DOW EUROPE GMBH: President, EMEAI1 from July 2024 to December 2024; Commercial Vice President for Packaging & Specialty Plastics for Europe, Middle East, and Africa from November 2019 to July 2024. |
| Lisa Bryant, 49 | Chief Human Resources Officer | 2022 | DOW INC.: Chief Human Resources Officer since November 2022. TDCC: Chief Human Resources Officer since November 2022; Senior Global Human Resources Director for Finance, Legal, Public Affairs, and Government Affairs from May 2020 to November 2022; North America Human Resources Director from February 2019 to May 2020. |
| Karen S. Carter, 54 | Chief Operating Officer | 2019 | DOW INC.: Chief Operating Officer since December 2024; President, Packaging & Specialty Plastics from November 2022 to December 2024; Chief Human Resources Officer and Chief Inclusion Officer from April 2019 to November 2022. TDCC: Chief Operating Officer since December 2024; President, Packaging & Specialty Plastics from November 2022 to December 2024; Chief Human Resources Officer from October 2018 to November 2022; Chief Inclusion Officer from July 2017 to November 2022. |
| Keith Cleason, 58 | President, Packaging & Specialty Plastics | 2024 | DOW INC.: President, Packaging & Specialty Plastics since December 2024. TDCC: President, Packaging & Specialty Plastics since December 2024; Business Vice President for Olefins, Aromatics & Alternatives and Univation Technologies from July 2018 to December 2024. |
| Andrea L. Dominowski, 50 | Controller and Vice President of Controllers | 2024 | DOW INC.: Controller and Vice President of Controllers since February 2024. TDCC: Controller and Vice President of Controllers since February 2024; Global Business Director for Silicone Feedstocks & Intermediates from August 2020 to February 2024; Regional Finance Director for North America from January 2018 to August 2020. |
| Jim Fitterling, 63 | Chair and Chief Executive Officer | 2018 | DOW INC.: Chair since April 2020; Chief Executive Officer since August 2018. TDCC: Chair since April 2020; Chief Executive Officer since July 2018. |
| Brendy Lange, 41 | President, Performance Materials & Coatings | 2024 | DOW INC.: President, Performance Materials & Coatings since April 2024. TDCC: President, Performance Materials & Coatings since April 2024; Business Vice President, Dow Industrial Solutions from February 2020 to April 2024; Global Business Director, Dow Industrial Solutions from January 2017 to February 2020. |
| John M. Sampson, 64 | Senior Vice President, Operations, Manufacturing & Engineering | 2021 | DOW INC.: Senior Vice President, Operations, Manufacturing & Engineering since October 2020. OLIN CORPORATION: Executive Vice President, Business Operations from April 2019 to September 2020. |
| A. N. Sreeram, 57 | Senior Vice President of Research & Development and Chief Technology Officer | 2019 | DOW INC.: Senior Vice President of Research & Development and Chief Technology Officer since April 2019. TDCC: Chief Technology Officer since October 2015; Senior Vice President of Research & Development since August 2013. |
| Jeffrey L. Tate, 55 | Chief Financial Officer | 2023 | DOW INC.: Chief Financial Officer since November 2023. TDCC: Chief Financial Officer since November 2023. LEGGETT & PLATT INCORPORATED: Executive Vice President and Chief Financial Officer from September 2019 to June 2023. |
| Amy E. Wilson, 54 | General Counsel and Corporate Secretary | 2018 | DOW INC.: General Counsel and Corporate Secretary since April 2019. TDCC: General Counsel since October 2018; Corporate Secretary since February 2015. |
1.Europe, Middle East, Africa and India.
The factors described below represent the Company's principal risks.
CLIMATE CHANGE - RELATED RISKS
Climate Change: Climate change-related risks and uncertainties, legal or regulatory responses to climate change and failure to meet the Company’s climate change commitments could negatively impact the Company’s results of operations, financial condition and/or reputation.
The Company is subject to increasing climate-related risks and uncertainties, many of which are outside of its control. Climate change may result in more frequent and damaging severe weather and weather-related events, potential changes in precipitation patterns and extreme variability in weather patterns. These short- and long-term weather and weather-related events can disrupt the operations of the Company as well as those of its customers, partners and vendors due to damage to local infrastructure and other property damage limiting site access, and causing water scarcity and lack of access to high-quality water, among other factors. These risks and uncertainties may also directly or indirectly impact decisions to invest in the construction and/or renovation of new or existing manufacturing sites and other Company facilities and locations.
The transition to lower greenhouse gas emissions technology, the effects of carbon pricing and changes in public sentiment, incentives, regulations, taxes, public mandates or requirements and increases in climate-related lawsuits, insurance premiums and implementation of more robust disaster recovery and business continuity plans could increase costs to maintain or resume the Company’s operations or achieve its sustainability commitments in the expected timeframes, which would negatively impact the Company’s results of operations.
In 2020, the Company announced commitments to reduce its net annual Scope 1 and 2 carbon dioxide equivalent ("CO2e") emissions by an additional 5 million metric tons, approximately a 15 percent reduction compared with its 2020 baseline, by 2030 (the 2020 baseline represents a 15 percent reduction in greenhouse gas emissions since 2005) and its intention to be carbon neutral by 2050 (Scope 1+2+3, as defined by the Greenhouse Gas Protocol Corporate Accounting and Reporting Standard, plus product benefits). In November 2023, the Board approved the final investment decision to build the world's first net-zero Scope 1 and 2 CO2e emissions integrated ethylene cracker and derivatives facility in Alberta, Canada, a key element for the Company to achieve its 2030 greenhouse gas emissions reduction commitment.
The commitments reflect the Company's current plans and targets and are not guarantees that it will be able to achieve them. The execution and achievement of the Company's commitments within projected cost estimates and expected timeframes, including the success of the Company's integrated ethylene cracker and derivatives facility in Alberta, Canada, are subject to risks and uncertainties which include, but are not limited to: advancement, availability, development and affordability of technology necessary to achieve these commitments; unforeseen design, operational and technological difficulties; availability and cost of necessary materials and components; adapting products to customer preferences and customer acceptance of sustainable supply chain solutions; changes in public sentiment and political leadership, including government incentives and tax credits to promote emission reductions; and the Company’s ability to comply with changing regulations, taxes, mandates or requirements related to greenhouse gas emissions or other climate-related matters, including prescriptive reporting of climate-related matters. In addition, standards for tracking and reporting on sustainability matters have not been harmonized, continue to evolve and may change over time, which could result in significant revisions to the Company's performance metrics, commitments or reported progress in achieving such commitments. Given the focus on sustainable investing, if the Company fails to meet its climate change commitments within the committed timeframe, coupled with its significant investments to meet those commitments, and adopt policies and practices to enhance sustainability, the Company’s reputation and its customer and other stakeholder relationships could be negatively impacted, reducing demand for the Company's products, and it may be more difficult for the Company to compete effectively or gain access to financing on acceptable terms when needed, which could negatively impact the Company’s financial condition, results of operations and cash flows.
MACROECONOMIC RISKS
Financial Commitments and Credit Markets: Market conditions could reduce the Company's flexibility to respond to changing business conditions or fund capital needs.
Adverse economic conditions, such as fluctuating interest rates, could reduce the Company’s flexibility to respond to changing business and economic conditions or to fund capital expenditures or working capital needs. The economic
environment could result in a contraction in the availability of credit in the marketplace and reduce sources of liquidity for the Company. This could result in higher borrowing costs.
Global Economic Considerations: The Company operates in a global, competitive environment which gives rise to operating and market risk exposure.
The Company sells its broad range of products and services in a competitive, global environment, and competes worldwide for sales on the basis of product quality, price, technology and customer service. Increased levels of competition could result in lower prices or lower sales volume, which could have a negative impact on the Company’s results of operations. Sales of the Company's products are also subject to extensive federal, state, local and foreign laws and regulations; trade agreements; import and export controls; taxes; and duties and tariffs. The imposition of additional regulations, controls, taxes and duties and tariffs or changes to bilateral and regional trade agreements could result in lower sales volume, which could negatively impact the Company’s results of operations.
Economic conditions around the world, and in certain industries and geographic regions in which the Company does business, also impact sales price and volume and affect the efficacy of the Company's supply chain. For example, market uncertainty and an economic downturn driven by inflationary pressures, higher input costs and margin compression have reduced demand for the Company's products, resulting in decreased sales volume in recent years which has yet to fully recover. Adverse economic conditions also caused supply chain constraints. These factors have had a negative impact on the Company's results of operations. Additionally, political tensions; war, including the ongoing conflicts in the Middle East and between Russia and Ukraine with the related sanctions and export restrictions; terrorism; epidemics; pandemics; or political instability in the geographic regions or industries in which the Company sells its products could also reduce demand for the Company's products and result in decreased sales volume or supply chain disruptions, which could have a negative impact on the Company’s results of operations.
In February 2022, Russia invaded Ukraine resulting in the United States, Canada, the European Union and other countries imposing economic sanctions on Russia. Dow suspended purchases of feedstocks and energy from Russia. Investments in and flow of Dow's materials into Russia have been stopped. These actions have not had and are not expected to have a material impact on the Company's financial condition or results of operations. However, the fluidity and continuation of the conflict may result in additional economic sanctions and other impacts which could have a negative impact on the Company’s financial condition, results of operations and cash flows. These include decreased sales; supply chain and logistics disruptions; volatility in foreign exchange rates and interest rates; inflationary pressures on and availability of raw materials and energy, most notably in Europe; and heightened cybersecurity threats. Further, the intensity and duration of the conflict in the Middle East and potential expansion of the hostilities in the region are difficult to predict and could disrupt the Company's supply chain operations, which could have a negative impact on the Company's results of operations.
In addition, volatility and disruption of financial markets could limit the ability of Dow's customers and suppliers to obtain adequate financing to maintain operations, which could result in a decrease in sales volume and have a negative impact on the Company’s results of operations. The Company’s global business operations also give rise to market risk exposure related to changes in inflation, foreign currency exchange rates, including the impact of foreign currency exchange rates resulting from highly inflationary economies such as Argentina, interest rates, commodity prices and other market factors such as equity prices. To manage such risks, the Company enters into hedging and other investment transactions, where deemed appropriate, pursuant to established guidelines and policies. If the Company fails to effectively manage such risks, it could have a negative impact on its results of operations.
Pension and Other Postretirement Benefits: Increased obligations and expenses related to the Company's defined benefit pension plans and other postretirement benefit plans could negatively impact its financial condition and results of operations.
While the Company has frozen its defined benefit plans and other postretirement benefit plans in the United States, the Company continues to sponsor these plans as well as defined benefit pension plans and other postretirement benefit plans in a number of other countries (together with U.S. plans, the “plans”). The assets of the Company's funded plans are primarily invested in fixed income securities, equity securities of U.S. and foreign issuers and alternative investments, including investments in real estate, private equity and absolute return strategies. Changes in the market value of plan assets, investment returns, discount rates, mortality rates and regulations may affect the funded status of the Company's plans and could cause volatility in the net periodic benefit cost and future funding requirements of the plans. A significant increase in the Company's obligations or future funding requirements could
have a negative impact on the Company's results of operations and cash flows for a particular period and on the Company's financial condition.
Supply/Demand Balance: Earnings generated by the Company's products vary based in part on the balance of supply relative to demand within the industry.
The balance of supply relative to demand within the industry may be significantly impacted by the addition of new capacity, especially for basic commodities where capacity is generally added in large increments as world-scale facilities are built. This may result in excess capacity which can disrupt regional industry supply and demand balances, particularly in Europe, Middle East, Africa and India ("EMEAI") and Asia Pacific, resulting in downward pressure on prices and decreased operating rates, which could negatively impact the Company’s results of operations.
LEGAL AND REGULATORY RISKS
Environmental Compliance: The costs of complying with evolving regulatory requirements could negatively impact the Company's financial results. Actual or alleged violations of environmental laws or permit requirements could result in restrictions or prohibitions on plant operations, substantial civil or criminal sanctions, as well as the assessment of strict liability and/or joint and several liability.
The Company is subject to extensive federal, state, local and foreign laws, regulations, rules and ordinances relating to pollution, protection of the environment, climate change, greenhouse gas emissions, and the generation, storage, handling, transportation, treatment, disposal and remediation of hazardous substances and waste materials. In addition, the Company may have costs related to environmental remediation and restoration obligations associated with past and current sites as well as related to its past or current waste disposal practices or other hazardous materials handling. Although management will estimate and accrue liabilities for these obligations, it is reasonably possible that the Company’s ultimate cost with respect to these matters could be significantly higher, which could negatively impact the Company’s financial condition and results of operations. Costs and capital expenditures relating to environmental, health or safety matters are subject to evolving regulatory requirements and depend on the timing of the promulgation and enforcement of specific standards which impose the requirements. Moreover, changes in environmental regulations could inhibit or interrupt the Company’s operations, or require modifications to its facilities. Further, additional environmental disclosure obligations require and may continue to require the Company to implement new practices and reporting processes, and have created and will continue to create additional compliance risk. Accordingly, environmental, health or safety regulatory matters could result in significant unanticipated costs or liabilities. For additional information, see Part II, Item 7. Other Matters, Environmental Matters in Management’s Discussion and Analysis of Financial Condition and Results of Operations.
Health and Safety: Increased concerns regarding the safe use of chemicals and plastics in commerce and their potential impact on the environment have resulted in more restrictive regulations and could lead to new regulations.
Concerns regarding the safe use of chemicals and plastics in commerce and their potential impact on health and the environment reflect a growing trend in societal demands for increasing levels of product safety and environmental protection. These concerns could manifest themselves in stockholder proposals, preferred purchasing, delays or failures in obtaining or retaining regulatory approvals, delayed product launches, lack of market acceptance and continued pressure for more stringent regulatory intervention and litigation. These concerns could also influence public perceptions, the viability or continued sales of certain of the Company's products, its reputation and the cost to comply with regulations. In addition, terrorist attacks and natural disasters have increased concerns about the security and safety of chemical production and distribution. These concerns could have a negative impact on the Company's results of operations.
Local, state, federal and foreign governments continue to propose new regulations related to the security of chemical plant locations and the transportation of hazardous chemicals, which could result in higher operating costs.
Litigation: The Company is party to a number of claims and lawsuits arising out of the normal course of business with respect to product liability, patent infringement, employment matters, governmental tax and regulation disputes, contract and commercial litigation, and other actions.
Certain of the claims and lawsuits facing the Company purport to be class actions and seek damages in very large amounts. All such claims are contested. With the exception of the possible effect of the asbestos-related liability of Union Carbide Corporation (“Union Carbide”) as described below, it is the opinion of the Company’s management that the possibility is remote that the aggregate of all such claims and lawsuits will have a material adverse impact on the Company’s consolidated financial statements.
Union Carbide is and has been involved in a large number of asbestos-related suits filed primarily in state courts during the past several decades. At December 31, 2024, Union Carbide's total asbestos-related liability, including future defense and processing costs, was $791 million ($867 million at December 31, 2023).
Plastic Waste: Increased concerns regarding plastic waste in the environment, resulting in the demand for substitute materials; brand owners selectively reducing their use of plastic products; a lack of plastic waste collection and recycling infrastructure and a failure to develop circular plastic materials or a circular economy for plastics; and/or the development of new or more restrictive regulations and rules related to plastic waste and related emissions could reduce demand for the Company’s plastic products and could negatively impact the Company’s financial results.
Plastics have faced increasing public scrutiny due to low recycling rates and the presence of plastic waste in the environment, including the world’s oceans and rivers, and pollution associated with the manufacture of plastics. Accordingly, regulators, manufacturers, brand owners and consumers are driving demand for materials made with recycled content, bio-based materials and materials made with low or zero carbon emission options, and local, state, federal and foreign governments are proposing and implementing regulations to address the global plastic waste challenge, including, but not limited to, extended producer responsibility fees, recycled content mandates, taxes on plastics at the national level and bans on non-essential items. Further, an intergovernmental negotiation committee is in the process of negotiating an international legally binding instrument to end plastic pollution.
Dow is one of the world’s largest plastics producers and sells plastic products that continue to enable increasing quality and standards of living and offer significant greenhouse gas reductions compared with alternative solutions. In order to both maintain the benefits of plastics, meet growing demand for circular and renewable plastics and advance efforts to end plastic pollution in the environment, the Company is partnering with other organizations to bring the waste back into the circular economy. The Company's Transform the Waste target (announced in October 2022) aims to transform plastic waste and other forms of waste to commercialize 3 million metric tons of circular and renewable solutions by 2030. Further, the Company has committed to reducing its net annual greenhouse gas emissions and intends to be carbon neutral by 2050 (Scope 1+2+3, as defined by the Greenhouse Gas Protocol Corporate Accounting and Reporting Standard, plus product benefits).
Without the expansion of proper waste collection and recycling infrastructure and the development of a circular economy for plastics at scale, along with increased pressure to reduce the use of plastics, the Company could experience reduced demand for its polyethylene products, which could negatively impact the Company’s financial condition, results of operations and cash flows.
OPERATIONAL AND STRATEGIC RISKS
Company Strategy: Implementing certain elements of the Company's strategy could negatively impact its financial results.
The Company currently has manufacturing operations, sales and marketing activities, and joint ventures in emerging geographic regions. Activities in these geographic regions are accompanied by uncertainty and risks including: navigating different government regulatory environments; relationships with new, local partners; project funding commitments and guarantees; expropriation, military actions, war, terrorism, sanctions and political instability; sabotage; uninsurable risks; suppliers not performing as expected resulting in increased risk of extended project timelines; and determining raw material supply and other details regarding product movement.
The Company also makes strategic investments in emerging companies. While the Company pursues strategic investments because it expects them to yield longer-term benefits, they could adversely affect the Company’s near-term results of operations. These investments may not yield the business benefits, synergies or financial benefits anticipated by management.
Additionally, disruptions to supply chains, distribution chains and/or public and private infrastructure and services, including those caused by industry capacity constraints, material availability, global logistics delays, and third party service and material providers; and constraints arising from, among other things, the transportation capacity of ocean shipping containers; global labor availability constraints; and/or disruptions to the Company's site operations caused by tenant and neighboring manufacturing operations, as well as the Company's ability to attract and retain a talented workforce, could materially and adversely impact the Company's business operations.
If the manufacturing operations, supply chains, sales and marketing activities, investments in emerging companies and joint venture operations are not reliable and/or the implementation of the Company's projects is not successful, it could adversely affect the Company’s financial condition, cash flows and results of operations.
Cybersecurity Threat: Disruption of the Company's information technology, data security, and other operating or third-party systems, including disruption of the ability to safely and reliably operate the Company's facilities; the risk of loss of the Company’s proprietary information including trade secrets, know-how or other sensitive business information; and the risk of loss or security of the private data of the Company, its customers and its employees could negatively impact the Company’s business strategy, results of operations, financial condition and reputation.
The Company relies on various information systems, including information systems operated by third-parties which may also include embedded artificial intelligence ("AI"), to support safe, efficient and reliable business and operating processes and activities and to safeguard its proprietary information assets, including trade secrets, know-how and other sensitive, business critical information. These systems are critical to the Company's process to accurately report financial results for management and external reporting purposes and to ensure compliance with financial reporting, legal and tax requirements in the United States and around the world. These systems may also be used to collect and process sensitive customer and personal employee data the Company may be legally required to protect.
Increased global cybersecurity vulnerabilities, threats and targeted cyberattacks, which are becoming more sophisticated as attackers increase their utilization of developing techniques and tools, including AI, continue to pose risks to the Company’s products, systems and networks, and the confidentiality, availability and integrity of the Company’s data. These vulnerabilities also expose the Company’s customers, suppliers and third-party service providers to loss. In addition, the Company is exposed to similar risks resulting from cyberattacks that are experienced by its suppliers and other vendors. As a result, cyberattacks, internal and external security breaches, and attacks and security breaches of third-party systems could disrupt the Company's operations, compromise Dow’s proprietary and confidential, business critical information, jeopardize the Company's ability to safeguard and maintain accurate data, including personal data, and harm the Company's reputation which could result in litigation, enforcement actions, including fines, penalties and disruption of the Company's right to operate in certain jurisdictions, and significant remediation costs. Additionally, the Company’s use of AI software may create additional risks related to the unintentional disclosure of proprietary, confidential, personal or otherwise sensitive information.
While the Company has a comprehensive cybersecurity program that is continuously reviewed, maintained and upgraded, cyberattacks by nation-state organizations, crime organizations and other hackers have become increasingly sophisticated, and it is possible for such attacks to remain undetected for an extended period of time. Such attacks could have a material negative impact on the Company’s business strategy, results of operations, financial position and reputation. More information on the Company’s processes for assessing, identifying and managing material risks from cybersecurity threats, including management’s role and the Board's oversight of such processes, can be found in Item 1C. Cybersecurity.
Goodwill: An impairment of goodwill could negatively impact the Company’s financial results.
At least annually, the Company assesses goodwill for impairment. If testing indicates that goodwill is impaired, the carrying value is written down based on fair value with a charge against earnings. Where the Company utilizes a discounted cash flow methodology in determining fair value, continued weak demand for a specific product line or business could result in an impairment. Accordingly, any determination requiring the write-off of a significant portion of goodwill could negatively impact the Company's results of operations. See Note 12 to the Consolidated Financial Statements for additional information regarding the Company's goodwill impairment testing.
Operational Event: A significant operational event could negatively impact the Company's results of operations.
As a diversified chemical manufacturing company, the Company's operations at each site, including maintenance of its facilities, the transportation of supplies and products, cyberattacks, the Company's limited utilization of AI in its operations, pandemics and other public health-related events or severe weather conditions and other natural phenomena (such as freezing, drought, hurricanes, earthquakes, tsunamis, floods, etc.) could result in an unplanned or unintended event that could be significant in scale and could negatively impact operations, neighbors or the public at large, which could have a negative impact on the Company's results of operations.
Major hurricanes and other weather-related events have caused significant disruption in the Company's operations on the U.S. Gulf Coast, logistics across the region, and the supply of certain raw materials, which had an adverse impact on volume and cost for some of its products. Due to the Company's substantial presence on the U.S. Gulf Coast, similar severe weather conditions or other natural phenomena in the future could negatively impact the Company's results of operations. Other non-weather-related unplanned events have also caused disruptions in the
Company’s operations at various sites. While the Company has processes in place to minimize the risks and impacts of such events, such unplanned future events could negatively impact the Company’s results of operations.
Raw Materials: Availability of purchased feedstock and energy, and the volatility of these costs, impact Dow’s operating costs and add variability to earnings.
Purchased feedstock and energy costs account for a substantial portion of the Company’s total production costs and operating expenses. The Company purchases hydrocarbon-based raw materials including ethane, propane, butane, naphtha and condensate as feedstocks and purchases certain monomers, primarily ethylene and propylene, to supplement internal production, as well as other raw materials. The Company also purchases natural gas, primarily to generate electricity, electric power to supplement internal generation, and steam.
Feedstock and energy costs generally follow price trends in crude oil and natural gas, which are sometimes volatile. Power prices often follow general energy trends, and are additionally subject to short-term surfeits and shortages related to, for example, intermittent wind and solar generation, and power generation and transmission outages. While the Company uses its feedstock flexibility and financial and physical hedging programs to help mitigate feedstock cost increases, the Company is not always able to immediately raise selling prices. Ultimately, the ability to pass on underlying cost increases is dependent on market conditions. Conversely, when feedstock and energy costs decline, selling prices generally decline as well. As a result, volatility in these costs could impact the Company’s results of operations.
While the Company expects abundant and cost-advantaged supplies of natural gas liquids ("NGLs") in the United States to persist for the foreseeable future, if NGLs become significantly less advantaged than crude oil-based feedstocks, it could have a negative impact on the Company’s results of operations and future investments. Also, if the Company’s key suppliers of feedstock and energy are unable to provide the raw materials required for production, it could have a negative impact on the Company’s results of operations.
PANDEMIC - RELATED RISKS
Public Health Crisis: A public health crisis or global outbreak of disease could have a negative effect on the Company's manufacturing operations, supply chain and workforce, creating business disruptions that could have a substantial negative impact on the Company’s results of operations, financial condition and cash flows.
A public health crisis, including a pandemic similar in nature to coronavirus disease 2019, could impact all geographic regions where Dow products are produced and sold. The global, regional and local spread of a public health crisis could result in, and in the past has resulted in, significant global mitigation measures, including government-directed quarantines, social distancing and shelter-in-place mandates, travel restrictions and/or bans, mask and vaccination mandates, restrictions on large gatherings and restricted access to certain corporate facilities and manufacturing sites. Business disruptions and market volatility resulting from a public health crisis could have a substantial negative impact on the Company’s results of operations, financial condition and cash flows. The adverse impact of a pandemic could include, and in the past has included, without limitation, fluctuations in the Company’s stock price due to market volatility; a decrease in demand for certain Company products; price declines; reduced profitability; supply chain disruptions impeding the Company’s ability to ship and/or receive product; temporary idling or permanent closure of select manufacturing facilities and/or manufacturing assets; asset impairment charges; interruptions or limitations to manufacturing operations imposed by local, state or federal governments; reduced market liquidity and increased borrowing costs; workforce absenteeism and distraction; labor shortages; customer credit concerns; increased cybersecurity risk and data accessibility disruptions due to remote working arrangements; workforce reductions and fluctuations in foreign currency markets. Additional risks may include, but are not limited to: shortages of key raw materials; potential impairment in the carrying value of goodwill; additional asset impairment charges; increased obligations related to the Company’s pension and other postretirement benefit plans; and tax valuation allowance; and may also have the effect of heightening many of the other risks described in this "Risk Factors" section.
| | |
| ITEM 1B. UNRESOLVED STAFF COMMENTS |
None.
Risk Management and Strategy
The Company has processes in place to identify, assess and monitor material risks from cybersecurity threats, which are part of the Company’s overall enterprise risk management process and have been embedded in the Company’s operating procedures, internal controls and information systems.
Dow's comprehensive cybersecurity and information security framework includes risk assessment and mitigation through a threat intelligence-driven approach, application controls, and enhanced security with ransomware defense. The framework leverages International Organization for Standardizations 27001/27002 standards for general information technology controls, International Society of Automation/International Electrotechnical Commission standards for industrial automation, the National Institute of Standards and Technology Cyber Security Framework ("NIST CSF") for measuring overall readiness to respond to cyber threats, and Sarbanes-Oxley for assessment of internal controls. In addition, the Company maintains business continuity and disaster recovery plans as well as a cybersecurity insurance policy.
Dow has comprehensive processes to manage cybersecurity risks when engaging with third-party service providers, including reviewing questionnaires and independent quantitative scores of the vendor’s cyber hygiene, maintaining robust controls to address and mitigate significant risks that may arise, and performing ongoing assessments and reviews throughout the duration of the engagement.
Dow has established cybersecurity and information security awareness training programs. Formal training on topics relating to the Company’s cybersecurity, data privacy and information security policies and procedures is mandatory at least annually for all employees, contractors and third parties with access to the Company’s network. Training is administered and tracked through online learning modules. Training topics include how to escalate suspicious activities including phishing, viruses, spams, insider threats, suspect human behaviors or safety issues. Based on role and location, some employees receive additional in-depth training to provide more comprehensive knowledge on potential risks related to their individual job responsibilities. Training is supplemented through regular Company communications with frequent updates to educate on the latest adversary trends and social engineering techniques.
Additionally, Dow engages in cyber crisis response simulations to assess Dow’s ability to adapt to information and operational technology threats. Improper or illegitimate use of the Company’s information system resources or violation of the Company’s information security policies and procedures is subject to disciplinary action. Dow’s security posture is supported by a comprehensive defense-in-depth strategy that relies on layers of technology including Multi-Factor Authentication and principles of Zero Trust to ensure that access to information and communication is vetted and secure.
Dow also utilizes internal and external audits and assessments, vulnerability testing, governance processes over outsourced service providers, active risk management and benchmarking against peers in the industry to validate Dow’s security posture. The Company also engages external firms to measure Dow’s NIST CSF maturity level.
As of the date of this report, no risks from cybersecurity threats, including those resulting from any previous cybersecurity incidents, have materially affected, or are reasonably likely to materially affect, the Company, including its business strategy, results of operations or financial condition. Although the Company has mature processes in place to identify and mitigate potential risks from cybersecurity threats, such risks cannot be completely eliminated. More information on the risks of cybersecurity threats and potential impact to the Company can be found in Item 1A. Risk Factors.
Governance
Role of Management
Dow’s Information Systems organization is led by Dow’s Chief Information and Digital Officer, who reports to Dow's Chief Operating Officer, and is responsible for administration of the cybersecurity and information security framework and risk management, with oversight by the Audit Committee of the Board.
The Company’s Chief Information and Digital Officer has formal education in information technology and more than 30 years of experience in information systems and technology, including as the vice president of Global Information Technology. Prior to joining Dow, the Chief Information and Digital Officer held a variety of leadership roles including vice president of Information Technology at Cargill, Incorporated. The Chief Information and Digital Officer receives
regular updates on cybersecurity matters, results of mitigation efforts and cybersecurity incident response and remediation.
The Company’s management responsible for developing and executing Dow’s cybersecurity policies is comprised of individuals with either formal education and degrees in information technology or cybersecurity, or with experience working in information technology and cybersecurity, including relevant experience in security related industries. Additionally, leaders in the Company’s information technology function receive periodic training and education on cybersecurity related topics. Certain leaders also obtain industry certifications, such as Certified Information Systems Security Professional or Certified Information Security Manager.
The Company’s Cyber Security Operations Center (“CSOC”) serves as the central point for all cybersecurity incidents and reporting, including incidents that directly target employees or Dow internal information systems and incidents originating from third parties. The CSOC provides end-to-end operations for purposes of monitoring, detecting, alerting and responding to cybersecurity incidents. The CSOC evaluates each incident in terms of its impact on the Company’s operations, ability to conduct business with customers and suppliers, brand reputation and health, safety or the environment, and the speed and degree to which the incident has been contained. The CSOC is also responsible for activating the containment and resolution efforts and third-party service providers are engaged where appropriate to support the Company through the resolution of the incident. The CSOC escalates incidents with significant impact and pervasiveness to the Company’s Corporate Crisis Management Team for further action. After initial identification, the CSOC monitors all cybersecurity incidents for changes in degree of impact or pervasiveness.
Role of the Board
Dow's Board recognizes the importance of cybersecurity in safeguarding the Company’s sensitive data. The Board is responsible for overseeing overall risk management for the Company, including review and approval of the enterprise risk management approach and processes implemented by management to identify, assess, manage and mitigate risk, at least annually. While the full Board is accountable for cybersecurity and AI risk management, the Board has delegated responsibility for oversight of the Company’s cybersecurity and information security framework and risk management to the Audit Committee of the Board. The Audit Committee receives information and updates at least quarterly and actively engages with senior leaders, including the Chief Information and Digital Officer and Chief Information Security Officer, with respect to the effectiveness of the Company’s cybersecurity and information security framework, data privacy, and risk management. In addition, the Audit Committee receives reports summarizing threat detection and mitigation plans, audits of internal controls, training and certification, and other cyber priorities and initiatives, as well as timely updates from senior leaders on material incidents relating to information systems security, including cybersecurity incidents. The Audit Committee also reviews external firms’ assessments of the Company’s security posture and NIST CSF maturity level. Information made available to the Audit Committee is also made available to the full Board. The Audit Committee includes members with significant experience and/or expertise in technology or cybersecurity, including information systems.
The Company's corporate headquarters are located in Midland, Michigan. The Company's manufacturing, processing, marketing and research and development facilities, as well as regional purchasing offices and distribution centers are located throughout the world. The Company has investments in property, plant and equipment related to global manufacturing operations. Collectively, the Company operates 91 manufacturing sites in 30 countries. The following table includes the major manufacturing sites by operating segment, including consolidated variable interest entities:
| | | | | | | | | | | |
| Major Manufacturing Sites by Segment | Packaging & Specialty Plastics | Industrial Intermediates & Infrastructure | Performance Materials & Coatings |
| Location |
| Bahia Blanca, Argentina | X | | |
| Candeias, Brazil | X | X | |
| Canada: | | | |
| Fort Saskatchewan, Alberta | X | | |
| Prentiss, Alberta | X | | |
| Joffre, Alberta | X | | |
| Zhangjiagang, China | X | X | X |
| Germany: | | | |
| Boehlen | X | X | |
| Leuna | X | | |
| Schkopau | X | X | |
| Stade | | X | |
| Terneuzen, The Netherlands | X | X | |
| Tarragona, Spain | X | X | |
| Map Ta Phut, Thailand | | X | X |
| Barry, United Kingdom | | | X |
| United States: | | | |
| Carrollton, Kentucky | | | X |
| Hahnville, Louisiana | X | X | X |
| Plaquemine, Louisiana | X | X | |
| Midland, Michigan | | | X |
| Deer Park, Texas | | X | X |
| Freeport, Texas | X | X | X |
| Orange, Texas | X | | |
| Seadrift, Texas | X | X | |
| Texas City, Texas | | X | X |
Including the major manufacturing sites, the Company has manufacturing sites and holdings in all geographic regions as follows:
| | | | | |
| Manufacturing Sites by Region |
| Asia Pacific | 14 manufacturing sites in 10 countries |
EMEAI 1 | 32 manufacturing sites in 14 countries |
| Latin America | 13 manufacturing sites in 4 countries |
| U.S. & Canada | 32 manufacturing sites in 2 countries |
1.Europe, Middle East, Africa and India.
Properties of the Company include facilities which, in the opinion of management, are suitable and adequate for their use and will have sufficient capacity for the Company’s current needs and expected near-term growth. All of the Company’s plants are owned or leased, subject to certain easements of other persons which, in the opinion of management, do not substantially interfere with the continued use of such properties or materially affect their value. No title examination of the properties has been made for the purpose of this report. Additional information with respect to the Company's property, plant and equipment and leases is contained in Notes 10, 14 and 16 to the Consolidated Financial Statements.
| | |
| ITEM 3. LEGAL PROCEEDINGS |
Asbestos-Related Matters of Union Carbide Corporation
Union Carbide Corporation (“Union Carbide”), a wholly owned subsidiary of the Company, is and has been involved in a large number of asbestos-related suits filed primarily in state courts during the past several decades. These suits principally allege personal injury resulting from exposure to asbestos-containing products and frequently seek both actual and punitive damages. The alleged claims primarily relate to products that Union Carbide sold in the past, alleged exposure to asbestos-containing products located on Union Carbide’s premises, and Union Carbide’s responsibility for asbestos suits filed against a former Union Carbide subsidiary, Amchem Products, Inc.
For additional information, see Part II, Item 7. Other Matters, Asbestos-Related Matters of Union Carbide Corporation in Management’s Discussion and Analysis of Financial Condition and Results of Operations, and Notes 1 and 15 to the Consolidated Financial Statements.
Environmental Proceedings
On May 17, 2021, the Company received a civil complaint from the State of Texas ("State") on behalf of the Texas Commission on Environmental Quality, filed in the 250th District Court of Travis County, Texas. The suit alleges environmental violations at the Company's Freeport, Texas, site involving several air emissions events, which allegedly occurred at the site between 2016 and 2021. The State is seeking monetary and injunctive relief to prevent recurrence. Discussions between the Company and the Texas Office of the Attorney General are ongoing.
On December 16, 2022, the U.S. Department of Justice filed a complaint and proposed consent decree with the U.S. District Court for the District of New Jersey ("District Court") on behalf of the U.S. Environmental Protection Agency ("EPA") relating to environmental contamination at the Lower Passaic River Study Area Superfund Site in New Jersey. The EPA filed an amended complaint and proposed consent decree on January 17, 2024. The proposed consent decree includes a requirement that 85 settling defendants, including the Company’s Essex Chemical Corporation subsidiary ("Essex"), make a collective payment of $150 million for the EPA’s past and anticipated future response costs, with Essex’s share of the group settlement costs being $1.15 million. On January 31, 2024, the EPA filed a motion for approval and entry of the consent decree. On December 18, 2024, the District Court approved and entered the consent decree. The District Court's decision has been appealed to the U.S. Third Circuit Court of Appeals.
In October 2023, EPA Region 6 conducted an inspection of the Company’s Louisiana Operations under the EPA’s Risk Management Program ("RMP"). The inspection was initiated due to an incident at the Company's Glycol-2 unit in Plaquemine, Louisiana, on July 14, 2023, as previously disclosed by the Company. The EPA published its inspection report on January 26, 2024. On January 3, 2025, the Company received a Notice Letter from the EPA’s enforcement branch, which formally alleged 21 violations of RMP and Clean Air Act requirements and offered the Company an opportunity to confer with the EPA. The Company expects to engage with the EPA to discuss the Notice Letter.
| | |
| ITEM 4. MINE SAFETY DISCLOSURES |
Not applicable.
| | | | | | | | |
| Dow Inc. and Subsidiaries | |
| The Dow Chemical Company and Subsidiaries | |
| PART II | |
| | |
| ITEM 5. MARKET FOR REGISTRANT'S COMMON EQUITY, RELATED STOCKHOLDER MATTERS AND ISSUER PURCHASES OF EQUITY SECURITIES |
Dow Inc. is the direct parent company of The Dow Chemical Company and its consolidated subsidiaries, ("TDCC" and together with Dow Inc., "Dow" or the "Company"), owning all of the outstanding common shares of TDCC. The principal market for Dow Inc.'s common stock is the New York Stock Exchange, traded under the symbol “DOW.”
Dow Inc. has paid dividends on a quarterly basis and expects to continue to do so, subject to approval by the Dow Inc. Board of Directors ("Board"). Additional dividend information can be found in Note 17 to the Consolidated Financial Statements and Liquidity and Capital Resources in Item 7. Management's Discussion and Analysis of Financial Condition and Results of Operations.
At January 15, 2025, there were 60,643 stockholders of record.
See Part III, Item 11. Executive Compensation for information relating to shares authorized for issuance under Dow Inc.'s equity compensation plans.
The Company grants stock-based compensation to employees and non-employee directors under stock incentive plans, in the form of stock options, stock appreciation rights, performance stock units and restricted stock units. See Note 20 to the Consolidated Financial Statements for additional information.
Issuer Purchases of Equity Securities
The following table provides information regarding purchases of Dow Inc. common stock by the Company during the three months ended December 31, 2024. The Company makes such purchases only during open windows subject to its insider trading policy.
| | | | | | | | | | | | | | |
| Issuer Purchases of Equity Securities | Total number of shares purchased as part of the Company's publicly announced share repurchase program | Approximate dollar value of shares that may yet be purchased under the Company's publicly announced share repurchase program 1 (In millions) |
| Period | Total number of shares purchased | Average price paid per share |
|
| October 2024 | — | | $ | — | | — | | $ | 931 | |
| November 2024 | — | | $ | — | | — | | $ | 931 | |
| December 2024 | — | | $ | — | | — | | $ | 931 | |
| Fourth quarter 2024 | — | | $ | — | | — | | $ | 931 | |
1.On April 13, 2022, the Board approved a share repurchase program authorizing up to $3.0 billion for the repurchase of the Company's common stock, with no expiration date.
| | |
| ITEM 7. MANAGEMENT'S DISCUSSION AND ANALYSIS OF FINANCIAL CONDITION AND RESULTS OF OPERATIONS |
STATEMENT ON CURRENCY EXCHANGE RATES
The Company's global business operations give rise to market risk exposure related to changes in foreign currency exchange rates and international capital flows that may be affected by extensive regulations and controls, especially in developing or highly inflationary countries such as Argentina. The Company continues to monitor these situations and take appropriate actions as necessary to manage the financial impact pursuant to established guidelines and policies. If the Company is unable to manage certain exposures in a cost-effective manner it could have a significant negative impact on its future results of operations and cash flows. A detailed discussion of these and other principal risks and uncertainties, which may negatively impact the future results of the Company, are included in Part I, Item 1A. Risk Factors.
ABOUT DOW
Dow is one of the world’s leading materials science companies, serving customers in high-growth markets such as packaging, infrastructure, mobility and consumer applications. The Company's global breadth, asset integration and scale, focused innovation, leading business positions and commitment to sustainability enables the Company to achieve profitable growth and help deliver a sustainable future. Dow operates manufacturing sites in 30 countries and employs approximately 36,000 people.
In 2024, the Company had net sales of $43 billion, of which 38 percent were to customers in the U.S. & Canada; 33 percent were in Europe, Middle East, Africa and India ("EMEAI"); while the remaining 29 percent were to customers in Asia Pacific and Latin America.
In 2024, the Company and its consolidated subsidiaries did not operate in countries subject to U.S. economic sanctions and export controls as imposed by the U.S. State Department or in countries designated by the U.S. State Department as state sponsors of terrorism, including Cuba, Iran, the Democratic People's Republic of Korea (North Korea) and Syria. The Company has policies and procedures in place designed to ensure that it and its consolidated subsidiaries remain in compliance with applicable U.S. laws and regulations.
OVERVIEW
The following is a summary of the results for the Company for the year ended December 31, 2024:
The Company reported net sales in 2024 of $43 billion, down 4 percent from $45 billion in 2023, with decreases across all geographic regions, and driven by a decrease in local price of 4 percent. Net sales decreased in Packaging & Specialty Plastics (down 6 percent) and Industrial Intermediates & Infrastructure (down 5 percent), partially offset by an increase in Performance Materials & Coatings (up 1 percent).
Local price decreased 4 percent compared with 2023, with decreases in all operating segments and geographic regions. Local price decreased in Packaging & Specialty Plastics (down 4 percent), Industrial Intermediates & Infrastructure (down 6 percent) and Performance Materials & Coatings (down 3 percent).
Volume was flat compared with 2023 and mixed by operating segment, with a decrease in Packaging & Specialty Plastics (down 2 percent) offset by increases in Industrial Intermediates & Infrastructure (up 1 percent) and Performance Materials & Coatings (up 5 percent). Volume increased in the U.S. & Canada (up 2 percent), decreased in Latin America (down 1 percent), and was flat in EMEAI and Asia Pacific.
The impact of currency on net sales was flat compared with 2023.
Restructuring and asset related charges - net were $103 million in 2024 compared with $528 million in 2023, primarily reflecting restructuring actions approved by the Board in January 2023. The restructuring charges recognized in 2024 consisted of severance and related benefit costs of $41 million, asset write-downs and write-offs of $16 million and costs associated with exit and disposal activities of $9 million. In addition, the Company recognized pretax impairment charges of $37 million related to assets included in the divestiture of the Company's flexible packaging laminating adhesives business.
Equity in losses of nonconsolidated affiliates was $6 million in 2024, compared with losses of $119 million in 2023, primarily driven by improved equity earnings at the Kuwait joint ventures driven from higher prices and volumes, improved results at the Sadara joint venture, partially offset by continued margin compression at the Thai joint ventures.
Sundry income (expense) - net for Dow Inc. and TDCC was income of $415 million and $404 million, respectively, in 2024, compared with expense of $280 million and $327 million, respectively, in 2023. Sundry income (expense) - net increased primarily due to lower foreign currency exchange losses and the absence of a one-time non-cash settlement charge related to the Company's pension de-risking activities in 2023.
Net income available for Dow Inc. and TDCC common stockholder(s) was $1,116 million and $1,127 million, respectively, in 2024, compared with $589 million and $556 million, respectively, in 2023. Earnings per share for Dow Inc. was $1.57 per share in 2024, compared with $0.82 per share in 2023.
In 2024, Dow Inc. declared and paid dividends to common stockholders of $2.80 per share ($1,966 million).
In 2024, Dow Inc. repurchased $494 million of the Company's common stock.
Other notable events and highlights from the year ended December 31, 2024 include:
•On January 25, 2024, the Company published its Green Finance Framework and related Second Party Opinion on its website, to support the execution of its sustainability strategy.
•On February 1, 2024, Andrea L. Dominowski became Controller and Vice President of Controllers.
•On February 9, 2024, TDCC issued $1.25 billion of senior unsecured notes in connection with the Company's Green Finance Framework.
•On April 2, 2024, the Company announced that Mauro Gregorio, President of Performance Materials & Coatings, elected to retire in the third quarter of 2024 after 40 years of service.
•On April 2, 2024, the Company announced that Brendy Lange, business vice president of Dow Industrial Solutions, was named President of Performance Materials & Coatings.
•On May 16, 2024, the Company announced it will expand its Protect the Climate targets by setting distinct milestones for climate change mitigation that focus on water and nature conservation. Additional information can be found on the Company's website.
•On June 18, 2024, Dow Inc. released its INtersections Report, highlighting how the Company is advancing its ambition to be the most innovative, customer-centric, inclusive and sustainable materials science company in the world. Additional information can be found on the Company's website.
•On July 1, 2024, Ronald C. Edmonds, former Controller and Vice President of Controllers and Tax, elected to retire after 31 years of service.
•On July 1, 2024, Fitch Ratings affirmed TDCC's BBB+ and F1 rating, and its outlook of stable. Additionally, on July 1, 2024, Standard & Poor's affirmed TDCC's BBB and A-2 rating, and its outlook of stable.
•On August 1, 2024, the Company acquired Circulus Holdings, LLC, a U.S. mechanical recycling company that converts plastic waste into post-consumer resin, for approximately $130 million.
•On August 6, 2024, Moody's Ratings affirmed TDCC's Baa1 and P-2 rating, and its outlook of stable.
•On October 24, 2024, the Company announced that it will complete a strategic review of select assets in Europe, primarily certain polyurethanes assets within the Industrial Intermediates & Infrastructure segment, as part of an effort to continue to optimize its global asset footprint.
•On October 28, 2024, Moody's Ratings re-affirmed TDCC's Baa1 and P-2 rating and revised its outlook to negative from stable.
•On December 2, 2024, the Company completed the sale of its flexible packaging laminating adhesives business, within the Packaging & Specialty Plastics segment, to Arkema S.A. for cash proceeds of $115 million, net of working capital adjustments, costs to sell and other transaction expenses and subject to customary post-closing adjustments.
•On December 3, 2024, the Company announced that Karen Carter, President of Packaging & Specialty Plastics, had been named Chief Operating Officer.
•On December 4, 2024, the Company announced that Keith Cleason had been named President of Packaging & Specialty Plastics.
•On December 4, 2024, the Company announced that Jane Palmieri, President of Industrial Intermediates & Infrastructure, had elected to retire in March 2025 after 30 years of service with Dow.
•On December 4, 2024, the Company announced that Marco ten Bruggencate had been named President of Industrial Intermediates & Infrastructure.
•On December 8, 2024, the Company entered into a definitive agreement to sell a 40 percent equity stake in select U.S. Gulf Coast infrastructure assets to a fund managed by Macquarie Asset Management in exchange for cash proceeds of approximately $2.4 billion. Under the terms of the agreement, Macquarie Asset Management has the option to purchase up to an additional 9 percent equity stake in exchange for additional cash proceeds of up to $600 million.
•On December 9, 2024, Standard & Poor's re-affirmed TDCC's BBB and A-2 rating, and its outlook of stable.
•Dow was named on the Top 100 Global Innovators™ list for the 13th consecutive year.
•Dow received a record-setting 12 2024 Edison Awards™ (three gold, five silver and four bronze), once again earning more awards than any other organization for the seventh consecutive year.
•Dow was named to the JUST 100 list, placing 35th overall, a 20-place improvement from last year, and securing the top spot for Customers in the Chemicals sector.
•Dow earned a spot in the S&P Global Sustainability Yearbook, recognizing the Company as a top industry performer.
•Dow received six 2024 BIG Innovation Awards from the Business Intelligence Group™, the most received in a single Business Intelligence Group™ Awards program by the Company.
•Dow was recognized with a 2024 CIO 100 Award, for the third consecutive year, for the Company's Integrated Data Hub.
•Dow advanced to third place on the 2024 Fair360, formerly DiversityInc, Top 50 Companies for Diversity list making it the seventh consecutive year on the list. Dow was also included on 12 of Fair360's Specialty Lists including: Top Companies for Executive Fairness Councils, Top Companies for Board of Directors, Top Companies for Environmental, Social & Governance, Top Companies for Philanthropy, Top Companies for Supplier Fairness, Top Companies for Employee Resource Groups, Top Companies for Mentoring, Top Companies for Sponsorship, Top Companies for People with Disabilities, Top Companies for Latino Executives, Top Companies for Asian American Executives and Top Companies for LGBTQ+ Employees.
•Dow received six prestigious 2024 SEAL (Sustainability, Environmental Achievement and Leadership) Business Sustainability Awards. Dow's DOWSIL™ ACP-3089 Antifoam Compound and Dow's SILASTIC™ STT 2650 Self Sealing Silicone each received a SEAL Sustainable Innovation Award. Dow's DOWSIL™ 2080, DOWSIL™ IE-9100, DOWSIL™ 991 and SILASTIC™ STT 2650 each received a SEAL Sustainable Product Award.
•For the eighth consecutive year, Dow received a top score on the Disability Equality Index®, placing the Company among the Best Places to Work for Disability Inclusion® for 2024.
•Dow was named one of the 2024 PEOPLE® Companies that Care by Great Place to Work® and PEOPLE® for the fifth consecutive year.
•Dow was honored by Great Place to Work® and Fortune as one of the World's Best Workplaces. Dow was also certified as a Great Place to Work® in 15 countries and ranked on eight national Best Workplaces lists, including the Fortune 100 Best Companies to Work For® list in the United States for the fourth consecutive year.
•Dow was named to the Dow Jones Sustainability World Index by S&P Dow Jones Indices, the world's leading index provider focused on providing essential sustainability intelligence. This is the 24th year Dow has achieved this prestigious ranking.
•Dow received the first place spot on the Best Workplace in Manufacturing and Production list by Great Place to Work® and Fortune. This is the fourth consecutive year Dow has been named to this prestigious list and the first time atop the ranking.
In addition to the highlights above, the following events occurred subsequent to December 31, 2024:
•On January 27, 2025, the Dow Inc. Board approved targeted actions to further achieve the Company's cost reduction initiatives in response to ongoing macroeconomic uncertainty, including a workforce reduction of approximately 1,500 roles.
RESULTS OF OPERATIONS
For comparison of results of operations for the fiscal years ended December 31, 2023 and 2022, see Part II, Item 7. Management’s Discussion and Analysis of Financial Condition and Results of Operations of the Company's Annual Report on Form 10-K for the fiscal year ended December 31, 2023, filed with the SEC on January 31, 2024.
Net Sales
The following tables summarize net sales and sales variances by operating segment and geographic region from the prior year:
| | | | | | | | | |
| Summary of Sales Results | | | |
| In millions | 2024 | 2023 | |
| Net sales | $ | 42,964 | | $ | 44,622 | | |
| | | | | | | | | | | | | | | | | | | | | | | | | | | | |
| Sales Variances by Operating Segment and Geographic Region |
| 2024 | 2023 |
| Percentage change from prior year | Local Price & Product Mix | Currency | Volume | | Total | Local Price & Product Mix | Currency | Volume | | Total |
| Packaging & Specialty Plastics | (4) | % | — | % | (2) | % | | (6) | % | (16) | % | — | % | (5) | % | | (21) | % |
| Industrial Intermediates & Infrastructure | (6) | | — | | 1 | | | (5) | | (14) | | (1) | | (9) | | | (24) | |
| Performance Materials & Coatings | (3) | | (1) | | 5 | | | 1 | | (15) | | (1) | | (5) | | | (21) | |
| Total | (4) | % | — | % | — | % | | (4) | % | (16) | % | — | % | (6) | % | | (22) | % |
| Total, excluding the Hydrocarbons & Energy business | (5) | % | — | % | 3 | % | | (2) | % | (15) | % | (1) | % | (4) | % | | (20) | % |
| U.S. & Canada | (3) | % | — | % | 2 | % | | (1) | % | (15) | % | — | % | (6) | % | | (21) | % |
| EMEAI | (4) | | — | | — | | | (4) | | (17) | | — | | (9) | | | (26) | |
| Asia Pacific | (6) | | (1) | | — | | | (7) | | (14) | | (2) | | (4) | | | (20) | |
| Latin America | (5) | | — | | (1) | | | (6) | | (17) | | — | | 4 | | | (13) | |
| Total | (4) | % | — | % | — | % | | (4) | % | (16) | % | — | % | (6) | % | | (22) | % |
2024 Versus 2023
The Company reported net sales of $43.0 billion in 2024, down 4 percent from $44.6 billion in 2023, with local price down 4 percent, and volume and currency both flat. Net sales decreased across all operating segments except Performance Materials & Coatings, and across all geographic regions. Local price decreased in all operating segments and across all geographic regions driven by industry supply and demand dynamics and lower global energy and feedstock costs. Local price decreased in Packaging & Specialty Plastics (down 4 percent), Industrial Intermediates & Infrastructure (down 6 percent) and Performance Materials & Coatings (down 3 percent). Volume increased 2 percent in the U.S. & Canada, decreased 1 percent in Latin America and was flat in EMEAI and Asia Pacific. Volume decreased in Packaging & Specialty Plastics (down 2 percent) and increased in Industrial Intermediates & Infrastructure (up 1 percent) and Performance Materials & Coatings (up 5 percent). Excluding the Hydrocarbons & Energy business, sales decreased 2 percent.
Cost of Sales
Cost of sales ("COS") was $38.4 billion in 2024, compared with $39.7 billion in 2023. COS decreased in 2024 primarily due to lower raw material costs, lower global energy and feedstock costs, and the impact of structural cost improvements, partially offset by increased planned maintenance turnaround spending. COS as a percentage of net sales was 89.3 percent in 2024, compared with 89.1 percent in 2023. The increase in COS as a percentage of net sales was driven by the impact of lower local price on flat net sales volume.
Research and Development Expenses
Research and development ("R&D") expenses were $810 million in 2024, compared with $829 million in 2023. R&D expenses decreased in 2024 primarily due to lower performance-based compensation costs.
Selling, General and Administrative Expenses
Selling, general and administrative ("SG&A") expenses were $1,581 million in 2024, compared with $1,627 million in 2023. SG&A expenses decreased in 2024 primarily due to lower performance-based compensation costs, as well as lower fringe benefit expenses resulting from the U.S. pension plan freeze, which more than offset an increase in bad debt expense, including expense incurred as a result of a resolution of a customer dispute.
Amortization of Intangibles
Amortization of intangibles was $310 million in 2024, compared with $324 million in 2023. Amortization of intangibles decreased primarily due to the reduction in the intangible asset base, resulting primarily from the write-off of an intangible asset, certain intangible asset write-offs related to the divestiture of the Company's flexible packaging laminating adhesives business and certain intangible assets becoming fully amortized in 2024. See Note 12 to the Consolidated Financial Statements for additional information on intangible assets.
Restructuring and Asset Related Charges - Net
2023 Restructuring Program
On January 25, 2023, the Board approved restructuring actions to achieve the Company's structural cost improvement initiatives in response to the continued economic impact from the global recessionary environment and to enhance its agility and long-term competitiveness across the economic cycle. These actions are expected to be substantially complete by the end of the first quarter of 2025.
As a result of these actions, in 2023 the Company recorded pretax restructuring charges of $535 million, consisting of severance and related benefit costs of $344 million and asset write-downs and write-offs of $191 million. The restructuring charges by segment were as follows: $1 million in Packaging & Specialty Plastics, $50 million in Industrial Intermediates & Infrastructure, $49 million in Performance Materials & Coatings and $435 million in Corporate. These charges were partially offset by other asset related credit adjustments of $7 million in Corporate related to a prior restructuring program. See Note 5 to the Consolidated Financial Statements for additional information.
In 2024, the Company recorded pretax restructuring charges of $66 million, consisting of severance and related benefit costs of $41 million, asset write-downs and write-offs of $16 million and costs associated with exit and disposal activities of $9 million. The restructuring charges by segment were as follows: $8 million in Industrial Intermediates & Infrastructure, $7 million in Performance Materials & Coatings and $51 million in Corporate. In addition, the Company recognized pretax impairment charges of $37 million related to assets included in the divestiture of the Company's flexible packaging laminating adhesives business and related to Packaging & Specialty Plastics. See Note 5 to the Consolidated Financial Statements for additional information.
Equity in Earnings (Losses) of Nonconsolidated Affiliates
The Company’s share of equity in losses of nonconsolidated affiliates was $6 million in 2024, compared with losses of $119 million in 2023, driven primarily by improved equity earnings at the Kuwait joint ventures from higher prices and volumes and improved results at the Sadara joint venture, partially offset by margin compression from softer demand at the Thai joint ventures.
Sundry Income (Expense) - Net
Sundry income (expense) – net includes a variety of income and expense items such as foreign currency exchange gains and losses, dividends from investments, gains and losses on sales of investments and assets, non-operating pension and other postretirement benefit plan credits or costs, losses on early extinguishment of debt and certain litigation matters.
Sundry income (expense) - net for 2024 was income of $415 million and $404 million for Dow Inc. and TDCC, respectively, compared with expense of $280 million and $327 million for Dow Inc. and TDCC, respectively, in 2023. In 2024, sundry income (expense) - net included non-operating pension and postretirement benefit plan credits and gains on the sales of assets and investments, which were partially offset by foreign currency exchange losses. In 2023, sundry income (expense) - net included a $642 million non-cash settlement charge related to the purchase of nonparticipating group annuity contracts for certain pension plans (related to Corporate) and foreign currency exchange losses, including $109 million related to the December 2023 devaluation of the Argentine peso (related to Corporate), which were partially offset by non-operating pension and postretirement benefit plan credits, a $106 million gain associated with a legal matter with Nova Chemicals Corporation (related to Packaging & Specialty Plastics), and gains on the sales of assets and investments. See Notes 6, 15, 19 and 25, to the Consolidated Financial Statements for additional information.
In 2024 and 2023, in addition to the amounts previously discussed above for TDCC, sundry income (expense) - net for Dow Inc. included net gains of $13 million and $42 million, respectively, associated with agreements and matters with DuPont de Nemours, Inc. ("DuPont") and Corteva, Inc. ("Corteva") (related to Corporate).
Interest Expense and Amortization of Debt Discount
Interest expense and amortization of debt discount was $811 million in 2024, compared with $746 million in 2023. The increase in interest expense is primarily due to $1.25 billion of senior unsecured notes issued in connection with the Green Finance Framework in the first quarter of 2024 and borrowings outside of the United States. See Liquidity and Capital Resources in Management's Discussion and Analysis of Financial Condition and Results of Operations and Note 14 to the Consolidated Financial Statements for additional information related to debt financing activity.
Provision (Credit) for Income Taxes
The Company's effective tax rate fluctuates based on, among other factors, where income is earned, the level of income relative to tax attributes and the level of equity earnings, since most earnings from the Company's equity method investments are taxed at the joint venture level. The underlying factors affecting the Company's overall tax rate are summarized in Note 7 to the Consolidated Financial Statements.
The Company reported a tax provision of $399 million in 2024, resulting in an effective tax rate of 24.9 percent, compared with a tax credit of $4 million in 2023, resulting in an effective tax rate of negative 0.6 percent. The provision for income taxes and higher effective tax rate for 2024 was primarily due to the geographic mix of earnings, partially offset by adjustments and the reassessment of interest and penalties on a tax matter in foreign jurisdictions.
The credit for income taxes and lower effective tax rate in 2023 were primarily due to low pretax income, the geographic mix of earnings and increases in tax basis in assets located in foreign jurisdictions, partially offset by changes in uncertain tax positions in various jurisdictions.
The Company continues to monitor and evaluate legislative developments related to the Global Anti-Base Erosion Proposal ("GloBE") established by the Organization of Economic Cooperation and Development’s ("OECD") Pillar Two framework. Several countries in which the Company operates have adopted those rules into their legislation and several others are expected to implement in the future. To date, such legislation has not materially impacted the Company's effective tax rate. The Company continues to evaluate impacts as further guidance is released.
Net Income Attributable to Noncontrolling Interests
Net income attributable to noncontrolling interests was $85 million in 2024, compared with $71 million in 2023. See Notes 18 and 23 to the Consolidated Financial Statements for additional information.
Net Income Available for Common Stockholder(s)
Dow Inc.
Net income available for Dow Inc. common stockholders was $1,116 million in 2024, compared with $589 million in 2023. Earnings per share of Dow Inc. was $1.57 per share in 2024, compared with $0.82 per share in 2023. See Note 8 to the Consolidated Financial Statements for details on Dow Inc.'s earnings per share calculations.
TDCC
Net income available for the TDCC common stockholder was $1,127 million in 2024, compared with $556 million in 2023. TDCC's common shares are owned solely by Dow Inc.
SEGMENT RESULTS
The Company conducts its worldwide operations through six global businesses which are organized into the following operating segments: Packaging & Specialty Plastics, Industrial Intermediates & Infrastructure and Performance Materials & Coatings. Corporate contains the reconciliation between the totals for the operating segments and the Company's totals. The Company did not aggregate any operating segments when determining its reportable segments. The Company reports geographic information for the following regions: U.S. & Canada, EMEAI, Asia Pacific and Latin America. The Company transfers ethylene to its downstream derivative businesses at market prices. See Part I, Item 1. Business for further discussion of the Company's segments.
Dow’s measure of profit/loss for segment reporting purposes is Operating EBIT as this is the manner in which the chief executive officer, chief operating officer, chief financial officer, general counsel and corporate secretary, and senior vice president of corporate development, together the "executive committee" and chief operating decision maker ("CODM"), assesses performance and allocates resources. The CODM compares quarterly results to both the year-ago and sequential periods to assess performance and allocate resources to each segment. The Company defines Operating EBIT as earnings (i.e., "Income before income taxes") before interest, excluding the impact of significant items. Operating EBIT by segment includes all operating items relating to the businesses; items that principally apply to Dow as a whole are assigned to Corporate. See Note 25 to the Consolidated Financial Statements for reconciliations of these measures.
For comparison of segment results for the fiscal years ended December 31, 2023 and 2022, see Part II, Item 7. Management’s Discussion and Analysis of Financial Condition and Results of Operations of the Company's Annual Report on Form 10-K for the fiscal year ended December 31, 2023, filed with the SEC on January 31, 2024.
PACKAGING & SPECIALTY PLASTICS
| | | | | | | | | |
| Packaging & Specialty Plastics | | | |
| In millions | 2024 | 2023 | |
| Net sales | $ | 21,776 | | $ | 23,149 | | |
| Operating EBIT | $ | 2,373 | | $ | 2,700 | | |
| Equity earnings | $ | 81 | | $ | 130 | | |
| | | | | | | | | |
| Packaging & Specialty Plastics | | | |
| Percentage change from prior year | 2024 | 2023 | |
| Change in Net Sales from Prior Period due to: | | | |
| Local price & product mix | (4) | % | (16) | % | |
| Currency | — | | — | | |
| Volume | (2) | | (5) | | |
| | | |
| Total | (6) | % | (21) | % | |
2024 Versus 2023
Packaging & Specialty Plastics net sales were $21,776 million in 2024, down 6 percent from net sales of $23,149 million in 2023, with local price down 4 percent, volume down 2 percent and currency flat. Local price decreased in Packaging and Specialty Plastics in all geographic regions, primarily driven by lower pricing of downstream polymers. Local price was flat in Hydrocarbons & Energy. Volume increased in Packaging and Specialty Plastics, primarily in EMEAI and the U.S. & Canada, due to higher downstream polymers and polyethylene demand. Volume decreased in Hydrocarbons & Energy in all geographic regions, led by EMEAI, primarily driven by higher internal derivative demand and lighter feedslate cracking.
Operating EBIT was $2,373 million in 2024, down $327 million from Operating EBIT of $2,700 million in 2023. Operating EBIT decreased primarily due to lower selling prices, lower volumes in Hydrocarbons & Energy, higher planned maintenance costs, and the impact of an unplanned ethylene facility outage, which were partially offset by lower raw material, energy and feedstock costs.
INDUSTRIAL INTERMEDIATES & INFRASTRUCTURE
| | | | | | | | | |
| Industrial Intermediates & Infrastructure | | | |
| In millions | 2024 | 2023 | |
| Net sales | $ | 11,869 | | $ | 12,538 | | |
| Operating EBIT | $ | 125 | | $ | 124 | | |
| Equity losses | $ | (102) | | $ | (276) | | |
| | | | | | | | | |
| Industrial Intermediates & Infrastructure | | | |
| Percentage change from prior year | 2024 | 2023 | |
| Change in Net Sales from Prior Period due to: | | | |
| Local price & product mix | (6) | % | (14) | % | |
| Currency | — | | (1) | | |
| Volume | 1 | | (9) | | |
| | | |
| Total | (5) | % | (24) | % | |
2024 Versus 2023
Industrial Intermediates & Infrastructure net sales were $11,869 million in 2024, down 5 percent from $12,538 million in 2023, with local price down 6 percent, volume up 1 percent and currency flat. Local price
decreased in both businesses and across all geographic regions, led by industrial and building and construction applications. Volume in Industrial Solutions increased, led by industrial and coatings applications, and in all geographic regions except the U.S. & Canada, which was flat, reflecting the impacts of an outage in 2023 at the Louisiana Operations Glycol-2 unit in Plaquemine, Louisiana, which successfully restarted in June 2024. Volume in Polyurethanes & Construction Chemicals decreased in all geographic regions, except EMEAI, driven by lower demand, particularly in consumer durables and industrial applications, which were partially offset by an increase in building and construction applications.
Operating EBIT was $125 million in 2024, up $1 million from Operating EBIT of $124 million in 2023. Operating EBIT increased primarily due to lower raw material and feedstock costs and improved results at the EQUATE and Sadara joint ventures, which were offset by lower selling prices in both businesses and the impact of an outage in 2023 at the Louisiana Operations Glycol-2 unit in Plaquemine, Louisiana, which successfully restarted in June 2024.
PERFORMANCE MATERIALS & COATINGS
| | | | | | | | | |
| Performance Materials & Coatings | | | |
| In millions | 2024 | 2023 | |
| Net sales | $ | 8,574 | | $ | 8,497 | | |
| Operating EBIT | $ | 318 | | $ | 219 | | |
| Equity earnings | $ | 11 | | $ | 20 | | |
| | | | | | | | | |
| Performance Materials & Coatings | | | |
| Percentage change from prior year | 2024 | 2023 | |
| Change in Net Sales from Prior Period due to: | | | |
| Local price & product mix | (3) | % | (15) | % | |
| Currency | (1) | | (1) | | |
| Volume | 5 | | (5) | | |
| | | |
| Total | 1 | % | (21) | % | |
2024 Versus 2023
Performance Materials & Coatings net sales were $8,574 million in 2024, up 1 percent from net sales of $8,497 million in 2023, with volume up 5 percent, local price down 3 percent and an unfavorable currency impact of 1 percent. Volume increased in both businesses. In Coatings & Performance Monomers, volume increased in all geographic regions except EMEAI, led by acrylic monomers. Volume increased in Consumer Solutions in all geographic regions, primarily in downstream silicones, led by consumer and electronics and home and personal care applications. Local price decreased in both businesses and was broad-based. In Coatings & Performance Monomers, local price decreased in all geographic regions except Asia Pacific, and in Consumer Solutions local price decreased in all geographic regions. Currency was flat in Coatings & Performance Monomers and had an unfavorable impact on sales in Consumer Solutions, driven by Asia Pacific.
Operating EBIT was $318 million in 2024, up $99 million from Operating EBIT of $219 million in 2023. Operating EBIT increased primarily due to improved demand and higher operating rates, which were partially offset by lower selling prices and higher raw material costs.
CORPORATE
| | | | | | | | | |
| Corporate | | | |
| In millions | 2024 | 2023 | |
| Net sales | $ | 745 | | $ | 438 | | |
| Operating EBIT | $ | (228) | | $ | (265) | | |
| Equity earnings | $ | 4 | | $ | 7 | | |
2024 Versus 2023
Net sales for Corporate, which primarily relate to the Company's insurance operations, were $745 million in 2024, up from net sales of $438 million in 2023, largely driven by premiums received for insurance policies covering third parties.
Operating EBIT was a loss of $228 million in 2024, compared with a loss of $265 million in 2023. Operating EBIT improved primarily due to lower environmental costs and increased income from insurance operations.
OUTLOOK
Operating Segments & End-Market Expectations
The Company remains confident that it will benefit from the completion of its near-term incremental growth projects and an enhanced focus on operational discipline in 2025. In addition, the Company is optimistic that it will see further demand growth in attractive end-markets such as packaging, energy and electronics. Dow's differentiated portfolio and strong balance sheet enables it to deliver on all of its capital allocation priorities, including an industry-leading dividend. Until there are more definitive indications of a true recovery taking hold, and in order to deliver improved margins, the Company is taking actions to reduce its costs by approximately $1 billion and capital expenditures plan by $300 million to $500 million. Dow will complete these actions while staying the course on its long-term strategic priorities. The Company's proactive interventions are necessary for it to continue to successfully navigate this economic downcycle.
In Packaging & Specialty Plastics, supply improvements driven by new polyethylene capacity coming online during 2025, combined with improved reliability, will allow the Company to continue to drive volume growth and improve margins. Local prices are expected to be impacted by market supply and demand dynamics as well as volatility in feedstocks due to sensitivity to external economic and geopolitical factors. The Company’s feedstock flexibility and advantaged regional footprint will continue to position the segment well to navigate market dynamics throughout the year. In-region presence and superior derivative flexibility will allow the segment to continue to optimize price and volume mix.
In Industrial Intermediates & Infrastructure, improved demand is expected based on improving fiscal conditions resulting from interest rate cuts across several regions. The Company will benefit from the full-year impact of resumed production at the Louisiana Operations Glycol-2 unit in Plaquemine, Louisiana, which successfully restarted in June 2024. Recent and in-flight growth investments in specialty amines and alkoxylation capacity are expected to support long-term, above GDP volume growth in key markets including energy transition, pharmaceuticals and consumer health, and sustainable surfactants.
In Performance Materials & Coatings, the Company will continue to prioritize key end-markets in performance silicones in which its innovation and footprint can drive value and volume growth above GDP. Pricing for specialty products is expected to remain relatively stable, with anticipated modest but steady economic expansion. Volume growth is expected in feedstocks and intermediates on improved regional supply and demand dynamics, and while competitive pressures in the market impacting local price persist, lower interest rates are expected to drive improved demand and local price. Market conditions impacting sales of coatings are expected to improve compared with recent years based on lower interest rates and an increase in residential spending.
Projected Sources and Uses of Cash
Items that may impact the consolidated statements of cash flows in 2025 include:
•Capital expenditures are expected to be approximately $3 billion to $3.2 billion.
•Cash inflows related to the Company's sale of a 40 percent ownership stake in its Dow InfraCo, LLC subsidiary are expected to be approximately $2.4 billion.
•Cash dividends from equity companies are expected to be approximately $300 million.
•Cash contributions to pension plans are expected to be approximately $175 million.
•Cash outflows related to the Company's 2023 Restructuring Program, including restructuring implementation costs, are expected to be approximately $100 million.
•Cash outflows related to the Company's targeted actions to further achieve its cost reduction initiatives, including implementation costs, are expected to be $100 million to $150 million.
LIQUIDITY AND CAPITAL RESOURCES
The Company had cash and cash equivalents of $2,189 million at December 31, 2024 and $2,987 million at December 31, 2023, of which $1,427 million at December 31, 2024 and $1,984 million at December 31, 2023, was held by subsidiaries in foreign countries, including U.S. territories. For each of its foreign subsidiaries, the Company makes an assertion regarding the amount of earnings intended for permanent reinvestment, with the balance available to be repatriated to the United States.
Cash held by foreign subsidiaries for permanent reinvestment is generally used to finance the subsidiaries' operational activities and future foreign investments. Dow has the ability to repatriate additional funds to the United States, which could result in an adjustment to the tax liability for foreign withholding taxes, foreign and/or U.S. state income taxes and the impact of foreign currency movements. At December 31, 2024, management believed that sufficient liquidity was available in the United States. The Company has and expects to continue repatriating certain funds from its non-U.S. subsidiaries that are not needed to finance local operations; however, these particular repatriation activities have not and are not expected to result in a significant incremental tax liability to the Company.
For comparison of cash flows for the fiscal years ended December 31, 2023 and 2022, see Part II, Item 7. Management’s Discussion and Analysis of Financial Condition and Results of Operations of the Company's Annual Report on Form 10-K for the fiscal year ended December 31, 2023, filed with the SEC on January 31, 2024.
The Company’s cash flows from operating, investing and financing activities, as reflected in the consolidated statements of cash flows, are summarized in the following table:
| | | | | | | | | | | | | | | | |
| Cash Flow Summary | Dow Inc. | TDCC | |
| In millions | 2024 | 2023 | | 2024 | 2023 | |
| Cash provided by (used for): | | | | | | |
| Operating activities - continuing operations | $ | 2,903 | | $ | 5,164 | | | $ | 2,939 | | $ | 5,109 | | |
| Operating activities - discontinued operations | 11 | | 32 | | | — | | — | | |
| Operating activities | $ | 2,914 | | $ | 5,196 | | | $ | 2,939 | | $ | 5,109 | | |
| Investing activities | $ | (2,368) | | $ | (2,928) | | | $ | (2,368) | | $ | (2,928) | | |
| Financing activities | $ | (1,168) | | $ | (3,115) | | | $ | (1,193) | | $ | (3,028) | | |
| | | | | | |
| | | | | | |
| | | | | | |
| | | | | | |
| | | | | | |
| | | | | | |
| | | | | | |
Cash Flows from Operating Activities
Cash provided by operating activities from continuing operations in 2024 was primarily driven by the Company's cash earnings and dividends from equity method investments, which were partially offset by cash used for working capital, performance-based compensation payments, pension contributions and severance payments related to the 2023 Restructuring Program. Cash provided by operating activities from continuing operations in 2023 was primarily driven by the Company's cash earnings, dividends from equity method investments and cash provided by working capital, which were partially offset by performance-based compensation payments, severance payments related to the 2023 Restructuring Program and pension contributions.
| | | | | | | | | | | | | | |
| Net Working Capital and Current Ratio at Dec 31 | Dow Inc. | TDCC |
| In millions | 2024 | 2023 | 2024 | 2023 |
| Current assets | $ | 16,590 | | $ | 17,614 | | $ | 16,565 | | $ | 17,676 | |
| Current liabilities | 10,288 | | 9,957 | | 10,210 | | 9,849 | |
| Net working capital | $ | 6,302 | | $ | 7,657 | | $ | 6,355 | | $ | 7,827 | |
| Current ratio | 1.61:1 | 1.77:1 | 1.62:1 | 1.79:1 |
| | | | | | | | | | | | |
| Working Capital Metrics | | Twelve Months Ended |
| | | | | Dec 31, 2024 | Dec 31, 2023 |
| Days sales outstanding in trade receivables | | | | | 40 | | 42 | |
| Days sales in inventory | | | | | 60 | | 60 | |
| Days payables outstanding | | | | | 60 | | 64 | |
Cash provided by operating activities from discontinued operations reflected cash payments and receipts for certain agreements and matters related to the Company's separation from DowDuPont Inc.
Cash Flows from Investing Activities
Cash used for investing activities in 2024 and 2023 was primarily for capital expenditures and purchases of investments, which were partially offset by proceeds from sales and maturities of investments. In addition, 2024 included a cash inflow for the sale of the flexible packaging laminating adhesives business and a cash outflow for the acquisition of Circulus Holdings, LLC, a U.S. mechanical recycling company.
The Company's capital expenditures were $2,940 million in 2024 and $2,356 million in 2023. Capital spending was higher in 2024 as the Company continued the ramp up of investments in its higher return, lower risk and quicker payback incremental growth projects, and also included ramp up of the construction of the Fort Saskatchewan Path2Zero project aligned to the Company's Decarbonize & Grow strategy. The Company expects capital spending in 2025 to be approximately $3 billion to $3.2 billion, which includes construction of the Fort Saskatchewan Path2Zero project. The Company expects capital spending for this key growth project to average approximately $1 billion annually through 2029. Enterprise-wide capital spending is expected to exceed depreciation and amortization through 2027, during the first phase of the project, and average depreciation and amortization over the economic cycle. As evidenced across prior economic cycles, the Company will adjust its spending as economic conditions evolve.
Capital spending in recent years has included the addition of an integrated methylene diphenyl diisocyanate distillation and prepolymers facility in Freeport, Texas, which was completed in 2023; construction of a world-scale polyethylene unit on the U.S. Gulf Coast, which is expected to be completed in 2025; and construction of the world's first net-zero Scope 1 and 2 carbon dioxide equivalent ("CO2e") emissions integrated ethylene and derivatives complex in Alberta, Canada.
Cash Flows from Financing Activities
Cash used for financing activities in 2024 for Dow Inc. was primarily related to dividends paid to stockholders, purchases of treasury stock and payments on long-term debt, which were partially offset by proceeds from the issuance of long-term debt. TDCC included cash outflows for dividends paid to Dow Inc. Cash used for financing activities in 2023 was primarily for debt related activities. In addition, Dow Inc. included cash outflows for dividends paid to stockholders and purchases of treasury stock. TDCC included cash outflows for dividends paid to Dow Inc. See Notes 14 and 17 to the Consolidated Financial Statements for additional information related to the issuance and retirement of debt and the Company's share repurchases and dividends.
Non-GAAP Cash Flow Measures
Free Cash Flow
Dow defines Free Cash Flow as "Cash provided by operating activities - continuing operations," less capital expenditures. Under this definition, Free Cash Flow represents the cash generated by Dow from operations after investing in its asset base. Free Cash Flow, combined with cash balances and other sources of liquidity, represents the cash available to fund obligations and provide returns to shareholders. Free Cash Flow is an integral financial measure used in the Company's financial planning process.
Operating EBITDA
Dow defines Operating EBITDA as earnings (i.e., "Income before income taxes") before interest, depreciation and amortization, excluding the impact of significant items.
Cash Flow Conversion (Cash Flow From Operations to Operating EBITDA)
Dow defines Cash Flow Conversion (Cash flow from operations to Operating EBITDA) as "Cash provided by operating activities - continuing operations," divided by Operating EBITDA. Management believes Cash Flow Conversion is an important financial metric as it helps the Company determine how efficiently it is converting its earnings into cash flow.
These financial measures are not recognized in accordance with accounting principles generally accepted in the United States of America ("GAAP") and should not be viewed as alternatives to GAAP financial measures of performance. All companies do not calculate non-GAAP financial measures in the same manner and, accordingly, Dow's definitions may not be consistent with the methodologies used by other companies.
| | | | | | | | | |
| Reconciliation of Non-GAAP Cash Flow Measures | Dow Inc. | |
| In millions | 2024 | 2023 | |
| Cash provided by operating activities - continuing operations (GAAP) | $ | 2,903 | | $ | 5,164 | | |
| Capital expenditures | (2,940) | | (2,356) | | |
| Free Cash Flow (non-GAAP) | $ | (37) | | $ | 2,808 | | |
| | | | | | | | | |
| Reconciliation of Cash Flow Conversion (Cash Flow From Operations to Operating EBITDA) | Dow Inc. | |
| In millions | 2024 | 2023 | |
| Net income (GAAP) | $ | 1,201 | $ | 660 | |
| + Provision (credit) for income taxes | 399 | (4) | |
| Income before income taxes | $ | 1,600 | $ | 656 | |
| - Interest income | 200 | 229 | |
| + Interest expense and amortization of debt discount | 811 | 746 | |
- Significant items 1 | (377) | (1,605) | |
| Operating EBIT (non-GAAP) | $ | 2,588 | $ | 2,778 | |
| + Depreciation and amortization | 2,894 | 2,611 | |
| Operating EBITDA (non-GAAP) | $ | 5,482 | $ | 5,389 | |
| Cash provided by operating activities - continuing operations (GAAP) | $ | 2,903 | $ | 5,164 | |
| Cash flow from operations to net income (GAAP) | 241.7 | % | 782.4 | % | |
| Cash Flow Conversion (Cash flow from operations to Operating EBITDA) (non-GAAP) | 53.0 | % | 95.8 | % | |
1.The year ended December 31, 2024, includes restructuring charges and implementation and efficiency costs associated with the Company's 2023 Restructuring Program, gains associated with a previously impaired equity investment, impairment charges related to the write-down of certain manufacturing assets, a charge related to an arbitration settlement agreement for historical product claims from a divested business and activity related to the separation from DowDuPont. The year ended December 31, 2023, includes restructuring charges and implementation and efficiency costs associated with the Company's 2023 Restructuring Program, certain gains and losses associated with previously impaired equity investments, a loss associated with legacy agricultural products groundwater contamination matters, a gain associated with a legal matter with Nova Chemicals Corporation, foreign currency losses and inventory valuation impacts related to the devaluation of the Argentine peso, non-cash settlement charges related to the purchase of nonparticipating group annuity contracts for certain Company pension plans in the United States and Canada and activity related to the separation from DowDuPont. See Note 25 to the Consolidated Financial Statements for additional information.
Liquidity & Financial Flexibility
The Company’s primary source of incremental liquidity is cash flows from operating activities. The generation of cash from operations and the Company's ability to access capital markets is expected to meet the Company’s cash requirements for working capital, capital expenditures, debt maturities, contributions to pension plans, dividend distributions to stockholders, share repurchases and other needs. In addition to cash from operating activities, the Company’s current liquidity sources also include TDCC's U.S. and Euromarket commercial paper programs, committed and uncommitted credit facilities, committed and uncommitted accounts receivable facilities, a medium-term notes program, a U.S. retail note program (“InterNotes®”) and other debt markets.
The Company continues to maintain a strong financial position with all of its committed credit facilities undrawn and fully available at December 31, 2024. Cash and committed and available forms of liquidity were $12.0 billion at December 31, 2024, a decrease of $800 million from December 31, 2023. The Company also has no substantive long-term debt maturities due until 2027. Additional details on sources of liquidity are as follows:
Commercial Paper
TDCC issues promissory notes under its U.S. and Euromarket commercial paper programs. TDCC had no commercial paper outstanding at December 31, 2024 and 2023. TDCC maintains access to the commercial paper market at competitive rates. Amounts outstanding under TDCC's commercial paper programs during the period may be greater or less than the amount reported at the end of the period. Subsequent to December 31, 2024, TDCC issued commercial paper and had approximately $2.1 billion of commercial paper outstanding at February 4, 2025.
Committed Credit Facilities
The Company also has the ability to access liquidity through TDCC's committed and available credit facilities. At December 31, 2024, TDCC had total committed and available credit facilities of $8.4 billion. See Note 14 to the Consolidated Financial Statements for additional information on committed and available credit facilities.
Uncommitted Credit Facilities
The Company has entered into various uncommitted bilateral credit arrangements as a potential source of excess liquidity. These lines can be used to support short-term liquidity needs and for general purposes. The Company had no drawdowns outstanding at December 31, 2024.
Accounts Receivable Securitization Facilities
In addition to the above credit facilities, the Company maintains a committed accounts receivable facility in the United States where eligible trade accounts receivable, up to $900 million, may be sold at any point in time. The Company also maintains a committed accounts receivable facility in Europe where eligible trade accounts receivable, up to €500 million, may be sold at any point in time. In 2024, there were $290 million in sales of receivables under the U.S. and Europe committed accounts receivable facilities ($39 million in sales of receivables in 2023). At December 31, 2024, no material balances of sold receivables remained outstanding ($5 million remained outstanding at December 31, 2023).
In addition, the Company has an uncommitted accounts receivable facility in the United States providing additional liquidity. In 2024, sales of receivables under this facility were $378 million ($73 million in sales of receivables in 2023). At December 31, 2024, no material balances of sold receivables remained outstanding ($73 million remained outstanding at December 31, 2023). See Note 13 to the Consolidated Financial Statements for additional information.
Early Settlement of Letters of Credit
The Company utilizes, from time-to-time, letters of credit discounting programs to manage and expedite the settlement of letters of credit in certain regions. These letters of credit are associated with accounts receivable and the Company retains no interest in the transferred letters of credit or receivables once sold.
Accounts Receivable Discounting Facilities
The Company has access to accounts receivable discounting facilities, under which receivables are transferred with limited recourse. The Company retains no interest in the transferred receivables once sold. In 2024, sales of receivables under these facilities were $865 million ($91 million in sales of receivables in 2023). At December 31, 2024, approximately $287 million of sold receivables were outstanding ($91 million remained outstanding at December 31, 2023). See Note 13 to the Consolidated Financial Statements for additional information.
The Company maintains these facilities and also participates in certain customers’ supply chain financing and other early pay programs as a routine source of working capital.
Letters of Credit
TDCC utilizes letters of credit to support commitments made in the ordinary course of business. While the terms and amounts of letters of credit change, TDCC generally has approximately $600 million of outstanding letters of credit at any given time.
Company-Owned Life Insurance
The Company has investments in company-owned life insurance ("COLI") policies, which are recorded at their cash surrender value as of each balance sheet date. The Company has the ability to monetize its investment in its COLI policies as an additional source of liquidity. The Company had no outstanding monetization of its existing COLI policies' surrender value at December 31, 2024 ($97 million at December 31, 2023). See Note 6 to the Consolidated Financial Statements for additional information.
Shelf Registration - United States
On June 13, 2022, Dow Inc. and TDCC filed a shelf registration statement with the U.S. Securities and Exchange Commission. The shelf indicates that Dow Inc. may offer common stock; preferred stock; depositary shares; debt securities; guarantees; warrants to purchase common stock, preferred stock and debt securities; and stock purchase contracts and stock purchase units, with pricing and availability of any such offerings depending on market conditions. The shelf also indicates that TDCC may offer debt securities, guarantees and warrants to purchase debt securities, with pricing and availability of any such offerings depending on market conditions.
In 2022, TDCC filed a prospectus supplement under this shelf registration to register an undetermined amount of securities for issuance under InterNotes®. Also, in 2022, TDCC filed a prospectus supplement under this shelf registration to register an undetermined amount of securities for issuance under a medium-term notes program. In 2024, TDCC filed a prospectus supplement under this shelf registration to register $1.25 billion of securities for issuance in connection with its Green Finance Framework. The shelf registration expires on June 13, 2025. The Company expects to renew the shelf registration.
Debt
As the Company continues to maintain its strong balance sheet and financial flexibility, management is focused on net debt (a non-GAAP financial measure), as the Company believes this is the best representation of its financial leverage at this point in time. As shown in the following table, net debt is equal to total gross debt minus "Cash and cash equivalents" and "Marketable securities."
| | | | | | | | | | | | | | |
| Total Debt at Dec 31 | Dow Inc. | TDCC |
| In millions | 2024 | 2023 | 2024 | 2023 |
| Notes payable | $ | 135 | $ | 62 | $ | 135 | $ | 62 |
| Long-term debt due within one year | 497 | 117 | 497 | 117 |
| Long-term debt | 15,711 | 14,907 | 15,711 | 14,907 |
| Gross debt | $ | 16,343 | $ | 15,086 | $ | 16,343 | $ | 15,086 |
| - Cash and cash equivalents | 2,189 | 2,987 | 2,189 | 2,987 |
- Marketable securities 1 | 383 | 1,300 | 383 | 1,300 |
| Net debt (non-GAAP) | $ | 13,771 | $ | 10,799 | $ | 13,771 | $ | 10,799 |
| Total equity | $ | 17,851 | $ | 19,108 | $ | 18,032 | $ | 19,406 |
| Gross debt as a percentage of total capitalization | 47.8 | % | 44.1 | % | 47.5 | % | 43.7 | % |
| Net debt as a percentage of total capitalization (non-GAAP) | 43.5 | % | 36.1 | % | 43.3 | % | 35.8 | % |
1.Included in "Other current assets" in the consolidated balance sheets.
In the first quarter of 2024, the Company issued $1.25 billion of senior unsecured notes. This offering included $600 million aggregate principal amount of 5.150 percent notes due 2034 and $650 million aggregate principal amount of 5.600 percent notes due 2054. The issuance was completed in connection with the Company's Green Finance Framework. The Company distributed the proceeds toward projects that support the execution of its sustainability strategy and achieve its targets focused on climate protection and a circular economy, including applicable expenditures and investments related to the Company's Fort Saskatchewan Path2Zero project.
In the second quarter of 2024, the Company redeemed $10 million aggregate principal amount of 2.100 percent notes due November 2030, $30 million aggregate principal amount of 4.250 percent notes due October 2034, $8 million aggregate principal amount of 5.250 percent notes due November 2041 and $12 million aggregate principal amount of 4.375 percent notes due November 2042. As a result of the redemption, the Company recognized a pretax gain on the early extinguishment of debt of $5 million, included in "Sundry income (expense) - net" in the consolidated statements of income and related to Corporate.
In 2024, the Company issued an aggregate principal amount of $94 million of InterNotes®. The Company also issued $122 million of foreign currency loans. Additionally, the Company repaid $83 million of long-term debt at maturity.
The Company may at any time repurchase certain debt securities in the open market or in privately negotiated transactions subject to: the applicable terms under which any such debt securities were issued, certain internal approvals of the Company, and applicable laws and regulations of the relevant jurisdiction in which any such potential transactions might take place. This in no way obligates the Company to make any such repurchases nor should it be considered an offer to do so.
TDCC’s public debt instruments and primary, private credit agreements contain, among other provisions, certain customary restrictive covenant and default provisions. TDCC’s most significant debt covenant with regard to its financial position is the obligation to maintain the ratio of its consolidated indebtedness to consolidated capitalization at no greater than 0.70 to 1.00 at any time the aggregate outstanding amount of loans under the Five Year Competitive Advance and Revolving Credit Facility Agreement ("Revolving Credit Agreement") equals or exceeds
$500 million. The ratio of TDCC’s consolidated indebtedness as defined in the Revolving Credit Agreement was 0.45 to 1.00 at December 31, 2024. Management believes TDCC was in compliance with all of its covenants and default provisions at December 31, 2024. For information on TDCC's debt covenants and default provisions, see Note 14. There were no material changes to the debt covenants and default provisions related to TDCC’s outstanding long-term debt and primary, private credit agreements in 2024.
Dow Inc. is obligated, substantially concurrently with the issuance of any guarantee in respect of outstanding or committed indebtedness under the Revolving Credit Agreement, to enter into a supplemental indenture with TDCC and the trustee under TDCC’s existing 2008 base indenture governing certain notes issued by TDCC. Under such supplemental indenture, Dow Inc. will guarantee all outstanding debt securities and all amounts due under such existing base indenture and will become subject to certain covenants and events of default under the existing base indenture.
In addition, the Revolving Credit Agreement includes an event of default which would be triggered in the event Dow Inc. incurs or guarantees third party indebtedness for borrowed money in excess of $250 million or engages in any material activity or directly owns any material assets, in each case, subject to certain conditions and exceptions. Dow Inc. may, at its option, cure the event of default by delivering an unconditional and irrevocable guarantee to the administrative agent within thirty days of the event or events giving rise to such event of default.
No such events have occurred or have been triggered at the time of the filing of this Annual Report on Form 10-K. See Note 14 to the Consolidated Financial Statements for information related to TDCC’s notes payable and long-term debt activity and information on TDCC’s debt covenants and default provisions.
While taking into consideration the current economic environment, management expects that the Company will continue to have sufficient liquidity and financial flexibility to meet all of its business obligations.
Credit Ratings
TDCC's credit ratings at January 31, 2025 were as follows:
| | | | | | | | | | | |
| Credit Ratings | Long-Term Rating | Short-Term Rating | Outlook |
| Fitch Ratings | BBB+ | F1 | Stable |
| Moody’s Ratings | Baa1 | P-2 | Negative |
| Standard & Poor’s | BBB | A-2 | Stable |
Fitch Ratings affirmed TDCC's BBB+ and F1 rating and its outlook of stable on July 1, 2024. Standard & Poor's affirmed TDCC's BBB and A-2 rating and its outlook of stable on July 1, 2024 and December 9, 2024. Moody's Ratings affirmed TDCC's Baa1 and P-2 rating and its outlook of stable on August 6, 2024, and re-affirmed TDCC's Baa1 and P-2 rating and revised its outlook to negative from stable on October 28, 2024. These credit agencies' decisions were made as part of their annual review process and reflect the Company's supportive financial policies, scale, liquidity and cost-advantaged footprint.
Dividends
Dow Inc.
Dow Inc. has paid dividends on a quarterly basis and expects to continue to do so, subject to approval by the Board. The dividends declared by the Board align to the Company's strategy announced in 2018 of returning approximately 45 percent of Operating Net Income to shareholders through dividends and total shareholder remuneration of approximately 65 percent, when including share repurchases, over the economic cycle. The Company defines Operating Net Income, a non-GAAP measure, as "Net income available for Dow Inc. common stockholders," excluding the impact of significant items. The following tables provide information on dividends declared and paid to common stockholders:
| | | | | | | | | |
| Dividends Paid for the Years Ended Dec 31 | 2024 | 2023 | |
| In millions, except per share amounts |
| Dividends paid, per common share | $ | 2.80 | | $ | 2.80 | | |
| Dividends paid to common stockholders | $ | 1,966 | | $ | 1,972 | | |
| | | |
| | | | | | | | | | | |
| Dow Inc. Cash Dividends Declared and Paid |
| Declaration Date | Record Date | Payment Date | Amount (per share) |
| February 15, 2024 | February 29, 2024 | March 8, 2024 | $ | 0.70 | |
| April 11, 2024 | May 31, 2024 | June 14, 2024 | $ | 0.70 | |
| August 14, 2024 | August 30, 2024 | September 13, 2024 | $ | 0.70 | |
| October 10, 2024 | November 29, 2024 | December 13, 2024 | $ | 0.70 | |
TDCC
TDCC has committed to fund Dow Inc.'s dividends paid to common stockholders and share repurchases, as approved by the Board from time to time, as well as certain governance expenses. Funding is accomplished through intercompany loans. TDCC's Board of Directors reviews and determines a dividend distribution to Dow Inc. to settle the intercompany loans. For the year ended December 31, 2024, TDCC declared $2,578 million of dividends to Dow Inc. and paid $2,485 million of dividends to Dow, Inc. ($2,510 million for the year ended December 31, 2023). At December 31, 2024, TDCC's intercompany loan balance with Dow Inc. was insignificant. See Note 24 to the Consolidated Financial Statements for additional information.
Share Repurchase Program
On April 13, 2022, the Board approved a share repurchase program authorizing up to $3 billion for the repurchase of the Company's common stock, with no expiration date. The Company repurchased $494 million of its common stock in 2024. At December 31, 2024, approximately $931 million of the share repurchase program authorization remained available for repurchases. As previously announced, the Company intends to repurchase shares at a minimum to cover dilution over the economic cycle. The Company may from time to time expand its share repurchases beyond dilution, based on a number of factors including macroeconomic conditions, free cash flow generation, and the Dow share price. Any share repurchases, when coupled with the Company's dividends, are intended to implement the long-term strategy of targeting shareholder remuneration of approximately 65 percent over the economic cycle.
Pension Plans
The Company has both funded and unfunded defined benefit pension plans in the United States and a number of other countries. The Company’s funding policy is to contribute to funded plans when pension laws and/or economics either require or encourage funding. In 2024 and 2023, the Company contributed $121 million and $142 million to its pension plans, respectively, including contributions to fund benefit payments for its unfunded pension plans. Additionally, in the second quarter of 2024, the Company received a pension plan reversion of approximately $70 million (approximately $90 million in the second quarter of 2023) for a portion of the excess funding of one of its plans in Europe, included in "Other assets and liabilities, net" in the consolidated statements of cash flows. The Company expects to contribute approximately $175 million to its pension plans in 2025, inclusive of a plan contribution previously expected to be made in 2024, now expected to be contributed in 2025.
As announced in 2021, all U.S. pension plans were frozen for substantially all employees who participated in the U.S. defined benefit pension programs effective December 31, 2023. In the fourth quarter of 2023, the Company spun off a portion of each of the Company’s existing tax-qualified U.S defined benefit pension plans into new tax-qualified pension plans, which include the tax-qualified benefit obligations for substantially all employees hired after January 1, 2008. These employees earned benefits based on a set percentage of annual pay, plus interest, and the spin of these plans provides the Company the ability to separately manage the assets and obligations of these plans with like benefits. In the second quarter of 2024, as part of its ongoing pension de-risking initiatives, the Company initiated the termination of the new tax-qualified pension plans. As part of the plan termination process, the Company will offer participants of these plans annuity or lump sum distribution options. Final asset distributions are expected to be paid from plan assets in the fourth quarter of 2025. The Company anticipates that these asset distributions will result in pension settlement charges, with the amounts dependent on various factors, including interest rates, plan asset returns, annuity pricing and participant distribution elections.
See Note 19 to the Consolidated Financial Statements for additional information related to the Company’s pension plans.
Restructuring
The actions related to the 2023 Restructuring Program are expected to result in additional cash expenditures of $60 million, primarily through the first quarter of 2025 and consist primarily of severance and related benefit costs. Restructuring implementation and efficiency costs, primarily decommissioning and demolition activities related to asset actions, and costs associated with the Company's productivity and efficiency actions, are expected to result in additional cash expenditures of approximately $40 million, primarily through the first quarter of 2025. Restructuring implementation and efficiency costs totaled $230 million for the year ended December 31, 2024 ($243 million for the year ended December 31, 2023).
The Company expects to incur additional costs in the future related to its restructuring activities, which will be recognized as incurred. The Company also expects to incur additional employee-related costs, including involuntary termination benefits related to its other optimization activities. These costs cannot be reasonably estimated at this time. See Note 5 to the Consolidated Financial Statements for additional information on the Company's restructuring activities.
Contractual Obligations
The following table summarizes the Company’s contractual obligations, commercial commitments and expected cash requirements for interest at December 31, 2024. Additional information related to these obligations can be found in Notes 14, 15, 16 and 19 to the Consolidated Financial Statements.
| | | | | | | | | | | | | | | | | |
| Contractual Obligations at Dec 31, 2024 | Payments Due In | |
| In millions | 2025 | 2026-2027 | 2028-2029 | 2030 and beyond | Total |
| Dow Inc. | | | | | |
Long-term debt obligations 1 | $ | 495 | | $ | 1,384 | | $ | 2,156 | | $ | 12,417 | | $ | 16,452 | |
Expected cash requirements for interest 2 | 804 | | 1,472 | | 1,380 | | 8,608 | | 12,264 | |
| Pension and other postretirement benefits | 223 | | 398 | | 404 | | 3,402 | | 4,427 | |
Operating leases 3 | 365 | | 511 | | 284 | | 388 | | 1,548 | |
Purchase obligations 4 | 2,520 | | 3,167 | | 2,003 | | 6,345 | | 14,035 | |
Other noncurrent obligations 5 | — | | 687 | | 509 | | 1,931 | | 3,127 | |
| Total | $ | 4,407 | | $ | 7,619 | | $ | 6,736 | | $ | 33,091 | | $ | 51,853 | |
| TDCC | | | | | |
Long-term debt obligations 1 | $ | 495 | | $ | 1,384 | | $ | 2,156 | | $ | 12,417 | | $ | 16,452 | |
Expected cash requirements for interest 2 | 804 | | 1,472 | | 1,380 | | 8,608 | | 12,264 | |
| Pension and other postretirement benefits | 223 | | 398 | | 404 | | 3,402 | | 4,427 | |
Operating leases 3 | 365 | | 511 | | 284 | | 388 | | 1,548 | |
Purchase obligations 4 | 2,520 | | 3,167 | | 2,003 | | 6,345 | | 14,035 | |
Other noncurrent obligations 5 | — | | 686 | | 509 | | 1,798 | | 2,993 | |
| Total | $ | 4,407 | | $ | 7,618 | | $ | 6,736 | | $ | 32,958 | | $ | 51,719 | |
1.Excludes unamortized debt discount and issuance costs of $244 million. Includes finance lease obligations of $939 million.
2.Cash requirements for interest on long-term debt was calculated using current interest rates at December 31, 2024, and includes $165 million of various floating rate notes.
3.Includes imputed interest of $246 million.
4.Includes a $1.3 billion purchase commitment for the use of a water supply reservoir asset expected to commence in 2028, as discussed in Note 15 to the Consolidated Financial Statements, and outstanding purchase orders and other commitments greater than $1 million obtained through a survey conducted within the Company.
5.Includes liabilities related to asbestos litigation, environmental remediation, legal matters and other noncurrent liabilities. In addition to these items, Dow Inc. includes liabilities related to noncurrent obligations with DuPont and Corteva. The table excludes uncertain tax positions due to uncertainties in the timing of the effective settlement of tax positions with the respective taxing authorities and deferred tax liabilities as it is impractical to determine whether there will be a cash impact related to these liabilities. The table also excludes deferred revenue as it does not represent future cash requirements arising from contractual payment obligations.
The Company expects to meet its contractual obligations through its normal sources of liquidity and believes it has the financial resources to satisfy these contractual obligations.
Off-Balance Sheet Arrangements
Off-balance sheet arrangements are obligations the Company has with nonconsolidated entities related to transactions, agreements or other contractual arrangements. The Company holds variable interests in joint ventures accounted for under the equity method of accounting. The Company is not the primary beneficiary of these joint ventures and therefore is not required to consolidate these entities (see Note 23 to the Consolidated Financial Statements). In addition, see Note 13 to the Consolidated Financial Statements for information regarding the transfer of financial assets.
Guarantees arise during the ordinary course of business from relationships with customers, committed accounts receivable facilities and nonconsolidated affiliates when the Company undertakes an obligation to guarantee the performance of others if specific triggering events occur. Additional information related to guarantees can be found in the “Guarantees” section of Note 15 to the Consolidated Financial Statements.
Fair Value Measurements
See Note 19 to the Consolidated Financial Statements for information related to fair value measurements of pension and other postretirement benefit plan assets; see Note 21 for information related to other-than-temporary impairments; and, see Note 22 for additional information concerning fair value measurements.
OTHER MATTERS
Recent Accounting Guidance
See Note 2 to the Consolidated Financial Statements for a summary of recent accounting guidance.
Critical Accounting Estimates
The preparation of financial statements and related disclosures in accordance with U.S. GAAP requires management to make judgments, assumptions and estimates that affect the amounts reported in the consolidated financial statements and accompanying notes. Note 1 to the Consolidated Financial Statements describes the significant accounting policies and methods used in the preparation of the consolidated financial statements. Following are the Company’s accounting policies impacted by judgments, assumptions and estimates:
Asbestos-Related Matters of Union Carbide Corporation
Union Carbide is and has been involved in a large number of asbestos-related suits filed primarily in state courts during the past several decades. These suits principally allege personal injury resulting from exposure to asbestos-containing products and frequently seek both actual and punitive damages. The alleged claims primarily relate to products that Union Carbide sold in the past, alleged exposure to asbestos-containing products located on Union Carbide’s premises, and Union Carbide’s responsibility for asbestos suits filed against a former Union Carbide subsidiary, Amchem Products, Inc. ("Amchem"). Each year, Ankura Consulting Group, LLC ("Ankura") performs a review for Union Carbide based upon historical asbestos claims, resolution and asbestos-related defense and processing costs, through the terminal year of 2049. Union Carbide compares current asbestos claim and resolution activity, including asbestos-related defense and processing costs, to the results of the most recent Ankura study at each balance sheet date to determine whether the asbestos-related liability continues to be appropriate.
For additional information, see Part I, Item 3. Legal Proceedings; Asbestos-Related Matters of Union Carbide Corporation in Management’s Discussion and Analysis of Financial Condition and Results of Operations; and Notes 1 and 15 to the Consolidated Financial Statements.
Environmental Matters
The Company determines the costs of environmental remediation of its facilities and formerly owned facilities based on evaluations of current law and existing technologies. Inherent uncertainties exist in such evaluations primarily due to unknown environmental conditions, changing governmental regulations and legal standards regarding liability, and emerging remediation technologies. The recorded liabilities are adjusted periodically as remediation efforts progress, or as additional technical or legal information becomes available. At December 31, 2024, the Company had accrued obligations of $1,113 million for probable environmental remediation and restoration costs, including $234 million for the remediation of Superfund sites. This is management’s best estimate of the costs for remediation and restoration with respect to environmental matters for which the Company has accrued liabilities, although it is reasonably possible that the ultimate cost with respect to these particular matters could range up to approximately two times that amount. For further discussion, see Environmental Matters in Management’s Discussion and Analysis of Financial Condition and Results of Operations and Notes 1 and 15 to the Consolidated Financial Statements.
Pension and Other Postretirement Benefits
The amounts recognized in the consolidated financial statements related to pension and other postretirement benefits are determined from actuarial valuations. Inherent in these valuations are assumptions including expected return on plan assets, discount rates at which the liabilities could have been settled at December 31, 2024, rate of increase in future compensation levels, mortality rates and health care cost trend rates. These assumptions are updated annually and are disclosed in Note 19 to the Consolidated Financial Statements. In accordance with U.S. GAAP, actual results that differ from the assumptions are accumulated and amortized over future periods and, therefore, affect expense recognized and obligations recorded in future periods. The U.S. pension plans represent 73 percent of the Company’s pension plan assets and 70 percent of the pension obligations. The U.S. pension plans were frozen effective December 31, 2023, and therefore, participants do not accrue additional benefits for future service and compensation.
The Company uses the spot rate approach to determine the discount rate utilized to measure the service cost and interest cost components of net periodic pension and other postretirement benefit costs for the United States and other selected countries, as applicable. Under the spot rate approach, the Company calculates service cost and interest cost by applying individual spot rates from the Willis Towers Watson RATE:Link yield curve (based on high-quality corporate bond yields) for each selected country to the separate expected cash flow components of service cost and interest cost; service cost and interest cost for all other plans are determined on the basis of the single equivalent discount rates derived in determining those plan obligations.
The following information relates to the U.S. plans only; a similar approach is used for the Company’s non-U.S. plans.
The Company determines the expected long-term rate of return on assets by performing a detailed analysis of historical and expected returns based on the strategic asset allocation approved by the Company's Investment Committee and the underlying return fundamentals of each asset class. The Company’s historical experience with the pension fund asset performance is also considered. The expected return of each asset class is derived from a forecasted future return confirmed by historical experience. The expected long-term rate of return is an assumption and not what is expected to be earned in any one particular year. The weighted-average long-term rate of return assumption used for determining net periodic pension expense for 2024 was 7.07 percent. The weighted-average assumption to be used for determining 2025 net periodic pension expense is 7.04 percent. Future actual pension expense will depend on future investment performance, changes in future discount rates and various other factors related to the population of participants in the Company’s pension plans.
The discount rates utilized to measure the pension and other postretirement obligations of the U.S. plans are based on the yield on high-quality corporate fixed income investments at the measurement date. Future expected actuarially determined cash flows for the Company’s U.S. plans are individually discounted at the spot rates under the Willis Towers Watson U.S. RATE:Link 60-90 corporate yield curve (based on 60th to 90th percentile high-quality corporate bond yields) to arrive at the plan’s obligations as of the measurement date. The weighted average discount rate utilized to measure pension obligations increased to 5.74 percent at December 31, 2024, from 5.30 percent at December 31, 2023.
At December 31, 2024, the net underfunded status of the U.S. tax-qualified plans on a projected benefit obligation basis was $1,360 million. The net underfunded amount increased $168 million compared with December 31, 2023. The increase in the net underfunded amount in 2024 was primarily due to the unfavorable returns on plan assets partially offset by the market-related impact of higher discount rates. The Company uses a generational mortality table to determine the duration of its pension and other postretirement obligations.
The following discussion relates to the Company’s significant pension plans.
The Company bases the determination of pension expense on a market-related valuation of plan assets that reduces year-to-year volatility. This market-related valuation recognizes investment gains or losses over a five-year period from the year in which they occur. Investment gains or losses for this purpose represent the difference between the expected return calculated using the market-related value of plan assets and the actual return based on the market value of plan assets. Since the market-related value of plan assets recognizes gains or losses over a five-year period, the future value will be impacted when previously deferred gains or losses are recorded. Over the life of the plans, both gains and losses have been recognized and amortized. At December 31, 2024, net losses of $2,899 million remain to be recognized in the calculation of the market-related value of plan assets. These net
losses will result in increases in future pension expense as they are recognized in the market-related value of assets.
The net decrease in the market-related value of assets due to the recognition of prior losses is presented in the following table:
| | | | | |
| Net Decrease in Market-Related Asset Value Due to Recognition of Prior Losses |
| In millions |
| 2025 | $ | 1,126 | |
| 2026 | 1,264 | |
| 2027 | 266 | |
| 2028 | 243 | |
| Total | $ | 2,899 | |
Excluding the impact of the Company's 2024 one-time pension events, the Company expects net periodic benefit cost ("NPBC") credit to decrease in 2025 by approximately $88 million compared with 2024. The reduction in the NPBC credit is due to a smaller expected increase in assets and increased amortization, partially offset by reduced interest and service cost.
A 25 basis point increase or decrease in the long-term return on assets assumption would change the Company’s NPBC credit for 2025 by $48 million. A 25 basis point increase in the discount rate assumption would increase the Company's NPBC credit for 2025 by $9 million. A 25 basis point decrease in the discount rate assumption would decrease the Company's NPBC credit for 2025 by $8 million.
Income Taxes
Deferred tax assets and liabilities are determined based on temporary differences between the financial reporting and tax bases of assets and liabilities, applying enacted tax rates expected to be in effect for the year in which the differences are expected to reverse. Based on the evaluation of available evidence, both positive and negative, the Company recognizes future tax benefits, such as net operating loss carryforwards and tax credit carryforwards, to the extent that realizing these benefits is considered to be more likely than not.
At December 31, 2024, the Company had a net deferred tax asset balance of $865 million, after valuation allowances of $2,748 million.
In evaluating the ability to realize the deferred tax assets, the Company relies on, in order of increasing subjectivity, taxable income in prior carryback years, the future reversals of existing taxable temporary differences, tax planning strategies and forecasted taxable income using historical and projected future operating results.
The Company files tax returns in multiple jurisdictions and is subject to examination by taxing authorities throughout the world. Tax authorities have the ability to review and challenge matters that could be subject to differing interpretation of applicable tax laws and regulations as they relate to the amount, character, timing or inclusion of revenue and expenses or the sustainability of tax attributes. The ultimate resolution of such uncertainties could last several years. When an uncertain tax position is identified, the Company considers and interprets complex tax laws and regulations in order to determine the need for recognizing a provision in its financial statements. Significant judgment is required in determining the timing and measurement of uncertain tax positions. The Company utilizes internal and external expertise in interpreting tax laws to support the Company's tax positions. The Company recognizes the financial statement effects of an uncertain income tax position when it is more likely than not, based on technical merits, that the position will be sustained upon examination. At December 31, 2024, the Company had uncertain tax positions for both domestic and foreign issues of $422 million and $327 million for interest and penalties.
Goodwill
The Company performs goodwill impairment testing at the reporting unit level. Reporting units are the level at which discrete financial information is available and reviewed by business management on a regular basis. The Company tests goodwill for impairment annually (in the fourth quarter), or more frequently when events or changes in circumstances indicate it is more likely than not that the fair value of a reporting unit has declined below its carrying value. Goodwill is evaluated for impairment using qualitative and/or quantitative testing procedures. At December 31, 2024, goodwill was carried by five out of six of the Company's reporting units.
The Company has the option to first perform qualitative testing to determine whether it is more likely than not that the fair value of a reporting unit is less than its carrying value. Qualitative factors assessed at the Company level include, but are not limited to, GDP growth rates, long-term hydrocarbon and energy prices, equity and credit market activity, discount rates, foreign exchange rates and overall financial performance. Qualitative factors assessed at the reporting unit level include, but are not limited to, changes in industry and market structure, competitive environments, planned capacity and new product launches, cost factors such as raw material prices, and financial performance of the reporting unit. If the Company chooses not to complete a qualitative assessment for a given reporting unit or if the initial assessment indicates that it is more likely than not that the estimated fair value of a reporting unit is less than its carrying value, additional quantitative testing is required.
Quantitative testing requires the fair value of the reporting unit to be compared with its carrying value. If the reporting unit's carrying value exceeds its fair value, an impairment charge is recognized for the difference. The Company utilizes a discounted cash flow methodology to calculate the fair value of its reporting units. This valuation technique has been selected by management as the most meaningful valuation method due to the limited number of market comparables for the Company's reporting units. However, where market comparables are available, the Company includes EBIT/EBITDA multiples as part of the reporting unit valuation analysis. The discounted cash flow valuations are completed using the following key assumptions: projected revenue growth rates or compounded annual growth rates, discount rates, tax rates, terminal values, currency exchange rates, and forecasted long-term hydrocarbon and energy prices, by geographic region and by year, which include the Company's key feedstocks as well as natural gas and crude oil (due to its correlation to naphtha). Currency exchange rates and long-term hydrocarbon and energy prices are established for the Company as a whole and applied consistently to all reporting units, while revenue growth rates, discount rates and tax rates are established by reporting unit to account for differences in business fundamentals and industry risk. These key assumptions drive projected EBIT/EBITDA and EBIT/EBITDA margins, which are key elements of management’s internal control over the reporting unit valuation analysis.
2024 Goodwill Impairment Testing
In 2024, there were no events or changes in circumstances that warranted interim goodwill impairment testing. In the fourth quarter of 2024, qualitative testing was performed for all reporting units carrying goodwill. Based on the results of the qualitative testing, quantitative testing was performed on one reporting unit. For the qualitative assessments, management considered factors at both the Company level and the reporting unit level. Based on the qualitative assessments for the reporting units, management concluded it is more likely than not that the carrying value of the reporting unit is less than the fair value of the reporting unit. For the quantitative testing, the fair value exceeded the carrying value of the reporting unit.
Environmental Matters
Environmental Policies
Dow is committed to world-class environmental, health and safety (“EH&S”) performance, as demonstrated by industry-leading results, a long-standing commitment to the American Chemistry Council's Responsible Care® program, a strong commitment to achieve the Company's 2025 Sustainability Goals and Dow's drive to deliver against its targets around a circular economy and climate protection. These goals and targets set the standard for sustainability in the chemical industry, focusing on improvements in the Company’s local corporate citizenship and product stewardship, and by actively pursuing methods to reduce the Company's environmental impact.
To meet the Company’s public commitments, as well as the stringent laws and government regulations related to environmental protection and remediation to which its global operations are subject, the Company has well-defined policies, requirements and management systems. The Company's EH&S Management System (“EMS”) defines the “who, what, when and how” needed for the businesses to implement the Company’s policies and requirements and meet performance objectives, leadership expectations and public commitments. To ensure effective utilization, the EMS is integrated into a company-wide management system for EH&S, Operations, Quality and Human Resources.
The Company believes third-party verification and transparent public reporting are cornerstones of world-class EH&S performance and building public trust. Numerous Dow sites in EMEAI, Latin America, Asia Pacific and the U.S. & Canada have received third-party verification of the Company’s compliance with Responsible Care® and with outside specifications such as ISO-14001. The Company continues to be a global champion of Responsible Care® and has worked to broaden the application and impact of Responsible Care® around the world through engagement with peer companies, suppliers, customers and joint venture partners.
Dow manages environmental data for reporting with a waste, water and emissions inventory system. All emitting manufacturing sites globally record their emissions and water use in the system. The data is reviewed at the facility level and then by global coordinators before being aggregated for corporate environmental reporting purposes.
Dow's EH&S policies help to ensure the Company achieves its annual health and safety performance targets and the Company seeks to continuously improve on these targets through process and personal safety project implementations. Improvement in these areas, as well as environmental compliance, remains a top management priority, as the Company continues to implement its 2025 Sustainability Goals and progressive, multi-decade sustainability targets that include advancing a circular economy and climate protection. Progress is reviewed annually by management and with the Environment, Health, Safety & Technology ("EHS&T") Committee of the Board.
Detailed information on Dow’s performance regarding environmental matters and goals is accessible through the Company's Science & Sustainability webpage at www.dow.com/sustainability. Dow's website and its content are not deemed incorporated by reference into this report.
Chemical Security
Public and political attention continues to be placed on the protection of critical infrastructure, including the chemical industry, from security threats. Sabotage, terrorism, war, natural disasters and cybersecurity incidents have increased global concerns about the security and safety of chemical production and distribution. Many, including the Company and the American Chemistry Council, have called for uniform risk-based and performance-based national standards for securing the U.S. chemical industry. The Company is subject to U.S. regulations with established risk-based and performance-based standards that must be met at U.S. Coast Guard-regulated facilities promulgated by the U.S. Department of Homeland Security. The Company is also subject to the requirements of the Rail Transportation Security Rule issued by the U.S. Transportation Security Administration. The Company continues to support uniform risk-based national standards for securing the chemical industry.
The Company maintains a comprehensive, multi-level security plan that focuses on security, emergency planning, preparedness and response. This plan, which has been activated in response to significant world and national events, is reviewed on an annual basis. The Company continues to improve its security plans, placing emphasis on the safety of Dow communities and people by being prepared to meet risks at any level and to address both internal and external identifiable risks. The security plan includes regular vulnerability assessments, security audits, mitigation efforts and physical security upgrades designed to reduce vulnerability. The Company’s security plans are also designed to avert interruptions of normal business operations that could materially and adversely affect the Company’s results of operations, financial condition and cash flows.
The Company played a key role in the development and implementation of the American Chemistry Council’s Responsible Care® Security Code ("Security Code"), which requires that all aspects of security – including facility, transportation and cyberspace – be assessed and gaps addressed. Through the global implementation of the Security Code, the Company has permanently heightened the level of security – not just in the United States, but worldwide. The Company employs several hundred employees and contractors in its Emergency Services and Security department worldwide. In 2019, the Company established its Global Security Operations Center ("GSOC") to provide 24-hour/day, 365-day/year real-time monitoring of global risks to Dow assets and people. The GSOC employs state-of-the-art social media monitoring, threat reporting and geo-fencing capabilities to analyze global risks and report those risks, facilitating decision-making and actions to prevent Dow crises.
Through the implementation of the Security Code, including voluntary security enhancements and upgrades, the Company is well-positioned to comply with U.S. chemical facility regulations and other regulatory security frameworks. The Company participates with the American Chemistry Council to periodically review and update the Security Code.
The Company continues to work collaboratively across the supply chain on Responsible Care®, supply chain design, emergency preparedness, shipment visibility and transportation of hazardous materials. The Company cooperated with public and private entities to lead the implementation of advanced tank car design, and track and trace technologies. Further, the Company’s Distribution Risk Review process addresses potential threats in all modes of transportation across the Company’s supply chain. To reduce vulnerabilities, the Company maintains security measures that meet or exceed regulatory and industry security standards in all areas in which they operate.
The Company's initiatives relative to chemical security, emergency preparedness and response, Community Awareness and Emergency Response and crisis management are implemented consistently at all Dow sites on a global basis. Each Dow site has established outreach programs designed to engage community stakeholders with objectives centered around awareness of Dow operations, products, and efforts to protect worker and community health and the environment. These programs also educate community members on emergency planning and response, emissions and waste, future site plans to reduce waste and emissions, and process safety systems. Finally, these outreach efforts establish an opportunity for Dow site leaders to hear about community stakeholder expectations and address questions and concerns about safety, health, environmental or other issues. The Company participates with chemical associations globally and participates as an active member of the Global Congress on Chemical Security and Emerging Threats and in positions of leadership in the U.S. Chemical Sector Coordinating Council.
Climate Protection
Evaluation of climate-related risks and opportunities continues to be a catalyst for the development of the Company’s Decarbonize & Grow strategy (Dow’s climate transition plan), its broad water stewardship efforts and its new nature goal. Dow's science-based strategy includes a phased approach to decarbonize while meeting the growing demand for Dow's products and contributing to a low-emissions future through continued investment in new products, technologies and processes.
In 2020, Dow set a target to be carbon neutral by 2050 across Scopes 1, 2 and 3, as defined by the Greenhouse Gas Protocol Corporate Accounting and Reporting Standard, plus product benefits. Dow’s Protect the Climate goals include reducing net annual GHG emissions by 5 million metric tons by 2030 versus its 2020 baseline, representing approximately a 15 percent reduction versus 2020 and a nearly 30 percent reduction since 2005. In 2021, Dow outlined a path to decarbonize its production processes (Scope 1 and 2 CO2e emissions), utilizing a phased approach in which end-of-life capacity is replaced with higher-efficiency, lower GHG emitting assets. In 2024, Dow continued near-term progression in its Decarbonize & Grow strategy by starting construction of its Fort Saskatchewan Path2Zero project which will be the world’s first net-zero Scope 1 and 2 emissions ethylene complex, when completed, and will decarbonize approximately 20 percent of Dow’s global ethylene production capacity. Dow also continued to advance a project with X-energy, a nuclear energy innovation company, to commercialize an advanced small modular nuclear reactor that will generate GHG emissions-free process heat and energy at its site in Seadrift, Texas. In the near term, energy reduction and optimization projects will provide continuous progress toward Dow’s carbon-neutral ambitions.
Dow is also committed to advancing water stewardship within the Company's operations and supply chain and with downstream customers and to working collaboratively to enhance water management at the watershed level. In addition to Dow's target to reduce freshwater intake intensity at six key water-stressed sites by 20 percent from its 2015 baseline by the end of 2025, Dow announced in 2024 a robust new 2050 water resilience strategy as well as a 50,000 acre habitat conservation target to address these key elements of climate adaptation.
Despite these commitments, climate change-related risks and uncertainties, legal or regulatory responses to climate change, and failure to meet climate change commitments could negatively impact Dow’s results of operations, financial condition and/or reputation. Climate-related risks include both physical and transition risks.
Physical Risks
Climate-related physical risks include more frequent severe weather events, potential changes in precipitation patterns, water scarcity and extreme variability in weather patterns, which can disrupt the operations of the Company as well as those of its customers, partners and vendors.
To evaluate physical risks, Dow partnered with S&P Global Trucost (“Trucost”) to assess the Company’s exposure to physical risks based on the geographic location of its manufacturing operations. The risks assessed included water stress, flood, heat waves, cold waves, hurricanes, wildfires and sea level rise. The analysis included an assessment of the physical risks using a baseline year of 2020 with time periods for medium- (year 2030) and long-term (year 2050) using the Intergovernmental Panel on Climate Change representative concentration pathways. These pathways represent varying degrees of global atmospheric GHG concentrations (low, medium and high), and thus different expectations on global temperature rise. Results will be incorporated into Dow’s long-term assessments of its manufacturing sites, which is a key input into Dow’s capital approval process.
Transition Risks
Climate-related transition risks include the availability, development and affordability of lower GHG emissions technology, the effects of CO2e pricing, and changes in public sentiment, regulations, taxes, public mandates or requirements as they relate to CO2e, water or land use.
Climate-related risks, including both physical and transition risks, are assessed with input from internal and external sources including corporate, business, function and geographic leaders; subject matter experts; investors; and other stakeholders. The evaluation of climate-related risks and opportunities is integrated into an annual company-wide risk management process, known as enterprise risk management (“ERM”). ERM identifies significant or major risks to the Company and develops action plans to modify or mitigate risks.
Every few years, Dow also utilizes a robust scenario analysis to assess the long-term materiality and impact of climate-related risks and opportunities. Scenario analysis is used to challenge business-as-usual assumptions and strengthen the resiliency of the Company’s Decarbonize & Grow strategy. Scenarios are used to evaluate both physical and transition risk and are particularly useful in evaluating the potential and impact of emerging risks.
Managing Climate Risks
Management of climate risk is assigned to Dow’s Climate Steering Team (“CST”), which is accountable for developing and implementing plans to mitigate risk and for tracking actions and progress against those plans. With oversight and accountability by the CST, specific carbon-related risks are managed by Dow’s Climate Program Management Office (“PMO”). The PMO partners with subject matter experts to develop and implement strategies to mitigate or eliminate climate-related risks. The team develops specific action plans and ensures owners are assigned to drive forward progress in order to reduce Dow’s risk exposure. Risk mitigation status updates are provided to executive leaders on a regular basis and discussions include risk time horizons and/or magnitude of impact to confirm that the strategy remains solid.
Decarbonize & Grow
Dow’s Decarbonize & Grow strategy involves specific actions to mitigate identified climate-related physical and transition risks, while also advancing opportunities in several key areas. These include:
•Optimizing Manufacturing Facilities and Processes for Sustainability: In addition to implementing near-term growth and efficiency investments, Dow is phasing out inefficient assets, decarbonizing remaining assets and building best-in-class, net-zero assets, as well as investing in innovative technologies such as clean hydrogen, advanced nuclear and carbon capture and storage. Dow has committed to investing approximately $1 billion in annual capital across the economic cycle to decarbonize assets in a phased approach, while growing capacity.
•Increasing Use of Clean Energy and Steam: As a major user and producer of energy, Dow is committed to reducing the use of fossil fuels for energy production and increasing consumption of clean energy, including both renewable and net-zero-emissions sources.
•Developing Low-Emissions Products, Technologies and Services: As a leading materials science company, Dow products are capable of making important contributions to the reduction of GHG emissions, including products that facilitate energy efficiency, lightweighting, fuel transition, circularity, increased operational efficiency and resource reductions.
•Developing Next Generation, Low-Carbon Manufacturing Technologies: Dow is investing in longer-term, future-focused manufacturing technologies that will be critical in the decarbonization of the Company's manufacturing.
•Building a Value-Generating Scope 3 Decarbonization Pathway: Approximately 70 percent of Dow’s emissions footprint fall into Scope 3 categories and more than half of those emissions derive from the raw materials, transportation and other services purchased as a company. Dow is actively validating and developing Scope 3 emissions reduction and mitigation efforts. Collaboration with the Company’s partners along the entire value chain is key to lowering Scope 3 carbon emissions.
Water Stewardship
Water is Dow’s largest dependency on nature. Water-related risk considers water availability (too much, too little), water quality (intake and effluents), access to safe drinking water, health of ecosystems and reputational and regulatory challenges. Dow’s approach to identifying water-related risks and impacts includes identification of
physical, regulatory and reputational risks. Dow’s methodology uses scientifically robust external tools such as WRI Aqueduct and the World Wildlife Fund water risk filter tool. Dow’s actions are also informed by the Trucost physical risk assessment, wherein water scarcity is recognized and addressed as the biggest climate-related threat to corporate assets with potential substantive financial or strategic impact on business.
Dow’s water risk management approach recognizes that every site and every business is accountable for water and certain watersheds require additional measures to address specific water stress challenges. Many Dow locations have specific water action plans to address local challenges, and Dow's new water strategy calls for water stewardship plans at its 20 water-dependent sites by 2030 and for all manufacturing sites by 2035. These action plans include mitigations for local water scarcity or quality issues and consider the needs of other local users for freshwater. Additionally, in 2015 Dow identified six sites, located in Texas (2); Bahia Blanca, Argentina; Terneuzen, The Netherlands; Böhlen, Germany; and Tarragona, Spain; where its operations are located in a water-stressed watershed, have local water quality issues, have competition among local users for water, or have some local knowledge of watershed challenges, and these six sites have since been the focus of Company actions. In 2024, the Company secured the use of a reservoir asset at one of its main U.S. Gulf Coast manufacturing sites, with a 35-year contract period that is expected to commence upon completion of construction in 2028.
In addition to site water stewardship efforts, Dow will work with suppliers to understand and mitigate water and biodiversity impacts and dependencies in its supply chain and will continue to innovate products that enable society to have reduced impacts on water bodies and other ecosystems.
Accountability for operational water stewardship begins at the site level where the operating permits exist. The Company's progress against its broader water and nature targets is reviewed regularly by management and with the EHS&T Committee of the Board.
Advancing a Circular Economy
Since Dow is only one part of the materials ecosystem, Dow advocates for the adoption of policies to accelerate the broader pathway to circularity. Circularity-enabling policies such as recycling mandates; mandates for recycled content in products; extended producer responsibility systems to finance state-of-the-art local access to collection, sorting and recycling; and policies to incentivize investments in innovative circular technologies are all critical to ensure that post-use products are diverted away from landfilling, incineration, open dumps and open burning and instead enter the circular economy. To accelerate the materials ecosystem, Dow is working toward its Transform the Waste target collectively with partners. The goal is to boost recycling rates for materials by developing the associated ecosystems to increase collection, sorting and recycling. As part of Dow’s sustainability targets, Dow intends to transform waste and alternative feedstocks to commercialize 3 million metric tons per year of circular and renewable solutions by 2030.
Although the volume base is fairly small today, circular products are seeing increasing promise with commercially attractive growth rates, and Dow expects this market to gain an increasingly larger market share over the coming decades, as supporting policies, technology and economics improve. Dow is partnering to build industrial ecosystems to collect, reuse or recycle waste and expand its portfolio to meet rapidly growing demand for circular solutions. Further, Dow is redesigning product formulations in order to use circular feedstocks such as waste and renewable materials, thereby reducing the reliance on virgin fossil feedstocks.
A circular economy requires embedding circularity in all parts of the value chains downstream from Dow. This includes product design for recyclability, accessible collection, sorting and recycling facilities, and appropriate economic incentives to make recycling economically viable. Through innovative developments, combined with partnerships and value chain collaboration, Dow is assisting its customers to design downstream applications for recyclability.
Developing Safer Materials
Chemistry-based products provide many benefits to society. Like any product, they must be managed responsibly to minimize any potential adverse effects on humans or the environment. Dow takes this responsibility seriously and works hard to ensure that its products are designed, stored, transported, used, disposed of, or recycled in a manner that shows high regard for human health, safety and environmental stewardship.
Dow utilizes the Company’s strong innovation pipeline to develop safer materials or reduce or eliminate priority substances in its products. Dow also invests in clean upstream manufacturing technologies to reduce facility emissions and, where necessary, restricts downstream uses of some substances.
At Dow, material safety is a continuous journey made possible through innovation, design and more predictive, enabling technologies. Dow works to offer products that – if used properly and in the manner intended – pose low risk to the environment, health and safety, and seeks to optimize products so they use resources more efficiently and sustainably.
Dow is working to deliver a sustainable future through its materials science expertise and collaboration with its customers. By constantly innovating how it sources, manufactures and delivers material solutions, Dow helps customers achieve their goals and create a better tomorrow. Dow also transparently communicates information on substances to customers via safety data sheets, regulatory data sheets and, in some cases, product handling guides.
Dow is committed to demonstrating the value of chemistry and materials science to society and improving the way the world understands and considers science in decision-making to maximize benefits to businesses, society and the planet. Through Dow’s 2025 Safe Materials for a Sustainable Planet goal, the Company has made progress toward this vision by innovating sustainable materials of tomorrow, leading candid conversations about product safety and committing to the advancement of open and transparent chemistry with value chain partners, customers and the public.
Environmental Remediation
For comparison of environmental remediation-related matters for the fiscal years ended December 31, 2023 and 2022, see Part II, Item 7. Management’s Discussion and Analysis of Financial Condition and Results of Operations of the Company's Annual Report on Form 10-K for the fiscal year ended December 31, 2023, filed with the SEC on January 31, 2024.
The Company accrues the costs of remediation of its facilities and formerly owned facilities based on current law and regulatory requirements. The nature of such remediation can include management of soil and groundwater contamination. The accounting policies adopted to properly reflect the monetary impacts of environmental matters are discussed in Note 1 to the Consolidated Financial Statements. To assess the impact on the financial statements, environmental experts review currently available facts to evaluate the probability and scope of potential liabilities. Inherent uncertainties exist in such evaluations primarily due to unknown environmental conditions, changing governmental regulations and legal standards regarding liability, and the ability to apply remediation technologies. These liabilities are adjusted periodically as remediation efforts progress or as additional technical or legal information becomes available. The Company had an accrued liability of $879 million at December 31, 2024, related to the remediation of current or former Dow-owned sites. At December 31, 2023, the liability related to remediation was $939 million.
In addition to current and former Dow-owned sites, under the federal Comprehensive Environmental Response, Compensation and Liability Act ("CERCLA") and equivalent state laws (hereafter referred to collectively as "Superfund Law"), the Company is liable for remediation of other hazardous waste sites where the Company allegedly disposed of, or arranged for the treatment or disposal of, hazardous substances. Because Superfund Law imposes joint and several liability upon each party at a site, the Company has evaluated its potential liability in light of the number of other companies that have also been named potentially responsible parties (“PRPs”) at each site, the estimated apportionment of costs among all PRPs, and the financial ability and commitment of each to pay its expected share. The Company’s remaining liability for the remediation of Superfund sites was $234 million at December 31, 2024 ($241 million at December 31, 2023). The Company has not recorded any third-party recovery related to these sites as a receivable.
Information regarding environmental sites is provided below:
| | | | | | | | | | | | | | |
| Environmental Sites | Dow-owned Sites 1 | Superfund Sites 2 |
| 2024 | 2023 | 2024 | 2023 |
| Number of sites at Jan 1 | 154 | | 171 | | 133 | | 130 | |
| Sites added during year | 2 | | 6 | | 1 | | 4 | |
| Sites closed during year | — | | (23) | | (3) | | (1) | |
| Number of sites at Dec 31 | 156 | | 154 | | 131 | | 133 | |
1.Dow-owned sites are sites currently or formerly owned by the Company. In the United States, remediation obligations are imposed by the Resource Conservation and Recovery Act or analogous state law. At December 31, 2024, 25 of these sites (24 sites at December 31, 2023) were formerly owned by Dowell Schlumberger, Inc., a group of companies in which the Company previously owned a 50 percent interest. The Company sold its interest in Dowell Schlumberger in 1992.
2.Superfund sites are sites, including sites not owned by the Company, where remediation obligations are imposed by Superfund Law.
Additional information is provided below for the Company’s Midland, Michigan, manufacturing site and Midland off-site locations (collectively, the "Midland sites"), as well as a Superfund site in Wood-Ridge, New Jersey, the locations for which the Company has the largest potential environmental liabilities.
In the early days of operations at the Midland manufacturing site, wastes were usually disposed of on-site, resulting in soil and groundwater contamination, which has been contained and managed on-site under a series of Resource Conservation and Recovery Act permits and regulatory agreements. The Hazardous Waste Operating License for the Midland manufacturing site, issued in 2003, and renewed and replaced in September 2015, also included provisions for the Company to conduct an investigation to determine the nature and extent of off-site contamination from historic Midland manufacturing site operations. In January 2010, the Company, the U.S. Environmental Protection Agency ("EPA") and the State of Michigan ("State") entered into an Administrative Order on Consent that requires the Company to conduct a remedial investigation, a feasibility study and a remedial design for the Tittabawassee River, the Saginaw River and the Saginaw Bay, and pay the oversight costs of the EPA and the State under the authority of CERCLA. See Note 15 to the Consolidated Financial Statements for further information relating to Midland off-site environmental matters.
Rohm and Haas, a wholly owned subsidiary of the Company, is a PRP at the Wood-Ridge, New Jersey, Ventron/Velsicol Superfund Site, and the adjacent Berry’s Creek Study Area ("BCSA") (collectively, the "Wood-Ridge sites"). Rohm and Haas is a successor in interest to a company that owned and operated a mercury processing facility, where wastewater and waste handling resulted in contamination of soils and adjacent creek sediments. In 2018, the Berry’s Creek Study Area Potentially Responsible Party Group (“PRP Group”), consisting of over 100 PRPs, completed a Remedial Investigation/Feasibility Study for the BCSA. During that time, the EPA concluded that an “iterative or adaptive approach” was appropriate for cleaning up the BCSA. Thus, each phase of remediation will be followed by a period of monitoring to assess its effectiveness and determine if there is a need for more work. In September 2018, the EPA signed a Record of Decision ("ROD 1") which describes the initial phase of the EPA’s plan to clean-up the BCSA. ROD 1 will remediate waterways and major tributaries in the most contaminated part of the BCSA. The PRP Group has signed agreements with the EPA to design the selected remedy. Although there is currently much uncertainty as to what will ultimately be required to remediate the BCSA and Rohm and Haas's share of these costs has yet to be determined, the range of activities that are required in the interim Record of Decision is known in general terms. The PRP Group has been approached by the EPA to convene discussions for the Remedial Action Consent Decree the EPA is preparing for the Berry’s Creek Site. The group submitted the 95 percent design for EPA review and has identified and contracted with a Remedial Action contractor to support completion of the 100 percent design. Allocation remains incomplete.
At December 31, 2024, the Company had accrued liabilities totaling $303 million ($319 million at December 31, 2023) for environmental remediation at the Midland and Wood-Ridge sites. In 2024, the Company spent $45 million ($48 million in 2023) for environmental remediation at the Midland and Wood-Ridge sites.
In total, the Company’s accrued liability for probable environmental remediation and restoration costs was $1,113 million at December 31, 2024, compared with $1,180 million at December 31, 2023. This is management’s best estimate of the costs for remediation and restoration with respect to environmental matters for which the Company has accrued liabilities, although it is reasonably possible that the ultimate cost with respect to these particular matters could range up to approximately two times that amount. Consequently, it is reasonably possible that environmental remediation and restoration costs in excess of amounts accrued could have a material impact on
the Company’s results of operations, financial condition and cash flows. It is the opinion of the Company’s management, however, that the possibility is remote that costs in excess of the range disclosed will have a material impact on the Company’s results of operations, financial condition and cash flows.
The amounts charged to income on a pretax basis related to environmental remediation totaled $197 million in 2024 and $203 million in 2023. The amounts charged to income on a pretax basis related to operating the Company's current pollution abatement facilities, excluding internal recharges, totaled $823 million in 2024 and $758 million in 2023. Capital expenditures for environmental protection were $208 million in 2024 and $228 million in 2023.
Asbestos-Related Matters of Union Carbide Corporation
Union Carbide is and has been involved in a large number of asbestos-related suits filed primarily in state courts during the past several decades. These suits principally allege personal injury resulting from exposure to asbestos-containing products and frequently seek both actual and punitive damages. The alleged claims primarily relate to products that Union Carbide sold in the past, alleged exposure to asbestos-containing products located on Union Carbide’s premises, and Union Carbide’s responsibility for asbestos suits filed against a former Union Carbide subsidiary, Amchem. In many cases, plaintiffs are unable to demonstrate that they have suffered any compensable loss as a result of such exposure, or that injuries incurred in fact resulted from exposure to Union Carbide’s products.
For comparison of asbestos-related matters of Union Carbide Corporation for the fiscal years ended December 31, 2023 and 2022, see Part II, Item 7. Management’s Discussion and Analysis of Financial Condition and Results of Operations of the Company's Annual Report on Form 10-K for the fiscal year ended December 31, 2023, filed with the SEC on January 31, 2024.
The table below provides information regarding asbestos-related claims pending against Union Carbide and Amchem based on criteria developed by Union Carbide and its external consultants:
| | | | | | | | | |
| Asbestos-Related Claim Activity | 2024 | 2023 | |
| Claims unresolved at Jan 1 | 6,367 | | 6,873 | | |
| Claims filed | 4,568 | | 4,199 | | |
| Claims settled, dismissed or otherwise resolved | (5,122) | | (4,705) | | |
| Claims unresolved at Dec 31 | 5,813 | | 6,367 | | |
| Claimants with claims against both Union Carbide and Amchem | (1,005) | | (1,236) | | |
| Individual claimants at Dec 31 | 4,808 | | 5,131 | | |
Plaintiffs’ lawyers often sue numerous defendants in individual lawsuits or on behalf of numerous claimants. As a result, the damages alleged are not expressly identified as to Union Carbide, Amchem or any other particular defendant, even when specific damages are alleged with respect to a specific disease or injury. For these reasons and based upon Union Carbide’s litigation and settlement experience, Union Carbide does not consider the damages alleged against Union Carbide and Amchem to be a meaningful factor in its determination of any potential asbestos-related liability.
For additional information see Part I, Item 3. Legal Proceedings and Asbestos-Related Matters of Union Carbide Corporation in Note 15 to the Consolidated Financial Statements.
| | |
| ITEM 7A. QUANTITATIVE AND QUALITATIVE DISCLOSURES ABOUT MARKET RISK |
The Company’s business operations give rise to market risk exposure due to changes in foreign exchange rates, interest rates, commodity prices and other market factors such as equity prices. To manage such risks effectively, the Company enters into hedging transactions, pursuant to established guidelines and policies that enable it to mitigate the adverse effects of financial market risk. Derivatives used for this purpose are designated as hedges per the accounting guidance related to derivatives and hedging activities, where appropriate. A secondary objective is to add value by creating additional non-specific exposure within established limits and policies; derivatives used for this purpose are not designated as hedges. The potential impact of creating such additional exposures is not material to the Company’s results.
The global nature of the Company’s business requires active participation in the foreign exchange markets. The Company has assets, liabilities and cash flows in currencies other than the U.S. dollar. The primary objective of the Company’s foreign currency risk management is to optimize the U.S. dollar value of net assets and cash flows. To achieve this objective, the Company hedges on a net exposure basis using foreign currency forward contracts, over-the-counter option contracts, cross-currency swaps and nonderivative instruments in foreign currencies. Exposures primarily relate to assets, liabilities and bonds denominated in foreign currencies, as well as economic exposure, which is derived from the risk that currency fluctuations could affect the dollar value of future cash flows related to operating activities. The largest exposures are denominated in European currencies, the Chinese yuan, the Japanese yen, the Thai baht and the Argentinian peso, although exposures also exist in other currencies in Asia Pacific, Canada, Latin America, the Middle East, Africa and India.
The main objective of interest rate risk management is to reduce the total funding cost to the Company and to alter the interest rate exposure to the desired risk profile. To achieve this objective, the Company hedges using interest rate swaps, “swaptions,” and exchange-traded instruments. The Company’s primary exposure is to the U.S. dollar yield curve.
The Company has a portfolio of debt and equity securities derived primarily from the investment activities of its insurance subsidiaries. This exposure is managed in a manner consistent with the Company’s market risk policies and procedures. The Company also uses equity and debt derivatives to hedge its exposure to non-qualified plans.
Inherent in the Company’s business is exposure to price changes for several commodities. Some exposures can be hedged effectively through liquid tradable financial instruments. Natural gas and crude oil, along with feedstocks for ethylene and propylene production, constitute the main commodity exposures. Over-the-counter and exchange traded instruments are used to hedge these risks, when feasible.
The Company uses value-at-risk (“VAR”), stress testing and scenario analysis for risk measurement and control purposes. VAR estimates the maximum potential loss in fair market values, given a certain move in prices over a certain period of time, using specified confidence levels. The VAR methodology used by the Company is a variance/covariance model. This model uses a 97.5 percent confidence level and includes at least one year of historical data.
The 2024 and 2023 year-end and average daily VAR for the aggregate of all positions are shown below. These amounts are immaterial relative to the total equity of the Company.
| | | | | | | | | | | | | | |
| Total Daily VAR by Exposure Type at Dec 31 | 2024 | 2023 |
| In millions | Year-end | Average | Year-end | Average |
| Commodities | $ | 10 | | $ | 12 | | $ | 14 | | $ | 11 | |
| Equity securities | 11 | | 11 | | 6 | | 8 | |
| Foreign exchange | 23 | | 22 | | 20 | | 17 | |
| Interest rate | 118 | | 139 | | 139 | | 177 | |
| Composite | $ | 162 | | $ | 184 | | $ | 179 | | $ | 213 | |
The Company’s daily VAR for the aggregate of all positions decreased from a composite VAR of $179 million at December 31, 2023 to a composite VAR of $162 million at December 31, 2024. The interest rate VAR decreased due to a decrease in interest rate volatility. The equity securities VAR increased due to an increase in equity exposure. The foreign exchange VAR increased due to an increase in outstanding derivatives and bonds designated as hedging instruments. The commodities VAR decreased due to a decrease in managed exposures. See Note 21 to the Consolidated Financial Statements for further disclosure regarding market risk.
| | |
| ITEM 8. FINANCIAL STATEMENTS AND SUPPLEMENTARY DATA |
REPORT OF INDEPENDENT REGISTERED PUBLIC ACCOUNTING FIRM
To the Stockholders and the Board of Directors of Dow Inc.
Opinion on the Financial Statements
We have audited the accompanying consolidated balance sheets of Dow Inc. and subsidiaries (the "Company") as of December 31, 2024 and 2023, the related consolidated statements of income, comprehensive income, equity, and cash flows, for each of the three years in the period ended December 31, 2024, and the related notes and the schedule listed in the Index at Item 15(a)(2) (collectively referred to as the "financial statements"). In our opinion, the financial statements present fairly, in all material respects, the financial position of the Company as of December 31, 2024 and 2023, and the results of its operations and its cash flows for each of the three years in the period ended December 31, 2024, in conformity with accounting principles generally accepted in the United States of America.
We have also audited, in accordance with the standards of the Public Company Accounting Oversight Board (United States) (“PCAOB”), the Company's internal control over financial reporting as of December 31, 2024, based on criteria established in Internal Control — Integrated Framework (2013) issued by the Committee of Sponsoring Organizations of the Treadway Commission and our report dated February 4, 2025, expressed an unqualified opinion on the Company's internal control over financial reporting.
Basis for Opinion
These financial statements are the responsibility of the Company's management. Our responsibility is to express an opinion on the Company's financial statements based on our audits. We are a public accounting firm registered with the PCAOB and are required to be independent with respect to the Company in accordance with the U.S. federal securities laws and the applicable rules and regulations of the Securities and Exchange Commission and the PCAOB.
We conducted our audits in accordance with the standards of the PCAOB. Those standards require that we plan and perform the audit to obtain reasonable assurance about whether the financial statements are free of material misstatement, whether due to error or fraud. Our audits included performing procedures to assess the risks of material misstatement of the financial statements, whether due to error or fraud, and performing procedures that respond to those risks. Such procedures included examining, on a test basis, evidence regarding the amounts and disclosures in the financial statements. Our audits also included evaluating the accounting principles used and significant estimates made by management, as well as evaluating the overall presentation of the financial statements. We believe that our audits provide a reasonable basis for our opinion.
Critical Audit Matters
The critical audit matter communicated below is a matter arising from the current-period audit of the financial statements that was communicated or required to be communicated to the audit committee and that (1) relate to accounts or disclosures that are material to the financial statements and (2) involved our especially challenging, subjective, or complex judgments. The communication of critical audit matters does not alter in any way our opinion on the financial statements, taken as a whole, and we are not, by communicating the critical audit matter below, providing separate opinions on the critical audit matter or on the accounts or disclosures to which it relates.
Uncertain Tax Positions — Refer to Notes 1 and 7 to the financial statements
Critical Audit Matter Description
The Company has a complex legal structure involving numerous domestic and foreign locations with constantly changing tax laws, regulations, and legal interpretations. The Company’s management is required to interpret and apply these tax laws and regulations in determining the amount of its income tax liability and provision. When an uncertain tax position is identified by management, the Company must evaluate if it is more likely than not, based on the technical merits, that the uncertain tax position will be sustained upon examination. The Company recognizes a benefit for tax positions using the highest cumulative tax benefit that is more likely than not to be
realized. The Company establishes a liability for unrecognized tax benefits that do not meet this threshold. The evaluation of each uncertain tax position requires management to apply specialized skill, knowledge, and significant judgment related to the identified position. The Company’s liability for unrecognized tax benefits and related accrued interest and penalties as of December 31, 2024 was $422 million and $327 million, respectively.
Because of the complexity of tax laws, regulations, and legal interpretations relevant to numerous taxing jurisdictions in which the Company operates, auditing uncertain tax positions and the determination of whether the more likely than not threshold was met requires a high degree of auditor judgment and increased extent of effort, including the involvement of our income tax specialists.
How the Critical Audit Matter Was Addressed in the Audit
Our audit procedures related to uncertain tax positions included the following, among others:
•We tested the effectiveness of internal controls over income taxes, including those over identifying uncertain tax positions and measuring liabilities.
•We evaluated, with the assistance of our income tax specialists, the Company’s uncertain tax positions by performing the following:
◦Obtaining Company and third-party opinions or memoranda regarding the uncertain tax positions.
◦Identifying key judgements underlying the Company’s position and evaluating whether the conclusions are consistent with our interpretation of the relevant laws and regulations.
◦Evaluating the Company’s method of measuring its liability for unrecognized tax benefits, including underlying data and assumptions.
◦Evaluating the basis for certain intercompany transactions, such as transfer pricing, by comparison to economic studies performed by management and third-party data.
◦Evaluating matters raised by taxing authorities in former and ongoing tax audits.
◦Assessing changes and interpretation of applicable tax law.
| | |
| /s/ DELOITTE & TOUCHE LLP |
| Midland, Michigan |
| February 4, 2025 |
We have served as the Company's auditor since 1905.
REPORT OF INDEPENDENT REGISTERED PUBLIC ACCOUNTING FIRM
To the Stockholder and the Board of Directors of The Dow Chemical Company
Opinion on the Financial Statements
We have audited the accompanying consolidated balance sheets of The Dow Chemical Company and subsidiaries (the "Company") as of December 31, 2024 and 2023, the related consolidated statements of income, comprehensive income, equity, and cash flows, for each of the three years in the period ended December 31, 2024, and the related notes and the schedule listed in the Index at Item 15(a)(2) (collectively referred to as the "financial statements"). In our opinion, the financial statements present fairly, in all material respects, the financial position of the Company as of December 31, 2024 and 2023, and the results of its operations and its cash flows for each of the three years in the period ended December 31, 2024, in conformity with accounting principles generally accepted in the United States of America.
We have also audited, in accordance with the standards of the Public Company Accounting Oversight Board (United States) (“PCAOB”), the Company's internal control over financial reporting as of December 31, 2024, based on criteria established in Internal Control — Integrated Framework (2013) issued by the Committee of Sponsoring Organizations of the Treadway Commission and our report dated February 4, 2025, expressed an unqualified opinion on the Company's internal control over financial reporting.
Basis for Opinion
These financial statements are the responsibility of the Company's management. Our responsibility is to express an opinion on the Company's financial statements based on our audits. We are a public accounting firm registered with the PCAOB and are required to be independent with respect to the Company in accordance with the U.S. federal securities laws and the applicable rules and regulations of the Securities and Exchange Commission and the PCAOB.
We conducted our audits in accordance with the standards of the PCAOB. Those standards require that we plan and perform the audit to obtain reasonable assurance about whether the financial statements are free of material misstatement, whether due to error or fraud. Our audits included performing procedures to assess the risks of material misstatement of the financial statements, whether due to error or fraud, and performing procedures that respond to those risks. Such procedures included examining, on a test basis, evidence regarding the amounts and disclosures in the financial statements. Our audits also included evaluating the accounting principles used and significant estimates made by management, as well as evaluating the overall presentation of the financial statements. We believe that our audits provide a reasonable basis for our opinion.
Critical Audit Matter
The critical audit matter communicated below is a matter arising from the current-period audit of the financial statements that was communicated or required to be communicated to the audit committee and that (1) relates to accounts or disclosures that are material to the financial statements and (2) involved our especially challenging, subjective, or complex judgments. The communication of critical audit matters does not alter in any way our opinion on the financial statements, taken as a whole, and we are not, by communicating the critical audit matter below, providing separate opinions on the critical audit matter or on the accounts or disclosures to which it relates.
Uncertain Tax Positions — Refer to Notes 1 and 7 to the financial statements
Critical Audit Matter Description
The Company has a complex legal structure involving numerous domestic and foreign locations with constantly changing tax laws, regulations, and legal interpretations. The Company’s management is required to interpret and apply these tax laws and regulations in determining the amount of its income tax liability and provision. When an uncertain tax position is identified by management, the Company must evaluate if it is more likely than not, based on the technical merits, that the uncertain tax position will be sustained upon examination. The Company recognizes a benefit for tax positions using the highest cumulative tax benefit that is more likely than not to be realized. The Company establishes a liability for unrecognized tax benefits that do not meet this threshold. The evaluation of each uncertain tax position requires management to apply specialized skill, knowledge, and significant
judgment related to the identified position. The Company’s liability for unrecognized tax benefits and related accrued interest and penalties as of December 31, 2024 was $422 million and $327 million, respectively.
Because of the complexity of tax laws, regulations, and legal interpretations relevant to numerous taxing jurisdictions in which the Company operates, auditing uncertain tax positions and the determination of whether the more likely than not threshold was met requires a high degree of auditor judgment and increased extent of effort, including the involvement of our income tax specialists.
How the Critical Audit Matter Was Addressed in the Audit
Our audit procedures related to uncertain tax positions included the following, among others:
•We tested the effectiveness of internal controls over income taxes, including those over identifying uncertain tax positions and measuring liabilities.
•We evaluated, with the assistance of our income tax specialists, the Company’s uncertain tax positions by performing the following:
◦Obtaining Company and third-party opinions or memoranda regarding the uncertain tax positions.
◦Identifying key judgements underlying the Company’s position and evaluating whether the conclusions are consistent with our interpretation of the relevant laws and regulations.
◦Evaluating the Company’s method of measuring its liability for unrecognized tax benefits, including underlying data and assumptions.
◦Evaluating the basis for certain intercompany transactions, such as transfer pricing, by comparison to economic studies performed by management and third-party data.
◦Evaluating matters raised by taxing authorities in former and ongoing tax audits.
◦Assessing changes and interpretation of applicable tax law.
| | |
| /s/ DELOITTE & TOUCHE LLP |
| Midland, Michigan |
| February 4, 2025 |
We have served as the Company's auditor since 1905.
Dow Inc. and Subsidiaries
Consolidated Statements of Income
| | | | | | | | | | | |
| (In millions, except per share amounts) For the years ended Dec 31, | 2024 | 2023 | 2022 |
| Net sales | $ | 42,964 | | $ | 44,622 | | $ | 56,902 | |
| Cost of sales | 38,358 | | 39,742 | | 48,338 | |
| Research and development expenses | 810 | | 829 | | 851 | |
| Selling, general and administrative expenses | 1,581 | | 1,627 | | 1,675 | |
| Amortization of intangibles | 310 | | 324 | | 336 | |
| Restructuring and asset related charges - net | 103 | | 528 | | 118 | |
| Equity in earnings (losses) of nonconsolidated affiliates | (6) | | (119) | | 268 | |
| Sundry income (expense) - net | 415 | | (280) | | 727 | |
| Interest income | 200 | | 229 | | 173 | |
| Interest expense and amortization of debt discount | 811 | | 746 | | 662 | |
| Income before income taxes | 1,600 | | 656 | | 6,090 | |
| Provision (credit) for income taxes | 399 | | (4) | | 1,450 | |
| Net income | 1,201 | | 660 | | 4,640 | |
| Net income attributable to noncontrolling interests | 85 | | 71 | | 58 | |
| Net income available for Dow Inc. common stockholders | $ | 1,116 | | $ | 589 | | $ | 4,582 | |
| | | |
| | | |
| Per common share data: | | | |
| Earnings per common share - basic | $ | 1.57 | | $ | 0.82 | | $ | 6.32 | |
| Earnings per common share - diluted | $ | 1.57 | | $ | 0.82 | | $ | 6.28 | |
| | | |
| Weighted-average common shares outstanding - basic | 703.8 | | 705.7 | | 721.0 | |
| Weighted-average common shares outstanding - diluted | 705.1 | | 709.0 | | 725.6 | |
See Notes to the Consolidated Financial Statements.
Dow Inc. and Subsidiaries
Consolidated Statements of Comprehensive Income
| | | | | | | | | | | |
| (In millions) For the years ended Dec 31, | 2024 | 2023 | 2022 |
| Net income | $ | 1,201 | | $ | 660 | | $ | 4,640 | |
| Other comprehensive income (loss), net of tax | | | |
| Unrealized gains (losses) on investments | 10 | | — | | (312) | |
| Cumulative translation adjustments | (172) | | 43 | | (579) | |
| Pension and other postretirement benefit plans | (234) | | (609) | | 2,457 | |
| Derivative instruments | (33) | | 24 | | 272 | |
| Total other comprehensive income (loss) | (429) | | (542) | | 1,838 | |
| Comprehensive income | 772 | | 118 | | 6,478 | |
| Comprehensive income attributable to noncontrolling interests, net of tax | 85 | | 71 | | 58 | |
| Comprehensive income attributable to Dow Inc. | $ | 687 | | $ | 47 | | $ | 6,420 | |
See Notes to the Consolidated Financial Statements.
Dow Inc. and Subsidiaries
Consolidated Balance Sheets
| | | | | | | | |
| (In millions, except share amounts) At Dec 31, | 2024 | 2023 |
| Assets | | |
| Current Assets | | |
| Cash and cash equivalents | $ | 2,189 | | $ | 2,987 | |
| | |
| Accounts and notes receivable: | | |
| Trade (net of allowance for doubtful receivables - 2024: $95; 2023: $81) | 4,756 | | 4,718 | |
| Other | 2,108 | | 1,896 | |
| Inventories | 6,544 | | 6,076 | |
| Other current assets | 993 | | 1,937 | |
| | |
| Total current assets | 16,590 | | 17,614 | |
| Investments | | |
| Investment in nonconsolidated affiliates | 1,266 | | 1,267 | |
| Other investments (investments carried at fair value - 2024: $2,047; 2023: $1,877) | 3,033 | | 2,740 | |
| Noncurrent receivables | 380 | | 438 | |
| Total investments | 4,679 | | 4,445 | |
| Property | | |
| Property | 62,121 | | 60,203 | |
| Less: Accumulated depreciation | 40,117 | | 39,137 | |
| Net property | 22,004 | | 21,066 | |
| Other Assets | | |
| Goodwill | 8,565 | | 8,641 | |
| Other intangible assets (net of accumulated amortization - 2024: $5,394; 2023: $5,374) | 1,721 | | 2,072 | |
| Operating lease right-of-use assets | 1,268 | | 1,320 | |
| Deferred income tax assets | 1,257 | | 1,486 | |
| Deferred charges and other assets | 1,228 | | 1,323 | |
| Total other assets | 14,039 | | 14,842 | |
| Total Assets | $ | 57,312 | | $ | 57,967 | |
| Liabilities and Equity | | |
| Current Liabilities | | |
| Notes payable | $ | 135 | | $ | 62 | |
| Long-term debt due within one year | 497 | | 117 | |
| Accounts payable: | | |
| Trade | 4,847 | | 4,529 | |
| Other | 1,694 | | 1,797 | |
| Operating lease liabilities - current | 318 | | 329 | |
| Income taxes payable | 276 | | 419 | |
| | |
| Accrued and other current liabilities | 2,521 | | 2,704 | |
| | |
| Total current liabilities | 10,288 | | 9,957 | |
| Long-Term Debt | 15,711 | | 14,907 | |
| Other Noncurrent Liabilities | | |
| Deferred income tax liabilities | 392 | | 399 | |
| Pension and other postretirement benefits - noncurrent | 4,736 | | 4,932 | |
| Asbestos-related liabilities - noncurrent | 713 | | 788 | |
| Operating lease liabilities - noncurrent | 984 | | 1,032 | |
| Other noncurrent obligations | 6,637 | | 6,844 | |
| Total other noncurrent liabilities | 13,462 | | 13,995 | |
| Stockholders’ Equity | | |
Common stock (authorized 5,000,000,000 shares of $0.01 par value each; issued 2024: 784,471,939 shares; 2023: 778,595,514 shares) | 8 | | 8 | |
| Additional paid-in capital | 9,203 | | 8,880 | |
| Retained earnings | 20,909 | | 21,774 | |
| Accumulated other comprehensive loss | (8,110) | | (7,681) | |
| Treasury stock at cost (2024: 80,859,145 shares; 2023: 76,302,081 shares) | (4,655) | | (4,374) | |
| Dow Inc.’s stockholders’ equity | 17,355 | | 18,607 | |
| Noncontrolling interests | 496 | | 501 | |
| Total equity | 17,851 | | 19,108 | |
| Total Liabilities and Equity | $ | 57,312 | | $ | 57,967 | |
See Notes to the Consolidated Financial Statements.
Dow Inc. and Subsidiaries
Consolidated Statements of Cash Flows
| | | | | | | | | | | |
| (In millions) For the years ended Dec 31, | 2024 | 2023 | 2022 |
| Operating Activities | | | |
| Net income | $ | 1,201 | | $ | 660 | | $ | 4,640 | |
| Adjustments to reconcile net income to net cash provided by operating activities: | | | |
| Depreciation and amortization | 2,894 | | 2,611 | | 2,758 | |
| Provision (credit) for deferred income tax | 135 | | (1,222) | | 79 | |
| Earnings of nonconsolidated affiliates less than dividends received | 348 | | 387 | | 696 | |
| Net periodic pension benefit cost (credit) | (210) | | 548 | | 23 | |
| Pension contributions | (121) | | (142) | | (235) | |
| Net gain on sales of assets, businesses and investments | (65) | | (70) | | (19) | |
| | | |
| | | |
| Restructuring and asset related charges - net | 103 | | 528 | | 118 | |
| | | |
| Other net loss | 239 | | 796 | | 212 | |
| Changes in assets and liabilities, net of effects of acquired and divested companies: | | | |
| Accounts and notes receivable | (224) | | 1,161 | | 1,187 | |
| Inventories | (529) | | 844 | | 347 | |
| Accounts payable | 278 | | (734) | | (1,255) | |
| Other assets and liabilities, net | (1,146) | | (203) | | (1,065) | |
| Cash provided by operating activities - continuing operations | 2,903 | | 5,164 | | 7,486 | |
| Cash provided by (used for) operating activities - discontinued operations | 11 | | 32 | | (11) | |
| Cash provided by operating activities | 2,914 | | 5,196 | | 7,475 | |
| Investing Activities | | | |
| Capital expenditures | (2,940) | | (2,356) | | (1,823) | |
| Investment in gas field developments | (203) | | (215) | | (190) | |
| | | |
| | | |
| Purchases of previously leased assets | — | | (7) | | (7) | |
| Proceeds from sales of property, businesses and consolidated companies, net of cash divested | 234 | | 95 | | 32 | |
| Acquisitions of property and businesses, net of cash acquired | (125) | | (114) | | (228) | |
| | | |
| Investments in and loans to nonconsolidated affiliates | (28) | | (5) | | (148) | |
| Distributions and loan repayments from nonconsolidated affiliates | — | | 2 | | 52 | |
| Proceeds from sales of ownership interests in nonconsolidated affiliates | — | | 63 | | 11 | |
| Purchases of investments | (1,809) | | (2,288) | | (1,366) | |
| Proceeds from sales and maturities of investments | 2,536 | | 1,958 | | 747 | |
| | | |
| Other investing activities, net | (33) | | (61) | | (50) | |
| Cash used for investing activities | (2,368) | | (2,928) | | (2,970) | |
| Financing Activities | | | |
| Changes in short-term notes payable | (61) | | (249) | | 253 | |
| Proceeds from issuance of short-term debt greater than three months | 143 | | — | | — | |
| Payments on short-term debt greater than three months | (17) | | — | | (14) | |
| Proceeds from issuance of long-term debt | 1,467 | | 104 | | 1,667 | |
| Payments on long-term debt | (267) | | (446) | | (1,006) | |
| Collections on securitization programs, net of remittances | (9) | | 18 | | — | |
| Purchases of treasury stock | (494) | | (625) | | (2,325) | |
| Proceeds from issuance of stock | 166 | | 188 | | 212 | |
| | | |
| Transaction financing, debt issuance and other costs | (14) | | (2) | | (24) | |
| Employee taxes paid for share-based payment arrangements | (39) | | (42) | | (35) | |
| | | |
| Distributions to noncontrolling interests | (77) | | (89) | | (83) | |
| | | |
| | | |
| Dividends paid to stockholders | (1,966) | | (1,972) | | (2,006) | |
| | | |
| Cash used for financing activities | (1,168) | | (3,115) | | (3,361) | |
| Effect of exchange rate changes on cash, cash equivalents and restricted cash | (163) | | (45) | | (237) | |
| Summary | | | |
| Increase (decrease) in cash, cash equivalents and restricted cash | (785) | | (892) | | 907 | |
| Cash, cash equivalents and restricted cash at beginning of year | 3,048 | | 3,940 | | 3,033 | |
| Cash, cash equivalents and restricted cash at end of year | $ | 2,263 | | $ | 3,048 | | $ | 3,940 | |
| Less: Restricted cash and cash equivalents, included in "Other current assets" | 74 | | 61 | | 54 | |
| Cash and cash equivalents at end of year | $ | 2,189 | | $ | 2,987 | | $ | 3,886 | |
See Notes to the Consolidated Financial Statements.
Dow Inc. and Subsidiaries
Consolidated Statements of Equity
| | | | | | | | | | | |
| (In millions, except per share amounts) For the years ended Dec 31, | 2024 | 2023 | 2022 |
| Common Stock | | | |
| Balance at beginning and end of year | $ | 8 | | $ | 8 | | $ | 8 | |
| | | |
| | | |
| Additional Paid-in Capital | | | |
| Balance at beginning of year | 8,880 | | 8,540 | | 8,151 | |
| Common stock issued / sold | 166 | | 188 | | 212 | |
| Stock-based compensation and allocation of ESOP shares | 370 | | 276 | | 258 | |
| Treasury stock issuances - compensation and benefit plans | (213) | | (124) | | (79) | |
| Other | — | | — | | (2) | |
| Balance at end of year | 9,203 | | 8,880 | | 8,540 | |
| Retained Earnings | | | |
| Balance at beginning of year | 21,774 | | 23,180 | | 20,623 | |
| Net income available for Dow Inc.'s common stockholders | 1,116 | | 589 | | 4,582 | |
| Dividends to stockholders | (1,966) | | (1,972) | | (2,006) | |
| Common control transaction | 10 | | — | | — | |
| Other | (25) | | (23) | | (19) | |
| Balance at end of year | 20,909 | | 21,774 | | 23,180 | |
| Accumulated Other Comprehensive Loss | | | |
| Balance at beginning of year | (7,681) | | (7,139) | | (8,977) | |
| Other comprehensive income (loss) | (429) | | (542) | | 1,838 | |
| Balance at end of year | (8,110) | | (7,681) | | (7,139) | |
| Unearned ESOP Shares | | | |
| Balance at beginning of year | — | | — | | (15) | |
| Allocation of ESOP shares | — | | — | | 15 | |
| | | |
| Balance at end of year | — | | — | | — | |
| Treasury Stock | | | |
| Balance at beginning of year | (4,374) | | (3,871) | | (1,625) | |
| Treasury stock purchases | (494) | | (627) | | (2,325) | |
| Treasury stock issuances - compensation and benefit plans | 213 | | 124 | | 79 | |
| Balance at end of year | (4,655) | | (4,374) | | (3,871) | |
| Dow Inc.'s stockholders' equity | 17,355 | | 18,607 | | 20,718 | |
| Noncontrolling Interests | 496 | | 501 | | 529 | |
| Total Equity | $ | 17,851 | | $ | 19,108 | | $ | 21,247 | |
| | | |
| Dividends declared per share of common stock | $ | 2.80 | | $ | 2.80 | | $ | 2.80 | |
See Notes to the Consolidated Financial Statements.
The Dow Chemical Company and Subsidiaries
Consolidated Statements of Income
| | | | | | | | | | | |
| (In millions) For the years ended Dec 31, | 2024 | 2023 | 2022 |
| Net sales | $ | 42,964 | | $ | 44,622 | | $ | 56,902 | |
| Cost of sales | 38,346 | | 39,738 | | 48,332 | |
| Research and development expenses | 810 | | 829 | | 851 | |
| Selling, general and administrative expenses | 1,581 | | 1,627 | | 1,675 | |
| Amortization of intangibles | 310 | | 324 | | 336 | |
| Restructuring and asset related charges - net | 103 | | 528 | | 118 | |
| Equity in earnings (losses) of nonconsolidated affiliates | (6) | | (119) | | 268 | |
| Sundry income (expense) - net | 404 | | (327) | | 714 | |
| Interest income | 210 | | 239 | | 181 | |
| Interest expense and amortization of debt discount | 811 | | 746 | | 662 | |
| Income before income taxes | 1,611 | | 623 | | 6,091 | |
| Provision (credit) for income taxes | 399 | | (4) | | 1,450 | |
| Net income | 1,212 | | 627 | | 4,641 | |
| Net income attributable to noncontrolling interests | 85 | | 71 | | 58 | |
| | | |
| | | |
| Net income available for The Dow Chemical Company common stockholder | $ | 1,127 | | $ | 556 | | $ | 4,583 | |
See Notes to the Consolidated Financial Statements.
The Dow Chemical Company and Subsidiaries
Consolidated Statements of Comprehensive Income
| | | | | | | | | | | |
| (In millions) For the years ended Dec 31, | 2024 | 2023 | 2022 |
| Net income | $ | 1,212 | | $ | 627 | | $ | 4,641 | |
| Other comprehensive income (loss), net of tax | | | |
| Unrealized gains (losses) on investments | 10 | | — | | (312) | |
| Cumulative translation adjustments | (172) | | 43 | | (579) | |
| Pension and other postretirement benefit plans | (234) | | (609) | | 2,457 | |
| Derivative instruments | (33) | | 24 | | 272 | |
| Total other comprehensive income (loss) | (429) | | (542) | | 1,838 | |
| Comprehensive income | 783 | | 85 | | 6,479 | |
| Comprehensive income attributable to noncontrolling interests, net of tax | 85 | | 71 | | 58 | |
| Comprehensive income attributable to The Dow Chemical Company | $ | 698 | | $ | 14 | | $ | 6,421 | |
See Notes to the Consolidated Financial Statements.
The Dow Chemical Company and Subsidiaries
Consolidated Balance Sheets
| | | | | | | | |
| (In millions, except share amounts) At Dec 31, | 2024 | 2023 |
| Assets | | |
| Current Assets | | |
| Cash and cash equivalents | $ | 2,189 | | $ | 2,987 | |
| | |
| Accounts and notes receivable: | | |
| Trade (net of allowance for doubtful receivables - 2024: $95; 2023: $81) | 4,756 | | 4,718 | |
| Other | 2,116 | | 1,997 | |
| Inventories | 6,544 | | 6,076 | |
| Other current assets | 960 | | 1,898 | |
| | |
| Total current assets | 16,565 | | 17,676 | |
| Investments | | |
| Investment in nonconsolidated affiliates | 1,266 | | 1,267 | |
| Other investments (investments carried at fair value - 2024: $2,047; 2023: $1,877) | 3,033 | | 2,740 | |
| Noncurrent receivables | 374 | | 424 | |
| Total investments | 4,673 | | 4,431 | |
| Property | | |
| Property | 62,121 | | 60,203 | |
| Less: Accumulated depreciation | 40,117 | | 39,137 | |
| Net property | 22,004 | | 21,066 | |
| Other Assets | | |
| Goodwill | 8,565 | | 8,641 | |
| Other intangible assets (net of accumulated amortization - 2024: $5,394; 2023: $5,374) | 1,721 | | 2,072 | |
| Operating lease right-of-use assets | 1,268 | | 1,320 | |
| Deferred income tax assets | 1,257 | | 1,486 | |
| Deferred charges and other assets | 1,228 | | 1,323 | |
| Total other assets | 14,039 | | 14,842 | |
| Total Assets | $ | 57,281 | | $ | 58,015 | |
| Liabilities and Equity | | |
| Current Liabilities | | |
| Notes payable | $ | 135 | | $ | 62 | |
| Long-term debt due within one year | 497 | | 117 | |
| Accounts payable: | | |
| Trade | 4,847 | | 4,529 | |
| Other | 1,732 | | 1,818 | |
| Operating lease liabilities - current | 318 | | 329 | |
| Income taxes payable | 276 | | 419 | |
| Accrued and other current liabilities | 2,405 | | 2,575 | |
| | |
| Total current liabilities | 10,210 | | 9,849 | |
| Long-Term Debt | 15,711 | | 14,907 | |
| Other Noncurrent Liabilities | | |
| Deferred income tax liabilities | 392 | | 399 | |
| Pension and other postretirement benefits - noncurrent | 4,736 | | 4,932 | |
| Asbestos-related liabilities - noncurrent | 713 | | 788 | |
| Operating lease liabilities - noncurrent | 984 | | 1,032 | |
| Other noncurrent obligations | 6,503 | | 6,702 | |
| | |
| Total other noncurrent liabilities | 13,328 | | 13,853 | |
| | |
| Stockholder's Equity | | |
| Common stock (authorized and issued 100 shares of $0.01 par value each) | — | | — | |
| Additional paid-in capital | 9,626 | | 9,091 | |
| Retained earnings | 16,020 | | 17,495 | |
| Accumulated other comprehensive loss | (8,110) | | (7,681) | |
| | |
| | |
| The Dow Chemical Company’s stockholder's equity | 17,536 | | 18,905 | |
| Noncontrolling interests | 496 | | 501 | |
| Total equity | 18,032 | | 19,406 | |
| Total Liabilities and Equity | $ | 57,281 | | $ | 58,015 | |
See Notes to the Consolidated Financial Statements.
The Dow Chemical Company and Subsidiaries
Consolidated Statements of Cash Flows
| | | | | | | | | | | |
| (In millions) For the years ended Dec 31, | 2024 | 2023 | 2022 |
| Operating Activities | | | |
| Net income | $ | 1,212 | | $ | 627 | | $ | 4,641 | |
| Adjustments to reconcile net income to net cash provided by operating activities: | | | |
| Depreciation and amortization | 2,894 | | 2,611 | | 2,758 | |
| Provision (credit) for deferred income tax | 135 | | (1,222) | | 80 | |
| Earnings of nonconsolidated affiliates less than (in excess of) dividends received | 348 | | 387 | | 696 | |
| Net periodic pension benefit cost (credit) | (210) | | 548 | | 23 | |
| Pension contributions | (121) | | (142) | | (235) | |
| Net gain on sales of assets, businesses and investments | (65) | | (70) | | (19) | |
| | | |
| | | |
| Restructuring and asset related charges - net | 103 | | 528 | | 118 | |
| | | |
| Other net loss | 252 | | 797 | | 221 | |
| Changes in assets and liabilities, net of effects of acquired and divested companies: | | | |
| Accounts and notes receivable | (224) | | 1,161 | | 1,187 | |
| Inventories | (529) | | 844 | | 347 | |
| Accounts payable | 278 | | (734) | | (1,255) | |
| Other assets and liabilities, net | (1,134) | | (226) | | (1,043) | |
| Cash provided by operating activities | 2,939 | | 5,109 | | 7,519 | |
| Investing Activities | | | |
| Capital expenditures | (2,940) | | (2,356) | | (1,823) | |
| Investment in gas field developments | (203) | | (215) | | (190) | |
| | | |
| | | |
| Purchases of previously leased assets | — | | (7) | | (7) | |
| Proceeds from sales of property, businesses and consolidated companies, net of cash divested | 234 | | 95 | | 32 | |
| Acquisitions of property and businesses, net of cash acquired | (125) | | (114) | | (228) | |
| | | |
| Investments in and loans to nonconsolidated affiliates | (28) | | (5) | | (148) | |
| Distributions and loan repayments from nonconsolidated affiliates | — | | 2 | | 52 | |
| Proceeds from sales of ownership interests in nonconsolidated affiliates | — | | 63 | | 11 | |
| Purchases of investments | (1,809) | | (2,288) | | (1,366) | |
| Proceeds from sales and maturities of investments | 2,536 | | 1,958 | | 747 | |
| | | |
| Other investing activities, net | (33) | | (61) | | (50) | |
| Cash used for investing activities | (2,368) | | (2,928) | | (2,970) | |
| Financing Activities | | | |
| Changes in short-term notes payable | (61) | | (249) | | 253 | |
| Proceeds from issuance of short-term debt greater than three months | 143 | | — | | — | |
| Payments on short-term debt greater than three months | (17) | | — | | (14) | |
| Proceeds from issuance of long-term debt | 1,467 | | 104 | | 1,667 | |
| Payments on long-term debt | (267) | | (446) | | (1,006) | |
| Collections on securitization programs, net of remittances | (9) | | 18 | | — | |
| Proceeds from issuance of stock | 166 | | 188 | | 212 | |
| | | |
| Transaction financing, debt issuance and other costs | (14) | | (2) | | (24) | |
| Employee taxes paid for share-based payment arrangements | (39) | | (42) | | (35) | |
| | | |
| Distributions to noncontrolling interests | (77) | | (89) | | (83) | |
| | | |
| | | |
| | | |
| Dividends paid to Dow Inc. | (2,485) | | (2,510) | | (4,375) | |
| | | |
| Cash used for financing activities | (1,193) | | (3,028) | | (3,405) | |
| Effect of exchange rate changes on cash, cash equivalents and restricted cash | (163) | | (45) | | (237) | |
| Summary | | | |
| Increase (decrease) in cash, cash equivalents and restricted cash | (785) | | (892) | | 907 | |
| Cash, cash equivalents and restricted cash at beginning of year | 3,048 | | 3,940 | | 3,033 | |
| Cash, cash equivalents and restricted cash at end of year | $ | 2,263 | | $ | 3,048 | | $ | 3,940 | |
| Less: Restricted cash and cash equivalents, included in "Other current assets" | 74 | | 61 | | 54 | |
| Cash and cash equivalents at end of year | $ | 2,189 | | $ | 2,987 | | $ | 3,886 | |
See Notes to the Consolidated Financial Statements.
The Dow Chemical Company and Subsidiaries
Consolidated Statements of Equity
| | | | | | | | | | | |
| (In millions, except per share amounts) For the years ended Dec 31, | 2024 | 2023 | 2022 |
| | | |
| | | |
| | | |
| | | |
| Common Stock | | | |
| Balance at beginning and end of year | $ | — | | $ | — | | $ | — | |
| | | |
| | | |
| Additional Paid-in Capital | | | |
| Balance at beginning of year | 9,091 | | 8,627 | | 8,159 | |
| | | |
| Issuance of parent company stock - Dow Inc. | 166 | | 188 | | 212 | |
| Stock-based compensation and allocation of ESOP shares | 370 | | 276 | | 258 | |
| Other | (1) | | — | | (2) | |
| Balance at end of year | 9,626 | | 9,091 | | 8,627 | |
| Retained Earnings | | | |
| Balance at beginning of year | 17,495 | | 19,472 | | 19,288 | |
| Net income available for The Dow Chemical Company's common stockholder | 1,127 | | 556 | | 4,583 | |
| Dividends to Dow Inc. | (2,578) | | (2,510) | | (4,375) | |
| Other | (24) | | (23) | | (24) | |
| Balance at end of year | 16,020 | | 17,495 | | 19,472 | |
| Accumulated Other Comprehensive Loss | | | |
| Balance at beginning of year | (7,681) | | (7,139) | | (8,977) | |
| Other comprehensive income (loss) | (429) | | (542) | | 1,838 | |
| | | |
| | | |
| Balance at end of year | (8,110) | | (7,681) | | (7,139) | |
| Unearned ESOP Shares | | | |
| Balance at beginning of year | — | | — | | (15) | |
| Allocation of ESOP shares | — | | — | | 15 | |
| | | |
| Balance at end of year | — | | — | | — | |
| | | |
| | | |
| | | |
| | | |
| | | |
| | | |
| | | |
| The Dow Chemical Company's stockholder's equity | 17,536 | | 18,905 | | 20,960 | |
| Noncontrolling Interests | 496 | | 501 | | 529 | |
| Total Equity | $ | 18,032 | | $ | 19,406 | | $ | 21,489 | |
See Notes to the Consolidated Financial Statements.
| | |
Dow Inc. and Subsidiaries
The Dow Chemical Company and Subsidiaries |
| Notes to the Consolidated Financial Statements |
Table of Contents
| | | | | | | | |
| Note | | Page |
| 1 | | |
| 2 | | |
| 3 | | |
| 4 | | |
| 5 | | |
| 6 | | |
| 7 | | |
| 8 | | |
| 9 | | |
| 10 | | |
| 11 | | |
| 12 | | |
| 13 | | |
| 14 | | |
| 15 | | |
| 16 | | |
| 17 | | |
| 18 | | |
| 19 | | |
| 20 | | |
| 21 | | |
| 22 | | |
| 23 | | |
| 24 | | |
| 25 | | |
| | |
NOTE 1 – SUMMARY OF SIGNIFICANT ACCOUNTING POLICIES
Principles of Consolidation and Basis of Presentation
The accompanying consolidated financial statements of Dow Inc. and TDCC were prepared in accordance with accounting principles generally accepted in the United States of America (“U.S. GAAP”) and include the assets, liabilities, revenues and expenses of all majority-owned subsidiaries over which Dow exercises control and, when applicable, entities for which Dow has a controlling financial interest or is the primary beneficiary. Intercompany transactions and balances are eliminated in consolidation. Investments in nonconsolidated affiliates (20-50 percent owned companies or less than 20 percent owned companies over which significant influence is exercised) are primarily accounted for using the equity method.
Dow Inc. owns all of the outstanding common shares of TDCC. As a result of the parent/subsidiary relationship between Dow Inc. and TDCC, and considering that the financial statements and disclosures of each company are substantially similar, the companies are filing a combined report for this Annual Report on Form 10-K. The information reflected in the report is equally applicable to both Dow Inc. and TDCC, except where otherwise noted. Transactions between TDCC and Dow Inc. are treated as related party transactions for TDCC. See Note 24 for additional information.
The Company conducts its worldwide operations through six global businesses which are organized into the following operating segments: Packaging & Specialty Plastics, Industrial Intermediates & Infrastructure and Performance Materials & Coatings. Corporate contains the reconciliation between the totals for the operating segments and the Company's totals. See Note 25 for additional information.
Except as otherwise indicated by the context, the term "Union Carbide" means Union Carbide Corporation and the term "Dow Silicones" means Dow Silicones Corporation, both wholly owned subsidiaries of the Company.
Use of Estimates in Financial Statement Preparation
The preparation of financial statements in accordance with U.S. GAAP requires the use of estimates and assumptions that affect the reported amounts of assets and liabilities, the disclosure of contingent assets and liabilities at the date of the financial statements, and the reported amounts of revenues and expenses during the reporting period. The Company’s consolidated financial statements include amounts that are based on management’s best estimates and judgments. Actual results could differ from those estimates.
Significant Accounting Policies
Asbestos-Related Matters
Accruals for asbestos-related matters, including defense and processing costs, are recorded based on an analysis of claim and resolution activity, defense spending, and pending and future claims. These accruals are assessed at each balance sheet date to determine if the asbestos-related liability remains appropriate. Accruals for asbestos-related matters are included in the consolidated balance sheets in “Accrued and other current liabilities” and “Asbestos-related liabilities - noncurrent.” See Note 15 for additional information.
Legal Costs
The Company expenses legal costs as incurred, with the exception of defense and processing costs associated with asbestos-related matters.
Foreign Currency Translation
The local currency has been primarily used as the functional currency throughout the world. Translation gains and losses of those operations that use local currency as the functional currency are included in the consolidated balance sheets in "Accumulated other comprehensive loss" ("AOCL"). For certain subsidiaries, the U.S. dollar is used as the functional currency. This occurs when the subsidiary operates in an economic environment where the products produced and sold are tied to U.S. dollar-denominated markets, or when the foreign subsidiary operates in a hyper-inflationary environment. Where the U.S. dollar is used as the functional currency, foreign currency translation gains and losses are reflected in income.
Environmental Matters
Accruals for environmental matters are recorded when it is probable that a liability has been incurred and the amount of the liability can be reasonably estimated based on current law and existing technologies. These accruals are adjusted periodically as assessment and remediation efforts progress or as additional technical or legal information becomes available. Accruals for environmental liabilities are included in the consolidated balance sheets in “Accrued and other current liabilities” and “Other noncurrent obligations” at undiscounted amounts. Accruals for related insurance or other third-party recoveries for environmental liabilities are recorded when it is probable that a recovery will be realized and are included in the consolidated balance sheets in “Accounts and notes receivable - Other” or "Noncurrent receivables."
Environmental costs are capitalized if the costs extend the life of the property, increase its capacity and/or mitigate or prevent contamination from future operations. Environmental costs are also capitalized in recognition of legal asset retirement obligations resulting from the acquisition, construction and/or normal operation of a long-lived asset. Costs related to environmental contamination treatment and cleanup are charged to expense. Estimated future incremental operations, maintenance and management costs directly related to remediation are accrued when such costs are probable and reasonably estimable.
Cash and Cash Equivalents
Cash and cash equivalents include time deposits and investments with maturities of three months or less at the time of purchase.
Financial Instruments
The Company calculates the fair value of financial instruments using quoted market prices when available. When quoted market prices are not available for financial instruments, the Company uses standard pricing models with market-based inputs that take into account the present value of estimated future cash flows.
The Company utilizes derivatives to manage exposures to foreign currency exchange rates, commodity prices and interest rate risk. The fair values of all derivatives are recognized as assets or liabilities at the balance sheet date.
Changes in the fair values of these instruments are reported in income or AOCL, depending on the use of the derivative and whether the Company has elected hedge accounting treatment.
Gains and losses on derivatives that are designated and qualify as cash flow hedging instruments are recorded in AOCL until the underlying transactions are recognized in income. Gains and losses on derivative and non-derivative instruments used as hedges of the Company’s net investment in foreign operations are recorded in AOCL as part of the cumulative translation adjustment.
Gains and losses on derivatives designated and qualifying as fair value hedging instruments, as well as the offsetting losses and gains on the hedged items, are reported in income in the same accounting period. Derivatives not designated as hedging instruments are marked-to-market at the end of each accounting period with the results included in income.
Accounts Receivable Programs
The Company maintains accounts receivable securitization and discounting facilities with various financial institutions, which allow for the sale of eligible trade accounts receivable at any point in time. The securitized accounts receivable are isolated in wholly owned special purpose entities and support the securities issued by those entities. The Company derecognizes the eligible trade receivables upon sale and retains no interest in the sold trade receivables. The Company continues to service the trade receivables and remit payments received from customers to the financial institutions. Amounts collected from customers but not yet remitted to the applicable financial institution are included in “Accrued and other current liabilities” in the consolidated balance sheets. When previously sold trade receivables are repurchased, they are included in “Accounts and notes receivable – Other” in the consolidated balance sheets. See Note 13 for additional information.
Inventories
Inventories are stated at the lower of cost or net realizable value. The method of determining cost for each subsidiary varies among last-in, first-out (“LIFO”); first-in, first-out (“FIFO”); and average cost, and is used consistently from year to year. See Note 9 for additional information.
The Company routinely utilizes exchange, swap and tolling arrangements with other companies for raw materials and finished goods to increase sourcing options, shorten delivery times, and reduce freight and other transportation costs. These transactions are treated as non-monetary exchanges and are valued at cost.
Property
Land, buildings and equipment are carried at cost less accumulated depreciation or amortization. Property under finance lease agreements is carried at the present value of lease payments over the lease term less accumulated amortization. Depreciation is based on the estimated service lives of depreciable assets and is calculated using the straight-line method. Fully depreciated assets are retained in property and accumulated depreciation accounts until they are disposed. In the case of disposals, assets and related accumulated depreciation are removed from the accounts, and the net amounts, less proceeds from disposal, are included in income.
Impairment and Disposal of Long-Lived Assets
The Company evaluates long-lived assets (property, finite-lived intangible assets and lease right-of-use assets) for impairment whenever events or changes in circumstances indicate that the carrying amount of an asset may not be recoverable. When undiscounted future cash flows are not expected to be sufficient to recover an asset’s carrying amount, the asset is written down to its fair value based on bids received from third parties or a discounted cash flow analysis based on market participant assumptions.
Long-lived assets to be disposed of by sale, if material, are classified as held for sale and reported at the lower of carrying amount or fair value less cost to sell, and depreciation/amortization is ceased. Long-lived assets to be disposed of other than by sale are classified as held and used until they are disposed of and reported at the lower of carrying amount or fair value, and depreciation/amortization is recognized over the remaining useful life of the assets.
Goodwill and Other Intangible Assets
The Company records goodwill when the purchase price of a business combination exceeds the estimated fair value of net identified tangible and intangible assets acquired. Goodwill is tested for impairment at the reporting unit level annually in the fourth quarter, or more frequently when events or changes in circumstances indicate that the fair value of a reporting unit has more likely than not declined below its carrying value. When testing goodwill for
impairment, the Company may first assess qualitative factors. If an initial qualitative assessment identifies that it is more likely than not that the fair value of a reporting unit is less than its carrying value, additional quantitative testing is performed. The Company may also elect to skip the qualitative testing and proceed directly to the quantitative testing. If the quantitative testing indicates that goodwill is impaired, an impairment charge is recognized based on the difference between the reporting unit's carrying value and its fair value. The Company primarily utilizes a discounted cash flow methodology to calculate the fair value of its reporting units.
Finite-lived intangible assets such as developed technology, customer-related assets, trademarks, tradenames and software, are amortized over their estimated useful lives, generally on a straight-line basis for periods ranging primarily from 3 to 20 years.
Asset Retirement Obligations
The Company records asset retirement obligations as incurred and reasonably estimable, including obligations for which the timing and/or method of settlement are conditional on a future event that may or may not be within the control of the Company. The fair values of obligations are recorded as liabilities on a discounted basis and are accreted over time for the change in present value. Costs associated with the liabilities are capitalized and amortized over the estimated remaining useful life of the assets.
Investments
Investments in debt securities, primarily held by the Company's insurance operations, are classified as trading, available-for-sale or held-to-maturity. Investments classified as trading are reported at fair value with unrealized gains and losses related to mark-to-market adjustments included in income. Those classified as available-for-sale are reported at fair value with unrealized gains and losses recorded in AOCL. Those classified as held-to-maturity are recorded at amortized cost. The cost of investments sold is determined by FIFO or specific identification.
Investments in equity securities with a readily determinable fair value are reported at fair value with unrealized gains and losses related to mark-to-market adjustments included in income. Equity securities without a readily determinable fair value are accounted for at cost, adjusted for impairments and observable price changes in orderly transactions.
The Company routinely reviews its investments for declines in fair value below the cost basis. When events or changes in circumstances indicate the carrying value of an asset may not be recoverable, the security is written down, establishing a new cost basis.
Leases
The Company determines whether a contract contains a lease at contract inception. A contract contains a lease if there is an identified asset and the Company has the right to control the asset.
Operating lease right-of-use (“ROU”) assets represent the Company's right to use an underlying asset for the lease term, and lease liabilities represent the Company's obligation to make lease payments arising from the lease. Operating lease ROU assets and lease liabilities are recognized at commencement date based on the present value of lease payments over the lease term. The Company uses the incremental borrowing rate in determining the present value of lease payments, unless the implicit rate is readily determinable. If lease terms include options to extend or terminate the lease, the ROU asset and lease liability are measured based on the reasonably certain decision. Leases with a term of 12 months or less at the commencement date are not recognized on the balance sheet and are expensed as incurred.
The Company has lease agreements with lease and non-lease components, which are accounted for as a single lease component for nearly all classes of leased assets for which the Company is the lessee. Additionally, for certain equipment leases, the portfolio approach is applied to account for the operating lease ROU assets and lease liabilities. In the consolidated statements of income, lease expense for operating lease payments is recognized on a straight-line basis over the lease term. For finance leases, interest expense is recognized on the lease liability and the ROU asset is amortized over the lease term.
Some leasing arrangements require variable payments that are dependent upon usage or output, or may vary for other reasons, such as insurance or tax payments. Variable lease payments are recognized as incurred and are not presented as part of the ROU asset or lease liability. See Note 16 for additional information.
Revenue
The Company recognizes revenue when its customer obtains control of promised goods or services in an amount that reflects the consideration which the Company expects to receive in exchange for those goods or services. To determine revenue recognition, the Company performs the following five steps: (1) identify the contract(s) with a customer, (2) identify the performance obligations in the contract, (3) determine the transaction price, (4) allocate the transaction price to the performance obligations in the contract and (5) recognize revenue when (or as) the entity satisfies a performance obligation. See Note 3 for additional information.
Revenue related to the Company's insurance operations includes third-party insurance premiums, which are earned over the terms of the related insurance policies and reinsurance contracts.
Severance Costs
The Company routinely reviews its operations around the world in an effort to ensure competitiveness across its businesses and geographic regions. When the reviews result in a workforce reduction related to the shutdown of facilities or other optimization activities, severance benefits are provided to employees primarily under the Company’s ongoing benefit arrangements. These severance costs are accrued once management commits to a plan of termination and it becomes probable that employees will be entitled to benefits at amounts that can be reasonably estimated.
Government Assistance
The Company receives grants, subsidies and incentives (collectively "incentives") from governments in various jurisdictions in support of its operations and capital projects. The incentives are recorded when it is probable that the Company will comply with the terms and conditions attached to the incentives and that the incentives will be received. Incentives are recognized on a systematic basis over the periods in which the related cost or expenditures occur and are included in the Company's financial statements as reductions of "Cost of sales" or "Research and development expenses" in the Company’s consolidated statements of income or as a reduction of "Property" in the consolidated balance sheets.
In 2024, the Company received $272 million of government incentives ($183 million in 2023 and $260 million in 2022) primarily related to the cost of energy used in the Company’s production processes. These incentives, from various governments, are typically based on level of energy consumption and are recorded as a reduction to "Cost of sales" in the consolidated statements of income and as "Accounts and notes receivable - Other" until received or as a reduction to "Accounts payable - Trade" in the consolidated balance sheets.
In 2024, the Company recognized $56 million in government incentives (zero in 2023 and 2022) related to the construction of certain energy assets in the United States. These incentives are recorded as a reduction of “Property” in the consolidated balance sheets and will lower depreciation expense over the useful lives of the related energy assets through a reduction to “Cost of sales” in the consolidated statements of income.
Other forms of government assistance received by the Company in 2024, 2023 and 2022 were not material.
Income Taxes
The Company accounts for income taxes using the asset and liability method. Under this method, deferred tax assets and liabilities are recognized for the future tax consequences of temporary differences between the carrying amounts and tax bases of assets and liabilities using enacted tax rates. The effect of a change in tax rates on deferred tax assets or liabilities is recognized in income in the period that includes the enactment date. The Company uses the portfolio approach for releasing income tax effects from AOCL.
The Company recognizes the financial statement effects of an uncertain income tax position when it is more likely than not, based on the technical merits, that the position will be sustained upon examination. The Company accrues for other tax contingencies when it is probable that a liability to a taxing authority has been incurred and the amount of the contingency can be reasonably estimated. The current portion of uncertain income tax positions is included in “Income taxes payable” and the long-term portion is included in “Other noncurrent obligations” in the consolidated balance sheets.
Provision is made for taxes on undistributed earnings of foreign subsidiaries and related companies to the extent that such earnings are not deemed to be permanently invested.
Earnings per Common Share
The calculation of earnings per common share is based on the weighted-average number of the Company's common shares outstanding for the applicable period. The calculation of diluted earnings per common share reflects the effect of all potential common shares that were outstanding during the respective periods, unless the effect of doing so is antidilutive.
TDCC Dividends
TDCC is a wholly owned subsidiary of Dow Inc. and TDCC's Board of Directors determines whether or not there will be a dividend distribution to Dow Inc. See Notes 17 and 24 for additional information.
NOTE 2 – RECENT ACCOUNTING GUIDANCE
Recently Adopted Accounting Guidance
On January 1, 2024, the Company adopted the amendments in Accounting Standards Update ("ASU") 2023-02, "Investments — Equity Method and Joint Ventures (Topic 323): Accounting for Investments in Tax Credit Structures Using the Proportional Amortization Method" and elected to account for certain tax equity investments using the proportional amortization method, as provided by the ASU. Under the proportional amortization method, an entity amortizes the initial cost of tax equity investments in proportion to the income tax credits and other income tax benefits received and recognizes the net amortization and income tax credits and other income tax benefits in the income statement as a component of income tax expense (benefit). The adoption of the ASU did not have a material impact on the Company's consolidated financial statements.
In the fourth quarter of 2024, the Company adopted the annual and interim disclosure requirements of ASU 2023-07, "Segment Reporting (Topic 280): Improvements to Reportable Segment Disclosures." The amendments expand a public business entity's segment disclosures by requiring disclosure of significant segment expenses that are regularly provided to the CODM, clarifying when an entity may report one or more additional measures to assess segment performance, requiring enhanced interim disclosures, providing new disclosure requirements for entities with a single reportable segment, and requiring other new disclosures. See Note 25 for applicable reportable segment disclosures required by this guidance.
Accounting Guidance Issued But Not Adopted at December 31, 2024
In December 2023, the Financial Accounting Standards Board ("FASB") issued ASU 2023-09, "Income Taxes (Topic 740): Improvements to Income Tax Disclosures," which is intended to enhance the transparency, decision usefulness and effectiveness of income tax disclosures. The amendments in this ASU require a public business entity to disclose a tabular tax rate reconciliation, using both percentages and currency, with specific categories. A public business entity is also required to provide a qualitative description of the states and local jurisdictions that make up the majority of the effect of the state and local income tax category and the net amount of income taxes paid, disaggregated by federal, state and foreign taxes and also disaggregated by individual jurisdictions. The amendments also remove certain disclosures that are no longer considered cost beneficial. The amendments are effective prospectively for annual periods beginning after December 15, 2024, and early adoption and retrospective application are permitted. The adoption of the ASU is not expected to have a material impact on the Company's consolidated financial statements.
In November 2024, the FASB issued ASU 2024-03, "Income Statement—Reporting Comprehensive Income—Expense Disaggregation Disclosures (Subtopic 220-40): Disaggregation of Income Statement Expenses," which is intended to improve disclosures about a public business entity's expenses and address requests from investors for more detailed information about the types of expenses in commonly presented expense captions. Such information should allow investors to better understand an entity's performance, assess future cash flows, and compare performance over time and with other entities. The amendments will require public business entities to disclose in the notes to the financial statements, at each interim and annual reporting period, specific information about certain costs and expenses, including purchases of inventory, employee compensation, depreciation, and intangible asset amortization included in each expense caption presented on the face of the income statement, and the total amount of an entity's selling expenses. The amendments are effective for annual reporting periods beginning after December 15, 2026, and interim reporting periods beginning after December 15, 2027, and may be applied either prospectively or retrospectively. Early adoption is permitted. The Company is currently evaluating the impact of adopting this guidance on the consolidated financial statements.
SEC Final Rules Not Adopted at December 31, 2024
In March 2024, the U.S. Securities and Exchange Commission ("SEC") adopted final rules under SEC Release Nos. 33-11275 and 34-99678, "The Enhancement and Standardization of Climate-Related Disclosures for Investors," which requires registrants to disclose certain climate related information in registration statements and annual reports. The final rules include requirements to disclose material climate-related risks; activities to mitigate or adapt to such risks; information about the board of directors' oversight of climate-related risks and management’s role in managing material climate-related risks; and information on any climate-related targets or goals that are material to the registrant's business, results of operations, or financial condition. Registrants are also required to disclose the financial statement effects of severe weather events and other natural conditions in the notes to the financial statements. Certain large registrants are also required to disclose Scope 1 and Scope 2 greenhouse gas ("GHG") emissions, when material. The final rules include a phased-in compliance period for all registrants. As a large accelerated filer, most disclosure requirements are effective for the Company beginning with the year ending December 31, 2025. GHG emissions disclosures are required for the year ending December 31, 2026. The Company will also be required to obtain limited assurance on its Scope 1 and Scope 2 GHG emissions disclosures beginning with the year ending December 31, 2029, with reasonable assurance required beginning with the year ending December 31, 2033. In April 2024, the SEC informed the U.S. Court of Appeals for the Eighth Circuit ("Court") that it would voluntarily stay the final rules until various legal challenges are resolved by the Court. The Company is currently evaluating the impact of the final rules on its consolidated financial statements and annual disclosures.
NOTE 3 – REVENUE
The majority of the Company's revenue is derived from product sales. In 2024, 98 percent of the Company's revenue related to product sales (98 percent in 2023 and 99 percent in 2022). The remaining sales were primarily related to the Company's insurance operations and licensing of patents and technologies.
Disaggregation of Revenue
Dow disaggregates its revenue from contracts with customers by operating segment and business, as the Company believes it best depicts the nature, amount, timing and uncertainty of its revenue and cash flows. See details in the tables below:
| | | | | | | | | | | |
| Net Trade Sales by Segment and Business | 2024 | 2023 | 2022 |
| In millions |
| Hydrocarbons & Energy | $ | 5,759 | | $ | 6,566 | | $ | 9,414 | |
| Packaging and Specialty Plastics | 16,017 | | 16,583 | | 19,846 | |
| Packaging & Specialty Plastics | $ | 21,776 | | $ | 23,149 | | $ | 29,260 | |
| Industrial Solutions | $ | 4,179 | | $ | 4,207 | | $ | 5,682 | |
| Polyurethanes & Construction Chemicals | 7,675 | | 8,316 | | 10,907 | |
| Others | 15 | | 15 | | 17 | |
| Industrial Intermediates & Infrastructure | $ | 11,869 | | $ | 12,538 | | $ | 16,606 | |
| Coatings & Performance Monomers | $ | 3,492 | | $ | 3,337 | | $ | 4,051 | |
| Consumer Solutions | 5,082 | | 5,160 | | 6,713 | |
| Performance Materials & Coatings | $ | 8,574 | | $ | 8,497 | | $ | 10,764 | |
| Corporate | $ | 745 | | $ | 438 | | $ | 272 | |
| Total | $ | 42,964 | | $ | 44,622 | | $ | 56,902 | |
| | | | | | | | | | | |
| Net Trade Sales by Geographic Region | 2024 | 2023 | 2022 |
| In millions |
| U.S. & Canada | $ | 16,423 | | $ | 16,640 | | $ | 20,945 | |
EMEAI 1 | 13,958 | | 14,537 | | 19,631 | |
| Asia Pacific | 7,707 | | 8,266 | | 10,344 | |
| Latin America | 4,876 | | 5,179 | | 5,982 | |
| Total | $ | 42,964 | | $ | 44,622 | | $ | 56,902 | |
1. Europe, Middle East, Africa and India.
Product Sales
Product sales consist of sales of the Company's products to manufacturers and distributors. The Company considers order confirmations or purchase orders, which in some cases are governed by master supply agreements, to be contracts with a customer. Product sale contracts are generally short-term contracts where the time between order confirmation and satisfaction of all performance obligations is less than one year. However, the Company has some long-term contracts which can span multiple years.
Revenues from product sales are recognized when the customer obtains control of the product, which occurs at a point in time, usually upon shipment, with payment terms typically in the range of 30 to 60 days after invoicing, depending on business and geographic region. When the Company performs shipping and handling activities after the transfer of control to the customer (e.g., when control transfers prior to shipment), these are considered fulfillment activities, and accordingly, the costs are accrued when the related revenue is recognized. Taxes collected from customers relating to product sales and remitted to governmental authorities are excluded from revenues. The Company elected to use the practical expedient to expense cash and non-cash sales incentives, as the amortization period for the costs to obtain the contract would have been one year or less.
Certain long-term contracts include a series of distinct goods that are delivered continuously to the customer through a pipeline (e.g., feedstocks). For these types of product sales, the Company invoices the customer in an amount that directly corresponds with the value to the customer of the Company’s performance to date. As a result, the Company recognizes revenue based on the amount billable to the customer in accordance with the right to invoice practical expedient.
The transaction price includes estimates for reductions in revenue from customer rebates and right of returns on product sales. These amounts are estimated based upon the most likely amount of consideration to which the customer will be entitled. All estimates are based on historical experience, anticipated performance and the Company’s best judgment at the time to the extent it is probable that a significant reversal of revenue recognized will not occur. All estimates for variable consideration are reassessed periodically. The Company elected the practical expedient to not adjust the amount of consideration for the effects of a significant financing component for all instances in which the period between payment and transfer of the goods will be one year or less.
For contracts with multiple performance obligations, the Company allocates the transaction price to each performance obligation based on the relative standalone selling price. The standalone selling price is the observable price which depicts the price as if sold to a similar customer in similar circumstances.
Patents, Trademarks and Licenses
The Company enters into licensing arrangements in which it licenses certain rights of its patents and technology to customers. Revenue from the majority of the Company’s licenses for patents and technology is derived from sales-based royalties. The Company estimates the amount of sales-based royalties it expects to be entitled to based on historical sales to the customer. For the remaining revenue from licensing arrangements, payments are typically received from the Company's licensees based on billing schedules established in each contract. Revenue is recognized when the performance obligation is satisfied.
Remaining Performance Obligations
Remaining performance obligations represent the transaction price allocated to unsatisfied or partially unsatisfied performance obligations. At December 31, 2024, the Company had unfulfilled performance obligations of $759 million ($744 million at December 31, 2023) related to the licensing of technology and expects revenue to be recognized for the remaining performance obligations over the next five years.
The Company has additional remaining performance obligations for product sales that have expected durations of one year or less, product sales of materials delivered through a pipeline for which the Company has elected the "right to invoice" practical expedient, and variable consideration attributable to royalties for licenses of patents and technology. The Company has received advance payments from customers related to long-term supply agreements that are deferred and recognized over the life of the contract, with remaining contract terms that range up to 19 years. The Company will have rights to future consideration for revenue recognized when product is delivered to the customer. These payments are included in "Accrued and other current liabilities" and "Other noncurrent obligations" in the consolidated balance sheets.
Contract Assets and Liabilities
The Company receives payments from customers based upon contractual billing schedules. Accounts receivable are recorded when the right to consideration becomes unconditional. Contract assets include amounts related to the Company’s contractual right to consideration for completed performance obligations not yet invoiced. Contract liabilities include payments received in advance of performance under the contract and are recognized in revenue when the performance obligations are met. "Contract liabilities - current" primarily reflects deferred revenue from prepayments from customers for product to be delivered in 12 months or less and royalty payments that are deferred and will be recognized in 12 months or less. "Contract liabilities - noncurrent" includes advance payments that the Company has received from customers related to long-term supply agreements and royalty payments that are deferred and recognized over the life of the contract.
Revenue recognized in 2024 from amounts included in contract liabilities at the beginning of the period was approximately $190 million (approximately $315 million in 2023 and $250 million in 2022). In 2024, the amount of contract assets reclassified to receivables as a result of the right to the transaction consideration becoming unconditional was insignificant (approximately $45 million in 2023). The Company did not recognize any asset impairment charges related to contract assets in 2024 (no impairment charges in 2023 and immaterial in 2022).
The following table summarizes contract assets and liabilities at December 31, 2024 and 2023:
| | | | | | | | | | | | |
| Contract Assets and Liabilities at Dec 31 | Balance Sheet Classification | 2024 | 2023 | |
| In millions |
| Accounts and notes receivable - trade | Accounts and notes receivable - trade | $ | 4,756 | | $ | 4,718 | | |
| Contract assets - current | Other current assets | $ | — | | $ | 13 | | |
| Contract assets - noncurrent | Deferred charges and other assets | $ | 2 | | $ | 4 | | |
Contract liabilities - current 1 | Accrued and other current liabilities | $ | 244 | | $ | 195 | | |
Contract liabilities - noncurrent 2 | Other noncurrent obligations | $ | 1,480 | | $ | 1,642 | | |
1.The increase from December 31, 2023 to December 31, 2024 was primarily due to the reclassification of deferred royalty payments from noncurrent to current, partially offset by recognition of deferred royalty payments.
2.The decrease from December 31, 2023 to December 31, 2024 was primarily due to recognition of revenue on long-term product supply agreements and the reclassification of deferred royalty payments from noncurrent to current, partially offset by deferred royalty payments.
NOTE 4 – ACQUISITIONS AND DIVESTITURES
Divestiture of the Flexible Packaging Laminating Adhesives Business
On December 2, 2024, the Company sold its flexible packaging laminating adhesives business, within Packaging & Specialty Plastics, to Arkema S.A. for cash proceeds of $115 million, net of working capital adjustments, costs to sell and other transaction expenses and subject to customary post-closing adjustments. The divestiture included five manufacturing sites in the United States, Italy and Mexico as well as the associated inventory, customer contracts and lists, process technology and certain intellectual property. Divested assets included inventory of $51 million, property with a net book value of $51 million, and goodwill of $16 million. The Company recognized a pretax gain of $1 million in the fourth quarter of 2024, included in "Sundry income (expense) - net" in the consolidated statements of income. Additionally, the Company recognized impairment charges related to write-downs of certain manufacturing assets included in this divestiture. See Notes 5 and 22 for additional information.
The Company evaluated the divestiture of its flexible packaging laminating adhesives business and determined it did not represent a strategic shift that had a major effect on the Company’s operations and financial results and did not qualify as an individually significant component of the Company. As a result, the divestiture is not reported as discontinued operations.
Acquisition of North American Polyethylene Recycler
On August 1, 2024, the Company acquired Circulus Holdings, LLC, a U.S. mechanical recycling company that converts plastic waste into post-consumer resin, for a cash purchase of approximately $130 million. The acquisition includes two facilities in the United States with a total recycling capacity of 50,000 metric tons per year and supports Dow's efforts to transform plastic waste and other forms of alternative feedstocks into 3 million metric tons of circular and renewable solutions annually by 2030. The assets acquired and liabilities assumed as part of the acquisition were recorded at their estimated fair value as of the acquisition date and consisted primarily of property of $74 million and intangible assets, primarily technology and know-how, of $22 million, with the excess of purchase price over the fair value of net assets acquired of $37 million allocated to goodwill.
NOTE 5 – RESTRUCTURING AND ASSET RELATED CHARGES - NET
The "Restructuring and asset related charges - net" line in the consolidated statements of income is used to record charges for restructuring programs and other asset related charges, which includes other asset impairments.
Restructuring Programs
2023 Restructuring Program
On January 25, 2023, the Board approved restructuring actions to achieve the Company's structural cost improvement initiatives in response to the continued economic impact from the global recessionary environment and to enhance its agility and long-term competitiveness across the economic cycle. These actions are expected to be substantially complete by the end of the first quarter of 2025. As a result of these actions the Company recorded pretax restructuring charges of $541 million in the first quarter of 2023, additional pretax restructuring charges of $8 million in the second quarter of 2023, and a $14 million net credit adjustment in the fourth quarter of 2023.
In the first quarter of 2024, the Company recorded additional pretax restructuring charges of $8 million for asset write-downs and write-offs related to the shutdown of certain polyurethanes assets within the Industrial Intermediates & Infrastructure segment. In the third quarter of 2024, the Company recorded additional pretax restructuring charges of $7 million for asset write-downs and write-offs related to the shutdown of certain silicones assets within the Performance Materials & Coatings segment. The impacted facilities are expected to be shutdown by the end of 2025. Additionally, the Company recorded a pretax restructuring charge of $16 million for severance and related benefit costs and a pretax restructuring charge of $1 million for additional asset write-downs and write-offs, related to Corporate. In the fourth quarter of 2024, the Company recorded a pretax restructuring charge of $25 million for severance and related benefit costs and a pretax restructuring charge of $9 million for costs associated with exit and disposal activities, related to Corporate.
The following table summarizes the activities related to the 2023 Restructuring Program, including segment information:
| | | | | | | | | | | | | | |
| 2023 Restructuring Program | Severance and Related Benefit Costs | Asset Write-downs and Write-offs | Costs Associated with Exit and Disposal Activities | Total |
| In millions |
| Packaging & Specialty Plastics | $ | — | | $ | 1 | | $ | — | | $ | 1 | |
| Industrial Intermediates & Infrastructure | — | | 50 | | — | | 50 | |
| Performance Materials & Coatings | — | | 49 | | — | | 49 | |
| Corporate | 344 | | 91 | | — | | 435 | |
| Total restructuring charges | $ | 344 | | $ | 191 | | $ | — | | $ | 535 | |
| Charges against the reserve | — | | (191) | | — | | (191) | |
| Cash payments | (222) | | — | | — | | (222) | |
| Reserve balance at Dec 31, 2023 | $ | 122 | | $ | — | | $ | — | | $ | 122 | |
| Packaging & Specialty Plastics | $ | — | | $ | — | | $ | — | | $ | — | |
| Industrial Intermediates & Infrastructure | — | | 8 | | — | | 8 | |
| Performance Materials & Coatings | — | | 7 | | — | | 7 | |
| Corporate | 41 | | 1 | | 9 | | 51 | |
| Total restructuring charges | $ | 41 | | $ | 16 | | $ | 9 | | $ | 66 | |
| Charges against the reserve | — | | (16) | | (9) | | (25) | |
| Cash payments | (103) | | — | | — | | (103) | |
| Reserve balance at Dec 31, 2024 | $ | 60 | | $ | — | | $ | — | | $ | 60 | |
At December 31, 2024, $60 million of the reserve balance was included in "Accrued and other current liabilities" ($101 million at December 31, 2023) and zero was included in "Other noncurrent obligations" ($21 million at December 31, 2023) in the consolidated balance sheets.
The Company recorded pretax restructuring charges of $601 million inception-to-date under the 2023 Restructuring Program, consisting of severance and related benefit costs of $385 million, asset write-downs and write-offs of $207 million, and costs associated with exit and disposal activities of $9 million.
Severance and Related Benefit Costs
Severance benefits are provided to employees primarily under Dow's ongoing benefit arrangements and are accrued against the Corporate segment once management commits to a plan of termination. The 2023 Restructuring Program included a charge for severance and related benefit costs of $385 million for a global workforce reduction of approximately 2,000 employees. The majority of separations occurred by the end of the second quarter of 2023 with the remaining occurring primarily through the first quarter of 2025.
Asset Write-downs and Write-offs
The 2023 Restructuring Program included charges related to the write-down and write-off of assets totaling $207 million. Details regarding the asset write-downs and write-offs are as follows:
•Industrial Intermediates & Infrastructure charges relate to the shutdown of certain polyurethanes assets and the write-off of other assets. The majority of the impacted facilities are expected to be shutdown by the end of 2025.
•Performance Materials & Coatings recorded charges to rationalize its asset footprint by shutting down certain coatings assets. These facilities are expected to be shutdown by the end of 2025.
•Corporate recorded charges related to the write-down of Company owned and leased, non-manufacturing facilities, primarily related to office space rationalization.
Costs Associated with Exit and Disposal Activities
The 2023 Restructuring program included a net pretax charge of $9 million for the net cost of benefit settlement, curtailment and special termination benefits related to participants of a pension plan in Europe that were impacted by the restructuring program, related to Corporate.
Restructuring implementation costs, primarily decommissioning and demolition activities related to asset actions and costs associated with the Company's productivity and efficiency actions, are expected to result in additional cash expenditures of approximately $40 million, primarily through the first quarter of 2025. Restructuring implementation and efficiency costs totaled $230 million in 2024 ($243 million in 2023).
Asset Related Charges
In 2024, the Company recognized pretax impairment charges of $37 million primarily related to write-downs of certain manufacturing assets in the United States and Italy included in the Company's planned divestiture of its flexible packaging laminating adhesives business. The impairment charges were included in "Restructuring and asset related charges - net" in the consolidated statements of income and related to Packaging & Specialty Plastics. See Notes 4 and 22 for additional information.
In 2023, the Company recorded pretax asset related credits of $7 million in Corporate related to a prior restructuring program.
In 2022, the Company recorded pretax asset related charges of $118 million due to the Russia and Ukraine conflict and the expectation that certain assets would not be recoverable. These charges included the write-down of inventory, the recording of bad debt reserves and the impairment of other assets. Asset related charges by segment in 2022 were as follows: $8 million in Packaging & Specialty Plastics, $73 million in Industrial Intermediates & Infrastructure, $6 million in Performance Materials & Coatings and $31 million in Corporate.
Subsequent Event
On January 27, 2025, the Board approved targeted actions to further achieve the Company's cost reduction initiatives in response to ongoing macroeconomic uncertainty, while reinforcing its long-term competitiveness across the economic cycle. This program includes a workforce reduction of approximately 1,500 roles.
The Company will record a charge in the first quarter of 2025 for costs associated severance and related benefit costs. In total, these costs are expected to be in the range of $250 million to $325 million and have future cash payments to be paid out primarily over the next two years. In addition, the Company will incur costs to implement these actions, which will be expensed as incurred and range from $20 million to $30 million over the life of the program.
NOTE 6 – SUPPLEMENTARY INFORMATION
| | | | | | | | | | | | | | |
| Dow Inc. Sundry Income (Expense) – Net | 2024 | 2023 | 2022 | |
| In millions | | | |
Non-operating pension and other postretirement benefit plan net (cost) credits 1 | $ | 264 | | $ | (264) | | $ | 358 | | | | |
Foreign exchange losses 2 | (45) | | (340) | | (117) | | | | |
Gain on sales of other assets and investments 3 | 60 | | 80 | | 78 | | | | |
Gain (loss) on early extinguishment of debt 4 | 5 | | 5 | | (8) | | | | |
Indemnification and other transaction related costs 5 | 13 | | 26 | | 4 | | | | |
Asset impairments and related costs 6 | 18 | | (18) | | — | | | | |
Gain related to Nova legal matter 7 | — | | 106 | | 321 | | | | |
| Dow Silicones breast implant liability adjustment | — | | — | | 60 | | | | |
| Other - net | 100 | | 125 | | 31 | | | | |
| Total sundry income (expense) – net | $ | 415 | | $ | (280) | | $ | 727 | | | | |
1.The year ended December 31, 2023, includes pretax pension settlement charges of $642 million related to the transfer of certain plan benefit obligations to insurance companies. See Note 19 for additional information about the Company's pension and other postretirement plans, including pension settlement charges.
2.Foreign exchange losses in 2024 relate primarily to exposures in the Argentine peso and Egyptian pound, while 2023 and 2022 relate primarily to exposures in the Argentine peso. In addition, 2023 includes a loss of $109 million related to the devaluation of the Argentine peso by the Argentina government in December 2023.
3.The year ended December 31, 2024, includes a gain of $25 million associated with a warehouse sale. The year ended December 31, 2023, includes gains associated with the sale of shares of a previously impaired equity method investment.
4.See Note 14 for additional information.
5.Primarily related to charges associated with agreements entered into with DuPont de Nemours, Inc. ("DuPont") and Corteva, Inc. ("Corteva") as part of the separation and distribution.
6.The year ended December 31, 2024 and 2023, includes certain obligations and subsequent reversals associated with a previously impaired equity method investment.
7.See Note 15 for additional information.
Sundry income (expense) - net for TDCC for the years ended December 31, 2024, 2023 and 2022, is substantially the same as that of Dow Inc., with the primary difference related to indemnification and other transaction related costs recorded on Dow Inc. Therefore, Sundry income (expense) - net for TDCC is not disclosed separately.
Other Investments
The Company has investments in company-owned life insurance policies ("COLI"), which are recorded at their cash surrender value as of each balance sheet date, as provided below:
| | | | | | | | |
| Investments in Company-Owned Life Insurance | Dec 31, 2024 | Dec 31, 2023 |
| In millions |
| Gross cash value | $ | 558 | | $ | 623 | |
Less: Existing drawdowns 1 | — | | 97 | |
| | |
Investments in company-owned life insurance 2 | $ | 558 | | $ | 526 | |
1.Classified as "Proceeds from sales and maturities of investments" in the consolidated statements of cash flows.
2.Classified as "Other investments" in the consolidated balance sheets.
The Company has the ability to monetize its investment in its COLI policies as an additional source of liquidity. At December 31, 2024, the Company had no outstanding monetization of its existing COLI policies' surrender value ($97 million at December 31, 2023).
Supplier Finance Program
The Company facilitates a supply chain financing (“SCF”) program in the ordinary course of business in order to extend payment terms with vendors. Under the terms of this program, a vendor can voluntarily enter into an agreement with a participating financial intermediary to sell its receivables due from the Company. The vendor receives payment from the financial intermediary, and the Company pays the financial intermediary on the terms originally negotiated with the vendor, which generally range from 90 to 120 days. The vendor negotiates the terms of the agreements directly with the financial intermediary and the Company is not a party to that agreement. The financial intermediary may allow the participating vendor to utilize the Company’s creditworthiness in establishing credit spreads and associated costs, which may provide the vendor with more favorable terms than they would be able to secure on their own. The Company does not provide guarantees related to the SCF program. At December 31, 2024, outstanding obligations confirmed as valid under the SCF program were $291 million ($285 million at December 31, 2023), included in “Accounts payable – Trade” in the consolidated balance sheets.
The following table summarizes the activity of the SCF program for the years ended December 31, 2024 and 2023:
| | | | | | | | | |
| Supplier Finance Program Activity | 2024 | 2023 | |
| In millions |
| Confirmed obligations outstanding at Jan 1 | $ | 285 | | $ | 267 | | |
| Invoices confirmed to financial intermediary | 1,313 | | 1,308 | | |
| Confirmed invoices paid to financial intermediary | (1,307) | | (1,290) | | |
| Confirmed obligations outstanding at Dec 31 | $ | 291 | | $ | 285 | | |
Accrued and Other Current Liabilities
“Accrued and other current liabilities” were $2,521 million and $2,405 million at December 31, 2024 and $2,704 million and $2,575 million at December 31, 2023, for Dow Inc. and TDCC, respectively. No components of "Accrued and other current liabilities" were more than 5 percent of "Total current liabilities" at December 31, 2024. At December 31, 2023, accrued payroll, which is a component of "Accrued and other current liabilities" and includes liabilities related to payroll, performance-based compensation and severance, was $714 million. No other components of "Accrued and other current liabilities" were more than 5 percent of "Total current liabilities" at December 31, 2023.
Supplemental Cash Flow Information
The following table shows cash paid for interest and income taxes for the years ended December 31, 2024, 2023 and 2022:
| | | | | | | | | | | |
| Supplemental Cash Flow Information | 2024 | 2023 | 2022 |
| In millions |
| Cash paid during year for: | | | |
| Interest | $ | 887 | | $ | 800 | | $ | 675 | |
| Income taxes | $ | 827 | | $ | 735 | | $ | 793 | |
NOTE 7 – INCOME TAXES
The financial statements for Dow Inc. and TDCC are substantially similar, including the reporting of current and deferred tax expense (benefit), provision (credit) for income taxes, and deferred tax asset and liability balances. As a result, the following income tax discussion pertains to Dow Inc. only.
| | | | | | | | | | | |
| Geographic Allocation of Income and Provision (Credit) for Income Taxes | | | |
| In millions | 2024 | 2023 | 2022 |
| Income (loss) before income taxes | | | |
| Domestic | $ | 492 | | $ | (602) | | $ | 2,383 | |
| Foreign | 1,108 | | 1,258 | | 3,707 | |
| Income before income taxes | $ | 1,600 | | $ | 656 | | $ | 6,090 | |
| Current tax expense (benefit) | | | |
| Federal | $ | (137) | | $ | 249 | | $ | 434 | |
| State and local | 12 | | 18 | | 82 | |
| Foreign | 389 | | 951 | | 855 | |
| Total current tax expense | $ | 264 | | $ | 1,218 | | $ | 1,371 | |
| Deferred tax expense (benefit) | | | |
| Federal | $ | 218 | | $ | (445) | | $ | 63 | |
| State and local | 51 | | 3 | | 1 | |
| Foreign | (134) | | (780) | | 15 | |
| Total deferred tax expense (benefit) | $ | 135 | | $ | (1,222) | | $ | 79 | |
| Provision (credit) for income taxes | $ | 399 | | $ | (4) | | $ | 1,450 | |
| Net income | $ | 1,201 | | $ | 660 | | $ | 4,640 | |
| | | | | | | | | | | |
| Reconciliation to U.S. Statutory Rate | 2024 | 2023 1 | 2022 1 |
| Statutory U.S. federal income tax rate | 21.0 | % | 21.0 | % | 21.0 | % |
| Equity earnings effect | — | | 4.2 | | (1.2) | |
| Foreign income taxed at rates other than the statutory U.S. federal income tax rate | 4.6 | | 8.3 | | (1.4) | |
| U.S. tax effect of foreign earnings and dividends | 3.9 | | (13.0) | | 1.2 | |
| Unrecognized tax benefits | (10.2) | | 33.1 | | 1.3 | |
| Changes in valuation allowances | (4.4) | | 18.8 | | (2.8) | |
| Federal tax accrual adjustment | (1.0) | | (21.2) | | 0.6 | |
| State and local income taxes | 5.4 | | 3.0 | | 2.8 | |
Change in tax basis in foreign assets 2 | 8.3 | | (54.9) | | — | |
| Foreign permanent items | (5.7) | | (1.1) | | (0.6) | |
| Other - net | 3.0 | | 1.2 | | 2.9 | |
| Effective tax rate | 24.9 | % | (0.6) | % | 23.8 | % |
1.Certain prior year rates have been adjusted to conform with the current year presentation.
2.The 2023 impact primarily represents the initial recognition of tax basis in intangible assets in foreign jurisdictions and the related valuation allowance.
| | | | | | | | | | | | | | |
| Deferred Tax Balances at Dec 31 | 2024 | 2023 |
| In millions | Assets | Liabilities | Assets | Liabilities |
| Property | $ | 178 | | $ | 2,550 | | $ | 404 | | $ | 2,663 | |
| Tax loss and credit carryforwards | 1,732 | | — | | 1,754 | | — | |
| Postretirement benefit obligations | 949 | | 187 | | 983 | | 196 | |
| Other accruals and reserves | 1,881 | | 572 | | 1,923 | | 521 | |
| Intangibles | 1,972 | | 261 | | 2,090 | | 331 | |
| Inventory | 137 | | 227 | | 114 | | 272 | |
| | | | |
| Investments | 102 | | 31 | | 166 | | 34 | |
| | | | |
| Other – net | 586 | | 96 | | 733 | | 115 | |
| Subtotal | $ | 7,537 | | $ | 3,924 | | $ | 8,167 | | $ | 4,132 | |
| Valuation allowances | (2,748) | | — | | (2,948) | | — | |
| Total | $ | 4,789 | | $ | 3,924 | | $ | 5,219 | | $ | 4,132 | |
| | | | | | | | |
| Operating Loss and Tax Credit Carryforwards at Dec 31 | 2024 | 2023 |
| In millions | Assets | Assets |
| Operating loss carryforwards | | |
| Expire within 5 years | $ | 390 | | $ | 213 | |
| Expire after 5 years or indefinite expiration | 567 | | 727 | |
| Total operating loss carryforwards | $ | 957 | | $ | 940 | |
| Tax credit carryforwards | | |
| Expire within 5 years | $ | 121 | | $ | 80 | |
| Expire after 5 years or indefinite expiration | 244 | | 317 | |
| Total tax credit carryforwards | $ | 365 | | $ | 397 | |
| Capital loss carryforwards | | |
| Expire within 5 years | $ | 410 | | $ | 417 | |
| Total tax loss and tax credit carryforwards | $ | 1,732 | | $ | 1,754 | |
Undistributed earnings of foreign subsidiaries and related companies that are deemed to be permanently invested amounted to $7,125 million at December 31, 2024 and $7,148 million at December 31, 2023. Undistributed earnings are subject to certain taxes upon repatriation, primarily where foreign withholding taxes apply. It is not practicable to calculate the unrecognized deferred tax liability on undistributed earnings.
The following table provides a reconciliation of the Company's unrecognized tax benefits:
| | | | | | | | | | | |
| Total Gross Unrecognized Tax Benefits | | | |
| In millions | 2024 | 2023 | 2022 |
| Total unrecognized tax benefits at Jan 1 | $ | 513 | | $ | 520 | | $ | 580 | |
| Decreases related to positions taken on items from prior years | (3) | | (58) | | (47) | |
| Increases related to positions taken on items from prior years | — | | 89 | | 53 | |
| Increases related to positions taken in the current year | 47 | | 77 | | 46 | |
| Settlement of uncertain tax positions with tax authorities | (118) | | (109) | | (111) | |
| Decreases due to expiration of statutes of limitations | (12) | | (11) | | — | |
| Foreign exchange loss (gain) | (5) | | 5 | | (1) | |
| Total unrecognized tax benefits at Dec 31 | $ | 422 | | $ | 513 | | $ | 520 | |
| Total unrecognized tax benefits that, if recognized, would impact the effective tax rate | $ | 422 | | $ | 513 | | $ | 520 | |
| Total amount of interest and penalties expense (benefit) recognized in "Provision (credit) for income taxes" | $ | (234) | | $ | 126 | | $ | (27) | |
| Total accrual for interest and penalties recognized in the consolidated balance sheets | $ | 327 | | $ | 561 | | $ | 498 | |
The Company files tax returns in multiple jurisdictions. These returns are subject to examination and possible challenge by the tax authorities. Open years contain matters that could be subject to differing interpretations of applicable tax laws and regulations as they relate to the amount, character, timing or inclusion of revenue and expenses or the sustainability of income tax credits for a given audit cycle. The ultimate resolution of such uncertainties is not expected to have a material impact on the Company's results of operations. The earliest open tax years are 2004 for state income taxes and 2007 for federal income taxes in the United States and 2011 for taxes in foreign jurisdictions.
NOTE 8 - EARNINGS PER SHARE CALCULATIONS
The following tables provide earnings per share calculations of Dow Inc. for the years ended December 31, 2024, 2023 and 2022. In accordance with the accounting guidance for earnings per share, earnings per share of TDCC is not presented as this information is not required in financial statements of wholly owned subsidiaries.
| | | | | | | | | | | |
| Net Income for Earnings Per Share Calculations | 2024 | 2023 | 2022 |
| In millions |
| Net income | $ | 1,201 | | $ | 660 | | $ | 4,640 | |
| Net income attributable to noncontrolling interests | 85 | | 71 | | 58 | |
| | | |
Net income attributable to participating securities 1 | 12 | | 11 | | 24 | |
| Net income attributable to common stockholders | $ | 1,104 | | $ | 578 | | $ | 4,558 | |
1.Restricted stock units are considered participating securities due to the Company's practice of paying dividend equivalents on unvested shares.
| | | | | | | | | | | |
| Earnings Per Share - Basic and Diluted | 2024 | 2023 | 2022 |
| Dollars per share |
| Earnings per common share - basic | $ | 1.57 | | $ | 0.82 | | $ | 6.32 | |
| Earnings per common share - diluted | $ | 1.57 | | $ | 0.82 | | $ | 6.28 | |
| | | | | | | | | | | |
| Share Count Information | 2024 | 2023 | 2022 |
| Shares in millions |
| Weighted-average common shares outstanding - basic | 703.8 | | 705.7 | | 721.0 | |
| Plus dilutive effect of equity compensation plans | 1.3 | | 3.3 | | 4.6 | |
| Weighted-average common shares outstanding - diluted | 705.1 | | 709.0 | | 725.6 | |
Stock options and restricted stock units excluded from EPS calculations 1 | 10.8 | | 9.6 | | 7.6 | |
1.These outstanding stock units were excluded from the calculation of diluted earnings per share because the effect of including them would have been antidilutive.
NOTE 9 – INVENTORIES
The following table provides a breakdown of inventories:
| | | | | | | | |
| Inventories at Dec 31 | | |
| In millions | 2024 | 2023 |
| Finished goods | $ | 3,773 | | $ | 3,413 | |
| Work in process | 1,323 | | 1,234 | |
| Raw materials | 822 | | 746 | |
| Supplies | 1,039 | | 992 | |
| Total | $ | 6,957 | | $ | 6,385 | |
| Adjustment of inventories to the LIFO basis | (413) | | (309) | |
| Total inventories | $ | 6,544 | | $ | 6,076 | |
At December 31, 2024, approximately 29 percent, 59 percent and 12 percent of the Company's inventories were accounted for under the LIFO, FIFO and average cost methods, respectively. At December 31, 2023, approximately 29 percent, 60 percent and 11 percent of the Company's inventories were accounted for under the LIFO, FIFO and average cost methods, respectively.
NOTE 10 – PROPERTY
The following table provides a breakdown of property:
| | | | | | | | | | | |
| Property at Dec 31 | Estimated Useful
Lives (Years) | 2024 | 2023 |
| In millions |
| Land and land improvements | 0-25 | $ | 2,255 | | $ | 2,218 | |
| Buildings | 5-50 | 5,145 | | 5,216 | |
| Machinery and equipment | 3-25 | 44,047 | | 43,343 | |
| Other property | 3-50 | 7,243 | | 6,865 | |
| Construction in progress | — | | 3,431 | | 2,561 | |
| Total property | | $ | 62,121 | | $ | 60,203 | |
| | | | | | | | | | | |
| In millions | 2024 | 2023 | 2022 |
| Depreciation expense | $ | 1,992 | | $ | 1,932 | | $ | 1,958 | |
| Capitalized interest | $ | 133 | | $ | 88 | | $ | 63 | |
NOTE 11 – NONCONSOLIDATED AFFILIATES
The Company’s investments in companies accounted for using the equity method (“nonconsolidated affiliates”), by classification in the consolidated balance sheets, and dividends received from nonconsolidated affiliates are shown in the following tables:
| | | | | | | | |
| Investments in Nonconsolidated Affiliates at Dec 31 | 2024 1 | 2023 1 |
| In millions |
| Investment in nonconsolidated affiliates | $ | 1,266 | | $ | 1,267 | |
| Other noncurrent obligations | (568) | | (229) | |
| Net investment in nonconsolidated affiliates | $ | 698 | | $ | 1,038 | |
1.The carrying amount of the Company’s investments in nonconsolidated affiliates at December 31, 2024 and 2023, was $55 million less than its share of the investees’ net assets, exclusive of additional differences relating to Sadara and EQUATE Petrochemical Company K.S.C.C. ("EQUATE"), which are discussed separately in the disclosures that follow.
| | | | | | | | | | | |
| Dividends Received from Nonconsolidated Affiliates | 2024 | 2023 | 2022 |
| In millions |
Dividends from nonconsolidated affiliates 1 | $ | 342 | | $ | 268 | | $ | 964 | |
1.Included in "Earnings of nonconsolidated affiliates less than dividends received" in the consolidated statements of cash flows.
The nonconsolidated affiliates in which the Company has investments are privately held companies; therefore, quoted market prices are not available.
Sadara
In 2011, the Company and Saudi Arabian Oil Company formed Sadara - a joint venture between the two companies that constructed and operates a world-scale, fully integrated chemicals complex in Jubail Industrial City, Kingdom of Saudi Arabia. The Company has a 35 percent equity interest in this joint venture and continues to be responsible for marketing a significant portion of Sadara’s products through the Company’s established sales channels. In 2021, Dow and the Saudi Arabian Oil Company agreed to a marketing rights transition plan. Execution of the transition plan is ongoing and progressing towards aligning marketing rights and responsibilities to levels more consistent with each partner's equity ownership. This transition will not impact equity earnings, but is expected to reduce the Company's sales of Sadara products over the transition period.
The Company’s investment in Sadara was $1,280 million less than Dow’s proportionate share of the carrying value of the underlying net assets held by Sadara at December 31, 2024 ($1,387 million less at December 31, 2023). This basis difference, which resulted from the 2019 impairment of the investment, is primarily attributed to the long-lived assets of Sadara and is being amortized over the remaining useful lives of the assets. At December 31, 2024, the Company had a negative investment balance in Sadara of $517 million classified as "Other noncurrent obligations" (negative $128 million at December 31, 2023) in the Company’s consolidated balance sheets. The negative investment in Sadara Chemical Company at December 31, 2024 is primarily due to the equity losses generated during the year. See Note 15 for additional information related to guarantees.
EQUATE
At December 31, 2024, the Company had a negative investment balance in EQUATE of $51 million classified as "Other noncurrent obligations" (negative $101 million at December 31, 2023) in the consolidated balance sheets. The reduction in the negative investment was driven by improved results during the year. The Company's investment in EQUATE was $417 million less than the Company's proportionate share of EQUATE's underlying net assets at December 31, 2024 ($432 million less at December 31, 2023), which represents the difference between the fair values of certain MEGlobal assets acquired by EQUATE and the Company's related valuation on a U.S. GAAP basis at the acquisition date. A basis difference of $97 million at December 31, 2024 ($111 million at December 31, 2023), is being amortized over the remaining useful lives of the assets and the remainder is considered a permanent difference.
AgroFresh Solutions Inc. ("AFSI")
As of March 31, 2023, the Company no longer holds an investment in AFSI.
Transactions with Nonconsolidated Affiliates
The Company has service agreements with certain nonconsolidated affiliates, including contracts to manage the operations of manufacturing sites and the construction of new facilities; licensing and technology agreements; and marketing, sales, purchase, lease and sublease agreements.
The Company sells excess ethylene glycol produced at manufacturing facilities in the United States and Europe to MEGlobal, a subsidiary of EQUATE. The Company also sells ethylene to MEGlobal as a raw material for its ethylene glycol plants in Canada. Sales of these products to MEGlobal represented 1 percent of total net sales in 2024, 2023 and 2022. Sales of ethylene to MEGlobal are reflected in the Packaging & Specialty Plastics segment and represented 2 percent of the segment's sales in 2024, 2023 and 2022. Sales of ethylene glycol to MEGlobal are reflected in the Industrial Intermediates & Infrastructure segment and represented 1 percent of the segment's sales in 2024, 2023 and 2022.
The Company is responsible for marketing the majority of Sadara products outside of the Middle East zone through the Company’s established sales channels. Under this arrangement, the Company purchases and sells Sadara products for a marketing fee. Purchases of Sadara products represented 6 percent of "Cost of sales" in 2024 (6 percent in 2023 and 7 percent in 2022).
The Company purchases products from The SCGC-Dow Group, primarily for marketing and distribution in Asia Pacific. Purchases of products from The SCGC-Dow Group represented 3 percent of "Cost of sales" in 2024, 2023 and 2022.
Sales to and purchases from other nonconsolidated affiliates were not material to the consolidated financial statements.
Balances due to or due from nonconsolidated affiliates at December 31, 2024 and 2023, were as follows:
| | | | | | | | |
| Balances Due To or Due From Nonconsolidated Affiliates at Dec 31 | 2024 | 2023 |
| In millions |
| Accounts and notes receivable - Other | $ | 300 | | $ | 189 | |
| | |
| | |
| | |
| Accounts payable - Other | $ | 748 | | $ | 823 | |
| | |
Principal Nonconsolidated Affiliates
The Company had an ownership interest in 38 nonconsolidated affiliates at December 31, 2024 and 2023. The Company's principal nonconsolidated affiliates and its ownership interest (direct and indirect) for each at December 31, 2024, 2023 and 2022, are as follows:
| | | | | | | | | | | | | | |
| Principal Nonconsolidated Affiliates at Dec 31 | Country | Ownership Interest |
| | 2024 | 2023 | 2022 |
| EQUATE Petrochemical Company K.S.C.C. | Kuwait | 42.50 | % | 42.50 | % | 42.50 | % |
| The Kuwait Olefins Company K.S.C.C. | Kuwait | 42.50 | % | 42.50 | % | 42.50 | % |
| The Kuwait Styrene Company K.S.C.C. | Kuwait | 42.50 | % | 42.50 | % | 42.50 | % |
Map Ta Phut Olefins Company Limited 1 | Thailand | 32.77 | % | 32.77 | % | 32.77 | % |
| | | | |
| Sadara Chemical Company | Saudi Arabia | 35.00 | % | 35.00 | % | 35.00 | % |
| The SCGC-Dow Group: | | | | |
| Siam Polyethylene Company Limited | Thailand | 50.00 | % | 50.00 | % | 50.00 | % |
| Siam Polystyrene Company Limited | Thailand | 50.00 | % | 50.00 | % | 50.00 | % |
| Siam Styrene Monomer Company Limited | Thailand | 50.00 | % | 50.00 | % | 50.00 | % |
| Siam Synthetic Latex Company Limited | Thailand | 50.00 | % | 50.00 | % | 50.00 | % |
| | | | |
1.The Company's effective ownership of Map Ta Phut Olefins Company Limited ("Map Ta Phut") is 32.77 percent, of which the Company directly owns 20.27 percent and indirectly owns 12.50 percent through its equity interest in Siam Polyethylene Company Limited.
The Company’s investment in and equity earnings from its principal nonconsolidated affiliates are as follows:
| | | | | | | | |
| Investment in Principal Nonconsolidated Affiliates at Dec 31 | 2024 | 2023 |
| In millions |
| Investment in principal nonconsolidated affiliates | $ | 740 | | $ | 754 | |
| Other noncurrent obligations | (568) | | (229) | |
| Net investment in principal nonconsolidated affiliates | $ | 172 | | $ | 525 | |
| | | | | | | | | | | |
| Equity in Earnings (Losses) of Principal Nonconsolidated Affiliates | 2024 | 2023 | 2022 |
| In millions |
| Equity in earnings (losses) of principal nonconsolidated affiliates | $ | (57) | | $ | (192) | | $ | 192 | |
The summarized financial information that follows represents the combined accounts (at 100 percent) of the principal nonconsolidated affiliates.
| | | | | | | | |
| Summarized Balance Sheet Information at Dec 31 | 2024 | 2023 |
| In millions |
| Current assets | $ | 5,414 | | $ | 4,904 | |
| Noncurrent assets | 20,695 | | 21,832 | |
| Total assets | $ | 26,109 | | $ | 26,736 | |
| Current liabilities | $ | 3,842 | | $ | 3,490 | |
| Noncurrent liabilities | 19,158 | | 18,794 | |
| Total liabilities | $ | 23,000 | | $ | 22,284 | |
| Noncontrolling interests | $ | 136 | | $ | 157 | |
| | | | | | | | | | | |
Summarized Income Statement Information 1 | 2024 | 2023 | 2022 |
| In millions |
| Sales | $ | 12,094 | | $ | 11,102 | | $ | 14,026 | |
| Gross profit | $ | 598 | | $ | 289 | | $ | 1,246 | |
| Income (loss), net of tax | $ | (748) | | $ | (1,053) | | $ | (91) | |
1.The results in this table include purchase and sale activity between certain principal nonconsolidated affiliates and the Company, as previously discussed in the "Transactions with Nonconsolidated Affiliates" section.
NOTE 12 – GOODWILL AND OTHER INTANGIBLE ASSETS
The following table shows changes in the carrying amounts of goodwill by reportable segment for the years ended December 31, 2024 and 2023:
| | | | | | | | | | | | | | |
| Goodwill | Packaging & Specialty Plastics | Industrial Intermediates & Infrastructure | Performance Materials & Coatings | Total |
| In millions |
| Balance at Jan 1, 2023 | $ | 5,100 | | $ | 1,093 | | $ | 2,451 | | $ | 8,644 | |
| Foreign currency impact | 3 | | 1 | | (7) | | (3) | |
| | | | |
| | | | |
| Balance at Dec 31, 2023 | $ | 5,103 | | $ | 1,094 | | $ | 2,444 | | $ | 8,641 | |
| Foreign currency impact | (6) | | (2) | | (89) | | (97) | |
| Purchase of Circulus Holdings, LLC | 37 | | — | | — | | 37 | |
| Sale of laminating adhesives business | (16) | | — | | — | | (16) | |
| Balance at Dec 31, 2024 | $ | 5,118 | | $ | 1,092 | | $ | 2,355 | | $ | 8,565 | |
The Company has six reporting units in total: Coatings & Performance Monomers, Consumer Solutions, Hydrocarbons & Energy, Industrial Solutions, Packaging and Specialty Plastics and Polyurethanes & Construction
Chemicals. At December 31, 2024, goodwill was carried by all reporting units except Coatings & Performance Monomers.
Goodwill Impairments
The carrying amounts of goodwill at December 31, 2024 and 2023, were net of accumulated impairments of $309 million in Industrial Intermediates & Infrastructure and $2,530 million in Performance Materials & Coatings.
Goodwill Impairment Testing
The Company performs an impairment test of goodwill annually in the fourth quarter. In 2024, the Company performed qualitative assessments for all reporting units that carried goodwill. Based on the results of the qualitative testing, the Company performed quantitative testing for one reporting unit in 2024 (zero in 2023 and 2022). The qualitative assessments on the remaining reporting units indicated that it was more likely than not that carrying value was less than the fair value for the reporting units. The quantitative testing conducted in 2024 concluded that no goodwill impairment existed.
Other Intangible Assets
The following table provides information regarding the Company’s other intangible assets:
| | | | | | | | | | | | | | | | | | | | |
| Other Intangible Assets at Dec 31 | 2024 | 2023 |
| In millions | Gross
Carrying
Amount | Accum Amort | Net | Gross
Carrying
Amount | Accum Amort | Net |
| Intangible assets: | | | | | | |
| Developed technology | $ | 2,541 | | $ | (2,214) | | $ | 327 | | $ | 2,634 | | $ | (2,181) | | $ | 453 | |
| Software | 1,354 | | (1,007) | | 347 | | 1,352 | | (981) | | 371 | |
| Trademarks/tradenames | 324 | | (318) | | 6 | | 352 | | (346) | | 6 | |
| Customer-related | 2,896 | | (1,855) | | 1,041 | | 3,108 | | (1,866) | | 1,242 | |
| | | | | | |
| Total other intangible assets | $ | 7,115 | | $ | (5,394) | | $ | 1,721 | | $ | 7,446 | | $ | (5,374) | | $ | 2,072 | |
The following table provides information regarding amortization expense related to intangible assets:
| | | | | | | | | | | |
| Amortization Expense | 2024 | 2023 | 2022 |
| In millions |
| Other intangible assets, excluding software | $ | 310 | | $ | 324 | | $ | 336 | |
| Software, included in "Cost of sales" | $ | 67 | | $ | 70 | | $ | 80 | |
Total estimated amortization expense for the next five fiscal years, including amounts expected to be capitalized, is as follows:
| | | | | |
| Estimated Amortization Expense for Next Five Years |
| In millions |
| 2025 | $ | 294 | |
| 2026 | $ | 222 | |
| 2027 | $ | 187 | |
| 2028 | $ | 166 | |
| 2029 | $ | 155 | |
NOTE 13 – TRANSFERS OF FINANCIAL ASSETS
Accounts Receivable Programs
The Company maintains accounts receivable facilities with various financial institutions, with committed and uncommitted facilities in the United States and a committed facility in Europe (collectively, "the Programs"), which are set to expire in November 2025. Under the terms of the Programs, the Company may sell certain eligible trade accounts receivable at any point in time, up to $900 million for the U.S. committed facility and up to €500 million for the Europe committed facility. Under the terms of the Programs, the Company continues to service the receivables from the customer, but retains no interest in the receivables, and remits payment to the financial institutions. Losses on transfers of receivables were insignificant for the years ended December 31, 2024, 2023 and 2022. The Company also provides a guarantee to the financial institutions for the creditworthiness and collection of the receivables in satisfaction of the facility. See Note 15 for additional information related to guarantees.
Beginning in 2023, the Company has access to accounts receivable discounting facilities that cover certain receivables generated from sales in EMEAI, Asia Pacific and Canada (collectively, the "Facilities"). Under the terms of the Facilities, the Company retains no interest in the transferred receivables once sold and receivables are transferred with limited recourse. The Company continues to service the receivables from the customer and remits payment to the Facilities. Losses on transfers of receivables were insignificant for the years ended December 31, 2024 and 2023.
The following table provides a summary of cash flows related to the Programs and the Facilities for the years ended December 31, 2024, 2023 and 2022:
| | | | | | | | | | | |
| Cash Flows Related to Transfers of Accounts Receivable | | | |
| In millions | 2024 | 2023 | 2022 |
| Proceeds received from new transfers | $ | 1,533 | | $ | 203 | | $ | 391 | |
| | | |
| | | |
The following table provides the balances related to the Programs and the Facilities at December 31, 2024 and 2023:
| | | | | | | | |
| Balances Related to Transfers of Accounts Receivable at Dec 31 | | |
| In millions | 2024 | 2023 |
| Balance outstanding | $ | 287 | $ | 170 |
| Accounts receivable derecognized | $ | 278 | $ | 152 |
| Amounts recognized in the consolidated balance sheets: | | |
| | |
Accrued and other current liabilities 1 | $ | 9 | $ | 18 |
1. Represents amounts collected from customers and not yet remitted by the Company.
NOTE 14 – NOTES PAYABLE, LONG-TERM DEBT AND AVAILABLE CREDIT FACILITIES
| | | | | | | | |
| Notes Payable at Dec 31 | | |
| In millions | 2024 | 2023 |
| | |
| Notes payable to banks and other lenders | $ | 135 | | $ | 62 | |
| | |
| | |
| | |
| Year-end average interest rates | 36.03 | % | 33.84 | % |
| | | | | | | | | | | | | | |
| Long-Term Debt at Dec 31 | 2024 Average Rate | 2024 | 2023
Average
Rate | 2023 |
| In millions |
| Promissory notes and debentures: | | | | |
| | | | |
| Final maturity 2025 | 5.63 | % | $ | 333 | | 5.63 | % | $ | 333 | |
| Final maturity 2028 | 4.80 | % | 600 | | 4.80 | % | 600 | |
| Final maturity 2029 | 7.58 | % | 1,368 | | 7.58 | % | 1,367 | |
Final maturity 2030 and thereafter 1 | 5.10 | % | 10,010 | | 5.07 | % | 8,861 | |
| Other facilities: | | | | |
| | | | |
| Foreign currency notes and loans, various rates and maturities | 2.01 | % | 2,540 | | 1.18 | % | 2,653 | |
InterNotes®, varying maturities through 2053 | 4.31 | % | 661 | | 4.12 | % | 595 | |
| Medium-term notes, maturity 2025 | 4.75 | % | 1 | | — | % | — | |
| | | | |
Finance lease obligations 2 | | 939 | | | 873 | |
| Unamortized debt discount and issuance costs | | (244) | | | (258) | |
Long-term debt due within one year 3 | | (497) | | | (117) | |
| Long-term debt | | $ | 15,711 | | | $ | 14,907 | |
1.Cost includes net fair value hedge adjustment gains of $9 million at December 31, 2024 ($49 million at December 31, 2023). See Note 21 for additional information.
2.See Note 16 for additional information.
3.Presented net of current portion of unamortized debt issuance costs.
| | | | | |
| Maturities of Long-Term Debt for Next Five Years at Dec 31, 2024 |
| In millions |
| 2025 | $ | 495 | |
| 2026 | $ | 140 | |
| 2027 | $ | 1,244 | |
| 2028 | $ | 697 | |
| 2029 | $ | 1,459 | |
2024 Activity
In the first quarter of 2024, the Company issued $1.25 billion of senior unsecured notes. This offering included $600 million aggregate principal amount of 5.150 percent notes due 2034 and $650 million aggregate principal amount of 5.600 percent notes due 2054. The issuance was completed in connection with the Company's Green Finance Framework. The Company distributed the proceeds toward projects that support the execution of its sustainability strategy and achieve its targets focused on climate protection and a circular economy, including applicable expenditures and investments related to the Company's Fort Saskatchewan Path2Zero project.
In the second quarter of 2024, the Company redeemed $10 million aggregate principal amount of 2.100 percent notes due November 2030, $30 million aggregate principal amount of 4.250 percent notes due October 2034, $8 million aggregate principal amount of 5.250 percent notes due November 2041 and $12 million aggregate principal amount of 4.375 percent notes due November 2042. As a result of the redemption, the Company recognized a pretax gain on the early extinguishment of debt of $5 million, included in "Sundry income (expense) - net" in the consolidated statements of income and related to Corporate.
In 2024, the Company issued an aggregate principal amount of $94 million of InterNotes®. The Company also issued $122 million of foreign currency loans. Additionally, the Company repaid $83 million of long-term debt at maturity.
2023 Activity
In the fourth quarter of 2023, the Company redeemed $23 million aggregate principal amount of 2.100 percent notes due November 2030, $14 million aggregate principal amount of 4.625 percent notes due October 2044, and $1 million aggregate principal amount of 4.375 percent notes due November 2042. As a result of the redemption, the Company recognized a pretax gain on the early extinguishment of debt of $5 million, included in "Sundry income (expense) - net" in the consolidated statements of income and related to Corporate.
In 2023, the Company issued an aggregate principal amount of $80 million of InterNotes®. Additionally, the Company repaid $250 million of long-term debt at maturity and approximately $3 million of long-term debt was repaid by consolidated variable interest entities.
2022 Activity
In the second quarter of 2022, the Company redeemed $750 million aggregate principal amount of 3.625 percent notes due May 2026. As a result of the redemption, the Company recognized a pretax loss on the early extinguishment of debt of $8 million, included in "Sundry income (expense) - net" in the consolidated statements of income and related to Corporate.
In the fourth quarter of 2022, the Company issued $1.5 billion of senior unsecured notes. The offering included $600 million aggregate principal amount of 6.30 percent notes due 2033 and $900 million aggregate principal amount of 6.90 percent notes due 2053.
In 2022, the Company issued an aggregate principal amount of $167 million of InterNotes®. Additionally, the Company repaid $121 million of long-term debt at maturity and approximately $3 million of long-term debt was repaid by consolidated variable interest entities.
Available Credit Facilities
The following table summarizes the Company's credit facilities:
| | | | | | | | | | | | | | | |
| Committed and Available Credit Facilities at Dec 31, 2024 |
| In millions | | Committed Credit | Credit Available | Maturity Date | Interest |
| Five Year Competitive Advance and Revolving Credit Facility | | $ | 5,000 | | $ | 5,000 | | November 2028 | Floating rate |
| Bilateral Revolving Credit Facility | | 100 | | 100 | | March 2025 | Floating rate |
| Bilateral Revolving Credit Facility | | 100 | | 100 | | March 2025 | Floating rate |
| Bilateral Revolving Credit Facility | | 200 | | 200 | | September 2025 | Floating rate |
| Bilateral Revolving Credit Facility | | 175 | | 175 | | September 2025 | Floating rate |
| Bilateral Revolving Credit Facility | | 300 | | 300 | | November 2025 | Floating rate |
| Bilateral Revolving Credit Facility | | 300 | | 300 | | February 2026 | Floating rate |
| Bilateral Revolving Credit Facility | | 100 | | 100 | | March 2026 | Floating rate |
| Bilateral Revolving Credit Facility | | 375 | | 375 | | October 2026 | Floating rate |
| Bilateral Revolving Credit Facility | | 150 | | 150 | | November 2026 | Floating rate |
| Bilateral Revolving Credit Facility | | 200 | | 200 | | November 2026 | Floating rate |
| Bilateral Revolving Credit Facility | | 250 | | 250 | | March 2027 | Floating rate |
| Bilateral Revolving Credit Facility | | 100 | | 100 | | May 2027 | Floating rate |
| Bilateral Revolving Credit Facility | | 350 | | 350 | | June 2027 | Floating rate |
| Bilateral Revolving Credit Facility | | 200 | | 200 | | September 2027 | Floating rate |
| Bilateral Revolving Credit Facility | | 100 | | 100 | | October 2027 | Floating rate |
| Bilateral Revolving Credit Facility | | 100 | | 100 | | November 2027 | Floating rate |
| Bilateral Revolving Credit Facility | | 300 | | 300 | | May 2028 | Floating rate |
| Total Committed and Available Credit Facilities | | $ | 8,400 | | $ | 8,400 | | | |
Letters of Credit
The Company utilizes letters of credit to support commitments made in the ordinary course of business. While the terms and amounts of letters of credit change, the Company generally has approximately $600 million of outstanding letters of credit at any given time.
Debt Covenants and Default Provisions
TDCC’s outstanding long-term debt has been issued primarily under indentures which contain, among other provisions, certain customary restrictive covenants with which TDCC must comply while the underlying notes are outstanding. Failure of TDCC to comply with any of its covenants, could result in a default under the applicable indenture and allow the note holders to accelerate the due date of the outstanding principal and accrued interest on the underlying notes.
TDCC's indenture covenants include obligations to not allow liens on principal U.S. manufacturing facilities, enter into sale and lease-back transactions with respect to principal U.S. manufacturing facilities, merge or consolidate with any other corporation, or sell, lease or convey, directly or indirectly, all or substantially all of TDCC’s assets. The outstanding debt also contains customary default provisions. TDCC remains in compliance with these covenants.
TDCC’s primary, private credit agreements also contain certain customary restrictive covenant and default provisions in addition to the covenants set forth above with respect to TDCC’s debt. Significant other restrictive covenants and default provisions related to these agreements include:
(a)the obligation to maintain the ratio of TDCC’s consolidated indebtedness to consolidated capitalization at no greater than 0.70 to 1.00 at any time the aggregate outstanding amount of loans under the Five Year Competitive Advance and Revolving Credit Facility Agreement ("Revolving Credit Agreement") dated November 23, 2021, equals or exceeds $500 million,
(b)a default if TDCC or an applicable subsidiary fails to make any payment, including principal, premium or interest, under the applicable agreement on other indebtedness of, or guaranteed by, TDCC or such applicable subsidiary in an aggregate amount of $100 million or more when due, or any other default or other event under the applicable agreement with respect to such indebtedness occurs which permits or results in the acceleration of $400 million or more in the aggregate of principal, and
(c)a default if TDCC or any applicable subsidiary fails to discharge or stay within 60 days after the entry of a final judgment against TDCC or such applicable subsidiary of more than $400 million.
Failure of TDCC to comply with any of the covenants or default provisions could result in a default under the applicable credit agreement which would allow the lenders to not fund future loan requests and to accelerate the due date of the outstanding principal and accrued interest on any outstanding indebtedness.
Dow Inc. is obligated, substantially concurrently with the issuance of any guarantee in respect of outstanding or committed indebtedness under TDCC's Revolving Credit Agreement, to enter into a supplemental indenture with TDCC and the trustee under TDCC’s existing 2008 base indenture governing certain notes issued by TDCC. Under such supplemental indenture, Dow Inc. will guarantee all outstanding debt securities and all amounts due under such existing base indenture and will become subject to certain covenants and events of default under the existing base indenture.
In addition, the Revolving Credit Agreement includes an event of default which would be triggered in the event Dow Inc. incurs or guarantees third party indebtedness for borrowed money in excess of $250 million or engages in any material activity or directly owns any material assets, in each case, subject to certain conditions and exceptions. Dow Inc. may, at its option, cure the event of default by delivering an unconditional and irrevocable guarantee to the administrative agent within thirty days of the event or events giving rise to such event of default.
No such events have occurred or have been triggered at the time of the filing of this Annual Report on Form 10-K.
NOTE 15 – COMMITMENTS AND CONTINGENCIES
Environmental Matters
Introduction
Accruals for environmental matters are recorded when it is probable that a liability has been incurred and the amount of the liability can be reasonably estimated based on current law and existing technologies. At December 31, 2024, the Company had accrued obligations of $1,113 million for probable environmental remediation and restoration costs ($1,180 million at December 31, 2023), including $234 million for the remediation of Superfund sites ($241 million at December 31, 2023). This is management’s best estimate of the costs for remediation and restoration with respect to environmental matters for which the Company has accrued liabilities, although it is reasonably possible that the ultimate cost with respect to these particular matters could range up to approximately two times that amount. Consequently, it is reasonably possible that environmental remediation and restoration costs in excess of amounts accrued could have a material impact on the Company’s results of operations, financial condition and cash flows. It is the opinion of the Company’s management, however, that the possibility is remote that costs in excess of the range disclosed will have a material impact on the Company’s results of operations, financial condition or cash flows. Inherent uncertainties exist in these estimates primarily due to unknown conditions, changing governmental regulations and legal standards regarding liability, and emerging remediation technologies for handling site remediation and restoration. As new or additional information becomes available and/or certain spending trends become known, management will evaluate such information in determination of the current estimate of the environmental liability.
The following table summarizes the activity in the Company's accrued obligations for environmental matters for the years ended December 31, 2024 and 2023:
| | | | | | | | |
| Accrued Obligations for Environmental Matters | 2024 | 2023 |
| In millions |
| Balance at Jan 1 | $ | 1,180 | | $ | 1,192 | |
| Accrual adjustment | 216 | | 211 | |
| Payments against reserve | (259) | | (229) | |
| Foreign currency impact | (24) | | 6 | |
| Balance at Dec 31 | $ | 1,113 | | $ | 1,180 | |
The amounts charged to income on a pretax basis related to environmental remediation totaled $197 million in 2024, $203 million in 2023 and $176 million in 2022. Capital expenditures for environmental protection were $208 million in 2024, $228 million in 2023 and $137 million in 2022.
Midland Off-Site Environmental Matters
On June 12, 2003, the Michigan Department of Environmental Quality ("MDEQ") issued a Hazardous Waste Operating License (the "License") to the Company’s Midland, Michigan, manufacturing site (the “Midland Site”), which was renewed and replaced by the MDEQ on September 25, 2015, and included provisions requiring the Company to conduct an investigation to determine the nature and extent of off-site contamination in the City of Midland soils, the Tittabawassee River and Saginaw River sediment and floodplain soils, and the Saginaw Bay, and, if necessary, undertake remedial action. In 2016, final regulatory approval was received from the MDEQ for the City of Midland and the Company is continuing the long-term monitoring requirements of the Remedial Action Plan.
Tittabawassee and Saginaw Rivers, Saginaw Bay
The Company, the U.S. Environmental Protection Agency (“EPA”) and the State of Michigan ("State") entered into an administrative order on consent (“AOC”), effective January 21, 2010, that requires the Company to conduct a remedial investigation, a feasibility study and a remedial design for the Tittabawassee River, the Saginaw River and the Saginaw Bay, and pay the oversight costs of the EPA and the State under the authority of the Comprehensive Environmental Response, Compensation, and Liability Act. These actions, to be conducted under the lead oversight of the EPA, will build upon the investigative work completed under the State Resource Conservation Recovery Act program from 2005 through 2009.
The Tittabawassee River, beginning at the Midland Site and extending down to the first six miles of the Saginaw River, are designated as the first Operable Unit for purposes of conducting the remedial investigation, feasibility study and remedial design work. This work will be performed in a largely upriver to downriver sequence for eight geographic segments of the Tittabawassee and upper Saginaw Rivers. In the first quarter of 2012, the EPA
requested the Company address the Tittabawassee River floodplain ("Floodplain") as an additional segment. In January 2015, the Company and the EPA entered into an order to address remediation of the Floodplain. The remedial work is expected to continue as river levels allow. The remainder of the Saginaw River and the Saginaw Bay are designated as a second Operable Unit and the work associated with that unit may also be geographically segmented. The AOC does not obligate the Company to perform removal or remedial action; that action can only be required by a separate order. The Company and the EPA have been negotiating orders separate from the AOC that obligate the Company to perform remedial actions under the scope of work of the AOC. The Company and the EPA have entered into six separate orders to perform limited remedial actions in seven of the eight geographic segments in the first Operable Unit, including the Floodplain. Dow has received from the EPA a Notice of Completion of Work for three of these six orders and the Company continues the long-term monitoring requirements. In 2024, Dow continued its evaluation of the final geographic segment of the first Operable Unit and completed the implementation of the remedial actions for the three open orders for other areas in the first Operable Unit.
Alternative Dispute Resolution Process
The Company, the EPA, the U.S. Department of Justice and the natural resource damage trustees (which include the Michigan Office of the Attorney General, the Michigan Department of Environment, Great Lakes and Energy, the Michigan Department of Natural Resources, the U.S. Fish and Wildlife Service, the U.S. Bureau of Indian Affairs and the Saginaw-Chippewa Indian Tribe of Michigan) have been engaged in negotiations to seek to resolve potential governmental claims against the Company for natural resource damages related to historical off-site contamination associated with the City of Midland, the Tittabawassee and Saginaw Rivers and the Saginaw Bay. The Company and the governmental parties started meeting in the fall of 2005 and entered into a Confidentiality Agreement in December 2005.
On July 20, 2020, the U.S. District Court for the Eastern District of Michigan ("District Court") entered a final consent decree in Civil Action No. 1:19-cv-13292 between the Company and federal, state and tribal trustees to resolve allegations of natural resource damages arising from the historic operations of the Company’s Midland Site. The consent decree required the Company to pay a $15 million cash settlement to be used for long-term maintenance and trustee-selected remediation projects with an additional $7 million to specified local projects managed by third parties. These funds were paid in December 2020. The consent decree further requires the Company to complete or fund 13 additional environmental restoration projects which are valued by the trustees at approximately $77 million, to be conducted over the next several years. To date, five of the eight Dow-led projects have been completed, including four environmental restoration projects/public amenities opened to the public. The Company continues to work with the trustees on the remaining projects.
At December 31, 2024, the accrual for these off-site matters was $80 million (included in the total accrued obligation of $1,113 million). At December 31, 2023, the Company had an accrual for these off-site matters of $89 million (included in the total accrued obligation of $1,180 million).
Environmental Matters Summary
It is the opinion of the Company’s management that the possibility is remote that costs in excess of those disclosed will have a material impact on the Company’s results of operations, financial condition or cash flows.
Litigation
Asbestos-Related Matters of Union Carbide Corporation
Introduction
Union Carbide is and has been involved in a large number of asbestos-related suits filed primarily in state courts during the past several decades. These suits principally allege personal injury resulting from exposure to asbestos-containing products and frequently seek both actual and punitive damages. The alleged claims primarily relate to products that Union Carbide sold in the past, alleged exposure to asbestos-containing products located on Union Carbide’s premises and Union Carbide’s responsibility for asbestos suits filed against a former Union Carbide subsidiary, Amchem Products, Inc. ("Amchem"). In many cases, plaintiffs are unable to demonstrate that they have suffered any compensable loss as a result of such exposure, or that injuries incurred in fact resulted from exposure to Union Carbide’s products. Union Carbide expects more asbestos-related suits to be filed against Union Carbide and Amchem in the future, and will aggressively defend or reasonably resolve, as appropriate, both pending and future claims.
Estimating the Asbestos-Related Liability
Union Carbide has engaged Ankura Consulting Group, LLC ("Ankura") to perform periodic studies to estimate the undiscounted cost of disposing of pending and future claims against Union Carbide and Amchem through the terminal year of 2049, including a reasonable forecast of future defense and processing costs. Each October, Union Carbide requests Ankura to review its historical asbestos claim and resolution activity through the third quarter of the current year, including asbestos-related defense and processing costs, to determine the appropriateness of updating the most recent study. At each balance sheet date, Union Carbide also compares current asbestos claim and resolution activity, including asbestos-related defense and processing costs, to the results of the most recent Ankura study to determine whether the accrual continues to be appropriate.
In December 2022, Ankura completed a study of Union Carbide's historical asbestos claim and resolution activity through September 30, 2022, including asbestos-related defense and processing costs, and provided estimates for the undiscounted cost of disposing of pending and future claims against Union Carbide and Amchem through the terminal year of 2049. Based on the study and Union Carbide's internal review process, it was determined that no adjustment to the accrual was required.
In December 2023, Ankura stated that an update of its December 2022 study would not provide a more likely estimate of future events than the estimate reflected in that study and, therefore, the estimate in that study remained applicable. Based on Union Carbide's internal review process and Ankura's response, Union Carbide determined that no adjustment to the accrual was required. At December 31, 2023, the asbestos-related liability for pending and future claims against Union Carbide and Amchem, including future asbestos-related defense and processing costs, was $867 million, and approximately 25 percent of the recorded liability related to pending claims and approximately 75 percent related to future claims.
In December 2024, Ankura completed a study of Union Carbide's historical asbestos claim and resolution activity through September 30, 2024, including asbestos-related defense and processing costs, and provided estimates for the undiscounted cost of disposing of pending and future claims against Union Carbide and Amchem through the terminal year of 2049. Based on the study and Union Carbide's internal review process, it was determined that no adjustment to the accrual was required. At December 31, 2024, the asbestos-related liability for pending and future claims against Union Carbide and Amchem, including future asbestos-related defense and processing costs, was $791 million, and approximately 23 percent of the recorded liability related to pending claims and approximately 77 percent related to future claims.
Summary
The Company's management believes the amounts recorded by Union Carbide for the asbestos-related liability, including defense and processing costs, reflect reasonable and probable estimates of the liability based upon current, known facts. However, future events, such as the number of new claims to be filed and/or received each year, the average cost of defending and disposing of each such claim, as well as the numerous uncertainties surrounding asbestos litigation in the United States over a significant period of time, could cause the actual costs for Union Carbide to be higher or lower than those projected or those recorded. Any such events could result in an increase or decrease in the recorded liability.
Because of the uncertainties described above, Union Carbide cannot estimate the full range of the cost of resolving pending and future asbestos-related claims facing Union Carbide and Amchem. As a result, it is reasonably possible that an additional cost of disposing of Union Carbide's asbestos-related claims, including future defense and processing costs, could have a material impact on the Company's results of operations and cash flows for a particular period and on the consolidated financial position.
Legacy Matters
The Company is the subject of various complaints related to alleged groundwater contamination based on decades-old sales and applications of certain agricultural chemical products ("Groundwater Matters"). The costs associated with these Groundwater Matters were previously covered by insurance policies that have since been depleted. In the first quarter of 2023, the Company completed a study of the Groundwater Matters now deemed to be probable and estimable based on the public reporting of sampling data and historical information to develop a reasonable estimate of the cost of pending and future claims. As a result, the Company recorded a pretax charge of $177 million, included in "Cost of sales" in the consolidated statements of income and related to Industrial Intermediates & Infrastructure. At December 31, 2024, the total liability related to such alleged Groundwater Matters settlements was $155 million ($232 million at December 31, 2023), which was included in “Accrued and other current liabilities” and "Other noncurrent obligations" in the consolidated balance sheets.
The Company is also the subject of other groundwater contamination complaints, including claims related to 1,4-dioxane. The Company continues to defend itself in this litigation and it has determined that the Company's exposure to liability, if any, is not currently probable or estimable at December 31, 2024.
Separately, on October 10, 2024, the Company executed a settlement agreement related to arbitration for historical product claims from a divested business. As a result, the Company recorded a pretax charge of $75 million in the third quarter of 2024, which is included in "Cost of sales" in the consolidated statements of income, related to Corporate, and was paid in the fourth quarter of 2024. This is management's best estimate of loss, although the amount is subject to further arbitration and it is reasonably possible that the total loss could range up to approximately three times that amount.
Other Litigation Matters
In addition to the specific matters described above, the Company is party to a number of other claims and lawsuits arising out of the normal course of business with respect to product liability, patent infringement, employment matters, governmental tax and regulation disputes, contract and commercial litigation, and other actions. Certain of these actions purport to be class actions and seek damages in very large amounts. All such claims are being contested. The Company has an active risk management program consisting of numerous insurance policies secured from many carriers at various times. These policies may provide coverage that could be utilized to minimize the financial impact, if any, of certain contingencies described above. It is the opinion of the Company’s management that the possibility is remote that the aggregate of all such other claims and lawsuits will have a material adverse impact on the results of operations, financial condition and cash flows of the Company.
Indemnifications with Corning Incorporated ("Corning")
In connection with the June 1, 2016, ownership restructure of Dow Silicones, the Company is indemnified by Corning for at least 50 percent of future losses associated with certain pre-closing liabilities, subject to certain conditions and limits. The maximum amount of indemnified losses which may be recovered are subject to a cap that declines over time. Indemnified losses are capped at $1 billion between May 31, 2018 and May 31, 2023, and no recoveries are permitted on claims initially submitted after May 31, 2023. The Company had indemnification assets of $43 million at December 31, 2024 ($100 million at December 31, 2023), which was included in "Other current assets" and "Noncurrent receivables" in the consolidated balance sheets.
Gain Contingency - Dow v. Nova Chemicals Corporation Patent Infringement Matter
In December 2010, Dow filed suit in the Federal Court in Ontario, Canada ("Federal Court") alleging that Nova Chemicals Corporation ("Nova") was infringing the Company's Canadian polyethylene patent 2,106,705 (the "'705 Patent"). Nova counterclaimed on the grounds of invalidity and non-infringement. In accordance with Canadian practice, the suit was bifurcated into a merits phase, followed by a damages phase. Following trial in the merits phase, in May 2014, the Federal Court ruled that the Company's '705 Patent was valid and infringed by Nova. Nova appealed to the Canadian Federal Court of Appeal, which affirmed the Federal Court decision in August 2016. Nova then sought leave to appeal its loss to the Supreme Court of Canada ("Canadian Supreme Court"), which dismissed Nova’s petition in April 2017. As a result, Nova exhausted all appeal rights on the merits, and it was undisputed that Nova owed the Company the profits it earned from its infringing sales as determined in the trial for the damages phase.
In April 2017, the Federal Court issued a Public Judgment in the damages phase, which detailed its conclusions on how to calculate the profits to be awarded to the Company. In June 2017, the Federal Court ordered Nova to pay $645 million Canadian dollars to the Company, plus pre- and post-judgment interest, for which the Company received payment equivalent to $501 million U.S. dollars in July 2017. Although Nova was appealing portions of the damages judgment, certain portions of it were indisputable and could be retained by the Company regardless of the outcome of any further appeals by Nova. As a result of these actions and in accordance with ASC Topic 450-30 "Gain Contingencies," the Company recorded a $160 million pretax gain in the second quarter of 2017.
On September 15, 2020, the Canadian Federal Court of Appeal dismissed Nova's appeal of the damages judgment, thus affirming the trial court's decision in its entirety. In November 2020, Nova filed an application for leave to appeal this decision to the Canadian Supreme Court. In November 2022, the Canadian Supreme Court dismissed Nova's appeal, thereby exhausting all of Nova's appeal rights for the damages judgment. As a result, the Company recorded a pretax gain of $341 million in the fourth quarter of 2022 for the previously disputed portion of the damages judgment, of which $321 million was included in "Sundry income (expense) - net," related to Packaging & Specialty Plastics, and $20 million was included in "Selling, general and administrative expenses" in the consolidated statements of income.
Gain Contingency - Dow v. Nova Chemicals Corporation Ethylene Asset Matter
On September 18, 2019, the Court of the King's Bench in Alberta, Canada, signed a judgment ordering Nova to pay the Company $1.43 billion Canadian dollars (equivalent to approximately $1.08 billion U.S. dollars) by October 11, 2019, for damages the Company incurred through 2012 related to the companies’ jointly-owned ethylene asset in Joffre, Alberta, Canada, which has been received by the Company. The Court of the King's Bench in Alberta, Canada, which initially ruled in June 2018, found that Nova failed to operate the ethylene asset at full capacity for more than ten years, and furthermore, that Nova violated several contractual agreements related to the Company receiving its share of the asset’s ethylene production. These actions deprived the Company of millions of pounds of ethylene. Nova appealed the judgment; however, certain portions were no longer in dispute and would be retained by the Company regardless of the outcome of any further appeals by Nova. As a result and in accordance with ASC Topic 450-30 “Gain Contingencies,” the Company recorded a $186 million pretax gain in 2019. In 2020 and 2023, further actions by Nova and/or related court decisions upholding the majority of Dow's damages made additional portions of the ruling in Dow's favor final and no longer subject to dispute. As a result, the Company recorded additional pretax gains of $570 million in 2020 and $122 million in 2023. In 2023, $106 million of the pretax gain was included in "Sundry income (expense) - net," related to Packaging & Specialty Plastics, and $16 million was included in "Selling, general and administrative expenses" in the consolidated statements of income.
At December 31, 2024, $201 million ($201 million at December 31, 2023) was included in "Other noncurrent obligations" in the Company's consolidated balance sheets related to the disputed portion of the damages judgment. Dow continues to seek an award of additional damages for the period from 2013 through 2018 to account for the ethylene shortfall during those years. The damages hearing that began in the trial court in November 2021 to resolve the impact of the appellate ruling and quantify Dow's damages for the 2013-2018 period has concluded; the parties are awaiting the court's ruling. Dow has also filed another lawsuit in the same Alberta, Canada court to account for damages due to lost ethylene after June 2018.
Brazilian Tax Credits
In March 2017, the Federal Supreme Court of Brazil (“Brazil Supreme Court”) ruled in a leading case that a Brazilian value-added tax ("ICMS") should not be included in the base used to calculate a taxpayer's federal contribution on total revenue known as PIS/COFINS (the “2017 Decision”). Previously, three of the Company’s Brazilian subsidiaries filed lawsuits challenging the inclusion of ICMS in their calculation of PIS/COFINS, seeking recovery of excess taxes paid. In response to the 2017 Decision, the Brazilian tax authority filed an appeal seeking clarification of the amount of ICMS tax to exclude from the calculation of PIS/COFINS. In May 2021, the Brazil Supreme Court ruled in a leading case related to the amount of ICMS tax to exclude from the calculation of PIS/COFINS, which resolved two of the lawsuits filed by the Company. In May 2022, a court decision related to the remaining lawsuit, ruling in favor of the Company's Brazilian subsidiary, became final and unappealable and the Company recorded pretax gains of $112 million for certain excess PIS/COFINS paid, plus applicable interest, which the Company expects to apply to future required federal tax payments, and the reversal of related liabilities. The pretax gains were recorded in “Cost of sales” in the consolidated statements of income. At December 31, 2024, related tax credits available and expected to be applied to future required federal tax payments totaled $63 million ($114 million at December 31, 2023).
Purchase Commitments
In the third quarter of 2024, the Company entered into a commitment for the use of a reservoir asset that will be used to supply water to one of Dow’s main U.S. Gulf Coast manufacturing locations. The related contract became effective in the fourth quarter of 2024, with a 35 year contract period expected to commence in 2028 upon completion of construction. The aggregate value of the fixed and determinable portion over the expected contract period is $1.3 billion (approximately $650 million on a present value basis) at December 31, 2024.
Guarantees
The following table provides a summary of the final expiration, maximum future payments and recorded liability reflected in the consolidated balance sheets for guarantees:
| | | | | | | | | | | | | | | | | | | | |
| Guarantees | Dec 31, 2024 | Dec 31, 2023 |
| In millions | Final
Expiration | Maximum Future Payments 1 | Recorded Liability | Final
Expiration | Maximum Future Payments 1 | Recorded Liability |
| Guarantees | 2038 | $ | 1,456 | | $ | 155 | | 2038 | $ | 1,385 | | $ | 196 | |
| | | | | | |
1.In addition, TDCC has provided guarantees, in proportion to the Company's 35 percent ownership interest, of all future interest payments that will become due on Sadara’s project financing debt during the grace period, which Dow's share is estimated to be $158 million at December 31, 2024 ($298 million at December 31, 2023). The Company does not expect to be required to perform under the guarantees.
Guarantees arise during the ordinary course of business from relationships with customers, committed accounts receivable facilities and nonconsolidated affiliates when the Company undertakes an obligation to guarantee the performance of others (via delivery of cash or other assets) if specified triggering events occur. With guarantees, such as commercial or financial contracts, non-performance by the guaranteed party triggers the obligation of the Company to make payments to the beneficiary of the guarantee. The majority of the Company’s guarantees relate to debt of nonconsolidated affiliates, which have expiration dates ranging from less than one year to 14 years. The Company’s current expectation is that future payment or performance related to the non-performance of others is considered remote.
The Company maintains accounts receivable facilities with various financial institutions, with committed and uncommitted facilities in the United States and a committed facility in Europe. Under the terms of the Programs, the Company continues to service the receivables from the customers, but retains no interest in the receivables, and remits payment to the financial institutions. The Company also has access to accounts receivable discounting facilities, under which receivables are transferred with limited recourse. The Company’s maximum guaranteed liability for the accounts receivable facilities is $239 million at December 31, 2024 ($150 million at December 31, 2023). The Company expects receivable collections and remittances to occur within the next six months.
TDCC has entered into guarantee agreements related to Sadara, a nonconsolidated affiliate. Sadara reached an agreement with its lenders to re-profile its outstanding project financing debt in the first quarter of 2021. In conjunction with the debt re-profiling, TDCC entered into a guarantee of up to approximately $1.3 billion of Sadara’s debt, proportionate to the Company's 35 percent ownership interest. The debt re-profiling includes a grace period until June 2026, during which Sadara is obligated to make interest-only payments which are guaranteed by TDCC in proportion to the Company's 35 percent ownership interest. As part of the debt re-profiling, Sadara established a $500 million revolving credit facility guaranteed by Dow, which would be used to fund Dow’s pro-rata share of any potential shortfall during the grace period. See Note 11 for additional information on Dow's investment in Sadara.
Asset Retirement Obligations
The Company has 91 manufacturing sites in 30 countries. Most of these sites contain numerous individual manufacturing operations, particularly at the Company’s larger sites. Asset retirement obligations are recorded as incurred and reasonably estimable, including obligations for which the timing and/or method of settlement are conditional on a future event that may or may not be within the control of the Company. The retirement of assets may involve such efforts as remediation and treatment of asbestos, contractually required demolition, and other related activities, depending on the nature and location of the assets; and retirement obligations are typically realized only upon demolition of those facilities. In identifying asset retirement obligations, the Company considers identification of legally enforceable obligations, changes in existing law, estimates of potential settlement dates and the calculation of an appropriate discount rate to be used in calculating the fair value of the obligations. The Company has a well-established global process to identify, approve and track the demolition of retired or to-be-retired facilities; and no assets are retired from service until this process has been followed. The Company typically forecasts demolition projects based on the usefulness of the assets; environmental, health and safety concerns; and other similar considerations. Under this process, as demolition projects are identified and approved, reasonable estimates are determined for the time frames during which any related asset retirement obligations are expected to be settled. For those assets where a range of potential settlement dates may be reasonably estimated, obligations are recorded. The Company routinely reviews all changes to items under consideration for demolition to determine if an adjustment to the value of the asset retirement obligation is required.
The Company has recognized asset retirement obligations for the demolition and remediation activities at manufacturing sites primarily in Europe, the United States, Brazil, Argentina, Canada and Japan, and capping activities at landfill sites in the United States, Brazil and Canada. The Company has also recognized conditional asset retirement obligations related to asbestos encapsulation as a result of planned demolition and remediation activities at manufacturing and administrative sites primarily in the United States and Europe. The aggregate carrying amount of conditional asset retirement obligations recognized by the Company (included in the asset retirement obligations balance shown below) was $19 million at December 31, 2024 ($21 million at December 31, 2023).
The following table shows changes in the aggregate carrying amount of the Company’s asset retirement obligations for the years ended December 31, 2024 and 2023:
| | | | | | | | |
| Asset Retirement Obligations | 2024 | 2023 |
| In millions |
| Balance at Jan 1 | $ | 140 | | $ | 119 | |
| Additional accruals | 45 | | 26 | |
| Liabilities settled | (13) | | (2) | |
| Accretion expense | 4 | | 3 | |
| Revisions in estimated cash flows | 3 | | 1 | |
| Other | (5) | | (7) | |
| Balance at Dec 31 | $ | 174 | | $ | 140 | |
The discount rate used to calculate the Company’s asset retirement obligations at December 31, 2024, was 4.93 percent (5.07 percent at December 31, 2023). These obligations are included in the consolidated balance sheets as "Accrued and other current liabilities" and "Other noncurrent obligations."
The Company has not recognized conditional asset retirement obligations for which a fair value cannot be reasonably estimated in its consolidated financial statements. Assets that have not been submitted/reviewed for potential demolition activities are considered to have continued usefulness and are generally still operating normally. Therefore, without a plan to demolish the assets or the expectation of a plan, such as shortening the useful life of assets for depreciation purposes in accordance with the accounting guidance related to property, plant and equipment, the Company is unable to reasonably forecast a time frame to use for present value calculations. As such, the Company has not recognized obligations for individual plants/buildings at its manufacturing sites where estimates of potential settlement dates cannot be reasonably made. In addition, the Company has not recognized conditional asset retirement obligations for the capping of its approximately 25 underground storage wells and 79 underground brine mining and other wells at Company-owned sites when there are no plans or expectations of plans to exit the sites. It is the opinion of the Company’s management that the possibility is remote that such conditional asset retirement obligations, when estimable, will have a material impact on the Company’s consolidated financial statements based on current costs.
NOTE 16 - LEASES
Operating lease ROU assets are included in "Operating lease right-of-use assets" while finance lease ROU assets are included in "Net property" in the consolidated balance sheets. With respect to lease liabilities, operating lease liabilities are included in "Operating lease liabilities - current" and "Operating lease liabilities - noncurrent," and finance lease liabilities are included in "Long-term debt due within one year" and "Long-Term Debt" in the consolidated balance sheets.
Dow routinely leases sales and administrative offices, power plants, production facilities, warehouses and tanks for product storage, aircraft, motor vehicles, railcars, office machines and equipment. Some leases contain renewal provisions, purchase options and escalation clauses and the terms for these leased assets vary depending on the lease agreement. These leased assets have remaining lease terms of up to 51 years. See Note 1 for additional information on leases.
The components of lease cost for operating and finance leases for the years ended December 31, 2024, 2023 and 2022, were as follows:
| | | | | | | | | | | |
| Lease Cost | 2024 | 2023 | 2022 |
| In millions |
| Operating lease cost | $ | 433 | | $ | 426 | | $ | 397 | |
| Finance lease cost | | | |
| Amortization of right-of-use assets - finance | 117 | | 106 | | 105 | |
| Interest on lease liabilities - finance | 45 | | 34 | | 32 | |
| Total finance lease cost | 162 | | 140 | | 137 | |
| Short-term lease cost | 322 | | 255 | | 255 | |
| Variable lease cost | 1,074 | | 929 | | 611 | |
| Sublease income | (10) | | (9) | | (10) | |
| Total lease cost | $ | 1,981 | | $ | 1,741 | | $ | 1,390 | |
The following table provides supplemental cash flow and other information related to leases:
| | | | | | | | | | | |
| Other Lease Information | 2024 | 2023 | 2022 |
| In millions |
| | | |
| Cash paid for amounts included in the measurement of lease liabilities: | | | |
| Operating cash flows for operating leases | $ | 436 | | $ | 424 | | $ | 393 | |
| Operating cash flows for finance leases | $ | 45 | | $ | 34 | | $ | 32 | |
| Financing cash flows for finance leases | $ | 132 | | $ | 127 | | $ | 114 | |
| Right-of-use assets obtained in exchange for lease obligations: | | | |
Operating leases 1 | $ | 241 | | $ | 309 | | $ | 151 | |
Finance leases 1 | $ | 218 | | $ | 234 | | $ | 62 | |
1.In 2023, $98 million of leased assets were reclassified from Operating leases to Finance leases due to an amendment that extended the term of the agreement.
The following table summarizes the lease-related assets and liabilities recorded in the consolidated balance sheets at December 31, 2024 and 2023:
| | | | | | | | | | | |
| Lease Position | Balance Sheet Classification | Dec 31, 2024 | Dec 31, 2023 |
| In millions |
| Assets | | | |
| Operating lease assets | Operating lease right-of-use assets | $ | 1,268 | | $ | 1,320 | |
| Finance lease assets | Property | 1,495 | | 1,328 | |
| Finance lease amortization | Accumulated depreciation | (619) | | (538) | |
| Total lease assets | | $ | 2,144 | | $ | 2,110 | |
| Liabilities | | | |
| Current | | | |
| Operating | Operating lease liabilities - current | $ | 318 | | $ | 329 | |
| Finance | Long-term debt due within one year | 106 | | 117 | |
| Noncurrent | | | |
| Operating | Operating lease liabilities - noncurrent | 984 | | 1,032 | |
| Finance | Long-Term Debt | 833 | | 756 | |
| Total lease liabilities | | $ | 2,241 | | $ | 2,234 | |
The weighted-average remaining lease term and discount rate for leases recorded in the consolidated balance sheets at December 31, 2024 and 2023 are provided below:
| | | | | | | | |
| Lease Term and Discount Rate | Dec 31, 2024 | Dec 31, 2023 |
| Weighted-average remaining lease term | | |
| Operating leases | 6.7 years | 6.9 years |
| Finance leases | 9.7 years | 10.5 years |
| Weighted-average discount rate | | |
| Operating leases | 4.84 | % | 4.82 | % |
| Finance leases | 5.00 | % | 4.84 | % |
The following table provides the maturities of lease liabilities at December 31, 2024:
| | | | | | | | |
| Maturities of Lease Liabilities | Operating Leases | Finance Leases |
| In millions |
| 2025 | $ | 365 | | $ | 147 | |
| 2026 | 281 | | 134 | |
| 2027 | 230 | | 145 | |
| 2028 | 175 | | 103 | |
| 2029 | 109 | | 97 | |
| 2030 and thereafter | 388 | | 568 | |
| Total future undiscounted lease payments | $ | 1,548 | | $ | 1,194 | |
| Less: Imputed interest | 246 | | 255 | |
| Total present value of lease liabilities | $ | 1,302 | | $ | 939 | |
At December 31, 2024, Dow had additional leases of approximately $409 million, primarily for buildings and equipment, which had not yet commenced. These leases are expected to commence between 2025 and 2027, with lease terms of up to 20 years.
Dow provides guarantees related to certain leased assets, specifying the residual value that will be available to the lessor at lease termination through the sale of the assets to the lessee or third parties. The following table provides a summary of the final expiration, maximum future payments and recorded liability reflected in the consolidated balance sheets for residual value guarantees at December 31, 2024 and 2023. The lease agreements do not contain any material restrictive covenants.
| | | | | | | | | | | | | | | | | | | | |
| Lease Guarantees | Dec 31, 2024 | Dec 31, 2023 |
| In millions | Final Expiration | Maximum Future Payments | Recorded Liability | Final Expiration | Maximum Future Payments | Recorded Liability |
| Residual value guarantees | 2034 | $ | 313 | | $ | — | | 2031 | $ | 295 | | $ | — | |
NOTE 17 – STOCKHOLDERS’ EQUITY
Common Stock
The principal market for Dow Inc.'s common stock is the New York Stock Exchange, traded under the symbol “DOW.” Dow Inc. is the direct parent company of The Dow Chemical Company and its consolidated subsidiaries, ("TDCC" and together with Dow Inc., "Dow" or the "Company"), owning all of the outstanding common shares of TDCC.
The Company may issue shares of Dow Inc. common stock out of treasury stock or as new shares of common stock for options exercised and for the release of restricted stock units ("RSUs"), performance stock units ("PSUs"), the Employee Stock Purchase Plan ("ESPP") and the Employees' Savings Plan (the "Savings Plan"). Common stock shares issued to employees and non-employee directors was approximately 5.9 million in 2024 (6.9 million in 2023 and 7.5 million in 2022). See Note 20 for additional information on the Company's equity awards.
Retained Earnings
Dow Inc.
There are no significant restrictions limiting Dow Inc.’s ability to pay dividends. Dow Inc. declared dividends of $2.80 per share in 2024, 2023 and 2022.
Undistributed earnings of nonconsolidated affiliates included in retained earnings was $758 million at December 31, 2024 and $684 million at December 31, 2023.
TDCC
TDCC's Board of Directors determines whether or not there will be a dividend distribution to Dow Inc. TDCC declared $2,578 million of dividends to Dow Inc. and paid $2,485 million of dividends to Dow Inc. in 2024 (declared and paid $2,510 million in 2023 and $4,375 million in 2022).
Employee Stock Ownership Plan
The Dow Employee Stock Ownership Plan (the “ESOP”) allocated the remaining shares in 2022 and no shares remained unallocated at December 31, 2024, 2023 and 2022.
Compensation expense for allocated shares is recorded at the fair value of the shares on the date of allocation. As all remaining ESOP shares were allocated in 2022, there was no compensation expense recorded in 2024 or 2023 for allocated ESOP shares. Compensation expense reflected in income before income taxes for ESOP shares allocated was $31 million in 2022.
Treasury Stock
On April 1, 2019, the Board ratified the share repurchase program originally approved on March 15, 2019, authorizing up to $3.0 billion for the repurchase of the Company's common stock, with no expiration date. The Company completed the April 1, 2019 share repurchase program in the second quarter of 2022. On April 13, 2022, the Board approved a new share repurchase program authorizing up to $3.0 billion for the repurchase of the Company's common stock, with no expiration date. In 2024, the Company repurchased $494 million of its common stock ($625 million in 2023 and $2,325 million in 2022). Excise tax for repurchased shares was zero in 2024 ($2 million in 2023 and zero in 2022), and was included in treasury stock at cost. At December 31, 2024, $931 million of the share repurchase program authorization remained available for repurchases.
The Company began issuing treasury shares to satisfy its obligations to make matching contributions to plan participants under the Savings Plan in the first quarter of 2022. In addition, beginning on January 1, 2024, all eligible U.S. employees also received an automatic non-elective contribution of 4 percent of eligible compensation to their respective defined contribution plans. The Company issued 4.3 million treasury shares under its compensation and benefit plans in 2024, 2.3 million in 2023 and 1.5 million in 2022.
Compensation expense for issued shares is recorded at the fair value of the shares on the date of issuance. Compensation expense reflected in income before income taxes for treasury shares issued was $229 million in 2024, $120 million in 2023 and $94 million in 2022.
The following table provides a reconciliation of Dow Inc. common stock activity for the years ended December 31, 2024, 2023 and 2022:
| | | | | | | | |
| Shares of Dow Inc. Common Stock | Issued | Held in Treasury |
|
| Balance at Jan 1, 2022 | 764,226,882 | | 29,011,573 | |
Issued 1 | 7,451,643 | | (1,499,610) | |
| Repurchased | — | | 39,286,642 | |
| Balance at Jan 1, 2023 | 771,678,525 | | 66,798,605 | |
Issued 1 | 6,916,989 | | (2,347,747) | |
| Repurchased | — | | 11,851,223 | |
| Balance at Jan 1, 2024 | 778,595,514 | | 76,302,081 | |
Issued 1 | 5,876,425 | | (4,304,574) | |
| Repurchased | — | | 8,861,638 | |
| Balance at Dec 31, 2024 | 784,471,939 | | 80,859,145 | |
1.Shares issued to employees and non-employee directors under the Company's equity compensation and defined contribution plans.
Accumulated Other Comprehensive Loss
The changes in each component of AOCL for the years ended December 31, 2024, 2023 and 2022 were as follows:
| | | | | | | | | | | |
| Accumulated Other Comprehensive Loss | 2024 | 2023 | 2022 |
| In millions |
| Unrealized Gains (Losses) on Investments | | | |
| Beginning balance | $ | (253) | | $ | (253) | | $ | 59 | |
| Unrealized gains (losses) on investments | 39 | | (6) | | (326) | |
| Tax (expense) benefit | (17) | | 54 | | 13 | |
| Net unrealized gains (losses) on investments | 22 | | 48 | | (313) | |
(Gains) losses reclassified from AOCL to net income 1 | (15) | | (63) | | 2 | |
Tax expense (benefit) 2 | 3 | | 15 | | (1) | |
| Net (gains) losses reclassified from AOCL to net income | (12) | | (48) | | 1 | |
| Other comprehensive income (loss), net of tax | 10 | | — | | (312) | |
| Ending balance | $ | (243) | | $ | (253) | | $ | (253) | |
| Cumulative Translation Adjustment | | | |
| Beginning balance | $ | (1,891) | | $ | (1,934) | | $ | (1,355) | |
| Gains (losses) on foreign currency translation | (150) | | 57 | | (557) | |
| Tax (expense) benefit | (2) | | — | | 24 | |
| Net gains (losses) on foreign currency translation | (152) | | 57 | | (533) | |
(Gains) losses reclassified from AOCL to net income 3 | (20) | | (14) | | (46) | |
| Other comprehensive income (loss), net of tax | (172) | | 43 | | (579) | |
| Ending balance | $ | (2,063) | | $ | (1,891) | | $ | (1,934) | |
| Pension and Other Postretirement Benefits | | | |
| Beginning balance | $ | (5,486) | | $ | (4,877) | | $ | (7,334) | |
| Gains (losses) arising during the period | (371) | | (1,454) | | 2,611 | |
| Tax (expense) benefit | 77 | | 349 | | (630) | |
| Net gains (losses) arising during the period | (294) | | (1,105) | | 1,981 | |
Amortization of net loss and prior service credits reclassified from AOCL to net income 4 | 76 | | 648 | | 622 | |
Tax expense (benefit) 2 | (16) | | (152) | | (146) | |
| Net loss and prior service credits reclassified from AOCL to net income | 60 | | 496 | | 476 | |
| Other comprehensive income (loss), net of tax | (234) | | (609) | | 2,457 | |
| Ending balance | $ | (5,720) | | $ | (5,486) | | $ | (4,877) | |
| Derivative Instruments | | | |
| Beginning balance | $ | (51) | | $ | (75) | | $ | (347) | |
| Gains (losses) on derivative instruments | (65) | | (201) | | 638 | |
| Tax (expense) benefit | 22 | | 30 | | (87) | |
| Net gains (losses) on derivative instruments | (43) | | (171) | | 551 | |
(Gains) losses reclassified from AOCL to net income 5 | 14 | | 250 | | (313) | |
Tax expense (benefit) 2 | (4) | | (55) | | 34 | |
| Net (gains) losses reclassified from AOCL to net income | 10 | | 195 | | (279) | |
| Other comprehensive income (loss), net of tax | (33) | | 24 | | 272 | |
| Ending balance | $ | (84) | | $ | (51) | | $ | (75) | |
| Total AOCL ending balance | $ | (8,110) | | $ | (7,681) | | $ | (7,139) | |
1.Reclassified to "Net sales" and "Sundry income (expense) - net."
2.Reclassified to "Provision (credit) for income taxes."
3.Reclassified to "Sundry income (expense) - net."
4.These AOCL components are included in the computation of net periodic benefit cost of the Company's defined benefit pension and other postretirement benefit plans. See Note 19 for additional information.
5.Reclassified to "Cost of sales," "Sundry income (expense) - net" and "Interest expense and amortization of debt discount."
NOTE 18 – NONCONTROLLING INTERESTS
Ownership interests in the Company's subsidiaries held by parties other than the Company are presented separately from the Company's equity in the consolidated balance sheets as "Noncontrolling interests." The amount of consolidated net income attributable to the Company and the noncontrolling interests are both presented on the face of the consolidated statements of income.
The following table summarizes the activity for equity attributable to noncontrolling interests for the years ended December 31, 2024, 2023 and 2022:
| | | | | | | | | | | |
| Noncontrolling Interests | | | |
| In millions | 2024 | 2023 | 2022 |
| Balance at Jan 1 | $ | 501 | | $ | 529 | | $ | 574 | |
Net income attributable to noncontrolling interests 1 | 85 | | 71 | | 58 | |
Distributions to noncontrolling interests 2 | (69) | | (81) | | (76) | |
| | | |
| | | |
| | | |
| | | |
| | | |
| | | |
| | | |
| Cumulative translation adjustments | (20) | | (19) | | (28) | |
| Other | (1) | | 1 | | 1 | |
| Balance at Dec 31 | $ | 496 | | $ | 501 | | $ | 529 | |
1.2022 includes the portion of asset related charges attributable to noncontrolling interests related to a joint venture in Russia. See Note 5 for additional information.
2.Distributions to noncontrolling interests are net of $8 million in 2024 ($8 million in 2023 and $7 million in 2022) in dividends paid to a joint venture, which were reclassified to "Equity in earnings (losses) of nonconsolidated affiliates" in the consolidated statements of income.
On December 8, 2024, TDCC entered into a sale and purchase agreement with InfraPark Holdings, LLC ("InfraPark"), a subsidiary of a fund managed by Macquarie Asset Management, whereby TDCC will sell 40 percent of the membership interests in its wholly owned subsidiary Dow InfraCo, LLC in exchange for cash proceeds of approximately $2.4 billion (the "Transaction"). Under the terms of the sale and purchase agreement, InfraPark has the option to purchase up to an additional 9 percent of Dow InfraCo, LLC's membership interests in exchange for additional cash proceeds of up to $600 million within six months of the closing date of the Transaction. The Company is targeting to close the Transaction in mid-2025, subject to regulatory approval and other closing conditions. Upon closing the Transaction, InfraPark's ownership is expected to be accounted for as a noncontrolling interest in Dow InfraCo, LLC. Dow InfraCo, LLC and its subsidiaries operate certain non-product producing energy, environmental, pipeline and infrastructure assets located at five of the Company's manufacturing sites in the U.S. Gulf Coast.
NOTE 19 – PENSION PLANS AND OTHER POSTRETIREMENT BENEFITS
Defined Benefit Pension Plans
The Company has both funded and unfunded defined benefit pension plans in the United States and a number of other countries. The U.S. tax-qualified plans administered by the parent company are the largest plans. In 2021, the Company announced changes to the design of its U.S. tax-qualified and non-qualified pension plans (collectively, the "U.S. Plans"), which covered substantially all U.S. employees. As a result, effective December 31, 2023, the Company froze the pensionable compensation and credited service amounts used to calculate pension benefits for substantially all employees who participated in the U.S. Plans.
Separately, in the fourth quarter of 2023, certain Company pension plans in the United States and Canada purchased or converted to nonparticipating group annuity contracts from certain insurance companies, irrevocably transferring approximately $1,681 million of benefit obligations and $1,617 million of related plan assets to the insurers. These transactions did not require any cash funding from the Company and did not impact the pension benefits of participants. As a result of these transactions, the Company recognized pretax, non-cash settlement charges of $642 million in 2023, primarily related to the accelerated recognition of a portion of the accumulated actuarial losses of the plans, recorded in “Sundry income (expense) – net” in the consolidated statements of income and related to Corporate. In the second quarter of 2024, the Company initiated the termination of certain U.S. tax-qualified pension plans, which include the tax-qualified benefit obligations for substantially all employees hired after January 1, 2008. These employees earned benefits based on a set percentage of annual pay, plus interest. As part of the plan termination process, the Company will offer participants of these plans annuity or lump sum distribution options. Final asset distributions are expected to be paid from plan assets in the fourth quarter of 2025.
The Company's funding policy is to contribute to the plans when pension laws and/or economics either require or encourage funding. Total global pension contributions were $121 million in 2024, which includes contributions necessary to fund benefit payments for the Company's unfunded pension plans. Additionally, in the second quarter of 2024, the Company received a pension plan reversion of approximately $70 million (approximately $90 million in the second quarter of 2023) for a portion of the excess funding of one of its plans in Europe, included in "Other assets and liabilities, net" in the consolidated statements of cash flows. The Company expects to contribute approximately $175 million to its pension plans in 2025.
The weighted-average assumptions used to determine pension plan obligations and net periodic benefit cost for all plans are summarized in the table below:
| | | | | | | | | | | | | | | | | |
| Weighted-Average Assumptions for All Pension Plans | Benefit Obligations
at Dec 31 | Net Periodic Benefit Cost
for the Year Ended |
| | 2024 | 2023 | 2024 | 2023 | 2022 |
| Discount rate | 5.13 | % | 4.73 | % | 4.73 | % | 5.26 | % | 2.57 | % |
| Interest crediting rate for applicable benefits | 3.81 | % | 3.99 | % | 3.99 | % | 4.19 | % | 3.57 | % |
| Rate of compensation increase | 3.40 | % | 3.80 | % | 3.80 | % | 4.05 | % | 3.94 | % |
| Expected return on plan assets | | | 6.42 | % | 6.62 | % | 6.68 | % |
The weighted-average assumptions used to determine pension plan obligations and net periodic benefit cost for U.S. plans are summarized in the table below:
| | | | | | | | | | | | | | | | | |
| Weighted-Average Assumptions for U.S. Pension Plans | Benefit Obligations
at Dec 31 | Net Periodic Benefit Cost
for the Year Ended |
| 2024 | 2023 | 2024 | 2023 | 2022 |
| Discount rate | 5.74 | % | 5.30 | % | 5.30 | % | 5.76 | % | 3.04 | % |
| Interest crediting rate for applicable benefits | 3.54 | % | 4.50 | % | 4.50 | % | 4.50 | % | 4.50 | % |
Rate of compensation increase 1 | — | % | 4.25 | % | 4.25 | % | 4.25 | % | 4.25 | % |
| Expected return on plan assets | | | 7.07 | % | 7.46 | % | 7.95 | % |
1.The rate of compensation increase assumption is not relevant for the U.S. Plans at December 31, 2024, due to the freezing of plan benefits.
Other Postretirement Benefit Plans
The Company provides certain health care and life insurance benefits to retired employees and survivors. The Company’s plans outside of the United States are not significant; therefore, this discussion relates to the U.S. plans only. The plans provide health care benefits, including hospital, physicians’ services, drug and major medical expense coverage, and life insurance benefits. In general, for employees hired before January 1, 1993, the plans provide benefits supplemental to Medicare when retirees are eligible for these benefits. The Company and the retiree share the cost of these benefits, with the Company portion increasing as the retiree has increased years of credited service, although there is a cap on the Company portion. The Company has the ability to change these benefits at any time. Employees hired after January 1, 2008, are not covered under the plans.
The Company funds most of the cost of these health care and life insurance benefits as incurred. In 2024, the Company did not make any contributions to its other postretirement benefit plan trusts. The trusts did not hold assets at December 31, 2024. The Company does not expect to contribute assets to its other postretirement benefit plan trusts in 2025.
The weighted-average assumptions used to determine other postretirement benefit plan obligations and net periodic benefit cost for the U.S. plans are provided below:
| | | | | | | | | | | | | | | | | |
| Weighted-Average Assumptions for U.S. Other Postretirement Benefits Plans | Benefit Obligations
at Dec 31 | Net Periodic Benefit Cost
for the Year Ended |
| 2024 | 2023 | 2024 | 2023 | 2022 |
| Discount rate | 5.66 | % | 5.23 | % | 5.23 | % | 5.57 | % | 2.85 | % |
| Health care cost trend rate assumed for next year | 7.00 | % | 6.61 | % | 6.61 | % | 6.79 | % | 6.50 | % |
| Rate to which the cost trend rate is assumed to decline (the ultimate health care cost trend rate) | 5.00 | % | 5.00 | % | 5.00 | % | 5.00 | % | 5.00 | % |
| Year that the rate reaches the ultimate health care cost trend rate | 2033 | 2033 | 2033 | 2033 | 2028 |
Assumptions
The Company determines the expected long-term rate of return on plan assets by performing a detailed analysis of key economic and market factors driving historical returns for each asset class and formulating a projected return based on factors in the current environment. Factors considered include, but are not limited to, inflation, real economic growth, interest rate yield, interest rate spreads and other valuation measures and market metrics. The expected long-term rate of return for each asset class is then weighted based on the strategic asset allocation approved by the governing body for each plan. The Company’s historical experience with the pension fund asset performance is also considered.
The Company uses the spot rate approach to determine the discount rate utilized to measure the service cost and interest cost components of net periodic pension and other postretirement benefit costs for the United States and other selected countries, as applicable. Under the spot rate approach, the Company calculates service cost and interest cost by applying individual spot rates from the Willis Towers Watson RATE:Link yield curve (based on high-quality corporate bond yields) for each selected country to the separate expected cash flow components of service cost and interest cost. Service cost and interest cost for all other plans are determined on the basis of the single equivalent discount rates derived in determining those plan obligations.
The discount rates utilized to measure the pension and other postretirement obligations of the U.S. plans are based on the yield on high-quality corporate fixed income investments at the measurement date. Future expected actuarially determined cash flows for the Company’s U.S. plans are individually discounted at the spot rates under the Willis Towers Watson U.S. RATE:Link 60-90 corporate yield curve (based on 60th to 90th percentile high-quality corporate bond yields) to arrive at the plan’s obligations as of the measurement date.
The Company’s mortality assumption used for the U.S. plans is a benefit-weighted version of the Society of Actuaries’ RP-2014 base table with future rates of mortality improvement based on a modified version of the assumptions used in the Social Security Administration’s 2021 trustees report.
Summarized information on the Company's pension and other postretirement benefit plans is as follows:
| | | | | | | | | | | | | | |
| Change in Projected Benefit Obligations, Plan Assets and Funded Status of All Significant Plans | Defined Benefit Pension Plans | Other Postretirement Benefit Plans |
| In millions | 2024 | 2023 | 2024 | 2023 |
| Change in projected benefit obligations: | | | | |
| Benefit obligations at beginning of year | $ | 22,467 | | $ | 22,861 | | $ | 914 | | $ | 893 | |
| Service cost | 57 | | 272 | | 3 | | 4 | |
| Interest cost | 1,005 | | 1,110 | | 44 | | 45 | |
| Plan participants' contributions | 16 | | 9 | | — | | — | |
| Actuarial changes in assumptions and experience | (877) | | 1,086 | | (56) | | 65 | |
| Benefits paid | (1,237) | | (1,385) | | (88) | | (94) | |
| Plan amendments | — | | 6 | | — | | — | |
| Other | 8 | | 6 | | — | | — | |
| Effect of foreign exchange rates | (360) | | 279 | | (5) | | 1 | |
Settlements/curtailments/termination benefits 1 | (69) | | (1,777) | | — | | — | |
| Benefit obligations at end of year | $ | 21,010 | | $ | 22,467 | | $ | 812 | | $ | 914 | |
| | | | |
| Change in plan assets: | | | | |
| Fair value of plan assets at beginning of year | $ | 19,634 | | $ | 21,231 | | $ | — | | $ | — | |
| Actual return on plan assets | 9 | | 1,228 | | — | | — | |
| Employer contributions | 121 | | 142 | | — | | — | |
| Plan participants' contributions | 16 | | 9 | | — | | — | |
| Benefits paid | (1,237) | | (1,385) | | — | | — | |
Settlements 2 | (34) | | (1,777) | | — | | — | |
Other 3 | (56) | | (73) | | — | | — | |
| Effect of foreign exchange rates | (284) | | 259 | | — | | — | |
| | | | |
| Fair value of plan assets at end of year | $ | 18,169 | | $ | 19,634 | | $ | — | | $ | — | |
| | | | |
| Funded status: | | | | |
| U.S. plans with plan assets | $ | (1,360) | | $ | (1,192) | | $ | — | | $ | — | |
| Non-U.S. plans with plan assets | (888) | | (1,017) | | — | | — | |
| All other plans | (593) | | (624) | | (812) | | (914) | |
| | | | |
| Funded status at end of year | $ | (2,841) | | $ | (2,833) | | $ | (812) | | $ | (914) | |
| | | | |
| Amounts recognized in the consolidated balance sheets at Dec 31: | | | | |
| Deferred charges and other assets | $ | 757 | | $ | 889 | | $ | — | | $ | — | |
| Accrued and other current liabilities | (73) | | (67) | | (77) | | (86) | |
| Pension and other postretirement benefits - noncurrent | (3,525) | | (3,655) | | (735) | | (828) | |
| | | | |
| | | | |
| Net amount recognized | $ | (2,841) | | $ | (2,833) | | $ | (812) | | $ | (914) | |
| | | | |
| Pretax amounts recognized in accumulated other comprehensive loss at Dec 31: | | | | |
| Net loss (gain) | $ | 7,996 | | $ | 7,709 | | $ | (417) | | $ | (402) | |
| Prior service credit | (44) | | (84) | | — | | — | |
| Pretax balance in accumulated other comprehensive loss at end of year | $ | 7,952 | | $ | 7,625 | | $ | (417) | | $ | (402) | |
1.The 2024 impact primarily relates to the curtailment, special termination benefits and settlement of certain pension benefit obligations of a European plan resulting from the 2023 Restructuring Program, and the settlement and curtailment impacts of certain pension benefit obligations in Canada, China and Europe. The 2023 impact primarily relates to the transfer of certain pension benefit obligations in the United States and Canada through the purchase of or conversion to annuity contracts from insurance companies, triggering settlement accounting.
2.The 2024 impact primarily relates to the settlement of certain pension benefit obligations of a European plan resulting from the 2023 Restructuring Program and settlement of certain pension benefit obligations in Canada. The 2023 impact primarily relates to the purchase of annuity contracts associated with the transfer of certain pension benefit obligations to insurance companies, triggering settlement accounting.
3.The 2024 and 2023 impacts primarily relate to reversions of pension plan funds for a portion of the excess funding of one of its plans in Europe.
A significant component of the overall decrease in the Company's benefit obligation for the year ended December 31, 2024, was due to benefits paid and the change in weighted-average discount rates, which increased from 4.73 percent at December 31, 2023, to 5.13 percent at December 31, 2024. A significant component of the overall decrease in the Company's benefit obligation for the year ended December 31, 2023, was due to the irrevocable transfer of certain benefit obligations to third-party insurance companies, partially offset by the change in weighted-average discount rates, which decreased from 5.18 percent at December 31, 2022, to 4.73 percent at December 31, 2023.
The accumulated benefit obligation for all significant pension plans was $20.9 billion and $22.3 billion at December 31, 2024 and 2023, respectively.
| | | | | | | | |
| Pension Plans with Accumulated Benefit Obligations in Excess of Plan Assets at Dec 31 | 2024 | 2023 |
| In millions |
| Accumulated benefit obligations | $ | 17,455 | | $ | 18,612 | |
| Fair value of plan assets | $ | 13,905 | | $ | 14,962 | |
| | | | | | | | |
| Pension Plans with Projected Benefit Obligations in Excess of Plan Assets at Dec 31 | 2024 | 2023 |
| In millions |
| Projected benefit obligations | $ | 17,502 | | $ | 18,783 | |
| | |
| Fair value of plan assets | $ | 13,905 | | $ | 15,060 | |
| | | | | | | | | | | | | | | | | | | | |
| Net Periodic Benefit Cost (Credit) for All Significant Plans for the Year Ended Dec 31 | Defined Benefit Pension Plans | Other Postretirement Benefit Plans |
| In millions | 2024 | 2023 | 2022 | 2024 | 2023 | 2022 |
| Net Periodic Benefit Costs: | | | | | | |
| Service cost | $ | 57 | | $ | 272 | | $ | 392 | | $ | 3 | | $ | 4 | | $ | 6 | |
| Interest cost | 1,005 | | 1,110 | | 680 | | 44 | | 45 | | 26 | |
| Expected return on plan assets | (1,380) | | (1,539) | | (1,686) | | — | | — | | — | |
| Amortization of prior service credit | (14) | | (26) | | (21) | | — | | — | | — | |
| Amortization of unrecognized (gain) loss | 141 | | 89 | | 658 | | (41) | | (57) | | (15) | |
Curtailment/settlement/other 1 | (10) | | 642 | | — | | — | | — | | — | |
| Net periodic benefit cost (credit) | $ | (201) | | $ | 548 | | $ | 23 | | $ | 6 | | $ | (8) | | $ | 17 | |
| Changes in plan assets and benefit obligations recognized in other comprehensive (income) loss: | | | | | | |
| Net (gain) loss | $ | 444 | | $ | 1,395 | | $ | (2,231) | | $ | (56) | | $ | 64 | | $ | (317) | |
| Prior service cost (credit) | — | | 6 | | (25) | | — | | — | | — | |
| Amortization of prior service credit | 14 | | 26 | | 21 | | — | | — | | — | |
| Amortization of unrecognized gain (loss) | (141) | | (89) | | (658) | | 41 | | 57 | | 15 | |
Curtailment and settlement gain (loss) 1 | 10 | | (642) | | — | | — | | — | | — | |
| Total recognized in other comprehensive (income) loss | $ | 327 | | $ | 696 | | $ | (2,893) | | $ | (15) | | $ | 121 | | $ | (302) | |
| Total recognized in net periodic benefit cost and other comprehensive (income) loss | $ | 126 | | $ | 1,244 | | $ | (2,870) | | $ | (9) | | $ | 113 | | $ | (285) | |
1.The 2024 impact primarily relates to the settlement of certain plan obligations of a European plan resulting from the 2023 Restructuring Program and curtailments and settlement of certain pension benefit obligations in Canada, China and Europe. The 2023 impact relates to the settlement of certain pension benefit obligations in the United States and Canada through the purchase of or conversion to annuity contracts from insurance companies.
Except for curtailment, special termination benefits, and settlement costs related to the 2023 Restructuring Program, which are included in “Restructuring and asset related charges – net” in the consolidated statements of income, non-service cost components of net periodic benefit cost are included in "Sundry income (expense) - net" in the consolidated statements of income. See Notes 5 and 6 for additional information.
Estimated Future Benefit Payments
The estimated future benefit payments, reflecting expected future service, as appropriate, are presented in the following table:
| | | | | | | | |
| Estimated Future Benefit Payments at Dec 31, 2024 | Defined Benefit Pension Plans | Other Postretirement Benefit Plans |
| In millions |
20251 | $ | 1,943 | | $ | 79 | |
| 2026 | 1,357 | | 76 | |
| 2027 | 1,372 | | 75 | |
| 2028 | 1,398 | | 73 | |
| 2029 | 1,404 | | 71 | |
| 2030-2034 | 7,032 | | 313 | |
| Total | $ | 14,506 | | $ | 687 | |
1. Includes benefit payments related to the planned termination of certain U.S. tax qualified pension plans.
Plan Assets
Plan assets consist primarily of equity and fixed income securities of United States and foreign issuers, and include alternative investments, such as real estate, private equity and absolute return strategies. Plan assets totaled $18.2 billion at December 31, 2024 and $19.6 billion at December 31, 2023 and included no directly held common stock of Dow Inc.
The Company's investment strategy for plan assets is to manage the assets in relation to the liability in order to pay retirement benefits to plan participants over the life of the plans. This is accomplished by identifying and managing the exposure to various market risks, diversifying investments across various asset classes and earning an acceptable long-term rate of return consistent with an acceptable amount of risk, while considering the liquidity needs of the plans.
The plans are permitted to use derivative instruments for investment purposes, as well as for hedging the underlying asset and liability exposure and rebalancing the asset allocation. The plans use value-at-risk, stress testing, scenario analysis and Monte Carlo simulations to monitor and manage both the risk within the portfolios and the surplus risk of the plans.
Equity securities primarily include investments in large- and small-cap companies located in both developed and emerging markets around the world. Fixed income securities include investment and non-investment grade corporate bonds of companies diversified across industries, U.S. treasuries, non-U.S. developed market securities, U.S. agency mortgage-backed securities, emerging market securities and fixed income related funds. Alternative investments primarily include investments in real estate, private equity and absolute return strategies. Other significant investment types include various insurance contracts and interest rate, equity, commodity and foreign exchange derivative investments and hedges.
The Company mitigates the credit risk of investments by establishing guidelines with investment managers that limit investment in any single issue or issuer to an amount that is not material to the portfolio being managed. These guidelines are monitored for compliance both by the Company and external managers. Credit risk related to derivative activity is mitigated by utilizing multiple counterparties, collateral support agreements and centralized clearing, where appropriate. A short-term investment money market fund is utilized as the sweep vehicle for the U.S. plans, which from time to time can represent a significant investment.
The weighted-average target allocation for plan assets of the Company's pension plans is summarized as follows:
| | | | | |
| Target Allocation for Plan Assets at Dec 31, 2024 | Target Allocation |
| Asset Category |
| Equity securities | 20 | % |
| Fixed income securities | 49 | |
| Alternative investments | 26 | |
| Other investments | 5 | |
| Total | 100 | % |
Fair value calculations may not be indicative of net realizable value or reflective of future fair values. Furthermore, although the Company believes its valuation methods are appropriate and consistent with other market participants, the use of different methodologies or assumptions to determine the fair value of certain financial instruments could result in a different fair value measurement at the reporting date.
For pension plan assets classified as Level 1 measurements (measured using quoted prices in active markets), total fair value is either the price of the most recent trade at the time of the market close or the official close price, as defined by the exchange on which the asset is most actively traded on the last trading day of the period, multiplied by the number of units held without consideration of transaction costs.
For pension plan assets classified as Level 2 measurements, where the security is frequently traded in less active markets, fair value is based on the closing price at the end of the period; where the security is less frequently traded, fair value is based on the price a dealer would pay for the security or similar securities, adjusted for any terms specific to that asset or liability. Market inputs are obtained from well-established and recognized vendors of market data and subjected to tolerance and quality checks. For derivative assets and liabilities, standard industry models are used to calculate the fair value of the various financial instruments based on significant observable market inputs, such as foreign exchange rates, commodity prices, swap rates, interest rates and implied volatilities obtained from various market sources. For other pension plan assets for which observable inputs are used, fair value is derived through the use of fair value models, such as a discounted cash flow model or other standard pricing models.
For pension plan assets classified as Level 3 measurements, total fair value is based on significant unobservable inputs including assumptions where there is little, if any, market activity for the investment.
Certain pension plan assets are held in funds where fair value is based on an estimated net asset value per share (or its equivalent) as of the most recently available fund financial statements which are received on a monthly or quarterly basis. These valuations are reviewed for reasonableness based on applicable sector, benchmark and company performance. Adjustments to valuations are made where appropriate to arrive at an estimated net asset value per share at the measurement date. These funds are not classified within the fair value hierarchy.
The following table summarizes the bases used to measure the Company’s pension plan assets at fair value for the years ended December 31, 2024 and 2023:
| | | | | | | | | | | | | | | | | | | | | | | | | | |
| Basis of Fair Value Measurements | Dec 31, 2024 | Dec 31, 2023 |
| In millions | Total | Level 1 | Level 2 | Level 3 | Total | Level 1 | Level 2 | Level 3 |
| Cash and cash equivalents | $ | 1,319 | | $ | 1,087 | | $ | 232 | | $ | — | | $ | 1,050 | | $ | 987 | | $ | 63 | | $ | — | |
| Equity securities: | | | | | | | | |
| U.S. equity securities | $ | 1,474 | | $ | 1,466 | | $ | 7 | | $ | 1 | | $ | 1,443 | | $ | 1,431 | | $ | 11 | | $ | 1 | |
| Non - U.S. equity securities | 1,620 | | 1,488 | | 127 | | 5 | | 1,720 | | 1,584 | | 132 | | 4 | |
| Total equity securities | $ | 3,094 | | $ | 2,954 | | $ | 134 | | $ | 6 | | $ | 3,163 | | $ | 3,015 | | $ | 143 | | $ | 5 | |
| Fixed income securities: | | | | | | | | |
| Debt - government-issued | $ | 3,805 | | $ | — | | $ | 3,805 | | $ | — | | $ | 4,665 | | $ | 47 | | $ | 4,618 | | $ | — | |
| Debt - corporate-issued | 3,189 | | 308 | | 2,881 | | — | | 4,277 | | 584 | | 3,692 | | 1 | |
| Debt - asset-backed | 42 | | — | | 42 | | — | | 43 | | — | | 43 | | — | |
| Total fixed income securities | $ | 7,036 | | $ | 308 | | $ | 6,728 | | $ | — | | $ | 8,985 | | $ | 631 | | $ | 8,353 | | $ | 1 | |
| Alternative investments: | | | | | | | | |
| | | | | | | | |
| Private markets | $ | 1 | | $ | — | | $ | — | | $ | 1 | | $ | 1 | | $ | — | | $ | — | | $ | 1 | |
| Real estate | 19 | | 19 | | — | | — | | 21 | | 21 | | — | | — | |
| Derivatives - asset position | 242 | | 5 | | 237 | | — | | 190 | | 1 | | 189 | | — | |
| Derivatives - liability position | (423) | | (5) | | (418) | | — | | (223) | | — | | (223) | | — | |
| Total alternative investments | $ | (161) | | $ | 19 | | $ | (181) | | $ | 1 | | $ | (11) | | $ | 22 | | $ | (34) | | $ | 1 | |
| Other investments | $ | 1,180 | | $ | — | | $ | 1,180 | | $ | — | | $ | 609 | | $ | 3 | | $ | 606 | | $ | — | |
| Subtotal | $ | 12,468 | | $ | 4,368 | | $ | 8,093 | | $ | 7 | | $ | 13,796 | | $ | 4,658 | | $ | 9,131 | | $ | 7 | |
| Investments measured at net asset value: | | | | | | | | |
| Hedge funds | $ | 839 | | | | | $ | 820 | | | | |
| Private markets | 3,556 | | | | | 3,350 | | | | |
| Real estate | 1,423 | | | | | 1,741 | | | | |
| Total investments measured at net asset value | $ | 5,818 | | | | | $ | 5,911 | | | | |
| Items to reconcile to fair value of plan assets: | | | | | | | | |
Pension trust receivables 1 | $ | 81 | | | | | $ | 42 | | | | |
Pension trust payables 2 | (198) | | | | | (115) | | | | |
| Total | $ | 18,169 | | | | | $ | 19,634 | | | | |
1.Primarily receivables for investment securities sold.
2.Primarily payables for investment securities purchased.
The following table summarizes the changes in the fair value of Level 3 pension plan assets for the years ended December 31, 2024 and 2023:
| | | | | | | | | | | | | | | |
| Fair Value Measurement of Level 3 Pension Plan Assets | Equity Securities | Fixed Income Securities | Alternative Investments | | Total |
| In millions |
| Balance at Jan 1, 2023 | $ | 6 | | $ | 1 | | $ | 5 | | | $ | 12 | |
| Actual return on assets: | | | | | |
| | | | | |
| Relating to assets held at Dec 31, 2023 | 1 | | — | | (4) | | | (3) | |
| Purchases, sales and settlements, net | (2) | | — | | — | | | (2) | |
| | | | | |
| | | | | |
| Balance at Dec 31, 2023 | $ | 5 | | $ | 1 | | $ | 1 | | | $ | 7 | |
| Actual return on assets: | | | | | |
| | | | | |
| Relating to assets held at Dec 31, 2024 | (1) | | — | | — | | | (1) | |
| Purchases, sales and settlements, net | (1) | | — | | — | | | (1) | |
| Transfers into Level 3, net | 3 | | (1) | | — | | | 2 | |
| | | | | |
| Balance at Dec 31, 2024 | $ | 6 | | $ | — | | $ | 1 | | | $ | 7 | |
Defined Contribution Plans
U.S. employees may participate in defined contribution plans by contributing a portion of their compensation, which is partially matched by the Company. In addition, beginning on January 1, 2024, all eligible U.S. employees also received an automatic non-elective contribution of 4 percent of eligible compensation to their respective defined contribution plans. Defined contribution plans also cover employees in some subsidiaries in other countries, including Brazil, The Netherlands, Canada, Korea, Spain, Switzerland and the United Kingdom. Expense recognized for all defined contribution plans was $312 million in 2024, $214 million in 2023 and $150 million in 2022.
NOTE 20 – STOCK-BASED COMPENSATION
The Company grants stock-based compensation to employees and non-employee directors under stock incentive plans, in the form of stock options, stock appreciation rights, PSUs and RSUs. The Company also provides stock-based compensation in the form of the Employee Stock Purchase Plan, which grants eligible employees the right to purchase shares of the Company's common stock at a discounted price.
The total stock-based compensation expense included in the consolidated statements of income was $159 million, $212 million and $211 million in 2024, 2023 and 2022, respectively. The income tax benefits related to stock-based compensation arrangements were $35 million, $47 million and $47 million in 2024, 2023 and 2022, respectively.
Accounting for Stock-Based Compensation
The Company grants stock-based compensation awards that vest over a specified period or upon employees meeting certain performance and/or retirement eligibility criteria. The fair value of equity instruments issued to employees is measured on the grant date. The fair value of liability instruments (granted to executive employees subject to stock ownership requirements, that provide the recipient the option to elect to receive a cash payment equal to the value of the stock award on the date of delivery) is measured at the end of each quarter. The fair value of equity and liability instruments is expensed over the vesting period or, in the case of retirement, from the grant date to the date on which retirement eligibility provisions have been met and additional service is no longer required. The Company estimates expected forfeitures based on historical activity.
The Company uses the Black-Scholes option valuation model to estimate the fair value of stock options. The weighted-average assumptions used to calculate total stock-based compensation are included in the following table:
| | | | | | | | | | | |
| Weighted-Average Assumptions | 2024 | 2023 | 2022 |
| Dividend yield | 5.08 | % | 4.74 | % | 4.59 | % |
| Expected volatility | 29.70 | % | 30.30 | % | 30.20 | % |
| Risk-free interest rate | 4.24 | % | 3.83 | % | 2.00 | % |
| Expected life of stock options granted during period (years) | 6.00 | 6.00 | 6.25 |
| | | |
The dividend yield assumption was equal to the dividend yield on the grant date, which reflected the Company's quarterly dividend payments of $0.70 per share in 2024, 2023 and 2022 on Dow Inc. common stock. The expected volatility assumptions for the 2024, 2023 and 2022 stock options were based on an equal weighting of the historical daily volatility for the expected term of the awards and current implied volatility from exchange-traded options. The expected volatility assumption for the market portion of the 2024, 2023 and 2022 PSU awards were based on historical daily volatility for the term of the award. The risk-free interest rate was based on the U.S. Treasury strip rates over the expected life of the 2024, 2023 and 2022 options. The expected life of stock options granted was based on an analysis of historical exercise patterns.
Stock Incentive Plan
The Company has historically granted equity awards under various plans (the "Prior Plans"). On February 9, 2012, the TDCC Board of Directors authorized The Dow Chemical Company 2012 Stock Incentive Plan (the "2012 Plan"), which was approved by stockholders at TDCC's annual meeting on May 10, 2012 ("2012 Plan Effective Date"), and became effective on that date. On February 13, 2014, the TDCC Board of Directors adopted The Dow Chemical Company Amended and Restated 2012 Stock Incentive Plan (the "2012 Restated Plan"). The 2012 Restated Plan was approved by stockholders at TDCC's annual meeting on May 15, 2014, and became effective on that date. The Prior Plans were superseded by the 2012 Plan and the 2012 Restated Plan (collectively, the "2012 Plan"). Under the 2012 Plan, the Company granted options, RSUs, PSUs, restricted stock, stock appreciation rights and stock units to employees and non-employee directors, subject to an aggregate limit and annual individual limits. The terms of the grants were fixed at the grant date. TDCC's stock-based compensation programs were assumed by DowDuPont and continued in place with the ability to grant and issue DowDuPont common stock until separation.
On April 1, 2019 ("Original Effective Date"), in connection with the separation, the Company adopted the 2019 Stock Incentive Plan (the "2019 Plan"). On February 11, 2021, the Board approved the first amendment, which was approved by the Company's stockholders at the 2021 Annual Meeting of Stockholders held on April 15, 2021. Under the 2019 Plan, as amended in 2021, the Company may grant stock options, RSUs, PSUs, stock appreciation rights and stock units to employees and non-employee directors until the tenth anniversary of the Original Effective Date, subject to an aggregate limit and annual individual limits. The terms of the grants are fixed at the grant date. At December 31, 2024, there were approximately 36 million shares of common stock available for grant under the 2019 Plan.
Stock Options
The Company grants stock options to certain employees, subject to certain annual and individual limits, with terms of the grants fixed at the grant date. The exercise price of each stock option equals the market price of the common stock on the grant date. Options vest from one year to three years and have a maximum term of ten years. The following table summarizes stock option activity for 2024:
| | | | | | | | |
| Stock Options | 2024 |
| Shares in thousands | Shares | Exercise Price 1 |
| Outstanding at Jan 1, 2024 | 13,303 | | $ | 56.79 | |
| Granted | 1,308 | | $ | 55.17 | |
| Exercised | (1,171) | | $ | 48.38 | |
| Forfeited/Expired | (70) | | $ | 59.75 | |
| Outstanding at Dec 31, 2024 | 13,370 | | $ | 57.35 | |
| Remaining contractual life in years | | 4.55 |
| Aggregate intrinsic value in millions | $ | — | | |
| Exercisable at Dec 31, 2024 | 10,984 | | $ | 57.37 | |
| Remaining contractual life in years | | 3.70 |
| Aggregate intrinsic value in millions | $ | — | | |
1. Weighted-average per share.
| | | | | | | | | | | |
| Additional Information about Stock Options | | | |
| In millions, except per share amounts | 2024 | 2023 | 2022 |
| Weighted-average fair value per share of options granted | $ | 10.94 | | $ | 12.13 | | $ | 11.08 | |
| Total compensation expense for stock option plans | $ | 13 | | $ | 13 | | $ | 13 | |
| Related tax benefit | $ | 3 | | $ | 3 | | $ | 3 | |
| Total amount of cash received from the exercise of options | $ | 53 | | $ | 77 | | $ | 109 | |
Total intrinsic value of options exercised 1 | $ | 9 | | $ | 40 | | $ | 73 | |
| Related tax benefit | $ | 2 | | $ | 9 | | $ | 16 | |
1.Difference between the market price at exercise and the price paid by the employee to exercise the options.
Total unrecognized compensation cost related to unvested stock option awards of $4 million at December 31, 2024, is expected to be recognized over a weighted-average period of 1.54 years.
Restricted Stock Units
The Company grants RSUs to certain employees and non-employee directors. The grants vest after a designated period of time, one to three years for employees and two years for non-employee directors. The following table shows changes in nonvested RSUs:
| | | | | | | | |
| RSU Awards | 2024 |
| Shares in thousands | Shares | Grant Date Fair Value 1 |
| Nonvested at Jan 1, 2024 | 3,858 | | $ | 57.87 | |
| Granted | 2,104 | | $ | 55.14 | |
| Vested | (1,679) | | $ | 56.86 | |
| Canceled | (158) | | $ | 52.60 | |
| Nonvested at Dec 31, 2024 | 4,125 | | $ | 57.09 | |
1.Weighted-average per share.
| | | | | | | | | | | |
| Additional Information about RSUs | | | |
| In millions, except per share amounts | 2024 | 2023 | 2022 |
| Weighted-average fair value per share of RSUs granted | $ | 55.14 | | $ | 58.39 | | $ | 58.60 | |
Total fair value of RSUs vested 1 | $ | 86 | | $ | 117 | | $ | 102 | |
| Related tax benefit | $ | 19 | | $ | 26 | | $ | 23 | |
| Total compensation expense for RSU awards | $ | 110 | | $ | 103 | | $ | 99 | |
| Related tax benefit | $ | 24 | | $ | 23 | | $ | 22 | |
| | | |
| | | |
1.Includes the fair value of shares vested in prior years and delivered in the reporting year.
Total unrecognized compensation cost related to RSU awards of $90 million at December 31, 2024 is expected to be recognized over a weighted-average period of 1.75 years. At December 31, 2024, approximately 1.8 million RSUs with a grant date weighted-average fair value per share of $57.81 had previously vested, but were not issued. These shares are scheduled to be issued to employees within six months to three years or to non-employee directors upon retirement.
Performance Stock Units
The Company grants PSUs to certain employees. The grants vest when the Company attains specified performance targets, such as return on capital, cumulative cash from operations, environmental, social and governance metrics, and relative total shareholder return, over a predetermined period, generally one year to three years. Performance and payouts are determined independently for each metric. Compensation expense related to PSU awards is recognized over the lesser of the service or performance period. Changes in the fair value of liability instruments are recognized as compensation expense each quarter.
The following table shows the PSU awards granted:
| | | | | | | | | | | |
| PSU Awards | Target Shares Granted 1 | Grant Date Fair Value 2 |
| Shares in thousands |
| Year | Performance Period |
| 2024 | Various 3 | 11 | | $ | 51.93 | |
| 2024 | Jan 1, 2024 - Dec 31, 2026 | 1,366 | | $ | 58.43 | |
| 2023 | Dec 18, 2023 – Dec 18, 2026 3 | 13 | | $ | 54.25 | |
| 2023 | Jan 1, 2023 – Dec 31, 2025 | 1,233 | | $ | 64.04 | |
| 2022 | Jan 1, 2022 – Dec 31, 2024 | 1,157 | | $ | 65.83 | |
| | | |
| | | |
| | | |
1.At the end of the performance period, the actual number of shares issued can range from zero to 200 percent of target shares granted for the Jan 1 - Dec 31, 2024, 2023 and 2022 awards, and zero to 100 percent of target shares granted for the Dec 18, 2023 - Dec 18, 2026 and various 2024 awards.
2.Weighted-average per share.
3.PSU awards granted with a three-year performance period and vest based on completion of a Company initiative.
The following table shows changes in nonvested PSUs:
| | | | | | | | |
| PSUs | 2024 |
| Shares in thousands | Shares | Grant Date Fair Value 1 |
| Nonvested at Jan 1, 2024 | 3,425 | | $ | 63.76 | |
| Granted | 1,377 | | $ | 58.38 | |
Vested 2 | (1,140) | | $ | 55.42 | |
| Canceled | (43) | | $ | 52.02 | |
| Nonvested at Dec 31, 2024 | 3,619 | | $ | 62.44 | |
1.Weighted-average per share.
2.1,140,477 granted shares were issued at 200 percent.
| | | | | | | | | | | |
| Additional Information about PSUs | | | |
| In millions, except share amounts | 2024 | 2023 | 2022 |
Total fair value of PSUs vested and delivered 1 | $ | 127 | | $ | 77 | | $ | 51 | |
| Related tax benefit | $ | 28 | | $ | 17 | | $ | 11 | |
| Total compensation expense for PSU awards | $ | 9 | | $ | 67 | | $ | 70 | |
| Related tax benefit | $ | 2 | | $ | 15 | | $ | 16 | |
Shares of PSUs settled in cash (in thousands) 2 | 398 | | 369 | | 162 | |
Total cash paid to settle PSUs 3 | $ | 44 | | $ | 21 | | $ | 10 | |
1.Includes the fair value of shares vested in prior years and delivered at 200 percent in the reporting year.
2.PSU awards vested in prior years and delivered in the reporting year at 200 percent.
3.Cash paid to certain executive employees for PSU awards vested in prior periods and delivered in the reporting year, equal to the value of the stock award on the date of delivery.
Total unrecognized compensation cost related to PSU awards of $27 million at December 31, 2024, is expected to be recognized over a weighted-average period of 1.69 years.
Employee Stock Purchase Plan
The Board unanimously approved the Dow Inc. 2021 Employee Stock Purchase Plan (the "2021 ESPP"), which was approved by the Company's stockholders at the 2021 Annual Meeting of Stockholders held on April 15, 2021. Under the 2024 ESPP offering, most employees were eligible to purchase shares of common stock of Dow Inc. valued at up to 10 percent of their annual total base salary or wages. The number of shares purchased was determined using the amount contributed by the employee divided by the plan price. The plan price of the stock was equal to 85 percent of the fair market value (closing price) of the common stock at April 1, 2024 (beginning) or October 4, 2024 (ending) of the offering period, whichever was lower.
In 2024, employees subscribed to the right to purchase approximately 2.4 million shares at a weighted-average price of $47.04 per share. The plan price was fixed upon the close of the offering period. The shares were delivered to employees in the fourth quarter of 2024.
In 2023, employees subscribed to the right to purchase approximately 2.6 million shares at a weighted-average price of $42.27 per share. The plan price was fixed upon the close of the offering period. The shares were delivered to employees in the fourth quarter of 2023.
In 2022, employees subscribed to the right to purchase approximately 2.7 million shares at a weighted-average price of $37.75 per share. The plan price was fixed upon the close of the offering period. The shares were delivered to employees in the fourth quarter of 2022.
| | | | | | | | | | | | |
| Additional Information about Employee Stock Purchase Plan | | | | |
| In millions, except per share amounts | 2024 | 2023 | 2022 | |
| Weighted-average fair value per share of purchase rights granted | $ | 11.71 | | $ | 11.75 | | $ | 14.28 | | |
| Total compensation expense for ESPP | $ | 27 | | $ | 29 | | $ | 29 | | |
| Related tax benefit | $ | 6 | | $ | 6 | | $ | 7 | | |
| Total amount of cash received from the exercise of purchase rights | $ | 113 | | $ | 111 | | $ | 103 | | |
Total intrinsic value of purchase rights exercised 1 | $ | 20 | | $ | 20 | | $ | 18 | | |
| Related tax benefit | $ | 4 | | $ | 4 | | $ | 4 | | |
1.Difference between the market price at exercise and the price paid by the employee to exercise the purchase rights.
NOTE 21 – FINANCIAL INSTRUMENTS
Refer to Note 22 for a summary of the fair value of financial instruments at December 31, 2024 and 2023.
Debt Securities
The Company’s investments in debt securities are primarily classified as available-for-sale. The following table provides the investing results from available-for-sale securities for the years ended December 31, 2024, 2023 and 2022.
| | | | | | | | | | | |
| Investing Results | | | |
| In millions | 2024 | 2023 | 2022 |
| Proceeds from sales of available-for-sale securities | $ | 1,821 | | $ | 985 | | $ | 543 | |
| Gross realized gains | $ | 36 | | $ | 89 | | $ | 43 | |
| Gross realized losses | $ | 21 | | $ | 26 | | $ | 45 | |
The following table summarizes the contractual maturities of the Company’s investments in debt securities:
| | | | | | | | |
| Contractual Maturities of Debt Securities at Dec 31, 2024 | Cost | Fair
Value |
| In millions |
| Within one year | $ | 88 | | $ | 78 | |
| One to five years | 1,224 | | 1,118 | |
| Six to ten years | 426 | | 405 | |
| After ten years | 537 | | 432 | |
| Total | $ | 2,275 | | $ | 2,033 | |
Portfolio managers regularly review the Company’s holdings to determine if any investments in debt securities are other-than-temporarily impaired. The analysis includes reviewing the amount of the impairment, as well as the length of time it has been impaired.
The credit rating of the issuer, current credit rating trends, the trends of the issuer’s overall sector, the ability of the issuer to pay expected cash flows and the length of time the security has been in a loss position are considered in
determining whether unrealized losses represent an other-than-temporary impairment. The Company did not have any credit-related losses in 2024, 2023 or 2022.
The following table provides the fair value and gross unrealized losses of the Company’s investments in debt securities that were deemed to be temporarily impaired at December 31, 2024 and 2023, aggregated by investment category:
| | | | | | | | | | | | | | | | | | | | |
Temporarily Impaired Debt Securities at
Dec 31 | Less than 12 months | 12 months or more | Total |
Fair
Value | Unrealized
Losses | Fair
Value | Unrealized
Losses | Fair Value | Unrealized Losses |
| In millions |
| 2024 | | | | | | |
Government debt 1 | $ | 388 | | $ | (18) | | $ | 482 | | $ | (105) | | $ | 870 | | $ | (123) | |
| Corporate bonds | 334 | | (55) | | 486 | | (83) | | 820 | | (138) | |
| Total temporarily impaired debt securities | $ | 722 | | $ | (73) | | $ | 968 | | $ | (188) | | $ | 1,690 | | $ | (261) | |
| 2023 | | | | | | |
Government debt 1 | $ | 37 | | $ | (2) | | $ | 546 | | $ | (105) | | $ | 583 | | $ | (107) | |
| Corporate bonds | 255 | | (98) | | 660 | | (93) | | 915 | | (191) | |
| Total temporarily impaired debt securities | $ | 292 | | $ | (100) | | $ | 1,206 | | $ | (198) | | $ | 1,498 | | $ | (298) | |
1.U.S. Treasury obligations, U.S. agency obligations, U.S. agency mortgage-backed securities and other municipalities' obligations.
Equity Securities
There were no material adjustments to the carrying value of the not readily determinable investments for impairment or observable price changes for the year ended December 31, 2024. The net unrealized gain recognized in earnings on equity securities totaled $1 million for the year ended December 31, 2024 ($7 million net unrealized gain for the year ended December 31, 2023).
| | | | | | | | |
| Investments in Equity Securities | Dec 31, 2024 | Dec 31, 2023 |
| In millions |
| Readily determinable fair value | $ | 14 | | $ | 17 | |
| Not readily determinable fair value | $ | 153 | | $ | 171 | |
Risk Management
The Company’s business operations give rise to market risk exposure due to changes in foreign exchange rates, interest rates, commodity prices and other market factors such as equity prices. To manage such risks effectively, the Company enters into hedging transactions, pursuant to established guidelines and policies that enable it to mitigate the adverse effects of financial market risk. Derivatives used for this purpose are designated as hedges per the accounting guidance related to derivatives and hedging activities, where appropriate. A secondary objective is to add value by creating additional non-specific exposure within established limits and policies; derivatives used for this purpose are not designated as hedges. The potential impact of creating such additional exposure is not material to the Company’s results. Accounting guidance requires companies to recognize all derivative instruments as either assets or liabilities at fair value.
The Company’s risk management program for interest rate, foreign currency and commodity risks is based on fundamental, mathematical and technical models that take into account the implicit cost of hedging. Risks created by derivative instruments and the mark-to-market valuations of positions are strictly monitored at all times, using value-at-risk and stress tests. Counterparty credit risk arising from these contracts is not significant because the Company minimizes counterparty concentration, deals primarily with major financial institutions of solid credit quality, and the majority of its hedging transactions mature in less than three months. In addition, the Company minimizes concentrations of credit risk through its global orientation by transacting with large, internationally diversified financial counterparties. It is the Company’s policy to not have credit risk-related contingent features in its derivative instruments. No significant concentration of counterparty credit risk existed at December 31, 2024. The Company does not anticipate losses from credit risk, and the net cash requirements arising from counterparty risk associated with risk management activities are not expected to be material in 2025.
The Company revises its strategies as market conditions dictate and management reviews its overall financial strategies and the impacts from using derivatives in its risk management program with the Company’s senior leadership who also reviews these strategies with the Board and/or relevant committees thereof.
Derivative Instruments
The notional amounts of the Company's derivative instruments at December 31, 2024 and 2023, were as follows:
| | | | | | | | |
Notional Amounts 1 | Dec 31, 2024 | Dec 31, 2023 |
| In millions |
| Derivatives designated as hedging instruments | | |
| Interest rate contracts | $ | 1,870 | | $ | 3,000 | |
| Foreign currency contracts | $ | 3,144 | | $ | 2,316 | |
| Derivatives not designated as hedging instruments | | |
| Interest rate contracts | $ | 14 | | $ | 59 | |
| Foreign currency contracts | $ | 9,244 | | $ | 5,824 | |
1.Notional amounts represent the absolute value of open derivative positions at the end of the period. Multi-leg option positions are reflected at the maximum notional position at expiration.
The notional amounts of the Company's commodity derivatives at December 31, 2024 and 2023, were as follows:
| | | | | | | | | | | |
Commodity Notionals 1 | Dec 31, 2024 | Dec 31, 2023 | Notional Volume Unit |
|
| Derivatives designated as hedging instruments | | | |
| Hydrocarbon derivatives | 3.2 | | 3.7 | | million barrels of oil equivalent |
| | | |
| | | |
| | | |
| | | |
| | | |
| Derivatives not designated as hedging instruments | | | |
| Hydrocarbon derivatives | 1.1 | | 1.4 | | million barrels of oil equivalent |
| | | |
| | | |
| | | |
| | | |
1.Notional amounts represent the net volume of open derivative positions outstanding at the end of the period.
| | | | | |
| Maturity Dates of Derivatives Designated as Hedging Instruments | Year |
| Interest rate contracts | 2025 |
| Foreign currency contracts | 2026 |
| Commodity contracts | 2028 |
Interest Rate Risk Management
The main objective of interest rate risk management is to reduce the total funding cost to the Company and to alter the interest rate exposure to the desired risk profile. To achieve this objective, the Company hedges using interest rate swaps, “swaptions,” and exchange-traded instruments.
Foreign Currency Risk Management
The global nature of the Company's business requires active participation in the foreign exchange markets. The Company has assets, liabilities and cash flows in currencies other than the U.S. dollar. The primary objective of the Company's foreign currency risk management is to optimize the U.S. dollar value of net assets and cash flows. To achieve this objective, the Company hedges on a net exposure basis using foreign currency forward contracts, over-the-counter option contracts, cross-currency swaps and nonderivative instruments in foreign currencies. Exposures primarily relate to assets, liabilities and bonds denominated in foreign currencies, as well as economic exposure, which is derived from the risk that currency fluctuations could affect the dollar value of future cash flows related to operating activities.
Commodity Risk Management
The Company has exposure to the prices of commodities in its procurement of certain raw materials. The primary purpose of commodity hedging activities is to manage the price volatility associated with these forecasted inventory purchases.
Derivatives Not Designated in Hedging Relationships
Foreign Currency Contracts
The Company also uses foreign exchange forward contracts, options and cross-currency swaps that are not designated as hedging instruments primarily to manage foreign currency exposure.
Commodity Contracts
The Company utilizes futures, options and swap instruments that are effective as economic hedges of commodity price exposures, but do not meet hedge accounting criteria for derivatives and hedging, to reduce exposure to commodity price fluctuations on purchases of raw materials and inventory.
Interest Rate Contracts
The Company uses swap instruments that are not designated as hedging instruments to manage interest rate exposures. The Company uses interest rate swaps, "swaptions," and exchange-traded instruments to accomplish this objective.
Total Return Swaps
The Company uses total return swaps that are not designated as hedging instruments to manage equity indexed based exposures in employee benefit plans.
Accounting for Derivative Instruments and Hedging Activities
Cash Flow Hedges
For derivatives that are designated and qualify as cash flow hedging instruments, the gain or loss on the derivative is recorded in AOCL; it is reclassified to income in the same period or periods that the hedged transaction affects income. The unrealized amounts in AOCL fluctuate based on changes in the fair value of open contracts at the end of each reporting period. The Company anticipates volatility in AOCL and net income from its cash flow hedges. The amount of volatility varies with the level of derivative activities and market conditions during any period.
The portion of the mark-to-market effects of the foreign currency contracts is recorded in AOCL; it is reclassified to income in the same period or periods that the underlying item affects income, except for amounts excluded from the assessment of effectiveness that are recognized in earnings through an amortization approach.
Commodity swaps, futures and option contracts with maturities of not more than 60 months are utilized and designated as cash flow hedges of forecasted commodity purchases. The designated portion of the mark-to-market effect of the cash flow hedge instrument is recorded in AOCL; it is reclassified to income in the same period or periods that the underlying commodity purchase affects income.
Fair Value Hedges
For interest rate instruments that are designated and qualify as fair value hedges, the gain or loss on the derivative as well as the offsetting loss or gain on the hedge item attributable to the hedged risk are recognized in current period income and reflected as “Interest expense and amortization of debt discount” in the consolidated statements of income, except for amounts excluded from the assessment of effectiveness that are recognized in earnings through an amortization approach.
Net Foreign Investment Hedges
The Company designates derivatives that qualify as effective net foreign investment hedges, the results of which are presented in the effect of derivative instruments table. The Company also utilizes non-derivative instruments as net foreign investment hedges. The Company had outstanding foreign-currency denominated debt designated as a hedge of net foreign investment of $2,466 million at December 31, 2024 ($2,629 million at December 31, 2023).
The following tables provide the fair value and balance sheet classification of derivative instruments at December 31, 2024 and 2023:
| | | | | | | | | | | | | | | | | | | | |
| Fair Value of Derivative Instruments | Dec 31, 2024 | Dec 31, 2023 |
| In millions | Gross | Counterparty and Cash Collateral Netting 1 | Net 2 | Gross | Counterparty and Cash Collateral Netting 1 | Net 2 |
| Asset derivatives | | | | | | |
| Derivatives designated as hedging instruments | | | | | | |
Interest rate contracts 3 | $ | 20 | | $ | (20) | | $ | — | | $ | 73 | | $ | (73) | | $ | — | |
Interest rate contracts 4 | — | | — | | — | | 59 | | (56) | | 3 | |
Foreign currency contracts 3 | 33 | | (15) | | 18 | | 21 | | (5) | | 16 | |
Foreign currency contracts 4 | — | | — | | — | | 5 | | — | | 5 | |
Commodity contracts 3 | 25 | | (14) | | 11 | | 27 | | (21) | | 6 | |
Commodity contracts 4 | 46 | | (36) | | 10 | | 2 | | (1) | | 1 | |
| Total | $ | 124 | | $ | (85) | | $ | 39 | | $ | 187 | | $ | (156) | | $ | 31 | |
| Derivatives not designated as hedging instruments | | | | | | |
Interest rate contracts 3 | $ | — | | $ | — | | $ | — | | $ | 4 | | $ | (3) | | $ | 1 | |
| | | | | | |
Foreign currency contracts 3 | 74 | | (16) | | 58 | | 33 | | (16) | | 17 | |
| | | | | | |
Commodity contracts 3 | 16 | | (1) | | 15 | | 33 | | (28) | | 5 | |
Commodity contracts 4 | 4 | | (3) | | 1 | | — | | — | | — | |
| | | | | | |
| Total | $ | 94 | | $ | (20) | | $ | 74 | | $ | 70 | | $ | (47) | | $ | 23 | |
| Total asset derivatives | $ | 218 | | $ | (105) | | $ | 113 | | $ | 257 | | $ | (203) | | $ | 54 | |
| Liability derivatives | | | | | | |
| Derivatives designated as hedging instruments | | | | | | |
Interest rate contracts 5 | $ | 46 | | $ | (20) | | $ | 26 | | $ | 95 | | $ | (73) | | $ | 22 | |
Interest rate contracts 6 | — | | — | | — | | 56 | | (56) | | — | |
Foreign currency contracts 5 | 75 | | (15) | | 60 | | 8 | | (5) | | 3 | |
Foreign currency contracts 6 | 40 | | — | | 40 | | — | | — | | — | |
Commodity contracts 5 | 16 | | (14) | | 2 | | 34 | | (22) | | 12 | |
Commodity contracts 6 | 37 | | (36) | | 1 | | 2 | | (1) | | 1 | |
| Total | $ | 214 | | $ | (85) | | $ | 129 | | $ | 195 | | $ | (157) | | $ | 38 | |
| Derivatives not designated as hedging instruments | | | | | | |
Interest rate contracts 5 | $ | 1 | | $ | — | | $ | 1 | | $ | 3 | | $ | (3) | | $ | — | |
| | | | | | |
Foreign currency contracts 5 | 27 | | (16) | | 11 | | 38 | | (16) | | 22 | |
| | | | | | |
Commodity contracts 5 | 8 | | (1) | | 7 | | 34 | | (28) | | 6 | |
Commodity contracts 6 | 4 | | (3) | | 1 | | — | | — | | — | |
| Total | $ | 40 | | $ | (20) | | $ | 20 | | $ | 75 | | $ | (47) | | $ | 28 | |
| Total liability derivatives | $ | 254 | | $ | (105) | | $ | 149 | | $ | 270 | | $ | (204) | | $ | 66 | |
1.Counterparty and cash collateral amounts represent the estimated net settlement amount when applying netting and set-off rights included in master netting arrangements between the Company and its counterparties and the payable or receivable for cash collateral held or placed with the same counterparty.
2.Represents the net amounts included in the consolidated balance sheets.
3.Included in "Other current assets" in the consolidated balance sheets.
4.Included in "Deferred charges and other assets" in the consolidated balance sheets.
5.Included in "Accrued and other current liabilities" in the consolidated balance sheets.
6.Included in "Other noncurrent obligations" in the consolidated balance sheets.
Assets and liabilities related to forward contracts, interest rate swaps, currency swaps, options and other conditional or exchange contracts executed with the same counterparty under a master netting arrangement are netted. Collateral accounts are netted with corresponding assets or liabilities, when applicable. The Company posted cash collateral of $16 million at December 31, 2024 ($22 million at December 31, 2023). No cash collateral was posted by counterparties with the Company at December 31, 2024 and December 31, 2023.
The following table summarizes the gain (loss) of derivative instruments in the consolidated statements of income and comprehensive income for the years ended December 31, 2024, 2023 and 2022:
| | | | | | | | | | | | | | | | | | | | |
| Effect of Derivative Instruments | Gain (loss) recognized in OCI 1 | Gain (loss) recognized in income 2 |
| In millions | 2024 | 2023 | 2022 | 2024 | 2023 | 2022 |
| Derivatives designated as hedging instruments: | | | | | | |
| Fair value hedges: | | | | | | |
Interest rate contracts 3, 4 | $ | — | | $ | — | | $ | — | | $ | (40) | | $ | — | | $ | — | |
Excluded components 3, 5 | 6 | | (18) | | — | | — | | — | | — | |
| Cash flow hedges: | | | | | | |
Interest rate contracts 3 | 8 | | 5 | | 239 | | (13) | | (10) | | (10) | |
Foreign currency contracts 6 | (72) | | 20 | | 5 | | 6 | | 2 | | 13 | |
| | | | | | |
Commodity contracts 6 | 28 | | (152) | | 166 | | — | | (242) | | 310 | |
Excluded components 5, 6 | (8) | | (4) | | — | | (7) | | — | | — | |
| Net foreign investment hedges: | | | | | | |
| Foreign currency contracts | 20 | | 60 | | 34 | | — | | — | | — | |
Excluded components 5, 7 | 26 | | 36 | | 59 | | 18 | | 29 | | 44 | |
| Total derivatives designated as hedging instruments | $ | 8 | | $ | (53) | | $ | 503 | | $ | (36) | | $ | (221) | | $ | 357 | |
| Derivatives not designated as hedging instruments: | | | | | | |
Interest rate contracts 3 | $ | — | | $ | — | | $ | — | | $ | — | | $ | — | | $ | (1) | |
Foreign currency contracts 7 | — | | — | | — | | 183 | | (156) | | (249) | |
Commodity contracts 6 | — | | — | | — | | 12 | | 1 | | 48 | |
Total return swap 6 | — | | — | | — | | 44 | | 14 | | — | |
| Total derivatives not designated as hedging instruments | $ | — | | $ | — | | $ | — | | $ | 239 | | $ | (141) | | $ | (202) | |
| Total derivatives | $ | 8 | | $ | (53) | | $ | 503 | | $ | 203 | | $ | (362) | | $ | 155 | |
1.OCI is defined as other comprehensive income (loss).
2.Pretax amounts.
3.Included in "Interest expense and amortization of debt discount" in the consolidated statements of income.
4.Gain (loss) recognized in income of derivatives is offset by gain (loss) recognized in income of the hedged item.
5.The excluded components are related to the time value of the derivatives designated as hedges.
6.Included in "Cost of sales" in the consolidated statements of income.
7.Included in "Sundry income (expense) - net" in the consolidated statements of income.
The following table provides the net after-tax gain (loss) expected to be reclassified from AOCL to income within the next 12 months:
| | | | | |
| Expected Reclassifications from AOCL within the next 12 months | Dec 31,
2024 |
| Cash flow hedges: | |
| Interest rate contracts | $ | (4) | |
| Commodity contracts | $ | 9 | |
| Foreign currency contracts | $ | 6 | |
| Excluded components | $ | (4) | |
| Net foreign investment hedges: | |
| Excluded components | $ | 5 | |
NOTE 22 – FAIR VALUE MEASUREMENTS
Fair Value Measurements on a Recurring Basis
The following table summarizes the bases used to measure certain assets and liabilities at fair value on a recurring basis:
| | | | | | | | | | | | | | | | | | | | | | | | | | | | | |
| Fair Value Measurements on a Recurring Basis | | Dec 31, 2024 | Dec 31, 2023 |
| In millions | Fair Value Level | Cost | Gain | Loss | Fair Value | Cost | Gain | Loss | Fair Value |
| Assets at fair value: | | | | | | | | | |
| Cash equivalents: | | | | | | | | | |
Held-to-maturity securities 1 | Level 2 | $ | 96 | | $ | — | | $ | — | | $ | 96 | | $ | 485 | | $ | — | | $ | — | | $ | 485 | |
| Money market funds | Level 2 | 1,164 | | — | | — | | 1,164 | | 663 | | — | | — | | 663 | |
Marketable securities 2 | Level 2 | 453 | | — | | (70) | | 383 | | 1,361 | | — | | (61) | | 1,300 | |
Nonconsolidated affiliates 3 | Level 3 | | | | — | | | | | 7 | |
| Other investments: | | | | | | | | | |
Debt securities: 4 | | | | | | | | | |
Government debt 5 | Level 2 | 1,103 | | 13 | | (123) | | 993 | | 766 | | 3 | | (107) | | 662 | |
| Corporate bonds | Level 1 | 18 | | — | | (1) | | 17 | | 24 | | — | | (3) | | 21 | |
| Corporate bonds | Level 2 | 954 | | 6 | | (88) | | 872 | | 1,148 | | 17 | | (99) | | 1,066 | |
| Corporate bonds | Level 3 | 200 | | — | | (49) | | 151 | | 200 | | — | | (89) | | 111 | |
Equity securities 4, 6 | Level 1 | 4 | | 10 | | — | | 14 | | 5 | | 12 | | — | | 17 | |
Derivatives relating to: 7 | | | | | | | | | |
| Interest rates | Level 2 | — | | 20 | | — | | 20 | | — | | 136 | | — | | 136 | |
| Foreign currency | Level 2 | — | | 107 | | — | | 107 | | — | | 59 | | — | | 59 | |
| Commodities | Level 1 | — | | 4 | | — | | 4 | | — | | 2 | | — | | 2 | |
| Commodities | Level 2 | — | | 87 | | — | | 87 | | — | | 60 | | — | | 60 | |
| Total assets at fair value | | | | | $ | 3,908 | | | | | $ | 4,589 | |
| Liabilities at fair value: | | | | | | | | | |
Long-term debt including debt due within one year 8 | Level 2 | $ | (16,208) | | $ | 1,487 | | $ | (484) | | $ | (15,205) | | $ | (15,024) | | $ | 1,089 | | $ | (747) | | $ | (14,682) | |
Guarantee liability 9 | Level 3 | | | | (155) | | | | | (178) | |
Derivatives relating to: 7 | | | | | | | | | |
| Interest rates | Level 2 | — | | — | | (47) | | (47) | | — | | — | | (154) | | (154) | |
| Foreign currency | Level 2 | — | | — | | (142) | | (142) | | — | | — | | (46) | | (46) | |
| Commodities | Level 1 | — | | — | | (1) | | (1) | | — | | — | | (2) | | (2) | |
| Commodities | Level 2 | — | | — | | (64) | | (64) | | — | | — | | (68) | | (68) | |
| Total liabilities at fair value | | | | | $ | (15,614) | | | | | $ | (15,130) | |
1.The Company's held-to-maturity securities primarily relate to treasury bills and time deposits and are included in "Cash and cash equivalents" in the consolidated balance sheets.
2.The Company's investments in marketable securities are included in "Other current assets" in the consolidated balance sheets.
3.Estimated asset for an investment in a limited liability company included in "Investment in nonconsolidated affiliates" in the consolidated balance sheets.
4.The Company's investments in debt securities, which are primarily available-for-sale, and equity securities are included in "Other investments" in the consolidated balance sheets.
5.U.S. Treasury obligations, U.S. agency obligations, U.S. agency mortgage-backed securities and other municipalities' obligations.
6.Equity securities with a readily determinable fair value.
7.See Note 21 for the classification of derivatives in the consolidated balance sheets.
8.Cost includes fair value hedge adjustment gains of $9 million at December 31, 2024 and $49 million at December 31, 2023 on $5,129 million of debt at December 31, 2024 and $4,479 million of debt at December 31, 2023.
9.Estimated liability for TDCC's guarantee of Sadara's debt which is included in "Other noncurrent obligations" in the consolidated balance sheets. See Note 15 for additional information.
Cost approximates fair value for all other financial instruments.
For assets and liabilities classified as Level 1 measurements (measured using quoted prices in active markets), total fair value is either the price of the most recent trade at the time of the market close or the official close price, as defined by the exchange on which the asset is most actively traded on the last trading day of the period, multiplied by the number of units held without consideration of transaction costs.
For assets and liabilities classified as Level 2 measurements, where the security is frequently traded in less active markets, fair value is based on the closing price at the end of the period; where the security is less frequently traded, fair value is based on the price a dealer would pay for the security or similar securities, adjusted for any terms specific to that asset or liability, or by using observable market data points of similar, more liquid securities to imply the price. Market inputs are obtained from well-established and recognized vendors of market data and subjected to tolerance and quality checks.
For derivative assets and liabilities, standard industry models are used to calculate the fair value of the various financial instruments based on significant observable market inputs, such as foreign exchange rates, commodity prices, swap rates, interest rates and implied volatilities obtained from various market sources. Market inputs are obtained from well-established and recognized vendors of market data and subjected to tolerance/quality checks.
For all other assets and liabilities for which observable inputs are used, fair value is derived through the use of fair value models, such as a discounted cash flow model or other standard pricing models. See Note 21 for further information on the types of instruments used by the Company for risk management.
There were no transfers between Levels 1 and 2 in the years ended December 31, 2024 and 2023.
For assets classified as Level 3 measurements, fair value is based on significant unobservable inputs including assumptions where there is little, if any, market activity. The Level 3 asset value represents the fair value of an investment in a corporate bond, accounted for as a debt security. At December 31, 2023, the level 3 asset values also included an investment in a limited liability company, accounted for as an investment in nonconsolidated affiliates, and with no unfunded commitment.
The following table summarizes the changes in fair value measurements of the investment in a corporate bond using Level 3 inputs for the year ended December 31, 2024:
| | | | | | | | |
| Fair Value Measurements Using Level 3 Inputs for Investment in Corporate Bond at Dec 31, | 2024 | 2023 |
| In millions |
| Balance at Jan 1 | $ | 111 | | $ | — | |
Recognition of asset 1 | — | | 200 | |
Gain (Loss) included in AOCL 2 | 40 | | (89) | |
| Balance at Dec 31 | $ | 151 | | $ | 111 | |
1.Included in "Other investments" in the consolidated balance sheets.
2.Included in "Accumulated other comprehensive loss" in the consolidated balance sheets.
For liabilities classified as Level 3 measurements, the fair value is based on significant unobservable inputs including assumptions where there is little, if any, market activity. The fair value of the Company’s accrued liability related to the guarantee of Sadara's debt is in proportion to the Company's 35 percent ownership interest in Sadara. The estimated fair value of the guarantee was calculated using a "with" and "without" method. The fair value of the debt was calculated "with" the guarantee less the fair value of the debt "without" the guarantee. The "with" and "without" values were calculated using a discounted cash flow method based on contractual cash flows as well as projected prepayments made on the debt by Sadara. See Note 15 for further information on guarantees classified as Level 3 measurements.
The following table summarizes the changes in fair value measurements using Level 3 inputs for the years ended December 31, 2024 and 2023:
| | | | | | | | |
| Fair Value Measurements Using Level 3 Inputs for Accrued Liability of Sadara Guarantee at Dec 31, | 2024 | 2023 |
| In millions |
| Balance at Jan 1 | $ | (178) | | $ | (199) | |
| | |
Gain included in earnings 1 | 23 | | 21 | |
| Balance at Dec 31 | $ | (155) | | $ | (178) | |
1.Included in "Equity in earnings (losses) of nonconsolidated affiliates" in the consolidated income statements.
For equity securities calculated at net asset value per share (or its equivalent), the Company had $90 million in private equity and $15 million in real estate at December 31, 2024 ($86 million in private equity and $18 million in real estate at December 31, 2023). There are no redemption restrictions and the unfunded commitments on these investments were $81 million at December 31, 2024 ($75 million at December 31, 2023).
Fair Value Measurements on a Nonrecurring Basis
The following table summarizes the bases used to measure certain assets at fair value on a nonrecurring basis in the consolidated balance sheets:
| | | | | | | | | |
| Basis of Fair Value Measurements on a Nonrecurring Basis at Dec 31 | | (Level 3) | Total Losses |
| In millions |
| 2024 | | | |
| Assets at fair value: | | | |
| Long-lived assets and other assets | | $ | 60 | | $ | 53 | |
| 2023 | | | |
| Assets at fair value: | | | |
| Long-lived assets and other assets | | $ | 9 | | $ | 191 | |
| | | |
| | | |
| | | |
| | | |
| | | |
2024 Fair Value Measurements on a Nonrecurring Basis
As part of the 2023 Restructuring Program, the Company recorded impairment charges for asset write-downs and write-offs of $8 million related to the shutdown of certain polyurethanes assets (Industrial Intermediates & Infrastructure), $7 million related to the shutdown of certain silicones assets (Performance Materials & Coatings) and $1 million related to Corporate, included in "Restructuring and asset related charges - net" in the consolidated statements of income.
In 2024, the Company recorded impairment charges of $37 million related primarily to write-downs of certain manufacturing assets in the United States and Italy. The assets, classified as Level 3 measurements, were valued at $60 million using unobservable inputs. The impairment charges were included in "Restructuring and asset related charges - net" in the consolidated statements of income and related to Packaging & Specialty Plastics.
2023 Fair Value Measurements on a Nonrecurring Basis
As part of the 2023 Restructuring Program, the Company has or will shut down a number of manufacturing facilities, corporate facilities and miscellaneous assets around the world. The assets associated with this plan were written down to zero. Impairments of leased, non-manufacturing facilities, which were classified as Level 3 measurements, resulted in a write-down of right-of-use assets to a fair value of $9 million using unobservable inputs. The impairment charges related to the 2023 Restructuring Program, totaling $191 million, were included in "Restructuring and asset related charges - net" in the consolidated statements of income and related to Packaging & Specialty Plastics ($1 million), Industrial Intermediates & Infrastructure ($50 million), Performance Materials & Coatings ($49 million) and Corporate ($91 million).
See Note 5 for additional information on the Company's restructuring activities.
The Company's fair value measurements on a nonrecurring basis were insignificant in 2022.
NOTE 23 – VARIABLE INTEREST ENTITIES
Consolidated Variable Interest Entities ("VIEs")
The Company holds a variable interest in the following joint ventures or entities for which it is the primary beneficiary:
Asia Pacific Joint Ventures
The Company has variable interests in two joint ventures that own and operate manufacturing and logistics facilities, which produce chemicals and provide services in Asia Pacific. The Company's variable interests in these joint ventures relate to arrangements between the joint ventures and the Company, involving the majority of the output on take-or-pay terms with pricing ensuring a guaranteed return to the joint ventures.
Ethylene Storage Joint Venture
The Company has variable interests in a joint venture that provides ethylene storage in Alberta, Canada. The Company's variable interests relate to arrangements involving a majority of the joint venture's storage capacity on take-or-pay terms with pricing ensuring a guaranteed return to the joint venture; and favorably priced leases provided to the joint venture. The Company provides the joint venture with operation and maintenance services and utilities.
Accounts Receivable Monetization
The Company holds a variable interest in an entity created to monetize accounts receivable of select European entities. The Company is the primary beneficiary of this entity as a result of holding subordinated notes while maintaining servicing responsibilities for the accounts receivable.
Assets and Liabilities of Consolidated VIEs
The Company's consolidated financial statements include the assets, liabilities and results of operations of VIEs for which the Company is the primary beneficiary. The other equity holders’ interests are reflected in "Net income attributable to noncontrolling interests" in the consolidated statements of income and "Noncontrolling interests" in the consolidated balance sheets.
The following table summarizes the carrying amounts of these entities’ assets and liabilities included in the Company’s consolidated balance sheets at December 31, 2024 and 2023:
| | | | | | | | |
| Assets and Liabilities of Consolidated VIEs at Dec 31 | | |
| In millions | 2024 | 2023 |
| Cash and cash equivalents | $ | 22 | | $ | 26 | |
| Other current assets | 250 | | 130 | |
| Net property | 122 | | 139 | |
| Other noncurrent assets | 15 | | 15 | |
Total assets 1 | $ | 409 | | $ | 310 | |
| Current liabilities | $ | 24 | | $ | 26 | |
| | |
| Other noncurrent obligations | 13 | | 12 | |
Total liabilities 2 | $ | 37 | | $ | 38 | |
1.Restricted assets totaled $192 million and $216 million at December 31, 2024 and 2023, respectively.
2.All liabilities were nonrecourse at December 31, 2024 and 2023.
Amounts presented in the consolidated balance sheets and the table above as restricted assets or nonrecourse obligations relating to consolidated VIEs at December 31, 2024 and 2023, are adjusted for intercompany eliminations.
Upon closing of the transaction discussed in Note 18, Dow InfraCo, LLC is expected to be disclosed as a consolidated VIE of the Company.
Nonconsolidated VIEs
The Company holds a variable interest in the following entities for which the Company is not the primary beneficiary:
Silicon Joint Ventures
The Company holds minority voting interests in certain joint ventures that produce silicon inputs for the Company. These joint ventures operate under supply agreements that sell inventory to the equity owners using pricing mechanisms that guarantee a return, therefore shielding the joint ventures from the obligation to absorb expected losses. As a result of the pricing mechanisms of these agreements, these entities are determined to be VIEs. The Company is not the primary beneficiary, as it does not hold the power to direct the activities that most significantly impact the economic performance of these entities; therefore, the entities are accounted for under the equity method of accounting. The Company's maximum exposure to loss as a result of its involvement with these variable interest entities is determined to be the carrying value of the investment in these entities. At December 31, 2024, the Company's investment in these joint ventures was $143 million ($134 million at December 31, 2023), classified as "Investment in nonconsolidated affiliates" in the consolidated balance sheets, representing the Company's maximum exposure to loss.
NOTE 24 – RELATED PARTY TRANSACTIONS
TDCC has committed to fund Dow Inc.'s dividends paid to common stockholders and share repurchases, as approved by the Board from time to time, as well as certain governance expenses. Funding is accomplished through intercompany loans. TDCC's Board of Directors reviews and determines a dividend distribution to Dow Inc. to settle the intercompany loans. The following table summarizes cash dividends TDCC declared and paid to Dow Inc. for the years ended 2024, 2023 and 2022.
| | | | | | | | | | | |
| TDCC Dividends | 2024 | 2023 | 2022 |
| In millions |
Dividends declared 1 | $ | 2,578 | | $ | 2,510 | | $ | 4,375 | |
| Cash dividends paid | $ | 2,485 | | $ | 2,510 | | $ | 4,375 | |
1.Dividends declared for the year ended December 31, 2024 included $93 million of non-cash dividends.
At December 31, 2024 and 2023, TDCC's intercompany loan balance with Dow Inc. was insignificant.
NOTE 25 – SEGMENTS AND GEOGRAPHIC REGIONS
Sales are attributed to geographic region based on customer location; long-lived assets are attributed to geographic region based on asset location.
| | | | | | | | | | | | | | |
| Geographic Region Information | United
States | EMEAI | Rest of
World | Total |
| In millions |
| 2024 | | | | |
| Sales to external customers | $ | 15,304 | | $ | 13,958 | | $ | 13,702 | | $ | 42,964 | |
| Long-lived assets | $ | 15,216 | | $ | 2,726 | | $ | 4,062 | | $ | 22,004 | |
| 2023 | | | | |
| Sales to external customers | $ | 15,328 | | $ | 14,537 | | $ | 14,757 | | $ | 44,622 | |
| Long-lived assets | $ | 15,012 | | $ | 2,681 | | $ | 3,373 | | $ | 21,066 | |
| 2022 | | | | |
| Sales to external customers | $ | 19,336 | | $ | 19,631 | | $ | 17,935 | | $ | 56,902 | |
| Long-lived assets | $ | 14,638 | | $ | 2,578 | | $ | 3,226 | | $ | 20,442 | |
Dow’s measure of profit/loss for segment reporting purposes is Operating EBIT as this is the manner in which the chief executive officer, chief operating officer, chief financial officer, general counsel and corporate secretary, and senior vice president of corporate development, together the "executive committee" and chief operating decision maker ("CODM"), assesses performance and allocates resources. The CODM compares quarterly results to both the year-ago and sequential periods to assess performance and allocate resources to each segment. The Company defines Operating EBIT as earnings (i.e., "Income before income taxes") before interest, excluding the impact of significant items. Operating EBIT by segment includes all operating items relating to the businesses; items that principally apply to Dow as a whole are assigned to Corporate.
| | | | | | | | | | | | | | |
Segment Operating EBIT 1 | Pack. & Spec. Plastics | Ind. Interm. & Infrast. | Perf. Materials & Coatings | Operating Segment Total |
| In millions |
| 2024 | | | | |
| Net sales | $ | 21,776 | | $ | 11,869 | | $ | 8,574 | | $ | 42,219 | |
| Cost of sales | 18,540 | | 11,215 | | 7,479 | | 37,234 | |
SARD 2 | 977 | | 518 | | 690 | | 2,185 | |
| Equity in earnings (losses) of nonconsolidated affiliates | 81 | | (102) | | 11 | | (10) | |
Other segment income (expense) items 3 | 33 | | 91 | | (98) | | 26 | |
Segment Operating EBIT 4 | $ | 2,373 | | $ | 125 | | $ | 318 | | $ | 2,816 | |
| 2023 | | | | |
| Net sales | $ | 23,149 | | $ | 12,538 | | $ | 8,497 | | $ | 44,184 | |
| Cost of sales | 19,563 | | 11,654 | | 7,548 | | 38,765 | |
SARD 2 | 964 | | 574 | | 690 | | 2,228 | |
| Equity in earnings (losses) of nonconsolidated affiliates | 130 | | (276) | | 20 | | (126) | |
Other segment income (expense) items 3 | (52) | | 90 | | (60) | | (22) | |
Segment Operating EBIT 4 | $ | 2,700 | | $ | 124 | | $ | 219 | | $ | 3,043 | |
| 2022 | | | | |
| Net sales | $ | 29,260 | | $ | 16,606 | | $ | 10,764 | | $ | 56,630 | |
| Cost of sales | 24,564 | | 14,572 | | 8,636 | | 47,772 | |
SARD 2 | 950 | | 594 | | 743 | | 2,287 | |
| Equity in earnings (losses) of nonconsolidated affiliates | 359 | | (91) | | 10 | | 278 | |
Other segment income (expense) items 3 | 5 | | 69 | | (67) | | 7 | |
Segment Operating EBIT 4 | $ | 4,110 | | $ | 1,418 | | $ | 1,328 | | $ | 6,856 | |
1.Significant expense categories are presented on an operating basis, net of the impact of significant items.
2.SARD includes selling, general and administrative and research and development expenses.
3.Other segment items includes amortization of intangibles and sundry income (expense) - net.
4.Segment Operating EBIT for TDCC in 2024, 2023 and 2022, is substantially the same as that of Dow Inc. and therefore is not disclosed separately in the table above. A reconciliation of "Segment Operating EBIT" to "Income before income taxes" is provided in the following table.
| | | | | | | | | | | |
| Reconciliation of "Segment Operating EBIT" to "Income Before Income Taxes" | 2024 | 2023 | 2022 |
| In millions |
| Segment Operating EBIT | $ | 2,816 | | $ | 3,043 | | $ | 6,856 | |
| + Corporate Operating EBIT | (228) | | (265) | | (266) | |
| | | |
| + Interest income | 200 | | 229 | | 173 | |
| - Interest expense and amortization of debt discount | 811 | | 746 | | 662 | |
| + Significant items | (377) | | (1,605) | | (11) | |
| Income before income taxes | $ | 1,600 | | $ | 656 | | $ | 6,090 | |
| | | | | | | | | | | | | | | | | | | | |
| Other Segment Information | Pack. & Spec. Plastics | Ind. Interm. & Infrast. | Perf. Materials & Coatings | Operating Segment Total | Corp. 1 | Total |
| In millions |
| 2024 | | | | | | |
| Net sales | $ | 21,776 | | $ | 11,869 | | $ | 8,574 | | $ | 42,219 | | $ | 745 | | $ | 42,964 | |
| Depreciation and amortization | $ | 1,483 | | $ | 599 | | $ | 776 | | $ | 2,858 | | $ | 36 | | $ | 2,894 | |
| Capital expenditures | $ | 1,949 | | $ | 675 | | $ | 316 | | $ | 2,940 | | $ | — | | $ | 2,940 | |
| Operating EBIT | $ | 2,373 | | $ | 125 | | $ | 318 | | $ | 2,816 | | $ | (228) | | $ | 2,588 | |
| 2023 | | | | | | |
| Net sales | $ | 23,149 | | $ | 12,538 | | $ | 8,497 | | $ | 44,184 | | $ | 438 | | $ | 44,622 | |
| Depreciation and amortization | $ | 1,285 | | $ | 524 | | $ | 778 | | $ | 2,587 | | $ | 24 | | $ | 2,611 | |
| Capital expenditures | $ | 1,457 | | $ | 477 | | $ | 422 | | $ | 2,356 | | $ | — | | $ | 2,356 | |
| Operating EBIT | $ | 2,700 | | $ | 124 | | $ | 219 | | $ | 3,043 | | $ | (265) | | $ | 2,778 | |
| 2022 | | | | | | |
| Net sales | $ | 29,260 | | $ | 16,606 | | $ | 10,764 | | $ | 56,630 | | $ | 272 | | $ | 56,902 | |
| Depreciation and amortization | $ | 1,396 | | $ | 550 | | $ | 789 | | $ | 2,735 | | $ | 23 | | $ | 2,758 | |
| Capital expenditures | $ | 1,069 | | $ | 385 | | $ | 369 | | $ | 1,823 | | $ | — | | $ | 1,823 | |
| Operating EBIT | $ | 4,110 | | $ | 1,418 | | $ | 1,328 | | $ | 6,856 | | $ | (266) | | $ | 6,590 | |
1.Corporate contains the reconciliation between the totals for the operating segments and the Company's totals. Net sales for Corporate are primarily related to insurance operations. Corporate expenses are primarily related to insurance operations, salaries and wages and non-business aligned environmental and legal costs.
| | | | | | | | | | | | | | | | | | | | |
| Segment Asset Information | Pack. & Spec. Plastics | Ind. Interm. & Infrast. | Perf. Materials & Coatings | Operating Segment Total | Corp. | Total |
| In millions |
| 2024 | | | | | | |
| Total assets | $ | 29,034 | | $ | 11,928 | | $ | 11,170 | | $ | 52,132 | | $ | 5,180 | | $ | 57,312 | |
Investments in nonconsolidated affiliates 1 | $ | 711 | | $ | 367 | | $ | 146 | | $ | 1,224 | | $ | 42 | | $ | 1,266 | |
| 2023 | | | | | | |
| Total assets | $ | 28,692 | | $ | 11,993 | | $ | 12,080 | | $ | 52,765 | | $ | 5,202 | | $ | 57,967 | |
Investments in nonconsolidated affiliates 1 | $ | 705 | | $ | 384 | | $ | 136 | | $ | 1,225 | | $ | 42 | | $ | 1,267 | |
| 2022 | | | | | | |
| Total assets | $ | 30,017 | | $ | 12,883 | | $ | 13,028 | | $ | 55,928 | | $ | 4,675 | | $ | 60,603 | |
Investments in nonconsolidated affiliates 1 | $ | 846 | | $ | 454 | | $ | 115 | | $ | 1,415 | | $ | 174 | | $ | 1,589 | |
1.See Note 11 for additional information regarding the Company's investments in nonconsolidated affiliates.
The following tables summarize the pretax impact of significant items by segment that are excluded from Operating EBIT:
| | | | | | | | | | | | | | | | | | | | |
| Significant Items by Segment for 2024 | Pack. & Spec. Plastics | Ind. Interm. & Infrast. | Perf. Materials & Coatings | Operating Segment Total | Corp. | Total |
| In millions |
Restructuring, implementation and efficiency costs, and asset related charges - net 1 | $ | (37) | | $ | (8) | | $ | 11 | | $ | (34) | | $ | (281) | | $ | (315) | |
| | | | | | |
| | | | | | |
| | | | | | |
| | | | | | |
Indemnification and other transaction related costs 2 | — | | — | | — | | — | | (62) | | (62) | |
| Total | $ | (37) | | $ | (8) | | $ | 11 | | $ | (34) | | $ | (343) | | $ | (377) | |
1.Includes restructuring charges and implementation and efficiency costs associated with the Company's 2023 Restructuring Program. Also includes gains associated with a previously impaired equity investment and impairment charges related to the write-down of certain manufacturing assets. See Note 5 for additional information.
2.Includes charges associated with agreements entered into with DuPont and Corteva as part of the separation and distribution which, among other matters, provides for cross-indemnities and allocations of obligations and liabilities for periods prior to, at and after the completion of the separation. Also includes a charge related to an arbitration settlement agreement for historical product claims from a divested business. See Note 15 for additional information.
| | | | | | | | | | | | | | | | | | | | |
| Significant Items by Segment for 2023 | Pack. & Spec. Plastics | Ind. Interm. & Infrast. | Perf. Materials & Coatings | Operating Segment Total | Corp. | Total |
| In millions |
Restructuring, implementation and efficiency costs, and asset related charges - net 1 | $ | (1) | | $ | (50) | | $ | (67) | | $ | (118) | | $ | (623) | | $ | (741) | |
Litigation related charges, awards and adjustments 2 | 106 | | (177) | | — | | (71) | | — | | (71) | |
Argentine peso devaluation 3 | (52) | | (16) | | — | | (68) | | (109) | | (177) | |
Pension settlement charges 4 | — | | — | | — | | — | | (642) | | (642) | |
Indemnification and other transaction related costs 5 | — | | — | | — | | — | | 26 | | 26 | |
| Total | $ | 53 | | $ | (243) | | $ | (67) | | $ | (257) | | $ | (1,348) | | $ | (1,605) | |
1.Includes restructuring charges and implementation and efficiency costs associated with the Company's 2023 Restructuring Program, partially offset by a credit related to a prior restructuring program. Also includes certain gains and losses associated with previously impaired equity investments.
2.Includes a loss associated with legacy agricultural products groundwater contamination matters, partially offset by a gain associated with a legal matter with Nova Chemicals Corporation. See Note 15 for additional information.
3.Foreign currency losses and inventory valuation impacts related to the devaluation of the Argentine peso by the Argentina government in December 2023.
4.Non-cash settlement charges related to the purchase of nonparticipating group annuity contracts for certain Company pension plans in the United States and Canada. See Note 19 for additional information.
5.Primarily related to charges associated with agreements entered into with DuPont and Corteva as part of the separation and distribution which, among other matters, provides for cross-indemnities and allocations of obligations and liabilities for periods prior to, at and after the completion of the separation.
| | | | | | | | | | | | | | | | | | | | |
| Significant Items by Segment for 2022 | Pack. & Spec. Plastics | Ind. Interm. & Infrast. | Perf. Materials & Coatings | Operating Segment Total | Corp. | Total |
| In millions |
Digitalization program costs 1 | $ | — | | $ | — | | $ | — | | $ | — | | $ | (230) | | $ | (230) | |
Restructuring, implementation costs and asset related charges - net 2 | — | | — | | — | | — | | (40) | | (40) | |
Russia / Ukraine conflict charges 3 | (8) | | (73) | | (6) | | (87) | | (31) | | (118) | |
Loss on early extinguishment of debt 4 | — | | — | | — | | — | | (8) | | (8) | |
Litigation related charges, awards and adjustments 5 | 321 | | — | | — | | 321 | | 60 | | 381 | |
Indemnification and other transaction related costs 6 | — | | — | | — | | — | | 4 | | 4 | |
| Total | $ | 313 | | $ | (73) | | $ | (6) | | $ | 234 | | $ | (245) | | $ | (11) | |
1.Includes costs associated with implementing the Company's Digital Acceleration program.
2.Includes costs associated with implementing the Company's 2020 Restructuring Program.
3.Asset related charges due to the Russia and Ukraine conflict. See Note 5 for additional information.
4.The Company redeemed outstanding long-term debt resulting in a loss on early extinguishment. See Note 14 for additional information.
5.Includes a gain associated with a legal matter with Nova Chemicals Corporation and a gain related to an adjustment of the Dow Silicones breast implant liability. See Note 15 for additional information.
6.Primarily related to charges associated with agreements entered into with DuPont and Corteva as part of the separation and distribution which, among other matters, provides for cross-indemnities and allocations of obligations and liabilities for periods prior to, at and after the completion of the separation.
| | |
| ITEM 9. CHANGES IN AND DISAGREEMENTS WITH ACCOUNTANTS ON ACCOUNTING AND FINANCIAL DISCLOSURE |
Not applicable.
| | |
| ITEM 9A. CONTROLS AND PROCEDURES |
Evaluation of Disclosure Controls and Procedures
As of the end of the period covered by this Annual Report on Form 10-K, Dow Inc. and The Dow Chemical Company (the "Companies") carried out an evaluation, under the supervision and with the participation of the Companies' Disclosure Committee and the Companies' management, including the Chief Executive Officer and the Chief Financial Officer, of the effectiveness of the design and operation of the Companies' disclosure controls and procedures pursuant to paragraph (b) of Exchange Act Rules 13a-15 and 15d-15. Based upon that evaluation, the Chief Executive Officer and the Chief Financial Officer concluded that the Companies' disclosure controls and procedures were effective.
Changes in Internal Control Over Financial Reporting
There were no changes in the Companies' internal control over financial reporting identified in connection with the evaluation required by paragraph (d) of Exchange Act Rules 13a-15 and 15d-15 that was conducted during the quarter ended December 31, 2024, that have materially affected, or are reasonably likely to materially affect, the Companies' internal control over financial reporting.
Management’s Report on Internal Control Over Financial Reporting
Management is responsible for establishing and maintaining adequate internal control over financial reporting. The Companies' internal control framework and processes are designed to provide reasonable assurance to management and the Board regarding the reliability of financial reporting and the preparation of the Companies' consolidated financial statements in accordance with accounting principles generally accepted in the United States of America.
The Companies' internal control over financial reporting includes those policies and procedures that:
•pertain to the maintenance of records that, in reasonable detail, accurately and fairly reflect the transactions and dispositions of the assets of the Companies;
•provide reasonable assurance that transactions are recorded as necessary to permit preparation of financial statements in accordance with generally accepted accounting principles, and that receipts and expenditures of the Companies are being made only in accordance with authorizations of management and Directors of the Companies; and
•provide reasonable assurance regarding prevention or timely detection of unauthorized acquisition, use or disposition of the Companies' assets that could have a material effect on the consolidated financial statements.
Because of its inherent limitations, any system of internal control over financial reporting can provide only reasonable assurance and may not prevent or detect misstatements.
Management assessed the effectiveness of the Companies' internal control over financial reporting and concluded that, as of December 31, 2024, such internal control is effective. In making this assessment, management used the criteria set forth by the Committee of Sponsoring Organizations of the Treadway Commission in Internal Control—Integrated Framework (2013).
The Companies' independent auditors, Deloitte & Touche LLP, with direct access to the Board of Directors through the Audit Committee of Dow Inc., have audited the consolidated financial statements prepared by the Companies. Their reports on the consolidated financial statements are included in Part II, Item 8. Financial Statements and Supplementary Data. Deloitte & Touche LLP’s reports on the Companies' internal control over financial reporting are referenced therein and included herein.
REPORT OF INDEPENDENT REGISTERED PUBLIC ACCOUNTING FIRM
To the Stockholders and the Board of Directors of Dow Inc.
Opinion on Internal Control over Financial Reporting
We have audited the internal control over financial reporting of Dow Inc. and subsidiaries (the “Company”) as of December 31, 2024, based on criteria established in Internal Control — Integrated Framework (2013) issued by the Committee of Sponsoring Organizations of the Treadway Commission (“COSO”). In our opinion, the Company maintained, in all material respects, effective internal control over financial reporting as of December 31, 2024, based on criteria established in Internal Control — Integrated Framework (2013) issued by COSO.
We have also audited, in accordance with the standards of the Public Company Accounting Oversight Board (United States) (“PCAOB”), the consolidated financial statements as of and for the year ended December 31, 2024, of the Company and the financial statement schedule listed in the Index at Item 15(a)(2) and our report dated February 4, 2025, expressed an unqualified opinion on those financial statements and financial statement schedule.
Basis for Opinion
The Company’s management is responsible for maintaining effective internal control over financial reporting and for its assessment of the effectiveness of internal control over financial reporting, included in the accompanying Management's Report on Internal Control over Financial Reporting. Our responsibility is to express an opinion on the Company’s internal control over financial reporting based on our audit. We are a public accounting firm registered with the PCAOB and are required to be independent with respect to the Company in accordance with the U.S. federal securities laws and the applicable rules and regulations of the Securities and Exchange Commission and the PCAOB.
We conducted our audit in accordance with the standards of the PCAOB. Those standards require that we plan and perform the audit to obtain reasonable assurance about whether effective internal control over financial reporting was maintained in all material respects. Our audit included obtaining an understanding of internal control over financial reporting, assessing the risk that a material weakness exists, testing and evaluating the design and operating effectiveness of internal control based on the assessed risk, and performing such other procedures as we considered necessary in the circumstances. We believe that our audit provides a reasonable basis for our opinion.
Definition and Limitations of Internal Control over Financial Reporting
A company’s internal control over financial reporting is a process designed to provide reasonable assurance regarding the reliability of financial reporting and the preparation of financial statements for external purposes in accordance with generally accepted accounting principles. A company’s internal control over financial reporting includes those policies and procedures that (1) pertain to the maintenance of records that, in reasonable detail, accurately and fairly reflect the transactions and dispositions of the assets of the company; (2) provide reasonable assurance that transactions are recorded as necessary to permit preparation of financial statements in accordance with generally accepted accounting principles, and that receipts and expenditures of the company are being made only in accordance with authorizations of management and directors of the company; and (3) provide reasonable assurance regarding prevention or timely detection of unauthorized acquisition, use, or disposition of the company’s assets that could have a material effect on the financial statements.
Because of its inherent limitations, internal control over financial reporting may not prevent or detect misstatements. Also, projections of any evaluation of effectiveness to future periods are subject to the risk that controls may become inadequate because of changes in conditions, or that the degree of compliance with the policies or procedures may deteriorate.
| | |
/S/ DELOITTE & TOUCHE LLP |
| Midland, Michigan |
| February 4, 2025 |
REPORT OF INDEPENDENT REGISTERED PUBLIC ACCOUNTING FIRM
To the Stockholder and the Board of Directors of The Dow Chemical Company
Opinion on Internal Control over Financial Reporting
We have audited the internal control over financial reporting of The Dow Chemical Company and subsidiaries (the “Company”) as of December 31, 2024, based on criteria established in Internal Control — Integrated Framework (2013) issued by the Committee of Sponsoring Organizations of the Treadway Commission (“COSO”). In our opinion, the Company maintained, in all material respects, effective internal control over financial reporting as of December 31, 2024, based on criteria established in Internal Control — Integrated Framework (2013) issued by COSO.
We have also audited, in accordance with the standards of the Public Company Accounting Oversight Board (United States) (“PCAOB”), the consolidated financial statements as of and for the year ended December 31, 2024, of the Company and the financial statement schedule listed in the Index at Item 15(a)(2) and our report dated February 4, 2025, expressed an unqualified opinion on those financial statements and financial statement schedule.
Basis for Opinion
The Company’s management is responsible for maintaining effective internal control over financial reporting and for its assessment of the effectiveness of internal control over financial reporting, included in the accompanying Management's Report on Internal Control over Financial Reporting. Our responsibility is to express an opinion on the Company’s internal control over financial reporting based on our audit. We are a public accounting firm registered with the PCAOB and are required to be independent with respect to the Company in accordance with the U.S. federal securities laws and the applicable rules and regulations of the Securities and Exchange Commission and the PCAOB.
We conducted our audit in accordance with the standards of the PCAOB. Those standards require that we plan and perform the audit to obtain reasonable assurance about whether effective internal control over financial reporting was maintained in all material respects. Our audit included obtaining an understanding of internal control over financial reporting, assessing the risk that a material weakness exists, testing and evaluating the design and operating effectiveness of internal control based on the assessed risk, and performing such other procedures as we considered necessary in the circumstances. We believe that our audit provides a reasonable basis for our opinion.
Definition and Limitations of Internal Control over Financial Reporting
A company’s internal control over financial reporting is a process designed to provide reasonable assurance regarding the reliability of financial reporting and the preparation of financial statements for external purposes in accordance with generally accepted accounting principles. A company’s internal control over financial reporting includes those policies and procedures that (1) pertain to the maintenance of records that, in reasonable detail, accurately and fairly reflect the transactions and dispositions of the assets of the company; (2) provide reasonable assurance that transactions are recorded as necessary to permit preparation of financial statements in accordance with generally accepted accounting principles, and that receipts and expenditures of the company are being made only in accordance with authorizations of management and directors of the company; and (3) provide reasonable assurance regarding prevention or timely detection of unauthorized acquisition, use, or disposition of the company’s assets that could have a material effect on the financial statements.
Because of its inherent limitations, internal control over financial reporting may not prevent or detect misstatements. Also, projections of any evaluation of effectiveness to future periods are subject to the risk that controls may become inadequate because of changes in conditions, or that the degree of compliance with the policies or procedures may deteriorate.
| | |
/S/ DELOITTE & TOUCHE LLP |
| Midland, Michigan |
| February 4, 2025 |
| | |
| ITEM 9B. OTHER INFORMATION |
During the fourth quarter ended December 31, 2024, the Company's directors and officers (as defined in Rule 16a-1(f) of the Securities Exchange Act of 1934, as amended) did not adopt, terminate or modify Rule 10b5-1 or non-rule 10b5-1 trading arrangements (as defined in Item 408 of Regulation S-K).
| | |
| Dow Inc. and Subsidiaries |
| The Dow Chemical Company and Subsidiaries |
| PART III |
| | |
| ITEM 10. DIRECTORS, EXECUTIVE OFFICERS AND CORPORATE GOVERNANCE |
Information relating to Directors, certain executive officers and certain corporate governance matters (including identification of members of the Audit Committee of the Board and financial expert(s)) is contained in the definitive Proxy Statement for the 2025 Annual Meeting of Stockholders of Dow Inc. and is incorporated herein by reference. See also the information regarding executive officers of the registrant set forth in Part I, Item 1. Business under the caption "Executive Officers of the Registrant" in reliance on General Instruction G to Form 10-K.
This information is omitted for The Dow Chemical Company pursuant to General Instruction I of Form 10-K.
| | |
| ITEM 11. EXECUTIVE COMPENSATION |
Information relating to executive compensation and the Company's equity compensation plans is contained in the definitive Proxy Statement for the 2025 Annual Meeting of Stockholders of Dow Inc. and is incorporated herein by reference.
This information is omitted for The Dow Chemical Company pursuant to General Instruction I of Form 10-K.
| | |
| ITEM 12. SECURITY OWNERSHIP OF CERTAIN BENEFICIAL OWNERS AND MANAGEMENT AND RELATED STOCKHOLDER MATTERS |
Information with respect to beneficial ownership of Dow Inc. common stock by each Director and all Directors and executive officers of the Company as a group is contained in the definitive Proxy Statement for the 2025 Annual Meeting of Stockholders of Dow Inc. and is incorporated herein by reference.
Information relating to any person who beneficially owns in excess of 5 percent of the total outstanding shares of Dow Inc. common stock is contained in the definitive Proxy Statement for the 2025 Annual Meeting of the Stockholders of Dow Inc. and is incorporated herein by reference.
Information with respect to compensation plans under which equity securities are authorized for issuance is contained in the definitive Proxy Statement for the 2025 Annual Meeting of Stockholders of Dow Inc. and is incorporated herein by reference.
This information is omitted for The Dow Chemical Company pursuant to General Instruction I of Form 10-K.
| | |
| ITEM 13. CERTAIN RELATIONSHIPS AND RELATED TRANSACTIONS, AND DIRECTOR INDEPENDENCE |
Reportable relationships and related transactions, if any, as well as information relating to director independence are contained in the definitive Proxy Statement for the 2025 Annual Meeting of Stockholders of Dow Inc. and are incorporated herein by reference.
This information is omitted for The Dow Chemical Company pursuant to General Instruction I of Form 10-K.
| | |
| ITEM 14. PRINCIPAL ACCOUNTING FEES AND SERVICES |
Independent Registered Public Accountants
Information with respect to fees and services related to the Company's independent auditors, Deloitte & Touche LLP ("Deloitte"), and the disclosure of the preapproval policies and procedures of the Audit Committee of the Board are contained in the definitive Proxy Statement for the 2025 Annual Meeting of Stockholders of Dow Inc. and are incorporated herein by reference.
| | |
| Dow Inc. and Subsidiaries |
| The Dow Chemical Company and Subsidiaries |
| PART IV |
| | |
| ITEM 15. EXHIBITS, FINANCIAL STATEMENT SCHEDULES |
(a) The following documents are filed as part of this report:
(1) The Company’s 2024 Consolidated Financial Statements and the Report of Independent Registered Public Accounting Firm (PCAOB ID: 34) are included in Part II, Item 8. Financial Statements and Supplementary Data.
(2) Financial Statement Schedules – The following Financial Statement Schedule should be read in conjunction with the Consolidated Financial Statements and Report of Independent Registered Public Accounting Firm included in Part II, Item 8. Financial Statements and Supplementary Data: | | | | | |
| Schedule II | Valuation and Qualifying Accounts |
Schedules other than the one listed above are omitted due to the absence of conditions under which they are required or because the information called for is included in the Consolidated Financial Statements or the Notes to the Consolidated Financial Statements.
(3) The following exhibits are filed with or incorporated by reference into this Annual Report on Form 10-K:
| | | | | |
| Exhibit No. | Description of Exhibit |
| |
| 2.1 | |
| |
| 2.2 | |
| |
| 2.3 | |
| |
| 2.3.1 | |
| |
| 3.1 | |
| |
| 3.2 | |
| |
| 3.3 | |
| |
| 3.4 | |
| |
| 4.1 | |
| | | | | | | | | | | | | | |
| 4.1.1 | |
| |
| 4.1.2 | |
| |
| 4.1.3 | |
| |
| 4.2 | |
| |
| 4.2.1 | |
| |
| 4.2.2 | |
| | | | |
| 4.3 | |
| | | | |
| 4.4 | Dow Inc. agrees to provide the SEC, on request, copies of all other such indentures and instruments that define the rights of holders of long-term debt of Dow Inc. and its consolidated subsidiaries, including The Dow Chemical Company, pursuant to Item 601(b)(4)(iii)(A) of Regulation S-K. |
| | | | |
| 4.5 | |
| | | | |
| 10.1 | |
| | | | |
| 10.2 | |
| | | | |
| 10.3 | |
| | | | |
| 10.4 | |
| | | | |
| 10.5 | |
| | | | |
| 10.5.1 | |
| | | | |
| | | | | | | | | | | | | | | | | |
| | | | | |
| 10.5.3 | | |
| | | | | |
| 10.5.5 | | |
| | | | | |
| 10.5.6 | | |
| | | | | |
| 10.5.7 | | |
| | | | | |
| 10.5.8 | | |
| | | | | |
| 10.5.9 | | |
| | | | | |
| 10.5.10 | | |
| | | | | |
| 10.5.11 | | |
| 10.6 | | |
| | | | | |
| 10.7 | | |
| | | | | |
| 10.8 | | |
| | | | | |
| 10.9 | | |
| | | | | |
| 10.10 | | |
| | | | | |
| 10.11 | | |
| | | | | |
| 19* | | |
| | | | | |
| 21* | | |
| | | | | |
| 23.1.1* | | |
| | | | | |
| 23.1.2* | | |
| | | | | |
| 23.2* | | |
| | | | | |
| 31.1* | | |
| | | | | |
| 31.2* | | |
| | | | | |
| | | | | | | | | | | | | | | | | |
| 32.1* | | |
| | | | | |
| 32.2* | | |
| | | | | |
| 97.1 | | |
| | | | | |
| 97.2* | | |
| | | | | |
| 101.INS | The instance document does not appear in the Interactive Data File because its XBRL tags are embedded within the Inline XBRL document. | |
| | | | | |
| 101.SCH | Inline XBRL Taxonomy Extension Schema Document. | |
| 101.CAL | Inline XBRL Taxonomy Extension Calculation Linkbase Document. | |
| | | | | |
| 101.DEF | Inline XBRL Taxonomy Extension Definition Linkbase Document. | |
| | | | | |
| 101.LAB | Inline XBRL Taxonomy Extension Label Linkbase Document. | |
| | | | | |
| 101.PRE | Inline XBRL Taxonomy Extension Presentation Linkbase Document. | |
| | | | | |
| 104 | The cover page interactive data file does not appear in the Interactive Data File because its XBRL tags are embedded within the Inline XBRL document. | |
*Filed herewith
A copy of any exhibit can be obtained via the Internet through the Investor Relations section of the Company's website (www.dow.com/investors), or the Company will provide a copy of any exhibit upon receipt of a written request for the particular exhibit or exhibits desired. All requests should be addressed to the Controller and Vice President of Controllers and Tax of the Company at the address of the Company’s principal executive offices. The referenced website and its content are not deemed incorporated by reference into this report.
| | |
| ITEM 16. FORM 10-K SUMMARY |
Not applicable.
| | | | | | | | |
| Dow Inc. and Subsidiaries | |
| The Dow Chemical Company and Subsidiaries | |
| Valuation and Qualifying Accounts | Schedule II |
| | | | | | | | | | | |
| (In millions) For the years ended Dec 31, | 2024 | 2023 | 2022 |
| Accounts Receivable - Allowance for Doubtful Receivables | | | |
| Balance at beginning of year | $ | 81 | | $ | 110 | | $ | 54 | |
Additions charged to expenses 1 | 28 | | 21 | | 61 | |
| | | |
Deductions from reserves 2 | (14) | | (50) | | (5) | |
| Balance at end of year | $ | 95 | | $ | 81 | | $ | 110 | |
| Inventory - Obsolescence Reserve | | | |
| Balance at beginning of year | $ | 70 | | $ | 57 | | $ | 14 | |
| Additions charged to expenses | 27 | | 20 | | 50 | |
Deductions from reserves 3 | (9) | | (7) | | (7) | |
| Balance at end of year | $ | 88 | | $ | 70 | | $ | 57 | |
| Reserves for Other Investments and Noncurrent Receivables | | | |
| Balance at beginning of year | $ | 1,751 | | $ | 1,950 | | $ | 2,033 | |
Additions charged to expenses 4 | 14 | | 31 | | 17 | |
Deductions from reserves 5 | (115) | | (230) | | (100) | |
| Balance at end of year | $ | 1,650 | | $ | 1,751 | | $ | 1,950 | |
| Deferred Tax Assets - Valuation Allowance | | | |
| Balance at beginning of year | $ | 2,948 | | $ | 1,269 | | $ | 1,391 | |
Additions charged to expenses 6 | 55 | | 1,864 | | 120 | |
| Deductions from reserves | (255) | | (185) | | (242) | |
| Balance at end of year | $ | 2,748 | | $ | 2,948 | | $ | 1,269 | |
1.Additions included a $23 million reclassification from "Reserves for Other Investments and Noncurrent Receivables" in 2024.
2.Deductions included write-offs, recoveries, currency translation adjustments and other miscellaneous items, including a $23 million reclassification to "Reserves for Other Investments and Noncurrent Receivables" in 2023.
3.Deductions included disposals and currency translation adjustments.
4.Additions included a $23 million reclassification from "Accounts Receivable - Allowance for Doubtful Receivables" in 2023.
5.Deductions included a $23 million reclassification to "Accounts Receivable - Allowance for Doubtful Receivables" in 2024, $143 million related to the Company's investment in AgroFresh Solutions Inc., which was converted to cash, in 2023, and $77 million in 2024, 2023 and 2022 related to the Company's investment in Sadara. See Note 11 to the Consolidated Financial Statements for additional information.
6.Additions in 2023 include increases in valuation allowances related to foreign tax assets that are expected to expire without being utilized.
| | | | | | | | | | | | | | |
| | Dow Inc. and Subsidiaries
The Dow Chemical Company and Subsidiaries | | |
| | Signatures | | |
Pursuant to the requirements of Section 13 or 15(d) of the Securities Exchange Act of 1934, the registrant has duly caused this Annual Report on Form 10-K to be signed on its behalf by the undersigned, thereunto duly authorized, on February 4, 2025.
| | |
| DOW INC. |
| THE DOW CHEMICAL COMPANY |
|
| /s/ ANDREA L. DOMINOWSKI |
Andrea L. Dominowski, Controller and Vice President of Controllers
(Authorized Signatory and Principal Accounting Officer) |
Pursuant to the requirements of the Securities Exchange Act of 1934, this Annual Report on Form 10-K has been signed below on February 4, 2025, by the following persons on behalf of the registrant and in the capacities indicated.
| | | | | | | | |
| | |
| /s/ SAMUEL R. ALLEN | | /s/ JEFF M. FETTIG |
| Samuel R. Allen, Director, Dow Inc. | | Jeff M. Fettig, Director, Dow Inc. |
| | |
| /s/ GAURDIE E. BANISTER JR. | | /s/ JIM FITTERLING |
| Gaurdie E. Banister Jr., Director, Dow Inc. | | Jim Fitterling, Director, Chair and Chief Executive Officer, Dow Inc. and TDCC (Principal Executive Officer) |
| | |
| /s/ WESLEY G. BUSH | | /s/ JACQUELINE C. HINMAN |
| Wesley G. Bush, Director, Dow Inc. | | Jacqueline C. Hinman, Director, Dow Inc. |
| | |
| /s/ RICHARD K. DAVIS | | /s/ LUIS ALBERTO MORENO MEJIA |
| Richard K. Davis, Lead Director, Dow Inc. | | Luis Alberto Moreno Mejia, Director, Dow Inc. |
| | |
| /s/ JERRI DEVARD | | /s/ JEFFREY L. TATE |
| Jerri DeVard, Director, Dow Inc. | | Jeffrey L. Tate, Chief Financial Officer, Dow Inc. and TDCC; Director, TDCC
(Principal Financial Officer) |
| | |
| /s/ DEBRA L. DIAL | | /s/ JILL S. WYANT |
| Debra L. Dial, Director, Dow Inc. | | Jill S. Wyant, Director, Dow Inc. |
| | |
| /s/ ANDREA L. DOMINOWSKI | | /s/ DANIEL W. YOHANNES |
| Andrea L. Dominowski, Controller and Vice President of Controllers, Dow Inc. and TDCC (Authorized Signatory and Principal Accounting Officer) | | Daniel W. Yohannes, Director, Dow Inc. |
| | |
| | |
Dow Inc. and Subsidiaries
The Dow Chemical Company and Subsidiaries |
| Trademark Listing |
The following trademarks or service marks of The Dow Chemical Company and certain affiliated companies of Dow appear in this report: ACOUSTICRYL, ACRYSOL, ACUSOL, AMPLIFY, AQUASET, AVANSE, CARBOWAX, DECARBIA, DOW, DOWANOL, DOWFROST, DOWSIL, DOWTHERM, ELEVATE, EVOQUE, FASTRACK, FORMASHIELD, MAINCOTE, PRIMAL, RENUVA, REVOLOOP, RHOPLEX, SENTRY, SILASTIC, SPECFLEX, SUNSPHERES, SYL-OFF, TAMOL, TERGITOL, TRITON, UCAR, UCARSOL, UCON, VERSENE, WALOCEL
The following registered service mark of American Chemistry Council in the United States appears in this report:
Responsible Care®
The following trademark of the Business Intelligence Group™ appears in this report: BIG Innovation Awards
The following trademark of Clarivate™ appears in this report: Top 100 Global Innovators™
The following registered trademark of US Business Leadership Network, Inc. appears in this report: Disability Equality Index ®, Best Places to Work for Disability Inclusion®
The following trademark of The Edison Awards™ appears in this report: Edison Awards™
The following trademark of Evonik Operations GmbH appears in this report: HYPROSYN®
The following trademarks and registered trademarks of Great Place to Work® Institute, Inc. appears in this report: Great Place to Work®, Fortune 100 Best Companies to Work For®
The following trademarks of Ti Gotham Inc. appears in this report: PEOPLE®, PEOPLE® Companies that Care
The following registered trademark of InspereX Holdings LLC appears in this report: InterNotes®
® ™ Trademark of The Dow Chemical Company ("TDCC") or an affiliated company, except as otherwise specified.