UNITED STATES
SECURITIES AND EXCHANGE COMMISSION
Washington, D.C. 20549
__________________________________
FORM 10-K
__________________________________
(Mark One)
| | | | | |
| x | ANNUAL REPORT PURSUANT TO SECTION 13 OR 15(d) OF THE SECURITIES EXCHANGE ACT OF 1934 |
For the fiscal year ended December 31, 2024
OR
| | | | | |
| o | TRANSITION REPORT PURSUANT TO SECTION 13 OR 15(d) OF THE SECURITIES EXCHANGE ACT OF 1934 |
For the transition period from _____to _____
Commission file number: 001-39799
__________________________________
Certara, Inc.
(Exact name of registrant as specified in its charter)
__________________________________
| | | | | |
| Delaware | 82-2180925 |
| (State or other jurisdiction of incorporation or organization) | (I.R.S. Employer Identification No.) |
| |
4 Radnor Corporate Center, Suite 350 Radnor, Pennsylvania | 19087 |
| (Address of principal executive offices) | (Zip Code) |
Registrant’s telephone number, including area code: (415) 237-8272
Securities registered pursuant to Section 12(b) of the Act:
| | | | | | | | | | | | | | |
| Title of each class | | Trading Symbol | | Name of each exchange
on which registered |
| Common stock, par value $0.01 per share | | CERT | | The Nasdaq Stock Market LLC |
Securities registered pursuant to Section 12(g) of the Act: None
Indicate by check mark if the registrant is a well-known seasoned issuer, as defined in Rule 405 of the Securities Act.
Yes x No o
Indicate by check mark if the registrant is not required to file reports pursuant to Section 13 or Section 15(d) of the Act.
Yes o No x
Indicate by check mark whether the registrant (1) has filed all reports required to be filed by Section 13 or 15(d) of the Securities Exchange Act of 1934 during the preceding 12 months (or for such shorter period that the registrant was required to file such reports), and (2) has been subject to such filing requirements for the past 90 days. Yes x No o
Indicate by check mark whether the registrant has submitted electronically every Interactive Data File required to be submitted pursuant to Rule 405 of Regulation S-T (§ 232.405 of this chapter) during the preceding 12 months (or for such shorter period that the registrant was required to submit such files). Yes x No o
Indicate by check mark whether the registrant is a large accelerated filer, an accelerated filer, a non-accelerated filer, a smaller reporting company, or an emerging growth company. See the definitions of “large accelerated filer,” “accelerated filer,” “smaller reporting company,” and “emerging growth company” in Rule 12b-2 of the Exchange Act.
| | | | | |
Large accelerated filer x | Accelerated filer o |
| |
Non-accelerated filer o | Smaller reporting company o |
| |
| Emerging growth company o |
If an emerging growth company, indicate by check mark if the registrant has elected not to use the extended transition period for complying with any new or revised financial accounting standards provided pursuant to Section 13(a) of the Exchange Act. o
Indicate by check mark whether the registrant has filed a report on and attestation to its management’s assessment of the effectiveness of its internal control over financial reporting under Section 404(b) of the Sarbanes-Oxley Act (15 U.S.C. 7262(b)) by the registered public accounting firm that prepared or issued its audit report. x
If securities are registered pursuant to Section 12(b) of the Act, indicate by check mark whether the financial statements of the registrant included in the filing reflect the correction of an error to previously issued financial statements. o
Indicate by check mark whether any of those error corrections are restatements that required a recovery analysis of incentive-based compensation received by any of the registrant’s executive officers during the relevant recovery period pursuant to §240.10D-1(b). o
Indicate by check mark whether the registrant is a shell company (as defined in Rule 12b-2 of the Exchange Act). Yes o No x
The aggregate market value of the registrant’s outstanding voting common stock held by non-affiliates on June 30, 2024, determined using the per share closing price on that date on The Nasdaq Stock Market, LLC was $1.7 billion. There is no non-voting common equity of the registrant outstanding. Shares held by each executive officer and director and by each other person or entity deemed to be an affiliate have been excluded in such calculation. The determination of affiliate status is not necessarily a conclusive determination for other purposes.
As of February 17, 2025, the registrant had 161,017,775 shares of common stock, par value $0.01 per share, outstanding.
DOCUMENTS INCORPORATED BY REFERENCE
Portions of the definitive proxy statement for the registrant’s 2025 Annual Meeting of Stockholders to be held May 21, 2025, which will be filed with the Securities and Exchange Commission within 120 days after the end of the 2024 fiscal year, are incorporated by reference in Part III of this Annual Report on Form 10-K.
Table of Contents
Certara, Inc.
Unless otherwise indicated, references to the “Company,” “Certara,” “we,” “us” and “our” refer to Certara, Inc. and its consolidated subsidiaries.
Our registered trademarks include Certara™, Phoenix™, Simcyp™, Pinnacle 21™, CoAuthor™, GlobalSubmit™, Certara D360™ and VyasaTM. Such terms, when first mentioned in this report, appear with the trade name, trademark or service mark notice and then throughout the remainder of this report without trade name, trademark or service mark notices for convenience only and should not be construed as being used in a descriptive or generic sense.
SPECIAL NOTE REGARDING FORWARD-LOOKING STATEMENTS
This Annual Report on Form 10-K (this “Annual Report”) contains “forward-looking statements” within the meaning of Section 27A of the Securities Act of 1933, as amended (the “Securities Act”), and Section 21E of the Securities Exchange Act of 1934, as amended (the “Exchange Act”), which are subject to the “safe harbor” created by those sections. All statements (other than statements of historical facts) in this Annual Report regarding the prospects of the industry and our prospects, plans, financial position and business strategy may constitute forward-looking statements. In addition, forward-looking statements generally can be identified by the use of forward-looking terminology such as “may,” “should,” “expect,” “might,” “intend,” “will,” “estimate,” “anticipate,” “plan,” “seek,” “believe,” “predict,” “potential,” “continue,” “suggest,” “project,” “future,” “likely,” or “target” or the negatives of these terms or variations of them or similar terminology. Although we believe that the expectations reflected in these forward-looking statements are reasonable, we cannot provide any assurance that these expectations will prove to be correct. Such statements reflect the current views of our management with respect to our operations, results of operations and future financial performance and are subject to various risks and uncertainties. Accordingly, there are or will be important factors that could cause actual outcomes or results to differ materially from those indicated in these statements. These factors include but are not limited to those described in Part I, “Item 1A-Risk Factors.” These factors should not be construed as exhaustive and should be read in conjunction with the other cautionary statements that are included in this Annual Report. Certara undertakes no obligation to publicly update or review any forward-looking statements, whether as a result of new information, future developments or otherwise, except as required by law.
SUMMARY OF RISK FACTORS
An investment in shares of our common stock involves substantial risks and uncertainties that may materially adversely affect our business, financial condition and results of operations. Some of the more significant challenges and risks relating to an investment in our Company are summarized below. The following is only a summary of the principal risks that may materially adversely affect our business, financial condition, and results of operations. The following should be read in conjunction with the more complete discussion of the risk factors we face, which are set forth in Part I, “Item 1A- Risk Factors” in this Annual Report.
•Deceleration in, or resistance to, the acceptance of model-informed biopharmaceutical discovery and development could reduce the demand for our products and services.
•We compete in a competitive and highly fragmented market.
•Changes or delays in government regulation relating to the biopharmaceutical industry could decrease the need for some of the services we provide.
•Reduction in research and development (“R&D”) spending by our customers, as well as delays in the drug discovery and development process, may reduce demand for our products and services.
•Consolidation within the biopharmaceutical industry may reduce the pool of potential customers for our products and services or reduce the number of licenses for our software products.
•Our continued revenue growth depends on our ability to successfully increase our customer base, expand our relationships and the products and services we provide, and enter new markets.
•We depend on key personnel and may not be able to retain these employees or recruit additional qualified personnel, which could harm our business.
•If our independent contractors are characterized as employees, we could be subject to material adverse effects on our business and employment and withholding liabilities.
•Delays or defects in the release of new or enhanced software or other biosimulation tools may result in increased cost to us, delayed market acceptance of our products, diminished demand for our products, delayed or lost revenue, and liability.
•Issues relating to the implementation, use and development of artificial intelligence (“AI”) and machine learning in our products and services may result in reputational harm, regulatory action, or legal liability, and any failure to adapt to such technological developments or industry trends could adversely affect the competitiveness of our business.
•If our existing customers do not renew their software licenses, do not buy additional solutions from us or renew at lower prices, our business and operating results will suffer.
•We have government customers and have received government grants, which subject us to risks including early termination, audits, investigations, sanctions, or penalties.
•Our historic growth rates may not be sustainable or indicative of future growth.
•We regularly evaluate potential acquisitions and other strategic transactions that we deem beneficial and strategic to our long-term growth and profitability, which could divert our management’s attention, result in additional dilution to our stockholders, and otherwise disrupt our operations and adversely affect our operating results.
•Our estimated addressable market is subject to inherent challenges and uncertainties.
•Adverse global economic conditions could have a negative effect on our business, results of operations and financial condition and liquidity.
•We are subject to economic, political and other risks associated with the operation of a global business that could negatively affect our business, results of operations and financial condition.
•We are subject to the Foreign Corrupt Practices Act (“FCPA”) and the U.K. Bribery Act of 2010 (“U.K. Bribery Act”) and similar anti-corruption laws and regulations in other countries.
•Our failure to comply with trade compliance and economic sanctions laws and regulations could materially adversely affect our reputation and results of operations.
•If we fail to perform our services in accordance with contractual requirements, regulatory standards and ethical considerations, we could be liable for significant costs or penalties and our reputation could be harmed.
•The loss of one or more of our major customers could materially and adversely affect our business, results of operations and/or financial condition.
•Our bookings might not accurately predict our future revenue, and we might not realize all or any part of the anticipated revenue reflected in our bookings.
•Our business may be subject to risks arising from catastrophic events, including natural disasters, significant or extreme weather events, outbreaks of war or terrorism, epidemic diseases, pandemics, and public health crises.
•We rely upon third-party providers of cloud-based infrastructure to host our software solutions. Any disruption in the operations of these third-party providers, limitations on capacity or interference with our use could adversely affect our business.
•If we are not able to reliably meet our data storage and management or other information technology requirements, or if we experience any technology failures in the delivery of our services over the internet or in the administration of our business, customer satisfaction and our reputation could be harmed and customer contracts may be terminated.
•Our software solutions utilize third-party open source software, and any failure to comply with the terms of one or more of these open source licenses could adversely affect our business.
•If our cybersecurity measures are breached or unauthorized access to customer or other proprietary data is otherwise obtained, customers may reduce the use of or stop using our solutions and we may incur significant liabilities and/or loss of customer confidence.
•We are subject to numerous privacy and data security laws and related contractual requirements and our failure to comply with those obligations could cause us significant harm.
•We may be unable to adequately enforce or defend our ownership and use of our intellectual property and other proprietary rights.
•Third parties may initiate legal proceedings alleging that we are infringing their intellectual property rights, which could have a material adverse effect on our business.
•Our indebtedness could materially adversely affect our financial condition and our ability to operate our business.
•Impairment of goodwill and other tangible assets may adversely impact future results of operations.
Channels for Disclosure of Information
Investors and others should note that we may announce material information to the public through filings with the U.S. Securities and Exchange Commission (the “SEC”), our Investors Relations website (https://ir.certara.com), press releases, public conference calls and public webcasts. We use these channels to communicate with the public about us, our products, our services and other matters. We have used, and intend to continue to use, our Investor Relations website and our corporate website located at www.certara.com as a means of disclosing material non-public information and for complying with our disclosure obligations under Regulation FD. We encourage our investors, the media and others to review the information disclosed through such channels as such information could be deemed to be material information. The information on or available through such channels, including on our website, is not incorporated by reference in this Annual Report and shall not be deemed to be incorporated by reference into any other filing under the Securities Act or the
Exchange Act, except as expressly set forth by specific reference in such a filing. Please note that this list of disclosure channels may be updated from time to time.
Statistical and Other Industry and Market Data
This Annual Report includes statistical and other industry and market data that we obtained from industry publications and research, surveys and studies conducted by third parties. Industry publications and third-party research, surveys and studies generally indicate that their information has been obtained from sources believed to be reliable, although they do not guarantee the accuracy or completeness of such information. We have not independently verified the information contained in such sources.
PART I
Item 1. Business.
Our Company
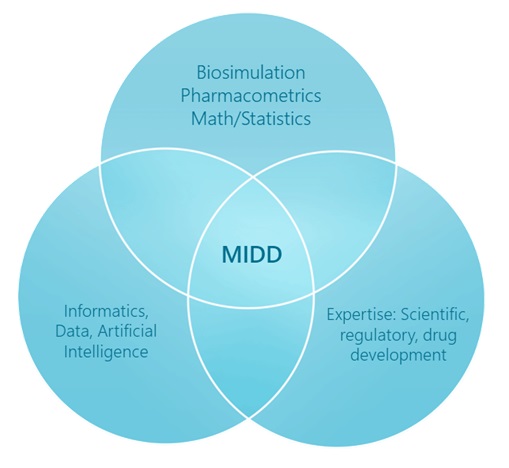
We are a global leader in biosimulation technology and solutions for using Model-Informed Drug Development (“MIDD”) in the global biopharmaceutical industry. MIDD is an approach that utilizes biological and statistical models derived from preclinical and clinical data to inform decision-making in drug development and commercialization. Biosimulation is a critical component of MIDD that uses computer-aided mathematical simulation of biological processes and systems to understand the action of a drug in a human body or a population of humans.
Biosimulation and MIDD can increase the probability of success in bringing a new drug to market and decrease the costs of drug development. There are many examples of currently approved drugs where models were successfully used in discovery, preclinical, first-in-human dose predictions, clinical trial design, and for drug interaction label claims. Biosimulation is also used to support drug development beyond the approval stage; examples include determining formulation or manufacturing changes and label extensions. In addition, MIDD strategies are increasingly utilized to help predict commercial success, a critical part of the drug development process as new products must be both approved by regulators and adopted by the market.
The diagram below shows the different areas of expertise that come together to enable MIDD. Our organization has been purposefully designed to include all of these capabilities to collectively enable a new model of drug development for our clients.
Our goal is to enable the life sciences industry to use data, modeling, and analytics to make better decisions during drug development and commercialization to increase productivity rates and vastly reduce development costs. The pharmaceutical industry spends more than $270 billion annually on research and development. On average, it takes 10-15 years and costs $6.2 billion to develop one new medicine, including the cost of failures. Drug development is necessarily a highly regulated process involving the collection of vast amounts of laboratory, clinical and evidence data, and there are many failures at every step along the way that add to total cost. Our software and scientists incorporate modern advances in scientific understanding, drug development experience, data analysis, and AI, resulting in significant opportunities to decrease the cost and increase the odds of new drug approval and commercial success.
Our proprietary biosimulation platforms are built on biology, chemistry, and pharmacology principles with proprietary mathematical algorithms that model how medicines and diseases behave in the body. For over two decades, our scientists have developed and validated our biosimulation technology using data from scientific literature, laboratory research, preclinical and clinical studies. To do this, we have developed solutions for the collection, standardization, validation, storage, and analysis of the preclinical and clinical data needed for MIDD. These data solutions are used internally and by global life sciences companies.
The scientific principles underlying our work must be transparent and fully explainable during the regulatory process, so we have developed expertise in incorporating data and results into regulatory documents. Our software and regulatory services streamline the creation of regulatory filings and speed regulatory data flow to maximize the chances of successful commercialization.
AI and machine learning technologies are being incorporated across our software and services portfolios, providing opportunities to expand the number of data sources utilized, better predict outcomes, and streamline reporting. For example, we are using machine learning to automate and speed the process of biosimulation, and we have created an AI application to aid in drafting regulatory documents from scientific analyses and clinical data. We believe that AI predictive models will continue to enhance the accuracy and usefulness of biosimulation models and will be utilized broadly across drug development.
We leverage our validated software applications to deliver technology-enabled services. Our services are delivered by scientists with extensive drug development experience who aid our customers in applying biosimulation and MIDD to their specific projects.
According to our internal data, Certara’s customers have received 90% or more of all novel drug approvals by the U.S. Food and Drug Administration (the “FDA”) from 2014 through 2024. We have worked with more than 2,400 life sciences companies and academic institutions and have collaborated on more than 9,000 customer projects in the last decade across a wide variety of therapeutic areas ranging from cancer and hematology to diabetes and hundreds of rare diseases. Our software products are licensed by more than 94,000 users and are also used by 23 global drug regulatory agencies, including the FDA, Japan’s Pharmaceuticals and Medical Devices Agency (the “PMDA”), and China’s National Medical Products Administration (the “NMPA”).
Our Solutions
We offer differentiated and comprehensive solutions for MIDD, which include software and technology-enabled services. Customers use our solutions to implement MIDD with the aim of improving certainty, accuracy, commercial success and the speed at which decisions can be made during the drug development process.
Life sciences companies make many decisions during the MIDD process that have regulatory considerations. We help support these decisions with comprehensive regulatory science solutions that include technology platforms along with regulatory submission and regulatory writing expertise. In addition, recognizing that time to approval is one of the most valuable components of the drug development journey, we designed our regulatory solutions to accelerate the regulatory writing and filing process.
By offering both software and services solutions, we provide flexible offerings for life sciences companies of all sizes and requirements. Services are complemented by scientific and regulatory expertise to conduct and interpret biosimulation results and make recommendations on the next best action to move a program forward. In 2023, we extended the capabilities of MIDD and regulatory offerings with the launch of an AI platform designed for life sciences, Certara.AI. Certara.AI is a secure, flexible platform for deploying life science-specific Generative Pre-Trained Transformers (“GPTs”) across an organization’s data, enabling faster search, connectivity, and content generation. Additionally, in 2024, we launched the next generation of our CoAuthor regulatory writing software, which combines generative AI, data integration, and structured content authoring tools to enable writers to create and assemble regulatory submissions and medical publications faster and with confidence in the quality of their results.
Our Biosimulation Solutions
Our biosimulation solutions are designed to predict both pharmacokinetics (how the body interacts with drugs) and pharmacodynamics (how a drug affects the body). We offer both mechanistic and empirical biosimulation solutions providing clients with a comprehensive offering based on their therapy goals, mechanism of action, and available data sources. Mechanistic biosimulation models are built by experts using known scientific principles and facts, while empirical biosimulation solutions are typically statistical models built using preclinical and clinical data. Our customers use biosimulation results to improve the design of clinical trials, reduce trial size and complexity, and in some cases obtain clinical trial waivers to replace clinical testing.
Simcyp™ Simulator
The Simcyp Simulator is a mechanistic biosimulation platform for physiologically based pharmacokinetic (“PBPK”) simulation. It is frequently utilized for determining first-in-human dosing, optimizing clinical study design, evaluating new drug formulations, setting the dose in untested populations, performing virtual bioequivalence analyses, and predicting drug-drug interactions (“DDIs”). The Simcyp Simulator has been applied to small molecules, biologics, antibody-drug conjugates (“ADCs”), generics, and new modality drugs. Simcyp was started over 20 years ago and has been expanded each year with extensions and additions to its biosimulation models and is designed to produce “regulatory quality” results that customers can use in their drug approval applications. The Simcyp Simulator family includes various add-on modules, as well as products focused on specific aspects of drug development that can benefit from its mechanistic simulation approach. The major Simcyp products are described below.
•Simcyp Discovery – Targeted to scientists working on pre-Investigational New Drug (“IND”) and translational stages.
•Simcyp Biopharmaceutics – Tailored for formulation scientists, who use it to identify and refine promising drug formulations in a cost-effective manner.
•Simcyp Secondary Intelligence – Integrates toxicology with quantitative analysis of large networks of molecular and functional biological changes to identify drug toxicity and adverse drug reactions earlier.
Empirical Biosimulation Software Platform
In addition to mechanistic modeling, MIDD requires empirical statistical modeling to account for all the data available on a drug including population variability. We have a large group of pharmacometrics scientists, who use clinical and preclinical data to quantify the impact of drugs on diseases and predict clinical efficacy and safety outcomes across various patient populations. These analyses are utilized to support the design of clinical trials and other drug development and/or regulatory decisions and are generally expected by regulators to support the justification of approved dosage regimens.
We provide customers with a powerful combination of scientific expertise, bringing experts with experience in thousands of projects across the industry, together with our industry-standard software applications. Our Phoenix™ PK/PD suite is the life sciences industry’s premier software for managing, analyzing and reporting pharmacokinetic (“PK”), pharmacodynamic (“PD”), and toxicokinetic (“TK”) data. Phoenix has four modules that support pharmacometrics and workflow.
•Phoenix WinNonlin – A platform for non-compartmental analysis, PK/PD, and TK modeling with a proven 30-year history and extensive use across the biopharmaceutics industry.
•Phoenix Hosted – A hosted (i.e., online) version of Phoenix, which provides a secured and validated Certara Amazon Web Services (“AWS”) workspace allowing for much quicker transit time from compliant data sources. It enhances productivity and supports compliance requirements by managing complex time-based drug data, the foundation for all PK/PD modeling.
•Phoenix NLME – A population modeling and simulation software for nonlinear mixed effects (“NLME”) models, a type of pharmacometric model often used by pharmacometricians to model absorption effects.
•Pirana Modeling Workbench – A workbench providing modelers with a structure to facilitate the iterative processes used to create population PK/PD models and perform simulations using AI and machine learning resulting in more efficient analysis.
Scientific Informatics for Improving Drug Discovery and In-Silico Development
In 2024, Certara acquired Chemaxon, a software company that develops leading software products for chemical property prediction, search, and analysis. Used by research scientists globally, Chemaxon software helps to digitize the design, make, test and analyze lifecycle to discover the best new chemical leads. Certara and Chemaxon have had a long-term partnership spanning ten years, providing integrated solutions to the life sciences industry. The acquisition strategically positions Certara in the drug discovery biosimulation market and is intended to complement Certara’s existing biosimulation portfolio which is widely used in later phases of drug development. Together, Certara and Chemaxon offer life sciences companies a more complete data and predictive analytics platform, helping to advance the decision-making from discovery through commercialization.
The major Chemaxon and Certara products focused on supporting more efficient chemical related information and workflows throughout drug discovery and development are described below.
Chemaxon JChem Engines – A widely used chemical search engine that integrates chemical intelligence into research informatics systems. It provides highly accurate single and combined search results rapidly providing researchers with the insights and data needed to move research projects forward.
Chemaxon Compound Registration – Compound Registration supports a streamlined lead optimization process workflow by comparing the uniqueness of new small molecules against those already stored in a database.
Chemaxon Design Hub – A compound design and tracking platform for drug discovery teams and their external collaborators that connects scientific hypotheses, candidate compound selection and computational capabilities. Design Hub has been integrated with the Certara D360 solution for more than eight years to provide an optimal end user experience throughout the lead optimization stage of discovery.
Certara D360™ Software – D360 is a scientific informatics system for small molecule and biologics discovery research. It provides researchers with self-service data access, integrated data visualizations, analysis and collaboration tools for prioritization, development of Structure Activity Relationship (“SAR”) and many other scientific data workflows to improve the effectiveness of data-driven research.
Chemaxon Marvin – Marvin is a universal chemical drawing tool for chemists involved in research and drug discovery. Marvin includes chemical intelligence to catch errors and perform live calculations and predictions and has a wide range of built-in tools to create publication-worthy chemical schemes.
Preclinical & Clinical Data Pipeline and Automation Suite
Our data suite allows customers to efficiently standardize preclinical and clinical data during the drug development process, utilize that data to support MIDD, and efficiently submit it to regulatory authorities for approval. Our customers typically collect large quantities of data from many sources during the drug development process, and our products allow them to reduce the cost of creating scientifically valid and analyzable data sets, speeding time to scientific insights and enabling better and faster decisions. The Certara suite of applications replaces costly manual processes in which pharmaceutical companies collect laboratory and clinical data from many sources, standardize, validate, analyze the data, and include it in reporting and downstream systems. Our principal clinical data suite is the Pinnacle 21™ family of products.
•Pinnacle 21 – A cloud-based platform for clinical data automation, standardization, and validation with industry standards. Pinnacle 21 is widely utilized across the pharmaceutical industry and by its regulators to validate that clinical data meets the required standards for regulatory submittal. We support two versions of Pinnacle 21 – a fully featured enterprise version, which contains workflow and reporting tools needed by large-scale drug development customers, and a more basic free community version designed for small organizations who want to try the software.
•Pinnacle 21 Data Exchange – Allows sponsors and data providers to define data standards and specifications (metadata) and ensure that data adheres to these specifications to make the process of acquiring external data from laboratory and clinical sources more efficient and predictable.
•Metadata Repository – A cloud-based Clinical Metadata Repository & Study Data Tabulation Model automation suite to enable faster study design using controlled and standardized data.
Regulatory Science
Our comprehensive regulatory science solutions help provide our customers the coordinated technology-enabled regulatory submission and regulatory writing expertise they need to accelerate the regulatory writing and filing process.
•CoAuthor™ Software – Structured and Assisted Content Authoring with Generative AI – Approval for a new drug or biologic requires expert development of numerous regulatory documents, which is a time intensive process often requiring inputs from a variety of data sources and types. CoAuthor powers efficient and expedited creation of regulatory documents and medical communications. Combining data integration, structured content authoring and AI, CoAuthor enables writers to create and assemble regulatory submissions and medical publications faster and with confidence in the quality of their results.
•GlobalSubmit™ eCTD Submissions Management – The Electronic Common Technical Document (“eCTD”) is a standard format required for submitting applications to regulatory authorities. Our
GlobalSubmit eCTD submissions management software provides regulatory teams with the tools they need to efficiently publish, validate, and review eCTD submissions.
Technology-Enabled Services
In addition to core software platforms, our scientists utilize our software to offer a broad range of technology-enabled services to help clients interpret biosimulation results, increase scientific insights related to the therapy, streamline drug submission and approval, and support the overall drug development process. We also provide the drug development expertise needed to ensure quality study execution and oversight along with preparation of commercialization plans and the evidence generation needed to ensure product launch success post approval.
Quantitative Systems Pharmacology (“QSP”): One of the most scientifically innovative areas of biosimulation is QSP, an approach which combines computational modeling and experimental data to examine the relationships between a drug, the biological system, and the disease process. We believe that Certara has one of the largest teams of QSP experts in the pharmaceutical industry. The insights delivered by our QSP team help answer critical questions about novel therapies required for development progression, including “which drug candidate is optimal” and “which patient populations are most likely to respond.”
We have differentiated our approach to QSP by building robust, regulatory-ready software platforms for reproducible model development that are further enabled by Certara.AI. Currently, QSP platforms are available for immunogenicity, immuno-oncology, and capabilities for neurodegenerative diseases are in development. This unique approach has been shared with U.S., European Union (“EU”), and Japanese regulators, all committed to advancing the use of QSP in drug discovery, development, and regulatory review.
Drug Development and Regulatory Strategy: Our experts develop and deliver drug development and regulatory plans and provide high-level regulatory input to customer projects, incorporating biosimulation and supporting decision making through critical development and investment stage gates.
Pharmacometrics: Pharmacometrics uses mathematical and statistical models to quantify drug, disease, and trial information to help address these decisions. The data used to build pharmacometrics models comes from both internal preclinical and clinical data as well as external data on competitor drugs.
Data Science: As the volume, variety, and velocity of data available in research has grown rapidly, so has the complexity of collecting, analyzing, and publishing data. Certara offers biometrics and data sciences services to help clients analyze and standardize data for faster time to insight and for submission readiness, in addition to preparing and transforming data for use in biosimulation and pharmacometrics models.
Clinical Pharmacology: Certara has numerous industry leaders and experts that guide drug developers in clinical pharmacology decisions. They provide early-phase development plans and study designs across the development life cycle, often incorporating biosimulation along with regulatory support.
Regulatory Science: Certara provides expert services for regulatory submissions from early-stage INDs, new drug applications, and MAAs that require Chemistry, Manufacturing, and Controls (“CMC”), nonclinical, and clinical expertise. Submission programs require the coordinated technology-enabled expertise that Certara regulatory writing solutions offers delivering quality and speed at scale.
Regulatory Operations: We manage the submission of regulatory documents using our GlobalSubmit platform. Submission management services include submission leadership, program management and planning, due diligence and readiness preparation, submission compilation, and eCTD publishing using Global Submit. Certara supports applications to all major health agencies, including the FDA, the European Medicines Agency (the “EMA”), Health Canada, Japan’s PMDA, and China’s NMPA.
Our Markets
Our markets within the biopharmaceutical industry are large and growing. Traditional drug discovery and development is costly and prone to failure. The biopharmaceutical industry was estimated to have spent a total of approximately $270 billion in 2024 on R&D. Currently, over 90% of drug candidates fail during the drug development process, many after significant expenditures of resources and time.
We believe that biosimulation solutions can improve these success rates. A small percentage increase in success rates has a large impact on the costs of the overall system; research shows that a modest increase of just three percent in the success rates at each development phase could save almost three hundred million dollars in total costs per approved drug. Additionally, there are often new ways that biosimulation is used to create value as the simulation and modeling capabilities are constantly expanding.
With increasing adoption of technology across all stages of drug discovery and development, we believe our end-to-end platform and growth strategies position us to further penetrate the rapidly growing technology-driven biopharmaceutical R&D market of the future that leverages advanced modeling and analytics.
With greater investment dollars being spent and increasing competition in the race to develop novel medicines, the speed and efficiency with which drugs are developed and brought to market have never been more critical. As a result, the demand for and willingness to adopt innovative approaches to discovery, development, and commercialization are rapidly increasing. Continued development and innovation in software and technology such as biosimulation, virtual trials, and real-world evidence tools are helping biopharmaceutical companies increase efficiency and decrease costs. This is further bolstered by regulatory agencies that have increasingly issued guidance supporting the adoption of many of these innovations. For example, the FDA announced in 2021 its Project Optimus initiative to reform the dose selection and optimization paradigm in oncology drug development to maximize both efficacy and safety. Biosimulation’s use cases in dose finding and optimization are well-suited to help biopharmaceutical companies navigate this evolving regulatory landscape.
As technology and analytics become increasingly powerful along with AI and the application of new solutions is validated, we anticipate further demand for these innovations. We believe we are still in the early stages of a long-term trend that will continue to advance traditional drug discovery and development into a technology-driven era of advanced modeling, analytics, and AI enabled solutions.
Our Growth Strategy
Our growth strategy is to build upon our platforms creating more value through increased automation and connectivity. We continue to innovate in biosimulation, develop more AI-enabled offerings across our portfolio, engage with regulatory agencies, and land and expand our customer relationships. We remain focused on reducing the cost, time, and probability of failure of clinical trials for our customers so that they may potentially accelerate and lower overall cost of the delivery of future therapies that are needed by patients worldwide. As new research and technologies areas and opportunities arise, we seek to attract and hire specialized talent and acquire complementary businesses to expand our offerings accordingly.
Advance Our Technology
The science, technology, and data behind biosimulation continue to advance rapidly, and our top investment priority is to develop additional functionality and uses for biosimulation to improve decision making and patient outcomes. We aim to release new software, additional features, and upgrades on a frequent and regular basis, with a focus on cloud-based solutions, as a means to integrate and connect access to our products within an end-to-end platform. In 2024, we introduced 36 new software applications and upgrades, including Phoenix Version 8.5, next-generation CoAuthor and Certara Cloud.
Grow Within Our Existing Customer Base
As we continue to expand our portfolio of offerings, we integrate our solutions and sell more across our end-to-end platform. We actively cross-sell our software and technology-enabled services throughout our end-to-end platform. Our scientists and regulatory and market access experts, business developers, marketing professionals, and business leaders work together to provide a high-quality customer experience and nurture long-term partnerships. Ultimately, one of our goals is to facilitate customer growth over time through higher adoption of biosimulation with additional user licenses and more modules.
Expand Our Customer Base Globally
We have invested in an international footprint to effectively serve the global biopharmaceutical industry. There are more than 5,500 biopharmaceutical companies worldwide with active R&D pipelines as of January 2023, up from nearly 2,400 in 2011. As of December 31, 2024, we had employees in 30 countries, including approximately 576 in the US, 688 in Europe, and 180 in Asia.
Scale Through Acquisitions
Part of our strategy to date has been to pursue strategic acquisitions to accelerate our development roadmap. Since 2013, we have acquired 21 companies, 14 of which include software or technology, with such key acquisitions including Simcyp, the core of our mechanistic biosimulation platform, Pinnacle 21, which enhances our software offerings in data management and the regulatory drug approval process, and VyasaTM, which brings state-of-the-art AI capabilities to our end-to-end platform. More recently, in 2023, we also acquired Formedix, which added a metadata repository and clinical data flow automation to our data platform, and Applied Biomath, a company focused on QSP to expand and complement our existing QSP capabilities. In 2024, we acquired Chemaxon, a leading provider of cheminformatics software to expand and complement our existing prediction and analytical capabilities in drug discovery.
Our Customers
Our customers include life sciences companies of all sizes along with contract research organizations, academic institutions, and global regulators. Certara software and services have been used by more than 2,400 biopharmaceutical companies and academic institutions across 70 countries, including 38 of the top 40 biopharmaceutical companies by R&D spend in 2023. We also derive limited revenue from contracts with U.S. government agencies, including the FDA and the Center for Disease Control and Prevention within the Department of Health and Human Services, as well as foreign governments. For example, our software products are licensed by 23 global drug regulatory agencies, including the FDA, Health Canada, Japan’s PMDA, China’s NMPA and the UK’s Medicines and Healthcare Products Regulatory Agency (“MHRA”). In addition to life sciences, Certara serves customers in animal health, crop science, bio science, medical devices, and public sector industries. No single customer accounted for more than 10% of our revenues in 2024. Our ten largest customers accounted for 27% and 28% of revenues for each of the years ended December 31, 2024 and 2023, respectively.
Sales and Marketing
Our sales and marketing functions pursue a coordinated approach with a global commercial team of business development, product management, and marketing experts. Our global commercial team collaborates with our scientists, subject matter experts, and technologists to engage with customers and prospects to understand their needs and offer tailored solutions with our biosimulation software and technology-enabled services. In support of our presence and authority within our fields, our scientists and experts have authored thousands of scientific
publications, posters, and articles to share biosimulation knowledge and methods to advance adoption. Additionally, in an effort to further expand our reach to potential customers, we may partner with software distributors in regions or categories where we may have less dedicated presence or activity today.
Competition
The market for our biosimulation products and related services for the biopharmaceutical industry is competitive and highly fragmented. The solutions offered by our competitors vary in size, capabilities and breadth. In addition to competition from other solution providers, another challenge is that some biopharmaceutical industry participants may still rely on or over-index the status quo method of conducting research without fully leveraging the benefits of modeling, simulation, AI, dataflow and analytics platforms to inform and de-risk decisions across each phase of research and development.
In our view, the principal competitive factors in our market are the functionality and quality of models, the breadth of molecular types, therapeutic areas, and modalities supported, regulator acceptance of our solutions, ease of use and functionality of applications, depth of experience in drug development, brand awareness and reputation, total cost, and the ability to securely integrate with other enterprise applications and the overall drug development process in the customer. We believe that we compete favorably based on these factors and that the time, effort, and investment necessary to develop validated models, modeling solutions, enterprise software and extensive MIDD experience presents a significant barrier to new entrants. Our ability to remain competitive depends on our ability to continue to invest in innovation as MIDD and drug development science advances.
In the biosimulation software market, we compete with other technology companies including Mathworks, Dassault Systemes, Ansys, Simulations Plus, and NONMEM, a division of ICON. Other competitors include open-sourced solutions such as R and PK-Sim and internally developed software from biopharmaceutical companies. There are also many clinical research organizations that provide various data, decision tools, and advice on drug candidates and drug trial decisions. Our technology-enabled services generally compete with in-house teams at biopharmaceutical companies. Additionally, we compete with other specialized service providers including Metrum Research, qPharmetra, and Pharmetheus. We compete in both the biosimulation software market and technology-enabled services markets, with outcomes typically based on the quality and capabilities of our products, our scientific, technical and regulatory expertise, our ability to innovate and develop solutions attractive to customers, our regulatory agency partnerships, and price, among other factors.
Intellectual Property
We safeguard and enhance our innovative technology platforms, systems, processes, and databases with a full array of intellectual property rights, including copyrights, trade secrets, know-how, patents, and tradenames/trademarks. Our proprietary software products are copyright protected, and may be further defined by contractual provisions in our software license agreements limiting permitted uses and also prohibiting specific acts of infringement, such as reverse engineering, deriving, or otherwise using the source code and underlying algorithms in all cases or beyond the terms of a license, as the case may be. Embedded within some of our biosimulation tools, including the Simcyp Simulator, are several decades’ worth of proprietary data that have been compiled and collated from both public and private sources. These data, in tandem with our proprietary source code and algorithms, create powerful modeling tools that cannot be easily or practically duplicated independently. Continual ongoing development of source code and algorithms as well as new version release of modeling tools also contribute to the competitive value of our proprietary software products. Our processes and systems are further protected by trade secrets principles and expert knowledge bases, which we seek to secure by requiring and enforcing confidentiality obligations with our employees, contractors, customers, and other third parties, and invention assignment agreements with our employees, in collaboration with administrative and technical safeguards.
We maintain a portfolio of issued and pending patents in several jurisdictions in which we do business. As of December 31, 2024, our patent portfolio consists of 29 issued patents, which expire and may be renewed by us on a rolling basis as available and determined by us, between November 2026 and August 2044, and 16 pending patent applications related to our software and technology. We do not currently consider any of our issued patents to be independently material to our business.
We maintain registration in the United States and other countries for numerous trademarks, including Certara, Simcyp, Phoenix, Pinnacle 21, Virtual Twin, WinNonlin, Vyasa, and BaseCase. We pursue trademark registrations to the extent we believe doing so would be beneficial to our competitive position. We are not presently a party to any legal proceedings relating to intellectual property that, in the opinion of our management, would individually or taken together have a material adverse effect on our business, financial condition, results of operations or cash flows.
Human Capital
We are a global team united in our purpose to accelerate medicine to patients. Challenging the status quo, our talented team of scientists, software developers, and subject matter experts strive to understand our customers’ most difficult business challenges and apply cutting edge technology and rigorous scientific thinking to inform solutions. As of December 31, 2024, we employed 1,546 professionals in 30 countries, including 1,487 full-time employees and 59 part-time employees, of which 408 held PhD or doctor of medicine degrees in their respective disciplines, including clinical pharmacology and pharmacometrics. Most of the senior management team and the members of our board of directors also hold PhDs and/or other advanced degrees. We also rely on independent contractors to address discrete parts of our business and provide expertise in certain specialized areas or focus on projects. In 2024, we again received the “Great Place to Work” award (from the Great Place to Work® Institute, Inc.).
Our over 1,500 employees are the key to our success. The breadth and depth of expertise, experience, and backgrounds fuel innovation by bringing rich ideas, problem-solving capabilities, and mutual respect. We are dedicated to attracting, retaining, and growing leading scientists and experts, who are passionate about developing medicines that matter. We strive to encourage intellectual curiosity and offer a variety of professional development opportunities to enable our colleagues to grow their skills. We have traditionally offered job training programs covering technical and soft skills for employees who want to refine specific skills, and all employees participate in a formal performance management process and receive career coaching and counseling as we may determine from time to time. We seek to offer our people competitive compensation packages, depending on role or market, and varying by location we may make available on group terms pension/retirement savings programs, benefits, life insurance, income protection, and healthcare offerings. We strive to provide all staff opportunities for career advancement by posting and announcing openly all promotion opportunities, regularly reviewing pay to ensure fair practices and providing training to all new hires.
Government Regulation
Regulation of Biopharmaceutical Products
The development, testing, manufacturing, labeling, approval, promotion, distribution and post-approval monitoring and reporting of biopharmaceutical products are subject to regulation by numerous governmental authorities at both the national and local levels, including the FDA in the United States, as well as those of other countries, such as the EMA in the EU and the MHRA in the United Kingdom. Although our biosimulation software products and platforms are not approved by the FDA or other government agencies, our customers’ products are subject to these regulations, which may be applicable to us to the extent that the services and deliverables we provide to our customers are used in their marketing applications. Consequently, we must
comply with relevant laws and regulations relating to certain aspects of the drug and biologic development and approval process. For example, our customers may require that documents or records we produce that may be used in the approval process be compliant with part 11 of Title 21 of the U.S. Code of Federal Regulations, which relates to the creation, modification, maintenance, archival, retrieval, transmittal or distribution of electronic records under records requirements in FDA regulations and submitted to the FDA. Further, certain portions of our business, such as the biosimulation work we conduct in connection with designing clinical trials, must comply with current Good Laboratory Practices (“GLP”) and Good Clinical Practices (“GCP”) requirements as established by the International Council on Harmonisation of Technical Requirements for Registration of Pharmaceuticals for Human Use, as adopted by the FDA and similar regulatory authorities in other countries, which helps ensure the quality and integrity of the data we produce. To help ensure compliance with GLP and GCP, we have established a robust quality management system that includes standard operating procedures, working practice documents and processes, and quality assurance personnel to audit deliverables intended to be used in our customers’ drug and biologic approval applications.
Privacy and Cybersecurity Laws
The collection, use, disclosure, disposal, protection, and other processing of information about individuals, in particular healthcare data, is highly regulated both in the U.S., EU and other jurisdictions, including but not limited to: the U.S. Health Insurance Portability and Accountability Act of 1996 (“HIPAA”), as amended by the Health Information Technology for Economic and Clinical Health Act (“HITECH”) and other U.S. privacy, security and breach notification and healthcare information laws; the European Union’s General Data Protection Directive (“GDPR” and its national implementing laws) and other European privacy laws; and additional privacy laws in other jurisdictions around the world.
We generally require that the clinical data we receive from our customers is de-identified within the meaning of HIPAA (or pseudonymized within the meaning of GDPR), although in limited cases we may encounter personal health and other information processed by our customers. The collection, retention, use, disclosure and other processing of such information is highly regulated, including under the laws described above. In each use case, we examine and apply the data privacy and cybersecurity laws that may govern our potential processing of any subject data.
In the United States, the Federal Trade Commission (the “FTC”) is active in regulating health-related privacy and security. The FTC has taken enforcement actions against companies for statements or promises made about the privacy or security of health information through Section 5 of the Federal Trade Commission Act, which prohibits unfair or deceptive acts or practices. We may also be subject to scrutiny by Federal and state regulators, partners, and consumers of our collection, use and disclosure of consumer personal data, including consumer health data.
Twenty states have also adopted robust data privacy laws, with several other states considering similar laws. For example, the California Consumer Privacy Act (“CCPA”), which became effective on January 1, 2020, as amended by the California Privacy Rights Act, which became effective on January 1, 2023, imposes obligations and restrictions on businesses regarding their collection, use, and sharing of personal information and provides new and enhanced data privacy rights to California residents, such as affording them the right to access and delete their personal information and to opt out of certain sharing of personal information. The interpretation and application of these new state privacy laws and their pending regulations are uncertain.
The processing of any personal data regarding individuals in the European Economic Area (“EEA”) is subject to the GDPR. The GDPR and the UK’s post-Brexit equivalent of the GDPR (“UK GDPR”) is wide-ranging in scope and imposes numerous requirements on companies that process personal data, including requirements relating to processing health and other sensitive personal data, cross-border transfers, notice and consent and contractual obligations with vendors and service providers. Data protection authorities are authorized to impose
large administrative penalties for violations of the GDPR or UK GDPR, including potential fines of up to €20 million or 4% of annual global revenues, whichever is greater, for each law.
Legal developments in Europe have created complexity and uncertainty regarding transfers of personal data from the EEA to the United States, including the European Commission’s adequacy decision with respect to the transfer of personal data from the EU to the United States and establishment of the EU-U.S. Data Privacy Framework (“EU-U.S DPF”), the UK Extension to the EU-U.S DPF, and the Swiss-U.S. Data Privacy Framework. We also currently rely on the standard contractual clauses to transfer personal data outside the EEA, including to the United States, among other data transfer mechanisms pursuant to the GDPR. While the Court of Justice of the European Union (the “CJEU”) has upheld the adequacy of the standard contractual clauses (a standard form of contract approved by the European Commission as an adequate personal data transfer mechanism), it made clear that reliance on them alone may not necessarily be sufficient in all circumstances; this has created uncertainty.
In response to the data privacy laws discussed above and those in other countries in which we do business, we have implemented a multi-disciplinary privacy management program that includes technological safeguards, processes, contractual third-parties provisions, and employee trainings to help ensure that we handle information about our employees and customers in a compliant manner. Concurrently, we observe a trend toward expanding privacy data protection law both in number and scope that will expand our obligations. We may need to modify our practices and incur expenses to accommodate this evolving privacy compliance landscape.
Bribery, Anti-Corruption and Other Laws
We are subject to compliance with the U.S. Foreign Corrupt Practices Act (“FCPA”) and similar anti-bribery laws, such as the U.K. Bribery Act of 2010 (“U.K. Bribery Act”), which generally prohibit companies and their intermediaries from making improper payments to foreign government officials for the purpose of obtaining or retaining business. In addition, in the United States, we may also be subject to certain state and federal fraud and abuse laws, including the federal Anti-Kickback Statute and False Claims Act, that are intended to reduce waste, fraud and abuse in the health care industry. Our employees, distributors, and agents are required to comply with these laws, and we have implemented policies, procedures, and training, to minimize the risk of violating these laws.
Seasonality
Our business has experienced seasonality, including quarterly unevenness in software sales driven primarily by the timing of customer sales and renewal cycles, and services contracts based on project and development activity within our customer base. Customer contract acquisitions and renewals, as well as our revenue, are typically highest in the fourth quarter.
Our Corporate Information
In 2008, Tripos International and Pharsight Corporation came together to form Certara. Certara, Inc. was incorporated in Delaware on June 27, 2017. Our principal business office is located at 4 Radnor Corporate Center, Suite 350, Radnor, Pennsylvania 19087, and the telephone number of our principal business office is (415) 237-8272. Our internet address is www.certara.com. Our internet website and the information contained therein or connected to or linked from our internet website are not incorporated information and do not constitute a part of this Annual Report or any amendment thereto.
Available Information
The SEC maintains a website at www.sec.gov that contains reports, proxy and information statements, and other information about reporting issuers, like us, that file electronically with the SEC. The following filings are available through our Investor Relations website as soon as reasonably practicable after we file them with, or furnish them to, the SEC: Annual Report on Form 10-K, Quarterly Reports on Form 10-Q, Current Reports on Form 8-K and our Proxy Statement for our annual meeting of stockholders, as applicable (as well as any amendments to those reports). These documents are also available for download free of charge through a link on our Investor Relations website. Further corporate governance information, including our Code of Conduct, Corporate Governance Guidelines, and committee charters, as well as our Environmental, Social and Governance (“ESG”) Report, are also available on our website. Our internet website and the information contained therein or connected to or linked from our internet web site are not incorporated information and do not constitute a part of this Annual Report.
Item 1A. Risk Factors.
Investing in our common stock involves a high degree of risk. You should carefully consider the following risk factors together with other information in this filing, including our consolidated financial statements and related notes included elsewhere in this filing, before deciding whether to invest in shares of our common stock. The occurrence of any of the events described below could harm our business, financial condition, results of operations and growth prospects. In such an event, the trading price of our common stock may decline and you may lose all or part of your investment.
Risks Related to Our Industry
Deceleration in, or resistance to, the acceptance of model-informed biopharmaceutical discovery and development by regulatory authorities or academic institutions could damage our reputation or reduce the demand for our products and services.
There has been a steady level of recognition by regulatory and academic institutions of the role that modeling and simulation can play in the biopharmaceutical development and approval process, as demonstrated by regulations and guidance documents describing and encouraging the use of modeling and simulation in the biopharmaceutical discovery, development, testing and approval process, which has directly led to an increase in the demand for our services. Nonetheless, significant changes in government or regulatory policy, or a reversal in the level of adoption and reliance upon in silico data (trials, studies, or experiments conducted via computer or computer simulation) in the drug approval process, could result in the decrease in demand for our products and services or lead regulatory authorities to cease use of, or to recommend against the use of, our products and services. These factors, in turn, could ultimately have a material adverse effect on our business, financial condition and results of operations.
Our software products are licensed by the FDA and other regulatory authorities, who may use them in assessing new drug applications. These licenses are typically renewed on an annual basis, and there is no obligation for these regulatory authorities to renew these licenses at the same or any level. While these licenses account for a small amount of our annual revenue, a reduction or the elimination of the use of any of our software products that are currently licensed by regulatory authorities could diminish our reputation and negatively impact our ability to effectively market and sell our software products, particularly if such action were part of a wider reversal of government or regulatory acceptance of in silico data.
We also work closely with the global academic community on research, publications, and training of the next generation of biopharmaceutical scientists. Our software products are used in many academic institutions, often free of charge, where students, including PhD candidates, are first exposed to the types of tools and models that we offer. Upon graduating, these students frequently become employed by biopharmaceutical companies, where
they may continue to use our products and advocate for their continued use. If academic institutions decide to use competitive products, develop their own biosimulation products, or reduce their exposure to biosimulation tools in general, familiarity with our products by the future generations of pharmacometricians and clinical pharmacologists may be diminished, which could ultimately result in a reduction in demand for our products over time.
We compete in a competitive and highly fragmented market.
The market for our biosimulation products and related services for the biopharmaceutical industry is competitive and highly fragmented. In biosimulation software, we compete with other scientific software providers, technology companies, in-house development by biopharmaceutical companies, and certain open source solutions. In the technology-driven services market, we compete with specialized companies, in-house teams at biopharmaceutical companies, and academic and government institutions. In some standard biosimulation services, and in regulatory and market access, we also compete with clinical research organizations. Some of our competitors have longer operating histories in certain segments of our industry than we do and could have greater financial, technical, marketing, R&D and other resources, and can use such resources to develop or adapt products, services or technologies that are comparable, or superior to, or could render obsolete, the products, services and technologies we offer. Some of our competitors offer products and services directed at more specific markets than those we target, enabling these competitors to focus a greater proportion of their efforts and resources on those specific markets. Some competing products are developed and made available at lower cost by government organizations and academic institutions, and these entities may be able to devote substantial resources to product development. Some clinical research organizations or technology companies may decide to enter into or expand their offerings in the biosimulation area, whether through acquisition or internal development. We also face continued competition from open source software initiatives, in which developers provide software and intellectual property free of charge, such as R and PK-Sim software. In addition, some of our customers spend significant internal resources in order to develop their own solutions. Any material decrease in demand for our technologies or services may have a material adverse effect on our business, financial condition and results of operations.
Changes or delays in government regulation, executive action or administrative decision-making relating to the biopharmaceutical industry could decrease the need for some of the services we provide.
Governmental agencies throughout the world strictly regulate the biopharmaceutical development process. Our business involves assisting biopharmaceutical companies strategically and tactically to navigate the regulatory approval process. New or amended regulations could result in higher regulatory standards and potentially additional revenues for companies that service these industries. However, some changes in regulations, such as a relaxation in regulatory requirements or the introduction of streamlined or expedited approval procedures, or an increase in regulatory requirements that we have difficulty satisfying or that make our regulatory strategy services less competitive, could eliminate or substantially reduce the demand for our regulatory services. Regulatory developments that could potentially increase demand for our services could also be postponed or not fully implemented.
Also, over time, but also with relatively short notice, governmental agencies could make different decisions or change standards with respect to all of the foregoing within their administrative oversight functions and authorities. There continue to be business and operational variables across regions and changes in governments that may adopt different strategies and priorities in approaches to the regulation of the biopharmaceutical industry. The biopharmaceutical industry may experience a change in the traditional approaches to government support and funding for drug development, in particular for public sector and academic organizations, dependent on outside funding to develop early-stage research. Any material decrease or delay in demand for our technologies or services, or regulatory restrictions or requirements placed on them, may have a material adverse effect on our business, results of operations and financial condition.
We cannot predict the likelihood, nature or extent of government regulation or intervention that may arise from future legislation or administrative or executive action, or changes to governmental regulation that may be required as a result of judicial decisions or change in administration, either in the United States or abroad. If we are slow or unable to adapt to changes in existing requirements or the adoption of new requirements or policies, or if we are not able to maintain regulatory compliance, our business may be harmed.
Reduction in R&D spending by our customers for a variety of reasons, as well as delays in the drug discovery and development process, may reduce demand for our products and services and negatively impact our results of operations and financial condition.
We provide biosimulation software platforms and services to the biopharmaceutical industry, including both private and public companies, as well as government and academic institutions. Because our products and services often depend on our customers’ R&D expenditures, our revenues may be materially negatively affected by any economic, competitive, regulatory, demand, or other market impact that decreases our customers’ financial performance, access to funds or their ability to raise capital, which may cause them to decrease or delay R&D spend. In such an event, our revenues may be reduced through increased downward pricing pressure, reduction in the scope of projects, delays or cancellations of ongoing projects, or our customers shifting away from using third parties for their modeling and simulation work. Our customers’ expenses and obligations could continue to increase as a result of the higher costs of developing more complex drugs and biologics and complying with more onerous government regulations. Furthermore, our customers may finance their R&D spending from both private and public sources, including the capital markets. As a result, our revenues and financial performance may be adversely impacted if our customers are unable to obtain sufficient capital on acceptable terms to finance their R&D spending. Government and university-based funding of scientific research can vary for a number of reasons, including general economic conditions, political priorities, changes in the number of students and other demographic changes.
Our customers’ revenue and/or profitability could decline as a result of efforts by government and third-party payors to reduce the cost of healthcare. Governments worldwide have increased efforts to expand healthcare coverage while at the same time curtailing and better controlling the increasing costs of healthcare. If cost-containment efforts or other measures substantially change existing insurance models and limit our customers’ profitability, our customers may decrease R&D spending, which could decrease the demand for our services and materially adversely affect our growth prospects.
Likewise, drug price controls are a topic subject to governmental intervention and regulation, and may vary by region, market and administration, and when applied could lead to reduced R&D spending by pharmaceutical companies, with one assumption being that they may have less financial incentive to develop new drugs, particularly for niche or complex therapeutic areas. For example, in the United States, specific drug price control provisions, allowing for negotiation of certain categories of drug prices through government executive agencies, were included in the Inflation Reduction Act of 2022, and the extent of their application may have an economic impact on the incentive structure related to drug development R&D spending by our customers. In addition, industry trends, economic factors, regulatory developments, patent protection and political and other events and circumstances that decrease our customers’ R&D spending also affect us.
Drug development cycles and investment in trials may also be impacted by a shift in government priorities, increased regulatory enforcement, more rigorous standards applied to public funding or reductions in philanthropic allocations or budgets. In such events, delays in the biopharmaceutical development cycle, particularly related to clinical trials being paused or canceled, could also impact the demand or timing for our products and services.
Furthermore, our financial success depends upon the creditworthiness and ultimate collection of amounts due from our customers. If we are not able to collect amounts due from our customers in a timely fashion due to funding or liquidity challenges or for any other reason, we may be required to write-off significant accounts
receivable and recognize bad debt expenses, which could materially and adversely affect our operating results. All of these events could have a material adverse effect on our business, financial condition and results of operations.
Consolidation within the biopharmaceutical industry may reduce the pool of potential customers for our products and services or reduce the number of licenses for our software products.
A significant portion of our customer base consists of biopharmaceutical companies, and our revenue is dependent upon expenditures by these customers. Consolidation through mergers or contraction through business failures within the biopharmaceutical industry may reduce the number of potential customers, particularly larger customers, for our products and services. Consolidation of major biopharmaceutical companies could result in consolidation of software licenses used by those companies, reduction of the number of individual user licenses, or increased pressure to negotiate price discounts or other terms for service that are less favorable to us, which may have a material adverse effect on our revenue and financial condition. Personnel redundancies and layoffs by merged companies to achieve deal synergies would result in a commensurate reduction in total users of our software, reducing the license fees we charge based on the number of users.
Evolving corporate governance and public disclosure regulations and expectations, including with respect to sustainability matters, could expose us to risks.
In recent years, there has been heightened interest from regulators, customers, investors, employees and other stakeholders on sustainability matters and related disclosures. Such attention to sustainability matters, including expanding mandatory and voluntary reporting, diligence, and disclosure on topics such as climate, human capital, labor and risk oversight, could expand the nature, scope, and complexity of matters that we are required to control, assess and report on.
At the same time, regulators and other stakeholders have increasingly expressed or pursued opposing views, legislation and investment expectations with respect to sustainability initiatives. Conflicting regulations and a lack of harmonization of ESG legal and regulatory environments across the jurisdictions in which we operate may create enhanced compliance risks and costs. If our sustainability practices do not meet evolving stakeholders’ expectations and standards, or if we are unable to satisfy all stakeholders, our reputation, ability to attract or retain employees, financial condition, results of operations and cash flows could be negatively impacted.
New and emerging costly and resource-consuming regulatory initiatives related to climate and sustainability matters could adversely affect our business, including, for example, the EU Corporate Sustainability Reporting Directive (“CSRD”) and climate disclosure laws adopted in California. These and other legal and regulatory requirements continue to evolve in scope and complexity, making compliance more difficult and uncertain. These changing rules, regulations and stakeholder expectations have resulted in, and are likely to continue to result in, increased general and administrative expenses and increased management time and attention spent complying with or meeting such regulations and expectations. We also expect to incur additional costs as we seek to engage in due diligence, verification and reporting in connection with our sustainability initiatives.
In particular, based on certain revenue, presence thresholds, and other measures, we may become subject to the EU CSRD and the California climate disclosure laws. The EU’s CSRD will require expansive disclosures on climate change and other sustainability topics such as biodiversity, workforce, supply chain, and business ethics by in-scope EU entities and certain non-EU entities with significant cross-border business in EU markets. California’s Climate Corporate Data Accountability Act will require annual disclosure of covered companies’ Scope 1, 2 and 3 greenhouse gas (“GHG”) emissions. California’s Climate-related Financial Risk Act will require biannual disclosure of climate-related financial risk reports by covered companies. California’s Voluntary Carbon Market Disclosures Act will require disclosure from entities that participate in the voluntary carbon offset market, or that make certain claims about their CO2 or GHG emissions, updated at least annually.
Further, we may from time to time announce, certain initiatives, including goals, targets and objectives, related to GHG emissions targets and other sustainability matters, in our SEC filings or in other public disclosures or reports. These initiatives and goals could be difficult and expensive to implement, and we could be criticized for the scope or nature of such initiatives, or for any revisions thereto, or the accuracy, adequacy or completeness of related disclosures. Statements about our sustainability initiatives and goals, and progress against those goals, reflect our current plans, which are based on standards for measuring progress that are still developing, internal controls and processes that continue to evolve, and assumptions that are subject to change in the future. There is no guarantee that we will be able to successfully achieve our initiatives or commitments related to sustainability matters, on the desired timeframes or at all. Nevertheless, if we fail or are perceived to fail to achieve progress with respect to our sustainability-related goals on a timely basis, or at all, or if we fail or are perceived to fail to comply with all laws, regulations, policies and related interpretations, this could negatively impact our reputation and our business results, as well as expose us to government enforcement actions, fines and private litigation. Achievement of our sustainability goals may also require us to incur additional costs or to make changes to our operations which could adversely affect our business and results of operations.
Risks Related to Our Business
Our continued revenue growth depends on our ability to successfully increase our customer base, expand our relationships and the products and services we provide to our existing customers, and enter new markets and expand geographies.
Our products and services are used primarily by modeling and simulation specialists in pharmaceutical, biotechnology, and government research or regulatory organizations. We have relationships with many large companies in the biopharmaceutical sector, and part of our growth strategy entails deriving more revenues from these existing customers by expanding their use of our existing and new products and services. As the total annual expenditure from a particular customer increases, we may experience pricing pressure, often from the customer’s procurement department, in the form of requests for discounts or rebates, price freezes and less favorable payment terms, which could have an adverse impact on our profitability. Additionally, our ability to increase revenues with existing customers may be limited without significant investment in marketing and enhancing our existing products and services or developing new products to keep pace with technological developments and meet evolving customer requirements, which could be time-consuming and costly and may not be successful.
We are also focused on the emerging or smaller biotechnology customers that we serve. These small companies also contribute to the discovery and development of new molecules and treatments, and their share of the total industry R&D discovery and development dollars continues to be relevant. Attracting these smaller customers may require us to expend additional resources on targeted marketing, as they may not be as familiar with us or our products. And although these small biotechnology companies tend to use third parties such as us for many of their development activities, these smaller companies also tend to be less financially secure. If their products are not successful or they have difficulty raising sufficient investment capital, they may not be able to timely or fully pay for our services, or they may terminate or decrease the scope of projects for which they use our products and services, which could adversely impact our revenues.
Our strategy also includes expanding into new markets, new geographies, and new areas within our existing markets, either organically or by acquiring other companies in these markets. If our strategies are not executed successfully, our products and services may not achieve market acceptance, penetration within our existing customers, or reach of new customers. We cannot guarantee that we will be able to identify new biosimulation or regulatory and market access technologies of interest to our customers, or develop or acquire them in a timely fashion. Even if we are able to identify and develop new technologies and biosimulation tools of interest, we may not be able to negotiate license agreements on acceptable terms, or at all. Some of our products, such as our QSP models, require significant time and investment to develop to a point where they can achieve market
acceptance, and we may not be able to develop them at a rate that matches market demand. We may also face more significant pricing pressure as we expand geographically and our customer profile evolves. For example, smaller biotechnology companies, or companies based in countries that have less developed economies, may not be able to afford our products and services at our customary rates. If we are unable to develop, acquire and/or create demand for new services and products, our future business, results of operations and financial condition could be adversely affected.
We depend on highly qualified personnel and may not be able to retain these employees or recruit additional qualified personnel, which could harm our business.
Our success depends to a significant extent on the continued services of our senior management and other important contributors throughout our business. There is significant competition for qualified personnel in the biopharmaceutical services industry, particularly for those with higher educational degrees, and our industry generally tends to experience relatively high levels of employee turnover.
We are highly dependent on the research and development, modeling, financial, operational, scientific, software engineering, regulatory and other business expertise of our executive officers, as well as the other principal members of our management, scientific, modeling, regulatory services and software engineering teams. In addition to serving in a technical capacity, many of our scientists also play a significant role in marketing and selling our products and services to new and existing customers. As of December 31, 2024, 408 of our employees held PhDs or doctor of medicine degrees.
In order to attract and retain personnel in a competitive marketplace, we believe that we must provide a competitive compensation package, and compensation for our employees, which makes up our most significant fixed cost. Nonetheless, we may be unable to hire, train, retain, or motivate highly qualified personnel on acceptable terms or at all given the competition among numerous biopharmaceutical and technology companies for similar personnel.
Furthermore, we may elect to recruit skilled technical professionals from other countries to work in the U.S., and from the U.S. and other countries to work abroad. Limitations imposed by immigration laws in the U.S. and abroad, the availability of visas in the countries where we do business, and other travel restrictions could hinder our ability to attract necessary qualified personnel and harm our business and future operating results.
The loss of highly qualified employees, or our inability to continue to recruit, retain, and motivate such personnel, replace departed personnel in a timely fashion, or train our scientists to develop new business, may adversely impact our ability to compete effectively and grow our business and negatively affect our ability to meet our short and long-term financial and operational objectives.
If our independent contractors are characterized as employees, we could be subject to material adverse effects on our business and employment and withholding liabilities.
We rely on independent contractors to supplement parts of our business and provide expertise in certain specialized areas or discrete projects from time to time. We structure the relationships with our independent contractors in a manner that we believe results in an independent contractor relationship, not an employee relationship. Although we believe that our independent contractors are properly characterized as independent contractors, individuals, tax or other regulatory authorities may in the future challenge our characterization of these relationships. In addition, changes to U.S. or foreign laws governing the definition or classification of independent contractors, or judicial decisions regarding independent contractors, could result in a reclassification of such contractors as employees. If we are required to reclassify our independent contractors as employees, we would be required to withhold income taxes, to withhold and pay social security, Medicare and similar taxes and to pay unemployment and other related payroll taxes. We would also be liable for unpaid past taxes, subject to penalties and increased operating costs moving forward. We may also have difficulty staffing
certain projects if we were not able to convert independent contractors to full or part-time employees. As a result, any determination that our independent contractors are our employees could have a material adverse effect on our business, financial condition and results of operations.
Delays or defects in the release of new or enhanced software or other biosimulation tools may result in increased cost to us, delayed market acceptance of our products, diminished demand for our products, delayed or lost revenue, and liability.
Market acceptance of our products depends upon the continuous, effective and reliable operation of our software and other biosimulation tools and models. New or enhanced products or services, whether developed internally or acquired through acquisitions, can require long development and testing periods, which may result in delays in scheduled introduction. Our software solutions and biosimulation tools and models are inherently complex and may contain defects or errors. The risk of errors is particularly significant when a new product is first introduced or when new versions or enhancements of existing software solutions are released, such as the integration of AI technology with our existing software products. Although we extensively test and conduct quality control on each new or enhanced biosimulation product before it is released to the market, there can be no assurance that significant errors will not be found in existing or future releases. As a result, in the months following the introduction of certain releases, we may need to devote significant resources to correct these errors.
We cannot provide assurance, however, that all of these errors can be corrected in a timely manner or without impact to our customers or business. Many of our customers also require that new versions of our software be internally validated before implementation, which can result in delays or the decision to skip smaller updates altogether. As such, any errors, defects, disruptions or other performance problems with our products could hurt our reputation and may damage our customers’ businesses. Furthermore, any delays in the release schedule for new or enhanced products or services may delay market acceptance of these products or services and may result in delays in new customer orders for these new or enhanced products or services or the loss of customer orders, which may have a material adverse effect on our business, financial condition and results of operations.
To the extent that defects or errors cause our software or other biosimulation tools to malfunction and our customers’ use of our products is interrupted, or the data derived from the use of our products is incorrect or incomplete, our customers may delay or withhold payment to us, cancel their agreements with us or elect not to renew, make service credit claims, warranty claims or other claims against us, and we could lose future sales. The occurrence of any of these events could result in diminishing demand for our software, a reduction of our revenues, an increase in collection cycles for accounts receivable, and require us to increase our warranty provisions or incur the expense of litigation or substantial liability.
Issues relating to the implementation, use and development of AI and machine learning in our products and services may result in increased competition, reputational harm, regulatory action, or legal liability, and any failure to adapt to such technological developments or industry trends could adversely affect the performance of our business.
AI and machine learning technologies have been selectively incorporated across our software and services portfolios, potentially providing opportunities to expand the number of data sources utilized, better predict outcomes, and streamline reporting. For example, we are using machine learning to automate and speed the process of biosimulation in a growing number of applications within our platform, and we have created a generative AI application to aid drafting regulatory documents from scientific analyses and clinical data. We believe that AI predictive models will continue to enhance the effectiveness of biosimulation models and be utilized impactfully within drug development, and we plan to develop and incorporate additional AI technology in more products and services.
As we benefit from the advanced speed and automation of AI, we may encounter new entrants to our sector and competitors deploying and leveraging AI, similarly or more effectively, to achieve outcomes that result in competitive harm and loss of business for our products and services. The disruptive nature of AI may allow new and unexpected entrants, at lower investment points and with less established history, to compete with our existing technology or create new modalities or use cases that are more advanced, less expensive or faster to market. Furthermore, established technology companies that are not currently present in our sector may also apply their extensive resources and investments in AI technology to solutions that are relevant to our customer base, and may be able to provide technology products that are more advanced and lower cost, with wide recognition. The emergence of AI and relevance to our sector may result in more competition over time, which could adversely affect the performance of our business.
The development, deployment and use of AI, particularly generative AI, however, is still in its early stages and presents risks that could negatively impact our business. While we aim to develop and use AI responsibly and attempt to identify and mitigate ethical and legal issues presented by its use, we may be unsuccessful in identifying and resolving issues before they arise, and the usage of such technologies may not enhance our products or services, keep pace with our competitors or be beneficial to our business, including our efficiency and profitability.
Given the nascent stage of the technology, the use of AI can lead to unintended consequences, including the generation of outputs that appear correct but are factually inaccurate, misleading, or that result in unintended biases and discriminatory outcomes, or are otherwise flawed. If the AI tools that we use are deficient, inaccurate, reflect unwanted forms of bias, or contain other errors or inadequacies, we could incur operational inefficiencies, competitive harm, legal liability, brand or reputational harm, or other adverse impacts on our business and financial results. Further, a failure to timely and effectively use or deploy AI and integrate it into new product offerings and services could negatively impact our competitiveness, particularly ahead of evolving industry trends and evolving consumer demands. We may be unable to devote adequate financial resources to develop or acquire new AI technologies and systems in the future.
Additionally, AI can pose risks from an intellectual property, confidential data leakage, data protection and privacy perspective, as well as raise ethical concerns, compliance issues, and security risks. The input of confidential information or trade secrets into AI systems may result in the loss of intellectual property, proprietary rights, or attorney-client privilege in such information or trade secrets. The use of AI technologies for developing products or services may adversely affect or preclude our intellectual property rights in such products or services, or may expose us to liability related to the infringement, misappropriation or other violation of third-party intellectual property. The use of AI technologies with personally identifiable information or protected health information may also result in legal liability. If we do not have sufficient rights to use the data or other material or content on which the AI tools we use rely, we also may incur liability through the violation of applicable laws and regulations, third-party intellectual property, data privacy, or other rights, or contracts to which we are a party.
Moreover, AI is subject to a dynamic and rapidly evolving legal and regulatory environment, which, without appropriate review, governance and risk management, could expose us to unforeseen legal or regulatory scrutiny and liabilities. The technologies underlying AI and its uses are subject to a variety of laws and regulations, including intellectual property, data privacy and security, consumer protection, competition, and equal opportunity laws, and are expected to be subject to increased regulation and new laws or new applications of existing laws and regulations. AI is the subject of ongoing review by various U.S. governmental and regulatory agencies, and various U.S. states and other foreign jurisdictions are applying, or are considering applying, their platform moderation, data privacy, and security laws and regulations to AI or are considering general legal frameworks for AI. We may not be able to anticipate how to respond to these rapidly evolving frameworks, and we may need to expend resources to adjust our operations or offerings in certain jurisdictions if the legal frameworks are inconsistent across jurisdictions. Furthermore, because AI technology itself is highly
complex and rapidly developing, it is not possible to predict all of the legal, operational, or technological risks that may arise relating to the use of AI. Our failure to adequately address legal risks relating to AI in our business could result in litigation regarding, among other things, intellectual property, privacy, employment, civil rights and other claims that could result in liability for our company, damage our reputation or otherwise materially harm our business.
If our existing customers do not renew their software licenses, do not buy additional solutions from us or renew at lower prices, our business and operating results will suffer.
We expect to continue to derive a significant portion of our software revenues from the renewal of existing license agreements. As a result, maintaining the renewal rate of our existing customers and selling additional or upgraded software solutions to them is critical to our future operating results. Factors that may affect the renewal rate for our customers and our ability to sell additional solutions to them include:
•the price, performance and functionality of our software solutions;
•the availability, price, performance and functionality of competing products;
•the effectiveness of our professional services;
•the ability to develop complementary software solutions, applications and services;
•the stability, performance and security of our technological infrastructure; and
•the business environment of our customers.
We deliver our software through either (i) a product license that permits our customers to install the software solution directly onto their own in-house hardware and use it for a specified term or (ii) a subscription that allows our customers to access the cloud-based software solution for a specified term. Our customers have no obligation to renew their product licenses or subscriptions for our software solutions after the license term expires, which are typically between one and three years, and some of our contracts may be terminated or reduced in scope either immediately or upon notice. In addition, our customers may negotiate terms less advantageous to us upon renewal, which may reduce our revenues from these customers.
Our customers depend on our support to resolve technical issues relating to our solutions, as our software requires expert usage to fully exploit its capabilities. Any failure to offer high-quality technical support, or a market perception that we do not offer high-quality support, could adversely affect our renewal rates and our ability to sell additional solutions to existing customers or to sell to prospective customers. Factors that are not within our control may also contribute to a reduction in our software revenues. For instance, our customers may reduce the number of their employees who are engaged in research and who would have use of our software, which would result in a corresponding reduction in the number of user licenses needed for some of our solutions and thus a lower aggregate renewal fee. The loss, reduction in scope or delay of a large contract, or the loss or delay of multiple contracts, could materially adversely affect our business.
Our future operating results also depend, in part, on our ability to sell new software solutions and licenses to our existing customers. The willingness of existing customers to license our software will depend on our ability to scale and adapt our existing software solutions to meet the performance and other requirements of our customers, which we may not do successfully. If our customers fail to renew their agreements, renew their agreements upon less favorable terms or at lower fee levels or fail to purchase new software solutions and licenses from us, our revenues may decline and our future revenues may be constrained. Furthermore, our sales process is dependent on the reputation of our solutions and business and on positive recommendations from our
existing customers. Any dissatisfaction from existing customers may adversely impact our ability to sell our solutions to new customers.
Many of our technology-driven service contracts may be delayed or terminated, or the scope of work reduced, by the customer at its discretion immediately or after a short notice period without penalty. Customers terminate, delay or reduce the scope of these types of contracts for a variety of reasons, including but not limited to:
•lack of available funding or financing;
•mergers or acquisitions involving the customer;
•a change in customer priorities;
•impacts to client trial operations;
•delay or termination of a specific product candidate development program; and
•a decision to shift business to a competitor or to use internal resources.
As a result, contract terminations, delays and reductions in scope occur regularly in the normal course of our business. However, the delay, loss or reduction in scope of a large contract or multiple smaller contracts could result in under-utilization of our personnel, a decline in revenue and profitability and adjustments to our bookings, any or all of which could have a material adverse effect on our business, financial condition and results of operations.
Many of our contracts with customers also provide for services on a fixed-price or fee-for-service with a cap basis. Accordingly, we bear the financial risk if we initially underprice our contracts or otherwise overrun our cost estimates. In these situations, we attempt to revise the scope of activity from the contract specifications and negotiate contract modifications shifting the additional cost to the customer, but are not always successful. If we fail to adequately price our contracts or if we experience significant cost overruns (including direct and indirect costs such as pass-through costs), or if we are delayed in, or fail to, execute contract modifications with customers increasing the scope of activity, our results of operations could be materially adversely affected. From time to time, we have had to commit unanticipated resources to complete fixed-fee projects, resulting in lower margins and profitability on those projects. We might experience similar situations in the future, which could have a material adverse impact on our business, financial condition and results of operations.
We have government customers and have received government grants, which subject us to risks including early termination, audits, investigations, sanctions, or penalties.
We derive revenue from contracts with U.S. government entities, including the FDA and the Center for Disease Control and Prevention within the Department of Health and Human Services, as well as foreign governments. For example, our software products are licensed by 23 global drug regulatory agencies, including the FDA, Health Canada, Japan’s PMDA, China’s NMPA and the UK’s MHRA. We have also accepted limited grant funds from governmental entities, whereby we are reimbursed for certain expenses incurred, subject to our compliance with the specific requirements of the applicable grant, including rigorous documentation requirements. We may enter into further contracts with the U.S. or foreign governments in the future or accept additional grant funds. Additionally, we may be subject to change in priorities and funding availability from these government agencies and organizations, even with short or no advance notice. Increasingly, government support and funding may change with new administrations, personnel or polices in effect from time to time, in the United States and globally. Under these more prevalent circumstances, with respect to these contract and
revenue sources, we may operate with less certainty and shorter known time horizons on public sector commitments and contracts.
These arrangements subject us to statutes and regulations applicable to companies doing business with the government and customarily contain provisions that give the government substantial rights and remedies, many of which are not typically found in commercial contracts and which are unfavorable to contractors, including provisions that allow the government to unilaterally terminate or modify our federal government contracts, in whole or in part, at the government’s convenience or in the government’s best interest, including if funds become unavailable to the applicable government agency. Under general principles of government contracting law, if the government terminates a contract for convenience, the terminated company may generally recover only its incurred or committed costs and settlement expenses and profit on work completed prior to the termination. If the government terminates a contract for default, the defaulting company may be liable for any extra costs incurred by the government in procuring undelivered items from another source. Further, the laws and regulations governing the procurement of goods and services by the U.S. government provide procedures by which other bidders and interested parties may challenge the award of a government contract at the U.S. Government Accountability Office (“GAO”) or in federal court. Such challenges or protests could be filed with respect to any government contract we are awarded, even if there are not any valid legal grounds on which to base the protest. If any such protests are filed, the government agency may decide to suspend our performance under the contract while such protests are being considered by the GAO or the applicable federal court, thus potentially delaying delivery of payment.
In addition, government contracts and grants normally contain additional requirements that may increase our costs of doing business, reduce our profits, and expose us to liability for failure to comply with these terms and conditions. These requirements include, for example:
•compliance with complex regulations for procurement, formation, administration, and performance of government contracts under the Federal Acquisition Regulations, agency-specific regulations supplemental to the Federal Acquisition Regulations, and regulations specific to the administration of grants by the U.S. government;
•specialized disclosure and accounting requirements unique to government contracts and grants;
•mandatory financial and compliance audits that may result in potential liability for price or cost adjustments, recoupment of government funds after such funds have been spent, civil and criminal penalties, or administrative sanctions such as suspension or debarment from doing business with the U.S. government;
•public disclosures of certain contract, grant, and company information; and
•a wide variety of individual and changing compliance requirements.
Government contracts and grants are also generally subject to greater scrutiny by the government, which can unilaterally initiate reviews, audits and investigations regarding our compliance with government contract and grant requirements. In addition, if we fail to comply with government contract laws, regulations and contract or grant requirements, our contracts and grants may be subject to termination or suspension, and we may be subject to financial and/or other liability under our contracts or under the Federal Civil False Claims Act. The False Claims Act’s “whistleblower” provisions allow private individuals, including present and former employees, to sue on behalf of the U.S. government. The False Claims Act statute provides for treble damages and other penalties and, if our operations are found to be in violation of the False Claims Act, we could face other adverse action, including suspension or prohibition from doing business with the United States government. Any penalties, damages, fines, suspension, or damages could have a material adverse impact on our business, financial condition and results of operations.
Our historic growth rates may not be sustainable or indicative of future growth.
While our growth has moderated in recent years, we have historically experienced periods of significant growth, including within the last five years. Our growth over these periods is attributable to both organic revenue growth and revenue from acquisitions over these periods. Revenue increased from $208.5 million for 2019 to $385.1 million for 2024. Our historical rate of growth may not be sustainable or indicative of our future rate of growth. We believe that our continued growth in revenue, as well as our ability to improve or maintain margins and profitability, will depend upon, among other factors, our ability to address the challenges, risks and difficulties described elsewhere in this “Risk Factors” section and the extent to which our various product offerings grow (either through internal development or external acquisition) and contribute to our results of operations. In addition, our customer base may not continue to grow or may decline due to a variety of possible risks, including increased competition, changes in the regulatory landscape and the maturation of our business. Any of these factors could cause our revenue growth to decline and may adversely affect our margins and profitability. Failure to continue our revenue growth or improve margins would have a material adverse effect on our business, financial condition and results of operations. You should not rely on our historical rate of revenue growth as an indication of our future performance.
We regularly evaluate potential acquisitions and other strategic transactions that we deem beneficial and strategic to our long-term growth and profitability, which could divert our management’s attention, result in additional dilution to our stockholders, and otherwise disrupt our operations and adversely affect our operating results.
We have acquired multiple businesses and technologies in the past, and we regularly evaluate opportunities to acquire or invest in businesses, solutions or technologies that we believe could complement or expand our solutions, enhance our technical capabilities or otherwise offer growth opportunities as well as opportunities to streamline our existing business. For example, in November 2024, we announced that we have begun a review process to consider the long-term strategic options for our regulatory services business. The pursuit of potential acquisitions or other strategic transactions may divert the attention of management and cause us to incur various expenses in identifying, investigating and pursuing suitable opportunities, whether or not they are consummated.
We may not be able to successfully integrate the personnel, operations and technologies of the businesses we acquire, effectively manage the combined business following an acquisition or preserve the operational synergies between our business units that we underwrite at the time of such acquisition. The following factors could result in our failure to achieve the expected synergies:
•inability to integrate or benefit from acquired technologies or services in a profitable manner;
•unanticipated costs or liabilities associated with the acquisition;
•incurrence of acquisition-related costs;
•difficulty integrating the accounting systems, operations and personnel of the acquired business;
•difficulties and additional expenses associated with supporting legacy products and hosting infrastructure of the acquired business;
•difficulty converting the customers of the acquired business onto our solutions and contract terms, including disparities in the revenues, licensing, support or professional services model of the acquired company;
•diversion of management’s attention from other business concerns;
•adverse effects to our existing business relationships with business partners and customers as a result of the acquisition;
•the potential loss of key employees;
•use of resources that are needed in other parts of our business; and
•use of substantial portions of our available cash to consummate the acquisition.
For example, in 2023, we acquired Formedix Limited, which added a metadata repository and clinical data flow automation to our data platform, as well as Applied Biomath, a company focused on quantitative systems pharmacology (QSP) to expand and complement our existing QSP capabilities. Additionally, in 2024, we acquired Chemaxon, a leading provider of cheminformatics software to expand and complement our existing prediction and analytical capabilities in drug discovery. The planned integrations of these businesses into our existing product offerings may be delayed or may not achieve the expected results.
Some acquisitions are structured in such a way that a portion of the purchase price may be based on achieving certain post-closing conditions (i.e., “earn-outs”), such as the Company recognizing certain levels of revenue generated by the acquired business. Failure to achieve the expected synergies or market acceptance could also result in the failure to achieve some or all of these conditions, which could result in disputes with the seller of the applicable business.
In addition, a significant portion of the purchase price of companies we acquire may be allocated to acquired goodwill and other intangible assets, which must be assessed for impairment at least annually. In the future, if our acquisitions do not yield the expected returns, we may be required to take charges to our operating results based on this impairment assessment process, which could adversely affect our business, financial condition and results of operations.
Acquisitions could also result in dilutive issuances of equity securities or the incurrence of debt, which could adversely affect our operating results. In addition, if an acquired business fails to meet our expectations, our business, financial condition and results of operations may suffer.
We have also deemphasized and may in the future divest certain product lines or technologies that no longer fit our long-term strategies. Deemphasis or divestiture may adversely impact our business, financial condition and results of operations if we are unable to achieve the anticipated benefits or cost savings from such a strategy, or if we are unable to offset impacts from the loss of revenue associated with the subject businesses, product lines or technologies. For example, if we sell or otherwise dispose of certain businesses, product lines or assets, we may be unable to do so on satisfactory terms within our anticipated timeframe or at all. Further, whether such divestitures are ultimately consummated or not, their pendency could have a number of negative effects on our current business, including disrupting our regular operations, diverting the attention of our workforce and management team and increasing undesired workforce turnover. It could also disrupt existing business relationships, make it harder to develop new business relationships, or otherwise negatively impact the way that we operate our business.
Our estimated addressable market is subject to inherent challenges and uncertainties. If we have overestimated the size of our addressable market or the various markets in which we operate, our future growth opportunities may be limited.
Our Total Available Market (“TAM”) is based on publicly available third-party market research and internal estimates regarding the size of our markets, is subject to significant uncertainty and change, and is based on assumptions that may not prove to be accurate or continuing. We have based the TAM for our business on our current core markets, biosimulation, regulatory science, and market access, which may change from time to
time as our strategy evolves. While we believe the information on which we base our TAM is generally informative, such expectations, assumptions and estimates are inherently imprecise.
As such, our expectations, assumptions and estimates of future opportunities are necessarily subject to a high degree of uncertainty and risk due to a variety of factors, including those described herein. If third-party or internally generated data prove to be inaccurate or if we make errors in our assumptions based on that data, our future growth opportunities may be affected. If our TAM, or the size of any of the various markets in which we operate, proves to be inaccurate, our future growth opportunities may be limited and there could be a material adverse effect on our business, financial condition and results of operations.
Adverse global economic conditions could have a negative effect on our business, results of operations and financial condition and liquidity.
A general slowdown in the global economy or in a particular region or industry, other unfavorable changes in economic conditions, such as inflation, higher interest rates, tightening of the credit markets, recession or slowing growth, or an increase in trade tensions with U.S. trading partners could negatively impact our business, financial condition and liquidity. Macroeconomic weakness and uncertainty also make it more difficult for us to accurately forecast operating results and may make it more difficult to raise or refinance debt. Sustained uncertainty about, or worsening of, current global economic conditions and further escalation of trade tensions between the U.S. and its trading partners, especially China, could result in a global economic slowdown and long-term changes to global trade. Such events may also (i) cause our customers to reduce, delay or forgo R&D spending, (ii) result in customers sourcing products or services in-house or from other suppliers not subject to such restrictions or tariffs, (iii) lead to the insolvency or consolidation of key customers and/or (iv) intensify pricing pressures. Any or all of these factors could negatively affect demand for our products and our business, financial condition and results of operations.
We are subject to economic, political and other risks associated with the operation of a global business that could negatively affect our business, results of operations and financial condition.
We operate on a global basis with offices or activities in the United States, Canada, France, Germany, the Netherlands, Poland, Switzerland, the United Kingdom, Australia, India, the Philippines, Japan, China, Hungary, and South Korea. In addition, we derive a significant portion of our total revenue from our operations in international markets. During the years ended December 31, 2024 and 2023, 28% and 27%, respectively, of our revenues were transacted in foreign currencies, the majority of which included the British Pound Sterling, the Euro and Japanese Yen. Our international operations and sales subject us to a number of increased risks, including, among others:
•fluctuations in foreign currency exchange rates, which may affect the costs incurred in international operations and foreign acquisitions and could harm our results of operations and financial condition;
•changes in general economic and political conditions in countries where we operate, particularly as a result of ongoing economic instability within foreign jurisdictions;
•the potential for political unrest, acts of terrorism, hostilities or war;
•government trade restrictions, including tariffs, export controls or other trade barriers, and changes to existing trade arrangements, including the unknown impact of current and future U.S. and Chinese trade regulations;
•differing protection of intellectual property, technology and data in foreign jurisdictions;
•difficulty in staffing and managing widespread operations, including as a result of different employment-related laws (such as those related to safety, discrimination, classification of employees, wages, and benefits);
•being subject to complex and restrictive immigration, employment and labor laws and regulations, as well as union and works council restrictions ;
•changes in tax laws or rulings in the United States or other foreign jurisdictions that may have an adverse impact on our effective tax rate;
•being subject to burdensome foreign laws and regulations, including regulations that may place an increased tax burden on our operations;
•being subject to longer payment cycles from customers and experiencing greater difficulties in timely accounts receivable collections; and
•required compliance with a variety of foreign laws and regulations, such as data privacy requirements, real estate and property laws, anti-competition regulations, import and trade restrictions, export requirements, U.S. laws such as the FCPA and the U.S. Department of Commerce’s Export Administration Regulations, and other U.S. federal laws and regulations established by the Office of Foreign Assets Control, local laws such as the U.K. Bribery Act or other local laws that prohibit corrupt payments to governmental officials or certain payments or remunerations to customers.
In particular, political and economic changes, including international conflicts and terrorist acts, throughout the world may interfere with our or our customers’ activities in particular locations and result in a material adverse effect on our business, financial condition and operating results. Although we do not believe that current conflicts around the world pose any immediate material impact to our business, if these conflicts intensify or expand beyond the current scope and impact, in their various forms, they could have an adverse impact on our business.
Furthermore, political, diplomatic or military events could result in trade disruptions, including tariffs, trade embargoes, export restrictions and other trade barriers. A significant trade disruption, export restriction, or the establishment or increase of any trade barrier in any area where we do business could reduce customer demand and cause customers to search for substitute products and services, make our products and services more expensive or unavailable for customers, increase the cost of our products and services, have a negative impact on customer confidence and spending, make our products or services less competitive, or otherwise have an adverse impact on our business, operating results and financial condition.
Moreover, in response to the U.S. adopting tariffs and trade barriers or taking other actions, other countries may also adopt tariffs and trade barriers that could in certain cases limit our ability to offer our products and services. Current and potential customers who are concerned or affected by such tariffs or restrictions may respond by developing their own products or replacing our solutions, which would have an adverse effect on our business. In addition, government or customer efforts, attitudes, laws or policies regarding technology independence may lead to non-U.S. customers favoring their domestic technology solutions that could compete with or replace our products, which would also have a material adverse effect on our business, financial condition and results of operations.
In addition to tariffs and other trade barriers, our global operations are subject to numerous U.S. and foreign laws and regulations such as those related to anti-corruption, tax, corporate governance, imports and exports, financial and other disclosures, privacy and labor relations. These laws and regulations are complex and may have differing or conflicting legal standards, making compliance difficult and costly. In addition, there is uncertainty regarding how proposed, contemplated or future changes to these complex laws and regulations
could affect our business. We may incur substantial expense in complying with the new obligations to be imposed by these laws and regulations, and we may be required to make significant changes in our business operations, all of which may adversely affect our revenues and our business overall. If we violate these laws and regulations, we could be subject to fines, penalties or criminal sanctions and may be prohibited from conducting business in one or more countries. Any violation individually or in the aggregate could have a material adverse impact on our business, financial condition and results of operations.
Our financial results are also affected by fluctuations in foreign currency exchange rates. A weakening U.S. dollar relative to other currencies increases expenses of our foreign subsidiaries when they are translated into U.S. dollars in our consolidated statements of income. Likewise, a strengthening U.S. dollar relative to other currencies reduces revenue of our foreign subsidiaries upon translation and consolidation. Exchange rates are subject to significant and rapid fluctuations due to a number of factors, including interest rate changes and political and economic uncertainty. Therefore, we cannot predict the prospective impact of exchange rate fluctuations. We may be unable to hedge all of our foreign currency risk, which could have a material adverse effect on our business, financial condition and results of operations.
We are subject to the FCPA and the U.K. Bribery Act and similar anti-corruption laws and regulations in other countries and jurisdictions. Violations of these laws and regulations could harm our reputation and business, or materially adversely affect our business, results of operations, financial condition and/or cash flows.
We operate in numerous countries around the world and are subject to the FCPA, the U.K. Bribery Act and similar anti-bribery laws in the countries and jurisdictions in which we operate. Our business involves sales to government and state-owned agencies and brings us and others acting on our behalf, into contact with government officials around the world. The FCPA and the U.K. Bribery Act prohibit us and our officers, directors, employees and third parties acting on our behalf, including distributors and agents, from corruptly offering, promising, authorizing or providing anything of value to a “foreign official” for the purposes of influencing official decisions or obtaining or retaining business or otherwise obtaining favorable treatment. The FCPA further requires us to make and keep books, records and accounts that accurately reflect transactions and dispositions of assets and to maintain a system of adequate internal accounting controls. The U.K. Bribery Act also prohibits “commercial” bribery and accepting bribes.
Although our officers, directors, employees, distributors, and agents are required to comply with these laws and are subject to our internal policies and procedures, we cannot be sure that our internal policies and procedures will always protect us from liability for violations of these laws committed by persons associated with us, including our employees or third parties acting on our behalf. Violations of anti-corruption laws, or even allegations of such violations, could disrupt our business and result in a material adverse effect on our business, financial condition and results of operations. For example, violations may result in criminal or civil penalties, disgorgement of profits, related stockholder lawsuits, debarment from government contracting and other remedial measures.
Our failure to comply with trade compliance and economic sanctions laws and regulations of the United States and other applicable international jurisdictions could materially adversely affect our reputation and results of operations.
We must operate our business in compliance with applicable economic and trade sanctions laws and regulations, such as those administered and enforced by the U.S. Department of Treasury’s Office of Foreign Assets Control, the U.S. Department of State, the U.S. Department of Commerce, the United Nations Security Council and other relevant sanctions authorities. Our global operations and use of distributors in jurisdictions outside the U.S. expose us to the risk of violating, or being accused of violating, either directly or indirectly through our distributors, economic and trade sanctions laws and regulations. Our failure to comply with these laws and regulations may expose us to reputational harm as well as significant penalties, including criminal
fines, imprisonment, civil fines, disgorgement of profits, injunctions and debarment from government contracts, as well as other remedial measures. Investigations of alleged violations can be expensive and disruptive. Despite our efforts to enforce our policies, we cannot assure compliance by our employees or representatives, such as our distributors or resellers, for which we may be held responsible, and any such violation could materially adversely affect our reputation, business, financial condition and results of operations.
Current and future litigation against us, which may arise in the ordinary course of our business, could be costly and time consuming to defend.
We are subject to claims that arise in the ordinary course of business, such as claims in connection with commercial disputes, employment claims made by our current or former employees, claims brought by third-parties for failure to adequately protect their personal data, or claims by shareholders or government agencies that we have failed to comply with laws and regulations pertaining to public companies or federal or state securities laws and regulations. Third parties may in the future assert intellectual property rights to technologies that are important to our business and demand back royalties or that we license their technology. Litigation may result in substantial costs and may divert management’s attention and resources, which may seriously harm our business, overall financial condition and operating results. Insurance may not cover such claims, may not be sufficient for one or more of such claims and may not continue to be available on terms acceptable to us. A claim brought against us that is uninsured or underinsured could result in unanticipated costs and could have a material adverse impact on our business, financial condition and results of operations.
Our insurance coverage may not be sufficient to avoid material impact on our financial position resulting from claims or liabilities against us, and we may not be able to obtain insurance coverage on attractive terms, or at all, in the future.
We maintain insurance coverage for protection against many risks of liability, including directors and officers liability, professional errors and omissions, breach of fiduciary duty, and cybersecurity risks. The extent of our insurance coverage is under regular review and is modified as we deem it necessary. Despite this insurance, it is possible that claims or liabilities against us may not have been fully insured, or our insurance carriers may contest coverage, which could have a material adverse impact on our business, financial position and results of operations. In addition, we may not be able to obtain any insurance coverage, or adequate insurance coverage on attractive terms, or at all, when our existing insurance coverage expires and the cost of obtaining such insurance coverage may materially increase.
If we fail to perform our services in accordance with contractual requirements, regulatory standards and ethical considerations, we could be liable for significant costs or penalties and our reputation could be harmed.
The services we provide to biopharmaceutical companies and other customers are complex and subject to contractual requirements, regulatory standards and ethical considerations. For example, some of our services must adhere to the regulatory requirements of the FDA governing our activities relating to preclinical studies and clinical trials, including GLP and GCP. Additionally, we are subject to compliance with the FDA’s regulations set forth in part 11 of title 21 of the Code of Federal Regulations, which relates to the creation, modification, maintenance, archival, retrieval, transmittal or distribution of electronic records under records requirements in FDA regulations and submitted to the FDA. The FDA may also issue or finalize guidance documents that may have implications for our customers and our products, platforms, and services. We may be subject to inspection by regulatory authorities in connection with our customers’ marketing applications and other regulatory submissions. If we fail to perform our services in accordance with regulatory requirements, regulatory authorities may take action against us or our customers for failure to comply with applicable regulations governing the development and testing of therapeutic products. Regulatory authorities may also disqualify certain data or analyses from consideration in connection with applications for regulatory approvals, which would result in our customers not being able to rely on our services in connection with their regulatory
submissions and may subject our customers to additional or repeat clinical trials and delays in the development and regulatory approval process. Mistakes in providing services to our customers, such as dosing models, could affect medical decisions for patients in clinical trials and create liability for personal injury. Such actions may include sanctions, such as warning or untitled letters, injunctions, or failure of such regulatory authorities to grant marketing approval of products, delay, suspension, or withdrawal of approvals, license revocation, loss of accreditation; product seizures or recalls; operational restrictions; or civil or criminal penalties or prosecutions, damages or fines. Customers may also bring claims against us for breach of our contractual obligations or errors in the outcomes of our products or services, may terminate their contracts with us and/or may choose not to award further work to us. Any such action could have a material adverse effect on our reputation, business, financial condition and results of operations.
We derive a significant percentage of our revenues from a key group of customers, and the loss of one or more of our major customers could materially and adversely affect our business, results of operations and/or financial condition.
Our ten largest customers accounted for 27% of revenues for the year ended December 31, 2024. The loss of any one or more of our major customers could have a material adverse effect on our results of operations and financial condition. We may not be able to maintain our customer relationships, and our customers may delay payment under, or fail to renew, their agreements with us, which could adversely affect our business, results of operations or financial condition. Any reduction in the amount of revenues that we derive from these customers, without an offsetting increase in new sales to other customers, could have a material adverse effect on our operating results. A significant change in the liquidity or financial position of our customers could also have a material adverse effect on the collectability of our accounts receivable, our liquidity, and our future operating results.
We may need additional funding. If we are unable to raise additional capital on terms acceptable to us or at all or generate cash flows necessary to maintain or expand our operations, we may not be able to compete successfully, which would harm our business, results of operations, and financial condition.
We expect to devote substantial financial resources to our ongoing and planned activities, including the continued investment in our biosimulation software platform and strategic partnerships and acquisitions.
As of December 31, 2024, we had cash and cash equivalents of $179.2 million. We believe that our existing cash and cash equivalents will be sufficient to fund our operations and capital expenditure requirements for an extended period. However, we have based this estimate on assumptions that may prove to be wrong, and our operating plans may change as a result of many factors currently unknown to us. As a result, we could deplete our capital resources sooner than we currently expect.
Our future capital requirements will depend on many factors, including: the growth of our revenue; the growth of our employee base; the timing and launch of new products; the continued expansion of sales and marketing activities; and mergers and acquisitions of technologies or services complementing or extending our biosimulation, regulatory science and market access businesses.
In the event that we require additional financing, we may not be able to raise such financing on terms acceptable to us or at all. In addition, we may seek additional capital due to favorable market conditions or strategic considerations, even if we believe we have sufficient funds for our current or future operating plans. If we are unable to raise additional capital on terms acceptable to us or at all or generate cash flows necessary to maintain or expand our operations and invest in our computational platform, we may not be able to compete successfully, which would harm our business, financial condition and results of operations.
Our bookings might not accurately predict our future revenue, and we might not realize all or any part of the anticipated revenue reflected in our bookings.
Our bookings represent anticipated revenue for work not yet completed or performed under a signed contract or purchase order where there is sufficient or reasonable certainty about the customer’s ability and intent to fund and commence the software or services. Bookings vary from period to period depending on numerous factors, including sales performance and the overall health of the biopharmaceutical industry, among others. Once work begins, we recognize direct revenue over the life of the contract based on our performance of services under the contract. Contracts may be terminated or delayed by our customers for reasons beyond our control. To the extent projects are delayed, the anticipated timing of our direct revenue could be materially affected.
In the event a customer terminates a contract, we are generally entitled to be paid for services rendered through the termination date and for services provided in winding down the project. However, we are generally not entitled to receive the full amount of direct revenue reflected in our bookings in the event of a contract termination. A number of factors may affect bookings and the direct revenue generated from our bookings, including the size, complexity and duration of solutions, changes in the scope of work during the course of a project and the cancellation or delay of a solution.
An increase in bookings at a particular point in time does not necessarily correspond to an increase in revenues during a particular period. The timing and extent to which bookings will result in direct revenue depend on many factors, including the timing of the commencement of work, the rate at which we perform services, scope changes, cancellations, delays, the receipt of regulatory approvals, and the nature, duration, size, complexity, and phase of the studies. In addition, delayed projects remain in bookings until they are canceled. As a result of these factors, our bookings are not necessarily a reliable indicator of future direct revenue, and we might not realize all or any part of the revenue from the authorizations in bookings at any given point in time.
Our business may be subject to risks arising from catastrophic events, including natural disasters, significant or extreme weather events, outbreaks of war or terrorism, epidemic diseases, pandemics, and public health crises.
We may be subject to risks related to catastrophic events, including natural disasters, significant or extreme weather events, outbreaks of war, acts of terrorism or other global tensions, epidemic diseases, pandemics, public health crises or other “acts of God,” each of which may be exacerbated by the effects of changing weather patterns. We are a global company with offices in many countries, and disruptions in the infrastructure, either on a local or global scale, caused by these types of events could adversely affect our ability to serve our customers. Any of these catastrophic events could adversely impact supply chain interruptions, disruptions or delays to pipeline development and clinical trials and interruptions or delays in regulatory approvals. These and other adverse impacts on our customers and general economic conditions may cause our customers to delay or cancel projects or significantly scale back their operations or R&D spending and limit the use of third parties, which could have a material adverse effect on our business, financial condition and results of operations. Additionally, public health crises could also impact the health of our employees and cause extensive absences from work, which may delay the completion of internal projects and lower our consultant utilization rates.
Furthermore, we rely extensively on software applications and other information technology systems that are critically important to our business operations. Any disruptions or incidents caused by cyberattacks and other cyber incidents, network or power outages, software or equipment failure, prolonged service disruptions, user errors, natural disasters or other catastrophic events could have a material adverse effect on our business, financial condition and results of operations. See “Risks Related to Intellectual Property, Information Technology and Data Privacy.”
Although we have disaster recovery and business continuity plans, carry business interruption insurance policies and typically have provisions in our contracts that protect us in certain force majeure type events, we cannot be
certain that our plans will be successful in the event of a disaster, that our insurance coverage will be adequate to compensate us for all losses that may occur or that provisions in our contracts will afford us adequate protection. If our disaster recovery or business continuity plans are unsuccessful in a disaster recovery scenario, we could potentially experience material adverse impacts, including loss of data, disruption to our operations, legal or regulatory proceedings, reputational harm and loss of customers, any of which could have a material adverse effect on our business, financial condition and results of operations.
Risks Related to Intellectual Property, Information Technology and Data Privacy
We rely on third-party providers of cloud-based infrastructure to host our software solutions. Any disruption in the operations of these third-party providers, limitations on capacity or interference with our use could adversely affect our business, financial condition, reputation and results of operations.
We outsource substantially all of the infrastructure relating to our hosted software solutions to third-party hosting services. Customers of our hosted software solutions need to be able to access our software platform at any time, without interruption or degradation of performance, and we provide them with service-level commitments with respect to uptime. Our hosted software solutions depend on protecting the virtual cloud infrastructure hosted by third-party hosting services by maintaining its configuration, architecture, features and interconnection specifications, as well as the information stored in these virtual data centers, which is transmitted by third-party internet service providers. Any limitation on the capacity of our third-party hosting services could impede our ability to onboard new customers or expand the usage of our existing customers, which could adversely affect our business, financial condition and results of operations. In addition, any incident affecting our third-party hosting services’ infrastructure that may be caused by catastrophic events could negatively affect our cloud-based solutions. Work-from-home and other flexible work arrangements have impacted our third-party vendors by increasing operational challenges and risks, including vulnerabilities to cybersecurity and information technology infrastructure threats. A prolonged service disruption affecting our cloud-based solutions for any of the foregoing reasons would negatively impact our ability to serve our customers and could damage our reputation with current and potential customers, expose us to liability, cause us to lose customers or otherwise harm our business. We may also incur significant costs for using alternative equipment or taking other actions in preparation for, or in reaction to, events that damage the third-party hosting services we use.
In the event that our service agreements with our third-party hosting services are terminated, or there is a lapse or interruption of services or features that we utilize, we could experience interruptions in access to our platform as well as significant delays and additional expense in arranging or creating new facilities and services and/or re-architecting our hosted software solutions for deployment on a different cloud infrastructure service provider, which could adversely affect our business, financial condition and results of operations.
If we are not able to reliably meet our data storage and management or other information technology requirements, or if we experience any technology failures in the delivery of our services over the internet or in the administration of our business, customer satisfaction and our reputation could be harmed and customer contracts may be terminated.
As part of our current business model, the portion of our software that is delivered over the internet as SaaS is increasing, and we store and manage significant data for our customers, resulting in substantial information technology infrastructure and ongoing technological challenges, which we expect to continue to increase over time. If we do not reliably meet these data storage and management requirements, or if we experience any failure or interruption in the delivery of our services over the internet, customer satisfaction and our reputation could be harmed, leading to reduced revenues and increased expenses. Our hosting services are subject to service-level agreements and, if we fail to meet guaranteed service or performance levels, we could be subject to customer credits or termination of these customer contracts. If the cost of meeting these data storage and
management requirements increases, our business, financial condition and results of operations could be harmed.
Furthermore, we utilize multiple complex integrated software and hardware operating systems, including enterprise resource planning systems, to support our business, and we have a continuous improvement strategy in place to keep our systems and overarching technology stable and in line with our business needs and growth. While we employ controlled change management methodologies to plan, test and execute all such system upgrades and improvements, transitioning critical business or accounting functions to upgraded or new processes and systems may require significant capital investments and personnel resources and coordination with third-party software and system providers. We cannot assure that our systems will meet our future business needs, that upgrades or new systems will operate as designed or that there will not be associated excessive costs or disruptions in portions of our business in the course of our maintenance, support, upgrade and/or transition of these systems. If our information technology systems, upgrades and associated change management are not adequate to support our business and our strategic initiatives, our business, financial condition and results of operations could be harmed.
Some of our software solutions utilize third-party open source software, and any failure to comply with the terms of one or more of these open source licenses could adversely affect our business, subject us to litigation and create potential liability.
Some of our software solutions utilize software covered by open source licenses, and we expect to continue to incorporate open source software in our solutions in the future. Open source software is often widely accessible, usable and modifiable and may be used by our development team in an effort to reduce development costs and speed up the development process. Use of open source software also in some respects entails greater risks than use of third party commercial software, as open source licensors generally do not provide warranties or other contractual protections regarding infringement claims or the quality of the code, including with respect to security vulnerabilities.
Although we have processes intended to comply with the license requirements in our software, certain open source software licenses require, among other things, that a licensor that distributes the open source software as a component of the licensor’s proprietary software to provide or offer to provide to the customer-licensee part or all of the source code to the licensor’s proprietary software. While we have policies against using this type of open source code in our distributed software, if we were to utilize this type of open source code, and if the owner of the copyright of the relevant open source software were to allege that we had not complied with the conditions of one or more of these licenses, we could be required to incur significant legal expenses defending against such allegations and could be subject to significant damages, enjoined from the sale of our solutions that contain the open source software and required to comply with onerous conditions or restrictions on these solutions, which could disrupt the distribution and sale of these solutions. Litigation or other enforcement actions initiated by a copyright owner could have a negative effect on our business, financial condition and results of operations, or require us to devote additional R&D resources to change our solutions. Moreover, we could effectively be required to publicly release the affected portions of our source code, re-engineer all or a portion of our solutions or otherwise be limited in the licensing of our solutions, each of which could reduce or eliminate the value of our solutions. Disclosing our proprietary source code could allow our competitors to create similar products with lower development effort and time and ultimately could result in a loss of sales. Any of these events could create liability for us and damage our reputation, which could have a material adverse effect on our business, financial condition and results of operations.
If our cybersecurity measures are breached or unauthorized or unlawful access to customer or other proprietary data occurs, our solutions may be perceived as not being secure, customers may reduce the use of or stop using our solutions and/or we may incur significant liabilities.
The evolution of technology systems introduces ever more complex risks of cybersecurity threats that are difficult to predict and defend against. An increasing number of companies, including those with significant online operations, have recently disclosed breaches of their cybersecurity systems, some of which involved sophisticated tactics and techniques allegedly attributable to criminal enterprises or nation-state actors. Our efforts to improve our defenses may not always prove successful, and we may detect, or receive notices from customers and both public and private agencies that they have detected, actual or perceived vulnerabilities or fraudulent activity. In addition, cybersecurity threats are constantly evolving, are becoming more frequent and more sophisticated and are being made by groups of individuals with a wide range of expertise and motives, which increases the difficulty of detecting and successfully defending against them. Our infrastructure (and that of the third parties with which we do business) is vulnerable to physical or electronic break-ins, ransomware attacks, computer viruses or similar problems, which in some cases may be outside our control. Like other companies in our industry, we are, in the normal course of business, the target of cyberattack attempts, and we can make no assurance that future cyberattacks will not be material.
Our solutions involve the collection, analysis and retention of our customers’ proprietary information related to their drug development efforts, including clinical data. Unauthorized access to this information or data (including health information and other personal data), whether deliberate or unintentional, could result in the loss of information, governmental inquiries or investigations, litigation, breach of contract claims, indemnity obligations, damage to our reputation and other liability. Given the trusted nature of our customer relationships and the importance of the data that we manage, any unauthorized access or breach, to any degree, could result in outsized reputational and customer harm, and as a result of which we could lose business and see our commercial prospects and liability exposure seriously and adversely impacted.
Our reliance on remote access to our information systems exposes us to potential cybersecurity breaches and the risk of loss or exposure of such information and data. Additionally, we rely on third parties and their cybersecurity procedures for the secure storage, processing, maintenance, and transmission of information that is critical to our operations and such third parties may also suffer cybersecurity incidents. Depending on their nature and scope, this could potentially result in the misappropriation, destruction, corruption or unavailability of critical data and confidential or proprietary information (our own or that of third parties, including information about our customers and employees) and the disruption of business operations.
If there is a cybersecurity incident and we know or reasonably suspect that certain personal information has been subject to unauthorized or unlawful access or use, we may need to inform the affected individuals and make certain public disclosures; moreover, we may be subject to significant fines and penalties. Determining whether a cybersecurity incident is notifiable or reportable may not be straightforward, and any such mandatory disclosures could be costly and lead to negative publicity, loss of customer confidence in the effectiveness of our security measures, diversion of management’s attention and governmental investigations. In some cases, these determinations will be fact-specific and vary by jurisdiction, with a range of notice periods and information requirements, as, for example, some notices will be sector-relevant or require acceleration depending on scope or categories of data in question.
Further, under certain regulatory schemes, such as the CCPA or other similar state privacy laws, individuals may bring private claims for our failure to deploy reasonable and appropriate cybersecurity controls, and we also may be liable for statutory and multiple damages. In addition, if our technical and operational cybersecurity safeguards fail, our existing and prospective customers may lose confidence in our ability to maintain the confidentiality of their intellectual property and other proprietary and sensitive data, we may be subject to breach of contract claims by our customers. Our insurance may not be adequate to cover losses associated with
such events, and in any case, such insurance may not cover all of the types of costs, expenses and losses we could incur to respond to and remediate a security breach. Defending against investigations, claims or litigation based on any security breach or incident, regardless of their merit, will be costly. The successful assertion of one or more large claims against us that exceed available insurance coverage, denial of coverage as to any specific claim, or any change or cessation in our insurance policies and coverages, including premium increases or the imposition of large deductible requirements, could have a material adverse effect on our business, financial condition and results of operations.
We are subject to numerous privacy and cybersecurity laws and related contractual requirements, and our failure to comply with those obligations could cause us significant harm, including financial losses and reputational harm.
In the normal course of our business, we collect, process, use and disclose information about individuals, including on behalf of our customers, as well as for our employees around the world. The collection, processing, use, disclosure, disposal and protection of such information is highly regulated both in the U.S. and other jurisdictions, including but not limited to, under HIPAA, as amended by HITECH; United States state privacy, security and breach notification and healthcare information laws, such as the CCPA; the European Union’s GDPR, UK GDPR, and other European and UK privacy laws, as well as the expanding number of privacy laws around the world, including China and Canada. These laws are complex and their interpretation is rapidly evolving, making implementation and enforcement, and thus compliance requirements, uncertain and potentially inconsistent. For example, the CCPA imposes obligations and restrictions on businesses regarding their collection, use, and sharing of personal information and provides new and enhanced data privacy rights to California residents, such as affording them the right to access and delete their personal information and to opt out of certain sharing of personal information. Protected health information that is subject to HIPAA is excluded from the CCPA; however, information we hold about individuals that is not subject to HIPAA would be subject to the CCPA. It is unclear how HIPAA and the other exceptions may be applied under the CCPA and how other, similar state laws, amendments, and regulations with similar exceptions for protected health information will be enforced.
In addition, our collection, use, disclosure, protection and other processing of information is subject to related contractual requirements. Compliance with such laws and related contractual requirements may require changes to our information processing practices and may thereby increase compliance costs. Failure to comply with such laws and/or related contractual obligations could result in regulatory enforcement or claims against us for breach of contract or may lead third parties to terminate their contracts with us and/or choose not to work with us in the future. Should this occur, there could be a material adverse effect on our business, financial condition and results of operations.
Data privacy and security laws and regulations often govern the handling of information about individuals, including personal health information and require the use of standard contracts, privacy and security standards and other administrative simplification provisions.
Additionally, the FTC and many state attorneys general are interpreting existing federal and state consumer protection laws to impose evolving standards for the online collection, use, dissemination and security of information about individuals, including health-related information. Courts may also adopt the standards for fair information practices promulgated by the FTC, which concern consumer notice, choice, security and access. Consumer protection laws require us to publish statements that describe how we handle information about individuals and choices individuals may have about the way we handle their information. If such information that we publish is considered untrue, we may be subject to government claims of unfair or deceptive trade practices, which could lead to significant liabilities and consequences. Furthermore, according to the FTC, violating consumers’ privacy rights or failing to take appropriate steps to keep information about consumers
secure may constitute unfair acts or practices in or affecting commerce in violation of Section 5(a) of the FTC Act.
The GDPR and the UK GDPR regulate our processing of personal data, and imposes stringent requirements. Failure to comply with the GDPR or UK GDPR may result in fines up to the greater of €20 million or 4.0% of worldwide gross annual revenue and applies to services providers such as us under each of GDPR and UK GDPR.
There is uncertainty regarding transfers of personal data from the EEA to the United States, including regarding the status and enforceability of the European Commission’s adequacy decision with the United States and the EU-U.S. Data Privacy Framework (“EU-U.S. DPF”) under which personal data could be transferred from the EEA to U.S. entities who had self-certified under the DPF scheme. While the Court of Justice of the European Union (CJEU) has upheld the adequacy of the standard contractual clauses (a standard form of contract approved by the European Commission as an adequate personal data transfer mechanism, and potential alternative to the DPF), it made clear that reliance on them alone may not necessarily be sufficient in all circumstances; and the validity of the standard contractual clauses as a transfer mechanism remains uncertain. We have previously relied on our own DPF certification and our relevant customers’ and third parties’ DPF certification(s) for the purposes of transferring personal data from the EEA to the United States in compliance with the GDPR’s data export conditions. We also currently rely on the standard contractual clauses to transfer personal data outside the EEA, including to the United States. If all or some jurisdictions within the European Union or the United Kingdom determine that the standard contractual clauses do not provide sufficient safeguards to transfer personal data to the United States, our ability to effect cross-border transfers of personal data will be severely limited or cause us to need to establish systems to maintain certain data sovereignty in the EEA or UK, and thereby divert resources from other aspects of our operations, all of which may adversely affect our business or we may face governmental enforcement actions, litigation, fines and penalties or adverse publicity, which could have an adverse effect on our reputation and business.
It is possible that we could fail to comply with the requirements of all of the various data privacy laws and regulations and contractual obligations that we are subject to or that we could incur liability due to the acts or omissions of our vendors. In the event we are not able to secure indemnification or the indemnification and any insurance coverage is inadequate to cover our losses, we could suffer significant financial, operational, reputational and other harm and our business, financial condition and results of operations could be materially adversely affected. Furthermore, as supervisory authorities issue further guidance on personal data export mechanisms, including circumstances where the standard contractual clauses cannot be used, and/or start taking enforcement action, we could suffer additional costs, complaints and/or regulatory investigations or fines, and/or if we are otherwise unable to transfer personal data between and among countries and regions in which we operate, it could affect the manner in which we provide our services, the geographical location or segregation of our relevant systems and operations.
We may be unable to adequately enforce or defend our ownership and use of our intellectual property and other proprietary rights.
Our success is dependent upon our intellectual property and other proprietary rights. We rely upon a combination of trademark, trade secret, copyright, patent and unfair competition laws, as well as contractual provisions, to protect our intellectual property and other proprietary rights. In addition, we attempt to protect our intellectual property and proprietary information by enforcing cyber and physical security measures and requiring our employees and certain of our consultants to enter into confidentiality, non-competition and assignment-of-inventions agreements. The steps we take to protect these rights may not be adequate to prevent misappropriation of our technology by third parties or may not be adequate under the laws of some foreign countries, which may not protect our intellectual property rights to the same extent as do the laws of the United States. Our attempts to protect our intellectual property may be challenged by others or invalidated through
administrative process or litigation, and agreement terms that address non-competition are difficult to enforce in many jurisdictions and may not be enforceable in any particular case. In addition, there remains the possibility that others will “reverse engineer” our software products to introduce competing products, or that others will develop competing technology independently. If we resort to legal proceedings to enforce our intellectual property rights or to determine the validity and scope of the intellectual property or other proprietary rights of others, the proceedings could be burdensome and expensive, even if we were to prevail. As we integrate AI into more of our products and services, the law pertaining to intellectual property created using AI remains subject to interpretation, or fact specific, and we may not be able to adequately protect all proprietary information created through the use of AI. The failure to adequately protect our intellectual property and other proprietary rights may have a material adverse effect on our business, financial condition and results of operations.
Third parties may initiate legal proceedings alleging that we are infringing, misappropriating or otherwise violating their intellectual property rights, the outcome of which would be uncertain and could have a material adverse effect on the success of our business.
Our commercial success depends upon our ability to develop, market and sell our products and services, allowing our customers to use our proprietary technologies without infringing, misappropriating or otherwise violating the intellectual property and proprietary rights of third parties. There is considerable patent and other intellectual property litigation in the software, pharmaceutical and biotechnology industries. We may become party to, or be threatened with, adversarial proceedings or litigation regarding intellectual property rights with respect to our technology and product candidates.
The legal threshold for initiating litigation or contested proceedings is low, so that even lawsuits or proceedings with a low probability of success might be initiated and require significant resources to defend. Litigation and contested proceedings can also be expensive and time-consuming, and our adversaries in these proceedings may have the ability to dedicate substantially greater resources to prosecuting these legal actions than we can. Third parties may assert infringement claims against us based on existing patents or patents that may be granted in the future, regardless of merit. We may not be aware of all such intellectual property rights potentially relating to our technology, or we may incorrectly conclude that third-party intellectual property is invalid or that our activities do not infringe such intellectual property. Thus, we do not know with certainty that our technology does not and will not infringe, misappropriate or otherwise violate any third party’s intellectual property.
Parties making claims against us may obtain injunctive or other equitable relief, which could effectively block our ability to further develop and commercialize the product candidates that we may identify. Defending these claims, regardless of their merit, would involve substantial litigation expense and would be a substantial diversion of employee resources from our business. In the event of a successful claim of infringement against us, we may have to pay substantial damages (including treble damages and attorneys’ fees for willful infringement), pay royalties, be forced to cease developing and commercializing or to redesign the infringing technology or product, be forced to indemnify our customers or collaborators or obtain one or more licenses from third parties, which may be impossible or require substantial time and monetary expenditure. Even if we were required to obtain a license, such license could be non-exclusive, thereby giving our competitors and other third parties access to the same technologies licensed to us and could require us to make substantial licensing and royalty payments. Claims that we have misappropriated the confidential information or trade secrets of third parties could have a similar material adverse effect on our business, financial condition and results of operations.
If we fail to comply with certain healthcare laws, including fraud and abuse laws, we could face substantial penalties and our business, results of operations, financial condition and prospects could be adversely affected.
Even though we do not order healthcare services or bill directly to Medicare, Medicaid or other third-party payors, as a result of contractual, statutory or regulatory requirements, we may be subject to healthcare fraud
and abuse laws of both the federal government and the states in which we conduct our business. Because of the breadth of these laws and the narrowness of available statutory and regulatory exceptions, it is possible that some of our business activities could be subject to challenge under one or more of such laws. If we or our operations are found to be in violation of any of the laws described above or any other governmental regulations that apply to us, we may be subject to penalties, including civil and criminal penalties, damages, fines, imprisonment and the curtailment or restructuring of our operations, any of which could have a material adverse effect on our business, financial condition and results of operations.
Risks Related to Our Indebtedness
Our indebtedness could materially adversely affect our financial condition and our ability to operate our business, react to changes in the economy or industry or pay our debts and meet our obligations under our debt and could divert our cash flow from operations to debt payments.
As of December 31, 2024, we had $298.5 million in total borrowings under our credit agreement, dated July 15, 2017 (as amended, the “Credit Agreement”), and $100.0 million of capacity outstanding under our revolving credit facility. In addition, subject to restrictions governing our Credit Agreement, we may incur additional debt.
Our debt could have important consequences, including the following:
•it may be difficult for us to satisfy our obligations, including debt service requirements under our outstanding debt, resulting in possible defaults on and acceleration of such indebtedness;
•our ability to obtain additional financing for working capital, capital expenditures, debt service requirements or other general corporate purposes may be impaired;
•a portion of cash flow from operations may be dedicated to the payment of principal and interest on our debt;
•we may be more vulnerable to economic downturns and adverse industry conditions and our flexibility to plan for, or react to, changes in our business or industry may be more limited;
•our ability to capitalize on business opportunities and to react to competitive pressures, as compared to our competitors, may be compromised due to our level of debt; and
•our ability to borrow additional funds or to refinance debt may be limited.
Furthermore, all of our debt under our Credit Agreement bears interest at variable rates. If these rates were to increase significantly, whether because of an increase in market interest rates or a decrease in our creditworthiness, our ability to borrow additional funds may be reduced and the risks related to our debt would intensify.
Our business may not generate sufficient cash flow from operating activities to service our debt obligations. Our ability to make payments on and to refinance our debt and to fund planned capital expenditures depends on our ability to generate cash in the future. To some extent, this is subject to general economic, financial, competitive, legislative, regulatory and other factors that are beyond our control.
If we are unable to generate sufficient cash flow from operations to service our debt and meet our other commitments, we may need to refinance all or a portion of our debt, sell material assets or operations, delay capital expenditures or raise additional debt or equity capital. We may not be able to effect any of these actions on a timely basis, on commercially reasonable terms or at all, and these actions may not be sufficient to meet
our capital requirements. In addition, the terms of our existing or future debt agreements may restrict us from pursuing any of these alternatives.
Additionally, we and our subsidiaries may be able to incur substantial additional debt in the future. Although the agreements governing our Credit Agreement contain restrictions on the incurrence of additional debt, these restrictions are subject to a number of qualifications and exceptions or may be waived, and the debt incurred in compliance with these restrictions could be substantial. If we incur additional debt above the levels currently in effect, the risks associated with our leverage, including those described above, would increase.
Restrictive covenants governing our Credit Agreement may restrict our ability to pursue our business strategies, and failure to comply with any of these restrictions could result in acceleration of our debt.
The operating and financial restrictions and covenants governing our Credit Agreement may materially adversely affect our ability to finance future operations or capital needs or to engage in other business activities. Such agreements limit our ability, among other things, to: incur additional indebtedness and guarantee indebtedness; pay dividends on or make distributions in respect of our common stock or make other restricted payments; make certain acquisitions, investments, loans and advances; transfer or sell certain assets; and consolidate, merge, sell or otherwise dispose of all or substantially all of our assets.
In addition, the restrictive covenants in our Credit Agreement require us to maintain a specified first lien leverage ratio when a certain percentage of our revolving credit facility commitments are borrowed and outstanding as of the end of each fiscal quarter. Our ability to meet this financial covenant may be affected by events beyond our control. Additionally, we have pledged substantially all of our assets as collateral to secure our Credit Agreement.
A breach of any of these and certain other covenants could result in a default under our Credit Agreement whereby the lenders could elect to declare all amounts outstanding under our Credit Agreement to be immediately due and payable and terminate any commitments to extend further credit. If we were unable to repay those amounts, the lenders under our Credit Agreement could proceed against the collateral granted to them to secure that indebtedness.
Furthermore, the terms of any future indebtedness we may incur could have further additional restrictive covenants. We may not be able to maintain compliance with these covenants in the future, and in the event that we are not able to maintain compliance, we may not be able to obtain waivers from the lenders or amend the covenants.
Risks Related to our Financial Statements and Results
Impairment of goodwill or other intangible assets may adversely impact future results of operations.
We have significant intangible assets, including goodwill and other finite-lived and indefinite-lived intangibles, on our balance sheet due to our acquisitions of businesses. The initial identification and valuation of these intangible assets and the determination of the estimated useful lives at the time of acquisition involve use of management judgments and estimates. These estimates are based on, among other factors, input from accredited valuation consultants, reviews of projected future income cash flows and statutory regulations. The use of alternative estimates and assumptions might have increased or decreased the estimated fair value of our goodwill and other intangible assets that could potentially result in a different impact to our results of operations. If the future growth and operating results of our business are not as strong as anticipated, we experience negative industry or economic trends, our stock price significantly declines for a sustained period and/or our market capitalization declines, this could impact the assumptions used in calculating the fair value of goodwill or other indefinite-lived intangibles. We assess the potential impairment of goodwill and other intangible assets on at least an annual basis. To the extent goodwill or other indefinite-lived intangibles are
impaired, their carrying value will be written down to its implied fair value and a charge will be made to our income from continuing operations. Any such impairment charges could have a material adverse effect on our results of operations.
Our ability to use our net operating losses (“NOLs”) and R&D tax credit carryforwards to offset future taxable income may be subject to certain limitations.
As of December 31, 2024, we had federal and state NOLs of approximately $6.2 million and $4.9 million, respectively, which are available to reduce future taxable income and expire between 2035 and 2036 and 2029 and 2040, respectively. We had federal R&D tax credit carryforwards of approximately $0.3 million to offset future income taxes, which expire between 2027 and 2048. We also had foreign tax credits of approximately $11 million, which will start to expire in 2027. These carryforwards that may be utilized in a future period may be subject to limitations based upon changes in the ownership of our stock in a future period. Additionally, we carried forward foreign NOLs of approximately $78.6 million which will start to expire in 2025, foreign research and development credits of $0.3 million which expire in 2029, and Canadian investment tax credits of approximately $3.9 million which expire between 2032 and 2042. Our carryforwards are subject to review and possible adjustment by the appropriate taxing authorities.
In addition, in general, under Section 382 of the Internal Revenue Code of 1986, as amended (the “Code”), and corresponding provisions of state law, a corporation that undergoes an “ownership change,” generally defined as a greater than 50 percentage point change (by value) in its equity ownership by certain stockholders over a three year period, is subject to limitations on its ability to utilize its pre-change NOLs, R&D tax credit carryforwards and disallowed interest expense carryforwards to offset future taxable income. We have performed an analysis for the period January 1, 2024 through December 31, 2024 and determined no ownership change occurred during this period. In addition, we determined that ownership changes occurred in prior periods and therefore our NOLs and R&D tax credit carryforwards reflect the amounts available after considering such limitations. We may experience further ownership changes in the future and/or subsequent changes in our stock ownership (which may be outside our control). As a result, if, and to the extent that, we earn net taxable income, our ability to use our pre-change NOLs, R&D tax credit carryforwards and disallowed interest expense carryforwards to offset such taxable income may be subject to limitations.
Risks Related to Ownership of Our Common Stock
Future sales, or the perception of future sales, of our common stock by us or our existing stockholders in the public market could cause the market price for our common stock to decline.
The sale of additional shares of our common stock in the public market, or the perception that such sales could occur, could harm the prevailing market price of shares of our common stock. These sales, or the possibility that these sales may occur, also might make it more difficult for us to sell equity securities in the future at a time and at a price that we deem appropriate.
As of December 31, 2024, shares controlled by Arsenal Capital Partners (“Arsenal”) and our officers and directors in aggregate represented approximately 24.7% of our outstanding common stock. The market price of our shares of common stock could drop significantly if Arsenal or our officers and directors sell their shares or are perceived by the market as intending to sell them. These factors could also make it more difficult for us to raise additional funds through future offerings of our shares of common stock or other securities.
In the future, we may also issue our securities in connection with investments or acquisitions. The number of shares of our common stock issued in connection with an investment or acquisition could constitute a material portion of our then-outstanding shares of our common stock. Any issuance of additional securities in connection with investments or acquisitions may result in additional dilution.
Arsenal holds a substantial amount of our outstanding common stock, and its interests may be different than the interests of other holders of our common stock.
As of December 31, 2024, Arsenal owns or controls approximately 22.6% of our outstanding common stock, and subject to the terms of the Stockholders Agreement, dated as of November 3, 2022, by and among the Company and Arsenal Saturn Holdings LP and certain affiliated entities (collectively, “Arsenal”), Arsenal maintains the right to nominate up to two board members. In addition, Arsenal has significant influence over the outcome of all matters requiring stockholder approval, including any potential change of control of our company. The concentration of ownership could deprive investors of an opportunity to receive a premium for shares of common stock as part of a sale of our Company and ultimately might affect the market price of our common stock.
Arsenal is in the business of making investments in companies and may from time to time acquire and hold interests in businesses that compete directly or indirectly with us. Our amended and restated certificate of incorporation provides that any director who is not employed by us or his or her affiliates does not have a duty to refrain from engaging, directly or indirectly, in the same business activities or similar business activities or lines of business in which we operate. Arsenal also may pursue acquisition opportunities that may be complementary to our business, and, as a result, those acquisition opportunities may not be available to us.
Our amended and restated certificate of incorporation provides, subject to limited exceptions, that the Court of Chancery of the State of Delaware and, to the extent enforceable, the federal district courts of the United States of America will be the sole and exclusive forums for certain stockholder litigation matters, which could limit our stockholder’s ability to obtain a favorable judicial forum for disputes with us or our current and former directors, officers, employees or stockholders.
Our amended and restated certificate of incorporation provides, subject to limited exceptions, that unless we consent in writing to the selection of an alternative forum, the Court of Chancery of the State of Delaware shall, to the fullest extent permitted by law, be the sole and exclusive forum for any (i) derivative action or proceeding brought on behalf of our company, (ii) action asserting a claim of breach of a fiduciary duty owed by any current or former director, officer, employee or stockholder of our Company to the Company or our stockholders, (iii) action asserting a claim against the Company or any current or former director, officer, employee or stockholder of the Company arising pursuant to any provision of the Delaware General Corporation Law (“DGCL”), or our amended and restated certificate of incorporation or our amended and restated bylaws (as either might be amended from time to time) or (iv) action asserting a claim governed by the internal affairs doctrine of the State of Delaware. Unless we consent in writing to the selection of an alternative forum, the federal district courts of the United States of America shall be the exclusive forum for the resolution of any complaint asserting a cause of action arising under the federal securities laws of the United States of America. Any person or entity purchasing or otherwise acquiring any interest in shares of our capital stock shall be deemed to have notice of and consented to the forum provisions in our amended and restated certificate of incorporation. Although our amended and restated certificate of incorporation contains the exclusive forum provision described above, it is possible that a court could find that such a provision is inapplicable for a particular claim or action or that such provision is unenforceable.
These choice of forum provisions may limit a stockholder’s ability to bring a claim in a different judicial forum, including one that it may find favorable or convenient for disputes with us or any of our directors, officers or other employees which may discourage lawsuits with respect to such claims. Alternatively, if a court were to find the choice of forum provisions that will be contained in our amended and restated certificate of incorporation to be inapplicable or unenforceable with respect to one or more of the specified types of actions or proceedings, we may incur additional costs associated with resolving such action in other jurisdictions, which could harm our business, operating results and financial condition.
Item 1B. Unresolved Staff Comments.
None.
Item 1C. Cybersecurity.
We are committed to safeguarding our customers’ information that is shared with us in the application of the software and services we contractually provide to them. Our information systems, including our cybersecurity program, risk management systems and processes and governance, reflect our dedication to meeting industry cybersecurity standards.
Risk Management and Strategy
We have implemented a comprehensive cybersecurity and data privacy program as part of our risk management processes to assess, identify and manage risks posed to our business by cybersecurity threats. We embed cybersecurity considerations into every material aspect of our operations, and our focus encompasses a proactive approach that involves continuous monitoring to swiftly detect and respond to cybersecurity threats. Our cybersecurity risk management processes are grounded in industry best practices, including NIST 800-53, ISO 27001, CIS Top 18, OWASP Top 10, and Security by Design and are intended to prevent adverse effects on the confidentiality, integrity and availability of our information systems and information residing therein.
Our cybersecurity processes have been integrated into our risk management processes in order for us to assess, identify, and manage risks related to cybersecurity threats and ensure compliance with our legal and contractual obligations, which require us to safeguard the confidential and sensitive information provided to us by our customers. For example, we use various methods and tools to identify and assess cybersecurity threats across all assets in our technical landscape, such as vulnerability scanning, penetration testing, threat intelligence, risk assessments, and audits from customers. We regularly engage third-party assessors, service providers, consultants, and auditors to support and review our risk management processes and to provide independent validation and verification of our security posture. We have established processes to oversee and identify risks from cybersecurity threats associated with our use of third-party assessors and service providers, such as due diligence, contractual language, monitoring and periodic vendor evaluation and qualification.
We maintain robust cybersecurity threat procedures, which includes escalating threats to the appropriate level of risk management, mitigation, remediation and the assessment of materiality of cybersecurity threats, or a series of related incidents, that may materially affect or are reasonably likely to materially affect our business strategy, results of operations, or financial condition. We disclose information regarding our cybersecurity and privacy program and practices on our website and in our public-facing notices.
Furthermore, we conduct annual cybersecurity awareness training for our employees in order to provide them with the knowledge necessary to navigate the digital landscape securely. We understand that cybersecurity is not a static concept but a dynamic discipline, and our security and privacy program reflects this by incorporating internal and third-party audits, penetration testing, active vulnerability scanning and a continuous improvement mindset.
As of December 31, 2024, we were not aware of any cybersecurity threats that have materially affected, or are reasonably likely to affect, the Company, including its business strategy, results of operations or financial condition. As discussed more fully under Part 1, Item 1A. Risk Factors, the sophistication of cyber threats continues to increase, and the preventative actions the Company takes to reduce the risk of cyber incidents and protect its systems and information may be insufficient. No matter how well designed or implemented the Company’s cybersecurity controls are, it will not be able to anticipate all security breaches, and it may not be able to implement effective preventive measures against cybersecurity breaches in a timely manner. See Part 1,
Item 1A. Risk Factors entitled “Risks Related to Intellectual Property, Information Technology and Data Privacy” included elsewhere in this Annual Report on Form 10-K.
Governance
We have established a corporate governance structure that provides oversight and guidance for our cybersecurity and data privacy program. Our Board of Directors (the “Board”) is responsible for the oversight of our cybersecurity and privacy program and risks from cybersecurity threats. Our Board’s Audit Committee, which supports the Board in its oversight of our cybersecurity and data privacy program, is focused on cybersecurity and data privacy risk, including incident response planning, and timely identification and assessment of cybersecurity threats, cybersecurity incident recovery and business continuity considerations.
We have defined roles and responsibilities for our assessment and management of risks related to cybersecurity threats, including specific executive-level and management-level positions or committees. Our cybersecurity and privacy program is overseen by our Security and Privacy Program Office (“SPPO”), which is composed of corporate leadership from legal and information technology (“IT”). The SPPO reports to our Head of Information Technology, who is the accountable executive for our cybersecurity program. Our function and business unit executive leadership, acting in support of our SPPO, is responsible for ensuring organizational compliance with data protection safeguard regulations and related risk controls across our organization. Our Head of Information Technology and our Director, Compliance Standards & Data Privacy (“DCSDP”), are responsible for the design, implementation, and monitoring of the cybersecurity and data privacy policies, standards, procedures, and controls that govern our information systems and data processing activities. Our Head of Information Technology has more than 30 years of experience in IT infrastructure, cybersecurity operations, and site reliability engineering for a wide range of software and service organizations, with the last 16 years focused on SaaS software businesses with access to sensitive customer data. The DCSDP also has over 30 years in IT with the last 13 focused on compliance and data privacy issues for Certara.
Our Head of Information Technology and DCSDP report to our General Counsel, as well as to our Board through its Audit Committee. The IT Security team and DCSDP coordinate the response and remediation of cybersecurity incidents and data breaches and report on the status and effectiveness of the security and privacy program to the SPPO, the Board and the Audit Committee on a quarterly basis, or more frequently as needed.
We have established processes to ensure that management is informed about and monitors cybersecurity threat prevention, detection, mitigation, and, if necessary, cybersecurity incident remediation. These processes include regular reporting, escalation, and communication protocols, as well as periodic reviews and audits of our cybersecurity and data privacy program.
Item 2. Properties.
As of December 31, 2024, we had 36 offices in 17 countries, with our headquarters located in Radnor, Pennsylvania. We lease or sublease all of our offices. None of our facilities are used for anything other than general office use. We believe that our facilities are suitable and adequate for our operations and we anticipate that additional suitable space will be available when needed.
As of December 31, 2024, our material active operating locations, which we define as the facilities we lease with more than 10,000 square feet, were as follows:
| | | | | | | | | | | | | | |
| LOCATION | | APPROXIMATE
SQUARE FOOTAGE | | LEASE EXPIRATION
DATES |
| Sheffield, UK | | 13,910 | | 1/28/2028 |
| Raleigh, North Carolina, USA | | 11,250 | | 1/31/2028 |
| Radnor, Pennsylvania, USA | | 19,371 | | 12/31/2034 |
Item 3. Legal Proceedings.
To the extent applicable, the information required with respect to this item can be found under Note 11. “Commitments and Contingencies” in the notes to the consolidated financial statements and is incorporated by reference into this Item 3.
Item 4. Mine Safety Disclosures.
Not applicable.
PART II
Item 5. Market for Registrant’s Common Equity, Related Stockholder Matters and Issuer Purchases of Equity Securities.
Market Information
Our common stock has been listed on The Nasdaq Stock Market LLC (“Nasdaq”) under the symbol “CERT” since December 11, 2020. Prior to that date, there was no public trading market for our common stock.
As of February 17, 2025, there were 30 holders of record of our common stock as reported by our transfer agent. Holders of record are defined as those stockholders whose shares are registered in their names in our stock records and do not include beneficial owners of common stock whose shares are held in the names of brokers, dealers, and clearing agencies.
Dividend Policy
We currently do not expect to declare any dividends on our common stock in the foreseeable future. Instead, we anticipate that all of our earnings in the foreseeable future will be used to provide working capital, to support our operations, to finance the growth and development of our business and to reduce our net debt. Any determination to declare dividends in the future will be at the discretion of our board of directors, subject to applicable laws, and will be dependent on a number of factors, including our earnings, capital requirements and overall financial condition. In addition, because we are a holding company, our ability to pay dividends on our common stock may be limited by restrictions on our ability to obtain sufficient funds through dividends from subsidiaries, including restrictions under our Credit Agreement, and may be further restricted by the terms of any future debt or preferred securities. See “Risk Factors—Risks Related to Ownership of Our Common Stock.”
Stock Performance Graph
The following graph compares (i) the cumulative total stockholder return on our common stock from December 11, 2020 (the date our common stock commenced trading on Nasdaq through December 31, 2024 with (ii) the cumulative total return of the NASDAQ Index and the S&P Small Cap 600 HealthCare Index over the same period, assuming the investment of $100 in our common stock and in each index on December 11, 2020 and the reinvestment of dividends. The graph uses the closing market price on December 11, 2020 of $38.08 per share as the initial value of our common stock.
As discussed above, we have never declared or paid a cash dividend on our common stock and do not anticipate declaring or paying a cash dividend in the foreseeable future.
Issuer Purchases of Equity Securities
The following table summarizes our purchases of common stock in the three months ended December 31, 2024:
| | | | | | | | | | | | | | | | | | | | | | | |
| Total Number of Shares Purchased(a) | | Weighted Average Price Paid per Share | | Total Number of Shares Purchased Under
Announced Programs | | Approximate Dollar Value of Shares That May
Yet be Purchased Under Announced Programs |
| 10/1/2024 to 10/31/2024 | 37,989 | | $ | 11.68 | | | 0 | | $ | 0 | |
| 11/1/2024 to 11/30/2024 | 10,927 | | $ | 10.22 | | | 0 | | $ | 0 | |
| 12/1/2024 to 12/31/2024 | 9,004 | | $ | 10.54 | | | 0 | | $ | 0 | |
| Total | 57,920 | | $ | 11.23 | | | 0 | | |
__________________________________
(a)Shares purchased were due to shares delivered by employees to us for the payment of taxes resulting from issuance of common stock upon the vesting of restricted stock or restricted stock units (RSUs) relating to stock-based compensation plans.
Unregistered Sales of Equity Securities
(b) There were no unregistered sales of equity securities during the fourth quarter of fiscal 2024.
Item 6. [Reserved]
Item 7. Management’s Discussion and Analysis of Financial Condition and Results of Operations.
For purposes of this Management's Discussion and Analysis of Financial Condition and Results of Operations section, we use the terms "Certara Inc.", "Company", “we”, “us”, and “our” to refer to Certara, Inc.
You should read the following discussion of our financial condition and results of operations in conjunction with our audited consolidated financial statements and the related notes and other financial information included elsewhere in this Annual Report and our audited consolidated financial statements and notes thereto.
As discussed in the section titled “Special Note Regarding Forward Looking Statements,” the following discussion and analysis, in addition to historical financial information, contains forward-looking statements that involve risks and uncertainties. Our actual results could differ materially from those anticipated in these forward-looking statements as a result of various factors, including those set forth in the section titled “Risk Factors” under Part I, Item 1A above. For a discussion of our financial condition and results of operations for the year ended December 31, 2023 compared to the year ended December 31, 2022, see “Results of Operations” and “Liquidity and Capital Resources” under Part II, Item 7. Management’s Discussion and Analysis of Financial Condition and Results of Operations in our 2023 Annual Report on Form 10-K.
We intend the discussion of our financial condition and results of operations that follows to provide information that will assist the reader in understanding our consolidated financial statements, the changes in certain key items in those financial statements from year to year, and the primary factors that accounted for those changes, as well as how certain accounting principles, policies and estimates affect our Consolidated Financial Statements.
Executive Overview
We are a leading provider of biosimulation technology and solutions for using MIDD in the global biopharmaceutical industry. Biosimulation and MIDD can increase the probability of success in bringing a new drug to market and decrease the costs of drug development. In addition, MIDD strategies are increasingly utilized to help predict commercial success, a critical part of the drug development process as new products must be both approved by regulators and adopted by the market. Our goal is to enable the life science industry to use data, modeling, and analytics to make better decisions during drug development and commercialization to increase productivity rates and vastly reduce development costs.
Drug development is necessarily a highly regulated process involving the collection of vast amounts of laboratory, clinical and evidence data, and there are many failures at every step along the way which add to total cost. On average, the pharmaceutical industry spends more than $270 billion annually on research and development("R&D"). Generally, companies spend an average of $6.2 billion per FDA-approved drug to develop one new medicine, including the cost of failures, according to "Analysis of pharma R&D productivity - a new perspective needed" on Drug Discovery Today. Our software and scientists incorporate modern advances in scientific understanding, drug development experience, data analysis, and AI resulting in significant opportunities to decrease the cost and increase the odds of new drug approval and commercial success.
Our proprietary biosimulation platforms are built on biology, chemistry, and pharmacology principles with proprietary mathematical algorithms that model how medicines and diseases behave in the body. For over two decades, our scientists have developed and validated our biosimulation technology using data from scientific literature, laboratory research, preclinical and clinical studies. To do this, we have developed solutions for the collection, standardization, validation, storage, and analysis of the preclinical and clinical data needed for MIDD. These data solutions are used internally and by global life sciences companies.
The scientific principles underlying our work with customers in biosimulation and MIDD must be transparent and fully explainable during the regulatory process, so we have become experts at incorporating data and results into regulatory documents. Our software and regulatory services streamline the creation of regulatory filings and speed regulatory data flow to maximize the chances of successful commercialization.
AI and machine learning technologies are being incorporated across our software and services portfolios providing opportunities to expand the number of data sources utilized, better predict outcomes, and streamline reporting. For example, we are using machine learning to automate and speed the process of biosimulation, and we have created an AI application to aid creating regulatory documents from scientific analyses and clinical data. We believe that AI predictive models will continue to enhance the accuracy and usefulness of biosimulation models and be utilized broadly across drug development.
We deliver software and technology-enabled services. Our strategy is to create and apply validated software applications that can be used broadly in the life science industry. We offer services, leveraging our technology, delivered by scientists with extensive drug development experience to aid our clients in applying biosimulation and MIDD to their specific projects.
Since 2014, customers who leverage our solutions have received 90% or more of all new drug approvals by FDA. We have worked with more than 2,400 life sciences companies and academic institutions and have collaborated on more than 9,000 customer projects in the last decade across a wide variety of therapeutic areas ranging from cancer and hematology to diabetes and hundreds of rare diseases. Our software products are licensed by more than 94,000 users and are also used by 23 global drug regulatory agencies, including the FDA and Japanese PMDA.
With continued innovation in and adoption of our biosimulation software, technology, and services, we believe more life science companies worldwide will leverage more of our end-to-end platform to reduce cost, accelerate speed to market, and ensure safety and efficacy of medicines for all patients.
Key Factors Affecting Our Performance
We believe that the growth of and future success of our business depends on many factors. While each of these factors presents significant opportunities for our business, they also pose important challenges that we must successfully address to sustain our growth and improve results of operations.
Customer Retention and Expansion
Our future operating results depend, in part, on our ability to successfully enter new markets, increase our customer base, and retain and expand our relationships with existing customers. We monitor two key performance indicators to evaluate retention and expansion: new bookings and net retention rates.
•Bookings: Our new bookings represent the estimated contract value of a signed contract or purchase order where there is sufficient or reasonable certainty about the customer’s ability and intent to fund and commence the software and/or services. Bookings vary from period to period depending on numerous factors, including the overall health of the biopharmaceutical industry, regulatory developments, industry consolidation, and sales performance. Bookings have varied and will continue to vary significantly from quarter to quarter and from year to year. See “Risk Factors — Risks Related to Our Business — Our bookings might not accurately predict our future revenue, and we might not realize all or any part of the anticipated revenue reflected in our backlog.”
•Net Retention Rates: Our net retention rates measure the percentage of recurring revenue that is retained from existing software customers over a specific period of time, inclusive of price increases and expansion, excluding revenue from acquisitions occurred within the past 12 months.
The tables below summarizes our quarterly bookings and net software retention rate trends:
| | | | | | | | | | | | | | | | | | | | | | | | | | | | | |
| Bookings |
| Q1 | | Q2 | | Q3 | | Q4 | | FULL YEAR |
| (in millions) |
| 2024 | $ | 105.8 | | | $ | 98.9 | | | $ | 96.1 | | | $ | 144.5 | | | $ | 445.3 | |
| 2023 | $ | 112.7 | | | $ | 85.9 | | | $ | 84.8 | | | $ | 118.9 | | | $ | 402.3 | |
| 2022 | $ | 108.5 | | | $ | 100.3 | | | $ | 79.8 | | | $ | 120.4 | | | $ | 409.0 | |
| | | | | | | | | |
| Net Retention Rates |
| Q1 | | Q2 | | Q3 | | Q4 | | FULL YEAR |
| (in percentage) |
| 2024 | 114.1 | % | | 108.0 | % | | 107.6 | % | | 105.5 | % | | 108.8 | % |
| 2023 | 108.3 | % | | 110.5 | % | | 106.4 | % | | 103.4 | % | | 108.4 | % |
| 2022 | 101.5 | % | | 104.5 | % | | 104.3 | % | | 109.2 | % | | 105.1 | % |
Investments in Growth
We have invested and intend to continue to invest in expanding the breadth and depth of our solutions, including through acquisitions and international expansion. We expect to continue to invest in (i) scientific talent to expand our ability to deliver solutions across the drug development spectrum; (ii) sales and marketing to promote our solutions to new and existing customers and in existing and expanded geographies; (iii) research and development to support existing solutions and innovate new technology; (iv) other operational and administrative functions to support our expected growth; and (v) complementary business. We expect that our headcount will increase over time and also expect our total operating expenses will continue to increase over time.
Our Operating Environment
The acceptance of model-informed biopharmaceutical discovery and development by regulatory authorities affects the demand for our products and services. Support for the use of biosimulation in discovery and development from regulatory bodies, such as the FDA and EMA, has been critical to its rapid adoption by the biopharmaceutical industry. There has been a steady increase in the recognition by regulatory and academic institutions of the role that modeling and simulation can play in the biopharmaceutical development and approval process, as demonstrated by new regulations and guidance documents describing and encouraging the use of modeling and simulation in the biopharmaceutical discovery, development, testing, and approval process, which has directly led to an increase in the demand for our services. Changes in government or regulatory policy, or a reversal in the trend toward increasing the acceptance of and reliance upon in silico data in the drug approval process, could decrease the demand for our products and services or lead regulatory authorities to cease use of, or recommend against the use of, our products and services.
Governmental agencies throughout the world, but particularly in the United States where the majority of our customers are based, strictly regulate the biopharmaceutical development process. Our business involves helping biopharmaceutical companies strategically and tactically navigate the regulatory approval process. New or amended regulations are expected to result in higher regulatory standards and often additional revenues for companies that service these industries. However, some changes in regulations, such as a relaxation in regulatory requirements or the introduction of streamlined or expedited approval procedures, or an increase in regulatory requirements that we have difficulty satisfying or that make our regulatory strategy services less competitive, could eliminate or substantially reduce the demand for our regulatory services. Additionally, a new
government administration may lead to either stricter or more relaxed regulatory environments. Currently, the new U.S. federal administration shows signs of reforming the pharmaceutical industry, particularly focusing on drug pricing and accelerated drug approval. These changes are expected to potentially have a significant impact on the biopharmaceutical industries, creating a mix of opportunities and challenges for us.
In addition to the external regulatory environment, internally, we initiated a review process in 2024 to evaluate the long-term strategic options for our regulatory services business. This review could result in several potential directions for the business, which could potentially have a significant impact on our operations.
Competition
The market for our biosimulation products and related services for the biopharmaceutical industry is competitive and highly fragmented. In our view, the principal competitive factors in our market are the functionality and quality of models, the breadth of molecular types, therapeutic areas, and modalities supported, regulator acceptance of our solutions, ease of use and functionality of applications, depth of experience in drug development, brand awareness and reputation, total cost, and the ability to securely integrate with other enterprise applications and the overall drug development process in the customer. For additional information, see “Business — Competition”.
non-GAAP measures
Management uses various financial metrics, including total revenues, income from operations, net income, as well as certain metrics that are not required by, or presented in accordance with, GAAP, such as adjusted EBITDA, adjusted net income, and adjusted diluted earnings per share, to measure and assess the performance of our business, to evaluate the effectiveness of our business strategies, to make budgeting decisions, to make certain compensation decisions, and to compare our performance against that of other peer companies using similar measures. We believe that presentation of the GAAP and the non-GAAP metrics in this filing will aid investors in understanding our business.
Management measures operating performance based on adjusted EBITDA defined for a particular period as net income (loss) excluding interest expense, provision (benefit) for income taxes, depreciation and amortization expense, intangible asset amortization, equity-based compensation expense, goodwill impairment expense, acquisition and integration expense, and other items not indicative of our ongoing operating performance. Management also measures operating performance based on adjusted net income defined for a particular period as net income (loss) excluding equity-based compensation expense, amortization of acquisition-related intangible assets, acquisition and integration expense, and other items not indicative of our ongoing operating performance. Further, management measures operating performance based on adjusted diluted earnings per share defined for a particular period as adjusted net income divided by the weighted-average diluted common shares outstanding.
We believe adjusted EBITDA, adjusted net income, and adjusted diluted earnings per share are helpful to investors, analysts, and other interested parties because they can assist in providing a more consistent and comparable overview of our operations across our historical periods. In addition, these measures are frequently used by analysts, investors, and other interested parties to evaluate and assess performance.
Adjusted EBITDA, adjusted net income, and adjusted diluted earnings per share are non-GAAP measures and are presented for supplemental purposes only and should not be considered as an alternative or substitute to financial information presented in accordance with GAAP. Adjusted EBITDA, adjusted net income and adjusted diluted earnings per share have certain limitations in that they do not include the impact of certain expenses that are reflected in our consolidated statements of operations and comprehensive income (loss) that are necessary to run our business. Other companies, including other companies in our industry, may not use
these measures and may calculate both differently than as presented, limiting the usefulness as a comparative measure.
The following table reconciles net income (loss) to adjusted EBITDA :
| | | | | | | | | | | | | | | | | |
| YEAR ENDED DECEMBER 31, |
| 2024 | | 2023 | | 2022 |
| | | | | |
| (in thousands) |
| Net income (loss)(a) | $ | (12,051) | | | $ | (55,357) | | | $ | 14,731 | |
| Interest expense(a) | 21,520 | | | 22,916 | | | 17,773 | |
| Interest income(a) | (9,034) | | | (9,317) | | | (1,294) | |
| (Benefit from) Provision for income taxes(a) | (5,133) | | | 214 | | | 4,024 | |
| Depreciation and amortization expense(a) | 1,994 | | | 1,552 | | | 1,731 | |
| Intangible asset amortization(a) | 66,039 | | | 54,519 | | | 50,739 | |
| Currency (gain) loss(a) | 2,344 | | | 638 | | | (3,166) | |
| Equity-based compensation expense(b) | 34,774 | | | 28,300 | | | 30,345 | |
| Change in fair value of contingent consideration(d) | 8,089 | | | 24,118 | | | — | |
| Goodwill impairment expense(e) | — | | | 46,984 | | | — | |
| Acquisition-related expenses(f) | 5,426 | | | 6,064 | | | 2,233 | |
| Integration expense(g) | — | | | 121 | | | — | |
| Transaction-related expenses(h) | 2,625 | | | — | | | 1,136 | |
| Severance expenses(i) | 183 | | | — | | | 653 | |
| Reorganization expense(j) | 4,223 | | | 1,660 | | | — | |
| Loss on disposal of fixed assets(k) | 401 | | | 65 | | | 169 | |
| Executive recruiting expense(l) | 646 | | | 631 | | | 139 | |
| First-year Sarbanes-Oxley implementation costs(m) | — | | | — | | | 961 | |
| Adjusted EBITDA | $ | 122,046 | | | $ | 123,108 | | | $ | 120,174 | |
| | | | | |
| | | | | |
The following table reconciles net income (loss) to adjusted net income:
| | | | | | | | | | | | | | | | | |
| YEAR ENDED DECEMBER 31, |
| 2024 | | 2023 | | 2022 |
| | | | | |
| (in thousands) |
| Net income (loss) (a) | $ | (12,051) | | | $ | (55,357) | | | $ | 14,731 | |
| Currency (gain) loss(a) | 2,344 | | | 638 | | | (3,166) | |
| Equity-based compensation expense(b) | 34,774 | | | 28,300 | | | 30,345 | |
| Amortization of acquisition-related intangible assets(c) | 54,431 | | | 45,838 | | | 43,822 | |
| Change in fair value of contingent consideration(d) | 8,089 | | | 24,118 | | | — | |
| Goodwill impairment expense(e) | — | | | 46,984 | | | — | |
| Acquisition-related expenses(f) | 5,426 | | | 6,064 | | | 2,233 | |
| Integration expense(g) | — | | | 121 | | | — | |
| Transaction-related expenses(h) | 2,625 | | | — | | | 1,136 | |
| Severance expenses(i) | 183 | | | — | | | 653 | |
| Reorganization expense(j) | 4,223 | | | 1,660 | | | — | |
| Loss on disposal of fixed assets(k) | 401 | | | 65 | | | 169 | |
| Executive recruiting expense(l) | 646 | | | 631 | | | 139 | |
| First-year Sarbanes-Oxley implementation costs(m) | — | | | — | | | 961 | |
| Income tax expense impact of adjustments(n) | (28,220) | | | (30,041) | | | (17,633) | |
| Adjusted net income | $ | 72,871 | | | $ | 69,021 | | | $ | 73,390 | |
| | | | | |
The following table reconciles diluted earnings per share to adjusted diluted earnings per share:
| | | | | | | | | | | | | | | | | |
| YEAR ENDED DECEMBER 31, |
| 2024 | | 2023 | | 2022 |
| | | | | |
| Diluted earnings per share(a) | $ | (0.08) | | | $ | (0.35) | | | $ | 0.09 | |
| Currency (gain) loss(a) | 0.02 | | | — | | | (0.02) | |
| Equity-based compensation expense(b) | 0.22 | | | 0.18 | | | 0.19 | |
| Amortization of acquisition-related intangible assets(c) | 0.34 | | | 0.29 | | | 0.28 | |
| Change in fair value of contingent consideration(d) | 0.05 | | | 0.15 | | | — | |
| Goodwill impairment expense(e) | — | | | 0.30 | | | — | |
| Acquisition-related expenses(f) | 0.03 | | | 0.04 | | | 0.01 | |
| Integration expense(g) | — | | | — | | | — | |
| Transaction-related expenses(h) | 0.02 | | | — | | | 0.01 | |
| Severance expenses(i) | — | | | — | | | — | |
| Reorganization expense(j) | 0.03 | | | 0.01 | | | — | |
| Loss on disposal of fixed assets(k) | — | | | — | | | — | |
| Executive recruiting expense(l) | — | | | — | | | — | |
| First-year Sarbanes-Oxley implementation costs(m) | — | | | — | | | 0.01 | |
| Income tax expense impact of adjustments(n) | (0.18) | | | (0.19) | | | (0.11) | |
| Adjusted diluted earnings per share | $ | 0.45 | | | $ | 0.43 | | | $ | 0.46 | |
| | | | | |
| Basic weighted average common shares outstanding | 160,392,805 | | 158,936,251 | | 156,876,942 |
| Effect of potentially dilutive shares outstanding (o) | 635,547 | | 943,886 | | 2,477,452 |
| Adjusted diluted weighted average common shares outstanding | 161,028,352 | | | $ | 159,880,137 | | | 159,354,394 | |
__________________________________
(a)Represents a measure determined under GAAP.
(b)Represents expense related to equity-based compensation. Equity-based compensation has been, and we expect will continue to be for the foreseeable future, a recurring expense in our business and an important part of our compensation strategy.
(c)Represents amortization costs associated with acquired intangible assets in connection with business acquisitions.
(d)Represents expense associated with remeasuring fair value of contingent consideration of business acquisitions.
(e)Represents expense associated with goodwill impairment charge.
(f)Represents costs associated with mergers and acquisitions and any retention bonuses pursuant to the acquisitions.
(g)Represents integration costs related to post-acquisition integration activities.
(h)Represents costs associated with our public offerings that are not capitalized, as well as debt issuance costs that are not deferred or treated as a contra-liability directly deducted from the carrying value of the associated debt liability.
(i)Represents charges for severance provided to former executives.
(j)Represents expense related to reorganization, including legal entity reorganization and lease abandonment cost associated with the evaluation of our office space footprint.
(k)Represents the gain/loss related to disposal of fixed assets.
(l)Represents recruiting and relocation expenses related to hiring senior executives.
(m)Represents the first-year Sarbanes-Oxley costs for accounting and consulting fees related to the Company's preparation to comply with Section 404 of the Sarbanes-Oxley Act, as well as implementation cost of adopting ASC 842.
(n)Represents the income tax effect of the non-GAAP adjustments calculated using the applicable statutory rate by jurisdiction.
(o)Represents dilutive shares or potentially dilutive shares that were excluded from the Company's GAAP diluted weighted average common shares outstanding because the Company had a reported net loss and therefore including these shares would have been anti-dilutive.
In addition to adjusted EBITDA, adjusted net income, and adjusted diluted earnings per share, management also uses organic revenue, a non-GAAP financial metric, to measure the growth of our existing business operations excluding the impact of acquisitions and divestitures. Our definition of organic revenue may not be comparable to similarly titled measures used by other companies and is not a measure of performance presented in accordance with GAAP.
The table below presents revenue growth from organic operations and acquisitions:
| | | | | | | | | | | | | | |
| | YEAR ENDED DECEMBER 31, | | Growth
2024 vs 2023 |
| | 2024 | | % |
| | (in thousands except percentage) |
| Total revenues | | $ | 385,148 | | | 9 | % |
| Revenue related to acquisitions* | | (27,410) | | | 7 | % |
| Organic revenue | | $ | 357,738 | | | 2 | % |
——————————————————
•Acquisition revenue includes revenues from DIDB, Formedix, ABM, and Chemaxon.
Components of Results of Operations
Revenues
Our business generates revenue from the sale of software products and delivery of consulting services.
•Software. Our software business generates revenues from software licenses, software subscriptions and software maintenance as follows:
•Software licenses: We recognize revenue for software license fees upfront, upon delivery of the software license.
•Software subscription: Subscription revenue consists of subscription fees to provide our customers access to and related support for our cloud-based solutions. We recognize subscription fees ratably over the term of the subscription, usually over one to three years. Any subscription revenue paid upfront that is not recognized in the current period is included in deferred revenue in our consolidated balance sheet until earned.
•Software maintenance: Software maintenance revenue includes fees for providing updates and technical support for software offerings. Software maintenance revenue is recognized ratably over the contract term, usually one year.
•Services. Our services business generates revenues primarily from technology-driven services and professional services, which include software implementation services. Our service arrangements are time and materials, fixed fee, or prepaid. Revenues are recognized over the time services are performed for time and materials, and over time by estimating progress to completion for fixed fee and prepaid services.
Cost of Revenues
Cost of revenues consists primarily of employee related expenses, equity-based compensation, the costs of third-party subcontractors, travel costs, distributor fees, amortization of capitalized software and allocated overhead. We may add or expand computing infrastructure service providers, make additional investments in the availability and security of our solutions, or add resources to support our growth.
Operating Expenses
•Sales and Marketing. Sales and marketing expense consists primarily of employee-related expenses, equity-based compensation, sales commissions, brand development, advertising, travel-related expenses and industry conferences and events. We plan to continue to invest in sales and marketing to increase penetration of our existing client base and expand to new clients.
•Research and Development. Research and development expense consists primarily of employee-related expenses, equity-based compensation, third-party consulting, allocated software costs and tax credits. We plan to continue to invest in our R&D efforts to enhance and scale our software product offerings by development of new features and increased functionality.
•General and Administrative. General and administrative ("G&A") expense consists of personnel-related expenses associated with our executive, legal, finance, human resources, information technology, and other administrative functions, including salaries, benefits, bonuses, and equity-based compensation. General and administrative expense also includes professional fees for external legal, accounting and other consulting services, allocated overhead costs, and other general operating expenses.
•Intangible Asset Amortization. Intangible asset amortization consists primarily of amortization expense related to intangible assets recorded in connection with acquisitions and amortization of capitalized software development costs.
•Depreciation and Amortization Expense. Depreciation and amortization expense consists of depreciation of property and equipment and amortization of leasehold improvements.
Other Expenses
•Interest Expense. Interest expense consists primarily of interest expense associated with the Credit Agreement, including amortization of debt issuance costs and discounts.
•Net Other Income (Expense). Net other income (expense) consists of miscellaneous non-operating expenses primarily comprised of foreign exchange transaction gains and losses.
•Provision for (Benefit from) Income Taxes. Provision for (benefit from) income taxes consists of U.S. federal and state income taxes and income taxes in certain foreign jurisdictions in which we conduct business. We expect income tax expense to increase over time as the Company continues to grow more profitable.
Acquisitions
Since 2013, we have successfully acquired 21 companies. Below is an overview of the businesses we acquired in 2024, 2023, and 2022.
Integrated Nonclinical Development Solutions, Inc. ("INDS")
On January 3, 2022, we completed the acquisition of INDS for a total consideration of $8.0 million. The business combination was not significant to our consolidated financial statements. Based on the purchase price allocation, approximately $2.4 million, $1.0 million, $0.1 million, and $2.9 million of the purchase price was assigned to customer relationships, developed technology, non-compete agreements, and goodwill, respectively.
Vyasa Analytics, LLC (“Vyasa”)
On December 28, 2022, we completed the acquisition of Vyasa, a company that provides an AI-powered, scalable deep learning software and analytics platform for organizations within healthcare and life sciences, higher education and state and local governments for total consideration of $29.3 million. The business combination was not significant to the Company’s consolidated financial statements.
Based on the Company’s purchase price allocation, approximately $11.4 million, $1.5 million, $0.1 million, $0.1 million and $16.6 million of the purchase price was assigned to developed technology, customer relationships, trademarks, non-compete agreements and goodwill, respectively.
The total estimated consideration includes a portion of contingent consideration that is payable over the next three years following the acquisition in a combination of 70% cash and 30% in shares of our common stock. Future payments of contingent consideration are based on achieving certain eligible revenue thresholds for each of the twelve-month periods ended December 31, 2023, 2024, and 2025, respectively. In December 2023, we modified the acquisition agreement and revised thresholds for eligible revenues. The potential payments range from $0 to $60 million over the three-year period. The fair value of the contingent consideration was estimated to be $19.8 million as of the acquisition date.
For the year ended December 31, 2024, the Company paid contingent consideration of $12.4 million, consisting of $8.6 million in cash and $3.7 million in Company stock. At December 31, 2024 and 2023, the contingent consideration was remeasured to $43.9 million and $45.2 million, respectively, resulting in fair value adjustments of $11.0 million and $25.4 million, respectively. These adjustments were recorded in G&A expenses on the accompanying consolidated statement of operations and comprehensive income (loss).
Drug Interaction Solutions, University of Washington ("DIDB")
On June 20, 2023, we entered into an asset purchase agreement with the University of Washington and completed the acquisition of DIDB, including the Drug Interaction Database and related products, from the University of Washington for a total estimated consideration of $8.3 million. The business combination was not significant to the Company’s consolidated financial statements.
Based on our purchase price allocation, approximately $0.3 million, $5.6 million, $0.4 million, and $2.3 million of the purchase price was assigned to trademarks, database content/technology, customer relationships and goodwill, respectively. The total estimated consideration included a portion of contingent consideration that is payable over the next two years following the acquisition in cash, not to exceed $2.0 million. The fair value of the contingent consideration was estimated to be $0.8 million as of the acquisition date. At December 31, 2024 and 2023, the contingent consideration was remeasured to zero and $0.1 million, respectively, resulting in negative fair value adjustments of $0.1 million and $0.7 million, respectively, and recorded in G&A expenses on the accompanying consolidated statement of operations and comprehensive income (loss).
Formedix Limited ("Formedix")
On October 10, 2023, we completed the acquisition of Formedix for total estimated consideration of $41.4 million. The business combination was not material to our consolidated financial statements.
The total estimated consideration included a portion of contingent consideration that is payable over two years following the acquisition in cash, not to exceed $9.0 million. The fair value of the contingent consideration related to revenue threshold was estimated to be $4.4 million as of the acquisition date. Future payments of contingent consideration are based on achieving certain eligible revenue targets for each of the twelve-month periods ended December 31, 2023 and 2024, respectively. Additionally, another portion of the contingent consideration is based on the resolution of certain tax contingencies. In total, the fair value of the contingent consideration was estimated to be $5.2 million as of the acquisition date.
Based on our purchase price allocation, approximately $11.7 million, $3.1 million, and $25.1 million of the purchase price were assigned to developed technology, customer relationships and goodwill, respectively.
For the year ended December 31, 2024, the Company paid contingent consideration of $1.8 million. At December 31, 2024 and 2023, the contingent consideration related to eligible revenue was remeasured to zero and $3.7 million, respectively, resulting in negative fair value adjustments of $1.9 million and $0.7 million, respectively, and recorded in G&A expenses on the accompanying consolidated statement of operations and comprehensive income (loss). In addition, as of December 31, 2024, the contingent consideration related to tax contingencies was $0.5 million.
Applied BioMath, LLC ("ABM")
On December 12, 2023, we completed the acquisition of ABM, an industry leader in providing model-informed drug discovery and development support to help accelerate and de-risk therapeutic research and development, for total estimated consideration of $36.6 million. The business combination was not material to our consolidated financial statements.
Based on our preliminary purchase price allocation, approximately $4.6 million, $0.8 million, $13.7 million and $15.9 million of the purchase price was assigned to developed technology, non-compete agreements, customer relationships and goodwill, respectively.
The total estimated consideration includes a portion of contingent consideration that is payable over two years in cash, not to exceed $17.6 million. Future payments of contingent consideration are based on achieving certain eligible revenue targets for each of the twelve-month periods ended December 31, 2023 and 2024, respectively. The fair value of the contingent consideration was estimated to be $5.4 million as of the acquisition date.
For the year ended December 31, 2024, the Company paid contingent consideration of $4.7 million. At December 31, 2024 and 2023, the contingent consideration was remeasured to zero and $5.4 million, respectively, resulting in fair value adjustments of $(0.7) million and $23.0 thousand. These adjustments were recorded in G&A expenses on the accompanying consolidated statement of operations and comprehensive income (loss).
The contingent considerations for all acquisitions were classified as liability and included in accrued expense and other long term liabilities on the Company’s consolidated balance sheet. The contingent consideration related to eligible revenues that are remeasured on a recurring basis at fair value for each reporting period. Any changes in the fair value of these contingent liabilities are included in the earnings in the consolidated statements of operations and comprehensive income (loss).
Chemaxon, Kft.("Chemaxon")
On October 1, 2024, we completed the acquisition of 100% of the equity of Chemaxon, a software company that develops leading software products for chemical structure drawing, property prediction, search, and analysis, for a total cash consideration of $96.4 million. Based on our purchase price allocation, approximately $2.9 million, $0.3 million, $11.0 million, $36.0 million, and $46.5 million of the purchase price was assigned to
trademark, non-compete agreement, customer relationships, developed technology, and goodwill, respectively. The results of Chemaxon have been included in our consolidated results of operations and comprehensive income (loss) since the date of acquisition.
The current purchase price allocation for Chemaxon is preliminary. The primary areas of the preliminary purchase price allocation that are not yet finalized relate to the fair value of deferred taxes and residual goodwill. The Company expects to continue to obtain information to assist in determining the fair values of the net assets acquired at the acquisition date during the measurement period. Any adjustments to the preliminary purchase price allocation identified during the measurement period, which will not exceed one year from the acquisition date, will be accounted for prospectively.
For more information about our acquisitions, see Note 4. "Business Combinations" in the notes to the consolidated financial statements.
Results of Operations
| | | | | | | | | | | | | | | | | |
| YEAR ENDED
DECEMBER 31, |
| 2024 | | 2023 | | 2022 |
| | | | | |
| (dollars in thousands) |
| Statement of operations data: | | | | | |
| Revenues | $ | 385,148 | | | $ | 354,337 | | | $ | 335,644 | |
| Cost of revenues | 154,516 | | | 141,022 | | | 132,577 | |
| Operating expenses: | | | | | |
| Sales and marketing | 47,444 | | | 32,022 | | | 27,408 | |
| Research and development | 37,105 | | | 34,173 | | | 28,205 | |
| General and administrative | 94,221 | | | 95,385 | | | 71,773 | |
| Intangible asset amortization | 51,599 | | | 43,973 | | | 41,429 | |
| Depreciation and amortization expense | 1,994 | | | 1,552 | | | 1,731 | |
| Goodwill impairment expense | — | | | 46,984 | | | — | |
| Total operating expenses | 232,363 | | | 254,089 | | | 170,546 | |
| Income (loss) from operations | (1,731) | | | (40,774) | | | 32,521 | |
| Other expenses: | | | | | |
| Interest expense | (21,520) | | | (22,916) | | | (17,773) | |
| Net other income (expenses) | 6,067 | | | 8,547 | | | 4,007 | |
| Total other expenses | (15,453) | | | (14,369) | | | (13,766) | |
| Income (loss) before income taxes | (17,184) | | | (55,143) | | | 18,755 | |
| Provision for income taxes | (5,133) | | | 214 | | | 4,024 | |
| Net income (loss) | $ | (12,051) | | | $ | (55,357) | | | $ | 14,731 | |
Comparison of the Years Ended December 31, 2024 and 2023
Revenues
| | | | | | | | | | | | | | | | | | | | | | | |
| YEAR ENDED DECEMBER 31, | | CHANGE |
| 2024 | | 2023 | | $ | | % |
| | | | | | | |
| (in thousands) |
| Software | $ | 155,696 | | | $ | 131,677 | | | $ | 24,019 | | | 18 | % |
| Services | 229,452 | | | 222,660 | | | 6,792 | | | 3 | % |
| Total revenues | $ | 385,148 | | | $ | 354,337 | | | $ | 30,811 | | | 9 | % |
Revenues increased by $30.8 million, or 9%, to $385.1 million for the year ended December 31, 2024, as compared to the same period in 2023. The overall revenue growth was primarily due to an increase in our technology-enabled services and software product offerings, driven by growth from business acquisitions, which increased by $24.1 million, as well as strong demand from existing customers, expansion of relationships with existing customers and new customers.
Software revenue increased by $24.0 million, or 18%, to $155.7 million for the year ended December 31, 2024, as compared to the same period in 2023, primarily driven by strong demand within existing customers, and expansion of relationships with existing customers, and business acquisitions. Revenue from acquisitions increased by $11.3 million.
Services revenue increased by $6.8 million, or 3%, to $229.5 million for the year ended December 31, 2024, as compared to the same period in 2023. The growth in overall services revenue was primarily attributed to growth from business acquisitions, which increased by $12.8 million, as well as continued growth in technology-enabled services with both existing and new customers.
Cost of Revenues
| | | | | | | | | | | | | | | | | | | | | | | |
| YEAR ENDED DECEMBER 31, | | CHANGE |
| 2024 | | 2023 | | $ | | % |
| | | | | | | |
| (in thousands) |
| Cost of revenues | $ | 154,516 | | | $ | 141,022 | | | $ | 13,494 | | | 10 | % |
Cost of revenues increased by $13.5 million, or 10%, to $154.5 million for the year ended December 31, 2024, as compared to the same period in 2023. The increase was primarily due to a $6.7 million increase in employee-related costs resulting primarily from billable headcount growth, a $3.9 million increase in intangible assets amortization, a $2.3 million increase in equipment and software expense, a $1.8 million increase in equity-based compensation cost, a $0.5 million decrease in capitalized software cost, and a $0.5 million increase in license expense, partially offset by a $2.3 million decrease in consulting and professional services cost resulting from the implementation of a cost reduction plan.
Sales and Marketing Expense
| | | | | | | | | | | | | | | | | | | | | | | |
| YEAR ENDED DECEMBER 31, | | CHANGE |
| 2024 | | 2023 | | $ | | % |
| | | | | | | |
| (in thousands) |
| Sales and marketing | $ | 47,444 | | | $ | 32,022 | | | $ | 15,422 | | | 48 | % |
| % of total revenues | 12 | % | | 9 | % | | | | |
Sales and marketing expense increased by $15.4 million, or 48%, to $47.4 million for the year ended December 31, 2024, as compared to the same period in 2023. Sales and marketing expense increased primarily due to a $6.7 million increase in employee-related costs mainly resulting from headcount growth driven by acquisitions along with investment to build the commercial organization, a $4.2 million increase in commission expenses, a $1.7 million increase in equity-based compensation cost, a $1.0 million increase in marketing expense, a $0.6 million increase in consulting and professional services expense, a $0.6 million increase in travel related expense, and a $0.6 million increase in equipment and software expense.
Research and Development Expense
| | | | | | | | | | | | | | | | | | | | | | | |
| YEAR ENDED DECEMBER 31, | | CHANGE |
| 2024 | | 2023 | | $ | | % |
| | | | | | | |
| (in thousands) |
| Research and development | $ | 37,105 | | | $ | 34,173 | | | $ | 2,932 | | | 9 | % |
| % of total revenues | 10 | % | | 10 | % | | | | |
Research and development expense increased by $2.9 million, or 9%, to $37.1 million for the year ended December 31, 2024, as compared to the same period in 2023. The increase in research and development expense was primarily due to a $9.6 million increase in employee-related costs, mainly resulting from headcount growth associated with investments in software development, including AI integration across our product portfolio, a $0.8 million increase in equipment and software expense, and a $0.4 million increase in the cost of licenses, partially offset by a $6.3 million increase in capitalized cost in R&D, a $1.1 million decrease in equity-based compensation cost, and a $0.4 million decrease in consulting and professional services expense.
General and Administrative Expense
| | | | | | | | | | | | | | | | | | | | | | | |
| YEAR ENDED DECEMBER 31, | | CHANGE |
| 2024 | | 2023 | | $ | | % |
| | | | | | | |
| (in thousands) |
| General and administrative | $ | 94,221 | | | $ | 95,385 | | | $ | (1,164) | | | (1) | % |
| % of total revenues | 24 | % | | 27 | % | | | | |
G&A expense decreased by $1.2 million, or (1)%, to $94.2 million for the year ended December 31, 2024, as compared to the same period in 2023. The decrease in general and administrative expenses was primarily due to a $16.0 million decrease related to a change in the fair value of contingent considerations, a $1.2 million decrease in equipment and software related expenses, a $1.0 million decrease in business acquisition-related costs, and a $0.4 million decrease in lease abandonment expense, partially offset by a $7.1 million increase in employee-related costs, mainly resulting from headcount growth and organizational restructuring, a $4.1 million increase in equity-based compensation cost, a $2.4 million increase in transaction expense primarily related to refinancing of our term loan and revolving line of credit, a $1.1 million increase in professional and consulting costs, a $1.0 million increase in franchise and other miscellaneous business taxes, a $0.8 million increase in provision for credit allowance, a $0.5 million increase in public company expense, and a $0.5 million increase in facility lease-related expenses.
Intangible Asset Amortization Expense
| | | | | | | | | | | | | | | | | | | | | | | |
| YEAR ENDED DECEMBER 31, | | CHANGE |
| 2024 | | 2023 | | $ | | % |
| | | | | | | |
| (in thousands) |
| Intangible asset amortization | $ | 51,599 | | | $ | 43,973 | | | $ | 7,626 | | | 17 | % |
| % of total revenues | 13 | % | | 12 | % | | | | |
Intangible asset amortization expense increased by $7.6 million, or 17%, to $51.6 million for the year ended December 31, 2024, as compared to the same period in 2023. The increase in intangible asset amortization was primarily due to a $4.7 million increase in amortization expense from acquired intangible assets and a $2.9 million increase in amortization expense from capitalized software.
Depreciation and Amortization Expense
| | | | | | | | | | | | | | | | | | | | | | | |
| YEAR ENDED DECEMBER 31, | | CHANGE |
| 2024 | | 2023 | | $ | | % |
| | | | | | | |
| (in thousands) |
| Depreciation and amortization | $ | 1,994 | | | $ | 1,552 | | | $ | 442 | | | 28 | % |
| % of total revenues | 1 | % | | — | % | | | | |
Depreciation and amortization expense increased by $0.4 million, or 28%, to $2.0 million for the year ended December 31, 2024, as compared to the same period in 2023. The increase was primarily due to an increase in depreciation expense related to computer equipment.
Goodwill Impairment Expense
| | | | | | | | | | | | | | | | | | | | | | | |
| YEAR ENDED DECEMBER 31, | | CHANGE |
| 2024 | | 2023 | | $ | | % |
| | | | | | | |
| (in thousands) |
| Goodwill impairment expense | $ | — | | | $ | 46,984 | | | $ | (46,984) | | | nm |
There was no goodwill impairment charge for the year ended December 31, 2024. Goodwill impairment expense was $47.0 million for the year ended December 31, 2023, primarily due to an impairment related to the legacy Regulatory and Writing reporting unit, as its carrying value exceeded its fair value.
Interest Expense
| | | | | | | | | | | | | | | | | | | | | | | |
| YEAR ENDED DECEMBER 31, | | CHANGE |
| 2024 | | 2023 | | $ | | % |
| | | | | | | |
| (in thousands) |
| Interest expense | $ | 21,520 | | | $ | 22,916 | | | $ | (1,396) | | | (6) | % |
| % of total revenues | 6 | % | | 6 | % | | | | |
Interest expense decreased by $1.4 million, or (6)%, to $21.5 million for the year ended December 31, 2024, as compared to the same period in 2023. The decrease was primarily due to a $0.5 million decrease related with the amortization of debt issuance cost, a $0.5 million increase in gain from our interest swap hedge activities, and a $0.4 million decrease in interest expense from our floating rate term loan debt, primarily related to the base margin rate reduction from term loan refinancing.
Net Other Income (Expense)
| | | | | | | | | | | | | | | | | | | | | | | |
| YEAR ENDED DECEMBER 31, | | CHANGE |
| 2024 | | 2023 | | $ | | % |
| | | | | | | |
| (in thousands) |
| Net other income (expense) | $ | 6,067 | | | $ | 8,547 | | | $ | (2,480) | | | (29) | % |
| % of total revenues | 2 | % | | 2 | % | | | | |
Net other income (expense) decreased by $2.5 million to $6.1 million for the year ended December 31, 2024 as compared to the same period in 2023. The decrease in net other income (expense) was primarily due to a $1.7 million increase in remeasurement losses related to the fluctuation of foreign currency exchange rates, a $0.3 million increase in loss related to disposal fixed assets, and a $0.3 million decrease in interest income.
Provision for Income Taxes
| | | | | | | | | | | | | | | | | | | | | | | |
| YEAR ENDED DECEMBER 31, | | CHANGE |
| 2024 | | 2023 | | $ | | % |
| | | | | | | |
| (in thousands) |
| Provision for income taxes | $ | (5,133) | | | $ | 214 | | | $ | (5,347) | | | (2,499) | % |
| Effective tax rate | 29.9 | % | | (0.4) | % | | | | |
Our income tax benefit was $5.1 million, resulting in an effective income tax rate of 29.9%, for the year ended December 31, 2024, as compared to an income tax expense of $0.2 million, or an effective income tax rate of (0.4)% for the year ended December 31, 2023. Our income tax benefit for the year ended December 31, 2024 was primarily due to the impact of non-deductible items, the impact of valuation allowances recorded against certain tax attributes, and the relative mix of domestic and international earnings.
Net Income (Loss)
| | | | | | | | | | | | | | | | | | | | | | | |
| YEAR ENDED DECEMBER 31, | | CHANGE |
| 2024 | | 2023 | | $ | | % |
| | | | | | | |
| (in thousands) |
| Net income (loss) | $ | (12,051) | | | $ | (55,357) | | | $ | 43,306 | | | (78) | % |
Net loss was $12.1 million, representing a $43.3 million increase in net income for the year ended December 31, 2024, as compared to the same period in 2023. The increase in net income was primarily due to a $30.8 million increase in revenue, a $21.7 million decrease in operating expense, a $5.3 million decrease in tax expense, and a $1.4 million decrease in interest expense, partially offset by a $13.5 million increase in cost of revenue and a $2.5 million decrease in net other income.
Liquidity and Capital Resources
We have consistently generated positive cash flow from operations, providing $80.5 million, $82.8 million, and $92.5 million as a source of funds each year for the years ended December 31, 2024, 2023, and 2022, respectively. Our additional sources of liquidity have included: maintaining adequate balances of cash and cash equivalents, sale of common stock, and accessing our credit facilities and the revolving line of credit. The following table provides a summary of the major sources of liquidity for periods ended December 31, 2024, 2023, and 2022. and as of December 31, 2024, 2023, and 2022.
| | | | | | | | | | | | | | | | | |
| 2024 | | 2023 | | 2022 |
| | | | | |
| (in thousands) |
| Net cash provided by operating activities | $ | 80,466 | | | $ | 82,755 | | | $ | 92,543 | |
Cash and cash equivalents(1) | $ | 179,183 | | | $ | 234,951 | | | $ | 236,586 | |
| Term loan credit facilities | $ | 298,500 | | | $ | 294,450 | | | $ | 297,470 | |
| Available revolving line of credit | $ | 100,000 | | | $ | 100,000 | | | $ | 100,000 | |
__________________________________(1)Cash balance as of December 31, 2024, 2023, and 2022 included $45.8 million, $47.3 million, and $56.4 million, respectively, of cash and cash equivalents held outside of the United States.
Our material cash requirements from known contractual obligations as of December 31, 2024 are as follows:
| | | | | | | | | | | | | | | | | | | | | | | | | | | | | |
| TOTAL | | LESS THAN
1 YEAR | | 1 TO 3 YEARS | | 4 TO 5 YEARS | | MORE THAN
5 YEARS |
| | | | | | | | | |
| (in thousands) |
| Operating leases | $ | 18,441 | | | $ | 4,821 | | | $ | 6,412 | | | $ | 2,118 | | | $ | 5,090 | |
| Principal payments of long-term debt | 298,500 | | | 3,000 | | | 6,000 | | | 6,000 | | | 283,500 | |
Interest on long-term debt(1) | 139,805 | | | 22,181 | | | 43,690 | | | 42,854 | | | 31,080 | |
| Total | $ | 456,746 | | | $ | 30,002 | | | $ | 56,102 | | | $ | 50,972 | | | $ | 319,670 | |
__________________________________(1)Represents the expected cash payments for interest on our long-term debt based on the amounts outstanding as of the end of each period and the interest rates applicable on such debt as of December 31, 2024.
We assess our liquidity in terms of our ability to generate adequate amounts of cash to meet current and future needs. We believe our existing sources of liquidity will be sufficient to meet our working capital, capital expenditures, and contractual obligations for the foreseeable future. Our expected primary uses on a short-term and long-term basis are for repayment of debt, interest payments, working capital, capital expenditures, geographic or service offering expansion, acquisitions, investments, and other general corporate purposes. We believe we will meet short-term and long-term expected future cash requirements and obligations through a combination of cash flows from operating activities, available cash balances, and potential future equity or debt transactions.
Our future capital requirements, however, will depend on many factors, including funding needed for potential acquisitions, investments, and other growth and strategic opportunities, which could increase our cash requirements. While we believe we have, and will be able to generate, sufficient liquidity to fund our operations for the foreseeable future, our sources of liquidity could be affected by factors described under “Risk Factors” elsewhere in this report.
Cash Flows
The following table presents a summary of our cash flows for the periods shown:
| | | | | | | | | | | | | | | | | |
| YEAR ENDED DECEMBER 31, |
| 2024 | | 2023 | | 2022 |
| | | | | |
| (in thousands) |
| Net cash provided by operating activities | $ | 80,466 | | | $ | 82,755 | | | $ | 92,543 | |
| Net cash used in investing activities | (112,368) | | | (79,550) | | | (27,837) | |
| Net cash used in financing activities | (21,010) | | | (9,447) | | | (7,363) | |
| Effect due to foreign exchange rate changes on cash, cash equivalents, and restricted cash | (2,856) | | | 1,505 | | | (4,279) | |
| Net (decrease) increase in cash, cash equivalents and restricted cash | $ | (55,768) | | | $ | (4,737) | | | $ | 53,064 | |
| Cash paid for interest | 22,737 | | | 19,089 | | | 17,268 | |
| Cash paid for income taxes | 14,658 | | | 19,320 | | | 10,141 | |
Operating Activities
Our cash flows from operating activities primarily include net income (loss) adjusted for (i) non-cash items included in net income (loss), such as provisions for credit losses, depreciation and amortization, stock-based compensation, deferred taxes and other non-cash items and (ii) changes in the balances of operating assets and liabilities. Net cash provided by operating activities for the year ended December 31, 2024 was $80.5 million, compared to $82.8 million for the year ended December 31, 2023. The $2.3 million decrease in cash provided from operating activities was primarily driven by an increase in accounts receivable, and an increase in cash used for prepaid and other assets, partially offset by higher cash inflows from deferred revenues, a decrease in cash used for liability payments, and an increase in cash-adjusted net income.
Investing Activities
Net cash used in investing activities for the year ended December 31, 2024 was approximately $112.4 million, an increase of $32.8 million, compared to $79.6 million in 2023. The change in investing activities was primarily due to a $27.1 million increase in cash payments in connection with business acquisitions, and a $5.9 million increase in cash utilized in capitalized development costs.
Financing Activities
During the year ended December 31, 2024, net cash used in financing activities was approximately $21.0 million, compared to $9.4 million in the same period of 2023. The $11.6 million increase in cash used from financing activities was primarily due to a $15.2 million increase in cash payments for contingent consideration related to business acquisitions, and a $2.3 million increase in cash payments in connection with share awards vested and withheld for payroll tax, partially offset by a $5.1 million increase in cash proceeds net of debt issuance cost from refinancing of term loan debt, and a $0.8 million decrease in quarterly prepayments of term loan debt.
Indebtedness
Credit Facilities
We have been a party to a Credit Agreement since August 2017 that provides for a senior secured term loan and commitments under a revolving credit facility (as amended, the “Credit Agreement”). On June 26, 2024, we entered into the Fifth Amendment to the Credit Agreement (the "Amendment"), which primarily (1) amended the principal amount of the term loan to $300.0 million and the maturity date to June 26, 2031; and (2) extended the termination date associated with the $100.0 million revolving credit commitment to June 26, 2029. The term loan under this Amendment has substantially the same terms as the existing term loans and revolving credit commitments. As of December 31, 2024, we had $298.5 million of outstanding borrowings on the term loan, and $100.0 million of availability under the revolving credit facility under the Credit Agreement.
Borrowings under the Credit Agreement bear interest at a rate per annum equal to, at the election of the Borrowers, either (i) the Term SOFR rate, with a floor of 0.00% plus an applicable margin rate of 3.00% for the Term Loans and between 3.50% and 2.75% for loans under the Revolving Facility, depending on the applicable first lien leverage ratio or (ii) an Alternate Base Rate (“ABR”), with a floor of 1.00%, plus an applicable margin rate of 2.00% for the Term Loans or between 2.50% and 1.75% for loans under the Revolving Facility, depending on the applicable first lien leverage ratio. The ABR is determined as the greatest of (a) the prime rate, (b) the federal funds effective rate, plus 0.50% and (c) the Term SOFR rate plus 1.00%. Additionally, we are obligated to pay a commitment fee on the unused amount and other customary fees.
All obligations under the Credit Agreement are unconditionally guaranteed by our wholly owned direct and indirect subsidiaries, subject to certain exceptions. All obligations under the Credit Agreement, and the guarantees of those obligations, are secured on a first lien basis, subject to certain exceptions, by substantially all of our assets and the assets of the other guarantors.
As of December 31, 2024, we were in compliance with the covenants of the Credit Agreement.
Income Taxes
We recorded an income tax benefit of $(5.1) million for the year ended December 31, 2024 and income tax expense of $0.2 million for the year ended December 31, 2023.
As of December 31, 2024, we had federal and state NOLs of approximately $6.2 million and $4.9 million, respectively, which are available to reduce future taxable income and expire between 2035 and 2036 and 2029 and 2040, respectively. We had federal R&D tax credit carryforwards of approximately $0.3 million to offset future income taxes, which expire between 2027 and 2048. We also had foreign tax credits of approximately $11 million, which will start to expire in 2027. These carryforwards that may be utilized in a future period may be subject to limitations based upon changes in the ownership of our stock in a future period. Additionally, we carried forward foreign NOLs of approximately $78.6 million which will start to expire in 2025, foreign research and development credits of $0.3 million which expire in 2029, and Canadian investment tax credits of approximately $3.9 million which expire between 2032 and 2042. Our carryforwards are subject to review and possible adjustment by the appropriate taxing authorities.
As required by Accounting Standards Codification (‘‘ASC’’) Topic 740, Income Taxes, our management has evaluated the positive and negative evidence bearing upon the realizability of our deferred tax assets, which are composed principally of NOL carryforwards, Section 174 carryforwards, investment tax credit carryforward, and foreign tax credit carryforwards. Management has determined that it is more likely than not that we will not realize the benefits of foreign tax credit carryforwards. At the foreign subsidiaries, management has determined that it is more likely than not that we will not realize the benefits of certain NOL carryforwards. As a result, a valuation allowance of $24 million is recorded at December 31, 2024.
Off-Balance Sheet Arrangements
During the periods presented, we did not have, and currently we do not have, any significant off-balance sheet arrangements, as defined under the rules and regulations of the SEC.
Critical Accounting Policies and Estimates
Our management’s discussion and analysis of our financial condition and results of operations are based on our consolidated financial statements, which have been prepared in accordance with GAAP. The preparation of these consolidated financial statements requires us to make judgments and estimates that affect the reported amounts of assets, liabilities, revenues, and expenses and the disclosure of contingent assets and liabilities in our consolidated financial statements. We base our estimates on historical experience, known trends and events, and various other factors that we believe to be reasonable under the circumstances, the results of which form the basis for making judgments about the carrying values of assets and liabilities that are not readily apparent from other sources. Actual results may differ from these estimates under different assumptions or conditions. On an ongoing basis, we evaluate our judgments and estimates in light of changes in circumstances, facts, and experience. The effects of material revisions in estimates, if any, are reflected in the consolidated financial statements prospectively from the date of change in estimates.
While our significant accounting policies are described in more detail in the notes to our consolidated financial statements appearing elsewhere in this annual report, we believe the following accounting policies used in the preparation of our consolidated financial statements require the most significant judgments and estimates.
Revenue Recognition
Applying GAAP to the measurement and recognition of revenue requires us to make judgments and estimates. Specifically, complex arrangements with nonstandard terms and conditions may require significant contract interpretation to determine the appropriate accounting, including whether promised goods and services specified in an arrangement are distinct performance obligations. Revenue recognition is also impacted by our ability to determine when a contract is probable of collection and to estimate variable consideration. We consider various factors when making these judgments.
Our revenue is primarily derived from the sale of software products and delivery of consulting services. We recognize revenue when control of the promised good or service is transferred to the customer in an amount that reflects the consideration for which we are expected to be entitled in exchange for those services.
Consulting Service Revenues
Our primary professional services offering includes consulting services, which may be either strategic consulting services, reporting and analysis services, regulatory writing services, or any combination of the three. Our professional services contracts are either time-and-materials or fixed fee. Services revenues are generally recognized over time as the services are performed. Generally, these services are delivered to customers electronically. Revenue from time-and-material contracts is recognized on an output basis as labor hours are delivered and/or direct expenses are incurred. Revenues for fixed price services are generally recognized over time applying input methods to estimate progress to completion. Accordingly, the number of resources being paid for and varying lengths of time they are being paid for, determine the measure of progress.
Software Services
Maintenance services agreements on perpetual licenses consist of fees for providing software updates and for providing technical support for software products for a specified term. Revenue allocated to maintenance services is recognized ratably over the contract term beginning on the delivery date of each offering.
Maintenance contracts generally have a term of one year. While transfer of control of the software training and implementation performance obligations are over time, the services are typically started and completed within a few days. Due to the quick nature of the performance obligation from start to finish and the insignificant amounts, we recognize any software training or implementation revenue at the completion of the service. Any unrecognized portion of amounts paid in advance for licenses and services is recorded as deferred revenue.
Arrangements with Multiple Performance Obligations
For contracts with multiple performance obligations, such as a software license plus software training, implementation, and/or maintenance/support, or in contracts where there are multiple software licenses, we determine if the products or services are distinct and allocate the consideration to each distinct performance obligation on a relative standalone selling price basis (“SSP”). The delivery of a particular type of software and each of the user licenses would be one performance obligation. Additionally, any training, implementation, or support and maintenance promises as part of the software license agreement would be considered separate performance obligations, as those promises are distinct and separately identifiable from the software licenses. The payment terms in these arrangements are less than one year such that there is no significant financing component to the transaction.
Goodwill and Other Intangible Assets
We assess goodwill for impairment at least annually, during the fourth quarter based on balances as of October 1st, and more frequently on an interim basis if we believe indicators of impairment exist. Goodwill is tested for impairment at the reporting unit level, which is one level below or the same as an operating segment. The application of an interim or the annual goodwill impairment test begins with the identification of reporting units, which requires judgment. During 2024, the Company reorganized its Certara Drug Development Solutions reporting unit (“CDDS”), Software reporting unit (“Software”), and SimCyp reporting unit (“SimCyp”) for goodwill allocation and impairment testing purposes. We determined that we have three reporting units as of October 1, 2024: the Certara Data Science Software (“CDS”), the Certara Predictive Technologies reporting unit (“CPT”), and the Certara Drug Development Services reporting unit (“CDDS”), which are within a single operating segment of the Company. The process of evaluating the potential impairment of goodwill is highly subjective and requires significant judgment. Our review of impairment starts with performing a qualitative assessment to determine whether events or circumstances lead to a determination that it is more-likely-than-not that the fair value of the reporting units are less than their carrying amounts.
Our qualitative assessment of the recoverability of goodwill considers various macroeconomic, industry-specific and company-specific factors. These factors include: (1) the nature of the business and the history of the Company and its reporting units from their inception; (2) the economic outlook in general and the condition and outlook of the industry in which the Company and its reporting units operate; (3) the financial condition of the Company and its reporting units; (4) the earnings capacity of the Company and its reporting units; (5) the dividend-paying capacity of the Company and its reporting units; (6) whether goodwill or other intangible value exists within the Company and/or its reporting units; (7) previous sales of the Company’s and/or reporting units’ stock and the size of the block of stock to be valued; and (8) the market prices of stocks of corporations engaged in the same or a similar line of business having their stocks actively traded in a free and open market, either on an exchange or over-the-counter. After assessing the totality of events and circumstances, if we determine that it is not more-likely-than-not that the fair values of our reporting units are less than their net book values, no further assessment is performed. If we determine that it is more-likely-than-not that the fair values of our reporting units are less than carrying value or if we elect to bypass the qualitative assessment, we proceed to a quantitative assessment or test of goodwill.
If a quantitative assessment of goodwill is required, the determination of the fair value of a reporting unit will involve the use of significant estimates and assumptions. Our quantitative goodwill impairment test uses both the income approach and the market approach to estimate fair value. The income approach is based on the
discounted cash flow method that discounts forecasted future cash flows expected to be generated which are based on the Company's estimates of financial performance including revenues, adjusted EBITDA, taxes, and working capital and capital asset requirements. When performing our market approach, we rely specifically on the guideline public company method. Our guideline public company method incorporates revenues and EBITDA multiples from publicly traded companies with operations and other characteristics similar to our entity. If the carrying amount of a reporting unit exceeds its fair value, an impairment loss is recognized in an amount equal to that excess, limited to the total amount of goodwill allocated to that reporting unit.
We performed the annual goodwill impairment analysis during the fourth quarters of 2024 and 2023. The quantitative assessments resulted in no impairment as the estimated fair value of each reporting unit exceeded its carrying value. During the third quarter of 2023, we performed an interim goodwill impairment test for the prior regulatory writing reporting unit, which was integrated into the CDDS reporting unit at the end of third quarter of 2023. The fair value of the regulatory writing reporting unit was determined to be less than its carrying value, resulting in a goodwill impairment charge of $47.0 million for the reporting unit. The fair value of that reporting unit was estimated using a combination of the discounted cash flow method and the guideline public company method.
Our other intangible assets primarily consist of customer relationship assets, software products acquired in acquisitions, trade names, software development costs, and non-compete agreements. Other identifiable intangible assets with finite lives, such as software products acquired in acquisitions, non-compete agreements, trade names, customer relationship assets, and patents, are amortized over their estimated lives using either a straight-line method or a method based on pattern of expected economic benefit of the asset as follows: acquired software — 3 to 15 years; non-compete agreements — 2 to 5 years; customer relationships — 11 to 16 years; trade names — 10 to 20 years; and patents — 5 years. The Company evaluates finite intangible assets for impairment whenever events or changes in circumstances indicate that the carrying amount of the asset might not be recoverable. An impairment loss is recognized when estimated undiscounted future cash flows expected to result from the use of the asset are less than its carrying amount.
Software Development Costs
Software development costs are accounted for in accordance with ASC Subtopic 985-20 if the software is to be sold, leased or otherwise marketed, or by ASC Subtopic 350-40 if the software is for internal use. After the technological feasibility of the software has been established (for software to be marketed), or at the beginning of application development (for internal-use software), software development costs, which include primarily salaries and related payroll costs and costs of independent contractors incurred during development, are capitalized. Research and development costs incurred prior to the establishment of technological feasibility (for software to be marketed), or prior to application development (for internal-use software), are expensed as incurred. Software development costs are amortized on a product-by-product basis commencing on the date of general release of the products (for software to be marketed) or the date placed in service (for internal-use software).
Income Taxes
We are subject to the income tax laws and regulations of the many jurisdictions in which we operate. These tax laws and regulations are complex and involve uncertainties in the application to our facts and circumstances that may be open to interpretation. We account for uncertainty in income taxes using a two-step approach. The first step requires the Company to conclude that a tax position, based solely on its technical merits, is more likely than not to be sustained upon examination by a tax authority. The second step requires the Company to measure the largest amount of benefit, determined on a cumulative probability basis, that is more likely than not to be realized upon ultimate settlement with tax authority. We recognize benefits for these uncertain tax positions in the period during which, based on all available evidence, we believe it is more likely than not (a likelihood of more than 50%) that the position will be sustained upon examination. This process is inherently subjective since
it requires our assessment of the probability of future outcomes. We evaluate these uncertain tax positions on a quarterly basis, including consideration of changes in facts and circumstances.
On a quarterly basis, we also assess the likelihood that we will be able to recover our deferred tax assets against future sources of taxable income and reduce the carrying amounts of deferred tax assets by recording a valuation allowance if, based on the available evidence, it is more likely than not (a likelihood of more than 50%) that all or a portion of such assets will not be realized.
Business Acquisitions
When we acquire businesses, we allocate the purchase price to tangible assets and liabilities and identifiable intangible assets acquired at their acquisition date fair values. Any residual purchase price is recorded as goodwill.
We also estimate the fair value of any contingent consideration using Level 3 unobservable inputs. Our estimates of fair value are based upon assumptions believed to be reasonable but which are uncertain and involve significant judgments by management. We classified our contingent considerations as liabilities and remeasure the fair value of contingent liabilities related to revenue thresholds quarterly until the contingencies are resolved. The changes in fair value will be recognized in earnings in our consolidated statements of operations and comprehensive income (loss).
Recently Adopted and Issued Accounting Standards
We have reviewed all recently issued standards and have determined that, other than as disclosed in Note 2 to our consolidated financial statements appearing elsewhere in this annual report, such standards will not have a material impact on our consolidated financial statements or do not otherwise apply to our operations.
Item 7A. Quantitative and Qualitative Disclosures About Market Risk.
Market risk is broadly defined as potential economic losses due to adverse changes in the fair value of a financial instrument. In the normal course of business, we are exposed to market risks, including foreign currency exchange rate risk and interest rate risk.
Foreign Currency Exchange Rate Risk
We are exposed to foreign currency exchange rate risk by virtue of our international operations. This risk arises because we use different currencies to recognize revenue and pay operating expenses. We derived 28% of our revenue for the year ended December 31, 2024 from operations outside of the United States. Our strategy for managing foreign currency risk relies on efforts to negotiate customer contracts to receive payment in the same currency used to pay expenses. As of December 31, 2024, we had no outstanding foreign currency forward contracts. Foreign currency exchange rate risk is evidenced in our consolidated financial statements through translation risk and transaction and re-measurement risk.
Translation Risk
We are exposed to movements in foreign currencies, predominately in U.S. dollars, British Pounds Sterling, Euros, or Japanese yen, with the majority in U.S. dollars. The vast majority of our contracts are entered into by our U.S. and U.K., E.U., and Japanese subsidiaries. Contracts entered into by our U.S. subsidiaries are almost always denominated in U.S. dollars. Contracts entered into by our other subsidiaries are generally denominated in U.S. dollars, pounds sterling, euros, or Japanese yen, with the majority in U.S. dollars. If the U.S. dollar had weakened 10% or strengthened 10% relative to the pound sterling, the euro, and the Japanese yen in the year
ended December 31, 2024, income from operations would have been lower or higher by approximately $3.5 million, based on revenues and costs related to our foreign operations.
Changes in exchange rates between the applicable foreign currency and the U.S. dollar will affect the translation of foreign subsidiaries’ financial results into U.S. dollars for purposes of reporting our consolidated financial results. The process by which we translate each foreign subsidiary’s financial results to U.S. dollars is as follows:
•we translate statement of operations accounts at the exchange rates on the dates those transactions are recognized or the average exchange rates for the relevant monthly period;
•we translate balance sheet asset and liability accounts at the end of period exchange rates; and
•we translate equity accounts at historical exchange rates.
Translation of the balance sheet in this manner affects stockholders’ equity through the foreign currency translation adjustment account. This account exists only in the foreign subsidiary’s U.S. dollar balance sheet and is necessary to keep the foreign balance sheet, stated in U.S. dollars, in balance.
We report translation adjustments within accumulated other comprehensive loss as a separate component of stockholders’ equity on our consolidated balance sheets. Gains or losses from translating amounts in foreign currencies are recorded in other comprehensive income (loss) on our consolidated statements of operations and comprehensive income (loss).
Transaction and Re-measurement Risk
We have currency risk resulting from the passage of time between the recognition of revenue, invoicing of customers under contracts, and the collection of payment. If a contract is denominated in a currency other than the subsidiary’s functional currency, we recognize an unbilled services asset at the time of revenue recognition and a receivable at the time of invoicing for the local currency equivalent of the foreign currency invoice amount. Changes in exchange rates from the time we recognize revenue until the time the customer pays will result in our receiving either more or less in local currency than the amount that was originally invoiced. We recognize this difference as a foreign currency transaction gain or loss, as applicable.
We also have currency risk as a result of intercompany loans or other intercompany borrowings throughout our organization when such intercompany debt is denominated in a currency other than the subsidiary’s functional currency. Changes in exchange rates from the time a subsidiary records the intercompany debt until the time the subsidiary pays the intercompany debt will result in a foreign currency transaction gain or loss. We record all foreign currency transaction and re-measurement gains and losses as other income (expense), net on the consolidated statement of operations and comprehensive income (loss). We do not have significant operations in countries considered highly inflationary.
Interest Rate Risk
We have borrowings under our Credit Agreement that bear interest at a rate per annum equal to, at the election of the Borrowers, either (i) the Term SOFR rate, with a floor of 0.00% plus an applicable margin rate of 3.00% for the Term Loans and between 3.50% and 2.75% for loans under the Revolving Facility, depending on the applicable first lien leverage ratio or (ii) an Alternate Base Rate (“ABR”), with a floor of 1.00%, plus an applicable margin rate of 2.00% for the Term Loans or between 2.50% and 1.75% for loans under the Revolving Facility, depending on the applicable first lien leverage ratio. The ABR is determined as the greatest
of (a) the prime rate, (b) the federal funds effective rate, plus 0.50% and (c) the Term SOFR rate plus 1.00%. Additionally, we are obligated to pay a commitment fee on the unused amount and other customary fees.
In response to the discontinuation of LIBOR, we executed a LIBOR transition amendment in June 2023, formalizing the replacement of LIBOR with the Secured Overnight Funding Rate (“SOFR”). As part of this modification, a Credit Spread Adjustment (“CSA”) was introduced to aligning SOFR with LIBOR in terms of the overall interest rate earned by lenders under the Credit Agreement. The CSA varied depending on the selected interest period.
As of December 31, 2024, we had $298.5 million of outstanding borrowings on the term loan and no outstanding borrowings under the revolving credit facility.
Each quarter basis point increase in the SOFR rate would increase interest expense on our current variable rate debt by approximately $0.2 million for the year ended December 31, 2024. Our exposure to interest rate risk is minimized by our interest rate swaps. As of December 31, 2024, we recorded the fair value of our interest rate swaps in the amount of $2.2 million as a derivative asset included in prepaid expenses and other assets in our consolidated balance sheets.
Other Risk
Although we perform services for customers located in a number of jurisdictions, we have not experienced any material difficulties in receiving funds remitted from foreign countries. However, new or modified exchange control restrictions could have an adverse effect on our ability to repatriate cash to fund our operations and make principal and interest payments, when necessary.
Item 8. Financial Statements and Supplementary Data.
Certara, Inc.
Index to Consolidated Financial Statements
Report of Independent Registered Public Accounting Firm
To the Stockholders and the Board of Directors of Certara, Inc.
Opinion on the Financial Statements
We have audited the accompanying consolidated balance sheets of Certara, Inc. and Subsidiaries (the Company) as of December 31, 2024 and 2023, the related consolidated statements of operations and comprehensive income (loss), stockholders’ equity and cash flows for each of the three years in the period ended December 31, 2024, and the related notes to the consolidated financial statements (collectively, the financial statements). In our opinion, the financial statements present fairly, in all material respects, the financial position of the Company as of December 31, 2024 and 2023, and the results of its operations and its cash flows for each of the three years in the period ended December 31, 2024, in conformity with accounting principles generally accepted in the United States of America.
We have also audited, in accordance with the standards of the Public Company Accounting Oversight Board (United States) (PCAOB), the Company’s internal control over financial reporting as of December 31, 2024, based on criteria established in Internal Control—Integrated Framework issued by the Committee of Sponsoring Organizations of the Treadway Commission in 2013, and our report dated February 26, 2025, expressed an unqualified opinion on the effectiveness of the Company’s internal control over financial reporting.
Basis for Opinion
These financial statements are the responsibility of the Company’s management. Our responsibility is to express an opinion on the Company’s financial statements based on our audits. We are a public accounting firm registered with the PCAOB and are required to be independent with respect to the Company in accordance with U.S. federal securities laws and the applicable rules and regulations of the Securities and Exchange Commission and the PCAOB.
We conducted our audits in accordance with the standards of the PCAOB. Those standards require that we plan and perform the audit to obtain reasonable assurance about whether the financial statements are free of material misstatement, whether due to error or fraud. Our audits included performing procedures to assess the risks of material misstatement of the financial statements, whether due to error or fraud, and performing procedures that respond to those risks. Such procedures included examining, on a test basis, evidence regarding the amounts and disclosures in the financial statements. Our audits also included evaluating the accounting principles used and significant estimates made by management, as well as evaluating the overall presentation of the financial statements. We believe that our audits provide a reasonable basis for our opinion.
Critical Audit Matters
The critical audit matters communicated below are matters arising from the current period audit of the financial statements that were communicated or required to be communicated to the audit committee and that: (1) relate to accounts or disclosures that are material to the financial statements and (2) involved our especially challenging, subjective or complex judgments. The communication of critical audit matters does not alter in any way our opinion on the financial statements, taken as a whole, and we are not, by communicating the critical audit matters below, providing separate opinions on the critical audit matters or on the accounts or disclosures to which they relate.
Revenue Recognition on the Company’s Fixed Price Contract Revenue
As described in Note 2 (q) to the consolidated financial statements, the Company performs professional services under fixed price contracts with the associated revenue recognized over time. For fixed price revenue contracts recognized over time, management utilizes the input method to measure estimated progress to completion.
We identified revenue recognition for fixed price contracts as a critical audit matter. The principal consideration for our determination that revenue recognition for fixed price contracts was a critical audit matter is that the measure of progress towards completion is based upon the hours incurred to date as a percentage of the total estimated hours and utilizes assumptions for future hours to complete the performance obligations, and those assumptions have significant estimation uncertainty. A significant change in the assumptions could affect both the profitability of the contract and the amount of revenue and profit recognized in an accounting period. Given these factors, the related audit effort in evaluating management’s judgments in determining the revenue recognition for fixed price contracts was challenging, subjective, and complex and required a high degree of auditor judgment.
Our audit procedures related to testing the existence, accuracy and completeness of the Company’s fixed price contract revenue included the following, among others:
•We obtained an understanding of the relevant controls related to the existence, accuracy and completeness of fixed price contract revenue and tested such controls for design and operating effectiveness, including management review controls.
•We evaluated the reasonableness of management estimates of cost recognition by comparing costs incurred under completed contracts to the costs estimated by management at the inception of the customer agreement.
•We selected a sample of customer contracts and performed the following procedures:
–We reviewed the terms in the customer contract and evaluated the appropriateness of management’s application of their accounting policies, along with their use of estimates, to determine the revenue recognition conclusions are reasonable.
–We evaluated management’s estimated cost budget for each selection and compared the actual costs incurred to the amount recognized in accordance with management’s accounting policies.
–We assessed the progress towards completion by performing inquiries of key financial and operational executives to evaluate the progress to date and factors impacting the estimated total contract costs expected at completion as well as attending certain regular operational meetings to observe discussions over progress and total estimated remaining costs. We also held discussions with certain project leads to confirm the budgeting process and assumptions used in developing the original budget and subsequent modifications.
Valuation of Certain Intangible Assets Related to the Acquisition of Chemaxon, Kft.
As described in Note 4 to the consolidated financial statements, in 2024 the Company completed the acquisition of Chemaxon, Kft. (“Chemaxon”) for $96.4 million which resulted in $50.2 million of intangible assets being recorded. Those intangible assets were primarily comprised of developed technology of $36.0 million and customer relationships of $11.0 million.
The fair value of the developed technology and customer relationships acquired were valued at acquisition date using forms of the income approach including the multi-period excess earnings method and the distributor method. Key inputs used in the income approaches included estimations of the future cash flows attributable to these intangible assets considering their economic lives and applying appropriate discount rates.
We identified the valuation of developed technology and customer relationships related to the acquisition as a critical audit matter given the significant judgment exercised by management. Determining the valuation of developed technology and customer relationships led to a high degree of auditor judgment in performing procedures relating to management’s significant assumptions related to the revenue and expense growth rates, customer attrition rates, technical obsolescence rate and discount rates. Given these factors, the related audit effort in evaluating management’s judgments in determining the valuation of such assets was challenging, subjective, and complex and required a high degree of auditor judgment. Also, the audit effort involved the use of professionals with valuation skill and knowledge.
Our audit procedures related to the Company’s valuation of the developed technology and customer relationships in connection with the aforementioned acquisition included the following, among others:
•We obtained an understanding of the relevant controls related to the valuation of the customer relationships and developed technology and tested such controls for design and operating effectiveness, including management review controls related to the development of significant assumptions.
•We evaluated the reasonableness of management’s forecasts of revenue and expenses, customer attrition rates and technical obsolescence rate by comparing the forecasts to (1) the historical results and (2) internal communications to management and the Board of Directors, as applicable.
•With the assistance of our valuation specialists, we evaluated the reasonableness of the Company’s valuation methodologies and significant assumptions by:
–Evaluating the reasonableness of the discount rates.
–Testing the relevance and reliability of source information underlying the determination of the discount rates.
/s/ RSM US LLP
We have served as the Company's auditor since 2022.
Blue Bell, Pennsylvania
February 26, 2025
Report of Independent Registered Public Accounting Firm
To the Stockholders and the Board of Directors of Certara, Inc.
Opinion on the Internal Control Over Financial Reporting
We have audited Certara, Inc. and Subsidiaries’ (the Company) internal control over financial reporting as of December 31, 2024, based on criteria established in Internal Control—Integrated Framework issued by the Committee of Sponsoring Organizations of the Treadway Commission in 2013. In our opinion, the Company maintained, in all material respects, effective internal control over financial reporting as of December 31, 2024, based on criteria established in Internal Control—Integrated Framework issued by the Committee of Sponsoring Organizations of the Treadway Commission in 2013.
We have also audited, in accordance with the standards of the Public Company Accounting Oversight Board (United States) (PCAOB), the December 31, 2024 consolidated financial statements of the Company and our report dated February 26, 2025, expressed an unqualified opinion.
As described in Management’s Annual Report on Internal Controls over Financial Reporting, management has excluded Chemaxon, Kft. (Chemaxon) from its assessment of internal control over financial reporting as of December 31, 2024, because it was acquired by the Company in a purchase business combination in the fourth quarter of 2024. We have also excluded Chemaxon from our audit of internal control over financial reporting. Chemaxon is a wholly owned subsidiary whose total assets and total revenues represent approximately 6% and 2%, respectively, of the related consolidated financial statement amounts as of and for the year ended December 31, 2024.
Basis for Opinion
The Company’s management is responsible for maintaining effective internal control over financial reporting and for its assessment of the effectiveness of internal control over financial reporting in the accompanying Management’s Annual Report on Internal Controls over Financial Reporting. Our responsibility is to express an opinion on the Company’s internal control over financial reporting based on our audit. We are a public accounting firm registered with the PCAOB and are required to be independent with respect to the Company in accordance with U.S. federal securities laws and the applicable rules and regulations of the Securities and Exchange Commission and the PCAOB.
We conducted our audit in accordance with the standards of the PCAOB. Those standards require that we plan and perform the audit to obtain reasonable assurance about whether effective internal control over financial reporting was maintained in all material respects. Our audit included obtaining an understanding of internal control over financial reporting, assessing the risk that a material weakness exists, and testing and evaluating the design and operating effectiveness of internal control based on the assessed risk. Our audit also included performing such other procedures as we considered necessary in the circumstances. We believe that our audit provides a reasonable basis for our opinion.
Definition and Limitations of Internal Control Over Financial Reporting
A company's internal control over financial reporting is a process designed to provide reasonable assurance regarding the reliability of financial reporting and the preparation of financial statements for external purposes in accordance with generally accepted accounting principles. A company's internal control over financial reporting includes those policies and procedures that (1) pertain to the maintenance of records that, in reasonable detail, accurately and fairly reflect the transactions and dispositions of the assets of the company; (2) provide reasonable assurance that transactions are recorded as necessary to permit preparation of financial statements in accordance with generally accepted accounting principles, and that receipts and expenditures of
the company are being made only in accordance with authorizations of management and directors of the company; and (3) provide reasonable assurance regarding prevention or timely detection of unauthorized acquisition, use or disposition of the company's assets that could have a material effect on the financial statements.
Because of its inherent limitations, internal control over financial reporting may not prevent or detect misstatements. Also, projections of any evaluation of effectiveness to future periods are subject to the risk that controls may become inadequate because of changes in conditions, or that the degree of compliance with the policies or procedures may deteriorate.
/s/ RSM US LLP
Blue Bell, Pennsylvania
February 26, 2025
CERTARA, INC. AND SUBSIDIARIES
CONSOLIDATED BALANCE SHEETS
| | | | | | | | | | | | | | |
| | DECEMBER 31, |
| (IN THOUSANDS, EXCEPT PER SHARE AND SHARE DATA) | | 2024 | | 2023 |
| Assets | | | | |
| Current assets: | | | | |
| Cash and cash equivalents | | $ | 179,183 | | | $ | 234,951 | |
| Accounts receivable, net of allowances for credit losses of $2,164 and $1,312, respectively | | 102,189 | | | 84,857 | |
| Prepaid expenses and other current assets | | 29,480 | | | 20,393 | |
| Total current assets | | 310,852 | | | 340,201 | |
| Other assets: | | | | |
| Property and equipment, net | | 2,167 | | | 2,670 | |
| Operating lease right-of-use assets | | 13,841 | | | 9,604 | |
| Goodwill | | 757,038 | | | 716,333 | |
| Intangible assets, net of $338,809 and $273,522, respectively | | 485,214 | | | 487,043 | |
| Deferred income taxes | | 3,961 | | | 4,236 | |
| Other long-term assets | | 2,031 | | | 3,053 | |
| Total assets | | $ | 1,575,104 | | | $ | 1,563,140 | |
| Liabilities and stockholders' equity | | | | |
| Current liabilities: | | | | |
| Accounts payable | | $ | 3,502 | | | $ | 5,171 | |
| Accrued expenses | | 56,451 | | | 56,779 | |
| Current portion of deferred revenue | | 77,829 | | | 60,678 | |
| Current portion of long-term debt | | 3,000 | | | 3,020 | |
| Other current liabilities | | 5,306 | | | 4,375 | |
| Total current liabilities | | 146,088 | | | 130,023 | |
| Long-term liabilities: | | | | |
| Deferred revenue, net of current portion | | 1,049 | | | 1,070 | |
| Deferred income taxes | | 40,421 | | | 50,826 | |
| Operating lease liabilities, net of current portion | | 11,166 | | | 6,955 | |
| Long-term debt, net of current portion and debt discount | | 292,425 | | | 288,217 | |
| Other long-term liabilities | | 25,299 | | | 39,209 | |
| Total liabilities | | 516,448 | | | 516,300 | |
| Commitments and contingencies | | | | |
| Stockholders' equity | | | | |
| Preferred shares, $0.01 par value, 50,000,000 and no shares authorized, issued, and outstanding as of December 31, 2024 and 2023, respectively | | — | | | — | |
| Common shares, $0.01 par value, 600,000,000 shares authorized, 161,958,810 and 160,284,901 shares issued as of December 31, 2024 and 2023, respectively; 161,009,112 and 159,848,286 shares outstanding as of December 31, 2024 and 2023, respectively | | 1,620 | | | 1,603 | |
| Additional paid-in capital | | 1,216,925 | | | 1,178,461 | |
| Accumulated deficit | | (128,281) | | | (116,230) | |
| Accumulated other comprehensive loss | | (13,424) | | | (7,593) | |
| Treasury stock at cost, 949,698 and 436,615 shares at December 31, 2024 and 2023, respectively | | (18,184) | | | (9,401) | |
| Total stockholders' equity | | 1,058,656 | | | 1,046,840 | |
| Total liabilities and stockholders' equity | | $ | 1,575,104 | | | $ | 1,563,140 | |
The accompanying notes are an integral part of the consolidated financial statements.
CERTARA, INC. AND SUBSIDIARIES
CONSOLIDATED STATEMENTS OF OPERATIONS AND COMPREHENSIVE INCOME (LOSS)
| | | | | | | | | | | | | | | | | | | | |
| | YEAR ENDED DECEMBER 31, |
| (IN THOUSANDS, EXCEPT PER SHARE AND SHARE DATA) | | 2024 | | 2023 | | 2022 |
| Revenues | | $ | 385,148 | | | $ | 354,337 | | | $ | 335,644 | |
| Cost of revenues | | 154,516 | | | 141,022 | | | 132,577 | |
| Operating expenses: | | | | | | |
| Sales and marketing | | 47,444 | | | 32,022 | | | 27,408 | |
| Research and development | | 37,105 | | | 34,173 | | | 28,205 | |
| General and administrative | | 94,221 | | | 95,385 | | | 71,773 | |
| Intangible asset amortization | | 51,599 | | | 43,973 | | | 41,429 | |
| Depreciation and amortization expense | | 1,994 | | | 1,552 | | | 1,731 | |
| Goodwill impairment expense | | — | | | 46,984 | | | — | |
| Total operating expenses | | 232,363 | | | 254,089 | | | 170,546 | |
| Income (loss) from operations | | (1,731) | | | (40,774) | | | 32,521 | |
| Other expenses: | | | | | | |
| Interest expense | | (21,520) | | | (22,916) | | | (17,773) | |
| Net other income (expense) | | 6,067 | | | 8,547 | | | 4,007 | |
| Total other expenses | | (15,453) | | | (14,369) | | | (13,766) | |
| Income (loss) before income taxes | | (17,184) | | | (55,143) | | | 18,755 | |
| (Benefit) Provision for income taxes | | (5,133) | | | 214 | | | 4,024 | |
| Net income (loss) | | (12,051) | | | (55,357) | | | 14,731 | |
| Other comprehensive income (loss) | | | | | | |
| Foreign currency translation adjustment, net of tax of $(956), $(717), $(916) | | (3,247) | | | 2,696 | | | (10,490) | |
| Change in fair value of interest rate swap, net of tax of $(827), 1,393, $2,056 | | (2,584) | | | (2,059) | | | 6,186 | |
| Total other comprehensive income (loss) | | (5,831) | | | 637 | | | (4,304) | |
| Comprehensive income (loss) | | $ | (17,882) | | | $ | (54,720) | | | $ | 10,427 | |
| | | | | | |
| Net income (loss) per share attributable to common stockholders: | | | | | | |
| Basic | | $ | (0.08) | | | $ | (0.35) | | | $ | 0.09 | |
| Diluted | | $ | (0.08) | | | $ | (0.35) | | | $ | 0.09 | |
| | | | | | |
| Weighted average common shares outstanding: | | | | | | |
| Basic | | 160,392,805 | | 158,936,251 | | 156,876,942 |
| Diluted | | 160,392,805 | | 158,936,251 | | 159,354,394 |
The accompanying notes are an integral part of the consolidated financial statements.
CERTARA, INC. AND SUBSIDIARIES
CONSOLIDATED STATEMENTS OF STOCKHOLDERS’ EQUITY
| | | | | | | | | | | | | | | | | | | | | | | | | | | | | | | | | | | | | | | | | | | | | | | | | | |
| (IN THOUSANDS, EXCEPT SHARE DATA) | | COMMON STOCK | | ADDITIONAL
PAID-IN CAPITAL | | ACCUMULATED
DEFICIT | | ACCUMULATED
OTHER
COMPREHENSIVE
LOSS | | TREASURY STOCK | | TOTAL
STOCKHOLDER’S
EQUITY |
| SHARES | | AMOUNT | | | | | SHARES | | AMOUNT | |
| Balance as of December 31, 2021 | | 159,660,048 | | | $ | 1,596 | | | $ | 1,119,821 | | | $ | (75,604) | | | $ | (3,926) | | | $ | (1,100) | | | $ | (38) | | | $ | 1,041,849 | |
| Equity-based compensation expense, net of forfeiture | | (421,624) | | | (4) | | | 30,349 | | | — | | | — | | | — | | | — | | | 30,345 | |
| Restricted stock and stock units withheld for tax liabilities | | — | | | — | | | 2 | | | — | | | — | | | (149,107) | | | (2,962) | | | (2,960) | |
| Common shares issued for employee share-based compensation | | 437,726 | | | 4 | | | (4) | | | — | | | — | | | — | | | — | | | — | |
| Change in fair value from interest rate swap, net of tax | | — | | | — | | | — | | | — | | | 6,186 | | | — | | | — | | | 6,186 | |
| Net income | | — | | | — | | | — | | | 14,731 | | | — | | | — | | | — | | | 14,731 | |
| Foreign currency translation adjustment, net of tax | | — | | | — | | | — | | | — | | | (10,490) | | | — | | | — | | | (10,490) | |
| Balance as of December 31, 2022 | | 159,676,150 | | 1,596 | | | 1,150,168 | | | (60,873) | | | (8,230) | | | (150,207) | | (3,000) | | | 1,079,661 | |
| Equity-based compensation expense, net of forfeiture | | (201,838) | | (1) | | | 28,301 | | | — | | | — | | | — | | — | | | 28,300 | |
| Restricted stock and stock units withheld for tax liabilities | | — | | — | | | — | | | — | | | — | | | (286,408) | | (6,401) | | | (6,401) | |
| Common shares issued for employee share-based compensation | | 810,589 | | 8 | | | (8) | | | — | | | — | | | — | | — | | | — | |
| Change in fair value from interest rate swap, net of tax | | — | | — | | | — | | | — | | | (2,059) | | | — | | | — | | | (2,059) | |
| Net loss | | — | | — | | | — | | | (55,357) | | | | | — | | — | | | (55,357) | |
| Foreign currency translation adjustment, net of tax | | — | | — | | | — | | | — | | | 2,696 | | | — | | — | | | 2,696 | |
| Balance as of December 31, 2023 | | 160,284,901 | | 1,603 | | | 1,178,461 | | | (116,230) | | | (7,593) | | | (436,615) | | (9,401) | | | 1,046,840 | |
| Equity-based compensation expense, net of forfeiture | | (5,123) | | — | | | 34,774 | | | — | | | — | | | — | | — | | | 34,774 | |
| Restricted stock and stock units withheld for tax liabilities | | — | | — | | | — | | | — | | | — | | | (513,083) | | (8,783) | | | (8,783) | |
| Common shares issued for employee share-based compensation | | 1,464,340 | | 15 | | | (15) | | | — | | | — | | | — | | — | | | — | |
| Common shares issued for contingent consideration | | 214,692 | | | 2 | | | 3,705 | | | — | | | — | | | — | | | — | | | 3,707 | |
| Change in fair value from interest rate swap, net of tax | | — | | — | | | — | | | — | | | (2,584) | | | — | | — | | | (2,584) | |
| Net loss | | — | | — | | | — | | | (12,051) | | | — | | | — | | — | | | (12,051) | |
| Foreign currency translation adjustment, net of tax | | — | | — | | | — | | | — | | | (3,247) | | | — | | — | | | (3,247) | |
| Balance as of December 31, 2024 | | 161,958,810 | | $ | 1,620 | | | $ | 1,216,925 | | | $ | (128,281) | | | $ | (13,424) | | | (949,698) | | $ | (18,184) | | | $ | 1,058,656 | |
The accompanying notes are an integral part of the consolidated financial statements.
CERTARA, INC. AND SUBSIDIARIES
CONSOLIDATED STATEMENTS OF CASH FLOWS
| | | | | | | | | | | | | | | | | | | | |
| | YEAR ENDED DECEMBER 31, |
| (IN THOUSANDS) | | 2024 | | 2023 | | 2022 |
| Cash flows from operating activities: | | | | | | |
| Net income (loss) | | $ | (12,051) | | | $ | (55,357) | | | $ | 14,731 | |
| Adjustments to reconcile net income (loss) to net cash provided by operating activities: | | | | | | |
| Depreciation and amortization of property and equipment | | 1,994 | | | 1,552 | | | 1,731 | |
| Amortization of intangible assets | | 66,039 | | | 54,519 | | | 50,739 | |
| Amortization of debt issuance costs | | 1,035 | | | 1,527 | | | 1,540 | |
| Provision for credit losses | | 1,464 | | | 684 | | | 1,072 | |
| Equity-based compensation expense | | 34,774 | | | 28,300 | | | 30,345 | |
| Change in fair value of contingent considerations | | 8,089 | | | 24,118 | | | — | |
| Goodwill impairment | | — | | | 46,984 | | | — | |
| Deferred income taxes | | (12,695) | | | (16,523) | | | (11,511) | |
| Changes in assets and liabilities | | | | | | |
| Accounts receivable | | (16,225) | | | 152 | | | (15,009) | |
| Prepaid and other assets | | (2,873) | | | 711 | | | 126 | |
| Accounts payable and accrued expenses, and other liabilities | | (4,765) | | | (5,607) | | | 9,080 | |
| Deferred revenue | | 13,834 | | | 28 | | | 9,530 | |
| Other operating activities, net | | 1,846 | | | 1,667 | | | 169 | |
| Net cash provided by operating activities | | 80,466 | | | 82,755 | | | 92,543 | |
| Cash flows from investing activities: | | | | | | |
| Capital expenditures | | (1,625) | | | (1,777) | | | (1,430) | |
| Capitalized software development costs | | (19,416) | | | (13,491) | | | (11,099) | |
| Investment in intangible assets | | — | | | (54) | | | — | |
| Business acquisitions, net of cash acquired | | (91,327) | | | (64,228) | | | (15,308) | |
| Net cash used in investing activities | | (112,368) | | | (79,550) | | | (27,837) | |
| Cash flows from financing activities: | | | | | | |
| Proceeds from borrowings on term loan debt | | 6,305 | | | — | | | — | |
| Payment of debt issuance costs | | (1,216) | | | — | | | — | |
| Payments on long-term debt and finance lease obligations | | (2,255) | | | (3,045) | | | (3,313) | |
| Payments for business acquisition related contingent consideration | | (15,156) | | | — | | | — | |
| Payments on financing component of interest rate swap | | — | | | — | | | (1,088) | |
| Payment of taxes on shares and units withheld for employee taxes | | (8,688) | | | (6,402) | | | (2,962) | |
| Net cash used in financing activities | | (21,010) | | | (9,447) | | | (7,363) | |
| Effect of foreign exchange rate changes on cash, cash equivalents, and restricted cash | | (2,856) | | | 1,505 | | | (4,279) | |
| Net increase (decrease) in cash, cash equivalents, and restricted cash | | (55,768) | | | (4,737) | | | 53,064 | |
| Cash, cash equivalents, and restricted cash, at beginning of year | | 234,951 | | | 239,688 | | | 186,624 | |
| Cash, cash equivalents, and restricted cash, at end of year | | $ | 179,183 | | | $ | 234,951 | | | $ | 239,688 | |
| Supplemental disclosures of cash flow information | | | | | | |
| Cash paid for interest | | $ | 22,737 | | | $ | 19,089 | | | $ | 17,268 | |
| Cash paid for taxes | | $ | 14,658 | | | $ | 19,320 | | | $ | 10,141 | |
| Supplemental schedule of noncash investing and financing activities | | | | | | |
| Contingent liabilities established in connection with business acquisition | | $ | — | | | $ | 11,308 | | | $ | 19,813 | |
| Stock issuance related to business acquisition contingent consideration | | $ | 3,707 | | | $ | — | | | $ | — | |
The accompanying notes are an integral part of the consolidated financial statements.
CERTARA, INC. AND SUBSIDIARIES
NOTES TO THE CONSOLIDATED FINANCIAL STATEMENTS
(IN THOUSANDS, EXCEPT PER SHARE PERCENTAGES AND SHARE AND UNIT DATA)
1. Description of Business
Certara, Inc. and its wholly-owned subsidiaries (together, the “Company”) deliver software products and technology-driven services to customers to efficiently carry out and realize the full benefits of biosimulation in drug discovery, preclinical and clinical research, regulatory submissions and market access. The Company is a global leader in biosimulation, and the Company’s biosimulation software and technology-driven services help optimize, streamline, or even waive certain clinical trials to accelerate programs, reduce costs, and increase the probability of success. The Company’s regulatory science and market access software and services are underpinned by technologies such as regulatory submissions software, natural language processing, and Bayesian analytics. When combined, these solutions allow the Company to offer customers end-to-end support across the entire product life cycle.
The Company has operations in the United States, Australia, Canada, China, France, Germany, India, Italy, Japan, Luxembourg, Netherlands, Philippines, Poland, Portugal, Spain, Switzerland, Egypt, Hungary and the United Kingdom.
2. Summary of Significant Accounting Policies
(a) Basis of Presentation and Use of Estimates
The preparation of consolidated financial statements in conformity with U.S. generally accepted accounting principles (“GAAP”) requires management to make estimates and assumptions that affect the reported amounts of assets, liabilities, disclosure of contingent assets and liabilities at the date of the consolidated financial statements and the reported amounts of revenues and expenses during the reporting period. Significant estimates include, among other estimates, assumptions used in the allocation of the transaction price to separate performance obligations, estimates towards the measure of progress of completion on fixed-price service contracts, the determination of fair values and useful lives of long-lived assets as well as intangible assets, goodwill, allowance for credit losses for accounts receivable, recoverability of deferred tax assets, recognition of deferred revenue, valuation of interest rate swaps, determination of fair value of equity-based awards and assumptions used in testing for impairment of long-lived assets. Actual results could differ from those estimates, and such differences may be material to the consolidated financial statements.
(b) Recently Adopted or Issued Accounting Standards
In November 2023, the Financial Accounting Standards Board ("FASB") issued Accounting Standards Update ("ASU") ASU 2023-07, “Segment Reporting (Topic 280): Improvements to Reportable Segment Disclosures.” The ASU requires an enhanced disclosure of significant segment expenses on an annual and interim basis. This ASU will be effective for fiscal years beginning after December 15, 2023, and interim periods within fiscal years beginning after December 15, 2024. Early adoption is permitted. Upon adoption, the guidance should be applied retrospectively to all prior periods presented in the financial statements. As of December 31, 2024, the Company has adopted the ASU on the disclosures within its consolidated financial statements.
In December 2023, the FASB issued ASU 2023-09, “Income Taxes (Topic 740): Improvements to Income Tax Disclosures". The ASU requires disclosure of specific categories in the rate reconciliation and provide additional information for reconciling items that meet a quantitative threshold and further disaggregation of income taxes paid for individually significant jurisdictions. The ASU will be effective for public business
entities for annual periods beginning after December 15, 2024. Early adoption is permitted. The Company is currently evaluating the impact of the ASU on the disclosures within our consolidated financial statements.
In November 2024, the FASB issued ASU 2024-03, Disaggregation of Income Statement Expenses. This ASU seeks to improve of the disclosures about the types of expenses, including employee compensation, depreciation, and amortization, and costs incurred related to inventory and manufacturing activities. ASU 2024-03 is effective for fiscal years beginning after December 15, 2026, and interim periods within fiscal years beginning after December 15, 2027. Early adoption is permitted. The Company is currently evaluating the impact of the ASU on the disclosures within its consolidated financial statements.
(c) Principles of Consolidation
The accompanying consolidated financial statements include the accounts of the Company and its wholly owned subsidiaries. All intercompany balances and transactions have been eliminated in consolidation.
(d) Fair Value Measurements
The Company follows FASB ASC 820-10, “Fair Value Measurements” (“ASC 820-10”), which defines fair value, establishes a framework for measuring fair value in U.S. GAAP, and requires certain disclosures about fair value measurements.
ASC 820-10 defines fair value as the exchange price that would be received for an asset or paid to transfer a liability (an exit price) in the most advantageous market for the asset or liability in an orderly transaction. Fair value measurement is based on a hierarchy of observable or unobservable inputs. The standard describes three levels of inputs that may be used to measure fair value.
Level 1 — Inputs to the valuation methodology are quoted prices available in active markets for identical securities as of the reporting date;
Level 2 — Inputs to the valuation methodology are other significant observable inputs, including quoted prices for similar securities, interest rates, credit risk etc. as of the reporting date, and the fair value can be determined through the use of models or other valuation methodologies; and
Level 3 — Inputs to the valuation methodology are unobservable inputs in situations where there is little, or no market activity of the securities and the reporting entity makes estimates and assumptions relating to the pricing of the securities including assumptions regarding risk.
If the inputs used to measure fair value fall in different levels of the fair value hierarchy, the hierarchy is based upon the lowest level of input that is significant to the fair value measurement. For the acquisitions noted in Note 5, the fair value measurement methods used to estimate the fair value of the assets acquired and liabilities assumed at the acquisition dates utilized a number of significant unobservable inputs of Level 3 assumptions. These assumptions included, among other things, projections of future operating results, implied fair value of assets using an income approach by preparing a discounted cash flow analysis, and other subjective assumptions.
Interest rate swaps are valued in the market using discounted cash flows techniques. These techniques incorporate Level 1 and Level 2 inputs. The market inputs are utilized in the discounted cash flows’ calculation considering the instrument’s term, notional amount, discount rate and credit risk. Significant inputs to the derivative instrument valuation model for interest rate swaps are observable in active markets and are classified as Level 2 in the hierarchy.
Contingent liabilities related to acquisitions are measured at fair value using Level 3 unobservable inputs. The Company's estimates of fair value are based upon assumptions believed to be reasonable but which are
uncertain and involve significant judgments by management. Any changes in the fair value of these contingent liabilities are included in the earnings in the consolidated statements of operations and comprehensive income (loss).
The Company utilizes Monte Carlo or a series of Black-Scholes-Merton options models to estimate the fair value of the contingent consideration liabilities of business acquisitions. Significant inputs used in the fair value measurement of contingent consideration include: expected eligible revenue for the acquired businesses over the relevant measurement periods, the risk profile of the expected eligible revenue for the acquired businesses, the uncertainty regarding the expected eligible revenue for the acquired businesses, the risk-free rate of return, the expected timing at which settlement of the contingent liabilities may occur, and the credit-adjusted discount rate associated with the risk of the Company’s future liability payments. At the acquisition date, the fair value of the contingent consideration liabilities related with eligible revenues was $19,813, $790, $4,380, and $5,357 for the acquisitions of Vyasa Analytics, LLC (“Vyasa”), Drug Interaction Solutions, University of Washington (“DIDB”), Formedix Limited ("Formedix") , and Applied BioMath, LLC (“ABM”), respectively.
The following table sets forth the assets and liabilities that were measured at fair value on a recurring and non-recurring basis by their levels in the fair value hierarchy at December 31, 2024:
| | | | | | | | | | | | | | | | | | | | | | | |
| LEVEL 1 | | LEVEL 2 | | LEVEL 3 | | TOTAL |
| | | | | | | |
| (In thousands) |
| Assets | | | | | | | |
| Money market funds | $ | 79,167 | | | $ | — | | | $ | — | | | $ | 79,167 | |
| Interest rate swap assets | — | | | 2,213 | | | — | | | 2,213 | |
| Total assets | $ | 79,167 | | | $ | 2,213 | | | $ | — | | | $ | 81,380 | |
| | | | | | | |
| Liabilities | | | | | | | |
| Contingent liabilities | $ | — | | | $ | — | | | $ | 43,939 | | | $ | 43,939 | |
| Total liabilities | $ | — | | | $ | — | | | $ | 43,939 | | | $ | 43,939 | |
The following table sets forth the assets that were measured at fair value on a recurring and non-recurring basis by their levels in the fair value hierarchy at December 31, 2023:
| | | | | | | | | | | | | | | | | | | | | | | |
| LEVEL 1 | | LEVEL 2 | | LEVEL 3 | | TOTAL |
| | | | | | | |
| (In thousands) |
| Assets | | | | | | | |
| Money market funds | $ | 147,478 | | | $ | — | | | $ | — | | | $ | 147,478 | |
| Interest rate swap assets | — | | | 5,624 | | | — | | | 5,624 | |
| Total assets | $ | 147,478 | | | $ | 5,624 | | | $ | — | | | $ | 153,102 | |
| | | | | | | |
| Liabilities | | | | | | | |
| Contingent liabilities | $ | — | | | $ | — | | | $ | 54,457 | | | $ | 54,457 | |
| Total liabilities | $ | — | | | $ | — | | | $ | 54,457 | | | $ | 54,457 | |
For the period ended December 31, 2024, there were no transfers between the levels within the fair value hierarchy. The Company’s Level 3 liabilities that were measured at fair value on a recurring basis are acquisition related contingent consideration liabilities.
The following table summarizes the Level 3 activity of the changes in the contingent consideration liability.
| | | | | | | | |
| | YEAR ENDED DECEMBER 31, 2024 |
| | (In thousands) |
| Beginning balance at December 31, 2023 | | $ | 54,457 | |
| Payments | | (18,863) | |
| Change in fair value | | 8,345 | |
| Ending balance at December 31, 2024 | | $ | 43,939 | |
(e) Cash and Cash Equivalents
Cash equivalents include highly-liquid investments with maturities of three months or less from the date purchased. At times, cash balances held at financial institutions were in excess of the Federal Deposit Insurance Corporation’s (“FDIC”) insured limits; however, the Company primarily places its temporary cash with high-credit quality financial institutions. The Company has never experienced losses related to these balances and believes it is not exposed to any significant credit risk on cash.
As of December 31, 2024 and 2023, the carrying values reflected in the consolidated balance sheets reasonably approximate the fair values of cash and cash equivalents due to the short-term maturity of these items.
The following table provides a reconciliation of cash and cash equivalents and restricted cash reported within the consolidated balance sheets to the amounts presented in the consolidated statements of cash flows:
| | | | | | | | | | | |
| DECEMBER 31, |
| 2024 | | 2023 |
| | | |
| (In thousands) |
| Cash and cash equivalents | $ | 179,183 | | | $ | 234,951 | |
(f) Accounts Receivable
Accounts receivable includes current outstanding invoices billed to customers. Invoices are typically issued with net 30-days to net 90-days terms upon delivery of product or upon achievement of billable events for service-based contracts. Unbilled receivables relate to the Company’s rights to consideration for performance obligations satisfied but not billed at the reporting date on contracts. Unbilled receivables are billed and transferred to customer accounts receivable when the rights become unconditional. The carrying amount of accounts receivable is reduced by a valuation allowance.
The Company estimates the expected credit losses for accounts receivables using historical loss data adjusted for current economic conditions, including reasonable and supportable forecasts to estimate the relative size of credit losses to be expected. The Company generally writes off a receivable or records a specific allowance for credit losses if the Company determines that the receivable is not collectible. Allowances for credit losses of $2,164 and $1,312, respectively, were provided in the accompanying consolidated financial statements as of December 31, 2024 and 2023, respectively.
| | | | | | | | | | | |
| DECEMBER 31, |
| 2024 | | 2023 |
| | | |
| (In thousands) |
| Trade receivables | $ | 90,609 | | | $ | 75,410 | |
| Unbilled receivables | 13,454 | | | 10,405 | |
| Other receivables | 290 | | | 354 | |
| Allowance for credit losses | (2,164) | | | (1,312) | |
| Accounts receivable, net | $ | 102,189 | | | $ | 84,857 | |
The following is a summary of the changes to the allowance for credit losses as of December 31, 2024 and 2023.
| | | | | | | | | | | |
| DECEMBER 31, |
| 2024 | | 2023 |
| | | |
| (In thousands) |
| Beginning balance | $ | 1,312 | | | $ | 1,250 | |
| Provision for credit losses | 1,464 | | | 684 | |
| Charge-offs, net of recoveries | (612) | | | (622) | |
| Ending balance | $ | 2,164 | | | $ | 1,312 | |
(g) Property and Equipment
Property and equipment are stated at cost, less accumulated depreciation and amortization.
Depreciation and amortization is provided using the straight-line method over the estimated useful lives of the assets, which range from three to ten years for computer and office equipment, the shorter of the useful lives of the improvement or the life of the related lease term for leasehold improvements, and one to three years for purchased software. The Company seeks to match the book useful life of assets to the expected productive lives. Assets deemed to be impaired or no longer productive are written down to their net realizable value. The Company reviews long-lived assets for impairment whenever events or changes in circumstances indicate that the carrying value of the asset may not be recoverable. If such events or changes in circumstances are present, an impairment loss would be recognized if the sum of the expected future net cash flows is less than the carrying amount of the asset. An impairment loss would be recorded for the excess of the carrying value of the asset over the estimated fair value. There was no impairment of property and equipment for the years ended December 31, 2024, 2023, and 2022.
(h) Leases
The Company determines if a contract contains a lease at contract inception and whether its classification as either an operating or finance lease at lease commencement. The Company’s current portfolio includes operating leases of real estate and capital leases of equipment. The Company records a lease liability, as of the lease commencement date, in an amount equal to the present value of future fixed payments over the lease term. Options to extend or terminate a lease are considered in the lease term to the extent that the option is reasonably certain of exercise. A right-of-use (“ROU”) asset is recorded in an amount equal to the corresponding lease liability adjusted for prepayments, initial directs costs and lease incentives, if applicable. The Company has elected not to recognize ROU assets and lease liabilities for short-term leases of real estate with a lease term of 12 months or less.
The Company generally uses its incremental borrowing rate in determining the present value of future payments as the rate implicit in the lease is unknown. The incremental borrowing rate represents the rate of interest that
the Company would expect to pay on a collateralized basis to borrow an amount equal to the lease payments under similar terms.
Fixed lease payments on operating leases are recognized on a straight-line basis over the lease term, while variable payments are recognized in the period incurred. Variable lease payments include real estate taxes and charges for other non-lease services due to lessors that are not dependent on an index or rate. The Company’s real estate contracts may include fixed consideration attributable to both lease and non-lease components, including non-lease services provided by the lessor, which are accounted for as a single fixed minimum payment. ROU assets under finance leases are depreciated in a manner similar to other property and equipment.
Lessee's ROU assets under ASC 842 are subject to the FASB ASC Subtopic 360-10 impairment guidance applicable to long-lived assets. For the years ended December 31, 2024 and 2023, the Company recorded lease abandonment expenses of $1,219 and $1,602, respectively, and reduced the lease ROU assets for the same amount in each year in connection with the evaluation of the Company's office space footprint. The expense is included within the general and administrative expenses in the Company's consolidated statements of operations and comprehensive income (loss).
(i) Software Development Costs
Software development costs are accounted for in accordance with FASB ASC Subtopic 985-20 if the software is to be sold, leased or otherwise marketed, or by FASB ASC Subtopic 350-40 if the software is for internal use. After the technological feasibility of the software has been established (for software to be marketed), or at the beginning of application development (for internal-use software), software development costs, which include primarily salaries and related payroll costs and costs of independent contractors incurred during development, are capitalized. Research and development (“R&D”) costs incurred prior to the establishment of technological feasibility (for software to be marketed), or prior to application development (for internal-use software), are expensed as incurred. Software development costs are amortized on a product-by-product basis commencing on the date of general release of the products (for software to be marketed) or the date placed in service (for internal-use software). During the years ended December 31, 2024, 2023 and 2022, costs of $19,446, $13,566, and $11,119, respectively, were capitalized related to software development activities. Software development costs for software to be marketed are amortized using the straight-line method over its estimated useful life, which is typically three years. The Company reviews capitalized software for impairment whenever events or changes in circumstances indicate that the carrying value of the asset may not be recoverable. If such events or changes in circumstances are present, an impairment loss would be recognized if the sum of the expected future net cash flows is less than the carrying amount of the asset. An impairment loss would be recorded for the excess of the carrying value of the asset over the estimated fair value. There was no impairment of software development costs for the years ended December 31, 2024, 2023, and 2022.
(j) Debt Issuance Costs
Debt issuance costs are capitalized and amortized over the term of the related debt using the effective interest rate method. Amortization of debt issuance costs is included in interest expense within the consolidated statements of operations and comprehensive income (loss). The unamortized amount is included as an offset against long-term debt on the consolidated balance sheets. Debt issuance costs related to line-of-credit arrangements are capitalized and are included in other long-term assets on the consolidated balance sheets. The capitalized costs are amortized ratably over the term of the line-of-credit arrangement. The amortization costs are included in interest expense within the consolidated statements of operations and comprehensive income (loss), regardless of whether there are any outstanding borrowings on the line-of-credit arrangement.
(k) Goodwill and Other Intangible Assets
During 2024, the Company reorganized its Certara Drug Development Solutions reporting unit (“CDDS”), Software reporting unit (“Software”), and SimCyp reporting unit (“SimCyp”) for goodwill allocation and impairment testing purposes. As of December 31, 2024, the Company had three reporting units – Certara Data Science Software (“CDS”), the Certara Predictive Technologies reporting unit (“CPT”), and the Certara Drug Development Services reporting unit (“CDDS”), which are within a single operating segment of the Company. Goodwill is tested for impairment at the reporting unit level, which is one level below or the same as an operating segment. When testing goodwill for impairment, the Company performs a qualitative assessment to determine whether events or circumstances lead to a determination that it is more-likely-than-not that the fair values of the reporting units are less than their carrying amounts. If the Company determines that it is not more-likely-than-not that the fair values of the reporting units are less than their carrying values, no further assessment is performed. If the Company determines that it is more-likely-than-not that the fair values of the reporting units are less than carrying value, the Company proceeds to perform a quantitative goodwill impairment test. If the result of the quantitative test shows that the carrying amount of reporting units exceeds its fair values, an impairment loss is recognized in an amount equal to that excess, limited to the total amount of goodwill allocated to that reporting unit.
The goodwill impairment test is performed at least annually at the reporting unit level. An interim test is performed when events or circumstances occur that may indicate that it is more likely than not that the fair value of any reporting unit may be less than its carrying value. During the third quarter of 2023, the Company performed interim goodwill impairment tests for the prior regulatory writing reporting unit, which was integrated into the CDDS at the end of third quarter 2023. The fair value of the regulatory writing reporting unit was determined to be less than its carrying value, resulting in a goodwill impairment charge of $46,984 for the reporting unit. The fair value of that reporting unit was estimated using a combination of the discounted cash flow method and the guideline public company method. The decline in the fair value of the regulatory writing reporting unit was driven by revised revenue growth and profitability forecasts resulting from certain reductions in our financial planning assumptions.
For the years ended December 31, 2024, 2023, and 2022, the Company performed annual quantitative assessments of goodwill, with the most recent assessment was performed on October 1, 2024. The annual quantitative assessments resulted in no impairment as the estimated fair value of each reporting unit exceeded its carrying value. The Company recorded a goodwill impairment charge of $46,984 for the year ended December 31, 2023. There was no goodwill impairment recorded for the years ended December 31, 2024 and 2022.
Other identifiable intangible assets with finite lives, such as software products acquired in acquisitions, non-compete agreements, trade names, customer relationship assets, and patents, are amortized over their estimated useful lives using either a straight-line method or a method based on pattern of expected economic benefit of the asset as follows: acquired software — 3 to 15 years; non-compete agreements — 2 to 5 years; customer relationships — 11 to 16 years; trade names — 10 to 20 years: patents — 5 years. The fair value of the intangible assets acquired were valued at acquisition date using forms of the income approach including the relief from royalty method and multi-period excess earnings method or the cost approach. Key inputs used in the income approaches included estimations of the future cash flows attributable to certain intangible assets, considering their economic lives, and then applying appropriate discount rates. Key inputs used in the cost approaches include the cost of re-creation and appropriate returns on those re-creation efforts. The Company evaluates finite intangible assets for impairment whenever events or changes in circumstances indicate that the carrying amount of the asset might not be recoverable. An impairment loss is recognized when estimated undiscounted future cash flows expected to result from the use of the asset are less than its carrying amount.
There were no impairment charges related to intangible assets for the years ended December 31, 2024, 2023, and 2022.
(l) Foreign Currency Translation
Generally, the functional currency of the Company’s international subsidiaries is the local currency of the country in which they operate. The Company translates the assets and liabilities of its non-U.S. dollar functional currency subsidiaries into U.S. dollars using exchange rates in effect at the end of each reporting period. Revenue and expenses for these subsidiaries are translated using average exchange rates prevailing during the period. Gains and losses from these translations are recognized as a cumulative translation adjustment and included as a separate component in accumulated other comprehensive loss within the consolidated statement of stockholders’ equity.
For transactions that are not denominated in the local functional currency, the Company remeasures monetary assets and liabilities at exchange rates in effect at the end of each reporting period. Foreign currency transaction gains and losses are included net within comprehensive gain or loss in the consolidated statements of operations and comprehensive income (loss) and resulted in foreign currency losses of $(2,344), $(638), and $(3,166) for the years ended December 31, 2024, 2023, and 2022, respectively.
(m) Derivative Instruments
In the normal course of business, the Company is subject to risk from adverse fluctuations in interest rates. The Company has chosen to manage this risk through the use of derivative financial instruments that consist of interest rate swap contracts. Counterparties to these contracts are major financial institutions. The Company is exposed to credit loss in the event of nonperformance by these counterparties. The Company does not use derivative instruments for trading or speculative purposes. The objective in managing exposure to market risk is to limit the impact on cash flows. To qualify for hedge accounting, the interest rate swaps must effectively reduce the risk exposure that they are designed to hedge. In addition, at inception of a qualifying cash flow hedging relationship, the underlying transaction or transactions must be, and be expected to remain, probable of occurring in accordance with the related assertions.
FASB ASC 815, “Derivatives and Hedging,” requires the Company to recognize all derivatives on the balance sheet at fair value. The Company may enter into derivative contracts such as interest rate swap contracts that effectively convert portions of the Company’s floating rate debt to a fixed rate, which serves to mitigate interest rate risk. The Company’s objectives in using interest rate swaps are to add stability to interest expense and to manage its exposure to interest rate movements. Interest rate swaps designated as cash flow hedges involve the receipt of variable-rate amounts from a counterparty in exchange for the Company making fixed-rate payments over the life of the agreements without exchange of the underlying notional amount.
The Company entered into an interest rate swap agreement in May 2022 that pays fixed, receives variable to modify the interest rate characteristics of term loan debt from variable to fixed in order to reduce the impact of changes in future cash flows due to market interest rate changes. The swap agreement has a notional amount of $230,000, a fixed rate of 2.8% and a termination date of August 31, 2025. During the quarter ended September 30, 2023, the Company and the counterparty amended the floating rate of the swap agreement from term LIBOR to term SOFR due to the cessation of LIBOR. At December 31, 2024 and 2023, the interest rate swap had a fair value of $2,213 and $5,624, respectively. The gross fair value recognized in accumulated other comprehensive income was $2,213 and $5,624 at December 31, 2024 and 2023, respectively. Interest expense (income) on derivative instruments recognized in the Company’s consolidated statements of operations and comprehensive income (loss) were $(5,751), $(5,295), and $25 for the years ended December 31, 2024, 2023, and 2022, respectively.
The Company uses derivatives to manage certain interest exposures and designated all the derivatives as cash flow hedges. The Company records derivatives at fair value on its consolidated balance sheets. Changes in the fair value of derivatives designated as cash flow hedges are recorded as a component of accumulated other
comprehensive income (loss). Those amounts are reclassified into interest expenses in the same period during which the hedged transactions impact earnings.
The notional amounts and fair values, locations of derivative instruments in the consolidated balance sheets as of December 31, 2024 were as follows:
| | | | | | | | | | | | | | |
| Interest rate swap derivative designated as cash flow hedging instruments: | | 2024 | | 2023 |
| | | | |
| | (In thousands) |
| Notional amounts | | $ | 230,000 | | | $ | 230,000 | |
| Prepaid expenses and other current assets | | $ | 2,213 | | | $ | 4,473 | |
| Other long-term assets | | $ | — | | | $ | 1,151 | |
The net amount of deferred gains related to derivative instruments designated as cash flow hedges that is expected to be reclassified from accumulated other comprehensive gains into earnings over the next twelve months is $2,213.
(n) Warranty
The Company includes an assurance commitment warranting the application software products will perform in accordance with written user documentation and the agreements negotiated with customers. Since the Company does not customize its applications software, warranty costs are insignificant and expensed as incurred.
(o) Earnings per Share
Basic earnings per common share is computed by dividing the net earnings by the weighted-average number of shares outstanding during the reporting period, without consideration for potentially dilutive securities. Diluted earnings per share is computed by dividing the net earnings attributable to stockholders by the weighted-average number of shares and dilutive securities outstanding during the period.
(p) Income Taxes
The Company accounts for income taxes under the asset and liability method. Under this method, the amount of taxes currently payable or refundable is accrued, and deferred tax assets and liabilities are recognized for the estimated future tax consequences attributable to differences between the financial reporting and tax basis of existing assets and liabilities. Deferred tax assets also include realizable tax losses and tax credit carryforwards.
The deferred tax assets may be reduced by a valuation allowance, which is established when it is more likely than not that some portion or all of the deferred tax assets will not be realized. In addition, management is required to evaluate all available evidence, both positive and negative, when making its judgment to determine whether to record a valuation allowance for a portion, or all, of its deferred tax assets. Deferred tax assets and liabilities are measured using enacted income tax rates in effect for the year in which those temporary differences are expected to be recovered or settled. The effect on deferred tax assets and liabilities of a change in income tax rate is recognized in the period that includes the enactment date.
Uncertainty in Income Taxes
The Company accounts for uncertainty in income taxes using a two-step approach. The first step requires the Company to conclude that a tax position, based solely on its technical merits, is more likely than not to be sustained upon examination by a tax authority. The second step requires the Company to measure the largest amount of benefit, determined on a cumulative probability basis, that is more likely than not to be realized upon ultimate settlement with tax authority. The Company recognizes the effect of income tax positions only if those
positions are more likely than not of being sustained. Changes in recognition or measurement are reflected in the period in which the change in judgment occurs. Further, the benefit to be recorded in the consolidated financial statements is the amount most likely to be realized assuming a review by the tax authorities having all relevant information and applying current conventions. The Company's policy is to recognize interest and penalties related to income tax positions taken as a component of the provision for income taxes.
The Company assessed its uncertain tax positions and determined that a liability of $7,411 and $2,708 was required to be recorded for uncertain tax positions as of December 31, 2024 and 2023, respectively. Uncertain tax positions relate primarily to federal and state R&D credits and certain net operating losses. The Company's policy is to recognize interest and penalties as a component of the provision for income taxes. For December 31, 2024 and 2023, the Company recognized interest of $0.1 million and $0.1 million, respectively, and no penalties. The Company does not anticipate any significant changes to its uncertain tax positions during the next twelve months. U.S. federal income tax returns are generally subject to examination for a period of three years after the filing of the return. However, the Internal Revenue Service can audit the NOLs generated in respective years in the years that the NOLs are utilized. State income tax returns are generally subject to examination for a period of three to six years after the filing of the respective tax return. The state impact of any federal changes remains subject to examination by various states for a period of up to one year after formal notification to the states. Foreign income tax returns are generally subject to examination based on the tax laws of the respective jurisdictions.
(q) Revenue Recognition
In accordance with ASC Topic 606, “Revenue from Contracts with Customers”, the Company determines revenue recognition through the following steps:
i.Identification of the contract, or contracts, with a customer
ii.Identification of the performance obligations in the contract
iii.Determination of the transaction price
iv.Allocation of the transaction price to the performance obligations in the contract
v.Recognition of revenue when, or as, the Company satisfies a performance obligation
The Company’s revenue consists of fees for perpetual and term licenses for its software products, post- contract customer support (referred to as maintenance), software as a service (“SaaS”), and professional services including training and other revenue. Revenue is recognized upon transfer of control of promised products or services to customers in an amount that reflects the consideration to which the Company expects to be entitled in exchange for promised goods or services.
The following describes the nature of the Company’s primary types of revenues and the revenue recognition policies as they pertain to the types of transactions the Company enters into with its customers.
Consulting Service Revenues
The Company’s primary professional services offering includes consulting services, which may be either strategic consulting services, reporting and analysis services, regulatory writing services, or any combination of the three. The Company’s professional services contracts are either time-and-materials or fixed fee. Services revenues are generally recognized over time as the services are performed. Generally, these services are delivered to customers electronically.
Revenue from time-and-material contracts is recognized on an output basis as labor hours are delivered and/or direct expenses are incurred. Revenues for fixed price services are generally recognized over time applying input methods to estimate progress to completion. Accordingly, the number of resources being paid for and varying lengths of time they are being paid for, determine the measure of progress.
Software Licenses
Software license revenue consists primarily of sales of software licenses downloaded and installed by our customers on their own hardware. The license period is generally one year or less and includes an insignificant amount of customer support to assist the customer with the software. Software license performance obligations are generally recognized upfront at the point in time when the software license has been delivered.
Software as a Service (SaaS) Revenue
SaaS revenue consists of subscription fees for access to, and related support for, the Company’s cloud-based solutions. The Company typically invoices subscription fees in advance in annual installments. The invoice is initially deferred and revenue is recognized ratably over the life of the contract. The Company’s software contracts do not typically include variable consideration or options for future purchases that would not be similar to the original goods.
Software Services
Maintenance services agreements on perpetual software consist of fees for providing software updates and for providing technical support for software products for a specified term. Revenue allocated to maintenance services is recognized ratably over the contract term beginning on the delivery date of each offering. Maintenance contracts generally have a term of one year. While transfer of control of the software training and implementation performance obligations are over time, the services are typically started and completed within a few days. Due to the quick nature of the performance obligation from start to finish and the insignificant amounts, the Company recognizes any software training or implementation revenue at the completion of the service. Any unrecognized portion of amounts paid in advance for licenses and services is recorded as deferred revenue.
Arrangements with Multiple Performance Obligations
For contracts with multiple performance obligations, such as a software license plus software training, implementation, and/or maintenance/support, or in contracts where there are multiple software licenses, the Company determines if the products or services are distinct and allocates the consideration to each distinct performance obligation on a relative SSP basis. The delivery of a particular type of software and each of the user licenses would be one performance obligation. Additionally, any training, implementation, or support and maintenance promises as part of the software license agreement would be considered separate performance obligations, as those promises are distinct and separately identifiable from the software licenses. The payment terms in these arrangements are less than one year such that there is no significant financing component to the transaction.
Contract Balances
The timing of revenue recognition, billings and cash collections results in billed accounts receivable, unbilled receivables (contract assets), and customer advances and deposits (deferred revenue, contract liabilities) on the consolidated balance sheets. Amounts are billed as work progresses in accordance with agreed-upon contractual terms, either at periodic intervals (e.g., quarterly or monthly) or upon achievement of contractual milestones.
Contract assets relate to the Company’s rights to consideration for performance obligations satisfied but not billed at the reporting date on contracts (i.e., unbilled revenue, a component of accounts receivable in the Consolidated Balance Sheets). Contract assets are billed and transferred to customer accounts receivable when the rights become unconditional. The Company typically invoices customers for term licenses, subscriptions, maintenance and support fees in advance with payment due before the start of the subscription term, ranging from one to three years. The Company records the amounts collected in advance of the satisfaction of performance obligations, usually over time, as a contract liability or deferred revenue. Invoiced amounts for non-cancelable services starting in future periods are included in contract assets and deferred revenue. The portion of deferred revenue that will be recognized within 12 months is recorded as current deferred revenue, and the remaining portion is recorded as deferred revenue in the consolidated balance sheets.
Contract balances at December 31, 2024 and 2023 were as follows:
| | | | | | | | | | | | | | | | | |
| YEAR ENDED DECEMBER 31, |
| 2024 | | 2023 | | 2022 |
| | | | | |
| (In thousands) |
| Contract assets | $ | 13,454 | | | $ | 10,405 | | | $ | 11,309 | |
| Contract liabilities | $ | 78,878 | | | $ | 61,748 | | | $ | 55,024 | |
During 2024, the Company recognized revenue of $60,678 related to contract liabilities at December 31, 2023.
The unsatisfied performance obligation as of December 31, 2024 was approximately $135,103. We expect to recognize approximately $114,239 or 84.6% of this revenue over the next 12 months and the remainder thereafter.
Deferred Contract Acquisition Costs
Under ASC Topic 606, sales commissions paid to the sales force and the related employer payroll taxes, collectively deferred contract acquisition costs, are considered incremental and recoverable costs of obtaining a contract with a customer.
The Company recognizes an asset for the incremental costs of obtaining a contract with a customer if the Company expects the benefit of those costs to be longer than one year. The Company has determined that certain sales incentive programs meet the requirements to be capitalized. The costs capitalized are primarily sales commissions for our sales force personnel. Capitalized costs to obtain a contract are amortized on a straight-line basis over the expected period of benefit. Amortization of capitalized costs are included in sales and marketing expense in our consolidated statements of operations and comprehensive income (loss). Capitalized contract acquisition costs were $873 and $655 as of December 31, 2024 and 2023, respectively, and were included in prepaid expenses and other current assets in the consolidated balance sheets.
Grant Revenue
The Company receives grant funding for certain specific projects from time to time. These grants specify the funds provided are to be used exclusively to satisfy the deliverables outlined in the grant agreements. In these agreements, both involved parties receive and sacrifice approximately commensurate value so these are accounted for as exchange transactions and revenue is recognized according to ASC Topic 606. The grant funding is generally provided near contract inception so a contract liability is initially recorded and revenue is recognized as the performance obligations are satisfied over time.
Sources and Timing of Revenue
The Company’s performance obligations are satisfied either over time or at a point in time. The following table presents the Company’s revenue by timing of revenue recognition to understand the risks of timing of transfer of control and cash flows:
| | | | | | | | | | | | | | | | | |
| YEAR ENDED DECEMBER 31, |
| 2024 | | 2023 | | 2022 |
| | | | | |
| (In thousands) |
| Software licenses transferred at a point in time | $ | 54,773 | | | $ | 49,754 | | | $ | 46,139 | |
| Software licenses transferred over time | 100,923 | | | 81,923 | | | 69,327 | |
| Service revenues earned over time | 229,452 | | | 222,660 | | | 220,178 | |
| Total | $ | 385,148 | | | $ | 354,337 | | | $ | 335,644 | |
(r) Equity-Based Compensation
The Company measures equity-based compensation at fair value and recognizes the expense over the vesting period. Forfeitures are recognized as they occur for all awards. The fair value of restricted stock, restricted stock units, and performance stock units are primarily determined by the market price of our common stock on the date of grant. For a specific group of performance stock units, a Monte Carlo simulation model was used to estimate the fair value. Compensation costs for our restricted stock and restricted stock units are recognized on a straight-line basis over the requisite service period. Performance stock units with a graded vesting schedule are recognized using graded vesting attribution approach. A performance stock unit represents a right to receive a certain number of shares of common stock based on the achievement of corporate performance goals and continued employment during the vesting period. At each reporting period, we reassess the probability of the achievement of such corporate performance goals and any increase or decrease in equity-based compensation expense resulting from an adjustment in the estimated shares to be released is treated as a cumulative catch-up in the period of adjustment.
Compensation costs for our legacy Class B Profits Interest Unit (the “Class B Units”), issued by former parent company, that vested based on continued service requirements and the restricted stock into which they were exchanged are recognized on a straight-line basis over the requisite service period. Compensation costs for our restricted stock exchanged for our legacy Class B Units with performance vesting conditions are recognized using the accelerated attribution approach. Compensation costs for our restricted stock units are recognized on a straight-line basis over the requisite service period.
(s) Comprehensive Income (Loss)
FASB ASC 220, “Comprehensive Income,” (“ASC Topic 220”) establishes standards for reporting of comprehensive income and its components (revenue, gains, and losses) in a full set of general-purpose financial statements. ASC Topic 220 requires that all components of comprehensive income, including net income, be reported in a financial statement that is displayed with the same prominence as other financial statements. Comprehensive income (loss) is defined as the change in equity during a period from transactions and other events and circumstances from non-owner sources. Net income (loss) and other comprehensive income (loss), including foreign currency translation adjustments, and changes in fair value of derivative instruments (interest rate swap agreements) designated as cash flow hedges, shall be reported to arrive at comprehensive income (loss). Comprehensive income (loss) is displayed in the consolidated statements of operations and comprehensive income (loss).
The components of other comprehensive income (loss) consisted of the net of tax foreign currency translation adjustments totaling $(3,247), $2,696 and $(10,490), respectively, and the changes in fair value of interest rate swap, totaling $(2,584), $(2,059), and $6,186 for the years ended December 31, 2024, 2023, and 2022, respectively.
(t) Reclassification
Certain previously reported amounts in the consolidated financial statements have been reclassified to conform to the current year presentation.
3. Concentrations of Credit Risk
Financial instruments that potentially subject the Company to concentrations of credit risk have consisted principally of cash and cash equivalent investments and trade receivables. The Company invests available cash in bank deposits, investment-grade securities, and short-term interest-producing investments, including government obligations and other money market instruments. At December 31, 2024 and 2023, the investments were bank deposits, overnight sweep accounts, and money market funds. The Company has adopted credit policies and standards to evaluate the risk associated with sales that require collateral, such as letters of credit or bank guarantees, whenever deemed necessary. Management believes that any risk of loss is significantly reduced due to the nature of the customers and distributors with which the Company does business.
As of December 31, 2024 and 2023, no customer accounted for more than 10% of the Company’s accounts receivable. For the years ended December 31, 2024, 2023, and 2022, no customer accounted for more than 10% of the Company’s revenues.
4. Business Combinations
Acquisitions have been accounted for using the acquisition method of accounting pursuant to FASB ASC 805, “Business Combinations” (“ASC Topic 805”). Amounts allocated to the purchased assets and liabilities assumed are based upon the total purchase price and the estimated fair values of such assets and liabilities on the effective date of the purchase as determined by an independent third party. The results of operations have been included in the Company’s consolidated financial statements prospectively from the date of acquisition.
INDS
On January 3, 2022, the Company completed the acquisition of INDS for a total consideration of $8,048, which qualified as a business combination. The business combination was not significant to the Company’s consolidated financial statements. Based on the Company’s purchase price allocation, approximately $2,380, $1,040, $100, and $2,910 of the purchase price was assigned to customer relationships, developed technology, non-compete agreements, and goodwill, respectively.
Vyasa Analytics, LLC (“Vyasa”)
On December 28, 2022, the Company completed the acquisition of Vyasa, a company that provides an AI powered, scalable deep learning software and analytics platform for organizations within healthcare and life sciences, higher education and state and local governments for total estimated consideration of $29,276. The business combination was not significant to the Company’s consolidated financial statements.
Based on the Company’s purchase price allocation, approximately $11,400, $1,500, $120, $80 and $16,589 of the purchase price was assigned to developed technology, customer relationships, trademarks, non-compete agreements and goodwill, respectively.
The total estimated consideration includes a portion of contingent consideration that is payable over the next three years following the acquisition in a combination of 70% cash and 30% Certara common stock. Future payments of contingent consideration are based on achieving certain eligible revenue thresholds for each of the twelve-month periods ended December 31, 2023, 2024, and 2025. In December 2023, the Company modified the acquisition agreement and revised the thresholds for eligible revenues. Potential payments range from $0 to $60,000 over the three years period. The fair value of the contingent consideration was estimated to be $19,813 as of the acquisition date.
For the year ended December 31, 2024, the Company paid contingent consideration of $12,356, consisting of $8,649 in cash and $3,707 in Company stock. At December 31, 2024 and 2023, the contingent consideration was remeasured to $43,939 and $45,249, respectively, resulting in fair value adjustments of $11,046 and $25,436, respectively. These adjustments were recorded in G&A expenses on the accompanying consolidated statement of operations and comprehensive income (loss).
Drug Interaction Solutions, University of Washington ("DIDB")
On June 20, 2023, the Company entered into an asset purchase agreement with the University of Washington and completed the acquisition of DIDB, including the Drug Interaction Database and related products, from the University of Washington for a total estimated consideration of $8,340. The business combination was not significant to the Company’s consolidated financial statements.
The total estimated consideration includes a portion of contingent consideration that is payable over the next two years following the acquisition in cash, not to exceed $2,000. Future payments of contingent consideration are based on eligible revenue for the period from July 1, 2023 through June 30, 2025. The fair value of the contingent consideration was estimated to be $790 as of the acquisition date. At December 31, 2024 and 2023, the contingent consideration was remeasured to zero and $132, respectively, resulting in negative fair value adjustments of $132 and $658, respectively, and recorded in G&A on the accompanying consolidated statement of operations and comprehensive income (loss).
Based on the Company’s purchase price allocation, approximately $330, $5,600, $360, and $2,289 of the purchase price were assigned to trademarks, database content/technology, customer relationships and goodwill, respectively. The Company expects goodwill to be fully deductible for U.S. federal income tax purposes due to the fact the acquisition was treated as an asset acquisition under the relevant sections of the Internal Revenue Code (“IRC”).
Formedix Limited ("Formedix")
On October 10, 2023, the Company completed the acquisition of Formedix, a provider of clinical metadata repository and clinical trial automation software, for total estimated consideration of $41,389. The business combination was not material to the Company’s consolidated financial statements.
The total estimated consideration includes a portion of contingent consideration that is payable over the next two years following the acquisition, in cash, not to exceed $9,000. The fair value of the contingent consideration related to revenue threshold was estimated to be $4,380 as of the acquisition date. Future payments of contingent consideration are based on achieving certain eligible revenue targets for each of the twelve-month periods ended December 31, 2023 and 2024, respectively. Additionally, the Company agreed to further contingent consideration based on the resolution of certain tax contingencies. In total, the fair value of the contingent consideration was estimated to be $5,161 as of the acquisition date.
Based on the Company’s purchase price allocation, approximately $11,700, $3,100, and $25,062 of the purchase price were assigned to developed technology, customer relationships and goodwill, respectively. The
Company does not expect goodwill to be deductible due to the fact the Company treated the acquisition as a stock acquisition under the relevant sections of the IRS.
For the year ended December 31, 2024, the Company paid contingent consideration of $1,777. At December 31, 2024 and 2023, the contingent consideration related to eligible revenue was remeasured to zero and $3,696, respectively, resulting in negative fair value adjustments of $1,919 and $684, respectively, and recorded in G&A expenses on the accompanying consolidated statement of operations and comprehensive income (loss). In addition, as of December 31, 2024, the contingent consideration related to tax contingencies was $529.
Applied BioMath, LLC ("ABM")
On December 12, 2023, the Company completed the acquisition of ABM, an industry leader in providing model-informed drug discovery and development support to help accelerate and de-risk therapeutic research and development, for total estimated consideration of $36,594. The business combination was not material to the Company’s consolidated financial statements.
Based on the Company’s preliminary purchase price allocation, approximately $4,600, $800, $13,700 and $15,872 of the purchase price were assigned to developed technology, non-compete agreements, customer relationships and goodwill, respectively. The Company expects goodwill to be fully deductible for U.S. federal income tax purposes due to the fact the Company treated the acquisition as an asset acquisition under the relevant sections of the IRS.
The total estimated consideration includes a portion of contingent consideration that is payable over the next two years following the acquisition in cash, not to exceed $17,550. Future payments of contingent consideration are based on achieving certain eligible revenue targets for each of the twelve-month periods ended December 31, 2023 and 2024. The fair value of the contingent consideration was estimated to be $5,357 as of the acquisition date. For the year ended December 31, 2024, the Company paid contingent consideration of $4,730. At December 31, 2024 and 2023, the contingent consideration was remeasured to zero and $5,380, respectively, resulting in fair value adjustments of $(650) and $23, respectively. These adjustments were recorded in G&A expenses on the accompanying consolidated statement of operations and comprehensive income (loss).
The contingent considerations for all acquisitions were classified as liability and included in accrued expense and other long term liabilities on the Company’s consolidated balance sheet. The contingent consideration related to eligible revenues that are remeasured on a recurring basis at fair value for each reporting period. Any changes in the fair value of these contingent liabilities are included in the earnings in the consolidated statements of operations and comprehensive income (loss).
Chemaxon, Kft.("Chemaxon")
On October 1, 2024, the Company acquired 100% of the equity of Chemaxon, a leading cheminformatics company that provides platforms, applications, and solutions to handle chemical entities in life sciences, biotechnology, agrochemicals, new materials, education, and other research industries. The acquisition strategically positions Certara in the drug discovery biosimulation market at scale. It complements Certara’s existing biosimulation portfolio which is widely used in later phases of drug development.
The acquisition of Chemaxon was accounted for as a purchase in accordance with ASC Topic 805, “Business Combinations”, which requires allocation of the purchase price to the estimated fair values of assets and liabilities acquired in the transaction.
The following table summarizes the fair value of the consideration paid as well as the fair values of the assets acquired and liabilities assumed as of the date of the acquisition:
| | | | | |
| Fair value of consideration: | Chemaxon |
| Cash paid to sellers | $ | 87,401 | |
| Cash paid to escrow | 9,000 | |
| Total consideration | $ | 96,401 | |
| |
| Assets acquired and liabilities assumed: | |
| Cash and cash equivalents | $ | 4,543 | |
| Intangible assets | 50,230 | |
| Goodwill | 46,483 | |
| All other assets | 6,633 | |
| Deferred revenue | (4,051) | |
| Deferred income taxes | (3,788) | |
| All other liabilities | (3,649) | |
| Net assets acquired | $ | 96,401 | |
•All other assets includes accounts receivable, prepaid expense, operating right of use assets, etc.; All other liabilities include accounts payable, operating lease liabilities, accrued expense.
The current purchase price allocation for Chemaxon is preliminary. The primary areas of the preliminary purchase price allocation that are not yet finalized relate to the value of deferred taxes and residual goodwill. The deferred tax balance and residual goodwill are not yet finalized due to the need for additional information and analysis to complete the allocation between relevant countries. The Company expects to continue to obtain information to assist in determining the fair values of the net assets acquired at the acquisition date during the measurement period. Any adjustments to the preliminary purchase price allocation identified during the measurement period, which will not exceed one year from the acquisition date, will be accounted for prospectively. As of December 31, 2024, an adjustment of approximately $531 to finalize the purchase consideration had not yet been settled with the seller.
The acquisition was structured as a stock acquisition for income tax purposes, therefore the Company’s tax basis in Chemaxon’s identifiable assets reflects the historical basis in the acquired assets, which resulted in deferred taxes being recorded in purchase accounting. The Company does not expect goodwill to be deductible due to the fact the Company treated the acquisition as a stock acquisition under the relevant sections of the IRS.
In connection with these transactions, the company recorded the following Intangible Assets.
| | | | | |
| Intangible assets | (in thousands) |
| Trademarks | $ | 2,900 | |
| Non-compete agreement | 330 | |
| Customer relationships | 11,000 | |
| Developed technology | 36,000 | |
| Total | $ | 50,230 | |
The fair value of the intangible assets is based on significant inputs that are not observable in the market and, therefore, represent Level 3 measurements within the fair value measurement hierarchy. The fair value of the trademarks (Relief from Royalty Rate method), non-compete agreements (Incremental Cash Flow method), developed technology (Multi-Period Excess Earnings method) and customer relationships (Distributor method) was determined under the income approach.
Goodwill of $46,483 was recorded to reflect the excess of the purchase price over the estimated fair value of the net identifiable assets acquired. The excess of the purchase prices over the fair values of the acquired business's net assets represents cost and revenue synergies specific to the Company, as well as non-capitalizable intangible assets, such as assembled and trained workforces acquired, and has been allocated to goodwill.
The Company incurred $1,652 of transaction costs related to this acquisition, which are included in G&A expenses in the consolidated statement of operations and comprehensive income (loss) for the year ended December 31, 2024.
The results of operations of the acquired business and the fair value of the acquired assets and liabilities assumed are included in the Company’s consolidated financial statements with effect from the date of the acquisition. The Company’s consolidated statement of operations for the year ended December 31, 2024, includes revenues of $6,561 and a net loss of $1,127 which includes the effects of purchase accounting adjustments, primarily changes in amortization of intangible assets.
Supplemental pro forma information
The following unaudited pro forma combined financial information assumes that the acquisition of Chemaxon occurred on January 1, 2023.
| | | | | | | | | | | | | | |
| | For the year ended December 31 |
| | 2024 | | 2023 |
| | (In thousands) |
| Revenue | | $ | 401,710 | | | $ | 376,775 | |
| Net loss | | $ | (21,984) | | | $ | (64,108) | |
The unaudited pro forma combined results for the years ended December 31, 2024 and 2023 primarily include the following pro forma adjustment:
*Revenue was adjusted by $(244) and $1,494 for the years ended December 31, 2024 and 2023, respectively.
*Incremental amortization expense, net of tax, related to Chemaxon purchased intangible assets was $2,317 and $3,712 for the years ended December 31, 2024 and 2023, respectively.
5. Prepaid expenses and other current assets and other long-term assets
Prepaid and other current assets consisted of the following:
| | | | | | | | | | | |
| DECEMBER 31, |
| 2024 | | 2023 |
| | | |
| (In thousands) |
| Prepaid expenses | $ | 8,315 | | | $ | 6,363 | |
| Income tax receivable | 9,341 | | | 3,395 | |
| Research and development tax credit receivable | 7,554 | | | 5,004 | |
| Current portion of interest rate swap asset | 2,213 | | | 4,473 | |
| Other current assets | 2,057 | | | 1,158 | |
| Prepaid expenses and other current assets | $ | 29,480 | | | $ | 20,393 | |
Other long-term assets consisted of the following:
| | | | | | | | | | | |
| DECEMBER 31, |
| 2024 | | 2023 |
| | | |
| (In thousands) |
| Long-term deposits | $ | 1,457 | | | $ | 1,451 | |
| Interest rate swap asset - long term | — | | | 1,151 | |
| Deferred financing cost | 574 | | | 451 | |
| Total other long-term assets | $ | 2,031 | | | $ | 3,053 | |
6. Property and Equipment
Property and equipment consisted of the following:
| | | | | | | | | | | |
| DECEMBER 31, |
| 2024 | | 2023 |
| | | |
| (In thousands) |
| Computer and office equipment | $ | 5,161 | | | $ | 4,898 | |
| Furniture | 1,686 | | | 2,489 | |
| Purchased software for internal use | 219 | | | 717 | |
| Leasehold improvements | 970 | | | 1,198 | |
| Property and equipment | 8,036 | | | 9,302 | |
| Less: Accumulated depreciation and amortization | (5,869) | | | (6,632) | |
| Property and equipment, net | $ | 2,167 | | | $ | 2,670 | |
Depreciation and amortization expense was $1,994, $1,552, and $1,731 for the years ended December 31, 2024, 2023, and 2022, respectively.
7. Goodwill and Intangible Assets
The following table presents the Company’s intangible assets (other than goodwill) and the related amortization:
| | | | | | | | | | | | | | | | | | | | | | | | | | | | | | | | | | | | | | | | | |
| WEIGHTED
AVERAGE
AMORTIZATION
PERIOD
(IN YEARS) | | DECEMBER 31, 2024 | | DECEMBER 31, 2023 |
| | GROSS
CARRYING
AMOUNT | | ACCUMULATED
AMORTIZATION | | NET | | GROSS
CARRYING
AMOUNT | | ACCUMULATED
AMORTIZATION | | NET |
| | | | | | | | | | | | | |
| (In thousands) |
| Acquired software | 10.81 | | $ | 193,257 | | | $ | (46,261) | | | $ | 146,996 | | | $ | 160,696 | | | $ | (32,002) | | | $ | 128,694 | |
| Capitalized software development costs | 2.60 | | 74,684 | | | (46,756) | | | 27,928 | | | 55,640 | | | (35,227) | | | 20,413 | |
| Non-compete agreements | 4.14 | | 2,634 | | | (1,630) | | | 1,004 | | | 2,358 | | | (1,439) | | | 919 | |
| Trade names | 13.09 | | 59,461 | | | (18,472) | | | 40,989 | | | 56,823 | | | (15,329) | | | 41,494 | |
| Customer relationships | 8.36 | | 493,815 | | | (225,549) | | | 268,266 | | | 484,873 | | | (189,454) | | | 295,419 | |
| Patents | 3.00 | | 172 | | | (141) | | | 31 | | | 175 | | | (71) | | | 104 | |
| Total | | | $ | 824,023 | | | $ | (338,809) | | | $ | 485,214 | | | $ | 760,565 | | | $ | (273,522) | | | $ | 487,043 | |
Amortization expense for intangible assets was $66,039, $54,519, and $50,739 for the years ended December 31, 2024, 2023 and 2022, respectively. Amortization expense of $14,440, $10,546, and $9,310 was recorded in cost of revenues for the years ended December 31, 2024, 2023, and 2022, respectively.
The remaining amortization of $51,599, $43,973, and $41,429 was recorded in operating expenses for the years ended December 31, 2024, 2023, and 2022, respectively.
Based on the current amount of intangibles subject to amortization, the estimated annual amortization expense for each of the succeeding five years and thereafter is as follows:
| | | | | | | | | | | | | | | | | | | | | | | | | | | | | | | | | | | | | | | | | |
| ACQUIRED
SOFTWARE | | CAPITALIZED
SOFTWARE
DEVELOPMENT
COSTS | | NON-
COMPETE
AGREEMENTS | | TRADE
NAMES | | PATENTS | | CUSTOMER
RELATIONSHIPS | | TOTAL |
| | | | | | | | | | | | | |
| (In thousands) | | |
| 2025 | $ | 16,731 | | | $ | 13,610 | | | $ | 256 | | | $ | 3,242 | | | $ | 10 | | | $ | 34,263 | | | $ | 68,112 | |
| 2026 | 16,506 | | | 9,162 | | | 256 | | | 3,242 | | | 10 | | | 33,349 | | | 62,525 | |
| 2027 | 14,591 | | | 5,156 | | | 236 | | | 3,242 | | | 11 | | | 33,349 | | | 56,585 | |
| 2028 | 14,382 | | | — | | | 211 | | | 3,242 | | | — | | | 33,349 | | | 51,184 | |
| 2029 | 14,208 | | | — | | | 45 | | | 3,242 | | | — | | | 33,349 | | | 50,844 | |
| Thereafter | 70,578 | | | — | | | — | | | 24,779 | | | — | | | 100,607 | | | 195,964 | |
| Total | $ | 146,996 | | | $ | 27,928 | | | $ | 1,004 | | | $ | 40,989 | | | $ | 31 | | | $ | 268,266 | | | $ | 485,214 | |
Goodwill
The goodwill impairment test is performed at least annually at the reporting unit level. An interim test is performed when events or circumstances occur that may indicate that it is more likely than not that the fair value of any reporting unit may be less than its carrying value. For the years ended December 31, 2024, 2023, and 2022, the Company performed annual quantitative assessments of goodwill, with the most recent assessment performed on October 1, 2024. The annual quantitative assessments resulted in no impairment as the estimated fair value of each reporting unit exceeded its carrying value.
During the third quarter of 2023, the Company performed interim goodwill impairment tests for the prior regulatory writing reporting unit, which was integrated into the CDDS at the end of third quarter 2023. The fair
value of the regulatory writing reporting unit was determined to be less than its carrying value, resulting in a goodwill impairment charge of $46,984 for the reporting unit. The fair value of that reporting unit was estimated using a combination of the discounted cash flow method and the guideline public company method. The decline in the fair value of the regulatory writing reporting unit was driven by revised revenue growth and profitability forecasts resulting from certain reductions in our financial planning assumptions. These reductions were primarily attributable to a decrease in demand from certain customer groups for the legacy reporting unit. As the result, the Company recorded impairment charges of $46,984 for the year ended December 31, 2023. The Company did not recognize any goodwill impairment charges for the years ended December 31, 2024 and 2022.
A reconciliation of the change in the carrying value of goodwill is as follows:
| | | | | |
| (In thousands) |
| Balance, December 31, 2022 | $ | 717,743 | |
| Goodwill associated with 2023 business combinations | 43,223 | |
| Foreign currency translation | 2,351 | |
| Impairment expense | (46,984) | |
| Balance, December 31, 2023 | 716,333 | |
| Goodwill associated with 2024 business combination | 46,483 | |
| Foreign currency translation | (5,778) | |
| Balance, December 31, 2024 | $ | 757,038 | |
8. Accrued Expenses and Other Long-Term Liabilities
Accrued expenses consist of the following:
| | | | | | | | | | | |
| DECEMBER 31, |
| 2024 | | 2023 |
| | | |
| (In thousands) |
| Accrued compensation | $ | 31,045 | | | $ | 28,624 | |
| Legal and professional accruals | 2,886 | | | 3,913 | |
| Interest payable | 51 | | | 2,351 | |
| Income taxes payable | 430 | | | 1,010 | |
| Short-term contingent considerations | 20,887 | | | 18,410 | |
| Other | 1,152 | | | 2,471 | |
| Total accrued expenses | $ | 56,451 | | | $ | 56,779 | |
Other long-term liabilities consist of the following:
| | | | | | | | | | | |
| DECEMBER 31, |
| 2024 | | 2023 |
| | | |
| (In thousands) |
| Uncertain tax position liability | $ | 1,718 | | | $ | 2,381 | |
| Long - term contingent consideration | 23,581 | | | 36,828 | |
| Total other long-term liabilities | $ | 25,299 | | | $ | 39,209 | |
9. Long-Term Debt and Revolving Line of Credit
The Company has been a party to a Credit Agreement since August 2017 that provides for a senior secured term loan and commitments under a revolving credit facility (as amended, the “Credit Agreement”). On June 26, 2024, the Company entered into the Fifth Amendment to its Credit Agreement (the "Amendment"), which primarily (1) amended the principal amount of the term loan to $300,000 and its maturity date to June 26, 2031; and (2) extended the termination date of the $100,000 revolving credit commitment to June 26, 2029. The term loan under this Amendment has substantially the same terms as the existing term loans and revolving credit commitments. The Credit Agreement is collateralized by substantially all U.S. assets and stock pledges for the non-U.S. subsidiaries and contains various financial and nonfinancial covenants.
As multiple lenders syndicated funds under the credit agreements, the Company assessed whether existing debt was modified or extinguished, or if new debt was issued under GAAP guidelines. This evaluation was conducted separately for each lender's portion of the loans and commitments in the syndication, treating each lender's participation as if separate debt instruments existed. The Company either deferred and amortized debt issuance costs or recognized expenses or losses, according to the applicable accounting guidance for each category.
Borrowings under the Credit Agreement bear interest at a rate per annum equal to, at the election of the Borrowers, either (i) the Term SOFR rate, with a floor of 0.00% plus an applicable margin rate of 3.00% for the Term Loans and between 3.50% and 2.75% for loans under the Revolving Facility, depending on the applicable first lien leverage ratio, or (ii) an Alternate Base Rate (“ABR”), with a floor of 1.00%, plus an applicable margin rate of 2.00% for the Term Loans or between 2.50% and 1.75% for loans under the Revolving Facility, depending on the applicable first lien leverage ratio. The ABR is determined as the greatest of (a) the prime rate, (b) the federal funds effective rate, plus 0.50%, and (c) the Term SOFR rate plus 1.00%. Additionally, the Company is obligated to pay a commitment fee of the unused amount and other customary fees.
As of each of December 31, 2024 and 2023, available borrowings under the revolving lines of credits were $100,000.
The effective interest rate was 8.68% and 8.84% for the years ended December 31, 2024 and 2023, respectively, for the Credit Agreement. As discussed previously, the Company entered into interest rate swap agreements that fixed the interest rate.
Interest incurred on the Credit Agreement with respect to the term loan amounted to $25,785, $26,202, and $15,803 for the years ended December 31, 2024, 2023, and 2022, respectively. Accrued interest payable on the Credit Agreement with respect to the term loan amounted to $61 and $2,400 at December 31, 2024 and 2023, respectively, and is included in accrued expenses. Interest incurred on the Credit Agreement with respect to the revolving line of credit was $303, $257, and $257 for the years ended December 31, 2024, 2023, and 2022, respectively. There was $1 and $2 accrued interest payable on the revolving line of credit at December 31, 2024 and 2023, respectively.
Long-term debt consists of the following:
| | | | | | | | | | | |
| DECEMBER 31, |
| 2024 | | 2023 |
| | | |
| (In thousands) |
| Term loans | $ | 298,500 | | | $ | 294,450 | |
| Revolving line of credit | — | | | — | |
| Less: debt issuance costs | (3,075) | | | (3,213) | |
| Total | 295,425 | | | 291,237 | |
| Current portion of long-term debt | (3,000) | | | (3,020) | |
| Long-term debt, net of current portion and debt issuance costs | $ | 292,425 | | | $ | 288,217 | |
The principal amount of long-term debt outstanding as of December 31, 2024, matures in the following years:
| | | | | | | | | | | | | | | | | | | | | | | | | | | | | | | | | | | | | | | | | |
| 2025 | | 2026 | | 2027 | | 2028 | | 2029 | | Thereafter | | TOTAL |
| (In thousands) |
| Maturities | $ | 3,000 | | | $ | 3,000 | | | $ | 3,000 | | | $ | 3,000 | | | $ | 3,000 | | | $ | 283,500 | | | $ | 298,500 | |
The Credit Agreement requires the Company to make an annual mandatory prepayment as it relates to the Company’s Excess Cash Flow calculation. For the year ended December 31, 2024, the Company was not required to make a mandatory prepayment on the term loan. The Company is required to make a quarterly principal payment of $750 on the term loan starting September 30, 2024.
The fair values of the Company’s variable interest term loan and revolving line of credit are not significantly different than their carrying value because the interest rates on these instruments are subject to change with market interest rates.
10. Employee Benefit Plan
The Company established a defined contribution 401(k) plan covering all U.S. employees who are at least 21 years of age and who meet IRS requirements for plan eligibility. Employees may contribute to the plan up to 50% of their compensation, which may be further limited by law. In addition, based on IRS guidelines, certain employees are eligible to make an additional catch-up contribution. Employees are considered catch-up eligible with respect to a plan year if the participant turns age 50 by the end of the calendar year in which the plan year ends and meets IRS guidance. Catch-up contributions and guidance for eligibility are determined and set by the IRS annually. The Company matches employee contributions for a percentage of the employee’s deferral, not to exceed the first 6% of each employee’s compensation.
The Company also operates a Group Personal defined contribution plan (“Plan”) covering all U.K. employees. Employees are auto-enrolled in the plan who are at least 22 years of age and paid more than £10 a year of basic salary, up to the State Pension Age. However, all employees who are between the ages of 16 and 75 can elect to join the Plan. Employees may contribute to their personal pension account and then convert that account into income at retirement. The Company contributes an additional 8% of salary for those employees who have registered for the Plan, which exceeds their duties under U.K. auto-enrollment legislation.
The 401(k) and plan contributions made by the Company in the aggregate were $5,924, $5,382, and $4,746 for the years ended December 31, 2024, 2023, and 2022, respectively.
11. Commitments and Contingencies
Contingent consideration
In connection with certain of the Company's business acquisitions, the Company is required to pay additional consideration if the acquired businesses achieve certain eligible revenue thresholds for certain periods. Furthermore, the Company agreed to pay additional contingent consideration related to a business acquisition, contingent on the resolution of certain tax-related contingencies. The contingent liabilities were $44,468 and $55,238 at December 31, 2024 and 2023, respectively.
Legal proceedings
The Company does not have any pending or threatened litigation which, individually or in the aggregate, would have a material adverse effect on the consolidated financial statements as of December 31, 2024.
Assurance-type warranty
The Company includes an assurance commitment warranting the application software products will perform in accordance with written user documentation and the agreements negotiated with customers. Since the Company does not customize its applications software, warranty costs are insignificant and expensed as incurred.
For information related to commitments for future minimum lease payments, please see Note 13 – Leases.
12. Equity-Based Compensation
The Company’s equity-based compensation programs are intended to attract, retain and provide incentives for employees, officers and directors. The Company has the following stock-based compensation plans and programs.
Restricted Stock
The majority of the Company’s restricted stock awarded to its employees was originally issued on December 10, 2020 in exchange for the Class B Units of EQT, which was the former parent of the Company. Additionally, the Company granted replacement shares of restricted stock in connection with the 2021 Pinnacle acquisition, which had fully vested in 2024.
Share-based compensation for the restricted stock exchanged for the time-based Class B Units is recognized on a straight-line basis over the requisite service period of the award, which is generally five years. Share-based compensation for the restricted stock exchanged for the performance-based Class B Units is recognized using the accelerated attribution approach.
A summary of the restricted stock activities as of and for the year ended December 31, 2024 is shown below: | | | | | | | | | | | |
| SHARES | | WEIGHTED-AVERAGE
GRANT-DATE
FAIR VALUE |
| Non-vested restricted stock as of December 31, 2023 | 538,661 | | $ | 23.18 | |
| Granted* | 16,842 | | | 17.35 | |
| Vested* | (376,052) | | 23.03 | |
| Forfeited | (5,123) | | 23.00 | |
| Cancelled* | (16,842) | | 23.00 |
| Non-vested restricted stock as of December 31, 2024 | 157,486 | | $ | 22.94 | |
__________________________________ •The number of the restricted stock vested includes 3,959 shares that were withheld on behalf of employees to satisfy the statutory tax withholding requirements.
•During the year ended December 31, 2024, the Company modified certain awards for recipients, resulting in 16,842 shares assumed to be granted, vested, and cancelled for accounting purposes.
The Company did not authorize or issue any restricted stock during the year ended December 31, 2024. Equity-based compensation expense related to the restricted stock exchanged for performance-based Class B Units were $668, $801 and $2,537 for the years ended December 31, 2024, 2023 and 2022, respectively. At December 31, 2024, the total unrecognized equity-based compensation expenses related to outstanding restricted stock recognized using the accelerated attribution approach was $160. The unrecognized compensation expense for the category at December 31, 2024 is expected to be recognized over a weighted-average period of 8.1 months.
Equity-based compensation expense related to the time-based restricted stock were $928, $1,313 and $3,166 for the years ended December 31, 2024, 2023 and 2022, respectively. At December 31, 2024, the total unrecognized equity-based compensation expense related to outstanding restricted stock recognized using the straight-line attribution approach was $321. The unrecognized compensation expense for the category at December 31, 2024 is expected to be recognized over a weighted-average period of 8.2 months.
Equity-based employee compensation expenses related to the time-based restricted stock for the Pinnacle acquisition were $318, $983, and $1,169 for the years ended December 31, 2024, 2023, and 2022, respectively. At December 31, 2024, there was no unrecognized equity-based compensation expense related to outstanding restricted stock recognized using the straight-line attribution approach.
2020 Incentive Plan
In order to align the Company’s equity compensation program with public company practices, the Company’s Board of Directors adopted and stockholders approved the 2020 Incentive Plan. The 2020 Incentive Plan allows for grants of non-qualified stock options, incentive stock options, restricted stock, restricted stock units (“RSUs”), and performance stock units (“PSUs”) to employees, directors, officers, and consultants or advisors of the Company. The 2020 Incentive Plan allows for 20,000,000 shares (the “plan share reserve”) of common stock to be issued. No more than the number of shares of common stock equal to the plan share reserve may be issued in the aggregate pursuant to the exercise of incentive stock options. The maximum number of shares of common stock granted during a single fiscal year to any non-employee director, taken together with any cash fees paid to such non-employee director during the fiscal year, may not exceed $1,000,000 in total value, except for certain awards made to a non-executive chair of our Board of Directors. At December 31, 2024, there were 13,699,466 shares reserved for future issuance.
The plan share reserve will be increased on the first day of each fiscal year beginning with the 2022 fiscal year and ending after the tenth anniversary of the effective date in an amount equal to the lesser of (i) the positive difference, if any, between (x) 4.0% of the outstanding common stock on the last day of the immediately preceding fiscal year and (y) the plan share reserve on the last day of the immediately preceding fiscal year and (ii) a lower number of shares of our common stock as determined by our board of directors.
Restricted Stock Units (“RSUs”)
RSUs represent the right to receive shares of the Company’s common stock at a specified date in the future. During the year ended December 31, 2024, the Company granted 2,322,890 RSUs under the 2020 Incentive Plan that generally vest over an average three-year period. The fair value of the RSUs is based on the fair value of the underlying shares on the date of grant.
A summary of the Company’s RSU activity is as follow:
| | | | | | | | | | | |
| UNITS | | WEIGHTED-
AVERAGE
GRANT DATE
FAIR VALUE |
| Non-vested RSUs as of December 31, 2023 | 2,588,403 | | $ | 23.77 | |
| Granted* | 2,322,890 | | 17.62 | |
| Vested** | (1,278,002) | | 24.04 | |
| Forfeited | (386,604) | | 20.36 | |
| Cancelled* | (42,098) | | $ | 24.21 | |
| Non-vested RSUs as of December 31, 2024 | 3,204,589 | | $ | 19.61 | |
* The majority of shares granted during 2024 were issued under the 2020 Incentive Plan. During the year ended December 31, 2024, the Company modified awards for recipients, resulting in 42,098 shares assumed to be granted, vested, and cancelled for accounting purposes.
** The number of the RSUs vested included 462,339 shares that were withheld on behalf of employees to satisfy the statutory tax withholding requirements.
The weighted average grant date fair values per share of RSUs granted during 2024, 2023, and 2022 were $17.62, $23.35, and $21.98, respectively. The total fair value of RSUs vested during 2024, 2023, and 2022 were $30,723, $20,261, and $12,395, respectively.
Equity-based compensation expense related to the RSUs was $31,582, $26,734 and $19,012 for the years ended December 31, 2024, 2023, and 2022, respectively. At December 31, 2024, the total unrecognized equity-based compensation expense related to outstanding RSUs was $41,088, which is expected to be recognized over a weighted-average period of 22.6 months.
Performance Restricted Stock Units (“PSUs”)
PSUs are issued under the 2020 Incentive Plan and represent the right to receive shares of the Company’s common stock at a specified date in the future based on the satisfaction of various service conditions and the achievement of certain performance thresholds for individual PSU plans including year-over-year revenue growth, unlevered free cash flow growth, annual revenue, and annual EBITDA. The PSUs granted in 2023 and 2024 also contain market condition.
Equity-based compensation for the PSUs is only recognized to the extent a threshold is probable of being achieved and is recognized using the accelerated attribution approach. The Company will continue to assess the probability of each condition being achieved at each reporting period to determine whether and when to recognize compensation cost.
A summary of the Company's PSU activity as of and for the year ended December 31, 2024 is as follows:
| | | | | | | | | | | |
| UNITS | | WEIGHTED-
AVERAGE
GRANT DATE
FAIR VALUE |
| Non-vested PSUs as of December 31, 2023 | 849,467 | | $ | 24.84 | |
| Granted* | 338,445 | | 18.98 | |
| Vested** | (106,354) | | 22.91 | |
| Forfeited | (42,131) | | 21.23 | |
| Cancelled* | (394,050) | | $ | 27.09 | |
| Non-vested PSUs as of December 31, 2024 | 645,377 | | $ | 20.95 | |
* During 2024, the Company modified an award for a recipient, resulting in 6,651 shares assumed to be granted and cancelled for accounting purpose.
** The number of the PSUs vested included 46,785 shares that were withheld on behalf of employees to satisfy the statutory tax withholding requirements.
The weighted average grant date fair values per share of PSUs granted during 2024, 2023, and 2022 were $18.98 and $27.00, and $22.25, respectively. The total fair values of PSUs vested were $2,437, $5,269, $305 during 2024, 2023 and 2022, respectively.
Equity-based compensation expense related to the PSUs was $1,279, $(1,531), and $4,462 for the years ended December 31, 2024, 2023, and 2022, respectively. At December 31, 2024, the total unrecognized equity-based compensation expense related to outstanding PSUs was $759, which is expected to be recognized over a weighted-average period of 17.1 months.
The grant date fair values for PSU 2023 and 2024 were determined based on Monte Carlo price model and the valuation assumptions noted in the following table. | | | | | | | | | | | |
| Year Ended December 31, |
| 2024 | | 2023 |
| | | |
| Expected dividend yield | — | | — |
| Volatility | 52.2% - 54.7% | | 61.4% - 61.9% |
| Expected term (years) | 1.78 - 2.78 | | 2.54 - 2.74 |
| Risk-free interest rate | 4.36%- 4.64% | | 3.89%- 4.29% |
In March 2023, the Company modified the 2022 PSU agreement to adjust criteria regarding the inclusion of merger and acquisition revenues in the second and third years of the performance period, as well as the corresponding base years. This change affected 12 participants at the time of the modification. As of December 31, 2024, the Company did not recognize any lifetime incremental cost associated with this modification, as it will not result in the issuance of incremental shares to participants.
Equity-based compensation expense
The following table summarizes the components of total equity-based compensation expense included in the consolidated statements of operations and comprehensive income (loss) for each period presented:
| | | | | | | | | | | | | | | | | |
| YEAR ENDED DECEMBER 31, |
| 2024 | | 2023 | | 2022 |
| | | | | |
| (In thousands) |
| Cost of revenues | $ | 13,323 | | | $ | 11,545 | | | $ | 7,494 | |
| Sales and marketing | 3,481 | | | 1,763 | | | 2,091 | |
| Research and development | 5,233 | | | 6,316 | | | 5,829 | |
| General and administrative expenses | 12,737 | | | 8,676 | | | 14,931 | |
| Total | $ | 34,774 | | | $ | 28,300 | | | $ | 30,345 | |
The tax benefit related to compensation expense was $5,051, $3,797, and $1,933 for the years ended December 31, 2024, 2023, and 2022.
13. Leases
The Company leases certain office facilities and equipment under non-cancelable operating leases with remaining terms from less than one to ten years.
Operating lease ROU assets are included in other assets in the consolidated balance sheets. With respect to operating lease liabilities, current operating lease liabilities are included in current liabilities and non-current operating lease liabilities are included in long-term liabilities in the consolidated balance sheets.
The following table presents information about the operating lease right-of-use assets and lease liabilities as well as lease term and discount rates:
| | | | | | | | | | | | | | |
| Lease right-of-use assets, lease liabilities, lease term and discount rate: | | December 31, 2024 | | December 31, 2023 |
| | | | |
| | (In thousands) |
| Lease right of use assets | | | | |
| Operating leases | | $ | 13,841 | | | $ | 9,604 | |
| | $ | 13,841 | | | $ | 9,604 | |
| Lease liabilities | | | | |
| Current | | | | |
| Operating leases | | $ | 5,306 | | | $ | 4,375 | |
| Noncurrent | | | | |
| Operating leases | | 11,166 | | | 6,955 | |
| | $ | 16,472 | | | $ | 11,330 | |
| | | | | | | | | | | |
| For the year ended
December 31, 2024 | | For the year ended
December 31, 2023 |
| Weighted-average remaining lease term (years): | | | |
| Operating leases | 5.4 | | 3.5 |
| | | |
| Weighted-average discount rate: | | | |
| Operating leases | 5.5 | % | | 3.4 | % |
The components of total lease cost were as follows:
| | | | | | | | | | | |
| December 31, 2024 | | December 31, 2023 |
| | | |
| (In thousands) |
| Operating lease cost | $ | 5,454 | | | $ | 4,813 | |
| Short-term lease cost | 453 | | | 740 | |
| Variable lease cost | (7) | | | (190) | |
| Sublease income | (217) | | | (399) | |
| Finance lease cost: | | | |
| Amortization of right-of-use assets | — | | | 46 | |
| Total lease cost | $ | 5,683 | | | $ | 5,010 | |
Supplemental cash flow and non-cash flow information was as follows:
| | | | | | | | | | | |
| December 31, 2024 | | December 31, 2023 |
| | | |
| (In thousands) |
| Cash paid for amounts included in the measurement of lease liabilities | | | |
| Operating cash flows from operating leases | $ | 4,684 | | | $ | 4,949 | |
| Financing cash flows from finance leases | $ | — | | | $ | 25 | |
| Right-of-use assets obtained in exchange for new and remeasured operating leases | $ | 5,912 | | | $ | 803 | |
| Right-of-use assets obtained through acquisition | $ | 2,052 | | | $ | 644 | |
The following table summarizes by year the maturities of our minimum lease payments as of December 31, 2024.
| | | | | |
|
LEASES |
| |
| (In thousands) |
| Year ending December 31, | |
| 2025 | $ | 4,821 | |
| 2026 | 3,735 | |
| 2027 | 2,677 | |
| 2028 | 1,076 | |
| 2029 | 1,042 | |
| Thereafter | 5,090 | |
| Total future lease payments | 18,441 | |
| Less: imputed interest | (1,969) | |
| Total | $ | 16,472 | |
Lease abandonment
During the years ended December 31, 2024 and 2023, the Company recorded lease abandonment expenses of $1,219 and $1,602, respectively, and reduced its lease ROU assets for the same amount in connection with the evaluation of the Company's office space footprint. These expenses are included within the general and administrative expenses in the Company's consolidated statements of operations and comprehensive income (loss).
14. Segment data
Operating segments are defined as components of an enterprise about which separate financial information is available that is evaluated regularly by the chief operating decision maker (“CODM”) in deciding how to allocate resources and in assessing performance.
The Company has determined that its chief executive officer (“CEO”) is its CODM. The Company manages its operations as a single segment for the purpose of assessing and making operating decisions. The Company’s CODM allocates resources and assesses performance based upon financial information at the consolidated level. The accounting policies of the Company's single segment are the same as those described in the summary of significant accounting policies. The inter-companies balances and transactions are eliminated.
As the Company operates and reports in a single reportable segment, the Company's CODM assesses performance for the segment and decides how to allocate resources based on net income that also is reported on the income statement as consolidated net income. The measure of segment assets is reported on the balance sheet as total consolidated assets.
The CODM uses net income and other performance indicators to evaluate income generated from segment assets (return on assets) in deciding whether to reinvest profits into the segment or into other parts of the entity, such as for acquisitions. Net income is also used to monitor budget versus actual results.
The Company manages the business activities on a consolidated basis. The Company's operating segment provides technology-enabled services and software products to its customers. The Company’s revenue consists of fees for its software products and services. The revenue is primarily generated from Americas. See item (q) - Revenue recognition under Note 2. “Summary of Significant Accounting Policies", for a description of the Company’s revenue categories.
The following table summarizes revenue by geographic area:
| | | | | | | | | | | | | | | | | |
| YEAR ENDED
DECEMBER 31, |
| 2024 | | 2023 | | 2022 |
| | | | | |
| (In thousands) |
| Revenue(1): | | | | | |
| Americas | $ | 281,493 | | | $ | 265,063 | | | $ | 252,921 | |
| EMEA | 76,567 | | | 63,567 | | | 57,002 | |
| Asia Pac | 27,088 | | | 25,707 | | | 25,721 | |
| Total | $ | 385,148 | | | $ | 354,337 | | | $ | 335,644 | |
__________________________________
(1)Revenue is attributable to the countries based on the location of the customer
Long-lived assets, defined as the net ROU assets and net Property, Plant, and Equipment, excluding goodwill and net intangible assets, by geographic area as of December 31, 2024 and 2023 are presented as follows:
| | | | | | | | | | | |
| DECEMBER 31, |
| 2024 | | 2023 |
| | | |
| (In thousands) |
| Long-Lived Assets, net: | | | |
| Americas | $ | 9,546 | | | $ | 6,858 | |
| EMEA | 5,605 | | | 3,802 | |
| Asia Pac | 857 | | | 1,614 | |
| Total | $ | 16,008 | | | $ | 12,274 | |
The following table presents information about reported segment revenue, segment profit or loss, and significant segment expenses.
| | | | | | | | | | | | | | | | | | | | |
| | YEAR ENDED DECEMBER 31, |
| | 2024 | | 2023 | | 2022 |
| | (In thousands) |
| Revenues | | $ | 385,148 | | | $ | 354,337 | | | $ | 335,644 | |
| Less: | | | | | | |
| Employee expense-non equity | | 221,379 | | | 187,035 | | | 170,324 | |
| Equity-based compensation expense | | 34,774 | | | 28,300 | | | 30,345 | |
| Equipment and software expense | | 13,990 | | | 11,528 | | | 9,476 | |
| Direct cost of revenues | | 5,310 | | | 4,399 | | | 4,242 | |
| Professional services expense | | 25,216 | | | 27,192 | | | 24,718 | |
| Change in fair value of contingent consideration | | 8,089 | | | 24,118 | | | — | |
| Intangible asset amortization | | 66,039 | | | 54,519 | | | 50,739 | |
| Depreciation expense | | 1,994 | | | 1,552 | | | 1,731 | |
| Goodwill impairment expense | | — | | | 46,984 | | | — | |
| Other segment expense(a) | | 4,021 | | | 937 | | | 7,541 | |
| Interest expense | | 21,520 | | | 22,916 | | | 17,773 | |
| Income tax expense | | (5,133) | | | 214 | | | 4,024 | |
| Segment net income | | $ | (12,051) | | | $ | (55,357) | | | $ | 14,731 | |
| | | | | | |
| Reconciliation of profit or loss | | | | | | |
| Adjustments and reconciling items | | $ | — | | | $ | — | | | $ | — | |
| | | | | | |
| Consolidated net income | | $ | (12,051) | | | $ | (55,357) | | | $ | 14,731 | |
(a) Other segment expense items included in segment net income include facilities related expense, marketing, travel, insurance, foreign currency exchange gains and losses, and other overhead expense.
15. Income Taxes
The components of income (loss) before income taxes were as follows:
| | | | | | | | | | | | | | | | | |
| YEAR ENDED DECEMBER 31, |
| 2024 | | 2023 | | 2022 |
| | | | | |
| (In thousands) |
| Domestic | $ | (15,443) | | | $ | (60,587) | | | $ | 9,456 | |
| Foreign | (1,741) | | | 5,444 | | | 9,299 | |
| Total | $ | (17,184) | | | $ | (55,143) | | | $ | 18,755 | |
The components of provision for (benefit from) income taxes were as follows:
| | | | | | | | | | | | | | | | | |
| DECEMBER 31, |
| 2024 | | 2023 | | 2022 |
| | | | | |
| (In thousands) |
| Current tax provision | | | | | |
| Federal | $ | (1,675) | | | $ | 3,986 | | | $ | 1,882 | |
| State and local | 2,169 | | | 3,976 | | | 3,335 | |
| Foreign | 7,068 | | | 8,775 | | | 10,318 | |
| Total current | 7,562 | | | 16,737 | | | 15,535 | |
| Deferred tax benefit | | | | | |
| Federal | (6,977) | | | (10,957) | | | (6,788) | |
| State and local | (2,934) | | | (2,835) | | | (2,190) | |
| Foreign | (2,784) | | | (2,731) | | | (2,533) | |
| Total deferred | (12,695) | | | (16,523) | | | (11,511) | |
| Total provision (benefit) | $ | (5,133) | | | $ | 214 | | | $ | 4,024 | |
The effective income tax rate was 29.87%, (0.39)% , and 21.46% for the years ended December 31, 2024, 2023 and 2022, respectively. The primary reconciling items between the statutory income tax rate of 21% and the effective income tax rate were as a result of the following:
| | | | | | | | | | | | | | | | | | | | | | | | | | | | | | | | | | | |
| DECEMBER 31, |
| 2024 | | 2023 | | 2022 |
| | | | | | | | | | | |
| (In thousands, except for percentage) |
| Tax at U.S. federal statutory rate | $ | (3,611) | | | 21.00 | % | | $ | (11,580) | | | 21.00 | % | | $ | 3,939 | | | 21.00 | % |
| State taxes, net of federal benefit | (1,201) | | | 6.98 | % | | 136 | | | (0.25) | % | | 967 | | | 5.16 | % |
| Foreign rate differential | 4,940 | | | (28.73) | % | | 4,552 | | | (8.26) | % | | 3,545 | | | 18.90 | % |
| Permanent items | (1,944) | | | 11.31 | % | | 5,205 | | | (9.44) | % | | (1,227) | | | (6.54) | % |
| Equity compensation | 2,738 | | | (15.91) | % | | 1,582 | | | (2.87) | % | | 2,278 | | | 12.15 | % |
| GIL TI inclusion | 1,442 | | | (8.38) | % | | 2,374 | | | (4.30) | % | | 451 | | | 2.41 | % |
| Tax credits | (7,969) | | | 46.34 | % | | (10,031) | | | 18.19 | % | | (6,427) | | | (34.27) | % |
| Rate change | — | | | — | % | | (237) | | | 0.43 | % | | (605) | | | (3.23) | % |
| Other adjustments | 2,304 | | | (13.40) | % | | 4,148 | | | (7.52) | % | | (4,554) | | | (24.28) | % |
| Return to provision adjustments | 820 | | | (4.76) | % | | (1,288) | | | 2.34 | % | | (405) | | | (2.16) | % |
| Valuation allowance | (2,652) | | | 15.42 | % | | 5,353 | | | (9.71) | % | | 6,062 | | | 32.32 | % |
| Effective tax rate | $ | (5,133) | | | 29.87 | % | | $ | 214 | | | (0.39) | % | | $ | 4,024 | | | 21.46 | % |
The tax effects of temporary differences that give rise to deferred tax assets and liabilities are summarized as follows:
| | | | | | | | | | | |
| DECEMBER 31, |
| 2024 | | 2023 |
| | | |
| (In thousands) |
| Deferred tax assets | | | |
| Accounts receivable | $ | 570 | | | $ | 341 | |
| Accrued compensation | 4,191 | | | 4,033 | |
| Accrued expenses | 15 | | | 27 | |
| Deferred revenue | 286 | | | 2,061 | |
| Net operating loss carryforwards | 12,448 | | | 17,192 | |
| R&D credit carryforward | 4,171 | | | 4,172 | |
| Foreign tax credits | 12,045 | | | 14,970 | |
| Equity based compensation | 4,366 | | | 4,600 | |
| Other assets | 1,303 | | | — | |
| Interest expense | 1,080 | | | 195 | |
| Lease liability | 3,362 | | | 2,295 | |
| Section 174 | 16,975 | | | 11,455 | |
| Total gross deferred tax asset | 60,812 | | | 61,341 | |
| Less: Valuation allowance | (24,023) | | | (31,500) | |
| Net deferred tax asset | 36,789 | | | 29,841 | |
| Deferred tax liabilities | | | |
| Property, equipment, and other long-lived assets | (146) | | | (223) | |
| Goodwill and intangible assets | (68,314) | | | (71,253) | |
| Prepaid expenses | (1,352) | | | (1,715) | |
| Interest rate hedge | (567) | | | (1,393) | |
| Right-of-use (ROU) Asset | (2,643) | | | (1,847) | |
| Other liabilities | (226) | | | — | |
| Total gross deferred tax liability | (73,248) | | | (76,431) | |
| Net deferred tax liability | $ | (36,459) | | | $ | (46,590) | |
| | | |
The net change in the total valuation allowance resulted in a decrease of $7,477 in 2024 compared to an increase of $5,768 in 2023. The valuation allowance is determined separately for each jurisdiction. A U.S. valuation allowance was required against the foreign tax credit carryforward. At the foreign subsidiaries, the valuation allowance was primarily related to foreign net operating losses that, in the judgment of management, are not more likely than not to be realized.
In assessing the realizability of deferred tax assets, management considered whether it is more likely than not that some portion or all of the deferred tax assets will not be realized. The ultimate realization of deferred tax assets is dependent upon the generation of future taxable income during the periods in which those temporary differences become deductible and carryforward attributes can be utilized. Management considered the reversal of deferred tax liabilities in making this assessment. Management believes it is more likely than not that the Company will realize the benefits of the deferred tax assets, net of the existing valuation allowance, at December 31, 2024.
At December 31, 2024, the Company had net operating loss carryforwards for federal income tax purposes of approximately $6,154 majority of which will expire if unused in years 2035 through 2036. The Company had net operating loss carryforwards for state income tax purposes of approximately $4,852, which will expire if unused in years 2029 through 2040. The Company had foreign net operating loss carryforwards of $78,623 which will expire if unused starting in 2025.
The Company has $336 of federal research and development credits that will expire if unused in years 2027 through 2048 and $292 of foreign research and development credits that will expire if unused by 2029. The Company has foreign tax credits of $10,977 that will expire if unused in years 2027 through 2034. and also Canadian investment tax credits of $3,877 which will expire if unused in years 2032 through 2042.
The Company had net operating losses and tax credits that are subject to limitation under Internal Revenue Code Section 382 and Section 383 due to changes in ownership. The Company has analyzed the realizability of these tax attributes carried forward and has recorded deferred tax assets for the attributes that meet the more-likely-than-not realizability threshold.
Foreign undistributed earnings were considered permanently invested, therefore no provision for US income taxes was accrued as of December 31, 2024 and 2023, with the exception of the withholding tax liability of $168 on the potential repatriation from Certara Canada Corporation.
The Company assessed its uncertain tax positions and determined that a liability of $7,411 and $2,708 was required to be recorded for uncertain tax positions as of December 31, 2024 and 2023, respectively. Uncertain tax positions relate primarily to federal and state R&D credits and certain net operating losses. The Company's policy is to recognize interest and penalties as a component of the provision for income taxes. For each years ended December 31, 2024 and 2023, the Company recognized interest of $0.1 million and $0.1 million, respectively and no penalties. The Company does not anticipate any significant changes to its uncertain tax positions during the next twelve months.
A reconciliation of the beginning and ending balance of unrecognized tax benefits is as follows:
| | | | | |
| (In thousands) |
| Balance at December 31, 2022 | $ | 2,818 | |
| Additions for tax positions related to the current year | 309 | |
| Additions for tax positions of prior years | 17 | |
| Reductions for tax positions of prior years | (436) | |
| Balance at December 31, 2023 | $ | 2,708 | |
| Additions for tax positions related to the current year | 509 | |
| Additions for tax positions of prior years | 5,312 | |
| Reductions for tax positions of prior years | (14) | |
| Reductions related to settlements with taxing authorities | (1,104) | |
| Balance at December 31, 2024 | $ | 7,411 | |
The uncertain tax positions, inclusive of interest and exclusive penalties, were $7,411 and $2,708 as of December 31, 2024 and December 31, 2023, respectively, which also represents potential tax benefits that if recognized, would impact the effective tax rate.
U.S. federal income tax returns are generally subject to examination for a period of three years after the filing of the return. However, the Internal Revenue Service can audit the NOLs generated in respective years in the years that the NOLs are utilized. State income tax returns are generally subject to examination for a period of three to six years after the filing of the respective return. The state impact of any federal changes remains subject to
examination by various states for a period of up to one year after formal notification to the states. Foreign income tax returns are generally subject to examination based on the tax laws of the respective jurisdictions.
The Company is subject to tax on Global Intangible Low-Taxed Income (GILTI) and has elected to account for GILTI as a current period expense.
The Organization for Economic Co-operation and Development (“OECD”) introduced Base Erosion and Profit Shifting (“BEPS”) Pillar 2 rules that impose a global minimum tax rate of 15%. Numerous countries, including European Union member states, have enacted or are expected to enact legislation to be effective as early as January 1, 2024, with general implementation of a global minimum tax by January 1, 2025. The Company does not expect this new rule to apply until the Company meets the minimum global revenue threshold.
16. Earnings per Share
Basic earnings per share is computed by dividing net income (loss) attributable to common stockholders by the weighted-average common shares outstanding for the period. Diluted net income (loss) per share is computed by dividing the net income (loss) attributable to stockholders by the weighted-average number of shares and dilutive potential common shares during the period.
| | | | | | | | | | | | | | | | | | | | |
| YEAR ENDED
DECEMBER 31, | |
| 2024 | | 2023 | | 2022 | |
| | | | | | |
| (In thousands, except per share and share data) |
| Basic earnings per share | | | | | | |
| Net income (loss) available to common shareholders | $ | (12,051) | | | $ | (55,357) | | | $ | 14,731 | | |
| Basic weighted-average common shares outstanding | 160,392,805 | | 158,936,251 | | 156,876,942 | |
| Basic earnings per common share | $ | (0.08) | | | $ | (0.35) | | | $ | 0.09 | | |
| | | | | | |
| Diluted earnings per share | | | | | | |
| Net income available to common shares | $ | (12,051) | | | $ | (55,357) | | | $ | 14,731 | | |
| Basic weighted-average common shares outstanding | 160,392,805 | | 158,936,251 | | 156,876,942 | |
| Dilutive potential common shares | — | | — | (1) | 2,477,452 | (2) |
| Diluted weighted-average common shares outstanding | 160,392,805 | | 158,936,251 | | 159,354,394 | |
| Diluted earnings per common share | $ | (0.08) | | | $ | (0.35) | | | $ | 0.09 | | |
__________________________________
(1)For the years ended December 31, 2024 and 2023, the Company excluded the restricted stock, RSUs, and PSUs from the calculation of diluted earnings per share that could potentially dilute earnings per share in the future because of the anti-dilutive effect of the reported net loss.
(2)For the year ended December 31, 2022 , the Company excluded certain potentially dilutive securities attributable to outstanding RSUs and restricted stock from the computation of diluted earnings per share because the securities would have had an antidilutive effect.
Item 9. Changes in and Disagreements With Accountants on Accounting and Financial Disclosure.
None.
Item 9A. Controls and Procedures.
Evaluation of Disclosure Controls and Procedures
As of the end of the period covered by this Annual Report on Form 10-K, we performed an evaluation under the supervision and with the participation of management, including our Chief Executive Officer and our Chief Financial Officer, of the design and effectiveness of our disclosure controls and procedures (as defined in Rules 13a-15(e) or 15d-15(e) under the Securities Exchange Act of 1934 as amended (the “Exchange Act”). Based upon that evaluation, our Chief Executive Officer and Chief Financial Officer concluded, as of the end of the period covered by this Annual Report, that our disclosure controls and procedures were effective at the reasonable assurance level to ensure that information required to be disclosed by the Company in the reports that it files or submits under the Exchange Act was recorded, processed, summarized and reported within the time periods specified in the SEC’s rules and forms, and to provide reasonable assurance that the information required to be disclosed in such reports is accumulated and communicated to the Company’s management, including its Chief Executive Officer and Chief Financial Officer, as appropriate to allow timely decisions regarding required disclosure.
Consistent with guidance issued by the SEC that an assessment of internal controls over financial reporting of a recently acquired business may be omitted from management's evaluation of disclosure controls and procedures, management is excluding an assessment of such internal controls of Chemaxon from its evaluation of the effectiveness of the Company's disclosure controls and procedures. The Company completed the acquisition of Chemaxon on October 1, 2024. Chemaxon, which is included in the 2024 consolidated financial statements of the Company, constituted approximately 6% of the Company's consolidated total assets and 2% of revenues for the year then ended.
Management’s Annual Report on Internal Control over Financial Reporting
Our management is responsible for establishing and maintaining adequate internal control over financial reporting, as is defined in the Exchange Act. Internal control over financial reporting is a process designed to provide reasonable assurance regarding the reliability of our financial reporting and the preparation of financial statements for external reporting purposes in accordance with GAAP and includes those policies and procedures that: (1) pertain to the maintenance of records that in reasonable detail accurately and fairly reflect our transactions and the dispositions of our assets; (2) provide reasonable assurance that our transactions are recorded as necessary to permit preparation of financial statements in accordance with GAAP and that our receipts and expenditures are being made only in accordance with appropriate authorizations; and (3) provide reasonable assurance regarding prevention or timely detection of unauthorized acquisition, use or disposition of our assets that could have a material effect on our consolidated financial statements.
Our management conducted an evaluation of the effectiveness of our internal control over financial reporting as of December 31, 2024, based on the framework in Internal Control – Integrated Framework (2013) issued by the Committee of Sponsoring Organizations of the Treadway Commission. Based on this evaluation, management concluded that, as of December 31, 2024, our internal control over financial reporting was effective. As reported above, on October 1, 2024, the Company completed the acquisition of Chemaxon. As a result, the Company is currently integrating Chemaxon’s operations into its overall system of internal control over financial reporting and, if necessary, will make appropriate changes as it integrates Chemaxon into the
Company's overall internal control over financial reporting process. Chemaxon, which is included in the 2024 consolidated financial statements of the Company, constituted approximately 6% of the Company's consolidated total assets and 2% of revenues for the year then ended. Consistent with guidance issued by the SEC that an assessment of a recently acquired business may be omitted from management’s report on internal control over financial reporting in the year of acquisition, management excluded an assessment of the effectiveness of the Company’s internal control over financial reporting related to Chemaxon.
RSM US LLP, the independent registered public accounting firm that audited our consolidated financial statements as of and for the year ended December 31, 2024 included in this Annual Report, has also audited the effectiveness of Certara’s internal control over financial reporting as of December 31, 2024 and has issued an attestation report on such internal control over financial reporting. The report of RSM US LLP is included under Item 8 of this Annual Report.
Changes in Internal Control over Financial Reporting
There were no changes in our internal control over financial reporting (as such term is defined in Rules 13a-15(f) under the Exchange Act) during the quarter ended December 31, 2024 that have materially affected, or are reasonably likely to materially affect, our internal control over financial reporting.
Item 9B. Other Information.
(a) On February 25, 2025, the Company filed with the Secretary of State of the State of Delaware (the “Delaware Secretary of State”) a certificate of correction (the “Certificate of Correction”) to its Amended and Restated Certificate of Incorporation, dated May 29, 2024 (the “2024 A&R Charter”). As previously disclosed in the Company’s Current Report on Form 8-K, filed with the SEC on May 23, 2024, the Company’s stockholders voted at the Company’s 2024 Annual Meeting of Stockholders on May 21, 2024 to approve two separate proposals to amend (the “Amendment Proposals”) the Company’s Amended and Restated Certificate of Incorporation, dated December 15, 2020 (the “2020 A&R Charter”). The Amendment Proposals were described in Proposal 2A and Proposal 2B in the Company’s proxy statement for the 2024 Annual Meeting of Stockholders filed with the SEC on April 10, 2024 (the “2024 Proxy Statement”). Accordingly, the Company filed the Certificate of Correction with the Delaware Secretary of State to void the 2024 A&R Charter and nullify the changes that were made through such filing. As a result, upon the effectiveness of the Certificate of Correction, the 2020 A&R Charter filed with the SEC on December 15, 2020 remains unchanged and in effect.
The foregoing description of the Certificate of Correction does not purport to be complete and is qualified in its entirety by reference to the full text of the Certificate of Correction, a copy of which is attached as Exhibit 3.2 to this Annual Report and incorporated herein by reference.
(b) Director and Officer 10b5-1 Trading Arrangements
Our directors and officers may adopt written plans, referred to as Rule 10b5-1 plans, in which they arrange with a broker to buy or sell our common stock on a periodic basis. Under a Rule 10b5-1 plan, the broker executes trades based on parameters established by the director or officer when the plan is created, , without further input from them. These plans are intended to meet the affirmative defense requirements of Rule 10b5-1(c) under the Exchange Act. For the three months ended December 31, 2024, no director or officer of the Company initiated or terminated a Rule 10b5-1 trading arrangement or non-Rule 10b5-1 trading arrangement.
Item 9C. Disclosure Regarding Foreign Jurisdictions That Prevent Inspections.
Not Applicable
PART III
Item 10. Directors, Executive Officers and Corporate Governance.
We have adopted a Code of Conduct (the “Code of Conduct”) applicable to all employees, executive officers (including our principal executive officer, principal financial officer, principal accounting officer or controller, and persons performing similar functions) and directors that addresses legal and ethical issues that may be encountered in carrying out their duties and responsibilities, including the requirement to report any conduct they believe to be a violation of the Code of Conduct. The Code of Conduct is available on our website, certara.gcs-web.com/corporate-governance/documents-charters. The information available on or through our website is not part of this Annual Report. If we ever were to amend or waive any provision of our Code of Conduct that applies to our principal executive officer, principal financial officer, principal accounting officer or any person performing similar functions, we intend to satisfy our disclosure obligations with respect to any such waiver or amendment by posting such information on our internet website set forth above rather than by filing a Form 8-K.
The remaining information required under this item is incorporated herein by reference to our definitive proxy statement (the “Proxy Statement”) pursuant to Regulation 14A under the Securities Exchange Act of 1934, as amended, which Proxy Statement is expected to be filed with Securities and Exchange Commission not later than 120 days after the close of our fiscal year ended December 31, 2024.
Item 11. Executive Compensation.
The information required by this item will be set forth in the Proxy Statement and is incorporated herein by reference.
Item 12. Security Ownership of Certain Beneficial Owners and Management and Related Stockholder Matters.
The information required by this item will be set forth in the Proxy Statement and is incorporated herein by reference.
Item 13. Certain Relationships and Related Transactions, and Director Independence.
The information required by this item will be set forth in the Proxy Statement and is incorporated herein by reference.
Item 14. Principal Accounting Fees and Services.
The information required by this item will be set forth in the Proxy Statement and is incorporated herein by reference.
PART IV
Item 15. Exhibits, Financial Statement Schedules.
(a)The following documents are filed as part of this Annual Report:
(1)Financial Statements
The financial statements filed as part of this Annual Report are included in Part II, Item 8 of this Annual Report.
(2)Financial Statement Schedules
Financial statement schedules have been omitted in this Annual Report because they are not applicable, not required under the instructions or the information requested is set forth in the financial statements or related notes thereto.
(3)List of Exhibits required by Item 601 of Regulation S-K
Incorporated by Reference
| | | | | | | | | | | | | | | | | | | | | | | | | | | | | | | | |
Exhibit
Number | | Exhibit Title | | Form | | File No. | | Exhibit | | Filing Date |
| | | | | | | | | | |
| 2.1 | | | | 8-K | | 001-39799 | | 2.1 | | 8/5/2021 |
| 3.1 | | | | S-8 | | 333-251368 | | 4.1 | | 12/15/2020 |
| 3.2^ | | | | | | | | | | |
| 4.1 | | | | S-1/A | | 333-250182 | | 4.1 | | 12/03/2020 |
| 4.2 | | | | 10-K | | 001-39799 | | 4.2 | | 3/15/2021 |
| 10.1 | | Credit Agreement, dated as of August 15, 2017, among Certara Holdings, Inc. (f/k/a EQT Avatar Holdings, Inc.), Certara Holdco, Inc., Certara USA, Inc., EQT Avatar Intermediate, Inc., Jefferies Finance LLC, as Administrative Agent and Issuing Bank, Golub Capital LLC as Issuing Bank and each lender from time to time party thereto | | S-1/A | | 333-250182 | | 10.3 | | 11/18/2020 |
| 10.2 | | First Amendment, dated as of January 24, 2018, to the Credit Agreement, among Certara Holdings, Inc. (f/k/a EQT Avatar Holdings, Inc.), Certara Holdco, Inc., Certara USA, Inc., EQT Avatar Intermediate, Inc., Jefferies Finance LLC, as Administrative Agent and Issuing Bank, Golub Capital LLC as Issuing Bank and each lender from time to time party thereto | | S-1/A | | 333-250182 | | 10.4 | | 11/18/2020 |
| | | | | | | | | | | | | | | | | | | | | | | | | | | | | | | | |
| 10.3 | | Second Amendment, dated as of April 3, 2018, to the Credit Agreement, among Certara Holdings, Inc. (f/k/a EQT Avatar Holdings, Inc.), Certara Holdco, Inc., Certara USA, Inc., Certara Intermediate, Inc. (f/k/a EQT Avatar Intermediate, Inc.), Jefferies Finance LLC, as Administrative Agent and Issuing Bank, Golub Capital LLC as Issuing Bank and each lender from time to time party thereto
| | S-1/A | | 333-250182 | | 10.5 | | 11/18/2020 |
| 10.4 | | Third Amendment, dated as of June 17, 2021, to the Credit Agreement, among Certara Holdings, Inc., Certara Holdco, Inc., Certara USA, Inc., Certara Intermediate, Inc., Bank of America, N.A., as Administrative Agent for the lenders from time to time party thereto and collateral agent for the secured parties thereunder | | 8-K | | 001-39799 | | 10.1 | | 6/22/2021 |
| 10.5 | | | | 10-Q | | 001-39799 | | 10.1 | | 8/9/2023 |
| 10.6 | | Fifth Amendment, dated as of June 26, 2024, to the Credit Agreement, dated as of August 15, 2017, among Certara Holdings, Inc., Certara Holdco, Inc., Certara USA, Inc., Certara Intermediate, Inc. Bank of America, N.A., as Administrative Agent for the lenders from time to time party thereto and collateral agent for the secured parties thereunder. | | 8-K | | 001-39799 | | 10.1 | | 6/26/2024 |
| 10.7 | | | | S-1/A | | 333-250182 | | 10.6 | | 11/18/2020 |
| 10.8 | | | | S-1/A | | 333-250182 | | 10.7 | | 11/18/2020 |
| 10.9 | | | | S-1/A | | 333-250182 | | 10.8 | | 11/18/2020 |
| 10.10 | | | | S-1/A | | 333-250182 | | 10.9 | | 11/25/2020 |
| 10.11* | | | | S-1/A | | 333-250182 | | 10.10 | | 11/18/2020 |
| 10.12* | | | | 10-K | | 001-39799 | | 10.21 | | 3/1/2022 |
| 10.13* | | | | 10-K | | 001-39799 | | 10.12 | | 3/15/2021 |
| 10.14* | | | | 10-K | | 001-39799 | | 10.12 | | 3/1/2023 |
| 10.15* | | | | 10-Q | | 001-39799 | | 10.1 | | 11/08/2023 |
| 10.16* | | | | S-1/A | | 333-250182 | | 10.19 | | 12/03/2020 |
| | | | | | | | | | | | | | | | | | | | | | | | | | | | | | | | |
| 10.17* | | | | S-1/A | | 333-250182 | | 10.20 | | 12/03/2020 |
| 10.18* | | | | 10-K | | 001-39799 | | 10.14 | | 3-15-2021 |
| 10.19* | | | | S-1/A | | 333-250182 | | 10.18 | | 11/25/2020 |
| 10.20** | | | | 10-Q | | 001-39799 | | 10.1 | | 5/7/2021 |
| 10.21** | | | | 10-Q | | 001-39799 | | 10.2 | | 5/8/2023 |
| 10.22** | | | | 10-Q | | 001-39799 | | 10.3 | | 5/8/2023 |
| 10.23** | | | | 10-Q | | 001-39799 | | 10.1 | | 5/7/2024 |
| 10.24* | | | | S-1/A | | 333-250182 | | 10.21 | | 11/25/2020 |
| 10.25* | | | | 10-K | | 001-39799 | | 10.18 | | 3/15/2021 |
| 10.26 | | | | 8-K | | 001-39799 | | 10.1 | | 11/7/2022 |
| 10.27 | | | | 8-K | | 001-39799 | | 10.2 | | 11/7/2022 |
| 10.28 | | | | 8-K | | 001-39799 | | 10.3 | | 11/7/2022 |
| 19.1^ | | | | | | | | | | |
| 21.1^ | | | | | | | | | | |
| 23.1^ | | | | | | | | | | |
| 24.1 | | | | | | | | | | |
| 31.1 | | | | | | | | | | |
| 31.2 | | | | | | | | | | |
| 32.1 | | | | | | | | | | |
| 32.2 | | | | | | | | | | |
| 97.10 | | | | 10-K | | 001-39799 | | 10.28 | | 2/29/2024 |
| 101.INS | | XBRL Instance Document – the instance document does not appear in the Interactive Data File because its XBRL tags are embedded within the Inline XBRL document | | | | | | | | |
| 101.SCH | | XBRL Taxonomy Extension Schema Document | | | | | | | | |
| 101.CAL | | XBRL Taxonomy Extension Calculation Linkbase Document | | | | | | | | |
| 101.DEF | | XBRL Taxonomy Extension Definition Linkbase Document | | | | | | | | |
| | | | | | | | | | | | | | | | | | | | | | | | | | | | | | | | |
| 101.LAB | | XBRL Taxonomy Extension Label Linkbase Document | | | | | | | | |
| 101.PRE | | XBRL Taxonomy Extension Presentation Linkbase Document | | | | | | | | |
| 104 | | Cover Page Interactive Data File (formatted in Inline XBRL and contained in Exhibit 101) | | | | | | | | |
* Management contract or compensatory plan or arrangement.
** Certain schedules and exhibits have been omitted pursuant to Item 601(a)(5) of Regulation S-K. The registrant agrees to furnish a copy of any omitted schedule or exhibit to the SEC upon request; provided, however, that the registrant may request confidential treatment pursuant to Rule 24b-2 of the Exchange Act for any document so furnished.
+ This certification is deemed not filed for purposes of Section 18 of the Exchange Act, or otherwise subject to the liability of that section, nor shall it be deemed incorporated by reference into any filings under the Securities Act or the Exchange Act.
^ Filed herewith.
Item 16. Form 10-K Summary.
None.
Signatures
Pursuant to the requirements of Section 13 or 15(d) of the Securities Exchange Act of 1934, the registrant has duly caused this report to be signed on its behalf by the undersigned, thereunto duly authorized.
| | | | | | | | |
| CERTARA, INC. |
| | |
| Date: February 26, 2025 | By: | /s/ WILLIAM F. FEEHERY |
| Name: | William F. Feehery |
| Title: | Chief Executive Officer
(Principal Executive Officer) |
| | |
| Date: February 26, 2025 | By: | /s/ JOHN E. GALLAGHER III |
| Name: | John E. Gallagher III |
| Title: | Senior Vice President
Chief Financial Officer
(Principal Financial Officer) |
KNOW ALL BY THESE PRESENTS, that each person whose signature appears below hereby constitutes and appoints William F. Feehery, John E. Gallagher III and Daniel Corcoran and each of them, his or her true and lawful agent, proxy and attorney-in-fact, with full power of substitution and resubstitution, for him or her and in his or her name, place and stead, in any and all capacities, to sign any and all amendments to this Annual Report on Form 10-K, and to file the same, with all exhibits thereto, and other documents in connection therewith, with the Securities and Exchange Commission, granting unto said attorneys-in-fact and agents, and each of them, full power and authority to do and perform each and every act and thing requisite and necessary to be done in connection therewith, as fully to all intents and purposes as he or she might or could do in person, hereby ratifying and confirming all that said attorneys-in-fact and agents, or any of them, or their or his substitutes, may lawfully do or cause to be done by virtue thereof.
Pursuant to the requirements of the Securities Exchange Act of 1934, this report has been signed below by the following persons on behalf of the registrant and in the capacities and on the dates indicated.
| | | | | | | | | | | | | | |
| SIGNATURE | | TITLE | | DATE |
| | | | |
| /s/ WILLIAM F. FEEHERY | | Chief Executive Officer and Director | | February 26, 2025 |
| William F. Feehery | | (Principal Executive Officer) | | |
| | | | |
| /s/ JOHN E. GALLAGHER III | | Senior Vice President and | | February 26, 2025 |
| John E. Gallagher III | | Chief Financial Officer
(Principal Financial Officer
and Principal Accounting Officer)
| | |
| | | | |
| /s/ JAMES E. CASHMAN III | | Chairman | | February 26, 2025 |
| James E. Cashman III | | | | |
| | | | |
| /s/ ERAN BROSHY | | Director | | February 26, 2025 |
| Eran Broshy | | | | |
| | | | |
| /s/ CYNTHIA COLLINS | | Director | | February 26, 2025 |
| Cynthia Collins | | | | |
| | | | |
| /s/ ROSEMARY CRANE | | Director | | February 26, 2025 |
| Rosemary Crane | | | | |
| | | | |
| | | | | | | | | | | | | | |
| /s/ NANCY KILLEFER | | Director | | February 26, 2025 |
Nancy Killefer | | | | |
| | | | |
| /s/ STEPHEN MCLEAN | | Director | | February 26, 2025 |
| Stephen McLean | | | | |
| | | | |
| | | | |
| /s/ JOHN REYNDERS | | Director | | February 26, 2025 |
| John Reynders | | | | |
| | | | |
| /s/ DAVID SPAIGHT | | Director | | February 26, 2025 |
| David Spaight | | | | |
| | | | |
| /s/ MATTHEW WALSH | | Director | | February 26, 2025 |
| Matthew Walsh | | | | |