UNITED STATES
SECURITIES AND EXCHANGE COMMISSION
Washington, D.C. 20549
FORM 10-K
x ANNUAL REPORT PURSUANT TO SECTION 13 OR 15(d) OF THE SECURITIES EXCHANGE ACT OF 1934
For the fiscal year ended December 29, 2024
OR
o TRANSITION REPORT PURSUANT TO SECTION 13 OR 15(d) OF THE SECURITIES EXCHANGE ACT OF 1934
For the transition period from__________to __________
Enovix Corporation
(Exact Name of Registrant as Specified in Charter)
| | | | | | | | | | | | | | |
| Delaware | | 001-39753 | | 85-3174357 |
(State or Other Jurisdiction
of Incorporation) | | (Commission
File Number) | | (IRS Employer
Identification No.) |
3501 W Warren Avenue
Fremont, California 94538
(Address of Principal Executive Offices) (Zip Code)
(510) 695-2350
(Registrant’s Telephone Number, Including Area Code)
Securities registered pursuant to Section 12(b) of the Act:
| | | | | | | | | | | | | | |
| Title of each class | | Trading Symbol(s) | | Name of each exchange on which registered |
| Common Stock, par value $0.0001 per share | | ENVX | | The Nasdaq Global Select Market |
Indicate by check mark if the registrant is a well-known seasoned issuer, as defined in Rule 405 of the Securities Act. Yes o No x
Indicate by check mark if the registrant is not required to file reports pursuant to Section 13 or Section 15(d) of the Act. Yes o No x
Indicate by check mark whether the registrant (1) has filed all reports required to be filed by Section 13 or 15(d) of the Securities Exchange Act of 1934 during the preceding 12 months (or for such shorter period that the registrant was required to file such reports), and (2) has been subject to such filing requirements for the past 90 days. Yes x No o
Indicate by check mark whether the registrant has submitted electronically every Interactive Data File required to be submitted pursuant to Rule 405 of Regulation S-T (§232.405 of this chapter) during the preceding 12 months (or for such shorter period that the registrant was required to submit such files). Yes x No o
Indicate by check mark whether the registrant is a large accelerated filer, an accelerated filer, a non-accelerated filer, smaller reporting company, or an emerging growth company. See the definitions of “large accelerated filer,” “accelerated filer,” “smaller reporting company,” and “emerging growth company” in Rule 12b-2 of the Exchange Act.
| | | | | | | | | | | |
| Large accelerated filer | x | Accelerated filer | o |
| Non-accelerated filer | o | Smaller reporting company | o |
| Emerging growth company | o | | |
If an emerging growth company, indicate by check mark if the registrant has elected not to use the extended transition period for complying with any new or revised financial accounting standards provided pursuant to Section 13(a) of the Exchange Act. o
Indicate by check mark whether the registrant has filed a report on and attestation to its management’s assessment of the effectiveness of its internal control over financial reporting under Section 404(b) of the Sarbanes-Oxley Act (15 U.S.C. 7262(b)) by the registered public accounting firm that prepared or issued its audit report. x
If securities are registered pursuant to Section 12(b) of the Act, indicate by check mark whether the financial statements of the registrant included in the filing reflect the correction of an error to previously issued financial statements. ¨
Indicate by check mark whether any of those error corrections are restatements that required a recovery analysis of incentive-based compensation received by any of the registrant’s executive officers during the relevant recovery period pursuant to § 240.10D-1(b). ¨
Indicate by check mark whether the registrant is a shell company (as defined in Rule 12b-2 of the Exchange Act). Yes ☐ No x
The aggregate market value of the voting and non-voting common equity held by non-affiliates on June 28, 2024 based on the closing price of the shares of common stock on such date as reported on The Nasdaq Global Select Market, was approximately $2.28 billion. Shares of voting stock held by each officer, director and each person known by the registrant to beneficially own 10% of more of the registrant’s outstanding common stock have been excluded in that such persons may be deemed to be affiliates. This assumption regarding affiliate status is not necessarily a conclusive determination for other purposes.
As of February 19, 2025, 191,273,833 shares of common stock, par value $0.0001 per share, were issued and outstanding.
Portions of the registrant's Proxy Statement for its 2025 Annual Meeting of Stockholders to be filed with the Securities and Exchange Commission pursuant to Regulation 14A not later than 120 days after the end of the fiscal year covered by this Annual Report on Form 10-K are incorporated by reference into Part III of this Annual Report on Form 10-K.
Enovix Corporation
ANNUAL REPORT ON FORM 10-K
For the Fiscal Year Ended December 29, 2024
Table of Contents
| | | | | | | | |
| | Page |
| PART I | | |
| | |
| | |
| Item 1. | | |
| Item 1A. | | |
| Item 1B. | | |
| Item 1C. | | |
| Item 2. | | |
| Item 3. | | |
| Item 4. | | |
| PART II | | |
| Item 5. | | |
| Item 6. | | |
| Item 7. | | |
| Item 7A. | | |
| Item 8. | | |
| Item 9. | | |
| Item 9A. | | |
| Item 9B. | | |
| Item 9C. | | |
| PART III | | |
| Item 10. | | |
| Item 11. | | |
| Item 12. | | |
| Item 13. | | |
| Item 14. | | |
| PART IV | | |
| Item 15. | | |
| Item 16. | | |
| Signatures | |
FORWARD LOOKING STATEMENTS
This Annual Report on Form 10-K contains forward-looking statements within the meaning of Section 27A of the Securities Act of 1933, as amended (the “Securities Act”), and Section 21E of the Securities Exchange Act of 1934, as amended (the “Exchange Act”). The statements contained in this Annual Report on Form 10-K that are not purely historical are forward-looking statements. Forward-looking statements generally relate to future events or our future financial or operating performance and can be identified by words such as anticipate, believe, continue, could, estimate, expect, intend, may, might, plan, possible, potential, predict, project, should, would and similar expressions that convey uncertainty about future events or outcomes. In addition, any statements that refer to projections, forecasts, management’s expectations, hopes, beliefs, intentions or strategies regarding the future, are forward-looking statements. may identify forward-looking statements, but the absence of these words does not mean that a statement is not forward-looking. Examples of forward-looking statements in this Annual Report on Form 10-K include, without limitation, statements about our:
•ability to respond to customer and market demand;
•ability to scale manufacturing lines for our lithium-ion batteries, as well as production and commercialization timelines, and our ability to have adequate capacity to satisfy customer demands;
•ability to meet milestones and customer acceptance of key products, such as EX-1M and EX-2M, and the ability to design and sample EX-3M in 2025, as well as the market readiness of such products and the effectiveness of our product design team;
•expectations and estimations of the total addressable market for our batteries, including the demand for more energy dense batteries and the suitability of our products to address this demand;
•expectations relating to the timing of the launch of commercial smartphone and commercial smart glasses products, the possible expansion of sales to defense customers, and expectations with respect to potential customer purchases, safety testing and customer qualification of our products;
•ability to manage our expenses and realize our cost savings goals;
•ability to manage and achieve the benefits of our restructuring efforts;
•products, technologies, business model and growth strategy, including commercialization opportunities, market opportunity and the expansion of our customer base;
•product strategy for our conventional lithium-ion battery products;
•ability to meet the expectations of new and current customers, including safety and qualification requirements, and our ability to achieve market acceptance for our products;
•financial performance, including revenue from the sale of batteries and battery pack products and engineering revenue contracts, as well as expenses and projections thereof;
•operational capabilities of our manufacturing lines, including the anticipated growth and benefits of our growing R&D teams to support product innovation;
•ability to attract and hire additional personnel, including for our international locations and to facilitate the build-out of existing and additional production lines;
•ability to optimize our manufacturing process and execute on our future product development strategy and roadmap to profitability, including projected improvements in our commercialization and R&D activities in support of our manufacturing operations;
•expectations regarding our development and other collaboration agreements with potential customers, including in the smartphone, IoT and defense categories;
•ability to validate the advantages of our cell architecture in the portable electronics and electric vehicle battery customer markets through our recent development agreements, as well as our expectations relating to the recognition of revenue from these markets, and our ability to expand our relationships with partners in the electric vehicle battery space; and
•ability to align with increasing customer demand for geodiversity and supply chain resilience.
The forward-looking statements contained in this Annual Report on Form 10-K are based on our current expectations and beliefs concerning future developments and their potential effects on us. There can be no assurance that future developments affecting us will be those that we have anticipated. These forward-looking statements, and the assumptions underlying such statements, involve a number of risks, uncertainties, some of which are beyond our control. These risks and uncertainties include, but are not limited to, those factors described in Part I, Item 1A of this Annual Report on Form 10-K, and include, but are not limited to, those summarized on the following page. Should one or more of these risks or uncertainties materialize, or should any of our assumptions prove incorrect, actual results may vary in material respects from those projected in these forward-looking statements. We undertake no obligation to update or revise any forward-looking statements, whether as a result of new information, future events or otherwise, except as required by law.
SUMMARY RISK FACTORS
Below is a summary of material factors that make an investment in our securities speculative or risky. Importantly, this summary does not address all of the risks and uncertainties that we face. Additional discussion of the risks and uncertainties summarized in this risk factor summary, as well as other risks and uncertainties that we face, can be found under Part I, Item 1A of this Annual Report on Form 10-K below.
•We will need to improve our energy density, cycle life, fast charging, capacity roll off and gassing metrics in order to stay ahead of competition over time, which is difficult and we may not be able to do.
•We rely on a new and complex manufacturing process for our operations, and achieving volume production involves a significant degree of risk and uncertainty in terms of operational performance such as yield and costs.
•If we cannot successfully scale our manufacturing facilities to produce our lithium-ion battery cell in sufficient quantities to meet expected demand, improve productivity and bring additional facilities online, we may be unable to achieve our profitability targets and our business will be negatively impacted and could fail.
•We rely on a manufacturing agreement with a Malaysia-based company for some of the facilities, procurement, and personnel needs of our operations. Changes to our relationship with such third-party contract manufacturer, expected or unexpected, may result in delays or disruptions that could harm our business.
•Our operations in international markets, including our manufacturing operations, expose us to operational, financial and regulatory risks, as well as risks relating to geopolitical tensions and conflicts, including changes to trade policies and regulations.
•We may not be able to source or establish supply relationships for necessary components and raw materials, or may be required to pay costs for components and raw materials that are more expensive than anticipated, including as a result of trade barriers, trade sanctions, export restrictions, tariffs, embargoes or shortages and other general economic and political conditions, which could delay the introduction of our product and negatively impact our business.
•We may be unable to adequately control the costs associated with our operations and the components necessary to build our lithium-ion battery cells.
•Lengthy sales cycles, unpredictable safety risks and certain provisions of defense and other customer contracts may negatively impact our ability to maintain and grow our customer base, which could adversely affect our business and future prospects.
•If our batteries fail to perform as expected, our ability to develop, market and sell our batteries could be harmed.
•We have a concentration of customer accounts in the defense sector and dependence on these customer accounts may create a risk to our financial stability.
•Our future growth and success depend on our ability to qualify new customers and the customer qualification cycles can take years to complete.
•We may not be able to accurately estimate the future supply and demand for our batteries, which could result in a variety of inefficiencies in our business and hinder our ability to generate revenue. If we fail to accurately predict our manufacturing requirements, we could incur additional costs or experience delays.
•We have a history of financial losses and expect to incur significant expenses and continuing losses for the foreseeable future.
•If we are unable to develop our business and effectively commercialize our products as anticipated, we may not be able to generate revenue or achieve profitability.
•We face significant barriers in our attempts to produce our products, our products are still under development, and we may not be able to successfully develop our products at commercial scale. If we cannot successfully overcome those barriers, our business will be negatively impacted and could fail.
•We have acquired and may continue to acquire other businesses, which could require significant management attention, disrupt our business, and dilute stockholder value.
•Fluctuations in foreign currency exchange rates or interest rates have had, and could continue to have, an adverse impact on our financial condition and results of operations.
•Operational problems with our manufacturing equipment subject us to safety risks which, if not adequately addressed, could have a material adverse effect on our business, results of operations, cash flows, financial condition or prospects.
•The battery market continues to evolve and is highly competitive, and we may not be successful in competing in this industry or establishing and maintaining confidence in our long-term business prospects among current and future partners and customers.
•Our failure to keep up with rapid technological changes and evolving industry standards may cause our batteries to become less marketable or obsolete, resulting in a decrease in demand for our batteries and harm our ability to grow revenue and expand margins.
•If we are unable to attract and retain key employees and qualified personnel on a global basis, our business and prospects could be harmed.
•We have previously been, currently are, and may in the future be involved in class-action lawsuits and other litigation matters that are expensive and time-consuming. If resolved adversely, lawsuits and other litigation matters could seriously harm our business.
•We may not have adequate funds to finance our operating needs and our growth, and may need to raise additional capital, which we may not be able to do.
•Servicing our debt requires a significant amount of cash, and we may not have sufficient cash flow from our business to pay our substantial debt.
•We rely heavily on our intellectual property portfolio. If we are unable to protect our intellectual property rights, our business and competitive position would be harmed.
•The trading price of our common stock may be volatile, and the value of our common stock may decline.
•Changes in tax laws or regulations that are applied adversely to us or our customers may have a material adverse effect on our business, cash flow, financial condition or results of operations.
PART I
Item 1. Business
Company Overview
Enovix Corporation (the “Company,” “we,” “us,” “our” and “Enovix”) is on a mission to deliver high-performance batteries that unlock the full potential of technology products. We do this by designing, developing, manufacturing, and commercializing next generation Lithium-ion, or Li-ion, battery cells that significantly increase the amount of energy density and storage capacity relative to conventional battery cells. Our battery’s mechanical design, or “architecture,” allows us to use high performance chemistries while enabling safety and charge time advantages.
Enhanced batteries for the mobile, IoT and defense sectors enable the development of devices that can accommodate user preferences for more advanced features and a slimmer design. Electric Vehicles (“EVs”) that use advanced batteries charge faster with lower system costs.
Enovix was established in 2006 based on the fundamental premise that improving battery performance would require a reinvention of the battery’s architecture. Our architecture allows us to use 100% active silicon and no graphite in the battery’s anode, which is the negative electrode that stores lithium ions when a battery is charged. The advantage of silicon over graphite is that a battery can theoretically store more than twice as much lithium as graphite, which increases a battery’s energy density and overall capacity. The battery industry has historically struggled to incorporate more than a small amount of silicon in the anode because silicon can swell and crack in conventional architectures, impacting safety and performance. By contrast, our architecture is designed to accommodate silicon’s swelling and apply stack pressure that alleviates the cracking problem.
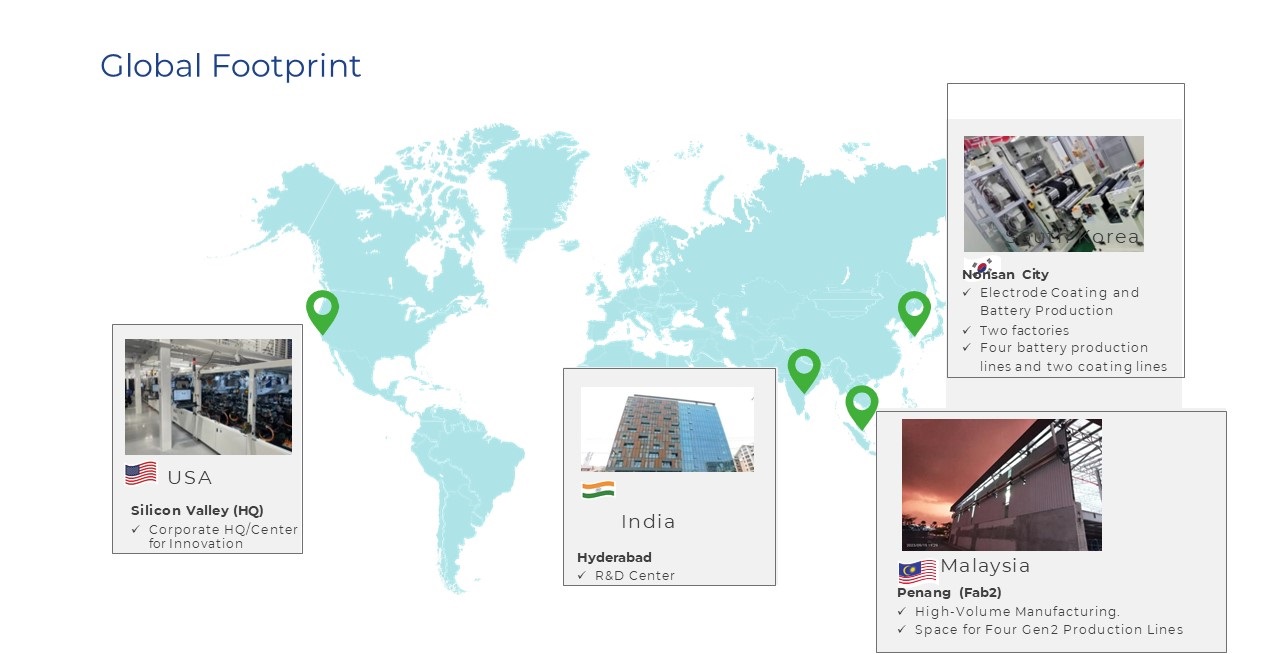
We have devoted significant funds and resources to develop our battery’s architecture and the unique patterning and stacking assembly process for manufacturing our cells. This was done in conjunction with partnership and investment from several strategic partners in the solar and semiconductor industries. Since 2018, we have sampled batteries to customers that have validated the performance of our products. In 2020, we started procuring equipment for our first production line (“Fab1”) at our headquarters in Silicon Valley. We recognized our first production revenue in the second quarter of 2022 from Fab1. In 2023, we identified a facility in Malaysia (“Fab2”) for high-volume production and acquired Routejade, Inc. (“Routejade”), a battery manufacturer in South Korea. The acquisition of Routejade allowed us to vertically integrate electrode coating and battery pack manufacturing and expand our battery offerings to include conventional graphite battery technology to service the IoT, industrial and defense markets.
Between May and July of 2024, we relocated our Fab1 R&D pilot line equipment to Fab2 in Malaysia. In August 2024, we officially opened our Fab2 production facility, located at the Penang Science Park in Malaysia. We have three manufacturing lines at Fab2, including the R&D focused pilot production line, the Agility line and the High-Volume (“HVM”) line. In October 2024, we commenced shipping battery cells from the Agility line and as of the end of 2024, we had completed Site Acceptance Testing (“SAT”) for the Agility and HVM lines.
Following the opening of Fab2 in Malaysia, our corporate functions, and certain sales, operations and engineering activities, are located at our U.S. headquarters, while our manufacturing and research and development activities are conducted primarily in Malaysia, Korea and India. As of December 29, 2024, we operate in one segment.
Industry Background
Battery Technology Innovation - Historical Overview
Sony developed the first Li-ion battery for consumer electronics to power its newly invented handheld video recorder in 1991, which needed smaller and lighter batteries with more energy than those available at the time. This battery architecture, sometimes referred to as a “Jelly Roll”, consists of an anode (A) in a long strip format, a long strip cathode (C) and two long strip separators (S), all on rolls, which are interleaved and then wound together into a Jelly Roll in this order: ASCSASCS.
The Jelly Roll is placed in a hermetic package and filled with electrolyte, an organic liquid through which the lithium ions repeatedly travel back and forth between the battery’s anode and the cathode. During charging, the lithium ions cycle from the cathode - the positive electrode, through tiny holes in the separator, and into the anode - the negative electrode. This basic construct of the Li-ion battery has remained unchanged for nearly 30 years.
Battery Technology Innovation - Our Approach
Historically, advancements in battery performance have been primarily driven by improvements in materials and manufacturing capability. These efforts have led to significant increases in metrics such as energy density over time, but as the industry moves toward next generation materials, such as silicon anodes, limitations in traditional cell design hinder progress. Enovix has re-imagined the lithium-ion cell design and assembly process to address the unique challenges of the next generation of active materials, maximizing their potential and value. The Enovix cell design improves the electrochemical, mechanical, thermal and safety performance of lithium-ion batteries.
A Fundamentally Different Design for Batteries
Our founders conceived a completely different design for a battery. Rather than focusing solely on the materials inside the battery, we began development of a novel 3D physical battery design, one that could both improve the packing efficiency of the active materials in the battery, as well as accommodate the use of a 100% active silicon anode. Our founders leveraged their knowledge from over 25 years in the hard disk drive and semiconductor industries to develop a battery architecture based on stacking instead of rolling. Rather than interleaving and winding long anode, cathode and separator strips into a roll, our founders proposed an architecture in which many short anodes and cathodes were stacked side by side, with a separator between each anode-cathode pair.
Uniquely Enabling Silicon Anodes
Looking at a problem from a different perspective often yields new opportunities and solutions that would otherwise not be possible. This is the case with our cell architecture. Rather than having long, wound electrodes that run parallel to the face of the battery, our cells have many small electrodes that are orthogonal to the largest face of the battery. This seemingly small difference has huge benefits. Specifically, our cell architecture is well-suited to accommodate the use of a silicon anode and therefore capitalize on the higher energy density it provides, as described below.
Silicon has long been heralded as the next important anode material. Silicon anodes can theoretically store more than twice as much lithium per unit volume than the graphite anode that is used in nearly all Li-ion batteries today.
Silicon’s high energy density, however, creates four significant technical problems that must be solved:
•Formation expansion. “Formation” is the term for the first charging of the battery, when lithium moves from the cathode, through the separator, to the anode. When fully charged, a silicon anode can more than double in thickness, resulting in significant swelling that can physically damage the battery, causing failure.
•Formation efficiency. When first charged, a silicon anode can absorb and permanently trap as much as roughly 40% to 50% of the original lithium in the battery, reducing the battery’s capacity by about 50% to 60%.
•Cycle swelling. A silicon anode will swell and shrink when the battery is charged and discharged, respectively, causing damage to both the package and the silicon particles in the anode, which can crack, and further trap lithium on the fresh silicon surfaces exposed by the crack.
•Cycle life. Silicon particles can become electrically disconnected from the electrode when the silicon anode is in its shrunken state and can crack when the silicon anode is swollen, both of which can lower cycle life. In addition, when silicon particles become disconnected from the electrode, they are no longer able to accept lithium and neighboring particles must absorb the excess, causing over charging and further opportunities for physical damage.
Left unaddressed, these four problems have limited the practical application of silicon anodes in conventional lithium-ion battery cells. Our cell architecture uniquely solves these four technical problems to enable 100% active silicon anodes.
Problem 1 — Formation expansion
In a conventional graphite anode, lithium atoms slip into the vacant spaces between the graphite layers, forming LiC6, resulting in very little graphite anode swelling during cycling (<10%). In a silicon anode, however, lithium atoms form a lithium-silicon alloy that does not have such vacant spaces, forming Li15Si4. While this alloying process results in an increased ability to store lithium, it also causes significant expansion of the anode material during charging, creating high pressure within the battery (1,500 psi).
If a silicon anode were used in a conventional battery architecture, the pressure of anode swelling would act on the large face of the battery, creating a force as large as 1.7 tons for a battery in a 50mm x 30mm x 3mm size battery. This force is analogous to a car standing on top of a cell phone sized battery.
By contrast, when silicon anodes are used in our cell architecture, the anodes do not face the largest side of the battery; instead the anodes face a short side of the battery. Because these anode faces are small in area, this same 1,500 psi pressure, therefore, creates a force of only 210 pounds in the same size battery.
To manage this force, we invented a very thin (50-micron) stainless steel constraint system to surround the battery. This constraint system limits the battery from swelling and growing in size. Moreover, the constraint system keeps the anode and cathode materials under constant compression, maintaining excellent particle-to-particle connection.
Problem 2 — Formation Efficiency
The first time a Li-ion battery is charged or formed, some of the lithium is permanently trapped in undesired side-reactions and surface layers on the anode and cathode particles. These losses proportionately reduce the capacity of the battery by removing lithium.
During formation of a conventional Li-ion battery with a graphite anode, approximately 5% of the lithium from a lithium cobalt oxide cathode will get permanently trapped in the graphite anode, never to return to the cathode.
A silicon anode, by contrast, can have a formation efficiency of roughly 50% to 60%, meaning that about 40% to 50% of the lithium is trapped in the silicon anode during formation and is no longer available for repeated cycling, reducing the battery’s capacity in half.
Our cell architecture uniquely enables a practical solution to this problem. Our cell assembly process has an added step called “pre-lithiation,” in which a thin lithium source is placed on top of the cell, within the package. By electrochemically coupling this lithium source to the electrodes, additional lithium can be dosed into the cell, replenishing the lithium lost during formation. Moreover, additional lithium beyond the initial replenishment can be dosed, providing a reservoir of lithium to a) counteract the normal lithium consumption that occurs in every battery during its life and b) provide the proper voltage balance to keep the minimum discharge voltage in the regime to be useful for devices.
The physical process by which the added lithium moves into the battery is called diffusion. The time required for lithium atoms to diffuse is proportional to the square of the diffusion distance. In a conventional battery architecture, the length of the electrode can be on the order of dozens of millimeters resulting in a pre-lithiation process that could take weeks to accomplish if a thin lithium source were placed on top of the cell. In our cell architecture, however, the lithium is required to travel a short distance, which can be accomplished in hours.
Problems 3 & 4 — Swelling and Cycle Life
When conventional Li-ion batteries with graphite anodes are cycled (charged and discharged), they exhibit a modest amount of cyclic swelling (<10%). Silicon anodes, by contrast, can swell by 20%, or more. The continuous swelling and shrinking during charging and discharging can fracture the anode silicon particles and/or electrically disconnect them and limit cycle life to less than 100 cycles, which is not commercially viable in many applications. Additionally, any swelling in the cell over its lifetime must be accommodated by larger cavity volume, effectively reducing the practical energy density of the cell.
Our unique structural constraint system applies a uniform engineered pressure on the silicon particles within the anode, limiting their fracture and maintaining electrical contact between them for an extended number of cycles. Cycle swelling is thus kept under 2%, outperforming even conventional graphite anodes. Our cells that have been cycled over 500 times show minimal expansion by contrast.
By addressing swelling, our cell architecture with its constraint system is designed to enable silicon anodes to achieve a minimum of 500 complete charge/discharge cycles to 80% remaining capacity.
Benefits of Our Advanced Li-ion Battery
Mobile — The Li-ion battery also provided the increase in energy density needed for cell phones to evolve from their original “brick-size” into today’s sleek, sophisticated smartphone. Energy requirements continue to become more demanding as original equipment manufacturers (“OEMs”) seek to launch heavy workload applications such as 4K and
8K video upload/download, multi-player gaming, enhanced camera capabilities and on-device AI. Just as it was 30 years ago, a significant increase in battery energy density will enable OEMs to continue improving user experience, functionality and battery life while keeping devices sizes small enough to fit in a pocket.
Computing — The Li-ion battery can also be credited for helping to usher in an era of portable PC computing. Users are now demanding higher performance from their portable PCs to accommodate everything from gaming to enterprise applications such as video conferencing. Ultimately users want “always on, all day” battery life, like that which they experience with their smartphones. Increased energy density is needed for this task, along with enabling more power-hungry features and AI.
IoT – The Internet-of-Things (“IoT”) market includes many types of devices powered by a Li-ion battery, including wearables, health/wellness devices, camera-based devices, power banks, location trackers, portable networking devices, augmented reality/virtual reality devices (“AR/VR”), and computing accessories, among others. Products in this market are often power budget constrained due to size. There is also a constant appetite in this market for power-hungry features such as sensors, high-speed connectivity, and the increasing integration of AI and generative AI (“Gen AI”) capabilities. AI-enabled workloads and on-device Gen AI applications require significantly more power to deliver enhanced functionality and user experience. All of these features can be enabled by a higher energy density battery.
Electric Vehicles — According to BloombergNEF's Electric Vehicle Outlook 2024, the number of EVs will grow from 13.9 million in 2023 to 30.0 million in 2027. Replacing internal combustion engine vehicles with EVs can reduce emissions that contribute to smog and climate change, but mass adoption of EVs hinges on lower cost vehicles and faster charging times that resemble the gas station experience of filling up quickly. The orientation of the electrodes in our battery allows for significantly higher thermal conductivity, enabling a faster-charging EV battery.
Producing Our Battery
In addition to designing our battery, we also develop the advanced manufacturing processes needed to produce our batteries in high volume and at low cost.
We use the conventional Li-ion battery cell manufacturing techniques for processes such as electrode coating, cell packaging, test and aging. We then use our own proprietary tools on steps such as cell assembly where we laser pattern and stack the electrodes and then apply a stainless steel constraint.
Standard Li-ion battery production involves: 1) electrode fabrication, 2) cell assembly and 3) battery packaging and formation.
Electrode Fabrication — Sony developed and commercialized the first Li-ion battery in 1991 to meet the power requirements of its new handheld camcorder. Sony’s battery division adapted its existing magnetic recording tape production equipment to make batteries: 1) to mix chemical anode and cathode slurries, 2) to coat them onto metal foil current collectors, 3) to “calender” (flatten) the surface, 4) to slit the coated metal foil into electrode sheets and 5) to roll them up for packaging in cylindrical metal cans. While there have been process improvements over the years, electrodes for conventional Li-ion batteries are still fabricated using this standard method developed almost 30 years ago. In 2023, we acquired Routejade to bring this electrode fabrication capability in-house.
Cell Assembly — Li-ion cells were initially assembled by winding electrodes and separators into a naturally cylindrical Jelly Roll configuration, packaged in a cylindrical metal can. While some Li-ion batteries still use cylindrical metal cans, low-profile portable electronic devices require thinner, flatter cell formats, like the flat Jelly Roll described earlier. Li-ion cell assembly first addressed this need with a wind-and-flatten process introduced in the early 1990s. Today, it is common to wind the Jelly Roll onto a flat–rather than round–metal form. We have developed a more precise roll-to-stack cell assembly process to enable a silicon anode that increases Li-ion cell energy density and maintains high cycle life.
Wind-and-Flatten Cell Assembly — Wind-and-flatten cell assembly, introduced in the early 1990s, essentially flattens the cylindrical Jelly Roll into a thin, flat package for use in portable electronic devices such as laptop computers and mobile phones. The wind-and-flatten electrode assembly can be packaged in a metal case, but it is most often packaged in a polymer pouch for portable electronic device applications. It can also be produced in larger formats, with welded aluminum housings for electric powertrains in EVs.
Cut-and-Stack Cell Assembly — Cut-and-stack cell assembly was introduced in 1995. Instead of winding and flattening, electrodes and separators are cut (or punched) into sheets, which are stacked horizontally. Cut-and-stack assembly provides better spatial efficiency than Jelly Roll wind-and-flatten assembly because the volume lost from the core is
eliminated and space at the outside edges is reduced. Cut-and-stack cells are used in consumer, defense and EV applications.
Enovix Roll-to-Stack Cell Assembly — We have designed proprietary tools, produced for us by precision automated equipment suppliers, which incorporate patented methods and processes to achieve precise laser patterning and high-speed roll-to-stack cell assembly.
Instead of cutting or punching, electrodes and separators are laser patterned and stacked. An in-line laser precisely patterns the electrodes and separators, which are then fed directly to a high-speed stacking tool.
Battery Packaging and Formation — Our battery uses the same battery packaging and formation process as a conventional Li-ion battery with the exception of the pre-lithiation process noted above. In our manufacturing process, we add an incremental lithium source during packaging which is then diffused into the cell during the formation process.
Our Products
Our product strategy is built on close collaboration with customers to understand their specific performance requirements such as energy density, cycle life, charge rate, and battery size. In 2023, we shifted from a horizontal business strategy, which focused on serving hundreds of customers with standard-sized batteries, to a vertical business strategy targeting a smaller group of large customers that require custom cells. We believe this transition provides the most efficient path to scale while optimizing battery performance for our target applications, including smartphones, computing, and IoT. We directly engage with OEMs to fine-tune our battery technology for maximum performance within the constraints of their devices.
To achieve this, we develop battery "nodes" that share a common set of active materials and mechanical design, enabling us to produce batteries in various sizes. Our technology roadmap is built around a structured progression of these nodes, with each new generation such as EX-1M, EX-2M, EX-3M and so on, delivering substantial improvement in energy density. By leveraging both material and design innovations, we aim to push the boundaries of Li-ion battery performance Continuous innovation will allow us to introduce higher-performing battery nodes over time, delivering meaningful performance gains for our customers ahead of market trends.
In 2023, we acquired Routejade, a leading battery manufacturer in South Korea that supplies batteries for wearables, medical devices, headsets, activity trackers, and industrial equipment. Routejade's patented encapsulation technology provides for design flexibility and structural safety, enabling high-energy-density Li-ion batteries primarily for IoT and wearable applications. The company also produces high-power batteries using Z-Folding technology, serving customers in the medical, industrial, aviation, and defense sectors. Routejade offers three main product categories. The PD series consists of rechargeable coin cells commonly used in healthcare and IoT applications. The FLPB and ASDB series utilize encapsulation technology—FLPB providing structural safety and ASDB maximizing design flexibility for compact devices—both primarily used in wearables and medical applications. The SLPB series features high C-Rate Z-Folding batteries optimized for high-power applications in the medical, industrial, aviation, and defense markets. One of Routejade’s key strengths is its in-house pack assembly, serving over 50 global end-user customers with a wide range of customized solutions to meet diverse market demands.
Our Competitive Strengths
100% Active Silicon Maximizes Anode Energy Density and Battery Capacity — Conventional Li-ion battery architecture only allows small amounts of silicon to be blended with graphite in the anode, limited by swelling. Our proprietary cell architecture enables use of silicon instead of graphite as the cycling material to achieve 100% active silicon anode that increases energy density and battery capacity.
Proprietary Manufacturing Process — In order to commercialize our unique architecture, we invented a customized manufacturing process that is not available “off-the-shelf” to conventional battery cell OEMs. In developing this process over multiple generations, we have accumulated significant intellectual property and trade secrets.
Full-Depth of Discharge Cycle Life — We have internally built and verified battery cells based on our proprietary cell architecture with an integrated structural constraint capable of 1,000 cycles, opening mass-market opportunities that were previously unobtainable with silicon anodes that failed to reach this number of cycles.
Architecture Enables Safety Innovation — Our architecture enables multiple parallel cell-to-busbar connections, which allow us in certain applications to apply a resistor at the busbar junction that can be utilized to regulate current flux in the
event of an internal short. Our BrakeFlowTM system is designed to limit a shorted area from overheating and inhibits thermal runaway.
Architecture Enables Fast Charge — We demonstrated a 0-80% state-of-charge in 5.2 minutes and a 0-98% state-of-charge in just under 10 minutes on 0.27Ah test cells. This fast charging is enabled by the fact that heat only has to travel a small distance from the center of our electrodes to the stainless steel constraint on the exterior.
Customer Tested in Multiple Form Factors — We have sampled pilot-production cells in several different sizes as part of product development programs. Applications cover a range of portable electronic products, including wearables, mobile handsets and laptop computers.
Practical Path to EV Market — We will initially validate our silicon anode Li-ion battery technology and production process in the quality-conscious, high-volume portable electronic device market. This will help mitigate technology and production risks as we look to commercialize our product for the EV market.
Home Grown IP — Unlike many advanced battery startups, which have licensed core technology from government or academic research laboratories, we have developed and own all our intellectual property. We received our first patents in 2011.
Supply Chain Geodiversity — Our manufacturing footprint in Korea and Malaysia aligns with increasing customer demand for geodiversity and supply chain resilience.
Research and Development
Our global research and development (“R&D”) programs are focused on driving improvements in the performance and cost of our batteries and manufacturing equipment.
Current R&D activities include the following:
Energy Density and Capacity — Increase the energy density and capacity of batteries by increasing the percent by volume of active cathode material inside the core, minimizing packaging overhead, maximizing the voltage of the cell, using cathode materials with higher specific capacity, and scaling the size of the battery while maintaining battery safety.
Cycle Life and Temperature — Improve the cycle life and high and low temperature performance of batteries by developing new electrolyte chemistries.
Fast Charge — Enable battery charging at a higher rate for reduced charge time, while minimizing heating.
Safety — Improve battery safety by developing techniques to regulate current flux in the event of a battery short and limit overheating to inhibit thermal runaway.
Anodes and Cathodes — Develop batteries with next-generation anodes and cathodes that increase energy density.
Cost and Throughput — Develop toolsets and processes to produce batteries with lower cost and higher manufacturing throughput.
Mechanical Design — Improve energy density, cycle life, safety, manufacturability and yield.
EV Batteries — Develop batteries targeted to the unique requirements of the EV industry.
Manufacturing and Supply Chain
We historically manufactured batteries at our Fab1 manufacturing facility at our headquarters in Fremont, California. In 2023, we selected a site for Fab2 in Penang, Malaysia at the Penang Science Park. In the third quarter of 2023 we initiated a plan to locate all manufacturing operations in Asia to be closer to customers and suppliers, and transition Fab1 to focus on new product development. In October 2023, we completed the acquisition of Routejade, which has two factories in Nonsan City, South Korea, that house a total of four automated battery production lines and two electrode coating lines.
In the second quarter of 2024, we undertook a restructuring plan that included a relocation of Fab1 manufacturing to Malaysia. In the third quarter of 2024, we formally opened Fab2 in Penang, Malaysia and began operating our Agility line at this site. We subsequently commenced shipping EX-1M battery cells to customers from the fully operational
Agility line in Malaysia. In addition, we completed SAT for our second generation (“Gen2”) HVM line in late December 2024 and began sampling EX-2M battery cells to smartphone customers.
We source materials for our batteries from third party suppliers globally. We have executed master supply agreements with many of our suppliers and have qualified second sources for certain of our battery materials. We seek second sources for materials that are high cost or where a risk to supply has been identified. On long-lead items we intend to keep safety stock on hand to mitigate interruptions to supply.
Intellectual Property
We operate in an industry in which innovation, investment in new ideas and protection of our intellectual property rights are critical for success. We protect our technology through a variety of means, including through patent, trademark, copyright and trade secrets laws in the U.S. and similar laws in other countries, confidentiality agreements and other contractual arrangements. As of December 29, 2024, we had approximately 65 issued U.S. patents, approximately 145 issued foreign patents, approximately 29 public and pending U.S. patent applications and approximately 132 public and pending foreign patent applications.
We continually assess the need for patent protection for those aspects of our technology that we believe provide significant competitive advantages. A majority of our patents relate to battery architectures, secondary batteries, and related structures and materials.
With respect to proprietary know-how that is not patentable and processes for which patents are difficult to enforce, we rely on trade secret protection and confidentiality agreements to safeguard our interests. We believe that many elements of our secondary battery manufacturing processes involve proprietary know-how, technology or data that are not covered by patents or patent applications, including technical processes, test equipment designs, algorithms and procedures.
We own or have rights to various trademarks and service marks in the U.S. and in other countries, including Enovix and the Enovix design mark. We rely on both registration of our marks as well as common law protection where available.
All of our research and development personnel have entered into confidentiality and proprietary information agreements with us. These agreements address intellectual property protection and require our employees to assign to us all of the inventions, designs and technologies they develop during the course of employment with us.
We also require our customers and business partners to enter into confidentiality agreements before we disclose any sensitive aspects of our technology or business plans. As part of our overall strategy to protect our intellectual property, we may take legal actions to prevent third parties from infringing or misappropriating our intellectual property or from otherwise gaining access to our technology.
For more information regarding the risks related to our intellectual property, including the above referenced intellectual property proceedings, see Part I, Item 1A of this Annual Report on Form 10-K.
Competition
The Li-ion battery supplier market is highly competitive, with both large incumbent suppliers and emerging new suppliers.
Prospective competitors of ours include major manufacturers currently supplying the mobile device, IoT, defense, EV and battery energy storage systems (“BESS”) industries, and potential new entrants to the industry. Incumbent suppliers of Li-ion batteries include Amperex Technology Ltd., Panasonic Corporation, Samsung SDI, Contemporary Amperex Technology Co. Ltd. and LG-Energy Solution Ltd. These companies supply conventional Li-ion batteries and, in some cases, Li-ion batteries with some silicon added to the anode. In addition, because of the importance of EVs, many automotive OEMs are researching and investing in advanced Li-ion battery efforts including battery development and production.
There are also several emerging companies investing in developing improvements to conventional Li-ion batteries or new technologies for Li-ion batteries, including silicon anodes and solid-state architectures. Some of these companies have developed relationships with incumbent battery suppliers, automotive OEMs and consumer electronics brands. These emerging companies are also exploring new chemistries for electrodes, electrolytes and additives.
Our ability to compete successfully will rely on factors both within and outside our control, including broader economic and industry trends. Factors within our control include driving competitive pricing, cost, energy density, safety and cycle life.
We believe that our ability to compete against this set of competitors will be driven by a number of factors, including product performance, cost, reliability, product roadmap, customer relationships and ability to scale manufacturing. We believe we will compete well on each of these factors based on advanced battery innovation to date and the ability to continue to design, develop and manufacture higher performing products for the customers served in our targeted markets.
Government Regulation and Compliance
Our business activities are global and are subject to various federal, state, local, and foreign laws, rules and regulations. For example, there are various government regulations pertaining to battery safety, transportation of batteries, use of batteries in cars, factory safety, and disposal of hazardous materials. In addition, substantially all of our import and export operations are subject to complex trade and customs laws, export controls, regulations and tax requirements such as sanctions orders or tariffs set by governments through mutual agreements or unilateral actions. Further, the countries into which our products are imported or are or will be manufactured may from time to time impose additional duties, tariffs or other restrictions on our imports or adversely modify existing restrictions. For example, recent tensions in U.S.-China trade relations, increased tariffs, and the possibility of additional tariffs, have created uncertainty and may negatively impact our key partners and suppliers. Changes in export controls, tax policy or trade regulations, the disallowance of tax deductions on imported merchandise, or the imposition of new tariffs on imported products, could have an adverse effect on our business and results of operations.
Prior to transitioning our Fab1 manufacturing equipment to Fab2 in Malaysia, our Fremont, California facility operated as a foreign trade zone through qualification with U.S. Customs. During its active period, this foreign trade zone status allowed us to defer certain U.S. duties and tariffs on materials received at the Fremont facility, until such time as those materials entered U.S. commerce. The operation of our foreign trade zone required compliance with applicable regulations and support from U.S. Customers with respect to the foreign trade zone program. While we previously may have benefited from reduced duties, deferral of certain duties and tariffs, and reduced processing fees through the foreign trade zone program, these benefits have been phased out as manufacturing operations are now located at Fab2 in Malaysia.
Privacy and Security Laws
In the ordinary course of our business, we may process personal or sensitive data. Accordingly, we are or may become subject to numerous data privacy and security obligations, including federal, state, local, and foreign laws, regulations, guidance, and industry standards related to data privacy, security, and protection. Such obligations may include, without limitation, the Federal Trade Commission Act, the Telephone Consumer Protection Act of 1991, the Controlling the Assault of Non-Solicited Pornography And Marketing Act of 2003.
The California Consumer Privacy Act of 2018, as amended by the California Privacy Rights Act of 2020 (collectively, “CCPA”) the European Union’s General Data Protection Regulation 2016/679 (“EU GDPR”), the EU GDPR as it forms part of United Kingdom (“UK”) law by virtue of section 3 of the European Union (Withdrawal) Act 2018 (“UK GDPR”), and the ePrivacy Directive. Furthermore, several states within the United States, including Colorado, Connecticut, Utah and Virginia, have enacted or proposed data privacy laws. Additionally, we are, or may become, subject to various U.S. federal and state consumer protection laws which require us to publish statements that accurately and fairly describe how we handle personal data and choices individuals may have about the way we handle their personal data.
The CCPA, UK GDPR, and EU GDPR are examples of the increasingly stringent and evolving regulatory frameworks related to personal data processing that may increase our compliance obligations and exposure for any noncompliance. For example, the CCPA imposes different obligations on covered businesses, including affording privacy rights to consumers, business representatives and employees who are California residents, requires covered businesses to provide specific disclosures to California residents in privacy notices, and provides such individuals with certain privacy rights to their personal data. The CCPA provides for administrative fines of up to $7,500 per violation and allows private litigants affected by certain data breaches to recover significant statutory damages.
Foreign data privacy and security laws (including but not limited to the EU GDPR and UK GDPR) impose significant and complex compliance obligations on entities that are subject to those laws. As one example, the EU GDPR applies to any company established in the EEA and to companies established outside the EEA that process personal data in connection with the offering of goods or services to data subjects in the EEA or the monitoring of the behavior of data subjects in the EEA. These obligations may include limiting personal data processing to only what is necessary for specified, explicit, and legitimate purposes; requiring a legal basis for personal data processing; requiring the appointment of a data protection officer in certain circumstances; increasing transparency obligations to data subjects; requiring data protection impact assessments in certain circumstances; limiting the collection and retention of personal data; increasing rights for data subjects; formalizing a heightened and codified standard of data subject consents; requiring the implementation and maintenance of technical and organizational safeguards for personal data; mandating notice of certain personal data breaches to the relevant supervisory authority(ies) and affected individuals; and mandating the appointment of representatives in the UK and/or the EU in certain circumstances. These developments further complicate compliance efforts and increase legal risk and compliance costs for us and the third parties upon whom we rely.
Our actual or perceived failure to comply with such obligations could lead to regulatory investigations or actions, litigation, fines and penalties, disruptions of our business operations, reputational harm, loss of revenue or profits, loss of customers or sales, and other adverse business consequences.
The EU GDPR, UK GDPR, CCPA, and other laws exemplify the obligations our business may have in responding to the evolving regulatory environment related to personal data. Our compliance costs and potential liability may increase with this scattered regulatory environment.
See the section titled “General Risk Factors” for additional information about the laws and regulations to which we are or may become subject and about the risks to our business associated with such laws and regulations.
Human Capital
Our human capital resources objectives include, as applicable, identifying, recruiting, retaining, incentivizing and integrating our existing and new employees. The principal purposes of our equity incentive plans are to attract, retain and motivate our people through the granting of equity-based compensation awards, in order to increase stockholder value and our success by motivating such individuals to perform to the best of their abilities and achieve Enovix’s objectives. As of December 29, 2024, we employed approximately 570 full-time employees. Approximately 18% of our employees are located in the United States, and 82% of our employees are located in Asia Pacific, which includes South Korea, Malaysia, India and China.
Culture and Benefits
Our people are our greatest asset. We strive to live up to our Core Values every day: integrity, respect, innovation, resilience, excellence and customer focus. Employees carry these Core Values with them on their access badge. Our Core Values are also displayed in conference rooms at Enovix offices globally, and are reinforced in new hire training and rewards and recognition programs. Our team at Enovix is comprised of a diverse group of dedicated technicians, engineers, scientists, and business professionals who are all driven to create a better, low-carbon world through innovation in energy storage. We could not be where we are today without the dedication of our workforce, and we prioritize pathways for career development, employee feedback and competitive compensation and benefits packages. Our benefits program includes an employee stock purchase plan, paid time off, team building events and talent development opportunities. The program is designed, and periodically evaluated, to ensure we continue to motivate, strengthen and empower our workforce.
Employee Engagement and Training
We are engaged in community building by collaborating with local non-profit organizations in both the U.S. and Asia. We regularly engage with our employees via quarterly All Hands meetings, employee engagement surveys and through team building events. These activities help advance employees’ cultural awareness and social responsibility and promote employee wellness and safety, as well as facilitate a collaborative and transparent working environment. We have engaged with top universities in Malaysia to build out a talent pipeline.
We have established a learning platform with both internal and external content to provide employees with on demand technical training programs and programs focused on developing soft skills. Our broader training program
covers leadership topics, safety and compliance, processes and systems. The trainings are done online and in person, in brown bag formats and in more formal settings.
Building a company where everyone feels that they belong is a priority at Enovix. Our Core Values are reinforced in new hire training, employee engagement activities and everyday interactions.
Corporate Information
Our principal executive offices are located at 3501 W. Warren Avenue, Fremont, CA 94538.
Available Information
We file or furnish periodic reports and amendments thereto, including our Annual Reports on Form 10-K, our Quarterly Reports on Form 10-Q and Current Reports on Form 8-K, proxy statements and other information with the Securities and Exchange Commission (“SEC”). The SEC maintains a website (www.sec.gov) that contains reports, proxy and information statements, and other information regarding issuers that file electronically. Copies of our SEC filings are made available, free of charge, on our investor relations website at https://ir.enovix.com as soon as reasonably practicable after we electronically file or furnish such information with the SEC. We may also use our investor relations website to announce important business and financial information to investors, including webcasts, podcasts, and press releases. In addition, we use various social media channels, such as X, LinkedIn, YouTube, Instagram and Facebook as a means of communicating with investors, and for complying with our disclosure obligations under Regulation FD. Accordingly, investors should monitor these channels, in addition to following our SEC filings, webcasts, press releases and blogs published on our website. The information posted on our website and through various social media channels is not incorporated by reference into this Annual Report on Form 10-K or in any other filings we make with the SEC.
Item 1A. Risk Factors
RISK FACTORS
Investing in our securities involves a high degree of risk. Before you make a decision to buy our securities, you should carefully consider the risks and uncertainties described below together with all of the other information contained in this Annual Report on Form 10-K, including our financial statements and related notes and in the section titled “Management’s Discussion and Analysis of Financial Condition and Results of Operations.” If any of the events or developments described below were to occur, our business, prospects, operating results and financial condition could suffer materially, the trading price of our securities could decline and you could lose all or part of your investment. The risks and uncertainties described below are not the only ones we face. Additional risks and uncertainties not presently known to us or that we currently believe to be immaterial may also adversely affect our business.
You should not interpret our disclosure of any of the following risks to imply that such risks have not already materialized.
Risks Related to Our Manufacturing and Scale-Up
We will need to improve our energy density, cycle life, fast charging, capacity roll off and gassing metrics in order to stay ahead of competition over time, which is difficult, and we may not be able to do.
Our roadmap to improve our energy density, cycle life, fast charging, capacity roll off and gassing metrics requires us to implement higher energy density materials for both cathodes and anodes, and electrolyte and separator materials. To successfully use these materials, we will have to optimize our cell designs including, but not limited to formulations, thicknesses, geometries, materials, chemistries and manufacturing tolerances and techniques. It could take us longer than we anticipate to incorporate these new materials, or we might not be able to achieve certain cell performance specifications required by customers. Further, we will need to make improvements in our technology to achieve our energy density, cycle life, fast charge, capacity roll off and gassing metrics improvement roadmap. These improvements may not be possible, or could take longer, or be more difficult than forecasted. If we are unable to improve our packaging technology, this could reduce the performance of our products and delay the availability of products to customers, which would negatively impact our competitive potential.
We rely on a new and complex manufacturing process for our operations, and achieving volume production involves a significant degree of risk and uncertainty in terms of operational performance such as yield and costs.
Although we have developed our lithium-ion battery technology, we rely heavily on a new and complex manufacturing process for the production of our lithium-ion battery cells, which is not currently operating at scale. To meet our projected future demand, we need to increase our manufacturing throughput and yield metrics. We expect that meeting our goals to improve throughput and yield will be a multi-quarter or potentially longer endeavor. We have in the past, and may in the future, experience delays in meeting these goals. We have more than one solution to improve manufacturing throughput and yield metrics, and it is uncertain which solution will be optimized for commercial scale. We use numerous vendors for subcomponents of the battery; changes in materials or vendor selection, or the failure of our solutions to improve yield, could negatively impact our ability to meet our throughput and yield metric goals.
The work required to develop these manufacturing processes and integrate equipment into the production of our lithium-ion battery cells, including achieving our goals for throughput and yield, is time intensive and requires us to work closely with numerous equipment and tooling providers to ensure that the equipment works properly for our unique battery technology. The integration of new equipment into our production process involves a significant degree of uncertainty and risk, and we have not in the past and may not in the future be able to achieve our goals for throughput and yield. Further, the integration work may result in the delay in the scaling up of production or result in additional costs to our battery cells, particularly if we encounter issues with performance or if we are unable to customize products for certain of our customers. We expect that certain customers may require several months or longer to complete technology qualification before accepting a product that is manufactured at high volume on the Gen2 lines, if at all. In addition, even if we are able to achieve volume production for the existing uses of our batteries, we may face challenges relating to the scaling up of production for new uses of our batteries, including in the EV market.
Our large-scale Gen2 manufacturing lines require large-scale machinery. We need one or more tooling vendors to produce custom products for our customers. Such machinery or tooling equipment has in the past suffered, and may in the future suffer, unexpected malfunctions from time to time and will require repairs and spare parts to resume operations, which may not be available when needed. Our tooling vendors may be new to the battery space or to producing silicon batteries and it may take longer to qualify and effectively utilize such tooling to make custom batteries. Further, our tooling may not be adequate for the various products our customers may demand and we may have to procure new or additional tooling to make products suitable for the market.
In addition, unexpected malfunctions of our production equipment have in the past significantly affected, and may in the future significantly affect, the intended operational efficiency. Qualified labor is needed to remedy any such equipment malfunction, which may not be readily available. Because this equipment has not previously been used to build lithium-ion battery cells, the operational performance and costs associated with the maintenance and repair of this equipment can be difficult to predict and may be influenced by factors outside of our control, such as, but not limited to, (i) failures by suppliers to deliver necessary components of our products in a timely manner and at prices and volumes acceptable to us, (ii) environmental hazards and remediation, (iii) difficulty or delays in obtaining governmental permits, (iv) damages or defects in systems, (v) cybersecurity intrusion and related disruptions; and (vi) industrial accidents, fires, seismic activity and other natural disasters. Further, we have in the past experienced power outages at our facilities, and may again in the future. If outages are more frequent or longer in duration than expected, it could impact our ability to manufacture batteries in a timely manner. If our production equipment does not achieve the projected levels of its output or our production equipment becomes obsolete, it may be necessary to record an impairment charge to reduce the carrying value of our machinery and equipment, which would adversely affect our results of operations and financial condition.
Even if we are able to successfully complete development of and modify, as necessary, this new and complex manufacturing process, we may not be able to produce our lithium-ion batteries in commercial volumes in a cost-effective manner.
If we cannot successfully scale our manufacturing facilities to produce our lithium-ion battery cell in sufficient quantities to meet expected demand, improve productivity and bring additional facilities online, we may be unable to achieve our profitability targets and our business will be negatively impacted and could fail.
In May 2024, we initiated a restructuring plan to relocate our Fab1 manufacturing operations in Fremont, California to Malaysia and to accelerate manufacturing operations at Fab2 in Malaysia. In 2024 we completed site acceptance testing (“SAT”) and began production of batteries on our Agility line, and completed factory acceptance testing (“FAT”), and SAT, for our High-Volume Manufacturing (“HVM”) line in Malaysia. However, our profitability targets rely on our ability to aggressively reduce the capital costs of our production lines and implement productivity improvements. If such efficiency gains are unsuccessful, we may be unable to achieve our target margin and profitability goals. We expect that
our current manufacturing lines will be sufficient to produce batteries in commercial scale, but not in high enough volumes to meet our expected customer demand. Therefore, we anticipate bringing additional facilities online at Fab2 and further refining our approach to improve yields over time. To the extent we continue to experience challenges with improving yields, we may have difficulty accepting additional customers due to capacity constraints, which could delay our growth. If we are unable to successfully build and manage such additional manufacturing lines, or otherwise further refine our approach to improve yields, our business will be negatively impacted and could fail.
Even if we overcome the manufacturing challenges and achieve volume production of our lithium-ion battery, if the cost, performance characteristics or other specifications of the battery fall short of our or our customers’ expectations and targets, our sales, product pricing and margins would likely be adversely affected. Our long-term target economics at scale assume we are able to obtain certain pricing levels for our batteries. If these assumptions are incorrect and/or customer demand is lower than expected, we may fail to achieve our target revenue and profitability goals.
We rely on a manufacturing agreement with a Malaysia-based company for some of the facilities, procurement, and personnel needs of our operations. Changes to our relationship with such third-party contract manufacturer, expected or unexpected, may result in delays or disruptions that could harm our business.
In July 2023, we entered into a 10-year manufacturing agreement (as amended, the “YBS Agreement”) with YBS International Berhad (“YBS”), a Malaysia-based investment holding company with operational segments including electronic manufacturing and assembly, high-precision engineering, precision machining and stamping, among others. If we are able to overcome the challenges in designing and refining our manufacturing process, YBS will have multiple lines to produce commercial volumes of our lithium-ion batteries to meet our expected customer demands.
On October 29, 2024, we entered into an amendment to the YBS Agreement, which modified certain payment terms and responsibilities of the parties. Pricing under the YBS Agreement is set on a cost-plus basis and we are subject to a minimum purchase commitment, which was mutually agreed to be reduced by the parties. Regardless of the level of manufacturing services YBS provides to us under the Agreement, we are obligated to pay a certain threshold amount each month during the term of the YBS Agreement. The ten-year term of the YBS Agreement expires in July 2033, subject to customary termination provisions.
Our manufacturing arrangement with YBS creates risks due to our reliance on YBS for certain aspects of our manufacturing facility operations, including procurement and personnel. Further, manufacturing in Malaysia is subject to possible disruptions due to power outages, equipment malfunction and failures, and supply chain disruptions relating to raw materials or components, among others. Our manufacturing operations may also be adversely affected by natural disasters and climate change. Other events, including political or public health crises, may affect our production capabilities or that of our suppliers, including lack of supplies. As a result, in addition to disruptions to operations, our insurance premiums may increase, or we may not be able to fully recover any sustained losses through insurance. If this manufacturing arrangement does not perform as expected, it may materially and adversely affect our results of operations, financial condition and prospects.
In addition, the YBS Agreement exposes us to risks because it limits our control and oversight over the management of manufacturing processes, capacity constraints, delivery timetables, product quality assurance and costs. If we fail to effectively manage our relationship with YBS; if YBS is unable to meet our manufacturing requirements in a timely manner; or if we experience delays, disruptions or quality control problems, it may materially and adversely affect our business, prospects, financial condition and results of operations.
Our operations in international markets, including our manufacturing operations, expose us to operational, financial and regulatory risks, as well as risks relating to geopolitical tensions and conflicts, including changes to trade policies and regulations.
In 2023 we acquired Routejade, a battery manufacturer in South Korea, and established a research and development center in Hyderabad, India, which supports the product and manufacturing teams in our other locations. In the second half of 2024, we relocated all manufacturing activities to Malaysia and established a subsidiary in Shenzhen, China. Following the shift of our manufacturing facilities to Malaysia and a reduction in force that primarily affected our U.S. operations, a higher percentage of our employees and a significant portion of our business operations are located overseas, while our leadership team is primarily located in the U.S. Additionally, relationships with customers and potential customers outside of the U.S. accounted for a significant portion of our revenues during 2024.
While we are continuing to adapt to and develop strategies to address international markets and to manage our international activities and geographically diverse workforce, there is no guarantee that such efforts will have the desired
effect. We have in the past and may continue to experience operational challenges associated with global business operations and a globally dispersed workforce, such as coordinating activities across multiple time zones and cultures and maintaining consistent operations standards across diverse locations. In addition, effective collaboration between R&D and manufacturing teams located overseas, and other parts of the organization, may be hindered by distance, language and cultural differences, which may have a negative impact on product innovation.
We expect that our international activities will continue to grow for the foreseeable future as we continue to pursue opportunities in existing and new international markets, which will require significant dedication of management attention and financial resources.
As a result of having significant international operations, including our manufacturing operations, we are subject to a number of risks, including:
• burdens of complying with a wide variety of laws and regulations;
• unexpected changes in regulatory requirements;
• exposure to political or economic instability and general economic fluctuations in the countries we operate;
• changes in currency exchange rates;
• changes in diplomatic and trade relationships;
• trade restrictions;
• terrorist activities, natural disasters, epidemics, pandemics and other outbreaks, including the regional or local impacts of any such activity;
• political, economic and social instability, war or armed conflict;
• differing employment practices and laws and labor disruptions, including strikes and other work stoppages, strains on the available labor pool, labor unrest, changes in labor costs and other employment dynamics;
• the imposition of government controls;
• lesser degrees of intellectual property protection;
• tariffs and customs duties, or other barriers to some international markets, and the classifications of our goods by applicable governmental bodies; and
• a legal system subject to undue influence or corruption.
Given our international operations, we face heightened risks relating to trade policies and disputes that could result in increased tariffs, trade barriers, and other trade restrictions and protectionist measures, If the United States or other countries impose tariffs or other trade barriers, trade restrictions and protectionist measures, the costs of our products could increase, and the demand for our products could decrease. Further, tariffs, trade restrictions and other protectionist measures could restrict our ability to source components or raw materials. The current geopolitical climate has created uncertainty regarding and fluctuations in trade policies, and our operations and business are subject to these uncertainties given the extent of our international operations and dependencies on international supply chains and access to international employees.
These factors and risks could negatively affect our international business operations, increase the difficulty or cost of selling our products in (or restrict our access to) certain foreign markets, divert management’s attention, and increase our costs, which would adversely affect our business, operating results, growth prospects and financial condition.
We may not be able to source or establish supply relationships for necessary components and raw materials, or we may be required to pay costs for components and raw materials that are more expensive than anticipated, including as a result of trade barriers, trade sanctions, export restrictions, tariffs, embargoes or shortages and other general economic or political conditions, which could delay the introduction of our products and negatively impact our business.
We rely on third-party suppliers for components necessary to develop and manufacture our lithium-ion batteries, including key supplies, such as our anode, cathode, electrolyte, and separator materials. If we are unable to enter into commercial agreements with these suppliers on beneficial terms, or these suppliers experience difficulties ramping up their supply of materials to meet our requirements, or delays in providing or developing the necessary materials, or cease providing or developing the necessary materials, we could experience delays in delivering on our timelines.
The unavailability of any equipment component could result in delays in constructing the manufacturing equipment, idle manufacturing facilities, product design changes and loss of access to important technology and tools for producing and supporting our lithium-ion batteries production, as well as impact our capacity. Moreover, significant increases in our production or product design changes by us may in the future require us to procure additional components in a short amount of time. We have faced in the past, and may face in the future, suppliers who are unwilling or unable to sustainably meet our timelines or our cost, quality and volume needs, or to do so may cost us more, which may require us to replace them with other sources, which may further impact our timelines and costs. While we believe that we will be able to secure additional or alternate sources for most of our components, there is no assurance that we will be able to do so quickly or at all. Any inability or unwillingness of our suppliers to deliver necessary product components at timing, prices, quality and volumes that are acceptable to us could have a material impact on our business, prospects, financial condition, results of operations and cash flows.
Our business depends on the continued supply of certain materials for our products and we expect to incur significant costs related to procuring materials required to manufacture and assemble our batteries. The cost of our batteries depends in part upon the prices and availability of raw materials such as lithium, silicon, graphite, nickel, cobalt, copper and/or other metals. The prices for these materials fluctuate and their available supply has been, and may continue to be, unstable depending on market conditions and global demand for these materials, including as a result of increased global production of EVs and energy storage products, recent inflationary pressures, supply chain disruption caused by pandemics or other outbreaks, and war or other armed conflicts, including Russia’s invasion of Ukraine. We have also experienced a need for expedited freight services associated with supply chain challenges, resulting in higher logistics costs. Moreover, we may not be able to negotiate purchase agreements and delivery lead-times for such materials on advantageous terms. In addition, several large battery companies are developing and manufacturing key supplies such as cathode material on their own, and as a result such supplies may be proprietary to these companies. Reduced availability of these materials or substantial increases in the prices for such materials has increased, and may continue to increase, the cost of our components and consequently, the cost of our products. There can be no assurance that we will be able to recoup increasing costs of our components, including as a result of recent inflationary pressures, by increasing prices, which in turn would increase our operating costs and negatively impact our prospects.
Any disruption in the supply of components or materials could temporarily disrupt production of our batteries until an alternative supplier is able to supply the required material. Changes in business conditions, unforeseen circumstances, governmental changes, labor shortages, the effects of pandemics or other outbreaks and other factors beyond our control or which we do not presently anticipate, could also affect our suppliers’ ability to deliver components to us on a timely basis. Our suppliers may go into bankruptcy or receivership based on conditions associated with their business. For example, one of our equipment suppliers went into receivership in the first half of 2024. To the extent our equipment suppliers experience business continuity challenges in the future, it may disrupt our production timelines, negatively impact our ability to successfully configure the equipment to run at its target performance and limit our ability to operate such equipment.
Currency fluctuations, trade barriers, trade sanctions, export restrictions, tariffs, embargoes or shortages and other general economic or political conditions may limit our ability to obtain key components for our lithium-ion batteries or significantly increase freight charges, raw material costs and other expenses associated with our business, which could further materially and adversely affect our results of operations, financial condition and prospects. For example, the recent tension in U.S.-China trade relations and the possibility of additional tariffs has created uncertainty in our industry and may negatively affect certain of our suppliers. It is difficult to predict what further trader-related actions governments may take and our business may be negatively impacted if we are unable to quickly and effectively react to such actions. In particular, our facilities are located in Malaysia, India and South Korea and our products require materials and equipment manufactured outside these countries, including China. If tariffs are placed on these materials and equipment, or if other trade barriers or restrictions are imposed, it could materially impact our ability to obtain materials on commercially reasonable terms.
Any of the foregoing could materially and adversely affect our results of operations, financial condition and prospects.
We may be unable to adequately control the costs associated with our operations and the components necessary to build our lithium-ion battery cells.
We will require significant capital to develop and grow our business and expect to incur significant expenses, including those relating to raw material procurement, leases, sales and distribution as we build our brand and market our batteries, and general and administrative costs as we scale our operations. Our ability to become profitable in the future will not only depend on our ability to successfully market our lithium-ion batteries and services, but also to control our costs. A large fraction of the cost of our battery, like most commercial batteries, is driven by the cost of component materials, such as anode and cathode powder, separator, pouch material, and current collectors. It also includes machined parts that are part of the package. Our cost reduction road map is based on extensive discussions with vendors, customers, industry analysts and independent research; however, an assumed cost reduction over time may be inaccurate if our forecasted demand does not materialize as planned. These estimates may prove inaccurate, which would adversely affect the expected profitability margins for our batteries.
If we are unable to cost-efficiently manufacture, market, sell and distribute our lithium-ion batteries and services, our margins, profitability and prospects would be materially and adversely affected. We have not yet produced any lithium-ion battery cells at significant volume, and our forecasted cost advantage for the production of these cells at scale, compared to conventional lithium-ion cells, will require us to achieve certain goals in connection with rates of throughput, use of electricity and consumables, yield and rate of automation demonstrated for mature battery, and battery material and manufacturing processes, that we have not yet achieved and may not achieve in the future. We intend to improve productivity and reduce the costs of our production lines relative to the first line we built. In addition, we are planning continuous productivity improvements going forward. If we are unable to achieve these targeted rates or productivity improvements, our business will be adversely impacted.
Additionally, we have previously undertaken restructuring plans to manage our operating expenses and we may do so again in the future. For example, in October 2023 we initiated a strategic realignment of Fab1 in Fremont to refocus the facility from a manufacturing hub to a facility focused on new product development, which resulted in a plan of workforce reduction. We subsequently accelerated our manufacturing operations in Malaysia and discontinued manufacturing operations at our Fab1 facility beginning in May 2024, resulting in a second plan of workforce reduction. We incurred significant restructuring charges associated with equipment disposals in connection with the relocation of manufacturing operations from Fab1 in California, to Fab2 in Malaysia, and may in the future incur, material costs and charges in connection with restructuring plans and initiatives. There can be no assurance that any restructuring plans and initiatives, including the 2024 Restructuring Plan, as defined and further discussed in Note 15 “Restructuring Costs” in the notes to financial statements, will be successful in managing our operating expenses. Any restructuring plans may adversely affect our operations and ability to recruit and retain skilled and motivated personnel, result in a loss of continuity and accumulated knowledge, or inefficiency during the transition period, and will likely require a significant amount of employees’ time and focus, all of which may divert attention away from operating and growing our business. For more information on our restructuring plans, see Note 15 “Restructuring Costs” of the notes to our consolidated financial statements in Part II, Item 8 of the Annual Report on Form 10-K.
If we fail to achieve some or all of the expected benefits of any restructuring plans, including the 2024 Restructuring Plan, which may be impacted by factors outside of our control, our business, operating results, and financial condition could be adversely affected.
Risks Related to Our Customers
Lengthy sales cycles, unpredictable safety risks and certain provisions of defense and other customer contracts may negatively impact our ability to maintain and grow our customer base, which could adversely affect our business and future prospects.
Our customers’ products are typically on yearly or longer refresh cycles. Due to the lengthy sales cycles, if we miss qualification timing by even a small amount, the impact to our production schedule, revenue and profits could be large and may mean that our guidance or revenue forecasts for fiscal year do not materialize as expected. While we intend to meet all qualification criteria, some field reliability risks remain such as cycle life, long-term high-temperature storage capacity and swelling, among others. Batteries are known in the market to have historically faced risks associated with safety, and therefore customers can be reluctant to take risks on new battery technologies. Since new battery technologies have not been widely adopted by customers in the battery market, it may be difficult for us to overcome customer risk
objections. If unanticipated product safety problems arise, it may raise warranty costs and adversely affect revenue and profit.
Our sales to defense customers often involve standard form contracts, which may not be subject to negotiation. In particular, certain of these contracts involve unlimited damages provisions that could result in large-scale liabilities.
If our batteries fail to perform as expected, our ability to develop, market and sell our batteries could be harmed.
We have experienced a limited number of returns of batteries that have failed to perform as expected. As commercial production of our lithium-ion battery cells increases, our batteries have in the past and may in the future contain defects in design and manufacture that may cause them to not perform as expected or that may require repairs, recalls and design changes. Our batteries are inherently complex and incorporate technology and components that have not been used for other applications and that may contain defects and errors, particularly when first introduced. We have a limited frame of reference from which to evaluate the long-term performance of our lithium-ion batteries. There can be no assurance that we will be able to detect and fix any defects in our lithium-ion batteries prior to the sale to potential consumers. If our batteries fail to perform as expected, we could lose design wins and customers may delay deliveries, terminate further orders or initiate product recalls, each of which could adversely affect our sales and brand and could adversely affect our business, prospects and results of operations.
Our cell architecture is different than other batteries and may behave differently in certain customer use applications that we have not evaluated. This could limit our ability to deliver to certain applications, including, but not limited to action cameras, portable gaming and smartwatches designed for children. In addition, we have limited historical data on the performance and reliability of our batteries over time. If our batteries fail unexpectedly in the field, such failures could result in significant warranty costs and/or reputational harm. For example, the electrodes and separator structure of our battery are different from traditional lithium-ion batteries and therefore could be susceptible to different and unknown failure modes, leading our batteries to fail and cause a safety event in the field, which could further result in the failure of our end customers’ products as well as the loss of life or property. Any safety event in the field, but in particular, one in which the end product failure results in significant loss, could result in severe financial penalties for us, including the loss of revenue, cancellation of supply contracts and the inability to win new business due to the reputational harm that results. In addition, some of our supply agreements require us to fund some or all of the cost of a recall and replacement of end products affected by our batteries.
We have a concentration of customer accounts in the defense sector and dependence on these customer accounts may create a risk to our financial stability.
We face risks associated with customer concentration, which could adversely affect our financial condition, results of operations, and business prospects. As a result of our Routejade acquisition in October 2023, our current revenue stream is derived largely from a limited number of key customers, including defense contractors. A single customer, who is a defense subcontractor in South Korea, accounted for approximately 50% of our total revenue for the fiscal year 2024. Any adverse changes in the purchasing behavior, financial stability, or strategic direction of these key customers could significantly impact our revenue. The terms and conditions of contracts with these key customers may not provide us with sufficient protection against fluctuations in demand, changes in pricing, or competitive pressures. For example, we rely on a single supplier for components to manufacture products for our defense customers and any disruption in the supply of components would negatively impact our ability to perform under such contracts and significantly negatively impact our revenues and profit margin. Further, should we have to replace our single supplier, or renegotiate the terms of our current supplier agreement, we may be unable to establish or obtain competitively favorable terms, which would also negatively impact our revenues and profit margin under our defense customer contracts.
Moreover, the expiration, termination, or renegotiation of contracts, whether from the integration of these customers as a result of the acquisition or otherwise, could lead to uncertainty and volatility in our revenue stream. Lack of diversification increases our susceptibility to adverse events affecting our key customers. The loss of a significant customer or a substantial reduction in business volume from key accounts could have a material adverse effect on our financial performance, cash flows, and ability to fund our operations, capital expenditures, and strategic initiatives. While we may seek to mitigate the risks associated with customer concentration through diversification efforts, expanded market reach, and enhanced customer relationship management, there can be no assurance that such measures will be successful in offsetting the potential adverse impacts of customer concentration.
Furthermore, such government contracts may be subject to procurement laws relating to the award, administration and performance of those contracts. Additionally, governmental entities are variously pursuing policies that may affect
our ability to sell our products and services. Changes in government procurement policy, priorities, regulations, technology initiatives and/or technical and compliance requirements may negatively impact our ability to continue to earn revenue from government and defense customers.
Our future growth and success depend on our ability to qualify new customers and the customer qualification cycles can take years to complete.
Our growth will depend in large part on our ability to qualify new customers. We have invested heavily in qualifying our customers and plan to continue to do so. We are in the early stages of growth in our existing markets, and we expect to substantially raise brand awareness by connecting directly with our customers. We anticipate that these activities will lead to additional deliveries, and, as a result, increase our base of qualified customers. An inability to attract new customers would substantially impact our ability to grow revenue or improve our financial results.
Customer qualification cycles are long and it can take many years for our products to qualify for customer shipment. There are numerous and rigorous safety, performance and other tests that we need to pass to achieve a customer design win. If we fail to qualify new customers in a timely manner, our business, financial condition and operating results may be harmed.
Our future growth and success depend on our ability to sell effectively to, and manage relationships with, large enterprise and defense customers.
Our potential customers are manufacturers of products that tend to be large enterprises and organizations, including defense customers. Therefore, our future success will depend on our ability to effectively sell our products to such large customers. Sales to these end-customers involve risks that may not be present (or that are present to a lesser extent) with sales to smaller customers. These risks include, but are not limited to, increased purchasing power and leverage held by large customers in negotiating contractual arrangements with us and longer sales cycles and the associated risk that substantial time and resources may be spent on a potential end-customer that elects not to purchase our lithium-ion battery solutions.
Large organizations often undertake a significant evaluation process that results in a lengthy sales cycle. In addition, product purchases by large organizations are frequently subject to budget constraints, multiple approvals and unanticipated administrative, processing and other delays. Finally, large organizations typically have longer implementation cycles, require greater product functionality and scalability, require a broader range of services, demand that vendors take on a larger share of risks, require acceptance provisions that can lead to a delay in revenue recognition and expect greater payment flexibility. All of these factors can add further risk to business conducted with these potential customers.
We may not be able to accurately estimate the future supply and demand for our batteries, which could result in a variety of inefficiencies in our business and hinder our ability to generate revenue. If we fail to accurately predict our manufacturing requirements, we could incur additional costs or experience delays.
It is difficult to predict our future revenue and therefore accurately budget for our expenses, and we may have limited insight into trends that may emerge and affect our business. We anticipate being required to provide forecasts of our demand to our current and future suppliers prior to the scheduled delivery of products to potential customers. Currently, there is no historical basis for making judgments on the demand for our batteries or our ability to develop, manufacture and deliver batteries, or our profitability in the future. If we overestimate our requirements, our suppliers may have excess inventory, which would indirectly increase our costs. If we underestimate our requirements, our suppliers may have inadequate inventory, which could interrupt manufacturing of our products and result in delayed shipments and revenue. Factors outside our control may also affect the demand for our batteries. For example, many of the expected end products for our batteries are manufactured in China. If the political situation between China and the U.S. were to deteriorate, it could prevent our customers from purchasing our batteries.
Lead times for materials and components that our suppliers order may vary significantly and depend on factors such as the specific supplier, contract terms and demand for each component at a given time. If we fail to order sufficient quantities of product components in a timely manner, the delivery of batteries to our potential customers could be delayed, which would harm our business, financial condition and operating results.
Increases in sales of our lithium-ion battery cells may expose us to the risks associated with manufacturing batteries for unique customer specifications and increase our dependency upon specific customers, including due to the costs to develop and qualify our system solutions.
The development of our lithium-ion battery cells is dependent, in part, upon successfully identifying and meeting our customers’ specifications for those products. Developing and manufacturing lithium-ion batteries with specifications unique to a customer increases our reliance upon that customer for purchasing our products at sufficient volumes and prices in a timely manner. If we fail to identify or develop products on a timely basis, or at all, that comply with our customers’ specifications or achieve design wins with customers, we may experience a significant adverse impact on our revenue and margins. Even if we are successful in selling lithium-ion batteries to our customers in sufficient volume, we may be unable to generate sufficient profit if per-unit manufacturing costs exceed per-unit selling prices. Manufacturing lithium-ion batteries to customer specifications requires a longer development cycle, as compared to discrete products, to design, test and qualify, which may increase our costs. We have limited experience with this customer design process and limited capacity at Fab2. If we are unsuccessful in meeting customer specifications and/or providing anticipated post-delivery product support services, we may be unable to effectively manage our business, including to develop products for multiple customers’ design specifications in a timely manner, which could harm our financial condition and operating results.
Risks Related to Our Business
We have a history of financial losses and expect to incur significant expenses and continuing losses for the foreseeable future.
We incurred net loss attributable to Enovix of approximately $222.2 million and $214.1 million, respectively, for the fiscal years ended December 29, 2024 and December 31, 2023 and had an accumulated deficit of approximately $821.1 million as of December 29, 2024. We believe that we will continue to incur operating and net losses each quarter until at least the time we begin significant production of our lithium-ion batteries.
We currently expect that we will continue to incur losses in future periods as we, among other things: (i) continue to incur additional expenses in connection with the development of our manufacturing process and the manufacturing of our batteries; (ii) secure additional manufacturing lines and invest in manufacturing capabilities; (iii) build up inventory of components for our batteries; (iv) build up supplies of batteries for projected demand; (v) increase our sales and marketing activities; (vi) develop our distribution infrastructure; and (vii) increase our general and administrative functions to support our growing operations. We may find that these efforts are more expensive than we currently anticipate or that these efforts may not result in substantial increase in our revenue, which would further increase our losses.
If we are unable to develop our business and effectively commercialize our products as anticipated, we may not be able to generate revenue or achieve profitability.
For our silicon batteries, the growth and development of our operations will depend on the successful commercialization and market acceptance of our products and our ability to manufacture products at scale while timely meeting customers’ demands. Our silicon batteries are in the early stages of commercialization and certain aspects of our technology have not been fully field tested. For example, there is no certainty that, once shipped, our products will operate as expected, and we may not be able to generate sufficient customer confidence in our latest designs and ongoing product improvements. For our graphite batteries, we may not be able to maintain or sustain our existing customers. Our customers’ battery needs are dependent on their end market demand, and they may place purchase orders and cancel them due to lack of demand. There are inherent uncertainties in our ability to predict future demand for our products and, as a consequence, we may have inadequate production capacity to meet demand, or alternatively, have excess available capacity. Our inability to predict the extent of customer adoption of our proprietary technologies makes it difficult to evaluate our future prospects.
If we experience significant delays or order cancellations from these customers, or if we fail to develop our products in accordance with contract specifications, then our operating results and financial condition will be adversely affected. In addition, there is no assurance that if we alter or change our products in the future, that the demand for these new products will develop, which could adversely affect our business and any possible revenue. If our products are not deemed desirable and suitable for purchase and we are unable to establish a customer base, we may not be able to generate revenue or attain profitability. In addition, if we are unable to deliver our engineering services on a timely basis,
we may be unable to attract and engage new or existing customers for engineering service contracts and we may not be able to generate revenue or attain profitability.
We face significant barriers in our attempts to produce our products, our products are still under development, and we may not be able to successfully develop our products at commercial scale. If we cannot successfully overcome those barriers, our business will be negatively impacted and could fail.
Producing lithium-ion batteries that meet the requirements for wide adoption by industrial and consumer applications is a difficult undertaking. We are still in the early stage of commercialization and face significant challenges achieving the long-term energy density targets for our products and producing our products in commercial volumes. Some of the challenges that could prevent the widespread adoption of our lithium-ion batteries include difficulties with (i) increasing the volume, yield and reliability of our cells, (ii) increasing manufacturing capacity to produce the volume of cells needed to meet demand, (iii) optimizing higher volume manufacturing equipment for scale, (iv) packaging our batteries to ensure adequate cycle life, (v) material cost reductions, (vi) qualifying new vendors, (vii) expanding supply chain capacity, (viii) the completion of rigorous and challenging battery safety testing required by our customers or partners, including but not limited to, performance, cycle life and abuse testing and (x) the development of the final manufacturing processes for optimal yield and throughput.
We have accelerated our manufacturing operations at Fab2 in Malaysia. In the second quarter of 2024, we completed SAT and began production of batteries on our Agility line, and in the fourth quarter of 2024, we shipped samples to customers. We also completed FAT for our HVM line, and subsequently completed SAT for our HVM line at the end of 2024. We have shipped customers EX-1M and EX-2M samples from Fab2; however, we may encounter yield, material cost, performance and manufacturing process challenges prior to volume commercial production. Further, we are likely to encounter engineering challenges as we increase the capacity of our batteries and efficiency of our manufacturing process. If we are unable to overcome these challenges in producing our batteries, our business could fail.
The Gen2 manufacturing equipment requires qualified labor to inspect the parts to ensure proper assembly. We have already experienced equipment malfunctions, and the lack of qualified labor to inspect our batteries may further slow our production and impact our manufacturing costs and production schedule.
Even if we complete development and achieve volume production of our lithium-ion batteries, if the cost, performance characteristics or other specifications of the batteries fall short of our targets, our sales, product pricing and margins will be adversely affected.
We have acquired and may continue to acquire other businesses, which could require significant management attention, disrupt our business, and dilute stockholder value.
In October 2023, we acquired Routejade, a manufacturer of lithium-ion batteries in South Korea. Although we have limited experience with acquisitions, we may in the future undertake acquisitions of other companies, products or technologies for the ongoing development and expansion of our operations. We may be unable to identify suitable acquisition candidates and/or complete acquisitions on favorable terms, if at all. If we do complete acquisitions, we may not ultimately strengthen our competitive position or achieve our goals, and any acquisitions we complete could be viewed negatively by existing and potential customers, vendors, suppliers, business partners or investors. In addition, we may not be able to integrate acquired businesses successfully or effectively manage the combined company following an acquisition. If we fail to successfully integrate our acquisitions, or the people or technologies associated with those acquisitions, into our company, the results of operations of the combined company could be adversely affected.
Any integration process will require significant time and resources, attention from management and will likely disrupt the ordinary functioning of our business, and we may not be able to manage the process successfully, which could harm our business. In addition, we may not successfully evaluate or utilize the acquired technology and accurately forecast the financial impact of an acquisition transaction, including accounting charges. We may not be able to fully realize the anticipated profits or other benefits of any particular transaction in the timeframe we expect or at all due to competition, market trends, additional costs or investments, the actions of advisors, suppliers or other third parties, or other factors. The Routejade acquisition resulted in, and future acquisitions may result in, significant costs and expenses. Further, if we fail to identify significant issues with any acquisition target during the due diligence process, we may be liable for significant and unforeseen liabilities.
We have previously, and may in the future, pay cash, incur debt or issue equity securities to pay for any such acquisition, any of which could negatively affect our financial condition or the value of our capital stock. The sale of our
equity to finance any such acquisitions could result in dilution to our stockholders. If we incur more debt, it will result in increased fixed obligations and could also subject us to covenants or other restrictions that would impede our ability to flexibly operate our business.
Fluctuations in foreign currency exchange rates or interest rates have had, and could continue to have, an adverse impact on our financial condition and results of operations.
Changes in the value of foreign currencies relative to the U.S. dollar and related changes in interest rates have adversely affected our results of operations and financial position and could continue to do so. In recent periods, as the value of the U.S. dollar has strengthened in comparison to certain foreign currencies, such as Malaysia, and in particular, South Korea, where we derived a substantial portion of our revenue for fiscal years 2023 and 2024, our reported international revenue has been reduced or costs associated with manufacturing increased, because foreign currencies translate into fewer U.S. dollars. As approximately all of our revenue is denominated in foreign currencies, these exchange rate fluctuations have impacted, and we expect will continue to impact, our revenue results.
Operational problems with our manufacturing equipment subject us to safety risks which, if not adequately addressed, could have a material adverse effect on our business, results of operations, cash flows, financial condition or prospects.
Operational problems with our manufacturing equipment subject us to safety risks which, if not adequately addressed, could result in the personal injury to or death of workers, the loss of production equipment, damage to manufacturing facilities, monetary losses, delays and unanticipated fluctuations in production. From time to time, we have experienced fires at our manufacturing facilities. While we have retained industry experts and designed our factories with appropriate safety precautions to address the fire risk of manufacturing batteries and to minimize the impact of any such event, if these precautions are inadequate or an event larger than expected, we could have significant equipment or facility damage that would impact our ability to deliver product and require additional cash to recover.
In addition, operational problems may result in environmental damage, administrative fines, increased insurance costs and potential legal liabilities. All of these operational problems could have a material adverse effect on our business, results of operations, cash flows, financial condition or prospects. Further, if other battery manufacturers experience fire hazards that result in personal injury or death, it may lead to unfavorable conditions for the battery manufacturing industry as a whole.
Lithium-ion battery modules in the marketplace have been observed to catch fire or vent smoke and flame, and such events have raised concerns over the use of such batteries.
We develop lithium-ion battery cells for industrial and consumer equipment and intend to supply these lithium-ion battery cells for industrial and consumer applications. Historically, lithium-ion batteries in laptops and cellphones have been reported to catch fire or vent smoke and flames, and more recently, news reports have indicated that several EVs that use high-power lithium-ion batteries have caught on fire. Any such adverse publicity or reports reflecting fire and other safety hazards associated with the use of high-power batteries in automotive or other industrial or consumer applications will negatively affect our business and prospects. In addition, any failure of our battery cells may cause damage to the industrial or consumer equipment or lead to personal injury or death and may subject us to lawsuits.
Our risks in this area are particularly pronounced given our lithium-ion batteries and BrakeFlowTM technology have not yet been commercially tested or mass produced. We may have to recall our battery cells, which would be time-consuming and expensive. A product liability claim could generate substantial negative publicity about our batteries and business and inhibit or prevent commercialization of other future battery candidates, which would have a material adverse effect on our brand, business, prospects and operating results. Our insurance coverage might not be sufficient to cover all potential product liability claims. Any lawsuit seeking significant monetary damages either in excess of our coverage, or outside of our coverage, may have a material adverse effect on our reputation, business and financial condition. We may not be able to secure additional product liability insurance coverage on commercially acceptable terms or at reasonable costs when needed, particularly if we do face liability for our products and are forced to make a claim under our policy.
Further, product liability claims, injuries, defects or other problems experienced by other companies in the lithium-ion battery market could lead to unfavorable market conditions for the industry as a whole, and may have an adverse effect on our ability to attract new customers, thus harming our growth and financial performance.
The battery market continues to evolve and is highly competitive, and we may not be successful in competing in this industry or establishing and maintaining confidence in our long-term business prospects among current and future partners and customers.
The battery market in which we compete continues to evolve and is highly competitive. Our current competitors have, and future competitors may have, greater resources than we do and may also be able to devote greater resources to the development of their current and future technologies. These competitors also may have greater access to customers and may be able to establish cooperative or strategic relationships amongst themselves or with third parties that may further enhance their resources and competitive positioning. Furthermore, existing and potential customers have developed, and may in the future develop, their own battery technologies with improvements in energy density faster than they have historically and what we have assumed, continue to reduce cost and expand supply of conventional batteries and therefore reduce our energy density advantage and price premium, which would negatively impact the prospects for our business or negatively impact our ability to sell our products at a market-competitive price and sufficient margins.
Developments in alternative technologies, improvements in batteries technology made by competitors, or changes in our competitors’ respective business models may materially adversely affect the sales, pricing and gross margins of our batteries. For example, large battery companies are becoming increasingly vertically integrated with respect to cathode materials, with the consequence being that next generation LCO material development will be proprietary to large battery companies. If a competing technology is developed that has superior operational or price performance, our business will be harmed. Further, our financial modeling assumes that, in addition to improving our core architecture over time, we are able to retain access to state-of-the-art industry materials as they are developed. If industry battery competitors develop their own proprietary materials, we would be unable to access these and would lose our competitive advantage in the market. If we fail to accurately predict and ensure that our battery technology can address customers’ changing needs or emerging technological trends, or if our customers fail to achieve the benefits expected from our lithium-ion batteries, our business will be harmed.
We must continue to commit significant resources to develop our battery technology in order to establish a competitive position, and these commitments will be made without knowing whether such investments will result in products potential customers will accept. There is no assurance we will successfully identify new customer requirements or develop and bring our batteries to market on a timely basis, or that products and technologies developed by others will not render our batteries obsolete or noncompetitive, any of which would adversely affect our business and operating results. Further, if we are unable to improve our energy density at a rate faster than the industry, our competitive advantage will erode. In addition, if we fail to produce batteries in large scale volume production at reduced unit cost, it may negatively impact our competitive advantage in the industry.
Customers will be less likely to purchase our batteries if they are not convinced that our business will succeed in the long term. Similarly, suppliers and other third parties will be less likely to invest time and resources in developing business relationships with us if they are not convinced that our business will succeed in the long term. Accordingly, in order to build and maintain our business, we must maintain confidence among current and future partners, customers, suppliers, analysts, ratings agencies and other parties in our long-term financial viability and business prospects. Maintaining such confidence may be particularly complicated by certain factors including those that are largely outside of our control, such as our limited operating history, market unfamiliarity with our products, any delays in scaling manufacturing, delivery and service operations to meet demand, competition and uncertainty regarding our production and sales performance compared with market expectations. In addition, due to competition, we may face pricing pressure and may not be able to charge the prices we would like or achieve profitability on the timeline we plan.
We could face state-sponsored competition from overseas and may not be able to compete in the market on the basis of price.
One or more foreign governments, including the Chinese government, have concluded that battery technology and battery manufacturing is a national strategic priority and therefore have instituted official economic policies meant to support these activities. These policies may provide our competitors with artificially lower costs. If these lower costs
materialize and enable competitive products to be sold into our markets at prices that, if applied to us, would cause us to become unprofitable, our ability to continue operating could be threatened.
Our failure to keep up with rapid technological changes and evolving industry standards may cause our batteries to become less marketable or obsolete, resulting in a decrease in demand for our batteries and harm our ability to grow revenue and expand margins.
The lithium-based battery market is characterized by changing technologies and evolving industry standards, which are difficult to predict. This, coupled with frequent introduction of new products and models, has shortened product life cycles and may render our batteries less marketable or obsolete. Also, our ability to grow revenue and expand margins will depend on our ability to develop and launch new product designs that are attractive to our customers. If we fail to invest in the development of new products and technologies, we may lose the opportunity to compete effectively or at all. Third parties, including our competitors, may improve their technologies or even achieve technological breakthroughs that could decrease the demand for our batteries. Our ability to adapt to evolving industry standards and anticipate future standards and market trends will be a significant factor in maintaining and improving our competitive position and our prospects for growth.
If we are unable to attract and retain key employees and qualified personnel on a global basis, our business and prospects could be harmed.
Our success depends on our ability to attract and retain our executive officers, key employees and other qualified personnel on a global basis, and, as a relatively small company with key talent residing in a limited number of employees, our operations and prospects may be severely disrupted if we lose any one or more of their services. There have been, and may continue to be, changes in our management team resulting from the departure or onboarding of executives and key employees, which could disrupt our business. For example, in addition to turnover of key executive positions in 2023, our Chief Financial Officer stepped down in December 2024 and we created a new role and appointed a Chief Accounting Officer at the end of December 2024. Such changes in our executive management team or workforce may be disruptive to our business, divert management’s attention, result in a loss of knowledge and negatively impact employee morale.
If we encounter further turnover or difficulties associated with the transition or departure of our executive officers and key employees, or if we are unsuccessful in recruiting new personnel or in retaining and motivating existing personnel, our operations may be disrupted, which could harm our business. We are dependent on the continued service of our senior technical and management personnel because of the complexity of our products. Our senior management and key employees are employed on an at-will basis. We cannot ensure you that we will be able to retain the services of our senior management team or other key employees, or that we will be able to timely replace such employees. The loss of one or more of our senior management or other key employees could harm our business.
Labor is subject to external factors that are beyond our control, including our industry’s highly competitive market for skilled workers and leaders, cost inflation, and workforce participation rates. As we build our brand and become more well known and grow globally, there is increased risk that competitors or other companies will seek to hire our personnel. While some of our employees are bound by non-competition agreements, these may prove to be unenforceable. The failure to attract, integrate, train, motivate and retain these personnel could seriously harm our business and prospects.
If we are unable to maintain effective internal control over financial reporting in the future, or implement or integrate effective internal control over financial reporting with respect to any acquired entities or subsidiaries, investors may lose confidence in the accuracy and completeness of our financial reports, and the market price of our common stock may be materially adversely affected.
In the past, we and our independent registered public accounting firm identified two material weaknesses in our internal control over financial reporting, all of which have since been remediated. We did not identify any material weakness for the fiscal years 2023 and 2024. With respect to any future acquisition, we may encounter unexpected integration challenges and such integration process may take longer than anticipated, which may have a negative impact on our ability to report effectively on our internal controls. If we are unable to successfully integrate any future acquisition into our existing internal control over financial reporting processes in a timely manner, our ability to accurately report our financial results could be negatively impacted.
Furthermore, if, in the future, we have a material weakness in our internal controls over financial reporting, we may not detect errors on a timely basis and our financial statements may be materially misstated. We or our independent registered public accounting firm may not be able to conclude on an ongoing basis that we have effective internal control over financial reporting, which could harm our operating results, cause investors to lose confidence in our reported financial information and cause the trading price of our stock to fall. In addition, as a public company, we are required to file accurate and timely quarterly and annual reports with the SEC under the Exchange Act. Any failure to report our financial results on an accurate and timely basis could result in sanctions, lawsuits, delisting of our shares from the Nasdaq Global Select Market or other adverse consequences that would materially harm our business. In addition, we could become subject to investigations by the stock exchange on which our securities are listed, the SEC and other regulatory authorities and litigation from investors and stockholders, which could harm our reputation and our financial condition, and/or divert financial and management resources from our core business.
We have incurred and will continue to incur significant increased expenses and administrative burdens as a public company, which could negatively impact our business, financial condition and results of operations.
We face increased legal, accounting, administrative and other costs and expenses as a public company that we would not incur as a private company. The Sarbanes-Oxley Act of 2002, including the requirements of Section 404, as well as rules and regulations subsequently implemented by the SEC, the Dodd-Frank Wall Street Reform and Consumer Protection Act of 2010 and the rules and regulations promulgated and to be promulgated thereunder, the PCAOB and the securities exchanges, impose additional reporting and other obligations on public companies. Compliance with public company requirements will increase costs and make certain activities more time consuming. A number of those requirements require us to carry out activities that we had not done previously as a private company. For example, we created new board committees and adopted new internal controls and disclosure controls and procedures.
Furthermore, if any issues in complying with those requirements are identified (for example, if we identify a material weakness or significant deficiency in the internal control over financial reporting), we could incur additional costs rectifying those issues, and the existence of those issues could adversely affect our reputation or investor perceptions of us. It may also be more expensive to obtain director and officer liability insurance. Risks associated with our status as a public company may make it more difficult to attract and retain qualified persons to serve on our board of directors or as executive officers. As a public company, we have additional reporting and other obligations, which lead to higher legal, accounting and administrative costs for supporting regulatory compliance requirements. These increased costs require us to divert a significant amount of money that could otherwise be used to expand the business and achieve strategic objectives. Advocacy efforts by stockholders and third parties may also prompt additional changes in governance and reporting practices, which could further increase our compliance costs.
In addition, we implemented an enterprise resource planning (“ERP”), system for our company. An ERP system is intended to combine and streamline the management of our financial, accounting, human resources, sales and marketing and other functions, enabling us to manage operations and track performance more effectively. However, an ERP system will likely require us to complete many processes and procedures for the effective use of the system or to run our business using the system, which may result in substantial costs. If a major system upgrade to our ERP system is required in the future, we will incur additional system implementation costs. Additionally, any disruptions or difficulties in using an ERP system could adversely affect our controls and harm our business, including our ability to forecast or make sales and collect our receivables. Moreover, such disruption or difficulties could result in unanticipated costs and diversion of management attention.
We have expended significant resources as a public company to comply with Section 404(a)of the Sarbanes-Oxley Act of 2002, which compliance costs may increase as our operations expand. Any failure to maintain effective controls and procedures could negatively impact our business.
We are subject to Section 404 of the Sarbanes-Oxley Act of 2002. The standards required for a public company under Section 404(a) of the Sarbanes-Oxley Act of 2002 are significantly more stringent than those that were required of us as a privately held company. Management may not be able to maintain effective controls and procedures that adequately respond to these increased regulatory compliance and reporting requirements. Further, we need to incorporate any future acquired acquisitions into our existing system of internal controls and procedures, which will further increase our compliance costs, may require additional staff, and will likely divert the attention of management in the transition and integration period. If we are not able to maintain the requirements of Section 404(a) in a timely manner or with adequate compliance, we may not be able to assess whether our internal controls over financial reporting are effective,
which may subject us to adverse regulatory consequences and could harm investor confidence and the market price of our securities.
We are required, pursuant to Section 404 of the Sarbanes-Oxley Act of 2002, to furnish a report by management on, among other things, the effectiveness of our internal control over financial reporting. This assessment includes disclosure of any material weaknesses identified by our management in our internal control over financial reporting. In addition, our independent registered public accounting firm is required to attest to the effectiveness of our internal control over financial reporting. Our compliance with Section 404 requires that we incur substantial expenses and expend significant management efforts. As we continue to expand our operations, including into international locations, we use a combination of our in-house Internal Audit team and third party service providers to assess and improve effectiveness of our internal controls over financial reporting, and we will likely expend more resources to hire additional accounting and finance staff with appropriate public company experience, technical accounting knowledge, and local knowledge, to update and refine the process documentation and internal controls for Section 404 compliance at each of our operational locations.
We have previously been, currently are, and may in the future be involved in class-action lawsuits and other litigation matters that are expensive and time-consuming. If resolved adversely, lawsuits and other litigation matters could seriously harm our business.
We have previously been, currently are, and may in the future be subject to litigation such as putative class action and shareholder derivative lawsuits brought by stockholders. We may be a target for additional lawsuits in the future. Please refer to Note 10 to the financial statements in Part II of this Annual Report on Form 10-K for a discussion of pending litigation.
Any litigation to which we are a party may result in an onerous or unfavorable judgment that may not be reversed on appeal, or we may decide to settle lawsuits on similarly unfavorable terms. Any such negative outcome could result in payments of substantial monetary damages, which would negatively impact our business and stock price, and to the extent such damages are paid in stock rather than cash, would result in dilution to our current stockholders. The results of lawsuits and claims cannot be predicted with certainty. Regardless of the final outcome, defending litigation is costly and can impose a significant burden on management and employees. We have in the past, and may in the future, receive unfavorable preliminary, interim, or final rulings in pending matters, which could damage our reputation and seriously harm our business.
Risks Related to Our Capital Needs and Capital Strategy
We may not have adequate funds to finance our operating needs and our growth, and may need to raise additional capital, which we may not be able to do.
The design, manufacture and sale of batteries is a capital-intensive business. As a result of the capital-intensive nature of our business, we can be expected to continue to sustain substantial operating expenses without generating sufficient revenue to cover expenditures. We may need to raise additional capital to expand our current production capabilities or to acquire additional manufacturing lines and facilities in the jurisdictions in which we operate. Adequate additional funding may not be available to us on acceptable terms or at all, and if the financial markets become difficult or costly to access, including due to rising interest rates, fluctuations in foreign currency exchange rates or other changes in economic conditions, our ability to raise additional capital may be negatively impacted. Our failure to raise capital in the future would have a negative impact on our ability to expand our existing manufacturing facilities for additional production lines or improve the production line capability, which would in turn negatively impact our ability to pursue our business strategies. The amount of capital that we will be required to raise, and our ability to raise substantial additional capital, will depend on many factors, including, but not limited to:
•our ability and the cost to develop our new and complex manufacturing process that will produce lithium-ion batteries in a cost-effective manner;
•our ability to continue to build-out and scale our Malaysia manufacturing facility in a timely and cost-effective manner;
•our ability to locate and acquire new, larger manufacturing facilities on commercially reasonable terms;
•our ability to build out our new, larger manufacturing facilities in a cost-effective manner;
•the cost of preparing to manufacture lithium-ion batteries on a larger scale;
•the costs of commercialization activities including product sales, marketing, manufacturing and distribution;
•our ability to hire additional personnel;
•the demand for our lithium-ion batteries and the prices for which we will be able to sell our lithium-ion batteries;
•the emergence of competing technologies or other adverse market developments; and
•volatility in the equity markets, including as a result of rising interest rates, inflation or war or other armed conflict, such as Russia’s invasion of Ukraine.
Our long-term financial model assumes we expand both on our own and by partnering with other battery companies. Should we not be able to achieve these partnering goals we would have to expand purely on our own. This would require additional capital and could impact how fast we can ramp revenue and achieve profitability. It could also impact our ability to service some customers that require second sources for supply. Additionally, if we can achieve these partnerships but not on the financial terms we are assuming, it could impact our financial performance.
Further, we cannot guarantee that our business will generate sufficient cash flow from operations to fund our capital expenditures or other liquidity needs. Over time, we expect that we will need to raise additional funds through the issuance of equity, equity-related or debt securities or through obtaining credit from financial institutions to fund, together with our principal sources of liquidity, ongoing costs such as research and development relating to our batteries, any significant unplanned or accelerated expenses and new strategic investments.
As discussed in the consolidated financial statements, in Part II, Item 8 of this Annual Report on Form 10-K, we are not profitable and have incurred losses in each year since our inception. We incurred a net loss attributable to Enovix of $222.2 million and $214.1 million, respectively, for the fiscal years ended December 29, 2024 and December 31, 2023. As of December 29, 2024, we had an accumulated deficit of $821.1 million. We anticipate these losses will increase as we continue our manufacturing scale up, add additional manufacturing capacity, continue commercialization and continue to operate as a public company and comply with legal, accounting and other regulatory requirements. We currently expect to continue to incur losses in fiscal year 2025 until we achieve scale in the near future. We cannot be certain that additional capital will be available on attractive terms, if at all, when needed, which could be dilutive to stockholders, and our financial condition, results of operations, business and prospects could be materially and adversely affected.
Raising additional funds may cause dilution to existing stockholders and/or may restrict our operations or require us to relinquish proprietary rights.
To the extent that we raise additional capital by issuing equity or convertible debt securities, our existing stockholders may experience substantial dilution, and the terms of these issued securities may include liquidation or other preferences that adversely affect the rights of our existing common stockholders. For example, we may issue debt or equity securities under our shelf registration statement filed with the SEC in August 2023, including in an at-the-market (“ATM”) offering under our ATM facility, or we may issue debt or equity securities in private transactions. Any agreements for future debt or preferred equity financings, if available, may involve covenants limiting or restricting our ability to take specific actions, such as raising additional capital, incurring additional debt, making capital expenditures or declaring dividends. In addition, if we raise additional funds through collaborations, strategic alliances or marketing, distribution or licensing arrangements with third parties, we may be required to relinquish valuable rights to our technologies or future revenue streams. If we incur additional debt, the debt holders, together with holders of our outstanding Convertible Senior Notes, would have rights senior to holders of common stock to make claims on our assets, and the terms of any future debt could restrict our operations, including our ability to pay dividends on our common stock.
Risks Related to Our Convertible Senior Notes
Servicing our debt requires a significant amount of cash, and we may not have sufficient cash flow from our business to pay our substantial debt.
Our ability to make scheduled payments of the principal of, to pay interest on or to refinance our indebtedness, including the Convertible Senior Notes, depends on our future performance, which is subject to economic, financial, competitive and other factors beyond our control. Our business may not continue to generate cash flow from operations in the future sufficient to service our debt and make necessary capital expenditures. If we are unable to generate such cash flow, we may be required to adopt one or more alternatives, such as selling assets, restructuring debt or obtaining additional equity capital on terms that may be onerous or highly dilutive. Our ability to refinance our indebtedness will depend on the capital markets and our financial condition at such time. We may not be able to engage in any of these activities or engage in these activities on desirable terms, which could result in a default on our debt obligations, including the Convertible Senior Notes.
The conditional conversion feature of the Convertible Senior Notes, if triggered, may adversely affect our financial condition and operating results.
In the event the conditional conversion feature of the Convertible Senior Notes is triggered, holders of the Convertible Senior Notes will be entitled to convert their notes at any time during specified periods at their option. If one or more holders elect to convert their notes, unless we elect to satisfy our conversion obligation by delivering solely shares of our common stock (other than paying cash in lieu of delivering any fractional share), we would be required to settle a portion or all of our conversion obligation through the payment of cash, which could adversely affect our liquidity. In addition, even if holders do not elect to convert their notes, we could be required under applicable accounting rules to reclassify all or a portion of the outstanding principal of the Convertible Senior Notes as a current rather than long-term liability, which would result in a material reduction of our net working capital.
Certain provisions in the indenture governing the Convertible Senior Notes may delay or prevent an otherwise beneficial takeover attempt of us.
Certain provisions in the indenture governing the Convertible Senior Notes may make it more difficult or expensive for a third party to acquire us. For example, the indenture governing the Convertible Senior Notes will require us to repurchase the Convertible Senior Notes for cash upon the occurrence of a fundamental change and, in certain circumstances, to increase the conversion rate for a holder that converts its notes in connection with a make-whole fundamental change. A takeover of us may trigger the requirement that we repurchase the Convertible Senior Notes and/or increase the conversion rate, which could make it costlier for a potential acquirer to engage in such takeover. Such additional costs associated with these and other provisions of the indenture governing our Convertible Senior Notes may have the effect of delaying or preventing a takeover of us that would otherwise be beneficial to investors.
Conversion of the Convertible Senior Notes may dilute the ownership interest of our stockholders or may otherwise depress the price of our common stock.
The conversion of some or all of the Convertible Senior Notes may dilute the ownership interests of our stockholders. Upon conversion of the Convertible Senior Notes, we have the option to pay or deliver, as the case may be, cash, shares of our common stock, or a combination of cash and shares of our common stock. If we elect to settle our conversion obligation in shares of our common stock or a combination of cash and shares of our common stock, any sales in the public market of our common stock issuable upon such conversion could adversely affect prevailing market prices of our common stock. In addition, the existence of the Convertible Senior Notes may encourage short selling by market participants because the conversion of the Convertible Senior Notes could be used to satisfy short positions, or anticipated conversion of the Convertible Senior Notes into shares of our common stock could depress the price of our common stock.
The accounting method for the Convertible Senior Notes could adversely affect our reported financial condition and results.
The accounting method for reflecting the Convertible Senior Notes, including our Affiliate Notes (each as defined in Note 9 “Borrowings” in the notes to our consolidated financial statements in Part II, Item 8 of this Report) on our consolidated balance sheet, accruing interest expense for the Convertible Senior Notes and reflecting the underlying shares of our common stock in our reported diluted earnings per share may adversely affect our reported earnings and financial condition.
In August 2020, the Financial Accounting Standards Board published Accounting Standards Update 2020-06 (“ASU 2020-06”), which simplified certain of the accounting standards that apply to convertible notes. ASU 2020-06 eliminated the cash conversion and beneficial conversion feature modes used to separately account for embedded conversion features as a component of equity. Instead, an entity would account for convertible debt or convertible preferred stock
securities as a single unit of account, unless the conversion feature requires bifurcation and recognition as derivatives. Additionally, the guidance requires entities to use the “if-converted” method for all convertible instruments in the diluted earnings per share calculation and to include the effect of potential share settlement for instruments that may be settled in cash or shares. ASU 2020-06 became effective for us beginning on January 1, 2022.
In accordance with ASU 2020-06, we recorded the Convertible Senior Notes as a liability on our consolidated balance sheets, with the initial carrying amount equal to the principal amount of the Convertible Senior Notes, net of issuance costs. The issuance costs are treated as a debt discount for accounting purposes, which are amortized into interest expense over the term of the Convertible Senior Notes. As a result of this amortization, the interest expense that we recognize for the Convertible Senior Notes for accounting purposes is greater than the cash interest payments we will pay on the Convertible Senior Notes, which will result in lower reported income.
In addition, the shares of common stock underlying the Convertible Senior Notes are reflected in our diluted earnings per share using the “if converted” method, if dilutive, in accordance with ASU 2020-06. Under that method, diluted earnings per share are generally calculated assuming that all the Convertible Senior Notes were converted solely into shares of common stock at the beginning of the reporting period, unless the result would be anti-dilutive. The application of the if-converted method may reduce our reported diluted earnings per share to the extent we are profitable in the future, and accounting standards may change in the future in a manner that may adversely affect our diluted earnings per share.
Furthermore, if any of the conditions to the convertibility of the Convertible Senior Notes is satisfied, then we may be required under applicable accounting standards to reclassify the liability carrying value of the Convertible Senior Notes as a current, rather than a long-term, liability. This reclassification could be required even if no noteholders or holders of Affiliate Notes convert their Convertible Senior Notes or Affiliate Notes, respectively, following the satisfaction of those conditions and could materially reduce our reported working capital.
The capped call transactions may affect the value of the Convertible Senior Notes and our common stock.
In connection with the pricing of the Convertible Senior Notes and the exercise by the initial purchasers of their option to purchase additional Convertible Senior Notes, we entered into capped call transactions (the “Capped Call Transactions”) with certain of the initial purchasers or affiliates thereof and/or other financial institutions (the “Option Counterparties”). The Capped Call Transactions will cover, subject to customary adjustments, the number of shares of our common stock initially underlying the Convertible Senior Notes. The Capped Call Transactions are expected generally to reduce the potential dilution to our common stock upon any conversion of notes and/or offset any cash payments we are required to make in excess of the principal amount of converted notes, as the case may be, with such reduction and/or offset subject to a cap.
In connection with establishing their initial hedges of the Capped Call Transactions, the Option Counterparties or their respective affiliates likely entered into various derivative transactions with respect to our common stock and/or purchased shares of our common stock concurrently with or shortly after the pricing of the Convertible Senior Notes, including with, or from, as the case may be, certain investors in the Convertible Senior Notes.
In addition, the Option Counterparties and/or their respective affiliates may modify their hedge positions by entering into or unwinding various derivatives with respect to our common stock and/or purchasing or selling our common stock or other securities of ours in secondary market transactions prior to the maturity of the Convertible Senior Notes (and are likely to do so on each exercise date of the Capped Call Transactions, or, to the extent we exercise the relevant election under the Capped Call Transactions, following any repurchase, redemption, or conversion of the Convertible Senior Notes).
We cannot make any prediction as to the direction or magnitude of any potential effect that the transactions described above may have on the price of the Convertible Senior Notes or the shares of our common stock. Any of these activities could adversely affect the value of the Convertible Senior Notes and our common stock.
We are subject to counterparty risk with respect to the Capped Call Transactions.
The Option Counterparties are financial institutions, and we will be subject to the risk that any or all of them might default under the Capped Call Transactions. Our exposure to the credit risk of the Option Counterparties will not be secured by any collateral.
If an Option Counterparty becomes subject to insolvency proceedings, we will become an unsecured creditor in those proceedings with a claim equal to our exposure at that time under the capped call transaction with such Option
Counterparty. Our exposure will depend on many factors but, generally, an increase in our exposure will be correlated to an increase in the market price and in the volatility of our common stock. In addition, upon a default by an Option Counterparty, we may suffer more dilution than we currently anticipate with respect to our common stock. We can provide no assurances as to the financial stability or viability of the Option Counterparties.
Risks Related to Our Intellectual Property
We rely heavily on our intellectual property portfolio. If we are unable to protect our intellectual property rights, our business and competitive position would be harmed.
We may not be able to prevent unauthorized use of our intellectual property, which could harm our business and competitive position. We rely upon a combination of the intellectual property protections afforded by patent, copyright, trademark and trade secret laws in the U.S. and other jurisdictions, as well as license agreements and other contractual protections, to establish, maintain and enforce rights in our proprietary technologies. In addition, we seek to protect our intellectual property rights through nondisclosure and invention assignment agreements with our employees and consultants and through non-disclosure agreements with business partners and other third parties. Despite our efforts to protect our proprietary rights, third parties may attempt to copy or otherwise obtain and use our intellectual property or be able to design around our intellectual property. Monitoring unauthorized use of our intellectual property is difficult and costly, and the steps we have taken or will take to prevent misappropriation may not be sufficient. Any enforcement efforts we undertake, including litigation, could be time-consuming and expensive and could divert management’s attention, which could harm our business, results of operations and financial condition. Moreover, our intellectual property is stored on computer systems that could be penetrated by intruders and potentially misappropriated. There is no guarantee that our efforts to protect our computer systems will be effective. In addition, existing intellectual property laws and contractual remedies may afford less protection than needed to safeguard our intellectual property portfolio.
Patent, copyright, trademark and trade secret laws vary significantly throughout the world. A number of foreign countries do not protect intellectual property rights to the same extent as do U.S. laws. Therefore, our intellectual property rights may not be as strong or as easily enforced outside the U.S., and efforts to protect against the unauthorized use of our intellectual property rights, technology and other proprietary rights may be more expensive and difficult outside the U.S. Further, we have not established our intellectual property rights in all countries in the world, and competitors may copy our designs and technology and operate in countries in which we have not prosecuted our intellectual property. Failure to adequately protect our intellectual property rights could result in our competitors using our intellectual property to offer products, and competitors’ ability to design around our intellectual property would enable competitors to offer similar or better batteries, in each case potentially resulting in the loss of some of our competitive advantage and a decrease in our revenue, which would adversely affect our business, prospects, financial condition and operating results.
We may need to defend ourselves against intellectual property infringement claims, which may be time-consuming and could cause us to incur substantial costs.
Companies, organizations or individuals, including our current and future competitors, may hold or obtain patents, trademarks or other proprietary rights that would prevent, limit or interfere with our ability to make, use, develop or sell our products, which could make it more difficult for us to operate our business. From time to time, we may receive inquiries from holders of patents or trademarks inquiring whether we are infringing their proprietary rights and/or seek court declarations that they do not infringe upon our intellectual property rights. Companies holding patents or other intellectual property rights relating to batteries, electric motors or electronic power management systems may bring suits alleging infringement of such rights or otherwise asserting their rights and seeking licenses. In addition, if we are determined to have infringed upon a third party’s intellectual property rights, we may be required to do one or more of the following:
•cease selling, incorporating or using products that incorporate the challenged intellectual property;
•pay substantial damages;
•obtain a license from the holder of the infringed intellectual property right, which license may not be available on reasonable terms or at all; or
•redesign our batteries.
In the event of a successful claim of infringement against us and our failure or inability to obtain a license to the infringed technology, our business, prospects, operating results and financial condition could be materially adversely affected. In addition, any litigation or claims, whether or not valid, could result in substantial costs and diversion of resources and management’s attention.
We may also license patents and other intellectual property from third parties, and we may face claims that our use of this intellectual property infringes the rights of others. In such cases, we may seek indemnification from our licensors under our license contracts with them. However, our rights to indemnification may be unavailable or insufficient to cover our costs and losses, depending on our use of the technology, whether we choose to retain control over conduct of the litigation and other factors.
Our patent applications may not result in issued patents or our patent rights may be contested, circumvented, invalidated or limited in scope, any of which could have a material adverse effect on our ability to prevent others from interfering with our commercialization of our products.
Our patent applications may not result in issued patents, which may have a material adverse effect on our ability to prevent others from commercially exploiting products similar to ours. The status of patents involves complex legal and factual questions and the breadth of claims allowed is uncertain. As a result, we cannot be certain that the patent applications that we file will result in patents being issued or that our patents and any patents that may be issued to us will afford protection against competitors with similar technology. Numerous patents and pending patent applications owned by others exist in the fields in which we have developed and are developing our technology. In addition to those who may claim priority, any of our existing or pending patents may also be challenged by others on the basis that they are otherwise invalid or unenforceable. Furthermore, patent applications filed in foreign countries are subject to laws, rules and procedures that differ from those in the U.S., and thus we cannot be certain that foreign patent applications related to issued U.S. patents will be issued.
Even if our patent applications succeed and we are issued patents in accordance with them, it is still uncertain whether these patents will be contested, circumvented, invalidated or limited in scope in the future. The rights granted under any issued patents may not provide us with meaningful protection or competitive advantages, and some foreign countries provide significantly less effective patent enforcement than in the U.S. In addition, the claims under any patents that issue from our patent applications may not be broad enough to prevent others from developing technologies that are similar or that achieve results similar to ours. The intellectual property rights of others could also bar us from licensing and exploiting any patents that issue from our pending applications. In addition, patents issued to us may be infringed upon or designed around by others, and others may obtain patents that we need to license or design around, either of which would increase costs and may adversely affect our business, prospects, financial condition and operating results.
Risks Related to Our Regulatory Compliance
We may encounter regulatory approval difficulties which could delay our ability to launch our lithium-ion battery cells, and compliance with regulatory laws may limit their usefulness.
Any delay in the development and manufacturing scale-up of our lithium-ion battery cells would negatively impact our business as it will delay time to revenue and negatively impact our customer relationships. For example, although we plan to successfully pass all required regulatory abuse testing, because our design is new and has very high energy density, there may be unanticipated failure modes that occur in the field which could delay or prevent us from launching our batteries. Further, there are current limits on the amount of energy that can be transported using different delivery methods, particularly air travel. These limits on battery transportation have historically been based on the energy of batteries currently on the market. If battery transportation regulations remain static or the energy capacity of new batteries is deemed unsafe at certain levels, our transportation options may be limited, which could increase the costs and duration of shipping of our finished product and reduce customer use of our batteries in certain locations. This could increase our inventory costs and limit sales of our batteries in some markets.
We are subject to substantial regulation, and unfavorable changes to, or our failure to comply with, these regulations could substantially harm our business and operating results.
Our batteries are subject to substantial regulation under international, federal, state and local laws, including export control laws. We expect to incur significant costs in complying with these regulations. Regulations related to the battery and alternative energy are currently evolving, and we face risks associated with changes to these regulations.
To the extent the laws change, our products may not comply with applicable international, federal, state or local laws, which would have an adverse effect on our business. Compliance with changing regulations could be burdensome, time consuming and expensive. To the extent compliance with new regulations is cost prohibitive, our business, prospects, financial condition and operating results would be adversely affected.
Internationally, there may be laws in jurisdictions we have not yet entered or laws we are unaware of in jurisdictions we have entered that may restrict our sales or other business practices. The laws in this area can be complex, difficult to interpret and may change over time. Continued regulatory limitations and other obstacles that may interfere with our ability to commercialize our products could have a negative and material impact on our business, prospects, financial condition and results of operations.
We are subject to a variety of laws and regulations related to the safety and transportation of our batteries. Our failure to comply with these laws and regulations may have a material adverse effect on our business and results of operations.
Many federal, state and local authorities require certification by Underwriters Laboratory, Inc., an independent, not-for-profit corporation engaged in the testing of products for compliance with certain public safety standards, or other safety regulation certification prior to marketing battery cells. Foreign jurisdictions also have regulatory authorities overseeing the safety of consumer products. Our products may not meet the specifications required by these authorities. A determination that any of our products are not in compliance with these rules and regulations could result in the imposition of fines or an award of damages to private litigants.
In addition, lithium batteries have been identified as a Class 9 dangerous good during transport. To be safely transported (by air, sea, rail or roadways), they must meet various international, national, state and local authorities, including, for example, the provisions laid out in United Nations standard UN 38.3. This standard applies to batteries transported either on their own or installed in a device. UN 38.3 has been adopted by regulators and competent authorities around the world, thus making it a requirement for global market access. Any failure to fully comply with such international or other transportation safety standards could subject us to increased costs or future liabilities.
We are subject to requirements relating to environmental and safety regulations and environmental remediation matters which could adversely affect our business, results of operations and reputation.
We are subject to numerous federal, state and local environmental laws and regulations governing, among other things, solid and hazardous waste storage, treatment and disposal and remediation of releases of hazardous materials. There are significant capital, operating and other costs associated with compliance with these environmental laws and regulations. Environmental laws and regulations may become more stringent in the future, which could increase costs of compliance or require us to manufacture with alternative technologies and materials.
Federal, state and local authorities also regulate a variety of matters, including, but not limited to, health, safety and permitting in addition to the environmental matters discussed above. New legislation and regulations may require us to make material changes to our operations, resulting in significant increases to the cost of production.
Our manufacturing process will have hazards such as, but not limited to, hazardous materials, machines with moving parts and high voltage and/or high current electrical systems typical of large manufacturing equipment and related safety incidents. There may be safety incidents that damage machinery or product, slow or stop production or harm employees. Consequences may include litigation, regulation, fines, increased insurance premiums, mandates to temporarily halt production, workers’ compensation claims or other actions that impact the company brand, finances or ability to operate.
We may continue to incur compliance costs under foreign trade zone laws and regulations, with no corresponding benefits.
Our Fab1 manufacturing facility in Fremont, California was established as a foreign trade zone through qualification with U.S. Customs. Materials received in a foreign trade zone are not subject to certain U.S. duties or tariffs until the
material enters U.S. commerce. While there are certain benefits associated with foreign trade zone status, such as a reduction in duty and tariff costs, there are increased compliance and personnel costs with maintaining this qualification. Following the 2024 relocation of our manufacturing operations to Malaysia, we are evaluating whether to continue with our foreign trade zone qualification at our Fremont location. To the extent our U.S. location no longer benefits from this qualification, we may be obligated to continue incurring certain compliance costs for a period of time, which could have an adverse effect on our business and results of operations.
Risks Related to Ownership of Our Securities
The trading price of our common stock may be volatile, and the value of our common stock may decline.
Historically, our stock price has been volatile and the trading price of our securities could continue to be volatile. The trading price of our common stock is subject to wide fluctuations in response to various factors, many of which are beyond our control. Any of the factors listed below could have a material adverse effect on your investment in our securities and our securities may trade at prices significantly below the price you paid. In such circumstances, the trading price of our securities may not recover and may experience a further decline.
Factors affecting the trading price of our securities:
•actual or anticipated fluctuations in our quarterly financial results or the quarterly financial results of companies perceived to be similar to us;
•changes in the market’s expectations about our operating results;
•market perception and speculation regarding announcements of new product or customer agreements;
•success of competitors;
•our operating results failing to meet the expectation of securities analysts or investors in a particular period;
•changes in financial estimates and recommendations by securities analysts concerning us or the market in general;
•operating and stock price performance of other companies that investors deem comparable to us;
•our ability to develop product candidates;
•changes in laws and regulations affecting our business;
•commencement of, or involvement in, litigation involving us;
•changes in our capital structure, such as future issuances of securities or the incurrence of additional debt;
•the volume of shares of our securities available for public sale;
•any major change in our board of directors or management;
•sales of securities convertible into shares of our capital stock by us;
•sales of substantial amounts of common stock by our directors, executive officers or significant stockholders or the perception that such sales could occur; and
•general economic and political conditions such as recessions, interest rates, fuel prices, international currency fluctuations and acts of war or other armed conflict or terrorism.
Broad market and industry factors may materially harm the market price of our securities irrespective of our operating performance. The stock market in general and the Nasdaq Global Select Market in particular have experienced price and volume fluctuations that have often been unrelated or disproportionate to the operating performance of the particular companies affected. The trading prices and valuations of these stocks, and of our securities, are not predictable. A loss of investor confidence in the market for battery company stocks or the stocks of other companies which investors perceive to be similar to us could depress our stock price regardless of our business, prospects, financial conditions or results of operations. A decline in the market price of our securities also could adversely affect our ability to issue additional securities and our ability to obtain additional financing in the future.
Furthermore, short sellers may engage in manipulative activity intended to drive down the market price of target company stock. We have in the past been the subject of a short seller report containing certain allegations against us. While we reviewed the allegations in such report and believe them to be unsubstantiated, we may in the future become subject to additional unfavorable reports, which may cause us to expend a significant number of resources to investigate such allegations and may lead to increased volatility in the price of our common stock.
If securities or industry analysts do not publish or cease publishing research or reports about us, our business, or our market, or if they change their recommendations regarding our securities adversely, the price and trading volume of our securities could decline.
The trading market for our securities is influenced by the research and reports that industry or securities analysts may publish about us, our business, our market, or our competitors. If any of the analysts who currently cover us change their recommendation regarding our stock adversely, or provide more favorable relative recommendations about our competitors, the price of our securities would likely decline. If any analyst who currently covers us were to cease coverage of us or fail to regularly publish reports on us, we could lose visibility in the financial markets, which could cause our stock price or trading volume to decline. If we obtain additional coverage and any new analyst issues an adverse or misleading opinion regarding us, our business model, our intellectual property or our stock performance, or if our operating results fail to meet the expectations of analysts, our stock price could decline.
The future sales of shares by existing stockholders may adversely affect the market price of our common stock.
Sales of a substantial number of shares of our common stock in the public market could occur at any time. If our stockholders sell, or the market perceives that our stockholders intend to sell, substantial amounts of our common stock in the public market, the market price of our common stock could decline. We have a total of 191,273,833 shares of common stock outstanding as of February 19, 2025. All of our outstanding shares are eligible for sale in the public market, other than shares and options held by directors, executive officers, and other affiliates that are subject to volume limitations under Rule 144 of the Securities Act, various vesting agreements, and restrictive legends that limit sales other than under an effective registration statement. Additionally, the shares of common stock subject to outstanding options and restricted stock unit awards under our equity incentive plans and the shares reserved for future issuance under our equity incentive plans will become eligible for sale in the public market upon issuance, subject to the applicable provisions of our insider trading policy.
Private Placement Warrants are exercisable for our common stock, which would increase the number of shares eligible for future resale in the public market and result in dilution to our stockholders.
In connection with the initial public offering of our predecessor entity, Rodgers Silicon Valley Acquisition Corp. (“RSVAC”), RSVAC issued and sold 6,000,000 private placement warrants (the “Private Placement Warrants”) to Rodgers Capital, LLC, which entity subsequently distributed the Private Placement Warrants to its Series B Unit holders. Each Private Placement Warrant is exercisable for one share of common stock at an exercise price of $11.50 per share. There are 5,500,000 Private Placement Warrants outstanding following the exercise of warrants by one warrant holder in July 2024.
To the extent Private Placement Warrants are exercised, additional shares of our common stock will be issued, which will result in dilution to our existing common stockholders, and increase the number of our shares eligible for resale in the public market.
Sales of a substantial number of these shares in the public market, or the perception of such sales, could adversely affect the market price of our common stock. The Private Placement Warrants expire on July 14, 2026, or earlier upon redemption or liquidation, as more fully described in the Warrant Agreement, dated July 31, 2021, filed as an exhibit to our Annual Report on Form 10-K.
An active trading market for our securities may not continue, which would adversely affect the liquidity and price of our securities.
The price of our securities may fluctuate significantly due to general market and economic conditions and an active trading market for our securities may not be sustained. In addition, the price of our securities can vary due to general economic conditions and forecasts, our general business condition and the release of our financial reports. If our securities are not listed on, or for any reason become delisted from, the Nasdaq Global Select Market and are quoted on the OTC Bulletin Board, an inter-dealer automated quotation system for equity securities that is not a national securities
exchange, the liquidity and price of our securities will be adversely affected. You may be unable to sell your securities if an active trading market for our securities cannot be sustained and/or the securities are no longer listed on the Nasdaq Global Select Market or other national securities exchange.
There can be no assurance that we will be able to comply with the continued listing standards of the Nasdaq Global Select Market.
If the Nasdaq Global Select Market delists our securities from trading on its exchange for failure to meet the listing standards, we and our stockholders could face significant material adverse consequences including:
•a limited availability of market quotations for our securities;
•a determination that our common stock is a “penny stock” which will require brokers trading in our common stock to adhere to more stringent rules, possibly resulting in a reduced level of trading activity in the secondary trading market for our common stock;
•a limited amount of analyst coverage; and
•a decreased ability to issue additional securities or obtain additional financing in the future.
Our amended and restated certificate of incorporation provides that the Court of Chancery of the State of Delaware and U.S. federal district courts will be the exclusive forums for certain disputes between us and our stockholders, which could limit our stockholders’ ability to choose the judicial forum for disputes with us or our directors, officers or employees.
Our amended and restated certificate of incorporation provides that the Court of Chancery of the State of Delaware (or, if and only if the Court of Chancery of the State of Delaware lacks subject matter jurisdiction, any state court located within the State of Delaware or, if and only if all such state courts lack subject matter jurisdiction, the federal district court for the District of Delaware) is the exclusive forum for:
•any derivative action or proceeding brought on our behalf;
•any action asserting a claim of breach of fiduciary duty owed by any of our current or former directors, officers or other employees to us or our stockholders;
•any action asserting a claim against us by any of our current or former directors, officers or other employees to us or our stockholders arising under the Delaware General Corporation Law, our amended and restated certificate of incorporation or our amended and restated bylaws;
•any action or proceeding to interpret, apply, enforce or determine the validity of the amended and restated certificate of incorporation or the amended or restated bylaws (including any right, obligation or remedy thereunder);
•any action or proceeding as to which the General Corporation Law of the State of Delaware confers jurisdiction to the Court of Chancery of the State of Delaware; and
•any action asserting a claim against us or any of our current or former directors, officers or other employees that is governed by the internal affairs doctrine, in all cases to the fullest extent permitted by law and subject to the court’s having personal jurisdiction over the indispensable parties named as defendants.
This exclusive-forum provision would not apply to suits brought to enforce a duty or liability created by the Exchange Act or any other claim for which the federal courts have exclusive jurisdiction, or the Securities Act. In addition, to prevent having to litigate claims in multiple jurisdictions and the threat of inconsistent or contrary rulings by different courts, among other considerations, our amended and restated certificate of incorporation provides that, unless we consent in writing to the selection of an alternative forum, to the fullest extent permitted by law, U.S. federal district courts will be the exclusive forum for resolving any complaint asserting a cause of action arising under the Securities Act. However, Section 22 of the Securities Act creates concurrent jurisdiction for federal and state courts over all suits brought to enforce any duty or liability created by the Securities Act or the rules and regulations thereunder. Accordingly, both state and federal courts have jurisdiction to entertain such claims. As noted above, our amended and restated certificate of incorporation provides that U.S. federal district courts will be the exclusive forum for the resolution of any complaint asserting a cause of action under the Securities Act. Due to the concurrent jurisdiction for federal and
state courts created by Section 22 of the Securities Act over all suits brought to enforce any duty or liability created by the Securities Act or the rules and regulations thereunder, there is uncertainty as to whether a court would enforce the exclusive form provision. Our amended and restated certificate of incorporation further provides that any person or entity holding, owning or otherwise acquiring any interest in any of our securities shall be deemed to have notice of and consented to these provisions. Investors also cannot waive compliance with the federal securities laws and the rules and regulations thereunder.
These exclusive-forum provisions may limit a stockholder’s ability to bring a claim in a judicial forum that it finds favorable for disputes with us or our directors, officers or other employees. While the Delaware courts have determined that such choice of forum provisions are facially valid, a stockholder may nevertheless seek to bring such a claim arising under the Securities Act against us or our directors, officers or other employees in a venue other than in U.S. federal district courts. In such instance, we would expect to vigorously assert the validity and enforceability of the exclusive forum provisions of our amended and restated certificate of incorporation. This may require significant additional costs associated with resolving such action in other jurisdictions and we cannot assure you that the provisions will be enforced by a court in those other jurisdictions. If a court were to find either exclusive-forum provision in our amended and restated certificate of incorporation to be inapplicable or unenforceable in an action, we may incur further significant additional costs associated with resolving the dispute in other jurisdictions, all of which could harm our business.
General Risk Factors
We have been, and may in the future be, involved in legal proceedings and commercial or contractual disputes, which could have an adverse impact on our profitability and consolidated financial position.
We may be involved in legal proceedings and commercial or contractual disputes that, from time to time, are significant. These are typically claims that arise in the normal course of business including, without limitation, commercial or contractual disputes, including warranty claims and other disputes with potential customers and suppliers, intellectual property matters, personal injury claims, environmental issues, tax matters and employment matters. Please refer to Note 10 to the financial statements in Part II of this Annual Report on Form 10-K for a discussion of pending litigation.
It is difficult to predict the outcome, duration or ultimate financial exposure, if any, represented by these matters, and there can be no assurance that any such exposure will not be material. Such contractual disputes and claims may also divert management’s attention away from our business operations, negatively affect our reputation and/or result in increased compliance costs.
Global conflicts could adversely impact our business, costs, supply chain, sales, financial condition or results of operations.
Recent global conflicts, such as the Russia’s invasion of Ukraine and the war in Yemen, have led the U.S. and certain other countries to impose significant sanctions and trade actions or have slowed down shipping options, and the U.S. and certain other countries could impose further sanctions, trade restrictions and other retaliatory actions, and affect shipment of products. It is not possible to predict the broader consequences of the conflicts, including related geopolitical tensions, and the measures and retaliatory actions taken by the U.S. and other countries in respect thereof, as well as any counter measures or retaliatory actions taken in response, have caused and are likely to continue to cause regional instability and geopolitical shifts. Further, such conflicts have in the past, and will likely continue to, materially adversely affected global trade, currency exchange rates, regional economies and the global economy. While it is difficult to anticipate the impact of any of the foregoing on the Company, such conflicts, and any similar future conflicts, including as a result of rising tensions between China and Taiwan, and actions taken in response to the conflict, could increase our costs, disrupt our supply chain, reduce our sales and earnings, impair our ability to raise additional capital when needed on acceptable terms, if at all, or otherwise adversely affect our business, financial condition and results of operations.
We may become subject to product liability claims, which could harm our financial condition and liquidity if we are not able to successfully defend or insure against such claims.
Highly publicized incidents of laptop computers and cell phones bursting into flames have focused attention on the safety of lithium-ion batteries. If one of our products were to cause personal injury or property damage, including as a result of product malfunctions, defects or improper installation leading to a fire or other hazardous condition, we may become subject to product liability claims, even those without merit, which could harm our business, prospects,
operating results and financial condition. We face inherent risk of exposure to claims in the event our batteries do not perform as expected or malfunction resulting in personal injury or death. Our risks in this area are particularly pronounced given our batteries have a limited history of commercial testing and mass production. A successful product liability claim against us could require us to pay a substantial monetary award. Moreover, a product liability claim could generate substantial negative publicity about our batteries and business and inhibit or prevent commercialization of other future battery product candidates, which would have material adverse effect on our brand, business, prospects and operating results. Any insurance coverage might not be sufficient to cover all potential product liability claims. Any lawsuit seeking significant monetary damages either in excess of our coverage, or outside of our coverage, may have a material adverse effect on our reputation, business and financial condition. We may not be able to secure additional product liability insurance coverage on commercially acceptable terms or at reasonable costs when needed, particularly if we do face liability for our products and are forced to make a claim under our policy.
If our batteries, our website, systems or data we maintain are or were compromised we could experience adverse consequences resulting from such compromise, including but not limited to regulatory investigations or actions; litigation; fines and penalties; disruptions of our business operations; reputational harm; loss of revenue or profits; loss of customers or sales; and other adverse consequences.
In the ordinary course of business, we collect, receive, store, process, generate, use, transfer, disclose, make accessible, protect, secure, dispose of, transmit, and share (collectively, process) personal data and other sensitive information, including proprietary and confidential business data, trade secrets, intellectual property, and sensitive third-party data. cyberattacks, malicious internet-based activity, online and offline fraud, and other similar activities threaten the confidentiality, integrity, and availability of our sensitive information and information technology systems, and those of the third parties upon which we rely. Such threats are prevalent and continue to rise, are increasingly difficult to detect, and come from a variety of sources, including traditional computer “hackers,” threat actors, “hacktivists,” organized criminal threat actors, personnel (such as through theft or misuse), sophisticated nation states, and nation-state-supported actors. Some actors now engage and are expected to continue to engage in cyber-attacks, including without limitation nation-state actors for geopolitical reasons and in conjunction with military conflicts and defense activities. During times of war and other major conflicts, we, the third parties upon which we rely, and our customers may be vulnerable to a heightened risk of these attacks, including retaliatory cyber-attacks, that could materially disrupt our systems and operations, supply chain, and ability to produce, sell and distribute our goods and services.
We and the third parties upon which we rely are subject to a variety of evolving threats, including but not limited to social-engineering attacks (including through deep fakes, which may be increasingly more difficult to identify as fake, and phishing attacks), malicious code (such as viruses and worms), malware (including as a result of advanced persistent threat intrusions), denial-of-service attacks, credential stuffing attacks, credential harvesting, personnel misconduct or error, ransomware attacks, supply-chain attacks, software bugs, server malfunctions, software or hardware failures, attacks facilitated or enhanced by artificial intelligence, loss of data or other information technology assets, adware, telecommunications failures, earthquakes, fires, floods, and other similar threats. In particular, severe ransomware attacks are becoming increasingly prevalent – particularly for companies like ours that are engaged in manufacturing – and can lead to significant interruptions in our operations, loss of sensitive data and income, reputational harm, and diversion of funds. Extortion payments may alleviate the negative impact of a ransomware attack, but we may be unwilling or unable to make such payments due to, for example, applicable laws or regulations prohibiting such payments.
Remote work has become more common and has increased risks to our information technology systems and data, as more of our employees utilize network connections, computers and devices outside our premises or network, including working at home, while in transit and in public locations. Additionally, future or past business transactions (such as acquisitions or integrations) could expose us to additional cybersecurity risks and vulnerabilities, as our systems could be negatively affected by vulnerabilities present in acquired or integrated entities’ systems and technologies. Furthermore, we may discover security issues that were not found during due diligence of such acquired or integrated entities, and it may be difficult to integrate any acquired companies into our information technology environment and security program.
We rely on third-party service providers and technologies to operate critical business systems to process sensitive information in a variety of contexts, including, without limitation, cloud-based infrastructure, data center facilities, encryption and authentication technology, employee email, and other functions. Our ability to monitor these third parties’ information security practices is limited, and these third parties may not have adequate information security measures in place. If our third-party service providers experience a security incident or other interruption, we could experience adverse consequences. For example, the Crowdstrike-Microsoft outage in July 2024 caused temporary
disruptions to our systems and servers at our U.S., Malaysia and India locations. While we may be entitled to damages if our third-party service providers fail to satisfy their privacy or security-related obligations to us, or we may be entitled to reimbursement under our insurance policies, any award may be insufficient to cover our damages, or we may be unable to recover such award.
Any of the previously identified or similar threats could cause a security incident or other interruption that could result in unauthorized, unlawful, or accidental acquisition, modification, destruction, loss, alteration, encryption, disclosure of, or access to our sensitive information or our information technology systems, or those of the third parties upon whom we rely. A security incident or other interruption could disrupt our ability (and that of third parties upon whom we rely) to provide our products. We may expend significant resources or modify our business activities to try to protect against security incidents. Certain data privacy and security obligations may require us to implement and maintain specific security measures or industry-standard or reasonable security measures to protect our information technology systems and sensitive information.
While we have implemented security measures designed to protect against security incidents, there can be no assurance that these measures will be effective. We take steps to detect, mitigate, and remediate vulnerabilities in our information systems (such as our hardware and/or software, including that of third parties upon which we rely), but we may not be able to detect and remediate all vulnerabilities on a timely basis because the threats and techniques used to exploit the vulnerability change frequently and are often sophisticated in nature. Therefore, such vulnerabilities could be exploited but may not be detected until after a security incident has occurred. These vulnerabilities pose material risks to our business. Further, we may experience delays in developing and deploying remedial measures designed to address any such identified vulnerabilities. Vulnerabilities could be exploited and result in a security incident.
Applicable data privacy and security obligations may require us to notify relevant stakeholders, including affected individuals, customers, regulators, and investors, of security incidents. For example, new SEC rules require disclosure on Form 8-K of the nature, scope and timing of any material cybersecurity incident and the reasonably likely impact of such incident. Such disclosures are costly, and the disclosure or the failure to comply with such requirements could lead to adverse consequences. If we (or a third party upon whom we rely) experience a security incident or are perceived to have experienced a security incident, we may experience adverse consequences, such as government enforcement actions (for example, investigations, fines, penalties, audits, and inspections); additional reporting requirements and/or oversight; restrictions on processing sensitive information (including personal data); litigation (including class claims); indemnification obligations; negative publicity; reputational harm; monetary fund diversions; diversion of management attention; interruptions in our operations (including availability of data); financial loss; and other similar harms. Security incidents and attendant consequences may cause customers to stop using our products, deter new customers from using our products, and negatively impact our ability to grow and operate our business.
Our contracts may not contain limitations of liability, and even where they do, there can be no assurance that limitations of liability in our contracts are sufficient to protect us from liabilities, damages, or claims related to our data privacy and security obligations. We cannot be sure that our insurance coverage will be adequate or sufficient to protect us from or to mitigate liabilities arising out of our privacy and security practices, that such coverage will continue to be available on commercially reasonable terms or at all, or that such coverage will pay future claims.
Additionally, sensitive information of the Company or our customers could be leaked, disclosed, or revealed as a result of or in connection with the use by our employees, personnel, or vendors of generative artificial intelligence (“AI”) technologies.
We are subject to stringent and evolving U.S. and foreign laws and other obligations related to data privacy and security. Our actual or perceived failure to comply with such obligations could harm our reputation and expose us to increased liability and other adverse business consequences.
We collect, store, use, transfer and share (collectively, “process”) personal data and other sensitive information. Our data processing activities may subject us to various laws and contractual requirements. A number of U.S. states have enacted comprehensive privacy laws that impose certain obligations on covered businesses. For example, the California Consumer Privacy Act of 2018, as amended by the California Privacy Rights Act of 2020 (collectively, “CCPA”) applies to personal data of California residents and requires businesses to provide specific disclosures in privacy notices and honor requests of such individuals to exercise certain privacy rights.
Outside the U.S., the U.K. and EU General Data Protection Regulation (“GDPR”) applies to some of our operations in Europe. Our data processing activities in Asia are subject to new and emerging data privacy regimes, including China’s Personal Information Law 2021 (“PIPL”) and in India’s Digital Personal Data Protection Act (“DPDPA”).
Our employees are instructed by Enovix IT not to use unauthorized generative AI and machine learning (“ML”) technologies to perform their work. However, employees’ indirect use of generative AI in unapproved third-party software and services may still occur, risking the inadvertent disclosure of personal data and sensitive company information to third parties. As Governments have passed and are likely to pass additional laws regulating generative AI, our use of this technology could result in additional compliance costs, regulatory investigations and actions, and lawsuits. If we are unable to use generative AI, it could make our business less efficient and result in competitive disadvantages.
Obligations related to data privacy and security are quickly changing, becoming increasingly stringent, and creating regulatory uncertainty. Preparing for and complying with these obligations requires us to devote significant resources, which may necessitate changes to our services, information technologies, systems, and practices, and to those of any third parties that process personal data on our behalf. If we or the third parties on which we rely fail, or are perceived to have failed, to address or comply with applicable data privacy and security obligations, we could face significant consequences, including government enforcement investigations, fines, penalties, audits, and inspections, additional reporting requirements, and litigation. Any of these events could have a material adverse effect on our reputation, business, or financial condition.
Our facilities or operations could be damaged or adversely affected as a result of natural disasters and other catastrophic events.
Our facilities or operations could be adversely affected by events outside of our control, such as natural disasters, wars or other armed conflicts, health epidemics, pandemics and other outbreaks, the long-term effects of climate change and other calamities. Our headquarters is located in Fremont, California, which is prone to earthquakes. We cannot assure you that any backup systems will be adequate to protect us from the effects of fire, floods, typhoons, earthquakes, power loss, telecommunications failures, break-ins, war, riots, terrorist attacks or similar events. Any of the foregoing events may give rise to interruptions, breakdowns, system failures, technology platform failures or internet failures, which could cause the loss or corruption of data or malfunctions of software or hardware as well as adversely affect our ability to provide services.
Any financial or economic crisis, or perceived threat of such a crisis, including a significant decrease in consumer confidence, may materially and adversely affect our business, financial condition and results of operations.
Global economic conditions have impacted, and will likely continue to impact, businesses around the world, including ours. Inflation and other macroeconomic pressures in the U.S. and global economy such as rising interest rates and recession fears are creating a complex and challenging environment for us and our customers.
The U.S. and certain foreign governments have taken actions in an attempt to address and rectify these extreme market and economic conditions by providing liquidity and stability to the financial markets. If the actions taken by these governments are not successful, the return of adverse economic conditions may negatively impact the demand for our lithium-ion battery cells and may negatively impact our ability to raise capital, if needed, on a timely basis and on acceptable terms or at all.
Our ability to utilize our net operating losses and certain other tax attributes to offset future taxable income and taxes may be subject to certain limitations.
Under the Internal Revenue Code of 1986, as amended, (the “Code”), a corporation is generally allowed a deduction for net operating losses (“NOLs”) carried over from a prior taxable year. Under the Code, we can carryforward our NOLs to offset our future taxable income, if any, until such NOLs are used or expire. The same is true of other unused tax attributes, such as tax credits. Under current U.S. federal income tax law, U.S. federal NOLs generated in taxable years beginning after December 31, 2017, may be carried forward indefinitely, but the deductibility of such U.S. federal NOLs is limited to 80 percent of taxable income. Many U.S. states do not conform to current U.S. federal income tax law regarding NOLs carried forward and deductibility, and generally have more restrictive rules which limit the use of NOLs for state income tax purposes. In addition, there may be periods during which states suspend or otherwise limit the use of NOLs for state income tax purposes.
In addition, under Sections 382 and 383 of the Code and corresponding provisions under state law, a corporation that undergoes an “ownership change” is subject to limitations on its ability to use its pre-change NOL carryforwards and other pre-change tax attributes to offset future taxable income and taxes. The limitations apply if a corporation undergoes an “ownership change,” which is generally defined as a greater than 50 percentage point change (by value) in its equity ownership by certain stockholders over a three-year period. We have experienced ownership changes and are subject to limitations on our ability to utilize a portion of our NOLs and other tax attributes to offset taxable income or tax liability. In addition, future changes in our stock ownership, which may be outside of our control, may trigger additional ownership changes and further limitations. Similar provisions of state tax law may also apply to suspend or otherwise limit our use of accumulated state tax attributes. As a result, even if we earn net taxable income in the future, our ability to use our or Legacy Enovix’s NOL carryforwards and other tax attributes to offset such taxable income or tax liability may be subject to limitations, which could potentially result in increased future income tax liability to us.
Changes in tax laws or regulations that are applied adversely to us or our customers may have a material adverse effect on our business, cash flow, financial condition or results of operations.
New income, sales, use or other tax laws, statutes, rules, regulations or ordinances could be enacted at any time, which could adversely affect our business operations and financial performance. Further, existing tax laws, statutes, rules, regulations or ordinances could be interpreted, changed, modified or applied adversely to us. For example, the legislation enacted in Tax Cuts and Jobs Act of 2017, the Coronavirus Aid, Relief, and Economic Security Act of 2020 and the Inflation Reduction Act of 2022 enacted many significant changes to U.S. tax laws. Further guidance from the Internal Revenue Service and other tax authorities with respect to such legislation may affect us, and certain aspects of such legislation could be repealed or modified in future legislation. In addition, it is uncertain if and to what extent various states will conform to federal tax laws. Future tax reform legislation could have a material impact on the value of our deferred tax assets and could increase our future U.S. tax expense.
In addition, effective January 1, 2022, the Tax Cuts and Jobs Act of 2017 requires taxpayers to capitalize and subsequently amortize research and development expenses over five years for research activities conducted in the U.S. and over 15 years for research activities conducted outside the U.S. Unless the U.S. Department of the Treasury issues regulations that narrow the application of this provision to a smaller subset of our research and development expenses or the provision is deferred, modified, or repealed by Congress, it could harm our future operating results by effectively increasing our future tax obligations. The actual impact of this provision will depend on multiple factors, including the amount of research and development expenses we will incur, whether we achieve sufficient income to fully utilize such deductions and whether we conduct our research and development activities inside or outside the U.S.
In 2021, the Organization for Economic Cooperation and Development announced an Inclusive Framework on Base Erosion and Profit Shifting including Pillar Two Model Rules defining the global minimum tax, which calls for the taxation of large multinational corporations at a minimum rate of 15%. Subsequently multiple sets of administrative guidance have been issued. Many non-US tax jurisdictions have either recently enacted legislation to adopt certain components of the Pillar Two Model Rules beginning in 2024 (including the European Union Member States) with the adoption of additional components in later years or announced their plans to enact legislation in future years. We performed an initial assessment of the potential impact from the Pillar Two rules to our income taxes and determined that there is no impact to us as it is below the global revenue threshold.
We are subject to anti-corruption, anti-bribery, anti-money laundering, import and export controls, financial and economic sanctions and similar laws, and non-compliance with such laws can subject us to administrative, civil and criminal fines and penalties, collateral consequences, remedial measures and legal expenses, all of which could adversely affect our business, results of operations, financial condition and reputation.
We are subject to anti-corruption, anti-bribery, anti-money laundering, import and export controls, financial and economic sanctions and similar laws and regulations in various jurisdictions in which we conduct or in the future may conduct activities, including the U.S. Foreign Corrupt Practices Act (“FCPA”), the U.K. Bribery Act 2010 and other anti-corruption laws and regulations. The FCPA and the U.K. Bribery Act 2010 prohibit us and our officers, directors, employees and business partners acting on our behalf, including agents, from directly or indirectly corruptly offering, promising, authorizing or providing anything of value to foreign government officials for the purposes of influencing official decisions or obtaining or retaining business or otherwise obtaining favorable treatment. The FCPA also requires companies to make and keep books, records and accounts that accurately reflect transactions and dispositions of assets and to maintain a system of adequate internal accounting controls. The U.K. Bribery Act also prohibits non-governmental “commercial” bribery and soliciting or accepting bribes. A violation of anti-corruption laws or regulations
could adversely affect our business, results of operations, financial condition and reputation. Our policies and procedures designed to ensure compliance with these regulations may not be sufficient and our directors, officers, employees, representatives, consultants, agents and business partners could engage in improper conduct for which we may be held responsible.
We are also subject to import and export control laws and regulations, including the U.S. Export Administration Regulations, U.S. Customs regulations, and various economic and trade sanctions regulations administered by the U.S. Treasury Department’s Office of Foreign Assets Control, and similar laws in other jurisdictions in which we conduct business. Exports of our products must be made in compliance with these laws and regulations. In addition, these laws may restrict or prohibit altogether the provision or supply of certain of our products to certain governments, persons, entities, countries, and territories, including those that are the target of comprehensive sanctions, unless there are license exceptions that apply or specific licenses are obtained. Any changes in import, export control, or sanctions laws and regulations, shift in the enforcement or scope of existing laws and regulations, or change in the countries, governments, persons, or technologies targeted by such laws and regulations, could result in decreased ability to export our products internationally.
Significant increases in import and excise duties or other taxes on, as well as any tariffs, particularly on our products to China, could materially increase our costs of our products and have an adverse effect on our business, liquidity, financial condition, and/or results of operations.
Non-compliance with anti-corruption, anti-bribery, anti-money laundering, import and export control, or financial and economic sanctions laws could subject us to whistleblower complaints, adverse media coverage, investigations, and severe administrative, civil and criminal sanctions, collateral consequences, remedial measures and legal expenses, all of which could materially and adversely affect our business, results of operations, financial condition and reputation.
Our insurance coverage may not be adequate to protect us from all business risks.
We may be subject, in the ordinary course of business, to losses resulting from products liability, accidents, acts of God and other claims against us, for which we may have no insurance coverage. As a general matter, the policies that we do have may include significant deductibles or self-insured retentions, and we cannot be certain that our insurance coverage will be sufficient to cover all future losses or claims against us. A loss that is uninsured or which exceeds policy limits may require us to pay substantial amounts, which could adversely affect our financial condition and operating results.
Item 1B. Unresolved Staff Comments
None.
Item 1C. CYBERSECURITY
Risk management and strategy
We implement and maintain various information security processes designed to identify, assess and manage material risks from cybersecurity threats to our critical computer networks, third party hosted services, communications systems, hardware and software, and our critical data, including intellectual property, confidential information that is proprietary, strategic or competitive in nature, and manufacturing-related information (“Information Systems and Data”).
Our board, through our Nominating and Governance committee, together with our company executives through our Information Security committee, and our IT and security management teams in conjunction with third party service providers who specialize in cybersecurity, help identify, assess and manage the Company’s cybersecurity threats and risks. We have a quarterly review of cybersecurity by our Nominating and Governance committee and our internal Information Security committee. We use a number of processes to identify and assess risks from cybersecurity threats by monitoring and evaluating our threat environment and the Company’s risk profile using various methods including, for example via manual and automated tools, which are internally prepared and also through external third-party vendors, subscribing to reports and services that identify cybersecurity threats, analyzing reports of threats and actors, conducting routine scans of the threat environments, evaluating our and our industry’s risk profile, performing annual assessments and penetration testing, evaluating the threats reported to us, coordinating with law enforcement concerning threats, conducting internal and external audits, conducting threat assessments for internal and external threats, reviewing third party threat assessments, conducting vulnerability assessments to identify vulnerabilities, using of external intelligence
feeds, conducting third-party- red/blue team testing and tabletop incident response exercises. In addition, we conduct internal tabletop exercise, third party red-team pen testing and OT security monitoring.
Depending on the environment, we implement and maintain various technical, physical, and organizational measures, processes, standards and policies designed to manage and mitigate material risks from cybersecurity threats to our Information Systems and Data, including, for example incident response plans, incident detection and response policies and procedures, vulnerability management policy, disaster recovery plans, and encryption of data.
Our assessment and management of material risks from cybersecurity threats are integrated into the Company’s overall risk management processes. For example, we have (1) cybersecurity risk addressed as a component of the Company’s enterprise risk management program and identified in the Company’s risk register; (2) the security department works with management to prioritize our risk management processes and mitigate cybersecurity threats that are more likely to lead to a material impact to our business; (3) our information security committee evaluates material risks from cybersecurity threats against our overall business objectives and our CISO reports to the Nominating and Governance committee the board of directors, which evaluates our overall enterprise risk.
We use third-party service providers to assist us from time to time to identify, assess, and manage material risks from cybersecurity threats, including, for example, threat intelligence service providers, cybersecurity consultants, cybersecurity software providers, managed cybersecurity service providers, penetrating testing firms, dark web monitoring services, forensic investigators and DHS CISA monitoring service providers.
We use third-party service providers to perform a variety of functions throughout our business, such as application providers, hosting companies and supply chain resources. We have a vendor management program to manage cybersecurity risks associated with our use of these providers. The program includes risk assessment for each vendor, security questionnaires, review of the vendor's written security program, review of security assessments, reports, vulnerability scans related to vendors, imposition of information contractual obligations on the vendors and other elements of vendor management program such as continuous cyber security monitoring by third-party service. Depending on the nature of the services provided, the sensitivity of the Information Systems and Data at issue, and the identity of the provider, our vendor management process may involve different levels of assessment designed to help identify cybersecurity risks associated with a provider and impose contractual obligations related to cybersecurity on the provider.
For a description of the risks from cybersecurity threats that may materially affect the Company and how they may do so, see our risk factors under Part 1. Item 1A. Risk Factors in this Annual Report on Form 10-K, including “Our batteries and our website, systems and data we maintain may be subject to intentional disruption, other security incidents or alleged violations of laws, regulations or other obligations relating to data handling that could result in liability and adversely impact our reputation and future sales.”
Governance
Our board of directors addresses the Company’s cybersecurity risk management as part of its general oversight function. The board of directors’ Nominating and Governance committee is responsible for overseeing Company’s cybersecurity risk management processes, including oversight and mitigation of risks from cybersecurity threats. Our Nominating and Governance committee consists of members with years of experience in cybersecurity oversight.
Our cybersecurity risk assessment and management processes are maintained by certain Company management, including the members of our Information Security Steering Committee, which meets quarterly to review cybersecurity matters. Our Information Security Steering Committee is comprised of our Chief Information Security Officer (“CISO”), CEO, Chief Financial Officer, Chief Accounting Officer, COO, Chief Legal Officer, Vice President of Human Resources and Vice President of Global Information Technology. At the management level, our CISO, who reports to our Chief Information Officer (“CIO”), is responsible for overseeing the assessment and management of our material risks from cyber security threats. Our CISO has extensive experience and knowledge in cybersecurity with years of experience in leading security teams, developing security strategies, and managing risk across various industries. Our Vice President, Global Information Technology serves as our CIO, and has over 25 years of information technology and cybersecurity risk management experience, including at other public companies.
Our CISO is responsible for hiring appropriate personnel, helping to integrate cybersecurity risk considerations into the Company’s overall risk management strategy, and communicating key priorities to relevant stakeholders at our US headquarters, and each of our international subsidiary locations. Our CISO is also responsible for approving budgets,
helping prepare for cybersecurity incidents, approving cybersecurity processes, and reviewing security assessments and other security-related reports. The CISO works in conjunction with our Nominating and Governance Committee Chair and committee members.
Our cybersecurity incident response and vulnerability management processes are designed to escalate certain cybersecurity incidents to members of management depending on the circumstances, including our CISO and our Nominating and Governance Committee Chair and members. These officials work with the Company’s incident response team to help the Company mitigate and remediate any cybersecurity incidents of which they are notified. In addition, the Company’s incident response and vulnerability management processes include reporting to the Nominating and Governance Committee of the board of directors for certain cybersecurity incidents.
The Nominating and Governance Committee receives periodic reports from our CISO and Information Security Steering Committee concerning the Company’s significant cybersecurity threats and risks and the processes the Company has implemented to address them. The Nominating and Governance Committee also has access to the various historical reports, summaries and presentations prepared by the Information Security Steering Committee related to cybersecurity threats, risk and mitigation.
Item 2. Properties
Our corporate headquarters are located in Fremont, California. The following is a summary of our principal facilities as of December 29, 2024.
| | | | | | | | | | | | | | | | | | | | |
| Principal Operations | | Location | | Approximately Square Footage | | Held |
| Headquarters and Center for Innovation | | United States | | 68,500 | | | Leased |
| Manufacturing Facility | | Malaysia | | 257,500 | | | Leased |
| Manufacturing Facilities | | South Korea | | 127,500 | | | Owned |
| R&D Center | | India | | 18,000 | | | Leased |
Item 3. Legal Proceedings
The information included under the heading “Litigation” in Note 10 “Commitments and Contingencies” of the notes to our consolidated financial statements in Part II, Item 8 of this Annual Report on Form 10-K is incorporated herein by reference.
Item 4. Mine Safety Disclosures
Not applicable.
PART II
Item 5. Market for Registrant’s Common Equity, Related Stockholder Matters and Issuer Purchases of Equity Securities
Our Common Stock is listed on The Nasdaq Global Select Market under the symbol “ENVX.” As of February 19, 2025, there were 56 holders of record of our Common Stock shares. The actual number of stockholders of our Common Stock is greater than this number of record holders and includes stockholders who are beneficial owners but whose shares of Common Stock are held in street name by banks, brokers and other nominees. Additionally, there were four holders of record of 5,500,000 Private Placement Warrants (as defined in Note 4 “Fair Value Measurement” of the notes to the consolidated financial statements included in Part II, Item 8 of this Annual Report on Form 10-K), each exercisable for one share of our Common Stock at a price of $11.50 per share.
Dividends
We have not declared or paid any dividends on our Common Stock and we currently do not anticipate to pay any cash dividends in the foreseeable future. Any future determination to declare cash dividends will be made at the discretion of our board of directors, subject to applicable laws, and will depend on our financial condition, results of operations, capital requirements, general business conditions and other factors that our board of directors may deem relevant.
Restricted Stock Units Withholding
We withhold Common Stock shares with value equivalent to cover employees' tax withholding obligations for certain employees upon the vesting of restricted stock units. During the fiscal year 2024, we withheld 664,634 shares for a total value of $7.1 million for our employees' tax obligations.
Purchases of Equity Securities by the Issuer and Affiliated purchasers
During the fiscal quarter ended December 29, 2024, we repurchased unvested shares of our Common Stock that had been issued upon early exercise of stock options. Upon termination of employment of a person holding unvested shares, we are entitled to repurchase the unvested shares. The table below summarizes repurchases of unvested shares of our Common Stock.
| | | | | | | | | | | | | | | | | | | | | | | | | | |
| | (a) | | (b) | | (c) | | (d) |
| Fiscal periods | | Total Number of Shares Purchased (1) | | Average Price Paid Per Share | | Shares Purchased as Part of Publicly Announced Plans or Programs (2) | | Approximate Dollar Value of Shares That May Yet be Purchased Under the Plans or Programs |
| September 30 - October 27, 2024 | | — | | | $ | — | | | — | | | — | |
| October 28 - November 24, 2024 | | 2,611 | | | 0.06 | | | — | | | — | |
| November 25 - December 29, 2024 | | — | | | — | | | — | | | — | |
| Total | | 2,611 | | | $ | 0.06 | | | — | | | — | |
(1)We repurchased 2,611 of shares from former employees for the early exercised stock options, which were unvested on the termination date, at the exercise price.
(2) We did not have any announced plan or programs to repurchase our Common Stock during the fiscal year 2024.
Performance Graph
The graph below compares the cumulative total stockholder return on our common stock with the cumulative total return on the Nasdaq Composite Index and the Russell 2000 Index over the same period. This graph assumes an initial investment of $100.00 in our common stock and in each index (assuming the reinvestment of all dividends, as applicable) at the market close on July 14, 2021 (the date of our common stock began trading on the Nasdaq Global Select Market under the symbol “ENVX” after the Business Combination), through December 27, 2024 (the last trading date before our fiscal year ended on December 29, 2024). The comparisons shown in the graph below are based upon historical data. We caution that the stock price performance shown in the graph below is not necessarily indicative of, nor is it intended to forecast, the potential future performance of our common stock.
Item 6. [Reserved]
Item 7. Management’s Discussion and Analysis of Financial Condition and Results of Operations
The following discussion and analysis of financial condition and results of operations should be read in conjunction with the consolidated financial statements and related notes thereto included elsewhere in this Annual Report on Form 10-K. This discussion and analysis contain forward-looking statements based upon our current expectations, estimates and projections that involve risks and uncertainties. Actual results and timing of selected events may differ materially from those anticipated in these forward-looking statements as a result of various factors, including those set forth under “Risk Factors” and elsewhere in this Annual Report on Form 10-K. The management of Enovix Corporation are referred to as the “Company,” “we,” “us,” “our” and “Enovix.”
Business Overview
We design, develop and have started to commercially manufacture an advanced silicon-anode lithium-ion battery using our proprietary cell architecture that increases energy density and maintains high cycle life. This enables us to use silicon as the only active lithium cycling material in the anode whereas industry incumbents have historically combined only a modest amount of silicon with graphite. We have applied an equally innovative approach to develop proprietary roll-to-stack production tools for existing lithium-ion battery manufacturing lines and increase megawatt hour capacity. Our silicon anode battery architecture allows lithium-ion batteries to be produced smaller, cheaper and more efficiently at scale than current alternatives. With our acquisition of Routejade, Inc. (“Routejade”) in 2023, we also offer conventional lithium-ion batteries, which expands our suite of battery offerings to our customers.
To date, we have concentrated our operational effort on researching, developing and commercializing the cutting-edge technology behind our silicon-anode lithium-ion battery. We have agreements to provide engineering and proof of concept samples to several market leading smartphone customers, and have advanced relationships with customers in the augmented reality/virtual reality (“AR/VR”) industry and smart eyewear market. We also operate in the defense market with sales of conventional graphite battery products to defense customers. In addition to the smartphone, AR/VR, smart eyewear and defense industries, we are pursuing the deployment of our technology for the electric vehicle (“EV”) market.
We currently lease our headquarters in Fremont, California. We commenced commercial manufacturing operations and recognized our first product revenue in the second quarter of 2022 from our first production line (“Fab1”). In 2023, we identified a facility in Malaysia (“Fab2”) for high-volume production. We relocated our Fab1 production line to Fab2 in the second quarter of 2024 and officially opened our Fab2 production facility in Malaysia in August 2024. In October 2024, we commenced shipping battery cells from our first production line, the“Agility line” at Fab2. As of the end of 2024, we had completed Site Acceptance Testing (“SAT”) for our Agility and High-Volume Manufacturing (“HVM”) lines and delivered samples of our smartphone batteries, EX-1M and EX-2M, to customers. We currently expect to commence mass production at Fab2 in late 2025.
Fiscal Year
Our fiscal year is the 52 or 53-week period ending on the Sunday closest to December 31. Accordingly, we will have a 53-week fiscal year every five or six years and our fiscal year 2026 will consist of 53 weeks. Our fiscal years 2024, 2023, and 2022 consisted of 52 weeks, which ended on December 29, 2024, December 31, 2023, and January 1, 2023, respectively. All period references are to the fiscal periods unless otherwise indicated.
Routejade Acquisition
On October 31, 2023, we completed our acquisition of Routejade, Inc. (“Routejade”), an established battery manufacturer in South Korea. This acquisition allowed us to vertically integrate electrode coating and battery pack manufacturing, in addition to adding to our suite of battery offerings with conventional lithium-ion batteries. The total purchase consideration of such transaction consisted of cash consideration in the amount of $15.4 million, net of acquisition-related seller expense, and 5,923,521 shares of our common stock, par value $0.0001, for the purchase of substantially all of outstanding shares of Routejade (the “Routejade Acquisition”). Please refer to Note 3 “Business Combinations” of the notes to our consolidated financial statements in Part II, Item 8 of this Annual Report on Form 10-K for further details of this acquisition.
Key Trends, Opportunities and Uncertainties
We generate revenue from the sale of (a) batteries and battery pack products (“Product Revenue”) and (b) engineering revenue contracts (“Service Revenue”) for the development of lithium-ion battery technology. Our
performance and future success depend on several factors that present significant opportunities, but also pose risks and challenges as described in Part I, Item 1A of this Annual Report on Form 10-K.
Fiscal Year 2024 Highlights:
•During the first quarter of 2024, we had built out approximately 250,000 square feet of factory space at our facility in Malaysia (“Fab2”) and had begun receiving shipments of our second generation (“Gen2”) manufacturing lines production equipment that had cleared FAT. In addition, we entered into a development agreement with a leading automaker to validate the potential advantages of the Enovix cell architecture for the EV battery.
•In the first half of 2024, we received total net proceeds of $40.0 million from the issuance of our common stock under our at-the-market (“ATM”) offering program in the first and second quarters of 2024.
•During the second quarter of 2024, we completed SAT for our Agility line in Malaysia and commenced battery production on our Agility line. In addition, we began sampling our EX-1M battery with samples that were built and tested at our Fab1 in Fremont, California. We also signed an agreement with a leading California-based technology company to provide silicon batteries and packs for a mixed reality headset.
•During the second quarter of 2024, we initiated a restructuring plan (the “2024 Restructuring Plan”) to relocate our manufacturing operations from Fremont, California to Malaysia. We substantially completed our 2024 Restructuring Plan in the fourth quarter of 2024. For the fiscal year 2024, we recorded pre-tax restructuring charges of $41.8 million, which included $38.2 million of Fab1 long-lived asset disposals.
•During the third quarter of 2024, we formally opened Fab2 in Penang, Malaysia, and subsequently commenced shipping batteries to customers from our Agility line. We also achieved UN38.3 certification for our EX-1M product, marking a critical milestone for market entry. Additionally, we signed a collaboration agreement with a Fortune 200 company to provide silicon batteries for a fast-growing IoT product category and a non-binding Memorandum of Understanding (“MOU”) with a high-performance, global automotive OEM aimed at scaling the Enovix cell architecture for the EV market.
•During the fourth quarter of 2024, we issued 11,626,089 shares of our common stock in a private offering and received total proceeds of $106.7 million, net of estimated issuance costs. In addition, we completed SAT for our HVM line at Fab2 and successfully completed safety testing of our EX-1M cells. We also expanded our active customer engagements to seven of the top eight smartphone OEMs and shipped early samples of EX-2M to a smartphone customer.
Product Development
We have developed and delivered standardized sample (i.e., prototype) lithium-ion batteries to multiple, industry leading consumer electronics manufacturers with energy densities higher than industry standard batteries of similar size. “Energy density” is measured as the product of the power a battery puts out in watts times the number of hours the battery can put out that power, divided by the volume (size) of the battery measured in liters. The units of energy density are thus watt-hours per liter or Wh/l. Additionally, we estimate that our batteries can deliver higher storage capacity (measured in milliampere/hour, or mAh) compared to industry standard batteries of similar size.
Our product development strategy is tightly aligned with the goals of meeting the market needs of higher energy density, cycle life, and fast charge while maintaining safety. In the third quarter of 2024, we shipped our first samples of EX-1M from Fab2 to our customers. In the fourth quarter of 2024, we shipped our early engineering samples of EX-2M to our smartphone customer. We have kicked off the design phase of EX-3M and our goal is to finalize the EX-3M design in early 2025, paving the way for our next-generation battery technology.
Commercialization
We approach our commercialization strategy by identifying customer requirements and determining where our battery architecture will offer the greatest value. In 2023, we added a product management team to interface with customers, collect these requirements, and feed these learnings into our technology roadmap. In 2024, we added a product design team in Penang, Malaysia to help ensure that our high-volume manufacturing lines meet customer product requirements.
Prior to 2023, our go-to-market strategy was to sample many customers across a broad set of end markets with a standard size battery while selectively considering customized batteries by size for certain customers. This is referred to as a horizontal business strategy. In 2023, we shifted our go-to-market strategy to a vertical business strategy based on our determination that it is more efficient to work with a smaller number of large customers and build highly customized batteries to their needs. With the shift to a vertical business strategy, we have put a particular emphasis on the largest end markets for portable electronics batteries, and in 2024, have made progress with securing development and collaboration agreements with potential customers in the portable electronics market. We are also exploring incremental growth opportunities in the conventional battery business, with allied defense customers, among other markets.
Our primary commercialization goal for 2025 is mass production of our batteries for smartphone customers.
Market Focus and Market Expansion
We are focused on four strategic markets: Smartphone, IoT, Computing and Defense. We also plan to expand into the EV market.
We prioritize large, high-value markets, such as smartphones and AR/VR headsets, where the need for higher energy density commands a premium. This approach has proven to be visionary, with the surge in AI-enabled smartphones and the emerging AI-enabled smart eyewear market further validating our strategy and driving significant pull for our products. We are confident that our go-to-market strategy positions us on an expedient path to profitability while maintaining a competitive edge in innovation.
In the smartphone market, we shipped early engineering samples of EX-2M to one smartphone customer in the fourth quarter of 2024, with results confirming that critical safety tests are passing. In continuation of this agreement, we received battery dimensions for custom sample qualification and planned 2025 commercial launch. We remain on track for commercial smartphone battery launches in 2025, pending successful completion of customer qualification.
A significant portion of our 2024 revenue came from sales of conventional graphite battery products to defense contractor customers in South Korea. We also observed an increase in inbound interest from drone manufacturers and defense suppliers seeking battery solutions that comply with allied country supply chain requirements, unlock energy-restricted capabilities such as satellite communications and sensor fusion, and are intrinsically safer.
We believe that focusing on the portable electronics market, such as the smartphone and IoT categories, will allow us to leverage our differentiated technology and solidify our manufacturing process while still driving toward profitability. At the same time, we are also laying the groundwork for our entry into the EV battery market by sampling batteries to EV OEMs and continuing work on our three-year grant with the U.S. Department of Energy to demonstrate batteries featuring our silicon anode paired with EV-class cathode materials. Our goal is to expand into the EV market through joint ventures or licensing arrangements with EV OEMs or battery OEMs in order to commercialize our technology in this end market.
Access to Capital
Assuming we experience no significant delays in the production plan nor any deterioration in capital efficiency, we believe that our cash resources are sufficient to fund the manufacturing and production ramp of our Fab2 manufacturing facility in Malaysia for commercial launch.
Components of Results of Operations
Revenue
In June 2022, we began to generate revenue from our Fab1 in Fremont, California. In October 2023, we acquired Routejade, a manufacturer of electrode coating and battery pack for customers worldwide. We recognize revenue within the scope of Accounting Standards Codification (“ASC”) 606, Revenue from Contracts with Customers.
Our revenue consists of product revenue, resulting from the sale of lithium-ion batteries. and battery pack products (“Product Revenue”), and service revenue, resulting from payments received from our customers based on executed engineering revenue contracts for the development of lithium-ion battery technology (“Service Revenue”).
Our Product Revenue is primarily generated from selling lithium-ion batteries or battery packs to commercial customers and defense contractors. Product Revenue is recognized once we have satisfied the performance obligations as defined in the sales agreement, which is generally satisfied upon transfer of control of goods. Control is transferred upon delivery for our products. For certain customized products with customer acceptance criteria specified in the sales
agreement, the performance obligations are generally satisfied upon our customer’s acceptance. Payment terms can vary depending on the contract and it is generally required within 90 days or less from the delivery date or the acceptance date of our product. The amount of revenue recognized reflects the consideration for the product sold.
Service Revenue contracts generally include the design and development efforts to conform our existing battery technology with customers’ specifications. Consideration for Service Revenue contracts generally becomes payable when we meet specific payment milestones, which usually include the design and approval of custom cells, procurement of fabrication tooling to meet the customer’s specifications, and the fabrication and delivery of custom cells from our facility. Within the existing Service Revenue contracts, the amount of consideration is fixed, the contracts contain a single performance obligation, and revenue is recognized at the point in time the final milestone is met (i.e., a final working prototype meeting all required specifications) and the customer obtains control of the deliverable.
Cost of Revenue
Cost of revenue includes materials, labor, depreciation and amortization expense, freight costs and other direct costs related to manufacturing our products and service contracts. Labor consists of personnel-related expenses such as salaries and benefits, and stock-based compensation. We anticipate that cost of revenue will continue to increase as we optimize and bring-up our production line.
Our inventory is stated at the lower of cost or net realizable value (“NRV”) on a first-in and first-out basis. Determining net realizable value of finished goods and work in process inventories involves projecting average selling prices. When the estimated net realizable values are below the manufacturing costs, a charge to cost of revenue is recorded.
Capitalization of certain costs are recognized as an asset if they relate directly to a customer contract, generate or enhance resources of the entity that will be used in satisfying future performance obligations, and are expected to be recovered. If these three criteria are not met, the costs are expensed in the period incurred. Deferred costs are recognized as cost of revenue in the period when the related revenue is recognized.
Operating Expenses
Research and Development Expenses
Research and development expenses consist of engineering services, allocated facilities costs, depreciation, development expenses, materials, labor and stock-based compensation related primarily to our (i) technology development, (ii) design, construction, and testing of preproduction prototypes and models, and (iii) certain costs related to the design, construction and operation of our pilot plant that are not of a scale economically feasible to us for commercial production. Research and development costs are expensed as incurred.
To date, research and development expenses have consisted primarily of personnel-related expenses for scientists, experienced engineers and technicians as well as costs associated with the expansion and ramp up of our engineering and manufacturing facility, materials and supplies to support the product development and process engineering efforts. As we ramp up our engineering operations to complete the development of batteries and required process engineering to meet customer specifications, we anticipate that research and development expenses will continue to increase for the foreseeable future as we expand hiring of scientists, engineers and technicians and continue to invest in additional plant and equipment for product development, building prototypes and testing of batteries. We established a research and development center in India to focus on developing machine learning algorithms, battery modeling, material screening and electrolyte optimization. We also established a research and development team in Malaysia.
Selling, General, and Administrative Expenses
Selling, general and administrative expenses consist of personnel-related expenses, marketing expenses, allocated facilities expenses, depreciation expenses, travel expenses, acquisition costs, and professional services expenses, including legal, human resources, audit, accounting and tax-related services. Personnel-related costs consist of salaries, benefits and stock-based compensation. Facilities costs consist of rent and maintenance of facilities.
We are expanding our personnel headcount to support the ramping up of commercial manufacturing. Accordingly, we expect our selling, general and administrative expenses to continue to increase in the near term and for the foreseeable future.
Impairment of Equipment and Restructuring Cost
Impairment of equipment was a result of our disposal of machinery and equipment that were identified to have no future or alternative usage.
Restructuring cost was the result of our restructuring plans in 2023 and 2024, which included workforce reductions, relocation of our Fab1 manufacturing operations from California to Malaysia and disposals of our long-lived assets located in Fremont that have no future or alternative use. Please refer to Note 15 “Restructuring Costs” of the notes to our consolidated financial statements in Part II, Item 8 of this Annual Report on Form 10-K for further details.
Other Income (Expense)
Other income and expense primarily consists of dividend income, interest income, interest expense, foreign currency transaction gain or loss and fair value adjustments for outstanding common stock warrants.
Income Tax
Our income tax provision consists of an estimate for U.S. federal, state and foreign income taxes based on enacted rates, as adjusted for allowable credits, deductions, uncertain tax positions, changes in deferred tax assets and liabilities, and changes in the tax law. We maintain a valuation allowance against the full value of our U.S. and state net deferred tax assets because we believe the recoverability of the tax assets is not more likely than not. Since our acquisition of Routejade and our establishment of operations in Malaysia and India in the fiscal year 2023, we became subject to taxation based on the foreign statutory rates in the countries.
Results of Operations
Comparison of Fiscal Year 2024 to Prior Fiscal Year 2023
The following table sets forth our consolidated operating results for the periods presented below (in thousands, except percentages).
| | | | | | | | | | | | | | | | | | | | | | | |
| Fiscal Years Ended | | | | |
| December 29, 2024 | | December 31, 2023 | | Change ($) | | % Change |
| | | | | | | |
| | | | | | | |
| | | | | | | |
| Revenue | $ | 23,074 | | | $ | 7,644 | | | $ | 15,430 | | | N/M |
| | | | | | | |
| | | | | | | |
| | | | | | | |
| Cost of revenue | 25,119 | | | 63,061 | | | (37,942) | | | (60) | % |
| Gross margin | (2,045) | | | (55,417) | | | 53,372 | | | (96) | % |
| Operating expenses: | | | | | | | |
| Research and development | 124,506 | | | 88,392 | | | 36,114 | | | 41 | % |
| Selling, general and administrative | 74,311 | | | 79,014 | | | (4,703) | | | (6) | % |
| Impairment of equipment | — | | | 4,411 | | | (4,411) | | | N/M |
| Restructuring cost | 41,807 | | | 3,021 | | | 38,786 | | | N/M |
| Total operating expenses | 240,624 | | | 174,838 | | | 65,786 | | | 38 | % |
| Loss from operations | (242,669) | | | (230,255) | | | (12,414) | | | 5 | % |
| Other income (expense): | | | | | | | |
| Change in fair value of common stock warrants | 12,244 | | | 6,180 | | | 6,064 | | | 98 | % |
| | | | | | | |
| | | | | | | |
| Interest income | 12,332 | | | 14,070 | | | (1,738) | | | (12) | % |
| Interest expense | (6,787) | | | (4,456) | | | (2,331) | | | 52 | % |
| Other income (expense), net | 954 | | | (304) | | | 1,258 | | | N/M |
| Total other expense, net | 18,743 | | | 15,490 | | | 3,253 | | | 21 | % |
| Loss before income tax benefit | (223,926) | | | (214,765) | | | (9,161) | | | 4 | % |
| Income tax benefit | (1,392) | | | (633) | | | (759) | | | N/M |
| Net loss | $ | (222,534) | | | $ | (214,132) | | | $ | (8,402) | | | 4 | % |
| | | | | | | |
| | | | | | | |
N/M – Not meaningful
Revenue
Revenue for fiscal years 2024 and 2023 was $23.1 million and $7.6 million, respectively. Revenue in both years primarily resulted from the product shipments from our facility in South Korea, which was acquired in October 2023. Revenue for fiscal year 2023 included $7.3 million of revenue from the Routejade acquisition.
The $15.4 million increase in revenue was primarily attributable to earning a full year of product revenue from the acquired business of Routejade in fiscal year 2024 versus only two months of revenue from the acquired business in fiscal year 2023. Of the $15.4 million increase in revenue compared to fiscal year 2023, $6.4 million of that increase was derived from higher shipment volumes to a South Korea defense contractor, and the remaining increase was attributable to higher shipment volumes to consumer electronics customers.
For fiscal years 2024 and 2023, revenue from a South Korea defense contractor accounted for approximately 50% and 75% of our total revenue, respectively. As of December 29, 2024 and December 31, 2023, we had $7.4 million and $10.5 million, respectively, of deferred revenue on our Consolidated Balance Sheets.
Cost of Revenue
Cost of revenue for the fiscal year 2024 was $25.1 million, compared to $63.1 million for the prior fiscal year 2023. The decrease of $37.9 million or 60% was primarily attributable to the fact that there was no production generated from Fab1 during the fiscal year 2024. With no production in Fab1 and minimal production in Fab2 in fiscal year 2024, a majority of the factory expenses associated with Fab1 and Fab2 were classified as research and development expenses
instead of cost of revenues in fiscal year 2024. The transition from Fab1 to Fab2 was a part of the 2023 and 2024 Restructuring Plans (as defined in Note 15 “Restructuring Costs” of the notes to the consolidated financial statements included in Part II, Item 8 of this Annual Report on Form 10-K). These restructuring plans also included U.S. workforce reductions in the fourth quarter of fiscal year 2023 and the second half of fiscal year 2024. In addition, the decreases in the cost of revenue were partially offset by inventory write-offs of $1.8 million and a $17.1 million increase in manufacturing costs associated with the increase of revenue as compared to fiscal year 2023.
In addition, we anticipate our factory expenses will increase as we continue to hire additional personnel to support the Fab2 production lines and our Fab2 manufacturing facility.
Research and Development Expenses
Research and development expenses for the fiscal year 2024 were $124.5 million, compared to $88.4 million for the fiscal year 2023. The increase of $36.1 million, or 41%, was primarily attributable to $16.2 million of overhead costs being recorded as R&D expenses (previously recorded as cost of revenue) as a result of the transition of Fab1 to focus on R&D in 2024 and there was no production generated from Fab1 or Fab2. In addition, there was a $13.9 million increase in depreciation expense, a $9.6 million increase in information technology and facility costs, and a $6.3 million increase in material and tooling costs, which included a $1.4 million increase of intangible amortization for the acquired technology from the Routejade Acquisition. Furthermore, we had a net $0.7 million increase in salaries and employee benefits due to increased headcount in Asia, offset by workforce reductions in the U.S. These increases were partially offset by a one-time severance, benefits and stock-based compensation expense of $10.6 million in connection with the departures of certain executives and senior management in 2023.
Selling, General and Administrative Expenses
Selling, general and administrative expenses for the fiscal year 2024 were $74.3 million, compared to $79.0 million for the fiscal year 2023. The decrease of $4.7 million, or 6%, was primarily attributable to one-time severance, benefits and stock-based compensation expense of $17.9 million in connection with the departure of certain officers and executives in fiscal year 2023, a $5.9 million decrease in information technology, professional fees and facility costs, and $1.3 million of acquisition costs in connection with the Routejade Acquisition. These decreases were partially offset by a $12.7 million increase in stock-based compensation expense (excluding the decrease in stock-based compensation associated with the departure of certain officers and executives), a $3.4 million increase in depreciation expense, a $2.4 million increase in intangible amortization for the acquired intangible assets from the acquisition of Routejade, a $1.0 million increase in salaries and benefits and a $0.9 million of net increase in miscellaneous expenses.
Impairment of Equipment
There was no impairment of equipment recorded for fiscal year 2024, while we recorded $4.4 million of impairment of equipment for fiscal year 2023 related to the disposal of machinery and equipment that were identified to have no future or alternative usage. These impaired assets were previously capitalized in the “Machinery and equipment” category of property and equipment, net on the Consolidated Balance Sheets.
Restructuring Cost
In May 2024, we initiated the 2024 Restructuring Plan (as defined in Note 15 “Restructuring Costs” of the notes to the consolidated financial statements included in Part II, Item 8 of this Annual Report on Form 10-K) to relocate our Fab1 manufacturing operations in Fremont, California to Malaysia. As a result, we recorded pre-tax restructuring charges of $41.8 million for the fiscal year 2024, which consisted of non-cash charges of $38.2 million of loss on disposals of Fab1 long-lived assets located in Fremont, $1.2 million of stock-based compensation expense, cash charges of $1.6 million of severance and termination benefits and $0.8 million of other charges.
In October 2023, the 2023 Restructuring Plan (as defined in Note 15 “Restructuring Costs” of the notes to the consolidated financial statements included in Part II, Item 8 of this Annual Report on Form 10-K) included $3.0 million of restructuring costs recorded during fiscal year 2023, which consisted of $2.4 million of severance and termination benefits and stock-based compensation expense and $0.6 million of inventory costs.
Change in Fair Value of Common Stock Warrants
For fiscal year 2024, the change in fair value of common stock warrants of $12.2 million was mainly attributable to a decrease in the fair value of the 5,500,000 Private Placement Warrants (as defined in Note 4 “Fair Value Measurement” of the notes to the consolidated financial statements included in Part II, Item 8 of this Annual Report on Form 10-K). The
decrease in fair value of Private Placement Warrants was primarily due to a decrease in our common stock price during the current year. In addition, there was a decrease in the number of warrants outstanding at the end of fiscal year 2024 as there was a warrant exercise of 500,000 shares during the fiscal year 2024.
For fiscal year 2023, the change in fair value of common stock warrants of $6.2 million was attributable to a decrease in the fair value of the 6,000,000 Private Placement Warrants. The decrease in fair value of Private Placement Warrants was primarily due to a decrease in our common stock price during the year 2023.
Interest Income
Interest income for fiscal year 2024 was $12.3 million, compared to $14.1 million during fiscal year 2023. The decrease of $1.7 million was primarily due to the fact that we received lower dividend income and interest income as we had lower cash balance in the fiscal year 2024 compared to the fiscal year 2023.
Interest Expense
Interest expense for fiscal year 2024 was $6.8 million, compared to $4.5 million for fiscal year 2023. The increase of $2.3 million, or 52%, was primarily attributable to the fact that the Convertible Senior Notes were issued in April 2023. Accordingly, we recognized a full year of interest expense in the fiscal year 2024 as compared to approximately 8.5 months of interest expense recognized for the fiscal year 2023.
Liquidity and Capital Resources
We have incurred operating losses and negative cash flows from operations since inception through December 29, 2024 and expect to incur operating losses for the foreseeable future. As of December 29, 2024, we had cash, cash equivalents and restricted cash of $274.7 million, working capital of $241.3 million and an accumulated deficit of $821.1 million. For the fiscal year 2024, we received net proceeds of $40.0 million from the issuance of our common stock under our ATM program. In addition, we sold 11,626,089 shares of our common stock and received proceeds of $106.7 million, net of estimated issuance costs in the fourth quarter of 2024.
Material Cash Requirements
As of December 29, 2024, we had cash, cash equivalents and restricted cash of $274.7 million. We currently use cash to fund operations, meet working capital requirements and fund our capital expenditures. In fiscal year 2025, we expect that our spending in cost of revenues and operating expenses will continue to increase as we ramp up our Fab2 operations and build additional production lines.
For the fiscal year 2024, we purchased $76.2 million of property and equipment. We will continue to increase our property and equipment purchases in the near future to support the build-out of our manufacturing facilities and our battery manufacturing equipment. See more discussion on contractual obligations and commitments in the section below.
Based on the anticipated spending and timing of expenditures to support operational development and market expansion, we currently expect that our cash will be sufficient to meet our funding requirements over the next twelve months from the date this Annual Report on Form 10-K is filed. We believe we will meet longer-term expected future cash requirements and obligations through a combination of available cash, cash equivalents and future debt financings, and access to other public or private equity offerings as well as potential strategic arrangements. We have made our estimates on historical experience and various other relevant factors and we believe that they are reasonable. Actual results may differ from our estimates, and we could utilize our available capital resources sooner than we expect.
Summary of Cash Flows
The following table provides a summary of cash flow data for the periods presented below (in thousands).
| | | | | | | | | | | | | | | | | |
| Fiscal Years | | |
| 2024 | | 2023 | | Change ($) |
| Net cash used in operating activities | $ | (108,633) | | | $ | (104,636) | | | $ | (3,997) | |
| Net cash used in investing activities | (1,379) | | | (142,956) | | | 141,577 | |
| Net cash provided by financing activities | 150,749 | | | 159,585 | | | (8,836) | |
| Effect of exchange rate changes on cash, cash equivalents and restricted cash | (1,169) | | | 154 | | | (1,323) | |
| Change in cash, cash equivalents, and restricted cash | $ | 39,568 | | | $ | (87,853) | | | $ | 127,421 | |
Comparison of Fiscal Year 2024 to Prior Fiscal Year 2023
Operating Activities
Our cash flows used in operating activities to date have been primarily comprised of operating expenses. We continue to increase hiring for employees in supporting the ramping up of commercial manufacturing. We expect our cash used in operating activities to increase significantly before we start to generate any material cash inflows from commercially manufacturing and selling our batteries.
Net cash used in operating activities was $108.6 million for the fiscal year 2024. Net cash used in operating activities consists of net loss of $222.5 million, adjusted for non-cash items and the effect of changes in working capital. Non-cash adjustments primarily include a decrease in fair value of the Private Placement Warrants of $12.2 million, stock-based compensation expense of $58.8 million, depreciation and amortization expense of $45.0 million and impairment and loss on disposal of long-lived assets of $38.3 million.
Net cash used in operating activities was $104.6 million for the fiscal year 2023. Net cash used in operating activities consists of net loss of $214.1 million, adjusted for non-cash items and the effect of changes in working capital. Non-cash adjustments primarily include the change in fair value of common stock warrants of $6.2 million, stock-based compensation expense of $69.5 million, depreciation and amortization expense of $34.0 million and impairment of equipment of $4.4 million.
Investing Activities
Our cash flows used in investing activities to date have been primarily comprised of purchases of property and equipment. Starting in the second quarter of 2023, we began to purchase short-term investments. We expect the costs to acquire property and equipment to increase in the future as we continue to build-out our Fab2 and develop our battery manufacturing production lines in Malaysia. Net cash used in investing activities, which were primarily related to equipment purchases, were $76.2 million and $61.8 million for the fiscal years 2024 and 2023, respectively.
During the fiscal years 2024 and 2023, we purchased $31.8 million and $138.3 million of investments, respectively. In addition, we had $106.6 million and $67.2 million of investments mature during the fiscal years 2024 and 2023, respectively. In October 2023, we used cash, net of cash acquired, of $10.0 million and 5,923,521 shares of our common stock to purchase substantially all of the outstanding shares of Routejade.
Financing Activities
Net cash provided by financing activities was $150.7 million for the fiscal year 2024, which primarily consisted of $107.2 million of proceeds, net of paid issuance costs, from issuance of common stock, $40.0 million of net proceeds from the issuance of our common stock under our ATM program, $4.8 million of proceeds from the exercise of stock options to purchase our common stock, $4.6 million of proceeds from the borrowings of short-term loans and $1.5 million of proceeds from our employee stock purchase plan (“ESPP”) to purchase our common stock, partially offset by $7.1 million of payroll tax payments for shares withheld upon vesting of restricted stock units.
Net cash provided by financing activities was $159.6 million for the fiscal year 2023, which primarily consisted of $172.5 million of gross proceeds from the Convertible Senior Notes, $11.9 million of proceeds from the exercise of stock options to purchase our common stock and $2.4 million of proceeds from our ESPP to purchase our common stock,
partially offset by $17.3 million of capped call transaction costs, $5.9 million of debt issuance costs, and $3.9 million of payroll tax payments for shares withheld upon vesting of restricted stock units.
Contractual Obligations and Commitments
As of December 29, 2024, we had $172.5 million aggregate principal amount of 3.0% Convertible Senior Notes outstanding, which will mature on May 1, 2028 unless earlier converted, redeemed or repurchased. Please see Note 9 “Borrowings” of the notes to our consolidated financial statements in Part II, Item 8 of this Annual Report on Form 10-K for further information.
We lease our headquarters in Fremont, California, our Fab2 in Penang, Malaysia, and offices in India and China. For the lease payment schedule, please see Note 7 “Leases,” of the notes to our consolidated financial statements in Part II, Item 8 of this Annual Report on Form 10-K for further information.
We expect to enter into other commitments to support our product development, the build-out of our manufacturing facilities, and our business development, which are generally cancellable upon notice. Additionally, from time to time, we enter into agreements in the normal course of business with various vendors, which are generally cancellable upon notice. Payments due upon cancellation consist only of payments for services provided or expenses incurred, including non-cancellable obligations of service providers, up to the date of cancellation. As of December 29, 2024, our commitments included approximately $17.4 million of our open purchase orders, including equipment purchase orders, and contractual obligations that occurred in the ordinary course of business. For contractual obligations, please See Note 10 “Commitments and Contingencies” of the notes to our consolidated financial statements in Part II, Item 8 of this Annual Report on Form 10-K for further information.
Off-Balance Sheet Arrangements
As of December 29, 2024 and December 31, 2023, we did not have any off-balance sheet arrangements, as defined in the rules and regulations of the SEC.
Critical Accounting Estimates
The preparation of our consolidated financial statements in conformity with GAAP requires our management to make estimates and assumptions that affect the reported amounts of assets and liabilities in our consolidated financial statements and accompanying notes. We base these estimates on historical experience and on various other assumptions that we believe are reasonable under the circumstances, the results of which form the basis for making judgments about the carrying amounts of assets and liabilities that are not readily apparent from other sources. Actual results may differ materially from these estimates. These estimates and assumptions include but are not limited to: depreciable lives for property and equipment and intangible assets, impairment of equipment, valuation for inventory, the valuation allowance on deferred tax assets, assumptions used in income tax provisions, valuation for assets acquired and liabilities assumed in business combinations, valuation of goodwill and intangible assets, assumptions used in stock-based compensation, incremental borrowing rate for operating right-of-use assets and lease liabilities, restructuring costs, and estimates to fair value of common stock warrants.
A summary of our significant accounting policies is included in Note 2 “Summary of Significant Accounting Policies” of the notes to our consolidated financial statements in Part II, Item 8 of this Annual Report on Form 10-K. We believe that application of the following accounting policies involves our subjective judgement, estimates and assumptions, which have had or are reasonable likely to have a material impact to our consolidated financial statements.
Common Stock Warrant Liabilities
In connection with 2021 business combination with Rodgers Silicon Valley Acquisition Corp., we issued outstanding warrants of 17.5 million to purchase common stock at a price of $11.50 per share. These warrants consisted of 11,500,000 warrants held by the third-party investors (the “Public Warrants”) and 6,000,000 warrants issued to a private placement to the sponsor and members of Rodgers Capital LLC (the “Private Placement Warrants”). As of December 29, 2024, there were 5,500,000 outstanding shares of the Private Placement Warrants and no Public Warrants outstanding.
We use the Black-Scholes option pricing model to determine the fair value of the Private Placement Warrants as of December 29, 2024. The estimates and assumptions impacting the fair value measurement include the fair value per share of the underlying shares of our Common Stock, risk free interest rate, expected dividend yield, expected volatility of the price of the underlying Common Stock and a probability weighted expected term of the warrants. The most
significant assumptions impacting the fair value of the Private Placement Warrants are the fair value of our common stock as of each re-measurement date and expected price volatility of our Common Stock, which included consideration of our historical observed volatility and other additional factors that were deemed relevant. The warrant liability is adjusted for changes in the fair value at each reporting date and recorded in the Consolidated Statement of Operations. The Private Placement Warrants are subject to re-measurement at each balance sheet date until they are exercised or expired. For further information, see Note 4 “Fair Value Measurement” of the notes to our consolidated financial statements in Part II, Item 8 of this Annual Report on Form 10-K.
Goodwill and Intangible Assets
As of December 29, 2024, our goodwill, customer relationship intangibles and other intangibles, net were $12.2 million and $36.4 million, respectively. We perform periodic reviews of significant identified intangible assets and goodwill at least annually in the fourth quarter or more frequently if events or changes in circumstances indicate that the asset may be impaired. These reviews can be affected by various factors, including external factors such as industry and economic trends, and internal factors such as changes in our business strategy and forecasts for specific products. Periodically, we also evaluate the estimated remaining useful lives of purchased intangible assets and whether events or changes in circumstances warrant a revision to the remaining periods of amortization. Based on our 2024 impairment analysis, there was no impairment to our intangible assets and goodwill for the periods presented.
Stock-Based Compensation
We issue stock-based compensation to employees and non-employees generally in the form of stock options or restricted stock units (“RSUs”) and performance-based restricted stock units (“PRSUs”). We also offer employee stock purchase plan (the “2021 ESPP”) to our employees. Stock-based compensation cost is measured at the grant date for all stock-based awards made to employees, consultants and directors based on the grant date fair value of the equity award. To determine the grant date fair value of the equity awards, we use the last reported sales price of our common stock on the grant date for RSUs and PRSUs and we use the Black-Scholes option pricing model with several assumptions and estimates to derive the grant date fair value of our stock options and ESPP shares. Since fiscal year 2022, we did not issue stock options.
For the PRSUs, stock-based compensation cost is recognized based on the grant date fair value and the expected performance achievement percentage of meeting the performance milestones. At each reporting period, we assess and determine the expected performance achievement percentage. The change in the expected performance achievement percentage could have an impact on the stock-based compensation expense until the end of each performance periods. For further information, see Note 14 “Stock-based Compensation” to our consolidated financial statements included in Part II, Item 8 of this Annual Report on Form 10-K.
Impairment of Long-Lived Assets
We evaluate the carrying value of long-lived assets when indicators of impairment exist. The carrying value of a long-lived asset is considered impaired when the estimated separately identifiable, undiscounted cash flows from such an asset are less than the carrying value of the asset. In that event, a loss is recognized based on the amount by which the carrying value exceeds the fair value of the long-lived asset. The fair value is determined based on the estimated discounted cash flows. If we cease to develop and automate certain equipment or our equipment is underutilized or idled, the carrying value of such equipment may be lower than its estimated fair value, which could result in future impairment loss. There was no impairment of equipment recorded for the fiscal year 2024 while we recorded $4.4 million of impairment of equipment for the fiscal year 2023 related to the disposal of machinery and equipment that were identified to have no future or alternative usage.
Recent Accounting Pronouncements
See section “Recently Adopted Accounting Pronouncements” of Note 2 “Summary of Significant Accounting Policies” within our consolidated financial statements included in Part II, Item 8 of this Annual Report on Form 10-K.
Item 7A. Quantitative and Qualitative Disclosures About Market Risk
We are exposed to a variety of market and other risks, including the effects of changes in interest rates, and foreign currency risk, as well as risks to the availability of funding sources, hazard events, and specific asset risks.
Interest Rate Risk
The market risk inherent in our financial instruments and financial position represents the potential loss arising from adverse changes in interest rates. As of December 29, 2024, we had cash, cash equivalents and restricted cash totaling $274.7 million. Our cash, cash equivalents, and restricted cash are held in cash deposits, money market funds and interest bearing account. We do not believe that an immediate 10% increase or decrease in interest rates would have a material effect on the fair value of our cash equivalents.
As of December 29, 2024, we had $172.5 million of Convertible Senior Notes with an annual interest rate of 3.0%, which accounted for approximately 94% of our total debt before debt issuance costs, and the other borrowings are mostly with fixed interest rates. As such, we do not believe that we are exposed to any material interest rate risk as a result of our borrowing activities.
Uncertain financial markets could result in a tightening in the credit markets, a reduced level of liquidity in many financial markets, and extreme volatility in fixed income and credit markets.
Foreign Currency Risk
In fiscal year 2024, we conducted operations in the U.S. and Asia. The majority of our expenses, and capital purchasing activities are transacted in U.S. dollars in fiscal year 2024. Our operations outside of the U.S. are subject to risks typical of operations outside of the U.S. including, but not limited to, differing economic conditions, changes in political climate, differing tax structures, other regulations and restrictions, and foreign exchange rate volatility. Our operating results in the international subsidiaries for fiscal year 2024 was not material. If a hypothetical 10% adverse change in foreign currency exchange rate was applied to our monetary assets and liabilities on December 29, 2024, the effect of such change would not be material to our consolidated financial condition or our results of operations.
Given the impact of foreign currency exchange rates has not been material to our historical operating results, we have not entered into derivative or hedging transactions, but we may do so in the future if our exposure to foreign currency should become more significant. As our international operations grow, we will continue to reassess our approach to manage our risk relating to fluctuations in currency rates.
Item 8. Financial Statements and Supplementary Data
Enovix Corporation
Index to Consolidated Financial Statements
REPORT OF INDEPENDENT REGISTERED PUBLIC ACCOUNTING FIRM
To the stockholders and the Board of Directors of Enovix Corporation
Opinion on the Financial Statements
We have audited the accompanying consolidated balance sheets of Enovix Corporation and subsidiaries (the “Company”) as of December 29, 2024, and December 31, 2023, the related consolidated statements of operations, comprehensive income (loss), stockholders’ equity, and cash flows, for each of the three years in the period ended December 29, 2024, and the related notes (collectively referred to as the “financial statements”). In our opinion, the financial statements present fairly, in all material respects, the financial position of the Company as of December 29, 2024 and December 31, 2023, and the results of its operations and its cash flows for each of the three years in the period ended December 29, 2024, in conformity with accounting principles generally accepted in the United States of America.
We have also audited, in accordance with the standards of the Public Company Accounting Oversight Board (United States) (PCAOB), the Company's internal control over financial reporting as of December 29, 2024, based on criteria established in Internal Control — Integrated Framework (2013) issued by the Committee of Sponsoring Organizations of the Treadway Commission and our report dated February 25, 2025, expressed an unqualified opinion on the Company's internal control over financial reporting.
Basis for Opinion
These financial statements are the responsibility of the Company's management. Our responsibility is to express an opinion on the Company's financial statements based on our audits. We are a public accounting firm registered with the PCAOB and are required to be independent with respect to the Company in accordance with the U.S. federal securities laws and the applicable rules and regulations of the Securities and Exchange Commission and the PCAOB.
We conducted our audits in accordance with the standards of the PCAOB. Those standards require that we plan and perform the audits to obtain reasonable assurance about whether the financial statements are free of material misstatement, whether due to error or fraud. Our audits included performing procedures to assess the risks of material misstatement of the financial statements, whether due to error or fraud, and performing procedures that respond to those risks. Such procedures included examining, on a test basis, evidence regarding the amounts and disclosures in the financial statements. Our audits also included evaluating the accounting principles used and significant estimates made by management, as well as evaluating the overall presentation of the financial statements. We believe that our audits provide a reasonable basis for our opinion.
Critical Audit Matter
The critical audit matter communicated below is a matter arising from the current-period audit of the financial statements that was communicated or required to be communicated to the audit committee and that (1) relates to accounts or disclosures that are material to the financial statements and (2) involved our especially challenging, subjective, or complex judgments. The communication of critical audit matters does not alter in any way our opinion on the financial statements, taken as a whole, and we are not, by communicating the critical audit matter below, providing a separate opinion on the critical audit matter or on the accounts or disclosures to which it relates.
Variable Interest Entity – Refer to Notes 2 and 16 to the Financial Statements
Critical Audit Matter Description
On October 29, 2024, the Company amended its agreement with YBS International Berhad (“YBS”), a Malaysia-based company. Management evaluated the manufacturing agreement, as amended (the “Amended Agreement”), and concluded the Company does not have a controlling financial interest in a variable interest entity (“VIE”) as defined in ASC 810, Consolidations.
We identified management’s assessment of whether the Amended Agreement provides the Company with a controlling financial interest in a VIE as a critical audit matter due to the complexity of applying the accounting principles of ASC 810 to the Amended Agreement.
How the Critical Audit Matter Was Addressed in the Audit
Our audit procedures related to the assessment of whether the Amended Agreement provides the Company with a controlling financial interest in a VIE included the following, among others:
•We tested the design and operating effectiveness of controls over management’s accounting for unique or complex transactions, specifically, the determination of whether the Amended Agreement provided the Company with a controlling financial interest in a VIE.
•We read and evaluated the terms of the Amended Agreement, and inquired of management and legal counsel, to understand the legal entities involved, the rights and responsibilities of each party, and the related commercial terms.
•With the assistance of our accounting specialists, we evaluated the Company’s conclusion that it does not have a controlling financial interest in a VIE as a result of the Amended Agreement.
/s/ DELOITTE & TOUCHE LLP
San Francisco, California
February 25, 2025
We have served as the Company’s auditor since 2021.
REPORT OF INDEPENDENT REGISTERED PUBLIC ACCOUNTING FIRM
To the stockholders and the Board of Directors of Enovix Corporation
Opinion on Internal Control over Financial Reporting
We have audited the internal control over financial reporting of Enovix Corporation and subsidiaries (the “Company”) as of December 29, 2024, based on criteria established in Internal Control — Integrated Framework (2013) issued by the Committee of Sponsoring Organizations of the Treadway Commission (COSO). In our opinion, the Company maintained, in all material respects, effective internal control over financial reporting as of December 29, 2024, based on criteria established in Internal Control — Integrated Framework (2013) issued by COSO.
We have also audited, in accordance with the standards of the Public Company Accounting Oversight Board (United States) (PCAOB), the consolidated financial statements as of and for the year ended December 29, 2024, of the Company and our report dated February 25, 2025, expressed an unqualified opinion on those financial statements.
Basis for Opinion
The Company’s management is responsible for maintaining effective internal control over financial reporting and for its assessment of the effectiveness of internal control over financial reporting, included in the accompanying Management’s Report on Internal Control over Financial Reporting. Our responsibility is to express an opinion on the Company’s internal control over financial reporting based on our audit. We are a public accounting firm registered with the PCAOB and are required to be independent with respect to the Company in accordance with the U.S. federal securities laws and the applicable rules and regulations of the Securities and Exchange Commission and the PCAOB.
We conducted our audit in accordance with the standards of the PCAOB. Those standards require that we plan and perform the audit to obtain reasonable assurance about whether effective internal control over financial reporting was maintained in all material respects. Our audit included obtaining an understanding of internal control over financial reporting, assessing the risk that a material weakness exists, testing and evaluating the design and operating effectiveness of internal control based on the assessed risk, and performing such other procedures as we considered necessary in the circumstances. We believe that our audit provides a reasonable basis for our opinion.
Definition and Limitations of Internal Control over Financial Reporting
A company’s internal control over financial reporting is a process designed to provide reasonable assurance regarding the reliability of financial reporting and the preparation of financial statements for external purposes in accordance with generally accepted accounting principles. A company’s internal control over financial reporting includes those policies and procedures that (1) pertain to the maintenance of records that, in reasonable detail, accurately and fairly reflect the transactions and dispositions of the assets of the company; (2) provide reasonable assurance that transactions are recorded as necessary to permit preparation of financial statements in accordance with generally accepted accounting principles, and that receipts and expenditures of the company are being made only in accordance with authorizations of management and directors of the company; and (3) provide reasonable assurance regarding prevention or timely detection of unauthorized acquisition, use, or disposition of the company’s assets that could have a material effect on the financial statements.
Because of its inherent limitations, internal control over financial reporting may not prevent or detect misstatements. Also, projections of any evaluation of effectiveness to future periods are subject to the risk that controls may become inadequate because of changes in conditions, or that the degree of compliance with the policies or procedures may deteriorate.
/s/ DELOITTE & TOUCHE LLP
San Francisco, California
February 25, 2025
ENOVIX CORPORATION
CONSOLIDATED BALANCE SHEETS
(In thousands, except share and par value amounts)
| | | | | | | | | | | |
| December 29, 2024 | | December 31, 2023 |
| Assets | | | |
| Current assets: | | | |
| Cash and cash equivalents | $ | 272,869 | | | $ | 233,121 | |
| Short-term investments | — | | | 73,694 | |
| Accounts receivable, net | 4,566 | | | 909 | |
| Notes receivable, net | 4 | | | 1,514 | |
| Inventory | 7,664 | | | 8,737 | |
| | | |
| Prepaid expenses and other current assets | 9,903 | | | 5,202 | |
| Total current assets | 295,006 | | | 323,177 | |
| Property and equipment, net | 167,947 | | | 166,471 | |
| Customer relationship intangibles and other intangibles, net | 36,394 | | | 42,168 | |
| Operating lease, right-of-use assets | 13,479 | | | 15,290 | |
| Goodwill | 12,217 | | | 12,098 | |
| | | |
| Other assets, non-current | 2,126 | | | 5,100 | |
| Total assets | $ | 527,169 | | | $ | 564,304 | |
| Liabilities and Stockholders’ Equity | | | |
| Current liabilities: | | | |
| Accounts payable | $ | 9,492 | | | $ | 21,251 | |
| Accrued expenses | 19,843 | | | 13,976 | |
| Accrued compensation | 8,228 | | | 10,731 | |
| Short-term debt | 9,452 | | | 5,917 | |
| Deferred revenue | 3,650 | | | 6,708 | |
| Other liabilities | 3,036 | | | 2,435 | |
| Total current liabilities | 53,701 | | | 61,018 | |
| Long-term debt, net | 169,820 | | | 169,099 | |
| Warrant liability | 28,380 | | | 42,900 | |
| Operating lease liabilities, non-current | 13,293 | | | 15,594 | |
| Deferred revenue, non-current | 3,774 | | | 3,774 | |
| Deferred tax liability | 8,784 | | | 10,803 | |
| Other liabilities, non-current | 14 | | | 13 | |
| Total liabilities | 277,766 | | | 303,201 | |
| Commitments and Contingencies (Note 10) | | | |
| Stockholders’ equity: | | | |
| Common stock, $0.0001 par value; authorized shares of 1,000,000,000; issued and outstanding shares of 190,559,335 and 167,392,315 as of December 29, 2024 and December 31, 2023, respectively | 19 | | | 17 | |
| Preferred stock, $0.0001 par value; authorized shares of 10,000,000; no shares issued or outstanding as of December 29, 2024 and December 31, 2023, respectively | — | | | — | |
| Additional paid-in-capital | 1,067,951 | | | 857,037 | |
| Accumulated other comprehensive loss | (143) | | | (62) | |
| Accumulated deficit | (821,086) | | | (598,845) | |
| Total Enovix's stockholders’ equity | 246,741 | | | 258,147 | |
| Non-controlling interest | 2,662 | | | 2,956 | |
| Total equity | 249,403 | | | 261,103 | |
| Total liabilities and equity | $ | 527,169 | | | $ | 564,304 | |
See accompanying notes to these consolidated financial statements.
ENOVIX CORPORATION
CONSOLIDATED STATEMENTS OF OPERATIONS
(In thousands, except share and per share amounts)
| | | | | | | | | | | | | | | | | |
| Fiscal Years Ended |
| 2024 | | 2023 | | 2022 |
| | | | | |
| | | | | |
| | | | | |
| Revenue | $ | 23,074 | | | $ | 7,644 | | | $ | 6,202 | |
| | | | | |
| | | | | |
| | | | | |
| Cost of revenue | 25,119 | | | 63,061 | | | 23,239 | |
| Gross margin | (2,045) | | | (55,417) | | | (17,037) | |
| Operating expenses: | | | | | |
| Research and development | 124,506 | | | 88,392 | | | 58,051 | |
| Selling, general and administrative | 74,311 | | | 79,014 | | | 51,970 | |
| Impairment of equipment | — | | | 4,411 | | | 4,921 | |
| Restructuring cost | 41,807 | | | 3,021 | | | — | |
| Total operating expenses | 240,624 | | | 174,838 | | | 114,942 | |
| Loss from operations | (242,669) | | | (230,255) | | | (131,979) | |
| Other income (expense): | | | | | |
| Change in fair value of common stock warrants | 12,244 | | | 6,180 | | | 75,180 | |
| | | | | |
| | | | | |
| | | | | |
| Interest income | 12,332 | | | 14,070 | | | 5,231 | |
| Interest expense | (6,787) | | | (4,456) | | | — | |
| Other income (loss), net | 954 | | | (304) | | | (54) | |
| Total other income, net | 18,743 | | | 15,490 | | | 80,357 | |
| Loss before income tax benefit | (223,926) | | | (214,765) | | | (51,622) | |
| Income tax benefit | (1,392) | | | (633) | | | — | |
| Net loss | (222,534) | | | (214,132) | | | (51,622) | |
| Net loss attributable to non-controlling interests | (293) | | | (61) | | | — | |
| Net loss attributable to Enovix | $ | (222,241) | | | $ | (214,071) | | | $ | (51,622) | |
| | | | | |
| Net loss per share attributable to Enovix shareholders, basic | $ | (1.27) | | | $ | (1.35) | | | $ | (0.34) | |
| Weighted average number of common shares outstanding, basic | 175,038,107 | | | 159,065,697 | | | 152,918,287 | |
| Net loss per share attributable to Enovix shareholders, diluted | $ | (1.27) | | | $ | (1.38) | | | $ | (0.82) | |
| Weighted average number of common shares outstanding, diluted | 175,038,107 | | | 159,575,555 | | | 154,149,367 | |
| | | | | |
See accompanying notes to these consolidated financial statements.
ENOVIX CORPORATION
CONSOLIDATED STATEMENTS OF COMPREHENSIVE INCOME (LOSS)
(In thousands)
| | | | | | | | | | | | | | | | | | | | |
| | Fiscal Years Ended |
| | 2024 | | 2023 | | 2022 |
| | | | | | |
| | | | | | |
| | | | | | |
| Net loss | | $ | (222,534) | | | $ | (214,132) | | | $ | (51,622) | |
| Other comprehensive income (loss), net of tax | | | | | | |
| Change in net foreign currency translation adjustments | | (66) | | | (77) | | | — | |
| Net unrealized gain (loss) on available-for-sale securities | | (15) | | | 15 | | | — | |
| Other comprehensive expense, net of tax | | (81) | | | (62) | | | — | |
| Comprehensive loss | | (222,615) | | | (214,194) | | | (51,622) | |
| Comprehensive loss attributable to non-controlling interest | | (293) | | | (61) | | | — | |
| Comprehensive loss attributable to Enovix | | $ | (222,322) | | | $ | (214,133) | | | $ | (51,622) | |
See accompanying notes to these consolidated financial statements.
ENOVIX CORPORATION
CONSOLIDATED STATEMENTS OF STOCKHOLDERS’ EQUITY
(In thousands, except share amounts)
| | | | | | | | | | | | | | | | | | | | | | | | | | | | | | | | | | | | | | | | | | | | | | | |
| Common Stock | | Additional
Paid-in
Capital | | Accumulated Other Comprehensive Loss | | Accumulated
Deficit | | Total
Stockholders' Equity | | Non-controlling Interests | | Total
Equity |
| Shares | | Amount | | | | | | |
| Balance as of January 2, 2022 | 152,272,287 | | | 15 | | | 659,254 | | | — | | | (333,152) | | | 326,117 | | | — | | | 326,117 | |
| Net loss | — | | | — | | | — | | | — | | | (51,622) | | | (51,622) | | | — | | | (51,622) | |
| Issuance of common stock upon exercise of common stock warrants, net | 4,126,466 | | | — | | | 47,452 | | | — | | | — | | | 47,452 | | | — | | | 47,452 | |
| Issuance of common stock upon exercise of stock options | 381,497 | | | — | | | 2,379 | | | — | | | — | | | 2,379 | | | — | | | 2,379 | |
| Issuance of common stock under employee stock purchase plan | 229,249 | | | — | | | 1,900 | | | — | | | — | | | 1,900 | | | — | | | 1,900 | |
| RSUs vested, net of shares withheld for taxes | 621,179 | | | — | | | (587) | | | — | | | — | | | (587) | | | — | | | (587) | |
| Early exercised stock options vested | — | | | — | | | 122 | | | — | | | — | | | 122 | | | — | | | 122 | |
| Stock-based compensation | — | | | — | | | 30,666 | | | — | | | — | | | 30,666 | | | — | | | 30,666 | |
| Repurchase of unvested restricted common stock | (168,876) | | | — | | | — | | | — | | | — | | | — | | | — | | | — | |
| Balance as of January 1, 2023 | 157,461,802 | | | $ | 15 | | | $ | 741,186 | | | $ | — | | | $ | (384,774) | | | $ | 356,427 | | | $ | — | | | $ | 356,427 | |
| Net loss | — | | | — | | | — | | | — | | | (214,071) | | | (214,071) | | | (61) | | | (214,132) | |
| Issuance of common stock upon exercise of stock options | 1,482,808 | | | — | | | 11,928 | | | — | | | — | | | 11,928 | | | — | | | 11,928 | |
| Issuance of common stock under employee stock purchase plan | 285,847 | | | — | | | 2,350 | | | — | | | — | | | 2,350 | | | — | | | 2,350 | |
| | | | | | | | | | | | | | | |
| | | | | | | | | | | | | | | |
| RSU vested, net of shares withheld | 2,655,170 | | | 1 | | | (3,931) | | | — | | | — | | | (3,930) | | | — | | | (3,930) | |
| Vesting of early exercised stock options | — | | | — | | | 128 | | | — | | | — | | | 128 | | | — | | | 128 | |
| Purchase of Capped Calls | — | | | — | | | (17,250) | | | — | | | — | | | (17,250) | | | — | | | (17,250) | |
| Stock-based compensation | — | | | — | | | 69,848 | | | — | | | — | | | 69,848 | | | — | | | 69,848 | |
| Repurchase of unvested restricted common stock | (416,833) | | | — | | | — | | | — | | | — | | | — | | | — | | | — | |
| Issuance of common stock for the Routejade Acquisition | 5,923,521 | | | 1 | | | 52,778 | | | — | | | — | | | 52,779 | | | 3,017 | | | 55,796 | |
| | | | | | | | | | | | | | | |
| | | | | | | | | | | | | | | |
| Other comprehensive loss, net | — | | | — | | | — | | | (62) | | | — | | | (62) | | | — | | | (62) | |
| Balance as of December 31, 2023 | 167,392,315 | | | $ | 17 | | | $ | 857,037 | | | $ | (62) | | | $ | (598,845) | | | $ | 258,147 | | | $ | 2,956 | | | $ | 261,103 | |
See accompanying notes to these consolidated financial statements.
ENOVIX CORPORATION
CONSOLIDATED STATEMENTS OF STOCKHOLDERS’ EQUITY - Continued
(In thousands, except share amounts)
| | | | | | | | | | | | | | | | | | | | | | | | | | | | | | | | | | | | | | | | | | | | | | | |
| Common Stock | | Additional
Paid-in
Capital | | Accumulated Other Comprehensive Loss | | Accumulated
Deficit | | Total
Stockholders' Equity | | Non-controlling Interests | | Total
Equity |
| Shares | | Amount | | | | | | |
| Balance as of December 31, 2023 | 167,392,315 | | | $ | 17 | | | $ | 857,037 | | | $ | (62) | | | $ | (598,845) | | | $ | 258,147 | | | $ | 2,956 | | | $ | 261,103 | |
| Net loss | — | | | — | | | — | | | — | | | (222,241) | | | (222,241) | | | (293) | | | (222,534) | |
| Issuance of common stock, net of issuance costs | 11,626,089 | | | 1 | | | 106,679 | | | — | | | — | | | 106,680 | | | — | | | 106,680 | |
| Issuance of common stock under ATM program, net of issuance costs | 4,359,019 | | | — | | | 39,960 | | | — | | | — | | | 39,960 | | | — | | | 39,960 | |
| Issuance of common stock upon exercise of stock options | 606,482 | | | — | | | 4,811 | | | — | | | — | | | 4,811 | | | — | | | 4,811 | |
| Issuance of common stock under employee stock purchase plan | 194,784 | | | — | | | 1,506 | | | — | | | — | | | 1,506 | | | — | | | 1,506 | |
| Issuance of common stock upon exercise of Private Warrants | 153,822 | | | — | | | 2,276 | | | — | | | — | | | 2,276 | | | — | | | 2,276 | |
| | | | | | | | | | | | | | | |
| | | | | | | | | | | | | | | |
| RSUs vested, net of shares withheld | 6,293,486 | | | 1 | | | (7,079) | | | — | | | — | | | (7,078) | | | — | | | (7,078) | |
| Vesting of early exercised stock options | — | | | — | | | 24 | | | — | | | — | | | 24 | | | — | | | 24 | |
| Repurchase of unvested restricted common stock | (66,662) | | | — | | | — | | | — | | | — | | | — | | | — | | | — | |
| Stock-based compensation | — | | | — | | | 62,737 | | | — | | | — | | | 62,737 | | | — | | | 62,737 | |
| | | | | | | | | | | | | | | |
| | | | | | | | | | | | | | | |
| Other comprehensive loss, net | — | | | — | | | — | | | (81) | | | — | | | (81) | | | (1) | | | (82) | |
| Balance as of December 29, 2024 | 190,559,335 | | | $ | 19 | | | $ | 1,067,951 | | | $ | (143) | | | $ | (821,086) | | | $ | 246,741 | | | $ | 2,662 | | | $ | 249,403 | |
| | | | | | | | | | | | | | | |
See accompanying notes to these consolidated financial statements.
ENOVIX CORPORATION
CONSOLIDATED STATEMENTS OF CASH FLOWS
(In thousands)
| | | | | | | | | | | | | | | | | |
| Fiscal Years |
| 2024 | | 2023 | | 2022 |
| Cash flows used in operating activities: | | | | | |
| Net loss | $ | (222,534) | | | $ | (214,132) | | | $ | (51,622) | |
| Adjustments to reconcile net loss to net cash used in operating activities | | | | | |
| Depreciation, accretion and amortization | 44,961 | | | 34,009 | | | 7,972 | |
| Stock-based compensation | 58,837 | | | 69,452 | | | 30,367 | |
| Change in fair value of common stock warrants | (12,244) | | | (6,180) | | | (75,180) | |
| Impairment and loss on disposal of long-lived assets | 38,258 | | | 4,411 | | | 4,921 | |
| Others | 448 | | | 703 | | | — | |
| Changes in operating assets and liabilities: | | | | | |
| Accounts and notes receivables | (2,465) | | | (370) | | | (170) | |
| Inventory | 1,073 | | | 4,509 | | | (634) | |
| Prepaid expenses and other assets | (2,211) | | | (626) | | | 926 | |
| Accounts payable | (7,970) | | | 6,096 | | | 2,272 | |
| Accrued expenses and compensation | 3,016 | | | 1,977 | | | 2,547 | |
| Deferred revenue | (3,058) | | | (3,860) | | | (4,091) | |
| Deferred tax liability | (2,697) | | | (813) | | | — | |
| Other liabilities | (2,047) | | | 188 | | | (48) | |
| Net cash used in operating activities | (108,633) | | | (104,636) | | | (82,740) | |
| Cash flows from investing activities: | | | | | |
| Purchase of property and equipment | (76,188) | | | (61,795) | | | (36,212) | |
| Routejade acquisition, net of cash and restricted cash acquired | — | | | (9,968) | | | — | |
| Purchases of investments | (31,812) | | | (138,343) | | | — | |
| Maturities of investments | 106,621 | | | 67,150 | | | — | |
| Net cash used in investing activities | (1,379) | | | (142,956) | | | (36,212) | |
| Cash flows from financing activities: | | | | | |
| Proceeds from issuance of common stock, net of issuance costs | 107,192 | | | — | | | — | |
| | | | | |
| Proceeds from exercise of common stock warrants, net and convertible preferred stock warrants | — | | | — | | | 52,828 | |
| Proceeds from issuance of Convertible Senior Notes and loans | 4,572 | | | 172,500 | | | — | |
| Purchase of Capped Calls | — | | | (17,250) | | | — | |
| Payments of debt issuance costs | — | | | (5,917) | | | — | |
| Repayment of debt | (209) | | | (69) | | | — | |
| Proceeds from issuance of common stock under employee stock purchase plan | 1,506 | | | 2,350 | | | 1,900 | |
| Payroll tax payments for shares withheld upon vesting of RSUs | (7,079) | | | (3,931) | | | (587) | |
| Proceeds from the exercise of stock options and issuance of common stock under ATM, net of issuance costs | 44,771 | | | 11,928 | | | 2,379 | |
| Repurchase of unvested restricted common stock | (4) | | | (26) | | | (10) | |
| Net cash provided by financing activities | 150,749 | | | 159,585 | | | 56,510 | |
| Effect of exchange rate changes on cash, cash equivalents and restricted cash | (1,169) | | | 154 | | | — | |
| Change in cash, cash equivalents, and restricted cash | 39,568 | | | (87,853) | | | (62,442) | |
| Cash and cash equivalents and restricted cash, beginning of period | 235,123 | | | 322,976 | | | 385,418 | |
| Cash and cash equivalents, and restricted cash, end of period | $ | 274,691 | | | $ | 235,123 | | | $ | 322,976 | |
See accompanying notes to these consolidated financial statements.
ENOVIX CORPORATION
CONSOLIDATED STATEMENTS OF CASH FLOWS (Continued)
(In thousands)
| | | | | | | | | | | | | | | | | |
| Fiscal Years |
| 2024 | | 2023 | | 2022 |
| Supplemental cash flow disclosure: | | | | | |
| Cash paid for interest | $ | 5,694 | | | $ | 2,757 | | | $ | — | |
| Cash paid for income taxes | 185 | | | — | | | — | |
| | | | | |
| Supplemental non-cash investing and financing activities: | | | | | |
| | | | | |
| | | | | |
| | | | | |
| Purchase of property and equipment included in liabilities | 12,955 | | | 15,980 | | | 7,037 | |
| Cashless warrant exercise | 2,276 | | | — | | | — | |
| Accrued issuance costs | 512 | | | — | | | — | |
| | | | | |
| | | | | |
| | | | | |
| | | | | |
| | | | | |
The following table presents our cash, cash equivalents and restricted cash by category in the Consolidated Balance Sheets.
| | | | | | | | | | | | | | | | | |
| Fiscal Years |
| 2024 | | 2023 | | 2022 |
| Cash and cash equivalents | $ | 272,869 | | | $ | 233,121 | | | $ | 322,851 | |
| Restricted cash included in prepaid expenses, other current assets and other assets, non-current | 1,822 | | | 2,002 | | | 125 | |
| Total cash, cash equivalents, and restricted cash | $ | 274,691 | | | $ | 235,123 | | | $ | 322,976 | |
| | | | | |
See accompanying notes to these consolidated financial statements.
ENOVIX CORPORATION
NOTES TO THE CONSOLIDATED FINANCIAL STATEMENTS
Note 1. Organization and Basis of Presentation
Organization
Enovix Corporation (“we,” “us,” “our,” “Enovix” or the “Company”) was incorporated in Delaware in 2006. We design, develop, manufacture and commercialize next generation Lithium-ion, or Li-ion, battery cells that significantly increase the amount of energy density and storage capacity relative to conventional battery cells. Our batteries’ mechanical design, or “architecture,” allows us to use high performance chemistries while enabling safety and charge time advantages. Enovix is headquartered in Silicon Valley, a region of California, with offices and facilities in Asia.
Prior to the second quarter of 2022, we focused on the development and commercialization of lithium-ion batteries. Beginning in the second quarter of 2022, we began our production of lithium-ion batteries or battery pack products and generated product revenue from our first production line (“Fab1”) in California in addition to service revenue from our engineering service contracts for the development of lithium-ion battery technology. In the fiscal year 2023, we were in process of building our facility in Malaysia (“Fab2”) for high-volume production and acquired Routejade, Inc. (“Routejade”), an established battery manufacturer in South Korea for battery pack manufacturing. In fiscal year 2024, our Fab2 facility opened with multiple production lines, include our first high-volume line (“Agility line”) and high-volume manufacturing (“HVM”) line.
Fiscal Year
Our fiscal year is the 52 or 53-week period ending on the Sunday closest to December 31. Accordingly, we will have a 53-week fiscal year every five or six years and our fiscal year 2026 will consist of 53 weeks. Our fiscal years 2024, 2023, and 2022 consisted of 52 weeks, which ended on December 29, 2024, December 31, 2023, and January 1, 2023, respectively. All period references are to the fiscal periods unless otherwise indicated.
Basis of Presentation and Consolidation
The accompanying consolidated financial statements are presented in accordance with accounting principles generally accepted in the United States (“GAAP”). The consolidated financial statements include our accounts, our wholly-owned subsidiaries and majority-owned subsidiaries, the business combinations from the closing dates and a variable interest entity (“VIE”) under the variable interest model. All intercompany balances and transactions have been eliminated in consolidation.
Reclassification of Prior Year Presentation
Certain prior period amounts in the notes to the consolidated financial statements have been reclassified to conform to the current period presentation.
Liquidity and Capital Resources
We have incurred operating losses and negative cash flows from operations since our inception through December 29, 2024 and expect to incur operating losses for the foreseeable future. As of December 29, 2024, we had working capital of $241.3 million and an accumulated deficit of $821.1 million. In April 2023, we issued $172.5 million aggregate principal amount of 3.0% convertible senior notes due 2028 (the “Convertible Senior Notes”). The net proceeds from the Convertible Senior Notes were approximately $166.6 million. We used approximately $17.3 million of the net proceeds from the offerings of the Convertible Senior Notes to pay the cost of the capped call transactions entered on April 20, 2023 in connection with such offerings. We use the remaining net proceeds for the construction of our Fab2 and production lines, as well as for working capital and other general corporate purposes. See Note 9 “Borrowings” for more information. In October 2023, we purchased substantially all of the outstanding shares of Routejade. The purchase price, net of cash acquired was $62.7 million. See Note 3 “Business Combinations” for more information. During the fiscal year 2024, we received net proceeds of $40.0 million from the issuance of our common stock through an at-the-market (“ATM”) offering and proceeds of $106.7 million, net of estimated issuance costs, from the issuance of our common stock through a secondary offering.
ENOVIX CORPORATION
NOTES TO THE CONSOLIDATED FINANCIAL STATEMENTS (Continued)
Based on the anticipated spending and timing of expenditures, we currently expect that our cash will be sufficient to meet our funding requirements over the next twelve months. Going forward, we may require additional financing for our future operations and expansion. The accompanying consolidated financial statements have been prepared assuming we will continue as a going concern, which contemplates the realization of assets and satisfaction of liabilities in the normal course of business.
Use of Estimates
The preparation of consolidated financial statements in conformity with GAAP requires management to make estimates and assumptions that affect the reported amounts of assets and liabilities in the consolidated financial statements and accompanying notes during the reporting periods. Estimates and assumptions include but are not limited to: depreciable lives for property and equipment and intangible assets, impairment of equipment, valuation for inventory, the valuation allowance on deferred tax assets, assumptions used in income tax provisions, valuation for assets acquired and liabilities assumed in business combinations, valuation of goodwill and intangible assets, assumptions used in stock-based compensation, incremental borrowing rate for operating right-of-use assets and lease liabilities, restructuring costs, and estimates to fair value of common stock warrants. Management bases the estimates on historical experience and on various other market-specific and relevant assumptions that it believes to be reasonable under the circumstances.
Note 2. Summary of Significant Accounting Policies
Summary of Significant Accounting Policies
Segment Reporting
We operate in one segment. Operating segments are identified as components of an enterprise about which separate discrete financial information is available for evaluation by the chief operating decision maker (“CODM”) in making decisions regarding resource allocation and assessing performance. Our Chief Executive Officer (“CEO”) has been identified as our CODM, who reviews operating results to make decisions and assesses performance for the Company as a whole. Total available cash and cash equivalents, total revenues and net loss are used by our CEO to evaluate key operating decisions, such as company strategy, and determine and allocate resources on a consolidated basis. Since we operate in one segment, all significant segment expenses and financial information required by “Segment Reporting” can be found in the consolidated financial statements and the accompanying notes of the consolidated financial statements. See Note 18 “Segment and Geographic Information” for more information.
Cash, Cash Equivalents and Restricted Cash
We consider all highly liquid investments with original maturities from the date of purchase of 90 days or less to be cash equivalents. As of December 29, 2024 and December 31, 2023, restricted cash is primarily comprised of $1.8 million and $2.0 million, respectively, of deposits to secure the advanced payment made by our customer. The restricted cash is classified within prepaid expenses and other current assets, and other assets, non-current of the Consolidated Balance Sheets.
Investments
Our investments consist of highly liquid fixed-income securities. We determine the appropriate classification of its investments at the time of purchase and reevaluates such designation at each consolidated balance sheet date. We classified and accounted for our investments as available-for-sale securities as we may sell these securities at any time for use in its current operations or for other purposes, including prior to maturity.
Investments with original maturities greater than 90 days and remaining maturities of less than one year are normally classified within current assets on the Consolidated Balance Sheets. In addition, investments with maturities beyond one year at the time of purchase that are highly liquid in nature and represent the investment of cash that is available for current operations are classified as current assets.
Unrealized gains and losses on these investments are reported as a separate component of Accumulated other comprehensive loss until the security is sold, the security has matured, or the security has realized. Realized gains and losses on these investments are calculated based on the specific identification method and would be reclassified from Accumulated other comprehensive loss to Other income (expense), net in the Consolidated Statements of Operations.
ENOVIX CORPORATION
NOTES TO THE CONSOLIDATED FINANCIAL STATEMENTS (Continued)
We designated all investments as available-for-sale and, therefore, the investments are subject to periodic impairment under the available-for-sale debt security impairment model. Available-for-sale debt securities in an unrealized loss position are written down to fair value through a charge to Other income (expense), net in the Consolidated Statements of Operations if we intend to sell the security or it is more likely than not we will be required to sell the security before recovery of its amortized cost basis. We evaluate the remaining securities to determine what amount of the excess, if any, is caused by expected credit losses. A decline in fair value attributable to expected credit losses is recorded to Other income (expense), net, while any portion of the loss related to non-credit factors is recorded in accumulated other comprehensive loss. For securities sold prior to maturity, the cost of the securities sold is based on the specific identification method. Realized gains and losses on the sale of investments are recorded in Other income (expense), net in the Consolidated Statements of Operations.
Trade Accounts Receivable, Notes Receivable and Allowance for Credit Losses
Our accounts receivable and notes receivable are recorded at invoiced amounts less allowance for any credit losses. According to the Financial Accounting Standards Board (“FASB”) issued Accounting Standards Update (“ASU”) 2016-13 that we adopted in the fiscal year 2022, we recognize credit losses based on a forward-looking current expected credit losses (“CECL”) model. We make estimates of expected credit losses based upon the assessment of various factors, including the age of receivable balances, credit quality of our customers, current economic conditions, reasonable and supportable forecasts of future economic conditions, and other factors that may affect our ability to collect from customers. The allowance for credit losses are recognized in the Consolidated Statement of Operations. The uncollectible receivables are written off in the period in which a determination is made that all commercially reasonable means of recovering them have been exhausted. We recognized an immaterial amount of allowance for expected credit loss as of December 29, 2024 and there was no write-off of accounts receivable for the periods presented. As of December 29, 2024 and December 31, 2023, our accounts receivable, net were $4.6 million and $0.9 million, respectively. As of December 29, 2024, we have an immaterial amount of notes receivable and $1.5 million of our notes receivable as of December 31, 2023.
Credit Losses
We are exposed to credit losses primarily through the available-for-sale investments. We invest excess cash in marketable securities with high credit ratings that are classified in Level 1 and Level 2 of the fair value hierarchy. Our investment portfolio at any point in time contains investments in United States (“U.S.”) treasury and U.S. government agency securities, taxable and tax-exempt municipal notes, corporate notes and bonds, commercial paper, non-U.S. government agency securities and money market funds, and are classified as available-for-sale. We assess whether our available-for sale investments are impaired at each reporting period. As December 29, 2024, we did not have any investments. As of December 31, 2023, we did not recognize an allowance for expected credit losses related to available-for-sale investments.
Inventory
Inventory is stated at the lower of cost or net realizable value (“NRV”) on a first-in and first-out (“FIFO”) basis. Inventory costs include direct materials, direct labor, and manufacturing overhead. Determining net realizable value of finished goods and work in process inventories involves projecting average selling prices. When the estimated net realizable values are below the manufacturing costs, a charge to cost of revenue is recorded.
The cost basis of our inventory is reduced for any products that are considered excess or obsolete based upon assumptions about future demand and market conditions. See Note 6 “Inventory” for more information.
Property and Equipment, net
Property and equipment, net are stated at the original cost, net of accumulated depreciation. Construction in process is related to the construction or development of property and equipment that have not yet been placed in service for their intended use. Property and equipment are depreciated or amortized using the straight-line method over the estimated useful lives of the following assets below.
ENOVIX CORPORATION
NOTES TO THE CONSOLIDATED FINANCIAL STATEMENTS (Continued)
| | | | | | | | | | | |
| Estimated Useful Life (in Years) |
| Machinery and equipment | 2 | - | 10 |
| Office equipment and software | 3 | - | 5 |
| Furniture and fixtures | 3 | - | 5 |
| Building | 33 |
| Leasehold improvements | Shorter of the economic life or the remaining lease term |
When assets are retired or disposed of, the cost and accumulated depreciation are removed from the accounts, and any resulting gains or losses are included in the Consolidated Statement of Operations in the period of disposition. Maintenance and repairs that do not improve or extend the lives of the respective assets are expensed in the Consolidated Statement of Operations in the period incurred. See Note 5 “Property and Equipment” for more information.
Capitalized Software Costs for Internal Use
We capitalize direct costs associated with developing or obtaining internal use software, including enterprise-wide business software, that are incurred during the application development stage. These capitalized costs are recorded as capitalized software within property and equipment. Costs related to preliminary project activities and post-implementation activities are expensed as incurred. Once the software is ready for its intended use, amounts capitalized are amortized over an estimated useful life of up to five years, generally on a straight-line basis. Capitalized software costs for internal use are included in office equipment category of the property and equipment on the Consolidated Balance Sheets.
Impairment of Long-Lived Assets
We evaluate the carrying value of long-lived assets when indicators of impairment exist. The carrying value of a long-lived asset is considered impaired when the estimated separately identifiable, undiscounted cash flows from such an asset are less than the carrying value of the asset. In that event, a loss is recognized based on the amount by which the carrying value exceeds the fair value of the long-lived asset. Fair value is determined primarily using the estimated cash flows discounted at a rate commensurate with the risk involved. See Note 5 “Property and Equipment” for more information.
Intangible Assets
We amortize acquisition-related intangible assets that are subject to amortization over their estimated useful lives. We perform periodic reviews of significant long-lived assets to determine whether facts and circumstances indicate that the carrying amount may not be recoverable. These reviews can be affected by various factors, including external factors such as industry and economic trends, and internal factors such as changes in our business strategy and the forecasts for specific products. Periodically, we also evaluate the estimated remaining useful lives of purchased intangible assets and whether events or changes in circumstances warrant a revision to the remaining periods of amortization. Based on our 2024 impairment analysis, there was no impairment to the intangible assets for the periods presented.
Leases
We measure our lease obligations in accordance with Accounting Standards Codification (“ASC”) 842, Leases , which requires us to recognize a right-of-use (“ROU”) asset and lease liability for leases with terms of more than 12 months. We determine lease classification at the inception of an arrangement and recognize ROU assets and lease liabilities based on the present value of the future minimum lease payments over the lease term at the commencement date. Currently, we only have operating leases.
ROU assets also include any initial direct costs incurred and any lease payments made on or before the lease commencement date, less lease incentives received. We use an incremental borrowing rate based on the information available at the commencement date in determining the lease liabilities as our leases generally do not provide an implicit rate. Lease terms may include options to extend or terminate the lease when we are reasonably certain that the option will be exercised. We combine the lease and non-lease components in determining the operating lease ROU assets and
ENOVIX CORPORATION
NOTES TO THE CONSOLIDATED FINANCIAL STATEMENTS (Continued)
liabilities. Lease expense is recognized on a straight-line basis over the lease term. The lease agreements may contain variable costs such as contingent rent escalations, common area maintenance, insurance, real estate taxes or other costs. Such variable lease costs are expensed as incurred on the Consolidated Statement of Operations. See Note 7 “Leases” for more information.
Goodwill
We review goodwill for impairment at least annually in the fourth quarter, or more frequently if events or changes in circumstances indicate that the asset may be impaired. Based on our 2024 impairment analysis, there was no goodwill impairment for the periods presented. See Note 3 “Business Combinations” for more information.
Debt
We accounted for our borrowings as liabilities measured at net proceeds less debt discount and debt issuance cost and were accreted to its face value over its expected term using the effective interest method. We considered whether there were any embedded features in its debt instruments that required bifurcation and separate accounting as derivative financial instruments pursuant to ASC 815, Derivatives and Hedging (“ASC 815”). See Note 9 “Borrowings” for more information.
Common Stock Warrants
In connection with the 2021 business combination with Rodgers Silicon Valley Acquisition Corp., we issued outstanding warrants of 17.5 million to purchase common stock at a price of $11.50 per share. These warrants consisted of 11,500,000 warrants held by the third-party investors (the “Public Warrants”) and 6,000,000 warrants issued to a private placement to the sponsor and members of Rodgers Capital LLC (the “Private Placement Warrants”). The warrants expire five years from the completion of the business combination and were exercisable starting December 5, 2021. There are no outstanding Public Warrants since fiscal year 2022.
The Private Placement Warrants are transferable, assignable or salable in certain limited exceptions. The Private Placement Warrants are exercisable for cash or on a cashless basis, at the holder’s option, and are non-redeemable so long as they are held by the initial purchasers or their permitted transferees. If the Private Placement Warrants are held by someone other than the initial purchasers or their permitted transferees, the Private Placement Warrants will cease to be Private Placement Warrants, and become Public Warrants and be redeemable by us and exercisable by such holders on the same basis as the other Public Warrants.
We account for the warrants in accordance with ASC 815, Derivative and Hedging. The Private Placement Warrants contain exercise and settlement features that may change with a change in the holder, which precludes the Private Placement Warrants from being indexed to our own stock, and therefore the Private Placement Warrants are precluded from being classified within equity and are accounted for as derivative liabilities on the Consolidated Balance Sheet at fair value, with subsequent changes in fair value recognized in the Consolidated Statement of Operations at each reporting date. As of December 29, 2024, there were 5,500,000 outstanding shares of the Private Placement Warrants and no Public Warrants outstanding. See Note 12 “Warrants” for more information.
Fair Value of Financial Instruments
Our assets and liabilities, which require fair value measurement on a recurring basis, consist of Private Placement Warrants recorded at fair value. Fair value principles require disclosures regarding the manner in which fair value is determined for assets and liabilities and establishes a three-tiered fair value hierarchy into which these assets and liabilities must be grouped, based upon significant levels of inputs as follows:
•Level 1 — Observable inputs, such as quoted prices (unadjusted) in active markets for identical assets or liabilities at the measurement date;
•Level 2 — Observable inputs, other than Level 1 prices, such as quoted prices in active markets for similar assets and liabilities, quoted prices in markets that are not active, or other inputs that are observable or can be corroborated by observable market data for substantially the full term of the assets or liabilities; and
ENOVIX CORPORATION
NOTES TO THE CONSOLIDATED FINANCIAL STATEMENTS (Continued)
•Level 3 — Unobservable inputs that are supported by little or no market activity and that are significant to the fair value of the assets or liabilities.
The lowest level of significant input determines the placement of the entire fair value measurement in the hierarchy. Our assessment of the significance of a particular input to the fair value measurement in its entirety requires management to make judgments and consider factors specific to the asset or liability. See Note 4 “Fair Value Measurement” for more information.
Non-Controlling Interests
Non-controlling interests represent the portion of equity not attributable to us and are reported as a separate component of equity, net of tax and transaction costs, on the Consolidated Balance Sheets. Net loss and comprehensive loss for majority-owned subsidiary are attributed to us and to non-controlling interest holders on the Consolidated Statements of Operations and Consolidated Statements of Comprehensive Loss based on respective ownership percentage.
Variable Interest Entity
We determine at the inception of each arrangement whether an entity in which we hold an investment or in which we have other variable interests is considered a VIE. We consolidate a VIE’s balance sheet and results of operations into the consolidated financials when we are the primary beneficiary that meets both of the following criteria: (1) we have the power to direct activities that most significantly affect the VIE’s economic performance and (2) we have the obligation to absorb losses or the right to receive benefits of the VIE that in either case could potentially be significant to the VIE.
We continually reassess whether we are the primary beneficiary of a VIE for the consolidation analysis. If we are not the primary beneficiary in a VIE, we account for the investment or other variable interest in accordance with applicable GAAP. Please refer to Note 16 “Variable Interest Entity” for more details.
We will reconsider whether an entity is still a VIE if certain reconsideration events occur as defined in the ASC 810, Consolidation, issued by the FASB.
Foreign Currency Transactions
The functional currency of our international subsidiaries is the U.S. dollar (“USD”), except for the acquired Routejade, which is in Korean Won. Monetary assets and liabilities of our international subsidiaries that are denominated in foreign currency are remeasured into USD at period-end exchange rates. Non-monetary assets and liabilities that are denominated in the foreign currency are remeasured into USD at the historical rates. Foreign transaction gains and losses resulting from the conversion of the transaction currency to functional currency and remeasurement of foreign currency accounts are reflected in Other income (expense), net of the Consolidated Statements of Operations. For the fiscal years 2024 and 2023, we recorded an immaterial amount of net foreign transaction losses in Other income (expense), net in the Consolidated Statements of Operations.
Routejade utilizes Korean Won as its functional currency. The assets and liabilities of this subsidiary is translated at period-end exchange rates, while revenue and expenses are translated at the average rates in effect for the period. The related translation gains and losses are included in other comprehensive income or loss within the Consolidated Statements of Operations and the Consolidated Statement of Comprehensive Income (Loss).
Concentrations of Credit Risk and Major Customers
Financial instruments that potentially subject us to concentrations of credit risk consist principally of cash and cash equivalents. We maintain cash and cash equivalent balances in checking, savings, and money market accounts at financial institutions. Amounts held in these accounts may exceed federally insured limits. As of December 29, 2024 and December 31, 2023, we did not experience any losses on such deposits.
For the fiscal year 2024, we have three customers, who had revenues greater than 10% of the total revenues. Customer D, Customer E and Customer G had accounted for approximately 50%, 20%, and 10% of our total revenues, respectively. For the fiscal year 2023, Customer D, which had revenues greater than 10% of the total revenues, had
ENOVIX CORPORATION
NOTES TO THE CONSOLIDATED FINANCIAL STATEMENTS (Continued)
accounted for approximately 75% of our total revenues. For the fiscal year 2022, Customer A and Customer C accounted for approximately 81% and 14%, respectively, of our total revenue.
As of December 29, 2024, we had three customers, which had accounts receivable greater than 10% of our total accounts receivables. Customer D, E, and G accounted for 54%, 11% and 16%, respectively, of the total accounts receivable. As of December 31, 2023, we had Customer C, E, and F accounted for 13%, 45% and 11%, respectively, of the total accounts receivable.
Revenue Recognition
In June 2022, we began to generate revenue from the planned principal business activities. We recognize revenue within the scope of ASC 606, Revenue from Contracts with Customers (“ASC 606”). The core principle of ASC 606 requires that an entity recognize revenue to depict the transfer of promised goods or services to customers in an amount that reflects the consideration to which we expect to be entitled in exchange for those goods or services. ASC 606 defines a five-step process to achieve this core principle and, in doing so, it is possible more judgment and estimates may be required within the revenue recognition process, including identifying performance obligations in the contract, estimating the amount of variable consideration to include in the transaction price and allocating the transaction price to each separate performance obligation. The following five steps are applied to achieve that core principle:
1.Identify the contract with the customer;
2.Identify the performance obligations in the contract;
3.Determine the transaction price;
4.Allocate the transaction price to the performance obligations in the contract; and
5.Recognize revenue when the company satisfies a performance obligation.
Our revenue consists of product revenue, resulting from the sale of lithium-ion batteries and battery pack products (“Product Revenue”), and service revenue, resulting from payments received from our customers based on executed engineering revenue contracts for the development of lithium-ion battery technology (“Service Revenue”).
Product Revenue
Product Revenue mainly relates to sales of lithium-ion batteries or battery packs. We recognize Product Revenue at a point in time when the performance obligation has been satisfied upon transfer of control of goods, which is upon product shipment, delivery or customer acceptance, depending on the specific contract terms. For certain customized products with customer acceptance criteria specified in the contract, the performance obligation is satisfied upon our customer’s formal acceptance. For the fiscal years 2024 and 2023, we had $23.1 million and $7.6 million of Product Revenue, respectively. We had an immaterial amount of Product Revenue for the fiscal year 2022.
Service Revenue
Service Revenue contracts generally include the design and development efforts to conform our existing battery technology with the customer’s required specifications. The term of the Service Revenue contracts generally last from one to three years beginning at the effective date of the contract with a single performance obligation. Generally, we own all intellectual property that is developed and directed toward our lithium-ion battery technology. Accordingly, the customer will only receive prototype units of our battery technology as well as any design reports that are submitted to them as part of the contract. Prototype units that are delivered throughout the term of the contract provide marginal value to the customers as they are contractually limited in their ability to derive benefit from the prototype units should the contract be terminated. We conclude that the performance obligation is the delivery of final prototype units, which meet the ultimate specifications set forth by the customer. We did not have Service Revenue for the fiscal years 2024 and 2023 while we had $6.2 million for the fiscal year 2022.
ENOVIX CORPORATION
NOTES TO THE CONSOLIDATED FINANCIAL STATEMENTS (Continued)
Deferred Revenue
Deferred revenue represents situations where the cash is collected, but the related revenue has not yet been recognized. Revenue is subsequently recognized when the revenue recognition criteria are met. The following table summarizes the significant changes in deferred revenue during the fiscal years 2024 and 2023 (in thousands).
| | | | | | | | | | | |
| 2024 | | 2023 |
| Beginning Balance | $ | 10,482 | | | $ | 3,774 | |
| Routejade acquisition | — | | | 10,568 | |
| Revenue recognized | (10,145) | | | (3,968) | |
| Increased due to customer advanced payments | 7,087 | | | 108 | |
| Deferred revenues, end of period | $ | 7,424 | | | $ | 10,482 | |
As of December 29, 2024, we currently expect to recognize approximately 49% of deferred revenue as revenue within the next twelve months and the remaining amount is expected to be recognized as revenues in 2026.
Costs to Fulfill a Customer Contract
The revenue recognition standard requires capitalization of certain costs to fulfill a customer contract, such as certain employee compensation for design and development services that specifically relate to customer contracts. Costs are recognized as an asset if they relate directly to a customer contract, generate or enhance resources of the entity that will be used in satisfying future performance obligations, and are expected to be recovered. If these three criteria are not met, the costs are expensed in the period incurred. Deferred costs are recognized as cost of revenue in the period when the related revenue is recognized. As of December 29, 2024 and December 31, 2023, total deferred contract costs were $0.8 million for each period.
Product Warranties
We provide product warranties, which cover certain repair or replacement under the revenue contracts and they generally range from one to four years. Estimated costs related to warranties are recorded in the same period when the product sales occur. The warranty liability reflects management’s best estimates of such costs and are recognized as cost of revenue. We continuously monitor our product returns for warranty failures and maintains a reserve for the related warranty expenses based on various factors, including historical product failure rates, results of accelerated lab testing, field monitoring, vendor reliability estimates, and data on industry averages for similar products. Due to the potential for variability in these underlying factors, the difference between the estimated costs and the actual costs could be material to our consolidated financial statements. If actual product failure rates or the frequency or severity of reported claims differ from the estimates, we may be required to revise our estimated warranty liability. As of December 29, 2024 and December 31, 2023, our warranty liability on the Consolidated Balance Sheet was immaterial.
Sales and Transaction Taxes
Sales and other taxes collected from customers and remitted to governmental authorities on revenue-producing transactions are reported on a net basis and are therefore excluded from revenues in the Consolidated Statement of Operations.
Cost of Revenues
Cost of revenues includes materials, labor, depreciation expense, and other direct costs related to product production and Service Revenue contracts. Labor consists of personnel-related expenses such as salaries, benefits, and stock-based compensation. Other direct costs include costs incurred on certain Service Revenue contracts that was in excess of the amount expected to be recovered and other overhead costs in connection with the product production.
Research and Development Costs
Research and development costs consist of engineering services, depreciation, development expenses, materials, labor and stock-based compensation and allocated facilities costs, related primarily to our (i) technology development,
ENOVIX CORPORATION
NOTES TO THE CONSOLIDATED FINANCIAL STATEMENTS (Continued)
(ii) design, construction, and testing of preproduction prototypes and models, and (iii) certain costs related to the design, construction, and operation of the pilot plant that is not of a scale economically feasible to us for commercial production. Research and development costs are expensed as incurred.
Selling, General and Administrative Expenses
Selling, general and administrative expenses consist of personnel-related expenses, marketing expenses, allocated facilities expenses, depreciation expenses, travel, and professional services expenses, including legal, human resources, information technology, audit, accounting and tax-related services. Personnel related costs consist of salaries, benefits and stock-based compensation. Facilities costs consist of rent and maintenance of facilities.
Government Grant
In September 2020, we entered into a financial assistance agreement totaling $6.5 million with the Office of Energy Efficiency and Renewable Energy (“EERE”), an office within the U.S. Department of Energy. Under the agreement, we will perform research and development under a joint project with the EERE, and the EERE will reimburse us for approximately 49.8% of allowable project costs. The remaining approximately 50.2% in costs would be incurred by us. We account for the reimbursable amount, which are probable of being received in the same period in which the costs were incurred as an offset to the related expense (Research and development) or capitalized asset (Property and equipment, net). As of December 29, 2024 and December 31, 2023, we had an immaterial reimbursement receivable from the assistance agreement, which is included in prepaid expenses and other current assets on the Consolidated Balance Sheets.
Income Taxes
We account for income taxes in accordance with ASC 740, Income Taxes, issued by FASB. Under the asset and liability method specified by ASC 740, deferred tax assets and liabilities are recognized for the future consequences of differences between the carrying amounts of existing assets and liabilities and their respective tax bases (temporary differences). Deferred tax assets and liabilities are measured using tax rates expected to apply to taxable income in the years in which those temporary differences are recovered or settled. Valuation allowances for deferred tax assets are established when it is more likely than not that some or all of the deferred tax assets will not be realized.
In addition, ASC 740 provides comprehensive guidance on the recognition and measurement of tax positions in previously filed tax returns or positions expected to be taken in future tax returns. The benefit from an uncertain tax position must meet a more-likely-than-not recognition threshold and is measured at the largest amount of benefit greater than 50% determined by cumulative probability of being realized upon ultimate settlement with the taxing authority. Our policy is to recognize interest and penalties expense, if any, related to uncertain tax positions as a component of income tax expense.
Stock-Based Compensation
We issue stock-based compensation to employees and non-employees in the form of stock options or restricted stock units (“RSUs”) or performance restricted stock units (“PRSUs”). Since the fiscal year 2022, we have not issued stock options.
Restricted Stock Units
Starting in the fiscal year 2021, we began to grant RSUs to our employees and non-employees and these RSUs generally have a service vesting condition over four or five years. We use our common stock price, which is the closing stock price on the grant date to value our RSUs. Stock-based compensation expense is recognized using the straight-line attribution method. Forfeitures are recorded when they occur.
Performance Restricted Stock Units
Starting in the fiscal year 2022, we began to grant PRSUs to certain employees with vesting conditions based on performance and service conditions over two years. We use our common stock price, which is the closing stock price on the grant date to value our PRSUs. We use the graded vesting method to calculate the stock-based compensation
ENOVIX CORPORATION
NOTES TO THE CONSOLIDATED FINANCIAL STATEMENTS (Continued)
expense. At each reporting period, we would recognize and adjust the stock-based compensation expense based on the probability assessment in meeting our PRSUs' performance conditions. Forfeitures are recorded when they occur.
Employee Stock Purchase Plan
We began to offer the employee stock purchase plan (“ESPP”) to our employees in the fiscal year 2021. We use the Black-Scholes valuation method to value the fair value of ESPP shares and use the graded vesting method to calculate the stock-based compensation expense.
Stock options
Generally, the stock options have a maximum contractual term up to 10 years. The fair value of stock options is based on the date of the grant using the Black-Scholes valuation method. The awards are accounted for by recognizing the fair value of the related award over the period during which services are provided in exchange for the award (referred to as the requisite service period, which typically equals the vesting period of the award). The vesting period is generally four or five years. No stock options have been issued with a market condition or other performance vesting condition. In accordance with ASU 2018-07, Compensation — Stock Compensation (Topic 718): Improvements to Non-employee Share-Based Payment Accounting, the measurement of equity-classified non-employee awards is fixed at the grant date. Stock-based compensation expense is recognized using the straight-line attribution method. Forfeitures are recorded when they occur. For the fiscal years 2024 and 2023, we did not grant any stock options and, for the fiscal year 2022, we granted less than 60,000 shares.
The following assumptions were used in the Black-Scholes valuation model for the fair value of stock options per share.
•Expected Term — The expected term of the options represents the average period the share options are expected to remain outstanding. As we did not have sufficient historical information to develop reasonable expectations about future exercise patterns and post-vesting employment termination behavior, the expected term of options granted is derived from the average midpoint between the weighted average vesting and the contractual term, also known as the simplified method. We used the simplified calculation of the expected life, which takes into consideration the grant’s contractual life and vesting period and assumes that all options will be exercised between the vesting date and the contractual term of the option.
•Risk-Free Interest Rate — The risk-free interest rate is based on the yield of U.S. Treasury notes as of the grant date with terms commensurate with the expected term of the option.
•Dividend Yield — The expected dividends assumption is based on our expectation of not paying dividends in the foreseeable future, as well as we did not pay any dividends in the past.
•Expected volatility — Prior to July 14, 2021, we were a private company and did not have any trading history for our ordinary shares, the expected volatility was based on the historical volatilities of the common stock of comparable publicly traded companies with comparable characteristics, including enterprise value, risk profiles, position within the industry, and with historical share price information sufficient to meet the expected life of our stock options.
Net Loss per Share of Common Stock
Basic net loss per share of common stock is calculated using the two-class method under which earnings are allocated to both common shares and participating securities. We consider participating securities including outstanding stock options, outstanding RSUs, estimated ESPP shares and convertible senior notes. Unvested early exercised stock options which are subject to repurchase by us are not considered participating securities as those shares do not have non-forfeitable rights to dividends or dividend equivalents. Net loss is attributed to common stockholders and participating securities based on their participation rights.
Basic net loss per share attributable to common stockholders is computed by dividing the net loss attributable to common stockholders by the weighted average number of shares of common stock outstanding during the period. Unvested early exercised stock options are not considered outstanding for purposes of the weighted average outstanding share calculation until they vest.
ENOVIX CORPORATION
NOTES TO THE CONSOLIDATED FINANCIAL STATEMENTS (Continued)
Diluted earnings per share (“EPS”) attributable to common stockholders adjusts basic EPS for the potentially dilutive impact of the participating securities. As we reported losses for the periods presented, all potentially dilutive securities including convertible senior notes, stock options and warrants, are generally antidilutive and accordingly, basic net loss per share equals diluted net loss per share, except when there were changes in fair value of the Private Placement Warrants recorded in earnings. With changes in fair value recorded in earnings, an adjustment would be made to both the diluted EPS numerator and denominator to eliminate such effects.
Recently Adopted Accounting Pronouncements
In November 2023, the Financial Accounting Standards Board (“FASB”) issued ASU No. 2023-07, Segment Reporting (Topic 280): Improvements to Reportable Segment Disclosures, which requires disclosure of significant segment expenses and other segment items on an annual and interim basis. This ASU is effective for fiscal years beginning after December 15, 2023 and interim periods within fiscal years beginning after December 15, 2024, with early adoption permitted. We adopted this standard for our fiscal year 2024 annual financial statements and interim financial statements thereafter. The adoption of 2023-07 did not change the way that we identify our reportable segment and, as a result, did not have a material impact on our segment-related disclosures. See Note 18 “Segment and Geographic Information” for more information.
Recently Issued Accounting Pronouncements
In December 2023, the FASB issued ASU 2023-09, Income Taxes (Topics 740): Improvements to Income Tax Disclosures, which expanded the disclosure requirements for income taxes, specifically related to the rate reconciliation and income taxes paid. ASU 2023-09 is effective for the annual reporting periods beginning December 15, 2024, with early adoption permitted. We are currently evaluating the potential impact of the adoption of this ASU on our financial statement disclosures.
In November 2024, the FASB issued ASU 2024-03, “Income Statement - Reporting Comprehensive Income - Expense Disaggregation Disclosures,” which requires disclosure of certain costs and expenses on an interim and annual basis in the notes to the financial statements. The standard is effective for the annual reporting periods beginning after December 15, 2026 and interim periods beginning after December 15, 2027, with early adoption permitted. We are currently evaluating the potential impact of the adoption of this ASU on our financial statement disclosures.
Note 3. Business Combinations
On September 18, 2023, we entered into a stock purchase agreement (the “Stock Purchase Agreement”) with Rene Limited, a corporation incorporated under the laws of South Korea (the “Seller”). On October 31, 2023, we closed the transaction contemplated by the Stock Purchase Agreement (the “Closing”) to purchase Routejade, Inc. (“Routejade”), a battery manufacturer incorporated under the laws of South Korea. This acquisition allowed us to vertically integrate electrode coating and battery pack manufacturing, as well as expanded our battery offerings to include conventional graphite battery technology to service the IoT, industrial, aviation, and defense markets.
The total purchase consideration of such transaction consists of cash consideration in the amount of $15.4 million, net of acquisition-related seller expense, and 5,923,521 shares of our common stock, par value $0.0001, for the purchase of 95.8% of the outstanding shares of Routejade (the “Routejade Acquisition”). The closing price of our common stock on October 31, 2023 was $8.91. Total following table summarized the considerations for the acquisition.
ENOVIX CORPORATION
NOTES TO THE CONSOLIDATED FINANCIAL STATEMENTS (Continued)
| | | | | | | | | | | |
| Cash paid, net of acquisition-related seller expense | | | $ | 15,448 | |
| Issuance of Enovix common stock (5,923,521 shares) | | | 52,779 | |
| Total purchase consideration | | | 68,227 | |
| Less: net assets acquired | | | |
| Net assets acquired, excluding liability assumed for acquisition-related seller expense | 56,367 | | | |
| Liability assumed for acquisition-related seller expense | (357) | | | |
| Net assets acquired | | | 56,010 | |
| Goodwill | | | $ | 12,217 | |
This acquisition constituted a business acquisition in accordance with ASC 805, Business Combinations (“ASC 805”) for business combinations and, therefore, was accounted for as a business combination using the acquisition method of accounting. The tangible and intangible assets acquired and liabilities assumed were recorded based on their estimated fair values at the acquisition date.
The following table summarizes the final purchase price allocation based on the fair values of the assets acquired and liabilities assumed as of the acquisition date (in thousands).
| | | | | |
| Cash, cash equivalents and restricted cash acquired | $ | 5,481 | |
Accounts and notes receivable, net (1) | 1,796 | |
| Inventory | 12,613 | |
| Prepaid expenses and other current assets | 1,715 | |
| Property and equipment, net | 28,579 | |
| Intangible assets | 41,948 | |
| Goodwill | 12,217 | |
| |
| |
| |
| Other non-current assets | 365 | |
| Debt assumed | (7,426) | |
| Deferred revenue | (10,568) | |
| Liabilities assumed | (3,182) | |
| Deferred income tax liabilities | (12,294) | |
| Fair value of net assets acquired | 71,244 | |
Less: non-controlling interest (2) | (3,017) | |
| Total purchase consideration | 68,227 | |
| Less: Cash, cash equivalents, restricted cash acquired | (5,481) | |
| Total purchase price, net of cash acquired | $ | 62,746 | |
| | | | | |
| (1) | The gross amount of the acquired accounts and notes receivable was $1.9 million, of which an immaterial amount was expected to be uncollectible. |
| (2) | The fair value of non-controlling interest was measured based on the fair values of net assets acquired at the acquisition date and the price for the equity shares and the portion of ownership not held by the acquirer.
|
Goodwill
The excess of the purchase price over the fair value of net assets acquired was recorded to goodwill. Goodwill is primarily attributable to the expected synergies from future expected economic benefits, including integrating electrode coating and battery pack manufacturing. Goodwill from this acquisition is not expected to be deductible for tax purposes.
ENOVIX CORPORATION
NOTES TO THE CONSOLIDATED FINANCIAL STATEMENTS (Continued)
The following table summarizes the change in goodwill for the periods presented below (in thousands).
| | | | | |
| Goodwill |
| Balance as of January 1, 2023 | $ | — | |
| Routejade Acquisition | 12,098 | |
| |
| Balances as of December 31, 2023 | 12,098 | |
Routejade Acquisition - measurement period adjustments(1) | 119 | |
| Balances as of December 29, 2024 | $ | 12,217 | |
| |
(1) Our purchase price allocation was finalized in the first quarter of 2024, which included a net adjustment of $0.1 million to goodwill and immaterial adjustments to other assets.
Intangible Assets
Intangible assets consist of customer relationships, developed technology and trade names and trademarks. Customer relationships relate to Routejade’s existing customer relationships for current and future business. Developed technology relates to Routejade’s technology for manufacturing standard lithium-ion batteries with varying chemistries, which allows for design flexibility and the production of customized battery cells.
The following table summarizes the intangible assets subject to amortization, net (in thousands) as of December 29, 2024.
| | | | | | | | | | | | | | | | | | | | | | | |
| Gross | | Accumulated amortization | | Net Carrying Amount | | Weighted-average Useful Lives |
| Customer relationships | $ | 29,933 | | | $ | (3,483) | | | $ | 26,450 | | | 10 years |
| Developed technology | 11,680 | | | (1,941) | | | 9,739 | | | 7 years |
| Trade Names and Trademarks | 335 | | | (130) | | | 205 | | | 3 years |
| Total intangible assets | $ | 41,948 | | | $ | (5,554) | | | $ | 36,394 | | | |
We acquired these intangible assets through the Routejade Acquisition in October 2023. For the fiscal years 2024 and 2023, amortization of the intangible assets was $4.7 million and $0.8 million, respectively. As of December 29, 2024, the weighted average remaining useful lives for intangible assets was approximately 8 years.
The following is a schedule of expected amortization for the intangible assets as of December 29, 2024 (in thousands).
| | | | | |
| As of December 29, 2024 |
| 2025 | $ | 4,757 | |
| 2026 | 4,829 | |
| 2027 | 4,645 | |
| 2028 | 4,645 | |
| 2029 | 4,645 | |
| Thereafter | 12,873 | |
| Total estimated amortization expense | $ | 36,394 | |
ENOVIX CORPORATION
NOTES TO THE CONSOLIDATED FINANCIAL STATEMENTS (Continued)
Acquisition Costs
For the fiscal year 2023, we recorded approximately $1.3 million of acquisition costs, which were included Selling, general and administrative in the Consolidated Statements of Operations. We did not incur acquisition costs in fiscal year 2024.
Proforma information
The consolidated unaudited proforma revenue for the fiscal years 2023 and 2022, which included Routejade assuming the acquisition occurred on January 3, 2022, were approximately $21.1 million and $16.4 million, respectively. The consolidated unaudited proforma net income related to this acquisition was not included because the impact on the consolidated results of operations was not material.
Note 4. Fair Value Measurement
The fair value of our financial assets and liabilities are determined in accordance with the fair value hierarchy established in ASC 820, Fair Value Measurements, issued by the FASB. The fair value hierarchy of ASC 820 requires an entity to maximize the use of observable inputs when measuring fair value and classifies those inputs into three levels:
| | | | | |
| Level 1: | Observable inputs, such as quoted prices (unadjusted) in active markets for identical assets or liabilities at the measurement date. |
| Level 2: | Observable inputs, other than Level 1 prices, such as quoted prices in active markets for similar assets and liabilities, quoted prices in markets that are not active, or other inputs that are observable or can be corroborated by observable market data for substantially the full term of the assets or liabilities. |
| Level 3: | Unobservable inputs that are supported by little or no market activity and that are significant to the fair value of the assets or liabilities. |
Our financial instruments consist primarily of cash and cash equivalents, short-term investments, accounts receivable, notes receivable, accounts payable, short-term and long-term debt, and warrant liabilities. Cash and cash equivalents are reported at their respective fair values on our Consolidated Balance Sheets. As of December 29, 2024 and December 31, 2023, the carrying values of accounts and notes receivables, accounts payable, short-term debt and accrued liabilities approximated the fair value based on the short maturity of those instruments.
Cash and cash equivalents are reported at their respective fair values on the Consolidated Balance Sheets. Where quoted prices are available in an active market, securities are classified as Level 1. We classify money market funds as Level 1. When quoted market prices are not available for the specific security, then we estimate fair value by using quoted prices for identical or similar instruments in markets that are not active and model-based valuation techniques for which all significant inputs are observable in the market or can be corroborated by observable market data for substantially the full term of the assets. Where applicable, these models project future cash flows and discount the future amounts to a present value using market-based observable inputs obtained from various third-party data providers, including but not limited to benchmark yields, reported trades and broker/dealer quotes. Where applicable the market approach utilizes prices and information from market transactions for similar or identical assets. We will classify commercial paper, corporate debt securities and asset-backed securities as Level 2. As of December 29, 2024 and December 31, 2023, we had cash and cash equivalents of $272.9 million and $233.1 million, respectively.
The following table details the fair value measurements of assets and liabilities that were measured at fair value on a recurring basis based on the following three-tiered fair value hierarchy per ASC 820, Fair Value Measurement, as of December 29, 2024 and December 31, 2023 (in thousands).
ENOVIX CORPORATION
NOTES TO THE CONSOLIDATED FINANCIAL STATEMENTS (Continued)
| | | | | | | | | | | | | | | | | | | | | | | | | | |
| | Fair Value Measurement using |
| | Level 1 | | Level 2 | | Level 3 | | Total
Fair Value |
| As of December 29, 2024 | | | | | | | | |
| Assets: | | | | | | | | |
| Cash equivalents: | | | | | | | | |
| Money Market Funds | | $ | 102,574 | | | $ | — | | | $ | — | | | $ | 102,574 | |
| | | | | | | | |
| | | | | | | | |
| | | | | | | | |
| | | | | | | | |
| | | | | | | | |
| Liabilities: | | | | | | | | |
| Private Placement Warrants | | $ | — | | | $ | — | | | $ | 28,380 | | | $ | 28,380 | |
| | | | | | | | |
| As of December 31, 2023 | | | | | | | | |
| Assets: | | | | | | | | |
| Cash equivalents: | | | | | | | | |
| Money Market Funds | | $ | 19,312 | | | $ | — | | | $ | — | | | $ | 19,312 | |
| U.S. Treasuries | | — | | | 45,175 | | | — | | | 45,175 | |
| Short-term investments: | | | | | | | | |
| U.S. Treasuries | | — | | | 73,694 | | | — | | | 73,694 | |
| Total assets measured at fair value | | $ | 19,312 | | | $ | 118,869 | | | $ | — | | | $ | 138,181 | |
| | | | | | | | |
| Liabilities: | | | | | | | | |
| Private Placement Warrants | | $ | — | | | $ | — | | | $ | 42,900 | | | $ | 42,900 | |
Cash Equivalents and Short-term Investments:
The following is a summary of cash equivalents and short-term investments (in thousands).
| | | | | | | | | | | | | | | | | | | | | | | | | | | | | | | | | | | | | | |
| | | | | | | | | | Reported as |
| | Amortized Cost | | Unrealized Gain | | Unrealized Loss | | Estimated Fair Value | | Cash Equivalents | | Short-term Investments |
| As of December 29, 2024 | | | | | | | | | | | | |
| Money Market Funds | | $ | 102,574 | | | $ | — | | | $ | — | | | $ | 102,574 | | | $ | 102,574 | | | $ | — | |
| | | | | | | | | | | | |
| Total | | $ | 102,574 | | | $ | — | | | $ | — | | | $ | 102,574 | | | $ | 102,574 | | | $ | — | |
| | | | | | | | | | | | |
| As of December 31, 2023 | | | | | | | | | | | | |
| Money Market Funds | | $ | 19,312 | | | $ | — | | | $ | — | | | $ | 19,312 | | | $ | 19,312 | | | $ | — | |
| U.S. Treasuries | | 118,854 | | | 15 | | | — | | | 118,869 | | | 45,175 | | | 73,694 | |
| Total | | $ | 138,166 | | | $ | 15 | | | $ | — | | | $ | 138,181 | | | $ | 64,487 | | | $ | 73,694 | |
| | | | | | | | | | | | |
Private Placement Warrants
Our liabilities are measured at fair value on a recurring basis, including 6,000,000 shares of the Private Placement Warrants that were held by Rodgers Capital, LLC (the “Sponsor”) and certain of its members. The fair value of the Private Placement Warrants is considered a Level 3 valuation and is determined using the Black-Scholes valuation model. Each whole Private Placement Warrant became exercisable for one whole share of our common stock at a price
ENOVIX CORPORATION
NOTES TO THE CONSOLIDATED FINANCIAL STATEMENTS (Continued)
of $11.50 per share on December 5, 2021. The key assumptions impacting the fair value of the Private Placement Warrants are the fair value of our common stock as of each re-measurement date, the remaining contractual terms of the Private Placement Warrants, risk-free rate of return and expected volatility which is based on our historical and implied volatility and the volatility of our peer group.
During the third quarter of 2024, there was a cashless exercise of 500,000 shares of the Private Placement Warrants with an exercise price of $11.50 per share and we issued 153,822 shares of our common stock.
As of December 29, 2024 and December 31, 2023, we had 5,500,000 and 6,000,000 Private Placement Warrants outstanding, respectively. The fair value of the Private Placement Warrants was $5.16 per share as of December 29, 2024. The following tables summarize the changes for Level 3 items measured at fair value on a recurring basis using significant unobservable inputs (in thousands).
| | | | | | | |
| Private Placement Warrants | | |
| Fair value as of January 1, 2023 | $ | 49,080 | | | |
| | | |
| | | |
| Change in fair value | (6,180) | | | |
| Fair value as of December 31, 2023 | 42,900 | | | |
| Cashless warrant exercise | (2,276) | | | |
| Change in fair value | (12,244) | | | |
| Fair value as of December 29, 2024 | $ | 28,380 | | | |
The following table summarizes the key assumptions used for determining the fair value of common stock warrants.
| | | | | | | | | | | | | | | | | | | |
| Private Placement Warrants Outstanding as of December 29, 2024 | | Private Placement Warrants Outstanding as of December 31, 2023 | | Private Placement Warrants Outstanding as of January 1, 2023 | | |
| Expected term (in years) | 1.5 | | 2.5 | | 3.5 | | |
| Expected volatility | 95.0% | | 90.0% | | 92.5% | | |
| Risk-free interest rate | 4.3% | | 4.1% | | 4.2% | | |
| Expected dividend rate | —% | | —% | | —% | | |
Convertible Senior Notes and Long-term Loans
We consider the fair value of the Convertible Senior Notes to be a Level 2 measurement as they are not actively traded in the market. As of December 29, 2024, the fair value of the Convertible Senior Notes was approximately $173.0 million. As of December 29, 2024, we consider the fair value of the long-term loans are approximately close to its carrying value of $1.5 million.
ENOVIX CORPORATION
NOTES TO THE CONSOLIDATED FINANCIAL STATEMENTS (Continued)
Note 5. Property and Equipment
Property and equipment are stated at cost, net of accumulated depreciation. Depreciation is computed on a straight-line basis over the estimated useful lives of the assets. Property and equipment as of December 29, 2024 and December 31, 2023 consists of the following categories (in thousands).
| | | | | | | | | | | |
| December 29, 2024 | | December 31,
2023 |
| Machinery and equipment | $ | 112,635 | | | $ | 100,335 | |
| Building and leasehold improvements | 33,658 | | | 36,651 | |
| Office equipment and software | 5,411 | | | 2,561 | |
| Furniture and fixtures | 16,821 | | | 898 | |
| Land | 1,433 | | | 1,433 | |
| Construction in process | 18,990 | | | 68,958 | |
| Total property and equipment | 188,948 | | | 210,836 | |
| Less: accumulated depreciation | (21,001) | | | (44,365) | |
| Property and equipment, net | $ | 167,947 | | | $ | 166,471 | |
The following table summarizes the depreciation and amortization expenses related to property and equipment, which were recorded within cost of revenue, research and development expense and selling, general and administrative expense in the Consolidated Statements of Operations (in thousands).
| | | | | | | | | | | | | | | | | | | | | | | | | | | |
| | | | | Fiscal Years |
| | | | | | | | | 2024 | | 2023 | | 2022 |
| Depreciation expense | | | | | | | | | $ | 38,183 | | | $ | 33,870 | | | $ | 7,425 | |
During the fiscal year 2022, we placed our leasehold improvement and machinery and equipment into service for our Fab1 and began the depreciation using the straight-line method on the date that machinery and equipment and leasehold improvement were placed into service.
In connection with the 2023 Restructuring Plan (as defined in Note 15 “Restructuring Costs”), we recognized accelerated depreciation expenses of $18.5 million for Fab1 equipment in the fourth quarter of 2023, of which approximately $5.3 million, $13.1 million, and $0.1 million were recorded as cost of revenue, research and development expense, and selling, general and administrative expense, respectively, in the Consolidated Statements of Operations. In addition, we recorded $18.4 million of depreciation expense for Fab1 equipment in the first quarter of 2024, of which approximately $18.3 million and $0.1 million were recorded as research and development expense, and selling, general and administrative expense, respectively, in the Consolidated Statements of Operations. We did not record any accelerated depreciation expenses for the remaining periods in the fiscal year 2024.
Fab1 Long-Lived Asset Disposals
During the fiscal year 2024, we recorded $38.2 million of loss on disposal of our Fab1 long-lived assets, including machinery and equipment, leasehold improvements and other assets located in Fremont, California as a part of the 2024 Restructuring Plan (as defined below) and it was recorded as Restructuring Cost in the Consolidated Statements of Operations. See Note 15 “Restructuring Costs” for more information.
Equipment Impairment
In the fourth quarter of 2022, we ceased to construct certain automation for a small portion of our equipment, which was previously capitalized as “construction in process” category of property and equipment, net on the Consolidated
ENOVIX CORPORATION
NOTES TO THE CONSOLIDATED FINANCIAL STATEMENTS (Continued)
Balance Sheets. For the fiscal year 2022, we recorded an impairment charge of equipment of $4.9 million in the Consolidated Statements of Operations.
During the second quarter of 2023, we disposed a group of machinery and equipment and recorded an impairment charge of $4.4 million in the Consolidated Statements of Operations for the fiscal year 2023. These impaired assets were previously capitalized as “Machinery and equipment” category of property and equipment, net on the Consolidated Balance Sheets. As of December 31, 2023, $0.6 million of the impairment charges was recorded as accrued expenses on the Consolidated Balance Sheets. There was no impairment of equipment recorded for the fiscal year 2024.
Note 6. Inventory
Inventory consists of the following components (in thousands).
| | | | | | | | | | | |
| December 29, 2024 | | December 31,
2023 |
| Raw materials | $ | 3,616 | | | $ | 1,926 | |
| Work-in-process | 2,989 | | | 6,687 | |
| Finished goods | 1,059 | | | 124 | |
| Total inventory | $ | 7,664 | | | $ | 8,737 | |
For the fiscal year 2024, we had recorded immaterial amounts of inventory reserve, including excess or obsolete inventory reserve, in the Consolidated Statement of Operations. For the fiscal year 2023, we recorded $11.7 million of inventory reserve as cost of revenue in the Consolidated Statement of Operations.
As of December 29, 2024, we had an immaterial amount of excess of obsolete inventory reserve. As of December 31, 2023, we did not have excess or obsolete inventory reserve.
Note 7. Leases
We entered into operating lease agreements primarily for offices and manufacturing spaces located in various locations with lease periods expiring between 2025 and 2030. We have an option to extend the office lease located in California for five years. From time to time, we enter into lease agreements in the normal course of business. We did not enter material lease agreements during the fiscal year 2024.
During the fiscal year 2023, we entered into two new operating lease agreements as described below.
•leased a manufacturing space located in Malaysia for Fab2 with a three-year term and an option to extend it for three years. We recognized the option to renew as part of the right-of-use assets and lease liabilities.
•leased an office space located in India for the research and development center with a 5.3 years lease term.
The following table summarizes the components of lease costs (in thousands).
| | | | | | | | | | | | | | | | | | | | | | | |
| | | | | Fiscal Years |
| | | | | | | | | 2024 | | 2023 | | |
| Operating lease cost | | | | | | | | | $ | 4,278 | | | $ | 2,429 | | | |
The following table shows supplemental lease information.
ENOVIX CORPORATION
NOTES TO THE CONSOLIDATED FINANCIAL STATEMENTS (Continued)
| | | | | | | | | | | | | | |
| | As of |
| Operating leases | | December 29, 2024 | | December 31,
2023 |
| Weighted-average remaining lease term | | 5.0 years | | 6.0 years |
| Weighted-average discount rate | | 8.5% | | 8.5% |
The following table shows supplemental cash flow information related to leases (in thousands).
| | | | | | | | | | | |
| Fiscal Years Ended |
| December 29, 2024 | | December 31, 2023 |
| Cash paid for amounts included in the measurement of lease liabilities: | | | |
| Operating cash flows from operating leases | $ | 3,645 | | | $ | 2,135 | |
| Lease liabilities arising from obtaining ROU assets: | | | |
| Operating leases | $ | 3 | | | $ | 9,922 | |
Maturities of Lease Liabilities
The following is a schedule of maturities of lease liabilities as of December 29, 2024 (in thousands).
| | | | | |
| Operating leases |
| 2025 | $ | 3,757 | |
| 2026 | 3,753 | |
| 2027 | 3,795 | |
| 2028 | 3,856 | |
| 2029 | 2,765 | |
| Thereafter | 1,099 | |
| Total | 19,025 | |
| Less: imputed interest | (3,087) | |
| Present value of lease liabilities | $ | 15,938 | |
ENOVIX CORPORATION
NOTES TO THE CONSOLIDATED FINANCIAL STATEMENTS (Continued)
Note 8. Accrued Expenses and Other Current Liabilities
Accrued expenses and other current liabilities consist of the following components (in thousands).
| | | | | | | | | | | |
| As of |
| December 29,
2024 | | December 31,
2023 |
| Accrued expenses | $ | 6,415 | | | $ | 3,520 | |
| Accrued equipment | 9,216 | | | 6,544 | |
| Accrued duty and taxes | 3,564 | | | 2,836 | |
| Accrued legal expenses | 648 | | | 1,076 | |
| Total accrued expenses | $ | 19,843 | | | $ | 13,976 | |
| | | |
| As of |
| December 29,
2024 | | December 31,
2023 |
| Operating lease liability | $ | 2,645 | | | $ | 2,216 | |
| Restructuring liability | 389 | | | $ | — | |
| Other | 2 | | | $ | 219 | |
| Other current liabilities | $ | 3,036 | | | $ | 2,435 | |
Note 9. Borrowings
Short-Term Debt
In connection with the Routejade Acquisition, we assumed secured loans with fixed and floating interest rates. These loans have various maturity dates. During the fiscal year 2024, we had $4.6 million of new short-term loans with fixed interest rates. As of December 29, 2024, short-term debt was $9.5 million, which comprised of $9.3 million of short-term loans with less than one-year term and $0.2 million of the current portion of long-term loans. The current portion of long-term debt is recorded as short-term debt based on time remaining until maturity. As of December 29, 2024, the weighted average interest rate on the short-term loans was approximately 5.2%. As of December 31, 2023, there was $5.9 million of short-term debt.
ENOVIX CORPORATION
NOTES TO THE CONSOLIDATED FINANCIAL STATEMENTS (Continued)
Long-Term Debt
Our long-term debt, net consists of the following (in thousands).
| | | | | | | | | | | | | | | | | | | | | | | | | | |
| | Annual Interest Rate | | Maturity Date | | December 29, 2024 | | December 31, 2023 |
| | | | | | | | |
| Convertible Senior Notes | | 3.0 | % | | May 1, 2028 | | $ | 172,500 | | | $ | 172,500 | |
| Long-term loans | | | | | | | | |
| Floating rate | | 3.4 | % | | June 30, 2027 | | 283 | | | 385 | |
| Floating rate | | 3.4 | % | | June 30, 2028 | | 340 | | | 385 | |
| Fixed rate | | 5.2 | % | | February 3, 2026 | | 914 | | | 1,036 | |
| | | | | | | | |
| Fixed rate | | 5.3 | % | | September 19, 2024 | | — | | | 1,540 | |
| Total Convertible Senior Notes and other borrowings | | | | | | 174,037 | | | 175,846 | |
| Less: unamortized debt issuance costs | | | | | | (4,047) | | | (5,142) | |
| Long-term debt | | | | | | 169,990 | | | 170,704 | |
| Current portion of long-term debt | | | | | | (170) | | | (1,605) | |
| Long-term debt, net | | | | | | $ | 169,820 | | | $ | 169,099 | |
Long-term Loans
In connection with the Routejade Acquisition in the fiscal year 2023, we assumed $3.3 million of long-term loans with fixed rate and floating rate loans. As of December 29, 2024 and December 31, 2023, we had $1.5 million and $3.3 million of long-term loans, respectively. Of the total long-term loan outstanding balances, $0.2 million and $1.6 million, respectively, represented the current portion of the long-term loans as of December 29, 2024 and December 31, 2023.
Convertible Senior Notes
On April 20, 2023, we issued $172.5 million aggregate principal amount of Convertible Senior Notes, pursuant to an indenture, dated as of April 20, 2023 (the “Indenture”), between us and U.S. Bank Trust Company, National Association, as trustee (the “Trustee”). The offerings and sale of the Convertible Senior Notes were made by us to the initial purchasers in reliance on the exemption from registration provided by Section 4(a)(2) of the Securities Act of 1933, as amended (the “Securities Act”), for resale by the initial purchasers to qualified institutional buyers (as defined in the Securities Act) pursuant to the exemption from registration provided by Rule 144A under the Securities Act. The issuance included the exercise in full by the initial purchasers of their option to purchase an additional $22.5 million aggregate principal amount of the Convertible Senior Notes. $10.0 million principal amount of the Convertible Senior Notes (the “Affiliate Notes”) were issued to an entity affiliated with Thurman John Rodgers, Chairman of our Board of Directors, in a concurrent private placement.
The Convertible Senior Notes are unsecured obligations of the Company and bear interest at a rate of 3.0% per year from April 20, 2023, and will be payable semiannually in arrears on May 1 and November 1 of each year, beginning on November 1, 2023. The Convertible Senior Notes will mature on May 1, 2028 unless earlier converted, redeemed or repurchased.
The net proceeds from the offerings were approximately $166.6 million. We used approximately $17.3 million of the net proceeds from the offerings to pay the cost of the capped call transactions entered on April 20, 2023 in connection with the offerings. We use a portion of the net proceeds to build out Fab2 in Malaysia and fund our working capital.
The conversion rate for the Convertible Senior Notes will initially be 64.0800 shares of our common stock per $1,000 principal amount of the Convertible Senior Notes, which is equivalent to an initial conversion price of $15.61 per share of common stock, subject to adjustment under certain circumstances in accordance with the terms of the Indenture.
ENOVIX CORPORATION
NOTES TO THE CONSOLIDATED FINANCIAL STATEMENTS (Continued)
Holders of the Convertible Senior Notes may convert all or any portion of their notes, in integral multiples of $1,000 principal amount, at their option at any time prior to the close of business on the business day immediately preceding February 1, 2028 only under the following conditions:
•during any fiscal quarter commencing after the fiscal quarter ending on October 1, 2023 (and only during such fiscal quarter), if the last reported sale price of our common stock for at least 20 trading days (whether or not consecutive) during a period of 30 consecutive trading days ending on, and including, the last trading day of the immediately preceding fiscal quarter is greater than or equal to 130% of the conversion price on each applicable trading day;
•during the five business day period after any ten consecutive trading day period (the “measurement period”) in which the “trading price” (as defined in the Indenture) per $1,000 principal amount of notes for each trading day of the measurement period was less than 98% of the product of the last reported sale price of our common stock and the conversion rate on each such trading day;
•if we call the Convertible Senior Notes for redemption, at any time prior to the close of business on the scheduled trading day immediately preceding the redemption date, but only with respect to the Convertible Senior Notes called (or deemed called) for redemption; or
•upon the occurrence of specified corporate events as set forth in the Indenture.
On or after February 1, 2028 until the close of business on the second scheduled trading day immediately preceding the maturity date, holders may convert all or any portion of their notes, at any time, in integral multiples of $1,000 principal amount, at the option of the holder regardless of the foregoing conditions.
Upon conversion, we may satisfy our conversion obligation by paying or delivering, as the case may be, cash, shares of our common stock, or a combination of cash and shares of our common stock, at our election, in the manner and subject to the terms and conditions provided in the Indenture.
We may not redeem the Convertible Senior Notes prior to May 6, 2026. We may redeem for cash all or any portion of the Convertible Senior Notes, at its option, on or after May 6, 2026, if the liquidity condition is satisfied and the last reported sale price of our common stock has been at least 130% of the conversion price then in effect for at least 20 trading days (whether or not consecutive) during any 30 consecutive trading day period (including the last trading day of such period) ending on, and including, the trading day immediately preceding the date on which we provide notice of redemption at a redemption price equal to 100% of the principal amount of the notes to be redeemed, plus accrued and unpaid interest to, but excluding, the redemption date. If we redeem less than all the outstanding notes, at least $100.0 million aggregate principal amount of notes must be outstanding and not subject to redemption as of, and after giving effect to, delivery of the relevant redemption notice.
If we undergo a “fundamental change,” as defined in the Indenture, fundamental change permits the holders of the Convertible Senior Notes to require us to repurchase the Convertible Senior Notes, subject to certain terms and conditions as defined in the Indenture. Holders may require us to repurchase for cash all or any portion of their notes in principal amounts of $1,000 or an integral multiple thereof. The fundamental change repurchase price will be equal to 100% of the principal amount of the notes to be repurchased, plus accrued and unpaid interest to, but excluding, the fundamental change repurchase date.
In accounting for the issuance of the Convertible Senior Notes, we accounted for the Convertible Senior Notes as liability instruments and considered it as single units of account pursuant to the Accounting Standards Update (“ASU”) No. 2020-06, Debt - Debt with Conversion and Other Options (Subtopic 470-20) and Derivatives and Hedging - Contracts in Entity’s Own Equity (Subtopic 815-40), (“ASU 2020-06”). Accrued interest for the Convertible Senior Notes was recorded as Accrued expenses on the Consolidated Balance Sheet. Costs incurred in connection with the issuance of debt are deferred and amortized as interest expense over the term of the related debt using the effective interest method. To the extent that the debt is outstanding, the debt issuance costs were recorded as a reduction to Long-term debt, net on the Consolidated Balance Sheet. For the fiscal year 2023, we incurred approximately $5.9 million of debt issuance costs relating to the issuance of the Convertible Senior Notes.
Capped Call Transactions
In connection with the issuance of the Convertible Senior Notes, we paid approximately $17.3 million to enter into capped call transactions with certain financial institutions (the “Capped Calls”) in the second quarter of 2023. The Capped Calls are generally expected to reduce the potential dilution to our common stock upon any conversion of the Convertible Senior Notes and/or offset any cash payments we are required to make in excess of the principal amount of
ENOVIX CORPORATION
NOTES TO THE CONSOLIDATED FINANCIAL STATEMENTS (Continued)
the converted Convertible Senior Notes, as the case may be, with such reduction and/or offset subject to a cap based on a cap price initially equal to $21.17 per share (which represents a premium of 56.0% over the last reported sale price of our common stock of $13.57 per share on The Nasdaq Global Select Market on April 17, 2023), and is subject to certain adjustments under the terms of the Capped Calls. We recorded the Capped Calls as a reduction of stockholders' equity, not as derivatives, as the Capped Calls met certain accounting criteria. No subsequent remeasurement is required.
Interest
The following table summarizes the interest expenses related to Convertible Senior Notes and loans, which are recorded within Interest expense in the Consolidated Statements of Operations (in thousands).
| | | | | | | | | | | | | | | | | | | |
| | | | Fiscal Years | |
| | | | | | 2024 | | 2023 | |
| Coupon interest | | | | | | $ | 5,175 | | | $ | 3,608 | | |
| Amortization of debt issuance costs | | | | | | 1,095 | | | 775 | | |
| Total interest expense on Convertible Senior Notes | | | | | | 6,270 | | | 4,383 | | |
| Loan interest | | | | | | 517 | | | 64 | | |
| Total interest expenses related to Convertible Senior Notes and loans | | | | | | $ | 6,787 | | | $ | 4,447 | | |
| | | | | | | | | |
As of both December 29, 2024 and December 31, 2023, we had $0.9 million of accrued interest liability.
Debt Maturity
The following table summarizes our long-term debt maturities, based on outstanding principal by years (in thousands).
| | | | | | | | |
| | December 29, 2024 |
| 2025 | | $ | 170 | |
| 2026 | | 1,141 | |
| 2027 | | 170 | |
| 2028 | | 172,556 | |
| | |
| | |
| Total gross amount of long-term debt | | $ | 174,037 | |
Note 10. Commitments and Contingencies
Purchase Commitments
As of December 29, 2024 and December 31, 2023, our commitments included approximately $17.4 million and $62.5 million, respectively, of our open purchase orders and contractual obligations that occurred in the ordinary course of business, including commitments with contract manufacturers and suppliers for which we have not received the goods or services, commitments for capital expenditures and construction-related activities for which we have not received the services. Although open purchase orders are considered enforceable and legally binding, the terms generally allow us the option to cancel, reschedule, and adjust the requirements based on our business needs prior to the delivery of goods or performance of services. For lease obligations, please refer to Note 7 “Leases” for more details. For the Convertible Senior Notes obligation, please refer to Note 9 “Borrowings” for more details.
ENOVIX CORPORATION
NOTES TO THE CONSOLIDATED FINANCIAL STATEMENTS (Continued)
Performance Obligations
As of December 29, 2024, we had $7.4 million of performance obligations, which comprised of total deferred revenue and customer order deposits. We currently expect to recognize approximately 49% of deferred revenue as revenue within the next twelve months and the remaining amount is expected to be recognized as revenues in 2026.
Litigation
From time to time, we are subject to a variety of claims, lawsuits, investigations, and proceedings concerning matters arising in connection with our business activities, including product liability, intellectual property, commercial, insurance, securities laws, contract disputes, and employment matters. Certain of these lawsuits and claims are described in further detail below. We intend to vigorously defend against each of these allegations.
A liability and related charge to earnings is recorded in the consolidated financial statements for legal contingencies when the loss is considered probable and the amount can be reasonably estimated. The assessment is re-evaluated each accounting period and is based on all available information, including the impact of negotiations, settlements, rulings, advice of legal counsel, and other information and events pertaining to each case. The outcomes of outstanding legal matters are inherently unpredictable and subject to uncertainties. While there can be no assurance of favorable outcome of these legal matters, we currently believe that the outcome of these matters will not have a material adverse effect on our results of operations, liquidity or financial position.
Former Employee Class Action Lawsuits
On January 21, 2022, two former machine operator employees filed a putative wage and hour class action lawsuit against Enovix and co-defendant Legendary Staffing, Inc. in the Superior Court of California, County of Alameda. The case is captioned Sopheak Prak & Ricardo Pimentel v Enovix Corporation and Legendary Staffing, Inc., 22CV005846 (the “Prak Complaint”). The Prak Complaint alleged, among other things, on a putative class-wide basis, that the defendants failed to pay all overtime wages and committed meal period, rest period and wage statement violations under the California Labor Code and applicable Wage Orders. The plaintiffs sought unpaid wages, statutory penalties and interest and reasonable costs and attorney fees. We began the mediation process in September 2022 and on June 6, 2024, a final settlement was approved by the court. All settlement funds were distributed in July 2024.
Legendary Staffing, our co-defendant in the Prak Complaint, filed a breach of contract action against us relating to the alleged failure to make payments on invoices relating to the Prak Complaint. On August 6, 2024, the court dismissed the breach of contact action against us and on November 25, 2024, a default judgment was entered against Legendary in this action.
In 2023, a former employee filed two complaints against Enovix. The first complaint asserted a putative class action, alleging various wage and hour violations, and individual claims alleging constructive discharge and adverse employment actions. The second complaint asserted claims under California’s Private Attorney General Act (“PAGA”) for alleged wage and hour violations. The cases are captioned Kody Walker v. Enovix Corporation, 23CV028923 and 23CV039290 (the “Walker Complaints”). The Walker Complaints were consolidated in April 2024. In November 2024, the parties entered into settlement agreements resolving the individual and PAGA claims, and plaintiff dismissed without prejudice the putative class action claims. Plaintiff filed a motion seeking court approval of the PAGA settlement, which hearing is scheduled for March 2025.
Securities Class Action Complaint
On January 6, 2023, a purported Company stockholder filed a securities class action complaint in the U.S. District Court for the Northern District of California against Enovix and certain of our current and former officers and directors (collectively, the “defendants”). The case is captioned Twitchell v. Enovix Corp., Case No. 23-cv-00071-SI (N.D. Cal.) (“Twitchell”). The complaint alleges that the defendants violated Sections 10(b) and 20(a) of the Exchange Act of 1934 and Rule 10b-5 promulgated thereunder by making material misstatements or omissions in public statements related to our manufacturing scale-ups and testing of new equipment. A substantially identical complaint was filed on January 25, 2023 by another purported Company stockholder. Following consolidation of the cases and court appointment of two purported Company stockholder lead plaintiffs, a consolidated complaint alleging substantially similar claims, including allegations that the defendants made material misstatements or omissions in public statements related to testing of new equipment, was filed on July 7, 2023.
ENOVIX CORPORATION
NOTES TO THE CONSOLIDATED FINANCIAL STATEMENTS (Continued)
The court granted the motion to dismiss the consolidated complaint on January 30, 2024. The plaintiffs filed a second amended complaint on March 19, 2024, which seeks unspecified damages, interest, fees and costs on behalf of all persons and entities that purchased and/or acquired shares of Enovix or its predecessor entity’s common stock between June 24, 2021 and October 3, 2023. On July 23, 2024, the court issued an order granting in part and denying in part defendants’ motion to dismiss. We and the defendants are defending against the remaining claims in this action.
In September 2024, we received two Section 220 book and records demand notices from two separate shareholders related to the securities class action complaint, which may result in separately filed lawsuits in Delaware. On November 21, 2024, a new derivative lawsuit was filed in Alameda County against us, which lawsuit has been stayed pending resolution of the Twitchell matter.
Guarantees and Indemnifications
In the normal course of business, we enter into contracts and agreements that contain a variety of representations and warranties and provide for general indemnifications. In addition, we purchased performance bonds for guarantee of our performance obligations for certain projects. Our exposure under these agreements is unknown because it involves claims that may be made against us in the future but have not yet been made. To date, we have not paid any claims or been required to defend any action related to the indemnification obligations. However, we may record charges in the future as a result of these indemnification obligations.
We also have indemnification obligations to our officers and directors for specified events or occurrences, subject to some limits, while they are serving at our request in such capacities. There have been no claims to date and we have director and officer insurance that may enable us to recover a portion of any amounts paid for future potential claims. We believe the fair value of these indemnification agreements is minimal. Accordingly, we have not recorded any liabilities relating to these obligations for the periods presented.
Note 11. Common Stock and Convertible Preferred Stock
Common Stock
As of December 29, 2024 and December 31, 2023, we had authorized 1,000,000,000 shares of common stock, par value $0.0001 and issued and outstanding of 190,559,335 and 167,392,315, respectively. Each holder of a share of common stock is entitled to one vote for each share held and is entitled to receive dividends whenever funds are legally available and when declared by the board of directors, subject to preferential rights of holders of other classes of stock outstanding. Such dividends shall be payable only when, as and if declared by the board of directors and shall be non-cumulative.
Sale of Common Stock
We have an effective shelf registration statement, filed with the SEC in August 2023, which allows us to offer, issue and sell, up to a maximum aggregate offering price of $1.0 billion of our common stock, preferred stock, debt securities and/or warrants in one or more offerings. During the fourth quarter of 2024, we sold 11,626,089 shares of our common stock and received proceeds of $106.7 million, net of estimated issuance costs.
At-Market Equity Offering
We launched an at-the-market equity offering (“ATM”) program in fiscal year 2024, which allowed us to offer and sell, from time to time, shares of our common stock, subject to the approval of our board of directors. During fiscal year 2024, we sold 4,359,019 shares of our common stock under the ATM program and received net proceeds of $40.0 million.
Convertible Preferred Stock
As of December 29, 2024 and December 31, 2023, we had authorized 10,000,000 shares of convertible preferred stock, par value $0.0001 and there was no shares issued and outstanding for both periods.
ENOVIX CORPORATION
NOTES TO THE CONSOLIDATED FINANCIAL STATEMENTS (Continued)
Note 12. Warrants
Private Placement Warrants
The 6,000,000 Private Placement Warrants were originally issued in a private placement to the initial stockholder of the Sponsor in connection with the initial public offering. Each whole Private Placement Warrant became exercisable for one whole share of our common stock at a price of $11.50 per share on December 5, 2021.
The Private Placement Warrants will be exercisable on a cashless basis, at the holder’s option, and will not be redeemable by us, in each case so long as they are still held by the initial purchasers or their affiliates. The Private Placement Warrants purchased by the Sponsor will not be exercisable more than five years from the effective date of the RSVAC IPO registration statement, in accordance with FINRA Rule 5110(f)(2)(G)(i), as long as Rodgers Capital, LLC or any of its related persons beneficially own these Private Placement Warrants. On September 8, 2021, the Sponsor made an in-kind distribution of the Private Placement Warrants to certain members of Rodgers Capital LLC. The Private Placement Warrants are classified as liability.
During the third quarter of 2024, there was a cashless exercise of 500,000 shares of the Private Placement Warrants with an exercise price of $11.50 per share and we issued 153,822 shares of our common stock. As of December 29, 2024, the remaining contractual term for the outstanding Private Placement Warrants to purchase our common stock is approximately 1.5 years.
As of December 29, 2024, we had 5,500,000 Private Placement Warrants outstanding. See Note 4 “Fair Value Measurement” for more information.
Note 13. Net Loss per Share
We compute net earnings per share (“EPS”) of common stock using the two-class method. Basic EPS is computed using net income (loss) divided by the weighted-average number of common stock shares outstanding. Diluted EPS is computed using net income (loss) with an adjustment of changes in fair value of the Private Placement Warrants recorded in earnings divided by the total of weighted-average number of common stock shares outstanding and any dilutive potential common stock shares outstanding. Dilutive potential common stock shares included the assumed stock options exercises, vesting and issuance activities of restricted stock units and estimated common stock issuance under the employee stock purchase plan.
The following table shows the computation of the basic and diluted net EPS of common stock for the periods presented below (in thousands, except share and per share amount).
ENOVIX CORPORATION
NOTES TO THE CONSOLIDATED FINANCIAL STATEMENTS (Continued)
| | | | | | | | | | | | | | | | | | | | | | | | |
| | | | Fiscal Years |
| | | | | | | | 2024 | | 2023 | | 2022 |
| | | | | | | | | | | | |
| Numerator: | | | | | | | | | | | | |
| Net loss attributable to common stockholders - basic | | | | | | | | $ | (222,241) | | | $ | (214,071) | | | $ | (51,622) | |
| Decrease in fair value of Private Placement Warrants | | | | | | | | — | | | (6,180) | | | (75,180) | |
| Net loss attributable to common stockholders - diluted | | | | | | | | $ | (222,241) | | | $ | (220,251) | | | $ | (126,802) | |
| | | | | | | | | | | | |
| Denominator: | | | | | | | | | | | | |
| Weighted-average shares outstanding used in computing net loss per share of common stock, basic | | | | | | | | 175,038,107 | | | 159,065,697 | | | 152,918,287 | |
| Dilutive effect of Private Placement Warrants | | | | | | | | — | | | 509,858 | | | 1,231,080 | |
| Weighted-average shares outstanding used in computing net loss per share of common stock, diluted | | | | | | | | 175,038,107 | | | 159,575,555 | | | 154,149,367 | |
| | | | | | | | | | | | |
| Net loss per share of common stock: | | | | | | | | | | | | |
| Basic | | | | | | | | $ | (1.27) | | | $ | (1.35) | | | $ | (0.34) | |
| Diluted | | | | | | | | $ | (1.27) | | | $ | (1.38) | | | $ | (0.82) | |
As we reported net loss for the periods presented above, the potentially dilutive securities were anti-dilutive and were excluded in the computation of diluted net loss per share. The following table discloses shares of the securities that were not included in the diluted EPS calculation above because they were anti-dilutive for the periods presented above.
| | | | | | | | | | | | | | | | | | | | | | | | |
| | | | Fiscal Years |
| | | | | | | | 2024 | | 2023 | | 2022 |
| Stock options outstanding | | | | | | | | 1,751,118 | | | 2,615,199 | | | 5,034,282 | |
| Restricted stock units and performance restricted stock units outstanding | | | | | | | | 13,172,101 | | | 11,424,740 | | | 7,371,158 | |
| Private Placement Warrants outstanding | | | | | | | | 5,500,000 | | | — | | | — | |
| | | | | | | | | | | | |
| Employee stock purchase plan estimated shares | | | | | | | | 238,368 | | | 442,146 | | | 349,988 | |
| Assumed conversion of Convertible Senior Notes | | | | | | | | 11,053,800 | | | 11,053,800 | | | — | |
| | | | | | | | | | | | |
| | | | | | | | | | | | |
| | | | | | | | | | | | |
Note 14. Stock-based Compensation
Equity Incentive Plans
As of December 29, 2024, our equity compensation plans include the 2021 Equity Incentive Plan (the “2021 Plan”) and 2021 Employee Stock Purchase Plan (the “2021 ESPP”).
2021 Equity Incentive Plan
The 2021 Plan was approved by our stockholders in July 2021. The 2021 Plan is intended as the successor to and continuation of the 2016 Equity Incentive Plan (the “2016 Plan”). Under the 2021 Plan, our employees, directors and consultants (“Participants”), are eligible for grants of incentive stock options, non-statutory stock options, stock appreciation rights, restricted stock awards, restricted stock units (“RSUs”), and performance restricted stock units (“PRSUs”), collectively referred to as “Stock Awards”. Incentive stock and non-statutory stock options are collectively referred to as “Option(s).”
Under the 2021 Plan, 16,850,000 shares of common stock were reserved for future issuance. The number of shares reserved for issuance under the 2021 Plan will automatically increase on January 1st each year, starting on January 1,
ENOVIX CORPORATION
NOTES TO THE CONSOLIDATED FINANCIAL STATEMENTS (Continued)
2022 and continuing through January 1, 2031, by the lesser of (a) 4% of the total number of shares of our common stock outstanding on December 31st of the immediately preceding fiscal year or (b) a lesser number determined by our board of directors prior to the applicable January 1st.
2021 Employee Stock Purchase Plan
The 2021 ESPP was adopted by our board of directors in June 2021 and approved by our stockholders in July 2021. Under the 2021 ESPP, 5,625,000 shares of common stock were reserved for future issuance. The number of shares reserved for issuance under the 2021 ESPP will automatically increase on January 1st each year, starting on January 1, 2022 and continuing through January 1, 2031, by the lesser of (a) 1% of the total number of shares of our common stock outstanding on December 31st of the preceding calendar year, (b) 2,000,000 shares of the Registrant’s common stock or (c) a lesser number determined by our board of directors.
The 2021 ESPP allows eligible employees to purchase shares of our common stock at a 15% discount through periodic payroll deductions of up to 15% of base compensation, subject to individual purchase limits in any single purchase date or in one calendar year. The 2021 ESPP provides 18-month offering periods with three 6-month purchase periods. A new 18-month offering period will commence every six months thereafter. The purchase price for our common stock under the ESPP is 85% of the lower of the fair market value of the shares at (1) on the offering period or (2) on the purchase date.
Common Stock
The following table shows the shares of our common stock that had been reserved for future issuance as of December 29, 2024.
| | | | | |
| Outstanding common stock options | 1,751,118 | |
| Options, RSUs and PRSUs available for future grants | 11,865,775 | |
| Outstanding RSUs and PRSUs for future vesting | 13,172,101 | |
| Common stock employee purchase plan available for future offerings | 9,686,346 | |
| 36,475,340 | |
Stock-Based Compensation
We issue equity awards to our employees and non-employees in the form of stock options, RSUs and PRSUs. Additionally, we also offer the 2021 ESPP to our eligible employees. We use Black-Scholes option pricing model to value our stock options granted and the estimated shares to be purchased under the ESPP. For both RSUs and PRSUs, we use our common stock price, which is the last reported sales price on the grant date to value those securities.
In general, we recognize stock-based compensation expense on a straight-line basis over the requisite service period and records forfeitures as they occur. For PRSUs, we use the graded vesting method to calculate stock-based compensation expense. At each reporting period, we would recognize and adjust stock-based compensation expense based on the probability assessment in meeting PRSUs' performance conditions.
The following table summarizes the total stock-based compensation expense, by operating expense category, recognized in the Consolidated Statements of Operations for the periods presented below (in thousands).
| | | | | | | | | | | | | | | | | |
| Fiscal Years Ended |
| 2024 | | 2023 | | 2022 |
| Cost of revenue | $ | 320 | | | $ | 5,460 | | | $ | 2,071 | |
| Research and development | 24,853 | | | 27,409 | | | 12,720 | |
Selling, general and administrative(1) | 32,448 | | | 36,224 | | | 15,576 | |
| Restructuring cost | 1,216 | | | 359 | | | — | |
| Total stock-based compensation expense | $ | 58,837 | | | $ | 69,452 | | | $ | 30,367 | |
ENOVIX CORPORATION
NOTES TO THE CONSOLIDATED FINANCIAL STATEMENTS (Continued)
(1) During the quarter ended June 30, 2024, we engaged a consulting company for its services and issued RSUs in exchange for its services. In connection with this service agreement, we recorded approximately $9.6 million of stock-based compensation expense for the fiscal year 2024.
For the fiscal years 2024 and 2023, we capitalized $3.6 million and $1.4 million, respectively, of stock-based compensation as property and equipment, net on the Consolidated Balance Sheets. In addition, we accrued $2.7 million of bonus to be settled in equity awards as accrued compensation on the Consolidated Balance Sheet as of December 29, 2024.
There was an immaterial amount of tax benefit recognized related to stock-based compensation for fiscal year 2024 and no recognized tax benefit related to stock-based compensation for the fiscal years 2023 and 2022. In addition, there was no recognized tax benefit from the stock options exercised for the periods presented.
As of December 29, 2024, there was approximately $105.2 million of total unrecognized stock-based compensation expense related to unvested equity awards, which are expected to be recognized over a weighted-average period of 3.1 years. As of December 29, 2024, there was approximately $0.8 million of total unrecognized stock-based compensation related to the 2021 ESPP, which is expected to be recognized over the remaining period of 1.4 years.
Equity Award Modification
In connection with the 2024 Restructuring Plan (as defined in Note 15 “Restructuring Costs”), there were few equity award modifications in the fiscal year 2024, which modified the terms of the awards. For the fiscal year 2024, we recognized $1.3 million of stock-based compensation expense related to the modifications.
During the fiscal year 2023, in connection with the retirement or resignation of several of our former officers and executives, the change in employment status impacted the vesting conditions as the term of equity award exercise period was extended and certain of the equity awards were accelerated and vested immediately. For the fiscal year 2023, we recognized $21.1 million of stock-based compensation expense related to the modifications. There was no equity modification for the fiscal year 2022.
Stock Option Activity
Options granted under the 2021 Plan and the 2016 Plan to employees generally have a service vesting condition over four or five years. Other vesting terms are permitted and are determined by our board of directors. Options have a term of no more than ten years from the date of grant and vested options are generally cancelled three months after termination of employment if unexercised.
ENOVIX CORPORATION
NOTES TO THE CONSOLIDATED FINANCIAL STATEMENTS (Continued)
The following table summarizes stock option activities for the fiscal year 2024 (in thousands, except share and per share amount).
| | | | | | | | | | | | | | | | | | | | | | | |
| Number of
Options
Outstanding | | Weighted
Average
Exercise
Price | | Weighted
Average
Remaining
Contractual
Life (Years) | | Aggregate Intrinsic Value (1) (2) |
| Balances as of January 1, 2024 | 2,615,199 | | $ | 9.71 | | | | | |
| | | | | | | |
| Exercised | (606,482) | | 7.93 | | | | | $ | 3,714 | |
| Forfeited | (257,599) | | 11.62 | | | | | |
| Balances as of December 29, 2024 | 1,751,118 | | $ | 10.05 | | | 6.3 | | $ | 3,394 | |
| Vested and expected to vest at December 29, 2024 | 1,775,004 | | $ | 9.91 | | | 6.3 | | |
| Vested and exercisable at December 29, 2024 | 1,567,576 | | $ | 10.02 | | | 6.3 | | |
| Unvested and exercisable at December 29, 2024 | 166,490 | | $ | 9.30 | | | 6.3 | | |
| | | | | |
| (1) | The intrinsic value of options exercised is based upon the value of our stock at exercise. |
| (2) | The aggregate intrinsic value of the stock options outstanding as of December 29, 2024 represents the value of our closing stock price at $11.28 on December 29, 2024 in excess of the exercise price multiplied by the number of options outstanding. |
There were no stock options granted in the fiscal years 2024 and 2023. We use the Black-Scholes option-pricing model to determine the grant date fair value of stock options with the following assumptions for the fiscal year 2022.
| | | | | | | | | |
| | | | | Fiscal Year |
| | | | | 2022 |
| Risk-free interest rate | | | | | 2.1% - 4.2% |
| Expected term (years) | | | | | 5.0 - 6.0 |
| Dividend yield | | | | | — | % |
| Expected volatility | | | | | 67.6% - 70.1% |
| | | | | |
The estimated weighted-average grant date fair value of stock options granted to employees during the fiscal year 2022 was $8.84 per share. The fair value of stock options that vested during the fiscal years 2024, 2023 and 2022 were $2.5 million, $15.1 million and $12.4 million, respectively.
Early Exercise of Options
The terms of the 2016 Plan and the 2021 Plan permit the exercise of options granted prior to vesting, subject to required approvals. The unvested shares are subject to our repurchase right, upon termination of employment, at the lower of (i) the fair market value of the shares of common stock on the date of repurchase or (ii) their original exercise price. The repurchase right lapses 90 days after the termination of the employee’s employment. Shares purchased by employees pursuant to the early exercise of stock options are not deemed, for accounting purposes, to be issued until those shares vest according to their respective vesting schedules. Cash received for early exercised stock options is recorded as other current and non-current liabilities on the Consolidated Balance Sheets and is reclassified to common stock and additional paid in capital as such shares vest.
Unvested early exercised stock options which are subject to repurchase by us are not considered participating securities as those shares do not have non-forfeitable rights to dividends or dividend equivalents. Unvested early exercised stock options are not considered outstanding for purposes of the weighted average outstanding share calculation until they vest.
As of December 29, 2024 and December 31, 2023, 23,886 and 470,544 shares, respectively, remained subject to our right of repurchase as a result of early exercised stock options. The remaining liability related to early exercised shares as
ENOVIX CORPORATION
NOTES TO THE CONSOLIDATED FINANCIAL STATEMENTS (Continued)
of December 29, 2024 and December 31, 2023 were immaterial. The early exercised stock options liability was recorded in other current and non-current liabilities in the Consolidated Balance Sheets.
Issuance of Common Stock Subject to Return
In connection with certain early exercised stock options, during the third quarter of fiscal year 2023, we erroneously issued an additional 1,304,954 shares of common stock to several former executive officers as a result of an administrative issue. During the fourth quarter of fiscal year 2023, we received a full recovery of these common stock shares from the former executive officers. For their cooperation in returning the additional shares to us, we issued a total of 130,000 shares of fully vested RSUs to them.
Restricted Stock Unit and Performance Restricted Stock Unit Activities
Since September 2021, we primarily grant RSUs to our employees and non-employee directors. We generally grant RSUs with service vesting condition over four or five years. In addition, in the fiscal year 2022, we began to grant PRSUs to certain employees with both performance and service vesting conditions over two years. Each RSU or PRSU is not considered issued and outstanding and does not have voting rights until it is converted into one share of our common stock upon vesting.
The following table summarizes RSUs and PRSUs activities for the fiscal year 2024 (in thousands, except share and per share amount).
| | | | | | | | | | | | | | | | | | | | | | | |
| RSUs | | PRSUs |
| Number of
Shares
Outstanding | | Weighted Average
Grant Date Fair Value | | Number of
Shares
Outstanding | | Weighted Average
Grant Date Fair Value |
| Issued and unvested shares balances as of January 1, 2024 | 10,893,271 | | | $ | 11.58 | | | 531,469 | | | $ | 13.16 | |
| Granted | 11,746,383 | | | 8.06 | | | 2,505,023 | | | 7.39 | |
| Vested | (6,894,810) | | | 9.20 | | | (63,298) | | | 13.41 | |
| Forfeited | (4,590,389) | | | 10.94 | | | (955,548) | | | 9.40 | |
| December 29, 2024 | 11,154,455 | | | $ | 9.61 | | | 2,017,646 | | | $ | 7.71 | |
The total fair values of RSUs vested during the fiscal years 2024 and 2023 were $71.6 million and $35.3 million, respectively. The total fair value of PRSUs vested during the fiscal years 2024 and 2023 was $0.7 million and $1.8 million, respectively .
We sell or withhold shares with value equivalent to the employees' obligation for the applicable income and other employment taxes and remitted the cash to the appropriate taxing authorities. The number of shares withheld was determined by our common stock’s closing share price on the vesting of our common stock. For the fiscal years 2024 and 2023, the total number of shares withheld were 664,634 and 303,805, respectively. The total amounts paid for the employees' tax obligation to taxing authorities were $7.1 million and $3.9 million, respectively, related to the shares withheld upon vesting of the RSUs for the fiscal years 2024 and 2023. These transactions were reflected as financing activities within the Consolidated Statements of Cash Flows.
Employee Stock Purchase Plan Activity
The 2021 ESPP was approved by the stockholders on July 12, 2021. The first offering of the 2021 ESPP was in November 2021 and the first purchase was in May 2022. During the fiscal years 2024, 2023 and 2022, 194,784, 285,847 and 229,249 common stock shares, respectively, were purchased under the 2021 ESPP with the weighted-average purchase price per share of $7.73, $8.22 and $8.29, respectively. The weighted average grant-date fair value per ESPP share for the fiscal years 2024, 2023 and 2022 were $9.15, $12.56 and $11.22, respectively.
ENOVIX CORPORATION
NOTES TO THE CONSOLIDATED FINANCIAL STATEMENTS (Continued)
We use the Black-Scholes option-pricing model to determine the fair value of estimated shares under the 2021 ESPP with the following assumptions for the fiscal years 2024, 2023 and 2022.
| | | | | | | | | | | | | | | | | | | | | | |
| | Fiscal Years |
| | 2024 | | 2023 | | 2022 | | |
| Risk-free interest rate | | 4.4% - 5.4% | | 0.3% - 5.5% | | 0.1% - 4.8% | | |
| Expected term (years) | | 0.5 - 1.5 | | 0.5 - 1.5 | | 0.5 - 1.5 | | |
| Dividend yield | | —% | | —% | | — | % | | |
| Expected volatility | | 83.9% - 102.4% | | 71.3% - 123.2% | | 62.3% - 123.2% | | |
Note 15. Restructuring Costs
2024 Restructuring Plan
In May 2024, our Board of Directors approved a restructuring plan (the “2024 Restructuring Plan”) designed to reduce operating costs and support our strategic goals. As part of the 2024 Restructuring Plan, we relocated our manufacturing operations from our Fab1 facility in Fremont, California to Malaysia, resulting in a plan of workforce reduction in the U.S, as well as long-lived asset disposals related to Fab1. The 2024 Restructuring Plan was substantially complete in 2024.
In connection with the 2024 Restructuring Plan, we recorded estimated pre-tax restructuring and related charges of $41.8 million for the fiscal year ended December 29, 2024. These restructuring costs were reflected in Restructuring cost in the Consolidated Statements of Operations.
The restructuring costs for the fiscal year ended December 29, 2024 included non-cash charges of $38.2 million of loss on disposals of Fab1 long-lived asset in Fremont, California, $1.2 million of stock-based compensation expense, cash charges of $1.6 million of severance and termination benefits and $0.8 million of other charges.
During the fiscal year 2024, we paid $2.0 million of cash costs related to the restructuring costs. As of December 29, 2024, we had $0.4 million of the restructuring liability, which was included in Other current liability on the Consolidated Balance Sheets.
2023 Restructuring Plan
On October 3, 2023, we announced a strategic realignment (the “2023 Restructuring Plan”) of our first production line (“Fab1”) in Fremont designed to refocus the facility from a manufacturing hub to our “Center for Innovation,” focused on new product development, including a plan of workforce reduction.
In connection with the 2023 Restructuring Plan, we recorded approximately $3.0 million of restructuring costs for the fiscal year 2023, which consisted of severance, termination benefits, stock-based compensation expense and inventory costs. These restructuring costs were reflected in Restructuring cost in the Consolidated Statements of Operations. During the fourth quarter of 2023, we paid $1.6 million of the restructuring costs and the remaining $0.4 million of the restructuring liability was included in Accrued compensation on the Consolidated Balance Sheet as of December 31, 2023.
In addition, we recognized an accelerated depreciation expenses of approximately $18.5 million for Gen1 equipment in the fourth quarter of 2023 and $18.4 million was recognized in the first quarter of 2024.
ENOVIX CORPORATION
NOTES TO THE CONSOLIDATED FINANCIAL STATEMENTS (Continued)
Note 16. Variable Interest Entity
We consolidate a VIE when we have the power to direct the activities that most significantly impact the VIE’s economic performance and the obligation to absorb losses or the right to receive benefits of the VIE, which could potentially be significant to the VIE, and, as a result, are considered the primary beneficiary of the VIE.
YBS Agreement
On July 26, 2023, we entered into a manufacturing agreement (the “YBS Agreement”) with YBS International Berhad (“YBS”), a Malaysia-based investment holding company with segments including electronic manufacturing and assembly, high-precision engineering, precision machining and stamping, among others. We have the sole and exclusive rights to YBS’s output of products with our proprietary technology. The term of the YBS Agreement is ten years, with an automatic five year extension. As a part of the YBS Agreement, YBS assigned Orifast Solution Sdn Bhd (“OSSB”), its subsidiary, to manufacture lithium-ion batteries for us under the terms and conditions of the Agreement.
Pursuant to the terms of the initial Agreement, Enovix and YBS agreed to share responsibility for the second generation (“Gen2”) Line 1 equipment and facilitization costs, with Enovix contributing 30% of the initial investment and YBS obligated to finance the remaining 70%.
As of December 31, 2023, we concluded that OSSB was considered a VIE (the “OSSB VIE”) and we were the primary beneficiary of OSSB based on relevant accounting guidance. We had a variable interest in OSSB with no equity investment in OSSB. Accordingly, we consolidated OSSB financial statements in accordance with GAAP. As of December 31, 2023, the total assets and liabilities of OSSB were immaterial.
YBS Agreement Amendment
On October 29, 2024, we entered into an amendment (the “Amendment”) to the YBS Agreement. Pursuant to the Amendment, Enovix is responsible for the initial investment of $100.0 million for the Gen2 Line 1 equipment and facilitization costs at 100% instead of 30%, and YBS is responsible for obtaining and managing its working capital requirements to fulfill its obligations to provide manufacturing services, including direct and indirect materials, direct labor utilities and repair and maintenance. Additionally, YBS is obligated to purchase the tooling and fixtures for manufacturing of the products as designed by us, pursuant to the Amendment.
Pricing under the YBS Agreement is set on a cost-plus basis and we are subject to a minimum commitment, as such term was modified by the Amendment. The YBS Agreement has an initial ten-year term with eight years and seven months remaining as of December 2024, which will automatically renew for one successive five-year period unless earlier terminated. There was no change to the remaining life of the contract or the renewal term under the Amendment.
Pursuant to the Amendment, YBS replaced OSSB and became a named entity in this modified arrangement. As such, we no longer have a relationship with OSSB, which is no longer a variable interest entity, and no consolidation evaluation is required. Accordingly, OSSB was deconsolidated in the fourth quarter of fiscal year 2024 and the effect of the deconsolidation on the consolidated financial statements was immaterial.
As a result of the Amendment, YBS is the named entity under the Amendment and we reassessed our relationship with YBS. We concluded that we did not have a controlling financial interest in YBS, as defined in ASC 810, Consolidation, as of December 29, 2024 due to the fact that we do not have the power to direct the activities that most significantly impact the economic performance of YBS and the obligation to absorb losses or the right to receive benefits of YBS. Therefore, we are not the primary beneficiary of YBS and are not required to consolidate YBS.
ENOVIX CORPORATION
NOTES TO THE CONSOLIDATED FINANCIAL STATEMENTS (Continued)
Note 17. Income Tax
Net loss before income taxes was attributable to the following geographic locations for the fiscal years 2024, 2023 and 2022 (in thousands).
| | | | | | | | | | | | | | | | | |
| Fiscal Years |
| 2024 | | 2023 | | 2022 |
| United States | $ | (219,494) | | | $ | (207,948) | | | $ | (51,496) | |
| Foreign | (4,432) | | | (6,817) | | | (126) | |
| Net loss before income taxes | $ | (223,926) | | | $ | (214,765) | | | $ | (51,622) | |
During the fiscal year 2024, we recorded tax provision benefit on foreign jurisdictions as we generated income from certain foreign entities, partially offset by losses from a subsidiary in South Korea. There was no provision for income taxes recorded on U.S. pre-tax loss as we generated net operating losses and a full valuation allowance was recorded against all U.S. federal and state net deferred tax assets. The following table summarizes the provision (benefit) for income taxes (in thousands).
| | | | | | | | | | | |
| Fiscal Years |
| 2024 | | 2023 |
| Current: | | | |
| | | |
| | | |
| Foreign | $ | 1,305 | | | $ | 180 | |
| Total current | 1,305 | | | 180 | |
| Deferred: | | | |
| | | |
| | | |
| Foreign | (2,697) | | | (813) | |
| Total deferred | (2,697) | | | (813) | |
| Total provision | $ | (1,392) | | | $ | (633) | |
The following table shows the differences between the effective tax rate and the U.S. federal statutory tax rate for the fiscal years 2024, 2023 and 2022.
| | | | | | | | | | | | | | | | | |
| Fiscal Years |
| 2024 | | 2023 | | 2022 |
| Federal statutory tax rate | 21.0 | % | | 21.0 | % | | 21.0 | % |
| State and local income taxes, net of federal benefit | 6.0 | % | | 5.8 | % | | 16.2 | % |
| | | | | |
| Non-deductible warrant expense | 1.1 | % | | 0.6 | % | | 30.6 | % |
| | | | | |
| Federal tax credits | 4.3 | % | | 3.8 | % | | (1.7 | %) |
| Share-based compensation | (0.4 | %) | | (3.3 | %) | | (3.5 | %) |
| Impact of changes in valuation allowance | (28.7 | %) | | (26.6 | %) | | (62.4 | %) |
| Uncertain position | (2.1 | %) | | (1.9 | %) | | — | % |
| Rate change | (0.1 | %) | | 1.2 | % | | — | % |
| Other | (0.5 | %) | | (0.3 | %) | | (0.2 | %) |
| Effective tax rate | 0.6 | % | | 0.3 | % | | — | % |
ENOVIX CORPORATION
NOTES TO THE CONSOLIDATED FINANCIAL STATEMENTS (Continued)
The following table shows the components of deferred tax assets (liabilities) as of December 29, 2024 and December 31, 2023.
| | | | | | | | | | | |
| December 29, 2024 | | December 31,
2023 |
| Gross deferred tax assets: | | | |
| | | |
| | | |
| | | |
| | | |
| | | |
| Capitalized research and experimental expenses | 42,300 | | | 24,031 | |
| Credit carryovers | 16,141 | | | 11,149 | |
| Net operating losses | 164,279 | | | 112,707 | |
| | | |
| | | |
| Other | 8,396 | | | 17,678 | |
| Total gross deferred tax assets | 231,116 | | | 165,565 | |
| Valuation allowance | (228,473) | | | (164,207) | |
| Total deferred tax assets, net of valuation allowance | 2,643 | | | 1,358 | |
| Deferred tax liabilities: | | | |
| Intangible assets | (9,585) | | | (10,091) | |
| | | |
| | | |
| Right-of-use asset | (1,445) | | | (1,625) | |
| Other | (397) | | | (445) | |
| Total deferred tax liabilities | (11,427) | | | (12,161) | |
| Net deferred tax liabilities | $ | (8,784) | | | $ | (10,803) | |
As of December 29, 2024, we had $703.7 million of state loss carryovers, $541.4 million of federal loss carryovers, and $5.4 million of foreign loss carryovers that could be utilized to reduce the tax liabilities of future years. The tax-effected loss carryovers were $62.2 million for state before federal effect, $113.7 million for federal and $1.4 million for foreign as of December 29, 2024. We also had $16.8 million of state research and development (“R&D”) tax credit carryovers, $18.0 million of federal R&D tax credit carryovers and $0.5 million of foreign R&D tax credit carryovers as of December 29, 2024.
The state losses expire between 2028 and 2044. Approximately $127.9 million of the federal losses expire between 2026 and 2037 and $413.6 million of the remainder do not expire. The foreign losses expire between 2037 and 2039. The federal credit carryovers expire between 2027 and 2044. The state credit carryovers do not expire. The foreign credit carryovers expire by 2030. Utilization of net operating losses and tax credit carryforwards are subject to certain limitations under Sections 382 and 383 of the Internal Revenue Code of 1986, as amended, due to historical changes in our ownership, as defined in current income tax regulations. A portion of the carryforwards will expire before being applied to reduce future income tax liabilities.
Valuation allowances are recorded when necessary to reduce deferred tax assets to the amount expected to be realized. Significant judgement is required in determining any valuation allowance recorded against deferred tax assets. In assessing the need for a valuation allowance, we consider all available evidence, including past operating results, estimates of future taxable income, and the feasibility of tax planning strategies. In the event we change our determination as to the amount of deferred tax assets that can be realized, we will adjust the valuation allowance with a corresponding impact to the provision for income taxes in the period in which such determination is made.
As of December 29, 2024, we recognized a full valuation allowance against the U.S. federal and state net deferred tax assets, including operating loss carryovers and credit carryovers. We evaluated the realizability of the net deferred tax assets based on all available evidence, both positive and negative, which existed as of December 29, 2024. Our conclusion to maintain a full valuation allowance against the U.S. federal and state net deferred tax assets was based upon the assessment of our ability to generate sufficient future taxable income in future periods. The following table presents the valuation allowance activities for fiscal years 2024, 2023 and 2022 (in thousands).
ENOVIX CORPORATION
NOTES TO THE CONSOLIDATED FINANCIAL STATEMENTS (Continued)
| | | | | | | | | | | | | | | | | |
| Fiscal Years |
| 2024 | | 2023 | | 2022 |
| Balance at beginning of fiscal year | $ | 164,207 | | | $ | 107,057 | | | $ | 74,824 | |
| Additions | 65,565 | | | 57,150 | | | 32,233 | |
| Deductions | (1,299) | | | — | | | — | |
| Balance at end of fiscal year | $ | 228,473 | | | $ | 164,207 | | | $ | 107,057 | |
The following table summarizes the activities related to unrecognized tax benefits for the fiscal years 2024, 2023 and 2022 (in thousands).
| | | | | | | | | | | | | | | | | |
| Fiscal Years |
| 2024 | | 2023 | | 2022 |
| Balance at beginning of fiscal year | $ | 12,163 | | | $ | 4,428 | | | $ | 5,048 | |
| Increases related to current year tax positions | 5,187 | | | 4,543 | | | 549 | |
| Increases related to the prior year tax positions | 63 | | | 3,192 | | | 12 | |
| Decreases related to prior year tax positions | — | | | — | | | (1,181) | |
| Balance at end of fiscal year | $ | 17,413 | | | $ | 12,163 | | | $ | 4,428 | |
As of December 29, 2024 and December 31, 2023, none of the amounts of unrecognized tax benefits would favorably affect the effective income tax rate in future periods if recognized, since the tax benefits would increase a deferred tax asset that is currently offset by a full valuation allowance.
As of December 29, 2024, we have not identified any unrecognized that benefits where it is reasonably possible that we will recognize a decrease within the next 12 months. If we do recognize such a decrease, the net impact on the Consolidated Statement of Operations would not be material.
For the fiscal years 2024, 2023 and 2022, no interest expense was recognized relating to income tax liabilities. There were no accrued interest or penalties related to income tax liabilities as of December 29, 2024 and December 31, 2023.
We file income tax returns in the U.S. federal jurisdiction and in the California and Florida state jurisdiction. In the normal course of business, we are subject to examination by taxing authorities in the U.S. We are also subject to income taxes in several foreign jurisdictions. We are not currently under examination by any taxing authority.
As of December 29, 2024, we maintain our prior indefinite reinvestment assertion on undistributed earnings related to foreign subsidiaries. Accordingly, no deferred taxes have been provided for withholding taxes or other taxes that would result upon repatriation as those earnings continue to be indefinitely reinvested. If the earnings were to be distributed, the tax liability associated with these indefinitely reinvested earnings would be immaterial. It is not practicable to estimate the additional income taxes related to indefinitely reinvested income.
Note 18. Segment and Geographic Information
We operate as a single operating segment based upon the information used by the CODM in evaluating the performance of our business and allocating resources and capital.
Long-lived assets
The following table summarizes the long-lived assets by geographic areas, which consisted of property and equipment and operating lease right-of-use assets (in thousands).
ENOVIX CORPORATION
NOTES TO THE CONSOLIDATED FINANCIAL STATEMENTS (Continued)
| | | | | | | | | | | |
| December 29, 2024 | | December 31,
2023 |
| United States | $ | 16,062 | | | $ | 119,685 | |
| Malaysia | 124,666 | | | 19,903 | |
| South Korea | 25,827 | | | 26,859 | |
| Other | 1,392 | | | 24 | |
| Total property and equipment, net | $ | 167,947 | | | $ | 166,471 | |
| | | | | | | | | | | |
| December 29, 2024 | | December 31,
2023 |
| United States | $ | 5,114 | | | $ | 5,760 | |
| Malaysia | 6,880 | | | 7,794 | |
| India | 1,433 | | | 1,681 | |
| Other | 52 | | | 55 | |
| Total operating lease, right-of-use assets | $ | 13,479 | | | $ | 15,290 | |
Disaggregated revenues
Our revenues are from our external customers and our revenue consists of Product Revenue and Service Revenue, which are summarized in the following table (in thousands). | | | | | | | | | | | | | | | | | |
| Fiscal years |
| 2024 | | 2023 | | 2022 |
| Product Revenue | $ | 23,074 | | | $ | 7,644 | | | $ | 45 | |
| Service Revenue | — | | | — | | | 6,157 | |
| Total revenues | $ | 23,074 | | | $ | 7,644 | | | $ | 6,202 | |
The following table summarizes the revenues by geographic areas based on the billing location of the customers (in thousands).
| | | | | | | | | | | | | | | | | |
| Fiscal years |
| 2024 | | 2023 | | 2022 |
| South Korea | $ | 12,899 | | | $ | 5,863 | | | $ | 10 | |
| Switzerland | 4,776 | | | — | | | — | |
| Norway | 2,364 | | | — | | | — | |
| United States | 889 | | | 473 | | | 6,170 | |
| Taiwan | 889 | | | 193 | | | — | |
| Other | 1,257 | | | 1,115 | | | 22 | |
| Total revenues | $ | 23,074 | | | $ | 7,644 | | | $ | 6,202 | |
| | | | | |
Note 19. Employee Retirement Plans
We have employee retirement plans at our U.S. and international locations. The followings are our plans.
401(k) Savings Plan for U.S. Employees
We have a defined contribution savings plan under Section 401(k) of the Internal Revenue Code and the plan allows participants to defer a portion of their annual compensation on a pre-tax basis. We have an employer contribution
ENOVIX CORPORATION
NOTES TO THE CONSOLIDATED FINANCIAL STATEMENTS (Continued)
program in place. For the fiscal years 2024, 2023 and 2022, our employer contributions were $0.8 million, $1.6 million and $1.3 million, respectively.
Other Retirement Plans
We have defined contribution plans for employees at international locations and make employer contributions to these defined contribution plans at a percentage of the employee’s compensation as defined in these plans. For the fiscal year 2024, our employer contributions to these plans were $1.0 million. For fiscal year 2023, our employer contributions to these plans were immaterial.
Note 20. Related Party
Affiliate Notes
On April 20, 2023, we issued $172.5 million aggregate principal amount of Convertible Senior Notes, which included $10.0 million principal amount of the Affiliate Notes that were issued to an entity affiliated with Thurman John Rodgers, Chairman of our Board of Directors, in a concurrent private placement. The Affiliate Notes were recorded in Long-term debt, net on the Consolidated Balance Sheets. For the fiscal years 2024 and 2023, we recorded $0.3 million and $0.2 million, respectively, of interest expense related to the Affiliate Notes in the Consolidated Statements of Operations. See Note 9 “Borrowings” for more information.
Employment Relationship
As of December 29, 2024, we employed one family member of our CEO, who assists with sales in North America.
Affiliate Pledge of Common Stock
In November 2023, Thurman John Rodgers, Chairman of our Board of Directors, pledged his ownership of our common stock under his name and his living trusts as a security collateral to his investment account. As of December 29, 2024 and December 31, 2023, Mr. Rodgers held approximately 21.7 million shares of our common stock at each period, which accounted for approximately 11% and 13% of total outstanding shares of our common stock, respectively.
Item 9. Changes in and Disagreements with Accountants on Accounting and Financial Disclosure
None.
Item 9A. Controls and Procedures.
Evaluation of Disclosure Controls and Procedures
We carried out an evaluation, under the supervision and with the participation of our management, including our Chief Executive Officer (who for the period covered by this report is serving as our principal executive officer and our principal financial officer) and our Chief Accounting Officer, of the effectiveness of our “disclosure controls and procedures” (as defined in Rules 13a-15(b) and 15d-15(b) under the Exchange Act) as of the end of the period covered by this report.
Based on the evaluation as described above, our Chief Executive Officer (who for the period covered by this report is serving as our principal executive officer and our principal financial officer) and our Chief Accounting Officer concluded that our disclosure controls and procedures were effective and designed to provide reasonable assurance that the information required to be disclosed is recorded, processed, summarized and reported within the time periods specified in the SEC’s rules and forms as of December 29, 2024. For the purpose of this review, disclosure controls and procedures means controls and procedures designed to ensure that information required to be disclosed by us in the reports that we file or submit is recorded, processed, summarized and reported within the time periods specified in the SEC’s rules and forms. These disclosure controls and procedures include, without limitation, controls and procedures designed to ensure that information required to be disclosed by us in the reports that we file or submit is accumulated and communicated to management, including our Chief Executive Officer (who for the period covered by this report is serving as our principal executive officer and our principal financial officer) and Principal Accounting Officer, as appropriate to allow timely decisions regarding required disclosure. In designing and evaluating the disclosure controls and procedures, our management recognized that any controls and procedures, no matter how well designed and operated, can provide only reasonable assurance of achieving the desired control objectives, and our management necessarily was required to apply judgment in evaluating the cost-benefit relationship of possible controls and procedures.
Management’s Report on Internal Control Over Financial Reporting
Management is responsible for establishing and maintaining adequate internal control over financial reporting in providing reasonable assurance regarding the reliability of financial reporting and the preparation of financial statements for external purposes in accordance with generally accepted accounting principles, as defined in Rule 13a-15(f) of the Exchange Act.
Management has assessed the effectiveness of our internal control over financial reporting as of December 29, 2024 based on criteria set forth in Internal Control - Integrated Framework issued by the Committee of Sponsoring Organizations of the Treadway Commission (2013). As a result of this assessment, management concluded that, as of December 29, 2024, our internal control over financial reporting was effective. Our independent registered public accounting firm, Deloitte & Touche LLP, has issued an attestation report on our internal control over financial reporting, which appears in Part II, Item 8 of this Annual Report on Form 10-K.
Changes in Internal Control over Financial Reporting
We completed the integration of Routejade, which was acquired in the fiscal year 2023, into our operations, compliance programs and internal control processes. Other than the integration of Routejade into our internal control over financial reporting, there were no changes in our internal controls over financial reporting that occurred during the most recent fiscal year ended December 29, 2024, that materially affected, or are reasonably likely to materially affect, our internal control over financial reporting.
Inherent Limitations on Effectiveness of Controls
Our management, including our Chief Executive Officer (who for the period covered by this report is serving as our principal executive officer and our principal financial officer) and Chief Accounting Officer, does not expect that our disclosure controls and procedures or our internal controls, will prevent all error and all fraud. A control system, no matter how well conceived and operated, can provide only reasonable, not absolute, assurance that the objectives of the control system are met. Further, the design of a control system must reflect the fact that there are resource constraints,
and the benefits of controls must be considered relative to their costs. Because of the inherent limitations in all control systems, no evaluation of controls can provide absolute assurance that all control issues and instances of fraud, if any, within the Company have been detected.
Item 9B. Other Information
Insider Trading Arrangements
During the quarter ended December 29, 2024, the following directors and officers (as defined in Rule 16a-1(f) under the Exchange Act) adopted a “Rule 10b5-1 trading arrangement” as defined in Item 408(a) of Regulation S-K, as follows:
On November 8, 2024, Dr. Raj Talluri, Chief Executive Officer and a member of our board of directors, adopted a Rule 10b5-1 trading arrangement providing for the sale from time to time of an aggregate of up to 300,000 shares of our common stock, all of which are prior vested restricted stock units (“RSUs”). The trading arrangement is intended to satisfy the affirmative defense in Rule 10b5-1(c). The duration of the trading arrangement is until February 6, 2026, or earlier if all transactions under the trading arrangement are completed.
No other directors or officers, as defined in Rule 16a-1(f), adopted or terminated a “Rule 10b5-1 trading arrangement” or a “non-Rule 10b5-1 trading arrangement,” as defined in Item 408(a) of Regulation S-K, during the last fiscal quarter ended December 29, 2024.
Appointment of Principal Financial Officer
On February 21, 2025, our board of directors appointed Dr. Raj Talluri, our Chief Executive Officer and a member of our board of directors, as the Company’s principal financial officer, effective as of the same date. Dr. Talluri will hold such position as the Company continues its formal search process for the Chief Financial Officer position.
Dr. Talluri has served as the Company’s Chief Executive Officer and as a member of our board of directors since January 2023. Additional information relating to Dr. Talluri’s business experience during the past five years is included under “Proposal No. 1 - Election of Directors - Director Nominees” in the Proxy Statement for our 2024 Annual Meeting filed with the SEC on April 29, 2024 (the “2024 Proxy Statement”). Information relating to material plans, contracts or arrangements to which Dr. Talluri is a party or participates in are also described in the 2024 Proxy Statement under “Executive Compensation” and “Certain Relationships and Related Party Transactions.”
As further detailed in the 2024 Proxy Statement under “Certain Relationships and Related Party Transactions - Employment Relationships,” the Company employs one family member of Dr. Talluri, who assists with sales in North America.
Item 9C. Disclosure Regarding Foreign Jurisdictions that Prevent Inspections
Not applicable
PART III
Item 10. Directors, Executive Officers and Corporate Governance
The information required by this item will be included under the captions “Proposal No. 1 - Election of Directors,” “Information Regarding Executive Officers,” “Information Regarding the Board of Directors and Corporate Governance” and “Delinquent Section 16(a) Reports” in our 2025 Proxy Statement for the 2025 Annual Meeting of Stockholders (the “2025 Proxy Statement”) to be filed with the SEC within 120 days of the fiscal year ended December 29, 2024 and is incorporated herein by reference.
Code of Conduct
We have a written code of business conduct and ethics (referred to as “Code of Conduct”) that applies to all executive officers, directors and employees. Our Code of Conduct is available on our website at https://ir.enovix.com/corporate-governance/governance-highlights. If we grant any waiver from a provision of the Code of Conduct to any executive officer or director, we will disclose it on our website.
Insider Trading Policy
We have adopted an Insider Trading Policy governing the purchase, sale and/or other dispositions of our securities by our directors, officers and employees. A copy of this policy is filed as an exhibit to this Annual Report on Form 10-K. The information required regarding our insider trading policies and procedures is incorporated by reference from the information contained in the section entitled “Insider Trading Policy” in our Proxy Statement.
Item 11. Executive Compensation
The information required by this item will be included under the captions “Director Compensation” and “Executive Compensation” in the 2025 Proxy Statement and is incorporated herein by reference (other than the information required by Item 402(v) of Regulation S-K, which is not incorporated by reference herein).
Item 12. Security Ownership of Certain Beneficial Owners and Management and Related Stockholder Matters
The information required by this item will be included under the caption “Security Ownership of Certain Beneficial Owners and Management” in the 2025 Proxy Statement and is incorporated herein by reference.
Item 13. Certain Relationship and Related Transactions, and Director Independence
The information required by this item will be included under the caption “Certain Relationships and Related Party Transactions” and “Information Regarding the Board of Directors and Corporate Governance” in the 2025 Proxy Statement and is incorporated herein by reference.
Item 14. Principal Accountant Fees and Services
The information required by this item will be included under the caption “Principal Accountant Fees and Services” in the 2025 Proxy Statement and is incorporated herein by reference.
PART IV
Item 15. Exhibits, Financial Statement Schedules
(a)The following are filed with this Annual Report on Form 10-K:
1.Financial Statements: See Index to consolidated financial statements in Part II, Item 8 of this Annual Report on Form 10-K.
2.Financial Statement Schedules: All financial statement schedules have been omitted because they are not required, not applicable or the required information is otherwise included.
3.Exhibits: The exhibits listed below are filed as part of this Annual Report on Form 10-K or incorporated herein by reference, in each case as indicated below.
| | | | | | | | | | | | | | | | | | | | | | | | | | | | | | | | | | | | | | |
Exhibit Number | | Description | | Incorporated by Reference | | Filed Herewith |
| | Schedule/Form | | File No. | | Exhibit | | Filing Date | |
| 2.1+ | | | | 8-K | | 001-39753 | | 2.1 | | February 22, 2021 | | |
| 3.1 | | | | 8-K | | 001-39753 | | 3.1 | | July 19, 2021 | | |
| 3.2 | | | | 8-K | | 001-39753 | | 3.2 | | July 19, 2021 | | |
| 4.1 | | | | S-4/A | | 333-253976 | | 4.5 | | June 21, 2021 | | |
| 4.2 | | | | S-1/A | | 333-250042 | | 4.3 | | November 25, 2020 | | |
| 4.3 | | | | 8-K | | 001-39753 | | 4.3 | | July 19, 2021 | | |
| 4.4 | | | | 10-K | | 001-39753 | | 4.4 | | March 25, 2022 | | |
| 4.5 | | | | 8-K | | 001-39753 | | 4.1 | | April 21, 2023 | | |
| 4.6 | | | | 8-K | | 001-39793 | | 4.1 | | April 21, 2023 | | |
| 10.1 | | | | 8-K | | 001-39753 | | 10.1 | | April 21, 2023 | | |
| 10.2# | | | | 8-K | | 001-39753 | | 10.2 | | July 19, 2021 | | |
| 10.3# | | | | S-4/A | | 333-253976 | | 10.11 | | May 10, 2021 | | |
| 10.4# | | | | S-4/A | | 333-253976 | | 10.12 | | May 10, 2021 | | |
| 10.5#+ | | | | 10-K | | 001-39753 | | 10.04 | | March 1, 2023 | | |
| | | | | | | | | | | | | | | | | | | | | | | | | | | | | | | | | | | | | | |
Exhibit Number | | Description | | Incorporated by Reference | | Filed Herewith |
| | Schedule/Form | | File No. | | Exhibit | | Filing Date | |
| 10.6# | | | | 10-Q | | 001-39753 | | 10.1 | | August 16, 2022 | | |
| 10.7# | | | | 8-K | | 001-39753 | | 10.5 | | July 19, 2021 | | |
| 10.8# | | | | S-4/A | | 333-253976 | | 10.6 | | May 10, 2021 | | |
| 10.9# | | | | S-4/A | | 333-253976 | | 10.7 | | May 10, 2021 | | |
| 10.10# | | | | S-4/A | | 333-253976 | | 10.8 | | May 10, 2021 | | |
| 10.11# | | | | S-4/A | | 333-253976 | | 10.9 | | May 10, 2021 | | |
| 10.12#+ | | | | 10-Q | | 001-39753 | | 10.6 | | May 5, 2023 | | |
| 10.13# | | | | 10-Q | | 001-39753 | | 10.7 | | May 5, 2023 | | |
| 10.14#+ | | | | 10-Q | | 001-39753 | | 10.2 | | May 7, 2024 | | |
| 10.15 | | | | S-4/A | | 333-253976 | | 10.21 | | May 10, 2021 | | |
| 10.16 | | | | S-4/A | | 333-253976 | | 10.22 | | May 10, 2021 | | |
| 10.17 | | | | S-4/A | | 333-253976 | | 10.23 | | May 10, 2021 | | |
| 10.18# | | | | 8-K | | 001-39753 | | 10.19 | | July 19, 2021 | | |
| 10.19# | | | | 10-Q | | 001-39753 | | 10.1 | | May 7, 2024 | | |
| 10.20# | | | | 10-K | | 001-39753 | | 10.29 | | March 1, 2023 | | |
| 10.21# | | | | 10-K | | 001-39753 | | 10.30 | | March 1, 2023 | | |
| 10.22# | | | | 10-Q | | 001-39753 | | 10.5 | | May 5, 2023 | | |
| 10.23# | | | | 10-Q | | 001-39753 | | 10.4 | | August 9, 2023 | | |
| 10.24† | | | | 10-Q | | 001-39753 | | 10.1 | | August 9, 2023 | | |
| | | | | | | | | | | | | | | | | | | | | | | | | | | | | | | | | | | | | | |
Exhibit Number | | Description | | Incorporated by Reference | | Filed Herewith |
| | Schedule/Form | | File No. | | Exhibit | | Filing Date | |
| 10.25† | | | | 10-Q | | 001-39753 | | 10.1 | | October 30, 2024 | | |
| 10.26† | | | | 10-Q | | 001-39753 | | 10.2 | | November 9, 2023 | | |
| 19.1+ | | | | | | | | | | | | X |
| 21.1 | | | | | | | | | | | | X |
| 23.1 | | | | | | | | | | | | X |
| 24.1 | | | | | | | | | | | | X |
| 31.1 | | | | | | | | | | | | X |
| 32.1* | | | | | | | | | | | | X |
| 97.1 | | | | 10-K | | 001-39753 | | 97.1 | | February 29, 2024 | | |
| 101.INS | | Inline XBRL Instance Document | | | | | | | | | | X |
| 101.SCH | | Inline XBRL Taxonomy Extension Schema Document | | | | | | | | | | X |
| 101.CAL | | Inline XBRL Taxonomy Extension Calculation Linkbase Document | | | | | | | | | | X |
| 101.DEF | | Inline XBRL Taxonomy Extension Definition Linkbase Document | | | | | | | | | | X |
| 101.LAB | | Inline XBRL Taxonomy Extension Label Linkbase Document | | | | | | | | | | X |
| 101.PRE | | Inline XBRL Taxonomy Extension Presentation Linkbase Document | | | | | | | | | | X |
| 104 | | Cover Page Interactive Data File (formatted as Inline XBRL and contained in Exhibits 101) | | | | | | | | | | |
+ Certain of the exhibits and schedules to this exhibit have been omitted in accordance with Regulation S-K Item 601. The Registrant agrees to furnish a copy of all omitted exhibits and schedules to the SEC upon its request.
# Indicates a management contract or compensatory plan, contract or arrangement.
† Portions of this exhibit, as marked by asterisks, have been omitted in accordance with Regulation S-K Item 601.
* These certifications are furnished to the SEC pursuant to Section 906 of the Sarbanes-Oxley Act of 2002 and are not deemed filed with the SEC for purposes of Section 18 of the Securities Exchange Act of 1934, as amended, nor shall they be deemed incorporated by reference in any filing under the Securities Act of 1933, as amended, except as shall be expressly set forth by specific reference in such filing.
Item 16. Form 10-K Summary
None.
SIGNATURES
Pursuant to the requirements of Section 13 or 15(d) the Securities Exchange Act of 1934, the Registrant has duly caused this report to be signed on its behalf by the undersigned, thereunto duly authorized.
| | | | | | | | |
| Dated: February 25, 2025 | ENOVIX CORPORATION |
| | |
| By: | /s/ Raj Talluri |
| | Raj Talluri |
| | President and Chief Executive Officer (Principal Executive Officer and Principal Financial Officer) |
POWER OF ATTORNEY
KNOW ALL PERSONS BY THESE PRESENTS, that each person whose signature appears below hereby constitutes and appoints Dr. Raj Talluri and Kristina Truong, and each of them, as their true and lawful attorneys-in-fact and agents, each with full power of substitution and resubstitution, for them and in their name, place and stead, in any and all capacities, to sign any and all amendments to this Annual Report on Form 10-K, and to file the same, with exhibits thereto and other documents in connection therewith, with the Securities and Exchange Commission, granting unto said attorneys-in-fact and agents, and each of them, full power and authority to do and perform each and every act and thing requisite and necessary to be done in connection therewith, as fully for all intents and purposes as they might or could do in person, hereby ratifying and confirming all that each of said attorneys-in-fact and agents, or any of them, or their substitute or substitutes, may lawfully do or cause to be done by virtue hereof.
Pursuant to the requirements of the Securities Exchange Act of 1934, this report has been signed below by the following persons on behalf of the Registrant and in the capacities and on the dates indicated.
| | | | | | | | | | | | | | | | | |
| Name | | Title | | Date |
| | | | | |
| /s/ | Raj Talluri | | President and Chief Executive Officer and Director | | February 25, 2025 |
| Raj Talluri | | (Principal Executive Officer and Principal Financial Officer) | | |
| | | | | |
| /s/ | Kristina Truong | | Chief Accounting Officer | | February 25, 2025 |
| Kristina Truong | | (Principal Accounting Officer) | | |
| | | | | |
| /s/ | Thurman John Rodgers | | Chairman of the Board of Directors | | February 25, 2025 |
| Thurman John Rodgers | | | | |
| | | | | |
| /s/ | Betsy Atkins | | Director | | February 25, 2025 |
| Betsy Atkins | | | | |
| | | | | |
| /s/ | Pegah Ebrahimi | | Director | | February 25, 2025 |
| Pegah Ebrahimi | | | | |
| | | | | |
| /s/ | Bernard Gutmann | | Director | | February 25, 2025 |
| Bernard Gutmann | | | | |
| | | | | |
| /s/ | Joseph Malchow | | Director | | February 25, 2025 |
| Joseph Malchow | | | | |
| | | | | |
| /s/ | Gregory Reichow | | Director | | February 25, 2025 |
| Gregory Reichow | | | | |