UNITED STATES
SECURITIES AND EXCHANGE COMMISSION
Washington, D.C. 20549
FORM 10-K
(Mark One) | | | | | |
| ☒ | ANNUAL REPORT PURSUANT TO SECTION 13 OR 15(d) OF THE SECURITIES EXCHANGE ACT OF 1934 |
For the fiscal year ended December 28, 2024
OR
| | | | | |
| ☐ | TRANSITION REPORT PURSUANT TO SECTION 13 OR 15(d) OF THE SECURITIES EXCHANGE ACT OF 1934 |
For the transition period from _________ to _________
Commission file number 001-40456
JANUS INTERNATIONAL GROUP, INC.
(Exact Name of Registrant as Specified In Its Charter) | | | | | |
| Delaware | 86-1476200 |
(State or other jurisdiction of incorporation or organization) | (I.R.S. Employer Identification No.) |
135 Janus International Blvd. Temple, GA | 30179 |
| (Address of Principal Executive Offices) | (Zip Code) |
(866) 562-2580
(Registrant’s telephone number, including area code)
Securities registered pursuant to Section 12(b) of the Act:
| | | | | | | | |
| Title of each class | Trading Symbol(s) | Name of each exchange on which registered |
| Common Stock, par value $0.0001 per share | JBI
| New York Stock Exchange
|
Securities registered pursuant to section 12(g) of the Act: None
Indicate by check mark if the registrant is a well-known seasoned issuer, as defined in Rule 405 of the Securities Act. Yes ☒ No ☐
Indicate by check mark if the registrant is not required to file reports pursuant to Section 13 or Section 15(d) of the Act. Yes ☐ No ☒
Indicate by check mark whether the registrant: (1) has filed all reports required to be filed by Section 13 or 15(d) of the Securities Exchange Act of 1934 during the preceding 12 months (or for such shorter period that the registrant was required to file such reports); and (2) has been subject to such filing requirements for the past 90 days. Yes ☒ No ☐
Indicate by check mark whether the registrant has submitted electronically every Interactive Data File required to be submitted pursuant to Rule 405 of Regulation S-T (§232.405 of this chapter) during the preceding 12 months (or for such shorter period that the registrant was required to submit and post such files). Yes ☒ No ☐
Indicate by check mark whether the registrant is a large accelerated filer, an accelerated filer, a non-accelerated filer, a smaller reporting company, or an emerging growth company. See the definitions of “large accelerated filer,” “accelerated filer,” “smaller reporting company,” and “emerging growth company” in Rule 12b-2 of the Exchange Act.
| | | | | | | | | | | |
| Large accelerated filer | ☒ | Accelerated filer | ☐ |
| Non-accelerated filer | ☐ | Smaller reporting company | ☐ |
| | Emerging growth company | ☐ |
If an emerging growth company, indicate by check mark if the registrant has elected not to use the extended transition period for complying with any new or revised financial accounting standards provided pursuant to Section 13(a) of the Exchange Act. ☐
Indicate by check mark whether the registrant has filed a report on and attestation to its management’s assessment of the effectiveness of its internal control over financial reporting under Section 404(b) of the Sarbanes-Oxley Act (15 U.S.C. 7262(b)) by the registered public accounting firm that prepared or issued its audit report. ☒
If securities are registered pursuant to Section 12(b) of the Act, indicate by check mark whether the financial statements of the registrant included in the filing reflect the correction of an error to previously issued financial statements. ☐
Indicate by check mark whether any of those error corrections are restatements that required a recovery analysis of incentive-based compensation received by any of the registrant’s executive officers during the relevant recovery period pursuant to §240.10D-1(b). ☐
Indicate by check mark whether the registrant is a shell company (as defined in Rule 12b-2 of the Act). Yes ☐ No ☒
The aggregate market value of voting and non-voting common equity held by non-affiliates of the Registrant on June 28, 2024 (the last business day of the Registrant’s most recently completed second quarter), based on the closing price of $12.63 for shares of the Registrant’s common stock, par value $0.0001, as reported by the New York Stock Exchange, was approximately $1,765.2 million.
As of February 21, 2025, 140,310,733 shares of the Registrant’s common stock were issued and outstanding.
DOCUMENTS INCORPORATED BY REFERENCE
Portions of the Registrant’s Definitive Proxy Statement (the “Proxy Statement”) relating to its 2025 Annual Meeting of Stockholders are incorporated by reference into Part III, Items 10-14 of this Annual Report on Form 10-K where indicated, or such information will be included in an amendment to this Annual Report on Form 10-K in accordance with Instruction G(3) of Form 10-K. Except with respect to information specifically incorporated by reference herein, the Proxy Statement is not deemed to be filed as part hereof.
Table of Contents
| | | | | |
| |
| Page |
| SAFE HARBOR, FORWARD-LOOKING STATEMENTS | |
| SUMMARY RISK FACTORS | |
| |
| |
| |
| |
| |
| |
| |
| |
| |
| |
| |
| |
| |
| |
| |
| |
| |
| |
| |
| |
| |
| |
| |
| |
| |
| |
| |
| |
CAUTIONARY NOTE REGARDING FORWARD-LOOKING STATEMENTS
Statements contained in this Annual Report on Form 10-K (this “Annual Report”) that reflect our current views with respect to future events and financial performance, business strategies, expectations for our business and any other statements of a future or forward-looking nature, constitute “forward-looking statements” within the meaning of Section 27A of the Securities Act of 1933, as amended (the “Securities Act”), and Section 21E of the Securities Exchange Act of 1934, as amended (the “Exchange Act”).
These forward-looking statements include, but are not limited to, statements about our financial condition, results of operations, earnings outlook and prospects or regarding our or our management’s expectations, beliefs, intentions or strategies regarding the future, including our expectations regarding our revenues, cost of revenues, operating expenses, other operating results, and other key metrics, and our ability to meet previously announced earnings guidance with respect to the Company and/or its segments. These forward-looking statements involve risks and uncertainties that could cause our actual results to differ materially from those contemplated in the forward-looking statements, including, without limitation, the risks set forth in Part I, Item 1A, “Risk Factors” in this Annual Report and in our other filings with the Securities and Exchange Commission. We do not assume any obligation to update any forward-looking statements after the date of this Annual Report, except as required by law.
In addition, any statements that refer to projections, forecasts, or other characterizations of future events or circumstances, including any underlying assumptions, are forward-looking statements. Forward-looking statements are typically identified by words such as “plan,” “believe,” “expect,” “anticipate,” “intend,” “outlook,” “estimate,” “forecast,” “project,” “continue,” “could,” “may,” “might,” “possible,” “potential,” “predict,” “should,” “would” and other similar words and expressions, but the absence of these words does not mean that a statement is not forward-looking.
The forward-looking statements contained in this Annual Report are based on our current expectations and beliefs concerning future developments and their potential effects on us. We cannot assure you that future developments affecting us will be those that we have anticipated. These forward-looking statements involve a number of risks, uncertainties (some of which are beyond our control) or other assumptions that may cause actual results or performance to be materially different from those expressed or implied by these forward-looking statements. Should one or more of these risks or uncertainties materialize, or should any of our assumptions prove incorrect, actual results may vary in material respects from those projected in these forward-looking statements. Some factors that could cause actual results to differ include, but are not limited to:
•changes adversely affecting the business in which we are engaged;
•geopolitical risks and changes in applicable laws or regulations;
•the possibility that Janus may be adversely affected by other economic, business, and/or competitive factors;
•operational risk;
•any failure to effectively manage, and receive anticipated returns from, acquisitions, divestitures, investments, joint
ventures and other portfolio actions;
•fluctuations in the demand for our products and services;
•the impact of supply chain disruptions and inflation and our ability to recoup rising costs in the rates we charge to our
customers;
•the possibility that we may impair our long-lived assets and other assets, including inventory, property, plant, and equipment, intangibles, and investments in unconsolidated affiliates;
•our ability to maintain the listing of our securities on a national securities exchange;
•the possibility of significant changes in foreign exchange rates and controls;
•litigation and regulatory enforcement risks, including the diversion of management’s time and attention and the additional
costs and demands on Janus’s resources;
•general economic conditions, including the capital and credit markets, and adverse macroeconomic conditions, including unemployment, inflation, fluctuating interest rates, changes in consumer practices, and regional or global liquidity constraints;
•the possibility of political instability, war, or acts of terrorism in any of the countries where we operate; and
•other risks and uncertainties, including those described in this Annual Report set forth in Part I, Item 1A, “Risk Factors.”
All subsequent written and oral forward-looking statements concerning the matters addressed in this Annual Report and attributable to us or any person acting on our behalf are expressly qualified in their entirety by the cautionary statements contained or referred to in this Annual Report. Except to the extent required by applicable law or regulation, we undertake no obligation to update these forward-looking statements to reflect events or circumstances after the date of this Annual Report or to reflect the occurrence of unanticipated events.
SUMMARY RISK FACTORS
Set forth below is a summary of certain risks that could adversely affect our business, results of operations, and financial condition, all of which are more fully described in Item 1A. “Risk Factors” in this Annual Report on Form 10-K. This summary should be read in conjunction with the “Risk Factors” section and should not be relied upon as an exhaustive summary of the material risks facing our business, as it does not address all of the risks that we face.
Risks Related to Our Business
•Our continued success is dependent upon our ability to hire, retain, and utilize qualified personnel.
•We engage in a highly competitive business. If we are unable to compete effectively, we could lose market share and our business and results of operations could be negatively impacted.
•Our business strategy relies in part on acquisitions to sustain our growth. Acquisitions of other companies present certain risks and uncertainties, including the successful integration and development of acquired businesses and our ability to retain key employees of acquired businesses, which could have a material adverse effect on our financial results.
•Our dependence on, and the price and availability of, raw materials (such as steel coil) as well as purchased components may adversely affect our business, results of operations, and financial condition.
•Our use of hedging arrangements may adversely affect our future operating results or liquidity.
•The outcome of pending and future claims and litigation could have a material adverse impact on our business, financial condition, and results of operations.
•We may be subject to liability if we breach our contracts, and our insurance may be inadequate to cover our losses.
•We are potentially subject to taxation-related risks in multiple jurisdictions, and changes in U.S. tax laws, in particular, could have a material adverse effect on our business, cash flow, results of operations, or financial condition.
•Unanticipated changes in effective tax rates or adverse outcomes resulting from examination of our income or other tax returns could adversely affect our financial condition and results of operations.
•We may experience negative or unforeseen tax consequences.
•Fluctuations in foreign currency could have an effect on our reported results of operations.
•Any significant disruption in or unauthorized access to our computer systems or those of third parties that we utilize in our operations, including those relating to cybersecurity or arising from cyber-attacks, could result in a loss or degradation of service, unauthorized disclosure of data, including user and corporate information, or theft of intellectual property, including digital assets, which could adversely impact our financial condition or harm our reputation.
•We face system security risks as we depend upon automated processes and the Internet, and our reputation could be damaged, we could incur substantial additional costs and become subject to litigation if our systems are penetrated.
•Emerging issues related to the development and use of artificial intelligence could give rise to a legal or regulatory action, damage our reputation, or otherwise materially harm our business.
•Our ongoing development of technology products presents security and safety risks.
•Our brand is integral to our success. If we fail to effectively maintain, promote, and enhance our brand in a cost-effective manner, our business and competitive advantage may be harmed.
•Economic uncertainty or downturns, particularly as it impacts specific industries, could adversely affect our business and results of operations.
•If we are unable to develop new product or service offerings, achieve increased consumer adoption of those offerings, or penetrate new vertical markets, our business and financial results could be materially adversely affected.
•Our corporate culture has contributed to our success and if we are unable to maintain it as we grow our business, financial condition, and results of operations could be harmed.
•Our past growth may not be indicative of our future growth, and our revenue growth rate may decline in the future.
•We may require additional capital to pursue our business objectives and respond to business opportunities, challenges, or unforeseen circumstances. If capital is not available to us, our business, operating results, and financial condition may be harmed.
•We may not be able to generate sufficient cash to service our obligations and any debt we incur.
•We may not be able to adequately protect our proprietary and intellectual property rights in our data or technology.
•We may in the future be sued by third parties for various claims, including alleged infringement of proprietary intellectual property rights.
•Rising operating expenses for our customers could indirectly reduce our cash flow and funds available for future distributions.
•Certain of our customers have negotiating leverage, which may require that we agree to terms and conditions that result in increased cost of revenues, decreased revenue, and lower average selling prices and gross margins, all of which could harm our results of operations.
•Our business is subject to complex and evolving U.S. and foreign laws and regulations regarding privacy and data protection.
•Privacy concerns could result in regulatory changes that may harm our business.
•Certain environmental regulations to which we are subject creates uncertainty regarding future environmental expenditures and liabilities.
•Our manufacturing facilities are subject to unexpected equipment failures, operational interruptions, and casualty losses.
•Our business and operations are subject to risk related to climate change.
•If employees violate our policies or we fail to maintain adequate record-keeping and internal accounting practices to accurately record our transactions, we may be subject to regulatory sanctions.
•Disruptions in the worldwide economy (including inflation) may adversely affect our business, results of operations, and financial condition.
•Changes in trade policies, including the imposition of tariffs, could negatively impact our business, financial condition, and results of operations.
Risks Related to Ownership of our Common Stock
•We may be not be able to pay dividends or make distributions or obtain loans to enable us to pay any dividends on our common stock or satisfy our other financial obligations.
•Provisions in our second amended and restated certificate of incorporation and Delaware law may inhibit a takeover of us, which could limit the price investors might be willing to pay in the future for our common stock and could entrench management.
•Our second amended and restated certificate of incorporation provides, subject to limited exceptions, that the Court of Chancery of the State of Delaware is the sole and exclusive forum for certain stockholder litigation matters, which could limit stockholders’ ability to obtain a favorable judicial forum for disputes with us or our directors, officers, employees, or stockholders.
•We have and may continue to incur increased costs and obligations as a result of complying with public company requirements.
•As a public reporting company, we are subject to rules and regulations established from time to time by the Securities and Exchange Commission (“SEC”) and the New York Stock Exchange (“NYSE”) regarding our internal control over financial reporting. If we fail to establish and maintain effective internal control over financial reporting and disclosure controls and procedures, we may not be able to accurately report our financial results, or report them in a timely manner.
•We may issue additional shares of common stock or other equity securities without stockholder approval, which would dilute existing stockholders’ ownership interest in us and may depress the market price of our common stock.
•If our performance does not meet market expectations, the price of our securities may decline.
•We cannot guarantee that our share repurchase program will be fully consummated or that it will enhance stockholder value, and any share repurchases could affect the trading price of our common stock.
•Our ability to successfully operate our business depends largely upon the efforts of certain key personnel, including our executive officers. The loss of such key personnel could adversely affect the operations and profitability of our business.
•Our ability to meet expectations and projections in any research or reports published by securities or industry analysts, or a lack of coverage by securities or industry analysts, could result in a depressed market price and limited liquidity for our common stock.
•Our second amended and restated certificate of incorporation renounced any interest or expectancy that we have in corporate opportunities that may be presented to our officers, directors, or stockholders or their respective affiliates, other than those officers, directors, stockholders, or affiliates who are ours or our subsidiaries’ employees. As a result, these persons are not required to offer certain business opportunities to us and may engage in business activities that compete with us.
•Our reported financial results may be affected by changes in accounting principles generally accepted in the United States.
PART I
Item 1. BUSINESS
Overview
Janus International Group, Inc. (“we,” “us,” “Group,” “Janus” or the “Company”), headquartered in Temple, Georgia with ten domestic and three international manufacturing facilities is a leading global manufacturer, supplier, and provider of turn-key self-storage, commercial, and industrial building solutions including: roll up and swing doors, hallway systems, relocatable storage units, and facility and door automation technologies. The Company provides facility and door automation and access control technologies, roll-up and swing doors, hallway systems, and relocatable storage “MASS” (Moveable Additional Storage Structures) units (among other solutions). Janus is highly integrated with customers at every phase of a project, including facility planning/design, construction, access control, and the restoration, rebuilding, and replacement (“R3”) of self-storage facilities. The self-storage industry is comprised of institutional and non-institutional facilities. Institutional facilities typically include multi-story, climate controlled facilities located in prime locations owned and/or managed by large real estate investment trusts (“REITs”) or returns-driven operators of scale and are primarily located in the top 50 U.S. metropolitan statistical areas (“MSAs”), whereas the vast majority of non-institutional facilities are single-story, non-climate controlled facilities located outside of city centers owned and/or managed by smaller private operators that are mostly located outside of the top 50 U.S. MSAs.
Company History
Founded in 2002, Janus is a leading global manufacturer and supplier of turn-key self-storage, commercial, and industrial building solutions, including roll-up and swing doors, hallway systems, relocatable storage units, and facility and door automation technologies. Over the past 20 years, Janus has expanded its operations to serve several U.S. and international locations. Our common stock is listed and traded on the NYSE under the ticker symbol “JBI.”
Competitive Strengths
We believe the following competitive strengths have been instrumental in our growth and position the Company for continued success:
Strong Share in Growing, Well-Structured Markets. The Company serves the market for interior building solutions through both institutional REITs and non-institutional operators. REITs comprise approximately 35% of the overall self-storage market, and have grown significantly over the past decade and at a higher rate than the non-institutional market. Within the commercial industrial sector, we are a smaller participant within a larger addressable market, which provides the Company significant opportunity for market share growth within a sector that is well positioned for future growth driven by the rising growth of e-commerce. We have achieved this success within the self-storage and commercial industrial sectors by being a full solution provider to our customers, providing expertise, and a full suite of products to solve our customers’ problems.
Mission Critical Solutions for a Small Fraction of Facility Costs. Our self-storage products are typically the last items installed on site before an operator can generate income from its properties. This results in a high cost of failure for our suite of product solutions and a reliance by customers on our extensive domestic and international manufacturing and distribution networks. We focus on finding solutions to obstacles that arise long before a unit or facility is complete and customers place a premium on our efficiency, reliability, and ability to deliver. Our products also represent a small portion of the overall cost of a facility or an R3 retrofit. Our value-added services, such as site pre-work planning, site drawings, installation, project management, and third-party security, as well as our ability to differentiate ourselves from the competition through on-time delivery, efficient installation, reliable service, and a reputation for high quality products, has allowed us to gain a significant competitive advantage.
Complete Offering of Products, Solutions, and Services along with Maintenance, Fabrication, and Installation. We provide a full suite of products, services and maintenance, fabrication, and installation offerings that meet a wide-range of client demands including management of third-party installation, architect drawings, R3 solutions, self-storage doors, hallway systems, relocatable systems, electronic locks, commercial doors, self-storage maintenance and servicing, and custom facility gate fabrication and installation, all of which are realized through a large network of third-party installers, as well as our ten strategically placed manufacturing and service facilities in the United States of America. Our current manufacturing, service, and distribution footprint enables us to serve customers globally, minimize lead times, and reduce freight expense. Our ability to provide a full suite of products, services, fabrication, installation and maintenance routines across a nationwide network enables us to compete for complex, marquee contract opportunities and deliver highly customized solutions at both the global and local level.
First Mover with Proprietary High ROI Technology Solutions. The Company and Nokē, Inc. (“NOKE”) (which we acquired in 2018) have been working for several years to develop proprietary access control technologies, software, and solutions focused on the self-storage sector where limited technologies or products currently exist. We are actively selling and developing a platform with multiple adjacencies including hardware (i.e., purpose-built locks), software (i.e., applications and a web portal) and back-end integration (i.e., APIs and a cloud platform) to provide ROI improvement opportunity for our client’s new facilities and R3 retrofits. Our proprietary hardware and smart locking systems have helped businesses manage physical security and have laid the ground work for Janus to integrate an enhanced wireless network within a self-storage facility, thereby creating a segment of our business with limited competition and high barriers to entry.
Proven and Experienced Management Team. Our management team has deep industry expertise and a deep bench of supporting talent. Janus is led by our Chief Executive Officer, Ramey Jackson, who has been with the Company since 2002 and has extensive experience in the industry. Mr. Jackson is supported by an executive leadership team that also has an average of over 20 years of experience. Our management team has a long track record of demonstrating an ability to produce robust and consistent organic and inorganic growth.
Our Acquisition Strategy. Our management team has a proven track record of identifying, executing, and integrating acquisitions to support our strategic growth initiatives. In order to achieve this growth, we utilize a disciplined, highly accretive acquisition strategy that prioritizes portfolio diversification into logical adjacencies, geographic expansion, and technological innovation. We continue to actively review a number of acquisition opportunities that fit this framework.
Acquisitions
Terminal Door Asset Acquisition
On May 17, 2024, the Company, through its wholly owned subsidiary Terminal Door, LLC (“Terminal Door”) acquired 100% of the business operations (such transaction, the “T.M.C. Acquisition”) of Smith T.M.C., Inc., a Georgia corporation, Jerry O. Smith Company, LLC, a Georgia limited liability company, and J.O.S. Realty, Inc., a Georgia corporation (collectively, “T.M.C.” or the “T.M.C. Sellers”). Pursuant to the asset purchase agreement for such acquisition, Terminal Door acquired substantially all assets of the T.M.C. Sellers related to the business of trucking terminal renovation, construction, remodeling, and maintenance.
Industry Overview
Self-Storage
Approximately 69% of our total revenues are attributable to the self-storage market. The self-storage industry refers to properties that offer do-it-yourself, storage space rental for personal or business use. Self-storage provides a convenient way for individuals and businesses to store their belongings, whether due to a life event or the need for extra storage.
According to management estimates, there are more than 50,000 self-storage facilities located in the United States. Self-storage facilities can be classified into two general categories: institutional and non-institutional. Institutionally owned facilities typically include multi-story, climate-controlled facilities located in prime locations owned and/or managed by a REIT or other returns-driven operators of scale. These institutional facilities are typically located in a top 50 U.S. Metropolitan Statistical Area (“MSA”). Non-institutional facilities are typically comprised of single-story, non-climate-controlled facilities, often located outside of city centers, owned and/or managed by smaller private operators.
The self-storage market is highly fragmented with REITs comprising approximately 35% of the overall self-storage market, having grown significantly over the past decade and at a higher rate than the non-institutional market. REITs often achieve growth via acquisition of existing self-storage facilities, which creates demand for remodeling solutions to conform branding to the acquirer’s colors, logos, and aesthetic.
The self-storage market benefits from unique and attractive demand and supply attributes. Growth in self-storage demand has been driven by favorable long-term macroeconomic trends, including rising storable consumption per capita, population growth, and rising home ownership rates. There are also several other demand drivers within the self-storage industry that create demand including disasters, dislocation, death, divorce, decluttering, and commercial customers utilizing self-storage for storage and/or operations of their business. Available supply of self-storage is well below long-term levels, as exhibited by the key self-storage REITs operating at over 90% occupancy rates based upon publicly available information as of the third quarter of 2024. In addition to ongoing tight supply conditions, management estimates that approximately 60% of existing self-storage facilities are over 20 years old, which creates the potential need for replacement and refurbishment of an aging installed base.
Given high existing occupancy rates and expected rising demand, investment in additional self-storage capacity may be required in the future. New self-storage capacity can be created in several ways, including greenfield construction, expansions of existing self-storage facilities, conversions of existing buildings into self-storage facilities (for example: mothballed Big Box retail locations), or via facility acquisitions and upgrades. Janus is the market leader in building solutions for the self-storage market, offering institutional and non-institutional operators the broadest product offering and unique end-to-end solutions.
Commercial Door
Approximately 31% of our total revenues are attributable to the commercial industrial door market. Commercial doors are primarily composed of metal, plastic, and wood and used in industrial facilities, office, retail, and lodging establishments, institutional buildings, trucking terminal renovation, construction, remodeling, and maintenance services, and other non-residential infrastructure.
We compete within the metal commercial doors sub-sector with a focus on commercial roll-up sheet doors and rolling steel doors. Roll-up sheet doors are constructed of lighter gauge steel, are less durable, and less expensive than rolling steel doors. These doors are used in pre-engineered buildings and for applications where insulation is less important. Rolling steel doors are constructed of heavier gauge steel, are more durable and more expensive than roll-up sheet and sectional doors, and are primarily used in facilities such as warehouses, particularly in heavy industrial applications (carrying with them the ability to better trap hot/cool air inside the facility).
The metal commercial door market has experienced solid growth driven by: (1) an increase in construction spending, (2) aging infrastructure, and (3) efforts to improve security, appearance, and the energy efficiency of buildings.
Within the commercial industrial sector, we are a smaller participant within a larger addressable market, which provides the Company with significant opportunity for market share growth within a sector that is well positioned for future growth driven by the rising growth of e-commerce.
Competitive Conditions
We are subject to competition in substantially all product and service areas. Although our competition can vary by local market, both the industries and markets we compete in are highly competitive and fragmented as a whole.
Our industries and markets include global, national, regional, and local providers for our products, services, and solutions, including manufacturers, distributors, service providers, online commerce providers, as well as newer entrants to the market with non-traditional business and customer service models or disruptive technologies and products.
We believe that participants in our industry compete on the basis of customer relationships, product quality and availability, reliability, delivery speed, value added products and services, service capabilities, product and technological innovation, pricing, and overall ease of doing business. We typically compete with one or more local providers in all of our markets, as well as a number of national and regional companies.
Raw Materials
The principal raw material used by the Company is steel (steel coil). The Company purchases raw materials from commercial sources on a fixed and variable basis. The Company’s practice is to seek cost savings and enhanced quality by purchasing from a limited number of suppliers.
The steel industry is highly cyclical and prices for the Company’s raw materials are influenced by numerous factors beyond the Company’s control. The steel market continues to be dynamic, with a degree of uncertainty about future pricing trends. Numerous factors may cause steel prices to increase in the future. In addition to increases in steel prices, steel mills may add surcharges for zinc, energy, and freight in response to increases in their costs. See “Item 1A — Risk Factors” and “Item 7 — Management’s Discussion and Analysis of Financial Condition and Results of Operations.” While sufficient raw materials are generally available, rising geopolitical challenges may impact the availability, and thereby cause supply constraints, for steel. Depending on relative demand in the raw materials market, the Company may purchase and carry more steel or other raw materials in inventory to meet projected sales demand, as required.
Patent and Intellectual Property Rights
Generally, the Company, through Janus Core and its subsidiaries, seeks statutory protection for strategic or financially important intellectual property developed in connection with its business. Certain intellectual property, where appropriate, is protected by contracts, licenses, confidentiality or other agreements. From time to time, the Company takes action to protect its businesses by asserting its intellectual property rights against third-party infringers.
The Company maintains various trademarks that are registered or otherwise legally protected in the U.S. and many non-U.S. countries where products and services of the Company are sold. As part of the Company’s Nokē Smart Entry platform, the Company provides a limited right for its customers to publicly display certain trademarks of the Company in connection with the customer’s use and adoption of the Nokē Smart Entry solution.
The Company has U.S. and foreign patents, the majority of which cover products that the Company currently manufactures and markets. Our patents expire at various dates between 2026 and 2041. These patents, and applications for new patents, cover various design aspects of the Company’s products, as well as processes used in their manufacture. The Company continues to develop new potentially patentable products, product enhancements, and product designs.
While the Company believes its intellectual property portfolio is important to its business operations and in the aggregate constitutes a valuable asset, no single patent, trademark, license or other intellectual property, or group of such intellectual property, is critical to the success of the business or any segment. See “Item 1A — Risk Factors.”
Regulation
Laws, ordinances, or regulations affecting development, construction, operation, upkeep, safety, and taxation requirements may result in significant unanticipated expenditures, loss of self-storage sites or other impairments to operations, which would adversely affect our cash flows from operating activities.
Insurance activities are subject to state insurance laws and regulations as determined by the particular insurance commissioner for each state in accordance with the McCarran-Ferguson Act, as well as subject to the Gramm-Leach-Bliley Act and the privacy regulations promulgated by the Federal Trade Commission pursuant thereto.
Under the Comprehensive Environmental Response, Compensation, and Liability Act of 1980 (“CERCLA”), and comparable state laws, we may be required to investigate and remediate regulated hazardous materials at one or more of our properties. For additional information on environmental matters and regulation, see “Risk Factors — Risks Related to Our Business — Extensive environmental regulation to which we are subject creates uncertainty regarding future environmental expenditures and liabilities.”
Greenhouse Gas (“GHG”) Emission Related Policies, Regulations, and Legislation
Governments across the globe have announced and implemented various policies, regulations, and legislation to support the transition from fossil fuels to low-carbon forms of energy and the infrastructure around that transition. The operation of our business and our customers’ use of our products and solutions and services as well as our digital applications are, and may in the future be, impacted by these various government actions. For example, the United States rejoined the Paris Agreement effective February 19, 2021, an international climate
change agreement among almost 200 nations and the European Union (“EU”), that established a long-term goal of keeping the increase in global average temperature well below 2°C above pre-industrial levels and which calls for countries to set their own GHG emissions targets and be transparent about the measures each country will use to achieve these targets. On January 20, 2025, President Trump issued an executive order directing the immediate notice to the United Nations of the United States’ withdrawal from the Paris Agreement and all other agreements made under the United Nations Framework Convention on Climate Change. However, various state and local governments in the U.S. have publicly committed to furthering the goals of the Paris Agreement and many of these efforts at the local, state and international levels are expected to continue.
In August 2022, the United States passed the Inflation Reduction Act of 2022 (“IRA”), which consists of a number of provisions aimed directly at confronting the climate change crisis. The climate-related provisions of the IRA are projected to cut emissions by up to 40% from 2005 GHG levels in the United States by 2030. Among other things, the IRA introduced the Clean Energy Investment Tax Credit (“ITC”) for standalone energy storage, which is anticipated to lower the capital cost of equipment. The IRA also contains provisions with incentives for grid modernization equipment, including domestic battery cell manufacturing, battery module manufacturing and its components as well as various upstream applications. These types of regulations incentivize the adoption of renewable energy technologies, including energy storage products. Compliance with these policies, regulations, and legislation to support the transition from fossil fuels to low-carbon forms of energy and the infrastructure around that transition may have an impact on the Company. However, in January 2025, President Trump issued an executive order directing the heads of all federal agencies to identify and begin the processes to suspend, revise, or rescind all agency actions that are unduly burdensome on the identification, development, or use of domestic energy resources. The Inflation Reduction Act may also be subject to amendment or repeal through Congressional budget reconciliation. Consequently, future implementation and enforcement of these rules remains uncertain at this time.
Human Capital
Workforce Composition and Demographics
As of December 28, 2024, we had 1,883 full-time and part-time employees worldwide (excluding 388 contract workers).
Approximately 58% of our employees are engaged in manufacturing and production roles, primarily as hourly production associates. The remaining portion of our workforce is comprised of professionals in various roles. Our current worldwide workforce is made up of approximately 88% domestic employees and approximately 12% international employees.
We recognize that our employees are our greatest asset. As a result, the Company strives to create an environment that keeps our employees safe, treats them with dignity and respect, and fosters a culture of performance recognition. The Company does this through the programs summarized below.
Employee Health and Safety
Safety is a core value at Janus and is a critical element to our continued growth strategy. We foster a culture that is committed to making safety a personal mission for every employee. Our overall goal is to eliminate workplace injuries. We also promote and foster an environment of empowerment and sharing throughout the company at all levels and at all locations. We engage our employees on safety with a focus on risk identification and elimination through various leading indicators. We track Occupational Safety and Health Administration (“OSHA”) recordable injuries and lost time rates by location monthly. We establish safety targets annually, which are tracked and reported to leadership on a monthly basis.
The Company has an Environmental, Health & Safety committee comprised of representatives from across the Company’s businesses that share best practices and is responsible for driving our environmental, health and safety strategy. This helps drive our programs designed to reinforce positive behaviors, empower our employees to actively take part in maintaining a safe work environment, to heighten awareness and mitigate risk on critical safety components. Within each of our manufacturing and distribution facilities, we have site-specific safety and environmental goals designed to reduce risk.
Total Rewards
As part of our compensation philosophy, we believe that we must offer and maintain a competitive total rewards program for our employees in order to attract and retain superior talent. These programs not only include base wages and performance-based incentives, but also health, welfare, and retirement benefits.
We offer competitive health and wellness benefits to eligible employees and periodically conduct analyses of plan utilization to further tailor our employee benefits to meet their ongoing needs.
Talent Development and Succession
We aim to inspire and equip our employees to be successful in their current role within the organization and help them develop the skills to build on opportunities for future career growth. We understand our most critical roles that serve as points of leverage to deliver value and place our best people in those roles while attracting new talent and capabilities in support of continuous improvement in all we do. The Company uses performance management programs to support a high-performance culture, strengthen our employee engagement, and help retain our top talent.
Succession planning for critical roles is an important part of our development program across the Company. The Company is committed to developing our current talent and has made a significant investment in assessing our talent against the jobs both in the near term and in the future state. We are committed to ensuring our leaders are prepared for greater levels of responsibility and can successfully transition into new roles.
We believe that investing in the long-term development of our employees further solidifies our commitment to recruit, mentor, and retain world-class talent. Through the development and implementation of Janus University, we are continuously expanding learning opportunities for our teams. We strongly believe that this investment in our teams will build upon our employees’ existing skills and talents and will allow them to advance in their careers while allowing us to achieve our strategic goals.
Available Information
Our principal office is located at 135 Janus International Blvd. Temple, GA. Our telephone number is (866) 562-2580. Our website address is www.janusintl.com. Our Annual Report on Form 10-K, Quarterly Reports on Form 10-Q, Current Reports on Form 8-K and all amendments to those reports filed or furnished pursuant to Sections 13(a) and 15(d) of the Exchange Act are available free of charge on our website as soon as reasonably practicable after we electronically file such material with, or furnish it to, the U.S. Securities and Exchange Commission (“SEC”). Unless expressly noted, the information on our website or any other website is provided as inactive textual references only and is not incorporated by reference into this Annual Report on Form 10-K and should not be considered part of this Annual Report on Form 10-K or any other information we file with or furnish to the SEC.
Information About Our Executive Officers
See “Item 10 — Directors, Executive Officers, and Corporate Governance”.
Item 1A. RISK FACTORS
Stockholders should carefully consider the following risk factors, together with all of the other information included in this Annual Report. We may face additional risks and uncertainties that are not presently known to us, or that we currently deem immaterial. The following discussion should be read in conjunction with the financial statements and notes to the financial statements included elsewhere in this Annual Report and in the section titled “Management’s Discussion and Analysis of Financial Condition and Results of Operations.” The occurrence of one or more of the events or circumstances described in these risk factors, alone or in combination with other events or circumstances, may have a material adverse effect on our business, reputation, revenue, financial condition, results of operations and future prospects, in which event the market price of our securities could decline, and you could lose part or all of your investment. The risks and uncertainties described below are not intended to be exhaustive and are not the only ones that we face. Additional risks and uncertainties not presently known to us or that we currently deem immaterial may also impair our business operations. Disclosures of risks should not be interpreted to imply that the risks have not already materialized, and there may be additional risks that are not presently material or known. This Annual Report also contains forward-looking statements that involve risks and uncertainties. Our actual results could differ materially from those anticipated in the forward-looking statements as a result of a number of factors, including the risks described below.
Risks Related to Our Business
Our continued success is dependent upon our ability to hire, retain, and utilize qualified personnel.
The success of our business is dependent upon our ability to hire, retain and utilize qualified personnel, including engineers, craft personnel, and corporate management professionals who have the required experience and expertise at a reasonable cost. The market for these and other personnel is competitive. From time to time, it may be difficult to attract and retain qualified individuals with the expertise, and in the timeframe, demanded by our clients, or to replace such personnel when needed in a timely manner. In certain geographic areas, for example, we may not be able to satisfy the demand for our services because of our inability to successfully hire and retain qualified personnel. Loss of the services of, or failure to recruit, qualified technical and management personnel could limit our ability to successfully complete existing projects and compete for new projects.
In addition, much of our future success depends on the continued service, availability, and performance of our senior management and highly skilled personnel across all levels of our organization. Our senior management team has acquired specialized knowledge and skills with respect to our business, and the loss of any of these individuals could harm our business, especially if we are not successful in developing adequate succession plans. The development of appropriate succession plans requires devoting time and resources toward identifying and integrating new personnel into leadership roles and other key positions. If we cannot attract and retain qualified personnel or effectively implement appropriate succession plans, it could have a material adverse impact on our business, financial condition, and results of operations.
We engage in a highly competitive business. If we are unable to compete effectively, we could lose market share and its business and results of operations could be negatively impacted.
We face intense competition to provide technical, professional, and construction services to clients. The markets we serve are highly competitive, and we compete against many local, regional, and national companies.
The extent of our competition varies by industry, geographic area, and project type. Our projects are frequently awarded through a competitive bidding process, which is standard in our industry. We are constantly competing for project awards based on pricing, schedule, and the breadth and technical sophistication of our services. Competition can place downward pressure on our contract prices and profit margins, and may force us to accept contractual terms and conditions that are less favorable to us, thereby increasing the risk that, among other things, we may not realize profit margins at the same rates as we have seen in the past or may become responsible for costs or other liabilities we have not accepted in the past. If we are unable to compete effectively, we may experience a loss of market share or reduced profitability or both, which, if significant, could have a material adverse impact on our business, financial condition and results of operations.
Our business strategy relies, in part, on acquisitions to sustain our growth. Acquisitions of other companies present certain risks and uncertainties, including the successful integration and development of acquired businesses and our ability to retain key employees of acquired businesses, which could have a material adverse effect on our financial results.
Our business strategy involves growth through, among other things, the acquisition of other companies. Our approach is to evaluate companies that we believe will strategically fit into our business and growth objectives. If we are unable to successfully integrate and develop acquired businesses, including our ability to retain key employees of acquired businesses, we could fail to achieve anticipated synergies and cost savings, including any expected increases in revenues and operating results, which could have a material adverse effect on our financial results.
We may not be able to identify suitable acquisition or strategic investment opportunities or may be unable to obtain the required consent of our lenders and, therefore, may not be able to complete such acquisitions or strategic investments. We may incur expenses associated with sourcing, evaluating, and negotiating acquisitions (including those that do not get completed), and we may also pay fees and expenses associated with financing acquisitions to investment banks and other advisors. Any of these amounts may be substantial, and together with the size, timing and number of acquisitions we pursue, may negatively affect and cause significant volatility in our financial results.
In addition, we have assumed, and may in the future assume, liabilities of the company we are acquiring. While we retain third-party advisors to consult on potential liabilities related to these acquisitions, there can be no assurances that all potential liabilities will be identified or known to us. If there are unknown liabilities or other obligations, our business could be materially affected.
Our dependence on, and the price and availability of, raw materials (such as steel coil) as well as purchased components may adversely affect our business, results of operations, and financial condition.
We are subject to fluctuations in market prices for raw materials, including steel and energy, which could have an adverse effect on our results of operations. In recent years, the prices of various raw materials have increased significantly, and we have been unable to avoid exposure to global price fluctuations and supply limitations. Such pricing fluctuations have impacted the cost and availability of steel coil and related products or components. Additionally, we anticipate that fluctuations in the price of raw materials will continue in the future and, although most of the raw materials and purchase components we use are commercially available from a number of sources, we could experience disruptions in the availability of such materials, including disruptions attributed to our continued consolidation of raw material suppliers. If we are unable to purchase materials we require or are unable to pass on price increases to our customers or otherwise reduce our cost of goods or services sold, our business, results of operations and financial condition may be adversely affected.
Our use of hedging arrangements may adversely affect our future operating results or liquidity.
To reduce our exposure to fluctuations in commodity price risks we may elect to enter into derivative financial instruments, including futures, swaps and option contracts. To the extent we hedge our exposure to commodity prices we forego the benefits we would otherwise experience if commodity prices were to change favorably to our hedged position.
Hedging arrangements could also expose us to risk of financial loss in some circumstances, including when: the hedge is imperfect, the counterparty to the hedging contract defaults on its contractual obligations; or there is a change in the expected differential between the underlying price in the hedging agreement and actual prices received. The use of derivatives also may require the posting of cash collateral with counterparties, which can impact working capital when commodity prices change.
In addition, derivative financial instruments are subject to extensive regulation under the Dodd-Frank Act, and the rules adopted by the U.S. Commodity Futures Trading Commission, the SEC and other federal regulators establishing federal regulation of the derivatives market and entities like us that may participate in that market may adversely affect our ability to manage certain of our risks on a cost-effective basis.
The outcome of pending and future claims and litigation could have a material adverse impact on our business, financial condition, and results of operations.
We are a party to claims and litigation in the normal course of business. Since we engage in engineering and construction activities for large facilities and projects where design, construction, or systems failures can result in substantial injury to employees or others or damage to property, we are exposed to claims, litigation, and investigations if there is a failure at any such facility or project. Such claims could relate to, among other things, personal injury, loss of life, business interruption, property damage, worker or public safety, pollution and damage to the environment or natural resources and could be brought by our clients or third-parties, such as those who use or reside near our clients’ projects. We can also be exposed to claims if we agreed that a project would achieve certain performance standards or satisfy certain technical requirements and those standards or requirements are not met. In addition, while clients and subcontractors may agree to indemnify us against certain liabilities, such third-parties may refuse or be unable to pay for the liabilities.
We may be subject to liability if we breach our contracts, and our insurance may be inadequate to cover our losses.
We are subject to numerous obligations in our contracts with organizations using our products and services, as well as vendors and other companies with which we do business. We may breach these commitments, whether through a weakness in our procedures, systems, and internal controls, negligence, or through the willful act of an employee or contractor. Our insurance policies may be inadequate to compensate us for the potentially significant losses that may result from claims arising from breaches of our contracts, as well as disruptions in our services, failures or disruptions to our infrastructure, catastrophic events and disasters, or otherwise.
In addition, our insurance may not cover all claims made against us, and defending a suit, regardless of its merit, could be costly and divert management’s attention. Further, such insurance may not be available to us in the future on economically reasonable terms, or at all.
We are potentially subject to taxation related risks in multiple jurisdictions, and changes in U.S. tax laws, in particular, could have a material adverse effect on our business, cash flow, results of operations, or financial condition.
We are a U.S.-based company potentially subject to tax in multiple U.S. and non-U.S. tax jurisdictions. Significant judgment is required in determining our global provision for income taxes, deferred tax assets or liabilities and in evaluating our tax positions on a worldwide basis. While we understand our tax positions to be consistent with the tax laws in the jurisdictions in which we conduct our business, it is possible that these positions may be overturned by jurisdictional tax authorities, which may have a significant impact on our global provision for income taxes.
Tax laws are dynamic and subject to change as new laws are passed and new interpretations of the law are issued or applied.
In December 2017, President Trump signed into law the Tax Cuts and Jobs Act (the “Tax Act”), which significantly revised the Internal Revenue Code of 1986, as amended (the “Code”). On March 27, 2020, the Tax Act was amended by the Coronavirus Aid, Relief, and Economic Security (CARES) Act. Certain provisions of the Tax Act, as amended by the CARES Act, may adversely affect us. The Tax Act requires complex computations that were not previously provided for under U.S. tax law. Furthermore, the Tax Act requires significant judgments to be made in interpretation of the law and significant estimates in the calculation of the provision for income taxes. Additional interpretive guidance may be issued by the U.S. Internal Revenue Service, the U.S. Department of the Treasury or another governing body
that may significantly differ from our interpretation of the Tax Act, which may result in a material adverse effect on our business, cash flow, results of operations or financial condition.
In August 2022, legislation commonly known as the Inflation Reduction Act (the “IRA”) was signed into law. Among other things, the IRA includes a 1% excise tax on corporate stock repurchases, applicable to repurchases after December 31, 2022, and also a new minimum tax based on book income. Our analysis of the effect of the IRA on us is ongoing. It is possible that the IRA (or implementing regulations or other guidance) could adversely impact our current and deferred federal tax liability. Furthermore, other changes that may be enacted in the future, including changes to tax laws enacted by state or local governments in jurisdictions in which we operate, could materially increase the amount of taxes, including state and local taxes, we would be required to pay and could materially adversely affect our financial position and results of operations. Governmental tax authorities are increasingly scrutinizing the tax positions of companies. Many countries in the EU, as well as a number of other countries and organizations such as the Organization for Economic Cooperation and Development, are actively considering changes to existing tax laws that, if enacted, could increase our tax obligations in countries where we do business. If U.S. federal, state or local or non-U.S. tax authorities change applicable tax laws, our overall taxes could increase, and our business, financial condition or results of operations may be adversely impacted.
In January 2025, President Trump issued an executive order directing the heads of all federal agencies to identify and begin the processes to suspend, revise, or rescind all agency actions that are unduly burdensome on the identification, development, or use of domestic energy resources. The Inflation Reduction Act may be subject to amendment or repeal through Congressional budget reconciliation. Consequently, future implementation and enforcement of these rules remains uncertain at this time.
Unanticipated changes in effective tax rates or adverse outcomes resulting from examination of our income or other tax returns could adversely affect our financial condition and results of operations.
We are subject to taxes by U.S. federal, state, and local and non-U.S. tax authorities. Our future effective tax rates could be adversely affected by a number of factors, including changes in the valuation of our deferred tax assets and liabilities, expected timing and amount of the release of any tax valuation allowances, or changes in tax laws, regulations, or interpretations thereof. In addition, we may be subject to audits of our income, sales, and other transaction taxes by U.S. federal, state, and local and non-U.S. taxing authorities. Outcomes from these audits could have an adverse effect on our financial condition and results of operations.
We may experience negative or unforeseen tax consequences.
The Organization for Economic Co-operation and Development (“OECD”)/G20 and other invited countries developed a global tax framework inclusive of a 15% global minimum tax under the Pillar Two Global Anti-Base Erosion Rules (“Pillar Two”). In December 2022, the Council of the EU formally adopted the OECD’s framework to achieve a coordinated implementation amongst EU Member States consistent with EU law. The EU’s Pillar Two Directive effective dates were January 1, 2024, and January 1, 2025, for different aspects of the directive. In 2023, the United Kingdom also formally adopted legislation consistent with the OECD framework. Other major jurisdictions are actively considering and implementing changes to their tax laws to adopt certain parts of the OECD’s proposals. We have assessed this framework including OECD administrative guidance and determined, based upon available guidance, that these changes will not have a material impact to our results of operations; however, any future changes in OECD guidance or interpretations, including local country tax legislative changes thereof, could impact our initial assessment.
Fluctuations in foreign currency could have an effect on our reported results of operations.
Our exposure to fluctuations in foreign currency rates results primarily from the translation exposure associated with the preparation of our consolidated financial statements, as well as from transaction exposure associated with transactions in currencies other than our functional currency. While the financial statements are reported in U.S. dollars, our financial statements are prepared using foreign currencies such as the Euro as the functional currency and then translated into U.S. dollars. We cannot accurately predict the nature or extent of future exchange rate variability of the Euro or other currencies or their exchange rates relative to the U.S. dollar. Foreign exchange rates are sensitive to factors beyond our control. Fluctuations in foreign currency exchange rates could negatively affect our results of operations and impact reported financial results.
Any significant disruption in or unauthorized access to our computer systems or those of third parties that we utilize in our operations, including those relating to cybersecurity or arising from cyber-attacks, could result in a loss or degradation of service, unauthorized disclosure of data, including user and corporate information, or theft of intellectual property, including digital assets, which could adversely impact our financial condition or harm our reputation.
Our reputation and ability to attract, retain, and serve our users is dependent upon the reliable performance and security of our computer systems, mobile and other user applications, and those of third parties that we utilize in our operations. Although we employ comprehensive measures to prevent, detect, address, and mitigate cybersecurity threats, a cybersecurity incident could potentially result in the misappropriation, destruction, corruption, or unavailability of critical data, personal identifiable information, and other confidential or proprietary data (our own or that of third parties) and the disruption of business operations. Our ability to keep our business operating is highly dependent on the proper and efficient operation of IT service providers. Our systems and those of third parties that we utilize may be subject to cyber incident, damage or interruption from earthquakes, adverse weather conditions, lack of maintenance due to a pandemic, other natural disasters, terrorist attacks, security breach, power loss or telecommunications failures. Additionally, threats to network and data security are constantly evolving and becoming increasingly diverse and sophisticated. Interruptions in, destruction or manipulation of these systems, or with the internet in general, could make our service unavailable or degraded or otherwise hinder our ability to deliver our services.
Service interruptions, errors in our software or the unavailability of computer systems used in our operations, delivery or user interface could diminish the overall attractiveness of our user service to existing and potential users.
Our computer systems, mobile and other applications and systems of third parties we use in our operations are vulnerable to cybersecurity risks, including cyber-attacks and loss of confidentiality, integrity or availability, both from state-sponsored and individual activity, such as hacks, unauthorized access, computer viruses, denial of service attacks, physical or electronic break-ins and similar disruptions and destruction, and such unauthorized access to systems of third parties that we use has occurred in the past. Such systems may periodically experience directed attacks intended to lead to interruptions and delays in our service and operations as well as loss, misuse or theft of data or intellectual property. Any attempt by hackers to obtain our data (including customer and corporate information) or intellectual property, disrupt our service, or otherwise access our systems, or those of third parties we use, if successful, could harm our business, be expensive to remedy and damage our reputation. We have implemented certain systems and processes to thwart hackers and protect our data and systems. There is no assurance that cybersecurity threats may not have a material impact on our Company or our service or systems in the future. Although we have cybersecurity insurance (subject to specified retentions or deductibles), such insurance may not fully cover all damages, fines, and claims arising from cybersecurity incidents or the damages, fines, and claims may exceed the amount of any insurance available or may not be insurable. Any significant disruption to our service or access to our systems could result in a loss of users, liability, and adversely affect our business and results of operation.
We utilize our own communications and computer hardware systems located either in our facilities or in that of a third-party provider. In addition, we utilize third-party “cloud” computing services in connection with our business operations. Problems faced by us or our third-party web hosting, “cloud” computing, or other network providers, including technological or business-related disruptions, as well as cybersecurity threats, could adversely impact the experience of our users. While we perform cybersecurity due diligence on our key vendors and service providers, because we do not control such third parties and our ability to monitor their cybersecurity is limited, we cannot ensure the cybersecurity measures they take will be sufficient to protect any information we share with them or prevent any disruption arising from a technology failure, cyber-attack, or other information or security breach. We depend on such parties to implement adequate controls and safeguards to protect against and report cyber incidents. If such parties fail to deter, detect, or report cybersecurity incidents in a timely manner, we may suffer from financial and other harm, including to our information, operations, performance, employees, and reputation. We have experienced cybersecurity incidents previously; however, for the fiscal year ended December 28, 2024, no cybersecurity incident has had a material adverse effect on our business, strategy, results of operations, financial condition or reputation.
We face system security risks as we depend upon automated processes and the Internet, and our reputation could be damaged, we could incur substantial additional costs and become subject to litigation if our systems are penetrated.
We are increasingly dependent upon automated information technology processes, and many of our new customers communicate with us via the telephone or over the Internet. Moreover, the nature of our business involves the receipt and retention of personal information about our customers. We also rely on third-party vendors to retain data, process transactions, and provide other systems and services. These systems, and our systems, are subject to damage or interruption from power outages, computer and telecommunications failures, computer viruses, malware, and other destructive or disruptive security breaches and catastrophic events, such as a natural disaster or a terrorist event or cyber-attack. In addition, experienced computer programmers and hackers may be able to penetrate our security systems and misappropriate our confidential information, create system disruptions, or cause shutdowns. Such data security breaches as well as system disruptions and shutdowns could result in additional costs to repair or replace such networks or information systems and possible legal liability, including government enforcement actions and private litigation. In addition, our customers could lose confidence in our ability to protect their personal information, which could cause them to discontinue our services.
If we are unable to attract and retain team members or contract with third parties having the specialized skills or technologies needed to support our systems, implement improvements to our customer-facing technology in a timely manner, quickly and efficiently fulfill our customer’s products and payment methods that they may demand, or provide a convenient and consistent experience for our customers regardless of the ultimate sales channel, our ability to compete and our results of operations could be adversely affected.
Failure to maintain, upgrade, or replace our IT systems could materially adversely affect us.
Our business continues to demand the use of sophisticated systems and technologies, including digital tools, SaaS offerings and cloud computing. As a result, we devote significant time and resources in maintaining, upgrading or replacing our systems and technologies in order to meet customers' demands and expectations. These types of activities subject us to additional costs and inherent risks associated with maintaining, upgrading, replacing, and changing these systems and technologies, including impairment of our ability to manage our business, loss of customer confidence and business, potential disruption of our internal control structure, substantial capital expenditures, additional administration and operating expenses, demands on management time, training our employees to operate the systems, and other risks and costs of delays or difficulties in transitioning to, or integrating, new systems and technologies into our current business. We rely on certain third-party providers to maintain and periodically upgrade many of these systems and technologies so that they can continue to support our business. Further, the software programs supporting our business are licensed to us by independent software developers. The inability of these developers or us to continue to maintain and upgrade our systems and technologies would disrupt or reduce the efficiency of our operations if we were unable to convert to alternate systems in an efficient and timely manner.
In addition, costs and potential problems and interruptions associated with the implementation of new or upgraded systems and technologies, maintenance or adequate support of outdated or other existing systems and technologies could disrupt or reduce the efficiency of our business operations and could have an adverse effect on our operations if not anticipated and appropriately mitigated. Our competitive position may be adversely affected if we are unable to maintain, upgrade or replace systems and technologies that allow us to manage our business in a
competitive manner. We also may not achieve the benefits that we anticipate from an upgraded or replaced system and technology. Additionally, any failure of a system or technology could impede our ability to timely collect and report financial results in accordance with applicable laws and regulations.
Emerging issues related to the development and use of artificial intelligence could give rise to legal or regulatory action, damage our reputation, or otherwise materially harm of our business.
We have begun implementing the use of certain artificial intelligence tools within our business while continuing to explore the opportunities that artificial intelligence could bring to us. Our use of artificial intelligence technologies may not be successful and may present business, compliance, and reputational risks. The use of artificial intelligence, particularly generative artificial intelligence, presents opportunities as well as risks that could negatively impact the business. Artificial intelligence technologies may be developed using inaccurate, incomplete, flawed, or biased algorithms, training methodologies, or data, which could result in competitive harm, regulatory penalties, legal liability, or brand or reputational harm. Further, a failure to timely and effectively use or deploy artificial intelligence and integrate it into new product or service offerings could negatively impact our competitiveness, particularly ahead of evolving industry trends and consumer demands. Artificial intelligence technologies are complex and rapidly evolving, and while we aim to develop and use artificial intelligence responsibly and attempt to mitigate ethical and legal issues presented by its use, we may ultimately be unsuccessful in identifying or resolving issues before they arise, and the technologies that we develop or use may ultimately be flawed. Particularly given the nascent stage of the technology, the use of artificial intelligence technologies can lead to unintended consequences, including the generation of outputs that appear correct but are factually inaccurate, misleading, or are otherwise flawed, which could harm our reputation and business and expose us to risks related to such inaccuracies or errors in these outputs.
Moreover, artificial intelligence technology is subject to rapidly evolving domestic and international laws and regulations, which could impose significant costs and obligations on us. Emerging regulations may also pertain to data privacy, data protection, and the ethical use of artificial intelligence, as well as clarifying intellectual property considerations. Our use of artificial intelligence could give rise to legal or regulatory action or increased scrutiny or liability and may damage our reputation or otherwise materially harm our business.
Our ongoing development of technology products presents security and safety risks.
An increasing number of our products are delivered with Internet of Things (“IoT”) capabilities and the accompanying interconnected device networks, which include sensors, data, and advanced computing capabilities. We have developed product software designs that we believe are less susceptible to cyber-attacks, but despite these efforts, if our products and services that include IoT solutions, artificial intelligence, or other technologies do not work as intended or are compromised, the possible consequences include, among other things, financial loss, reputational damage, exposure to legal claims or enforcement actions, theft of intellectual property, and diminution in the value of our investment in research, development, and engineering, which in turn could adversely affect our competitiveness and results of operations.
Our brand is integral to our success. If we fail to effectively maintain, promote, and enhance our brand in a cost-effective manner, our business and competitive advantage may be harmed.
Maintaining and enhancing our reputation and brand recognition is critical to our relationships with existing customers, providers, and strategic partners, and to our ability to attract new customers, providers, and strategic partners. The promotion of our brand may require us to make substantial investments, and we anticipate that, given the highly competitive nature of our market, these marketing initiatives may become increasingly difficult and expensive. Brand promotion and marketing activities may not be successful or yield increased revenue, and to the extent that these activities yield increased revenue, the increased revenue may not offset the expenses we incur and our results of operations could be harmed. In addition, any factor that diminishes our reputation or that of our management, including failing to meet the expectations of our customers, providers, or partners, could harm our reputation and brand and make it substantially more difficult for us to attract new customers, providers, and partners. If we do not successfully maintain and enhance our reputation and brand recognition in a cost-effective manner, our business may not grow and we could lose our relationships with customers, providers, and partners, which could harm our business, financial condition, and results of operations.
Economic uncertainty or downturns, particularly as it impacts specific industries, could adversely affect our business and results of operations.
In recent years, the U.S. and other significant markets have experienced cyclical downturns and worldwide economic conditions remain uncertain. Economic uncertainty and associated macroeconomic conditions make it extremely difficult for our partners, suppliers, and us to accurately forecast and plan future business activities, and could cause our customers to slow spending on our offerings, which could adversely affect our ability to complete current projects and attract new customers.
We are susceptible to the indirect effects of adverse macroeconomic events that can result in higher unemployment, shrinking demand for products, large-scale business failures, and tight credit markets. Specifically, if adverse macroeconomic and business conditions significantly affect self-storage and commercial market rental rates and occupancy levels, our customers could reduce spending surrounding our products and services, which could have a negative effect on our business and therefore our results of operations. Thus, our results of operations are sensitive to changes in overall economic conditions that impact consumer spending, including discretionary spending, as well as to increased bad debts due to recessionary pressures. Adverse economic conditions affecting disposable consumer income, such as employment levels, business conditions, interest rates, tax rates, and fuel and energy costs, could reduce consumer spending or cause consumers to shift their spending to other products and services. A general reduction in the level of discretionary spending or shifts in consumer discretionary
spending could adversely affect our growth and profitability. Also, competitors may respond to challenging market conditions by lowering prices and attempting to lure away our customers.
We cannot predict the timing, strength, or duration of any economic slowdown, financial market disruptions or any subsequent recovery, generally or in any industry in particular. We also cannot predict the many ways in which they may affect our customers and our business in general. Nonetheless, financial and macroeconomic disruptions could have a significant adverse effect on our revenues, profitability, and results of operations. If the conditions in the general economy and the markets in which we operate worsen from present levels, our business, financial condition, and results of operations could be materially adversely affected.
If we are unable to develop new product or service offerings, achieve increased consumer adoption of those offerings, or penetrate new vertical markets, our business and financial results could be materially adversely affected.
Our success depends on our continued innovation to provide product and service offerings that make our products and service offerings useful for consumers. Accordingly, we must continually invest resources in product, technology, and development in order to improve the comprehensiveness and effectiveness of our products and service offerings and effectively incorporate new technologies into them. These product, technology, and development expenses may include costs of hiring additional personnel and of engaging third-party service providers and other research and development costs.
Without innovative products and service offerings, we may be unable to attract additional customers or retain current customers, which could, in turn, harm our business and financial results. In addition, while we have historically concentrated our efforts on the self-storage and commercial markets, we may penetrate additional vertical markets in order to aid in our long-term growth goals. Our success in the self-storage and commercial markets depends on our deep understanding of these industries. In order to penetrate new vertical markets, we will need to develop a similar understanding of those new markets and the associated business challenges faced by participants in them. Developing this level of understanding may require substantial investments of time and resources and we may not be successful. In addition, these new vertical markets may have specific risks associated with them that could affect our business.
Our corporate culture has contributed to our success and, if we are unable to maintain it as we mature, our business, financial condition and results of operations could be harmed.
We have experienced and may in the future experience rapid expansion of our employee ranks. Our corporate culture has been a key element of our success. However, as our organization matures, it may be difficult to maintain our culture, which could reduce our ability to innovate and operate effectively. The failure to maintain the key aspects of our culture as our organization matures could result in decreased employee satisfaction, increased difficulty in attracting top talent, increased turnover, which could compromise the quality of our client service, all of which are important to our success and to the effective execution of our business strategy. In the event we are unable to maintain our corporate culture as we scale, our business, financial condition and results of operations could be harmed. Additionally, our recent restructuring plan may cause additional attrition and affect employee morale. As a result, we may face additional risk that we might not be able to execute on our strategic plans, which may have an adverse effect on our business, financial condition, and operating results.
Our past growth may not be indicative of our future growth, and our revenue growth rate may decline in the future.
The growth in revenue we have experienced in recent years may not be indicative of our future growth, if any, and we will not be able to grow as expected, or at all, if we do not accomplish the following:
• increase the number of customers;
• further improve the quality of our products and service offerings, and introduce high-quality new products;
• timely adjust expenditures in relation to changes in demand for the underlying products and services offered;
• maintain brand recognition and effectively leverage our brand; and
• attract and retain management and other skilled personnel for our business.
Our revenue growth rates may also be limited if we are unable to achieve high market penetration rates as we experience increased competition. If our revenue or revenue growth rates decline, investors’ perceptions of our business may be adversely affected and the market price of our common stock could decline.
We may require additional capital to pursue our business objectives and respond to business opportunities, challenges, or unforeseen circumstances. If capital is not available to us, our business, operating results, and financial condition may be harmed.
We intend to continue to make investments to support our growth and may require additional capital to pursue our business objectives and respond to business opportunities, challenges, or unforeseen circumstances, including to increase our marketing expenditures to improve our brand awareness, develop new product and service offerings and existing product and service offerings, enhance our operating infrastructure and acquire complementary businesses and technologies. Accordingly, we may need to engage in equity or debt financings to secure additional funds. However, additional funds may not be available when we need them, on terms that are acceptable to us, or at all. Volatility in the credit markets also may have an adverse effect on our ability to obtain debt financing.
If we raise additional funds through further issuances of equity or convertible debt securities, our existing stockholders could suffer significant dilution, and any new equity securities we issue could have rights, preferences, and privileges superior to those of holders of our common stock. If we are unable to obtain adequate financing or financing on terms satisfactory to us, when we require it, our ability to continue to pursue our business objectives and to respond to business opportunities, challenges, or unforeseen circumstances could be significantly limited, and our business, operating results, financial condition and prospects could be materially adversely affected.
We may not be able to generate sufficient cash to service our obligations and any debt we incur.
Our ability to make payments on our obligations and any debt we incur in the future will depend on our financial and operating performance, which is subject to prevailing macroeconomic and competitive conditions and to certain financial, business, and other factors beyond our control. We may be unable to attain a level of cash flows from operating activities sufficient to permit us to pay our obligations, including amounts due under our obligations, and the principal, premium, if any, and interest on any debt we incur.
If we are unable to service our obligations and any debt we incur from cash flows, we may need to refinance or restructure all or a portion of such obligations prior to maturity. Our ability to refinance or restructure obligations and any debt we incur will depend upon the condition of the capital markets and our financial condition at such time. Any refinancing or restructuring could be at higher interest rates and may require us to comply with more onerous covenants, which could further restrict our business operations. If our cash flows are insufficient to service our then-existing debt and other obligations, we may not be able to refinance or restructure any of these obligations on commercially reasonable terms or at all and any refinancing or restructuring could have a material adverse effect on our business, results of operations or financial condition.
If our cash flows are insufficient to fund our obligations and any debt we incur in the future and we are unable to refinance or restructure these obligations, we could face substantial liquidity problems and may be forced to reduce or delay investments and capital expenditures or to sell material assets or operations to meet our then-existing debt and other obligations. We cannot assure you that we would be able to implement any of these alternative measures on satisfactory terms or at all or that the proceeds from such alternatives would be adequate to meet any debt or other obligations then due. If it becomes necessary to implement any of these alternative measures, our business, results of operations or financial condition could be materially and adversely affected.
We may not be able to adequately protect our proprietary and intellectual property rights in our data or technology.
Our success is dependent, in part, upon protecting our proprietary information and technology. We may be unsuccessful in adequately protecting our intellectual property. No assurance can be given that confidentiality, non-disclosure, or invention assignment agreements with employees, consultants, or other parties will not be breached and will otherwise be effective in controlling access to and distribution of our platform or solutions, or certain aspects of our platform or solutions, and proprietary information. Further, these agreements do not prevent our competitors from independently developing technologies that are substantially equivalent or superior to our platform or solutions. Additionally, certain unauthorized use of our intellectual property may go undetected, or we may face legal or practical barriers to enforcing our legal rights even where unauthorized use is detected.
Current law may not provide for adequate protection of our platform or data. Further, the laws of some countries do not protect proprietary rights to the same extent as the laws of the United States, and mechanisms for enforcement of intellectual property rights in some foreign countries may be inadequate. To the extent we expand our international activities, our exposure to unauthorized copying and use of our data, intellectual property, or certain aspects of our platform or our data may increase. Competitors, foreign governments, foreign government-backed actors, criminals, or other third parties may gain unauthorized access to our proprietary information and technology.
Accordingly, despite our efforts, we may be unable to prevent third parties from infringing upon or misappropriating our technology and intellectual property. To protect our intellectual property rights, we may be required to spend significant resources to monitor and protect these rights, and we may or may not be able to detect infringement by our customers or third parties. Litigation has been and may be necessary in the future to enforce our intellectual property rights and to protect our trade secrets. Such litigation could be costly, time consuming, and distracting to management and could result in the impairment or loss of portions of our intellectual property. Furthermore, our efforts to enforce our intellectual property rights may be met with defenses, counterclaims, and counter suits attacking the validity and enforceability of our intellectual property rights. Our inability to protect our proprietary technology against unauthorized copying or use, as well as any costly litigation or diversion of our management’s attention and resources, could delay further sales or the implementation of our platform or solutions, impair the functionality of our platform or solutions, delay introductions of new features, integrations, and capabilities, result in our substituting inferior or more costly technologies into our platform or solutions, or injure our reputation. In addition, we may be required to license additional technology from third parties to develop and market new features, integrations, and capabilities, and we cannot be certain that we could license that technology on commercially reasonable terms or at all, and our inability to license this technology could harm our ability to compete.
We may in the future be sued by third parties for various claims, including alleged infringement of proprietary intellectual property rights.
There is considerable patent and other intellectual property development activity in the markets we serve. Litigation, based on allegations of infringement or other violations of intellectual property, is frequent in software and internet-based industries. We may receive communications from third parties, including practicing entities and non-practicing entities, claiming that we have infringed their intellectual property rights.
In addition, we may be sued by third parties for breach of contract, defamation, negligence, unfair competition, or copyright or trademark infringement or claims based on other theories. We could also be subject to claims based upon the services that are accessible from our website through links to other websites or information on our website supplied by third parties or claims that our collection of information
from third-party sites without a license violates certain federal or state laws or website terms of use. We could also be subject to claims that the collection or provision of certain information breached laws or regulations relating to privacy or data protection. As a result of claims against us regarding suspected infringement, our technologies may be subject to injunction, we may be required to pay damages, or we may have to seek a license to continue certain practices (which may not be available on reasonable terms, if at all), all of which may significantly increase our operating expenses or may require us to restrict our business activities and limit our ability to deliver our products and services and/or certain features, integrations, and capabilities of our platform. As a result, we may also be required to develop alternative non-infringing technology, which could require significant effort and expense and/or cause us to alter our products or services, which could negatively affect our business. Further, many of our subscription agreements require us to indemnify our customers for third-party intellectual property infringement claims, so any alleged infringement by us resulting in claims against such customers would increase our liability. Our exposure to risks associated with various claims, including the use of intellectual property, may be increased as a result of acquisitions of other companies. For example, we may have a lower level of visibility into the development process with respect to intellectual property or the care taken to safeguard against infringement risks with respect to the acquired company or technology. In addition, third parties may make infringement and similar or related claims after we have acquired technology that had not been asserted prior to our acquisition.
Rising operating expenses for our customers could indirectly reduce our cash flow and funds available for future distributions.
Our customers’ self-storage and commercial market facilities and any other facilities they acquire or develop in the future are and will be subject to operating risks common to real estate in general, any or all of which may negatively affect our customers, and in turn, negatively affect us. Our customers’ self-storage and commercial market facilities are subject to increases in operating expenses such as real estate and other taxes, personnel costs including the cost of providing specific medical coverage to their employees, utilities, insurance, administrative expenses, and costs for repairs and maintenance. If our customers’ operating expenses increase without a corresponding increase in revenues, they may decrease discretionary spending, which could diminish our profitability and limit our ability to make distributions to our stockholders.
Certain of our customers have negotiating leverage, which may require that we agree to terms and conditions that result in increased cost of revenues, decreased revenues, and lower average selling prices and gross margins, all of which could harm our results of operations.
Some of our customers have bargaining power when negotiating new projects or renewals of existing agreements and have the ability to buy similar products from other vendors or develop such systems internally. These customers have and may continue to seek advantageous pricing and other commercial and performance terms that may require us to develop additional features in the products we sell to them or add complexity to our customer agreements. We have been required to, and may continue to be required to, reduce the average selling price of our products in response to these pressures. If we are unable to avoid reducing our average selling prices or otherwise negotiate renewals with certain of our customers on favorable terms, our results of operations could be harmed.
Our business is subject to complex and evolving U.S. and foreign laws and regulations regarding privacy and data protection.
The regulatory environment surrounding data privacy and protection is constantly evolving and can be subject to significant change. Outside of the U.S., data protection laws, including the U.K. and E.U. General Data Protection Regulation (the “GDPR”), also apply to some of our operations. Legal requirements in these countries relating to the collection, storage, processing, and transfer of personal data continue to evolve. The GDPR imposes, among other things, strict obligations and restrictions on the collection and use of U.K. and E.U. personal data, a requirement for prompt notice of data breaches in certain circumstances, a requirement for implementation of certain approved safeguards (such as the use of approved “standard contractual clauses” and the performance of appropriate data transfer impact assessments, as applicable) for transfers of personal data to other countries that have not been determined by the E.U. or the U.K. to provide adequate data privacy protections, and possible substantial fines for any violations. Numerous other countries, including those in which we operate, have introduced and, in some cases, enacted, similar data privacy and cyber and data security laws.
The interpretation and enforcement of the laws and regulations described above are uncertain and subject to change and may require substantial costs to monitor and implement compliance with any additional requirements. Failure to comply with U.S. and international data protection laws and regulations could result in government enforcement actions (which could include substantial civil and/or criminal penalties), private litigation and/or adverse publicity, and could negatively affect our operating results and business.
Privacy concerns could result in regulatory changes that may harm our business.
Personal privacy has become a significant issue in the jurisdictions in which we operate. Many jurisdictions in which we operate, including California, Canada, and certain E.U. member states, have imposed restrictions and requirements on the use of personal information by those collecting such information. The regulatory framework for privacy issues is rapidly evolving and future enactment of more restrictive laws, rules, or regulations and/or future enforcement actions or investigations could have a materially adverse impact on us through increased costs or restrictions on our business or our customers businesses. Failure to comply with such laws and regulations could result in consent orders or regulatory penalties and significant legal liability, including fines, which could damage our reputation and have an adverse effect on our results of operations or financial condition.
We must comply with increasingly complex and rigorous regulatory standards enacted to protect businesses and personal data, including the GDPR and the California Consumer Privacy Act (“CCPA”). The E.U. GDPR is a comprehensive E.U. privacy and data protection reform, effective in 2018, which applies to companies that are organized in the EU or otherwise provide services to consumers who reside in the E.U., and imposes strict standards regarding the sharing, storage, use, disclosure, and protection of end user data and significant penalties (monetary and otherwise) for non-compliance. The CCPA, effective in 2020, together with the California Privacy Rights Act, provides consumers with expansive rights and control over personal information obtained by or shared with certain covered businesses. Any failure to comply with the
E.U. GDPR, the U.K. GDPR, the CCPA, or other regulatory standards, could subject us to legal and reputational risks. Misuse of or failure to secure personal information could also result in violation of data privacy laws and regulations, proceedings against us by governmental entities or others, damage to our reputation and credibility, and could have a material adverse effect on our business and results of operations.
Certain environmental regulations to which we are subject creates uncertainty regarding future environmental expenditures and liabilities.
We are subject to various federal, state, and local environmental laws, ordinances, and regulations. Under environmental statutes such as CERCLA, also known as the Superfund law, owners of real estate or operators of a facility may be liable for the costs of investigating and remediating certain hazardous substances or other regulated materials on or in such property or facility. Such laws often impose strict, joint and several liability, without regard to knowledge or fault, for removal or remediation of hazardous substances or other regulated materials upon owners and operators of contaminated property, even after they no longer own or operate the property. Moreover, the past or present owner or operator of a property from which a release emanates could be liable for any personal injuries or property damages that may result from such releases, as well as any damages to natural resources that may arise from such releases. Remediation may be required in the future as a result of spills or releases of petroleum products or hazardous substances or the discovery of unknown environmental conditions at our properties, or implementation of more stringent standards regarding existing contamination. The presence of such substances or materials, or the failure to properly remediate such substances for which we are liable, may adversely affect our ability to lease, sell, or rent such property or to borrow using such property as collateral.
We cannot predict what environmental legislation or regulations will be enacted in the future, how existing or future laws or regulations will be administered or interpreted, or what environmental conditions may be found to exist at our facilities or at third party sites for which we may be liable. Enactment of stricter laws or regulations, stricter interpretations of existing laws and regulations or the requirement to undertake the investigation or remediation of currently unknown environmental contamination at sites we own or third-party sites may require us to make additional expenditures, some of which could be material.
Our manufacturing facilities are subject to unexpected equipment failures, operational interruptions, and casualty losses.
Our manufacturing facilities are subject to risks that may limit our ability to manufacture and sell our products, including unexpected equipment failures, operational interruptions, and catastrophic losses due to other unanticipated events such as fires, explosions, accidents, adverse weather conditions, and transportation interruptions. Any such equipment failures or events, which have occurred in the past, can subject us to plant shutdowns and periods of reduced production or unexpected downtime. Furthermore, the resolution of certain operational interruptions may require significant capital expenditures. Although our insurance coverage could offset the losses or expenditures relating to some of these events, our results of operations and cash flows would be negatively impacted to the extent that such claims were not covered or only partially covered by our insurance.
Our business and operations are subject to risks related to climate change.
The long-term effects of global climate change could present both physical risks and transition risks (such as regulatory or technology changes), which are expected to be widespread and unpredictable. These changes could over time affect, for example, the availability and cost of raw materials, commodities, and energy (including utilities), which in turn may impact our supply chain and ability to procure goods or services required for the operation of our business at the quantities and levels we require. Additionally, we have facilities located in areas that may be impacted by the physical risks of climate change, and we face the risk of losses incurred as a result of physical damage to our facilities and inventory as well as business interruption caused by such events. Furthermore, periods of extended inclement weather or associated flooding may inhibit construction activity utilizing our products and delay shipments of our products to customers.
We also use natural gas, diesel fuel, gasoline, and electricity in our operations, all of which could face increased regulation as a result of climate change or other environmental concerns. Additionally, we may face increased costs to respond to future water laws and regulations, and operations in areas with limited water availability may be impacted if droughts become more frequent or severe. Any such events could have a material adverse effect on our costs or results of operations.
If employees violate our policies or we fail to maintain adequate record-keeping and internal accounting practices to accurately record our transactions, we may be subject to regulatory sanctions.
We are subject to various anti-corruption laws that prohibit improper payments or offers of payments to foreign governments and their officials by a U.S. person for the purpose of obtaining or retaining business. We operate in countries that may present a more corruptible business environment than the U.S. Such activities create the risk of unauthorized payments or offers of payments by one of our employees or agents that could be in violation of various laws, including the Foreign Corrupt Practices Act of 1977 (“FCPA”). We have implemented policies to discourage these practices by our employees and agents. However, existing safeguards and any future improvements may prove to be ineffective and employees or agents may engage in conduct for which we might be held responsible.
If employees violate our policies or we fail to maintain adequate record-keeping and internal accounting practices to accurately record our transactions, we may be subject to regulatory sanctions. Violations of the FCPA or other anti-corruption laws may result in severe criminal or civil sanctions and penalties, and we may be subject to other liabilities which could materially adversely affect our business, results of operations and financial condition. We are also subject to similar anti-corruption laws in other jurisdictions.
Disruptions in the worldwide economy (including inflation) may adversely affect our business, results of operations, and financial condition.
The global economy can be negatively impacted by a variety of factors such as the spread of fear, the occurrence of man-made or natural disasters, severe weather, actual or threatened hostilities or war, terrorist activity, political unrest, civil strife, and other geopolitical events of uncertainty. Such adverse and uncertain economic conditions may impact demand for our products generally and may cause disruptions in our supply chain. Furthermore, in connection with continued tensions related to the ongoing conflict between Russia and Ukraine, governments in the U.S., U.K., and the E.U. have each imposed export controls on certain products as well as financial and economic sanctions on certain industry sectors and parties within Russia. Further escalation of geopolitical tensions (such as those between Israel and Gaza and between Taiwan and China) could generate a broader impact, which could expand into other markets where we do business and could adversely affect our business and/or our supply chain, our international subsidiaries, business partners, or customers in the broader region. This could include potentially destabilizing effects for the European continent or the global oil and natural gas markets.
Additionally, increases in inflation, along with the uncertainties surrounding geopolitical developments and global supply chain disruptions, have caused, and may in the future cause, global economic uncertainty and uncertainty about the interest rate environment. A failure to adequately respond to these risks could have a material adverse impact on our financial condition, results of operations, or cash flows. In response to high levels of inflation and recession fears, the U.S. Federal Reserve, the European Central Bank, and the Bank of England have raised, and may continue to raise, interest rates and implement fiscal policy interventions. Even if these interventions lower inflation, they may also reduce economic growth rates, create a recession, and have other similar effects. The U.S. debt ceiling and budget deficit concerns have increased the possibility of credit-rating downgrades and economic slowdowns, or a recession in the United States.
In addition, our ability to manage normal commercial relationships with our suppliers, distributors, and customers may suffer. As a result, certain customers may shift purchases to lower-priced or other perceived value-offerings during economic downturns as a result of various factors, including: job losses, inflation, higher taxes, reduced access to credit, change in federal economic policy, and recent international trade disputes. Our suppliers and distributors may become more conservative in response to these conditions and seek to reduce their inventories. Changes to trade policy, import laws, and tariffs may also have a material adverse effect on our business, financial condition and results of operations. The effects of current and future economic and political conditions and other events beyond our control on us, our suppliers, distributors, and customers could severely disrupt our operations and have a material adverse effect on our business, results of operations, financial condition, and prospects. Our results of operations depend upon, among other things, our ability to maintain and increase sales volumes with our existing customers, our ability to attract new consumers, the financial condition of our customers, and our ability to provide products that appeal to customers at the right price. Decreases in demand for our products without a corresponding decrease in costs would put downward pressure on margins and would negatively impact our financial results. Prolonged unfavorable economic conditions or uncertainty may have an adverse effect on our revenues and profitability and may result in customers making long-lasting changes to their discretionary spending behavior on a more permanent basis.
Changes in trade policies, including the imposition of tariffs, could negatively impact our business, financial condition, and results of operations.
Our business is dependent upon the availability of raw materials and components for assembly. U.S. relations with the rest of the world remains uncertain with respect to taxes, trade policies, and tariffs, especially as the political landscape changes due to the recent U.S. presidential and congressional elections. Changes in U.S. administrative policy may lead to significant increases in tariffs for imported goods among other possible changes, and the current administration has indicated that it is likely to impose significant tariffs on imported goods. The imposition of such tariffs may strain international trade relations and increase the risk that foreign governments implement retaliatory tariffs on goods imported from the United States. These political and economic changes could have a material effect on global economic conditions and the stability of financial markets and could significantly reduce global trade. The imposition and continuation of tariffs and other potential changes in U.S. trade policy could increase the cost and/or limit the availability of raw materials, which could hurt our competitive position and adversely impact our business, financial condition, and results of operations. Additionally, challenging current and future global economic conditions, including inflation and supply chain disruptions may negatively impact our business operations and financial results.
Risks Related to Ownership of our Common Stock
We may not be able to pay dividends or make distributions or obtain loans to enable us to pay any dividends on our common stock or satisfy our other financial obligations.
We have no direct operations and no significant assets other than our ownership of Janus International Group, LLC and its respective subsidiaries, which operates our business. We depend on profits generated by our business for distributions and other payments to generate the funds necessary to meet our financial obligations, including our expenses as a publicly traded company, and to pay any dividends with respect to our capital stock. Legal and contractual restrictions in agreements governing our indebtedness, as well as our financial condition and operating requirements, may limit our ability to receive distributions from Janus International Group, LLC and its respective subsidiaries.
Provisions in our second amended and restated certificate of incorporation, our bylaws, and Delaware law may inhibit a takeover of us, which could limit the price investors might be willing to pay in the future for our common stock and could entrench management.
Our second amended and restated certificate of incorporation and bylaws contain provisions to limit the ability of others to acquire control of us or cause us to engage in change-of-control transactions, including, among other things:
• provisions that authorize the board of directors of the Company (the “Board”), without action by our stockholders, to authorize by resolution the issuance of shares of preferred stock and to establish the number of shares to be included in such series, along with the preferential rights determined by the Board; provided that, the Board may also, subject to the rights of the holders of preferred stock, authorize shares of preferred stock to be increased or decreased by the approval of the Board and the affirmative vote of the holders of a majority in voting power of the outstanding shares of capital stock of the corporation;
• provisions that impose advance notice requirements and other requirements and limitations on the ability of stockholders to propose matters for consideration at stockholder meetings; and
• a staggered board whereby our directors are divided by three classes, with each class subject to retirement and reelection once every three years on a rotating basis.
With our staggered Board, at least two annual meetings of stockholders will generally be required in order to effect a change in a majority of our directors. Our staggered Board can discourage proxy contests for the election of directors and purchases of substantial blocks of our shares by making it more difficult for a potential acquirer to gain control of the Board in a relatively short period of time.
Our second amended and restated certificate of incorporation provides, subject to limited exceptions, that the Court of Chancery of the State of Delaware is the sole and exclusive forum for certain stockholder litigation matters, which could limit stockholders’ ability to obtain a favorable judicial forum for disputes with us or our directors, officers, employees, or stockholders.
Our second amended and restated certificate of incorporation provides that, unless we consent in writing to the selection of an alternative forum, the Court of Chancery of the State of Delaware is the sole and exclusive forum for (1) any derivative action or proceeding brought on our behalf, (2) any action asserting a claim of breach of a fiduciary duty owed by any current or former of our directors, officers, stockholders, agents or other employees to us or our shareholders, or any claim for aiding and abetting such alleged breach, (3) any action asserting a claim against us or any director, officer, stockholder, agent, or other employee of ours arising pursuant to any provision of the Delaware General Corporation Law (“DGCL”), our certificate of incorporation or our bylaws or as to which the DGCL confers jurisdiction on the Court of Chancery, or (4) any other action asserting a claim against us or any director, officer, stockholder, agent or other employee of ours that is governed by the internal affairs doctrine; provided that for the avoidance of doubt, the forum selection provision that identifies the Court of Chancery of the State of Delaware as the exclusive forum for certain litigation, including any “derivative action,” will not apply to any claim (a) as to which the Delaware Court of Chancery determines that there is an indispensable party not subject to the jurisdiction of the Delaware Court of Chancery (and the indispensable party does not consent to the personal jurisdiction of the Court of Chancery within ten days following such determination), (b) which is vested in the exclusive jurisdiction of a court or forum other than the Delaware Court of Chancery, or (c) arising under federal securities laws, including the Securities Act as to which the federal district courts of the United States of America shall, to the fullest extent permitted by law, be the sole and exclusive forum. Notwithstanding the foregoing, the provisions of Article XI of our second amended and restated certificate of incorporation will not apply to suits brought to enforce any liability or duty created by the Exchange Act, or any other claim for which the federal district courts of the United States of America shall be the sole and exclusive forum. Any person or entity purchasing or otherwise acquiring any interest in shares of our capital stock shall be deemed to have notice of and consented to the forum provisions in our second amended and restated certificate of incorporation. If any action the subject matter of which is within the scope of the forum provisions is filed in a court other than a court located within the State of Delaware (a “foreign action”) in the name of any stockholder, such stockholder shall be deemed to have consented to: (x) the personal jurisdiction of the state and federal courts located within the State of Delaware in connection with any action brought in any such court to enforce the forum provisions (an “enforcement action”); and (y) having service of process made upon such stockholder in any such enforcement action by service upon such stockholder’s counsel in the foreign action as agent for such stockholder.
This choice of forum provision may limit a stockholder’s ability to bring a claim in a judicial forum that it finds favorable for disputes with us or any of our directors, officers, other employees or stockholders, which may discourage lawsuits with respect to such claims. Alternatively, if a court were to find the choice of forum provision contained in our second amended and restated certificate of incorporation to be inapplicable or unenforceable in an action, we may incur additional costs associated with resolving such action in other jurisdictions, which could harm our business, operating results and financial condition.
We have and may continue to incur increased costs and obligations as a result of complying with public company requirements.
The obligations associated with being a public company involve significant expenses and require significant resources and management attention, which may divert from our business operations.
We are subject to the reporting requirements of the Exchange Act and the Sarbanes-Oxley Act. The Exchange Act requires that we file annual, quarterly, and current reports with respect to our business, financial condition, and results of operations. The Sarbanes-Oxley Act requires, among other things, that we establish and maintain effective internal control over financial reporting. As a result, we incur significant legal, accounting, and other expenses that we did not incur prior to becoming a public company. Our entire management team and many of our other employees will need to devote substantial time to compliance and may not effectively or efficiently manage our obligations as a public company.
In addition, the need to establish the corporate infrastructure demanded of a public company may also divert management’s attention from implementing our business strategy, which could prevent us from improving our business, financial condition, cash flows, and results of operations. We have made, and will continue to make, changes to our internal control over financial reporting, including information technology controls, and procedures for financial reporting and accounting systems to meet our reporting obligations as a public company. However, the measures that we take may not be sufficient to satisfy our obligations as a public company. If we do not continue to develop and implement the right processes and tools to manage our changing enterprise and maintain our culture, our ability to compete successfully and
achieve our business objectives could be impaired, which could negatively impact our business, financial condition, cash flows, and results of operations. In addition, we cannot predict or estimate the amount of additional costs we may incur to continue to comply with these requirements. We anticipate that these costs will continue to increase our general and administrative expenses.
As a public reporting company, we are subject to rules and regulations established from time to time by the SEC and NYSE regarding our internal control over financial reporting. If we fail to establish and maintain effective internal control over financial reporting and disclosure controls and procedures, we may not be able to accurately report our financial results, or report them in a timely manner.
We are a public reporting company subject to the rules and regulations established from time to time by the SEC and NYSE. These rules and regulations require, among other things, that we establish and periodically evaluate procedures with respect to our internal control over financial reporting. Public company reporting obligations place a considerable burden on our financial and management systems, processes and controls, as well as on our personnel.
In addition, as a public company we are required to document and test our internal control over financial reporting pursuant to Section 404 of the Sarbanes-Oxley Act so that our management can certify as to the effectiveness of our internal control over financial reporting by the time our second annual report is filed with the SEC and thereafter, which has required us to document and make significant changes to our internal control over financial reporting. In addition, our independent registered public accounting firm is required to provide an attestation report on the effectiveness of our internal control over financial reporting since we no longer qualify as an “emerging growth company,” as defined in the JOBS Act.
We expect to continue to incur costs related to our internal control over financial reporting in future years to further improve our internal control environment. If we identify additional deficiencies in our internal control over financial reporting or if we are unable to comply with the requirements applicable to us as a public company, including the requirements of Section 404 of the Sarbanes-Oxley Act, in a timely manner, we may be unable to accurately report our financial results, or report them within the timeframes required by the SEC. If this occurs, we also could become subject to sanctions or investigations by the SEC or other regulatory authorities. In addition, if we are unable to assert that our internal control over financial reporting is effective, or if our independent registered public accounting firm is unable to express an opinion as to the effectiveness of our internal control over financial reporting, or express an adverse opinion, investors may lose confidence in the accuracy and completeness of our financial reports, we may face restricted access to the capital markets, and our stock price may be adversely affected.
We may issue additional shares of common stock or other equity securities without stockholder approval, which would dilute existing stockholders’ ownership interest in us and may depress the market price of our common stock.
We may issue additional shares of common stock or other equity securities in the future in connection with, among other things, future acquisitions, repayment of outstanding indebtedness, or grants under the Janus International Group, Inc. 2021 Omnibus Incentive Plan without stockholder approval in a number of circumstances.
The issuance of additional common stock or other equity securities could have one or more of the following effects:
• our existing stockholders’ proportionate ownership interest will decrease;
• the amount of cash available per share, including for payment of dividends in the future, may decrease;
• the relative voting strength of each previously outstanding share of common stock may be diminished; and
• the market price of our common stock may decline.
If our performance does not meet market expectations, the price of our securities may decline.
If our performance does not meet market expectations, the price of our common stock may decline. In addition, fluctuations in the price of our common stock could contribute to the loss of all or part of your investment. In an active market, the trading price of our common stock may be volatile and subject to wide fluctuations in response to various factors, some of which are beyond our control. Any of the factors listed below could have a material adverse effect on an investment in our common stock and our common stock may trade at prices significantly below the price that investors paid for them.
Factors affecting the trading price of our common stock may include:
• actual or anticipated fluctuations in our financial results or the financial results of companies perceived to be similar to us;
• changes in the market’s expectations about our operating results;
• our operating results failing to meet market expectations in a particular period;
•changes in financial estimates and recommendations by securities analysts concerning us or the self-storage and commercial industries and the market in general;
• operating and stock price performance of other companies that investors deem comparable to us;
• our ability to market new and enhanced products on a timely basis;
• changes in laws and regulations affecting our business;
• commencement of, or involvement in, litigation involving us;
• changes in our capital structure, such as future issuances of securities or the incurrence of additional debt;
• the volume of shares of our common stock available for public sale;
• any significant change in the Board or management;
• sales of substantial amounts of common stock by our directors, executive officers, or significant stockholders or the perception that such sales could occur; and
• general economic and political conditions such as recessions, interest rates, fuel prices, international currency fluctuations, and acts of war or terrorism.
Broad market and industry factors may depress the market price of our common stock irrespective of our operating performance. The stock market in general and NYSE have experienced price and volume fluctuations that have often been unrelated or disproportionate to the operating performance of the particular companies affected. The trading prices and valuations of our securities, may not be predictable. A loss of investor confidence in the market for industrial or industrial technology stocks or the stocks of other companies which investors perceive to be similar to us could depress our stock price regardless of our business, prospects, financial conditions, or results of operations. A decline in the market price of our common stock also could adversely affect our ability to issue additional securities and our ability to obtain additional financing in the future.
We cannot guarantee that our share repurchase program will be fully consummated or that it will enhance stockholder value, and any share repurchases could affect the trading price of our common stock.
In February 2024, our board of directors authorized a $100 share repurchase program. Although our board of directors has authorized a share repurchase program, and we have repurchased approximately $78.7 of our common stock as of December 28, 2024, the share repurchase program does not obligate us to repurchase any specific additional dollar amount or to acquire any specific additional number of shares. The share repurchase program could affect the price of our common stock, increase volatility and diminish our cash reserves. In addition, it may be suspended or terminated at any time, which may result in a decrease in the price of our common stock.
Our ability to successfully operate our business depends largely upon the efforts of certain key personnel, including our executive officers. The loss of such key personnel could adversely affect the operations and profitability of our business.
Our ability to successfully operate our business depends upon the efforts of certain key personnel of Janus, including our executive officers. The unexpected loss of key personnel may adversely affect our operations and profitability. In addition, our future success depends in part on our ability to identify and retain key personnel to succeed senior management. Furthermore, while we have closely scrutinized the skills, abilities, and qualifications of the key Janus personnel that are or will be employed by us, our assessment may not prove to be correct. If such personnel do not possess the skills, qualifications, or abilities we expect or those necessary to manage a public company, the operations and profitability of our business may be negatively impacted.
Our ability to meet expectations and projections in any research or reports published by securities or industry analysts, or a lack of coverage by securities or industry analysts, could result in a depressed market price and limited liquidity for our common stock.
The trading market for our common stock is influenced by the research and reports that industry or securities analysts may publish about us, our business, our market, or our competitors. If no (or few) securities or industry analysts cover us, our stock price would likely be less than that which would be obtained if we had such coverage and the liquidity, or trading volume of our common stock may be limited, making it more difficult for a stockholder to sell shares at an acceptable price or amount. If any analysts do cover us, their projections may vary widely and may not accurately predict the results we actually achieve. Our share price may decline if our actual results do not match the projections of research analysts covering us. Similarly, if one or more of the analysts who write reports on us downgrades our stock or publishes inaccurate or unfavorable research about our business, our share price could decline. If one or more of these analysts ceases coverage of us or fails to publish reports on it regularly, our share price or trading volume could decline.
Our second amended and restated certificate of incorporation renounced any interest or expectancy that we have in corporate opportunities that may be presented to our officers, directors, or stockholders or their respective affiliates, other than those officers, directors, stockholders, or affiliates who are ours or our subsidiaries’ employees. As a result, these persons are not required to offer certain business opportunities to us and may engage in business activities that compete with us.
Our non-employee directors and certain of their affiliates, may engage in activities where their interests conflict with our interests, such as investing in or advising businesses that directly or indirectly compete with certain portions of our business. Our second amended and restated certificate of incorporation provides that it does not have an interest or expectancy in corporate opportunities that may be presented to our directors or their respective affiliates, other than those directors who are our employees. Accordingly, our non-employee directors do not have any duty to refrain from engaging, directly or indirectly, in the same business activities or similar business activities or lines of business in which we operate. Non-employee directors and their affiliates also may pursue acquisition opportunities that may be complementary to our business, and, as a result, those acquisition opportunities may not be available to us.
Our reported financial results may be affected by changes in accounting principles generally accepted in the United States.
Generally accepted accounting principles in the United States (“GAAP” or “U.S. GAAP”) are subject to interpretation by the Financial Accounting Standards Board (“FASB”), the SEC, and various bodies formed to promulgate and interpret appropriate accounting principles. A change in these principles or interpretations could have a significant effect on our reported financial results, and could affect the reporting of transactions completed before the announcement of a change. Any difficulties in implementing any future changes to accounting principles could cause us to fail to meet our financial reporting obligations, which could result in regulatory discipline and harm investors’ confidence in us.
Item 1B. UNRESOLVED STAFF COMMENTS
None.
Item 1C. CYBERSECURITY
Cybersecurity Risk Management Protocols and Strategy
Organizations in our industry are frequently confronted with a broad range of cybersecurity threats, ranging from uncoordinated, individual attempts to gain unauthorized access to an organization’s information technology (“IT”) environment to sophisticated and targeted cyberattacks sponsored by foreign governments and criminal enterprises. Although we employ comprehensive measures to prevent, detect, address, and mitigate these threats, a cybersecurity incident could potentially result in the misappropriation, destruction, corruption, or unavailability of critical data, personal identifiable information, and other confidential or proprietary data (our own or that of third parties) and the disruption of business operations. The potential consequences of a material cybersecurity incident include remediation and restoration costs, reputational damage, regulatory fines, litigation with third parties, and diminution in the value of our investment in research and development, which in turn could adversely affect our competitiveness and results of operations. Accordingly, cybersecurity is an important part of our Enterprise Risk Management (“ERM”) program, and the Company seeks to address cybersecurity risks through a comprehensive, cross-functional approach.
The Company’s cybersecurity policies, standards, processes, and practices for assessing, identifying, and managing material risks from cybersecurity threats and responding to cybersecurity incidents are based on recognized frameworks established by the National Institute of Standards and Technology, the International Organization for Standardization, and other applicable industry standards. The Company has established certain controls and procedures, including an Incident Response Plan, that provide for the identification, analysis, notification, escalation, communication, and remediation of data security incidents at appropriate levels so that decisions regarding the public disclosure and reporting of such incidents can be made by management in a timely manner. In particular, the Company’s Incident Response Plan: (i) is designed to identify and detect information security threats through various mechanisms, such as through security controls and third-party disclosures; and (ii) sets forth a process to (a) analyze any such threats detected within the Company’s IT environment or within a third-party’s IT environment, (b) contain cybersecurity threats under various circumstances, and (c) better ensure the Company can recover from cybersecurity incidents to a normal state of business operations. The Company has established and maintains other incident response and recovery plans that address the Company’s response to a cybersecurity incident.
All new hires are required to complete mandatory cybersecurity awareness training upon joining the Company. Follow-on training is then assigned to all employees on a regular basis. Training assignments reinforce the Company’s security and information technology acceptable use policies, while also helping employees identify and properly respond to cybersecurity threats. To help assess and maintain awareness, training is supplemented with simulated phishing e-mails that are sent on a regular basis.
We have cybersecurity insurance (subject to specified retentions or deductibles) related to cybersecurity incidents that addresses costs, losses, and expenses related to cybersecurity investigations, crisis management, notification processes and credit monitoring services, public relations, and legal advice. Additionally, this cybersecurity insurance may cover certain physical injury to, loss or destruction of tangible property, including loss of use thereof, or loss of use of tangible property which has not been physically injured or destroyed. However, damages, fines, and claims arising from such incidents may not be covered or may exceed the amount of any insurance available or may not be insurable.
As part of its cybersecurity program, the Company deploys comprehensive measures to deter, prevent, detect, respond to and mitigate cybersecurity threats, including firewalls, anti-malware, intrusion prevention and detection systems, identity and access controls, software patching protocols, physical security measures, multi-factor authentication, and other tools to detect data exfiltration. The Company periodically assesses and tests the Company’s policies, standards, processes, and practices that are designed to address cybersecurity threats and incidents by assessing current threat intelligence from various sources, including but not limited to, certain key vendors, the United States Cybersecurity & Infrastructure Security Agency (“CISA”), and the open source threat intelligence community via open-source threat intelligence databases. Furthermore, we conduct periodic table top exercises, vulnerability and security testing, and “lessons learned” reviews from internal and industry related cybersecurity incidents. We have a process to report material results of such testing and assessments to the Board and our Audit Committee, and periodically make adjustments to our cybersecurity program based on these exercises and reviews. The Company engages third parties to conduct certain aspects of such testing and to assist with the Managed Detection and Response (“MDR”) of security events as well as the collection and reporting of data for cybersecurity key performance indicators (i.e., KPIs). The Company seeks to identify and oversee cybersecurity risks presented by third parties and their systems from a risk-based perspective through a vendor management program, including annual reviews of key vendors’ adherence to cybersecurity compliance, the monitoring of alerts from CISA, as well as open-source threat intelligence.
Some of our IT systems and products operate within a hosted architecture or by third-party service providers, and if these third-party IT environments fail to operate properly, our systems and products (including our Nokē Smart Entry System) could stop functioning for a period of time, which could put our users at risk. Accordingly, our ability to keep our business operating is highly dependent on the proper and efficient operation of IT service providers, and our vendor management process is an important part of our risk mitigation strategy. In particular, we review Service Organization Controls (“SOC”) reports describing vendors’ compliance with cybersecurity best practices when they are available or an appropriate subset of those controls for vendors who do not have a SOC report. Notwithstanding, if there is a catastrophic event, such as an adverse weather condition, natural disaster, terrorist attack, security breach, or other extraordinary event, we, and our service providers, may be unable to provide our services and products for the duration of the event and/or a time thereafter.
Cybersecurity Governance
In light of the pervasive and increasing threat from cyberattacks, the Board and the Audit Committee, with input from management, assess the Company’s cybersecurity threats and the measures implemented by the Company in an effort to mitigate and prevent cyberattacks. The Audit Committee consults with management regarding ongoing cybersecurity initiatives, and requests that management to report to the Audit Committee or the full Board regularly on their assessment of the Company’s cybersecurity program and risks. Both the Audit Committee (on no less than a quarterly basis) and the full Board (on no less than an annual basis) receive regular reports from our Chief Information Officer (“CIO”) on cybersecurity risks, timely reports regarding any cybersecurity incident that meets established reporting thresholds, as well as ongoing updates regarding any such incident until it has been addressed.
The Company’s information security and cybersecurity program is managed by a dedicated CIO, whose team is responsible for leading enterprise-wide cybersecurity strategy, policy, standards, architecture, and processes. Our CIO has more than 25 years of experience in privately held and publicly traded companies and has an established track record of developing and overseeing cybersecurity programs. Additionally, our CIO holds a Bachelor of Science in Computer Science, a Master of Science in Information Technology, and specializations in AI Product Management and Machine Learning Operations. Our CIO provides periodic reports to our Board and Audit Committee as well as our Chief Financial Officer and other members of our senior management as appropriate. We have also established cross-functional teams to collaborate and communicate on cybersecurity-related issues. The reports to management include updates on the Company’s cyber risks and threats, the status of projects to strengthen the Company’s information security systems, assessments of the information security program, and the emerging threat landscape. Specifically, our management-driven ERM Committee and Incident Response team include executives from key departments across the Company and each work collaboratively to ensure periodic reviews and assessments of the Company’s security environment are being observed.
As of the date of this report, the Company is not aware of any risks from cybersecurity threats that have materially affected or are reasonably likely to materially affect the Company, including its business strategy, results of operations, or financial condition. Additional information on cybersecurity risks we face is discussed in Part I, Item 1A, Risk Factors, which should be read in conjunction with the foregoing information.
Item 2. PROPERTIES
Our headquarters and principal executive office is located in Temple, Georgia. We have five domestic offices, located in Georgia, Utah, and North Carolina and two international offices, located in the United Kingdom. All office locations are leased.
We have ten domestic manufacturing operations, located in Arizona, Georgia, Indiana, North Carolina, and Texas, in addition to three international manufacturing operations, located in Australia, Poland, and the United Kingdom. All of our manufacturing operations are leased. In addition, we have two domestic distribution centers, located in Florida and California, and three international distribution centers, located in Canada and Australia. All distribution centers are leased.
We are of the opinion that the properties are suitable to our respective businesses and have production capacities adequate to meet the current needs of our businesses. Additional expansion in plant facilities, distribution centers, or office space is made as appropriate to balance capacity with anticipated demand and to improve quality and service.
Item 3. LEGAL PROCEEDINGS
From time to time, we are involved in various lawsuits, claims, and legal proceedings that arise in the ordinary course of business. These matters involve, among other things, disputes with vendors or customers, personnel and employment matters, and personal injury or property damage. We assess these matters on a case-by-case basis as they arise and establish reserves as required.
We assess our liabilities and contingencies in connection with outstanding legal proceedings utilizing the latest information available. Where it is probable that we will incur a loss and the amount of the loss can be reasonably estimated, we record a liability in our consolidated financial statements. These legal accruals may be increased or decreased to reflect any relevant developments on a quarterly basis. Where a loss is not probable or the amount of the loss is not estimable, we do not record an accrual, consistent with applicable accounting guidance. In the opinion of management, while the outcome of such claims and disputes cannot be predicted with certainty, our ultimate liability in connection with these matters is not expected to have a material adverse effect on our results of operations, financial position, or cash flows, and the amounts accrued for any individual matter are not material. However, legal proceedings are inherently uncertain. As a result, the outcome of a particular matter or a combination of matters may be material to our results of operations for a particular period, depending upon the size of the loss or our income for that particular period.
As of the date of this Annual Report on Form 10-K, there were no material pending legal proceedings in which we or any of our subsidiaries are a party or to which any of our property is subject.
Item 4. MINE SAFETY DISCLOSURES
Not applicable.
PART II
Item 5. MARKET FOR REGISTRANT’S COMMON EQUITY, RELATED STOCKHOLDER MATTERS AND ISSUER PURCHASES OF EQUITY SECURITIES
Common Stock
Our common stock is listed on the NYSE under the symbol “JBI.” Our certificate of incorporation authorizes the issuance of 825,000,000 shares of common stock with a par value of $0.0001 per share. The Company had 140,003,975 shares of common stock issued and outstanding as of December 28, 2024. The outstanding shares of the Company’s common stock are duly authorized, validly issued, fully paid and non-assessable.
Preferred Stock
Our certificate of incorporation authorizes the issuance of 1,000,000 shares of preferred stock with a par value of $0.0001 per share. As of December 28, 2024, no shares of preferred stock were issued and outstanding, and no designation of rights and preferences of preferred stock had been adopted. Our preferred stock is not quoted on any market or system, and there is not currently a market for our preferred stock.
Holders
As of the close of business on February 21, 2025, there were seven holders of record of our common stock, one of which was Cede & Co., a nominee for The Depository Trust Company, which holds shares of our common stock on behalf of an indeterminate number of beneficial owners, and no holders of record of our preferred stock. The number of holders of record does not include a substantially greater number of “street name” holders or beneficial holders whose common stock are held of record by banks, brokers, and other financial institutions.
Dividend Policy
We have not declared or paid any cash dividends on our common stock or preferred stock to date and do not anticipate declaring or paying any cash dividends on our common stock or preferred stock in the foreseeable future. It is presently intended that we will retain our earnings for use in business operations and, accordingly, it is not anticipated that the Board will declare dividends in the foreseeable future. In addition, the terms of our credit facilities include restrictions on our ability to issue dividends. See “Management’s Discussion and Analysis of Financial Condition and Results of Operations — Liquidity and Capital Resources — Overview” for a discussion of our credit facilities’ restrictions on our subsidiaries’ ability to pay dividends or other payments to us.
Recent Sales of Unregistered Securities
None.
Repurchases
In the future we may repurchase our shares in open market transactions from time to time in accordance with federal securities laws, at our discretion. On February 28, 2024, our Board authorized a $100 share repurchase program. Although our Board has authorized a share repurchase program, the share repurchase program does not obligate us to repurchase any specific dollar amount or to acquire any specific number of shares. The Company may repurchase shares from time to time through open market transactions pursuant to Rule 10b-18 under the Securities Exchange Act of 1934, as amended, in compliance with applicable state and federal securities laws. The timing, as well as the number and value of shares repurchased under the program, will be determined by the Company at its discretion and will depend on a variety of factors, including our assessment of the intrinsic value of the Company’s common stock, the market price of the Company’s common stock, general market and economic conditions, available liquidity, compliance with the Company’s debt and other agreements, applicable legal requirements, the nature of other investment opportunities available to the Company, and other considerations. The Company is not obligated to purchase any shares under the repurchase program, and the program may be suspended, modified, or discontinued at any time without prior notice. The Company expects to fund the repurchases by using cash on hand and expected free cash flow to be generated in the future.
The following table provides information with respect to our purchases of our common stock in the fiscal year ended December 28, 2024:
| | | | | | | | | | | | | | | | | | | | | | | |
| (amounts in millions, except share and per share data) | Total number of shares purchased(1) | | Average price paid per share(2) | | Total number of shares purchased as part of the publicly announced program | | Approximate dollar value of shares that may yet to be purchased under program |
| December 31, 2023 - January 30, 2024 | — | | | $ | — | | | — | | | $ | — | |
| January 31, 2024 - March 1, 2024 | — | | | — | | | — | | | — | |
| March 2, 2024 - April 1, 2024 | 1,019,889 | | | 14.84 | | | 1,019,889 | | | 84.9 | |
| April 2, 2024 - May 2, 2024 | — | | | — | | | — | | | — | |
| May 3, 2024 - June 2, 2024 | — | | | — | | | — | | | — | |
| June 2, 2024 - July 3, 2024 | 753,667 | | | 13.26 | | | 753,667 | | | 74.9 | |
| July 4, 2024 - August 3, 2024 | — | | | — | | | — | | | — | |
| August 4, 2024 - September 4, 2024 | 3,362,721 | | | 10.59 | | | 3,362,721 | | | 43.0 | |
| September 5, 2024 - September 28, 2024 | 902,642 | | | 10.49 | | | 902,642 | | | 29.9 | |
| September 29, 2024 - November 4, 2024 | — | | | — | | | — | | | — | |
| November 5, 2024 - December 5, 2024 | — | | | — | | | — | | | — | |
| December 6, 2024 - December 28, 2024 | 1,102,342 | | | 7.81 | | | 1,102,342 | | | 21.3 | |
| Total | 7,141,261 | | | $ | 11.02 | | | 7,141,261 | | | $ | 21.3 | |
(1)On February 28, 2024, the Company announced that the Board of Directors authorized a share repurchase program, pursuant to which the Company is authorized to purchase up to $100.0 million of its common stock. The repurchase authorization does not have an expiration date and may be terminated by the Company’s Board of Directors at any time.
(2)The share price paid per share is exclusive of $0.9 of commission and excise taxes associated with the share repurchase transactions for the year ended December 28, 2024.
Shareholder Return Performance Graph
The following line graph compares the yearly change in the Company’s cumulative total shareholder return (stock price appreciation plus reinvestment of dividends) on Janus’s common stock with the cumulative total return of (1) the Russell 2000 Index (“Russell 2000”) and (2) the S&P Small Cap 600 Industrial Index (“S&P 600 Industrials Index”). This graph assumes a $100 investment in each of the Company, the S&P 600 Industrials Index, and the Russell 2000 at the close of trading on June 7, 2021.
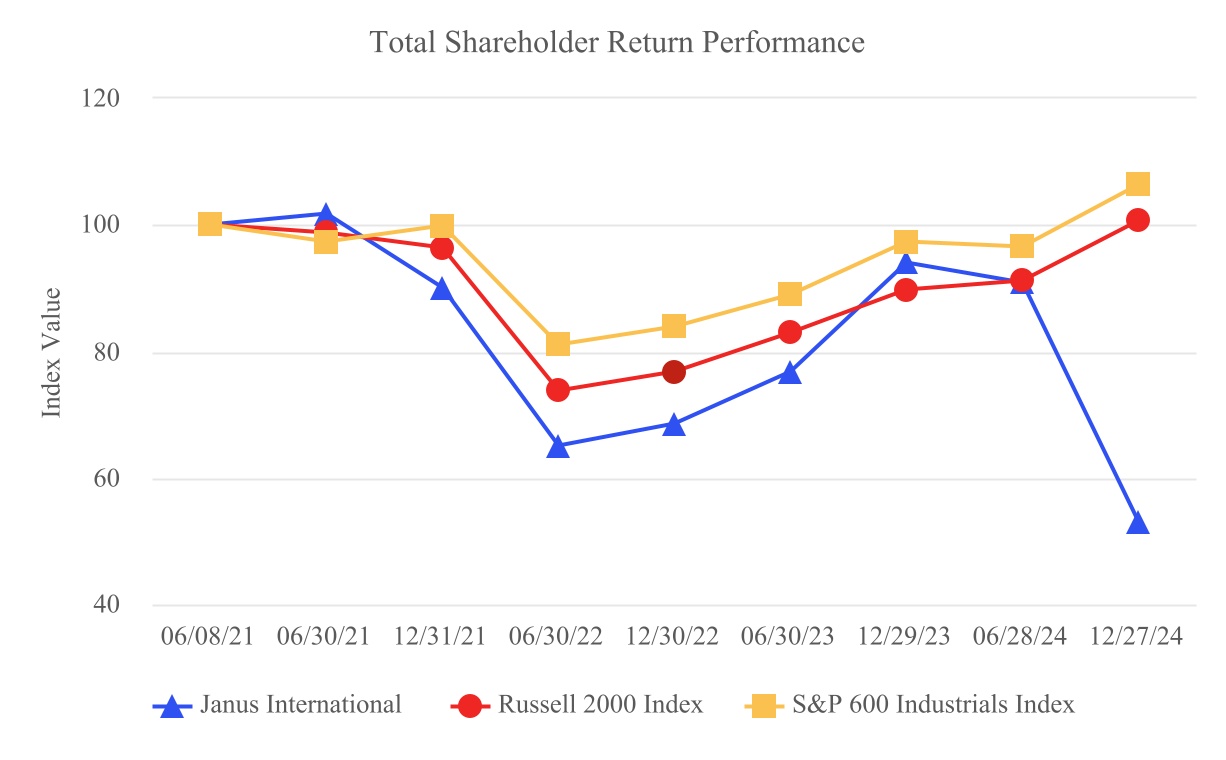
The comparisons shown in the performance graph above are based on historical data, and are not indicative of, and are not intended to forecast, the potential future performance of our common stock. This performance graph shall not be deemed “soliciting material” or to be “filed” with the SEC for purposes of Section 18 of the Exchange Act, or otherwise subject to the liabilities under that Section, and shall not be deemed to be incorporated by reference into any our filings under the Securities Act or the Exchange Act.
Item 6. RESERVED
Item 7. MANAGEMENT’S DISCUSSION AND ANALYSIS OF FINANCIAL CONDITION AND RESULTS OF OPERATIONS
The following discussion and analysis provides information which Janus’s management believes is relevant to an assessment and understanding of the consolidated results of operations and financial condition. You should read the following discussion and analysis of Janus’s financial condition and results of operations in conjunction with the consolidated financial statements and notes thereto contained in this Annual Report on Form 10-K (this “Annual Report”).
See “Management’s Discussion and Analysis of Financial Condition and Results of Operations” included in our Annual Report on Form 10-K filed on February 28, 2024 for discussion and analysis of results of operations for the year ended December 30, 2023.
Certain information contained in this discussion and analysis or set forth elsewhere in this Annual Report, including information with respect to plans and strategy for Janus’s business, includes forward-looking statements that involve risks and uncertainties. As a result of many factors, including those factors set forth in the section entitled “Risk Factors,” Janus’s actual results could differ materially from the results described in or implied by the forward-looking statements contained in the following discussion and analysis. Factors that could cause or contribute to such differences include, but are not limited to, capital expenditures, economic and competitive conditions, regulatory changes and other uncertainties, as well as those factors discussed below and elsewhere in this Annual Report. We assume no obligation to update any of these forward-looking statements.
Unless otherwise indicated or the context otherwise requires, references in this Management’s Discussion and Analysis of Financial Condition and Results of Operations section to “Janus,” “we,” “us,” “our,” and other similar terms refer to Janus International Group Inc. and its subsidiaries.
Percentage amounts included in this Annual Report have not in all cases been calculated on the basis of such rounded figures, but on the basis of such amounts prior to rounding. For this reason, percentage amounts in this Annual Report may vary from those obtained by performing the same calculations using the figures in our consolidated financial statements included elsewhere in this Annual Report. Certain other amounts that appear in this Annual Report may not sum due to rounding.
Dollar amounts are shown in millions of dollars, unless otherwise noted, and rounded to the nearest million except for share
and per share amounts.
Introduction
This Management’s Discussion and Analysis of Financial Condition and Results of Operations (“MD&A”) is a supplement to the accompanying consolidated financial statements and provides additional information on our business, recent developments, financial condition, liquidity and capital resources, cash flows and results of operations. MD&A is organized as follows:
•Business Overview: This section provides a general description of our business, and a discussion of management’s general outlook regarding market demand, our competitive position and product innovation, as well as recent developments that are important to understanding our results of operations and financial condition or in understanding anticipated future trends.
•Basis of Presentation: This section provides a discussion of the basis on which our consolidated financial statements were prepared.
•Results of Operations: This section provides an analysis of our results of operations for the years ended December 28, 2024 and December 30, 2023.
•Liquidity and Capital Resources: This section provides a discussion of our financial condition and an analysis of our cash flows for the years ended December 28, 2024 and December 30, 2023. This section also provides a discussion of our contractual obligations, other purchase commitments and customer credit risk that existed at December 28, 2024, as well as a discussion of our ability to fund our future commitments and ongoing operating activities through internal and external sources of capital.
•Critical Accounting Estimates: This section identifies and summarizes those accounting estimates that significantly impact our reported results of operations and financial condition and require significant judgment or estimates on the part of management in their application.
Business Overview
Janus is a leading global manufacturer and supplier of turn-key self-storage, commercial and industrial building solutions including: roll-up and swing doors, hallway systems, relocatable storage units, and facility and door automation technologies with manufacturing operations in Georgia, Texas, Arizona, Indiana, North Carolina, Poland, United Kingdom (“U.K.”), and Australia. The Company focuses on providing building solutions to two primary markets, providing building solutions to the self-storage industry and the broader commercial industrial market. The self-storage industry is comprised of institutional and non-institutional facilities. Institutional facilities typically include multi-story, climate-controlled facilities located in prime locations owned and/or managed by large REITs or returns-driven operators of scale and are primarily located in the top 50 MSAs, whereas the vast majority of non-institutional facilities are single-story, non-climate controlled facilities located outside of city centers owned and/or managed by smaller private operators that are mostly located outside of the top 50 U.S. MSAs. Janus is highly integrated with customers at every phase of a project, including facility planning/design, construction, access control and restore, rebuild, replace of damaged or end-of-life products.
Our business is operated through two geographic regions that comprise our two reportable segments: Janus North America and Janus International. The Janus International segment is comprised of Janus International Europe Holdings Ltd. (UK), whose production and sales are largely in Europe, the U.K., and Australia. The Janus North America segment is comprised of all the other entities including Janus International Group, Inc., Janus International Group, LLC (“Janus Core”), Betco, Inc. (“BETCO”), Nokē, Inc. (“NOKE”), Asta Industries, Inc. (“ASTA”), Access Control Technologies, LLC (“ACT”), Janus Door, LLC (“Janus Door”), Steel Door Depot.com, LLC (“Steel Door Depot”), Janus International Canada, Ltd. (“Janus Canada”), and Terminal Door, LLC (“Terminal Door”).
Furthermore, our business is comprised of three primary sales channels: New Construction-Self-storage, R3-Self-storage (R3), and Commercial and Other. The Commercial and Other category is primarily comprised of roll-up sheet and rolling steel door sales into the commercial marketplace.
New construction consists of engineering and project management work pertaining to the design, building, and logistics of a greenfield new self-storage facility tailored to customer specifications while being compliant with ADA regulations. Any Nokē Smart Entry System revenue associated with a new construction project also rolls up into this sales channel.
The concept of Janus R3 is to remodel self-storage facilities, including storage unit doors, hallways, ceilings, offices, optimizing unit mix, utilizing vacant land for movable storage units (JBI MASS relocatable storage units), and adding a more robust security solutions to enable customers to: (1) charge higher rental rates and (2) compete with modern self-storage facilities and large operators. In addition, the R3 sales channel also includes new self-storage capacity being brought online through conversions and expansions. R3 transforms self-storage and other facilities through door replacement, facility upgrades, Nokē Smart Entry Systems, and relocatable storage MASS.
Commercial light duty steel roll-up doors are designed for applications that require less frequent and less demanding operations. Janus offers heavy duty commercial grade steel doors (minimized dead-load, or constant weight of the curtain itself) perfect for warehouses, commercial buildings, and freight terminals, designed with a higher gauge and deeper guides, which combat the heavy scale of use with superior strength and durability. Janus also offers rolling steel doors known for minimal maintenance and easy installation with, but not limited to, the following options for; commercial slat doors, heavy duty service doors, fire doors, fire rated counter shutters, insulated service doors, counter shutters and grilles. Following the T.M.C. Acquisition (hereinafter defined), our business expanded to provide trucking terminal renovation, construction, remodeling, and maintenance services to trucking customers in the Southeast United States.
Executive Overview
Janus’s financials reflect the result of the execution of our operational and corporate strategy to penetrate the commercial and industrial storage markets, as well as capitalizing on the aging self-storage facilities, while continuing to diversify our products and solutions. Janus is a bespoke provider of not only products, but solutions that generate a favorable financial outcome for our clients.
•During fiscal year 2024, we introduced our all-new internal hardwired smart lock, Nokē Ion™ and announced our NS Series of enhanced security doors.
•Opened a distribution center in Toronto, Canada to service our Canadian markets and in Mt. Airy, North Carolina to support our commercial market.
•Acquired the assets of T.M.C., a premier provider of terminal maintenance services for the trucking industry in the Southeast.
•Announced a structural cost reduction program.
•Completed a voluntary pay down of $21.9 toward our debt and successfully repriced our term loan, which reduced the interest rate margin by 50 bps.
•Repurchased 7,141,261 shares for $79.6 as part of our previously announced $100.0 share repurchase program.
•Total revenues of $963.8 for the year ended December 28, 2024 compared to $1,066.4 for the year ended December 30, 2023.
•Net income was $70.4 for the year ended December 28, 2024 compared to $135.7 for the year ended December 30, 2023.
•Adjusted EBITDA was $208.5 for the year ended December 28, 2024 compared to $285.6 for the year ended December 30, 2023.
•Adjusted EBITDA as a percentage of revenue was 21.6% for the year ended December 28, 2024 compared to 26.8% for the year ended December 30, 2023.
•Cash flows from operations of $154.0 and free cash flow of $133.8 were generated for the year ended December 28, 2024 compared to $215.0 cash flows from operations and $196.0 free cash flow for the year ended December 30, 2023.
Information regarding use of Adjusted EBITDA and Free Cash Flow non-GAAP measures, and a reconciliation to the most comparable GAAP measure, is included in “Non-GAAP Financial Measures.”
Business Segment Information
Our business is operated through two geographic regions that comprise our two reportable segments: Janus North America and Janus International.
Janus North America is comprised of nine entities including Corporate, Janus Core, Janus Door, Steel Door Depot, ASTA, NOKE, BETCO, ACT and T.M.C. Janus North America produces and provides various fabricated components such as commercial and self-storage doors, walls, hallway systems and building components used primarily by owners or builders of self-storage facilities and also offers installation services along with the products. Janus North America represented 92.4% and 92.3% of Janus’s revenue for the years ended December 28, 2024 and December 30, 2023.
Janus International is comprised of Janus International Europe Holdings Ltd (“Janus Europe Holdings”) and its subsidiaries, Janus International Australia Pty Ltd (“Janus Australia”), Janus International Europe Ltd (“Janus Europe”), Janus International France SARL (“Janus France”), and Janus International Poland sp. z.o.o (“Janus Poland”). The Janus International segment produces and provides similar products and services as Janus North America but largely in Europe, the U.K., and Australia. Janus International represented 7.6% and 7.7% of Janus’s revenue for the years ended December 28, 2024 and December 30, 2023.
Basis of Presentation
The consolidated financial statements have been derived from the accounts of Janus and its wholly owned subsidiaries. Janus’s fiscal year follows a 4-4-5 calendar which generally divides a year into four quarters of 13 weeks, grouped into two 4-week “months” and one 5-week “month.” As a result, some period comparisons are not comparable as one period is longer than the other two. The major advantage of a 4-4-5 calendar is that the end date of the period is always the same day of the week, making manufacturing planning easier as every period is the same length. Our fiscal year is composed of the 52 or 53 weeks ending on the Saturday closest to the last day of December. Fiscal year 2024, ending on December 28, 2024, and fiscal year 2023, ending on December 30, 2023, were both comprised of 52 weeks. All references to years, quarters, and months relate to fiscal periods rather than calendar periods, unless otherwise noted.
We have presented results of operations, including the related discussion and analysis for the year ended December 28, 2024 compared to the year ended December 30, 2023.
Components of Results of Operations
Product revenues. Product revenues represent the sale of products, including steel roll-up and swing doors, rolling steel doors, steel structures, as well as hallway systems and facility and door automation technologies for commercial and self-storage customers. Product revenues are recognized upon transfer of control to the customer, which generally takes place at the point of destination. In certain instances, product revenues include all revenues affiliated with erecting an entire structure for our customers, which is recognized over time. We expect our product revenue may vary from period to period on, among other things, the timing and size of orders and delivery of products and the impact of significant transactions. Revenues are monitored and analyzed as a function of sales reporting within the following sales channels: Self-Storage New Construction, Self-Storage R3, and Commercial and Other.
Service revenues. Service revenue primarily reflects installation services provided to customers for steel structures, steel roll-up and swing doors, hallway systems, and relocatable storage units. Additionally, service revenue includes trucking terminal construction and remodeling, as well as repair and maintenance services tailored to trucking customers. Service revenue is recognized over time as performance obligations are satisfied. Janus maintains close integration with customers throughout all phases of a project, including facility planning and design, construction, access control, and R3 services for damaged or end-of-life products, as well as facility updates driven by market consolidation.
Product cost of revenues. Product cost of revenues includes the manufacturing cost of our steel roll-up and swing doors, rolling steel doors, steel structures, and hallway systems which primarily consists of amounts paid to our third-party contract suppliers, outbound freight, and personnel-related costs directly associated with manufacturing operations, depreciation on certain assets, as well as other as overhead and indirect costs. Product costs of revenues also include all costs affiliated with erecting a self storage facility for our customers. We expect our product cost of revenues to substantially correlate to our product revenues.
Service cost of revenues. Cost of services includes third-party installation subcontractor costs directly associated with the installation of our products. Our cost of revenues include purchase price variance, cost of spare or replacement parts, warranty costs, excess and obsolete inventory charges, shipping costs, and an allocated portion of overhead costs, including depreciation. We expect our service cost of revenues to substantially correlate to our service revenues.
Selling and marketing expense. Selling expenses consist primarily of compensation and benefits of employees engaged in selling activities as well as related travel, advertising, trade shows/conventions, meals and entertainment expenses. We expect selling expenses to substantially correlate to overall revenues, with some deviations for strategic investments.
General and administrative expense. General and administrative (“G&A”) expenses are comprised primarily of expenses relating to employee compensation and benefits, travel, meals and entertainment expenses as well as depreciation, amortization, professional services and public company costs. We expect general and administrative expenses to substantially correlate to overall revenues, with some deviations for strategic investments.
Interest expense. Consists of interest expense on short-term and long-term debt and amortization of deferred financing fees, partially offset by interest income earned on cash equivalents. (see “Long Term Debt” section).
Key Performance Measures
Management evaluates the performance of its reportable segments based on the revenue of products and services, gross profit, and Adjusted EBITDA, which is a non-GAAP financial metric, as a supplemental measure of our performance in order to provide investors with an improved understanding of underlying performance trends. Please see the section titled “Non-GAAP Financial Measures” below for further discussion of this financial measure, including the reasons why we use such financial measures and reconciliations of such financial measures to the nearest GAAP financial measures.
Human capital is also one of the main cost drivers of the manufacturing, selling, and administrative processes of Janus. As a result, headcount generally reflects Janus’s operational status, indicating whether the business is expanding or contracting. While we expect changes in our workforce to generally correlate to our operational performance, certain non-recurring events such as corporate restructuring, could impact general trends related to our headcount as the Company continues to develop an appropriate workforce composition to meet operational demand. As of December 28, 2024 and December 30, 2023, the Company’s headcount was 2,271 (including 388 temporary employees) and 2,305 (including 441 temporary employees), respectively.
The following table sets forth key performance measures for the years ended December 28, 2024 and December 30, 2023
(dollar amounts in millions)
| | | | | | | | | | | | | | | | | | | | | | | |
| Year Ended | | Variance |
| December 28, 2024 | | December 30, 2023 | | $ | | % |
| Total Revenue | $ | 963.8 | | $ | 1,066.4 | | $ | (102.6) | | | (9.6) | % |
| Adjusted EBITDA | $ | 208.5 | | $ | 285.6 | | $ | (77.1) | | | (27.0) | % |
| Adjusted EBITDA (% of revenue) | 21.6 | % | | 26.8 | % | | | | (5.2) | % |
Total revenues decreased by $102.6 or 9.6% for the year ended December 28, 2024 compared to the year ended December 30, 2023, primarily due to the negative impacts of volume declines due to project deferrals as a result of the higher interest rate environment.
Adjusted EBITDA decreased by $77.1 or 27.0% from the year ended December 28, 2024 compared to the year ended December 30, 2023, and Adjusted EBITDA as a percentage of revenue decreased 5.2% for the year ended December 28, 2024 primarily due to the negative impacts of volume declines due to project deferrals and increases in operating expenses. (See “Non-GAAP Financial Measures” section).
Factors Affecting the Results of Operations
Key Factors Affecting the Business and Financial Statements
Management understands Janus’s performance and future growth depends on a number of factors that present significant opportunities but also pose risks and challenges.
Factors Affecting Revenues
Janus’s revenues from products sold are driven by economic conditions, which impacts new construction of self-storage facilities, R3 of self-storage facilities, and commercial revenue.
Janus periodically modifies sales prices of their products due to changes in costs for raw materials, energy, market conditions, labor and logistics costs and the competitive environment. In certain cases, realized price increases are less than the announced price increases because of project pricing, competitive reactions and changing market conditions. Janus also offers a wide assortment of products that are differentiated by style, design and performance attributes. Pricing and margins for products within the assortment vary. In addition, changes in the relative quantity of products purchased at different price points can impact year-to-year comparisons of net sales and operating income.
Service revenue is driven by the product revenue and the increase in value-added services, such as pre-work planning, site drawings, installation and general contracting, project management, and third-party security. Janus differentiates itself through on-time delivery, efficient installation, best in-class service, and a reputation for high quality products.
Factors Affecting Growth Through Acquisitions
Janus’s business strategy involves growth through, among other things, the acquisition of other companies. Janus evaluates companies that it believes will strategically fit into its business and growth objectives, including those that will support its overall strategy of portfolio diversification, geographic expansion, and technological innovation, among other areas of focus. While Janus seeks acquisition opportunities that it believes will augment its business and growth objectives, certain factors could prevent acquisition opportunities from materializing, including target-company availability, relative valuation expectations, and certain due diligence considerations, among other factors.
Factors Affecting Operating Costs
Janus’s operating expenses are comprised of direct production costs (principally raw materials, labor and energy), manufacturing overhead costs, freight, costs to purchase sourced products and selling and marketing, and general and administrative expenses.
Janus’s largest individual raw material expenditure is steel coils. Fluctuations in the prices of steel coil are generally beyond Janus’s control and have a direct impact on the financial results. From time to time, Janus enters into agreements with large suppliers in order to fix steel coil prices for part of Janus’s production needs and partially mitigate the potential impacts of short-term steel coil price fluctuations. These arrangements allow Janus to purchase steel coils for fixed prices as outlined in the contracts. Outbound freight costs are driven by Janus’s volume of product revenues and are subject to the freight market pricing environment.
Results of Operations - Consolidated
The following discussion should be read in conjunction with the consolidated financial statements and related notes included elsewhere in this document. We have derived this data from our consolidated financial statements included elsewhere in this Annual Report. The following tables set forth our results of operations for the periods presented in dollars.
A detailed discussion of the prior year ended December 30, 2023 to the year ended December 31, 2022 year-over-year changes is not included herein and can be found in the Management’s Discussion and Analysis of Financial Condition and Results of Operations section in the year ended December 30, 2023 Annual Report on Form 10-K filed on February 28, 2024.
Results of Operations
(dollar amounts in millions)
For the year ended December 28, 2024 compared to the year ended December 30, 2023
| | | | | | | | | | | | | | | | | | | | | | | |
| Year Ended | | Variance |
| December 28, 2024 | | December 30, 2023 | | $ | | % |
| REVENUE | | | | | | | |
| Product revenues | $ | 779.4 | | | $ | 909.8 | | | $ | (130.4) | | | (14.3) | % |
| Service revenues | 184.4 | | | 156.6 | | | 27.8 | | | 17.8 | % |
| Total revenue | $ | 963.8 | | | $ | 1,066.4 | | | $ | (102.6) | | | (9.6) | % |
| Product cost of revenues | 442.3 | | | 500.8 | | | (58.5) | | | (11.7) | % |
| Service cost of revenues | 123.7 | | | 115.9 | | | 7.8 | | | 6.7 | % |
| Cost of revenues | $ | 566.0 | | | $ | 616.7 | | | $ | (50.7) | | | (8.2) | % |
| GROSS PROFIT | $ | 397.8 | | | $ | 449.7 | | | $ | (51.9) | | | (11.5) | % |
| OPERATING EXPENSE | | | | | | | |
| Selling and marketing | 68.1 | | | 65.5 | | | 2.6 | | | 4.0 | % |
| General and administrative | 171.1 | | | 138.5 | | | 32.6 | | | 23.5 | % |
| Impairment | 12.0 | | | — | | | 12.0 | | | 100.0 | % |
| Operating Expenses | $ | 251.2 | | | $ | 204.0 | | | $ | 47.2 | | | 23.1 | % |
| INCOME FROM OPERATIONS | $ | 146.6 | | | $ | 245.7 | | | $ | (99.1) | | | (40.3) | % |
| Interest expense, net | (49.6) | | | (60.0) | | | 10.4 | | | (17.3) | % |
| Gain on sale of manufacturing facility | 5.0 | | | — | | | 5.0 | | | 100.0 | % |
| Loss on extinguishment and modification of debt | (1.7) | | | (3.9) | | | 2.2 | | | (56.4) | % |
| Other (expense) | — | | | 1.0 | | | (1.0) | | | (100.0) | % |
| Other Expense, Net | $ | (46.3) | | | $ | (62.9) | | | $ | 16.6 | | | (26.4) | % |
| INCOME BEFORE TAXES | $ | 100.3 | | | $ | 182.8 | | | $ | (82.5) | | | (45.1) | % |
| Provision for Income Taxes | 29.9 | | | 47.1 | | | (17.2) | | | (36.5) | % |
| NET INCOME | $ | 70.4 | | | $ | 135.7 | | | $ | (65.3) | | | (48.1) | % |
| | | | | | | |
| Adjusted EBITDA* | $ | 208.5 | | | $ | 285.6 | | | $ | (77.1) | | | (27.0) | % |
*Janus uses measures of performance that are not required by or presented in accordance with GAAP in the United States. Non-GAAP financial performance measures are used to supplement the financial information presented on a GAAP basis. These non-GAAP financial measures should not be considered in isolation or as a substitute for the relevant GAAP measures and should be read in conjunction with information presented on a GAAP basis.
Revenue
| | | | | | | | | | | | | | | | | | | | | | | | | | | | | | | | | | | | | | | | | |
| (dollar amounts in millions) | Year Ended | | Variance | | Variance Breakdown |
| December 28, 2024 | | December 30, 2023 | | $ | | % | | Acquisition Revenue | | Organic Growth | | Organic Growth % |
| Product revenues | $ | 779.4 | | | $ | 909.8 | | | $ | (130.4) | | | (14.3) | % | | $ | — | | | $ | (130.4) | | | (14.3) | % |
| Service revenues | 184.4 | | | 156.6 | | | 27.8 | | | 17.8 | % | | 27.2 | | | $ | 0.6 | | | 0.4 | % |
| Total | $ | 963.8 | | | $ | 1,066.4 | | | $ | (102.6) | | | (9.6) | % | | $ | 27.2 | | | $ | (129.8) | | | (12.2) | % |
Total revenue declined $102.6 for the year ended December 28, 2024 compared to the year ended December 30, 2023. The organic revenue decline for the year ended December 28, 2024 is substantially attributed to a decline in volume associated with customer deferrals of projects based on macroeconomic uncertainty and the interest rate environment. The organic decline was partially offset by $27.2 in inorganic revenue from the T.M.C. Acquisition.
The following table and discussion compares Janus’s revenues by sales channel:
| | | | | | | | | | | | | | | | | | | | | | | | | | | | | | | | | | | |
| Year Ended | | | | Year Ended | | | | Variance |
| (dollar amounts in millions) | December 28, 2024 | | % of revenues | | December 30, 2023 | | % of revenues | | $ | | % |
| New Construction - Self Storage | $ | 416.3 | | | 43.2 | % | | $ | 394.9 | | | 37.0 | % | | $ | 21.4 | | | 5.4 | % |
| R3 - Self Storage | 245.7 | | | 25.5 | % | | 334.9 | | | 31.4 | % | | (89.2) | | | (26.6) | % |
| Commercial and Other | 301.8 | | | 31.3 | % | | 336.6 | | | 31.6 | % | | (34.8) | | | (10.3) | % |
| Total | $ | 963.8 | | | 100.0 | % | | $ | 1,066.4 | | | 100.0 | % | | $ | (102.6) | | | (9.6) | % |
New construction revenues increased by $21.4 or 5.4% for the year ended December 28, 2024 compared to the year ended December 30, 2023. The increase in the year ended December 28, 2024 is primarily due to elevated occupancy rates and continued demand in the first half of the year.
R3 revenues decreased by $89.2 or 26.6% for the year ended December 28, 2024 compared to the year ended December 30, 2023. The R3 sales decrease was due to project deferrals associated with macroeconomic uncertainty as well as an approximately 33% decline in facility expansion and retail big-box conversion activity.
Commercial and other revenues decreased by $34.8 or 10.3% for the year ended December 28, 2024 compared to the year ended December 30, 2023. The decrease was attributable to a decline in volumes for rolling sheet doors in the carport and shed market, partially offset by $27.2 in inorganic revenue from the T.M.C. Acquisition.
Cost of Revenues
| | | | | | | | | | | | | | | | | | | | | | | | | | | | | | | | | | | | | | | | | |
| Year Ended | | Variance | | Variance Breakdown |
| (dollar amounts in millions) | December 28, 2024 | | December 30, 2023 | | $ | | % | | Acquisition Cost | | Organic Growth | | Organic Growth % |
| Product cost of revenues | $ | 442.3 | | | $ | 500.8 | | | $ | (58.5) | | (11.7) | % | | $ | — | | | $ | (58.5) | | | (11.7) | % |
| Service cost of revenues | 123.7 | | | 115.9 | | | 7.8 | | 6.7 | % | | 17.9 | | | $ | (10.1) | | | (8.7) | % |
| Cost of revenues | $ | 566.0 | | | $ | 616.7 | | | $ | (50.7) | | (8.2) | % | | $ | 17.9 | | | $ | (68.6) | | | (11.1) | % |
The cost of revenues decreased $50.7 or 8.2% for the year ended December 28, 2024 compared to the year ended December 30, 2023. The decrease in product cost of revenues of $58.5 for the year ended December 28, 2024 is primarily attributable to the decline in volume. The $7.8 increase in service cost of revenue is primarily attributable to the operational costs of T.M.C., that was acquired in the second quarter of fiscal year 2024.
Operating Expenses - Selling and marketing
Selling and marketing expense increased $2.6 or 4.0% for the year ended December 28, 2024 compared to the year ended December 30, 2023. The increase is primarily the result of an increase in marketing and advertising expenses for strategic purposes.
Operating Expenses - General and administrative
General and administrative expenses increased by $32.6 or 23.5% for the year ended December 28, 2024 compared to December 30, 2023. This was primarily driven by a $15.7 increase in the provision of expected credit losses based on a number of customers that have an elevated risk of not making payment. In addition, there is a higher cost structure as a result of the T.M.C. Acquisition as well as $2.6 of post acquisition expenditures related to the T.M.C. business. Stock-based compensation increased $3.6 as a result of the inclusion of expense associated with three fiscal years of grants in 2024 compared to two years of grant expense in fiscal year 2023. There was also an increase in restructuring charges of $0.9 to support strategic initiatives. Lastly, there was a net $4.9 increase in one-time acquisition charges, relating to various non-recurring professional fees.
Intangible Asset Impairment
For the year ended December 28, 2024, the Company recognized a non-cash impairment of $12.0 on our DBCI tradename primarily due to an overall change in brand strategy for the DBCI tradename. Therefore, we have a lowered expected future revenue, earnings, and cash flow stream associated with the tradename.
Interest Expense, net
Interest expense, net decreased $10.4 to $49.6 or 17.3% for the year ended December 28, 2024 compared to the year ended December 30, 2023 primarily due to a voluntary debt repayment of $21.9 million during the 2024 fiscal year and a voluntary repayment of $85.3 throughout the 2023 fiscal year. The decrease in interest expense is also due to the April 2024 Repricing Agreement, which lowered the overall interest rate, partially offset by the investment in cash equivalents, which resulted in interest income of $2.1 for the year ended December 28, 2024. (See “Liquidity and Capital Resources” section).
Income Taxes
Income tax expense decreased by $17.2 or 36.5% to $29.9 for the year ended December 28, 2024 from $47.1 for the year ended December 30, 2023, due to the year over year decrease of income before taxes.
Net Income
The $65.3 or 48.1% decrease in net income for the year ended December 30, 2023 compared to the year ended December 28, 2024 is largely due to a decrease in revenues and increase in operating expenses partially offset by a decrease in cost of revenues.
Adjusted EBITDA
Adjusted EBITDA decreased by $77.1 or 27.0% for the year ended December 28, 2024 compared to the year ended December 30, 2023, primarily due to a decrease in revenue yielding a decline in gross profit of $45.7 with an increase in general and administrative costs largely attributed to the provision of expected credit losses reserves of $15.7 and an increase in costs associated with the opening of the Poland facility.
Segment Results of Operations
We operate in and report financial results for two segments: North America and International. We have the following sales channels: Self-Storage New Construction, Self-Storage R3, and Commercial and Other.
Gross profit and Adjusted EBITDA are the measures of profit and loss that our Chief Operating Decision Maker (“CODM”) uses to evaluate the financial performance of the business and as the basis for resource allocation, performance reviews and compensation.
Adjusted EBITDA is defined as net income excluding interest expense, income taxes, depreciation, amortization, and other non-operational, non-recurring items. The CODM uses Adjusted EBITDA, a non-GAAP financial measure, as a primary performance metric to assess operating performance, develop future operating plans, and make strategic decisions related to operating expenses and resource allocation, among others.
The segment discussion that follows describes the significant factors contributing to the changes in results for each segment included in net earnings.
Results of Operations - Janus North America
For the year ended December 28, 2024 compared to the year ended December 30, 2023
| | | | | | | | | | | | | | | | | | | | | | | |
| (dollar amounts in millions) | Year Ended | | Variance |
| December 28, 2024 | | December 30, 2023 | | $ | | % |
| REVENUE | | | | | | | |
| Product revenues | $ | 738.6 | | | $ | 865.1 | | | $ | (126.5) | | | (14.6)% |
| Services revenues | 154.0 | | | 120.6 | | | 33.4 | | | 27.7% |
| Total revenue | $ | 892.6 | | | $ | 985.7 | | | $ | (93.1) | | | (9.4)% |
| Product cost of revenues | 410.5 | | | 470.8 | | | (60.3) | | | (12.8)% |
| Service cost of revenues | 102.3 | | | 89.4 | | | 12.9 | | | 14.4% |
| Cost of revenues | $ | 512.8 | | | $ | 560.2 | | | $ | (47.4) | | | (8.5)% |
| GROSS PROFIT | $ | 379.8 | | | $ | 425.5 | | | $ | (45.7) | | | (10.7)% |
| OPERATING EXPENSE | | | | | | | |
| Selling and marketing | 63.6 | | | 62.2 | | | 1.4 | | | 2.3% |
| General and administrative | 157.6 | | | 125.4 | | | 32.2 | | | 25.7% |
| Impairment | 12.0 | | | — | | | 12.0 | | | 100.0% |
| Operating Expenses | $ | 233.2 | | | $ | 187.6 | | | $ | 45.6 | | | 24.3% |
| INCOME FROM OPERATIONS | $ | 146.6 | | | $ | 237.9 | | | $ | (91.3) | | | (38.4)% |
| | | | | | | |
| Adjusted EBITDA* | $ | 206.3 | | | $ | 275.8 | | | $ | (69.5) | | | (25.2)% |
*Janus uses measures of performance that are not required by or presented in accordance with GAAP in the United States. Non-GAAP financial performance measures are used to supplement the financial information presented on a GAAP basis. These non-GAAP financial measures should not be considered in isolation or as a substitute for the relevant GAAP measures and should be read in conjunction with information presented on a GAAP basis.
Revenue
| | | | | | | | | | | | | | | | | | | | | | | | | | | | | | | | | | | | | | | | | |
| (dollar amounts in millions) | Year Ended | | Variance | | Variance Breakdown |
| December 28, 2024 | | December 30, 2023 | | $ | | % | | Acquisition Revenue | | Organic Growth | | Organic Growth % |
Product revenues(1) | $ | 738.6 | | | $ | 865.1 | | | $ | (126.5) | | | (14.6) | % | | $ | — | | | $ | (126.5) | | | (14.6) | % |
| Service revenues | 154.0 | | | 120.6 | | | 33.4 | | | 27.7 | % | | 27.2 | | | $ | 6.2 | | | 5.1 | % |
| Total revenue | $ | 892.6 | | | $ | 985.7 | | | $ | (93.1) | | | (9.4) | % | | $ | 27.2 | | | $ | (120.3) | | | (12.2) | % |
(1) Product revenues include product revenues transferred at a point in time and product revenues transferred over time.
Total revenue declined $93.1 for the year ended December 28, 2024 compared to the year ended December 30, 2023. The organic revenue decline for the year ended December 28, 2024 is substantially attributed to a decline in volume associated with customer deferrals of projects based on macroeconomic uncertainty and the interest rate environment. The organic decline was partially offset by $27.2 in inorganic revenue from the T.M.C. Acquisition.
The following table and discussion compares Janus North America revenues by sales channel.
| | | | | | | | | | | | | | | | | | | | | | | | | | | | | | | | | | | |
| (dollar amounts in millions) | Year Ended | | Variance |
| December 28, 2024 | | % of total revenues | | December 30, 2023 | | % of total revenues | | $ | | % |
| New Construction - Self Storage | $ | 354.0 | | | 39.7 | % | | $ | 321.7 | | | 32.6 | % | | $ | 32.3 | | | 10.0 | % |
| R3 - Self Storage | 234.3 | | | 26.2 | % | | 325.8 | | | 33.1 | % | | (91.5) | | | (28.1) | % |
| Commercial and Other | 304.3 | | | 34.1 | % | | 338.2 | | | 34.3 | % | | (33.9) | | | (10.0) | % |
| Total | $ | 892.6 | | | 100.0 | % | | $ | 985.7 | | | 100.0 | % | | $ | (93.1) | | | (9.4) | % |
New Construction revenues increased by $32.3 or 10.0% for the year ended December 28, 2024 compared to the year ended December 30, 2023 primarily due to elevated occupancy rates and continued demand in the first half of the year.
R3 revenues decreased by $91.5 or 28.1% for the year ended December 28, 2024 compared to the year ended December 30, 2023. The R3 sales decrease was due to project deferrals associated with macroeconomic uncertainty as well as an approximately 33% decline in facility expansion and retail big-box conversion activity.
Commercial and Other revenues decreased by $33.9 or 10.0% for the year ended December 28, 2024 compared to the year ended December 30, 2023. The decrease was attributable to a decline in volumes for rolling sheet doors in the carport and shed market, offset by $27.2 in inorganic revenue from the T.M.C. Acquisition.
Cost of Revenues
| | | | | | | | | | | | | | | | | | | | | | | | | | | | | | | | | | | | | | | | | |
| (dollar amounts in millions) | Year Ended | | Variance | | Variance Breakdown |
| December 28, 2024 | | December 30, 2023 | | $ | | % | | Acquisition Cost | | Organic Growth | | Organic Growth % |
| Product cost of revenues | $ | 410.5 | | $ | 470.8 | | $ | (60.3) | | (12.8) | % | | $ | — | | | $ | (60.3) | | | (12.8) | % |
| Service cost of revenues | 102.3 | | 89.4 | | 12.9 | | 14.4 | % | | 17.9 | | | $ | (5.0) | | | (5.6) | % |
| Cost of revenues | $ | 512.8 | | $ | 560.2 | | $ | (47.4) | | (8.5) | % | | $ | 17.9 | | | $ | (65.3) | | | (11.7) | % |
The cost of revenues decreased $47.4 or 8.5% for the year ended December 28, 2024 compared to the year ended December 30, 2023. The decrease in product cost of revenues of $60.3 for the year ended December 28, 2024 is primarily attributable to the decline in volume. The $12.9 increase in service cost of revenue is primarily attributable to the T.M.C. Acquisition partially offset by the decline in organic volume for the year ended December 28, 2024 compared to the year ended December 30, 2023.
Operating Expenses - Selling and marketing
Selling and marketing expenses increased $1.4 or 2.3% for the year ended December 28, 2024 compared to the year ended December 30, 2023. The increase is primarily the result of increases in payroll, marketing, and advertising expenses.
Operating Expenses - General and administrative
General and administrative expenses increased $32.2 or 25.7% for the year ended December 28, 2024 compared to the year ended December 30, 2023. This was primarily driven by a $15.7 increase in the provision of expected credit losses based on a number of customers that have an elevated risk of not making payment. Operating expense depreciation increased by $1.8 as a result of the increased investment in property, plant and equipment. As a result of the T.M.C. Acquisition, there are approximately $2.6 additional inorganic expenses. Stock-based compensation increased $3.6 as a result of the inclusion of expense associated with three fiscal years of grants in 2024 compared to two years of grant expense in fiscal year 2023. Restructuring charges increased by $0.9 to support strategic initiatives. Lastly, there was a net $4.9 increase in one-time acquisition charges, relating to various non-recurring professional fees.
Intangible Asset Impairment
For the year ended December 28, 2024. the Company recognized a non-cash impairment of $12.0 on our DBCI tradename primarily due to an overall change in brand strategy for the DBCI tradename. The Company implemented a strategic decision to focus the use of the DBCI tradename toward the Commercial markets on a going forward basis. The DBCI tradename will no longer be a focus within the self-storage industry. Therefore, we have lowered expected future revenue, earnings, and cash flow stream associated with the tradename.
Income from Operations
Income from operations decreased by $91.3 or 38.4% for the year ended December 28, 2024 compared to the year ended December 30, 2023. The decrease is primarily due to a decline in sales volume and fixed cost leverage, the intangible asset impairment charge and the increase in general and administrative expenses.
Adjusted EBITDA
Adjusted EBITDA decreased by $69.5 or 25.2% for the year ended December 28, 2024 compared to the year ended December 30, 2023, primarily due to a decrease in revenue yielding a decline in gross profit of $45.7 with an increase in general and administrative costs largely attributed to the provision of expected credit losses reserves of $15.7.
Results of Operations - Janus International
For the year ended December 28, 2024 compared to the year ended December 30, 2023
| | | | | | | | | | | | | | | | | | | | | | | |
| (dollar amounts in millions) | Year Ended | | Variance |
| December 28, 2024 | | December 30, 2023 | | $ | | % |
| REVENUE | | | | | | | |
| Product revenues | $ | 43.2 | | | $ | 46.3 | | | $ | (3.1) | | | (6.7) | % |
| Services revenues | 30.4 | | | 36.0 | | | (5.6) | | | (15.6) | % |
| Total revenue | $ | 73.6 | | | $ | 82.3 | | | $ | (8.7) | | | (10.6) | % |
| Product cost of revenues | 33.3 | | | 31.7 | | | 1.6 | | | 5.0 | % |
| Service cost of revenues | 22.3 | | | 26.4 | | | (4.1) | | | (15.5) | % |
| Cost of revenues | $ | 55.6 | | | $ | 58.1 | | | $ | (2.5) | | | (4.3) | % |
| GROSS PROFIT | $ | 18.0 | | | $ | 24.2 | | | $ | (6.2) | | | (25.6) | % |
| OPERATING EXPENSE | | | | | | | |
| Selling and marketing | 4.5 | | | 3.3 | | | 1.2 | | | 36.4 | % |
| General and administrative | 13.5 | | | 13.1 | | | 0.4 | | | 3.1 | % |
| Operating Expenses | $ | 18.0 | | | $ | 16.4 | | | $ | 1.6 | | | 9.8 | % |
| INCOME FROM OPERATIONS | $ | — | | | $ | 7.8 | | | $ | (7.8) | | | (100.0) | % |
| | | | | | | |
| Adjusted EBITDA* | $ | 2.2 | | | $ | 9.8 | | | $ | (7.6) | | | (77.6) | % |
*Janus uses measures of performance that are not required by or presented in accordance with GAAP in the United States. Non-GAAP financial performance measures are used to supplement the financial information presented on a GAAP basis. These non-GAAP financial measures should not be considered in isolation or as a substitute for the relevant GAAP measures and should be read in conjunction with information presented on a GAAP basis.
Revenue
| | | | | | | | | | | | | | | | | | | | | | | | | | | | | | | | | | | | | | | | | |
| (dollar amounts in millions) | Year Ended | | Variance | | Variance Breakdown |
| December 28, 2024 | | December 30, 2023 | | $ | | % | | Acquisition Revenue | | Organic Growth | | Organic Growth % |
| Product revenues | $ | 43.2 | | | $ | 46.3 | | | $ | (3.1) | | | (6.7) | % | | $ | — | | | $ | (3.1) | | | (6.7) | % |
| Services revenues | 30.4 | | | 36.0 | | | (5.6) | | | (15.6) | % | | — | | | $ | (5.6) | | | (15.6) | % |
| Total revenues | $ | 73.6 | | | $ | 82.3 | | | $ | (8.7) | | | (10.6) | % | | $ | — | | | $ | (8.7) | | | (10.6) | % |
The $8.7 or 10.6% decrease in revenues is primarily due to a decline in volume as a result of the U.K. recessionary period during the first half of fiscal year 2024.
The following table illustrates the revenues by sales channel for the years ended December 28, 2024 and December 30, 2023.
| | | | | | | | | | | | | | | | | | | | | | | | | | | | | | | | | | | |
| (dollar amounts in millions) | Year Ended | | Variance |
| December 28, 2024 | |
% of total revenues | | December 30, 2023 | |
% of total revenues | | $ | | % |
| New Construction - Self Storage | $ | 62.2 | | | 84.5 | % | | $ | 73.2 | | | 88.9 | % | | $ | (11.0) | | (15.0)% |
| R3 - Self Storage | 11.4 | | | 15.5 | % | | 9.1 | | | 11.1 | % | | 2.3 | | 25.3 | % |
| Total | $ | 73.6 | | | 100.0 | % | | $ | 82.3 | | | 100.0 | % | | $ | (8.7) | | (10.6) | % |
New Construction revenues decreased by $11.0 or 15.0% for the year ended December 28, 2024 compared to the year ended December 30, 2023. The decrease in New Construction revenues is primarily due to a decline in volume as a result of the U.K. recessionary period during the first half of fiscal year 2024.
R3 revenues increased by $2.3 or 25.3% for the year ended December 28, 2024 compared to the year ended December 30, 2023.
Cost of revenues
| | | | | | | | | | | | | | | | | | | | | | | | | | | | | | | | | | | | | | | | | |
| (dollar amounts in millions) | Year Ended | | Variance | | Variance Breakdown |
| December 28, 2024 | | December 30, 2023 | | $ | | % | | Acquisition Cost | | Organic Growth | | Organic Growth % |
| Product cost of revenues | $ | 33.3 | | | $ | 31.7 | | | $ | 1.6 | | | 5.0 | % | | $ | — | | | $ | 1.6 | | | 5.0 | % |
| Service cost of revenues | 22.3 | | | 26.4 | | | (4.1) | | | (15.5) | % | | 17.9 | | | $ | (22.0) | | | (83.3) | % |
| Cost of revenues | $ | 55.6 | | | $ | 58.1 | | | $ | (2.5) | | | (4.3) | % | | $ | 17.9 | | | $ | (20.4) | | | (35.1) | % |
Cost of revenues decreased by $2.5 or 4.3% for the year ended December 28, 2024 compared to the year ended December 30, 2023. The change in cost of revenues is generally aligned with the changes in revenues following volume activity, slightly offset by an increase in fixed costs related to the manufacturing plant located in Poland, which was fully operational for the year ended December 28, 2024.
Operating Expenses - General and administrative
General and administrative expenses increased $0.4 or 3.1% for the year ended December 28, 2024 compared to the year ended December 30, 2023. The increase for the year ended December 28, 2024 is primarily due to the higher cost structure with an additional manufacturing plant located in Poland, which opened in late fiscal year 2023 and was operational during the full fiscal year 2024.
Income from Operations
Income from operations decreased by $7.8 for the year ended December 28, 2024 compared to the year ended December 30, 2023. The decrease for the periods is primarily due to a decrease in sales volume and decline from fixed cost leverage.
Adjusted EBITDA
Adjusted EBITDA decreased by $7.6 or 77.6% compared to the year ended December 30, 2023, primarily due to a decline in revenues and an increase in our cost structure associated with our Poland manufacturing plant.
Results of Operations - Eliminations
Eliminations include transactions to account for intercompany activity. The eliminations necessary to arrive at consolidated financial information activity for the years December 28, 2024 and December 30, 2023 are as follows:
| | | | | | | | | | | |
| (dollar amounts in millions) | Year Ended |
| Revenues | December 28, 2024 | | December 30, 2023 |
| North America Segment revenues | $ | 892.6 | | | $ | 985.7 | |
| International Segment revenues | 73.6 | | | 82.3 | |
| Intersegment Eliminations | (2.4) | | | (1.6) | |
| Consolidated total revenues | $ | 963.8 | | | $ | 1,066.4 | |
| | | | | | | | | | | |
| Year Ended |
| Cost of revenues | December 28, 2024 | | December 30, 2023 |
| North America Segment cost of revenues | $ | 512.8 | | | $ | 560.2 | |
| International Segment cost of revenues | 55.6 | | | 58.1 | |
| Intersegment Eliminations | (2.4) | | | (1.6) | |
| Consolidated total cost of revenues | $ | 566.0 | | | $ | 616.7 | |
| | | | | | | | | | | | | | | | | | | | | | | |
| |
| Revenues by sales channel | North America Revenues | | International Revenues | | Eliminations | | Consolidated Revenues |
| December 28, 2024 | | | | | | | |
| New Construction - Self Storage | $ | 354.0 | | | $ | 62.2 | | | $ | — | | | $ | 416.2 | |
| R3 - Self Storage | 234.3 | | | 11.4 | | | — | | | 245.7 | |
| Commercial and Other | 304.3 | | | — | | | (2.4) | | | 301.9 | |
| $ | 892.6 | | | $ | 73.6 | | | $ | (2.4) | | | $ | 963.8 | |
| December 30, 2023 | | | | | | | |
| New Construction - Self Storage | $ | 321.7 | | | $ | 73.2 | | | — | | | $ | 394.9 | |
| R3 - Self Storage | 325.8 | | | 9.1 | | | — | | | 334.9 | |
| Commercial and Other | 338.2 | | | — | | | (1.6) | | | 336.6 | |
| $ | 985.7 | | | $ | 82.3 | | | $ | (1.6) | | | $ | 1,066.4 | |
Non-GAAP Financial Measures
Janus uses measures of performance that are not required by or presented in accordance with GAAP in the United States. Non-GAAP financial performance measures are used to supplement the financial information presented on a GAAP basis. These non-GAAP financial measures should not be considered in isolation or as a substitute for the relevant GAAP measures and should be read in conjunction with information presented on a GAAP basis.
Adjusted EBITDA
Janus presents Adjusted EBITDA which is a non-GAAP financial performance measure, which excludes from reported GAAP results, the impact of certain items consisting of acquisition events and other non-recurring charges. Management believes Adjusted EBITDA allows investors to evaluate the Company’s operating performance and compare our results of operations from period to period on a consistent basis by excluding items that management does not believe are indicative of our core operating performance. EBITDA is earnings before interest, taxes, depreciation, and amortization.
Adjusted EBITDA is used by Janus to evaluate its operating performance, generate future operating plans, and make strategic decisions, including those relating to operating expenses and the allocation of internal resources. Accordingly, these measures provide useful information to investors and others in understanding and evaluating Janus’s operating results in the same manner as its management and board of directors. In addition, they provide useful measures for period-to-period comparisons of Janus’s business, as they remove the effect of certain non-cash items and certain variable charges. Adjusted EBITDA is defined as net income excluding interest expense, income taxes, depreciation expense, amortization, and other non-operational, non-recurring items.
Adjusted EBITDA should not be considered in isolation of, or as an alternative to, measures prepared in accordance with GAAP. There are a number of limitations related to the use of Adjusted EBITDA rather than net income, which is the nearest GAAP equivalent of Adjusted EBITDA. These limitations include that the non-GAAP financial measures:
•exclude depreciation and amortization, and although these are non-cash expenses, the assets being depreciated may be replaced in the future;
•do not reflect interest expense, or the cash requirements necessary to service interest on debt, which reduces cash available;
•do not reflect the provision for or benefit from income tax that may result in payments that reduce cash available;
•exclude non-recurring items which are unlikely to occur again and have not occurred before (e.g., corporate restructuring); and
•exclude non-cash impairments, non-cash gains or losses on the sale of property, plant and equipment (“PP&E”), other non-cash items and one-time charges;
•may not be comparable to similar non-GAAP financial measures used by other companies, because the expenses and other items that Janus excludes in the calculation of these non-GAAP financial measures may differ from the expenses and other items, if any, that other companies may exclude from these non-GAAP financial measures when they report their operating results.
Because of these limitations, these non-GAAP financial measures should be considered along with other operating and financial performance measures presented in accordance with GAAP. The following table presents a reconciliation of net income to Adjusted EBITDA for the periods indicated:
| | | | | | | | | | | | | | | | | | | | | | | |
| (dollar amounts in millions) | Year Ended | | Variance |
| December 28, 2024 | | December 30, 2023 | | $ | | % |
| Net Income | $ | 70.4 | | | $ | 135.7 | | | $ | (65.3) | | | (48.1) | % |
| Interest expense, net | 49.6 | | | 60.0 | | | (10.4) | | | (17.3) | % |
| Income taxes | 29.9 | | | 47.1 | | | (17.2) | | | (36.5) | % |
| Depreciation | 12.0 | | | 9.3 | | | 2.7 | | | 29.0 | % |
| Amortization | 32.0 | | | 29.8 | | | 2.2 | | | 7.4 | % |
| EBITDA* | $ | 193.9 | | | $ | 281.9 | | | $ | (88.0) | | | (31.2) | % |
Restructuring (income) expense(1) | (2.9) | | | 1.2 | | | (4.1) | | | (341.7) | % |
Impairment(2) | 12.0 | | | — | | | 12.0 | | | 100.0 | % |
Loss on extinguishment and modification of debt(3) | 1.7 | | | 3.9 | | | (2.2) | | | (56.4) | % |
Acquisition expense (income)(4) | 3.5 | | | (1.4) | | | 4.9 | | | (350.0) | % |
| Other | 0.3 | | | — | | | 0.3 | | | 100.0 | % |
| Adjusted EBITDA* | $ | 208.5 | | | $ | 285.6 | | | $ | (77.1) | | | (27.0) | % |
(1)Restructuring (income) expense consist of the following: 1) facility relocations; 2) severance and hiring costs associated with our strategic transformation, including executive leadership team changes; 3) sale of a manufacturing facility; and 4) strategic business assessment and transformation projects.
(2)Impairment consists of the write down of the DBCI tradename intangible asset.
(3)Adjustments for loss on extinguishment and modification of debt are related to the write off of unamortized fees and third-party fees as a result of the debt modification completed in April 2024 and the debt refinancing of its existing certain First Lien Credit and Guarantee Agreement, dated as of February 12, 2018 (as amended to date, the “First Lien Term Loan”) pursuant to Amendment No. 6 to the First Lien Term Loan, that occurred in August 2023 (the “Amendment No. 6 First Lien”).
(4)Expenses or income related to various professional fees, net working capital finalization, and legal settlements from acquisition related activities.
*Janus uses measures of performance that are not required by or presented in accordance with GAAP in the United States. Non-GAAP financial performance measures are used to supplement the financial information presented on a GAAP basis. These non-GAAP financial measures should not be considered in isolation or as a substitute for the relevant GAAP measures and should be read in conjunction with information presented on a GAAP basis.
Adjusted Net Income
Adjusted Net Income is defined as net income attributable to shareholders, which excludes from reported GAAP results, the impact of certain items consisting of acquisition events and other non-recurring charges. Similar to Adjusted EBITDA, such expenses, charges, and gains are excluded since they are not indicative of Janus’s normal, ongoing operations, and their inclusion in results makes for more difficult comparisons between years and with peer group companies.
We use Adjusted Net Income to facilitate a comparison of our operating performance on a consistent basis from period to period that, when viewed in combination with our results prepared in accordance with U.S. GAAP, provides a more complete understanding of factors and trends affecting our business than does U.S. GAAP measures alone. Adjusted net income should not be considered in isolation of, or as an alternative to, measures prepared in accordance with GAAP.
The following table presents a reconciliation of net income to adjusted net income for the periods indicated:
| | | | | | | | | | | |
| Year Ended |
| (dollar amounts in millions) | December 28, 2024 | | December 30, 2023 |
| Net Income | $ | 70.4 | | | $ | 135.7 | |
Net Income Adjustments(1) | 14.6 | | | 3.7 | |
Tax Effect on Net Income Adjustments(2) | (4.4) | | | (1.0) | |
Out of period adjustments(3) | $ | 1.5 | | | $ | — | |
| Non-GAAP Adjusted Net Income* | $ | 82.1 | | | $ | 138.4 | |
(1)Refer to the Adjusted EBITDA table above for detailed breakout of adjustment items.
(2)Tax effected for the net income adjustments. Effective tax rates of 29.8% and 25.8% were used for the periods ended December 28, 2024 and December 30, 2023, respectively.
(3)Out of period adjustments includes a tax correction of $3.4 partially offset by a reduction in service cost of revenues of $1.9, net of tax.
*Janus uses measures of performance that are not required by or presented in accordance with GAAP in the United States. Non-GAAP financial performance measures are used to supplement the financial information presented on a GAAP basis. These non-GAAP financial measures should not be considered in isolation or as a substitute for the relevant GAAP measures and should be read in conjunction with information presented on a GAAP basis.
Free Cash Flow
The Company uses a measure of free cash flow to facilitate an understanding of its ability to generate cash for reinvestment into its businesses. We define “Free Cash Flow” as cash flow from operating activities, less cash used in purchases of property plant and equipment. Free Cash Flow is not intended as an alternative measure of cash flow from operations, as determined in accordance with GAAP in the United States. We use this financial measure both in presenting results to shareholders and the investment community and in our internal evaluation and management of our businesses. We believe that this financial measure and the information it provides are useful to investors because it permits investors to view our performance using the same tool that we use to gauge progress in achieving our goals. We believe that the non-GAAP financial measure “Free Cash Flow” is also useful to investors because it is an indication of cash flow that may be available to fund investments in future growth initiatives. Free Cash Flow should not be considered in isolation of, or as an alternative to, measures prepared in accordance with GAAP.
The following table presents a reconciliation of cash flows provided by operating activities to Free Cash Flow for the periods indicated:
| | | | | | | | | | | |
| (dollar amounts in tables in millions) | Year Ended |
| December 28, 2024 | | December 30, 2023 |
| Cash flow from operating activities | $ | 154.0 | | $ | 215.0 |
| Less: Purchases of property, plant and equipment | (20.1) | | (19.0) |
| Free Cash Flow* | $ | 133.9 | | $ | 196.0 |
| | | |
| GAAP Net Income | $ | 70.4 | | $ | 135.7 |
| Non-GAAP Adjusted Net Income* | $ | 82.1 | | $ | 138.4 |
| | | |
| Operating Cash Flow to GAAP Net Income | 219 | % | | 158 | % |
| Free Cash Flow to Non-GAAP Adjusted Net Income (“conversion”)* | 163 | % | | 142 | % |
*Janus uses measures of performance that are not required by or presented in accordance with GAAP in the United States. Non-GAAP financial performance measures are used to supplement the financial information presented on a GAAP basis. These non-GAAP financial measures should not be considered in isolation or as a substitute for the relevant GAAP measures and should be read in conjunction with information presented on a GAAP basis.
Net Leverage Ratio
The Company uses the net leverage ratio as a metric to assess liquidity and the flexibility of its balance sheet. Consistent with other liquidity metrics, the Company monitors the net leverage ratio as a measure to determine the appropriate level of debt the Company believes is optimal to operate its business, and accordingly, to quantify debt capacity available for strengthening the balance sheet for strategic capital allocation and deployment through investments in the business, and for returning capital to the shareholders. The net leverage ratio is the ratio of our consolidated senior secured indebtedness reduced by cash to our trailing four-quarter consolidated EBITDA. Net leverage ratio and, net debt should not be considered in isolation of, or as alternatives to, measures prepared in accordance with GAAP.
The following table presents a reconciliation of Long-Term Debt to Net Debt and Long-Term Debt to Net Income Ratio to Net Leverage Ratio for the periods indicated:
| | | | | | | | | | | |
| (dollar amounts in tables in millions) | Year Ended |
| December 28, 2024 | | December 30, 2023 |
| Note payable - First Lien | $ | 598.5 | | | $ | 623.4 | |
| Less: Cash | 149.3 | | | 171.7 | |
| Net Debt* | $ | 449.2 | | | $ | 451.7 | |
| | | |
| Net Income | $ | 70.4 | | | $ | 135.7 | |
| Adjusted EBITDA | $ | 208.5 | | | $ | 285.6 | |
| | | |
| Long-Term Debt to Net Income | 8.5 | | | 4.6 | |
| Non-GAAP Net Leverage Ratio* | $ | 2.2 | | | $ | 1.6 | |
*Janus uses measures of performance that are not required by or presented in accordance with GAAP in the United States. Non-GAAP financial performance measures are used to supplement the financial information presented on a GAAP basis. These non-GAAP financial measures should not be considered in isolation or as a substitute for the relevant GAAP measures and should be read in conjunction with information presented on a GAAP basis.
Credit Ratings
Costs of borrowing and their respective ability to access the capital markets are affected not only by market conditions but also by the short-term and long-term credit ratings assigned to our respective debt by the major credit rating agencies.
In determining our credit ratings, the rating agencies consider a number of quantitative factors, including but not limited to, debt to total capitalization, operating cash flow relative to outstanding debt, and operating cash flow coverage of interest. In addition, the rating agencies consider qualitative factors such as consistency of our earnings over time and the quality of our management and business strategy.
Our debt is rated by two rating agencies: Standard & Poor’s Corporation (S&P) and Moody’s Investors Service (Moody’s). As of December 28, 2024, our outlook and current debt ratings are as follows:
| | | | | | | | | | | |
| S&P | | Moody’s |
| Corporate | B+ | | Ba3 |
Senior secured long-term debt(1) | BB- | | Ba3 |
| Outlook | Positive | | Positive |
(1) A credit rating is not a recommendation to buy, sell or hold securities. Our credit ratings may be revised or withdrawn at any time by the rating agencies, and each rating should be evaluated independently of any other rating. There can be no assurance that a rating will remain in effect for any given period of time or that a rating will not be lowered, or withdrawn entirely, by a rating agency if, in its judgment, circumstances so warrant.
Liquidity and Capital Resources
We assess our liquidity in terms of our ability to generate cash to fund our operating, investing and financing activities. In doing so, we review and analyze our current cash on hand, days sales outstanding, inventory turns, days payable outstanding, capital expenditure forecasts, interest and principal payments on debt and income tax payments.
Our primary sources of liquidity include cash balances on hand, cash flows from operations, proceeds from equity, debt offerings and borrowing availability under our existing credit facility. Based on the information available as of the date of this Annual Report, our operating cash flow, along with funds available under the line of credit, adequately support Janus’s liquidity and financing needs, including working capital requirements, capital expenditures, debt servicing, and potential acquisitions. The Company believes it will have sufficient working capital to fund operations for at least the next 12 months from the date of issuance of these financial statements.
Financial Policy
Our financial policy seeks to: (i) selectively invest in organic and inorganic growth to enhance our portfolio, including certain strategic capital investments, (ii) maintain appropriate leverage by using free cash flows to repay outstanding borrowings, and (iii) allocate capital toward repurchases of our common stock.
Liquidity Policy
We maintain a strong focus on liquidity and define our liquidity risk tolerance based on sources and uses to maintain a sufficient liquidity position to meet our obligations under both normal and stressed conditions. At Janus, we manage our liquidity to provide access to sufficient funding to meet our business needs and financial obligations, as well as capital allocation and growth objectives throughout business cycles.
Cash Management
Janus manages its operating cash management activities through banking relationships for the domestic entities and international entities. Domestic subsidiaries monitor cash balances on a monthly basis and excess cash is transferred to Janus to pay down intercompany debt, interest on the intercompany debt, and intercompany sales of products and materials and other services. International subsidiaries monitor excess cash balances on a periodic basis and transfer excess cash flow to Janus in the form of a dividend. Janus compiles a monthly standalone business unit and consolidated 13-week cash flow forecast to monitor various cash activities and forecast cash balances to fund operational activities.
Foreign Exchange
We have operations in various foreign countries, principally the United Kingdom, France, Australia, Canada and Poland. Therefore, changes in the value of the related currencies affect our financial statements when translated into U.S. dollars.
Debt Profile
| | | | | | | | | | | | | | | | | | | | | | | | | | | | | | | | | | | |
| Principal Amount | | Issuance Date | | Maturity Date | | Interest Rate | | Net Carrying Value |
| (dollar amounts in millions) | | | | | December 28, 2024 | | December 30, 2023 |
| Notes payable - First Lien | $ | 600.0 | | | August 3, 2023(1) | | August 3, 2030 | | 7.07% (2) | | $ | 598.5 | | | $ | 623.4 | |
| Financing leases | | | | | | | | | 3.4 | | | 3.4 | |
| Total principal debt | | | | | | | | | $ | 601.9 | | | $ | 626.8 | |
| Less: unamortized deferred finance fees | | | | | | | | | 9.9 | | | 11.8 | |
| Less: current portion of long-term debt | | | | | | | | | 8.8 | | | 7.3 | |
| Long-term debt, net of current portion | | | | | | | | | $ | 583.2 | | | $ | 607.7 | |
(1)Represents the original issuance date for the First Lien Term Loan. Subsequent to the original issuance of the First Lien Term Loan, the Company has amended the First Lien Term Loan on a number of occasions, including most recently on April 30, 2024 when the Company completed a repricing pursuant to the Repricing Amendment described below.
(2)The interest rate on the Repricing Amendment as of December 28, 2024, was 7.07%, which is a variable rate based on Adjusted Term SOFR plus an applicable margin of 2.50%.
First Lien Term Loan - On June 20, 2023, the Company entered into Amendment No. 5 to the First Lien Term Loan (the “Amendment No. 5 First Lien”). The Amendment No. 5 First Lien, among other things, (i) replaces the interest rate based on the London Interbank Offered Rate (“LIBOR”) and related LIBOR-based mechanics applicable to borrowings under the Agreement with an interest rate based on the Secured Overnight Financing Rate (“SOFR”) and related SOFR-based mechanics and (ii) updates certain other provisions of the Agreement to reflect the transition from LIBOR to SOFR. As chosen by the Company, the amended loan bears interest at a floating rate per annum consisting of Adjusted Term SOFR, plus 0.10% credit spread adjustment (“CSA”) and an applicable margin. The debt is secured by substantially all business assets. For the year ended December 30, 2023, the Company made voluntary payments of $85.3 toward the First Lien Term Loan using cash on hand.
On August 3, 2023, the Company refinanced its existing First Lien Term Loan pursuant to the Amendment No. 6 First Lien. The loan was made by a syndicate of lenders, with the aggregate amount of $625.0. The outstanding loan balance is to be repaid on a quarterly basis of 0.25% of the original balance of the amended loan beginning the last business day of December 2023 with the remaining principal due on the maturity date of August 3, 2030. As chosen by the Company, the amended loan bears interest at a floating rate per annum consisting of Adjusted Term SOFR plus 0.10% CSA and an applicable margin (see Note 10, Long-Term Debt, to our consolidated financial statements in this Form 10-K for a further discussion).
In April 2024, the Company made a voluntary prepayment of $21.9 toward the First Lien Term Loan. The Company used cash on hand to make the voluntary prepayment.
On April 30, 2024, the Company completed a repricing pursuant to Amendment No. 7 (the “Repricing Amendment”) to the First Lien Term Loan. The Repricing Amendment reduced the applicable interest rate margins on the $600.0 First Lien Term Loan from 2.0% to 1.50% for the term loans bearing interest at rates based on the base rate, and from 3.00% to 2.50% for the term loans bearing interest at rates based on the SOFR rate. In addition to the change in the applicable margin rate, the Company is no longer subject to a CSA rate of 0.1%. Interest is payable in arrears (with respect to base rate loans) or at the end of an interest period selected by the Company (with respect to SOFR loans). The outstanding loan balance is to be repaid on a quarterly basis in an amount equal to 0.25% of the original balance of the amended loan, with the remaining principal due on the maturity date of August 3, 2030. The interest rate on the First Lien Term Loan as of December 28, 2024, was 7.07%, which is a variable rate based on Adjusted Term SOFR and includes an applicable margin of 2.50%. In conjunction with the Repricing Amendment, the Company incurred $1.7 of costs from third parties that did not qualify for capitalization of deferred finance costs and were expensed within “Loss on extinguishment and modification of debt” on the Consolidated Statement of Operations and Comprehensive Income. See Note 10 to our Consolidated Financial Statements in this Form 10-K for a further discussion.
Revolving Credit Facility - On August 18, 2021, the Company increased the existing available LOC Agreement with a domestic bank, from $50.0 to $80.0, incurred additional fees for this amendment of $0.4 and extended the maturity date from February 18, 2023 to August 12, 2024. On August 3, 2023, the Company refinanced the revolving credit facility, pursuant to a new ABL Credit and Guarantee Agreement (the “2023 LOC Agreement”). The 2023 LOC Agreement, among other things, (i) increased the previous aggregate commitments from $80.0 to $125.0, subject to eligible collateral, (ii) updated the manner in which the previous borrowing base under the 2023 LOC Agreement was determined, and (iii) replaced the administrative agent with a new administrative agent. Interest payments with respect to the 2023 LOC Agreement are due in arrears. The maturity date is August 3, 2028.
As chosen by the Company, the amended revolving credit facility bears interest at a floating rate per annum consisting of SOFR plus 0.10% CSA and an applicable margin that is based on excess availability. There was no outstanding balance on the line of credit as of December 28, 2024, and December 30, 2023. As of December 28, 2024, the Adjusted Term SOFR interest rate for the facility was 5.9%. The line of credit is secured by accounts receivable and inventories. (see Note 9, Line of Credit, to our consolidated financial statements in this Form 10-K for a further discussion)
The 2023 LOC Agreement and Repricing Amendment contain affirmative and negative covenants, including limitations on, subject to certain exceptions, the incurrence of indebtedness, the incurrence of liens, fundamental changes, dispositions, restricted payments, investments, transactions with affiliates as well as other covenants customary for financings of these types. The 2023 LOC Agreement also includes a financial covenant, applicable only when the excess availability is less than the greater of (i) 10% of the lesser of the aggregate commitments under the line of credit facility and the borrowing base, and (ii) $10.0. In such circumstances, we would be required to maintain a minimum fixed charge coverage ratio for the trailing four quarters equal to at least 1.00 to 1.00; subject to our ability to make an equity cure (no more than twice in any four quarter period and up to five times over the life of the facility). As of December 28, 2024, we were compliant with our covenants under the agreements governing our outstanding indebtedness.
As of December 28, 2024, and December 30, 2023, the Company’s borrowing base capacity yielded $82.4 and $125.0, respectively.
As of December 28, 2024, and December 30, 2023, the Company maintained one letter of credit totaling approximately $0.4 on which there were no balances due.
Statement of Cash Flows
The following table presents a summary of cash flows from operating, investing and financing activities for the following comparative periods. For additional detail, please see the Consolidated Statements of Cash Flows in the consolidated financial statements.
Year ended December 28, 2024 compared to the year ended December 30, 2023:
| | | | | | | | | | | | | | | | | | | | | | | |
| December 28, 2024 | | December 30, 2023 | | Variance |
| (dollar amounts in millions) | | | $ | | % |
| Net cash provided by operating activities | $ | 154.0 | | | $ | 215.0 | | | $ | (61.0) | | | (28.4) | % |
| Net cash used in investing activities | (73.1) | | | (19.9) | | | (53.2) | | | 267.3 | % |
| Net cash used in financing activities | (103.0) | | | (102.4) | | | (0.6) | | | 0.6 | % |
| Effect of foreign currency rate changes on cash | (0.3) | | | 0.6 | | | (0.9) | | | (150.0) | % |
| Net (decrease) increase in cash | $ | (22.4) | | | $ | 93.3 | | | $ | (115.7) | | | (124.0) | % |
Net cash provided by operating activities
Net cash provided by operating activities decreased by $61.0, or 28.4%, to $154.0 for the year ended December 28, 2024, compared to $215.0 for the year ended December 30, 2023. This decline was primarily driven by a $15.9 reduction in net cash activity from net working capital requirements, reflecting higher inventory levels and timing of receivables and payables. Additionally, a $45.1 decrease in net income adjusted for non-cash items contributed to the overall decline in operating cash flows.
Net cash used in investing activities
Net cash used in investing activities increased by $53.2 or 267.3% for the year ended December 28, 2024, compared to the prior year. This increase was primarily due to the T.M.C. Acquisition, which resulted in $59.4 of cash outflows, partially offset by higher proceeds from sale of property, plant, and equipment during the year ended December 28, 2024, compared to the prior year.
Net cash used in financing activities
Net cash used in financing activities increased slightly by $0.6 or 0.6% for the year ended December 28, 2024, compared to the prior year. This was driven by debt payments, net of debt proceeds, of $24.9 during the year, compared to $90.9 in the prior year. The decrease in net borrowings was partially offset by share repurchases of $78.8. See Note 10, Long-term Debt, to our consolidated financial statements for additional discussion of the financing transactions.
Capital allocation strategy
We continually assess our capital allocation strategy, including but not limited to decisions relating to mergers and acquisitions, share repurchases, capital expenditures, and debt pay-downs.
Contractual Obligations
The table below summarizes our approximate contractual obligations as of December 28, 2024 and their expected impact on our liquidity and cash flows in future periods:
| | | | | | | | | | | | | | | | | | | | | | | | | | | | | |
| (dollar amounts in millions) | Total | | Less than 1 year | | 1-3 years | | 3-5 years | | Thereafter |
| Notes payable - First Lien | $ | 598.5 | | | $ | 7.5 | | | $ | 12.0 | | | $ | 12.0 | | | $ | 567.0 | |
| Finance lease obligations | 3.4 | | | $ | 1.4 | | | $ | 1.6 | | | $ | 0.4 | | | $ | — | |
Unconditional purchase obligations (1) | 6.8 | | | $ | 2.8 | | | $ | 3.9 | | | $ | 0.1 | | | $ | — | |
| Operating lease obligations | 61.6 | | | 6.8 | | | 12.7 | | | 11.0 | | | 31.1 | |
| Total | $ | 670.3 | | | $ | 18.5 | | | $ | 30.2 | | | $ | 23.5 | | | $ | 598.1 | |
(1)Unconditional purchase obligations consist of supply contracts that relate to fixed price agreements as well as multi-year software contracts.
Operating lease obligations consist of operating lease liabilities for real and personal property leases with various lease expiration dates. The amount listed in the thereafter category is primarily comprised of nine real property leases with expiration dates ranging from 2030 – 2044. See Note 5, Leases, to our consolidated financial statements for a further discussion.
The table above does not include warranty liabilities because it is not certain when this liability will be funded and because this liability is considered immaterial.
Off-Balance Sheet Arrangements
As of December 28, 2024, we did not have any off-balance sheet arrangements that are material or reasonably likely to be material to our financial condition or results of operations.
Critical Accounting Estimates
For the critical Accounting Estimates used in preparing Janus’s consolidated financial statements, Janus makes assumptions, judgments and estimates that can have a significant impact on its revenue, results from operations and net income, as well as on the value of certain assets and liabilities on its consolidated balance sheets. Janus bases its assumptions, judgments and estimates on historical experience and various other factors that are reasonable under the circumstances. Actual results could differ materially from these estimates under different assumptions or conditions.
In accordance with Janus’s policies, Janus regularly evaluates its estimates, assumptions, and judgments, including, but not limited to, those concerning revenue recognition, business combinations, goodwill and indefinite-life intangible valuations and allowance for credit losses. The results involve judgments about the carrying values of assets and liabilities not readily apparent from other sources. If Janus’s assumptions or conditions change, the actual results Janus reports may differ from these estimates. The following critical accounting estimates affect the more significant estimates, assumptions, and judgments Janus uses to prepare these consolidated financial statements.
Revenue Recognition
For performance obligations recognized over time, we utilize the cost-to-cost input method as we consider it the most accurate measure of when goods and services are transferred to the customer. Under this method, we estimate the costs to complete individual contracts and recognize revenue proportionately to the total contract price deemed complete, based on the relationship of costs incurred to date to total anticipated costs.
It is important to note that, under the cost-to-cost method, the use of estimated costs to complete each contract is a crucial variable in determining recognized revenue. This estimate can change over the course of a contract’s duration due to many factors such as contract modifications and other elements affecting job completion.
To ensure accuracy, we regularly review and reassess our estimates for each uncompleted contract at least quarterly, incorporating the latest reliable information available. It is important to recognize that changes in these estimates could have both favorable and unfavorable impacts on revenues and their related profits.
Business Combinations
Under the acquisition method of accounting, the Company recognizes tangible and identifiable intangible assets acquired and liabilities assumed based on their estimated fair values. We record the excess of the fair value of the consideration transferred over the value of the net assets acquired as goodwill. The accounting for business combinations requires us to make significant estimates and assumptions, especially with respect to intangible assets and the fair value of contingent payment obligations. We use a variety of information sources to determine the value of acquired assets and liabilities including: third-party appraisers for the values and lives of property, identifiable intangibles and inventories; and legal counsel or other advisors to assess the obligations associated with legal, environmental or other claims. Critical estimates in valuing customer relationships, noncompete agreements, and tradenames, include future cash flows that we expect to generate from the acquired assets. If the subsequent actual results and updated projections of the underlying business activity change compared with the assumptions and projections used to develop these values, we could experience impairment charges which could be material.
Goodwill and Indefinite-Life Intangible Valuations
The Company’s business acquisitions result in the recognition of goodwill and other intangible assets, which are a significant portion of the Company’s total assets. Goodwill represents the excess of acquisition costs over the fair value of the net tangible assets and identifiable intangible assets acquired in a business combination. Identifiable intangible assets are recognized separately from goodwill and include customer relationships, tradenames and trademarks, software, and other specifically identifiable assets. Certain tradenames and trademarks are deemed to be indefinite-lived.
Goodwill represents the excess of the purchase price paid over the estimated fair value of the net assets acquired and liabilities assumed in the acquisition of a business. Goodwill has an indefinite useful life, and is not amortized, but instead tested for impairment annually on the first day of the fourth quarter of or more often if events or changes in circumstances indicate that the carrying amount may exceed fair value as set forth in ASC 350, “Intangibles—Goodwill and Other” (“ASC 350”). The Company tests for goodwill impairment at the reporting unit level, which is an operating segment or one level below an operating segment. The amount of goodwill acquired in a business combination that is assigned to one or more reporting units as of the acquisition date is the excess of the purchase price of the acquired businesses (or portion thereof) included in the reporting unit, over the fair value assigned to the individual assets acquired or liabilities assumed from a market participant perspective. Goodwill is assigned to the reporting unit(s) expected to benefit from the synergies of the combination even though other assets or liabilities of the acquired entity may not be assigned to that reporting unit.
ASC 350 allows an optional qualitative assessment as part of annual impairment testing, prior to a quantitative assessment test, to determine whether it is more likely than not that the fair value of a reporting unit exceeds its carrying amount. If a qualitative assessment determines an impairment is more likely than not, the Company is required to perform a quantitative impairment test. Otherwise, no further analysis is required. Alternatively, the Company may elect to proceed directly to the quantitative impairment test.
In conducting a qualitative assessment, the Company analyzes actual and projected growth trends for net sales and margin for each reporting unit, as well as historical performance versus plan and the results of prior quantitative tests performed. Additionally, the Company assesses factors that may impact its business, including macroeconomic conditions and the related impact, market-related exposures, plans to market for sale all or a portion of the business, competitive changes, new or discontinued product lines, changes in key personnel, and any potential risks to projected financial results.
If performed, the quantitative test compares the fair value of a reporting unit with its carrying amount. We determine the fair value of each reporting unit by estimating the present value of expected future cash flows, discounted by the applicable discount rate, and peer company multiples. If the carrying value exceeds the fair value, the Company recognizes an impairment loss in the amount equal to the excess, not to exceed the total amount of goodwill allocated to that reporting unit.
In performing a quantitative assessment of indefinite-life intangible assets other than goodwill, primarily tradenames and trademarks, we estimate the fair value of these intangible assets using the relief-from-royalty method which requires assumptions related to projected revenues from our long-range plans; assumed royalty rates that could be payable if we did not own the trademark; and a discount rate using a market based weighted-average cost of capital. If the estimated fair value of the indefinite-life intangible asset is less than its carrying value, we would recognize an impairment loss. If actual results are not consistent with management’s estimate and assumptions, a material impairment charge of our trademarks and trade names could occur, which could have an adverse effect on the Company’s financial condition and results of operations.
Allowance for Credit Losses
We encounter credit loss risks associated with the collection of our account receivables. We analyze historical experience, customer specific and general economic conditions, and reasonable and supportable forecasts that affect the collectability of the reported amount in estimating credit losses. The accounting estimate related to the allowance for credit losses is a critical accounting estimate because the underlying assumptions used for the allowance can change from time to time and credit losses could potentially have a material impact on our results of operations.
Recently Issued Accounting Standards
See Note 2, Summary of Significant Accounting Policies, to our consolidated financial statements for a discussion of recently issued and adopted accounting pronouncements.
Item 7A. QUANTITATIVE AND QUALITATIVE DISCLOSURE ABOUT MARKET RISK
Foreign Currency Exposures
Janus is exposed to foreign currency exchange risk related to currency translation exposure because the operations of its subsidiaries are measured in their functional currency which is the currency of the primary economic environment in which the subsidiary operates; particularly, the United Kingdom, Australia, and Poland. Any currency balances that are denominated in currencies other than the functional currency of the subsidiary are re-measured into the functional currency, with the resulting gain or loss recorded in the other income (expense) in Janus’s Consolidated Statement of Operations and Comprehensive Income. In turn, subsidiary income statement balances that are denominated in currencies other than the U.S. dollar are translated into U.S. dollars, Janus’s functional currency, in consolidation using the average exchange rate in effect during each fiscal month during the period, with any related gain or loss recorded as foreign currency translation adjustments in other comprehensive (loss) income. The assets and liabilities of subsidiaries that use functional currencies other than the U.S. dollar are translated into U.S. dollars in consolidation using period end exchange rates, with the effects of foreign currency translation adjustments included in accumulated other comprehensive (loss) income.
Janus seeks to naturally hedge its foreign exchange transaction exposure by matching the transaction currencies for its cash inflows and outflows and maintaining access to credit in the principal currencies in which it conducts business. Janus does not currently hedge our foreign exchange transaction or translation exposure but may consider doing so in the future. Other comprehensive (loss) income includes foreign currency translation adjustments.
Raw Material Price Exposures and Concentration of Supplier Risk
Janus’s biggest raw material spend is steel coils, which is subject to price volatility due to external factors, and comprises approximately of 55% to 60% of raw material spend on a consolidated level for the fiscal years ended December 28, 2024 and December 30, 2023. Historically, these costs were managed through our expected sales volume, yielding an expected steel coil usage for our procurement team to manage the order to fulfillment schedule. We fulfill those steel coil purchases through dual sourcing strategies with multiple vendors. Prices for spot market purchases were negotiated on a continuous basis in line with the market at the time. Other than short term supply contracts and occasional strategic purchases of larger quantities of certain raw materials, we generally buy materials on an as-needed basis. Periodically, we enter into fixed price and fixed supply agreements to combat fluctuations in the price of steel locking in prices and will continue to do so in the future. We have not entered into hedges with respect to our raw material costs at this time, but we may choose to enter into such hedges in the future.
Interest Rate Exposure
As indicated in Note 10, Long-term Debt, of Janus’s consolidated financial statements, for the year ended December 28, 2024, outstanding borrowings under its credit facilities include a First Lien term loan. On August 3, 2023, the Company refinanced its existing First Lien Term Loan pursuant to Amendment No. 6 First Lien. The loan was made by a syndicate of lenders, with the aggregate amount of $625.0. As chosen by the Company, the amended loan bears interest at a floating rate per annum consisting of Adjusted Term SOFR plus an applicable margin. The interest rate on the Amendment No. 6 First Lien term loan as of December 30, 2023, was 7.07%, which is a variable rate based on Adjusted Term SOFR, subject to a 1.00% floor, and includes a 0.10% CSA and an applicable margin of 3.25%. On April 30, 2024, the Company completed a repricing pursuant to the Repricing Amendment to the First Lien Term Loan. The Repricing Amendment reduced the applicable interest rate margins on the $600.0 First Lien Term Loan from 2.00% to 1.50% for the term loans bearing interest at rates based on the base rate, and from 3.00% to 2.50% for the term loans bearing interest at rates based on the SOFR rate. In addition to the change in the applicable margin rate, the Company is no longer subject to a CSA rate of 0.10%. Interest is payable in arrears (with respect to base rate loans) or at the end of an interest period selected by the Company (with respect to SOFR loans). The interest rate on the First Lien Term Loan as of December 28, 2024, was 7.07%, which is a variable rate based on Adjusted Term SOFR and includes an applicable margin percentage of 2.50%.
As indicated in Note 9, Line of Credit, of Janus’s consolidated financial statements, Janus also has a $125.0 revolving credit facility with a financial institution. On August 3, 2023, the Company refinanced the revolving credit facility, pursuant to the 2023 LOC Agreement. Interest payments with respect to the 2023 LOC Agreement are due in arrears. The maturity date is August 3, 2028. As of December 28, 2024, the Adjusted Term SOFR interest rate for the facility was 5.9%.
Janus experiences risk related to fluctuations in the SOFR rate and base rate at any given time. Taking into account the SOFR floor of 0.00%, a hypothetical increase or decrease in 100 basis points of the SOFR rate on the amounts outstanding under the First Lien Term Loan as of December 28, 2024, would have led to an approximate $6.0 increase or $6.0 decrease in the interest expense of the First Lien Term Loan on an annual basis. Management may consider using interest rate hedges in the future to combat potential interest rate exposure. Refer to Item 1A. Risk Factors for further information on the risks associated with our interest rate exposure.
Credit Risk
As of December 28, 2024 and December 30, 2023, our cash was maintained at major financial institutions in the United States, United Kingdom, and Australia, and our current deposits are likely in excess of insured limits. Based on the information available as of the date of this Annual Report, these institutions have sufficient assets and liquidity to conduct their operations in the ordinary course of business with little or no credit risk to us.
Our accounts receivable primarily relate to revenue from the sale of products and services to established customers. To mitigate credit risk, ongoing credit evaluations of customers’ financial condition are performed, deposits are required for select customers, and lien rights on any jobs in which Janus provides subcontracted installation services are available. As of December 28, 2024, there were no customers that
represented more than 10% of accounts receivable. As of December 30, 2023, one customer accounted for 11% of the accounts receivable balance.
Impact of Inflation
Inflationary factors such as increases in the cost of our product and overhead costs may adversely affect our operating results if we are unsuccessful in passing such inflationary increases on to our customers in the form of higher prices.
Item 8. FINANCIAL STATEMENTS AND SUPPLEMENTARY DATA
REPORT OF INDEPENDENT REGISTERED PUBLIC ACCOUNTING FIRM
To the Shareholders and Board of Directors
Janus International Group, Inc.:
Opinion on the Consolidated Financial Statements
We have audited the accompanying consolidated balance sheet of Janus International Group, Inc. and subsidiaries (the Company) as of December 28, 2024, the related consolidated statements of operations and comprehensive income, changes in stockholders’ equity, and cash flows for the year then ended, and the related notes (collectively, the consolidated financial statements). In our opinion, the consolidated financial statements present fairly, in all material respects, the financial position of the Company as of December 28, 2024, and the results of its operations and its cash flows for the year then ended, in conformity with U.S. generally accepted accounting principles.
We also have audited the adjustments to the 2023 and 2022 consolidated financial statements to retrospectively apply the change in accounting related to the Company’s adoption of ASU 2023-07, Segment Reporting (Topic 280): Improvements to Reportable Segment Disclosures, as described in Notes 2 and 18. In our opinion, such adjustments are appropriate and have been properly applied. We were not engaged to audit, review, or apply any procedures to the 2023 or 2022 consolidated financial statements of the Company other than with respect to the adjustments and, accordingly, we do not express an opinion or any other form of assurance on the 2023 or 2022 consolidated financial statements taken as a whole.
We also have audited, in accordance with the standards of the Public Company Accounting Oversight Board (United States) (PCAOB), the Company’s internal control over financial reporting as of December 28, 2024, based on criteria established in Internal Control – Integrated Framework (2013) issued by the Committee of Sponsoring Organizations of the Treadway Commission, and our report dated February 26, 2025 expressed an unqualified opinion on the effectiveness of the Company’s internal control over financial reporting.
Basis for Opinion
These consolidated financial statements are the responsibility of the Company’s management. Our responsibility is to express an opinion on these consolidated financial statements based on our audit. We are a public accounting firm registered with the PCAOB and are required to be independent with respect to the Company in accordance with the U.S. federal securities laws and the applicable rules and regulations of the Securities and Exchange Commission and the PCAOB.
We conducted our audit in accordance with the standards of the PCAOB. Those standards require that we plan and perform the audit to obtain reasonable assurance about whether the consolidated financial statements are free of material misstatement, whether due to error or fraud. Our audit included performing procedures to assess the risks of material misstatement of the consolidated financial statements, whether due to error or fraud, and performing procedures that respond to those risks. Such procedures included examining, on a test basis, evidence regarding the amounts and disclosures in the consolidated financial statements. Our audit also included evaluating the accounting principles used and significant estimates made by management, as well as evaluating the overall presentation of the consolidated financial statements. We believe that our audit provides a reasonable basis for our opinion.
Critical Audit Matter
The critical audit matter communicated below is a matter arising from the current period audit of the consolidated financial statements that was communicated or required to be communicated to the audit committee and that: (1) relates to accounts or disclosures that are material to the consolidated financial statements and (2) involved our especially challenging, subjective, or complex judgments. The communication of a critical audit matter does not alter in any way our opinion on the consolidated financial statements, taken as a whole, and we are not, by communicating the critical audit matter below, providing a separate opinion on the critical audit matter or on the accounts or disclosures to which it relates.
Certain service revenues recognized over time using cost-to-cost percentage of completion
As discussed in Notes 2 and 14 to the consolidated financial statements, the Company recognized $154.1 million of services revenue transferred over time within its North America segment for the year ended December 28, 2024. Service revenues are recognized over time as the customer simultaneously receives and consumes the benefits provided by the Company. For revenue recognized over time, the Company utilizes the cost-to-cost input method as the most accurate measure of when goods and services are transferred to the customer. Under this method, the Company estimates the costs to complete individual contracts and recognizes revenue proportionately to the total contract price deemed complete, based on the relationship of costs incurred to date to total anticipated costs.
We identified the evaluation of certain service revenues recognized over time using cost-to-cost percentage of completion as a critical audit matter. Specifically, subjective auditor judgment was required to assess management’s percentage of completion assumptions, which are based on the determination of the status of uncompleted projects and rely on the expertise, experience, and judgment of project management. Changes in the percentage of completion assumptions could have an impact on recognized service revenues.
The following are the primary procedures we performed to address this critical audit matter. We evaluated the design and tested the operating effectiveness of certain internal controls over the Company’s revenue recognition process, including controls related to the development of the percentage of completion assumption for uncompleted contracts. We selected a sample of uncompleted contracts and, for each sampled contract, assessed the percentage of completion assumption used to recognize revenue by:
•reading the underlying contract to obtain an understanding of the contractual requirements
•interviewing and reviewing questionnaires prepared by project management personnel of the Company, and inspecting related documentation, to gain an understanding of project status and factors that should be considered within the percentage of completion assumption
•comparing the percentage of completion assumption for the contract to the Company’s project status assessment.
We have served as the Company’s auditor since 2024.
/s/ KPMG LLP
Atlanta, Georgia
February 26, 2025
Report of Independent Registered Public Accounting Firm
Shareholders and Board of Directors
Janus International Group, Inc.
Temple, Georgia
Opinion on the Consolidated Financial Statements
We have audited, before the effects of the adjustments to retrospectively apply the change in accounting due to the adoption of Accounting Standards Update 2023-07, Segment Reporting (Topic 280): Improvements to Reportable Segment Disclosures (“ASU 2023-07”), as described in Notes 2 and 18, the accompanying consolidated balance sheet of Janus International Group, Inc. (the “Company”) as of December 30, 2023, and the related consolidated statements of operations and comprehensive income, changes in stockholders’ equity, and cash flows for each of the two fiscal years in the period ended December 30, 2023 (the 2023 and 2022 consolidated financial statements before the effects of the change in accounting due to the adoption of ASU 2023-07 described in Notes 2 and 18 are not presented herein). In our opinion, the 2023 and 2022 consolidated financial statements, before the effects of the adjustments to retrospectively apply the change in accounting due to the adoption of ASU 2023-07 described in Notes 2 and 18, present fairly, in all material respects, the financial position of the Company as of December 30, 2023, and the results of its operations and its cash flows for each of the two years in the period ended December 30, 2023, in conformity with accounting principles generally accepted in the United States of America.
We were not engaged to audit, review, or apply any procedures to the adjustments to retrospectively apply the change in accounting due to the adoption of ASU 2023-07 described in Notes 2 and 18 and, accordingly, we do not express an opinion or any other form of assurance about whether such adjustments are appropriate and have been properly applied. Those adjustments were audited by KPMG LLP.
Basis for Opinion
These consolidated financial statements are the responsibility of the Company’s management. Our responsibility is to express an opinion on the Company’s consolidated financial statements based on our audits. We are a public accounting firm registered with the Public Company Accounting Oversight Board (United States) (“PCAOB”) and are required to be independent with respect to the Company in accordance with the U.S. federal securities laws and the applicable rules and regulations of the Securities and Exchange Commission and the PCAOB.
We conducted our audits in accordance with the standards of the PCAOB. Those standards require that we plan and perform the audit to obtain reasonable assurance about whether the consolidated financial statements are free of material misstatement, whether due to error or fraud.
Our audits included performing procedures to assess the risks of material misstatement of the consolidated financial statements, whether due to error or fraud, and performing procedures that respond to those risks. Such procedures included examining, on a test basis, evidence regarding the amounts and disclosures in the consolidated financial statements. Our audits also included evaluating the accounting principles used and significant estimates made by management, as well as evaluating the overall presentation of the consolidated financial statements. We believe that our audits provide a reasonable basis for our opinion.
/s/ BDO USA, P.C.
We served as the Company's auditor from 2018 to 2024.
Atlanta, Georgia
February 28, 2024
| | |
| Janus International Group, Inc. |
|
| Consolidated Balance Sheets |
| (amounts in millions, except share and per share data) |
| | | | | | | | | | | |
| December 28, 2024 | | December 30, 2023 |
| ASSETS | | | |
| Current Assets | | | |
| Cash and cash equivalents | $ | 149.3 | | | $ | 171.7 | |
| Accounts receivable, less allowance for credit losses of $18.1 and $3.6 as of December 28, 2024 and December 30, 2023, respectively | 136.5 | | | 174.1 | |
| Contract assets | 23.2 | | | 49.7 | |
| Inventories | 53.3 | | | 48.4 | |
| Prepaid expenses | 7.2 | | | 8.4 | |
| Other current assets | 16.0 | | | 10.8 | |
| Total current assets | $ | 385.5 | | | $ | 463.1 | |
| Property, plant and equipment, net | 56.8 | | | 52.4 | |
| Right-of-use assets, net | 59.7 | | | 50.9 | |
| Intangible assets, net | 373.5 | | | 375.3 | |
| Goodwill | 383.1 | | | 368.6 | |
| Deferred tax assets, net | 36.9 | | | 36.8 | |
| Other assets | 5.8 | | | 2.9 | |
| Total assets | $ | 1,301.3 | | | $ | 1,350.0 | |
| LIABILITIES AND STOCKHOLDERS’ EQUITY | | | |
| Current Liabilities | | | |
| Accounts payable | $ | 53.9 | | | $ | 59.8 | |
| Contract liabilities | 17.9 | | | 26.7 | |
| Current maturities of long-term debt | 8.8 | | | 7.3 | |
| Accrued expenses and other current liabilities | 56.2 | | | 80.3 | |
| Total current liabilities | $ | 136.8 | | | $ | 174.1 | |
| Long-term debt, net | 583.2 | | | 607.7 | |
| Deferred tax liabilities, net | 1.7 | | | 1.7 | |
| Other long-term liabilities | 60.8 | | | 46.9 | |
| Total liabilities | $ | 782.5 | | | $ | 830.4 | |
| Commitments and Contingencies (Note 19) | | | |
| STOCKHOLDERS’ EQUITY | | | |
| Common Stock, 825,000,000 shares authorized, $0.0001 par value, 147,280,524 and 146,861,489 shares issued as of December 28, 2024 and December 30, 2023, respectively | $ | — | | | $ | — | |
| Treasury stock, at cost, 7,276,549 and 34,297 shares as of December 28, 2024 and December 30, 2023, respectively | (81.4) | | | (0.4) | |
| Additional paid in capital | 299.7 | | | 289.0 | |
| Accumulated other comprehensive loss | (3.8) | | | (2.9) | |
| Retained earnings | 304.3 | | | 233.9 | |
| Total stockholders’ equity | $ | 518.8 | | | $ | 519.6 | |
| Total liabilities and stockholders’ equity | $ | 1,301.3 | | | $ | 1,350.0 | |
See accompanying Notes to Consolidated Financial Statements
| | |
| Janus International Group, Inc. |
|
| Consolidated Statements of Operations and Comprehensive Income |
| (amounts in millions, except share and per share data) |
| | | | | | | | | | | | | | | | | |
| Year Ended |
| December 28, 2024 | | December 30, 2023 | | December 31, 2022 |
| | | | | |
| REVENUES | | | | | |
| Product revenues | $ | 779.4 | | | $ | 909.8 | | | $ | 890.9 | |
| Service revenues | 184.4 | | | 156.6 | | | 128.6 | |
| Total revenues | $ | 963.8 | | | $ | 1,066.4 | | | $ | 1,019.5 | |
| Product cost of revenues | 442.3 | | | 500.8 | | | 557.1 | |
| Service cost of revenues | 123.7 | | | 115.9 | | | 97.5 | |
| Cost of revenues | $ | 566.0 | | | $ | 616.7 | | | $ | 654.6 | |
| GROSS PROFIT | $ | 397.8 | | | $ | 449.7 | | | $ | 364.9 | |
| OPERATING EXPENSES | | | | | |
| Selling and marketing | 68.1 | | | 65.5 | | | 58.3 | |
| General and administrative | 171.1 | | | 138.5 | | | 119.1 | |
| Impairment | 12.0 | | | — | | | — | |
| Operating expenses | $ | 251.2 | | | $ | 204.0 | | | $ | 177.4 | |
| INCOME FROM OPERATIONS | $ | 146.6 | | | $ | 245.7 | | | $ | 187.5 | |
| Interest expense, net | (49.6) | | | (60.0) | | | (42.0) | |
| Gain on sale of manufacturing facility | 5.0 | | | — | | | — | |
| Loss on extinguishment and modification of debt | (1.7) | | | (3.9) | | | — | |
| Other income (expense) | — | | | 1.0 | | | (0.2) | |
| Other Expense, Net | $ | (46.3) | | | $ | (62.9) | | | $ | (42.2) | |
| INCOME BEFORE TAXES | $ | 100.3 | | | $ | 182.8 | | | $ | 145.3 | |
| Provision for income taxes | 29.9 | | | 47.1 | | | 37.6 | |
| NET INCOME | $ | 70.4 | | | $ | 135.7 | | | $ | 107.7 | |
| Other comprehensive (loss) income | $ | (0.9) | | | $ | 1.9 | | | $ | (3.9) | |
| COMPREHENSIVE INCOME | $ | 69.5 | | | $ | 137.6 | | | $ | 103.8 | |
| | | | | |
| Weighted-average shares outstanding, basic and diluted | | | | | |
| Basic | 144,256,152 | | | 146,782,101 | | | 146,606,197 | |
| Diluted | 144,799,100 | | | 146,882,057 | | | 146,722,866 | |
| Net income per share, basic and diluted | | | | | |
| Basic | $ | 0.49 | | | $ | 0.92 | | | $ | 0.73 | |
| Diluted | $ | 0.49 | | | $ | 0.92 | | | $ | 0.73 | |
See accompanying Notes to Consolidated Financial Statements.
| | |
| Janus International Group, Inc. |
|
| Consolidated Statements of Changes in Stockholders’ Equity |
| (amounts in millions, except share data) |
| | | | | | | | | | | | | | | | | | | | | | | | | | | | | | | | | | | | | | | | | | | | | | | | | | | | | | | | | | | |
| Class A Preferred Units (0 shares authorized par value of 0.0001) | | Common Stock | | Treasury Stock | | Additional paid-in capital | | Accumulated Other Comprehensive Loss | | Retained Earnings
(Accumulated
deficit) | | Total |
| Shares | | Amount | | Shares | | Amount | | Shares | | Amount | | | | | | | | |
| Balance as of January 1, 2022 | — | | | $ | — | | | 146,561,717 | | | $ | — | | | — | | | $ | — | | | $ | 277.8 | | | $ | (0.9) | | | $ | (8.6) | | | $ | 268.3 | |
| Issuance of restricted units | — | | | — | | | 142,177 | | | — | | | — | | | — | | | — | | | — | | | — | | | — | |
| Share-based compensation | — | | | — | | | — | | | — | | | — | | | — | | | 4.1 | | | — | | | — | | | 4.1 | |
Cumulative effect of change in accounting principle (a) | — | | | — | | | — | | | — | | | — | | | — | | | — | | | — | | | (0.9) | | | (0.9) | |
| Foreign currency translation adjustment | — | | | — | | | — | | | — | | | — | | | — | | | — | | | (3.9) | | | — | | | (3.9) | |
| Net income | — | | | — | | | — | | | — | | | — | | | — | | | — | | | — | | | 107.7 | | | 107.7 | |
| Balance as of December 31, 2022 | — | | | $ | — | | | 146,703,894 | | | $ | — | | | — | | | $ | — | | | $ | 281.9 | | | $ | (4.8) | | | $ | 98.2 | | | $ | 375.3 | |
| Issuance of restricted units | — | | | — | | | 191,892 | | | — | | | — | | | — | | | — | | | — | | | — | | | — | |
| Shares withheld for taxes upon vesting of restricted units | — | | | — | | | (34,297) | | | — | | | 34,297 | | | (0.4) | | | — | | | — | | | — | | | (0.4) | |
| Share-based compensation | — | | | — | | | — | | | — | | | — | | | — | | | 7.1 | | | — | | | — | | | 7.1 | |
| Foreign currency translation adjustment | — | | | — | | | — | | | — | | | — | | | — | | | — | | | 1.9 | | | — | | | 1.9 | |
| Net income | — | | | — | | | — | | | — | | | — | | | — | | | — | | | — | | | 135.7 | | | 135.7 | |
| Balance as of December 30, 2023 | — | | | $ | — | | | 146,861,489 | | | $ | — | | | 34,297 | | | $ | (0.4) | | | $ | 289.0 | | | $ | (2.9) | | | $ | 233.9 | | | $ | 519.6 | |
| Repurchase of common shares | — | | | — | | | (7,141,261) | | | — | | | 7,141,261 | | | (79.6) | | | — | | | — | | | — | | | (79.6) | |
| Issuance of restricted units | — | | | — | | | 382,669 | | | — | | | — | | | — | | | — | | | — | | | — | | | — | |
| Issuance of common stock on exercise of stock options | — | | | — | | | 2,069 | | | — | | | — | | | — | | | — | | | — | | | — | | | — | |
| Shares withheld for taxes upon vesting of restricted units | — | | | — | | | (100,991) | | | — | | | 100,991 | | | (1.4) | | | — | | | — | | | — | | | (1.4) | |
| Share-based compensation | — | | | — | | | — | | | — | | | — | | | — | | | 10.7 | | | — | | | — | | | 10.7 | |
| Foreign currency translation adjustment | — | | | — | | | — | | | — | | | — | | | — | | | — | | | (0.9) | | — | | | (0.9) | |
| Net income | — | | | — | | | — | | | — | | | — | | | — | | | — | | | — | | | 70.4 | | | 70.4 | |
| Balance as of December 28, 2024 | — | | | $ | — | | | 140,003,975 | | | $ | — | | | 7,276,549 | | | $ | (81.4) | | | $ | 299.7 | | | $ | (3.8) | | | $ | 304.3 | | | $ | 518.8 | |
(a) Effective January 2, 2022, the Company adopted the provisions of Accounting Standards Update (“ASU”) 2016-13, Financial Instruments - Credit Losses: Measurement of Credit Losses on Financial Instruments (Topic 326) and ASU 2016-02, Leases (Topic 842).
Total shares issued are the aggregate of Common Stock outstanding and Treasury Shares.
See accompanying Notes to Consolidated Financial Statements
| | | | | | | | | | | | | | | | | |
| Janus International Group, Inc. |
| Consolidated Statements of Cash Flows |
| (dollar amounts in millions) |
| | | | | |
| Year Ended |
| December 28, 2024 | | December 30, 2023 | | December 31, 2022 |
| Cash flows provided by operating activities | | | | | |
| Net income | $ | 70.4 | | | $ | 135.7 | | | $ | 107.7 | |
| Adjustments to reconcile net income to net cash provided by operating activities | | | | | |
| Depreciation of property, plant and equipment | 12.0 | | | 9.3 | | | 7.9 | |
| Noncash lease expense | 7.6 | | | 6.3 | | | 5.4 | |
| Provision for inventory obsolescence | — | | | — | | | (0.7) | |
| Amortization of intangibles | 32.0 | | | 29.8 | | | 29.7 | |
| Deferred finance fee amortization | 2.4 | | | 3.6 | | | 3.7 | |
| Provisions for (reversal of) expected losses on accounts receivable | 15.7 | | | (0.7) | | | 1.7 | |
| Share-based compensation | 10.7 | | | 7.1 | | | 4.1 | |
| Impairment | 12.0 | | | — | | | — | |
| Loss on extinguishment of debt | — | | | 1.6 | | | — | |
| (Gain) loss on sale of property, plant, and equipment | (5.0) | | | 0.1 | | | (0.1) | |
| Loss on abandonment of lease | — | | | — | | | 0.6 | |
| Gain on equity method investment | (0.7) | | | — | | | (0.2) | |
| Deferred income taxes, net | 0.1 | | | 9.5 | | | 13.5 | |
| Changes in operating assets and liabilities, excluding effects of acquisition | | | | | |
| Accounts receivable | 24.2 | | | (17.4) | | | (50.1) | |
| Contract assets | 26.2 | | | (10.3) | | | (16.1) | |
| Inventories | (4.8) | | | 19.4 | | | (10.3) | |
| Prepaid expenses and other current assets | (3.9) | | | 4.1 | | | (8.5) | |
| Other assets | — | | | (1.9) | | | (12.3) | |
| Accounts payable | (6.1) | | | 7.3 | | | (2.7) | |
| Contract liabilities | (9.1) | | | 5.0 | | | (1.8) | |
| Accrued expenses and other current liabilities | (24.6) | | | 10.0 | | | 7.7 | |
| Other long-term liabilities | (5.1) | | | (3.5) | | | 9.3 | |
| Net cash provided by operating activities | $ | 154.0 | | | $ | 215.0 | | | $ | 88.5 | |
| Cash flows used in investing activities | | | | | |
| Proceeds from sale of property plant and equipment | $ | 8.9 | | | $ | 0.1 | | | $ | 0.1 | |
| Purchases of property, plant and equipment | (20.1) | | | (19.0) | | | (8.8) | |
| Payment for equity method investment | (2.5) | | | — | | | — | |
| Cash paid for acquisitions, net of cash acquired | (59.4) | | | (1.0) | | | — | |
| Net cash used in investing activities | $ | (73.1) | | | $ | (19.9) | | | $ | (8.7) | |
| Cash flows used in financing activities | | | | | |
| Payments on line of credit | $ | — | | | $ | — | | | $ | (6.4) | |
| Principal payments on long-term debt | (24.9) | | | (428.5) | | | (8.1) | |
| Principal payments on finance lease obligations | (1.6) | | | (0.7) | | | (0.2) | |
| Proceeds from issuance of long-term debt | — | | | 337.6 | | | — | |
| Cash paid for common stock withheld for taxes | (1.7) | | | — | | | — | |
| Repurchase of common stock | (78.8) | | | — | | | — | |
| Payments for deferred financing fees | (0.2) | | | (10.8) | | | — | |
| Other financing activities | 4.2 | | | — | | | — | |
| Net cash used in financing activities | $ | (103.0) | | | $ | (102.4) | | | $ | (14.7) | |
| Effect of exchange rate changes on cash and cash equivalents | $ | (0.3) | | | $ | 0.6 | | | $ | 0.1 | |
| Net (decrease) increase in cash | $ | (22.4) | | | $ | 93.3 | | | $ | 65.2 | |
| Cash, beginning of fiscal year | $ | 171.7 | | | $ | 78.4 | | | $ | 13.2 | |
| Cash, end of fiscal year | $ | 149.3 | | | $ | 171.7 | | | $ | 78.4 | |
| | | | | |
| Supplemental cash flows information | | | | | |
| Interest paid | $ | 58.9 | | | $ | 43.4 | | | $ | 40.9 | |
| Income taxes paid | $ | 26.8 | | | $ | 33.9 | | | $ | 33.4 | |
| Cash paid for operating leases included in operating activities | $ | 9.2 | | | $ | 8.4 | | | $ | 7.7 | |
| | | | | | | | | | | | | | | | | |
| Janus International Group, Inc. |
| Consolidated Statements of Cash Flows |
| (dollar amounts in millions) |
| | | | | |
| Year Ended |
| December 28, 2024 | | December 30, 2023 | | December 31, 2022 |
| Non-cash investing and financing activities | | | | | |
| Right-of-use assets obtained in exchange for operating lease obligations | $ | 15.9 | | | $ | 9.5 | | | $ | 48.4 | |
| Right-of-use assets and lease liabilities reduced for terminated leases | $ | 0.5 | | | $ | — | | | $ | — | |
| Right-of-use assets obtained in exchange for finance lease obligations | $ | 1.6 | | | $ | 3.1 | | | $ | 1.2 | |
| RSU shares withheld included in accrued employee taxes | $ | 0.1 | | | $ | 0.4 | | | $ | — | |
| Excise taxes from common share repurchase included in accrued expenses | $ | 0.8 | | | $ | — | | | $ | — | |
| Purchases of property, plant and equipment in accounts payable | $ | 0.2 | | | $ | — | | | $ | — | |
| Property, plant and equipment obtained in exchange for operating lease obligations | $ | — | | | $ | 1.6 | | | $ | — | |
See accompanying Notes to Consolidated Financial Statements
Janus International Group, Inc.
Notes to Consolidated Financial Statements
(dollar amounts in millions, except per share data)
1. Nature of Operations
Janus International Group, Inc. is a holding company incorporated in Delaware. References to “Janus,” “Group,” “Company,” “we,” “our” or “us” refer to Janus International Group, Inc. and its consolidated subsidiaries. The Company is a global manufacturer, supplier, and provider of turn-key self-storage, commercial, and industrial building solutions. The Company provides roll up and swing doors, hallway systems, and relocatable storage “MASS” (Moveable Additional Storage Structures) units, among other solutions, and works with its customers throughout every phase of a project by providing solutions including facility planning and design, construction, technology, and the restoration, rebuilding, and replacement (“R3”) of self-storage facilities. Additionally, the Company provides facility and door automation and access control technologies.
The Company is headquartered in Temple, GA with operations in the United States of America (“United States” or “U.S.”), United Kingdom (“U.K.”), Australia, France, Canada, and Poland. The Company provides products and services through its two operating and reportable segments, which are based on the geographic region of its operations: (i) Janus North America and (ii) Janus International. The Janus North America segment is comprised of Janus International Group, LLC (“Janus Core”), together with each of its operating subsidiaries, Betco, Inc. (“BETCO”), Nokē, Inc. (“NOKE”), Asta Industries, Inc. (“ASTA”), Access Control Technologies, LLC (“ACT”), U.S. Door & Building Components, LLC (“U.S. Door”), Janus Door, LLC (“Janus Door”) Steel Door Depot.com, LLC (“Steel Door Depot”), Janus International Canada, Ltd. (“Janus Canada”), and Terminal Door, LLC (“Terminal Door”). The Janus International segment is comprised of Janus International Europe Holdings Ltd (“Janus Europe Holdings”) and its subsidiaries, Janus International Australia Pty Ltd (“Janus Australia”), Janus International Europe Ltd (“Janus Europe”), Janus International France SARL (“Janus France”), and Janus International Poland sp. z.o.o (“Janus Poland”), whose production and sales are largely in Europe, the U.K., and Australia. The Company’s common stock is currently traded on the New York Stock Exchange under the symbol “JBI”.
The dollar amounts in the notes are shown in millions of dollars and rounded to the nearest tenth of a million, unless otherwise noted, except for share and per share amounts.
2. Summary of Significant Accounting Policies
Basis of Presentation
The accompanying consolidated financial statements are presented in U.S. dollars and have been prepared in accordance with accounting principles generally accepted in the United States of America (U.S. GAAP) and pursuant to the applicable rules and regulations of the U.S. Securities and Exchange Commission (“SEC”).
Principles of Consolidation
The consolidated financial statements include the accounts of the Company and its wholly owned subsidiaries. All significant intercompany accounts and transactions have been eliminated in consolidation.
Reclassification and Adjustments
Certain items have been reclassified in the prior year financial statements to conform to the presentation and classifications used in the current
year. These reclassifications had no effect on our previously reported results of operations or retained earnings.
For the year ended December 28, 2024, the Company recorded a $2.5 out of period adjustment as a reduction in service cost of revenues with an offset to accounts payable, to adjust estimated contract costs to actual costs incurred on installation projects which were completed during the years 2017 to 2023. In addition, for the year ended December 28, 2024, the Company recorded a $3.4 out of period adjustment reflecting an increase to income tax expense to correct an error derived from a 2021 structural tax change in conjunction with the company going public.
Use of Estimates in the Consolidated Financial Statements
The preparation of consolidated financial statements in conformity with U.S GAAP requires management to make estimates and assumptions that affect the reported amounts of assets and liabilities and disclosure of contingent assets and liabilities at the date of the financial statements and the reported amounts of revenues and expenses during the reporting period. Actual results could differ from those estimates.
Items subject to such estimates and assumptions include, but are not limited to, income taxes and the effective tax rates, inventory basis adjustments, the fair value of assets, liabilities and assumptions related to business combinations, the recognition and valuation of unit-based compensation arrangements, the useful lives of property, plant, and equipment, the commencement date of leases, the incremental borrowing rate used to calculate lease liabilities, estimated progress toward completion for certain revenue contracts, allowance for credit losses, fair values and impairment of intangible assets and goodwill.
Cash and Cash Equivalents
Cash and cash equivalents include the Company’s short-term, highly liquid investments that are readily convertible to known amounts of cash and have maturities of three months or less from the date of purchase. Interest income on cash equivalents is offset against Interest expense on the Consolidated Statements of Operations and Comprehensive Income. For the year ended December 28, 2024, interest income was $2.1. There was no interest income for the years ended December 30, 2023 and December 31, 2022. At December 28, 2024 and December 30, 2023, the Company did not have any restricted cash.
The Company maintains cash in bank deposit accounts that, at times, may exceed the insured limits of the local country, which may lead to a concentration of credit risk. Substantially all of the Company’s cash balances were deposited with financial institutions which management has determined to be high-credit quality institutions. The Company has not experienced any losses in such accounts.
Accounts Receivable and Allowance for Credit Losses
Accounts receivable primarily arise from the sale of products and services to established customers. Accounts receivable are recorded at the invoiced amount and do not bear interest. Additionally, accounts receivable are stated at estimated net realizable value, net of allowance for credit losses which is based on the Company’s assessment of the collectability of customer accounts.
During the fiscal year ended December 28, 2024, we received notice that a customer filed a petition for bankruptcy. In addition, we experienced payment delays from a number of customers, and have an elevated risk of certain customers not making payment, yielding an additional increase in the provision for expected credit losses primarily associated with a change in estimate, totaling $15.7 for the year ended December 28, 2024.
The Company estimates the allowance for credit losses using the loss-rate method. As the Company determined that its customers at various business units and sales channels share similar risk characteristics, the same loss rate is applied to all accounts receivable. The Company estimates the allowance for credit losses by considering various factors such as historical write-offs, changes in customers’ credit ratings, delinquency, payment history, the age of the accounts receivable balances, and current and expected economic conditions that may affect a customer’s ability to pay. Account balances are charged off against the allowance when it is determined that internal collection efforts should no longer be pursued.
The summary of activity in the allowance for credit losses for the years ended December 28, 2024 and December 30, 2023 is as follows:
| | | | | |
| (dollar amounts in millions) | |
| Balance at December 30, 2023 | $ | 3.6 | |
| Write-offs | (1.2) | |
| Provision for expected credit losses, net | 15.7 | |
| Balance at December 28, 2024 | $ | 18.1 | |
| | | | | |
| (dollar amounts in millions) | |
| Balance at December 31, 2022 | $ | 4.6 | |
| Write-offs | (0.3) | |
| Provision (reversal) for expected credit losses, net | (0.7) | |
| Balance at December 30, 2023 | $ | 3.6 | |
Inventories
Inventories are stated at the lower of cost or net realizable value. Cost is determined using actual costs determined on a first-in, first-out basis or average cost. Labor and overhead costs associated with inventory produced by the Company are capitalized into inventories.
Property, Plant and Equipment
Property plant and equipment are stated at cost less accumulated depreciation. Property plant and equipment acquired in business combinations are recorded at fair value as of the acquisition date and are subsequently stated less accumulated depreciation. Depreciation is charged to expense on the straight-line basis over the estimated useful life of each asset. Leasehold improvements are amortized over the shorter of the lease term or their respective useful lives. Maintenance and repairs are charged to expense as incurred.
Business Combinations
We account for business acquisitions in accordance with Accounting Standards Codification (“ASC”) 805, “Business Combinations”, which requires the acquiring entity to recognize all assets acquired and liabilities assumed at their acquisition-date fair values. The determination of fair value involves assessment of factors such as expected future cash flows and appropriate discount rates. When observable market values are unavailable, the Company utilizes acceptable valuation principles, such as discounted cash flow methods. Consideration paid, including
contingent consideration, is measured at fair value, and transaction costs are expensed as incurred. The results of operations for acquired entities are included in the Company’s consolidated financial statements from the acquisition date.
The Company determines the fair value of acquired intangible assets using valuation methodologies appropriate to the asset type. Customer relationships and software development costs are valued using the excess earnings method under the income approach, which calculates the present value of incremental after-tax cash flows attributable to the asset over its economic life. The relief-from-royalty method is used to value tradenames and trademarks, considering market-based royalty rates and discounting future savings from owning the asset rather than licensing it. These valuation models incorporate future operating projections, discount rates, and other key assumptions, including near-term sales expectations and long-term growth projections.
Goodwill and Indefinite-Lived Intangible Assets
The Company accounts for goodwill and indefinite-lived intangible assets under ASC 350, “Intangibles—Goodwill and Other”. Goodwill represents the excess of the consideration transferred over the estimated fair value of net assets acquired and liabilities assumed in a business combination. Indefinite-lived intangible assets, such as tradenames and trademarks, are recognized as part of business acquisitions. Neither goodwill nor indefinite-lived intangible assets are amortized but are tested for impairment annually at the beginning of the fourth quarter or more frequently if events or changes in circumstances indicate that it is more likely than not that the fair value of the asset is below its carrying amount.
Goodwill is tested for impairment at the reporting unit level, which is an operating segment or one level below an operating segment. Goodwill is assigned to the reporting unit(s) expected to benefit from the synergies of the business combination. As part of the annual impairment test, the Company may first perform a qualitative assessment to determine whether it is more likely than not that a reporting unit’s fair value exceeds its carrying amount. This assessment considers factors such as actual and projected growth trends for net sales and margin, historical performance versus plan, macroeconomic conditions, market-related exposures, competitive dynamics, changes in key personnel, new or discontinued product lines, and potential risks to projected financial results. If the qualitative assessment indicates potential impairment, or if the Company elects to bypass it, a quantitative impairment test is performed.
The quantitative test compares the fair value of a reporting unit with its carrying amount. If the carrying amount exceeds the fair value, an impairment loss is recognized for the difference, not exceeding the total amount of goodwill allocated to that reporting unit. The Company determines the fair value of each reporting unit using a combination of the income approach, which applies a discounted cash flow methodology, and the market approach, which considers comparable company valuations.
Indefinite-lived intangible assets are also tested for impairment using a similar process. The Company may first perform a qualitative assessment to determine whether it is more likely than not that the asset’s fair value exceeds its carrying amount. If this assessment suggests potential impairment, or if the Company elects to bypass it, a quantitative impairment test is performed, comparing the asset’s fair value with its carrying amount. If the carrying amount exceeds the fair value, an impairment loss is recognized for the difference.
Intangible Assets
The Company’s finite-lived intangible assets primarily consist of customer relationships, non-compete agreements, software development costs, and certain tradenames and trademarks acquired through business combinations. These assets are recorded at fair value at the acquisition date and are amortized on a straight-line basis over their estimated useful lives, which reflect the period over which the assets are expected to contribute to future cash flows.
The Company regularly evaluates the assigned amortization periods to ensure they remain appropriate. If events or changes in circumstances indicate that the useful life of an asset may no longer be accurate, the Company revises its estimates accordingly. Additionally, finite-lived intangible assets are assessed for impairment whenever events or circumstances indicate that their carrying amounts may not be recoverable. If the carrying amount of an asset exceeds its estimated future undiscounted cash flows, an impairment loss is recognized in the amount by which the carrying value exceeds the asset’s fair value. Refer to Note 7, Acquired Intangible Assets and Goodwill, for further details.
Leases
The Company leases certain logistics, office, and manufacturing facilities, as well as vehicles, copiers and other equipment under long-term operating and financing leases with varying terms.
We adopted the provisions of ASC 842 on January 2, 2022, using the modified retrospective approach. The Company has recognized the cumulative effect adjustment to the opening balance of retained earnings. The Company elected to adopt the package of practical expedients which apply to leases that commenced before the adoption date. By electing the package of practical expedients, the Company did not reassess whether any expired or existing contracts are or contain leases, the lease classification for any expired or existing leases, and the initial direct costs for any existing leases.
The Company determines whether an arrangement is a lease at inception of the agreement. Lease liabilities and right-of-use (“ROU”) assets are recognized at commencement date. ROU assets represent our right to use an underlying asset for the lease term and lease liabilities represent our obligation to make lease payments arising from the lease. Lease liabilities are measured based on the present value of the total lease payments not yet paid based on the Company’s incremental borrowing rate, as the rate implicit in the lease is generally not determinable. Lease payments include only payments that are fixed and determinable at the time of commencement. Rent expense commences when the lessor makes the underlying asset available to us. Lease expense for operating lease payments is recognized on a straight-line basis over the lease term. The Company does not assume renewals or early terminations unless it is reasonably certain to exercise these options at commencement. ROU assets are measured based on the corresponding lease liability adjusted for: (i) payments made to the
lessor at or before the commencement date; (ii) initial direct costs; and (iii) tenant incentives under the lease. The variable portion of the lease payments is not included in the right-of-use assets or lease liabilities. Rather, variable payments, other than those dependent upon an index or rate, are expensed when the obligation for those payments is incurred. Leases with an initial term of 12 months or less are not recorded on the balance sheet in accordance with the short-term lease recognition exemption.
The Company has elected the practical expedient to not separate non-lease components from the lease components to which they relate, and instead account for each as a single lease component. Accordingly, all expenses associated with a lease contract are accounted for as lease expenses. Non-lease components for real estate leases primarily relate to common area maintenance, insurance, taxes, utilities and non-lease components for equipment, vehicles and leases within supply agreements primarily relate to usage, repairs, and maintenance.
The Company estimates the incremental borrowing rate based on the rates of interest that the Company would have to pay to borrow an amount equal to the lease payments on a collateralized basis, over a similar term, and in a similar economic environment. We use the unsecured borrowing rate and risk-adjust that rate to approximate a collateralized rate, and apply the rate based on the currency of the lease, which is updated on a quarterly basis for measurement of new lease liabilities. See Note 5, Leases, for additional details.
Accounting for Income Taxes
The Company accounts for income taxes under the asset and liability method. Deferred tax assets and liabilities are recognized for the expected tax consequences of temporary differences between the tax bases of assets and liabilities and their reported amounts. Valuation allowances are recorded to reduce deferred tax assets to the amount that will more likely than not be realized.
The Company accounts for uncertainty in income taxes using a two-step approach to recognizing and measuring uncertain tax positions. The first step is to evaluate the tax position for recognition by determining if the weight of available evidence indicates that it is more likely than not that the position will be sustained on audit, including resolution of related appeals or litigation processes, if any. The second step is to measure the tax benefit as the largest amount that is more than 50% likely of being realized upon settlement. The Company recognizes accrued interest associated with unrecognized tax benefits as part of Interest expense, and penalties associated with unrecognized tax benefits as part of Other expenses on the Consolidated Statement of Operations and Comprehensive Income.
Deferred Income Tax Assets and Liabilities. The carrying values of deferred income tax assets and liabilities reflect the application of our income tax accounting policies in accordance with applicable accounting standards, and are based on management’s assumptions and estimates regarding future operating results and levels of taxable income, as well as management’s judgment regarding the interpretation of the provisions of applicable accounting standards. The carrying values of liabilities for income taxes currently payable are based on management’s interpretations of applicable tax laws, and incorporate management’s assumptions and judgments regarding the use of tax planning strategies in various taxing jurisdictions. The use of different estimates, assumptions and judgments in connection with accounting for income taxes may result in materially different carrying values of income tax assets and liabilities and results of operations.
We evaluate the recoverability of these deferred tax assets by assessing the adequacy of future expected taxable income from all sources, including reversal of taxable temporary differences, forecasted operating earnings and available tax planning strategies. These sources of income inherently rely heavily on estimates. We use our historical experience and our short-term and long-term business forecasts to provide insight. Further, our global business portfolio gives us the opportunity to employ various prudent and feasible tax planning strategies to facilitate the recoverability of future deductions. To the extent we do not consider it more likely than not that a deferred tax asset will be recovered, a valuation allowance is established.
Revenue Recognition
The Company recognizes revenue in accordance with ASC 606, “Revenue from Contracts with Customers” (“ASC 606”). The Company accounts for a contract with a customer when both parties have approved the contract and are committed to perform their respective obligations, each party’s rights and payment terms can be identified, the contract has commercial substance, and it is probable that the Company will collect substantially all of the consideration to which it is entitled.
Revenue is recognized when, or as, performance obligations are satisfied by transferring control of a promised good or service to a customer. A performance obligation is a promise to transfer a distinct good or service to the customer and is the unit of account.
The Company’s performance obligations primarily include:
•Product revenues – Product revenues are recognized at a point in time when control transfers to the customer.
•Service revenues – Service revenues are recognized overtime as the customer simultaneously receives and consumes the benefits provided by the Company. Service revenues include construction, installation, and remodeling services which are recognized using a cost-to-cost input method. It also includes subscription services that are recognized over time as customers receive continuous access to the software and technical support.
The Company enters into certain contracts with customers that may include multiple performance obligations. For contracts with multiple performance obligations, the transaction price is allocated based on the standalone selling price.
For revenue recognized over time, the Company utilizes the cost-to-cost input method as it provides the most accurate measure of when goods and services are transferred to the customer. Under this method, the Company estimates the costs to complete individual contracts and recognizes revenue proportionately to the total contract price deemed complete, based on the relationship of costs incurred to date to total anticipated costs.
For performance obligations that are not complete at the reporting date, the Company recognizes contract assets or contract liabilities. Contract assets include unbilled receivables and revenues in excess of billings and represent the rights to consideration in exchange for goods or services that the Company has transferred to a customer. Unbilled receivables arise when revenue is recognized at a point in time before invoicing, representing an unconditional right to payment subject primarily to the passage of time. Revenues in excess of billings result from over-time revenue recognition, where the Company has an unconditional right to payment. Both unbilled receivables and revenues in excess of billings are recognized as accounts receivable when billed. Contract liabilities result from performance obligations recognized over time and represent the net balance of billings that already occurred in excess of revenue that was recognized. If a down payment is received from a customer before a project becomes active, it is recorded as a customer deposit within accrued expenses and other current liabilities.
The Company’s payment terms are generally up to 90 days on an open account. These payment terms are customary for the industry and, in some cases, may include early payment incentives. The Company’s contracts typically have durations of less than one year and do not contain significant financing components. The Company has elected to account for shipping and handling as activities to fulfill the promise to transfer the good rather than a promised service. As a result, shipping and handling costs are recorded as expenses in the same period the revenue is recognized. Sales taxes collected from customers are excluded from revenue and recorded as a liability until remitted to the appropriate tax authorities. Additionally, commissions paid to internal and external sales representatives for obtaining contracts are expensed as incurred, as the Company’s contracts are generally short-term in nature.
Product Warranties
The Company records a liability for product warranties at the time of the related sale of goods. The liability is estimated using historical warranty experience, projected claim rates and expected costs per claim. The Company adjusts its liability for specific warranty matters when they become known and the exposure can be estimated. Product failure rates as well as material usage and labor costs incurred in correcting a product failure affect the Company’s warranty liabilities. If actual costs differ from estimated costs, the Company must make a revision to the warranty liability.
The following activity related to product warranty liabilities was recorded in accrued expenses and other current liabilities during the years ended December 28, 2024 and December 30, 2023, respectively:
| | | | | |
| (dollar amounts in millions) | |
| Balance at December 30, 2023 | $ | 2.3 | |
| Additional reserves on product warranties | 3.0 | |
| Warranty claims | (0.5) | |
| Balance at December 28, 2024 | $ | 4.8 | |
| | | | | |
| Balance at December 31, 2022 | $ | 0.9 | |
| Additional reserves on product warranties | 1.4 | |
| Warranty claims | — | |
| Balance at December 30, 2023 | $ | 2.3 | |
Shipping and Handling (Product Revenues & Product Cost of Revenues)
The Company records amounts billed to customers in product revenue transactions, related to shipping and handling, as revenue earned for the goods provided. Shipping and handling costs are included in product cost of revenues. Shipping and handling costs were approximately $35.0, $38.1 and $42.7 for the years ended December 28, 2024, December 30, 2023, and December 31, 2022, respectively.
Advertising Costs
The Company records all advertising and tradeshow related costs to the consolidated statements of operations and comprehensive income during the year they are incurred and they are included in Selling and marketing operating expenses. During the years ended December 28, 2024, December 30, 2023, and December 31, 2022, the Company incurred and expensed advertising costs of $4.6, $3.8 and $2.6, respectively.
General and Administrative
The Company records corporate and business unit administrative personnel, facilities, professional services, amortization of intangible assets, share-based compensation, and other operating activities in general and administrative expenses on the Consolidated Statements of Operations and Comprehensive Income.
Selling and Marketing
The Company records compensation and benefits of employees engaged in selling activities as well as related travel, advertising, trade shows/conventions, meals and entertainment expenses to selling and marketing expense on the Consolidated Statements of Operations and Comprehensive Income.
Stock Compensation
We recognize expense for share-based compensation plans based on the estimated fair value of the related awards in accordance with ASC 718, “Compensation – Stock Compensation”. Pursuant to our incentive stock plans, we can grant stock options, restricted stock units, performance-based restricted stock units (“PSUs”) to employees and our non-employee directors. The majority of our awards are restricted stock units granted to employees, with vesting period between one year and four years. We charge compensation expense under the plan to earnings over each award’s individual vesting period. Forfeitures are recorded as they occur. See Note 12, Equity Compensation, for additional information.
Treasury Stock
We account for treasury stock under the cost method pursuant to the provisions of ASC 505-30, “Treasury Stock”. Under the cost method, the gross cost of the shares reacquired is charged to a contra equity account, treasury stock. The equity accounts that were originally credited for the original share issuance, common stock and additional paid-in capital, remain intact.
If the treasury shares are ever reissued in the future at a price higher than its cost, the difference will be recorded as a component of additional paid-in-capital in our Consolidated Balance Sheets. When treasury stock is re-issued at a price lower than its cost, the difference will be recorded as a component of additional paid-in-capital to the extent that there are previously recorded gains to offset the losses. If there are no treasury stock gains in additional paid-in-capital, the losses upon re-issuance of treasury stock are recorded as a reduction of retained earnings in our Consolidated Balance Sheets. If treasury stock is reissued in the future, a cost flow assumption will be adopted to compute excesses and deficiencies upon subsequent share re-issuance.
Earnings Per Share
Basic Earnings Per Share is computed by dividing net income by the weighted-average number of common shares outstanding during each period. Diluted Earnings Per Share assumes the exercise of outstanding stock options and the vesting of performance share awards using the treasury stock method when the effects of such assumptions are dilutive.
Deferred Finance Fees
Deferred financing fees consist of First Lien Term Loan and the ABL Credit and Guarantee Agreement costs, which are being amortized on the effective interest and straight-line method, respectively, over the life of the related debt. Debt issuances are more fully described in Note 9, Line of Credit, and Note 10, Long-Term Debt.
Fair Value Measurement
The Company uses valuation approaches that maximize the use of observable inputs and minimize the use of unobservable inputs to the extent possible. A three-tiered hierarchy is established as a basis for considering such assumptions and for inputs used in the valuation methodologies in measuring fair value. This hierarchy requires that the Company use observable market data, when available, and minimize the use of unobservable inputs when determining fair value:
•Level 1, observable inputs such as quoted prices in active markets;
•Level 2, inputs other than the quoted prices in active markets that are observable either directly or indirectly; and
•Level 3, unobservable inputs in which there is little or no market data, which requires that the Company develop its own assumptions.
As of December 28, 2024 and December 30, 2023, the carrying value of the Company’s financial instruments including cash and cash equivalents, accounts receivable less allowance for credit losses, and accounts payable approximate their fair value based on the short-term nature of these instruments.
The fair value of the Company’s debt is estimated using fair value based risk measurements that are indirectly observable, such as credit risk that fall within Level 2 of the Fair Value hierarchy. The Company’s debt approximates its carrying amount as of December 28, 2024 and December 30, 2023 due to its variable interest rate that is tied to the current Secured Overnight Financing Rate (“SOFR”) rate plus an applicable margin (see Notes 9 and 10 to our Consolidated Financial Statements in this Form 10-K for a further discussion of the Company’s debt). Cash equivalents are highly liquid investments purchased three months or less from maturity.
Impairment of Long-Lived Assets
The Company reviews long-lived assets and definite-lived intangible assets for impairment whenever events or changes in circumstances indicate that the carrying amount of an asset may not be recoverable. If an evaluation of recoverability is required, the estimated undiscounted future cash flows associated with the asset group are compared to the asset group’s carrying amount to determine if an impairment is required. If the undiscounted cash flows are less than the carrying amount, an impairment loss is recorded to the extent that the carrying amount exceeds the fair value. No impairment was recorded during any of the fiscal years presented.
Foreign Currency Translation
The local currency is the functional currency for all of the Company’s foreign operations. Assets and liabilities of foreign operations are translated into U.S. dollars using the exchange rates in effect at the balance sheet reporting date, while income and expenses are translated at the average monthly exchange rates during the period. Adjustments from the translating financial statements in foreign currencies into U.S. dollars are recorded in other comprehensive income. The income tax effect of currency translation adjustments related to foreign subsidiaries that are not considered indefinitely reinvested is recorded as a component of deferred taxes with an offset to other comprehensive income. We record gains and losses from changes in exchange rates on transactions denominated in currencies other than the reporting location’s functional currency in Other income (expense), in the Consolidated Statements of Operations and Comprehensive Income.
Concentrations of Risk
Financial instruments that are potentially subject to concentration of credit risk consist primarily of cash and accounts receivable. The Company maintains cash in bank deposit accounts that, at times, may exceed the insured limits of the local country. The Company has not experienced any losses in such accounts. The Company sells its products and services mainly in the United States of America and European regions. The Company performs ongoing evaluations of its customers’ financial condition and limits the amount of credit extended when
deemed necessary. The Company generally does not require its customers to provide collateral or other security to support accounts receivable.
As of December 28, 2024, there were no customers that represented more than 10% of accounts receivable. As of December 30, 2023, one customer accounted for 11% of the accounts receivable balance. There were no customers that represented more than 10% of revenues as of December 28, 2024 or December 30, 2023. As of December 28, 2024, the Company had one vendor that accounted for 16% of all raw material and finished goods purchases. This vendor provides raw materials to the Company which can be sourced by alternative vendors should the need arise. There were no vendors that represented more than 10% of all raw material and finished goods purchases as of December 30, 2023.
Segments
The Company manages its operations through two operating and reportable segments: Janus North America and Janus International. These segments are structured to align the Company’s products and service offerings based on the geographic location between North America and International locations and with how the Company’s CODM assesses the Company’s operations. The CODM allocates resources and evaluates the financial performance of each operating segment. The Company’s segments are strategic businesses that are managed separately because each one develops, manufactures and markets distinct products and services. Refer to Note 18, Segments Information, for further detail.
Recently Adopted Accounting Pronouncements
In November 2023, the FASB issued ASU 2023-07, Segment Reporting (Topic 280): Improvements to Reportable Segment Disclosures, which expands disclosures about a public entity’s reportable segments and requires more enhanced information about a reportable segment’s expenses, interim segment profit or loss, and how a public entity’s chief operating decision maker uses reported segment profit or loss information in assessing segment performance and allocating resources. The update is effective for annual periods beginning after December 15, 2023 and for interim periods beginning after December 15, 2024. We adopted the guidance for the year ended December 28, 2024 and applied it retrospectively to all prior periods presented in the financial statements. Upon adoption, our disclosures regarding segment reporting were updated to comply with ASU 2023-07 and we have recast previously reported amounts across all reportable segments to conform to current segment presentation. The adoption of this ASU only affects our disclosures, with no impacts to our financial condition and results of operations.
Recently Issued Accounting Pronouncements Not Yet Adopted
In November 2024, the FASB issued ASU 2024-03, Income Statement—Reporting Comprehensive Income—Expense Disaggregation Disclosures. ASU 2024-03 is intended to improve disclosures about a public business entity’s expense and provide more detailed information to investors about the types of expenses in commonly presented expense captions. The amendments in this ASU are effective for annual reporting periods beginning after December 15, 2026, and interim periods beginning after December 15, 2027, with early adoption permitted. The Company is currently evaluating the potential impact of this guidance on its disclosures.
In December 2023, the FASB issued ASU 2023-09, Income Taxes (Topic 740): Improvements to Income Tax Disclosures, which expands disclosures in a public entity’s income tax rate reconciliation table and other disclosures regarding cash taxes paid both in the U.S. and foreign jurisdictions. The update will be effective for annual periods beginning after December 15, 2024. We are assessing the effect of this update on our consolidated financial statements and related disclosures.
In October 2023, the FASB issued ASU 2023-06, Disclosure Improvements - Codification Amendment in Response to the SEC’s Disclosure Update and Simplification Initiative. The ASU incorporates several disclosure and presentation requirements currently residing in the SEC Regulations S-X and S-K. The amendments will be applied prospectively and are effective when the SEC removes the related requirements from Regulations S-X or S-K. Any amendments the SEC does not remove by June 30, 2027 will not be effective. As we are currently subject to these SEC requirements, this ASU is not expected to have a material impact on our consolidated financial statements or related disclosures.
On August 23, 2023, the FASB issued ASU 2023-05, Business Combinations—Joint Venture Formations (Subtopic 805-60): Recognition and Initial Measurement, under which an entity that qualifies as either a joint venture or a corporate joint venture as defined in the FASB ASC master glossary is required to apply a new basis of accounting upon the formation of the joint venture. Specifically, the ASU provides that a joint venture or a corporate joint venture (collectively, “joint ventures”) must initially measure its assets and liabilities at fair value on the formation date. The amendments are effective for all joint venture formations with a formation date on or after January 1, 2025. Early adoption and retrospective application of the amendments are permitted.
Although there are several other new accounting pronouncements issued or proposed by the FASB, which have been adopted or will be adopted as applicable, management does not believe any of these accounting pronouncements has had or will have a material impact on the Company’s consolidated financial position or results of operations.
3. Inventories
The major components of inventories are detailed below at:
| | | | | | | | | | | |
| (dollar amounts in millions) | December 28, 2024 | | December 30, 2023 |
| Raw materials | $ | 40.3 | | | $ | 31.0 | |
| Work-in-process | 0.4 | | | 1.4 | |
| Finished goods | 12.6 | | | 16.0 | |
| Inventories | $ | 53.3 | | | $ | 48.4 | |
4. Property, Plant, and Equipment
Property, plant, and equipment are as follows:
| | | | | | | | | | | | | | | | | |
| (dollar amounts in millions) | Useful Life | | December 28, 2024 | | December 30, 2023 |
| Land | Indefinite | | $ | 3.4 | | | $ | 4.5 | |
| Building | 39 years | | — | | | 2.5 | |
| Manufacturing machinery and equipment | 3-7 years | | 50.6 | | | 43.5 | |
| Leasehold improvements | Over the shorter of the lease term or respective useful life | | 12.9 | | | 11.4 | |
| Computer and software | 3 years | | 16.3 | | | 14.5 | |
| Furniture and fixtures, and vehicles | 3-7 years | | 5.9 | | | 4.9 | |
| Construction in progress | | | 12.8 | | | 6.2 | |
| Total property, plant, and equipment | | | $ | 101.9 | | | $ | 87.5 | |
| Less: accumulated depreciation | | | (45.1) | | | (35.1) | |
| Property, plant, and equipment, net | | | $ | 56.8 | | | $ | 52.4 | |
For the years ended December 28, 2024, December 30, 2023, and December 31, 2022, the Company incurred depreciation expense of $12.0, $9.3 and $7.9, respectively.
5. Leases
The Company primarily leases certain office and manufacturing facilities, as well as vehicles, copiers and other equipment. These operating leases generally have an original lease term between 1 year and 20 years, and some include multiple options to extend (generally in increments of 5 to 10 years). Lease agreements generally do not include material variable lease payments, residual value guarantees or restrictive covenants.
The components of ROU assets and lease liabilities were as follows:
| | | | | | | | | | | | | | |
| (dollar amounts in millions) | Balance Sheet Classification | December 28, 2024 | | December 30, 2023 |
| Assets: | | | | |
| Operating lease assets | Right-of-use assets, net | $ | 56.3 | | | $ | 47.6 | |
| Finance lease assets | Right-of-use assets, net | 3.4 | | | 3.3 | |
| Total leased assets | | $ | 59.7 | | | $ | 50.9 | |
| Liabilities: | | | | |
| Current: | | | | |
| Operating | Accrued expenses and other current liabilities | $ | 5.4 | | | $ | 5.4 | |
| Finance | Current maturities of long-term debt | 1.3 | | | 1.0 | |
| Noncurrent: | | | | |
| Operating | Other long-term liabilities | $ | 56.2 | | | $ | 46.9 | |
| Finance | Long-term debt | 2.1 | | | 2.4 | |
| Total lease liabilities | | $ | 65.0 | | | $ | 55.7 | |
The components of lease expense were as follows:
| | | | | | | | | | | | | | | | | |
| (dollar amounts in millions) | December 28, 2024 | | December 30, 2023 | | December 31, 2022 |
| Operating lease cost | $ | 10.1 | | | $ | 8.9 | | | $ | 8.3 | |
| Variable lease cost | 0.9 | | | 0.7 | | | 0.4 | |
| Short-term lease cost | 1.7 | | | 0.9 | | | 0.1 | |
| Finance lease cost: | | | | | |
| Amortization of right-of-use assets | 1.4 | | | 0.8 | | | 0.2 | |
| Interest on lease liabilities | 0.3 | | | 0.2 | | | — | |
| Total lease cost | $ | 14.4 | | | $ | 11.5 | | | $ | 9.0 | |
Other information related to leases was as follows:
| | | | | | | | | | | |
| December 28, 2024 | | December 30, 2023 |
| Weighted Average Remaining Lease Term (in years) | | | |
| Operating Leases | 12.6 | | 8.9 |
| Finance Leases | 2.9 | | 3.4 |
| Weighted Average Discount Rate | | | |
| Operating Leases | 7.4% | | 7.6% |
| Finance Leases | 7.9% | | 8.4% |
As of December 28, 2024, future minimum lease payments under noncancellable operating leases with initial or remaining lease terms in excess of one year were as follows:
| | | | | |
| (dollar amounts in millions) | |
| 2025 | $ | 9.7 | |
| 2026 | 9.7 | |
| 2027 | 8.8 | |
| 2028 | 8.6 | |
| 2029 | 7.5 | |
| Thereafter | 53.8 | |
| Total future lease payments | $ | 98.1 | |
| Less: imputed interest | $ | (36.5) | |
| Present value of future lease payments | $ | 61.6 | |
As of December 28, 2024, future minimum repayments of finance leases were as follows:
| | | | | |
| (dollar amounts in millions) | |
| 2025 | $ | 1.5 | |
| 2026 | 1.0 | |
| 2027 | 0.8 | |
| 2028 | 0.3 | |
| 2029 | 0.2 | |
| Total future lease payments | $ | 3.8 | |
| Less: imputed interest | $ | (0.4) | |
| Present value of future lease payments | $ | 3.4 | |
6. Business Combinations
Terminal Door Asset Acquisition
On May 17, 2024, the Company, through its wholly owned subsidiary Terminal Door, acquired 100% of the business operations (such transaction, the “T.M.C. Acquisition”) of Smith T.M.C., Inc., a Georgia corporation, Jerry O. Smith Company, LLC, a Georgia limited liability company, and J.O.S. Realty, Inc., a Georgia corporation (collectively, “T.M.C.” or the “T.M.C. Sellers”). Pursuant to the asset purchase agreement for such acquisition, Terminal Door acquired substantially all assets of the T.M.C. Sellers related to the business of trucking terminal renovation, construction, remodeling, and maintenance. The Company accounted for this acquisition as a business combination.
For the year ended December 28, 2024, the Company incurred approximately $1.1 of third-party acquisition costs in connection with the T.M.C. Acquisition. These expenses are included in general and administrative expense in the accompanying Consolidated Statement of Operations and Comprehensive Income.
The following tables summarize the fair value of consideration transferred, the recognized amount of identified assets acquired, and liabilities assumed at the date of acquisition:
| | | | | |
| (dollar amounts in millions) | |
| Segment | North America |
| Consideration transferred | |
| Cash paid | $ | 59.4 | |
| Total purchase consideration, net of cash acquired | $ | 59.4 | |
| Recognized amounts of identifiable assets acquired | |
| Accounts receivable | $ | 2.4 | |
| Inventory | 0.2 | |
| Property and equipment | 0.4 | |
| Identifiable intangible assets | 42.5 | |
| Recognized amounts of identifiable liabilities assumed | |
| Accounts payable | (0.4) | |
| Contract liabilities | (0.5) | |
| Total identifiable net assets | 44.6 | |
| Goodwill | 14.8 | |
| Total net assets acquired | $ | 59.4 | |
The Company recognized goodwill related to the T.M.C. Acquisition of $14.8. The goodwill recognized in this acquisition was attributable to the acquired assembled workforce, expected synergies and economies of scale, none of which qualify for recognition as a separate intangible asset. The goodwill is expected to be deductible for tax purposes.
The following table sets forth the components of identifiable intangible assets acquired as of the date of the T.M.C. Acquisition, and the related weighted average amortization period:
| | | | | | | | |
| (dollar amounts in millions) | Fair Value | Weighted-Average Amortization Period (years) |
| Customer relationships | $ | 38.1 | | 15 |
| Tradename | 1.7 | | 5 |
| Non-compete agreement | 2.7 | | 5 |
| Identifiable intangible assets | $ | 42.5 | | |
Results of Acquired Operations
The results of the acquired operations of Terminal Door have been included in the Consolidated Financial Statements of the Company since the acquisition date of May 17, 2024. For the period from May 17, 2024 through December 28, 2024, Terminal Door contributed revenues of $27.2 and net income of $4.9. Pro forma results of operations for this acquisition have not been presented as the historical results of operations for T.M.C are not material to the consolidated results of operations in the prior years.
7. Acquired Intangible Assets and Goodwill
Intangible assets acquired in a business combination (see Note 6, Business Combinations) are recognized at fair value and amortized over their estimated useful lives. The carrying amount and accumulated amortization of recognized intangible assets at December 28, 2024 and December 30, 2023, are as follows:
| | | | | | | | | | | | | | | | | | | | | | | | | | | | | | | | | | | | | | | | | | | | | | | |
| (dollar amounts in millions) | | December 28, 2024 | | December 30, 2023 |
| Intangible Assets | Useful Life | Weighted-Average Amortization period (years) | Gross Carrying Amount | | Accumulated Amortization | | Accumulated Impairment | | Net Amount | | Gross Carrying Amount | | Accumulated Amortization | | Net Amount |
| Customer relationships | 10-15 years | 8.6 | $ | 446.8 | | | $ | 184.0 | | | $ | — | | | $ | 262.8 | | | $ | 409.0 | | | $ | 154.1 | | | $ | 254.9 | |
| Tradenames and trademarks | Indefinite | Indefinite | 107.5 | | | — | | | 12.0 | | | 95.5 | | | 107.5 | | | — | | | 107.5 | |
| Tradenames and trademarks | Definite | 4.4 | 1.7 | | | 0.2 | | | — | | | 1.5 | | | — | | | — | | | — | |
| Software development | 10-15 years | 8.2 | 20.3 | | | 9.0 | | | — | | | 11.3 | | | 20.3 | | | 7.5 | | | 12.8 | |
| Noncompete agreements | 3-8 years | 4.1 | 3.0 | | | 0.6 | | | — | | | 2.4 | | | 0.3 | | | 0.2 | | | 0.1 | |
| | | $ | 579.3 | | | $ | 193.8 | | | $ | 12.0 | | | $ | 373.5 | | | $ | 537.1 | | | $ | 161.8 | | | $ | 375.3 | |
Changes to gross carrying amount of recognized intangible assets due to translation adjustments include a loss of $0.3 and $0.8 for the years ended December 28, 2024 and December 30, 2023, respectively. Amortization expense was approximately $32.0, $29.8 and $29.7 for the years ended December 28, 2024, December 30, 2023, and December 31, 2022, respectively.
Impairment of Indefinite-Lived Tradenames and Trademarks
During the three months ended September 28, 2024, the Company experienced a revenue decline relative to expectations, historical performance, and strategic plans. This decrease was primarily driven by soft demand resulting from elevated interest rates and broader macroeconomic uncertainties, as well as a decline in stock price. Given these qualitative factors, the Company determined it was more likely than not that the fair value of the acquired assets could be impaired. Consequently, the Company performed a quantitative test of goodwill and indefinite-lived tradenames and trademarks as of September 28, 2024, ahead of the scheduled annual impairment test on September 29, 2024. This quantitative test yielded an impairment of $2.8 on its DBCI tradename.
In addition, on December 28, 2024, the Company implemented a strategic decision to focus the use of the DBCI tradename toward the Commercial markets on a go forward basis. The DBCI tradename will no longer be a focus within the self-storage industry. As a result of this strategic change, the Company performed an additional quantitative assessment of the DBCI tradename. We estimated the fair value of these intangible assets using the relief-from-royalty method which requires assumptions related to projected revenues from our long-range plans. This quantitative test indicated that the carrying value of the DBCI tradename exceeded its fair value, leading the Company to record a non-cash impairment of an additional $9.2 for a total impairment of $12.0 for the year ended December 28, 2024. The impairment was recorded in the caption “Impairment” in our Consolidated Statements of Operations and Comprehensive Income and is included within the North America segment. No other impairments were identified in the quantitative tests performed. The Company did not recognize any impairments for the year ended December 30, 2023.
If assumptions or estimates with respect to future performance vary from what is expected, including those assumptions related to revenue, margins, and economic indicators such as inflation and interest rates, it could result in a decline in fair value that may trigger future impairments.
The following table summarizes the aggregate expected amortization expense of definite-lived intangible assets as of December 28, 2024 (dollar amounts in millions):
| | | | | |
| 2025 | $ | 33.0 | |
| 2026 | 33.0 | |
| 2027 | 33.0 | |
| 2028 | 32.8 | |
| 2029 | 32.2 | |
| Thereafter | 114.0 | |
| Total | $ | 278.0 | |
Goodwill
The Company performed a quantitative test of goodwill as of September 28, 2024 as well as on the annual impairment testing on the first day of the fourth quarter. The Company determined that it is more likely than not that the goodwill was not impaired. The changes in the carrying amounts of goodwill for the years ended December 28, 2024 and December 30, 2023 were as follows:
| | | | | | | | | | | | | | | | | |
| (dollar amounts in millions) | Janus North America | | Janus International | | Consolidated |
| Balance as of December 31, 2022 | $ | 357.0 | | | $ | 11.2 | | | $ | 368.2 | |
| Foreign Currency Translation Adjustment | — | | | 0.4 | | | 0.4 | |
| Balance as of December 30, 2023 | $ | 357.0 | | | $ | 11.6 | | | $ | 368.6 | |
| Foreign Currency Translation Adjustment | — | | | (0.3) | | | (0.3) | |
| Terminal Door Asset Acquisition | 14.8 | | | — | | | 14.8 | |
| Balance as of December 28, 2024 | $ | 371.8 | | | $ | 11.3 | | | $ | 383.1 | |
8. Accrued Expenses and Other Current Liabilities
Accrued Expenses and Other Current Liabilities are summarized as follows:
| | | | | | | | | | | |
| (dollar amounts in millions) | December 28, 2024 | | December 30, 2023 |
| Customer deposits | $ | 17.4 | | | $ | 29.6 | |
| Employee compensation | 13.7 | | | 20.2 | |
| Interest payable | 3.5 | | | 13.2 | |
| Current operating lease liabilities | 5.4 | | | 5.4 | |
| Product warranties | 4.8 | | | 2.3 | |
Other liabilities(1) | 11.4 | | | 9.6 | |
| Total | $ | 56.2 | | | $ | 80.3 | |
(1) Other liabilities as of December 28, 2024 and December 30, 2023 consists primarily of property tax, credit card and various other accruals.
9. Line of Credit
Amendment No. 3 to the ABL Credit and Guarantee Agreement - On April 10, 2023, the Company entered into Amendment Number Three to ABL Credit and Guarantee Agreement (the “LOC Amendment No. 3”) to that certain ABL Credit and Guarantee Agreement, dated as of February 12, 2018 (the “LOC Agreement”). The LOC Amendment No. 3, among other things, (i) replaced the interest rate based on the LIBOR and related LIBOR-based mechanics applicable to borrowings under the LOC Agreement with an interest rate based on the Secured Overnight Financing Rate (“SOFR”) and related SOFR-based mechanics and (ii) updated certain other provisions of the LOC Agreement to reflect the transition from LIBOR to SOFR. The LOC Amendment provided for a revolving line of credit of $80.0 with interest payments due in arrears. The interest rate on the facility is based on a base rate, unless a SOFR Rate (as defined in the LOC Agreement) option is chosen by the Company. If the SOFR Rate is elected, the interest computation is equal to the SOFR Rate plus the SOFR Margin (as defined in the LOC Agreement) of either 1.25% or 1.50%. If the Base Rate (as defined in the LOC Agreement) is elected, the interest computation is equal to the Base Rate of the greatest of (a) the federal funds rate plus 0.50%, (b) the SOFR rate for a one month tenor plus 1.00%, (c) the floor (i.e., zero), or (d) the financial institution’s Prime Rate (as defined in the LOC Agreement), plus the Base Rate Margin (as defined in the LOC Agreement) of either 0.25% or 0.50%. As of December 30, 2023, the interest rate for the facility was 6.76%. At the beginning of each quarter, the applicable margin is set and determined based on the average net availability on the line of credit for the previous quarter.
2023 ABL Credit and Guarantee Agreement - On August 3, 2023, the Company refinanced the revolving credit facility, pursuant to a new ABL Credit and Guarantee Agreement (the “2023 LOC Agreement”). The 2023 LOC Agreement, among other things, (i) increased the previous aggregate commitments from $80.0 to $125.0 subject to eligible collateral, (ii) updated the manner in which the previous borrowing base under the 2023 LOC Agreement was determined, and (iii) replaced the administrative agent with a new administrative agent. Interest payments with respect to the 2023 LOC Agreement are due in arrears. The maturity date is August 3, 2028.
The interest rate on the facility is based on a base rate, unless an Adjusted Term SOFR Rate (as defined in the 2023 LOC Agreement) option is chosen by the Company. If the Adjusted Term SOFR Rate is elected, the interest rate is equal to the Adjusted Term SOFR Rate, which includes a 10bps flat CSA, plus the SOFR Margin (as defined in the 2023 LOC Agreement) of 1.25%, 1.50%, or 1.75%, based on the Average Excess Availability (as defined in the 2023 LOC Agreement). As of December 28, 2024, the SOFR Margin Rate was 1.25%. If the Alternate Base Rate (as defined in the 2023 LOC Agreement) is elected, the interest computation is equal to the Alternate Base Rate of the greatest of (a) the federal funds rate plus 0.50%, (b) the Adjusted Term SOFR Rate for a one month tenor plus 1.00%, or (c) the financial institution’s Prime Rate (as defined in the 2023 LOC Agreement), plus the Base Rate Margin (as defined in the 2023 LOC Agreement) of either 0.25%, 0.50%, or 0.75% (as of December 28, 2024, the Base Rate Margin was 0.25%). At the beginning of each quarter, the applicable margin is set and determined based on the average net availability on the line of credit for the previous quarter. As of December 28, 2024, the Adjusted Term SOFR interest rate for the facility was 5.92%. The line of credit is collateralized by accounts receivable and inventories. The Company accrues an unused commitment fee to the administrative agent at the varying rate of 0.25% to 0.38%, based on the unused portion of the maximum commitment, as defined in the 2023 LOC Agreement.
This refinancing amendment was accounted for as a debt extinguishment and a $0.2 loss on debt extinguishment was recognized for this transaction within Loss on extinguishment and modification of debt on the Consolidated Statement of Operations and Comprehensive Income. The Company incurred $1.3 of debt issuance costs, which were capitalized and are being amortized over the term of the facility that expires on August 3, 2028, using the straight-line method, and are presented as part of Other assets within our Consolidated Balance Sheet. The amortization of the deferred loan costs is included in Interest expense on the Consolidated Statements of Operations and Comprehensive Income.
Amortization of approximately $0.2, $0.3 and $0.2 was recognized for the years ended December 28, 2024, December 30, 2023 and December 31, 2022, respectively. The unamortized portion of the fees, included in Other assets, as of December 28, 2024 and December 30, 2023, was approximately $0.9 and $1.1, respectively. There were no borrowings outstanding on the line of credit as of December 28, 2024 and December 30, 2023.
As of December 28, 2024, and December 30, 2023, the Company’s borrowing base capacity was $82.4 and $125.0, respectively.
As of December 28, 2024, and December 30, 2023, the Company maintained one letter of credit totaling approximately $0.4. The amount available on the revolver as of December 28, 2024 and December 30, 2023, was approximately $82.0, and $124.6, respectively.
The Company has no outstanding balance as of December 28, 2024 and December 30, 2023, respectively.
10. Long-Term Debt
Long-term debt consists of the following:
| | | | | | | | | | | |
| (dollar amounts in millions) | December 28, 2024 | | December 30, 2023 |
| First Lien Note payable | $ | 598.5 | | | $ | 623.4 | |
| Finance leases | 3.4 | | | 3.4 | |
| $ | 601.9 | | | $ | 626.8 | |
| Less: unamortized deferred finance fees | 9.9 | | | 11.8 | |
| Less: current maturities | 8.8 | | | 7.3 | |
| Total long-term debt | $ | 583.2 | | | $ | 607.7 | |
Notes Payable - First Lien - On February 12, 2018, the Company entered into the First Lien Credit and Guarantee Agreement, dated as of February 12, 2018 (as amended to date, the “First Lien Term Loan”) comprised of a syndicate of lenders as amended from time to time. On February 5, 2021, the Company completed a repricing of its First Lien and First Lien B2 term loans and consolidated the prior two outstanding tranches into a single tranche of debt with Amendment No. 3. On August 18, 2021, the Company completed a refinancing of its Firs Lien Term Loan with Amendment No. 4, in which the principal terms of the amendment were used to fund the DBCI acquisition.
On June 20, 2023, the Company entered into Amendment No. 5 which replaced the prior interest rate based on LIBOR with an interest rate based on SOFR.On August 3, 2023, the Company refinanced its existing First Lien Term Loan pursuant to Amendment No. 6. As chosen by the Company, the amended loan bears interest at a floating rate per annum consisting of Adjusted Term SOFR plus an applicable margin. As a result, the Company wrote off a portion of unamortized debt financing costs associated with the prior First Lien Agreement, that was deemed extinguished and recognized a loss on debt extinguishment of $1.4 for the year ended December 30, 2023, recognized within Loss on extinguishment and modification of debt on the Consolidated Statement of Operations and Comprehensive Income. In conjunction with the Amendment No. 6, the Company incurred $2.3 of costs from third parties that did not qualify for capitalization of deferred finance costs, and were expensed within Loss on extinguishment and modification of debt on the Consolidated Statement of Operations and Comprehensive Income.
Notes Payable - Amendment No. 7 First Lien - As a result of a credit rating upgrade in March 2024, the First Lien Term Loan allowed the previous applicable margin rate to decrease from 3.25% to 3.00%. On April 18, 2024, the Company made a voluntary prepayment of $21.9 toward the First Lien Term Loan. As a result of the prepayment, the Company expensed an additional $0.4 for pro-ration of the unamortized debt issuance costs that was amortizing over the expected life of the borrowing. The Company used cash on hand to make the voluntary prepayment.
On April 30, 2024, the Company completed a repricing pursuant to the Repricing Amendment to the First Lien Term Loan. The Repricing Amendment reduced the applicable interest rate margins on the $600.0 First Lien Term Loan from 2.00% to 1.50% for the term loans bearing interest at rates based on the base rate, and from 3.00% to 2.50% for the term loans bearing interest at rates based on the secured overnight financing rate. In addition to the change in the applicable margin rate, the Company is no longer subject to a CSA rate of 0.1%. Interest is payable in arrears (with respect to Base Rate loans) or at the end of an interest period selected by the Company (with respect to SOFR loans). The outstanding loan balance is to be repaid on a quarterly basis in an amount equal to 0.25% of the original balance of the amended loan, with the remaining principal due on the maturity date of August 3, 2030. The debt was secured by substantially all of the Company’s business assets. The interest rate on the First Lien Term Loan as of December 28, 2024 was 7.07%, which is a variable rate based on Adjusted Term SOFR and includes an applicable margin of 2.50%.
The Repricing Amendment was accounted for in accordance with ASC 470-50, “Debt - Modification and Extinguishment.” The First Lien Term Loan consists of a syndicate of lenders which were evaluated, for accounting purposes, as individual lenders. Certain lenders exited the Term Loan credit facility in connection with the Repricing Amendment, which resulted in extinguishment accounting. There were $599.0 of borrowings held by lenders in the First Lien Term Loan as amended by the Repricing Amendment, that were also held by lenders in the First Lien Term Loan prior to the Repricing Amendment.
As a result, the Company wrote off an immaterial portion of unamortized debt financing costs associated with the First Lien Term Loan prior to the Repricing Agreement, that was deemed extinguished and recognized within “Loss on extinguishment and modification of debt” on the Consolidated Statement of Operations and Comprehensive Income. In conjunction with the Repricing Amendment, the Company incurred $1.7 of costs from third parties that did not qualify for capitalization of deferred finance costs, and were expensed within Loss on extinguishment and modification of debt on the Consolidated Statement of Operations and Comprehensive Income.
In conjunction with the Repricing Amendment, the Company incurred $0.2 of capitalizable deferred finance costs, which will be amortized over the remaining term of the modified loan. Amortization of deferred loan costs is included in interest expense on the Consolidated Statements of Operations and Comprehensive Income.
Amortization of approximately $2.2, $3.4, and $3.4 was recognized for the years ended December 28, 2024 and December 30, 2023, and December 31, 2022 respectively, as a component of interest expense. These amounts are inclusive of the additional costs affiliated with voluntary prepayment of principal balances.
During the year ended December 28, 2024, the Company’s finance lease obligation primarily consists of vehicle lease agreements. The leases expire at various dates through 2030 with terms between one and five years.
Aggregate annual maturities of long-term debt and finance leases at December 28, 2024, are:
(dollar amounts in millions)
| | | | | |
| 2025 | $ | 8.9 | |
| 2026 | 6.9 | |
| 2027 | 6.7 | |
| 2028 | 6.3 | |
| 2029 | 6.0 | |
| Thereafter | 567.1 | |
| Total | $ | 601.9 | |
11. Profit Sharing Plan
The Company has one 401(k) plan for the years ended December 28, 2024, December 30, 2023 and December 31, 2022 covering substantially all U.S. employees of Janus International Group, Inc., Janus International Group, LLC, Betco, Inc., Noke, Inc., ASTA Industries, Inc., and Access Control Technologies, LLC. Eligible employees may contribute up to the limits established by applicable income tax regulations. The Company made employer matching contributions of approximately $2.1, $1.9 and $1.5 for the years ended December 28, 2024, December 30, 2023 and December 31, 2022, respectively.
12. Equity Compensation
2021 Omnibus Incentive Plan
The Company maintains its 2021 Omnibus Incentive Plan (the “Plan”) under which it grants stock-based awards to eligible directors, officers and employees in order to attract, retain and reward such individuals and strengthen the mutuality of interest between such individuals and the Company’s stockholders. The Plan allows to issue and grant 15,125,000 shares.
The Company measures compensation expense for stock-based awards in accordance with ASC Topic 718, “Compensation – Stock Compensation” (“ASC 718”). During the twelve months ended December 28, 2024, the Company granted stock-based awards including restricted stock units (“RSUs”), performance-based restricted stock units (“PSUs”) and stock options under the Plan. The grant date value of RSUs and PSUs are equal to the closing price of the Company’s common stock on either: (i) the date of grant; or (ii) the previous trading day, depending on the level of administration required. Forfeitures are recognized as they occur. Any unvested RSUs, PSUs, or stock options are forfeited upon a “Termination of Service”, as defined in the Plan, or as otherwise provided in the applicable award agreement or determined by the Company’s Compensation Committee of the Board of Directors. In connection with these equity awards, the stock-based compensation expense was $10.7, $7.1 and $4.1 and the income tax benefit from stock-based compensation was $1.9, $1.4 and $0.9, for the years ended December 28, 2024, December 30, 2023, and December 31, 2022, respectively.
Restricted Stock Unit Grants
RSUs are subject to a vesting period between one and four years. RSUs activity for the years ended December 30, 2023 and December 28, 2024 is as follows:
| | | | | | | | | | | |
| (amounts in millions, except share and per share data) | RSUs | | Weighted-Average Grant Date Fair Value, per share |
| Unvested, outstanding at December 31, 2022 | 465,064 | | | $ | 10.5 | |
| Granted | 748,198 | | | 10.6 | |
| Vested | (191,892) | | | 10.9 | |
| Forfeited | (76,560) | | | 10.1 | |
| Unvested, outstanding at December 30, 2023(1) | 944,810 | | | $ | 10.6 | |
| Granted | 1,461,217 | | | 14.0 | |
| Vested | (382,669) | | | 10.8 | |
| Forfeited | (73,251) | | | 11.6 | |
| Unvested, outstanding at December 28, 2024 | 1,950,107 | | | $ | 13.1 | |
Stock-based compensation expense for RSUs is recognized straight-line over the respective vesting period, reduced for actual forfeitures, and included in general and administrative in the accompanying Consolidated Statement of Operations and Comprehensive Income. Total compensation expense related to the above awards was approximately $9.4, $3.5, and $2.4 for the years ended December 28, 2024, December 30, 2023, and December 31, 2022, respectively. As of December 28, 2024, there was an aggregate of $18.0 of unrecognized expense related to the RSUs granted, which the Company expects to amortize over a weighted-average period of 1.8 years.
Performance-based Restricted Stock Unit Grants
PSU awards are based on the satisfaction of the Company’s three-year cumulative Adjusted EBITDA. The number of PSUs that become earned can range between 0% and 200% of the original target number of PSUs awarded for the 2022 and 2023 awards. PSUs are subject to a three-year performance cliff-vesting period.
PSUs activity for the years ended December 30, 2023 and December 28, 2024 is as follows:
| | | | | | | | | | | |
| (amounts in millions, except share and per share data) | PSUs | | Weighted-Average Grant Date Fair Value, per share |
| Outstanding at December 31, 2022 | 252,923 | | | $ | 9.50 | |
| Granted | 229,091 | | | 10.6 | |
| Vested | — | | | — | |
| Forfeited | — | | | — | |
Unvested, outstanding at December 30, 2023(1) | 482,014 | | | $ | 10.0 | |
| Granted | 832,445 | | | 9.9 | |
| Vested | — | | | — | |
| Forfeited | (41,008) | | | 11.0 | |
Unvested, outstanding at December 28, 2024(1)(2) | 1,273,451 | | | $ | 9.9 | |
(1) This number excludes 252,923 performance stock units, which represents the incremental number of units that would be issued based on performance results from previously-granted PSU awards.
(2) This number includes 431,355 performance stock units, which are projected to payout at 0% due to performance results from previously-granted PSU awards.
Stock-based compensation expense for PSUs is recognized straight line over the requisite vesting period, reduced for actual forfeitures, and included in general and administrative in the accompanying Consolidated Statement of Operations and Comprehensive Income. Total compensation expense related to the PSUs was approximately $0.7, $2.8, and $1.2 for the years ended December 28, 2024, December 30, 2023, and December 31, 2022, respectively. As of December 28, 2024, there was an aggregate of $4.7 of unrecognized expense related to the PSUs granted, which the Company expects to amortize over a weighted-average period of 2.3 years.
The above table represents PSUs assuming 100% of target payout at the time of the grant. The actual payout of the 2022 grants will be in a range of 0% to 200%, depending on performance results for the three-year performance period from January 2, 2022, through December 28, 2024. As of December 28, 2024, the Company deemed the estimate of the PSUs granted in fiscal year ended December 31, 2022 to be issued at 200% of target, and have reflected such estimates within the share-based compensation expense.
The actual payout of the 2023 grants will be in a range of 0% to 200%, depending on performance results for the three-year performance period from January 1, 2023, through December 27, 2025. As of December 28, 2024, the Company deemed the estimate of the PSUs granted in the year ended December 28, 2024 to be issued at 0% of target, and have reflected such estimates within the share-based compensation expense.
Included in the 2024 grants are 232,702 units granted as part of the normal annual PSU grants. The actual payout of the 2024 grants will be in a range of 0% to 200%, depending on performance results for the three-year performance period from January 1, 2024, through December 26, 2026. As of December 28, 2024, the Company deemed the estimate of the PSUs granted in the year ended December 28, 2024 to be issued at 0% of target, and have reflected such estimates within the share-based compensation expense.
Included in the 2024 grants are 599,743 units granted as a special incentive to retain key members of the management team. The actual payout of the 2024 grants will be in a range of 0% to 200%, depending on performance results for the two-year performance period from December 29, 2024, through January 2, 2027. As of December 28, 2024, the Company deemed the estimate of the PSUs granted in the year ended December 28, 2024 to be issued at 100% of target, and have reflected such estimates within the share-based compensation expense.
Stock Options
Stock options are granted by applying a Black-Scholes valuation model to determine the fair value on the grant date. Stock options are subject to a vesting period of either three or four years. Stock option awards typically vest in 33% or 25% annual installments on each annual anniversary of the vesting commencement date for the duration of the vesting period, and expire ten years from the grant date. The principal assumptions utilized in valuing stock options include the expected option life, the risk-free interest rate (an estimate based on the yield of United States Treasury zero coupon with a maturity equal to the expected life of the option), the expected stock price volatility using the historical and implied price volatility, and the expected dividend yield.
A summary of the assumptions used in determining the fair value of stock options for the year ended December 30, 2023 is below. There were no stock options granted for the year ended December 28, 2024.
| | | | | |
| Years Ended |
| December 30, 2023 |
| Fair market value at grant date per share | $ | 5.30 | |
Expected life of option (years) (1) | 6.0 |
Risk-free interest rate (2) | 3.7 | % |
Expected volatility of the Company’s stock (3) | 48.0 | % |
| Expected dividend yield on the Company’s stock | — | % |
(1) Expected life is the weighted average of mid-point between vesting and expiry.
(2) The risk-free rate is based on an average of U.S. Treasury yields in effect at the time of grant corresponding with the expected term.
(3) Expected volatility is based on historical volatilities from a group of comparable entities for a time period similar to that of the expected term.
Stock options activity for the years ended December 30, 2023 and December 28, 2024 is as follows:
| | | | | | | | | | | | | | | | | | | | | | | |
| (amounts in millions, except share and per share data) | Stock Options | | Weighted-Average Exercise Price, per share | | Weighted Average Remaining Contractual Life (in years) | | Aggregate Intrinsic Value |
| Outstanding at December 31, 2022 | 700,729 | | | $ | 9.4 | | | 9.8 | | $ | 0.1 | |
| Granted | 18,796 | | | | | | | |
| Forfeited | — | | | | | | | |
| Outstanding at December 30, 2023 | 719,525 | | | $ | 9.4 | | | 8.4 | | $ | 2.0 | |
| Granted | — | | | | | | | |
| Exercised | (2,069) | | | | | | | |
| Forfeited | (40,871) | | | | | | | |
| Outstanding at December 28, 2024 | 676,585 | | | $ | 9.4 | | | 7.4 | | $ | — | |
| Outstanding, unvested | 339,340 | | | $ | 9.4 | | | 7.4 | | $ | — | |
| Outstanding, vested | 337,245 | | | $ | 9.4 | | | 7.4 | | $ | — | |
The intrinsic value of each option share is the difference between the fair market value of our common stock and the exercise price of such option share to the extent it is “in-the-money”. Aggregate intrinsic value represents the value that would have been received by the holders of in-the-money options had they exercised their options on the last trading day of the year and sold the underlying shares at the closing stock price on such day. The intrinsic value calculation is based on the $7.36 closing stock price of our common stock on December 27, 2024, the last trading day of 2024. As of December 30, 2023, the intrinsic value calculation is based on the $13.05 closing stock price of our common stock on December 29, 2023, the last trading day of 2023.
Stock-based compensation expense for stock options is recognized straight line over the requisite service period, reduced for actual forfeitures, and included in general and administrative expenses in the accompanying Consolidated Statement of Operations and Comprehensive Income. Total compensation expense related to stock options was approximately $0.6, $0.8, and $0.5 for the years ended December 28, 2024, December 30, 2023, and December 31, 2022, respectively. Total unamortized stock-based compensation expense related to the unvested stock options was approximately $1.0, which the Company expects to amortize over a weighted-average period of 1.3 years. There were no stock options exercised during the twelve months ended December 28, 2024.
13. Restructuring
During fiscal year 2023, the Company initiated a restructuring plan to relocate one of its international facilities to further align its corporate strategy. During fiscal year 2024, the Company initiated a new multi-phase restructuring plan to improve its operational efficiencies to further support its corporate strategy. The Company incurs costs associated with restructuring initiatives intended to improve operating performance, profitability and efficiency of business processes. Restructuring expenses include severance costs, relocations costs, recruiting fees affiliated with hiring new personnel, legal costs, gain/loss on assets disposed of on closed facilities, and contract cancellation costs.
The Company records restructuring charges when they are probable and estimable. Restructuring costs are accrued when the Company announces the closure or restructuring event, and the amounts can be reasonably estimated. Restructuring costs are included in general and administrative expenses on the Consolidated Statements of Operations and Comprehensive Income, other than the gain on sale of manufacturing facility, which is included in Other expenses, net on the Consolidated Statements of Operations and Comprehensive Income.
The Company’s restructuring expenses are comprised of the following:
| | | | | | | | | | | | | | |
| (dollar amounts in millions) | | Year Ended |
| | December 28, 2024 | | December 30, 2023 |
| Severance and termination benefits | | $ | 1.6 | | | $ | 0.3 | |
| Gain on sale of manufacturing facility | | (5.0) | | | — | |
| Other facility related charges | | 0.4 | | | 0.1 | |
| Legal, consulting, and other costs | | 0.1 | | | 0.8 | |
| Total restructuring (income) expenses | | $ | (2.9) | | | $ | 1.2 | |
The following table summarizes the changes in the Company’s accrued restructuring balance, which are included in accrued expenses and other current liabilities in the accompanying Consolidated Balance Sheets.
| | | | | |
| |
| Balance at December 30, 2023 | $ | — | |
| Restructuring expenses | 2.1 | |
| Payments | (1.8) | |
| Balance at December 28, 2024 | $ | 0.3 | |
14. Revenue Recognition
Contract Balances
Contract balances as of December 28, 2024 and December 30, 2023 were as follows:
| | | | | |
| (dollar amounts in millions) | |
| Revenues in excess of billings at December 28, 2024 | $ | 16.2 | |
| Unbilled receivables at December 28, 2024 | 7.0 | |
| Contract assets at December 28, 2024 | $ | 23.2 | |
| |
| Revenues in excess of billings at December 30, 2023 | $ | 17.8 | |
| Unbilled receivables at December 30, 2023 | 31.9 | |
| Contract assets at December 30, 2023 | $ | 49.7 | |
| |
| Contract liabilities, December 28, 2024 | $ | 17.9 | |
| Contract liabilities, December 30, 2023 | $ | 26.7 | |
| |
During the year ended December 31, 2022, the Company recognized revenue of approximately $21.2 related to contract liabilities at January 1, 2022. During the year ended December 30, 2023, the Company recognized revenue of approximately $18.9 related to contract liabilities at December 31, 2022. During the year ended December 28, 2024, the Company recognized revenue of approximately $24.5 related to contract liabilities at December 30, 2023. All remaining performance obligations are expected to be satisfied within one year.
Disaggregation of Revenue
The principal categories we use to disaggregate revenues are by timing and sales channel of revenue recognition. The following disaggregation of revenues depicts the Company’s reportable segment revenues by timing and sales channel of revenue recognition for the years ended December 28, 2024, December 30, 2023, and December 31, 2022:
Revenue by Timing of Revenue Recognition
| | | | | | | | | | | | | | | | | |
| (dollar amounts in millions) | Year Ended |
| Reportable segments by timing of revenue recognition | December 28, 2024 | | December 30, 2023 | | December 31, 2022 |
| Janus North America | | | | | |
| Product revenues transferred at a point in time | $ | 633.8 | | | $ | 742.7 | | | $ | 746.5 | |
| Product revenues transferred over time | 104.8 | | | 122.4 | | | 85.0 | |
| Service revenues transferred over time | 154.0 | | | 120.6 | | | 114.3 | |
| $ | 892.6 | | | $ | 985.7 | | | $ | 945.8 | |
| Janus International | | | | | |
| Product revenues transferred at a point in time | $ | 43.3 | | | $ | 46.3 | | | $ | 43.4 | |
| Service revenues transferred over time | 30.3 | | | 36.0 | | | 32.1 | |
| $ | 73.6 | | | $ | 82.3 | | | $ | 75.5 | |
| Eliminations | $ | (2.4) | | | $ | (1.6) | | | $ | (1.8) | |
| Total revenue | $ | 963.8 | | | $ | 1,066.4 | | | $ | 1,019.5 | |
Revenue by Sales Channel Revenue Recognition
| | | | | | | | | | | | | | | | | | |
| (dollar amounts in millions) | Year Ended | |
| Reportable Segments by Revenues Channel Revenue Recognition | December 28, 2024 | | December 30, 2023 | | December 31, 2022 | |
| Janus North America | | | | | | |
| Self Storage-New Construction | $ | 354.0 | | | $ | 321.7 | | | $ | 266.1 | | |
| Self Storage-R3 | 234.3 | | | 325.8 | | | 302.8 | | |
| Commercial and Others | 304.3 | | | 338.2 | | | 376.9 | | |
| $ | 892.6 | | | $ | 985.7 | | | $ | 945.8 | | |
| Janus International | | | | | | |
| Self Storage-New Construction | $ | 62.2 | | | $ | 73.2 | | | $ | 57.2 | | |
| Self Storage-R3 | 11.4 | | | 9.1 | | | 18.3 | | |
| $ | 73.6 | | | $ | 82.3 | | | $ | 75.5 | | |
| Eliminations | $ | (2.4) | | | $ | (1.6) | | | $ | (1.8) | | |
| Total Revenues | $ | 963.8 | | | $ | 1,066.4 | | | $ | 1,019.5 | | |
15. Income Taxes
The Company is taxed as a Corporation for U.S. income tax purposes and similar sections of the state income tax laws. The Company’s effective tax rate is based on pre-tax earnings, enacted U.S. statutory tax rates, non-deductible expenses, and certain tax rate differences between U.S. and foreign jurisdictions. The foreign pass-through subsidiaries file income tax returns in the U.K., France, Australia, and Singapore as necessary, and the controlled foreign corporation subsidiaries file income tax returns in Poland and Canada, as necessary. The Company expect to continue to reinvest foreign earnings outside the U.S. indefinitely. The Company’s provision for income taxes consists of provisions for federal, state, and foreign income taxes.
The provision for income taxes for the years ended December 28, 2024, December 30, 2023 and December 31, 2022 includes amounts related to entities within the Company taxed as corporations in the U.S., U.K., France, Australia, Singapore, Poland, and Canada. The income tax effects of significant unusual or infrequently occurring items are recognized entirely within the period in which the event occurs.
During the years ended December 28, 2024, December 30, 2023 and December 31, 2022, the Company recorded a total income tax provision of approximately $29.9, $47.1 and $37.6, on pre-tax income of approximately $100.3, $182.8 and $145.3, respectively, resulting in an effective tax rate of 29.8%, 25.8% and 25.9%, respectively. The effective tax rates for the years ended December 28, 2024, December 30, 2023 and December 31, 2022, were primarily impacted by state income taxes (net of federal benefits), permanent differences, tax credits, and the statutory rate differential as well as the change in tax rates.
The carrying values of deferred income tax assets and liabilities reflect the application of our income tax accounting policies in accordance with applicable accounting standards, and are based on management’s assumptions and estimates regarding future operating results and levels of taxable income, as well as management’s judgment regarding the interpretation of the provisions of applicable accounting standards. The carrying values of liabilities for income taxes currently payable are based on management’s interpretations of applicable tax laws, and incorporate management’s assumptions, and judgments regarding the use of tax planning strategies in various taxing jurisdictions. The use of different estimates, assumptions and judgments in connection with accounting for income taxes may result in materially different carrying values of income tax assets and liabilities and results of operations.
We evaluate the recoverability of these deferred tax assets by assessing the adequacy of future expected taxable income from all sources, including reversal of taxable temporary differences, forecasted operating earnings and available tax planning strategies. These sources of income inherently rely on estimates. We use our historical experience and our short-term and long-term business forecasts to provide insight. Further, our global business portfolio gives us the opportunity to employ various prudent and feasible tax planning strategies to facilitate the recoverability of future deductions. The Company believes it is more likely than not that the results of future operations will generate sufficient taxable income to realize the net deferred tax assets recorded. To the extent we do not consider it more likely than not that a deferred tax asset will be recovered, a valuation allowance is established.
For the years ended December 28, 2024, December 30, 2023 and December 31, 2022, income before taxes consist of the following:
| | | | | | | | | | | | | | | | | |
| (dollar amounts in millions) | Year Ended |
| December 28, 2024 | | December 30, 2023 | | December 31, 2022 |
| US operations | $ | 105.7 | | | $ | 178.7 | | | $ | 140.7 | |
| Foreign operations | (5.4) | | | 4.1 | | | 4.6 | |
| Total | $ | 100.3 | | | $ | 182.8 | | | $ | 145.3 | |
Income tax expense (benefit) attributable to income from operations consists of:
| | | | | | | | | | | | | | | | | |
| (dollar amounts in millions) | Current | | Deferred | | Total |
| Year ended December 28, 2024: | | | | | |
| U.S. federal | $ | 22.8 | | | $ | (0.5) | | | $ | 22.3 | |
| State and local | 7.1 | | | 1.1 | | | 8.2 | |
| Foreign jurisdiction | (0.1) | | | (0.5) | | | (0.6) | |
| Total | $ | 29.8 | | | $ | 0.1 | | | $ | 29.9 | |
| | | | | | | | | | | | | | | | | |
| Current | | Deferred | | Total |
| Year ended December 30, 2023: | | | | | |
| U.S. federal | $ | 27.8 | | | $ | 9.5 | | | $ | 37.3 | |
| State and local | 7.6 | | | 0.5 | | | 8.1 | |
| Foreign jurisdiction | 2.2 | | | (0.5) | | | 1.7 | |
| Total | $ | 37.6 | | | $ | 9.5 | | | $ | 47.1 | |
| | | | | | | | | | | | | | | | | |
| Current | | Deferred | | Total |
| Year ended December 31, 2022: | | | | | |
| U.S. federal | $ | 19.4 | | | $ | 9.8 | | | $ | 29.2 | |
| State and local | 3.4 | | | 3.6 | | | 7.0 | |
| Foreign jurisdiction | 1.3 | | | 0.1 | | | 1.4 | |
| Total | $ | 24.1 | | | $ | 13.5 | | | $ | 37.6 | |
Income tax expense attributable to income from continuing operations was approximately $29.9, $47.1, and $37.6 for the years ended December 28, 2024, December 30, 2023, and December 31, 2022, respectively:
| | | | | | | | | | | | | | | | | |
| (dollar amounts in millions) | Year Ended |
| December 28, 2024 | | December 30, 2023 | | December 31, 2022 |
| Income before taxes | $ | 100.3 | | | $ | 182.8 | | | $ | 145.3 | |
| Computed “expected” tax expense | 21.1 | | | 38.4 | | | 30.5 | |
| Increase (reduction) in income taxes resulting from: | | | | | |
| Statutory rate differential | (0.2) | | | 0.2 | | | 0.4 | |
| Permanent difference | 0.8 | | | 0.4 | | | — | |
| State income taxes, net of federal benefit | 5.5 | | | 7.8 | | | 6.0 | |
| Change in tax rates | 0.4 | | | (1.2) | | | 1.2 | |
| Out of period adjustments | 3.4 | | | — | | | — | |
| Change in estimate | (1.3) | | | (0.2) | | | 0.8 | |
| Change in valuation allowance | — | | | — | | | (0.3) | |
| Tax Credits | (1.0) | | | (0.6) | | | (1.3) | |
| U.S. tax on foreign operations | 0.9 | | | 0.9 | | | — | |
| Other, net | 0.3 | | | 1.4 | | | 0.3 | |
| Total | $ | 29.9 | | | $ | 47.1 | | | $ | 37.6 | |
The tax effects of temporary differences that give rise to significant portions of the deferred tax assets and deferred tax liabilities at December 28, 2024 and December 30, 2023 are presented below:
| | | | | | | | | | | |
| (dollar amounts in millions) | December 28, 2024 | | December 30, 2023 |
| Deferred tax assets | | | |
| Allowance for credit losses | $ | 4.4 | | | $ | 1.3 | |
| Intangibles | 25.6 | | | 36.3 | |
| Lease obligations | 14.8 | | | 11.9 | |
| Research and development | 3.9 | | | 0.3 | |
| Accrued expenses | 1.7 | | | 0.9 | |
| Inventories | 1.0 | | | 0.2 | |
| Stock compensation | 1.6 | | | 1.5 | |
| Interest expense carryforward | 0.9 | | | 0.2 | |
| Other | 1.1 | | | 0.1 | |
| Total deferred tax assets | $ | 55.0 | | | $ | 52.7 | |
| | | |
| Deferred tax liabilities | | | |
| Property, plant and equipment | $ | (5.4) | | | $ | (6.0) | |
| Right-of-use assets | (13.6) | | | (10.9) | |
| Other | (0.8) | | | (0.7) | |
| Total deferred tax liabilities | $ | (19.8) | | | $ | (17.6) | |
| Net deferred tax asset | $ | 35.2 | | | $ | 35.1 | |
The difference between income tax expense recorded in our consolidated statements of operations and comprehensive income and income taxes computed by applying the corporate statutory federal income tax rate of 21% for the years ended December 28, 2024, December 30, 2023 and December 31, 2022 is shown above. For the year ended December 28, 2024, the Company realized a current tax benefit of $0.1 from the utilization of state net operating loss carryforwards. We record a tax provision related to the amount of undistributed earnings of our foreign subsidiaries expected to be repatriated.
At December 28, 2024 and December 30, 2023, the Company had no net operating loss carryforwards for Federal income tax purposes which would be available to offset future federal taxable income, if any, and would not be subject to expiration. At December 28, 2024 and December 30, 2023, the Company has net operating loss carryforwards for state income tax purposes of $3.1 and $1.8 which are available to offset future state taxable income, of which $0.2 and $1.2 are subject to expiration beginning in 2030 and 2038, respectively.
In evaluating its ability to realize its net deferred tax assets, the Company considered all available positive and negative evidence, including its past operating results, forecasted earnings, future taxable income, and prudent and feasible tax planning strategies.
ASC 740 clarifies the accounting for uncertainty in income taxes and prescribes a recognition threshold and measurement attributes for financial statement disclosure of income tax positions taken or expected to be taken on an income tax return. Management believes there are no material tax positions for which there is uncertainty as of December 28, 2024 and December 30, 2023, or penalties and interest associated with them. There are no changes expected in the next 12 months.
Management of Janus is required to analyze all open tax years, as defined by the statute of limitations, for all major jurisdictions, which includes federal and certain states. For the years before 2021, the Company is no longer subject to U.S. federal tax examinations, and for the years before 2020, the Company is no longer subject to state income tax examinations.
16. Net Income Per Share
Basic net income per share is computed based on the weighted average number of shares of common stock outstanding during the period. Diluted net income per share is computed based on the weighted average number of common shares outstanding plus the effect of dilutive potential common shares outstanding during the period using the treasury stock method. For the years ended December 28, 2024, December 30, 2023 and December 31, 2022, dilutive potential common shares include stock options and unvested restricted stock units. Dilutive EPS excludes all common shares if their effect is anti-dilutive.
The following table sets forth the computation of basic and diluted EPS attributable to common stockholders for the years ended December 28, 2024, December 30, 2023 and December 31, 2022:
| | | | | | | | | | | | | | | | | |
| (dollar amounts in millions) | Year Ended |
| December 28, 2024 | | December 30, 2023 | | December 31, 2022 |
| Numerator: | | | | | |
| Net income attributable to common stockholders | $ | 70.4 | | | $ | 135.7 | | | $ | 107.7 | |
| | | | | |
| | | | | |
| Denominator: | | | | | |
| Weighted average number of shares: | | | | | |
| Basic | 144,256,152 | | | 146,782,101 | | | 146,606,197 | |
| Adjustment for dilutive securities | 542,948 | | | 99,956 | | | 116,669 | |
| Diluted | 144,799,100 | | | 146,882,057 | | 146,722,866 |
| Basic net income per share attributable to common stockholders | $ | 0.49 | | | $ | 0.92 | | | $ | 0.73 | |
| Diluted net income per share attributable to common stockholders | $ | 0.49 | | | $ | 0.92 | | | $ | 0.73 | |
17. Share Repurchase Program
On February 28, 2024, the Company announced that the Board of Directors authorized a share repurchase program, pursuant to which the Company is authorized to purchase up to $100.0 of its common stock. The repurchase authorization does not have an expiration date and may be terminated by the Company’s Board of Directors at any time. As of December 28, 2024, $21.3 is remaining under the share repurchase program. There was no repurchase program in place for the year ended December 30, 2023.
The Inflation Reduction Act of 2022 imposes a 1% excise tax on share repurchases in excess of issuances, which is effective for Janus for repurchases completed after December 31, 2022. We reflect the excise tax within equity as part of the repurchase of the common stock.
The following table presents the share repurchase activity for the year ended December 28, 2024:
| | | | | |
| (amounts in millions) | |
| December 28, 2024 |
| Number of shares repurchased | 7,141,261 |
| Share repurchase cost (including excise taxes) | $ | 79.6 | |
18. Segments Information
The Company operates and reports its results through two geographic-based reportable segments: Janus North America and Janus International, in accordance with ASC Topic 280, Segment Reporting.
•The Janus International reportable segment is comprised of JIE with its production and sales located primarily in U.K., Australia, Poland and France.
•The Janus North America segment is comprised of all the other entities including Janus Core, BETCO, NOKE, ASTA, ACT, Janus Door, Bloom Door, Steel Door Depot, Janus Canada and Terminal Door.
This segment structure reflects how the Company’s Chief Executive Officer (“CEO”), who has been identified as the Chief Operating Decision Maker (“CODM”), evaluates performance and allocates resources. Key business strategies, strategic objectives, and competitive decisions are determined at the geographical level (North America and International) rather than by product lines, functional divisions, or business units. The CEO primarily assesses segment performance and allocates resources—including personnel, property, and financial or capital resources—using Gross Profit and Adjusted EBITDA. Budget-to-actual variances are reviewed monthly to assess performance and allocate resources.
Adjusted EBITDA is defined as net income excluding interest expense, income taxes, depreciation expense, amortization, and other non-operational, non-recurring items. The Company uses Adjusted EBITDA, a non-GAAP financial measure, to assess operating performance, develop future operating plans, and make strategic decisions related to operating expenses and resource allocation, among others.
Summarized financial information for the Company’s segments is shown in the following tables:
| | | | | | | | | | | | | | | | | | | | | | | |
| (dollar amounts in millions) | Janus North America | | Janus International | | Intersegment eliminations | | Total |
| Year ended December 28, 2024 | | | | | | | |
| Revenues | $ | 892.6 | | | $ | 73.6 | | | $ | (2.4) | | | $ | 963.8 | |
| Cost of revenues | 512.8 | | | 55.6 | | | (2.4) | | | 566.0 | |
| Gross profit | $ | 379.8 | | | $ | 18.0 | | | | | $ | 397.8 | |
Other segment items (1) | (173.5) | | | (15.8) | | | | | (189.3) | |
| Adjusted EBITDA | $ | 206.3 | | | 2.2 | | | | $ | 208.5 | |
| | | | | | | | | | | | | | | | | | | | | | | |
| (dollar amounts in millions) | Janus North America | | Janus International | | Intersegment eliminations | | Total |
| Year ended December 30, 2023 | | | | | | | |
| Revenues | $ | 985.7 | | | $ | 82.3 | | | $ | (1.6) | | | $ | 1,066.4 | |
| Cost of revenues | 560.2 | | | 58.1 | | | (1.6) | | | 616.7 | |
| Gross profit | $ | 425.5 | | | $ | 24.2 | | | | | $ | 449.7 | |
Other segment items (1) | (149.7) | | | (14.4) | | | | | (164.1) | |
| Adjusted EBITDA | $ | 275.8 | | | 9.8 | | | | $ | 285.6 | |
| | | | | | | | | | | | | | | | | | | | | | | |
| (dollar amounts in millions) | Janus North America | | Janus International | | Intersegment eliminations | | Total |
| Year ended December 31, 2022 | | | | | | | |
| Revenues | $ | 945.8 | | | $ | 75.5 | | | $ | (1.8) | | | $ | 1,019.5 | |
| Cost of revenues | 600.5 | | | 55.9 | | | (1.8) | | | 654.6 | |
| Gross profit | $ | 345.3 | | | $ | 19.6 | | | | | $ | 364.9 | |
Other segment items (1) | (125.1) | | | (12.9) | | | | | (138.0) | |
| Adjusted EBITDA | $ | 220.2 | | | 6.7 | | | | $ | 226.9 | |
(1) Other segment items included in Adjusted EBITDA primarily include selling and marketing expense, general and administrative expense, and depreciation and amortization expense.
| | | | | | | | | | | | | | | | | |
| (dollar amounts in millions) | Year Ended |
| December 28, 2024 | | December 30, 2023 | | December 31, 2022 |
| Consolidated Reconciliation | | | | | |
| Net Income | $ | 70.4 | | | $ | 135.7 | | | $ | 107.7 | |
| Interest Expense | 49.6 | | | 60.0 | | | 42.0 | |
| Income Taxes | 29.9 | | | 47.1 | | | 37.6 | |
| Depreciation and Amortization | 44.0 | | | 39.1 | | | 37.6 | |
| Restructuring & other Adjusted EBITDA adjustments | 14.6 | | | 3.7 | | | 2.0 | |
| Adjusted EBITDA | $ | 208.5 | | | $ | 285.6 | | | $ | 226.9 | |
| | | | | | | | | | | | | | | | | |
| (dollar amounts in millions) | Year Ended |
| December 28, 2024 | | December 30, 2023 | | December 31, 2022 |
| Depreciation expense - cost of revenues | | | | | |
| Janus North America | $ | 6.9 | | | $ | 6.3 | | | $ | 5.2 | |
| Janus International | 0.9 | | | 0.6 | | | 0.5 | |
| Consolidated depreciation expense - cost of revenues | $ | 7.8 | | | $ | 6.9 | | | $ | 5.7 | |
| Depreciation expense - operating expenses | | | | | |
| Janus North America | $ | 3.8 | | | $ | 2.0 | | | $ | 1.9 | |
| Janus International | 0.4 | | | 0.4 | | | 0.3 | |
| Consolidated depreciation expense - operating expenses | $ | 4.2 | | | $ | 2.4 | | | $ | 2.2 | |
| Amortization of intangible assets | | | | | |
| Janus North America | $ | 30.5 | | | $ | 28.4 | | | $ | 28.4 | |
| Janus International | 1.5 | | | 1.4 | | | 1.3 | |
| Consolidated amortization expense | $ | 32.0 | | | $ | 29.8 | | | $ | 29.7 | |
| Purchases of property, plant and equipment | | | | | |
| Janus North America | $ | 17.2 | | | $ | 15.4 | | | $ | 7.7 | |
| Janus International | 3.2 | | | 3.6 | | | 1.1 | |
| Consolidated purchases of property, plant and equipment | $ | 20.4 | | | $ | 19.0 | | | $ | 8.8 | |
| | | | | | | | | | | |
| December 28, 2024 | | December 30, 2023 |
| Identifiable assets | | | |
| Janus North America | $ | 1,234.6 | | | $ | 1,280.0 | |
| Janus International | 66.7 | | | 70.0 | |
| Consolidated assets | $ | 1,301.3 | | | $ | 1,350.0 | |
| Property, plant and equipment, net | | | |
| Janus North America | $ | 49.0 | | | $ | 46.3 | |
| Janus International | 7.8 | | | 6.1 | |
| Consolidated property, plant and equipment, net | $ | 56.8 | | | $ | 52.4 | |
| | | | | | | | | | | |
| December 28, 2024 | | December 30, 2023 |
Long-lived assets(1) | | | |
| United States | $ | 459.9 | | | $ | 449.4 | |
| Other | 30.1 | | | 29.2 | |
| Total long-lived assets | $ | 490.0 | | | $ | 478.6 | |
(1)The Company’s long-lived assets consist primarily of intangible assets, net, right-of-use assets, net, and property, plant and equipment, net.
| | | | | | | | | | | | | | | | | |
| December 28, 2024 | | December 30, 2023 | | December 31, 2022 |
| Revenues by country | | | | | |
| United States | $ | 885.6 | | | $ | 979.4 | | | $ | 939.9 | |
| Other | 80.6 | | | 88.6 | | | 81.4 | |
| Eliminations | (2.4) | | | (1.6) | | | (1.8) | |
| Total revenues | $ | 963.8 | | | $ | 1,066.4 | | | $ | 1,019.5 | |
| | | | | | | | | | | | | | | | | | | | | | | |
| (dollar amounts in millions) | Janus North America | | Janus International | | Intersegment eliminations | | Total |
| Year ended December 28, 2024 | | | | | | | |
| Product revenues | $ | 738.6 | | | $ | 43.2 | | | $ | (2.4) | | | $ | 779.4 | |
| Service revenues | 154.0 | | | 30.4 | | | — | | | $ | 184.4 | |
| Total revenues | $ | 892.6 | | | $ | 73.6 | | | | | $ | 963.8 | |
| Year ended December 30, 2023 | | | | | | | |
| Product revenues | $ | 865.1 | | | $ | 46.3 | | | $ | (1.6) | | | $ | 909.8 | |
| Service revenues | 120.6 | | | 36.0 | | | | | $ | 156.6 | |
| Total revenues | $ | 985.7 | | | $ | 82.3 | | | | | $ | 1,066.4 | |
| Year ended December 31, 2022 | | | | | | | |
| Product revenues | $ | 849.3 | | | $ | 43.4 | | | $ | (1.8) | | | $ | 890.9 | |
| Service revenues | 96.5 | | | 32.1 | | | | | $ | 128.6 | |
| Total revenues | $ | 945.8 | | | $ | 75.5 | | | | | $ | 1,019.5 | |
19. Commitments and Contingencies
Accounting principles generally accepted in the United States of America require disclosure of certain significant estimates and current vulnerabilities due to certain concentrations. Those matters include the following:
General Litigation
The Company is subject to claims and lawsuits that arise primarily in the ordinary course of business. It is the opinion of management that the disposition or ultimate resolution of such claims and lawsuits will not have a material adverse effect on the consolidated financial position, results of operations and cash flows of the Company.
Self-Insurance
Under the Company’s workers’ compensation insurance program, coverage is obtained for catastrophic exposures under which the Company retains a portion of certain expected losses. The Company has stop loss workers’ compensation insurance for claims in excess of $0.2 as of December 28, 2024 and December 30, 2023. Provision for losses expected under this program is recorded based upon the Company’s estimates of the aggregate liability for claims incurred and totaled approximately $0.9 and $0.5 as of December 28, 2024, and December 30, 2023, respectively. The amount of actual losses incurred could differ materially from the estimates reflected in these consolidated financial statements.
Under the Company’s health insurance program, coverage is obtained for catastrophic exposures under which the Company retains a portion of certain expected losses. The Company has stop loss insurance for claims in excess of $0.3 as of December 28, 2024 and December 30, 2023. Provision for losses expected under this program is recorded based upon the Company’s estimates of the aggregate liability for claims incurred and totaled approximately $1.4 and $2.4 as of December 28, 2024 and December 30, 2023, respectively. The amount of actual losses incurred could differ materially from the estimates reflected in these consolidated financial statements.
Unconditional Purchase Obligations
The Company has entered into certain unconditional purchase obligations with steel suppliers and under certain software agreements. Those agreements are non-cancelable and specify terms including fixed minimum quantities to be purchased, price provisions, and the terms of payment. We enter into these unconditional purchase obligation arrangements in the normal course of business to ensure that adequate levels of sourced product are available to us and as of December 28, 2024, unconditional purchase obligations were $6.8. Management expects to remit $2.8 of unconditional purchase obligations related to the supply contracts in the fiscal year 2025.
20. Subsequent Events
For the consolidated financial statements as of December 28, 2024, the Company has evaluated subsequent events through the issuance date of the financial statements.
Item 9. CHANGES IN AND DISAGREEMENTS WITH ACCOUNTANTS ON ACCOUNTING AND FINANCIAL DISCLOSURE
None.
Item 9A. CONTROLS AND PROCEDURES
Evaluation of Disclosure Controls and Procedures
Our Chief Executive Officer and Chief Financial Officer, with the participation of certain members of management (collectively “the management team”) evaluated the effectiveness of our disclosure controls and procedures as of December 28, 2024, the end of the period covered by this Annual Report on Form 10-K. The term “disclosure controls and procedures,” as defined in Rules 13a-15(e) and 15d-15(e) under the Securities Exchange Act of 1934, as amended, or the Exchange Act, means controls and other procedures of a company that are designed to ensure that information required to be disclosed by a company in the reports that it files or submits under the Exchange Act is recorded, processed, summarized and reported, within the time periods specified in the rules and forms of the Securities and Exchange Commission, or SEC. Disclosure controls and procedures include, without limitation, controls and procedures designed to ensure that information required to be disclosed by a company in the reports that it files or submits under the Exchange Act is accumulated and communicated to the Company’s management, including its principal executive and principal financial officers, as appropriate to allow timely decisions regarding required disclosure. Management recognizes that any controls and procedures, no matter how well designed and operated, can provide only reasonable assurance of achieving their objectives and management necessarily applies its judgment in evaluating the cost-benefit relationship of possible controls and procedures.
Based on the evaluation of our disclosure controls and procedures as of December 28, 2024, our management team concluded that our disclosure controls and procedures were effective.
Management’s Report on Internal Control over Financial Reporting
Our management is responsible for establishing and maintaining adequate internal control over financial reporting, as such term is defined in Exchange Act Rule 13a-15(f). Management, including our Chief Executive Officer and Chief Financial Officer, evaluated the effectiveness of our internal control over financial reporting as of the end of the period covered by this Annual Report on Form 10-K. In making its assessment of the effectiveness of internal control, management used the criteria set forth by the Committee of Sponsoring Organizations of the Treadway Commission (“COSO criteria”) in Internal Control-Integrated Framework (2013). Our internal control over financial reporting is designed to provide reasonable assurance to management and to our Board of Directors regarding the reliability of financial reporting and the preparation and fair presentation of financial statements for external purposes in accordance with generally accepted accounting principles. Our internal control over financial reporting includes those policies and procedures that:
(i) pertain to the maintenance of records that, in reasonable detail, accurately and fairly reflect the transactions and dispositions of our assets;
(ii) provide reasonable assurance that transactions are recorded as necessary to permit preparation of financial statements in accordance with generally accepted accounting principles, and that receipts and expenditures are being made only in accordance with authorizations of our management and directors; and
(iii) provide reasonable assurance regarding prevention or timely detection of unauthorized acquisition, use or disposition of our assets that could have a material effect on the financial statements.
Based on this assessment, management has concluded that our internal controls over financial reporting were effective as of December 28, 2024. Consistent with guidance issued by the SEC that an assessment of internal controls over financial reporting of a recently acquired business may be omitted from management’s evaluation of disclosure controls and procedures, management is excluding an assessment of the internal controls for the acquired processes of T.M.C. from its evaluation of the effectiveness of the Company’s disclosure controls and procedures. T.M.C. was acquired on May 17, 2024 and is included in our 2024 consolidated financial statements. It represented approximately $4.1 of assets as of December 28, 2024 and approximately $27.2 of total revenues for the year ended December 28, 2024.
KPMG LLP, the Company’s independent registered public accounting firm has issued its report on the effectiveness of our internal control over financial reporting as of December 28, 2024, which appears in this Annual Report on Form 10-K.
Limitations on Effectiveness of Controls and Procedures
Our disclosure controls and procedures are designed to provide reasonable assurance of achieving their objectives, as specified above. Our management recognizes that any control system, no matter how well designed and operated, is based upon certain judgments and assumptions, and cannot provide absolute assurance that its objectives will be met.
Changes in Internal Control Over Financial Reporting
Other than as described above, there have been no changes in the Company’s internal control over financial reporting during the quarter ended December 28, 2024, that have materially affected, or are reasonably likely to materially affect, the Company’s internal control over financial reporting.
REPORT OF INDEPENDENT REGISTERED PUBLIC ACCOUNTING FIRM
To the Stockholders and the Board of Directors
Janus International Group, Inc.
Opinion on Internal Control over Financial Reporting
We have audited Janus International Group, Inc. and subsidiaries' (the Company) internal control over financial reporting as of December 28, 2024, based on criteria established in Internal Control – Integrated Framework (2013) issued by the Committee of Sponsoring Organizations of the Treadway Commission. In our opinion, the Company maintained, in all material respects, effective internal control over financial reporting as of December 28, 2024, based on criteria established in Internal Control – Integrated Framework (2013) issued by the Committee of Sponsoring Organizations of the Treadway Commission.
We also have audited, in accordance with the standards of the Public Company Accounting Oversight Board (United States) (PCAOB), the consolidated balance sheet of the Company as of December 28, 2024, the related consolidated statements of operations and comprehensive income, changes in stockholders’ equity, and cash flows for the year then ended, and the related notes (collectively, the consolidated financial statements), and our report dated February 26, 2025 expressed an unqualified opinion on those consolidated financial statements.
The Company acquired T.M.C. during 2024, and management excluded from its assessment of the effectiveness of the Company’s internal control over financial reporting as of December 28, 2024, T.M.C.’s internal control over financial reporting associated with total assets of $4.1 million and total revenues of $27.2 million included in the consolidated financial statements of the Company as of and for the year ended December 28, 2024. Our audit of internal control over financial reporting of the Company also excluded an evaluation of the internal control over financial reporting of T.M.C.
Basis for Opinion
The Company’s management is responsible for maintaining effective internal control over financial reporting and for its assessment of the effectiveness of internal control over financial reporting, included in the accompanying Internal Control over Financial Reporting. Our responsibility is to express an opinion on the Company’s internal control over financial reporting based on our audit. We are a public accounting firm registered with the PCAOB and are required to be independent with respect to the Company in accordance with the U.S. federal securities laws and the applicable rules and regulations of the Securities and Exchange Commission and the PCAOB.
We conducted our audit in accordance with the standards of the PCAOB. Those standards require that we plan and perform the audit to obtain reasonable assurance about whether effective internal control over financial reporting was maintained in all material respects. Our audit of internal control over financial reporting included obtaining an understanding of internal control over financial reporting, assessing the risk that a material weakness exists, and testing and evaluating the design and operating effectiveness of internal control based on the assessed risk. Our audit also included performing such other procedures as we considered necessary in the circumstances. We believe that our audit provides a reasonable basis for our opinion.
Definition and Limitations of Internal Control over Financial Reporting
A company’s internal control over financial reporting is a process designed to provide reasonable assurance regarding the reliability of financial reporting and the preparation of financial statements for external purposes in accordance with generally accepted accounting principles. A company’s internal control over financial reporting includes those policies and procedures that (1) pertain to the maintenance of records that, in reasonable detail, accurately and fairly reflect the transactions and dispositions of the assets of the company; (2) provide reasonable assurance that transactions are recorded as necessary to permit preparation of financial statements in accordance with generally accepted accounting principles, and that receipts and expenditures of the company are being made only in accordance with authorizations of management and directors of the company; and (3) provide reasonable assurance regarding prevention or timely detection of unauthorized acquisition, use, or disposition of the company’s assets that could have a material effect on the financial statements.
Because of its inherent limitations, internal control over financial reporting may not prevent or detect misstatements. Also, projections of any evaluation of effectiveness to future periods are subject to the risk that controls may become inadequate because of changes in conditions, or that the degree of compliance with the policies or procedures may deteriorate.
/s/ KPMG LLP
Atlanta, Georgia
February 26, 2025
Item 9B. OTHER INFORMATION
Equity Trading Plan Elections
During the Company’s fiscal quarter ended December 28, 2024, none of our executive officers or directors (as defined in Section 16 of the Securities Exchange Act of 1934, as amended), adopted or terminated a Rule 10b5-1 trading arrangement or a “non-Rule 10b5-1 trading arrangement”, as those terms are defined in Item 408 of Regulation S-K.
Item 9C. DISCLOSURE REGARDING FOREIGN JURISDICTIONS THAT PREVENT INSPECTIONS
Not applicable.
PART III
Certain information required by Part III is incorporated by reference from our definitive Proxy Statement for the 2025 Annual Meeting of Stockholders (the “Proxy Statement”), or an amendment to this Form 10-K, which we intend to file with the SEC within 120 days after the fiscal year end covered by this report. Except for those portions specifically incorporated in this Form 10-K by reference to the Proxy Statement, no other portions of the Proxy Statement are deemed to be filed as part of this Form 10-K.
Item 10. DIRECTORS, EXECUTIVE OFFICERS AND CORPORATE GOVERNANCE
The Company expects to file the Proxy Statement no later than 120 days after the close of the Company’s last fiscal year pursuant to SEC Regulation 14A in connection with our 2025 Annual Meeting of Stockholders (the “Annual Meeting”), which involves the election of directors.
The following sections of the Proxy Statement are incorporated herein by reference: “Proposal 1 – Election of Directors”, “Executive Officers”, “Board of Directors and Corporate Governance”, “Certain Relationships and Related Party Transactions”, and “Delinquent Section 16(a) Reports.”
The Company has adopted a code of ethics entitled “Code of Ethics” that applies to the Company’s directors, officers, and employees (including its principal executive officer, principal financial officer, and principal accounting officer). We have posted our Code of Ethics on our website (https://ir.janusintl.com/governance/governance-documents) and will post on such website any amendments to, or waivers from, a provision of the Code of Ethics applying to an executive officer or director when required by applicable SEC and NYSE rules and regulations.
The Board has adopted an insider trading policy (the “Insider Trading Policy”) that applies to all of the Company’s directors, officers, and employees, as well as certain other designated individuals, to prevent the misuse of confidential information about the Company, as well as other companies with which the Company has a business relationship, and to promote compliance with all applicable securities laws. Among other things, the Insider Trading Policy prohibits engaging in transactions in securities based on material non-public information and prohibits directors, executive officers, and certain other employees from buying or selling the Company’s securities during certain periods, except pursuant to an approved trading plan under Rule 10b5-1 of the Securities Exchange Act of 1934, as amended (“Rule 10b5-1”). Certain types of transactions in the Company’s securities are also prohibited under the Insider Trading Policy. In addition, certain individuals, including directors and officers, are required to receive pre-clearance from the Company’s Chief Financial Officer, prior to engaging in transactions in the Company's securities. The Insider Trading Policy also sets forth mandatory guidelines that apply to all executive officers, directors, and employees of the Company who adopt Rule 10b5-1 plans for trading in the Company’s securities, which are intended to ensure compliance with Rule 10b5-1 and to conform to best practices with respect to the design and implementation of Rule 10b5-1 plans. For additional information, see the Insider Trading Policy, which is filed as an exhibit to our Annual Report on Form 10-K.
It is also the Company’s policy that the Company will not engage in transactions in Company securities, or adopt any securities repurchase plans, while in possession of material non-public information relating to the Company or its securities other than in compliance with applicable law, subject to the policies and procedures adopted by the Company. The Company currently has a share repurchase program in place. Repurchases may be made through open market purchases made in accordance with the terms of Rule 10b-18.
Executive Officers and Board of Directors
The following table sets forth the name, age (as of February 21, 2025), and title of the persons that serve as our executive officers and directors:
| | | | | | | | |
| Name | Age | Title |
| Ramey Jackson | 51 | Chief Executive Officer, Director |
| Anselm Wong | 52 | EVP and Chief Financial Officer |
| Morgan Hodges | 60 | Executive Vice President |
| Vic Nettie | 57 | Vice President of Manufacturing |
| Elliot Kahler | 34 | General Counsel and Corporate Secretary |
| David Vanevenhoven | 41 | Chief Accounting Officer |
| Peter Frayser | 40 | Chief Commercial Officer |
| Rebecca Castillo | 51 | Vice President of Human Resources |
| Roger Fradin | 71 | Chair of the Board |
| David Doll | 66 | Director |
| Xavier Gutierrez | 51 | Director |
| Thomas Szlosek | 61 | Director |
| Heather Harding | 56 | Director |
| | | | | | | | |
| Tony Byerly | 58 | Director |
| Joseph F. Hanna | 62 | Director |
| Eileen M. Youds | 67 | Director |
No family relationships exist among any of the above-listed officers or the members of the Board, and there are no arrangements or understandings between any of the above-listed officers and any other person pursuant to which they serve as an officer. During the past ten years, none of the above-listed officers was involved in any legal proceedings described in Item 401(f) of Regulation S-K.
Executive Officers
Ramey Jackson has served as a director and the Chief Executive Officer of the Company since the effective time of the Business Combination in June 2021. Mr. Jackson has been with Janus for over 20 years, having joined the company in 2002 when Janus was founded. Prior to Janus, Mr. Jackson was a sales executive for Doors and Building Components, Inc. and prior to that, a sales and marketing executive with Atlas Door and GA Power.
Anselm Wong has served as EVP and Chief Financial Officer of the Company since July 2022. Prior to Janus, Mr. Wong served as CFO for GE Digital and Deputy CFO for Resideo Technologies. Prior to that, Mr. Wong spent 20 years at Honeywell, having most recently served as VP of Finance & Spin Leader. In this role, he led the spinoff of the Honeywell Homes Business (Resideo) in ten months, separating 250+ legal entities, 17 ERP systems and numerous shared locations that included 17 factories, and hundreds of sales and back office locations throughout the globe. Mr. Wong holds a Bachelor of Commerce degree from University of Toronto in Ontario, Canada and is a CPA as well. He is Six Sigma Green Belt Certified.
Morgan Hodges has served as Executive Vice President of the Company since the effective time of the Business Combination in June 2021. Mr. Hodges has been with Janus since its inception in 2002. Prior to Janus, Mr. Hodges operated an independent company, CES, which specialized in self-storage construction and prior to that was an estimating executive at Doors and Building Components, Inc.
Vic Nettie has served as Vice President of Manufacturing of the Company since the effective time of the Business Combination in June 2021. Mr. Nettie has been with Janus since its inception in 2002. Prior to Janus, Mr. Nettie was the Manufacturing and Operations Manager for Doors and Building Components, Inc. Mr. Nettie has been involved in the construction of self-storage facilities, in multiple facets, since the late 1980’s. Mr. Nettie is a graduate of Michigan State University with a degree in Materials and Logistics Management with an emphasis in Operations.
Elliot Kahler serves as General Counsel and Corporate Secretary of the Company. Mr. Kahler joined the Company as Corporate Counsel in 2018, establishing the Company’s in-house Legal department. In September 2022, Mr. Kahler was promoted to General Counsel. In April 2024, Mr. Kahler was appointed Corporate Secretary of the Company. Prior to joining Janus, Mr. Kahler was an Atlanta-based attorney, where he focused his practice on corporate and transactional law. Mr. Kahler is an active member of the State Bar of Georgia. He received his Juris Doctor from Emory University School of Law and holds a Bachelor of Arts degree in History from Emory University.
David Vanevenhoven has served as Chief Accounting Officer since February 2023. He brings an extensive background in technical accounting, financial reporting, integration of mergers and acquisitions, and back-office process improvement primarily within the manufacturing and industrial sector. Mr. Vanevenhoven joined Janus from Mirion Technologies (NYSE: MIR), where he served as the Global Controller from June 2019 until February 2023, and helped the company through numerous domestic and international transactions, including a successful SPAC transaction to become a publicly traded company. Prior to Mirion, Mr. Vanevenhoven worked for Fleet Farm, a KKR-owned portfolio company, from October 2016 until June 2019. Mr. Vanevenhoven began his career in public accounting where he became a Senior Manager at KPMG LLP, serving private and public companies in the manufacturing sector. He is also a licensed CPA, and holds a bachelors degree in Accounting from the University of Wisconsin Eau-Claire.
Peter Frayser serves as Chief Commercial Officer of the Company. Before serving in his current role, Mr. Frayser served as Vice President of Sales and Estimating and served in positions of increasing responsibility since joining Janus in 2016. Prior to Janus, Mr. Frayser worked in real estate development in Valencia, Spain, and later in the international sports industry with the MLB and the NBA in New York City. Mr. Frayser has bachelor’s degrees in International Business and Spanish from the University of Georgia and a master’s degree in International Trade from the University of Castilla La Mancha (Spain).
Rebecca Castillo serves as the Vice President of Human Resources of the Company. Ms. Castillo joined the Company in 2016 as Director of Human Resources. In September 2022, Ms. Castillo was promoted to Vice President of Human Resources. Prior to joining Janus’s team, Ms. Castillo most recently served as a Regional Human Resources Manager where she led the employee relations and compliance functions for a major landscaping firm. Ms. Castillo received her bachelor’s degree in Business Administration from Mercer University’s Stetson School of Business and Economics where she graduated cum laude.
Directors
Roger Fradin has served as Chair of the Board of Directors since December 2023 and has served as a director of the Company since the effective time of the Business Combination in June 2021. Mr. Fradin has over 40 years of experience acquiring, building, and leading a diverse set of industrial businesses. Mr. Fradin began his career at Pittway Corporation where he held a variety of roles of increasing responsibility, including President and Chief Executive Officer of the Security and Fire Solutions segment, and helped lead an entrepreneurial team which transformed Pittway into a $2 billion world leader in electronic security and fire systems. In 2000, Pittway was acquired by Honeywell International Inc. (NYSE: HON), or Honeywell. Shortly thereafter, Mr. Fradin assumed the role of President and Chief Executive Officer of Honeywell Automation and Control Solutions, or ACS. In this role, Mr. Fradin transformed ACS from a business with $7 billion in
sales in 2003 focused predominantly on the U.S. market to a $17 billion in sales (as of 2014) global business leader in the development and manufacture of environmental controls, life safety products, and building and process solutions. From 2000 to 2017, Mr. Fradin oversaw, directed, and integrated the acquisition of 60 companies at Honeywell, aggregating billions of dollars in deal value. Mr. Fradin’s strategy and execution for ACS helped create more than $85 billion of value to Honeywell’s shareholders. During his tenure at Honeywell, Mr. Fradin also served as Vice Chairman of Honeywell where he was responsible for acquisition strategy for all of Honeywell. From 2018 to November 2024, Mr. Fradin served as Chairman of Resideo Technologies, Inc. (NYSE: REZI), or Resideo, a leading provider of home comfort and security solutions. In addition to Janus, Mr. Fradin currently sits on the boards of L3Harris Technologies Inc. (NYSE: LHX), Vertiv Group Corp. (NYSE: VTV), and CompoSecure (NASDAQ: CMPO). Mr. Fradin also currently serves as advisor to MSC Industrial Direct Co., Inc. (NYSE: MSM), or MSC and Resideo. Mr. Fradin formerly served on the boards of Pitney Bowes Inc. (NYSE: PBI) and GS Acquisition Holdings Corp. (NYSE: GSAH) and several of The Carlyle Group’s, or Carlyle, portfolio companies. Mr. Fradin holds a B.S. and M.B.A. from The Wharton School at the University of Pennsylvania.
David Doll has served as a director of the Company since the effective time of the Business Combination in June 2021. Mr. Doll is a seasoned executive in the self-storage industry. From 2005 through 2017, Mr. Doll was the President of Real Estate for Public Storage Inc., one of the world’s largest owner and operator of self-storage facilities. Prior to Public Storage, Mr. Doll was with Westfield Corporation, an international shopping center developer, owner, and operator. Mr. Doll graduated from the Ross School of Business at the University of Michigan with a bachelor’s degree in business administration and a major in accounting.
Xavier A. Gutierrez has served as a director of the Company since the effective time of the Business Combination in June 2021. Mr. Gutierrez is Chairman & CEO of ImpactX Sports Group, LLC, a private investment, operating, and strategic advisory firm focused on the global sports industry, positions he has held since April 2024. Previously, he served as CEO of the Arizona Coyotes NHL franchise from 2020 to 2024. In addition to serving as the first Latino CEO in the history of the National Hockey League, Mr. Gutierrez is one of the only real estate executives and private equity investors to have led a major professional sports franchise. During his 30-year career, Mr. Gutierrez has served as an investor, principal, and dealmaker at a wide array of organizations, including Clearlake Capital Group, The Meruelo Group, Phoenix Realty Group, Latham & Watkins, Lehman Brothers, and the NFL. Mr. Gutierrez currently serves on the boards of Trinitas Capital Management, the Arizona Community Foundation, Aspen Institute Latinos in Society Program, the Hispanic Scholarship Fund, the Stanford Alumni Association, and SUMA Wealth. In 2024, Mr. Gutierrez co-founded LiS: Latinos in Sports, a multi-strategy platform to promote and support the impact of Latinos to the global sports industry. Mr. Gutierrez has previously served as a voting member of the U.S. Securities and Exchange Commission Advisory Committee on Small and Emerging Companies and previously served on the board of directors of several organizations, including the Commercial Bank of California, Sizmek, Inc. (formerly NASDAQ: SZMK), the California Community Foundation, and the US Hispanic Chamber of Commerce. Mr. Gutierrez graduated cum laude from Harvard University, where he received a Bachelor of Arts in Government. He received his Doctor of Jurisprudence from Stanford Law School.
Thomas A. Szlosek has served as a director of the Company since the effective time of the Business Combination in June 2021. Mr. Szlosek is Executive Vice President and Chief Financial Officer of AutoNation (NYSE: AN). Mr. Szlosek currently serves on the board of directors of RXO, Inc. (NYSE: RXO). He joined AutoNation in August 2023, having served as Executive Vice President and Chief Financial Officer of Avantor (NYSE: AVTR) from December 2018 to August 2023. Prior to joining Avantor, he spent 14 years with Honeywell, including the last five years as Chief Financial Officer. Mr. Szlosek also spent eight years with GE Corporation, including three years as the CFO for GE Medical Systems, based in Asia, and two years as the CFO for GE Consumer Finance, based in Ireland. He is a Certified Public Accountant and graduated from The State University of New York at Geneseo.
Heather Harding has served as a director of the Company since July 2022. Previously, Ms. Harding served as Chief Financial Officer of Luxfer Holdings PLC from January 2018 until March 2022, and had served as its Advisor. Over the past 25 years, Ms. Harding has held finance leadership roles of increasing responsibility in global industrial companies. Most recently, she served as Vice President, Finance, for Eaton Lighting, a business unit of Eaton Corporation. Prior to that, she was Vice President, Finance, for various operating units within Cooper Industries and Emerson Electric. Ms. Harding currently serves on the board of directors of J.M. Huber Corporation. A Certified Public Accountant, Ms. Harding received a Bachelor of Science in Accounting from Southern Illinois University at Carbondale.
Tony Byerly has served as a director of the Company since December 2023. Mr. Byerly currently serves as Global President of Securitas Technology, Securitas AB, and Chief Executive Officer of Securitas Technology Corporation, a division of Securitas AB (STO: SECU-B) where he has worked since 2016. Mr. Byerly has over 30 years of senior leadership and security experience and has held positions of increasing responsibility in global security companies. Before serving in his current role at Securitas Technology, Byerly was the Executive Vice President of Global Security for Diebold Incorporated where he led global strategy efforts and the successful divestiture of the North America business to Securitas in 2016. Prior to that, Mr. Byerly served as President and Chief Operating Officer at Stanley Security as part of Stanley Black & Decker. Mr. Byerly received a Bachelor of Arts Degree in Social Science and Business from Eureka College.
Joseph F. Hanna has served as a director of the Company since December 2023. Mr. Hanna currently serves as President, Chief Executive Officer, and a director of McGrath RentCorp (Nasdaq: MGRC), a leading business-to-business rental company. Mr. Hanna has served as President, Chief Executive Officer, and director of McGrath since 2017. Before serving in his current role at McGrath, Mr. Hanna served as Chief Operating Officer and served in positions of increasing responsibility since 2003. Before joining McGrath, Mr. Hanna served as an officer in the United States Army following his graduation from West Point. Mr. Hanna received a Bachelor of Science Degree in Electrical Engineering from the U.S. Military Academy.
Eileen M. Youds has served as a director of the Company since December 2023. Ms. Youds most recently served as Chief Technology Officer of Portfolio Companies, Operating Principal of Global Infrastructure Partners (GIP) where she worked since December 2012. Prior to GIP, Ms. Youds was in manufacturing, human resources, and defense contracting, serving in leadership roles as President, GM, and COO. Ms. Youds has extensive expertise in process and productivity improvement, technology, manufacturing, engineering, and education. Ms.Youds also serves on the boards of a range of corporate, educational and civic organizations, including the University of Northern Iowa
and the University of St. Thomas. She has over 30 years of senior leadership and technology experience and has held positions of increasing responsibility in multi-billion dollar companies, including Pearson Vue and Honeywell. Ms. Youds holds a MEP (Management Executive Program) from the Carlson School of Management, University of Minnesota, a M.A. in Mathematics/Computer Science and a B.A. in Chemistry/Mathematics from the University of Northern Iowa.
Item 11. EXECUTIVE COMPENSATION
The following sections of the Proxy Statement are incorporated herein by reference: “Executive and Director Compensation”, “Compensation Discussion and Analysis”, “Compensation Committee Interlocks and Insider Participation”, and “Risk Oversight.”
Item 12. SECURITY OWNERSHIP OF CERTAIN BENEFICIAL OWNERS AND MANAGEMENT AND RELATED STOCKHOLDER MATTERS
The following section of the Proxy Statement is incorporated herein by reference: “Security Ownership of Certain Beneficial Owners and Management.”
Item 13. CERTAIN RELATIONSHIPS AND RELATED TRANSACTIONS, AND DIRECTOR INDEPENDENCE
The following sections of the Proxy Statement are incorporated herein by reference: “Board of Directors and Corporate Governance” and “Certain Relationships and Related Party Transactions.”
Item 14. PRINCIPAL ACCOUNTANT FEES AND SERVICES
Pursuant to General Instruction G(3) to Form 10-K, we incorporate by reference into this Item the information to be disclosed in our definitive proxy statement for our 2025 Annual Meeting of Stockholders.
Our independent registered public accounting firm is KPMG LLP, Atlanta, Georgia. Auditor Firm ID: 185.
On March 18, 2024 the Audit Committee approved the dismissal of our former independent accounting firm, BDO USA, P.C., Atlanta, Georgia, Auditor Firm ID: 243 (“BDO”), effective immediately. On March 18, 2024, the Audit Committee appointed KPMG LLP (“KPMG”), to audit the Company’s consolidated financial statements for our fiscal year ending December 28, 2024. KPMG has been our independent registered public accounting firm since March 18, 2024. BDO completed the audits for the consolidated financial statements as of and for the fiscal year ended December 30, 2023 and December 31, 2022.
The following section of the Proxy Statement is incorporated herein by reference: “Proposal 2 – Ratification of Appointment of Independent Registered Public Accounting Firm.”
PART IV
Item 15. EXHIBITS, FINANCIALS STATEMENT SCHEDULES
a.Listing of Documents
1.The financial statements of Janus International Group, Inc. filed as a part of this 2024 Annual Report on Form 10-K is listed in the “Index to Financial Statements and Schedules” on page 51. All other schedules are omitted because they are not applicable, not required, or the information is otherwise included in the financial statements or the notes thereto.
2.All financial statement schedules are omitted either because they are not applicable, not required, or the required information is included in the financial statements or notes thereto.
3.The following exhibits are filed as part of this 2024 Annual Report on Form 10-K:
| | | | | | | | | | | | | | | | | | | | | | | |
| | | | | Incorporated by Reference |
| Exhibit Number | Description | Form | Exhibit No. | Filing Date |
| 2.1 | Business Combination Agreement, dated December 21, 2020, by and among Juniper Industrial Holdings, Inc., Janus Parent, Inc., Janus Midco, LLC, Jupiter Management Holdings, LLC, Jupiter Intermediate Holdco, LLC and the other parties named therein. | 10-K | 2.1 | March 29, 2023 |
| 2.2 | | 10-K | 2.2 | March 29, 2023 |
| 3.1 | | 8-K | 3.1 | June 24, 2024 |
| 3.2 | | 8-K | 3.1 | February 1, 2024 |
| 4.1* | | | | |
| 4.2 | | 8-K | 4.3 | June 11, 2021 |
| 4.3 | | 10-K | 4.3 | March 29, 2023 |
| 10.1 | | 8-K | 10.4 | November 13, 2019 |
| 10.2 | | 8-K | 10.1 | June 11, 2021 |
| 10.3 | | 8-K | 10.3 | November 13, 2019 |
| 10.4 | | 8-K | 10.2 | June 11, 2021 |
| 10.5 | | 10-K | 10.5 | March 29, 2023 |
| 10.6 | | 8-K | 10.4 | June 11, 2021 |
| 10.7 | | 8-K | 10.5 | June 11, 2021 |
| 10.8 | | 10-K | 10.8 | March 29, 2023 |
| | | | | | | | | | | | | | | | | | | | | | | |
| 10.9 | | 8-K | 10.1 | September 29, 2021 |
| 10.10 | | 8-K | 10.2 | September 29, 2021 |
| 10.11 | | 8-K | 10.3 | September 29, 2021 |
| 10.12 | | 8-K | 10.4 | September 29, 2021 |
| 10.13 | Incremental Amendment No. 4, dated as of August 18, 2021 to that certain First Lien Credit and Guarantee Agreement, dated as of February 12, 2018, as amended, by and among Janus International Group, LLC, UBS AG, Stamford Branch, and the other parties thereto. | 8-K | 10.5 | September 29, 2021 |
| 10.14 | | 8-K | 10.6 | September 29, 2021 |
| 10.15 | | 8-K | 10.7 | September 29, 2021 |
| 10.16 | | 8-K | 10.8 | September 29, 2021 |
| 10.17+ | | 8-K | 10.1 | June 23, 2022 |
| 10.18+ | | 8-K | 10.2 | June 23, 2022 |
| 10.19+ | | S-8 | 10.1 | August 13, 2021 |
| 10.20+ | | 10-K | 10.10 | March 15, 2022 |
| 10.21+ | | 10-K | 10.21 | March 29, 2023 |
| 10.22+ | | 10-K | 10.22 | March 29, 2023 |
| 10.23+ | | 10-K | 10.23 | March 29, 2023 |
| 10.24+ | | 10-K | 10.24 | March 29, 2023 |
| 10.25 | | 8-K | 10.1 | April 12, 2023 |
| 10.26 | Open Market Sale Agreement, dated as of May 15, 2023, by and among Janus International Group, Inc., Clearlake Capital Partners IV (AIV-Jupiter), L.P., Clearlake Capital Partners IV (Offshore), L.P., Clearlake Capital Partners IV (AIV-Jupiter) USTE, L.P., Clearlake Capital Partners V, L.P., Clearlake Capital Partners V (Offshore), L.P., Clearlake Capital Partners V (USTE), L.P. and Jefferies LLC. | 8-K | 10.1 | May 15, 2023 |
| 10.27 | | 8-K | 10.1 | June 23, 2023 |
| 10.28 | | 8-K | 10.1 | August 4, 2023 |
| 10.29 | | 8-K | 10.2 | August 4, 2023 |
| 10.30 | | 8-K | 10.1 | April 30, 2024 |
| | | | | | | | | | | | | | | | | | | | | | | |
| 10.31 | Asset Purchase Agreement, dated May 17, 2024, by and among Smith T.M.C., Inc., Jerry O Smith Company, LLC, J.O.S. Realty, Inc., David Scot Smith, and Terminal Door, LLC. | 8-K | 10.1 | May 20, 2024 |
| 10.32+ | | 8-K | 10.1 | December 17, 2024 |
| 10.33*+ | | | | |
| 10.34*+ | | | | |
| 10.35*+ | | | | |
| 10.36*+ | | | | |
| 16.1 | | 8-K | 16.1 | March 22, 2024 |
| 19.1* | | | | |
| 21.1* | | | | |
| 23.1* | | | | |
| 23.2* | | | | |
| 24.1* | Power of Attorney (included on the signature page hereto). | | | |
| 31.1* | | | | |
| 31.2* | | | | |
| 32.1** | | | | |
| 32.2** | | | | |
| 97.1 | | 10-K | 97.1 | February 28, 2024 |
| 101.INS^ | Inline XBRL Instance Document. | | | |
| 101.SCH^ | Inline XBRL Taxonomy Extension Schema Document. | | | |
| 101.CAL^ | Inline XBRL Taxonomy Extension Calculation Linkbase Document. | | | |
| 101.DEF^ | Inline XBRL Taxonomy Extension Definition Linkbase Document. | | | |
| 101.LAB^ | Inline XBRL Taxonomy Extension Label Linkbase Document. | | | |
| 101.PRE^ | Inline XBRL Taxonomy Extension Presentation Linkbase Document. | | | |
| 104^ | Cover Page Interactive Data File (formatted as inline XBRL and contained in Exhibit 101). | | | |
*Filed herewith.
**The certifications furnished in Exhibit 32.1 and 32.2 hereto are deemed to accompany this Annual Report on Form 10-K and will not be deemed “filed” for purposes of Section 18 of the Securities Exchange Act of 1934, as amended, except to the extent that the registrant specifically incorporates it by reference.
+ Management contract or compensatory plan or arrangement.
^ Submitted electronically with this Report in accordance with the provisions of Regulation S-T.
Item 16. FORM 10-K SUMMARY
None.
SIGNATURES
Pursuant to the requirements of Section 13 or 15(d) of the Securities Exchange Act of 1934, the Registrant has duly caused this report to be signed on its behalf by the undersigned, thereunto duly authorized.
| | | | | | | | | | | | | | |
| Date: | February 26, 2025 | | By: | /s/ Anselm Wong |
| | | Name: | Anselm Wong |
| | | Title: | Executive Vice President and Chief Financial Officer |
| | | | |
POWER OF ATTORNEY
KNOW ALL BY THESE PRESENTS, that each person whose signature appears below constitutes and appoints Ramey Jackson, Anselm Wong, and Elliot Kahler or any of them, severally, as his attorney-in-fact and agent, with full power of substitution and resubstitution, for such person and in such person’s name, place, and stead, in any and all capacities, to sign any and all amendments to this Annual Report on Form 10-K, and to file the same with all exhibits hereto, and all other documents in connection herewith, with the Securities and Exchange Commission, granting unto said attorneys-in-fact and agents, and any of them, full power and authority to do and perform each and every act and thing requisite or necessary to be done in and about the premises, as fully to all intents and purposes as he or she might or could do in person, hereby ratifying and confirming all that said attorneys-in-fact and agents, or any of them, or their substitutes, may lawfully do or cause to be done by virtue hereof.
Pursuant to the requirements of the Securities Exchange Act of 1934, this report has been signed below by the following persons on behalf of the registrant and in the capacities and on the dates indicated.
| | | | | | | | | | | | | | |
| Name | | Position | | Date |
| | | | |
| /s/ Ramey Jackson | | Chief Executive Officer and Director (Principal Executive Officer) | | February 26, 2025 |
| Ramey Jackson | | | |
| /s/ Anselm Wong | | Executive Vice President and Chief Financial Officer (Principal Financial Officer) | | February 26, 2025 |
| Anselm Wong | | | |
| /s/ David Vanevenhoven | | Chief Accounting Officer
(Principal Accounting Officer) | | February 26, 2025 |
| David Vanevenhoven | | | |
| /s/ Roger Fradin | | Chair | | February 26, 2025 |
| Roger Fradin | | | |
| /s/ Tony Byerly | | Director | | February 26, 2025 |
| Tony Byerly | | | |
| /s/ David Doll | | Director | | February 26, 2025 |
| David Doll | | | |
| /s/ Joseph F. Hanna | | Director | | February 26, 2025 |
| Joseph F. Hanna | | | |
| /s/ Xavier A. Gutierrez | | Director | | February 26, 2025 |
| Xavier A. Gutierrez | | | |
| /s/ Eileen M. Youds | | Director | | February 26, 2025 |
| Eileen M. Youds | | | |
| | | | | | | | | | | | | | |
| /s/ Thomas A. Szlosek | | Director | | February 26, 2025 |
| Thomas A. Szlosek | | | |
| /s/ Heather Harding | | Director | | February 26, 2025 |
| Heather Harding | | | |