Cost of Goods Sold
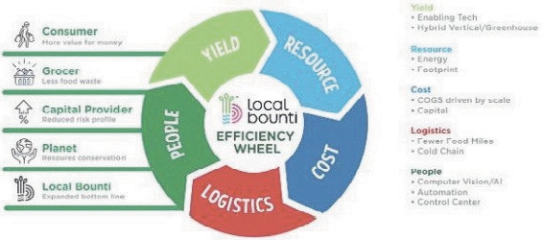
Cost of goods sold consists primarily of costs related to growing produce at our greenhouse growing facilities, including labor, seeds and other input supplies, packaging materials, depreciation, stock-based compensation, and utilities. We expect that, over time, cost of goods sold will decrease as a percentage of sales, as a result of scaling our business.
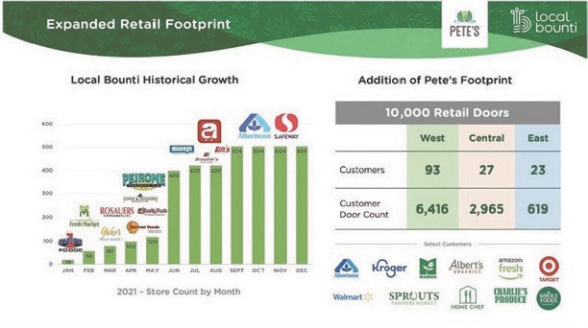
Cost of goods sold increased by $6,200 thousand for the three months ended June 30, 2022 compared to the three months ended June 30, 2021, due primarily to increased sales during the three months ended June 30, 2022 compared to the three months ended June 30, 2021. In addition, cost of goods sold was negatively impacted for three months ended June 30, 2022 due to the fair value step-up to expected selling price of acquired inventory from the Pete’s Acquisition during the quarter. This acquired inventory was subsequently sold during the quarter at the stepped-up value or at a zero margin, which negatively impacted gross margin by $1,042 or 16.6%. In addition, the increase in cost of goods sold reflects temporary supply chain challenges with suppliers that have since been resolved, but impacted second quarter yields in its California facilities, resulting in higher costs to fill orders.
Cost of goods sold increased by $6,394 thousand for the six months ended June 30, 2022 compared to the six months ended June 30, 2021, due primarily to increased sales during the six months ended June 30, 2022 compared to the six months ended June 30, 2021. In addition, cost of goods sold was negatively impacted for the six months ended June 30, 2022 due to the fair value step-up to expected selling price of acquired inventory from the Pete’s Acquisition during the quarter. This acquired inventory was subsequently sold during the quarter at the stepped-up value or at a zero margin, which negatively impacted gross margin by $1,042 or 15.9%. In addition, the increase in cost of goods sold reflects temporary supply chain challenges with suppliers that have since been resolved, but impacted second quarter yields in its California facilities, resulting in higher costs to fill orders.
Research and Development
Research and development expenses consist primarily of compensation to employees engaged in research and development activities, including salaries, stock-based compensation, and related benefits, overhead (including depreciation, utilities and other related allocated expenses), and supplies and services related to the development of our growing processes. Our research and development efforts are focused on the development of our processes utilizing our CEA facility, increasing production yields, developing new leafy green SKUs, and entering into new crops, including berries. Due to our ongoing research and development, we are currently generating approximately 26 crop turns annually for our commercial loose-leaf lettuce, which compares to approximately 17 to 22 turns annually as of December 31, 2021. We expect, over time, that research and development will decrease as a percentage of sales, as a result of the establishment of our growing process.
Research and development costs increased by $2,350 thousand for the three months ended June 30, 2022 compared to the three months ended June 30, 2021. Research and development costs increased by $4,759 thousand for the six months ended June 30, 2022 compared to the six months ended June 30, 2021. The increase for both periods was due to increased investment in research and development as we continue to expand our product offering and refine our growing process. We incurred costs for research and development of our production, harvesting, and post-harvest packaging techniques and processes, as well as production surplus costs related to the development of our production process.
Selling, General, and Administrative Expenses
Selling, general, and administrative expenses consist of employee compensation, including salaries, stock-based compensation, and related benefits for our executive, legal, finance, information technology, human resources and sales and marketing teams, expenses for third-party professional services, insurance, marketing, advertising, computer hardware and software, and amortization of intangible assets, among others.
58

