UNITED STATES SECURITIES AND EXCHANGE COMMISSION
WASHINGTON, D.C. 20549
FORM 10-K
| | | | | |
| ☒ | ANNUAL REPORT PURSUANT TO SECTION 13 OR 15(d) OF THE SECURITIES EXCHANGE ACT OF 1934 |
For the Fiscal Year Ended December 31, 2024
or
| | | | | |
| ☐ | TRANSITION REPORT PURSUANT TO SECTION 13 OR 15(d) OF THE SECURITIES EXCHANGE ACT OF 1934 |
| | | | | | | | | | | | | | |
Commission
File Number | | Name of Registrant; State or Other Jurisdiction of Incorporation; Address of Principal Executive Offices; and Telephone Number | | IRS Employer Identification Number |
| | | | |
| 001-41137 | | CONSTELLATION ENERGY CORPORATION | | 87-1210716 |
| | (a Pennsylvania corporation) 1310 Point Street Baltimore, Maryland 21231-3380 (833) 883-0162 | | |
| | | | |
| 333-85496 | | CONSTELLATION ENERGY GENERATION, LLC | | 23-3064219 |
| | (a Pennsylvania limited liability company) 200 Energy Way Kennett Square, Pennsylvania 19348-2473 (833) 883-0162 | | |
Securities registered pursuant to Section 12(b) of the Act: | | | | | | | | | | | | | | |
| Title of each class | | Trading Symbol(s) | | Name of each exchange on which registered |
| CONSTELLATION ENERGY CORPORATION: | | | | |
| Common Stock, without par value | | CEG | | The Nasdaq Stock Market LLC |
Securities registered pursuant to Section 12(g) of the Act: None
Indicate by check mark if the registrant is a well-known seasoned issuer, as defined in Rule 405 of the Securities Act.
| | | | | | | | | | | | | | | | | |
| Constellation Energy Corporation | Yes | x | | No | ☐ |
| Constellation Energy Generation, LLC | Yes | ☐ | | No | x |
Indicate by check mark if the registrant is not required to file reports pursuant to Section 13 or Section 15(d) of the Act.
| | | | | | | | | | | | | | | | | |
| Constellation Energy Corporation | Yes | ☐ | | No | x |
| Constellation Energy Generation, LLC | Yes | ☐ | | No | x |
Indicate by check mark whether the registrant (1) has filed all reports required to be filed by Section 13 or 15(d) of the Securities Exchange Act of 1934 during the preceding 12 months (or for such shorter period that the registrant was required to file such reports), and (2) has been subject to such filing requirements for the past 90 days.
| | | | | | | | | | | | | | | | | |
| Constellation Energy Corporation | Yes | x | | No | ☐ |
| Constellation Energy Generation, LLC | Yes | x | | No | ☐ |
Indicate by check mark whether the registrant has submitted electronically every Interactive Data File required to be submitted pursuant to Rule 405 of Regulation S-T (§232.405 of this chapter) during the preceding 12 months (or for such shorter period that the registrant was required to submit and post such files). Yes ý No ¨
Indicate by check mark whether the registrant is a large accelerated filer, an accelerated filer, a non-accelerated filer, a smaller reporting company, or an emerging growth company. See the definitions of “large accelerated filer,” “accelerated filer,” “smaller reporting company,” and "emerging growth company" in Rule 12b-2 of the Exchange Act.
| | | | | | | | | | | | | | | | | | | | | | | | | | | | | | | | |
| Constellation Energy Corporation | Large Accelerated Filer | x | Accelerated Filer | ☐ | Non-accelerated Filer | ☐ | Smaller Reporting Company | ☐ | Emerging Growth Company | ☐ |
| Constellation Energy Generation, LLC | Large Accelerated Filer | ☐ | Accelerated Filer | ☐ | Non-accelerated Filer | x | Smaller Reporting Company | ☐ | Emerging Growth Company | ☐ |
If an emerging growth company, indicate by check mark if the registrant has elected not to use the extended transition period for complying with any new or revised financial accounting standards provided pursuant to Section 13(a) of the Exchange Act. o
Indicate by check mark whether the registrant has filed a report on and attestation to its management’s assessment of the effectiveness of its internal control over financial reporting under Section 404(b) of the Sarbanes-Oxley Act by the registered public accounting firm that prepared or issued its audit report. ☒
If securities are registered pursuant to Section 12(b) of the Act, indicate by check mark whether the financial statements of the registrant included in the filing reflect the correction of an error to previously issued financial statements. o
Indicate by check mark whether any of those error corrections are restatements that required a recovery analysis of incentive-based compensation received by any of the registrant’s executive officers during the relevant recovery period pursuant to §240.10D-1(b). o
Indicate by check mark whether the registrant is a shell company (as defined in Rule 12b-2 of the Act). Yes ☐ No x
The estimated aggregate market value of the voting and non-voting common equity held by nonaffiliates of each registrant as of June 30, 2024 was as follows:
| | | | | |
| Constellation Energy Corporation | $62,564,709,888 |
| Constellation Energy Generation, LLC | Not applicable |
The number of shares outstanding of each registrant’s common stock as of January 31, 2025 was as follows:
| | | | | |
| Constellation Energy Corporation Common Stock, without par value | 312,847,257 | |
| Constellation Energy Generation, LLC | Not applicable |
Documents Incorporated by Reference
Portions of the Registrants’ Definitive Proxy Statement relating to the 2025 Annual Meeting of Shareholders are incorporated by reference into Part III of this report. The Registrants expect to file the Definitive Proxy Statement with the Securities and Exchange Commission within 120 days after December 31, 2024.
TABLE OF CONTENTS
| | | | | | | | |
| GLOSSARY OF TERMS AND ABBREVIATIONS |
| Constellation Energy Corporation and Related Entities |
| CEG Parent | | Constellation Energy Corporation |
| Constellation | | Constellation Energy Generation, LLC (formerly Exelon Generation Company, LLC) |
| Registrants | | CEG Parent and Constellation, collectively |
| Antelope Valley | | Antelope Valley Solar Ranch One |
| Continental Wind | | Continental Wind LLC |
| CENG | | Constellation Energy Nuclear Group, LLC |
| CR | | Constellation Renewables, LLC |
| Crane | | Crane Clean Energy Center (formerly known as Three Mile Island Unit 1) |
| CRP | | Constellation Renewables Partners, LLC |
| FitzPatrick | | James A. FitzPatrick nuclear generating station |
| Ginna | | R. E. Ginna nuclear generating station |
| NER | | NewEnergy Receivables LLC |
| NMP | | Nine Mile Point nuclear generating station |
| RPG | | Renewable Power Generation, LLC |
| | |
| STP | | South Texas Project nuclear generating station |
| | |
| West Medway II | | West Medway Generating Station II |
| | | | | | | | |
| Former Related Entities |
| Exelon | | Exelon Corporation |
| ComEd | | Commonwealth Edison Company |
| PECO | | PECO Energy Company |
| BGE | | Baltimore Gas and Electric Company |
| PHI | | Pepco Holdings LLC |
| Pepco | | Potomac Electric Power Company |
| DPL | | Delmarva Power & Light Company |
| | |
| ACE | | Atlantic City Electric Company |
| BSC | | Exelon Business Services Company, LLC |
| | | | | | | | |
| GLOSSARY OF TERMS AND ABBREVIATIONS |
| Other Terms and Abbreviations | | |
| ABO | | Accumulated Benefit Obligation |
| AEC | | Alternative Energy Credit that is issued for each megawatt hour of generation from a qualified alternative energy source |
| AEP Texas | | American Electric Power Texas, Inc. |
| AESO | | Alberta Electric Systems Operator |
| | |
| AOCI | | Accumulated Other Comprehensive Income (Loss) |
| APBO | | Accumulated Post-Retirement Benefit Obligation |
| ARC | | Asset Retirement Cost |
| ARO | | Asset Retirement Obligation |
| | |
| | |
| | |
| ASR | | Accelerated Share Repurchase |
| Atomic Energy Act | | Atomic Energy Act of 1954, as amended |
| | |
| Bcf | | Billion cubic feet |
| | |
| C&I | | Commercial and Industrial |
| CAISO | | California ISO |
| CBAs | | Collective Bargaining Agreements |
| | |
| | |
| CenterPoint | | CenterPoint Energy Houston Electric, LLC |
| CERCLA | | Comprehensive Environmental Response, Compensation, and Liability Act of 1980, as amended |
| | |
| Clean Air Act | | Clean Air Act of 1963, as amended |
| Clean Energy Law | | Illinois Public Act 102-0062 signed into law on September 15, 2021 |
| Clean Water Act | | Federal Water Pollution Control Amendments of 1972, as amended |
| CMC | | Carbon Mitigation Credit |
| CO2 | | Carbon Dioxide |
| CODM | | Chief Operating Decision Maker |
| CORe | | Constellation Offsite Renewables |
| | |
| | |
| DCPSC | | District of Columbia Public Service Commission |
| DEPSC | | Delaware Public Service Commission |
| DOE | | United States Department of Energy |
| | |
| DOJ | | United States Department of Justice |
| DPP | | Deferred Purchase Price |
| | |
| | |
| | |
| EFEC | | Emissions-Free Energy Certificate |
| | |
| EMT | | Everett Marine Terminal |
| EPA | | United States Environmental Protection Agency |
| | |
| ERCOT | | Electric Reliability Council of Texas |
| ERISA | | Employee Retirement Income Security Act of 1974, as amended |
| EROA | | Expected Rate of Return on Assets |
| ERP | | Enterprise Resource Program |
| | |
| | |
| | |
| EV | | Electric Vehicle |
| Exchange Act | | Securities Exchange Act of 1934. as amended |
| | |
| Federal Power Act | | Federal Power Act of 1920, as amended |
| FERC | | Federal Energy Regulatory Commission |
| | |
| Former ComEd Units | | Braidwood, Byron, Dresden, LaSalle and Quad Cities nuclear generating units |
| Former PECO Units | | Limerick, Peach Bottom, and Salem nuclear generating units |
| FRCC | | Florida Reliability Coordinating Council |
| | |
| GAAP | | Generally Accepted Accounting Principles in the United States |
| GDP | | Gross Domestic Product |
| | | | | | | | |
| GHG | | Greenhouse Gas |
| GW | | Gigawatt |
| GWh | | Gigawatt hour |
| HSR Act | | Hart-Scott-Rodino Antitrust Improvements Act |
| ICC | | Illinois Commerce Commission |
| ICE | | Intercontinental Exchange |
| IPA | | Illinois Power Agency |
| IRA | | Inflation Reduction Act of 2022 |
| | |
| IRS | | Internal Revenue Service |
| ISO | | Independent System Operator |
| ISO-NE | | ISO New England Inc. |
| ITC | | Investment Tax Credit |
| kWh | | Kilowatt-hour |
| LIBOR | | London Interbank Offered Rate |
| LLRW | | Low-Level Radioactive Waste |
| | |
| | |
| LTIP | | Long-Term Incentive Plan |
| | |
| MDE | | Maryland Department of the Environment |
| MDPSC | | Maryland Public Service Commission |
| MISO | | Midcontinent Independent System Operator, Inc. |
| | |
| | |
| MRV | | Market-Related Value |
| MW | | Megawatt |
| MWh | | Megawatt-hour |
| Mystic COS | | Mystic Cost of Service Agreement |
| N/A | | Not applicable |
| NASDAQ | | Nasdaq Stock Market, LLC |
| NAV | | Net Asset Value |
| NDT | | Nuclear Decommissioning Trust |
| NEIL | | Nuclear Electric Insurance Limited |
| | |
| NERC | | North American Electric Reliability Corporation |
| NGX | | Natural Gas Exchange, Inc. |
| | |
| NJDEP | | New Jersey Department of Environmental Protection |
| Non-Regulatory Agreement Units | | Nuclear generating units or portions thereof whose decommissioning-related activities are not subject to contractual elimination under regulatory accounting |
| | |
| NPDES | | National Pollutant Discharge Elimination System |
| NPNS | | Normal Purchase Normal Sale scope exception |
| NRC | | Nuclear Regulatory Commission |
| | |
| NYISO | | New York ISO |
| NYMEX | | New York Mercantile Exchange |
| NYPSC | | New York Public Service Commission |
| OCI | | Other Comprehensive Income (Loss) |
| OIESO | | Ontario Independent Electricity System Operator |
| OPEB | | Other Postretirement Employee Benefits |
| | |
| PAPUC | | Pennsylvania Public Utility Commission |
| PBO | | Projected Benefit Obligation |
| | |
| Pension Protection Act (the Act) | | Pension Protection Act of 2006 |
| PG&E | | Pacific Gas and Electric Company |
| PJM | | PJM Interconnection, LLC |
| PP&E | | Property, Plant, and Equipment |
| | | | | | | | |
| PPA | | Power Purchase Agreement |
| Price-Anderson Act | | Price-Anderson Nuclear Industries Indemnity Act of 1957 |
| PRP | | Potentially Responsible Parties |
| | |
| PSEG | | Public Service Enterprise Group Incorporated |
| PTC | | Production Tax Credit |
| PUCT | | Public Utility Commission of Texas |
| PV | | Photovoltaic |
| | |
| RCRA | | Resource Conservation and Recovery Act of 1976, as amended |
| REC | | Renewable Energy Certificate (Credit), which is the environmental attribute associated with each megawatt hour of production from a qualified renewable energy source |
| Regulatory Agreement Units | | Nuclear generating units or portions thereof whose decommissioning-related activities are subject to contractual elimination under regulatory accounting (includes the Former ComEd units, the Former PECO units, and STP) |
| RFP | | Request for Proposal |
| | |
| | |
| | |
| RMP | | Risk Management Policy |
| RNF | | Operating Revenues Net of Purchased Power and Fuel Expense |
| RNG | | Renewable Natural Gas |
| | |
| ROU | | Right-of-use |
| | |
| RPS | | Renewable Energy Portfolio Standards |
| | |
| | |
| | |
| RTO | | Regional Transmission Organization |
| S&P | | Standard & Poor’s Ratings Services |
| | |
| SEC | | United States Securities and Exchange Commission |
| SERC | | SERC Reliability Corporation (formerly Southeast Electric Reliability Council) |
| | |
| SNF | | Spent Nuclear Fuel |
| SOA | | Society of Actuaries |
| SOFR | | Secured Overnight Financing Rate |
| SOS | | Standard Offer Service |
| SPDES | | State Pollutant Discharge Elimination System |
| SPP | | Southwest Power Pool |
| | |
| STPNOC | | STP Nuclear Operating Company |
| | |
| TMA | | Tax Matters Agreement |
| | |
| TSA | | Transition Services Agreement |
| | |
| TWh | | Terawatt-hour |
| U.S. Court of Appeals for the D.C. Circuit | | United States Court of Appeals for the District of Columbia Circuit |
| U.S. Treasury | | U.S. Department of the Treasury |
| | |
| VEBA | | Voluntary Employees' Beneficiary Associations |
| VIE | | Variable Interest Entity |
| WECC | | Western Electric Coordinating Council |
| ZEC | | Zero Emission Credit |
| | |
FILING FORMAT
This combined Annual Report on Form 10-K is being filed separately by Constellation Energy Corporation and Constellation Energy Generation, LLC, (the Registrants). Information contained herein relating to any individual Registrant is filed by the Registrant on its own behalf. Neither Registrant makes any representation as to information relating to the other Registrant.
CAUTIONARY STATEMENTS REGARDING FORWARD-LOOKING INFORMATION
This Report contains certain forward-looking statements within the meaning of the Private Securities Litigation Reform Act of 1995 that are subject to risks and uncertainties. Words such as “could,” “may,” “expects,” “anticipates,” “will,” “targets,” “goals,” “projects,” “intends,” “plans,” “believes,” “seeks,” “estimates,” “predicts,” and variations on such words, and similar expressions that reflect our current views with respect to future events and operational, economic and financial performance, are intended to identify such forward-looking statements. These forward-looking statements include, but are not limited to, statements regarding the proposed transaction between Constellation and Calpine Corporation, the expected closing of the proposed transaction and the timing thereof, the financing of the proposed transaction and the pro forma combined company and its operations, strategies and plans, enhancements to investment-grade credit profile, synergies, opportunities and anticipated future performance and capital structure, and expected accretion to earnings per share and free cash flow. Information adjusted for the proposed transaction should not be considered a forecast of future results.
Forward-looking statements are based on current expectations, estimates and assumptions that involve a number of risks and uncertainties that could cause actual results to differ materially from those projected. The factors that could cause actual results to differ materially from the forward-looking statements made by us include those factors discussed herein, including those factors discussed in (a) Part I, ITEM 1A. Risk Factors, (b) Part II, ITEM 7. Management’s Discussion and Analysis of Financial Condition and Results of Operations, (c) Part II, ITEM 8. Financial Statements and Supplementary Data: Note 18 — Commitments and Contingencies, and (d) other factors discussed in filings with the SEC by the Registrants.
Readers are cautioned not to place undue reliance on these forward-looking statements, which apply only as of the date of this report. Neither Registrant undertakes any obligation to publicly release any revision to its forward-looking statements to reflect events or circumstances after the date of this Report.
AVAILABLE INFORMATION
The SEC maintains an Internet site at www.sec.gov that contains reports, proxy and information statements, and other information that we file electronically with the SEC. We file our Annual Report on Form 10-K, Quarterly Reports on Form 10-Q, Current Reports on Form 8-K, and all amendments to those reports with the SEC. In addition, as soon as reasonably practicable after such materials are furnished to the SEC, we make copies of these documents available to the public free of charge through our website at www.ConstellationEnergy.com. Information contained on our website shall not be deemed incorporated into, or to be a part of, this Report.
PART I
General
On February 21, 2021, the Board of Directors of Exelon Corporation (“Exelon”) authorized management to pursue a plan to separate its competitive generation and customer-facing energy businesses, conducted through Constellation Energy Generation, LLC (“Constellation”, formerly Exelon Generation Company, LLC) and its subsidiaries, into an independent, publicly traded company. Constellation Energy Corporation (“CEG Parent” or the “Company”), a Pennsylvania corporation and a direct, wholly owned subsidiary of Exelon, was newly formed for the purpose of separation and had not engaged in any activities except in preparation for the distribution. On February 1, 2022, Exelon completed the separation by distributing all the outstanding shares of the Company’s common stock, on a pro rata basis to the holders of Exelon’s common stock, with the Company holding all the interests in Constellation previously held by Exelon (the "Separation"). As of 2002, Constellation has been an individual registrant since the registration of their public debt securities under the Securities Act. As an individual registrant, Constellation has historically filed consolidated financial statements to reflect their financial position and operating results as a stand-alone, wholly owned subsidiary of Exelon.
Unless otherwise indicated or the context otherwise requires, references herein to the terms "we," "our," "us" and "the Company" refer collectively to CEG Parent and Constellation. See Glossary for defined terms.
Our Business
We are the nation’s largest producer of reliable, emissions-free energy and a leading energy supplier to businesses, homes and public sector customers nationwide, including three-fourths of Fortune 100 companies. Our nuclear, hydro, wind, and solar generation facilities have the generating capacity to power the equivalent of 16 million homes, providing about 10 percent of the nation's clean energy in the United States. Our fleet is helping to accelerate the nation’s transition to a carbon-free future with more than 31,676 megawatts of capacity and an annual output that is nearly 90 percent carbon-free. We are committed to investing in innovative technologies to drive the transition to a reliable, sustainable and secure energy future. Our customer-facing business is one of the nation's largest competitive energy suppliers, offering innovative solutions to meet our customers' needs. We employ approximately 14,264 people, and do business in 48 states, the District of Columbia, Canada, and the United Kingdom.
Our Operations
We operate the largest carbon-free generation fleet in the nation and are one of the largest competitive electric generation companies in the nation, as measured by owned and contracted MWs. Collectively, the combined fleet is the cleanest large generation portfolio in the country (nearly 90% carbon-free based on generation output of electricity) according to the 2024 Ceres Benchmarking Air Emissions of the 100 Largest Electric Power Producers in the United States.
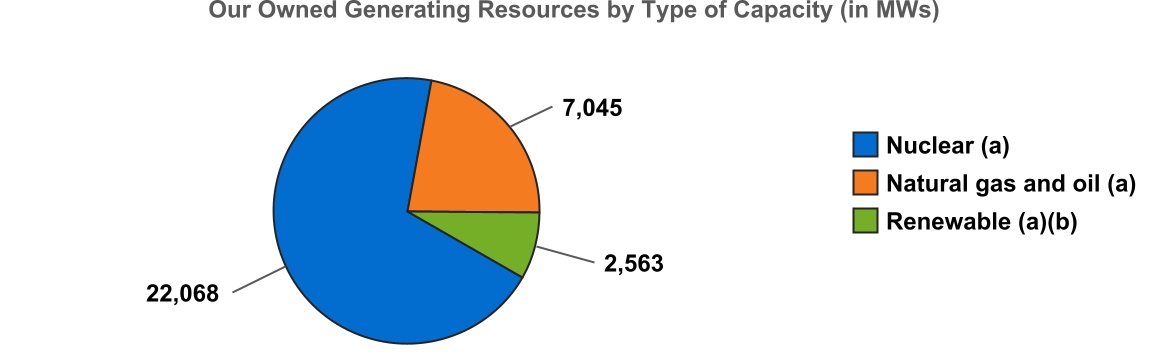
At December 31, 2024, our owned generating resources total capacity of 31,676 MWs consisted of the following:
__________
(a)Net generation capacity is stated at proportionate ownership share. See ITEM 2. PROPERTIES for additional information.
(b)Includes wind, hydroelectric, and solar generating assets.
In addition to the owned generating resources above, at December 31, 2024 we have contracted generation with a total capacity of 4,774 MWs, which represents electric supply procured under unit-specific agreements.
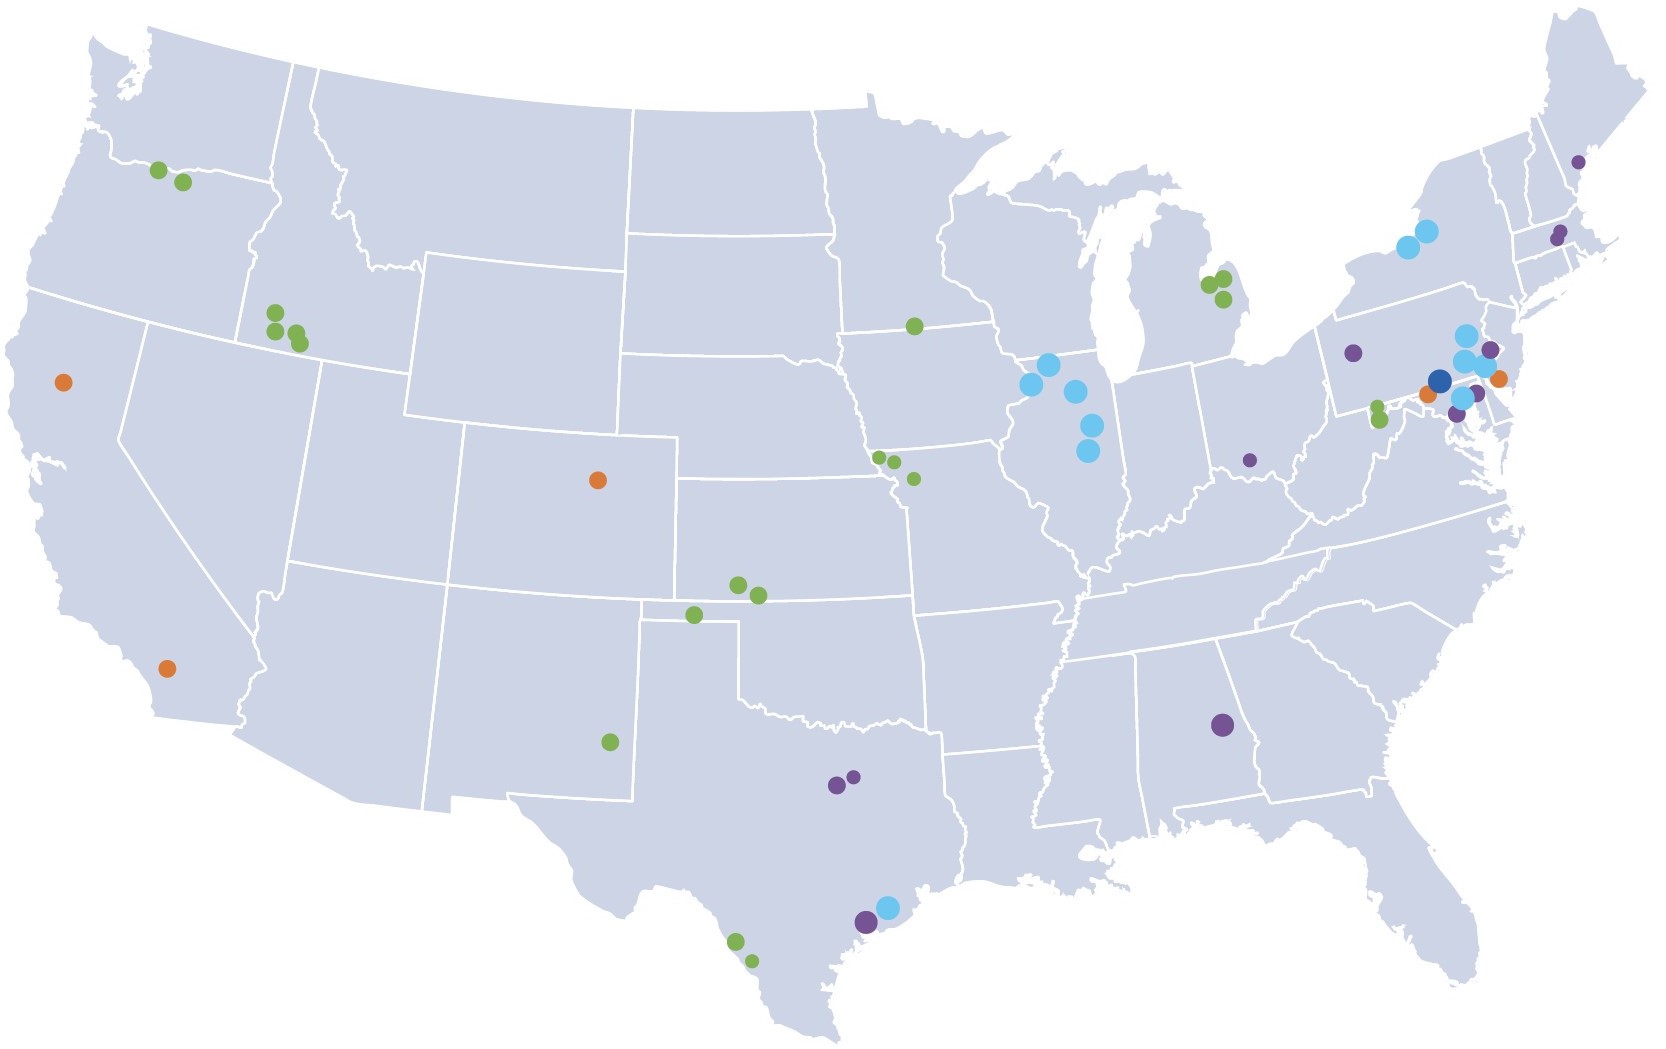
The following map illustrates the locations of our owned generation facilities as of December 31, 2024:
Our Owned Generation Fleet Map(a)(b)
Owned Assets
__________
(a)One symbol is included per location. Some locations may have multiple generating units. Locations in tight geographic proximity may appear as one symbol. Units that are not currently operational are not captured.
(b)Does not reflect Grand Prairie Generating Station (Gas/Other), located in Alberta, Canada.
We have five reportable segments, as described in the table below, representing the different geographic regions in which our owned generating resources are located and our customer-facing activities are conducted.
| | | | | | | | | | | | | | | | | | | | |
Segment(a) | | Net Generation Capacity (MWs)(b) | | % of Net Generation Capacity | | Geographic Regions |
| Mid-Atlantic | | 10,387 | | | 33 | % | | Eastern half of PJM, which includes New Jersey, Maryland, Virginia, West Virginia, Delaware, the District of Columbia, and parts of Pennsylvania and North Carolina |
| Midwest | | 11,608 | | | 37 | % | | Western half of PJM and the United States footprint of MISO, excluding MISO’s Southern Region |
| New York | | 3,093 | | | 10 | % | | NYISO |
| ERCOT | | 4,740 | | | 15 | % | | Electric Reliability Council of Texas |
| Other Power Regions | | 1,848 | | | 5 | % | | New England, South, West, and Canada |
| Total | | 31,676 | | | 100 | % | | |
__________(a)See Note 5 — Segment Information of the Combined Notes to Consolidated Financial Statements for additional information on reportable segments.
(b)Net generation capacity is stated at proportionate ownership share as of December 31, 2024. See ITEM 2. PROPERTIES for additional information.
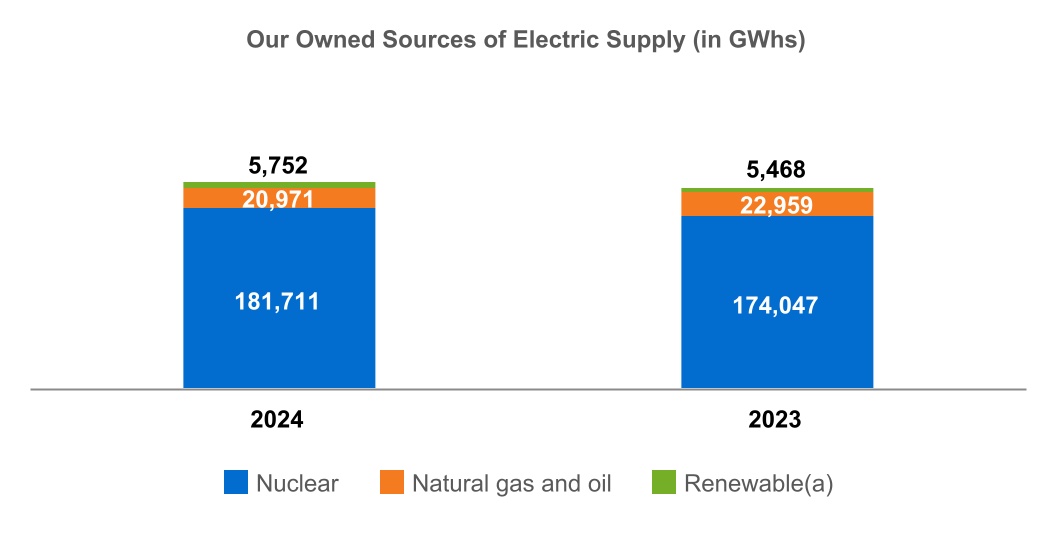
The following table shows our total owned sources of electric supply of 208,434 GWhs and 202,474 GWhs for 2024 and 2023, respectively, which includes the proportionate share of output where we have an undivided ownership interest in jointly-owned generating plants.
_________
(a)Includes wind, hydroelectric, and solar generating assets.
In addition to the owned generation above, we also had purchased power from the spot energy markets that are administered by the RTOs/ISOs and bilateral transactions of 60,983 GWhs and 67,215 GWhs for the years ended December 31, 2024 and 2023, respectively. See ITEM 7. MANAGEMENT'S DISCUSSION AND ANALYSIS OF FINANCIAL CONDITION AND RESULTS OF OPERATIONS for additional information on electric supply sources.
Nuclear Facilities
Our nuclear fleet is the nation’s largest, with current generating capacity of approximately 22 GWs, producing 182 TWhs of zero-emissions electricity during 2024 – enough to power 16 million homes and avoid more than 122 million metric tons of carbon emissions according to the EPA GHG Equivalencies Calculator. We have ownership interests in 14 nuclear generating stations currently in service, consisting of 25 units. As of December 31, 2024, we wholly own all our nuclear generating stations, except for undivided ownership interests in five jointly-owned nuclear stations: Quad Cities (75% ownership), Peach Bottom (50% ownership), Salem (42.59% ownership), NMP Unit 2 (82% ownership), and STP (44% ownership), that are reflected in our consolidated financial statements relative to our proportionate ownership interest in each unit. See ITEM 2. PROPERTIES for additional information on our nuclear facilities.
In September 2024, we executed a 20-year PPA with Microsoft that will support the restart of Three Mile Island Unit 1, renamed as the Crane Clean Energy Center, which was retired in 2019 for economic reasons. Under the agreement, Microsoft will purchase the output generated from the renewed plant which includes energy, capacity and carbon-free attributes as part of its goal to help power its data centers in PJM with clean energy. The site, which is expected to be online in 2028, will have approximately 835 MWs of carbon-free capacity. The restart is subject to certain regulatory approvals, permitting, and obtaining a renewed operating license.
In November 2023, we acquired NRG South Texas LP, which owns a 44% undivided ownership interest in the jointly-owned STP. Other owners include City Public Service Board of San Antonio (CPS, 40%) and the City of Austin, Texas (Austin Energy, 16%). In May 2024, we executed a settlement agreement with CPS/City of San Antonio, Austin, and NRG Energy, Inc., the terms of which require we sell a 2% ownership interest in STP to CPS. See Note 2 — Mergers, Acquisitions, and Dispositions of the Combined Notes to Consolidated Financial Statements for additional information regarding the acquisition of STP.
We operate all of our nuclear generating stations, except for the units at Salem and STP, which are operated by PSEG Nuclear, LLC (an indirect, wholly owned subsidiary of PSEG) and STPNOC, respectively. We have consistently operated our nuclear plants at best-in-class levels. During 2024, 2023, and 2022, our nuclear generating facilities achieved capacity factors(a) of 94.6%, 94.4%, and 94.8%, respectively, at ownership percentage. The nuclear capacity factor has been approximately four percentage points better than the industry average annually since 2013.
Capacity factors, which are significantly affected by the number and duration of refueling and non-refueling outages, can have a material impact on our results of operations. In 2024, we achieved an average refueling outage duration of 19 days for units we operate. We achieved an average refueling outage duration of 21 days in both 2023 and 2022, respectively, against industry averages of 38 and 40 days, respectively.
We manage our scheduled refueling outages to minimize their duration and to maintain high nuclear generating capacity factors, resulting in a stable supply position for our wholesale and retail power marketing activities. In 2024, 2023, and 2022, electric supply (in GWhs) generated from our nuclear generating facilities was 67%, 65%, and 64%, respectively, of our total electric supply.
During scheduled refueling outages, we perform maintenance and equipment upgrades in order to maintain safe, reliable operations and to minimize the occurrence of unplanned outages. In addition to the maintenance and equipment upgrades performed by us during scheduled refueling outages, we have extensive operating and security procedures in place to ensure the safe operation of our nuclear units. We also have extensive safety systems in place to protect the plant, personnel, and surrounding area in the unlikely event of an accident or other incident.
__________
(a)Capacity factor is defined as the ratio of the actual output of a unit (or combination of units) over a period of time to its output if the unit had operated at net monthly mean capacity for that time period. See ITEM 7. MANAGEMENT'S DISCUSSION AND ANALYSIS OF FINANCIAL CONDITION AND RESULTS OF OPERATIONS — Financial Results of Operations for additional information.
We have original 40-year operating licenses from the NRC for each of our nuclear units and have received 20-year operating license renewals from the NRC for all our nuclear units except Clinton. PSEG and STPNOC have also received 20-year operating license renewals for the Salem and STP units, respectively. Peach Bottom has previously received a second 20-year license renewal from the NRC for Units 2 and 3, for a total 80-year term. See Note 3 — Regulatory Matters of the Combined Notes to Consolidated Financial Statements for additional information on the status of Peach Bottom's license renewal.
The following table summarizes the current license expiration dates for our nuclear facilities currently in service:
| | | | | | | | | | | | | | | | | | | | |
| Station | | Unit | | In-Service Date(a) | | Current License
Expiration |
| Braidwood | | 1 | | | 1988 | | 2046 |
| | 2 | | | 1988 | | 2047 |
| Byron | | 1 | | | 1985 | | 2044 |
| | 2 | | | 1987 | | 2046 |
| Calvert Cliffs | | 1 | | | 1975 | | 2034 |
| | 2 | | | 1977 | | 2036 |
Clinton(b) | | 1 | | | 1987 | | 2027 |
Dresden(b) | | 2 | | | 1970 | | 2029 |
| | 3 | | | 1971 | | 2031 |
| FitzPatrick | | 1 | | | 1975 | | 2034 |
| LaSalle | | 1 | | | 1984 | | 2042 |
| | 2 | | | 1984 | | 2043 |
| Limerick | | 1 | | | 1986 | | 2044 |
| | 2 | | | 1990 | | 2049 |
| NMP | | 1 | | | 1969 | | 2029 |
| | 2 | | | 1988 | | 2046 |
Peach Bottom(c) | | 2 | | | 1974 | | 2033 |
| | 3 | | | 1974 | | 2034 |
| Quad Cities | | 1 | | | 1973 | | 2032 |
| | 2 | | | 1973 | | 2032 |
| Ginna | | 1 | | | 1970 | | 2029 |
| Salem | | 1 | | | 1977 | | 2036 |
| | 2 | | | 1981 | | 2040 |
| STP | | 1 | | | 1988 | | 2047 |
| | 2 | | | 1989 | | 2048 |
__________
(a)Denotes year in which nuclear unit began commercial operations.
(b)We are currently seeking license renewals for Clinton and Dresden Units 2 and 3 to extend the operating licenses by an additional 20 years.
(c)In February 2022, the NRC issued an order related to its review of our subsequent license renewal application for Peach Bottom and the NRC directed its staff to change the expiration dates for the licenses back to 2033 and 2034. We expect that the license expiration dates will be restored to 2053 and 2054, respectively. See Note 3 — Regulatory Matters of the Combined Notes to Consolidated Financial Statements for additional information.
The operating license renewal process takes approximately four years from commencement, which includes approximately two years for us to develop the application and approximately two additional years for the NRC to review the application. Depreciation provisions are based on the estimated useful lives of the stations, which generally include expectations for an additional 20-year term beyond current license expiration, except for Calvert Cliffs, FitzPatrick, Limerick, NMP Unit 2, Salem, and STP, where depreciation provisions correspond with the expiration of the current NRC operating license denoted in the table above. See Note 3 — Regulatory
Matters and Note 8 — Property, Plant, and Equipment of the Combined Notes to Consolidated Financial Statements for additional information.
Natural Gas, Oil and Renewable Facilities (including Hydroelectric)
We operate approximately 10 GWs of natural gas, oil, hydroelectric, wind, and solar generation assets, which provide a mix of baseload, intermediate, and peak power generation. We wholly own all our natural gas, oil, and renewable generating stations, except for: (1) Wyman 4; (2) certain wind project entities; and (3) CRP. We operate all of these facilities, except for Wyman 4, which is operated by the principal owner, NextEra Energy Resources LLC, a subsidiary of NextEra Energy, Inc. See ITEM 2. PROPERTIES for additional information regarding these generating facilities and Note 21 — Variable Interest Entities of the Combined Notes to Consolidated Financial Statements for additional information regarding CRP, which is a VIE.
In 2024, 2023, and 2022, electric supply (in GWhs) generated from our owned natural gas, oil, and renewable generating facilities was 10%, 11%, and 10%, respectively, of our total electric supply. Our natural gas, oil and renewable fleet has similarly demonstrated a track record of strong performance with a Dispatch Match(a) of 97.4%, 98.5%, and 98.2% and Renewables Energy Capture(b) of 96.1%, 96.4%, and 96.5% in 2024, 2023, and 2022, respectively.
Natural gas, oil, wind and solar generation plants are generally not licensed, and therefore, the decision on when to retire plants is, fundamentally, a commercial one. FERC has the exclusive authority to license most non-federal hydropower projects located on navigable waterways or federal lands, or connected to the interstate electric grid, which include our Conowingo Hydroelectric Project (Conowingo) and Muddy Run Pumped Storage Facility Project (Muddy Run). Muddy Run's license expires on December 1, 2055 and is currently being depreciated over an estimated useful life that corresponds with the available license term. In March 2021, FERC issued a new 50-year license for Conowingo, which was subsequently vacated in December 2022; however, depreciation provisions continue to assume an estimated useful life through 2071 in anticipation of the license expiration date being restored. See Note 3 — Regulatory Matters of the Combined Notes to Consolidated Financial Statements for additional information on the status of Conowingo's license.
__________
(a)Dispatch Match is used to measure the responsiveness of a unit to the market, expressed as the total actual energy revenue net of fuel cost relative to the total desired energy revenue net of fuel cost. Factors having an adverse effect on Dispatch Match include forced outages, derates, and failure to operate to the desired generation signal. Beginning in 2023, Dispatch Match reflects a change to remove the Conowingo run-of-river hydroelectric operational performance. Dispatch Match for 2022 was previously reported as 98.4%.
(b)Renewable Energy Capture is an indicator of how efficiently the installed assets capture the natural energy available from the wind, the sun, and water. Renewable Energy Capture represents an energy-based fraction, the numerator of which is the energy produced by the sum of the wind turbines, solar panels, and run-of-river hydroelectric operations in the year, and the denominator of which is the total expected energy to be produced during the year, with adjustments made for certain events that are considered non-controllable, such as force majeure events, serial design-manufacturing equipment failures, and transmission curtailments. Renewable Energy Capture for the combined wind, solar, and run-of-river hydroelectric fleet is weighted by the relative site projected pre-tax variable revenue. Beginning in 2023, Renewable Energy Capture reflects a change to include the Conowingo run-of-river hydroelectric operational performance. Renewable Energy Capture for 2022 was previously reported as 95.8%.
Contracted Generation
In addition to energy produced by owned generation assets, we source electricity from generators we do not own under long-term contracts. The following tables summarize our long-term contracts to purchase unit-specific physical power with an original term in excess of one year in duration, by region, in effect as of December 31, 2024:
| | | | | | | | | | | | | | | | | | | | |
| Region | | Number of
Agreements | | Expiration
Dates | | Capacity (MWs) |
Mid-Atlantic | | 17 | | | 2025 - 2039 | | 446 | |
| Midwest | | 7 | | | 2026 - 2044 | | 805 | |
| | | | | | |
| ERCOT | | 8 | | | 2025 - 2035 | | 1,121 | |
| Other Power Regions | | 16 | | | 2025 - 2037 | | 2,402 | |
| Total | | 48 | | | | | 4,774 | |
| | | | | | | | | | | | | | | | | | | | | | | | | | | | | | | | | | | | | | | | | | | | |
| | 2025 | | 2026 | | 2027 | | 2028 | | 2029 | | 2030 and thereafter | | Total |
| Capacity Expiring (MWs) | | 501 | | | 398 | | | 5 | | | 75 | | | 98 | | | 3,697 | | | 4,774 | |
Customer-Facing Business
We are one of the nation’s largest energy suppliers. Through our integrated business operations, we sell electricity, natural gas, and other energy-related products and sustainable solutions to various types of customers, including distribution utilities, municipalities, cooperatives, and commercial, industrial, public sector, and residential customers in markets across multiple geographic regions. We serve approximately 1.5 million total customers, including three-fourths of Fortune 100 companies, and approximately 1.2 million residential customers.
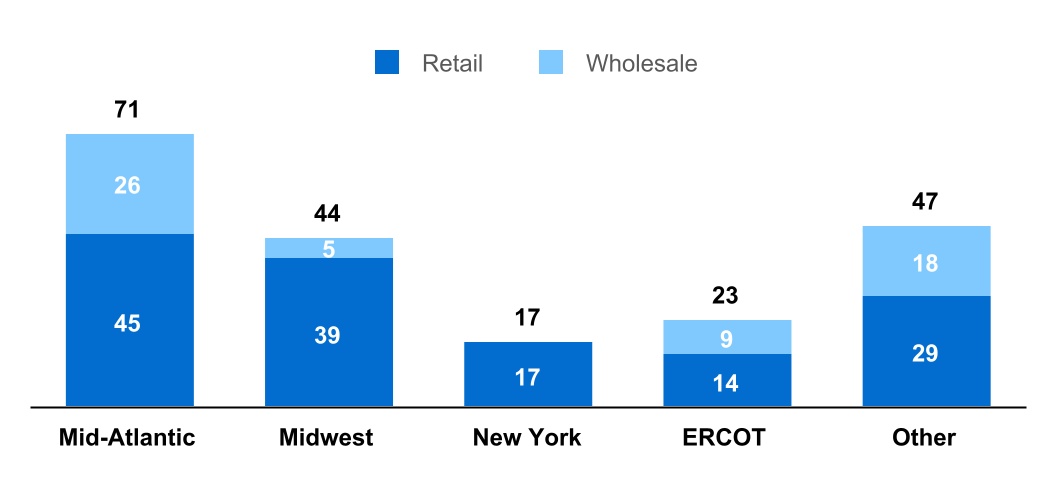
We are a leader in electric power supply, serving approximately 202 TWhs in 2024 through sales to retail customers and wholesale load auctions to a geographically diverse customer base. The following table illustrates these volumes across our five reportable segments:
2024 Electric Power Supply (TWhs) Served(a)
__________
(a)Includes retail load and wholesale load auction volumes only. Electric generation in excess of our total retail and wholesale load would be sold in the respective RTO or ISO in which our facility is located. Other includes New England, South, and West.
We are active in all domestic wholesale power and gas markets that span the entire lower 48 states and have complementary retail activity across many of those states. We typically obtain power supply from the market to meet our wholesale and retail obligations; our market risk is mitigated by our owned and contracted generation located in multiple geographic regions. The commodity risks associated with the output from owned and contracted generation are managed using various commodity transactions including sales to retail customers, trades on commodity exchanges, bilateral contracts, and sales to wholesale counterparties in accordance with our hedging program. See further discussion of the hedging program in the Price and Supply Risk Management section below. The main objective is to obtain low-cost energy supply to meet physical delivery obligations to both our wholesale and retail customers.
Retail Market
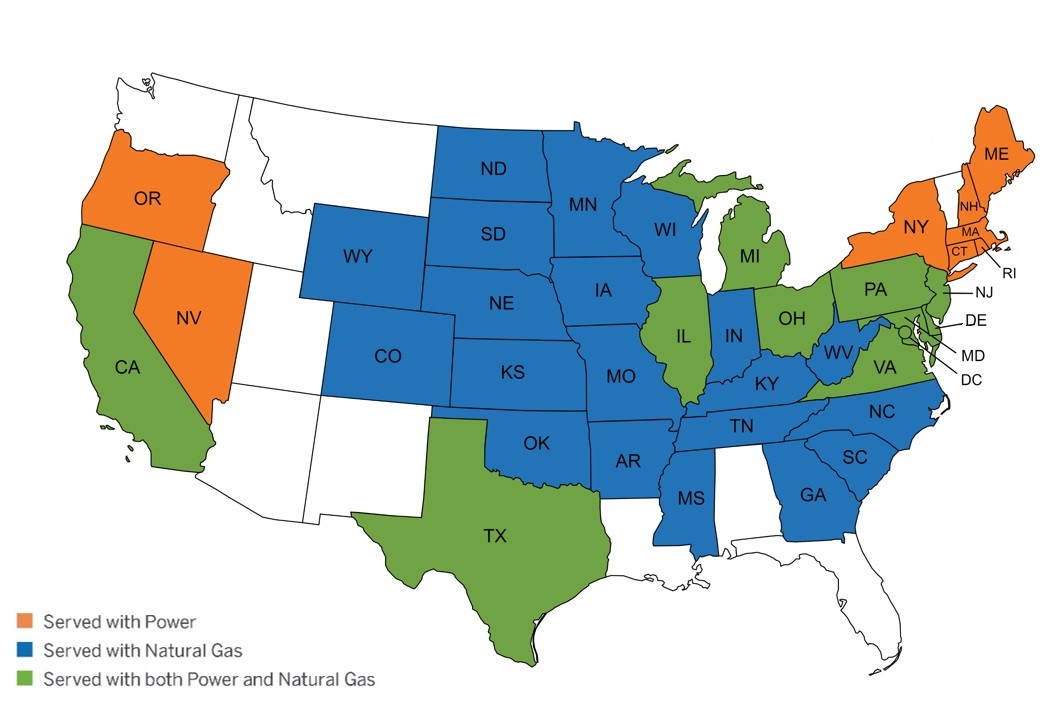
Retail competition in states across the U.S. range from full competition of energy suppliers for all retail customers (commercial, industrial, public sector, and residential) to partial retail competition available up to a capped amount for C&I customers only. We are a leader in retail markets, serving approximately 144 TWhs of electric power retail load and approximately 800 Bcf of gas in 2024, primarily to C&I customers across multiple geographic regions in the U.S.
Diverse Geographic Footprint in Retail Market
Strong customer relationships are a key part of our customer-facing business strategy, as demonstrated by our high renewal rates. Retail customer renewal rates have been strong over the last nine years across C&I power customer groups with average contract terms of approximately two years and customer duration of approximately five years, with many customers well beyond these metrics. Specifically, we enjoyed renewal rates of 78% for C&I power customers and 88% for C&I gas customers in 2024, owing to both our competitive pricing as well as our strong customer relationships. Our consistently high renewal rates are driven by our ability to provide customized solutions and deliver focused attention to our customers’ needs, resulting in an industry-leading C&I customer-service business ranking in the DNV 2024 Energy Blueprint: Sales Strategies report. We are also successful at acquiring new customers by offering innovative services and products that meet their needs. In addition to our high customer renewal rates, we have produced consistently high new win rates within C&I power
as well, acquiring nearly one out of every three new customers who have chosen to shop with us over the past six years.
High customer satisfaction levels, market expertise, stability, and scale driven growth have resulted in a historically proven business with consistent margins. While providing customers with a competitive price is a key focus, we leverage our broad suite of electric and gas product structures, oftentimes customized, to provide customers with the commodity solution and information that best fits their needs. It is this attention to the customer that creates the durable and repeatable value highlighted in these statistics.
Consumer purchasing strategies have trended from direct supply relationships to third-party relationships with a number of customers looking to third-party consultants and brokers to find suppliers like us to reduce costs and evaluate the increasing number of options available for expanding energy solutions beyond the commodity. In response, we have expanded our third-party capabilities, created scale through a comprehensive support structure, and enhanced digital applications providing tools, tracking, and measurement, as well as the ability to extend the reach of our sustainability solutions to drive additional market share. While this trend of customers using third parties to find suppliers has slowed in recent years, we have remained the market leader in direct C&I sales with over 32% of the C&I market share of direct customer business driven by our highly experienced and long-tenor direct sales team.
Wholesale Market
Our wholesale channel-to-market involves the sale of electricity among electric utilities and electricity marketers before it is eventually sold to end-use consumers. In 2024, we served approximately 58 TWhs of power load across competitive utility load procurement and bilateral sales to municipalities, co-ops, and other wholesale entities. Complementary to our national customer portfolio, we have several decades of relationships with wholesale counterparties across all domestic power markets as a means of both monetizing our own generation, as well as sourcing contracted generation to meet customer and portfolio needs. With increased customer demand for sustainability, our ability to source contracted generation has provided a capital-light way for us to provide customers with long-term sustainable solutions they are demanding to support a cleaner energy ecosystem. This creates durable customer relationships and repeatable business through the ability to respond to customer and marketplace trends. Similarly, this contracting acumen provides the ability to supplement our native generation with other non-renewable assets to meet changing portfolio needs in a financially efficient manner. In our wholesale gas business, we participate across all parts of the gas value chain, including trading, transport and storage, and physical supply.
Energy Solutions
As one of the largest customer-facing platforms in the U.S., we benefit from significant economies of scale, that allow us to provide our customers with competitively priced energy and to structure highly tailored solutions targeted to a customer’s unique power needs and clean energy goals. Our CORe+ product serves C&I customers' sustainability needs by matching contracted, third-party new-build renewable generation with customer desire to add additional carbon-free generation to the grid with a preference to be located within the same region as their load. In 2024, we continued to see growing demand for our Hourly Carbon-Free Energy (CFE) product and platform, as we have closed a number of additional Hourly CFE transactions with a strong pipeline of interested prospects. Achieving 100% carbon-free power is a key sustainability goal for many organizations. As customers make the transition to 100% hourly carbon-free power, many are looking to bridge the gap between their real-time electricity demand and available sources of carbon-free power. Our Hourly CFE platform and associated products match carbon-free generation every hour with a customer’s load, along with appropriate tracking and retirement of hourly attributes in the applicable registry. Many existing CORe+ customers are converting to 100% Hourly CFE with existing nuclear filling in the gaps of the hours renewable generation is not producing. In addition to larger-scale CORe+ offerings and Hourly CFE, we offer a range of sustainability solutions to customers (e.g., RECs, CORe+, EFECs, RINs, RNG, carbon offsets, etc.) as well as offers for carbon-free generation attributes to support their needs during the transition to a carbon-free energy ecosystem.
We also partner with our customers to provide energy efficiency options to meet their carbon-free energy goals. Our energy efficiency products provide the ability to optimize performance and maximize efficiency across customer facilities and operations through contract structures that include implementation of energy efficiency upgrades and behind-the-meter solutions with no upfront capital requirements. Additionally, these service
offerings provide scalable solutions to meet sustainability goals through investment across the life of the facility or operations and allow for greater budget certainty. The ongoing ability to optimize energy consumption for customers allows us to support customer demands with the right combination of technology and efficiency program options.
In addition to sustainability solutions, data and analytics have also become increasingly important for our customers. We recently launched Constellation Navigator, which delivers customized paths and sustainable solutions for customers to set and meet their environmental and operational goals. Driven by advanced technology platforms and experienced advisors, it provides strategies to help organizations understand their baseline emissions and reduce their carbon footprints. Constellation Navigator helps businesses solve challenges across the energy lifecycle including utility bill management, carbon accounting, rebate administration and sustainability advisory services. These platforms and services provide new avenues for incremental growth by coupling the opportunities for customer usage optimization with accompanying products and sustainable solutions that we can provide to customers. These types of data and analytical services allow us to grow our customer base in previously inaccessible regulated markets by offering non-commodity energy-related products and services.
We continue to look for new and innovative products and solutions to bring to our customers. Constellation Technology Ventures (CTV) is our venture investing business, focused on driving innovation and scaling breakthrough technologies. CTV invests in a broad range of hardware and software solutions that accelerate the transition to a sustainable, low-carbon economy. Our portfolio spans diverse areas, including, generation technologies, sustainability monitoring tools, distributed energy resources, financing solutions, and more. By collaborating closely with our portfolio companies, we help commercialize their products and technologies across our expansive customer base, creating value for both our partners and us.
Price and Supply Risk Management
We leverage a combination of wholesale and retail customer load sales, federal and state programs, as well as non-derivative and derivative contracts, all with credit-approved counterparties, to hedge the commodity price risk of our generation portfolio.
Beginning in 2024, our existing nuclear fleet is eligible for the nuclear PTC provided by the IRA, an important tool in managing commodity price risk for each nuclear unit not already receiving state support. The nuclear PTC provides increasing levels of support as unit revenues decline below levels established in the IRA and is further adjusted for inflation after 2024 through the duration of the program based on the GDP price deflator for the preceding calendar year. See Note 3 — Regulatory Matters and Note 6 — Government Assistance of the Combined Notes to Consolidated Financial Statements for additional information on the nuclear PTC.
In locations and periods where our load serving activities do not naturally offset existing generation portfolio risk, remaining commodity price exposure is managed through portfolio hedging activities. Portfolio hedging activities are generally concentrated in the prompt three years, when customer demand and market liquidity enable effective price risk mitigation. During this prompt three-year period, we seek to mitigate price risk associated with our load serving contracts, non-nuclear generation, and any residual price risk for our nuclear generation that the nuclear PTC and state programs may not fully mitigate. We also enter transactions that further optimize the economic benefits of our overall portfolio.
A portion of our hedging strategy may be implemented using fuel products based on assumed correlations between power and fuel prices. Our risk management group monitors the financial risks of the wholesale and retail power marketing activities. We also use financial and commodity contracts for proprietary trading purposes, but this activity accounts for only a small portion of our efforts and is not material to our results. The proprietary trading portfolio is subject to a risk management policy that includes stringent risk management limits. See ITEM 7A. QUANTITATIVE AND QUALITATIVE DISCLOSURES ABOUT MARKET RISK for additional information.
The cycle of production and utilization of nuclear fuel includes the mining and milling of uranium ore into uranium concentrates, the conversion of uranium concentrates to uranium hexafluoride, the enrichment of the uranium hexafluoride, and the fabrication of fuel assemblies. Nuclear fuel is obtained predominantly through long-term contracts for uranium concentrates, conversion services, enrichment services, (or a combination thereof) and fabrication services, including contracts sourced from Russia. We have inventory in various forms and engage a diverse set of domestic and international suppliers to secure the nuclear fuel needed to continue to operate our
nuclear fleet. We manage various risks around our nuclear fuel requirements in accordance with our fuel procurement policy limiting our transactions with each supplier to mitigate concentration of risk. The size of our inventory holdings and forward contractual coverage considers our refueling needs across multiple years to protect against supply disruptions and near-term price volatility, while allowing for capital flexibility. Our fuel procurement activities comply with all U.S. and international trade laws and we continue to take advantage of all available avenues to ensure continuity in our nuclear fuel supply, including working with the U.S. Government and our diverse set of suppliers to secure the nuclear fuel needed to continue to operate our nuclear fleet long-term. See ITEM 7A. QUANTITATIVE AND QUALITATIVE DISCLOSURES ABOUT MARKET RISK for additional information.
Natural gas is procured through long-term and short-term contracts, as well as spot-market purchases. Fuel oil inventories are managed so that in the winter months sufficient volumes of fuel are available in the event of extreme weather conditions and during the remaining months to take advantage of favorable market pricing.
See ITEM 1A. RISK FACTORS, ITEM 7. MANAGEMENT'S DISCUSSION AND ANALYSIS OF FINANCIAL CONDITION AND RESULTS OF OPERATIONS, Critical Accounting Policies and Estimates and Note 15 — Derivative Financial Instruments of the Combined Notes to Consolidated Financial Statements for additional information regarding derivative financial instruments.
Seasonality
Our operations are affected by weather, which affects demand for electricity and natural gas. The market price for electricity is also affected by changes in the demand for electricity and the available supply of electricity. With respect to the electric business, very warm weather in summer months and, with respect to the electric and natural gas businesses, very cold weather in winter months is generally referred to as “favorable weather conditions” because those weather conditions result in increased deliveries of electricity and natural gas. Conversely, mild weather reduces demand. As a result, our operating results in the future may fluctuate substantially on a seasonal basis, especially when more severe weather conditions such as heat waves or extreme winter weather make such fluctuations more pronounced. The pattern of this fluctuation may change depending on the type and location of the facilities owned, the wholesale and retail load served and the terms of contracts to purchase or sell electricity. See ITEM 7A. QUANTITATIVE AND QUALITATIVE DISCLOSURES ABOUT MARKET RISK for additional information.
Weather can also impact our operating conditions. See ITEM 1A RISK FACTORS for additional information regarding risks related to operational factors. To mitigate the potential for weather to impact our operations, we conduct seasonal readiness reviews at our power plants to ensure availability of fuel supplies and equipment performance before entering the summer and winter seasons. We also consider and review national climate assessments to inform our longer-term planning. Our nuclear fleet is resilient to weather extremes and is capable of generating emissions-free electricity 24 hours a day, even during unexpectedly cold winter events and hot summer events.
Insurance
We are subject to liability, property damage, and other risks associated with major incidents at our generating stations. We have reduced our financial exposure to these risks through insurance, both property damage and liability, and other industry risk-sharing provisions. We also maintain business interruption insurance for certain of our renewable assets, but not for our other generating stations unless required by contract or financing agreements. We are self-insured to the extent that any losses may exceed the amount of insurance maintained or are within the policy deductible for our insured losses.
See Note 18 — Commitments and Contingencies of the Combined Notes to Consolidated Financial Statements for insurance specific to our nuclear facilities.
Regulation
CEG Parent's subsidiaries include public utilities as defined under the Federal Power Act that are subject to FERC’s exclusive ratemaking jurisdiction over wholesale sales of electricity and the transmission of electricity in interstate commerce. Under the Federal Power Act, FERC has the authority to grant or deny market-based rates for sales of energy, capacity, and ancillary services to ensure that such sales are just and reasonable. FERC’s
jurisdiction over ratemaking includes the authority to suspend the market-based rates of utilities and set cost-based rates should FERC find that its previous grant of market-based rates authority is no longer just and reasonable. Other matters subject to FERC jurisdiction include, but are not limited to, certain third-party financings; review of certain mergers involving public utilities; certain dispositions of jurisdictional facilities and acquisitions of securities of another public utility or an existing operational generating facility; certain affiliate transactions; certain intercompany financings and cash management arrangements; certain internal corporate reorganizations; and certain holding company acquisitions of public utility and holding company securities.
RTOs and ISOs are FERC-regulated entities that exist in several regions to provide transmission service across multiple transmission systems. FERC has approved PJM, MISO, ISO-NE, and SPP as RTOs and CAISO and NYISO as ISOs. These entities are responsible for regional planning, managing transmission congestion, developing wholesale markets for energy and capacity, maintaining reliability, market monitoring, and the scheduling of physical power transactions in the region. ERCOT is not subject to regulation by FERC but performs a similar function in Texas to that performed by RTOs and ISOs in markets regulated by FERC.
We are subject to the jurisdiction of the NRC with respect to the operation of our nuclear generating facilities, including the licensing for operation of each unit. The NRC subjects nuclear generating stations to continuing review and regulation covering, among other things, operations, maintenance, emergency planning, security, and environmental and radiological aspects of those stations. As part of its Reactor Oversight Process, the NRC continuously assesses unit performance indicators and inspection results and communicates its assessment on a semi-annual basis. The NRC may modify, suspend, or revoke operating licenses and impose violations and/or civil penalties for failure to comply with the Atomic Energy Act, NRC regulations, or the terms of the operating licenses or orders. Changes in requirements by the NRC may require a substantial increase in capital expenditures and/or operating costs for our nuclear generating facilities. NRC regulations also require that licensees of nuclear generating facilities demonstrate reasonable assurance that funds will be available in specified minimum amounts at the end of the life of the facility to decommission the facility. We meet the ultimate decommissioning funding obligation through the use of dedicated NDT funds. See ITEM 7. MANAGEMENT'S DISCUSSION AND ANALYSIS OF FINANCIAL CONDITION AND RESULTS OF OPERATIONS — Liquidity and Capital Resources; Critical Accounting Policies and Estimates — Nuclear Decommissioning Asset Retirement Obligations; and Note 10 — Asset Retirement Obligations and Note 17 — Fair Value of Financial Assets and Liabilities of the Combined Notes to Consolidated Financial statements for additional information regarding our NDT funds and decommissioning obligations.
Our operations are also subject to the jurisdiction of various other federal, state, regional, and local agencies, and federal and state environmental protection agencies. Additionally, we are subject to NERC mandatory reliability standards, which protect the nation’s bulk power system against potential disruptions from cyber and physical security breaches.
Constellation's Strategy and Outlook
Strategy
We believe shareholder value is built on a foundation of operational excellence and the pairing of our majority carbon-free energy fleet with our customer-facing platform. We are committed to maintaining investment grade credit ratings. We focus on optimizing cash returns through a disciplined approach to safe and efficient operations and cost management, underpinned by stable and durable margins from our customer-facing business and coupled with distinct payments to our generation plants for the clean energy attributes. We may pursue future growth opportunities that provide additional value building on our core businesses, or expanding our competitive advantages. We are committed to maintaining a strong balance sheet, returning value to our shareholders, and investing in energy and sustainable solutions to meet customer needs.
The demand for reliable, carbon-free energy and sustainability solutions continues to grow across the country. We are committed to a clean energy future and aim to meet the growing energy needs of all our customers. We continue to serve as a partner to businesses and public entities that are setting ambitious sustainability goals and seeking long-term solutions to ensure reliability and maintain affordability.
The principles of our business strategy demonstrate our commitment to a carbon-free future while maintaining a strong balance sheet, advancing our sustainability and community initiatives, and investing in clean energy solutions:
•Power America's Clean Energy Future
•Expand America's Largest Fleet of Clean Energy Centers
•Uplift and Strengthen our Communities
•Provide Energy and Sustainability Solutions for Customers
We are committed to maintaining sufficient financial liquidity and an appropriate capital structure to support safe, secure and reliable operations, even in volatile market conditions. We believe our investment grade credit rating is a competitive advantage and we intend to maintain our credit position and best-in-class balance sheet. In line with that commitment, available cash flow will first be used to meet investment grade credit targets, with incremental capital allocated towards disciplined growth and shareholder return. We will build upon a strong compliance and risk management foundation and recognize the critical role this serves in maximizing operational results. We will continue to manage cash flow volatility through prudent risk management strategies across our business.
Growth Opportunities. We continually evaluate growth opportunities aligned with our businesses, assets, and markets leveraging our expertise in those areas and offering durable returns. We may pursue growth opportunities that optimize our core business or expand upon our strengths, including, but not limited to the following:
•Opportunistic energy acquisitions with a focus on reliability,
•Create new value from the existing fleet through nuclear uprates and license extensions, repowering of renewables, co-location of data centers, production of clean hydrogen, and other opportunities,
•Grow sustainability solutions for our customers focused on clean energy, efficiency, storage and electrification; help our C&I customers develop and meet sustainability targets,
•Engagement with the technology and innovation ecosystem through continued partnerships with national labs, universities, startups, and research institutions, and
•Continue to monitor opportunities to participate in advanced nuclear to maintain our leadership position as stewards of a carbon-free energy future.
We will employ a disciplined approach to acquisitions that grow future cash flow and support strategic initiatives. In further pursuit of our strategy, on January 10, 2025 we announced an agreement to acquire Calpine Corporation (Calpine), a combination that would couple the largest producer of clean, carbon-free energy with the reliable, dispatchable natural gas assets of Calpine, and also create the nation’s leading competitive retail electric supplier, providing increased scale, diversification and complementary capabilities that will enable us to meet growing demand with a broader array of energy and sustainability products. See Note 2 — Mergers, Acquisitions, and Dispositions of the Combined Notes to Consolidated Financial Statements for additional information on the proposed transaction.
Various market, financial, regulatory, legislative and operational factors could affect our success in pursuing these strategies. We continue to assess infrastructure, operational, policy, and legal solutions to these issues. See ITEM 1A. RISK FACTORS for additional information.
Outlook
The U.S. energy sector is experiencing unprecedented changes that we believe will increase the demand for reliable, clean power generation and benefit our business. We believe our generation fleet, including our nuclear assets, is well-positioned to deliver reliable and carbon-free power and benefit from growing demand for such electricity. Key drivers of increased demand include:
•Governmental and corporate policies designed to accelerate the decarbonization of the economy,
•Policy support for nuclear energy sources that also enable energy security, reliability and diversification,
•New technologies requiring reliable energy, and
•Evolving customer preferences favoring clean energy, choice and digitization.
Policy Support for Decarbonization and Emerging Carbon-Free Technologies. Many governments, corporations, and investors have been advocating for the reduction of GHG emissions across all sectors of the economy, with reduction of GHG emissions by the energy sector being a key focus. These include state mandates requiring increasingly stringent policies that require the reduction of GHG emissions over time. For example, many large corporations have adopted targets to reduce the carbon emissions in their business operations, spurred in part by demand from investors and customers for sustainable, environment-friendly business practices. These governmental and corporate policies support the retention and expansion of carbon-free generation and developments in emerging technologies like advanced nuclear power, carbon capture and sequestration, energy storage, advanced geothermal and hydrogen. We are focused on a clean energy future and we believe our business is well-positioned to benefit from policy support for decarbonization as our generation fleet is essential to helping meet sustainability goals.
Policy Support for Nuclear Energy. We expect our generation fleet will continue to play a critical role in meeting baseload power needs. Nuclear energy is currently the largest source of zero-emissions electricity in the U.S., accounting for over 50% of the nation’s carbon-free power and our nuclear plants are meaningful contributors to the clean energy mix in the states in which they operate. Through enactment of the nuclear PTC in the IRA, federal policymakers have recognized the need to ensure the continued operation of the nation’s nuclear power plants. Actions taken by states recognize that existing nuclear generation facilities are essential to meeting their policy objectives to reduce GHG emissions, with three states currently considering bills to add nuclear energy to clean energy targets and four states, including Connecticut, Michigan, North Carolina and Tennessee, finalizing such legislation since 2023. In addition, nuclear energy generation supports jobs and regional economies, and helps to ensure reliability and security of the electrical grid. As such, we plan to file applications to extend the licenses of our nuclear fleet to 80 years for our units that receive continued policy support for their long-term operation.
New Technologies Requiring Reliable Energy. Many news reports indicate the rapid expansion of data centers and the need for increased energy supply to meet future demand. Significant planned investments from hyperscalers such as Microsoft, Google, and Amazon in artificial intelligence (AI) technology and infrastructure are further contributing to unprecedented demand for reliable, around-the-clock energy in the U.S and abroad. According to the DOE, data centers are one of the most energy-intensive building types, consuming 10 to 50 times the energy per floor space of a typical commercial office building. Efforts to reduce GHG emissions could lead to further electrification of the U.S. economy, including electrification of transportation, industrial operations, heating and cooling, and appliances, which could materially increase demand for electricity. For companies like us whose core competency is safely generating and serving electricity and related products to our customers, the increasing demand provides natural growth opportunities.
Evolving Customer Preferences. Consumers are increasingly purpose-driven and knowledgeable of services that drive decarbonization, leading them to value the ability to be connected to and trace the source of their clean energy choices. Growing awareness of climate change and green energy helps drive customer interest in value-add services and products around their energy usage, such as solar, behind-the-meter storage, EV charging, and the ability to choose 100 percent clean power 24 hours a day, 365 days a year in competitive retail energy markets. Continuing innovation in the digitization of the broader economy will facilitate greater control and opportunities for customers and businesses to more frequently engage with their energy providers and become more knowledgeable of their energy choices, including the products and solutions we provide.
Environmental Matters and Regulation
We are subject to comprehensive and complex environmental legislation and regulation at the federal, state, and local levels, including requirements relating to climate change, air and water quality, solid and hazardous waste, and impacts on species and habitats.
Our Board of Directors is responsible for overseeing the management of environmental matters. We have a management team to address environmental compliance and strategy, including the CEO, and other members of senior management. Performance of those individuals directly involved in environmental compliance and strategy is reviewed and affects compensation as part of the annual individual performance review process. Our Board of Directors has delegated to its Nuclear Oversight Committee and the Corporate Governance Committee the authority to oversee our compliance with health, environmental, and safety laws and regulations and its
strategies and efforts to protect and improve the quality of the environment, including our internal climate change and sustainability policies and programs, as discussed in further detail below.
Climate
Many governments, corporations, and investors have advocated for the reduction of GHG emissions across all sectors of the economy, with reduction of GHG emissions by the energy sector being a key focus. These include state mandates requiring increasingly stringent policies that require the reduction of GHG emissions over time. For example, many large corporations have adopted targets to reduce the carbon emissions in their business operations, spurred in part by demand from investors and customers for sustainable, environment-friendly business practices. Emerging technologies like battery storage, carbon capture and sequestration, and clean hydrogen production are also helping to advance decarbonization.
We believe our business is well-positioned to benefit from policy for decarbonization. However, we also face climate mitigation and transition risks as well as adaptation risks. Mitigation and transition risks include changes to the energy systems as a result of new technologies, changing customer expectations, and/or voluntary GHG reduction goals, as well as local, state, or federal regulatory requirements intended to reduce GHG emissions. Adaptation risk refers to risks to our facilities or operations that may result from changes in the physical climate, such as changes to temperatures, weather patterns, and sea level rise. See ITEM 1A. RISK FACTORS for additional information.
GHG Mitigation and Transition
We currently are subject to, and may become subject to additional, federal and/or state legislation and/or regulations addressing GHG emissions. We are deliberately positioned as a low-carbon generation company. We have minimized GHG emitting assets in our portfolio and maximized carbon-free electric production. Our Scope 1 and 2 market-based GHG emissions in 2023 were 10 million metric tons carbon dioxide equivalent, of which 9.3 million metric tons were from our natural gas and oil-fueled generation fleet, significantly less than our peers with similar volume of power generation. Even with our proposed acquisition of Calpine, we would continue to have the lowest carbon intensity of any large generator in the U.S.
We produce electricity predominantly from low and carbon-free generating facilities (such as nuclear, hydroelectric, natural gas, wind, and solar) and neither own nor operate any coal-fueled generating assets. Our natural gas and oil generating plants produce some GHG emissions, most notably CO2. We have made investments in developing carbon capture technologies to reduce GHG emissions from carbon emitting generating plants. In addition, we sell natural gas through our customer-facing business; and consumers’ use of such natural gas produces GHG emissions. However, our owned-asset emission intensity, or rate of carbon dioxide equivalent (CO2e) emitted per unit of electricity generated, is among the lowest in the industry. In 2024, we achieved a 94.6% percent capacity factor across our nuclear fleet and our ownership of 22 GWs of carbon-free generation capacity at 25 nuclear units produced 182 TWhs of electricity in 2024.
The electric sector plays a key role in lowering GHG emissions across the rest of the economy. Electrification of other sectors such as transportation and buildings coupled with simultaneous decarbonization of electric generation is a key lever for emissions reductions. To support this transition, we are advocating for public policy supportive of vehicle electrification, investing in enabling infrastructure and technology, and supporting customer education and adoption. We also continue to explore other decarbonization opportunities, supporting pilots of emerging energy technologies and development of clean fuels.
International Climate Agreements. At the international level, the United States is a party to the United Nations Framework Convention on Climate Change (UNFCCC). The Parties to the UNFCCC adopted the Paris Agreement at the 21st session of the UNFCCC Conference of the Parties (COP 21) in December 2015. Under the Agreement, which became effective in November 2016, the parties committed to limit the global average temperature increase and to develop national GHG reduction commitments. The United States has set an economy-wide target of reducing its net GHG emissions by 50-52% below 2005 levels by 2030. UNFCC Conference of Parties (COP) sessions occur annually and we monitor developments in these international meetings for their impact on the U.S. energy policy. In January 2025, President Trump issued an executive order to withdraw the United States from the Paris Agreement.
Federal Climate Policy. The reelection of President Donald Trump has altered the landscape of federal climate policy. In the short time since his inauguration, President Trump has taken several actions that pare back climate and sustainability initiatives from prior administrations and called for the repeal of several Biden-era energy tax-support and related initiatives. It is not yet clear what impact, if any, these actions may have on us. President Trump has also emphasized the importance of reliable, affordable electricity to grow the economy and protect national security, and has specifically cited nuclear energy as an important technology.
Regulation of GHGs from Power Plants under the Clean Air Act. In April 2024, EPA issued a final rule that regulates greenhouse gases from existing coal, new natural gas-fired power plants, and existing oil/gas steam generators under Clean Air Act section 111. The applicable standards are subcategorized by retirement date for existing coal and capacity factor for existing gas. We are evaluating market impacts of this rule, which will be affected by upcoming state implementation and ongoing litigation. EPA has solicited comment on approaches for regulating GHGs from existing gas plants in a docket that closed in May 2024. In October 2024, the U.S. Supreme Court rejected a request to temporarily block implementation of EPA's GHG standards for existing coal, new gas, and existing oil/gas steam generators. The rule is currently being litigated in the DC Circuit. Under the Unleashing American Energy Executive Order, issued on January 20, 2025, agencies are directed to revisit regulations that “impose an undue burden” on the use of domestic energy resources, including coal, natural gas, and oil. In February 2025, EPA filed a motion to hold the D.C. Circuit litigation in abeyance.
State Climate Legislation and Regulation. Many states in which we operate have state and regional programs to reduce GHG emissions and renewable and other portfolio standards, which impact the power sector and other sectors as well. 25 states and the District of Columbia have 100% clean energy targets, deep GHG reductions, or both, encompassing 55% of U.S. residential electricity customers. See discussion below for additional information on renewable and other portfolio standards. As the nation’s largest generator of carbon-free electricity, our fleet supports these efforts to produce safe, reliable electricity with minimal GHGs.
In 2019, New York enacted the Climate Leadership and Community Protection Act, which commits the state to achieving net-zero emissions by 2050, with interim emission reduction and renewable energy requirements in 2030 and 2040. New Jersey’s Energy Master Plan provides a comprehensive roadmap for achieving the state’s goal of a 100% clean energy economy by 2050. The state's Global Warming Response Act stated GHG emissions reductions of 80% below 2006 levels by 2050 which was subsequently accelerated by Executive Order 315 targeting 100% clean energy by 2035. In September 2021, Illinois Public Act 102-0662 was signed into law by the Governor of Illinois. The Clean Energy Law is designed to achieve 100% carbon-free power by 2045 to enable the state’s transition to a clean energy economy. The Clean Energy Law establishes decarbonization requirements for Illinois as well as programs to support the retention and development of emissions-free sources of electricity.
Our nuclear plants are meaningful contributors to the clean energy mix in the states in which they operate. States may not be able to meet their zero-carbon goals without our nuclear plants, as our plants provide a significant portion of the current carbon-free power. Several states in which our nuclear facilities operate have established policies to support nuclear generation. The supportive policies are driven by several factors, including recognition by governments and policy makers that existing nuclear generation facilities are essential to meeting policy objectives on reduction of GHG emissions, the desire to support jobs and regional economies, and the need to ensure reliability and security of the electrical grid through resource diversity. These state-specific policies preserve the environmental attributes of our nuclear facilities, and include the following:
| | | | | | | | | | | | | | | | | | | | | | | | | | |
| Policy Name | | Year Enacted | | Nuclear Facilities Impacted | | Type of Program | | Year of Expiration |
| New York Clean Energy Standard | | 2016 | | FitzPatrick, Ginna, and NMP | | ZEC | | 2029 |
| Illinois Zero Emission Standard | | 2016 | | Clinton and Quad Cities | | ZEC | | 2027 |
| New Jersey Clean Energy Legislation | | 2018 | | Salem | | ZEC | | 2025(a) |
| Illinois Clean Energy Law | | 2021 | | Byron, Braidwood, and Dresden | | CMC | | 2027 |
__________
(a)The New Jersey Clean Energy Legislation program ends May 2025.
Regional Greenhouse Gas Initiative (RGGI). The RGGI program requires most fossil fuel-fired power plants in the region to hold allowances, sold at auction or on the secondary market, for each ton of CO2 emissions. Non-emitting resources do not have to purchase or hold these allowances. The following states are currently participants in RGGI; Connecticut, Delaware, Maine, Maryland, Massachusetts, New Hampshire, New Jersey, New York, Rhode Island, and Vermont. Pennsylvania’s participation in RGGI is currently being litigated at the Pennsylvania Supreme Court.
Renewable and Clean Energy Standards. According to the U.S. Energy Information Administration, 35 states and the District of Columbia, including most of the states where we operate, have adopted some form of renewable or clean energy procurement requirement. Of these 35 states, seven states have non-enforceable renewable energy goals. These standards impose varying levels of mandates for procurement of renewable or clean electricity (the definition of which varies by state) and/or energy efficiency. These are generally expressed as a percentage of annual electric load, often increasing by year. Load serving entities comply with these various requirements through purchasing qualifying renewables, acquiring sufficient certificates (e.g., RECs), paying an alternative compliance payment, and/or a combination of these compliance alternatives.
While we cannot predict the nature of future regulations or how such regulations might impact future financial statements, we have a low-emission portfolio and GHG restrictions would likely benefit our zero- and low-emission generating units relative to other higher-emission fossil fuel-fired generating units.
Corporate Clean Energy Targets. Corporations are facing increasing pressure from their customers and investors to align their businesses with environmental and sustainability objectives, including supporting goals to reduce GHG emissions in their business operations. Leading institutional investors and money managers are increasingly considering sustainability as a key factor in investment decisions and are increasingly advocating for more transparency in disclosure on climate-related matters and pledging to align proxy voting to climate-rated proposals with its fiduciary duty. An increasing number of corporations are also proactively making commitments to reducing their GHG emissions footprint, either through procuring increasing amounts of clean energy, such as RECs, EFECs, or emissions offsets, to offset their carbon footprint over time. The execution of the PPA with Microsoft that will support the restart of Crane is a recent example. As the nation’s largest producer of carbon-free energy, we support addressing climate concerns and continue leadership in both emerging technologies and existing clean infrastructure that together will power the future.
Emerging Clean Technologies. The need for new clean, reliable sources of power that can scale, decarbonize the system, and meet new load requirements is leading to rapid advancements in emerging technologies like advanced nuclear power, carbon capture and sequestration, energy storage, advanced geothermal and hydrogen. The improvements in advanced nuclear including Small Modular Reactors (SMR), growing state and federal support, and the potential to rapidly reduce costs with scaled deployment create a potential path to market for new nuclear within the next decade. Carbon capture and sequestration is similarly experiencing substantial investment and a heightened focus that could impact deployment earlier within the next decade. On a nearer term time horizon, it is expected that energy storage will continue to see high levels of investment driven by lower costs, state-directed mandates, a backlog of storage projects in the interconnection queue, and utilities seeking large-scale storage capacity to support higher renewables penetration, and innovations in battery chemistries and technologies. Advanced geothermal and clean hydrogen have similar opportunities to scale supply with early deployments de-risking the technologies. Clean hydrogen, in particular, has the potential to drive decarbonization downstream across hard to decarbonize demand sectors, like long-haul transportation, steel, chemicals, heating, agriculture, and long-term power storage. Nuclear power can be used to produce clean hydrogen, and our nuclear fleet positions us well to explore this emerging space. Collectively, advanced nuclear, carbon sequestration, energy storage, geothermal, and clean hydrogen are expected to help support carbon reduction goals.
Other Environmental Regulation
Air Quality
Good Neighbor Rule. In June 2023, the EPA published a final rule called “Federal 'Good Neighbor Plan' for the 2015 Ozone National Ambient Air Quality Standards” also known as the "Transport Rule". The rule, among other things, establishes nitrogen oxides emissions budgets requiring fossil fuel-fired power plants in 23 states to participate in an allowance-based ozone season trading program beginning in 2023. In February 2023, EPA disapproved state implementation plans submitted by 21 states for failure to address their obligations under the
"good neighbor" provisions of the Clean Air Act. However, several Regional Courts of Appeals issued orders staying, pending judicial review, EPA's disapproval of several state plans (including Texas). In June 2024, the Supreme Court stayed EPA's rule for the duration of the litigation. In November 2024, the EPA issued an administrative stay of the rule. The rule is currently under review on the merits before the D.C. Circuit. In February 2025, EPA filed a motion to hold the D.C. Circuit litigation in abeyance.
Water Quality
Under the federal Clean Water Act, NPDES permits for discharges into waterways are required to be obtained from the EPA or from the state environmental agency to which the permit program has been delegated, and permits must be renewed periodically. Certain of our facilities discharge water into waterways and are therefore, subject to these regulations and operate under NPDES permits.
Clean Water Act Section 316(b) is implemented through the NDPES program and requires that the cooling water intake structures at facilities that withdraw more than 2 million gallons of water per day for cooling reflect the best technology available to minimize adverse environmental impacts. Our power generation facilities with cooling water intake systems are subject to the EPA’s Section 316(b) regulations finalized in 2014; the regulation’s requirements have been or will be addressed through renewal of these facilities’ NPDES permits. We have completed all required studies and have submitted recommendations for compliance as part of the NPDES/SPDES renewal process. We have submitted the NPDES/SPDES renewal timely for all our owned and operated nuclear stations. Six of the twelve stations we operate and STP have been deemed compliant with the 316(b) rule using existing technology. Until the compliance requirements are determined by the applicable state permitting director for each of the six remaining nuclear stations, on a site-specific basis for each plant, we cannot estimate the effect that compliance with the EPA’s 2014 rule will have on the operation of our generating facilities and our consolidated financial statements. As a result, in some instances, such as Peach Bottom, the permit expiration dates have lapsed and have been administratively extended. Should a state permitting director determine that a facility must install cooling towers to comply with the rule, that facility’s economic viability could be called into question. However, the final rule does not mandate cooling towers and allows state permitting directors to require alternative, less costly technologies and/or operational measures, based on a site-specific assessment of the feasibility, costs, and benefits of available options. There is no regulatory established timeline for NPDES permit renewals.
In July 2016, the NJDEP issued a final permit for Salem requiring 316(b) studies and deferring the Agency's selection of a final compliance technology. The permit allows Salem to continue to operate utilizing the existing cooling water intake system with certain required modifications. However, the permit is being challenged by an environmental organization, and if successful, could result in additional costs for Clean Water Act compliance. Potential cooling water system modification costs could be material and could adversely impact the economic competitiveness of this facility.
Under Clean Water Act Section 404 and state laws and regulations, we may be required to obtain permits for projects involving dredge or fill activities in Waters of the United States.
Our hydroelectric and nuclear facilities are required to secure a federal license or permit for activities that may result in a discharge to covered waters. We are required to obtain a state water quality certification for those facilities under Clean Water Act section 401. See Note 3 — Regulatory Matters of the Combined Notes to Consolidated Financial Statements for additional information on the status of the 401 Certification from MDE for Conowingo.
We are also subject to the jurisdiction of the Delaware River Basin Commission and the Susquehanna River Basin Commission, regional agencies that primarily regulate water usage.
Solid and Hazardous Waste and Environmental Remediation
CERCLA authorizes response to releases or threatened releases of hazardous substances into the environment. CERCLA authorities complement those of the RCRA, which primarily regulates ongoing hazardous waste handling and disposal. Under CERCLA, generators and transporters of hazardous substances, as well as past and present owners and operators of hazardous waste sites, are strictly, jointly and severally liable for the cleanup costs of hazardous substances at sites, many of which are listed by the EPA on the National Priorities List. These PRPs can be ordered to perform a cleanup, can be sued for costs associated with an EPA-directed
cleanup, may voluntarily settle with the EPA concerning their liability for cleanup costs, or may voluntarily begin a site investigation and site remediation under state oversight. Most states have also enacted statutes that contain provisions substantially like CERCLA. Such statutes apply in many states where we currently own or operate, or previously owned or operated facilities. In addition, RCRA governs treatment, storage, and disposal of solid and hazardous waste and cleanup of sites where such activities were conducted.
Our operations have in the past, and may in the future, require substantial expenditures to comply with these federal and state environmental laws. Under these laws, we may be liable for the costs of remediating environmental contamination of property now or formerly owned by us and of property contaminated by hazardous substances generated or transported by us. We own or lease several real estate parcels, including parcels on which our operations or the operations of others may have resulted in contamination by substances that are considered hazardous under environmental laws. We are, or could become in the future, parties to proceedings initiated by the EPA, state agencies, and/or other responsible parties under CERCLA and RCRA or similar state laws with respect to several sites, or may undertake to investigate and remediate sites for which we may be subject to enforcement actions by an agency or third party.
We have established appropriate contingent liabilities for environmental remediation requirements. In addition, we may be required to make significant additional expenditures not presently determinable for other environmental remediation costs. See Note 18 — Commitments and Contingencies of the Combined Notes to Consolidated Financial Statements for additional information regarding our environmental matters, remediation efforts, and related impacts to our consolidated financial statements.
Nuclear Waste Storage and Disposal
There are no facilities for the reprocessing or permanent disposal of SNF currently in operation in the United States, nor has the NRC licensed any such facilities. We currently store all SNF generated by our nuclear generating facilities on-site in storage pools or in dry cask storage facilities. Since our SNF storage pools generally do not have sufficient storage capacity for the life of the respective plant, we have developed dry cask storage facilities to support operations.
As of December 31, 2024, we had approximately 95,800 SNF assemblies (23,400 tons) stored on-site in SNF pools or dry cask storage. All our nuclear sites have on-site dry cask storage. On-site dry cask storage in concert with on-site storage pools can meet all current and future SNF storage requirements at each of our sites, including Crane, for the duration of both current and subsequent license periods of all stations and through decommissioning. For a discussion of matters associated with our contracts with the DOE for the disposal of SNF, see Note 18 — Commitments and Contingencies of the Combined Notes to Consolidated Financial Statements.
As a by-product of their operations, nuclear generating units produce LLRW. LLRW is accumulated at each generating station and permanently disposed of at licensed disposal facilities. The Federal Low-Level Radioactive Waste Policy Act of 1980 provides that states may enter agreements to provide regional disposal facilities for LLRW and restrict use of those facilities to waste generated within the region. Illinois and Kentucky have entered into such an agreement, although neither state currently has an operational site, and none is anticipated to be operational for the next ten years. We ship our Class A LLRW, which represents 93% of LLRW generated at our stations, to disposal facilities in Utah and South Carolina, which have enough storage capacity to store all Class A LLRW for the duration of both current and subsequent license periods for all the stations in our nuclear fleet. The disposal facility in South Carolina at present is only receiving LLRW from LLRW generators in South Carolina, New Jersey (which includes Salem), and Connecticut.
We utilize on-site storage capacity at all our stations to store and stage for shipping Class B and Class C LLRW. We have a contract through 2040 to ship Class B and Class C LLRW to a disposal facility in Texas. The agreement provides for disposal of all Class B and Class C LLRW currently stored at each station as well as the Class B and Class C LLRW generated during the term of the agreement. However, because the production of LLRW from our nuclear fleet will exceed the capacity at the Texas site (3.9 million curies through 2027, with applications submitted by the facility for a 10-year extension and an increase in storage capacity), we will still be required to utilize on-site storage at our stations for Class B and Class C LLRW. We currently have enough storage capacity to store all Class B and Class C LLRW for the duration of both current and subsequent license periods for of all the stations in our nuclear fleet and, we continue to pursue alternative disposal strategies for LLRW, including an LLRW reduction program to minimize on-site storage and cost impacts.
Employees
Engaged Workforce
Our employees are our greatest strength. We strive to create a workplace that is inclusive, innovative, and safe for our employees. In order to provide the services and products that our customers expect, we focus on creating the best teams to foster teamwork, mutual respect and the empowerment of employees to be their authentic selves. We strive to attract highly qualified talent and review our hiring, development and promotion practices to maintain equal opportunity and non-discriminatory processes.
We develop our future highly skilled workforce by focusing on three main areas: (1) elevating career awareness by promoting STEM and energy career pathways; (2) fostering equal opportunities for all individuals; and (3) advancing the skills of workers by investing in training, reskilling, and upskilling programs.
We conducted an employee engagement survey during 2024 to gain insight into engagement and job satisfaction within our workforce. We will use this and future surveys to help identify our successes and opportunities for growth. The survey results are shared with leaders at all levels and they are also part of action planning to increase engagement. A robust action planning process is implemented that integrates both centralized action for organization-wide issues and leader-led action for areas unique to their own work groups and/or business areas.
Career Development
We strive to prepare our workforce for the future and help our employees develop competencies to progress in their careers. We work to continuously enhance the knowledge and skills of our workforce through formal assessments, feedback, coaching, mentoring, training, leadership development programs and development programs.
Well-Being and Benefits
We help our employees maintain and improve their overall well-being, and we offer a wide range of benefits that support physical, mental, financial, and family health. Our comprehensive benefits help our employees care for themselves and their families, now and in the future.
Community
We actively invest in community development through philanthropic giving and employee volunteerism. We work to build a future in which all our employees, customers, business associates and communities benefit from social, environmental and economic progress. We provide opportunities for company-sponsored volunteerism and charitable matching gifts programs. Our employees donated more than $5.3 million to non-profit organizations of their choice and provided more than 116,500 volunteer service hours in 2024.
Next Generation of Talent
We aim to attract, retain and advance a world-class workforce that effectively serves our customers and communities. We work toward this objective by sourcing from and developing a broad talent pipeline and cultivating an inclusive and respectful culture where all individuals can develop to reach their full potential. In 2024, we hired over 1,400 employees.
Through our talent acquisition strategy, we work with universities and organizations to attract and recruit STEM-focused students and professionals. Through these collaborations, we participate in mentoring programs, conferences, career fairs and industry events to identify highly skilled talent who may be interested in applying for employment.
Workforce
We provide training and review hiring and promotion processes and perform pay equity analyses. These actions help to create an environment where all employees can thrive and advance based on merit.
The following table shows total number of employees, management, and executives as of December 31, 2024:
| | | | | | | | |
| Metric | | All Employees |
| Full-Time | | 14,215 | |
| Part-Time | | 49 | |
| Total Employees | | 14,264 | |
| | | | | | | | |
| Metric | | All Employees |
Regular(a) | | 14,219 | |
Temporary(b) | | 45 | |
| Total Employees | | 14,264 | |
__________
(a)Regular employees hold a position where employment is for an indeterminate period and the position is expected to continue on an ongoing basis.
(b)Temporary employees hold a position (with or without a contract) for a limited period with an expected end date, typically based on completion of a specific assignment, project, or event.
Turnover Rates
As turnover is inherent, management succession planning is performed and tracked for executives enterprise-wide. Management frequently reviews succession planning to be prepared when positions become available.
The table below shows the turnover rate for regular employees for the year ended December 31, 2024:
| | | | | |
| Involuntary Termination | 1.50 | % |
Retirement(a) | 2.40 | % |
| Voluntary Resignation | 3.50 | % |
__________
(a)For reporting purposes, reflects employees who were at least 55 years of age and had at least 10 years of service at the time they ended employment.
Collective Bargaining Agreements
Approximately 25% of all employees participate in CBAs. The following table presents employee information, including information about CBAs, as of December 31, 2024:
| | | | | | | | | | | | | | | | | | | | |
| Total Employees Covered by CBAs | | Total Number of CBAs | | New and Renewed CBAs in 2024(a) | | Total Employees Under New and Renewed CBAs in 2024 |
| 3,333 | | | 21 | | | 8 | | | 726 | |
__________
(a)Does not include CBAs that expired in 2024 but are operating under interim extension agreements while negotiations are ongoing for renewal.
We operate in a complex market and regulatory environment that involves significant risks, many of which are beyond our direct control. Such risks, which could negatively affect our consolidated financial statements, fall primarily under the categories below: Risks related to market and financial factors primarily include:
•the price and availability of fuels,
•the generation resources in the markets in which we operate,
•the design of power markets,
•our ability to operate our generating assets,
•our ability to access capital markets,
•the impacts of ongoing competition, and
•emerging technologies and business models, including those related to climate change mitigation and transition to a low-carbon economy.
Risks related to legislative, regulatory, and legal factors primarily include changes to, and compliance with, the laws and regulations that govern:
•the renewal of operating licenses,
•environmental and climate policy, and
•tax policy.
Risks related to operational factors primarily include:
•changes in the global climate could produce extreme weather events, which could put our facilities at risk, and such changes could also affect the levels and patterns of demand for energy and related services,
•the safe, secure and effective operation of our nuclear facilities and the ability to effectively manage the associated decommissioning obligations,
•physical, cybersecurity, and third-party reliability risks for us as an owner-operator of generation facilities and as a participant in commodities trading,
•ability to attract and retain an appropriately qualified workforce, and
•acquisitions or investments in new business initiatives and new markets.
Risks related to the proposed acquisition of Calpine primarily include:
•challenges in satisfying conditions, obtaining regulatory approvals, and potential delays or abandonment of the merger agreement,
•no assurance of the dividends at the current rate post-acquisition, reduced ownership and voting power for current shareholders, and potential dilution to earnings per share and significant transaction costs,
•integration challenges including the complex, costly and time-consuming integration process with potential unknown liabilities, and the possible loss of key employees and customers, and
•legal and regulatory risks such as potential lawsuits and substantial costs, as well as valuation risk, which could negatively impact future operating results.
Risks Related to Market and Financial Factors
We are exposed to price volatility associated with both the wholesale and retail power markets and the procurement of nuclear fuel, natural gas, and oil.
We are exposed to commodity price risk for natural gas and the unhedged portion of our generation portfolio. Our earnings and cash flows are therefore exposed to variability of spot and forward market prices in the markets in which we operate.
Price of Fuels. The spot market price of electricity for each hour is generally determined by the marginal cost of supplying the next unit of electricity to the market during that hour. Thus, the market price of power is affected by the market price of the marginal fuel, in particular the price of natural gas, used to generate the electricity unit.
Cost and Availability of Fuel. We depend on nuclear fuel, natural gas, and oil to operate most of our generating facilities. The supply markets for nuclear fuel, natural gas, and oil are subject to price fluctuations,
availability restrictions, tariffs, counterparty default, and geopolitical risk, including the ongoing Russia and Ukraine conflict which has yielded sanctions and legislation by the United States, United Kingdom, European Union, and Canada impacting the exports and imports of Russian nuclear fuel. An example of such sanctions includes the "Prohibiting Russian Uranium Imports Act" which bans the import of low-enriched uranium into the U.S. that is produced in Russia or by Russian entities, absent a waiver from the DOE. The cycle of production and utilization of nuclear fuel is complex, and we engage a diverse set of suppliers to secure the nuclear fuel needed to continue to operate our nuclear fleet long-term. Non-performance by these suppliers could have a material adverse impact on our consolidated financial statements. See ITEM 1. BUSINESS – Price and Supply Risk Management and ITEM 7A. QUANTITATIVE AND QUALITATIVE DISCLOSURES ABOUT MARKET RISK for additional information on the nuclear fuel cycle and procurement.
Demand and Supply. The market price for electricity is also affected by changes in the demand for electricity and the available supply of electricity. Unfavorable economic conditions, milder than normal weather, and the growth of energy efficiency and demand response programs can depress demand. In addition, in some markets, the supply of electricity can exceed demand during some hours of the day, resulting in loss of revenue for baseload generating plants such as our nuclear plants.
Retail Competition. Our retail operations compete for customers in a competitive environment, which affects the margins we can earn and the volumes we are able to serve. In periods of sustained low natural gas and power prices and low market volatility, retail competitors can aggressively pursue market share because the barriers to entry can be low and wholesale generators (including us) use their retail operations to hedge generation output.
Market Designs. The wholesale markets vary from region to region with distinct rules, practices and procedures. Changes in these market rules, problems with rule implementation, or failure of any of these markets could adversely affect our business. In addition, a significant decrease in market participation could affect market liquidity and have a detrimental effect on market stability.
We may be adversely affected by the effects of sustained inflation.
The existence of inflation in the economy has resulted in, or may result in, higher interest rates and capital costs, increased costs of labor, and other similar effects. If inflation rates rise or become elevated for a sustained period, they could have a material adverse effect on our business, financial condition, results of operations and liquidity. Although we may take measures to mitigate the impact of inflation, those measures may not be effective.
We are potentially affected by emerging technologies that could, over time, affect or transform the energy industry.
Advancements in both distributed and utility-scale power generation technology could impact market prices and demand size and behaviors. For instance, commercial and residential solar generation installations, energy storage improvements that include batteries and fuel cells, and other emerging technologies are improving the cost-effectiveness of customer self-supply of electricity. Improvements in energy efficiency of lighting, appliances, equipment and building materials will also affect energy consumption by customers. Advancements in nuclear technology, carbon capture sequestration, storage and advanced geothermal may contribute to a substantial increase in the supply of clean, reliable baseload power, impacting market prices. Carbon sequestration technology may also allow for gas generation to continue to be a viable source of clean electricity and provide for future growth of clean gas-powered generation.
These developments could affect the price of energy, levels of customer-owned generation, customer expectations and current business models and make portions of our generation facilities uneconomic prior to the end of their useful lives. These technologies could also result in further declines in commodity prices or demand for delivered energy. Each of these factors could affect our consolidated financial statements through, among other things, reduced operating revenues, increased operating and maintenance expenses, increased capital expenditures, and potential asset impairment charges or accelerated depreciation and decommissioning expenses over shortened remaining asset useful lives.
Market performance and other factors could decrease the value of our NDT funds and employee benefit plan assets, which then could require significant additional funding.
Disruptions in the capital markets and their actual or perceived effects on particular businesses and the broader economy could adversely affect the value of the investments held within our NDTs and employee benefit plan trusts. We have significant obligations in these areas and hold substantial assets in these trusts to meet those obligations. The asset values are subject to market fluctuations and will yield uncertain returns, which could fall below our projected return rates. A decline in the market value of the NDT fund investments could increase our funding requirements to decommission our nuclear plants. A decline in the market value of the pension and OPEB plan assets would increase the funding requirements associated with our pension and OPEB plan obligations. Additionally, our pension and OPEB plan liabilities are sensitive to changes in interest rates. As interest rates decrease, the liabilities increase, potentially increasing benefit costs and funding requirements. See Note 10 — Asset Retirement Obligations and Note 14 — Retirement Benefits of the Combined Notes to Consolidated Financial Statements for additional information.
We could be negatively affected by unstable capital and credit markets and increased volatility in commodity markets.
We rely on the capital markets, particularly for publicly offered debt, as well as the banking and commercial paper markets, to meet our financial commitments and short-term liquidity needs. Disruptions in the capital and credit markets in the United States or abroad could negatively affect our ability to access the capital markets or draw on our bank revolving credit facilities. The banks may not be able to meet their funding commitments to us if they experience shortages of capital and liquidity or if they experience excessive volumes of borrowing requests within a short period of time. The inability to access capital markets or credit facilities, and longer-term disruptions in the capital and credit markets as a result of uncertainty, changing or increased regulation, reduced alternatives or failures of significant financial institutions could result in the deferral of discretionary capital expenditures, affect our ability to effectively hedge our generation portfolio, require changes to our hedging strategy in order to reduce collateral posting requirements, or require a reduction in discretionary uses of cash. In addition, we have exposure to worldwide financial markets, including Europe, Canada, and Asia. Disruptions in these markets could reduce or restrict our ability to secure sufficient liquidity or secure liquidity at reasonable terms. As of December 31, 2024, approximately 35%, 11%, and 20% of our available credit facilities were with European, Canadian, and Asian banks, respectively.
The strength and depth of competition in energy markets depend heavily on active participation by multiple trading parties, which could be negatively affected by disruptions in the capital and credit markets and legislative and regulatory initiatives that could affect participants in commodities transactions. Reduced capital and liquidity and failures of significant institutions that participate in the energy markets could diminish the liquidity and competitiveness of energy markets that are important to our business. Perceived weaknesses in the competitive strength of the energy markets could lead to pressures for greater regulation of those markets or attempts to replace market structures with other mechanisms for the sale of power, including the requirement of long-term contracts.
If we were to experience a downgrade in our credit ratings to below investment grade or otherwise fail to satisfy the credit standards in our agreements with our counterparties or regulatory financial requirements, we would be required to provide significant amounts of collateral that could affect our liquidity and we could experience higher borrowing costs.
Our business is subject to credit quality standards that could require market participants to post collateral for their obligations upon a decline in ratings. We are also subject to certain financial requirements under NRC regulations as a result of our operation of nuclear power plants that could require us to provide cash collateral or surety bonds if those requirements are not met. One or both events could adversely affect available liquidity and, in the case of a rating downgrade, borrowing and credit support costs.
See ITEM 7. MANAGEMENT'S DISCUSSION AND ANALYSIS OF FINANCIAL CONDITION AND RESULTS OF OPERATIONS – Liquidity and Capital Resources – Credit Matters and Cash Requirements – Security Ratings and Note 15 — Derivative Financial Instruments of the Combined Notes to Consolidated Financial Statements for additional information regarding the potential impacts of credit downgrades on our cash flows.
If we fail to meet project-specific financing agreement requirements, we could experience an impairment or loss of the financed project.
We have project-specific financing arrangements and must meet the requirements of various agreements relating to those financings. Failure to meet those arrangements could give rise to a project-specific financing default which, if not cured or waived, could result in the specific project being required to repay the associated debt or other borrowings earlier than otherwise anticipated, and if such repayment were not made, the lenders or security holders would generally have broad remedies, including rights to foreclose against the project assets and related collateral or to force our subsidiaries in the project-specific financings to enter bankruptcy proceedings. The impact of bankruptcy could result in the impairment of certain project assets. See Note 16 — Debt and Credit Agreements of the Combined Notes to Consolidated Financial Statements for additional information.
Our risk management policies cannot fully eliminate the risk associated with our commodity trading activities.
Our asset-based power position as well as our power marketing, fuel procurement and other commodity trading activities expose us to risks of commodity price movements. We buy and sell energy and other products and enter financial contracts to manage risk and hedge various positions in our portfolio. We are exposed to volatility in financial results for unhedged positions as well as the risk of ineffective hedges. We attempt to manage this exposure through enforcement of established risk limits and risk management procedures. These risk limits and risk management procedures may not work as planned and cannot eliminate all risks associated with these activities. Even when our policies and procedures are followed, and decisions are made based on projections and estimates of future performance, results of operations could be diminished if the judgments and assumptions underlying those decisions prove to be incorrect. Factors, such as future prices and demand for power, natural gas and other energy-related commodities, become more difficult to predict and the calculations become less reliable the further into the future estimates are made. As a result, we cannot predict the impact that our commodity trading activities and risk management decisions could have on our consolidated financial statements.
Financial performance and load requirements could be negatively affected if we are unable to effectively manage our power portfolio.
A significant portion of our power portfolio is used to provide power under procurement contracts with load serving entities and other customers. To the extent portions of the power portfolio are not needed for that purpose, our output is sold in the wholesale power markets. To the extent our power portfolio is not sufficient to meet the requirements of our customers under the related agreements, we must purchase power in the wholesale power markets. Our financial results could be negatively affected if we are unable to cost-effectively meet the load requirements of our customers, manage our power portfolio or effectively address the changes in the wholesale power markets.
The impacts of significant economic downturns (i.e., recession) could lead to decreased volumes delivered and increased expense for uncollectible customer balances.
The impacts of significant economic downturns on our retail customers, such as less demand for the products and services provided by our C&I customers, could result in an increase in the number of uncollectible customer balances and related expense.
See ITEM 7A. QUANTITATIVE AND QUALITATIVE DISCLOSURES ABOUT MARKET RISK and Note 15 — Derivative Financial Instruments of the Combined Notes to Consolidated Financial Statements for additional information on our credit risk.
We could be negatively affected by the impacts of weather.
Our operations are affected by weather, which impacts demand for electricity and natural gas, the price of energy commodities, as well as operating conditions. To the extent that weather is warmer in the summer or colder in the winter than assumed, we could require greater resources to meet our contractual commitments. Extreme weather conditions or storms could affect the availability of generation and the transmission of electricity, limiting our ability to source electricity or transmit it to our customers. It could also impair our ability to transport natural
gas to our generating assets and our ability to supply natural gas to our customers. In addition, drought-like conditions limiting water usage could impact our ability to run certain generating assets at full capacity. These conditions, which cannot be accurately predicted, could cause us to seek additional replacement supply at a time when supply is constrained.
Weather projections suggest increases to summer temperature and humidity trends, as well as more erratic precipitation and storm patterns over the long term in the areas where we have generation assets. The frequency in which weather conditions emerge outside the current expected climate norms could contribute to the weather-related impacts discussed above.
Long-lived assets, goodwill, and other assets could become impaired.
Long-lived assets – principally, generation assets – represent the single largest asset class on our Consolidated Balance Sheets. In addition, we have a material goodwill balance as of December 31, 2024.
We evaluate the recoverability of the carrying value of long-lived assets to be held and used whenever events or circumstances indicating a potential impairment may exist. Factors such as, but not limited to, the business climate, including current and future energy and market conditions, environmental regulation, and the condition of assets are considered. We assess goodwill for impairment at least annually or more frequently if an event occurs or circumstances change that would more likely than not reduce the fair value of the reporting units below their carrying amount. Changes in significant assumptions, including discount rates, energy prices, projected operating costs, and cash flows could potentially result in future impairments of goodwill.
An impairment would require us to reduce the carrying value of the long-lived asset and goodwill to fair value through a non-cash charge to expense by the amount of the impairment. See ITEM 7. MANAGEMENT'S DISCUSSION AND ANALYSIS OF FINANCIAL CONDITION AND RESULTS OF OPERATIONS – Critical Accounting Policies and Estimates, Note 1 — Basis of Presentation, Note 8 — Property, Plant, and Equipment, and Note 12 — Intangible Assets of the Combined Notes to Consolidated Financial Statements for additional information on long-lived asset impairments.
We could incur substantial costs in the event of non-performance by third parties under indemnification agreements. We are exposed to other credit risks in the power markets that are beyond our control.
We have entered into various agreements with counterparties that require those counterparties to reimburse us and hold us harmless against specified obligations and claims. To the extent that any of these counterparties are affected by deterioration in their creditworthiness or the agreements are otherwise determined to be unenforceable, we could be held responsible for the obligations.
We have issued indemnities to third parties regarding environmental or other matters in connection with purchases and sales of assets, including several of the Exelon utilities in connection with our absorption of their former generating assets. We could incur substantial costs to fulfill our obligations under these indemnities.
In the bilateral markets, we are exposed to the risk that counterparties that owe us money or are obligated to purchase energy or fuel from us will not perform under their obligations for operational or financial reasons. In the event the counterparties to these arrangements fail to perform, we could be forced to purchase or sell energy or fuel in the wholesale markets at less favorable prices and incur additional losses, to the extent amounts, if any, were already paid to the counterparties. In the spot markets, we are exposed to risk as a result of default sharing mechanisms that exist within certain markets, primarily RTOs and ISOs. We are also a party to agreements with entities in the energy sector that have experienced rating downgrades or other financial difficulties. In addition, our retail sales subject us to credit risk through competitive electricity and natural gas supply activities to serve C&I companies, governmental entities, and residential customers. Retail credit risk results when customers default on their contractual obligations. This risk represents the loss that could be incurred due to the nonpayment of a customer’s account balance, as well as the loss from the resale of energy previously committed to serve the customer.
Risks Related to Legislative, Regulatory, and Legal Factors
Federal or state legislative or regulatory actions could negatively affect the scope and functioning of the wholesale markets.
Approximately 70% of our generating resources, which include directly owned assets and capacity obtained through long-term contracts, are in the area encompassed by PJM. Our future results of operations are impacted by (1) FERC’s and PJM's level of support for policies that favor the preservation of competitive wholesale power markets, recognize the value of emissions-free electricity and resiliency, complement states' energy objectives and policies and (2) the absence of material changes to market structures that would limit or otherwise negatively affect us. Market rules in other regions could affect us in a similar fashion. We could also be affected by state laws, regulations or initiatives to subsidize existing or new generation.
FERC’s requirements for market-based rate authority could pose a risk that we may no longer satisfy FERC’s tests for market-based rates. A loss of market-based rate authority would mean that we would sell power at cost-based rates.
Our business is highly regulated and could be negatively affected by legislative and/or regulatory actions.
Substantial aspects of our business are subject to comprehensive federal or state legislation and/or regulation.
Our consolidated financial statements are significantly affected by our sales and purchases of commodities at market-based rates, as opposed to cost-based or other similarly regulated rates, and federal and state regulatory and legislative developments related to emissions, climate change, capacity market mitigation, energy price information, resilience, fuel diversity, and RPS. Federal or state legislative and regulatory efforts to preserve the environmental attributes and reliability benefits of zero-emission nuclear-powered generating facilities could be subject to legal and regulatory challenges and, if overturned, could result in the early retirement of certain of our nuclear plants. The PTC benefiting existing nuclear plants included in the IRA (starting January 1, 2024) continues to be the subject of additional guidance issued from the U.S. Treasury and IRS, which may negatively impact the amount of benefits we ultimately receive. In addition, the duration of the PTC program, the value of the PTC, and/or the existence of the PTC could be affected by legislative action and may have significant adverse effects on our financial performance depending on the future gross receipts received by our nuclear units.
Fundamental changes in regulations or other adverse legislative actions affecting our business would require changes in our business planning models and operations. We cannot predict when or whether legislative and regulatory proposals could become law or what their effect would be. See Note 3 — Regulatory Matters of the Combined Notes to Consolidated Financial Statements for additional information on the nuclear PTC.
NRC actions could negatively affect the operations and profitability of our nuclear generating fleet.
Regulatory Risk. A change in the Atomic Energy Act or the applicable regulations or licenses could require a substantial increase in capital expenditures or could result in increased operating or decommissioning costs. Events at nuclear plants owned by others, as well as those owned by us, could cause the NRC to initiate such actions.
Spent Nuclear Fuel Storage. Our nuclear operations produce various types of nuclear waste materials, including SNF. The approval of a national repository for the storage of SNF and the timing of that facility opening will significantly affect the costs associated with storage of SNF and the ultimate amounts received from the DOE to reimburse us for these costs.
Any regulatory action relating to the timing and availability of a repository for SNF could adversely affect our ability to decommission fully our nuclear units. We cannot predict whether a fee may be established or to what extent, in the future for SNF disposal. See Note 18 — Commitments and Contingencies of the Combined Notes to Consolidated Financial Statements for additional information.
We could be subject to higher costs and/or penalties related to mandatory reliability standards.
We, as a user of the bulk power transmission system, are subject to mandatory reliability standards promulgated by NERC and enforced by FERC. The standards are based on the functions that need to be performed to ensure the bulk power system operates reliably and are guided by reliability and market interface principles. Compliance with or changes in the reliability standards could subject us to higher operating costs and/or increased capital expenditures. If we were found in non-compliance with the federal and state mandatory reliability standards, we could be subject to remediation costs as well as sanctions, which could include substantial monetary penalties.
We could incur substantial costs to fulfill our obligations related to environmental and other matters.
We are subject to extensive environmental regulation and legislation by local, state and federal authorities. These laws and regulations affect the way we conduct our operations and make capital expenditures, including how we handle air and water emissions, hazardous and solid waste, and activities affecting surface waters, groundwater, and aquatic and other species. Violations of these requirements could subject us to enforcement actions, capital expenditures to bring existing facilities into compliance, additional operating costs for remediation and clean-up costs, civil penalties and exposure to third parties’ claims for alleged health or property damages or operating restrictions to achieve compliance. In addition, we are subject to liability under these laws for the remediation costs for environmental contamination of property now or formerly owned by us and of property contaminated by hazardous substances we generated or released. Also, we are currently involved in several proceedings relating to sites where hazardous substances have been deposited and could be subject to additional proceedings in the future. See ITEM 1. BUSINESS – Environmental Matters and Regulation and Note 18 — Commitments and Contingencies of the Combined Notes to Consolidated Financial Statements for additional information.
We could be negatively affected by federal and state RPS and/or energy conservation legislation, along with energy conservation by customers.
Changes to current state legislation or the development of federal legislation that requires the use of clean, renewable and alternate fuel sources could significantly impact us. The impact could include reduced use of some of our generating facilities with effects on our operating revenues and costs.
Federal and state legislation mandating the implementation of energy conservation programs and new energy consumption technologies could cause declines in customer energy consumption and lead to a decline in our operating revenues. See ITEM 1. BUSINESS – Environmental Matters and Regulation – Renewable and Clean Energy Standards and “We are potentially affected by emerging technologies that could over time affect or transform the energy industry” above for additional information.
Our financial performance could be negatively affected by risks arising from our ownership and operation of hydroelectric facilities.
FERC has the exclusive authority to license most non-federal hydropower projects located on navigable waterways, federal lands, or connected to the interstate electric grid. If FERC does not issue new operating licenses for our hydroelectric facilities in the future or a station cannot be operated through the end of its current operating license, our results of operations could be adversely affected by increased depreciation rates and accelerated future decommissioning costs, since depreciation rates and decommissioning cost estimates are currently based on the available license term for each facility. We could also lose operating revenues and incur increased purchased power and fuel expense to meet our supply commitments. In addition, conditions could be imposed as part of the license renewal process that could adversely affect operations, require a substantial increase in capital expenditures, result in increased operating costs or render the project uneconomic. Similar effects could result from a change in the Federal Power Act or the applicable regulations due to events at hydroelectric facilities owned by others, as well as those owned by us. See Note 3 — Regulatory Matters of the Combined Notes to Consolidated Financial Statements for additional information regarding the license renewal for the Conowingo hydroelectric project.
We could be negatively affected by challenges to tax positions taken, tax law changes and the inherent difficulty in quantifying potential tax effects of business decisions.
We are required to make judgments in order to estimate our obligations to taxing authorities. These tax obligations include income, real estate, sales and use, and employment-related taxes and ongoing appeal issues related to these tax matters. These judgments include reserves established for potential adverse outcomes regarding tax positions that have been taken that could be subject to challenge by the tax authorities. See Note 1 — Basis of Presentation and Note 13 — Income Taxes of the Combined Notes to Consolidated Financial Statements for additional information.
Legal proceedings could result in a negative outcome, which we cannot predict.
We are involved in legal proceedings, claims, and litigation arising from our business operations. Our material legal proceedings, claims, and litigation are summarized in Note 3 — Regulatory Matters and Note 18 — Commitments and Contingencies of the Combined Notes to Consolidated Financial Statements. Adverse outcomes in these proceedings could require significant expenditures, result in loss of revenue, or restrict existing business activities.
We could be subject to adverse publicity and reputational risks, which make us vulnerable to negative customer perception and could lead to increased regulatory oversight or other consequences.
We could be the subject of public criticism. Adverse publicity of this nature could render public service commissions and other regulatory and legislative authorities less likely to view energy companies in a favorable light, and could cause those companies, including us, to be susceptible to less favorable legislative and regulatory outcomes, as well as increased regulatory oversight and more stringent legislative or regulatory requirements.
Risks Related to Operational Factors
We are subject to risks associated with climate change.
Climate adaptation risk refers to risks to our facilities or operations that may result from changes in the physical climate, such as changes to temperatures, weather patterns and sea level rise.
We periodically perform analyses to better understand how climate change could affect our facilities and operations. We primarily operate in the Midwest, Mid-Atlantic, Northeast, and Texas areas that have historically been prone to various types of severe weather events. As such, we have well-developed response and recovery programs based on historical weather events and patterns. However, our physical facilities could be placed at greater risk of damage should changes in the global climate impact temperature and weather patterns, and result in more intense, frequent and extreme weather events, unprecedented levels of precipitation, sea level rise, increased surface water temperatures, and/or other effects. Over time, we may need to make additional investments to protect our facilities from physical climate-related risks.
In addition, changes to the climate may impact levels and patterns of demand for energy and related services, which could affect our operations. Over time, we may need to make additional investments to adapt to changes in operational requirements as a result of climate change.
Climate mitigation and transition risks include changes to the energy systems as a result of new technologies, changing customer expectations and/or voluntary GHG goals, as well as local, state or federal regulatory requirements intended to reduce GHG emissions.
We also periodically perform analyses of potential pathways to reduce power sector and economy-wide GHG emissions to mitigate climate change. To the extent additional GHG reduction regulation or legislation becomes effective at the federal and/or state levels, we could incur costs to further limit the GHG emissions from our operations or otherwise comply with applicable requirements. To the extent such additional regulation or legislation does not become effective, the potential competitive advantage offered by our low-carbon emission profile may be reduced.
See ITEM 1. BUSINESS – Environmental Matters and Regulation – Climate for additional information.
Our financial performance could be negatively affected by matters arising from our ownership and operation of nuclear facilities.
Nuclear capacity factors. Capacity factors for nuclear generating units significantly affect our results of operations. Lower capacity factors could decrease our revenues and increase operating costs by requiring us to produce additional energy from our natural gas and oil-fueled facilities or purchase additional energy in the spot or forward markets in order to satisfy our supply obligations to committed third-party sales. These sources generally have higher costs than we incur to produce energy from our nuclear stations.
Nuclear refueling outages. In general, refueling outages are planned to occur once every 18 to 24 months. The total number of refueling outages, along with their duration, could have a significant impact on our results of operations. When refueling outages last longer than anticipated or we experience unplanned outages, capacity factors decrease, and we face lower margins due to higher energy replacement costs and/or lower energy sales and higher operating and maintenance costs.
Nuclear fuel quality. The quality of nuclear fuel utilized by us could affect the efficiency and costs of our operations. Remediation actions could result in increased costs due to accelerated fuel amortization, increased outage costs and/or increased costs due to decreased generation capabilities.
Operational risk. Operations at any of our nuclear generation plants could degrade to the point where we must shut down the plant or operate at less than full capacity. If this were to happen, identifying and correcting the causes could require significant time and expense. We could choose to close a plant rather than incur the expense of restarting it or returning the plant to full capacity. In either event, we could lose revenue and incur increased purchased power costs and fuel expense to meet supply commitments.
If we are required to arrange for the safe and permanent disposal of SNF beyond current expectations, this could lead to substantial expense or capital expenditures. See "NRC actions could negatively affect the operations and profitability of our nuclear generating fleet" above for additional information on the storage of SNF.
For plants operated but not wholly owned by us, we could also incur liability to our co-owners. For nuclear plants not operated and not wholly owned by us, from which we receive a portion of the plants’ output, our results of operations are dependent on the operational performance of the operators and could be adversely affected by a significant event at those plants. We do not procure the fuel for the sites we do not operate. The operator's nuclear fuel procurement plan could impact our results of operations. Additionally, poor operating performance at nuclear plants not owned by us could result in increased regulation and reduced public support for nuclear-fueled energy. Closure of generating plants owned by others, or extended interruptions of generating plants or failure of transmission lines, could adversely affect transmission systems and the sale and delivery of electricity in markets served by us.
Nuclear major incident risk and insurance. The consequences of a major incident could be severe and include loss of life and property damage. Any resulting liability from a nuclear plant major incident within the United States, owned or operated by us or owned by others, could exceed our resources, including insurance coverage. We are a member of an industry mutual insurance company, NEIL, which provides property and accidental outage insurance for our nuclear operations. Uninsured losses and other expenses, to the extent not recovered from insurers or the nuclear industry, could be borne by us. Additionally, an accident or other significant event at a nuclear plant within the United States or abroad, whether owned by us or others, could result in increased regulation and reduced public support for nuclear-fueled energy.
As required by the Price-Anderson Act, we carry the maximum available amount of nuclear liability insurance, $500 million for each operating site. Claims exceeding that amount are covered through mandatory participation in a financial protection pool. In addition, the U.S. Congress could impose revenue-raising measures on the nuclear industry to pay claims exceeding the $16.3 billion limit for a single incident.
See Note 18 — Commitments and Contingencies of the Combined Notes to Consolidated Financial Statements for additional information of nuclear insurance.
Decommissioning obligation and funding. NRC regulations require that licensees of nuclear generating facilities demonstrate reasonable assurance that funds will be available in certain minimum amounts at the end of the life of the facility to decommission the facility.
Actual costs to decommission our nuclear facilities may substantially exceed our estimates as a result of changes in the approach and timing of decommissioning activities, changes in decommissioning costs, changes in federal or state regulatory requirements, other changes in our estimates or our ability to effectively execute on planned decommissioning activities.
We have recourse to collect additional amounts from utility customers through PECO (subject to certain limitations and thresholds) for former PECO units and through CenterPoint and AEP Texas for STP units. If circumstances changed such that there was an inability to continue to make contributions to the trust funds of the former PECO or STP units based on amounts collected from utility customers, or if we no longer had recourse to collect additional amounts from the respective utility customers if there was a shortfall of funds for decommissioning, the adequacy of the trust funds related to these units could be negatively affected. Any changes to the utilities' regulatory agreements could impact our ability to offset decommissioning-related activities for these units within the Consolidated Statements of Operations and Comprehensive Income, and the impact to our consolidated financial statements could be material.
Should the expected value of the NDT fund for any former ComEd unit fall below the amount of the expected decommissioning obligation for that unit, the accounting to offset decommissioning-related activities for that unit may be temporarily suspended or discontinued, and the decommissioning-related activities would be recognized in the Consolidated Statements of Operations and Comprehensive Income, the impact of which could be material.
Forecasting trust fund investment earnings and costs to decommission nuclear generating stations requires significant judgment, and actual results could differ significantly from current estimates. If the investments held by our NDT funds are not sufficient to fund the decommissioning of our nuclear units, we could be required to take steps, such as providing financial guarantees through letters of credit or parent company guarantees or making additional contributions to the trusts, which could be significant, to ensure that the trusts are adequately funded and that current and future NRC minimum funding requirements are met.
See Note 10 — Asset Retirement Obligations of the Combined Notes to Consolidated Financial Statements for additional information.
We are subject to evolving physical security, cybersecurity, and third-party reliability risks.
Threat actors continue to seek to exploit potential vulnerabilities in the energy sector associated with protection of sensitive and confidential information, grid infrastructure, and other energy infrastructures. These attacks and disruptions, both physical and cyber, are becoming increasingly sophisticated and dynamic. Security incidents such as ransomware attacks are becoming increasingly prevalent and severe, as well as increasingly difficult to detect. In addition, geopolitical issues, to include conflicts in the Ukraine and the Middle East, as well as tensions between the U.S. and China, may motivate cyber-attacks which could impact the U.S. energy sector and our Company via supply chain disruptions or direct targeting.
A security breach, including, but not limited to, physical or electronic intrusions, computer viruses, malware, attacks by cyber criminals or nation state threat actors, ransomware attacks, phishing attacks, supply chain attacks, third-party breaches, and other similar breaches of our physical assets or information systems, or those of our competitors, vendors, business partners and interconnected entities in RTOs, ISOs, and other energy markets, or regulators have the potential to disrupt our business and result in harm to the Company. Security breaches can also occur as a result of non-technical issues, including intentional or inadvertent actions by our employees, third-party service providers or their personnel or other parties. Our customers depend on the continuous availability of our commercial and generation operations. A failure, interruption, or breach of our operational or information security systems, or those of our third-party service providers, as a result of cyber-attacks or information security breaches could disrupt our business, result in the disclosure or misuse of confidential or proprietary information, damage our reputation, cause loss of customers or revenue, increase our costs, result in litigation and/or regulatory action, and/or cause other losses, any of which might have a materially adverse impact on our business operations and our financial position or results of operations. Operational harm could be in the form of impact to the generation fleet, our commercial operations, and/or reliability of the bulk
electric system. Impacts to confidential or proprietary information could include inappropriate release of certain types of information, including critical infrastructure, sensitive customer, vendor and employee, trading, export control or other confidential information. If a significant security breach were to occur, our reputation could be negatively affected, customer confidence in us or others in the industry could be diminished, or we could be subject to legal claims, loss of revenues, increased costs, regulatory penalties, or operational shutdown.
We currently utilize a mix of third-party managed service providers to host and support our information technology, customer support, and generation operations. As an example, our data centers are hosted in vendor-managed co-location facilities. Consequently, we may be subject to short- and long-term interruptions, delays and outages in service and availability due to third-party cybersecurity or reliability incidents that are outside of our direct control. We expect that in the future we may experience interruptions, delays and outages in service and availability from time to time due to a variety of factors, including infrastructure changes, human or software errors, website hosting disruptions and capacity constraints. Coordinated physical and or cyber-attacks that disrupt multiple key electric assets of unaffiliated parties responsible for real-time planning and management of the bulk electric system could impact our ability to provide generation, potentially resulting in localized and regional blackouts affecting third parties and the public, many of which will have no direct commercial relationship with the Company.
We cannot anticipate, detect, repel, or implement fully effective preventative measures against all cyber threats, particularly because the techniques used are constantly evolving. Similarly, we cannot guarantee uninterrupted availability of third-party managed systems that may be affected by factors unrelated to cybersecurity incidents. Continued implementation of advanced digital technologies increases the potentially unfavorable impacts of such attacks and reliability, and may introduce new vulnerabilities and threat tactics. For example, threat actors could use Artificial Intelligence (AI) to develop malicious code and sophisticated phishing attempts. As threats continue to evolve, we may be required to expend additional resources to continue to enhance our information security measures and/or to investigate and remediate information security vulnerabilities. While we have not experienced a material breach or disruption to our network or information systems or our operations to date, future attacks or reliability may negatively impact our business, reputation, or financial results.
Although we maintain insurance coverage for cyber events, the amount and scope of insurance maintained against losses resulting from a significant event or security breach may not be sufficient to cover losses or otherwise adequately compensate for any business disruptions that could result. There can be no assurance that such insurance will be available on commercially reasonable terms in the future. In addition, new or updated security regulations or new vulnerabilities identified by security researchers, third-party suppliers, or threat actors could require changes in current measures taken by security or our business operations and could adversely affect our consolidated financial statements.
We are continuously evolving our cybersecurity strategy and technical controls to prepare for, identify, protect, detect, respond, and recover our technology systems, information and operations from such attacks. See ITEM 1C. CYBERSECURITY for more information.
Our employees, contractors, customers and the general public could be exposed to a risk of injury due to the nature of the energy industry.
Employees and contractors throughout the organization work in, and the general public could be exposed to, potentially dangerous environments near our operations. As a result, employees, contractors and the general public are at some risk for serious injury, including loss of life. These risks include, but are not limited to, nuclear accidents, dam failure, gas explosions, and electric contact cases.
Natural disasters, war, acts and threats of terrorism, pandemic and other significant events could negatively impact our results of operations, ability to raise capital, and future growth.
Our fleet of power plants and the transmission infrastructure to which they are connected could be affected by natural disasters and extreme weather events, which could result in increased costs, including supply chain costs. Natural disasters and other significant events increase our risk that the NRC or other regulatory or legislative bodies could change the laws or regulations governing, among other things, operations, maintenance, operating licenses, decommissioning, SNF storage, insurance, emergency planning, security and environmental and radiological matters. In addition, natural disasters could affect the availability of a secure and economical supply of water in some locations, which is essential for our continued operation, particularly the cooling of
generating units. Also, the ability of energy transmission and distribution companies to maintain the reliability, resiliency and safety of their energy delivery systems could affect our ability to deliver energy to our customers and affect our operating costs.
The impact that potential terrorist attacks could have on the industry and on us is uncertain. We face a risk that our operations would be direct targets or indirect casualties of an act of terror. Any retaliatory military strikes or sustained military campaign could affect our operations in unpredictable ways, such as changes in insurance markets and disruptions of fuel supplies and markets, particularly uranium and oil. Furthermore, these catastrophic events could compromise the physical or cybersecurity of our facilities, which could adversely affect our ability to manage our business effectively. Instability in the financial markets as a result of terrorism, war, natural disasters, pandemic, credit crises, recession or other factors also could result in a decline in energy consumption or interruption of fuel or the supply chain. In addition, the implementation of security guidelines and measures has resulted in and is expected to continue to result in increased costs.
We could be significantly affected by the outbreak of a pandemic. We have plans in place to respond to a pandemic. However, depending on the severity of a pandemic and the resulting impacts to workforce and other resource availability, the ability to operate our generating assets could be adversely affected.
In addition, we maintain a level of insurance coverage consistent with industry practices against property, casualty, and cybersecurity losses subject to unforeseen occurrences or catastrophic events that could damage or destroy assets or interrupt operations. However, there can be no assurance that the amount of insurance will be adequate to address such property and casualty losses.
Our business is capital intensive, and our assets could require significant expenditures to maintain and are subject to operational failure, which could result in potential liability.
Our business is capital intensive and requires significant investments in electric generating facilities. Equipment, even if maintained in accordance with good industry practices, is subject to operational failure, including events that are beyond our control, and could require significant expenditures to remedy. Our consolidated financial statements could be negatively affected if we were unable to effectively manage our capital projects or raise the necessary capital. See ITEM 7. MANAGEMENT'S DISCUSSION AND ANALYSIS OF FINANCIAL CONDITION AND RESULTS OF OPERATIONS – Liquidity and Capital Resources for additional information regarding our potential future capital expenditures.
Our performance could be negatively affected if we fail to attract and retain an appropriately qualified workforce.
Certain events, such as an employee strike, loss of employees, loss of contract resources due to a major event, and an aging workforce without appropriate replacements, could lead to operating challenges and increased costs for us. The challenges include lack of resources, loss of knowledge, and a lengthy time period associated with skill development. In this case, costs, including costs for contractors to replace employees, productivity costs and safety costs, could arise. We are particularly affected due to the specialized knowledge required of the technical and support employees for generation operations. In 2024 we announced the planned restart of our Crane nuclear generation facility which will require hiring skilled employees to restart and operate the plant. Our ability to source qualified employees will impact the timing and cost of the restart. If we are unable to source the necessary workforce it could result in unfavorable financial results and/or a delay to Crane's restart.
We could make acquisitions or investments in new business initiatives and new markets, which may not be successful or achieve the intended financial results.
We could continue to pursue growth in our existing businesses and markets and further diversification across the competitive energy value chain. This could include opportunistic carbon-free energy acquisitions, creating new value from our existing fleet through nuclear uprates, renewable repowerings, co-location of customer load, growing sustainability solutions for our customers, and investment opportunities in other emerging technologies and innovation. Such initiatives could involve significant risks and uncertainties, including distraction of management from current operations, inadequate return on capital, and unidentified issues not discovered during diligence performed prior to launching an initiative or entering a market. Additionally, it is possible that FERC, state public utility commissions, or others could impose certain other restrictions on such transactions. All these
factors could result in higher costs or lower revenues than expected, resulting in lower than planned returns on investment.
We are actively pursuing the restart of our Crane nuclear generation facility. The restart is estimated to cost $1.6 billion and is subject to certain regulatory approvals, including the NRC comprehensive safety and environmental review, as well as permits from relevant state and local agencies. Additionally, through separate requests, we will pursue obtaining a renewed license to operate the plant and a FERC interconnection agreement. Failure to obtain the necessary approvals could result in the impairment of amounts capitalized. The restart is a complex undertaking including procuring or restoring specialized components on a critical timeline. Failure to meet contractual timelines could result in significant penalties. Overages in costs or unforeseen issues could result in lower than planned returns on the investment.
Risks Related to the Proposed Acquisition of Calpine
We may encounter difficulties in satisfying the conditions for the completion of the Merger Agreement, including obtaining the necessary regulatory approvals, within the expected time frame or at all. Such challenges could delay the completion of the merger or impose conditions that could cause abandonment of the Merger Agreement.
Consummation of the merger is subject to the satisfaction or waiver of specified closing conditions, including: (1) the receipt of regulatory approvals required to consummate the Merger Agreement; (2) the expiration or termination of the applicable waiting period under the HSR Act; and (3) other customary closing conditions.
Completion of the merger is conditioned upon the receipt of consents, orders, approvals or clearances, to the extent required, from various regulatory authorities, including DOJ, FERC, and public utility commissions or similar entities in certain states in which the companies operate. We cannot provide assurance that all required regulatory approvals will be obtained or that these approvals will not contain terms, conditions or restrictions that would be unacceptable and, accordingly, the merger may be delayed or may not be consummated. In connection with the required regulatory approvals and to prevent market power concerns, we are expecting to sell certain of the combined company’s PJM natural-gas-fired generating assets following the closing of the merger. The Merger Agreement generally permits us to terminate the Merger Agreement if the final terms of any of the required regulatory consents or approvals include any Burdensome Condition (as defined in the Merger Agreement).
In addition, the Merger Agreement provides that either we or Calpine could terminate the Merger Agreement if the merger is not completed by December 31, 2025 (which date may be automatically extended to June 1, 2026, as further provided in the Merger Agreement). If the Merger Agreement is terminated under certain circumstances due to the failure to obtain regulatory approvals, the failure to obtain regulatory approvals without Burdensome Conditions, or the breach by us of our obligations in respect of obtaining regulatory approvals, we would be required to pay Calpine a termination fee of $500 million as liquidated damages.
Further, the share price of our common stock may decline to the extent that the current market price reflects an assumption by the market that the merger will be completed. See Note 2 — Mergers, Acquisitions, and Dispositions of the Combined Notes to Consolidated Financial Statements for additional information regarding the status of the transaction.
We cannot assure that we will continue paying dividends at the current rate.
We currently expect to pay dividends in an amount consistent with the dividend policy in effect prior to the completion of the merger. However, there is no assurance that our shareholders will receive the same dividends following the merger for reasons that may include capital spending plans, financing agreements, cash flow or financial position. Decisions on whether, when, and in which amounts to make any future distributions will remain at all times entirely at the discretion of our Board of Directors, which reserves the right to change our dividend practices at any time and for any reason.
Our current shareholders will have a reduced ownership and voting power after the merger.
We will issue or reserve for issuance 50 million newly issued shares of common stock to Calpine stockholders as noted in the Merger Agreement (including shares of our common stock issuable pursuant to Calpine restricted
stock units and other equity-based awards). Based on the number of shares of our common stock as of the transaction announcement date, our current shareholders and former Calpine stockholders would own approximately 85% and 15% of the outstanding shares of Constellation common stock, respectively, immediately following the consummation of the merger. Each current shareholder will remain a shareholder of Constellation with a percentage ownership of the combined company that will be smaller than the shareholder’s percentage of Constellation prior to the merger. As a result of this reduced ownership percentage, our current shareholders will have less influence on the policies of the combined company than they did prior to the transaction.
The merger may not be accretive to earnings and may cause dilution to our earnings per share, which may negatively affect the market price of our common stock.
We currently anticipate that the merger will be accretive to earnings per share in 2026, which is expected to be the first full year following completion of the merger. This expectation is based on preliminary estimates that are subject to change. We may also encounter additional transaction and integration-related costs, may fail to realize all the benefits anticipated in the merger, or be subject to other factors that affect preliminary estimates. Any of these factors could negatively impact our operating results or decrease or delay the expected accretive effect of the merger and contribute to a decrease in the price of our common stock.
We have incurred and will incur significant transaction and merger-related costs, and these costs may be more than anticipated, negatively impacting our operating results.
We have incurred and expect to incur non-recurring costs associated with consummation of the transaction. Most of these costs will be transaction costs, including fees paid to financial and legal advisors related to the merger and related financing arrangements, and employment-related costs, including change-in-control related payments made to certain Calpine executives. We will also incur transition costs related to formulating integration plans. We may incur additional unanticipated costs in the integration of the businesses, which could negatively impact our operating results. We expect that the elimination of costs, as well as the realization of other efficiencies related to the integration of the businesses, will exceed incremental transaction and merger-related costs over time.
We may not realize all the expected benefits of the merger because of integration challenges.
The success of the merger will depend, in part, on our ability to realize all or some of the anticipated benefits from integrating Calpine’s business with our existing businesses. The integration process will be complex, costly and time-consuming. The challenges associated with integrating the operations of Calpine’s business include, among others:
•customer retention risk as well as the inability to finalize certain transactions currently in progress between Calpine and its customers;
•delay in implementation of our business plan for the combined business;
•unanticipated issues or costs in integrating financial, information technology, communications and other systems;
•complexities associated with managing the larger, more complex, combined business;
•potential unknown liabilities and unforeseen expenses, delays or regulatory conditions associated with the merger;
•integrating relationships with industry contacts and business partners;
•possible inconsistencies in standards, controls, procedures and policies, and compensation structures between Calpine and us; and
•performance of Calpine’s generating assets and the costs to operate and maintain them, relative to expectations.
In addition, the companies have operated and, until the completion of the merger, will continue to operate, independently. It is possible that the integration process could result in the disruption of, or the loss of momentum
in, our ongoing businesses or inconsistencies in standards, controls, procedures and policies, which could negatively impact the combined company.
Uncertainties associated with the merger may cause a loss of management personnel and other key employees, which could adversely affect the future business and operations of the combined company.
We are dependent on the experience and industry knowledge of our officers and other key employees to execute our business plans. Our success until the merger and the combined company’s success after the merger will depend in part upon our ability to retain key management personnel and other key employees of both companies. Current and prospective employees may experience uncertainty about their future roles within the combined company following completion of the merger, which may have an adverse effect on our ability to attract or retain key management and other key personnel. Accordingly, no assurance can be given that the combined company will be able to attract or retain key management personnel and other key employees to the same extent that we have previously been able to attract or retain our employees.
The merger may divert significant attention of our management team, which could detract from efforts to meet business goals.
The pursuit of the merger and the preparation for the integration could place a burden on management and internal resources. Any significant diversion of management attention away from ongoing business concerns and any difficulties encountered in the transition and integration process may negatively impact our financial results.
We are obligated to complete the transaction whether or not we have obtained the required funding for closing.
We are funding the transaction using $4.5 billion in cash and by issuing 50 million shares of common stock. While we expect to have cash on hand needed for closing, we would be required to complete the transaction even if we experience a cash shortfall. This could require us to obtain additional financing which may cause us to incur additional costs.
The combined company’s assets, liabilities or results of operations could be negatively impacted by unknown or unexpected events, conditions or actions that might occur at Calpine prior to the closing of the merger.
The Calpine assets, liabilities, business, financial condition, cash flows, operating results and prospects to be acquired or assumed by us in the merger could be negatively impacted before or after the merger closing as a result of previously unknown events or conditions occurring or existing before the merger closes. Adverse changes in Calpine’s business or operations could occur or arise as a result of actions by Calpine, legal or regulatory developments including the emergence or unfavorable resolution of pre-merger loss contingencies, deteriorating general business, market, industry or economic conditions, and other factors both within and beyond the control of Calpine. A significant decline in the value of Calpine assets to be acquired or a significant increase in Calpine liabilities to be assumed could negatively impact the combined company’s future business, operating results, cash flows, financial conditions or prospects. In addition, there could be potential unknown liabilities and unforeseen expenses as a result of the merger, some of which we may not discover during our due diligence or adequately adjust for in our merger arrangements.
We may record goodwill that could become impaired and adversely affect our operating results.
In accordance with GAAP, the merger will be accounted for as a business combination. The assets and liabilities of Calpine will be consolidated in our balance sheet. Any excess of consideration transferred over the fair values of Calpine’s assets and liabilities, if any, will be recorded as goodwill.
The amount of goodwill, which could be material, will be allocated to the appropriate reporting units of the combined company. Pursuant to the Merger Agreement, the stock consideration at the closing will consist of 50 million newly issued shares of Constellation common stock, with no par value. However, the total value of consideration transferred will be determined, in part, based on the market price of the 50 million shares at the closing date. The number of shares we expect to issue in connection with the stock consideration will not be
adjusted for changes in the price of our common stock, which may vary significantly. Any increase in the value of our common stock may be reflected as additional goodwill.
We are required to assess goodwill for impairment at least annually by comparing the fair value of reporting units to the carrying value of those reporting units. A potential impairment could result in a material non-cash charge that would have a material negative impact on our future operating results or financial position.
The merger may be completed on terms different from those contained in the Merger Agreement.
Prior to the completion of the merger, we and Calpine could, by mutual agreement, amend or alter the terms of the Merger Agreement, including with respect to, among other things, the consideration to be received by Calpine stockholders or any covenants or agreements with respect to the parties’ respective operations pending completion of the merger. In addition, we could choose to waive requirements of the Merger Agreement, including some conditions to closing of the merger.
Lawsuits may be filed against us or our Board in connection with the merger. An adverse ruling in any such lawsuit could result in an injunction preventing the completion of the merger and/or substantial costs to us.
Securities class action lawsuits and derivative lawsuits are often brought against public companies that have entered acquisition, merger or other business combination agreements like the Merger Agreement. Even if such a lawsuit is without merit, defending against these claims can result in substantial costs and divert management time and resources. An adverse judgment could result in monetary damages, which could have a negative impact on our liquidity and financial condition.
Although we are not aware of any pending or threatened lawsuits relating to the transactions contemplated by the Merger Agreement, lawsuits arising out of the transactions contemplated by the Merger Agreement could be filed in the future.
One of the conditions to the closing of the merger is that no applicable law of any governmental entity having competent jurisdiction is in effect at the time of closing, which makes the consummation of the merger illegal or otherwise prohibits, restrains or enjoins the consummation of the merger. Consequently, if a plaintiff is successful in obtaining an injunction prohibiting completion of the merger, that injunction may delay or prevent the merger from being completed within the expected timeframe or at all, which may adversely affect our business, financial position and results of operations. Even if such injunction is eventually lifted and the merger is later completed, the resulting delays and costs incurred may continue to affect the combined company following the completion of the merger.
Additionally, there can be no assurance that any of the defendants will be successful in the outcome of any potential lawsuits. The defense or settlement of any lawsuit or claim that remains unresolved at the time the merger is completed may adversely affect the combined company’s business, financial condition, results of operations and cash flows.
| | | | | |
| ITEM 1B. | UNRESOLVED STAFF COMMENTS |
None.Risk Management and Strategy
Constellation has established programs and processes to manage material risks from cybersecurity threats including assessing and identifying existing cybersecurity risks, as well as continuously monitoring for developing risks. Our cybersecurity risk management strategy is established at the executive level and is implemented through our cybersecurity program which deploys risk-based security controls and services to protect our customers, personnel, information and cyber assets. The program aligns enterprise cyber and physical security controls with the National Institute of Standards & Technology (NIST) Cybersecurity Framework (CSF) and other industry standards such as the NERC and NRC cybersecurity standards. Our cybersecurity program is aligned to
the five functions of the NIST Cybersecurity Framework – identify, detect, protect, respond, and recover. Cybersecurity risk is assessed and reported in our enterprise risk management program, which utilizes the Three Lines Model adapted from the Institute of Internal Auditors, for risk management to assign clear risk responsibilities across the enterprise. Through coordination with operational teams, we align on cybersecurity risk classification, categorization, likelihood, and potential impact to the company. At the highest level, our program includes multi-layered oversight by the Board of Directors and Board Committees.
Our cybersecurity and physical security controls are implemented through policies and procedures we utilize for planning, performing, managing, assessing, innovating, and improving our security controls. To protect our information and cyber assets, we implement practices for training and screening of personnel, access management, network defense, asset configuration management, vulnerability assessment (including penetration testing), third-party security, and privacy and information protection. Our defense-in-depth strategy to protect our cyber assets and sensitive information reduces the potential severity and duration of a cybersecurity incident by leveraging security measures across various layers of the enterprise. Cross-functional executive steering committees and peer groups, with business unit and technical stakeholder participation, are maintained to support oversight, security controls development, change management, implementation, evaluation, continuous improvement, and sustainment.
To assist in detecting cybersecurity events, we deploy security logging and monitoring, malicious code detection, and data loss protection tools. If the company is the target of a cybersecurity attack, we have established processes for incident response and crisis management to triage potential incidents, determine severity, contain, and eradicate a threat. These processes require notifications to regulatory and other governmental authorities of cybersecurity events as required by law, including providing notice to investors for material cybersecurity events. To recover our systems and information, we utilize established system recovery plans and business continuity plans.
As part of our process to continuously improve, we utilize our internal audit, risk, and legal functions to evaluate security controls and risk management practices. We also engage third-party subject matter experts to independently assess our programs, processes and technical controls, as needed. For our regulated cyber assets associated with critical infrastructure, such as those within the scope of NERC and the NRC, regulatory auditors and inspectors monitor our adherence to mandatory cybersecurity requirements on a regular frequency using a variety of compliance monitoring and enforcement mechanisms.
Board Governance and Management
Our Board is actively engaged in monitoring the performance of the Company's cybersecurity program and maintains oversight of the Company’s enterprise risk program, including with respect to commodity markets, market design, enterprise security (physical and cyber), operating risks, and financial performance. While the full Board retains ultimate responsibility and oversight of the Company's cybersecurity risk management practices, the Nuclear Oversight Committee and the Audit and Risk Committee also have cybersecurity risk management as part of their charters. The Nuclear Oversight Committee is tasked with overseeing compliance with policies and procedures to manage and mitigate cybersecurity risks associated with our nuclear assets. The Audit and Risk Committee oversees policies and processes established by management to identify, assess, monitor, manage and control technology and cyber risks, among other risks. Our Chief Information Officer (CIO) and Chief Information Security Officer (CISO) provide regular reports to the Board, or one or both of its designated Committees, regarding the security of our operational and information technology programs, systems, and risks. We also report on the state of our cybersecurity program and provide key risk indicators to track performance. Emergent matters or events are reported to the Board between scheduled meetings on an ad hoc basis through our incident response and crisis management protocols.
At the executive and management level, the Chief Administration Officer, via delegations to the Cyber Security organization, is authorized to govern and functionally oversee our security controls and services on behalf of the enterprise. Our cybersecurity organization, under the direction of the CISO who reports to the CIO, implements and provides governance and functional oversight for cybersecurity controls and services, including coordination with our Corporate Security function. Our CIO has over 20 years of experience with information systems, including management roles in operational security, technical design and engineering, and platform architecture cybersecurity, governance and compliance, and business continuity. Our CISO has over 20 years of experience in cybersecurity, governance and compliance, physical security and business continuity. In addition, cybersecurity risk is assessed and tracked through the Company's enterprise risk management program.
Although the risks from cyber threats have not materially affected our business strategy, results of operations, or financial condition to date, we continue to closely monitor cyber risk. Overall, our company has implemented tactical processes for assessing, identifying, and managing material risks from cybersecurity threats to the company including governance at the Board level and accountability in our executive management for the execution of our cyber risk management strategy and the controls designed to protect our operations. See ITEM 1A. RISK FACTORS for additional information regarding the Company’s cybersecurity risks.
The following table presents our interests in net electric generating capacity by station at December 31, 2024:
| | | | | | | | | | | | | | | | | | | | | | | | | | | | | | | | | | | | | | | | | |
Station(a) | | Location | | No. of
Units | | Percent Owned(b) | | Primary
Fuel Type | | Primary Dispatch Type(c) | | Net Generation Capacity (MWs)(d) | |
| Midwest | | | | | | | | | | | | | |
| Braidwood | | Braidwood, IL | | 2 | | | | Uranium | | Baseload | | 2,386 | | |
| Byron | | Byron, IL | | 2 | | | | Uranium | | Baseload | | 2,350 | | |
| LaSalle | | Seneca, IL | | 2 | | | | Uranium | | Baseload | | 2,320 | | |
| Dresden | | Morris, IL | | 2 | | | | Uranium | | Baseload | | 1,845 | | |
| Quad Cities | | Cordova, IL | | 2 | | 75 | | | Uranium | | Baseload | | 1,403 | | |
| Clinton | | Clinton, IL | | 1 | | | | Uranium | | Baseload | | 1,092 | | |
| Michigan Wind 2 | | Sanilac County, MI | | 50 | | 51 | | (e) | Wind | | Intermittent | | 46 | | |
| Beebe | | Gratiot County, MI | | 34 | | 51 | | (e) | Wind | | Intermittent | | 42 | | |
| Michigan Wind 1 | | Huron County, MI | | 46 | | 51 | | (e) | Wind | | Intermittent | | 35 | | |
| Harvest 2 | | Huron County, MI | | 33 | | 51 | | (e) | Wind | | Intermittent | | 30 | | |
| Harvest | | Huron County, MI | | 31 | | 51 | | (e) | Wind | | Intermittent | | 26 | | |
| Beebe 1B | | Gratiot County, MI | | 21 | | 51 | | (e) | Wind | | Intermittent | | 26 | | |
| CP Windfarm | | Faribault County, MN | | 2 | | 51 | | (e) | Wind | | Intermittent | | 2 | | |
| Clinton Battery Storage | | Blanchester, OH | | 1 | | | | Energy Storage | | Peaking | | 5 | | |
| Total Midwest | | | | | | | | | | | | 11,608 | | |
| | | | | | | | | | | | | |
| Mid-Atlantic | | | | | | | | | | | | | |
| Limerick | | Sanatoga, PA | | 2 | | | | Uranium | | Baseload | | 2,315 | | |
| Calvert Cliffs | | Lusby, MD | | 2 | | | | Uranium | | Baseload | | 1,789 | | |
| Peach Bottom | | Delta, PA | | 2 | | 50 | | | Uranium | | Baseload | | 1,324 | | |
| Salem | | Lower Alloways
Creek Township, NJ | | 2 | | 42.59 | | | Uranium | | Baseload | | 989 | | |
| Conowingo | | Darlington, MD | | 11 | | | | Hydroelectric | | Baseload | | 497 | | |
| Criterion | | Oakland, MD | | 28 | | 51 | | (e) | Wind | | Intermittent | | 36 | | |
| Fair Wind | | Garrett County, MD | | 12 | | | | Wind | | Intermittent | | 30 | | |
| Fourmile Ridge | | Garrett County, MD | | 16 | | 51 | | (e) | Wind | | Intermittent | | 20 | | |
| Solar Horizons | | Emmitsburg, MD | | 1 | | 51 | | (e) | Solar | | Intermittent | | 8 | | |
| Solar New Jersey 3 | | Middle Township, NJ | | 4 | | 51 | | (e) | Solar | | Intermittent | | 1 | | |
| Muddy Run | | Drumore, PA | | 8 | | | | Hydroelectric | | Intermediate | | 1,058 | | |
| Eddystone 3, 4 | | Eddystone, PA | | 2 | | | | Oil/Gas | | Peaking | | 760 | | (h) |
| Perryman | | Aberdeen, MD | | 5 | | | | Oil/Gas | | Peaking | | 404 | | (i) |
| Croydon | | West Bristol, PA | | 8 | | | | Oil | | Peaking | | 391 | | |
| Handsome Lake | | Kennerdell, PA | | 5 | | | | Gas | | Peaking | | 268 | | |
| Richmond | | Philadelphia, PA | | 2 | | | | Oil | | Peaking | | 98 | | |
| Philadelphia Road | | Baltimore, MD | | 4 | | | | Oil | | Peaking | | 60 | | |
| | | | | | | | | | | | | | | | | | | | | | | | | | | | | | | | | | | | | | | | | |
Station(a) | | Location | | No. of
Units | | Percent Owned(b) | | Primary
Fuel Type | | Primary Dispatch Type(c) | | Net Generation Capacity (MWs)(d) | |
| Eddystone | | Eddystone, PA | | 4 | | | | Oil | | Peaking | | 60 | | |
| Delaware | | Philadelphia, PA | | 4 | | | | Oil | | Peaking | | 56 | | |
| Southwark | | Philadelphia, PA | | 4 | | | | Oil | | Peaking | | 52 | | |
| Falls | | Morrisville, PA | | 3 | | | | Oil | | Peaking | | 51 | | |
| Moser | | Lower Pottsgrove Township, PA | | 3 | | | | Oil | | Peaking | | 51 | | |
| Chester | | Chester, PA | | 3 | | | | Oil | | Peaking | | 39 | | |
| Schuylkill | | Philadelphia, PA | | 2 | | | | Oil | | Peaking | | 30 | | |
| Total Mid-Atlantic | | | | | | | | | | | | 10,387 | | |
| | | | | | | | | | | | | |
| ERCOT | | | | | | | | | | | | | |
| STP | | Bay City, TX | | 2 | | 44 | | (j) | Uranium | | Baseload | | 1,162 | | |
| Whitetail | | Webb County, TX | | 57 | | 51 | | (e) | Wind | | Intermittent | | 47 | | |
| Sendero | | Jim Hogg and Zapata Counties, TX | | 39 | | 51 | | (e) | Wind | | Intermittent | | 40 | | |
| Colorado Bend II | | Wharton, TX | | 3 | | | | Gas | | Intermediate | | 1,143 | | |
| Wolf Hollow II | | Granbury, TX | | 3 | | | | Gas | | Intermediate | | 1,103 | | |
| Handley 3 | | Fort Worth, TX | | 1 | | | | Gas | | Intermediate | | 375 | | |
| Handley 4, 5 | | Fort Worth, TX | | 2 | | | | Gas | | Peaking | | 870 | | |
| Total ERCOT | | | | | | | | | | | | 4,740 | | |
| | | | | | | | | | | | | |
| New York | | | | | | | | | | | | | |
| NMP | | Scriba, NY | | 2 | | | (f) | Uranium | | Baseload | | 1,675 | | |
| FitzPatrick | | Scriba, NY | | 1 | | | | Uranium | | Baseload | | 842 | | |
| Ginna | | Ontario, NY | | 1 | | | | Uranium | | Baseload | | 576 | | |
| Total New York | | | | | | | | | | | | 3,093 | | |
| | | | | | | | | | | | | |
| Other | | | | | | | | | | | | | |
| Antelope Valley | | Lancaster, CA | | 1 | | | | Solar | | Intermittent | | 242 | | |
| Bluestem | | Beaver County, OK | | 60 | | 51 | | (e)(g) | Wind | | Intermittent | | 101 | | |
| Shooting Star | | Kiowa County, KS | | 65 | | 51 | | (e) | Wind | | Intermittent | | 53 | | |
| Bluegrass Ridge | | King City, MO | | 26 | | 51 | | (e) | Wind | | Intermittent | | 29 | | |
| Conception | | Barnard, MO | | 23 | | 51 | | (e) | Wind | | Intermittent | | 26 | | |
| Cow Branch | | Rock Port, MO | | 24 | | 51 | | (e) | Wind | | Intermittent | | 26 | | |
| Mountain Home | | Glenns Ferry, ID | | 20 | | 51 | | (e) | Wind | | Intermittent | | 21 | | |
| | | | | | | | | | | | | | | | | | | | | | | | | | | | | | | | | | | | | | | | | |
Station(a) | | Location | | No. of
Units | | Percent Owned(b) | | Primary
Fuel Type | | Primary Dispatch Type(c) | | Net Generation Capacity (MWs)(d) | |
| High Mesa | | Elmore County, ID | | 19 | | 51 | | (e) | Wind | | Intermittent | | 20 | | |
| Echo 1 | | Echo, OR | | 21 | | 50.49 | | (e) | Wind | | Intermittent | | 17 | | |
| Sacramento PV Energy | | Sacramento, CA | | 4 | | 51 | | (e) | Solar | | Intermittent | | 15 | | |
| Cassia | | Buhl, ID | | 13 | | 51 | | (e) | Wind | | Intermittent | | 14 | | |
| Wildcat | | Lovington, NM | | 13 | | 51 | | (e) | Wind | | Intermittent | | 14 | | |
| Echo 2 | | Echo, OR | | 9 | | 51 | | (e) | Wind | | Intermittent | | 9 | | |
| Tuana Springs | | Hagerman, ID | | 8 | | 51 | | (e) | Wind | | Intermittent | | 9 | | |
| Greensburg | | Greensburg, KS | | 10 | | 51 | | (e) | Wind | | Intermittent | | 6 | | |
| Threemile Canyon | | Boardman, OR | | 6 | | 51 | | (e) | Wind | | Intermittent | | 5 | | |
| Loess Hills | | Rock Port, MO | | 4 | | | | Wind | | Intermittent | | 5 | | |
| Denver Airport Solar | | Denver, CO | | 1 | | 51 | | (e) | Solar | | Intermittent | | 2 | | |
| Hillabee | | Alexander City, AL | | 3 | | | | Gas | | Intermediate | | 753 | | |
| Wyman 4 | | Yarmouth, ME | | 1 | | 5.9 | | | Oil | | Intermediate | | 35 | | |
| West Medway II | | West Medway, MA | | 2 | | | | Oil/Gas | | Peaking | | 188 | | |
| West Medway | | West Medway, MA | | 3 | | | | Oil | | Peaking | | 123 | | |
| Grand Prairie | | Alberta, Canada | | 1 | | | | Gas | | Peaking | | 105 | | |
| Framingham | | Framingham, MA | | 3 | | | | Oil | | Peaking | | 30 | | |
| Total Other | | | | | | | | | | | | 1,848 | | |
| Total | | | | | | | | | | | | 31,676 | | |
__________
(a)All nuclear stations are boiling water reactors except Braidwood, Byron, Calvert Cliffs, Ginna, Salem, and STP units which are pressurized water reactors.
(b)100%, unless otherwise indicated.
(c)Baseload units are those that normally operate to take all or part of the minimum continuous load of a system and, consequently, produce electricity at an essentially constant rate. Intermittent units are those with output controlled by the natural variability of the energy resource rather than dispatched based on system requirements. Intermediate units are those that normally operate to take load of a system during the daytime higher load hours and, consequently, produce electricity by cycling on and off daily. Peaking units consist of lower-efficiency, quick response steam units, gas turbines and diesels normally used during the maximum load periods.
(d)Net generation capacity is stated at proportionate ownership share. For nuclear stations, capacity reflects the annual mean rating. All other facilities reflect a summer rating.
(e)Reflects the prior sale of 49% of CRP to a third party. See Note 21 — Variable Interest Entities of the Combined Notes to Consolidated Financial Statements for additional information.
(f)We wholly own NMP Unit 1 and have an 82% undivided ownership interest in NMP Unit 2.
(g)CRP owns 100% of the Class A membership interests and a tax equity investor owns 100% of the Class B membership interests of the entity that owns the Bluestem generating assets.
(h)Eddystone units 3 and 4 will be retiring in June 2025.
(i)In July 2024, we submitted a deactivation notice with PJM with intent to deactivate one of the Perryman 6 units (unit 1) with approximately 54.9 MW of installed capacity on or about May 31, 2025.
(j)Within the 44% undivided ownership interest in STP, 2% interest was recorded as held for sale as of December 31, 2024. See Note 2 — Mergers, Acquisitions, and Dispositions of the Combined Notes to Consolidated Financial Statements for additional information.
The net generation capability available for operation at any time may be less due to regulatory restrictions, transmission congestion, fuel restrictions, efficiency of cooling facilities, level of water supplies, or generating units being temporarily out of service for inspection, maintenance, refueling, repairs, or modifications required by regulatory authorities.
We also own EMT, which is a liquefied natural gas import facility located on the Mystic River in Everett, MA. EMT connects to two interstate pipeline systems as well as a local gas utility's distribution system.
We maintain property insurance against loss or damage to our principal plants and properties by fire or other perils, subject to certain exceptions. For additional information on insurance specific to our nuclear facilities, see
Note 18 — Commitments and Contingencies of the Combined Notes to Consolidated Financial Statements. For our insured losses, we are self-insured to the extent that any losses are within the policy deductible or exceed the amount of insurance maintained. Any such losses could have a material adverse effect on our consolidated financial statements.
We are parties to various lawsuits and regulatory proceedings in the ordinary course of business. For information regarding material lawsuits and proceedings, see Note 3 — Regulatory Matters and Note 18 — Commitments and Contingencies of the Combined Notes to Consolidated Financial Statements. Such descriptions are incorporated herein by these references. | | | | | |
| ITEM 4. | MINE SAFETY DISCLOSURES |
Not Applicable.
PART II
| | | | | |
| ITEM 5. | MARKET FOR REGISTRANT’S COMMON EQUITY, RELATED STOCKHOLDER MATTERS AND ISSUER PURCHASES OF EQUITY SECURITIES |
CEG Parent
Our common stock is listed on the Nasdaq (trading symbol: CEG). As of January 31, 2025, there were approximately 66,724 record holders of common stock.
Stock Performance Graph
The performance graph below illustrates a three-year comparison of cumulative total returns based on an initial investment of $100 in CEG Parent common stock, as compared with the S&P 500 Stock Index and the Philadelphia Utility Sector Index (UTY), for the period 2022 through 2024.
This performance chart assumes:
•$100 invested on February 1, 2022, in CEG Parent common stock, the S&P 500 Stock Index, and the UTY, and
•All dividends are reinvested.
| | | | | | | | | | | | | | | | | | | | | | | | |
| Value of Investment |
| 2/1/22 | | | | | | | | | | | 12/31/22 | 12/31/23 | 12/31/24 |
| CEG | $100 | | | | | | | | | | | $175 | $240 | $462 |
| S&P 500 | $100 | | | | | | | | | | | $86 | $108 | $135 |
| UTY | $100 | | | | | | | | | | | $107 | $96 | $116 |
Constellation
As of January 31, 2025, CEG Parent directly held the entire membership interest in Constellation.
Dividends
Our Board of Directors approved a 10% increase in the 2025 quarterly dividend per share compared to the 2024 quarterly dividend per share. The 2025 quarterly dividend will be $0.3878 per share.
The following table sets forth Constellation’s quarterly cash dividends per share paid during 2024 and 2023.
| | | | | | | | | | | | | | | | | | | | | | | | | | | | | | | | | | | | | | | | | | | | |
| 2024 | | 2023 |
Fourth
Quarter | | Third
Quarter | | Second
Quarter | | First
Quarter | | Fourth
Quarter | | Third
Quarter | | Second
Quarter | | First
Quarter |
| $ | 0.3525 | | | $ | 0.3525 | | | $ | 0.3525 | | | $ | 0.3525 | | | $ | 0.2820 | | | $ | 0.2820 | | | $ | 0.2820 | | | $ | 0.2820 | |
First Quarter 2025 Dividend
On February 18, 2025, our Board of Directors declared a regular quarterly dividend of $0.3878 per share on our common stock for the first quarter of 2025. The dividend is payable on Tuesday, March 18, 2025, to shareholders of record as of 5 p.m. Eastern time on Friday, March 7, 2025.
Unregistered Sales of Equity Securities
None.
Issuer Purchases of Equity Securities
Our Board of Directors considers share buybacks to be one of several ways we can provide value to our shareholders through our deployment of capital. The first is to maintain strong investment grade metrics in addition to the pursuit of organic and inorganic growth consistent with our role as a leader in the clean energy transition. Our deployment of capital can also include the repurchase of shares if they can be acquired at attractive prices and increases to our dividend, which currently targets a 10% annual growth rate. We take into account the excise taxes imposed and other administrative costs when assessing our repurchase program. We believe that our share buyback policy is in the best interests of our company and its shareholders and is also consistent with the interests of our other stakeholders.
Since 2023, our Board of Directors authorized the repurchase of up to $3 billion of the Company's outstanding common stock. See Note 19 — Shareholders' Equity of the Combined Notes to Consolidated Financial Statements for additional information regarding our share repurchase program. There were no share repurchases under our share repurchase program during the three months ended December 31, 2024. As of December 31, 2024, there was $991 million of remaining authority to repurchase shares of the Company's outstanding common stock.
| | | | | |
| Item 7. | MANAGEMENT’S DISCUSSION AND ANALYSIS OF FINANCIAL CONDITION AND RESULTS OF OPERATIONS |
(Dollars in millions, unless otherwise noted)Executive Overview
We are a producer of carbon-free energy and a supplier of energy products and services. Our generating capacity includes primarily nuclear, wind, solar, natural gas, and hydroelectric assets. Through our integrated business operations, we sell electricity, natural gas, and other energy-related products and sustainable solutions to various types of customers, including distribution utilities, municipalities, cooperatives, and commercial,
industrial, public sector, and residential customers in markets across multiple geographic regions. We have five reportable segments: Mid-Atlantic, Midwest, New York, ERCOT and Other Power Regions. The following Management’s Discussion and Analysis of Financial Condition and Results of Operations summarizes results for the year ended December 31, 2024 compared to the year ended December 31, 2023. For discussion of the year ended December 31, 2023 compared to the year ended December 31, 2022, refer to ITEM 7. MANAGEMENT'S DISCUSSION AND ANALYSIS OF FINANCIAL CONDITION AND RESULTS OF OPERATIONS in the 2023 Form 10-K, which was filed with the SEC on February 27, 2024.
Significant Transactions and Developments
Proposed Acquisition of Calpine Corporation
On January 10, 2025, we entered an agreement and plan of merger (Merger Agreement) with Calpine Corporation (Calpine) under which we will acquire all the outstanding equity interests of Calpine in a cash and stock transaction. Calpine owns and operates a generation fleet of natural gas, geothermal, battery storage, and solar assets with over 27 GWs of generation capacity, in addition to a competitive retail electric supplier platform serving approximately 2.5 million customers with 60 TWhs of load annually.
This acquisition is complementary to and aligns strategically with our existing business operations and provides both increased scale and meaningful market diversification. We will couple the largest producer of clean, carbon-free energy with the reliable, dispatchable natural gas assets of Calpine, and also create the nation’s leading competitive retail electric supplier, providing increased scale, diversification and complementary capabilities that will enable us to meet growing demand with a broader array of energy and sustainability products. The addition of Calpine will strengthen our essential role in providing clean, reliable, and affordable energy as the nation seeks to transition to a more sustainable future, and will better position us to pursue investments in new and existing technologies to meet growing demand.
Completion of the transaction is conditioned upon review of the transaction by the DOJ, and approval by the FERC, NYPSC, and PUCT, in addition to other regulatory bodies, and is also subject to other customary closing conditions. See Note 2 — Mergers, Acquisitions, and Dispositions of the Combined Notes to Consolidated Financial Statements for additional information.
Crane Clean Energy Center
During the third quarter of 2024, we executed a 20-year PPA with Microsoft that will support the restart of Three Mile Island Unit 1, renamed as the Crane Clean Energy Center, which was retired in 2019 for economic reasons. Under the agreement, Microsoft will purchase the output generated from the renewed plant as part of its goal to help power its data centers in PJM with clean energy. We expect Crane will also be eligible for the technology-neutral clean electricity PTC (45Y) provided for by the IRA for its first 10 years of operations. We estimate the project will require approximately $1.6 billion of cash from operations for capital expenditures necessary to restart the plant, with an estimated in-service date of 2028. The restart of the plant and delivery of electricity under the PPA is subject to certain regulatory approvals, including the NRC comprehensive safety and environmental review, as well as permits from relevant state and local agencies. Additionally, through a separate request, we will pursue obtaining a renewed license that will extend operations at the plant to at least 2054.
Nuclear PTC
Beginning in 2024, our existing nuclear units are eligible for a PTC extending through 2032. The nuclear PTC (45U) provides a transferable credit up to $15 per MWh (a base credit of $3 per MWh with a five times multiplier provided certain prevailing wage requirements are met) and is subject to phase-out when annual gross receipts are between $25.00 per MWh and $43.75 per MWh. We have evaluated and expect to meet the annual prevailing wage requirements at all our nuclear units and are eligible for the five times multiplier. Both the amount of the PTC and the gross receipts thresholds adjust for inflation after 2024 through the duration of the program based on the GDP price deflator for the preceding calendar year. The benefits of the PTC may be realized through a credit against our federal income taxes or transferred via sale to an unrelated party. For the year ended December 31, 2024, our Consolidated Statements of Operations and Comprehensive Income include a nuclear PTC benefit of approximately $2,080 million in Operating revenues. See Note 6 — Government Assistance of the Combined Notes to Consolidated Financial Statements for additional information.
Share Repurchase Program
As part of our capital allocation plan, our Board of Directors has authorized up to $3 billion of share repurchases of our outstanding common stock to-date, of which $991 million has yet to be exercised. See Note 19 — Shareholders' Equity of the Combined Notes to Consolidated Financial Statements for additional information.
Other Key Business Drivers
Russia and Ukraine Conflict
We are closely monitoring developments of the ongoing Russia and Ukraine conflict, including United States, United Kingdom, European Union, and Canadian sanctions, and legislation that may impact exports and imports of Russian nuclear fuel supply and enrichment activities, as well as the potential for Russia to limit fuel deliveries. The U.S. “Prohibiting Russian Uranium Imports Act” became effective in August 2024, banning the import of low-enriched uranium into the U.S. that is produced in Russia or by Russian entities, absent a waiver from the DOE. Under a corollary bill, the Department of Energy has begun the process of distributing billions of dollars that were previously appropriated to support expansion of the domestic nuclear fuel cycle within the United States to improve carbon-free energy security. In November 2024, the Russian government issued a decree imposing temporary restrictions on the export of enriched uranium from Russia to the U.S. but allowing for a special Russian export license to be issued for individual shipments. Our nuclear fuel is obtained predominantly through long-term uranium supply and service contracts. We work with a diverse set of domestic and international suppliers years in advance to procure our nuclear fuel to support our refueling needs regardless of the risk to Russian nuclear fuel supply. Recognizing the potential for the continuing conflict to impact our longer-term security and cost of supply, we have entered into contracts to increase the size of our nuclear fuel inventory. Our fuel procurement activities comply with all U.S. and international trade laws and we continue to take advantage of all available avenues to maintain continuity in our nuclear fuel supply, including working with the U.S. Government and our diverse set of suppliers to secure the nuclear fuel needed to continue to operate our nuclear fleet long-term.
Critical Accounting Policies and Estimates
The preparation of financial statements in conformity with GAAP requires that management apply accounting policies and make estimates and assumptions that affect results of operations and the amounts of assets and liabilities reported in the consolidated financial statements. Management believes that the accounting policies described below require significant judgment in their application or incorporate estimates and assumptions that are inherently uncertain and that may change in subsequent periods. Additional information on the application of these accounting policies can be found in the Combined Notes to Consolidated Financial Statements.
Nuclear Decommissioning Asset Retirement Obligations
The AROs associated with decommissioning our nuclear units were $12.2 billion at December 31, 2024. The authoritative guidance requires that we estimate our obligation for the future decommissioning of our nuclear generating plants. To estimate that liability, we use an internally-developed, probability-weighted, discounted cash flow model which, on a unit-by-unit basis, considers multiple decommissioning outcome scenarios.
Over the past decade, nuclear operators and third-party service providers have continued to obtain more information about costs associated with decommissioning activities. At the same time, regulators are gaining more information about decommissioning activities which could result in changes to existing decommissioning requirements. In addition, over time, it is possible that technological advances will be identified that could create efficiencies and lead to a reduction in decommissioning costs. The amount of NDT funds could also impact the timing of the decommissioning activities. Additionally, certain factors such as changes in regulatory requirements during plant operations or the profitability of a nuclear plant could impact the timing of plant retirements. These factors could result in material changes to our current estimates as more information becomes available and could change the timing of plant retirements and the probability assigned to the decommissioning outcome scenarios.
The nuclear decommissioning obligation is adjusted on a regular basis due to the passage of time and revisions to the key assumptions for the expected timing and/or estimated amounts of the future undiscounted cash flows
required to decommission the nuclear plants, based upon the following methodologies and significant estimates and assumptions:
Decommissioning Cost Studies. We use unit-by-unit decommissioning cost studies to provide a marketplace assessment of the expected costs (in current year dollars) and timing of decommissioning activities, which are validated by comparison to current decommissioning projects within the industry and other estimates. Decommissioning cost studies are updated, on a rotational basis, for each of our nuclear units at least every five years, unless circumstances warrant more frequent updates. As part of the annual cost study update process, we evaluate newly assumed costs or substantive changes in previously assumed costs to determine if the cost estimate impacts are sufficiently material to warrant application of the updated estimates to the AROs across the nuclear fleet outside of the normal five-year rotating cost study update cycle.
Cost Escalation Factors. We use cost escalation factors to escalate the decommissioning costs from the decommissioning cost studies discussed above through the assumed decommissioning period for each of the units. Cost escalation studies, updated on an annual basis, are used to determine escalation factors, and are based on inflation indices for labor, equipment and materials, energy, LLRW disposal, and other costs. All the nuclear AROs are adjusted each year for updated cost escalation factors.
Probabilistic Cash Flow Models. Our probabilistic cash flow models include the assignment of probabilities to various scenarios for decommissioning cost levels, decommissioning approaches, and timing of plant shutdown on a unit-by-unit basis. Probabilities assigned to cost levels include an assessment of the likelihood of costs 20% higher (high-cost scenario) or 15% lower (low-cost scenario) than the base-cost scenario. The assumed decommissioning scenarios generally include the following three alternatives: (1) DECON, which assumes major decommissioning activities begin shortly after the cessation of operation, (2) Shortened SAFSTOR, which generally assumes a 30-year delay prior to onset of major decommissioning activities, and (3) SAFSTOR, which assumes the nuclear facility is placed and maintained in such condition during decommissioning, so that the nuclear facility can be safely stored and subsequently decontaminated within 60 years after cessation of operations. In each decommissioning scenario, spent fuel is transferred to dry cask storage as soon as possible until DOE acceptance for disposal.
The actual decommissioning approach selected will be determined at the time of shutdown and may be influenced by multiple factors including the funding status of the NDT funds at the time of shutdown and regulatory or other commitments.
The plant shutdown timing scenarios consider four alternatives: (1) the probability of early plant retirement, (2) the probability of operating through the original 40-year nuclear license term, (3) the probability of operating through an initial 20-year license renewal term, and (4) the probability of a second 20-year license renewal term. As power market and regulatory environment developments occur, we evaluate and incorporate, as necessary, the impacts of such developments into our nuclear ARO assumptions and estimates.
Our probabilistic cash flow models also include an assessment of the timing of DOE acceptance of SNF for disposal. We currently assume DOE will begin accepting SNF from the industry in 2040. The SNF acceptance date assumption is based on management’s estimates of the amount of time required for DOE to select a site location and develop the necessary infrastructure for long-term SNF storage. For additional information regarding SNF, see Note 18 — Commitments and Contingencies of the Combined Notes to Consolidated Financial Statements.
Discount Rates. The probability-weighted estimated future cash flows for the various assumed scenarios are discounted using our specific credit-adjusted, risk-free rates (CARFR) or a AAA-rated U.S. company proxy CARFR for the units that maintain the ability to collect decommissioning costs from utility customers (former PECO and STP units). We initially recognize an ARO at fair value and subsequently adjust it for changes to estimated costs, timing of future cash flows and modifications to decommissioning assumptions. The ARO is not required or permitted to be re-measured for changes in the CARFR that occur in isolation. Increases in the ARO due to upward revisions in estimated undiscounted cash flows are considered new obligations and are measured using a current CARFR as the increase creates a new cost layer within the ARO. Any decrease in the estimated undiscounted future cash flows relating to the ARO are treated as a modification of an existing ARO cost layer and, therefore, are measured using the average historical CARFR rates used in creating the initial ARO cost layers. If all our future nominal cash flows associated with the ARO were to be discounted at the current prevailing CARFR, the obligation would decrease from approximately $12.2 billion to approximately $11.2 billion.
The following table illustrates the significant impact that changes in the CARFR, when combined with changes in projected amounts and expected timing of cash flows, can have on the valuation of the ARO:
| | | | | |
| Change in the CARFR applied to the annual ARO update | Increase (Decrease) to ARO as of December 31, 2024 |
| 2023 CARFR rather than the 2024 CARFR | $ | (300) | |
| 2024 CARFR increased by 50 basis points | (790) | |
| 2024 CARFR decreased by 50 basis points | 990 | |
ARO Sensitivities. Changes in the assumptions underlying the ARO could materially affect the decommissioning obligation. The impact of a change in any one of these assumptions to the ARO is highly dependent on how the other assumptions may correspondingly change.
The following table illustrates the effects of changing certain ARO assumptions while holding all other assumptions constant:
| | | | | |
| Change in ARO Assumption | Increase (Decrease) to ARO as of December 31, 2024 |
| Cost escalation studies | |
| Uniform increase in escalation rates of 50 basis points | $ | 2,290 | |
| Probabilistic cash flow models | |
| Increase the estimated costs to decommission the nuclear plants by 10 percent | 770 | |
Increase the likelihood of the DECON scenario by 10 percent and decrease the likelihood of the SAFSTOR scenario by 10 percent(a) | 130 | |
Shorten each unit's probability-weighted operating life assumption by 10 percent(b) | 430 | |
| Extend the estimated date for DOE acceptance of SNF to 2045 | (40) | |
__________
(a)Excludes any sites in which management has committed to a specific decommissioning approach.
(b)Excludes Crane and Zion.
See Note 1 — Basis of Presentation and Note 10 — Asset Retirement Obligations of the Combined Notes to Consolidated Financial Statements for additional information regarding accounting for nuclear AROs.
Purchase Accounting
In accordance with authoritative guidance, the assets acquired and liabilities assumed in an acquired business are recorded at their estimated fair values on the date of acquisition. Determining the fair value of assets acquired and liabilities assumed requires management’s judgment, often utilizes independent valuation experts and involves the use of significant estimates and assumptions with respect to the timing and amounts of future cash inflows and outflows, discount rates, market prices and asset lives, among other items. Changes to these estimates and assumptions could result in material changes to the fair value of assets and liabilities as of the acquisition date. The judgments made in the determination of the estimated fair value assigned to the assets acquired and liabilities assumed, as well as the estimated useful life of each asset and the duration of each liability, could significantly impact the financial statements in periods after acquisition, such as through depreciation and amortization expense. Authoritative guidance provides that the allocation of the purchase price may be modified up to one year after the acquisition date as more information is obtained about the fair value of assets acquired and liabilities assumed. See Note 2 — Mergers, Acquisitions, and Dispositions of the Combined Notes to Consolidated Financial Statements for additional information.
The difference between the purchase price amount and the net fair value of assets acquired and liabilities assumed is recognized as goodwill on the balance sheet if the purchase price exceeds the estimated net fair value, or as a bargain purchase gain on the income statement if the purchase price is less than the estimated net fair value. Goodwill is assigned to reporting units that are expected to benefit from the acquisition. Goodwill is not amortized, instead it is subject to an impairment assessment at least annually to consider whether the reporting unit fair value is more likely than not less than the carrying amount. See Note 1 — Basis of Presentation, Note 2 — Mergers, Acquisitions, and Dispositions, and Note 12 — Intangible Assets of the Combined Notes to Consolidated Financial Statements for additional information.
Goodwill
We perform an assessment for impairment of goodwill at least annually or more frequently if an event occurs or circumstances change that would more likely than not reduce the fair value of the reporting units below their carrying amount. A reporting unit is an operating segment or one level below an operating segment (known as a component) and is the level at which goodwill is tested for impairment. Our operating segments and reporting units are Mid-Atlantic, Midwest, New York, ERCOT, and Other Power Regions. See Note 5 — Segment Information of the Combined Notes to Consolidated Financial Statements for additional information on our segments. Goodwill is primarily reported within our ERCOT segment. See Note 12 — Intangible Assets of the Combined Notes to Consolidated Financial Statements for additional information.
We first perform a qualitative assessment to determine whether a quantitative assessment is necessary. As part of the qualitative assessment, we evaluate, among other things, management’s best estimate of projected operating and capital cash flows for the reporting units and changes in certain market conditions, including the discount rate. Significant assumptions used in these fair value analyses include discount and growth rates, energy prices, and projected operating and capital cash flows.
While the 2024 annual assessments indicated no impairments, certain assumptions used in the assessment are highly sensitive to changes. Adverse regulatory actions or changes in significant assumptions could potentially result in future impairments of our goodwill, which could be material.
See Note 1 — Basis of Presentation, Note 2 — Mergers, Acquisitions, and Dispositions, and Note 12 — Intangible Assets of the Combined Notes to Consolidated Financial Statements for additional information.
Unamortized Energy Contract Assets and Liabilities
Unamortized energy contract assets and liabilities represent the remaining unamortized balances of non-derivative energy contracts and fuel contracts that we have acquired. The initial amount recorded represents the difference between the fair value of the contracts at the time of acquisition and the contract value based on the terms of each contract. The unamortized energy contract assets and liabilities are amortized over the life of the contract in relation to the expected realization of the underlying cash flows. Amortization of the unamortized energy and fuel contract assets and liabilities are recorded through Operating revenues or Purchased power and fuel expense, depending on the nature of the underlying contract. See Note 12 — Intangible Assets of the Combined Notes to Consolidated Financial Statements for additional information.
Impairment of Long-Lived Assets
We regularly monitor and evaluate the carrying value of long-lived assets or asset groups for recoverability whenever events or changes in circumstances indicate that the carrying value of those assets may not be recoverable. Indicators of potential impairment may include a deteriorating business climate, including, but not limited to, declines in energy prices, condition of the asset, or plans to dispose of a long-lived asset significantly before the end of its useful life.
The review of long-lived assets or asset groups for impairment utilizes significant assumptions about operating strategies and estimates of future cash flows, which require assessments of current and projected market conditions. Forecasting future cash flows requires assumptions regarding forecasted commodity prices for the sale of power and purchases of fuel and the expected operations of assets. A variation in the assumptions used could lead to a different conclusion regarding the recoverability of an asset or asset group and, thus, could potentially result in material future impairments. An impairment evaluation is based on an undiscounted cash flow analysis at the lowest level at which cash flows of the long-lived assets or asset groups are largely independent of the cash flows of other assets and liabilities. The lowest level of independent cash flows is determined by the evaluation of several factors, including the geographic dispatch of the generating units and the hedging strategies related to those units. The cash flows from our generating units are generally evaluated at a regional portfolio level (asset group), given the interdependency of cash flows generated from the customer supply and risk management activities within each region. In certain cases, our generating assets may be evaluated on an individual basis where those assets are contracted on a long-term basis with a third party and operations are independent of other generating assets (typically contracted renewable generation).
On a quarterly basis, we assess our long-lived assets or asset groups for indicators of potential impairment. If indicators are present for a long-lived asset or asset group, a comparison of the undiscounted expected future cash flows to the carrying value is performed. When the undiscounted cash flow analysis indicates the carrying value of a long-lived asset or asset group may not be recoverable, the amount of the impairment loss is determined by measuring the excess of the carrying amount of the long-lived asset or asset group over its fair value. The fair value of the long-lived asset or asset group is dependent upon a market participant’s view of the exit price of the asset or asset groups. This includes significant assumptions of the estimated future cash flows generated by the asset or asset groups and market discount rates. Events and circumstances often do not occur as expected, resulting in differences between prospective financial information and actual results, which may be material. The determination of fair value is driven by both internal assumptions that include significant unobservable inputs, such as revenue and generation forecasts, projected capital, maintenance expenditures, and discount rates, as well as information from various public, financial and industry sources.
Depreciable Lives of Property, Plant, and Equipment
We have significant investments in electric generating assets. These assets are generally depreciated on a straight-line basis, using the group, composite or unitary methods of depreciation. The group approach is typically for groups of similar assets that have approximately the same useful lives and the composite approach is used for heterogeneous assets that have different lives. Under both methods, a reporting entity depreciates the assets over the average life of the assets in the group. The estimation of asset useful lives requires management judgment, supported by formal depreciation studies of historical asset retirement experience. Depreciation studies are generally conducted periodically if an event, regulatory action, or change in retirement patterns indicate an update is necessary.
Along with depreciation study results, management considers expected future energy market conditions and generation plant operating costs and capital investment requirements in determining the estimated useful lives of our generating facilities and reassesses the reasonableness of estimated useful lives whenever events or changes in circumstances warrant. When a determination has been made that an asset will be retired before the end of its current estimated useful life, depreciation provisions will be accelerated to reflect the shortened estimated useful life, which could have a material unfavorable impact on future results of operations.
Changes in estimated useful lives of electric generating assets could have a significant impact on future results of operations. See Note 1 — Basis of Presentation and Note 8 — Property, Plant, and Equipment of the Combined Notes to Consolidated Financial Statements for information regarding depreciation and estimated useful lives of the property, plant and equipment.
Accounting for Derivative Instruments
We use derivative instruments to manage commodity price risk, foreign currency exchange risk and interest rate risk related to ongoing business operations. Our derivative activities are in accordance with our RMP. See Note 15 — Derivative Financial Instruments of the Combined Notes to Consolidated Financial Statements for additional information.
We account for derivative financial instruments under the applicable authoritative guidance. Determining whether a contract qualifies as a derivative requires that management exercise significant judgment, including assessing market liquidity as well as determining whether a contract has one or more underlying and one or more notional quantities. Changes in management’s assessment of contracts and the liquidity of their markets, and changes in authoritative guidance, could result in previously excluded contracts becoming in scope of new authoritative guidance.
All derivatives are recognized on the balance sheet at their fair value, except for certain derivatives that qualify for, and are elected under, NPNS. Derivatives entered for economic hedging and for proprietary trading purposes are recorded at fair value through earnings. NPNS transactions are not required to be recorded at fair value, but rather on an accrual basis of accounting. Determining whether a contract qualifies for NPNS requires judgment on whether the contract will physically deliver and requires that management ensure compliance with all associated qualification and documentation requirements.
Commodity Contracts. Identification of a commodity contract as an economic hedge requires us to determine that the contract is in accordance with the RMP. We reassess our economic hedges on a regular basis to determine if they continue to be within the guidelines of the RMP.
As a part of the authoritative guidance, we make estimates and assumptions concerning future commodity prices, load requirements, interest rates, the timing of future transactions and their probable cash flows, the fair value of contracts and the expected changes in the fair value in deciding whether to enter derivative transactions, and in determining the initial accounting treatment for derivative transactions. Under the authoritative guidance for fair value measurements, we categorize these derivatives under a fair value hierarchy that prioritizes the inputs to valuation techniques used to measure fair value.
Derivative contracts are traded in both exchange-based and non-exchange-based markets. Exchange-based derivatives that are valued using unadjusted quoted prices in active markets are generally categorized in Level 1 in the fair value hierarchy.
Certain derivative pricing is verified using indicative price quotations available through brokers or over-the-counter, online exchanges. The price quotations reflect the average of the mid-point of the bid-ask spread from observable markets that we believe provide the most liquid market for the commodity. The price quotations are reviewed and corroborated to ensure the prices are observable and representative of an orderly transaction between market participants. Our derivatives are traded predominantly at liquid trading points. The remaining derivative contracts are valued using models that consider inputs such as contract terms, including maturity, and market parameters, and assumptions of the future prices of commodities, interest rates, volatility, credit worthiness and credit spread. For derivatives that trade in liquid markets, such as generic forwards, swaps, and options, the model inputs are generally observable. Such instruments are categorized in Level 2.
For derivatives that trade in less liquid markets with limited pricing information, the model inputs generally would include both observable and unobservable inputs and are categorized in Level 3.
We consider non-performance risk, including credit risk in the valuation of derivative contracts, and both historical and current market data in our assessment of non-performance risk. The impacts of non-performance and credit risk to date have not been material to the consolidated financial statements.
See ITEM 7A. QUANTITATIVE AND QUALITATIVE DISCLOSURES ABOUT MARKET RISK and Note 15 — Derivative Financial Instruments and Note 17 — Fair Value of Financial Assets and Liabilities of the Combined Notes to Consolidated Financial Statements for additional information regarding derivative instruments.
Defined Benefit Pension and Other Postretirement Employee Benefits
The majority of our employees participate in defined benefit pension and OPEB plans we sponsor. Measuring plan obligations and costs involves various factors, including valuation assumptions and inputs and accounting policy elections. When developing the required assumptions, we consider historical information as well as future expectations. The measurement of these benefit obligations and costs is affected by several assumptions including the discount rate, the long-term expected rate of return on plan assets, the anticipated rate of increase of health care costs, our contributions, the rate of compensation increases, and the long-term expected investment rate credited to employees of certain plans, among others. The assumptions are updated annually and during any interim remeasurement.
Pension and OPEB plan assets include U.S. and international equity securities, fixed income securities, and alternative investments such as real assets, private equity, private credit, and hedge funds.
Expected Rate of Return on Plan Assets. To determine the EROA, we consider forecasted future long-term capital market performance, weighted by our target asset class allocations. We calculate the expected return on pension and OPEB plan assets by multiplying the EROA by the MRV of plan assets at the beginning of the year, considering anticipated contributions and benefit payments to be made during the year. The MRV for pension and OPEB plan assets is based on either fair value or a calculated value that systematically and rationally recognizes changes in fair value over multiple years. For the majority of pension plan assets, we use a calculated value that adjusts for 20% of the difference between fair value and expected MRV, resulting in less volatile expected asset returns to be recognized as a component of pension cost from year to year. For OPEB plan assets and certain pension plan assets, we use fair value to calculate the MRV.
Discount Rate. Discount rates are determined by developing a spot rate curve based on the yield to maturity of high-quality non-callable (or callable with make-whole provisions) bonds with similar maturities to the pension and OPEB obligations. These spot rates discount the estimated future benefit distribution amounts for the pension and OPEB plans. The discount rate is the single level rate that matches the spot rate curve. We utilize an analytical tool developed by our actuaries to determine these rates.
Mortality. The mortality assumption includes a base table for the current expectation of life expectancy of the population adjusted by an improvement scale that attempts to anticipate future improvements in life expectancy. Upon remeasurement as of December 31, 2023 and 2024, we utilized the mortality tables and projection scales released by the SOA.
Sensitivity to Changes in Key Assumptions. The following table illustrates the effects of changing certain of the actuarial assumptions reflected above and as discussed in Note 14 — Retirement Benefits of the Combined Notes to Consolidated Financial Statements, while holding all other assumptions constant:
| | | | | | | | | | | | | | | | | | | | | | | | | | | | | | | | | | | |
| Actual Assumption |
| Pension | | OPEB | | Assumption | | Increase / (Decrease) |
| Actuarial Assumption | | | | Pension | | OPEB | | Total |
| Change in 2025 cost: | | | | | | | | | | | |
Discount rate(a) | 5.66 | % | | 5.63 | % | | 0.5 | % | | $ | (13) | | | $ | (1) | | | $ | (14) | |
| 5.66 | % | | 5.63 | % | | (0.5) | % | | 17 | | | 1 | | | 18 | |
| EROA | 6.50 | % | | 6.00 | % | | 0.5 | % | | (38) | | | (3) | | | (41) | |
| 6.50 | % | | 6.00 | % | | (0.5) | % | | 38 | | | 3 | | | 41 | |
| Change in benefit obligation as of December 31, 2024: | | | | | | | | | | | |
Discount rate(a) | 5.66 | % | | 5.63 | % | | 0.5 | % | | (319) | | | (59) | | | (378) | |
| 5.66 | % | | 5.63 | % | | (0.5) | % | | 346 | | | 64 | | | 410 | |
__________(a)Generally, the discount rate will have a larger impact on the pension and OPEB cost and obligation as the rate moves closer to 0%. Therefore, the sensitivities above cannot be extrapolated for larger changes in the discount rate. Additionally, our liability-driven hedging investment strategy for our pension asset portfolio is not reflected in the sensitivities shown, which do not account for the offsetting impact that discount rate changes may have on pension asset returns.
See Note 1 — Basis of Presentation and Note 14 — Retirement Benefits of the Combined Notes to Consolidated Financial Statements for additional information regarding the accounting for the defined benefit pension and OPEB plans.
Taxation
Significant management judgment is required in determining our provision for income taxes, primarily due to the uncertainty related to tax positions taken, as well as deferred tax assets and liabilities and valuation allowances. We account for uncertain income tax positions using a benefit recognition model with a two-step approach, including a more-likely-than-not recognition threshold and a measurement approach based on the largest amount of tax benefit that is greater than 50% likely of being realized upon ultimate settlement. Management evaluates each position based on the technical merits and facts and circumstances of the position, assuming the position will be examined by a taxing authority having full knowledge of all relevant information. Significant judgment is required to determine whether the recognition threshold has been met and, if so, the appropriate amount of tax benefits to be recorded in the consolidated financial statements.
We evaluate quarterly the probability of realizing deferred tax assets by reviewing a forecast of future taxable income and our intent and ability to implement tax planning strategies, if necessary, to realize deferred tax assets. We also assess negative evidence, such as the expiration of historical operating loss or tax credit carryforwards, that could indicate our inability to realize our deferred tax assets. Based on the combined assessment, we record valuation allowances for deferred tax assets when it is more-likely-than-not such benefit will not be realized in future periods.
Actual income taxes could vary from estimated amounts due to the future impacts of various items, including future changes in income tax laws, our forecasted financial condition and results of operations, failure to successfully implement tax planning strategies, as well as results of audits and examinations of filed tax returns by taxing authorities. See Note 13 — Income Taxes of the Combined Notes to Consolidated Financial Statements for additional information.
Accounting for Loss Contingencies
In the preparation of our financial statements, we make judgments regarding the future outcome of contingent events and record liabilities for loss contingencies that are probable and can be reasonably estimated based upon available information. The amount recorded may differ from the actual expense incurred when the uncertainty is resolved and may have a material impact to our consolidated financial statements.
Environmental Costs. Environmental investigation and remediation liabilities are based upon estimates with respect to the number of sites for which we will be responsible, the scope, and cost of work to be performed at each site, the portion of costs that will be shared with other parties, the timing of the remediation work, regulations, and the requirements of local governmental authorities. These matters, if resolved in a manner different from the estimate, could have a material impact to our consolidated financial statements. See Note 18 — Commitments and Contingencies of the Combined Notes to Consolidated Financial Statements for additional information.
Other, Including Personal Injury Claims. For accidents we maintain insurance coverage for general liability, automotive liability, workers’ compensation, and personal injury claims and are self-insured to the extent that losses are within policy deductibles or exceed the amount of insurance maintained. We have reserves for both open claims asserted, and an estimate of claims incurred but not reported (IBNR). The IBNR reserve is estimated based on actuarial assumptions and analysis and is updated annually. Future events, such as the number of new claims to be filed each year, the average cost of disposing of claims, as well as the numerous uncertainties surrounding litigation and possible state and national legislative measures could cause the actual costs to be higher or lower than estimated. Accordingly, these claims, if resolved in a manner different from the estimate, could have a material impact to the consolidated financial statements.
Revenue Recognition
Sources of Revenue and Determination of Accounting Treatment. We earn revenue from various business activities including competitive sales of power, natural gas, and other energy-related products and sustainable solutions.
The accounting treatment for revenue recognition is based on the nature of the underlying transaction and applicable authoritative guidance. We primarily apply the Revenue from Contracts with Customer, Government Assistance, and Derivatives and Hedging guidance to recognize revenue, as discussed in more detail below.
Revenue from Contracts with Customers. We recognize revenues in the period in which the performance obligations within contracts with customers are satisfied, which generally occurs when power, natural gas and other energy-related products and services are provided to the customer. Transactions within the scope of Revenue from Contracts with Customers generally include non-derivative agreements, contracts that are designated as NPNS and spot-market energy commodity sales, including settlements with RTOs and ISOs.
The determination of our retail power and natural gas sales to individual customers is based on systematic readings of customer meters, generally monthly. Energy delivered to customers that has not yet been billed as of the reporting period is estimated and corresponding unbilled revenue is recorded. The measurement of unbilled revenue is based upon individual customer meter readings, forecasted volumes, and applicable rates. See Note 1 — Basis of Presentation and Note 4 — Revenue from Contracts with Customers of the Combined Notes to Consolidated Financial Statements for additional information.
Government Assistance. Our existing nuclear plants are eligible for federal government incentives including transferable tax credits for qualifying electric production volumes. The nuclear PTC is subject to legislative and regulatory changes, which can affect the availability and amount of credits. Repeal or significant reduction or modification of the PTC could have a material impact on our financial performance depending on gross receipts received by our nuclear units each year. Further, the nuclear PTC continues to be the subject of additional
guidance expected to be issued from the U.S. Treasury and IRS that may materially impact the total amount of benefits we receive. Absence of prescriptive guidance requires the application of judgement in determining annual gross receipts, a primary component in the determination of the credit. We closely monitor developments in relevant tax laws and regulations to anticipate and mitigate potential risks. Given that the nuclear PTC is a function of annual gross receipts, quarterly results rely on forecasted gross receipts for the fiscal year. Energy prices are volatile and are impacted by various factors beyond our control. Significant deviations in market prices from those we’ve forecasted could materially impact our quarterly recognition of nuclear PTC revenues as we progress through the calendar year. See ITEM 1. BUSINESS – Price and Supply Risk Management for additional information on how we mitigate market price risk.
See Note 6 — Government Assistance of the Combined Notes to the Consolidated Financial Statements for additional information regarding nuclear PTC.
Derivative Revenues. We record revenues and expenses using the fair value method of accounting, also referred to as mark-to-market method of accounting for transactions that are accounted for as derivatives. These derivative transactions primarily relate to commodity price risk management activities. Mark-to-market revenues and expenses include inception gains or losses on new transactions where the fair value is observable, unrealized gains and losses from changes in the fair value of open contracts, and realized gains and losses.
Financial Results of Operations
GAAP Results of Operations. The following table sets forth our consolidated GAAP Net Income (Loss) Attributable to Common Shareholders for the year ended December 31, 2024 compared to the same period in 2023. For additional information regarding the financial results for the years ended December 31, 2024 and 2023, see the discussions of Results of Operations below.
| | | | | | | | | | | | | | | | | |
| For the Years Ended December 31, | $ Change |
| 2024 | | 2023 | |
| GAAP Net Income (Loss) Attributable to Common Shareholders | $ | 3,749 | | | $ | 1,623 | | | $ | 2,126 | |
Adjusted (non-GAAP) Operating Earnings. We utilize Adjusted (non-GAAP) Operating Earnings (and/or its per share equivalent) in our internal analysis, and in communications with investors and analysts, as a consistent measure for comparing our financial performance and discussing the factors and trends affecting our business. The presentation of Adjusted (non-GAAP) Operating Earnings is intended to complement and should not be considered an alternative to, nor more useful than, the presentation of GAAP Net Income.
The table below provides a reconciliation of GAAP Net Income to Adjusted (non-GAAP) Operating Earnings. Adjusted (non-GAAP) Operating Earnings is not a standardized financial measure and may not be comparable to other companies’ presentations of similarly titled measures.
Unless otherwise noted, the income tax impact of each reconciling adjustment between GAAP Net Income (Loss) Attributable to Common Shareholders and Adjusted (non-GAAP) Operating Earnings is based on the marginal statutory federal and state income tax rates, taking into account whether the income or expense item is taxable or deductible, respectively, in whole or in part. For all adjustments except the NDT fund investment returns, which are included in decommissioning-related activities, the marginal statutory income tax rate was 25.5% and 25.1% for the years ended December 31, 2024 and 2023, respectively. Under IRS regulations, NDT fund investment returns are taxed at different rates for investments if they are in qualified or non-qualified funds. The effective tax rates for the unrealized and realized gains and losses related to NDT funds were 54.8% and 52.4% for the years ended December 31, 2024 and 2023, respectively. The following table provides a reconciliation between GAAP Net Income (Loss) Attributable to Common Shareholders and Adjusted (non-GAAP) Operating Earnings for the year ended December 31, 2024 compared to the same period in 2023.
| | | | | | | | | | | | | | | | | | | | | | | |
| For the Years Ended December 31, |
| 2024 | | 2023 |
| | | Earnings Per Share(a) | | | | Earnings Per Share(a) |
| GAAP Net Income (Loss) Attributable to Common Shareholders | $ | 3,749 | | | $ | 11.89 | | | $ | 1,623 | | | $ | 5.01 | |
Unrealized (Gain) Loss on Fair Value Adjustments (net of taxes $346 and $169, respectively)(b) | (1,026) | | | (3.25) | | | 506 | | | 1.56 | |
| Plant Retirements and Divestitures (net of taxes $9 and $2, respectively) | 28 | | | 0.09 | | | (7) | | | (0.02) | |
Decommissioning-Related Activities (net of taxes $244 and $339, respectively)(c) | (50) | | | (0.16) | | | (183) | | | (0.56) | |
| Pension & OPEB Non-Service (Credits) Costs (net of taxes $2 and $14, respectively) | 5 | | | 0.02 | | | (41) | | | (0.13) | |
Separation Costs (net of taxes $3 and $21, respectively)(d) | 9 | | | 0.03 | | | 62 | | | 0.19 | |
| ERP System Implementation Costs (net of taxes $3 and $6, respectively) | 8 | | | 0.02 | | | 19 | | | 0.06 | |
| Change in Environmental Liabilities (net of taxes $22 and $11, respectively) | 65 | | | 0.21 | | | 33 | | | 0.10 | |
Income Tax-Related Adjustments(e) | (52) | | | (0.17) | | | (9) | | | (0.03) | |
| Acquisition-Related Costs (net of taxes $2 and $3, respectively) | 6 | | | 0.02 | | | 9 | | | 0.03 | |
| Asset Impairments (net of taxes $— and $9, respectively) | — | | | — | | | 62 | | | 0.19 | |
Noncontrolling Interests(f) | (7) | | | (0.02) | | | (40) | | | (0.12) | |
| Adjusted (non-GAAP) Operating Earnings | $ | 2,735 | | | $ | 8.67 | | | $ | 2,034 | | | $ | 6.28 | |
__________(a)Amounts may not sum due to rounding. Earnings per share amount is based on average diluted common shares outstanding of 315 million and 324 million for the years ended December 31, 2024 and 2023, respectively.
(b)Includes mark-to-market on economic hedges, interest rate swaps, and fair value adjustments related to gas imbalances and equity investments.
(c)Reflects all gains and losses associated with NDTs, ARO accretion, ARC depreciation, ARO remeasurement, and impacts of contractual offset for Regulatory Agreement Units.
(d)Represents certain incremental costs related to the separation (system-related costs, third-party costs paid to advisors, consultants, lawyers, and other experts assisting in the separation), including a portion of the amounts billed to us pursuant to the TSA. See Note 1 — Basis of Presentation of the Combined Notes to Consolidated Financial Statements for additional information.
(e)In 2024, primarily reflects the adjustment to deferred income taxes due to changes in forecasted apportionment.
(f)Represents elimination of the noncontrolling interest portion of certain adjustments included above.
Results of Operations
| | | | | | | | | | | | | | | | | |
| 2024 | | 2023 | | $ Change |
| Operating revenues | $ | 23,568 | | | $ | 24,918 | | | $ | (1,350) | |
| Operating expenses | | | | | |
| Purchased power and fuel | 11,419 | | | 16,001 | | | (4,582) | |
| Operating and maintenance | 6,159 | | | 5,685 | | | 474 | |
| Depreciation and amortization | 1,123 | | | 1,096 | | | 27 | |
| Taxes other than income taxes | 586 | | | 553 | | | 33 | |
| Total operating expenses | 19,287 | | | 23,335 | | | (4,048) | |
| Gain (loss) on sales of assets and businesses | 71 | | | 27 | | | 44 | |
| Operating income (loss) | 4,352 | | | 1,610 | | | 2,742 | |
| Other income and (deductions) | | | | | |
| Interest expense, net | (506) | | | (431) | | | (75) | |
| Other, net | 670 | | | 1,268 | | | (598) | |
| Total other income and (deductions) | 164 | | | 837 | | | (673) | |
| Income (loss) before income taxes | 4,516 | | | 2,447 | | | 2,069 | |
| Income tax (benefit) expense | 774 | | | 859 | | | (85) | |
| Equity in income (losses) of unconsolidated affiliates | (4) | | | (11) | | | 7 | |
| Net income (loss) | 3,738 | | | 1,577 | | | 2,161 | |
| Net income (loss) attributable to noncontrolling interests | (11) | | | (46) | | | 35 | |
| Net income (loss) attributable to common shareholders | $ | 3,749 | | | $ | 1,623 | | | $ | 2,126 | |
Year Ended December 31, 2024 Compared to Year Ended December 31, 2023. The variance in Net income (loss) attributable to common shareholders was favorable by $2,126 million primarily due to:
•Favorable net mark-to-market activity and other fair value adjustments;
•Favorable nuclear PTC activity related to the IRA beginning in 2024; and
•Favorable market and portfolio conditions primarily driven by higher realized margins on load contracts and generation-to-load optimization.
The favorable items were partially offset by:
•Higher labor (inclusive of incentives), contracting, and materials;
•Lower unrealized gains resulting from an investment that became a publicly traded company in the second quarter of 2023;
•Unfavorable net realized and unrealized NDT activity; and
•Lower revenue recognized for ZECs delivered under the Illinois ZEC program in prior planning years.
Operating revenues. Our five reportable segments are Mid-Atlantic, Midwest, New York, ERCOT, and Other Power Regions. See Note 5 — Segment Information of the Combined Notes to Consolidated Financial Statements for additional information on these reportable segments.
Wholesale and retail sales of natural gas, as well as sales of other energy-related products and sustainable solutions and other miscellaneous business activities that are not significant to overall results of operations are reported under Other and not allocated to a region.
For the year ended December 31, 2024 compared to 2023, Operating revenues were as follows:
| | | | | | | | | | | | | | | | | | | | | | | |
| | | | | 2024 vs. 2023 |
| 2024 | | 2023 | | $ Change | | % Change(a) |
| Mid-Atlantic | $ | 5,522 | | | $ | 5,138 | | | $ | 384 | | | 7.5 | % |
| Midwest | 4,805 | | | 4,658 | | | 147 | | | 3.2 | % |
| New York | 2,050 | | | 2,021 | | | 29 | | | 1.4 | % |
| ERCOT | 1,550 | | | 1,346 | | | 204 | | | 15.2 | % |
| Other Power Regions | 5,506 | | | 5,851 | | | (345) | | | (5.9) | % |
| Total reportable segment electric revenues | 19,433 | | | 19,014 | | | 419 | | | 2.2 | % |
| Other | 3,819 | | | 4,505 | | | (686) | | | (15.2) | % |
| Mark-to-market gains | 316 | | | 1,399 | | | (1,083) | | | |
| Total Operating revenues | $ | 23,568 | | | $ | 24,918 | | | $ | (1,350) | | | (5.4) | % |
__________(a)% Change in mark-to-market is not a meaningful measure.
Sales and Supply Sources. Our sales and supply sources by region are summarized below:
| | | | | | | | | | | | | | | | | | | | | | | |
| | | | | 2024 vs. 2023 |
| (GWhs) | 2024 | | 2023 | | Change | | % Change |
Nuclear Generation(a) | | | | | | | |
| Mid-Atlantic | 52,898 | | | 53,012 | | | (114) | | | (0.2) | % |
| Midwest | 95,321 | | | 93,768 | | | 1,553 | | | 1.7 | % |
| New York | 25,134 | | | 25,546 | | | (412) | | | (1.6) | % |
| ERCOT | 8,358 | | | 1,721 | | | 6,637 | | | 385.6 | % |
| Total Nuclear Generation | 181,711 | | | 174,047 | | | 7,664 | | | 4.4 | % |
| | | | | | | |
Natural Gas, Oil and Renewables(a) | | | | | | | |
| Mid-Atlantic | 2,137 | | | 2,014 | | | 123 | | | 6.1 | % |
| Midwest | 1,116 | | | 1,024 | | | 92 | | | 9.0 | % |
| | | | | | | |
| ERCOT | 14,778 | | | 16,877 | | | (2,099) | | | (12.4) | % |
| Other Power Regions | 8,692 | | | 8,512 | | | 180 | | | 2.1 | % |
| Total Natural Gas, Oil and Renewables | 26,723 | | | 28,427 | | | (1,704) | | | (6.0) | % |
| | | | | | | |
| Purchased Power | | | | | | | |
Mid-Atlantic | 15,729 | | | 16,509 | | | (780) | | | (4.7) | % |
| Midwest | 928 | | | 984 | | | (56) | | | (5.7) | % |
| | | | | | | |
| ERCOT | 3,249 | | | 5,530 | | | (2,281) | | | (41.2) | % |
| Other Power Regions | 41,077 | | | 44,192 | | | (3,115) | | | (7.0) | % |
| Total Purchased Power | 60,983 | | | 67,215 | | | (6,232) | | | (9.3) | % |
| | | | | | | |
| Total Supply/Sales by Region | | | | | | | |
| Mid-Atlantic | 70,764 | | | 71,535 | | | (771) | | | (1.1) | % |
| Midwest | 97,365 | | | 95,776 | | | 1,589 | | | 1.7 | % |
| New York | 25,134 | | | 25,546 | | | (412) | | | (1.6) | % |
| ERCOT | 26,385 | | | 24,128 | | | 2,257 | | | 9.4 | % |
| Other Power Regions | 49,769 | | | 52,704 | | | (2,935) | | | (5.6) | % |
| Total Supply/Sales by Region | 269,417 | | | 269,689 | | | (272) | | | (0.1) | % |
__________
(a)Includes the proportionate share of output where we have an undivided ownership interest in jointly-owned generating plants.
Nuclear Fleet Capacity Factor. The following table presents nuclear fleet operating data for our plants that reflects our ownership percentage for stations operated by us and excludes Salem and STP, which are operated by PSEG and STPNOC, respectively. The nuclear fleet capacity factor presented in the table is defined as the ratio of the actual output of a unit (or combination of units) over a period of time to its output if the unit had operated at net monthly mean capacity for that time period. We consider capacity factor to be a useful measure to analyze the nuclear fleet performance between periods. We have included the analysis below as a complement to the financial information provided in accordance with GAAP. However, these measures are not a presentation defined under GAAP and may not be comparable to other companies’ presentations or be more useful than the GAAP information provided elsewhere in this report.
| | | | | | | | | | | |
| 2024 | | 2023 |
| Nuclear fleet capacity factor | 94.6 | % | | 94.4 | % |
| Refueling outage days | 230 | | | 256 | |
| Non-refueling outage days | 36 | | | 51 | |
Nuclear PTC. Beginning in 2024, our existing nuclear units are eligible for a PTC extending through 2032. The nuclear PTC provides a transferable credit up to $15 per MWh (a base credit of $3 per MWh with a five times multiplier provided certain prevailing wage requirements are met) and is subject to phase-out when annual gross receipts are between $25.00 per MWh and $43.75 per MWh. We have evaluated and expect to meet the annual prevailing wage requirements at all our nuclear units and are eligible for the five times multiplier. Both the amount of the PTC and the gross receipts thresholds adjust for inflation after 2024 through the duration of the program based on the GDP price deflator for the preceding calendar year. The benefits of the PTC may be realized through a credit against our federal income taxes or transferred via sale to an unrelated party.
Many of the state-sponsored programs (i.e., ZECs and CMCs) providing compensation for the emissions-free attributes of generation from certain of our nuclear units include contractual or other provisions that require us to refund that compensation up to the amount of the nuclear PTC received or pass through the entirety of the nuclear PTC received. See Note 6 — Government Assistance of the Combined Notes to Consolidated Financial Statements for additional information on the nuclear PTC.
ZEC Prices. We are compensated through state programs for the carbon-free attributes of our nuclear generation. The following table includes the average ZEC reference prices ($/MWh) for each of our major regions in which state programs have been enacted. Gross prices reflect the weighted average price for the various delivery periods within the years ended December 31, 2024 and 2023 and may not necessarily reflect prices we ultimately realize as a result of interaction with the nuclear PTC discussed above.
| | | | | | | | | | | | | | | | | | | | | | | |
| | | | | 2024 vs. 2023 |
State (Region)(a) | 2024 | | 2023 | | $ Change | | % Change |
New Jersey (Mid-Atlantic)(b) | $ | 9.98 | | | $ | 9.92 | | | $ | 0.06 | | | 0.6 | % |
Illinois (Midwest)(c) | 5.60 | | | 5.18 | | | 0.42 | | | 8.1 | % |
| New York (New York) | 18.27 | | | 19.05 | | | (0.78) | | | (4.1) | % |
__________
(a)See ITEM 1. BUSINESS, Environmental Matters for additional information on the plants receiving payments through state programs.
(b)The ZEC price is expected to be $10.00/MWh for each delivery period and is subject to an annual update once full year generation is known. Following the latest annual update in August 2024, the ZEC price for the delivery period beginning June 2023 through May 2024 was calculated to be $9.95.
(c)See Note 4 — Revenue from Contracts with Customers of the Combined Notes to Consolidated Financial Statements for additional information on the Illinois ZEC program.
Illinois CMC Price. The price received (paid) for each CMC is determined by the IPA monthly and is based on the accepted CMC bid, less the sum of (a) monthly weighted average PJM Busbar price, (b) ComEd zone capacity price and (c) any federal tax credit or subsidy received by each qualifying plant and is subject to a customer protection cap ($30.30 per MWh for initial delivery period June 2022 through May 2023, $32.50 per MWh for the period June 2023 through May 2024 and $33.43 per MWh for the period June 2024 through May 2025). If the monthly CMC price per MWh calculation results in a net positive value, ComEd will multiply that value by the delivered quantity and pay the total to us. If the CMC price per MWh calculation results in a net negative value, we will multiply this value by the delivered quantity and pay the net value to ComEd. The average
CMC prices per MWh were $8.05 and $4.13 for the years ended December 31, 2024 and 2023, respectively. The average CMC prices may not necessarily reflect prices we ultimately realize as a result of interaction with the nuclear PTC discussed above.
Capacity Prices. We participate in capacity auctions in each of our major regions, except ERCOT which does not have a capacity market. We also incur capacity costs associated with load served, which are factored into customer sales prices. Capacity prices have a material impact on our operating revenues and purchased power and fuel expense. We report capacity on a net monthly basis within each region in either Operating revenues or Purchased power and fuel expense, depending on our net monthly position. The following table presents the average capacity prices ($/MW Day) for each of our major regions. Prices reflect the weighted average prices for the various auction periods within the years ended December 31, 2024 and 2023.
| | | | | | | | | | | | | | | | | | | | | | | |
| | | | | 2024 vs. 2023 |
| Location (Region) | 2024 | | 2023 | | $ Change | | % Change |
| Eastern Mid-Atlantic Area Council (Mid-Atlantic) | $ | 51.89 | | | $ | 69.64 | | | $ | (17.75) | | | (25.5) | % |
| ComEd (Midwest) | 31.09 | | | 48.64 | | | (17.55) | | | (36.1) | % |
| Rest of State (New York) | 106.44 | | | 137.88 | | | (31.44) | | | (22.8) | % |
| Southeast New England (Other) | 581.69 | | | 91.67 | | | 490.02 | | | 534.5 | % |
Electricity Prices. As a producer and supplier of electricity, the price of electricity has a significant impact on our operating revenues and purchased power cost. We report the sale and purchase of electricity in the spot market on a net hourly basis in either Operating revenues or Purchased power and fuel expense within each region, depending on our net hourly position. The price of electricity is impacted by several variables, including but not limited to, the price of fuels, generation resources in the region, weather, ongoing competition, emerging technologies, as well as macroeconomic and regulatory factors. The following table presents an average day-ahead around-the-clock reference price ($/MWh) for the periods presented for each of our major regions and does not necessarily reflect prices we ultimately realized.
| | | | | | | | | | | | | | | | | | | | | | | |
| | | | | 2024 vs. 2023 |
| Location (Region) | 2024 | | 2023 | | $ Change | | % Change |
| PJM West (Mid-Atlantic) | $ | 33.74 | | | $ | 33.06 | | | $ | 0.68 | | | 2.1 | % |
| ComEd (Midwest) | 25.50 | | | 26.64 | | | (1.14) | | | (4.3) | % |
| Central (New York) | 34.12 | | | 26.97 | | | 7.15 | | | 26.5 | % |
| North (ERCOT) | 26.97 | | | 55.15 | | | (28.18) | | | (51.1) | % |
Southeast Massachusetts (Other)(a) | 41.70 | | | 37.35 | | | 4.35 | | | 11.6 | % |
__________
(a)Reflects New England, which comprises the majority of the activity in the Other region.
For the year ended December 31, 2024 compared to 2023, changes in Operating revenues by region were approximately as follows:
| | | | | | | | | | | | | | | | | |
| 2024 vs. 2023 | | |
| $ Change | | % Change(a) | | Description |
| Mid-Atlantic | $ | 384 | | | 7.5 | % | | • favorable estimated nuclear PTC revenue of $515 • favorable retail load revenue of $135 primarily due to higher contracted energy prices; partially offset by • unfavorable wholesale load revenue of ($100) primarily due to lower volumes • unfavorable net ZEC program revenue of ($80) due to estimated refund associated with Nuclear PTC • unfavorable settled economic hedges of ($60) due to settled prices relative to hedged prices |
| | | | | | | | | | | | | | | | | |
| 2024 vs. 2023 | | |
| $ Change | | % Change(a) | | Description |
| Midwest | 147 | | | 3.2 | % | | • favorable estimated nuclear PTC revenue of $1,300; partially offset by • unfavorable net ZEC and CMC program revenue of ($750) due to decrease in ZEC revenue realized and estimated pass through associated with nuclear PTC • unfavorable settled economic hedges of ($205) due to settled prices relative to hedged prices • unfavorable net generation and wholesale load revenue of ($85) primarily due to lower load volumes • unfavorable PJM performance bonuses of ($70) due to absence of favorable adjustment in 2023 associated with the December 2022 weather event |
| New York | 29 | | | 1.4 | % | | • favorable retail load revenue of $155 primarily due to higher load volumes and contracted energy prices • favorable estimated nuclear PTC revenue of $150; partially offset by • unfavorable net ZEC program revenue of ($180) due to estimated refund associated with nuclear PTC and decrease in ZEC price in current planning year • unfavorable settled economic hedges of ($120) due to settled prices relative to hedged prices |
| ERCOT | 204 | | | 15.2 | % | | • favorable settled economic hedges of $150 due to settled prices relative to hedged prices • favorable estimated nuclear PTC revenue of $110; partially offset by • unfavorable retail load revenue of ($100) primarily due to lower contracted energy prices |
| Other Power Regions | (345) | | | (5.9) | % | | • unfavorable wholesale load revenue of ($515) primarily due to lower contracted prices and load volumes; partially offset by • favorable retail load revenue of $200 primarily due to higher contracted energy prices |
| Other | (686) | | | (15.2) | % | | • unfavorable gas revenue, inclusive of settled economic hedges, of ($555) primarily due to lower gas prices • no other individually significant items to note |
Mark-to-market(b) | (1,083) | | | | | • gains on economic hedging activities of $316 in 2024 compared to gains of $1,399 in 2023 |
| Total | $ | (1,350) | | | (5.4) | % | | |
__________
(a)% Change in mark-to-market is not a meaningful measure.
(b)See Note 15 — Derivative Financial Instruments of the Combined Notes to Consolidated Financial Statements for additional information on mark-to-market gains and losses.
Purchased power and fuel. See Operating revenues above for discussion of our reportable segments and hedging strategies and for supplemental statistical data, including sales and supply sources by region, nuclear fleet capacity factor, capacity prices, and electricity prices.
Wholesale and retail natural gas activity, as well as other miscellaneous business activities that are not significant to overall results of operations are reported under Other and are not allocated to a region.
For the year ended December 31, 2024 compared to 2023, Purchased power and fuel expense were as follows:
| | | | | | | | | | | | | | | | | | | | | | | |
| | | | | 2024 vs. 2023 |
| 2024 | | 2023 | | $ Change | | % Change(a) |
| Mid-Atlantic | $ | 2,442 | | | $ | 2,214 | | | $ | 228 | | | 10.3 | % |
| Midwest | 1,603 | | | 1,403 | | | 200 | | | 14.3 | % |
| New York | 597 | | | 770 | | | (173) | | | (22.5) | % |
| ERCOT | 503 | | | 764 | | | (261) | | | (34.2) | % |
| Other Power Regions | 4,238 | | | 4,611 | | | (373) | | | (8.1) | % |
| Total electric purchased power and fuel | 9,383 | | | 9,762 | | | (379) | | | (3.9) | % |
| Other | 2,997 | | | 3,868 | | | (871) | | | (22.5) | % |
| Mark-to-market losses (gains) | (961) | | | 2,371 | | | (3,332) | | | |
| Total purchased power and fuel | $ | 11,419 | | | $ | 16,001 | | | $ | (4,582) | | | (28.6) | % |
__________
(a)% Change in mark-to-market is not a meaningful measure.
For the year ended December 31, 2024 compared to 2023, changes in Purchased power and fuel expense by region were approximately as follows:
| | | | | | | | | | | | | | | | | |
| 2024 vs. 2023 | | |
| $ Change | | % Change(a) | | Description |
| Mid-Atlantic | $ | 228 | | | 10.3 | % | | • unfavorable cost of ($100) associated with purchased power to supply load relative to generation volumes primarily driven by higher prices during peak load periods and higher net transmission costs • unfavorable settlement of economic hedges of ($75) due to settled prices relative to hedged prices |
| Midwest | 200 | | | 14.3 | % | | • unfavorable cost of ($170) associated with purchased power to supply load relative to generation volumes primarily driven by higher net transmission costs • unfavorable nuclear fuel cost of ($55) primarily due to higher amortization rates related to the reversal of the previous decision in 2020 to retire certain sites |
| New York | (173) | | | (22.5) | % | | • favorable settlement of economic hedges of $230 due to settled prices relative to hedged prices |
| ERCOT | (261) | | | (34.2) | % | | • favorable cost of $245 associated with purchased power to supply load relative to generation volumes primarily due to higher generation volumes • favorable settlement of economic hedges of $70 due to settled prices relative to hedged prices |
| Other Power Regions | (373) | | | (8.1) | % | | • favorable purchased power and fuel of $390 primarily due to lower energy prices and load served, partially offset by the expiration of the Mystic COS |
| | | | | | | | | | | | | | | | | |
| 2024 vs. 2023 | | |
| $ Change | | % Change(a) | | Description |
| Other | (871) | | | (22.5) | % | | • favorable net gas purchases, inclusive of settled economic hedges, of $730 primarily due to lower gas prices • favorable purchases in the United Kingdom, inclusive of settled economic hedges, of $95 primarily due to lower energy prices |
Mark-to-market(b) | (3,332) | | | | | • gains on economic hedging activities of $961 in 2024 compared to losses of ($2,371) in 2023 |
| Total | $ | (4,582) | | | (28.6) | % | | |
__________(a)% Change in mark-to-market is not a meaningful measure.
(b)See Note 15 — Derivative Financial Instruments of the Combined Notes to Consolidated Financial Statements for additional information on mark-to-market gains and losses.
The changes in Operating and maintenance expense consisted of the following:
| | | | | |
| 2024 vs. 2023 |
| Increase (Decrease) |
Labor, other benefits, contracting, and materials(a) | $ | 495 | |
| Plant retirements and divestitures | 47 | |
| Change in environmental liabilities | 43 | |
| Decommissioning-related activities | 37 | |
Nuclear refueling outage costs(b) | 6 | |
| Asset impairments | (71) | |
| Separation costs | (90) | |
| |
| |
| |
| |
| |
| |
| |
| |
| Other | 7 | |
| Total increase | $ | 474 | |
__________
(a)Primarily reflects increased employee incentive program costs, driven by stock compensation expense and Company performance exceeding relative metrics, increased headcount, and the acquisition of STP in November 2023.
(b)Includes the co-owned Salem and STP generating units.
Other, net was unfavorable for the year ended December 31, 2024 compared to the same period in 2023, due to activity described in the table below:
| | | | | | | | | | | |
| Income (Deductions) |
| For the Years Ended December 31, |
| 2024 | | 2023 |
Decommissioning-related activities(a) | $ | 567 | | | $ | 803 | |
| Non-service net periodic benefit credit (cost) | (8) | | | 54 | |
| Net realized and unrealized gains (losses) from equity investments | 11 | | | 307 | |
| | | |
| Other | 100 | | | 104 | |
| Other, net | $ | 670 | | | $ | 1,268 | |
__________(a)Includes net realized and net unrealized gains (losses) on NDT fund investments, the elimination of decommissioning-related activities, and the elimination of income taxes related to all NDT fund activity for the Regulatory Agreement Units. See Note 10 — Asset Retirement Obligations and Note 22 — Supplemental Financial Information of the Combined Notes to Consolidated Financial Statements for additional information.
Effective income tax rates were 17.1% and 35.1% for the years ended December 31, 2024 and 2023, respectively. The change in effective tax rate in 2024 compared 2023 is primarily attributable to the inclusion of nuclear PTCs which are non-taxable. See Note 13 — Income Taxes of the Combined Notes to Consolidated Financial Statements for additional information.
Liquidity and Capital Resources
For discussion of the year ended December 31, 2023 compared to the year ended December 31, 2022, refer to Liquidity and Capital Resources of MANAGEMENT'S DISCUSSION AND ANALYSIS OF FINANCIAL CONDITION AND RESULTS OF OPERATIONS in the 2023 Form 10-K which was filed with the SEC on February 27, 2024.
All results included throughout the liquidity and capital resources section are presented on a GAAP basis.
Our operating and capital expenditures requirements are provided by internally generated cash flows from operations, the sale of certain receivables, as well as funds from external sources in the capital markets and through bank borrowings. Our business is capital intensive and requires considerable capital resources. We annually evaluate our financing plan and credit line sizing, focusing on maintaining our investment grade ratings while meeting our cash needs to fund capital requirements, including construction expenditures, retire debt, pay dividends, fund pension and OPEB obligations, and invest in new and existing ventures. A broad spectrum of financing alternatives beyond the core financing options can be used to meet our needs and fund growth, including monetizing assets in the portfolio via project financing, asset sales, and the use of other financing structures (e.g., joint ventures, minority partners, etc.). Our access to external financing on reasonable terms depends on our credit ratings and current overall capital market business conditions. If these conditions deteriorate to the extent that we no longer have access to the capital markets at reasonable terms, we have access to credit facilities with aggregate bank commitments of $9 billion. We utilize our credit facilities to support our commercial paper programs, provide for other short-term borrowings and to issue letters of credit. See the “Credit Matters and Cash Requirements” section below for additional information. We expect cash flows to be sufficient to meet operating expenses, financing costs, and capital expenditure requirements. See Note 16 — Debt and Credit Agreements of the Combined Notes to Consolidated Financial Statements for additional information.
Cash Flows from Operating Activities
Our cash flows from operating activities include the sale of energy, energy-related products, and sustainable solutions, as well as sales of nuclear PTCs. Our future cash flows from operating activities may be affected by future demand for, and market prices of, energy and our ability to continue to produce and supply power at competitive costs, as well as to obtain collections from customers.
The following table provides a summary of the change in cash flows from operating activities for the years ended December 31, 2024 and 2023:
| | | | | | | | | | | | | | | | | |
| For the Years Ended December 31, | | |
| Cash flows from operating activities | 2024 | | 2023 | | $ Change |
| Net income (loss) | $ | 3,738 | | | $ | 1,577 | | | $ | 2,161 | |
| Adjustments to reconcile net income (loss) to cash: | | | | | |
| Collateral received (posted), net | 1,803 | | | (1,491) | | | 3,294 | |
| Option premiums received (paid), net | 216 | | | 26 | | | 190 | |
| Pension and non-pension postretirement benefit contributions | (184) | | | (54) | | | (130) | |
Changes in working capital and other noncurrent assets and liabilities(a) | (9,168) | | | (8,355) | | | (813) | |
| | | | | |
Total non-cash operating activities(b) | 1,131 | | | 2,996 | | | (1,865) | |
| Net cash flows provided by (used in) operating activities | $ | (2,464) | | | $ | (5,301) | | | $ | 2,837 | |
__________
(a)Includes changes in Accounts receivable, Inventories, Accounts payable and accrued expenses, Income taxes, and Other assets and liabilities.
(b)See the Consolidated Statements of Cash Flows for details of non-cash operating activities, includes Depreciation, amortization, and accretion, Asset impairments, Gain on sale of assets and businesses, Deferred income taxes and amortization of ITCs, Net fair value changes related to derivatives, and Net realized and unrealized activity associated with NDTs and equity investments. See Note 22 — Supplemental Financial Information of the Combined Notes to Consolidated Financial Statements for additional information on the Other non-cash operating activities line.
Changes in our cash flows from operations were generally consistent with changes in results of operations, as adjusted by changes in working capital in the normal course of business, except as discussed below. Significant operating cash flow impacts for 2024 and 2023 were as follows:
•In 2024, $1,570 million of cash was received related to the sale of nuclear PTCs. See Note 6 — Government Assistance of the Combined Notes to Consolidated Financial Statements for additional information.
•Depending upon whether we are in a net mark-to-market liability or asset position, collateral may be required to be posted with or collected from our counterparties, respectively. In addition, the collateral posting and collection requirements differ depending on whether the transactions are on an exchange or in the over-the-counter markets. See Note 15 — Derivative Financial Instruments of the Combined Notes to Consolidated Financial Statements for additional information on collateral.
•Option premiums received (paid), net relate to options contracts that we purchase and sell as part of our established policies and procedures to manage risks associated with market fluctuations in commodity prices. Note 15 — Derivative Financial Instruments of the Combined Notes to Consolidated Financial Statements for additional information on derivative contracts.
•Increase in cash outflows for pension and non-pension postretirement benefit contributions is primarily due to our annual qualified pension contribution of $161 million and $21 million made in February 2024 and July 2023, respectively. See Note 14 — Retirement Benefits of the Combined Notes to Consolidated Financial Statements for additional information on pension and non-pension postretirement benefit plans.
•A net increase in cash outflows for changes in working capital and other noncurrent assets and liabilities primarily driven by an increase in cash collections applied to the Deferred Purchase Price (DPP) partially offset by an increase in liabilities associated with state-sponsored programs requiring refund or pass through of the nuclear PTC, as well as price changes related to natural gas purchases in 2024. See Note 7 — Accounts Receivable of the Combined Notes to Consolidated Financial Statements for additional information on the sales of customer accounts receivable.
Cash Flows from Investing Activities
The following table provides a summary of the change in cash flows from investing activities for the years ended December 31, 2024 and 2023:
| | | | | | | | | | | | | | | | | |
| For the Years Ended December 31, | | |
| Cash flows from investing activities | 2024 | | 2023 | | $ Change |
| Collection of DPP, net | $ | 10,217 | | | $ | 7,340 | | | $ | 2,877 | |
| Acquisitions of assets and businesses | (32) | | | (1,690) | | | 1,658 | |
| | | | | |
| Investment in NDT funds, net | (277) | | | (228) | | | (49) | |
| Capital expenditures | (2,565) | | | (2,422) | | | (143) | |
| Other investing activities | 85 | | | 31 | | | 54 | |
| Net cash flows provided by (used in) investing activities | $ | 7,428 | | | $ | 3,031 | | | $ | 4,397 | |
Significant investing cash flow impacts for 2024 and 2023 were as follows:
•Collection of DPP, net increased primarily due to the increased cash collections applied to DPP as a result of a decrease in the drawn Facility balance in 2024 compared to 2023. In addition, more cash collections were reinvested in the Facility in 2024. See Note 7 — Accounts Receivable of the Combined Notes to Consolidated Financial Statements for additional information.
•See Note 2 — Mergers, Acquisitions, and Dispositions of the Combined Notes to Consolidated Financial Statements for additional information related to the STP acquisition in November 2023.
•Variances in capital expenditures are primarily due to the timing of cash payments for capital projects. See the "Credit Matters and Cash Requirements" section below for additional information on projected capital expenditure spending.
Cash Flows from Financing Activities
The following table provides a summary of the change in cash flows from financing activities for the years ended December 31, 2024 and 2023:
| | | | | | | | | | | | | | | | | |
| For the Years Ended December 31, | | |
| Cash flows from financing activities | 2024 | | 2023 | | $ Change |
| | | | | |
| Long-term debt, net | $ | 799 | | | $ | 3,027 | | | $ | (2,228) | |
| Changes in short-term borrowings, net | (1,644) | | | 485 | | | (2,129) | |
| Dividends paid on common stock | (444) | | | (366) | | | (78) | |
| Repurchases of common stock | (999) | | | (992) | | | (7) | |
| | | | | |
| | | | | |
| | | | | |
| Other financing activities | (1) | | | 42 | | | (43) | |
| Net cash flows provided by (used in) financing activities | $ | (2,289) | | | $ | 2,196 | | | $ | (4,485) | |
Significant financing cash flow impacts for 2024 and 2023 were as follows:
•Long-term debt, net varies due to debt issuances and redemptions each year. Refer to the Debt Issuances and Redemptions tables below for additional information.
•Changes in short-term borrowings, net is driven by repayments on and issuances of notes due in less than 365 days. Refer to Note 16 — Debt and Credit Agreements of the Combined Notes to Consolidated Financial Statements for additional information.
•Refer to ITEM 5. — MARKET FOR REGISTRANT'S COMMON EQUITY, RELATED STOCKHOLDER MATTERS AND ISSUER PURCHASES OF EQUITY SECURITIES for additional information on dividends. See below for quarterly dividends declared.
•Repurchases of common stock is related to our share repurchase program that commenced in March 2023. See Note 19 — Shareholders' Equity of the Combined Notes to Consolidated Financial Statements for additional information.
Debt Issuances and Redemptions
See Note 16 — Debt and Credit Agreements of the Combined Notes to Consolidated Financial Statements for additional information on our long-term debt. Debt activity for 2024 and 2023 was as follows:
During 2024, the following long-term debt was issued (redeemed):
| | | | | | | | | | | | | | | | | | | | | | |
| Type | | Interest Rate | | Maturity | | Amount | | |
Green Senior Notes(a) | | 5.75 | % | | March 2054 | | $ | 900 | | | |
Energy Efficiency Project Financing(b) | | 2.20% - 5.51% | | March 2025 - April 2028 | | 21 | | | |
| | | | | | | | |
| CR Nonrecourse Debt | | 3-month SOFR + 2.25% (c) | | December 2027 | | (22) | | | |
| Continental Wind Nonrecourse Debt | | 6.00 | % | | February 2033 | | (28) | | | |
| West Medway II Nonrecourse Debt | | 1-month SOFR + 3.225% | | March 2026 | | (36) | | | |
| Antelope Valley DOE Nonrecourse Debt | | 2.29% - 3.56% | | January 2037 | | (26) | | | |
| RPG Nonrecourse Debt | | 4.11 | % | | March 2035 | | (9) | | | |
| Total long-term debt issued (redeemed) | | | | | | $ | 800 | | | |
__________
(a)The Green Senior Notes were issued to finance or refinance, in whole or in part, one or more new or existing Eligible Projects. Eligible Projects are defined as investments and expenditures made by us in the 24 months prior to or after the issuance of the notes within the following eligible green categories: clean generation fleet, clean hydrogen, energy storage, and clean commercial offerings.
(b)Energy Efficiency Project Financing represents funding to install energy conservation measures. The maturity dates represent the expected date of project completion, upon which the respective customer assumes the outstanding debt.
(c)The interest rate for long-term debt redemptions prior to July 2024 were based on SOFR + 2.76%. Beginning in July 2024 these redemptions are based on SOFR + 2.25%.
During 2023, the following long-term debt was issued (redeemed):
| | | | | | | | | | | | | | | | | | | | | | | |
| Type | | Interest Rate | | Maturity | | Amount | |
| 2053 Senior Notes | | 6.50 | % | | October 2053 | | $ | 900 | | |
| 2028 Senior Notes | | 5.60 | % | | March 2028 | | 750 | | |
| 2033 Senior Notes | | 5.80 | % | | March 2033 | | 600 | | |
| 2034 Senior Notes | | 6.13 | % | | January 2034 | | 500 | | |
| Tax-Exempt Notes Reoffering | | 4.10% - 4.45% | | 2025 - 2053(a) | | 435 | | |
Energy Efficiency Project Financing(b) | | 2.20% - 4.96% | | March 2024 - June 2024 | | 11 | | |
| Energy Efficiency Project Financing | | 2.44% - 6.96% | | May 2023 - March 2024 | | (44) | | |
| CR Nonrecourse Debt | | 3-month SOFR + 2.76%(c) | | December 2027 | | (39) | | |
| West Medway II Nonrecourse Debt | | 1-month SOFR + 2.975% - 3.225%(d)(e) | | March 2026 | | (26) | | |
| Continental Wind Nonrecourse Debt | | 6.00 | % | | February 2033 | | (25) | | |
| Antelope Valley DOE Nonrecourse Debt | | 2.29% - 3.56% | | January 2037 | | (25) | | |
| RPG Nonrecourse Debt | | 4.11 | % | | March 2035 | | (9) | | |
| Total long-term debt issued (redeemed) | | | | | | $ | 3,028 | | |
__________
(a)The Tax-exempt notes have a maturity date of March 2025 - April 2053, and a mandatory purchase date that ranges from March 2025 - June 2029.
(b)For Energy Efficiency Project Financing, the maturity dates represent the expected date of project completion, upon which the respective customer assumes the outstanding debt.
(c)The interest rate for long-term debt redemptions prior to June 2023 were based on LIBOR + 2.50%. Beginning in June 2023, these redemptions are based on SOFR + 2.76%. See Note 16 — Debt and Credit Agreements of the Combined Notes to Consolidated Financial Statements for additional information on the CR nonrecourse debt.
(d)The interest rate for long-term debt redemptions prior to May 2023 were based on LIBOR + 2.875%. Beginning in May 2023, these redemptions are based on SOFR + the variable interest rate of 2.975% - 3.225%. See Note 16 — Debt and Credit Agreements of the Combined Notes to Consolidated Financial Statements for additional information on the West Medway II nonrecourse debt.
(e)The nonrecourse debt has an average blended interest rate.
Dividends
Quarterly dividends declared by our Board of Directors during 2024 and for the first quarter of 2025 were as follows:
| | | | | | | | | | | | | | | | | | | | | | | | | | |
| Period | | Declaration Date | | Shareholder of Record Date | | Dividend Payable Date | | Cash per Share |
| First Quarter of 2024 | | February 26, 2024 | | March 8, 2024 | | March 19, 2024 | | $ | 0.3525 | |
| Second Quarter of 2024 | | May 1, 2024 | | May 29, 2024 | | June 10, 2024 | | $ | 0.3525 | |
| Third Quarter of 2024 | | July 30, 2024 | | August 12, 2024 | | September 6, 2024 | | $ | 0.3525 | |
| Fourth Quarter of 2024 | | November 1, 2024 | | November 15, 2024 | | December 6, 2024 | | $ | 0.3525 | |
| First Quarter of 2025 | | February 18, 2025 | | March 7, 2025 | | March 18, 2025 | | $ | 0.3878 | |
Credit Matters and Cash Requirements
We fund liquidity needs for capital expenditures, working capital, energy hedging and other financial commitments through cash flows from operations, public debt offerings, commercial paper markets and large, diversified credit facilities. As of December 31, 2024, we have access to facilities with aggregate bank commitments of $9 billion. We had access to the commercial paper markets and had availability under our revolving credit facilities during 2024 to fund our short-term liquidity needs, when necessary. We routinely review the sufficiency of our liquidity position, including appropriate sizing of credit facility commitments, by performing various stress test scenarios, such as commodity price movements, increases in margin-related transactions, changes in hedging levels, and the impacts of hypothetical credit downgrades. We closely monitor events in the financial markets and the financial institutions associated with the credit facilities, including monitoring credit ratings and outlooks, credit default swap levels, capital raising, and merger activity. See PART I, ITEM 1A. RISK FACTORS for additional information regarding the effects of uncertainty in the capital and credit markets.
We believe our cash flow from operating activities, access to credit markets and our credit facilities provide sufficient liquidity to support the estimated future cash requirements discussed below, including the cash consideration necessary to close on our proposed acquisition of Calpine. See Note 2 — Mergers, Acquisitions, and Dispositions of the Combined Notes to Consolidated Financial Statements for additional information.
Security Ratings
Our access to the capital markets, including the commercial paper market, and our financing costs in those markets, may depend on our securities ratings. A loss of investment grade credit rating would have required a three-notch downgrade by S&P or Moody's from their current levels as of December 31, 2024 of BBB+ and Baa1, to BB+ and Ba1 or below, respectively. As of December 31, 2024, we had $6.7 billion of available capacity under our credit facilities and $3 billion of cash on hand. In the event of a credit downgrade below investment grade and a resulting requirement to provide incremental collateral exceeding available capacity under our credit facilities and cash on hand, we would be required to access additional liquidity through the capital markets. Our borrowings are not subject to default or prepayment as a result of a downgrade of our securities, although such a downgrade could increase fees and interest charges under our credit agreements. Our credit ratings were affirmed following the announcement of our proposed acquisition of Calpine.
If we had lost our investment grade credit ratings as of December 31, 2024, we would have been required to provide incremental collateral estimated to be approximately $1.9 billion to meet collateral obligations for derivatives, non-derivatives, NPNS, and applicable payables and receivables, net of the contractual right of offset under master netting agreements.
See Note 15 — Derivative Financial Instruments and Note 16 — Debt and Credit Agreements of the Combined Notes to Consolidated Financial Statements for additional information.
Capital Expenditures
Our most recent estimate of capital expenditures is approximately $3 billion and $3.5 billion for 2025 and 2026, respectively. Approximately 35% of projected capital expenditures are for the acquisition of nuclear fuel, which includes additional nuclear fuel to increase inventory levels in response to the potential for the continuing Russia and Ukraine conflict to impact our long-term nuclear fuel supply. Additionally, the above estimates of capital expenditures includes $1.7 billion of growth capital expenditures, including our planned restart of Crane, nuclear uprates, behind-the-meter infrastructure, and license renewals. The remaining amounts primarily reflect additions and upgrades to existing generation facilities (including material condition improvements during nuclear refueling outages). See ITEM 7. MANAGEMENT'S DISCUSSION AND ANALYSIS OF FINANCIAL CONDITION AND RESULTS OF OPERATIONS, Other Key Business Drivers for more information on the Russia and Ukraine conflict.
Planned additions and upgrades and other investments are subject to periodic review and revision to reflect changes in economic conditions impacting our generating assets and other factors, including, but not limited to, market power prices, results of capacity auctions, potential legislative and regulatory actions, impacts of inflation, changes in the cost of materials and labor, and financing costs.
We anticipate funding these capital expenditures with a combination of internally generated funds and borrowings.
Pension and Other Postretirement Benefits
We consider various factors when making qualified pension funding decisions, including actuarially determined minimum contribution requirements under ERISA, contributions required to avoid benefit restrictions and at-risk status as defined by the Pension Protection Act, and management of the pension obligation. The Pension Protection Act requires the attainment of certain funding levels to avoid benefit restrictions (such as an inability to pay lump sums or to accrue benefits prospectively) and at-risk status (which triggers higher minimum contribution requirements and participant notification). The contributions in the table below reflect a funding strategy to make levelized annual contributions to offset the growth of the liability. Unlike the qualified pension plans, our non-qualified pension plans are not subject to statutory minimum contribution requirements.
OPEB plans are also not subject to statutory minimum contribution requirements, though we have funded a portion of our plans. Annually, we evaluate whether additional funding for those plans is needed.
Expected contributions in 2025 or future years could be affected by adjustments in our pension and OPEB funding strategy, market conditions, or pension regulation changes. See Note 14 — Retirement Benefits of the Combined Notes to Consolidated Financial Statements for additional information on pension and OPEB contributions.
Cash Requirements for Other Financial Commitments
The following table summarizes our projected cash payments as of December 31, 2024 under existing financial commitments with fixed or minimum payments required:
| | | | | | | | | | | | | | | | | | | | | | | |
| 2025 | | Beyond 2025 | | Total | | Time Period |
| Long-term debt | $ | 1,028 | | | $ | 7,446 | | | $ | 8,474 | | | 2025 - 2054 |
Interest payments on long-term debt(a) | 438 | | | 5,805 | | | 6,243 | | | 2025 - 2054 |
Operating leases(b) | 58 | | | 409 | | | 467 | | | 2025 - 2056 |
Purchase power obligations(c) | 891 | | | 1,056 | | | 1,947 | | | 2025 - 2036 |
Fuel purchase agreements(d) | 1,381 | | | 8,630 | | | 10,011 | | | 2025 - 2040 |
Other purchase obligations(e) | 1,400 | | | 1,992 | | | 3,392 | | | 2025 - 2057 |
| SNF obligation | — | | | 1,366 | | | 1,366 | | | 2025 - 2040 |
Pension contributions(f) | 163 | | | 701 | | | 864 | | | 2025 - 2030 |
| Total cash requirements | $ | 5,359 | | | $ | 27,405 | | | $ | 32,764 | | | |
__________
(a)Interest payments are estimated based on final maturity dates of debt securities outstanding at December 31, 2024 and do not reflect anticipated future refinancing, early redemptions, or debt issuances. Variable rate interest obligations are estimated based on rates as of December 31, 2024.
(b)Capacity payments associated with contracted generation lease agreements are net of sublease and capacity offsets of $47 million and $230 million for 2025 and beyond 2025, respectively and $277 million in total.
(c)Purchase power obligations primarily include expected payments for REC purchases and capacity payments associated with contracted generation agreements, which may be reduced based on plant availability. Expected payments exclude payments on renewable generation contracts that are contingent in nature.
(d)Represents commitments to purchase nuclear fuel and related services and natural gas-related transportation and capacity.
(e)Represents the future estimated value at December 31, 2024 of the cash flows associated with all contracts, both cancellable and non-cancellable, entered into with third parties for the provision of services and materials, entered into in the normal course of business not specifically reflected elsewhere in this table. These estimates are subject to significant variability from period to period.
(f)These amounts represent our expected contributions to our qualified pension plans.
See Note 18 — Commitments and Contingencies of the Combined Notes to Consolidated Financial Statements for additional information of our other commitments potentially triggered by future events. Additionally, see below for where to find additional information regarding the financial commitments in the table above in the Combined Notes to Consolidated Financial Statements.
| | | | | | | | |
| Item | | Location within Combined Notes to Consolidated Financial Statements |
| Long-term debt | | Note 16 — Debt and Credit Agreements |
| Interest payments on long-term debt | | Note 16 — Debt and Credit Agreements |
| Operating leases | | Note 11 — Leases |
| SNF obligation | | Note 18 — Commitments and Contingencies |
| Pension contributions | | Note 14 — Retirement Benefits |
Sales of Customer Accounts Receivable
We had an accounts receivable financing facility with a number of financial institutions and a commercial paper conduit to sell certain receivables. The facility was amended effective December 31, 2024 resulting in an increased funding limit secured by certain receivables. See Note 7 — Accounts Receivable and Note 16 — Debt and Credit Agreements of the Combined Notes to Consolidated Financial Statements for additional information.
Project Financing
Project financing is based upon a nonrecourse financial structure, in which project debt is paid back from the cash generated by a specific asset or portfolio of assets. Borrowings under these agreements are secured by the assets and equity of each respective project. Lenders do not have recourse against us in the event of a default. If
a project financing entity does not maintain compliance with its specific debt covenants, there could be a requirement to accelerate repayment of the associated debt or other project-related borrowings earlier than the stated maturity dates. In these instances, if such repayment were not satisfied, or restructured, the lenders or security holders would generally have rights to foreclose against the project-specific assets and related collateral. The potential requirement to repay the debt or other borrowings earlier than otherwise anticipated could lead to impairments due to a higher likelihood of disposing of the respective project-specific assets significantly before the end of their useful lives. See Note 16 — Debt and Credit Agreements of the Combined Notes to Consolidated Financial Statements for additional information on project finance credit facilities and nonrecourse debt.
Credit Facilities
We meet our short-term liquidity requirements primarily through the issuance of commercial paper. We may use our credit facilities for general corporate purposes, including meeting short-term funding requirements and the issuance of letters of credit. See Note 16 — Debt and Credit Agreements of the Combined Notes to Consolidated Financial Statements for additional information on our credit facilities.
Capital Structure
At December 31, 2024, our capital structure consisted of the following:
| | | | | |
| Percentage of Capital Structure |
| |
| Long-term debt | 38 | % |
| |
| Member’s equity | 62 | % |
| |
NRC Minimum Funding Requirements
NRC regulations require that licensees of nuclear generating facilities demonstrate reasonable assurance that sufficient funds will be available in certain minimum amounts for radiological decommissioning of the facility. These NRC minimum funding levels are typically based upon the assumption that decommissioning activities will commence after the end of the current licensed life of each unit. If a unit fails the NRC minimum funding test, then the plant’s owners or parent companies would be required to take steps, such as providing financial guarantees through surety bonds, letters of credit, or parent company guarantees or making additional cash contributions to the NDT fund to ensure sufficient funds are available. See Note 10 — Asset Retirement Obligations of the Combined Notes to Consolidated Financial Statements for additional information.
If a nuclear plant were to retire before the end of its licensed life, there is a risk that it will no longer meet the NRC minimum funding requirements due to the earlier commencement of decommissioning activities and a shorter time period over which the NDT funds could appreciate in value. A shortfall could require that we address the shortfall by providing additional financial assurances, such as surety bonds, letters of credit, or parent company guarantees for our share of the funding assurance. However, the amount of any assurance will ultimately depend on the decommissioning approach, the associated level of costs, and the NDT fund investment performance going forward. No later than two years after shutting down a plant, we must submit a Post-shutdown Decommissioning Activities Report (PSDAR) to the NRC that includes the planned option for decommissioning the site.
Upon issuance of any additional financial assurance mechanisms to address a decommissioning funding shortfall, subject to satisfying various regulatory preconditions, each site would be able to utilize the respective NDT funds for radiological decommissioning costs, which represent the majority of the total expected decommissioning costs. However, under the regulations, the NRC must approve an exemption in order for us to utilize the NDT funds to pay for non-radiological decommissioning costs (i.e., spent fuel management and site restoration costs, if applicable). Any amounts not covered by an exemption would be borne by us without reimbursement.
As of December 31, 2024, the Crane NDT is fully funded under the SAFSTOR scenario that was the planned decommissioning option, as described in the Crane PSDAR filed with the NRC in April 2019. We will continue to file Crane's decommissioning funding status with the NRC annually until restart, at which point we will file decommissioning funding status reports in accordance with applicable NRC requirements. Additionally, as of December 31, 2024, we have adequate NDT funds for the remaining radiological decommissioning cost at Zion
Station related to the Independent Spent Fuel Storage Installation. Decommissioning costs other than radiological may require funding from us. See Note 10 — Asset Retirement Obligations of the Combined Notes to Consolidated Financial Statements for additional information.
| | | | | |
| ITEM 7A. | QUANTITATIVE AND QUALITATIVE DISCLOSURES ABOUT MARKET RISK |
We are exposed to market risks associated with adverse changes in commodity prices, counterparty credit, interest rates, and equity prices. We manage these risks through risk management policies and objectives for risk assessment, control and valuation, counterparty credit approval, and the monitoring and reporting of risk exposures. The Executive Committee and the Audit and Risk Committee of the Board of Directors have oversight responsibilities for risk management.Commodity Price Risk
Commodity price risk is associated with price movements resulting from changes in supply and demand, fuel costs, market liquidity, weather conditions, governmental, regulatory, and environmental policies, and other factors. To the extent the total amount of energy we produce or procure differs from the amount of energy we have contracted to sell, we are exposed to market fluctuations in commodity prices. We seek to mitigate our commodity price risk through the sale and purchase of electricity, natural gas and oil, and other commodities.
Electricity available from our owned or contracted generation supply in excess of our obligations to customers is sold into the wholesale markets. To reduce commodity price risk caused by market fluctuations, we enter non-derivative contracts as well as derivative contracts, including swaps, futures, forwards, and options, with approved counterparties to hedge anticipated exposures. We use derivative instruments as economic hedges to mitigate exposure to fluctuations in commodity prices. We expect the settlement of the majority of our economic hedges will occur during 2025 through 2027.
In general, increases and decreases in forward market prices have a positive and negative impact, respectively, on owned and contracted generation positions that have not been hedged. Beginning in 2024, our existing nuclear fleet is eligible for the nuclear PTC provided by the IRA, an important tool in managing commodity price risk for each nuclear unit not already receiving state support. The nuclear PTC provides increasing levels of support as unit revenues decline below levels established in the IRA and is further adjusted for inflation after 2024 through the duration of the program based on the GDP price deflator for the preceding calendar year. See Note 6 — Government Assistance of the Combined Notes to Consolidated Financial Statements for additional information on the nuclear PTC.
In locations and periods where our load serving activities do not naturally offset existing generation portfolio risk, remaining commodity price exposure is managed through portfolio hedging activities. Portfolio hedging activities are generally concentrated in the prompt three years, when customer demand and market liquidity enable effective price risk mitigation. During this prompt three-year period, we seek to mitigate price risk associated with our load serving contracts, non-nuclear generation, and any residual price risk for our nuclear generation that the nuclear PTC and state programs may not fully mitigate. We also enter transactions that further optimize the economic benefits of our overall portfolio.
The forecasted market price risk exposure is the risk of a change in the value of unhedged positions. The forecasted market price risk exposure for our entire economic hedge portfolio associated with a $5/MWh reduction in the annual average around-the-clock energy price based on December 31, 2024 market conditions and hedged position results in an immaterial impact to earnings for 2025 and 2026, respectively, largely due to the nuclear PTC. See Note 15 — Derivative Financial Instruments of the Combined Notes to Consolidated Financial Statements for additional information.
Fuel Procurement
We procure natural gas through long-term and short-term contracts, and spot-market purchases. Nuclear fuel is obtained predominantly through long-term contracts for uranium concentrates, conversion services, enrichment services, (or a combination thereof) and fabrication services, including contracts sourced from Russia. The supply markets for uranium concentrates and certain nuclear fuel services are subject to price fluctuations and availability restrictions. Supply market conditions may make our procurement contracts subject to credit risk related to the potential non-performance of counterparties to deliver the contracted commodity or service at the contracted prices. We engage a diverse set of suppliers to secure the nuclear fuel needed to continue to operate
our nuclear fleet long-term. Approximately 45% of our uranium concentrate requirements from 2025 through 2029 are supplied by three suppliers. To-date, we have not experienced any counterparty credit risk associated with these suppliers stemming from the Russia and Ukraine conflict. In the event of non-performance by these or other suppliers, we believe that replacement uranium concentrate can be obtained, although at prices that may be unfavorable when compared to the prices under the current supply agreements. Geopolitical developments, including the Russia and Ukraine conflict and United States, United Kingdom, European Union, and Canadian sanctions against Russia, have the potential to impact delivery from multiple suppliers in the international uranium processing industry. Non-performance by these counterparties could have a material adverse impact on our consolidated financial statements. See ITEM 7. MANAGEMENT'S DISCUSSION AND ANALYSIS OF FINANCIAL CONDITION AND RESULTS OF OPERATIONS — Other Key Business Drivers for more information on the Russia and Ukraine conflict.
Trading and Non-Trading Marketing Activities
The following table provides detail on changes in our commodity mark-to-market net assets (liabilities) balance sheet position from December 31, 2022 to December 31, 2024. This table incorporates the mark-to-market activities that are immediately recorded in earnings. This table excludes all NPNS contracts and does not segregate proprietary trading activity. See Note 15 — Derivative Financial Instruments of the Combined Notes to Consolidated Financial Statements for additional information on the balance sheet classification of the mark-to-market commodity contract net assets (liabilities) recorded as of December 31, 2024 and 2023.
| | | | | | | | | | | | | | | |
| 2024 | | 2023 | | | | |
Beginning balance as of January 1(a) | $ | 1,108 | | | $ | 1,046 | | | | | |
| Total change in fair value of contracts recorded in results of operations | (654) | | | (2,530) | | | | | |
| Reclassification to realized at settlement of contracts recorded in results of operations | 1,934 | | | 1,561 | | | | | |
| Changes in allocated collateral | (1,813) | | | 1,502 | | | | | |
| Net option premium paid (received) | (216) | | | (26) | | | | | |
| Option premium amortization | (32) | | | (183) | | | | | |
Upfront payments and amortizations(b) | (10) | | | (249) | | | | | |
| Foreign currency translation | — | | | (13) | | | | | |
Ending balance as of December 31(a) | $ | 317 | | | $ | 1,108 | | | | | |
__________
(a)Amounts are shown net of collateral paid to and received from counterparties.
(b)Includes derivative contracts acquired or sold through upfront payments or receipts of cash, excluding option premiums and the associated amortizations.
Fair Values
The following table presents maturity and source of fair value for mark-to-market commodity contract net assets (liabilities). See Note 17 — Fair Value of Financial Assets and Liabilities of the Combined Notes to Consolidated Financial Statements for additional information regarding fair value measurements and the fair value hierarchy.
| | | | | | | | | | | | | | | | | | | | | | | | | | | | | | | | | | | | | | | | | |
| Maturities Within | | Total Fair
Value |
| 2025 | | 2026 | | 2027 | | 2028 | | 2029 | | 2030 and Beyond | |
Normal Operations, Commodity derivative contracts(a)(b): | | | | | | | | | | | | | |
| Actively quoted prices (Level 1) | $ | 66 | | | $ | 67 | | | $ | 18 | | | $ | (8) | | | $ | (4) | | | $ | — | | | $ | 139 | |
| Prices provided by external sources (Level 2) | 150 | | | 9 | | | 15 | | | (1) | | | 6 | | | — | | | 179 | |
| Prices based on model or other valuation methods (Level 3) | 127 | | | (58) | | | (94) | | | (18) | | | (16) | | | 58 | | | (1) | |
| Total | $ | 343 | | | $ | 18 | | | $ | (61) | | | $ | (27) | | | $ | (14) | | | $ | 58 | | | $ | 317 | |
__________(a)Represents mark-to-market gains and losses on commodity derivative contracts that are recorded in the results of operations.
(b)Amounts are shown net of collateral paid to and received from counterparties (and offset against mark-to-market assets and liabilities) of $586 million at December 31, 2024.
Credit Risk
We would be exposed to credit-related losses in the event of non-performance by counterparties that execute derivative instruments. The credit exposure of derivative contracts, before collateral, is represented by the fair value of contracts at the reporting date. See Note 15 — Derivative Financial Instruments of the Combined Notes to Consolidated Financial Statements for a detailed discussion of credit risk.
Credit-Risk-Related Contingent Features
As part of the normal course of business, we routinely enter physically or financially settled contracts for the purchase and sale of capacity, electricity, fuels, emissions allowances, and other energy-related products. In accordance with the contracts and applicable law, if we are downgraded by a credit rating agency, especially if such downgrade is to a level below investment grade, it is possible that a counterparty would attempt to rely on such a downgrade as a basis for making a demand for adequate assurance of future performance. Depending on our net position with a counterparty, the demand could be for the posting of collateral. In the absence of expressly agreed-to provisions that specify the collateral that must be provided, collateral requested will be a function of the facts and circumstances of the situation at the time of the demand. See Note 15 — Derivative Financial Instruments and Note 18 — Commitments and Contingencies of the Combined Notes to Consolidated Financial Statements for additional information regarding the letters of credit supporting the cash collateral.
We sell output through bilateral contracts. The bilateral contracts are subject to credit risk, which relates to the ability of counterparties to meet their contractual payment obligations. Any failure to collect these payments from counterparties could have a material impact on our consolidated financial statements. As market prices rise above or fall below contracted price levels, we are required to post collateral with purchasers; as market prices fall below contracted price levels, counterparties are required to post collateral with us. To post collateral, we depend on access to bank credit facilities, which serve as liquidity sources to fund collateral requirements. See ITEM 7. MANAGEMENT'S DISCUSSION AND ANALYSIS OF FINANCIAL CONDITION AND RESULTS OF OPERATIONS, Liquidity and Capital Resources — Credit Matters and Cash Requirements — Credit Facilities for additional information.
RTOs and ISOs
We participate in all of the established wholesale energy markets that are administered by PJM, ISO-NE, NYISO, CAISO, MISO, SPP, AESO, and ERCOT. ERCOT is not subject to regulation by FERC but performs a similar function in Texas to that performed by RTOs and ISOs in markets regulated by FERC. In these areas, power and related products are traded through bilateral agreements between buyers and sellers and in the energy markets
that are administered by the RTOs or ISOs, as applicable. In areas where there is no RTO or ISO to administer energy markets, electricity and related products are purchased and sold solely through bilateral agreements. For activities administered by an RTO or ISO, the RTO or ISO maintains financial assurance policies that are established and enforced by those administrators. The credit policies of the RTOs and ISOs may, under certain circumstances, require that losses arising from the default of one member be shared by the remaining participants. Non-performance or non-payment by a major member of an RTO or ISO could result in a material adverse impact on our consolidated financial statements.
Exchange Traded Transactions
We enter commodity transactions on NYMEX, ICE, NASDAQ, NGX, and the Nodal exchange (each an Exchange and, collectively, Exchanges). The Exchange clearinghouses act as the counterparty to each trade. Transactions on the Exchanges must adhere to comprehensive collateral and margining requirements. As a result, transactions on Exchanges are significantly collateralized and have limited counterparty credit risk.
Interest Rate and Foreign Exchange Risk
We use a combination of fixed-rate and variable-rate debt to manage interest rate exposure. We may also utilize interest rate swaps to manage our interest rate exposure. A hypothetical 50 basis point increase in the interest rates associated with unhedged variable-rate debt (excluding Commercial Paper) and fixed-to-floating swaps would not have resulted in a material decrease in our earnings for the year ended December 31, 2024. To manage foreign exchange rate exposure associated with international energy purchases in currencies other than U.S. dollars, we utilize foreign currency derivatives, which are typically designated as economic hedges. See Note 15 — Derivative Financial Instruments of the Combined Notes to Consolidated Financial Statements for additional information.
Equity Price Risk
We maintain trust funds, as required by the NRC, to fund the costs of decommissioning our nuclear plants. Our NDT funds are reflected at fair value in the Consolidated Balance Sheets. The mix of securities in the trust funds is designed to provide returns to be used to fund decommissioning and to compensate us for inflationary increases in decommissioning costs; however, the equity securities in the trust funds are exposed to price fluctuations in equity markets, and the value of fixed-rate, fixed-income securities are exposed to changes in interest rates. We actively monitor the investment performance of the trust funds and periodically review asset allocations in accordance with our NDT fund investment policy.
A hypothetical 25 basis points increase in interest rates and 10% decrease in equity prices would have resulted in a $943 million reduction in the fair value of our NDT trust assets as of December 31, 2024. This calculation holds all other variables constant and assumes only the discussed changes in interest rates and equity prices. See Liquidity and Capital Resources section of ITEM 7. MANAGEMENT'S DISCUSSION AND ANALYSIS OF FINANCIAL CONDITION AND RESULTS OF OPERATIONS, and Note 10 — Asset Retirement Obligations of the Combined Notes to Consolidated Financial Statements for additional information.
Our employee benefit plan trusts also hold investments in equity and debt securities. See ITEM 7. MANAGEMENT'S DISCUSSION AND ANALYSIS OF FINANCIAL CONDITION AND RESULTS OF OPERATIONS — Critical Accounting Policies and Estimates for sensitivity analysis of key assumptions in the valuation of our Pension and OPEB obligations.
| | | | | |
| ITEM 8. | FINANCIAL STATEMENTS AND SUPPLEMENTARY DATA |
Management’s Report on Internal Control Over Financial Reporting
The management of Constellation Energy Corporation (CEG Parent) is responsible for establishing and maintaining adequate internal control over financial reporting, as such term is defined in Exchange Act Rule 13a-15(f). Internal control over financial reporting is a process designed to provide reasonable assurance regarding the reliability of financial reporting and the preparation of financial statements for external purposes in accordance with generally accepted accounting principles.
Because of its inherent limitations, internal control over financial reporting may not prevent or detect misstatements. Also, projections of any evaluation of effectiveness to future periods are subject to the risk that controls may become inadequate because of changes in conditions, or that the degree of compliance with the policies or procedures may deteriorate.
CEG Parent’s management assessed the effectiveness of CEG Parent’s internal control over financial reporting as of December 31, 2024. In making this assessment, management used the criteria in Internal Control—Integrated Framework (2013) issued by the Committee of Sponsoring Organizations of the Treadway Commission. Based on this assessment, CEG Parent’s management concluded that, as of December 31, 2024, CEG Parent’s internal control over financial reporting was effective.
The effectiveness of CEG Parent’s internal control over financial reporting as of December 31, 2024, has been audited by PricewaterhouseCoopers LLP, an independent registered public accounting firm, as stated in their report which appears herein.
February 18, 2025
Management’s Report on Internal Control Over Financial Reporting
The management of Constellation Energy Generation, LLC (Constellation) is responsible for establishing and maintaining adequate internal control over financial reporting, as such term is defined in Exchange Act Rule 13a-15(f). Internal control over financial reporting is a process designed to provide reasonable assurance regarding the reliability of financial reporting and the preparation of financial statements for external purposes in accordance with generally accepted accounting principles.
Because of its inherent limitations, internal control over financial reporting may not prevent or detect misstatements. Also, projections of any evaluation of effectiveness to future periods are subject to the risk that controls may become inadequate because of changes in conditions, or that the degree of compliance with the policies or procedures may deteriorate.
Constellation’s management assessed the effectiveness of Constellation’s internal control over financial reporting as of December 31, 2024. In making this assessment, management used the criteria in Internal Control—Integrated Framework (2013) issued by the Committee of Sponsoring Organizations of the Treadway Commission. Based on this assessment, Constellation’s management concluded that, as of December 31, 2024, Constellation’s internal control over financial reporting was effective.
February 18, 2025
Report of Independent Registered Public Accounting Firm
To the Board of Directors and Shareholders of Constellation Energy Corporation
Opinions on the Financial Statements and Internal Control over Financial Reporting
We have audited the consolidated financial statements, including the related notes, as listed in the index appearing under Item 15(a)(1)(i), and the financial statement schedule listed in the index appearing under Item 15(a)(1)(ii), of Constellation Energy Corporation and its subsidiaries (the “Company”) (collectively referred to as the “consolidated financial statements”). We also have audited the Company's internal control over financial reporting as of December 31, 2024, based on criteria established in Internal Control - Integrated Framework (2013) issued by the Committee of Sponsoring Organizations of the Treadway Commission (COSO).
In our opinion, the consolidated financial statements referred to above present fairly, in all material respects, the financial position of the Company as of December 31, 2024 and 2023, and the results of its operations and its cash flows for each of the three years in the period ended December 31, 2024 in conformity with accounting principles generally accepted in the United States of America. Also in our opinion, the Company maintained, in all material respects, effective internal control over financial reporting as of December 31, 2024, based on criteria established in Internal Control - Integrated Framework (2013) issued by the COSO.
Basis for Opinions
The Company's management is responsible for these consolidated financial statements, for maintaining effective internal control over financial reporting, and for its assessment of the effectiveness of internal control over financial reporting, included in Management’s Report on Internal Control Over Financial Reporting appearing under Item 8. Our responsibility is to express opinions on the Company’s consolidated financial statements and on the Company's internal control over financial reporting based on our audits. We are a public accounting firm registered with the Public Company Accounting Oversight Board (United States) (PCAOB) and are required to be independent with respect to the Company in accordance with the U.S. federal securities laws and the applicable rules and regulations of the Securities and Exchange Commission and the PCAOB.
We conducted our audits in accordance with the standards of the PCAOB. Those standards require that we plan and perform the audits to obtain reasonable assurance about whether the consolidated financial statements are free of material misstatement, whether due to error or fraud, and whether effective internal control over financial reporting was maintained in all material respects.
Our audits of the consolidated financial statements included performing procedures to assess the risks of material misstatement of the consolidated financial statements, whether due to error or fraud, and performing procedures that respond to those risks. Such procedures included examining, on a test basis, evidence regarding the amounts and disclosures in the consolidated financial statements. Our audits also included evaluating the accounting principles used and significant estimates made by management, as well as evaluating the overall presentation of the consolidated financial statements. Our audit of internal control over financial reporting included obtaining an understanding of internal control over financial reporting, assessing the risk that a material weakness exists, and testing and evaluating the design and operating effectiveness of internal control based on the assessed risk. Our audits also included performing such other procedures as we considered necessary in the circumstances. We believe that our audits provide a reasonable basis for our opinions.
Definition and Limitations of Internal Control over Financial Reporting
A company’s internal control over financial reporting is a process designed to provide reasonable assurance regarding the reliability of financial reporting and the preparation of financial statements for external purposes in accordance with generally accepted accounting principles. A company’s internal control over financial reporting includes those policies and procedures that:
(i) pertain to the maintenance of records that, in reasonable detail, accurately and fairly reflect the transactions and dispositions of the assets of the company; (ii) provide reasonable assurance that transactions are recorded as necessary to permit preparation of financial statements in accordance with generally accepted accounting principles, and that receipts and expenditures of the company are being made only in accordance with authorizations of management and directors of the company; and (iii) provide reasonable assurance regarding
prevention or timely detection of unauthorized acquisition, use, or disposition of the company’s assets that could have a material effect on the financial statements.
Because of its inherent limitations, internal control over financial reporting may not prevent or detect misstatements. Also, projections of any evaluation of effectiveness to future periods are subject to the risk that controls may become inadequate because of changes in conditions, or that the degree of compliance with the policies or procedures may deteriorate.
Critical Audit Matters
The critical audit matter communicated below is a matter arising from the current period audit of the consolidated financial statements that was communicated or required to be communicated to the audit committee and that (i) relates to accounts or disclosures that are material to the consolidated financial statements and (ii) involved our especially challenging, subjective, or complex judgments. The communication of critical audit matters does not alter in any way our opinion on the consolidated financial statements, taken as a whole, and we are not, by communicating the critical audit matter below, providing a separate opinion on the critical audit matter or on the accounts or disclosures to which it relates.
Nuclear Decommissioning Asset Retirement Obligations (ARO) Assessment
As described in Notes 1 and 10 to the consolidated financial statements, the Company has a legal obligation to decommission its nuclear power plants following the permanent cessation of operations. To estimate its decommissioning obligations management uses a probability- weighted, discounted cash flow model which, on a unit-by-unit basis, considers multiple outcome scenarios that include significant estimates and assumptions, and are based on decommissioning cost studies, cost escalation rates, probabilistic cash flow models, and discount rates. Management updates its ARO annually, unless circumstances warrant more frequent updates, based on its review of updated cost studies and its annual evaluation of cost escalation factors and probabilities assigned to various scenarios. As of December 31, 2024, the nuclear decommissioning ARO was $12.2 billion.
The principal considerations for our determination that performing procedures relating to the Company’s nuclear decommissioning ARO assessment is a critical audit matter are (i) the significant judgment by management when estimating its decommissioning obligations; (ii) a high degree of auditor judgment, subjectivity, and effort in performing procedures and evaluating the reasonableness of management’s discounted cash flow model and significant assumptions related to decommissioning cost studies; and (iii) the audit effort involved the use of professionals with specialized skill and knowledge.
Addressing the matter involved performing procedures and evaluating audit evidence in connection with forming our overall opinion on the consolidated financial statements. These procedures included testing the effectiveness of controls relating to management’s development of the inputs, assumptions, and discounted cash flow model used in management’s ARO assessment. These procedures also included, among others (i) testing management’s process for estimating the decommissioning obligations by evaluating the appropriateness of the discounted cash flow model; (ii) testing the completeness and accuracy of data used by management; and (iii) evaluating the reasonableness of management’s significant assumptions related to decommissioning cost studies. Professionals with specialized skill and knowledge were used to assist in evaluating the results of decommissioning cost studies.
/s/ PricewaterhouseCoopers LLP
Baltimore, Maryland
February 18, 2025
We have served as the Company's auditor since 2022.
Report of Independent Registered Public Accounting Firm
To the Board of Directors and Member of Constellation Energy Generation, LLC
Opinion on the Financial Statements
We have audited the consolidated financial statements, including the related notes, as listed in the index appearing under Item 15(a)(2)(i), and the financial statement schedule listed in the index appearing under Item 15(a)(2)(ii), of Constellation Energy Generation, LLC and its subsidiaries (the “Company”) (collectively referred to as the “consolidated financial statements”). In our opinion, the consolidated financial statements present fairly, in all material respects, the financial position of the Company as of December 31, 2024 and 2023, and the results of its operations and its cash flows for each of the three years in the period ended December 31, 2024 in conformity with accounting principles generally accepted in the United States of America.
Basis for Opinion
These consolidated financial statements are the responsibility of the Company's management. Our responsibility is to express an opinion on the Company’s consolidated financial statements based on our audits. We are a public accounting firm registered with the Public Company Accounting Oversight Board (United States) (PCAOB) and are required to be independent with respect to the Company in accordance with the U.S. federal securities laws and the applicable rules and regulations of the Securities and Exchange Commission and the PCAOB.
We conducted our audits of these consolidated financial statements in accordance with the standards of the PCAOB. Those standards require that we plan and perform the audits to obtain reasonable assurance about whether the consolidated financial statements are free of material misstatement, whether due to error or fraud. The Company is not required to have, nor were we engaged to perform, an audit of its internal control over financial reporting. As part of our audits we are required to obtain an understanding of internal control over financial reporting but not for the purpose of expressing an opinion on the effectiveness of the Company's internal control over financial reporting. Accordingly, we express no such opinion.
Our audits included performing procedures to assess the risks of material misstatement of the consolidated financial statements, whether due to error or fraud, and performing procedures that respond to those risks. Such procedures included examining, on a test basis, evidence regarding the amounts and disclosures in the consolidated financial statements. Our audits also included evaluating the accounting principles used and significant estimates made by management, as well as evaluating the overall presentation of the consolidated financial statements. We believe that our audits provide a reasonable basis for our opinion.
Critical Audit Matters
The critical audit matter communicated below is a matter arising from the current period audit of the consolidated financial statements that was communicated or required to be communicated to the audit committee and that (i) relates to accounts or disclosures that are material to the consolidated financial statements and (ii) involved our especially challenging, subjective, or complex judgments. The communication of critical audit matters does not alter in any way our opinion on the consolidated financial statements, taken as a whole, and we are not, by communicating the critical audit matter below, providing a separate opinion on the critical audit matter or on the accounts or disclosures to which it relates.
Nuclear Decommissioning Asset Retirement Obligations (ARO) Assessment
As described in Notes 1 and 10 to the consolidated financial statements, the Company has a legal obligation to decommission its nuclear power plants following the permanent cessation of operations. To estimate its decommissioning obligations management uses a probability- weighted, discounted cash flow model which, on a unit-by-unit basis, considers multiple outcome scenarios that include significant estimates and assumptions, and are based on decommissioning cost studies, cost escalation rates, probabilistic cash flow models, and discount rates. Management updates its ARO annually, unless circumstances warrant more frequent updates, based on its review of updated cost studies and its annual evaluation of cost escalation factors and probabilities assigned to various scenarios. As of December 31, 2024, the nuclear decommissioning ARO was $12.2 billion.
The principal considerations for our determination that performing procedures relating to the Company’s nuclear decommissioning ARO assessment is a critical audit matter are (i) the significant judgment by management when
estimating its decommissioning obligations; (ii) a high degree of auditor judgment, subjectivity, and effort in performing procedures and evaluating the reasonableness of management’s discounted cash flow model and significant assumptions related to decommissioning cost studies; and (iii) the audit effort involved the use of professionals with specialized skill and knowledge.
Addressing the matter involved performing procedures and evaluating audit evidence in connection with forming our overall opinion on the consolidated financial statements. These procedures included testing the effectiveness of controls relating to management’s development of the inputs, assumptions, and discounted cash flow model used in management’s ARO assessment. These procedures also included, among others; (i) testing management’s process for estimating the decommissioning obligations by evaluating the appropriateness of the discounted cash flow model; (ii) testing the completeness and accuracy of data used by management; and (iii) evaluating the reasonableness of management’s significant assumptions related to decommissioning cost studies. Professionals with specialized skill and knowledge were used to assist in evaluating the results of decommissioning cost studies.
/s/ PricewaterhouseCoopers LLP
Baltimore, Maryland
February 18, 2025
We have served as the Company's auditor since 2001.
Constellation Energy Corporation and Subsidiary Companies
Consolidated Statements of Operations and Comprehensive Income
| | | | | | | | | | | | | | | | | |
| For the Years Ended December 31, |
| (In millions, except per share data) | 2024 | | 2023 | | 2022 |
| Operating revenues | | | | | |
| Operating revenues | $ | 23,568 | | | $ | 24,918 | | | $ | 24,280 | |
| Operating revenues from affiliates | — | | | — | | | 160 | |
| Total operating revenues | 23,568 | | | 24,918 | | | 24,440 | |
| Operating expenses | | | | | |
| Purchased power and fuel | 11,419 | | | 16,001 | | | 17,457 | |
| Purchased power and fuel from affiliates | — | | | — | | | 5 | |
| Operating and maintenance | 6,159 | | | 5,685 | | | 4,797 | |
| Operating and maintenance from affiliates | — | | | — | | | 44 | |
| Depreciation and amortization | 1,123 | | | 1,096 | | | 1,091 | |
| Taxes other than income taxes | 586 | | | 553 | | | 552 | |
| Total operating expenses | 19,287 | | | 23,335 | | | 23,946 | |
| Gain (loss) on sales of assets and businesses | 71 | | | 27 | | | 1 | |
| Operating income (loss) | 4,352 | | | 1,610 | | | 495 | |
| Other income and (deductions) | | | | | |
| Interest expense, net | (506) | | | (431) | | | (250) | |
| Interest expense to affiliates | — | | | — | | | (1) | |
| Other, net | 670 | | | 1,268 | | | (786) | |
| Total other income and (deductions) | 164 | | | 837 | | | (1,037) | |
| Income (loss) before income taxes | 4,516 | | | 2,447 | | | (542) | |
| Income tax (benefit) expense | 774 | | | 859 | | | (388) | |
| Equity in income (losses) of unconsolidated affiliates | (4) | | | (11) | | | (13) | |
| Net income (loss) | 3,738 | | | 1,577 | | | (167) | |
| Net income (loss) attributable to noncontrolling interests | (11) | | | (46) | | | (7) | |
| Net income (loss) attributable to common shareholders | $ | 3,749 | | | $ | 1,623 | | | $ | (160) | |
| Comprehensive income (loss), net of income taxes | | | | | |
| Net income (loss) | $ | 3,738 | | | $ | 1,577 | | | $ | (167) | |
| Other comprehensive income (loss), net of income taxes | | | | | |
| Pension and non-pension postretirement benefit plans: | | | | | |
| Prior service benefit reclassified to periodic benefit cost | (4) | | | (4) | | | (6) | |
| Actuarial loss reclassified to periodic cost | 75 | | | 25 | | | 101 | |
| Pension and non-pension postretirement benefit plans valuation adjustment | (176) | | | (453) | | | 186 | |
| Unrealized gain (loss) on cash flow hedges | 4 | | | (1) | | | (1) | |
| | | | | |
| Unrealized gain (loss) on foreign currency translation | (10) | | | 2 | | | (3) | |
| Other comprehensive income (loss), net of income taxes | (111) | | | (431) | | | 277 | |
| Comprehensive income (loss) | $ | 3,627 | | | $ | 1,146 | | | $ | 110 | |
| Comprehensive income (loss) attributable to noncontrolling interests | (11) | | | (46) | | | (7) | |
| Comprehensive income (loss) attributable to common shareholders | $ | 3,638 | | | $ | 1,192 | | | $ | 117 | |
| | | | | |
| Average shares of common stock outstanding: | | | | | |
| Basic | 315 | | | 323 | | | 328 | |
| Assumed exercise and/or distributions of stock-based awards | — | | | 1 | | | 1 | |
| Diluted | 315 | | | 324 | | | 329 | |
| | | | | |
| Earnings per average common share | | | | | |
| Basic | $ | 11.91 | | | $ | 5.02 | | | $ | (0.49) | |
| Diluted | $ | 11.89 | | | $ | 5.01 | | | $ | (0.49) | |
See the Combined Notes to Consolidated Financial Statements
85
Constellation Energy Corporation and Subsidiary Companies
Consolidated Statements of Cash Flows
| | | | | | | | | | | | | | | | | |
| For the Years Ended December 31, |
| (In millions) | 2024 | | 2023 | | 2022 |
| Cash flows from operating activities | | | | | |
| Net income (loss) | $ | 3,738 | | | $ | 1,577 | | | $ | (167) | |
| Adjustments to reconcile net income (loss) to net cash flows provided by (used in) operating activities | | | | | |
| Depreciation, amortization, and accretion, including nuclear fuel and energy contract amortization | 2,700 | | | 2,514 | | | 2,427 | |
| | | | | |
| | | | | |
| | | | | |
| Deferred income taxes and amortization of ITC | 222 | | | 251 | | | (643) | |
| Net fair value changes related to derivatives | (1,297) | | | 996 | | | 986 | |
| Net realized and unrealized (gains) losses on NDT funds | (311) | | | (476) | | | 794 | |
| Net realized and unrealized (gains) losses on equity investments | (11) | | | (307) | | | 13 | |
| Other non-cash operating activities | (172) | | | 18 | | | 248 | |
| Changes in assets and liabilities: | | | | | |
| Accounts receivable | 688 | | | 396 | | | (868) | |
| Receivables from and payables to affiliates, net | — | | | — | | | 20 | |
| Inventories | (99) | | | 60 | | | (228) | |
| Accounts payable and accrued expenses | 1,121 | | | (1,330) | | | 1,142 | |
| Option premiums received (paid), net | 216 | | | 26 | | | (177) | |
| Collateral received (posted), net | 1,803 | | | (1,491) | | | (351) | |
| Income taxes | 296 | | | 325 | | | 162 | |
| Pension and non-pension postretirement benefit contributions | (184) | | | (54) | | | (237) | |
| Other assets and liabilities | (11,174) | | | (7,806) | | | (5,474) | |
| Net cash flows provided by (used in) operating activities | (2,464) | | | (5,301) | | | (2,353) | |
| Cash flows from investing activities | | | | | |
| Capital expenditures | (2,565) | | | (2,422) | | | (1,689) | |
| Proceeds from NDT fund sales | 6,005 | | | 5,822 | | | 4,050 | |
| Investment in NDT funds | (6,282) | | | (6,050) | | | (4,271) | |
| Collection of DPP, net | 10,217 | | | 7,340 | | | 4,964 | |
| | | | | |
| | | | | |
| Acquisitions of assets and businesses | (32) | | | (1,690) | | | (29) | |
| Other investing activities | 85 | | | 31 | | | 79 | |
| Net cash flows provided by (used in) investing activities | 7,428 | | | 3,031 | | | 3,104 | |
| Cash flows from financing activities | | | | | |
| Change in short-term borrowings | (1,105) | | | 146 | | | 257 | |
| Proceeds from short-term borrowings with maturities greater than 90 days | 200 | | | 539 | | | — | |
| Repayments of short-term borrowings with maturities greater than 90 days | (739) | | | (200) | | | (1,180) | |
| Issuance of long-term debt | 920 | | | 3,195 | | | 14 | |
| Retirement of long-term debt | (121) | | | (168) | | | (1,162) | |
| | | | | |
| Retirement of long-term debt to affiliate | — | | | — | | | (258) | |
| | | | | |
| | | | | |
| | | | | |
| Contributions from Exelon | — | | | — | | | 1,750 | |
| Dividends paid on common stock | (444) | | | (366) | | | (185) | |
| | | | | |
| | | | | |
| | | | | |
| | | | | |
| Repurchases of common stock | (999) | | | (992) | | | — | |
| Other financing activities | (1) | | | 42 | | | (35) | |
| Net cash flows provided by (used in) financing activities | (2,289) | | | 2,196 | | | (799) | |
| Increase (decrease) in cash, restricted cash, and cash equivalents | 2,675 | | | (74) | | | (48) | |
| Cash, restricted cash, and cash equivalents at beginning of period | 454 | | | 528 | | | 576 | |
| Cash, restricted cash, and cash equivalents at end of period | $ | 3,129 | | | $ | 454 | | | $ | 528 | |
| | | | | |
| Supplemental cash flow information | | | | | |
| Increase (decrease) in capital expenditures not paid | $ | 129 | | | $ | 16 | | | $ | (23) | |
| Increase (decrease) in DPP | 9,045 | | | 8,097 | | | 5,166 | |
| Increase (decrease) in PP&E related to ARO update | (1,486) | | | 501 | | | 343 | |
See the Combined Notes to Consolidated Financial Statements
86
Constellation Energy Corporation and Subsidiary Companies
Consolidated Balance Sheets
| | | | | | | | | | | |
| December 31, |
| (In millions) | 2024 | | 2023 |
| ASSETS | | | |
| Current assets | | | |
| Cash and cash equivalents | $ | 3,022 | | | $ | 368 | |
| Restricted cash and cash equivalents | 107 | | | 86 | |
| Accounts receivable | | | |
| Customer accounts receivable (net of allowance for credit losses of $190 and $56 as of December 31, 2024 and 2023, respectively) | 3,116 | | | 1,934 | |
| | | |
| | | |
| Other accounts receivable (net of allowance for credit losses of $6 and $5 as of December 31, 2024 and 2023, respectively) | 602 | | | 917 | |
| | | |
| | | |
| Mark-to-market derivative assets | 843 | | | 1,179 | |
| | | |
| | | |
| | | |
| Inventories, net | | | |
| Natural gas, oil, and emission allowances | 243 | | | 284 | |
| Materials and supplies | 1,357 | | | 1,216 | |
| | | |
| | | |
| Renewable energy credits | 797 | | | 660 | |
| | | |
| Other | 689 | | | 1,655 | |
| Total current assets | 10,776 | | | 8,299 | |
| Property, plant, and equipment (net of accumulated depreciation and amortization of $18,088 and $17,423 as of December 31, 2024 and 2023, respectively) | 21,235 | | | 22,116 | |
| Deferred debits and other assets | | | |
| | | |
| Nuclear decommissioning trust funds | 17,305 | | | 16,398 | |
| Investments | 640 | | | 563 | |
| Goodwill | 420 | | | 425 | |
| Mark-to-market derivative assets | 372 | | | 995 | |
| | | |
| | | |
| | | |
| | | |
| Deferred income taxes | — | | | 52 | |
| Other | 2,178 | | | 1,910 | |
| Total deferred debits and other assets | 20,915 | | | 20,343 | |
Total assets(a) | $ | 52,926 | | | $ | 50,758 | |
See the Combined Notes to Consolidated Financial Statements
87
Constellation Energy Corporation and Subsidiary Companies
Consolidated Balance Sheets
| | | | | | | | | | | |
| December 31, |
| (In millions) | 2024 | | 2023 |
| LIABILITIES AND EQUITY | | | |
| Current liabilities | | | |
| Short-term borrowings | $ | — | | | $ | 1,644 | |
| Long-term debt due within one year | 1,028 | | | 121 | |
| | | |
| Accounts payable and accrued expenses | 3,943 | | | 2,612 | |
| | | |
| | | |
| | | |
| Mark-to-market derivative liabilities | 467 | | | 632 | |
| | | |
| Renewable energy credit obligation | 1,076 | | | 972 | |
| | | |
| Other | 332 | | | 338 | |
| Total current liabilities | 6,846 | | | 6,319 | |
| Long-term debt | 7,384 | | | 7,496 | |
| | | |
| | | |
| Deferred credits and other liabilities | | | |
| Deferred income taxes and unamortized ITCs | 3,331 | | | 3,209 | |
| Asset retirement obligations | 12,449 | | | 14,118 | |
| Pension and non-pension postretirement benefit obligations | 1,875 | | | 1,802 | |
| | | |
| Spent nuclear fuel obligation | 1,366 | | | 1,296 | |
| | | |
| | | |
| | | |
| Payables related to Regulatory Agreement Units | 4,518 | | | 3,688 | |
| Mark-to-market derivative liabilities | 399 | | | 419 | |
| | | |
| | | |
| Other | 1,219 | | | 1,125 | |
| Total deferred credits and other liabilities | 25,157 | | | 25,657 | |
Total liabilities(a) | 39,387 | | | 39,472 | |
| Commitments and contingencies (Note 18) | | | |
| | | |
| Shareholders' equity | | | |
| | | |
| Common stock (No par value, 1,000 shares authorized, 313 shares and 317 shares outstanding as of December 31, 2024 and 2023, respectively) | 11,402 | | | 12,355 | |
| Retained earnings (deficit) | 4,066 | | | 761 | |
| Accumulated other comprehensive income (loss), net | (2,302) | | | (2,191) | |
| Total shareholders' equity | 13,166 | | | 10,925 | |
| Noncontrolling interests | 373 | | | 361 | |
| Total equity | 13,539 | | | 11,286 | |
| Total liabilities and shareholders' equity | $ | 52,926 | | | $ | 50,758 | |
__________
(a)Our consolidated assets include $4,318 million and $3,355 million at December 31, 2024 and 2023, respectively, of certain VIEs that can only be used to settle the liabilities of the VIE. Our consolidated liabilities include $968 million and $990 million at December 31, 2024 and 2023, respectively, of certain VIEs for which the VIE creditors do not have recourse to us. See Note 21–Variable Interest Entities for additional information.
See the Combined Notes to Consolidated Financial Statements
88
Constellation Energy Corporation and Subsidiary Companies
Consolidated Statements of Changes in Equity
| | | | | | | | | | | | | | | | | | | | | | | | | | | | | | | | | | | | | | | | | |
| Shareholder's Equity | | Noncontrolling
Interests | | Predecessor Member's Equity (a) | | Total
Equity |
| (In millions, shares in thousands) | Issued
Shares | | Common Stock | | Retained Earnings (Deficit) | | Accumulated Other Comprehensive Income (Loss), net | | |
| Balance, December 31, 2021 | — | | | $ | — | | | $ | — | | | $ | (31) | | | $ | 395 | | | $ | 11,250 | | | $ | 11,614 | |
| Net Income (loss) from January 1, 2022 to January 31, 2022 | — | | | — | | | — | | | — | | | — | | | 151 | | | 151 | |
| Separation related adjustments | — | | | — | | | — | | | (2,006) | | | 7 | | | 1,802 | | | (197) | |
| | | | | | | | | | | | | |
| Changes in equity of noncontrolling interest from January 1, 2022 to January 31, 2022 | — | | | — | | | — | | | — | | | (7) | | | — | | | (7) | |
| Consummation of separation | 326,664 | | | 13,203 | | | — | | | — | | | — | | | (13,203) | | | — | |
| Net Income (loss) from February 1, 2022 to December 31, 2022 | — | | | — | | | (311) | | | — | | | (7) | | | — | | | (318) | |
| Employee incentive plans | 466 | | | 71 | | | — | | | — | | | — | | | — | | | 71 | |
| Changes in equity of noncontrolling interest | — | | | — | | | — | | | — | | | (34) | | | — | | | (34) | |
Common stock dividends $0.1410/common share) | — | | | — | | | (185) | | | — | | | — | | | — | | | (185) | |
| Other comprehensive income (loss), net of income taxes | — | | | — | | | — | | | 277 | | | — | | | — | | | 277 | |
| Balance, December 31, 2022 | 327,130 | | | $ | 13,274 | | | $ | (496) | | | $ | (1,760) | | | $ | 354 | | | $ | — | | | $ | 11,372 | |
| Net Income (loss) | — | | | — | | | 1,623 | | | — | | | (46) | | | — | | | 1,577 | |
| Employee incentive plans | 902 | | | 81 | | | — | | | — | | | — | | | — | | | 81 | |
| Changes in equity of noncontrolling interest | — | | | — | | | — | | | — | | | 53 | | | — | | | 53 | |
Common stock dividends $0.2820/common share) | — | | | — | | | (366) | | | — | | | — | | | — | | | (366) | |
| Common stock repurchased | (10,560) | | | (1,000) | | | — | | | — | | | — | | | — | | | (1,000) | |
| Other comprehensive income (loss), net of income taxes | — | | | — | | | — | | | (431) | | | — | | | — | | | (431) | |
| Balance, December 31, 2023 | 317,472 | | | $ | 12,355 | | | $ | 761 | | | $ | (2,191) | | | $ | 361 | | | $ | — | | | $ | 11,286 | |
| Net Income (loss) | — | | | — | | | 3,749 | | | — | | | (11) | | | — | | | 3,738 | |
| Employee incentive plans | 885 | | | 56 | | | — | | | — | | | — | | | — | | | 56 | |
| Changes in equity of noncontrolling interest | — | | | — | | | — | | | — | | | 23 | | | — | | | 23 | |
Common stock dividends ($0.3525/common share) | — | | | — | | | (444) | | | — | | | — | | | — | | | (444) | |
| Common stock repurchased | (5,519) | | | (1,009) | | | — | | | — | | | — | | | — | | | (1,009) | |
| Other comprehensive income (loss), net of income taxes | — | | | — | | | — | | | (111) | | | — | | | — | | | (111) | |
| Balance, December 31, 2024 | 312,838 | | | $ | 11,402 | | | $ | 4,066 | | | $ | (2,302) | | | $ | 373 | | | $ | — | | | $ | 13,539 | |
__________
(a)Represents Constellation’s predecessor member's equity prior to the separation transaction. Upon completion of the separation, the predecessor member's equity was transferred to CEG Parent’s Common stock. See Note 1 — Basis of Presentation for additional information on the separation.
See the Combined Notes to Consolidated Financial Statements
89
Constellation Energy Generation, LLC and Subsidiary Companies
Consolidated Statements of Operations and Comprehensive Income
| | | | | | | | | | | | | | | | | |
| For the Years Ended December 31, |
| (In millions) | 2024 | | 2023 | | 2022 |
| Operating revenues | | | | | |
| Operating revenues | $ | 23,568 | | | $ | 24,918 | | | $ | 24,280 | |
| Operating revenues from affiliates | — | | | — | | | 160 | |
| Total operating revenues | 23,568 | | | 24,918 | | | 24,440 | |
| Operating expenses | | | | | |
| Purchased power and fuel | 11,419 | | | 16,001 | | | 17,457 | |
| Purchased power and fuel from affiliates | — | | | — | | | 5 | |
| Operating and maintenance | 6,159 | | | 5,685 | | | 4,797 | |
| Operating and maintenance from affiliates | — | | | — | | | 44 | |
| Depreciation and amortization | 1,123 | | | 1,096 | | | 1,091 | |
| Taxes other than income taxes | 586 | | | 553 | | | 552 | |
| Total operating expenses | 19,287 | | | 23,335 | | | 23,946 | |
| Gain (loss) on sales of assets and businesses | 71 | | | 27 | | | 1 | |
| Operating income (loss) | 4,352 | | | 1,610 | | | 495 | |
| Other income and (deductions) | | | | | |
| Interest expense, net | (506) | | | (431) | | | (250) | |
| Interest expense to affiliates | — | | | — | | | (1) | |
| Other, net | 670 | | | 1,268 | | | (786) | |
| Total other income and (deductions) | 164 | | | 837 | | | (1,037) | |
| Income (loss) before income taxes | 4,516 | | | 2,447 | | | (542) | |
| Income tax (benefit) expense | 774 | | | 859 | | | (388) | |
| Equity in income (losses) of unconsolidated affiliates | (4) | | | (11) | | | (13) | |
| Net income (loss) | 3,738 | | | 1,577 | | | (167) | |
| Net income (loss) attributable to noncontrolling interests | (11) | | | (46) | | | (7) | |
| Net income (loss) attributable to membership interest | $ | 3,749 | | | $ | 1,623 | | | $ | (160) | |
| Comprehensive income (loss), net of income taxes | | | | | |
| Net income (loss) | $ | 3,738 | | | $ | 1,577 | | | $ | (167) | |
| Other comprehensive income (loss), net of income taxes | | | | | |
| Pension and non-pension postretirement benefit plans: | | | | | |
| Prior service benefit reclassified to periodic benefit cost | (4) | | | (4) | | | (6) | |
| Actuarial loss reclassified to periodic benefit cost | 75 | | | 25 | | | 101 | |
| Pension and non-pension postretirement benefit plans valuation adjustment | (176) | | | (453) | | | 186 | |
| Unrealized gain (loss) on cash flow hedges | 4 | | | (1) | | | (1) | |
| | | | | |
| Unrealized gain (loss) on foreign currency translation | (10) | | | 2 | | | (3) | |
| | | | | |
| | | | | |
| Other comprehensive income (loss), net of income taxes | (111) | | | (431) | | | 277 | |
| Comprehensive income (loss) | 3,627 | | | 1,146 | | | 110 | |
| Comprehensive income (loss) attributable to noncontrolling interests | (11) | | | (46) | | | (7) | |
| Comprehensive income (loss) attributable to membership interest | $ | 3,638 | | | $ | 1,192 | | | $ | 117 | |
See the Combined Notes to Consolidated Financial Statements
90
Constellation Energy Generation, LLC and Subsidiary Companies
Consolidated Statements of Cash Flows
| | | | | | | | | | | | | | | | | |
| For the Years Ended December 31, |
| (In millions) | 2024 | | 2023 | | 2022 |
| Cash flows from operating activities | | | | | |
| Net income (loss) | $ | 3,738 | | | $ | 1,577 | | | $ | (167) | |
| Adjustments to reconcile net income (loss) to net cash flows provided by (used in) operating activities | | | | | |
| Depreciation, amortization, and accretion, including nuclear fuel and energy contract amortization | 2,700 | | | 2,514 | | | 2,427 | |
| | | | | |
| | | | | |
| | | | | |
| Deferred income taxes and amortization of ITCs | 222 | | | 251 | | | (643) | |
| Net fair value changes related to derivatives | (1,297) | | | 996 | | | 986 | |
| Net realized and unrealized (gains) losses on NDT funds | (311) | | | (476) | | | 794 | |
| Net realized and unrealized (gains) losses on equity investments | (11) | | | (307) | | | 13 | |
| Other non-cash operating activities | (218) | | | (44) | | | 199 | |
| Changes in assets and liabilities: | | | | | |
| Accounts receivable | 697 | | | 389 | | | (855) | |
| Receivables from and payables to affiliates, net | 231 | | | 73 | | | 65 | |
| Inventories | (99) | | | 60 | | | (228) | |
| Accounts payable and accrued expenses | 1,116 | | | (1,330) | | | 1,112 | |
| Option premiums received (paid), net | 216 | | | 26 | | | (177) | |
| Collateral received (posted), net | 1,803 | | | (1,491) | | | (351) | |
| Income taxes | 296 | | | 325 | | | 162 | |
| Pension and non-pension postretirement benefit contributions | (184) | | | (54) | | | (237) | |
| Other assets and liabilities | (11,369) | | | (7,897) | | | (5,540) | |
| Net cash flows provided by (used in) operating activities | (2,470) | | | (5,388) | | | (2,440) | |
| Cash flows from investing activities | | | | | |
| Capital expenditures | (2,565) | | | (2,422) | | | (1,689) | |
| Proceeds from NDT fund sales | 6,005 | | | 5,822 | | | 4,050 | |
| Investment in NDT funds | (6,282) | | | (6,050) | | | (4,271) | |
| Collection of DPP, net | 10,217 | | | 7,340 | | | 4,964 | |
| | | | | |
| | | | | |
| Acquisitions of assets and businesses | (32) | | | (1,690) | | | (29) | |
| | | | | |
| | | | | |
| | | | | |
| Other investing activities | 85 | | | 31 | | | 79 | |
| Net cash flows provided by (used in) investing activities | 7,428 | | | 3,031 | | | 3,104 | |
| Cash flows from financing activities | | | | | |
| Change in short-term borrowings | (1,105) | | | 146 | | | 257 | |
| Proceeds from short-term borrowings with maturities greater than 90 days | 200 | | | 539 | | | — | |
| Repayments of short-term borrowings with maturities greater than 90 days | (739) | | | (200) | | | (1,180) | |
| Issuance of long-term debt | 920 | | | 3,195 | | | 14 | |
| Retirement of long-term debt | (121) | | | (168) | | | (1,162) | |
| | | | | |
| Retirement of long-term debt to affiliate | — | | | — | | | (258) | |
| | | | | |
| | | | | |
| | | | | |
| Distributions to member | (1,441) | | | (1,239) | | | (185) | |
| | | | | |
| | | | | |
| Contributions from Exelon | — | | | — | | | 1,750 | |
| Contributions from member | — | | | — | | | 82 | |
| | | | | |
| | | | | |
| Other financing activities | 3 | | | 23 | | | (57) | |
| Net cash flows provided by (used in) financing activities | (2,283) | | | 2,296 | | | (739) | |
| Increase (decrease) in cash, restricted cash, and cash equivalents | 2,675 | | | (61) | | | (75) | |
| Cash, restricted cash, and cash equivalents at beginning of period | 440 | | | 501 | | | 576 | |
| Cash, restricted cash, and cash equivalents at end of period | $ | 3,115 | | | $ | 440 | | | $ | 501 | |
| | | | | |
| Supplemental cash flow information | | | | | |
| Increase (decrease) in capital expenditures not paid | $ | 129 | | | $ | 16 | | | $ | (23) | |
| Increase (decrease) in DPP | 9,045 | | | 8,097 | | | 5,166 | |
| Increase (decrease) in PP&E related to ARO update | (1,486) | | | 501 | | | 343 | |
See the Combined Notes to Consolidated Financial Statements
91
Constellation Energy Generation, LLC and Subsidiary Companies
Consolidated Balance Sheets
| | | | | | | | | | | |
| December 31, |
| (In millions) | 2024 | | 2023 |
| ASSETS | | | |
| Current assets | | | |
| Cash and cash equivalents | $ | 3,018 | | | $ | 366 | |
| Restricted cash and cash equivalents | 97 | | | 74 | |
| Accounts receivable | | | |
| Customer accounts receivable (net of allowance for credit losses of $190 and $56 as of December 31, 2024 and 2023, respectively) | 3,116 | | | 1,934 | |
| | | |
| | | |
| Other accounts receivable (net of allowance for credit losses of $6 and $5 as of December 31, 2024 and 2023, respectively) | 587 | | | 911 | |
| | | |
| | | |
| Mark-to-market derivative assets | 843 | | | 1,179 | |
| | | |
| | | |
| | | |
| Inventories, net | | | |
| Natural gas, oil, and emission allowance | 243 | | | 284 | |
| Materials and supplies | 1,357 | | | 1,216 | |
| | | |
| | | |
| | | |
| Renewable energy credits | 797 | | | 660 | |
| Other | 689 | | | 1,655 | |
| Total current assets | 10,747 | | | 8,279 | |
| Property, plant, and equipment (net of accumulated depreciation and amortization of $18,088 and $17,423 as of December 31, 2024 and 2023, respectively) | 21,235 | | | 22,116 | |
| Deferred debits and other assets | | | |
| | | |
| Nuclear decommissioning trust funds | 17,305 | | | 16,398 | |
| Investments | 640 | | | 563 | |
| Goodwill | 420 | | | 425 | |
| Mark-to-market derivative assets | 372 | | | 995 | |
| | | |
| | | |
| | | |
| | | |
| Deferred income taxes | — | | | 52 | |
| Other | 2,174 | | | 1,910 | |
| Total deferred debits and other assets | 20,911 | | | 20,343 | |
Total assets(a) | $ | 52,893 | | | $ | 50,738 | |
| | | |
| | | |
| | | |
| | | |
| | | |
| | | |
| | | |
| | | |
| | | |
| | | |
| | | |
| | | |
| | | |
| | | |
| | | |
See the Combined Notes to Consolidated Financial Statements
92
Constellation Energy Generation, LLC and Subsidiary Companies
Consolidated Balance Sheets
| | | | | | | | | | | |
| December 31, |
| (In millions) | 2024 | | 2023 |
| LIABILITIES AND EQUITY | | | |
| Current liabilities | | | |
| Short-term borrowings | $ | — | | | $ | 1,644 | |
| Long-term debt due within one year | 1,028 | | | 121 | |
| | | |
| Accounts payable and accrued expenses | 3,696 | | | 2,486 | |
| Payables to affiliates | 349 | | | 118 | |
| | | |
| | | |
| | | |
| Mark-to-market derivative liabilities | 467 | | | 632 | |
| | | |
| Renewable energy credit obligation | 1,076 | | | 972 | |
| | | |
| Other | 328 | | | 338 | |
| Total current liabilities | 6,944 | | | 6,311 | |
| Long-term debt | 7,384 | | | 7,496 | |
| | | |
| | | |
| Deferred credits and other liabilities | | | |
| Deferred income taxes and unamortized ITCs | 3,331 | | | 3,209 | |
| Asset retirement obligations | 12,449 | | | 14,118 | |
| Pension and non-pension postretirement benefit obligations | 1,875 | | | 1,802 | |
| | | |
| Spent nuclear fuel obligation | 1,366 | | | 1,296 | |
| | | |
| | | |
| Payables related to Regulatory Agreement Units | 4,518 | | | 3,688 | |
| Mark-to-market derivative liabilities | 399 | | | 419 | |
| | | |
| | | |
| Other | 1,044 | | | 1,025 | |
| Total deferred credits and other liabilities | 24,982 | | | 25,557 | |
Total liabilities(a) | 39,310 | | | 39,364 | |
| Commitments and contingencies (Note 18) | | | |
| | | |
| Equity | | | |
| Member’s equity | | | |
| Membership interest | 10,538 | | | 11,537 | |
| Undistributed earnings (deficit) | 4,974 | | | 1,667 | |
| Accumulated other comprehensive income (loss), net | (2,302) | | | (2,191) | |
| Total member’s equity | 13,210 | | | 11,013 | |
| Noncontrolling interests | 373 | | | 361 | |
| Total equity | 13,583 | | | 11,374 | |
| Total liabilities and equity | $ | 52,893 | | | $ | 50,738 | |
__________
(a)Our consolidated assets include $4,318 million and $3,355 million as of December 31, 2024 and 2023, respectively, of certain VIEs that can only be used to settle the liabilities of the VIE. Our consolidated liabilities include $968 million and $990 million as of December 31, 2024 and 2023, respectively, of certain VIEs for which the VIE creditors do not have recourse to us. See Note 21–Variable Interest Entities for additional information.
See the Combined Notes to Consolidated Financial Statements
93
Constellation Energy Generation, LLC and Subsidiary Companies
Consolidated Statements of Changes in Equity
| | | | | | | | | | | | | | | | | | | | | | | | | | | | | |
| Member’s Equity | | Noncontrolling
Interests | | Total
Equity |
| (In millions) | Membership
Interest | | Undistributed Earnings (Deficit) | | Accumulated Other Comprehensive Income (Loss), net | |
| Balance, December 31, 2021 | $ | 10,482 | | | $ | 768 | | | $ | (31) | | | $ | 395 | | | $ | 11,614 | |
| Net Income (loss) | — | | | (160) | | | — | | | (7) | | | (167) | |
| Separation-related adjustments | 1,844 | | | (11) | | | (2,006) | | | 7 | | | (166) | |
| Changes in equity of noncontrolling interests | — | | | — | | | — | | | (41) | | | (41) | |
| Distribution to member | — | | | (185) | | | — | | | — | | | (185) | |
| Contribution from member | 82 | | | — | | | — | | | — | | | 82 | |
| Other comprehensive income (loss), net of income taxes | — | | | — | | | 277 | | | — | | | 277 | |
| Balance, December 31, 2022 | $ | 12,408 | | | $ | 412 | | | $ | (1,760) | | | $ | 354 | | | $ | 11,414 | |
| Net Income (loss) | — | | | 1,623 | | | — | | | (46) | | | 1,577 | |
| Changes in equity of noncontrolling interests | — | | | — | | | — | | | 53 | | | 53 | |
| Distribution to member | (871) | | | (368) | | | — | | | — | | | (1,239) | |
| Other comprehensive income (loss), net of income taxes | — | | | — | | | (431) | | | — | | | (431) | |
| Balance, December 31, 2023 | $ | 11,537 | | | $ | 1,667 | | | $ | (2,191) | | | $ | 361 | | | $ | 11,374 | |
| Net Income (loss) | — | | | 3,749 | | | — | | | (11) | | | 3,738 | |
| Changes in equity of noncontrolling interest | — | | | — | | | — | | | 23 | | | 23 | |
| Distribution to member | (999) | | | (442) | | | — | | | — | | | (1,441) | |
| Other comprehensive income (loss), net of income taxes | — | | | — | | | (111) | | | — | | | (111) | |
| Balance, December 31, 2024 | $ | 10,538 | | | $ | 4,974 | | | $ | (2,302) | | | $ | 373 | | | $ | 13,583 | |
See the Combined Notes to Consolidated Financial Statements
94
Combined Notes to Consolidated Financial Statements
(Dollars in millions, unless otherwise noted)
1. Basis of Presentation
Description of Business
We are the nation's largest producer of carbon-free energy and a supplier of energy products and services. Our generating capacity includes primarily nuclear, wind, solar, natural gas, and hydroelectric assets. Through our integrated business operations, we sell electricity, natural gas, and other energy-related products and sustainable solutions to various types of customers, including distribution utilities, municipalities, cooperatives, and commercial, industrial, public sector, and residential customers in markets across multiple geographic regions. We have five reportable segments: Mid-Atlantic, Midwest, New York, ERCOT and Other Power Regions.
Basis of Presentation
Constellation Energy Corporation (“CEG Parent” or the “Company”), a Pennsylvania corporation, was formed for the purpose of separation of Constellation Energy Generation, LLC (“Constellation”, formerly Exelon Generation Company, LLC) and its subsidiaries from its predecessor parent company, Exelon Corporation (“Exelon”), into an independent, publicly traded company. On February 1, 2022, the separation was completed by distributing all the outstanding shares of the Company’s common stock, on a pro rata basis to the holders of its predecessor’s common stock, with the Company holding all the interests in Constellation previously held by Exelon (the "Separation"). Constellation has been an individual registrant since 2002 with the registration of its public debt securities under the Securities Act. Prior to the Separation, Constellation historically filed consolidated financial statements as an individual registrant to reflect its financial position and operating results as a stand-alone, wholly owned subsidiary of Exelon.
The accompanying Consolidated Financial Statements have been prepared in accordance with GAAP for annual financial statements and in accordance with the instructions to Form 10-K and Regulation S-X promulgated by the SEC. The Consolidated Financial Statements include the accounts of our subsidiaries and all intercompany transactions have been eliminated. CEG Parent's prior period financial statements have been adjusted to reflect the balances of Constellation in accordance with applicable guidance. Amounts disclosed relate to CEG Parent and Constellation unless specifically noted as relating to CEG Parent only. Unless otherwise indicated or the context otherwise requires, references herein to the terms “we,” “us,” and “our” refer collectively to CEG Parent and Constellation.
We own 100% of our significant consolidated subsidiaries, either directly or indirectly, except for certain consolidated VIEs. The remaining interests in the consolidated VIEs are included in noncontrolling interests on the Consolidated Balance Sheets. See Note 21 — Variable Interest Entities for additional information on consolidated VIEs.
We consolidate the accounts of entities in which we have a controlling financial interest, after the elimination of intercompany transactions. Where we do not have a controlling financial interest in an entity, proportionate consolidation, equity method accounting or accounting for investments in equity securities with or without readily determinable fair value is applied. We proportionately consolidate our undivided ownership interest in jointly-owned electric plants. Under proportionate consolidation, we separately record our proportionate share of the assets, liabilities, revenues and expenses related to the undivided interest in the asset. See Note 9 — Jointly-Owned Electric Plants for additional information on application of proportionate consolidation.
We apply equity method accounting when we have a significant influence over an investee through an ownership in equity, which generally approximates to a 20% to 50% voting interest. We apply equity method accounting to certain investments and joint ventures. Under equity method accounting, we report our interest in the entity as an investment and our percentage share of the earnings from the entity as single line items in our consolidated financial statements. We use accounting for investments in equity securities with or without readily determinable fair values if we lack a significant influence, which generally results when we hold less than 20% of the common stock of an entity. Under accounting for investments in equity securities with readily determinable fair values, the investments are reported based on quoted prices in active markets and realized and unrealized gains and losses are included in earnings. Under accounting for investments in equity securities without readily determinable fair values, the investments are reported at cost, adjusted for changes from observable transactions for identical or similar investments of the same issuer, less impairment, and changes in measurement are reported in earnings.
Combined Notes to Consolidated Financial Statements
(Dollars in millions, unless otherwise noted)
Note 1 — Basis of Presentation
Separation from Exelon
Prior to completion of the separation, our financial statements include certain transactions with affiliates of Exelon, which are disclosed as related party transactions. After February 1, 2022, all transactions with Exelon or its affiliates are no longer related party transactions.
In order to govern the ongoing relationships with Exelon after the separation, and to facilitate an orderly transition, we entered into several agreements with Exelon, including the following:
•Separation Agreement – sets forth the principal actions to be taken in connection with the separation, including the transfer of assets and assumption of liabilities and establishes certain rights and obligations between us following the distribution
• TSA – governs all matters relating to the provision of services between us and Exelon on a transitional basis, in addition to providing us with certain services. The services include support for information technology, accounting, finance, human resources, security, and various other administrative and operational services (the TSA ended in June 2024)
• Employee Matters Agreement (EMA) – addresses certain employment, compensation and benefits matters, including the allocation of employees between us and Exelon and the allocation and treatment of certain assets and liabilities relating to our employees and former employees
• TMA – governs the respective rights, responsibilities, and obligations between us and Exelon with respect to all tax matters (excluding employee-related taxes covered under the EMA)
Pursuant to the Separation Agreement, we received a cash contribution of $1.75 billion from Exelon on January 31, 2022, the proceeds of which were used to settle $258 million of an intercompany loan from Exelon and $200 million of short-term debt outstanding prior to separation, in addition to a $192 million contribution to our pension plans.
The amounts Exelon billed us for services pursuant to the TSA were not material in 2024 and $151 million and $266 million for the years ended December 31, 2023, and 2022, respectively. The amounts we billed Exelon for services pursuant to the TSA were not material to the periods presented.
Use of Estimates
The preparation of financial statements in conformity with GAAP requires management to make estimates and assumptions that affect the amounts reported in the financial statements and accompanying notes. Areas in which significant estimates have been made include, but are not limited to, the accounting for nuclear decommissioning costs and other AROs, pension and OPEB plans, inventory reserves, allowance for credit losses, long-lived asset valuations and impairment assessments, derivative instruments, goodwill, unamortized energy contracts, fixed asset depreciation, environmental costs and other loss contingencies, taxes and unbilled energy revenues. Actual results could differ from those estimates.
Revenues
Operating Revenues. Our operating revenues generally consist of revenues from contracts with customers involving competitive sales of power, natural gas, and other energy-related products and sustainable solutions. We recognize revenue from contracts with customers to depict the transfer of goods or services to customers in an amount that we expect to be entitled to in exchange for those goods or services. At the end of each reporting period, we accrue an estimate for the unbilled amount of power and natural gas delivered or services provided to customers.
Commodity Derivatives. Derivative instruments are generally recorded at fair value with subsequent changes in fair value recognized as realized and unrealized revenue or expense. The classification of revenue or expense is based on the intent of the transaction. See Note 15 — Derivative Financial Instruments for additional information.
Taxes Directly Imposed on Revenue-Producing Transactions. We collect certain taxes from customers such as sales and gross receipts taxes, along with other taxes, surcharges and fees, that are levied by state or local
Combined Notes to Consolidated Financial Statements
(Dollars in millions, unless otherwise noted)
Note 1 — Basis of Presentation
governments on the sale or distribution of electricity and natural gas and any taxable energy-related products and services. Some of these taxes are imposed on the customer, but paid by us, while others are imposed on us. Where these taxes are imposed on the customer, such as sales taxes, they are reported on a net basis in revenues. However, where these taxes are imposed on us, such as gross receipts taxes, they are reported on a gross basis in revenue and expense in the Consolidated Statements of Operations and Comprehensive Income.
Government Assistance. As a result of the enactment of the IRA, we qualify for certain federal government incentives through eligible activities. These incentives include both refundable and transferable tax credits. The current U.S. GAAP framework does not address the receipt of government assistance by for-profit entities. We account for this government assistance by analogy to International Accounting Standard (IAS) 20, Accounting for Government Grants and Disclosure of Government Assistance, and recognize the benefits when there is reasonable assurance that we will comply with the required conditions and that the benefits will be received. We believe the reasonable assurance term as used in IAS 20 is analogous to the term probable as defined under GAAP related to accounting for contingencies. See Note 6 — Government Assistance for additional information.
Leases
We recognize a ROU asset and lease liability for operating leases with a term of greater than one year. Operating lease ROU assets are included in Other deferred debits and other assets and operating lease liabilities are included in Other current liabilities and Other deferred credits and other liabilities on the Consolidated Balance Sheets. The ROU asset is measured as the sum of (1) the present value of all remaining fixed and in-substance fixed payments using the rate implicit in the lease whenever that is readily determinable or our incremental borrowing rate, (2) any lease payments made at or before the commencement date (less any lease incentives received) and (3) any initial direct costs incurred. The lease liability is measured the same as the ROU asset, but excludes any payments made before the commencement date and initial direct costs incurred. Lease terms include options to extend or terminate the lease if it is reasonably certain they will be exercised. We include non-lease components for most asset classes, which are service-related costs that are not integral to the use of the asset, in the measurement of the ROU asset and lease liability.
Expense for operating leases and leases with a term of one year or less is recognized on a straight-line basis over the term of the lease, unless another systematic and rational basis is more representative of the derivation of benefit from use of the leased property. Variable lease payments are recognized in the period in which the related obligation is incurred and consist primarily of payments for purchases of electricity under contracted generation that are based on the electricity produced by those generating assets. Operating lease expense and variable lease payments are recorded to Purchased power and fuel expense for contracted generation or Operating and maintenance expense for all other lease agreements in the Consolidated Statements of Operations and Comprehensive Income.
Income from operating leases, including subleases, is recognized on a straight-line basis over the term of the lease, unless another systematic and rational basis is more representative of the pattern in which income is earned over the term of the lease. Variable lease payments are recognized in the period in which the related obligation is performed and consist primarily of payments received from sales of electricity under contracted generation that are based on the electricity produced by those generating assets. Operating lease income and variable lease payments are recorded to Operating revenues in the Consolidated Statements of Operations and Comprehensive Income.
Our operating leases consist primarily of contracted generation, real estate including office buildings, and vehicles and equipment. We generally account for contracted generation in which the generating asset is not renewable as a lease if the customer has dispatch rights and obtains substantially all the economic benefits. We generally do not account for contracted generation in which the generating asset is renewable as a lease if the customer does not design the generating asset. We account for land right arrangements that provide for exclusive use as leases while shared use land arrangements are generally not leases.
See Note 11 — Leases for additional information.
Income Taxes
Deferred federal and state income taxes are recorded on temporary differences between the book and tax basis of assets and liabilities and for tax benefits carried forward. ITCs have been deferred in the Consolidated Balance Sheets and are recognized in book income over the life of the related property. We account for uncertain
Combined Notes to Consolidated Financial Statements
(Dollars in millions, unless otherwise noted)
Note 1 — Basis of Presentation
income tax positions using a benefit recognition model with a two-step approach; a more-likely-than-not recognition criterion and a measurement approach that measures the position as the largest amount of tax benefit that is greater than 50% likely of being realized upon ultimate settlement. If it is not more-likely-than-not that the benefit of the tax position will be sustained on its technical merits, no benefit is recorded. Uncertain tax positions that relate only to timing of when an item is included on a tax return are considered to have met the recognition threshold. We recognize accrued interest related to unrecognized tax benefits in Interest expense, net or Other, net (interest income) and recognize penalties related to unrecognized tax benefits in Other, net in the Consolidated Statements of Operations and Comprehensive Income.
Cash and Cash Equivalents
We consider investments purchased with an original maturity of three months or less to be cash equivalents.
Restricted Cash and Cash Equivalents
Restricted cash and cash equivalents represent funds that are restricted to satisfy designated current liabilities. As of December 31, 2024 and 2023, restricted cash and cash equivalents primarily represented the payment of medical, dental, vision, and long-term disability benefits and project-specific nonrecourse financing structures for debt service and financing of operations of the underlying entities. See Note 16 — Debt and Credit Agreements and Note 22 — Supplemental Financial Information for additional information.
Allowance for Credit Losses on Accounts Receivables
The allowance for credit losses reflects our best estimate of losses on the customers' accounts receivable balances based on historical experience, current information, and reasonable and supportable forecasts.
The allowance for credit losses for our retail and wholesale customers is based on accounts receivable aging historical experience coupled with specific identification through a credit monitoring process, which considers current conditions and forward-looking information such as industry trends, macroeconomic factors, changes in the regulatory environment, external credit ratings, publicly available news, payment status, payment history, and the exercise of collateral calls. When a wholesale customer’s risk characteristics are no longer aligned with the pooled population, we use specific identification to develop an allowance for credit losses. Adjustments to the allowance for credit losses are recorded in Operating and maintenance expense in the Consolidated Statements of Operations and Comprehensive Income.
We have certain non-customer receivables in Current Assets and Other deferred debits and other assets which primarily are with governmental agencies. The allowance for credit losses related to these receivables is not material. We monitor these balances and will record an allowance if there are indicators of a decline in credit quality.
Variable Interest Entities
We account for our investments in and arrangements with VIEs based on the following specific requirements:
•qualitative assessment of factors determinant in whether we have a controlling financial interest,
•ongoing reconsideration of this assessment, and
•where we consolidate a VIE (as primary beneficiary), disclosure of (1) the assets of the consolidated VIE, if they can be used to only settle specific obligations of the consolidated VIE, and (2) the liabilities of a consolidated VIE for which creditors do not have recourse to the general credit of the primary beneficiary.
See Note 21 — Variable Interest Entities for additional information.
Inventories
Inventory is recorded at the lower of weighted average cost or net realizable value. Provisions are recorded for excess and obsolete inventory. Natural gas, oil, and emission allowances are generally included in Inventory when purchased and are expensed to Purchased power and fuel expense when consumed. Materials and supplies are generally included in Inventory when purchased and are expensed to Operating and maintenance, or capitalized to Property, plant and equipment, as appropriate, when installed or used.
Combined Notes to Consolidated Financial Statements
(Dollars in millions, unless otherwise noted)
Note 1 — Basis of Presentation
Debt and Equity Security Investments
Debt and Equity Investments within NDT funds. We have debt and equity securities held in our NDT funds which are measured and recorded at fair value. Realized and unrealized gains and losses, net of trust level taxes, on our NDT funds associated with the Regulatory Agreement Units are offset in Noncurrent payables related to Regulatory Agreement Units. Realized and unrealized gains and losses, net of trust level taxes, on our NDT funds associated with the Non-Regulatory Agreement Units are included in Other, net in the Consolidated Statements of Operations and Comprehensive Income. For equity securities without readily determinable fair values, we have elected to use the NAV for qualifying investments as a practical expedient to determine the fair values. Our NDT funds are classified as current or noncurrent assets, depending on the timing of the decommissioning activities and expected payment of income taxes on trust earnings. See Note 10 — Asset Retirement Obligations and Note 17 — Fair Value of Financial Assets and Liabilities for additional information.
Equity Security Investments with Readily Determinable Fair Values. We have certain equity securities with readily determinable fair values. Realized and unrealized gains and losses are included in Other, net in the Consolidated Statements of Operations and Comprehensive Income. See Note 17 — Fair Value of Financial Assets and Liabilities for additional information.
Equity Security Investments without Readily Determinable Fair Values. We have certain equity securities without readily determinable fair values. We have elected to use the measurement alternative to measure these investments, defined as cost adjusted for changes from observable transactions for identical or similar investments of the same issuer, less impairment. Changes in measurement, are reported in Other, net in the Consolidated Statements of Operations and Comprehensive Income. See Note 17 — Fair Value of Financial Assets and Liabilities for additional information.
Property, Plant and Equipment
Property, plant and equipment is recorded at acquired cost. Acquired cost includes construction-related direct labor and material costs. When appropriate, acquired cost also includes capitalized interest. Costs associated with nuclear outages and planned major maintenance activities, are expensed to Operating and maintenance expense or capitalized to Property, plant, and equipment based on the nature of the activities in the period incurred. The cost of repairs and maintenance and minor replacements of property is charged to Operating and maintenance expense in the Consolidated Statements of Operations and Comprehensive Income as incurred.
Upon retirement, the cost of property is generally charged to accumulated depreciation in accordance with the composite and group methods of depreciation. Upon replacement of an asset, the costs to remove the asset, net of salvage, are capitalized to gross plant when incurred as part of the cost of the newly installed asset and recorded to depreciation expense over the life of the new asset. Removal costs, net of salvage, incurred for property that will not be replaced is charged to Operating and maintenance expense as incurred. Certain assets follow the unitary method of depreciation and recognize gains and losses in the period of replacement or retirement. These gains and losses are recorded in Operating and maintenance expense in the Consolidated Statements of Operations and Comprehensive Income.
Capitalized Software. Certain costs, such as design, coding, and testing incurred during the application development stage of software projects that are internally developed or purchased for operational use are capitalized in Property, plant and equipment in the Consolidated Balance Sheets. Similar costs incurred for cloud-based solutions treated as service arrangements are capitalized in Other current assets and Deferred debits and other assets in the Consolidated Balance Sheets. Such capitalized amounts are amortized ratably over the expected lives of the projects when they become operational, generally not to exceed five years.
Capitalized Interest. During construction, we capitalize the costs of debt funds. Most projects will use a debt rate calculated using the general corporate debt pool. In some cases, projects are specifically financed and use a project specific debt rate, which is excluded from the general corporate debt pool. Capitalization of debt funds is recorded as a charge to construction work in progress and as a non-cash credit to interest expense. See Note 8 — Property, Plant, and Equipment, Note 9 — Jointly-Owned Electric Plants and Note 22 — Supplemental Financial Information for additional information.
Combined Notes to Consolidated Financial Statements
(Dollars in millions, unless otherwise noted)
Note 1 — Basis of Presentation
Nuclear Fuel
The cost of nuclear fuel is capitalized in Property, plant and equipment and charged to Purchased power and fuel using the unit-of-production method. Any potential future SNF disposal fees will also be expensed through Purchased power and fuel expense. Additionally, certain on-site SNF storage costs are being reimbursed by the DOE since a DOE (or government-owned) long-term storage facility has not been completed. See Note 18 — Commitments and Contingencies for additional information regarding the cost of SNF storage and disposal.
Depreciation and Amortization
Except for the amortization of nuclear fuel, depreciation, inclusive of ARC, is generally recorded over the estimated useful lives of property, plant and equipment on a straight-line basis using the group, composite or unitary methods of depreciation. Two methods of depreciating multiple asset groups exist: the group method and the composite method. The group method is typically for groups of assets that are largely homogenous and have approximately the same useful lives. The composite method is used when the assets are heterogeneous and have different lives. Under both methods, a reporting entity depreciates the assets over the average life of the assets in the group. The estimated useful lives are based on a combination of depreciation studies, historical retirements, site licenses and management estimates of operating costs and expected future energy market conditions. See Note 8 — Property, Plant, and Equipment for additional information regarding depreciation, and Note 22 — Supplemental Financial Information for additional information regarding amortization expense of nuclear fuel.
Asset Retirement Obligations
We estimate and recognize a liability for our legal obligation to perform asset retirement activities even though the timing and/or methods of settlement may be conditional on future events. We generally update our nuclear decommissioning ARO annually, unless circumstances warrant more frequent updates, based on our annual evaluation of cost escalation factors and probabilities assigned to the multiple outcome scenarios within our probability-weighted discounted cash flow models. Our multiple outcome scenarios are generally based on decommissioning cost studies which are updated, on a rotational basis, for each of our nuclear units at least every five years, unless circumstances warrant more frequent updates. AROs are accreted throughout each year to reflect the time value of money for these present value obligations through a charge to Operating and maintenance expense in the Consolidated Statements of Operations and Comprehensive Income for Non-Regulatory Agreement Units and through an offsetting decrease in noncurrent payables related to Regulatory Agreement Units. See Note 10 — Asset Retirement Obligations for additional information.
Accounting Implications of the Regulatory Agreement Units
Based on the requirements of the ICC, PAPUC, and PUCT that dictate our obligations related to the shortfall or excess of NDT funds necessary for decommissioning the former ComEd, former PECO, and STP units, decommissioning-related activities net of applicable taxes, including realized and unrealized gains and losses on the NDT funds, depreciation of the ARC, and accretion of the decommissioning obligation are generally offset in the Consolidated Statements of Operations and Comprehensive Income and are recorded as noncurrent payables in the Consolidated Balance Sheets (within Payables related to Regulatory Agreement Units). See Note 10 — Asset Retirement Obligations for additional information.
Asset Impairments
Long-Lived Assets. We regularly monitor and evaluate the carrying value of long-lived assets or asset groups for recoverability whenever events or changes in circumstances indicate that the carrying value of those assets may not be recoverable. Indicators of impairment may include a deteriorating business climate, including, but not limited to, declines in energy prices, condition of the asset, or plans to dispose of a long-lived asset significantly before the end of its useful life. We determine if long-lived assets or asset groups are potentially impaired by comparing the undiscounted expected future cash flows to the carrying value when indicators of impairment exist. When the undiscounted cash flow analysis indicates a long-lived asset or asset group may not be recoverable, the amount of the impairment loss is determined by measuring the excess of the carrying amount of the long-lived asset or asset group over its fair value. Impairment losses are recorded in Operating and maintenance expense in the Consolidated Statements of Operations and Comprehensive Income.
Combined Notes to Consolidated Financial Statements
(Dollars in millions, unless otherwise noted)
Note 1 — Basis of Presentation
Goodwill. Goodwill represents the excess of the purchase price paid over the estimated fair value of the net assets acquired and liabilities assumed in the acquisition of a business. Goodwill is not amortized, but is tested for impairment at least annually or on an interim basis if an event occurs or circumstances change that would more likely than not reduce the fair value of a reporting unit below its carrying value. See Note 2 — Mergers, Acquisitions, and Dispositions and Note 12 — Intangible Assets for additional information.
Equity Method Investments. We regularly monitor and evaluate equity method investments to determine whether they are impaired. An impairment is recorded when the investment has experienced a decline in value that is other-than-temporary in nature. Additionally, if the entity in which we hold an investment recognizes an impairment loss, we would record the proportionate share of that impairment loss and evaluate the investment for an other-than-temporary decline in value. These impairment losses are recorded in Equity in income (losses) of unconsolidated affiliates in the Consolidated Statements of Operations and Comprehensive Income.
Equity Security Investments. Equity investments with readily determinable fair values are measured and recorded at fair value with any changes in fair value recorded in Other, net in the Consolidated Statements of Operations and Comprehensive Income. For equity securities without readily determinable fair values, we have elected to use the measurement alternative to measure these investments, defined as cost adjusted for changes from observable transactions for identical or similar investments of the same issuer, less impairment. Investments in equity securities without readily determinable fair values are qualitatively assessed for impairment each reporting period. If it is determined that the equity security is impaired, an impairment loss will be recognized in Other, net in the Consolidated Statements of Operations and Comprehensive Income in the amount by which the security’s carrying amount exceeds its fair value.
Derivative Financial Instruments
All derivatives are recognized on the balance sheet at their fair value unless they qualify for certain exceptions, including NPNS. For derivatives intended to serve as economic hedges, changes in fair value are recognized in earnings each period. Amounts classified in earnings are included in Operating revenues, Purchased power and fuel, or Interest expense in the Consolidated Statements of Operations and Comprehensive Income based on the activity the transaction is economically hedging. While most of the derivatives serve as economic hedges, there are also derivatives entered into for proprietary trading purposes, subject to our RMP, and changes in the fair value of those derivatives are recorded in Operating revenues in the Consolidated Statements of Operations and Comprehensive Income. Cash inflows and outflows related to derivative instruments are included as a component of operating, investing, or financing cash flows in the Consolidated Statements of Cash Flows, depending on the nature of each transaction.
As part of the energy marketing business, we enter contracts to buy and sell energy to meet the requirements of our customers. These contracts include short-term and long-term commitments to purchase and sell energy and energy-related products in the energy markets with the intent and ability to deliver or take delivery of the underlying physical commodity. NPNS are contracts where physical delivery is probable, quantities are expected to be used or sold in the normal course of business over a reasonable period and will not be financially settled. Revenues and expenses on derivative contracts that qualify, and are designated, as NPNS are recognized when the underlying physical transaction is completed. While these contracts are considered derivative financial instruments, they are not required to be recorded at fair value. See Note 15 — Derivative Financial Instruments for additional information.
Retirement Benefits
Effective upon separation, we sponsor defined benefit pension and OPEB plans as described in Note 14 — Retirement Benefits. The plan obligations and costs of providing benefits under these plans were measured upon separation as of February 1, 2022 and are remeasured annually as of year-end. The measurements involved various factors, assumptions, and accounting elections. The impact of assumption changes or experiences different from that assumed on pension and OPEB obligations is recognized over time, not immediately in the Consolidated Statements of Operations and Comprehensive Income. For defined benefit pension plans, gains or losses exceeding the greater of ten percent of the PBO or the MRV of plan assets are amortized over the expected average remaining service period of plan participants. For OPEB plans, gains or losses exceeding the greater of ten percent of the APBO or the MRV of plan assets are amortized over the average future remaining lifetime of the current inactive population.
Combined Notes to Consolidated Financial Statements
(Dollars in millions, unless otherwise noted)
Note 1 — Basis of Presentation
We separately report the pension and OPEB service cost and non-service cost (credit) components of net periodic benefit costs (credits) for all plans in our Consolidated Statements of Operations and Comprehensive Income. Effective February 1, 2022, the service cost component remains in Operating and maintenance expense and Property, plant, and equipment, net (where criteria for capitalization of direct labor has been met) while the non-service cost (credit) components are included in Other, net, in accordance with single employer plan accounting.
Renewable Energy Credits
RECs are included in Renewable energy credits in the Consolidated Balance Sheets. Purchased RECs are recorded at cost on the date they are purchased and internally generated RECs are recognized at a zero-cost basis when generated. The cost of RECs purchased on a stand-alone basis is based on the transaction price, while the cost of RECs acquired through PPAs represents the relative fair value at contract inception. Generally, revenue for RECs that are sold to a counterparty under a contract that specifically identifies a power plant are recognized at a point in time when the power is produced. This includes both bundled and unbundled REC sales. Otherwise, the revenue is recognized upon physical transfer of the REC to the customer.
2. Mergers, Acquisitions, and Dispositions
Proposed Acquisition of Calpine Corporation
On January 10, 2025, we entered an agreement and plan of merger (Merger Agreement) with Calpine Corporation (Calpine) under which we will acquire all the outstanding equity interests of Calpine in a cash and stock transaction. Calpine owns and operates a generation fleet of natural gas, geothermal, battery storage, and solar assets with over 27 GWs of generation capacity, in addition to a competitive retail electric supplier platform serving approximately 60 TWhs of load annually. This acquisition is complementary to and aligns strategically with our existing business operations and provides both increased scale and meaningful market diversification.
The merger consideration at closing will consist of an aggregate of 50 million newly issued shares of our common stock, no par value, and $4.5 billion in cash. We will also assume approximately $12.7 billion of Calpine’s outstanding debt. We expect to fund the cash portion of the transaction through a combination of cash on hand and cash flow generated by Calpine in the period between signing and closing of the transaction (that will be assumed at closing). Per the terms of the Merger Agreement, consummation of the transaction is to occur by December 31, 2025 (which date may be automatically extended to June 1, 2026, as further provided in the Merger Agreement). The Merger Agreement also provides for certain termination rights, and under certain specified circumstances, we may be required to pay Calpine a termination fee of $500 million. Completion of the transaction is conditioned upon review of the transaction by the DOJ, the expiration or termination of the applicable waiting period under the HSR Act, and approval by the FERC, NYPSC, and PUCT, in addition to other regulatory bodies, and is subject to other customary closing conditions.
In connection with certain of the regulatory approvals required for the transaction, the companies will propose to divest certain generating assets located in PJM, the only market where there is a material overlap of generation owned by both companies.
The transaction will be accounted for as a business combination using the acquisition method of accounting and we will record the fair value of the assets acquired and liabilities assumed as of the acquisition date. To the extent that the consideration transferred is greater than the fair value of the net assets acquired, goodwill will be recorded. To the extent the fair value of the net assets acquired is greater than the consideration transferred, a bargain purchase gain will be recorded.
Through December 31, 2024, fees incurred as part of the acquisition were not material to the Consolidated Statements of Operations and Comprehensive Income.
Acquisition of Joint Ownership in South Texas Project
In November 2023, we completed the acquisition of NRG South Texas LP (renamed and converted as Constellation South Texas, LLC), which owns a 44% undivided ownership interest in the jointly-owned STP, a 2,645 MW, dual-unit nuclear plant located in Bay City, Texas. The consideration transferred was $1.66 billion. Other owners include City Public Service Board of San Antonio (CPS, 40%) and the City of Austin, Texas (Austin
Combined Notes to Consolidated Financial Statements
(Dollars in millions, unless otherwise noted)
Note 2 — Mergers, Acquisitions, and Dispositions
Energy, 16%). This acquisition is complementary to and aligned strategically with our existing clean energy business operations.
The acquisition was accounted for using the acquisition method of accounting in accordance with authoritative guidance, which requires, among other things, the assets acquired and liabilities assumed to be recognized at their respective fair value as of the acquisition date. The excess of the purchase price over fair value of our proportionate share of the assets acquired and liabilities assumed was recorded to goodwill. The goodwill recognized is primarily driven by the opportunity for continued operations through 80 years and the value of STP’s carbon-free energy that is not fully reflected by the markets. The goodwill amount has been assigned entirely to the ERCOT operating segment. See Note 12 — Intangible Assets for additional information. The total amount of goodwill is expected to be deductible for tax purposes over the tax amortization period.
The fair values of STP’s assets and liabilities were determined based on significant estimates and assumptions that are judgmental in nature, including projected future cash flows (including timing), discount rates reflecting risk inherent in the future cash flows and future power and fuel market prices.
The following table summarizes the final acquisition-date fair value of the consideration transferred and the assets and liabilities assumed for the STP acquisition:
| | | | | | | | |
| Cash paid for purchase price | | $ | 1,657 | |
| | |
| Identifiable assets acquired and liabilities assumed | | |
| Property, plant, and equipment | | 1,254 | |
| Nuclear decommissioning trust funds | | 869 | |
| Inventories, net | | 47 | |
| Other long-term assets | | 40 | |
| Other current assets | | 11 | |
| | |
| Total assets | | 2,221 | |
| | |
| Asset retirement obligations | | 429 | |
| Payables related to Regulatory Agreement Units | | 376 | |
| Deferred income taxes and unamortized investment tax credits | | 65 | |
| Accounts payable and accrued expenses | | 42 | |
| Pension and OPEB obligations | | 25 | |
| Other long-term liabilities | | 5 | |
| | |
| | |
| | |
| Total liabilities | | 942 | |
| Total net identifiable assets, at fair value | | 1,279 | |
| | |
| Goodwill | | $ | 378 | |
The operating revenues and results of operations for STP have been included in the Consolidated Statements of Operations and Comprehensive Income from the date of acquisition and were not material for the year ended December 31, 2023. The pro forma effects of this acquisition are not significant to our reported results for any periods presented. Accordingly, no pro forma financial information has been presented herein.
In July 2023, NRG Energy, Inc. (NRG) accepted service of a lawsuit filed by the City of San Antonio, Texas, acting by and through CPS, in the 130th District Court of Matagorda County, Texas against NRG and certain of its subsidiaries, claiming the existence of a right of first refusal that applies to the transaction contemplated between us and NRG. In July 2023, we intervened in the lawsuit and Austin Energy also intervened in the lawsuit claiming a similar right of first refusal. Per the terms of the Equity Purchase Agreement, NRG made representations that no right of first refusal applied to the transaction contemplated between us.
In May 2024, we executed a settlement agreement with all parties (CPS/City of San Antonio, Austin, and NRG), resolving all litigation involving our purchase of the ownership interest in STP. The terms of the settlement include us selling a 2% ownership interest in STP to CPS at the same price and terms that we paid NRG for our 44%
Combined Notes to Consolidated Financial Statements
(Dollars in millions, unless otherwise noted)
Note 2 — Mergers, Acquisitions, and Dispositions
interest, subject to regulatory approvals from the NRC and the Public Utility Commission of Texas. Pursuant to the settlement, CPS and Austin filed Notices of Dismissal with Prejudice with the Court, which ends the litigation, and likewise withdrew their pending objections to the sale with the NRC. As a result of the settlement, we have reflected assets and liabilities associated with a 2% undivided ownership interest in STP as held for sale. The held for sale amounts are included in the Other current assets and Other current liabilities balances in the Consolidated Balance Sheets as of December 31, 2024. Closing is expected to occur within the first half of 2025. Upon closing of the sale, we and CPS will each own a 42% interest in STP, and Austin’s interest will remain at 16%. The terms of settlement are not expected to have a material impact on our consolidated financial statements.
3. Regulatory Matters
The following matters below discuss the status of our material regulatory and legislative proceedings.
New England Regulatory Matters
Mystic Units 8 and 9 Cost of Service Agreement. In December 2018, FERC issued an order accepting a cost of service agreement for Mystic Units 8 and 9 for the period between June 1, 2022 to May 31, 2024. The agreement was intended to preserve the two gas-fired electric generating units for the two-year period while allowing the Mystic units to recover their costs of operating, including a substantial portion of the costs associated with the adjacent EMT. Upon the expiration of the agreement on May 31, 2024, the two generating units retired.
The Mystic COS requires an annual process whereby we identify and support our projected costs under the agreement and/or true-up previous projections to the actual costs incurred. Interested parties then have the opportunity to challenge our filings. In September 2022, we made our second of the five annual filings at FERC. In December 2023, FERC issued an order setting for settlement/hearing certain components of the second annual filing, including the issue of Mystic’s recovery of historical rate base costs. In July 2024, the active parties to the proceeding reached a settlement in principle to resolve the second annual filing. The same parties then proceeded to reach a global settlement that would resolve all outstanding matters related to the Mystic COS, including the fourth and fifth annual filing proceedings. A global settlement was filed with FERC in November 2024, and FERC approved the settlement in January 2025. The global settlement does not have a material financial impact on our consolidated financial statements.
Federal Regulatory Matters
Inflation Reduction Act of 2022. In August 2022, President Biden signed into law the IRA, which, among other things, includes federal tax credits, certain of which are transferable or fully refundable, for a number of clean energy technologies including existing nuclear plants (45U). In addition, the IRA provides for a federal tax credit for technology-neutral clean energy production (45Y PTC or 48E ITC). We believe the planned restart of Crane and our planned nuclear uprates will be eligible for these credits. The nuclear PTC recognizes the contributions of carbon-free nuclear power by providing a federal tax credit of up to $15/MWh, subject to phase-out, beginning in 2024 and continuing through 2032. The nuclear PTC includes adjustments for inflation. The PTC benefiting existing nuclear plants included in the IRA continues to be the subject of additional guidance issued from the U.S. Treasury and IRS.
Operating License Renewals
Conowingo Hydroelectric Project. In 2012, we submitted an application to FERC for a new license for the Conowingo Hydroelectric Project (Conowingo). In connection with our efforts to obtain a water quality certification pursuant to Section 401 of the Clean Water Act (401 Certification) from MDE for Conowingo, we had been working with MDE and other stakeholders to resolve water quality licensing issues, including: (1) water quality, (2) fish habitat, and (3) sediment.
In 2019, we and MDE filed with FERC a Joint Offer of Settlement (Offer of Settlement) that would resolve all outstanding issues relating to the 401 Certification. FERC subsequently issued a new 50-year license for Conowingo, effective March 1, 2021. Several environmental groups appealed FERC’s ruling to the U.S. Court of Appeals for the D.C. Circuit. The court of appeals issued a decision vacating FERC’s decision to grant Conowingo its license renewal and sending the matter back to FERC for further proceedings. Upon issuance of
Combined Notes to Consolidated Financial Statements
(Dollars in millions, unless otherwise noted)
Note 3 — Regulatory Matters
the mandate from the U.S. Court of Appeals for the D.C. Circuit, we began operating under an annual license, which renews automatically, containing the same terms as the license that was in effect prior to the 2021 FERC order.
MDE informed us that as a result of the U.S. Court of Appeals decision, they would be resuming their administrative reconsideration of the 401 Certification. In response to the procedure outlined by the MDE, supplemental briefs on the 401 Certification were filed by the Lower Susquehanna Riverkeeper Association and Waterkeepers Chesapeake (jointly) and us. In addition, we filed a supplemental reply brief. We are currently participating in mediation with MDE and the parties that sought reconsideration of the 401 Certification. We are unable to further predict the outcome of this proceeding at this time. Depreciation provisions continue to assume operation through 2071 given our expectation that a 50-year license will be issued.
Peach Bottom Units 2 and 3. In March 2020, the NRC approved a second 20-year license renewal for Peach Bottom Units 2 and 3. As a result, Peach Bottom Units 2 and 3 were granted the authority to operate through 2053 and 2054, respectively.
Notwithstanding its 2020 approval, in February 2022, the NRC took action to modify Peach Bottom's subsequently renewed licenses in response to a request for hearing that the NRC had not previously adjudicated. In its February 2022 decision, the NRC reversed itself and concluded that the previous environmental review required by the National Environmental Policy Act (NEPA) for the Peach Bottom subsequently renewed licenses was incomplete because it did not adequately address environmental impacts resulting from renewing the units’ licenses for an additional 20 years. As a result, the NRC undertook a rulemaking to modify its regulations and guidance to specifically address environmental impacts during the period of subsequent license renewal. In addition, the NRC modified the expiration dates for the Peach Bottom licenses from 2053 and 2054 to 2033 and 2034, respectively, pending the completion of the updated NEPA analysis. The NRC approved final revisions to the rule in May 2024, and we have begun working with the NRC to close out the remaining environmental issues and restore the Peach Bottom expiration dates to 2053 and 2054. Depreciation provisions and ARO assumed retirement dates continue to assume Peach Bottom Units 2 and 3 will operate through 2053 and 2054, respectively, given our expectation that the previously approved expiration dates will be restored.
4. Revenue from Contracts with Customers
We recognize revenue from contracts with customers to depict the transfer of goods or services to customers at an amount that we expect to be entitled to in exchange for those goods or services. Our primary sources of revenue include competitive sales of power, natural gas, and other energy-related products and sustainable solutions. The performance obligations, revenue recognition, and payment terms associated with these sources of revenue are further discussed in the table below. There are no significant financing components for these sources of revenue.
Unless otherwise noted, for each of the significant revenue categories and related performance obligations described below, we have the right to consideration from the customer in an amount that corresponds directly with the value transferred to the customer for the performance completed to date. Therefore, we generally recognize revenue in the amount for which we have the right to invoice the customer. As a result, there are generally no significant judgments used in determining or allocating the transaction price.
Combined Notes to Consolidated Financial Statements
(Dollars in millions, unless otherwise noted)
Note 4 — Revenue from Contracts with Customers
| | | | | | | | | | | | | | |
| Revenue Source | Description | Performance Obligation | Timing of Revenue Recognition | Payment Terms |
| Power Sales | Sales of power and other energy-related products to wholesale and retail customers through our customer-facing business | Various, including the delivery of power (generally delivered over time) and other energy-related products such as capacity (generally delivered over time), CMCs, ZECs, RECs or other ancillary services (generally delivered at a point in time) | Concurrently as power is generated for bundled power sale contracts (a) | Generally within the month following delivery to the customer |
| Natural Gas Sales | Sales of natural gas to wholesale and retail customers through our customer-facing business | Various, including the delivery of natural gas (generally delivered overtime) and sustainable natural gas attributes (generally delivered at a point in time) | Over time as the natural gas is delivered to the customer | Generally within the month following delivery to the customer |
| Other Products and Services | Sales of other energy-related products and sustainable solutions, such as long-term construction and installation of energy efficiency assets and new power generating facilities, primarily to C&I customers | Construction and/or installation of the asset for the customer | Revenues and associated costs are recognized throughout the contract term using an input method to measure progress towards completion(b) | Generally within 30 or 45 days from the invoice date |
__________
(a)Certain contracts may contain limits on the total amount of revenue we are able to collect over the entire term of the contract. In such cases, we estimate the total consideration expected to be received over the term of the contract net of the constraint and allocate the expected consideration to the performance obligations in the contract such that revenue is recognized ratably over the term of the entire contract as the performance obligations are satisfied.
(b)The method recognizes revenue based on the various inputs used to satisfy the performance obligation, such as costs incurred and total labor hours expended. The total amount of revenue that will be recognized is based on the agreed upon contractually-stated amount. The average contract term for these projects is approximately 18 months.
We incur incremental costs in order to execute certain retail power and gas sales contracts. These costs, which primarily relate to retail broker fees and sales commissions, are capitalized when incurred as contract acquisition costs and generally amortized over the corresponding term of the contract. These capitalized costs and related amortization were not material as of and for the years ended December 31, 2024 and 2023.
Contract Balances
Contract Assets
We record contract assets for the revenue recognized on the construction and installation of energy efficiency assets and new power generating facilities before we have an unconditional right to bill for and receive the consideration from the customer. These contract assets are subsequently reclassified to receivables when the right to payment becomes unconditional. We record contract assets and contract receivables in Other current assets and Customer accounts receivable, net, respectively, in the Consolidated Balance Sheets.
Combined Notes to Consolidated Financial Statements
(Dollars in millions, unless otherwise noted)
Note 4 — Revenue from Contracts with Customers
The following table provides a rollforward of the contract assets reflected in the Consolidated Balance Sheets:
| | | | | | | | | | | | | | | |
| | | | | |
| 2024 | | 2023 | | | | |
| Beginning balance as of January 1 | $ | 82 | | | $ | 130 | | | | | |
| Amounts reclassified to receivables | (95) | | | (127) | | | | | |
| Revenues recognized | 103 | | | 79 | | | | | |
| | | | | | | |
| Ending balance as of December 31 | $ | 90 | | | $ | 82 | | | | | |
Contract Liabilities
We record contract liabilities when consideration is received or due prior to the satisfaction of the performance obligations. We record contract liabilities in Other current liabilities and Other deferred credits and other liabilities in the Consolidated Balance Sheets. These contract liabilities primarily relate to upfront consideration received or due for equipment service plans, the Mystic COS, and the Illinois ZEC program. The Mystic COS, which ended in May 2024, included upfront consideration received that differs from the recognized earnings over the cost of the service period. The Illinois ZEC program introduces an annual cap on the total consideration to be received by us for each delivery period. The ZEC price is established on a per MWh of production basis with a maximum annual cap for total compensation to be received for each planning year (June through May), while requiring delivery of all ZECs produced by our participating facilities during each delivery period. ZECs delivered to Illinois utilities in excess of the annual cost cap may be paid in subsequent years if the payments do not exceed the prescribed annual cost cap for that year. The contract liability balance as of December 31, 2024 primarily related to equipment service plans. The balance as of December 31, 2023 primarily related to equipment services plans and the Mystic COS.
The following table provides a rollforward of the contract liabilities reflected in the Consolidated Balance Sheets:
| | | | | | | | | | | | | | | | | |
| |
| 2024 | | 2023 | | 2022 |
| Beginning balance as of January 1 | $ | 40 | | | $ | 47 | | | $ | 75 | |
| Consideration received | 120 | | | 331 | | | 339 | |
| Revenues recognized | (127) | | | (338) | | | (367) | |
| | | | | |
| Ending balance as of December 31 | $ | 33 | | | $ | 40 | | | $ | 47 | |
Transaction Price Allocated to Remaining Performance Obligations
The following table shows the amounts of future revenues expected to be recorded in each year for performance obligations that are unsatisfied or partially unsatisfied as of December 31, 2024. This disclosure only includes contracts for which the total consideration is fixed and determinable at contract inception. The average contract term varies by customer type and commodity but ranges from one month to several years. This disclosure excludes mark-to-market derivatives and certain power and gas sales contracts which contain variable volumes and/or variable pricing.
| | | | | | | | | | | | | | | | | | | | | | | | | | | | | | | | | | | |
| 2025 | | 2026 | | 2027 | | 2028 | | 2029 and thereafter | | Total |
| Remaining performance obligations | $ | 251 | | | $ | 211 | | | $ | 147 | | | $ | 95 | | | $ | 211 | | | $ | 915 | |
Transaction Price Allocated to Previously Satisfied Performance Obligations
Our Clinton and Quad Cities units contract with certain utilities in Illinois that require delivery of all ZECs produced during each planning year (June through May), with total compensation limited by an annual cap for each planning year designed to limit the cost of ZECs to each utility's customers. ZECs delivered that, if paid, would result in the annual cap being exceeded may be paid in subsequent years at the vintage year price as long as the payments would not exceed the annual cap in the year paid. In each planning year since the program commenced in June 2017, we delivered ZECs to the utilities in excess of the annual compensation cap.
The ZEC price and annual compensation cap effective for each planning year are administratively determined by the IPA. For the June 2023 through May 2024 planning year, the ZEC price was established at $0.30 per ZEC, subject to an annual cap of $224 million. ZECs generated and delivered during the planning year did not exceed
Combined Notes to Consolidated Financial Statements
(Dollars in millions, unless otherwise noted)
Note 4 — Revenue from Contracts with Customers
the annual cap, providing capacity to compensate for ZECs delivered in prior planning years in excess of the compensation cap. In 2023, we recognized $218 million of revenue as a receivable for ZECs delivered in prior planning years, with payment received in the third quarter of 2024. For the June 2024 through May 2025 planning year, the ZEC price has been established at $9.38 per ZEC, subject to an annual cap of $222 million. Revenue recognized in 2024 for ZECs delivered in prior planning years was not material.
Revenue Disaggregation
We disaggregate the revenue recognized from contracts with customers into categories that depict how the nature, amount, timing, and uncertainty of revenue and cash flows are affected by economic factors. See Note 5 — Segment Information for the presentation of revenue disaggregation.
5. Segment Information
Operating segments are determined based on information used by the CODM in deciding how to evaluate performance and allocate resources. We have five reportable segments consisting of the Mid-Atlantic, Midwest, New York, ERCOT, and all other power regions referred to collectively as “Other Power Regions.”
The basis for our reportable segments is the integrated management of our electricity business that is located in different geographic regions, and largely representative of the footprints of ISO/RTO and/or NERC regions, which utilize multiple supply sources to provide electricity through various distribution channels (wholesale and retail). Our hedging strategies and risk metrics are also aligned to these same geographic regions. Descriptions of each of our five reportable segments are as follows:
•Mid-Atlantic represents operations in the eastern half of PJM, which includes New Jersey, Maryland, Virginia, West Virginia, Delaware, the District of Columbia, and parts of Pennsylvania and North Carolina.
•Midwest represents operations in the western half of PJM and the United States footprint of MISO, excluding MISO’s Southern Region.
•New York represents operations within NYISO.
•ERCOT represents operations within Electric Reliability Council of Texas that covers a majority of the state of Texas.
•Other Power Regions:
•New England represents operations within ISO-NE.
•South represents operations in FRCC, MISO’s Southern Region, and the remaining portions of SERC not included within MISO or PJM.
•West represents operations in WECC, which includes CAISO.
•Canada represents operations across the entire country of Canada and includes AESO, OIESO, and the Canadian portion of MISO.
Constellation's CEO is considered the CODM and evaluates the performance of our electric business activities and allocates resources based on segment RNF, primarily through review of budget-to-actual variance analyses. RNF is Operating revenues net of Purchased power and fuel expenses. We believe this is a useful measurement of operational performance, although it is not a presentation defined under GAAP and may not be comparable to other companies’ presentations or deemed more useful than the GAAP information provided elsewhere in this report. In our evaluation of operating segments, we noted the CODM reviews a variety of performance and profitability measures at a consolidated level with a primary focus on RNF reporting at the regional level. Our operating revenues include all sales to third parties as well as government assistance. Purchased power and fuel expenses are considered the significant segment expense. Purchased power costs include all costs associated with the procurement and supply of electricity including capacity, energy, and ancillary services. Fuel expense includes the fuel costs for our owned generation and fuel costs associated with tolling agreements. The results of our other business activities are not regularly reviewed by the CODM and are therefore not classified as operating segments or included in the regional reportable segment amounts. These activities include wholesale
Combined Notes to Consolidated Financial Statements
(Dollars in millions, unless otherwise noted)
Note 5 — Segment Information
and retail sales of natural gas, energy-related sales in the United Kingdom, as well as sales of other energy-related products and sustainable solutions that are not significant to our overall results of operations. Further, our unrealized mark-to-market gains and losses on economic hedging activities and our amortization of certain intangible assets and liabilities relating to commodity contracts recorded at fair value from mergers and acquisitions are also excluded from the regional reportable segment amounts. The CODM does not use a measure of total assets in making decisions regarding allocating resources to or assessing the performance of these reportable segments.
The following tables disaggregate the revenue recognized from contracts with customers into categories that depict how the nature, amount, timing, and uncertainty of revenue and cash flows are affected by economic factors. The disaggregation of revenues reflects our power sales by geographic region.
The following tables, which relate directly to our Consolidated Statements of Operations and Comprehensive Income, provide the reconciliation of operating revenues, purchased power and fuel expenses, and RNF for reportable segments for the years ended December 31, 2024, 2023, and 2022.
| | | | | | | | | | | | | | | | | | | | | | | | | | | | | |
| | 2024 |
| | Revenues from contracts with customers | | Other revenues(a) | | Total Operating revenues | | Total Purchased power and fuel expenses | | Total RNF |
| Mid-Atlantic | $ | 5,429 | | | $ | 93 | | | $ | 5,522 | | | $ | (2,442) | | | $ | 3,080 | |
| Midwest | 3,848 | | | 957 | | | 4,805 | | | (1,603) | | | 3,202 | |
| New York | 1,937 | | | 113 | | | 2,050 | | | (597) | | | 1,453 | |
| ERCOT | 1,053 | | | 497 | | | 1,550 | | | (503) | | | 1,047 | |
| Other Power Regions | 4,749 | | | 757 | | | 5,506 | | | (4,238) | | | 1,268 | |
| Total Reportable Segments | 17,016 | | | 2,417 | | | 19,433 | | | (9,383) | | | 10,050 | |
Other(b) | 1,948 | | | 2,187 | | | 4,135 | | | (2,036) | | | 2,099 | |
| Total Consolidated Results | $ | 18,964 | | | $ | 4,604 | | | $ | 23,568 | | | $ | (11,419) | | | $ | 12,149 | |
Combined Notes to Consolidated Financial Statements
(Dollars in millions, unless otherwise noted)
Note 5 — Segment Information
| | | | | | | | | | | | | | | | | | | | | | | | | | | | | |
| | 2023 |
| | Revenues from contracts with customers | | Other revenues(a) | | Total Operating revenues | | Total Purchased power and fuel expenses | | Total RNF |
| Mid-Atlantic | $ | 5,453 | | | $ | (315) | | | $ | 5,138 | | | $ | (2,214) | | | $ | 2,924 | |
| Midwest | 4,846 | | | (188) | | | 4,658 | | | (1,403) | | | 3,255 | |
| New York | 1,910 | | | 111 | | | 2,021 | | | (770) | | | 1,251 | |
| ERCOT | 1,232 | | | 114 | | | 1,346 | | | (764) | | | 582 | |
| Other Power Regions | 4,956 | | | 895 | | | 5,851 | | | (4,611) | | | 1,240 | |
| Total Reportable Segments | 18,397 | | | 617 | | | 19,014 | | | (9,762) | | | 9,252 | |
Other(b) | 2,444 | | | 3,460 | | | 5,904 | | | (6,239) | | | (335) | |
| Total Consolidated Results | $ | 20,841 | | | $ | 4,077 | | | $ | 24,918 | | | $ | (16,001) | | | $ | 8,917 | |
| | | | | | | | | | | | | | | | | | | | | | | | | | | | | |
| | 2022 |
| | Revenues from contracts with customers | | Other revenues(a) | | Total Operating revenues | | Total Purchased power and fuel expenses | | Total RNF |
| Mid-Atlantic | $ | 5,264 | | | $ | (100) | | | $ | 5,164 | | | $ | (3,026) | | | $ | 2,138 | |
| Midwest | 5,164 | | | (514) | | | 4,650 | | | (1,886) | | | 2,764 | |
| New York | 2,004 | | | (409) | | | 1,595 | | | (528) | | | 1,067 | |
| ERCOT | 954 | | | 589 | | | 1,543 | | | (1,136) | | | 407 | |
| Other Power Regions | 5,035 | | | 1,697 | | | 6,732 | | | (5,811) | | | 921 | |
| Total Reportable Segments | 18,421 | | | 1,263 | | | 19,684 | | | (12,387) | | | 7,297 | |
Other(b) | 3,150 | | | 1,606 | | | 4,756 | | | (5,075) | | | (319) | |
Total Consolidated Results(c) | $ | 21,571 | | | $ | 2,869 | | | $ | 24,440 | | | $ | (17,462) | | | $ | 6,978 | |
__________
(a)Includes revenues from nuclear PTCs beginning in 2024 as well as derivatives and leases. Intersegment activity in all periods presented is not material.
(b)Represents revenue activities not allocated to a region. See text above for a description of included activities, includes unrealized mark-to-market gains of $316 million and $1,399 million and losses of $1,188 million, and natural gas revenues from contracts with customers of $1,429 million, $1,859 million, and $2,559 million, for the years ended December 31, 2024, 2023, and 2022, respectively.
(c)Includes all wholesale and retail electric sales to third parties and affiliated sales to Exelon's utility subsidiaries prior to the separation on February 1, 2022. See Note 24 — Related Party Transactions for additional information.
Combined Notes to Consolidated Financial Statements
(Dollars in millions, unless otherwise noted)
Note 6 — Government Assistance
6. Government Assistance
Beginning in 2024, our existing nuclear units are eligible for a PTC extending through 2032. The nuclear PTC provides a transferable credit up to $15 per MWh (a base credit of $3 per MWh with a five times multiplier provided certain prevailing wage requirements are met) and is subject to phase-out when annual gross receipts are between $25.00 per MWh and $43.75 per MWh. We have evaluated and expect to meet the annual prevailing wage requirements at all our nuclear units and are eligible for the five times multiplier. Both the amount of the PTC and the gross receipts thresholds adjust for inflation after 2024 through the duration of the program based on the GDP price deflator for the preceding calendar year. The benefits of the PTC may be realized through a credit against our federal income taxes or transferred via sale to an unrelated party.
For the year ended December 31, 2024, our Consolidated Statements of Operations and Comprehensive Income include a nuclear PTC benefit of approximately $2,080 million in Operating revenues. Our estimate required the exercise of judgment in determining the amount of nuclear PTC expected for each of our nuclear units. The nuclear PTC continues to be the subject of additional guidance, which may be issued from the U.S. Treasury and IRS sometime in 2025, and may materially impact the total amount of the benefits we receive.
Nuclear PTCs are initially recorded within Other deferred debits and other assets within the Consolidated Balance Sheets and reclassified as a reduction to Accounts payable and accrued expenses when used to reduce our federal income tax payable, or an increase in Cash and cash equivalents or Other current assets when sold, depending on the specific payment terms of each contract.
In 2024, we executed agreements for the sale of $1,750 million of nuclear PTCs to unaffiliated third parties at a nominal discount, with approximately $1,570 million of cash proceeds received upon sale (included within Cash flows from operating activities in our Consolidated Statements of Cash Flows) and approximately $95 million to be received in the first quarter of 2025. As of December 31, 2024, our Consolidated Balance Sheets reflect approximately $185 million of estimated nuclear PTCs within Other deferred debits and other assets, $95 million within Other current assets, and a reduction to Accounts payable and accrued expenses of $150 million for estimated nuclear PTCs that we have utilized as a credit against our current federal income taxes payable.
Many of the state-sponsored programs providing compensation for the emissions-free attributes of generation from certain of our nuclear units include contractual or other provisions that require us to refund that compensation up to the amount of the nuclear PTC received or pass through the entirety of the nuclear PTC received. As of December 31, 2024, we have recognized approximately $1,030 million of estimated payables within Accounts payable and accrued expenses or as offsets to Customer accounts receivable in our Consolidated Balance Sheets associated with programs requiring refunds or pass through of the nuclear PTC. We recognized a reduction to net operating revenue of approximately $50 million (pre-tax) for the year ended December 31, 2024 associated with these programs in our Consolidated Statements of Operations and Comprehensive Income. As with the actual amount of the PTC earned, any change resulting from additional guidance received may materially impact amounts due under state-sponsored programs.
7. Accounts Receivable
Allowance for Credit Losses on Accounts Receivable
The following table presents the rollforward of allowance for credit losses on Customer accounts receivable, which does not include any allowance related to the sales of customer accounts receivable disclosed below. Allowance for credit losses on Other accounts receivable was not material as of the balance sheet dates.
| | | | | |
| |
| |
| |
| |
Balance as of December 31, 2023(a) | 56 | |
| Plus: Current period provision for expected credit losses | 17 | |
Less: Write-offs, net of recoveries(b) | 21 | |
Plus: Facility amendment impact(c) | 138 | |
| Balance as of December 31, 2024 | $ | 190 | |
__________
(a)2023 beginning balance and activity were not material.
(b)Recoveries were not material.
(c)Impact as a result of the December 2024 Facility amendment. See below for details.
Combined Notes to Consolidated Financial Statements
(Dollars in millions, unless otherwise noted)
Note 7 — Accounts Receivable
Unbilled Customer Revenue
We recorded $1,109 million and $372 million of unbilled customer revenues in Customer accounts receivables, net in the Consolidated Balance Sheets as of December 31, 2024 and 2023, respectively.
Sales of Customer Accounts Receivable
In 2020, NER, a bankruptcy remote, special purpose entity, which is wholly owned by us, entered a revolving accounts receivable financing arrangement with a number of financial institutions and a commercial paper conduit (Purchasers) to sell certain customer accounts receivables (Facility). On December 31, 2024, we amended the Facility. We will no longer sell receivables to the Purchasers and all outstanding receivables were assigned back to us. Prior to the amendment, the maximum funding limit of the Facility was $1.1 billion. Under the Facility's prior terms, NER sold eligible short-term customer accounts receivable to the Purchasers in exchange for cash and subordinated interest. The transfers were reported as sales of receivables in the consolidated financial statements. The subordinated interest in collections upon the receivables sold to the Purchasers was referred to as the DPP, which was reflected in Other current assets in the Consolidated Balance Sheets prior to the amendment. See Note 16 — Debt and Credit Agreements for terms of the amended Facility.
The following table summarizes the impact of the sale of certain receivables:
| | | | | | | | | | | |
| As of December 31, |
| 2024 | | 2023 |
| Derecognized receivables transferred at fair value | $ | — | | | $ | 1,516 | |
| Less: Cash proceeds received | — | | | 300 | |
DPP(a) | $ | — | | | $ | 1,216 | |
_________(a)As a result of the Facility amendment, DPP of $1,529 million was reclassified to Customer accounts receivable as of December 31, 2024.
| | | | | | | | | | | | | | | | | |
| For the Years Ended December 31, |
| 2024 | | 2023 | | 2022 |
Loss on sale of receivables(a) | $ | 61 | | | $ | 75 | | | $ | 69 | |
_________
(a)Reflected in Operating and maintenance expense in the Consolidated Statements of Operations and Comprehensive Income. This represents the amount by which the accounts receivable sold into the Facility are discounted, limited to credit losses.
| | | | | | | | | | | | | | | | | |
| For the Years Ended December 31, |
| 2024 | | 2023 | | 2022 |
Proceeds from new transfers(a) | $ | 1,688 | | | $ | 3,649 | | | $ | 6,108 | |
Cash collections received on DPP(b) | 10,517 | | | 8,140 | | | 4,764 | |
| Cash collections reinvested in the Facility | $ | 12,205 | | | $ | 11,789 | | | $ | 10,872 | |
_________
(a)Customer accounts receivable sold into the Facility were $12,262 million, $11,746 million, and $11,274 million for the years ended December 31, 2024, 2023, and 2022, respectively.
(b)Does not include the $300 million and $800 million net cash payments to the Purchasers in 2024 and 2023, respectively, or the $200 million net cash proceeds received from the Purchases in 2022.
We recognized the cash proceeds received upon sale in Cash flows from operating activities within the Changes in Other assets and liabilities line in the Consolidated Statements of Cash Flows, which were ($10,574) million, ($8,097) million, and ($5,166) million for the years ended December 31, 2024, 2023, and 2022, respectively. The collection and reinvestment of DPP is recognized in Cash flows from investing activities in the Collection of DPP, net line in the Consolidated Statements of Cash Flows, which were $10,217 million, $7,340 million, and $4,964 million for the years ended December 31, 2024, 2023, and 2022, respectively. As a result of the receivables being assigned back to NER under the amended Facility, NER forgave any and all remaining DPP owed by the Purchasers. The reassignment of receivables and unwind of DPP will be treated as a non-cash activity and therefore have no impact in the Consolidated Statements of Cash Flows.
Combined Notes to Consolidated Financial Statements
(Dollars in millions, unless otherwise noted)
Note 7 — Accounts Receivable
See Note 17 — Fair Value of Financial Assets and Liabilities and Note 21 — Variable Interest Entities for additional information on DPP and NER, respectively.
Other Sales of Customer Accounts Receivables
We are required, under supplier tariffs, to sell customer receivables to certain utility companies. The total receivables sold was $280 million, $356 million, and $423 million for the years ended December 31, 2024, 2023, and 2022, respectively.
8. Property, Plant, and Equipment
The following table presents a summary of property, plant, and equipment by asset category as of December 31, 2024 and 2023:
| | | | | | | | | | | |
| Asset Category | December 31, 2024 | | December 31, 2023 |
| Electric | $ | 32,141 | | | $ | 32,889 | |
Nuclear fuel(a) | 5,894 | | | 5,503 | |
| Construction work in progress | 1,273 | | | 1,133 | |
| Other property, plant, and equipment | 15 | | | 14 | |
| Total property, plant, and equipment | 39,323 | | | 39,539 | |
Less: accumulated depreciation(b) | 18,088 | | | 17,423 | |
| Property, plant, and equipment, net | $ | 21,235 | | | $ | 22,116 | |
__________(a)Includes nuclear fuel that is in the fabrication and installation phase of $1,485 million and $1,265 million as of December 31, 2024 and 2023, respectively.
(b)Includes accumulated amortization of nuclear fuel in the reactor core of $2,447 million and $2,484 million as of December 31, 2024 and 2023, respectively.
The estimated useful lives of our generating facilities are based on a combination of depreciation studies, historical retirements, site licenses and management estimates of operating costs and expected future energy market conditions. The estimated useful lives of our nuclear stations generally include expectations for an additional 20-year term beyond current license expiration, except for Calvert Cliffs, FitzPatrick, Limerick, NMP Unit 2, Salem, and STP where depreciation provisions correspond with the expiration of the current NRC operating license. Generally, our oil and gas plants have estimated useful lives of 40-45 year with wind and solar generating facilities having estimated useful lives of 25 and 35 years, respectively. The estimated useful lives of our hydroelectric facilities also generally align with their FERC operating licenses. Conowingo depreciation provisions are based on an estimated useful life through 2071, in anticipation that a 50-year license will be issued. See Note 3 — Regulatory Matters for additional information regarding license renewals for Peach Bottom and Conowingo.
Annual depreciation rates for electric generation were 3.43%, 3.26%, and 3.46% for the years ended December 31, 2024, 2023, and 2022, respectively. Nuclear fuel amortization is charged to fuel expense using the unit-of-production method and not included in the annual depreciation rates. See Note 22 — Supplemental Financial Information for additional information on nuclear fuel amortization.
Combined Notes to Consolidated Financial Statements
(Dollars in millions, unless otherwise noted)
Note 9 — Jointly-Owned Electric Plant
9. Jointly-Owned Electric Plants
Our material undivided ownership interests in jointly-owned nuclear plants as of December 31, 2024 and 2023 were as follows:
| | | | | | | | | | | | | | | | | | | | | | | | | | | | | |
| NMP Unit 2 | | Quad Cities | | Peach Bottom | | STP(a) | | Salem |
| Operator | Constellation | | Constellation | | Constellation | | STPNOC | | PSEG Nuclear |
| Ownership interest | 82.00 | % | | 75.00 | % | | 50.00 | % | | 44.00 | % | | 42.59 | % |
| Our share as of December 31, 2024 | | | | | | | | | |
| Plant in service | $ | 1,122 | | | $ | 1,294 | | | $ | 1,570 | | | $ | 1,040 | | | $ | 791 | |
| Accumulated depreciation | 327 | | | 840 | | | 721 | | | 52 | | | 387 | |
| Construction work in progress | 27 | | | 13 | | | 15 | | | 25 | | | 68 | |
| Our share as of December 31, 2023 | | | | | | | | | |
| Plant in service | $ | 1,073 | | | $ | 1,263 | | | $ | 1,552 | | | $ | 1,089 | | | $ | 781 | |
| Accumulated depreciation | 292 | | | 805 | | | 689 | | | 5 | | | 357 | |
| Construction work in progress | 35 | | | 8 | | | 14 | | | 13 | | | 49 | |
__________
(a)Within the 44% undivided ownership interest in STP, 2% interest was recorded as held for sale as of December 31, 2024. See Note 2 — Mergers, Acquisitions, and Dispositions for additional information.
Our undivided ownership interests are financed with our funds and all operations are proportionately consolidated consistent with our ownership interest in the Consolidated Statements of Operations and Comprehensive Income.
10. Asset Retirement Obligations
Nuclear Decommissioning Asset Retirement Obligations
We have a legal obligation to decommission our nuclear power plants following the permanent cessation of operations. To estimate our nuclear decommissioning obligations we use a probability-weighted, discounted cash flow model which, on a unit-by-unit basis, considers multiple outcome scenarios that include significant estimates and assumptions, and are based on decommissioning cost studies, cost escalation rates, probabilistic cash flow models, and discount rates. We update our AROs annually, unless circumstances warrant more frequent updates, based on our review of updated cost studies and our annual evaluation of cost escalation factors and probabilities assigned to various scenarios.
The financial statement impact for changes in the ARO, on an individual unit basis, due to the changes in and timing of estimated cash flows generally result in a corresponding change in the unit’s ARC in Property, plant, and equipment in the Consolidated Balance Sheets. If the ARO decreases for a Non-Regulatory Agreement Unit without any remaining ARC, the corresponding change is recorded as a decrease in Operating and maintenance expense in the Consolidated Statements of Operations and Comprehensive Income, whereas the corresponding decrease for Regulatory Agreement Units without any remaining ARC results in an increase to the Payables related to Regulatory Agreement Units in the Consolidated Balance Sheets.
The following table provides a rollforward of the nuclear decommissioning AROs reflected in the Consolidated Balance Sheets from January 1, 2023 to December 31, 2024:
| | | | | | | | | | | |
| 2024 | | 2023 |
| Beginning balance as of January 1 | $ | 13,891 | | | $ | 12,500 | |
| Net (decrease) increase due to changes in, and timing of, estimated future cash flows | (2,299) | | | 411 | |
| Accretion expense | 640 | | | 582 | |
Costs incurred related to decommissioning plants(a) | (24) | | | (31) | |
Acquisition of joint ownership in STP(b) | (22) | | | 429 | |
Ending balance as of December 31(c) | $ | 12,186 | | | $ | 13,891 | |
| | | |
__________
Combined Notes to Consolidated Financial Statements
(Dollars in millions, unless otherwise noted)
Note 10 — Asset Retirement Obligations
(a)We began decommissioning Crane upon permanently ceasing operations in 2019 and in 2024 commenced efforts to restart. See below for further discussion of the decommissioning of Zion Station.
(b)Reflects our estimated share of the STP decommissioning obligation acquired in 2023 and the portion subsequently transferred to Liabilities held for sale in 2024. See Note 2 — Mergers, Acquisitions, and Dispositions for additional information.
(c)Includes $18 million and $30 million as the current portion of the ARO as of December 31, 2024 and 2023, respectively, which is included in Other current liabilities in the Consolidated Balance Sheets.
The net $2,299 million decrease in the ARO during 2024 for changes in the amounts and timing of estimated decommissioning cash flows was driven by multiple adjustments, including the following:
•Net decrease of $3,036 million due to changes in assumed retirement dates for various plants, including Braidwood, Byron, Calvert Cliffs, FitzPatrick, LaSalle, Limerick, NMP Unit 2, Quad Cities, Salem and Crane
•A decrease of $154 million related to a change in assumed timing of DOE acceptance of SNF and a revised cost study for Salem
•An increase of $891 million due to an increase in cost escalation rates and lower discount rates
The 2024 ARO updates resulted in a decrease of $78 million in Operating and maintenance expense for the year ended December 31, 2024 in the Consolidated Statements of Operations and Comprehensive Income.
The net $411 million increase in the ARO during 2023 for changes in the amounts and timing of estimated decommissioning cash flows was driven by multiple adjustments, including the following:
•Net increase of approximately $610 million due to an increase in cost escalation rates partly offset by an increase in discount rates.
•Net increase of approximately $470 million due to updated cost assumptions for dry cask storage across the fleet and revised cost studies for Dresden, Limerick and Peach Bottom.
•Net decrease of approximately $675 million due to changes in assumed retirement dates for Ginna, NMP Unit 1 and Salem.
The 2023 ARO updates resulted in a decrease of $68 million in Operating and maintenance expense for the year ended December 31, 2023 in the Consolidated Statements of Operations and Comprehensive Income.
NDT Funds
NDT funds have been established for each of our nuclear units to satisfy our nuclear decommissioning obligations, as required by the NRC, and withdrawals from these funds for reasons other than to pay for decommissioning are restricted pursuant to NRC requirements until all decommissioning activities have been completed. Generally, NDT funds established for a particular unit may not be used to fund the decommissioning obligations of any other unit.
The NDT funds associated with our nuclear units have been funded with amounts collected from the previous owners and their respective utility customers. PECO is authorized to collect funds, in revenues, through regulated rates for decommissioning the former PECO nuclear plants, and these collections are scheduled through the operating lives of these former PECO plants. The amounts collected from PECO customers are remitted to us and deposited into the NDT funds for the unit for which funds are collected. Every five years, PECO files a rate adjustment with the PAPUC that reflects PECO’s calculations of the estimated amount needed to decommission each of the former PECO units based on updated fund balances and estimated decommissioning costs. The rate adjustment is used to determine the amount collectible from PECO customers. In March 2022, PECO filed its Nuclear Decommissioning Cost Adjustment with the PAPUC proposing an annual recovery from customers of approximately $4 million. In August 2022, the PAPUC approved the filing, and the new rates became effective January 1, 2023.
Additionally, for the STP units, we maintain decommissioning trust funds for those units proportionate to our ownership. We also retain the authority through the PUCT to obtain additional decommissioning funding through AEP Texas and CenterPoint. Every five years, owners of each Texas jurisdictional nuclear generation unit are
Combined Notes to Consolidated Financial Statements
(Dollars in millions, unless otherwise noted)
Note 10 — Asset Retirement Obligations
required to file an update of decommissioning costs with the PUCT in support of appropriate utility rates for decommissioning trust funding. In July 2023, the decommissioning cost update for our share of the STP decommissioning obligation was filed, proposing annual funding amounts from AEP Texas and CenterPoint totaling approximately $1 million. In March 2024, the PUCT approved the filing, and AEP Texas and CenterPoint tariffs were adjusted accordingly in May and August 2024, respectively.
Any shortfall of funds necessary for decommissioning, determined for each generating station unit, are generally required to be funded by us, with the exception of STP and the former PECO units. We have recourse to collect additional amounts from the respective utility customers through the utility commissions for the former PECO units and STP in the event of a shortfall of NDT funds. Collection of additional amounts for the former PECO units are subject to certain limitations and thresholds, as prescribed by an order from the PAPUC that limits collection of amounts associated with the first $50 million of any shortfall of trust funds compared to decommissioning costs, as well as 5% of any additional shortfalls, on an aggregate basis for all former PECO units. The initial $50 million and up to 5% of any additional shortfalls would be borne by us. No such limitations exist for the STP units, however PUCT regulations require that any funds remaining in the trust after completion of decommissioning to be refunded to utility customers in a manner determined by the commission. Aside from the former PECO units and STP, no recourse exists to collect additional amounts from utility customers for any of our other nuclear units.
With respect to the Regulatory Agreement Units, any funds remaining in the NDTs after all decommissioning has been completed are required to be refunded to the respective utility customers, subject to certain limitations that allow sharing of excess funds with us related to the former PECO units. With respect to our other nuclear units, we retain any funds remaining after decommissioning. However, in connection with CENG's acquisition of the NMP and Ginna plants and settlements with certain regulatory agencies, certain conditions pertaining to NDT funds apply that, if met, could possibly result in obligations to make payments to certain third parties (clawbacks). For NMP and Ginna, the clawback provisions are triggered only in the event that the required decommissioning activities are discontinued or not started or completed in a timely manner. In the event that the clawback provisions are triggered for NMP, then, depending upon the triggering event, an amount equal to 50% of the total amount withdrawn from the funds for non-decommissioning activities as defined in the agreement or 50% of any excess funds in the trust funds above the amounts required for decommissioning (including SNF management and site restoration) is to be paid to the NMP sellers. In the event that the clawback provisions are triggered for Ginna, then an amount equal to any estimated cost savings realized by not completing any of the required decommissioning activities is to be paid to the Ginna sellers. We expect to comply with applicable regulations and timely commence and complete all required decommissioning activities.
We had NDT funds totaling $17,321 million and $16,398 million as of December 31, 2024 and 2023, respectively. As of December 31, 2024, $16 million of the NDT funds were current and included in Other current assets in the Consolidated Balance Sheets. As of December 31, 2023, none of the NDT funds were reflected in Other current assets. See Note 22 — Supplemental Financial Information for additional information on activities of the NDT funds.
Accounting Implications of the Regulatory Agreement Units
See Note 1 — Basis of Presentation for additional information on the accounting policy for Regulatory Agreement Units.
For the former PECO units and STP, given the symmetric settlement provisions that allow for continued recovery of decommissioning costs from the respective utility customers in the event of a shortfall and the obligation for us to ultimately return excess funds to the respective utility customers (on an aggregate basis for all seven former PECO units and on the underlying utility customer basis for STP) decommissioning-related activities are generally offset in the Consolidated Statements of Operations and Comprehensive Income, regardless of whether the NDT funds are expected to exceed or fall short of the total estimated decommissioning obligation. The offset of decommissioning-related activities in the Consolidated Statements of Operations and Comprehensive Income results in an equal adjustment to noncurrent payables or noncurrent receivables. Any changes to the existing PECO or STP regulatory agreements could impact our ability to offset decommissioning-related activities in the Consolidated Statements of Operations and Comprehensive Income, and the potential impact to our consolidated financial statements could be material.
Combined Notes to Consolidated Financial Statements
(Dollars in millions, unless otherwise noted)
Note 10 — Asset Retirement Obligations
For the former ComEd units, given no further recovery from ComEd customers is permitted and we retain an obligation to ultimately return any unused NDTs to ComEd customers (on a unit-by-unit basis), to the extent the related NDT investment balances are expected to exceed the total estimated decommissioning obligation for each unit, decommissioning-related activities are offset in the Consolidated Statements of Operations and Comprehensive Income which results in us recognizing a noncurrent payable. However, given the asymmetric settlement provision that does not allow for continued recovery from ComEd customers in the event of a shortfall, recognition of a receivable related to former ComEd Units is not permissible and accounting for decommissioning-related activities for that unit would not be offset, and the impact to the Consolidated Statements of Operations and Comprehensive Income could be material during such periods.
The following table presents our noncurrent payables to ComEd, PECO, CenterPoint, and AEP Texas reflected as Payables related to Regulatory Agreement Units in the Consolidated Balance Sheets as of December 31, 2024 and 2023:
| | | | | | | | | | | |
| As of December 31, |
| 2024 | | 2023 |
| ComEd | $ | 3,780 | | | $ | 2,955 | |
| PECO | 247 | | | 278 | |
| CenterPoint | 365 | | | 338 | |
| AEP Texas | 126 | | | 117 | |
| Payables related to Regulatory Agreement Units | $ | 4,518 | | | $ | 3,688 | |
As of December 31, 2024, decommissioning-related activities for all of the former ComEd units, except for Zion (see Zion Station Decommissioning below), are currently offset in the Consolidated Statements of Operations and Comprehensive Income.
The decommissioning-related activities for the Non-Regulatory Agreement Units are reflected in the Consolidated Statements of Operations and Comprehensive Income within Operating and maintenance expense, Depreciation and amortization expense, and Other, net.
Zion Station Decommissioning
In 2010, we completed an asset sale agreement under which ZionSolutions assumed responsibility for decommissioning Zion Station and we transferred to ZionSolutions substantially all the Zion Station’s assets, including the related NDT funds. In November 2023, ZionSolutions completed its contractual obligations and transferred the NRC license back to us. We will store the SNF at Zion Station until it is transferred to the DOE for ultimate disposal and complete all remaining decommissioning activities associated with the SNF dry storage facility.
Any shortage of funds necessary to maintain the SNF and decommission the SNF storage facility is ultimately required to be funded by us. As of December 31, 2024 and 2023, the ARO associated with Zion's SNF storage facility is $163 million and $139 million, respectively, and the NDT funds available to fund this obligation are $63 million and $62 million, respectively.
NRC Minimum Funding Requirements
NRC regulations require that licensees of nuclear generating facilities demonstrate reasonable assurance that funds will be available in specified minimum amounts for radiological decommissioning of the facility at the end of its life. The estimated decommissioning obligations are calculated using an NRC methodology that is different from the ARO recorded in the Consolidated Balance Sheets primarily due to differences in the type of costs included in the estimates, the basis for estimating such costs, and assumptions regarding the decommissioning alternatives to be used, potential license renewals, decommissioning cost escalation, and the growth rate in the NDT funds. Under NRC regulations, if the minimum funding requirements for radiological decommissioning calculated under the NRC methodology are greater than the future value of the NDT funds, also calculated under the NRC methodology, then the NRC requires resolution of the shortfalls which could include further funding or other financial guarantees.
Combined Notes to Consolidated Financial Statements
(Dollars in millions, unless otherwise noted)
Note 10 — Asset Retirement Obligations
Key assumptions used in the minimum funding calculation for radiological decommissioning costs using the NRC methodology at December 31, 2024 include: (1) consideration of costs only for the removal of radiological contamination at each unit; (2) the option on a unit-by-unit basis to use generic, non-site specific cost estimates; (3) consideration of only one decommissioning scenario for each unit; (4) the plants cease operation at the end of their current license lives (with no assumed license renewals for those units that have not already received renewals); (5) the assumption of current nominal dollar cost estimates that are neither escalated through the anticipated period of decommissioning, nor discounted using the CARFR; and (6) assumed annual after-tax returns on the NDT funds of 2% (3% for the former PECO units, as specified by the PAPUC).
In contrast, the key criteria and assumptions used by us to determine the ARO and to forecast the target growth in the NDT funds as of December 31, 2024 include: (1) the use of site specific cost estimates that are updated at least once every five years; (2) the inclusion in the ARO estimate of all legally unavoidable costs required to decommission the unit (e.g., radiological decommissioning and full site restoration for certain units, on-site SNF maintenance and storage subsequent to ceasing operations and until DOE acceptance, and disposal of certain LLRW); (3) as applicable, the consideration of multiple scenarios where decommissioning and site restoration activities, as applicable, are completed under possible scenarios ranging from 10 to 70 years after the cessation of plant operations or the end of the current licensed operating life; (4) the consideration of multiple end of life scenarios; (5) the measurement of the obligation at the present value of the future estimated costs and an annual accretion of the ARO; and (6) an estimated targeted annual pre-tax return on the NDT funds of 6.3% to 7.1% (as compared to a historical 5-year annual average pre-tax return of approximately 6.5%).
We are required to provide to the NRC a biennial report by unit (annually for units that have been retired or are within five years of license expiration), based on values as of December 31, addressing our ability to meet the NRC minimum funding levels. Depending on the value of the trust funds, we may be required to take steps, such as providing financial guarantees through surety bonds, letters of credit, or parent company guarantees or making additional contributions to the trusts, which could be significant, to ensure that the trusts are adequately funded and that NRC minimum funding requirements are met. As a result, our cash flows and financial position may be significantly adversely affected.
We filed our biennial decommissioning funding status report with the NRC in March 2023 for all units, including our shutdown units, except for Zion Station which was included in a separate report to the NRC submitted by ZionSolutions, LLC. The status report demonstrated adequate decommissioning funding assurance based on trust fund values as of December 31, 2022 for all units except for Peach Bottom Unit 1. As a former PECO plant, financial assurance for decommissioning Peach Bottom Unit 1 is provided by the NDT fund, collections from PECO customers, and the ability to adjust those collections in accordance with the approved PAPUC tariff. See NDT Funds section above for additional information. Additionally, the STP units demonstrated adequate decommissioning funding assurance as of December 31, 2022 in the decommissioning funding status report filed with the NRC by STPNOC in March 2023.
In March 2024, we filed our annual decommissioning funding status report with the NRC for our shutdown units, including Zion Station which was transferred back to us in November 2023. The status report demonstrated adequate decommissioning funding assurance based on trust fund values as of December 31, 2023 for all shutdown units except for Peach Bottom Unit 1. Financial assurance for decommissioning Peach Bottom Unit 1 is provided by collections from PECO customers. Additionally in March 2024, STPNOC filed the decommissioning funding status report for STP. The status report demonstrated adequate funding assurance as of December 31, 2023.
We will file the next decommissioning funding status report with the NRC in March 2025. This report will reflect the status of decommissioning funding as of December 31, 2024 for all units, except for STP which will be filed separately by STPNOC. We expect the funding status reports to demonstrate adequate funding assurance based on the value of trust funds as of December 31, 2024, for all units except for Peach Bottom Unit 1. Financial assurance for decommissioning Peach Bottom Unit 1 is provided by the collections from PECO customers as mentioned above.
As the future values of trust funds change due to market conditions, the NRC minimum funding status of our units will change. In addition, if changes occur to the regulatory agreements with the PAPUC or the PUCT that currently allow amounts to be collected from utility customers for decommissioning the former PECO and STP units, the NRC minimum funding status of those plants could change at subsequent NRC filing dates.
Combined Notes to Consolidated Financial Statements
(Dollars in millions, unless otherwise noted)
Note 10 — Asset Retirement Obligations
Non-Nuclear Asset Retirement Obligations
We have AROs for plant closure costs associated with our natural gas, oil, and renewable generating facilities, including asbestos abatement, removal of certain storage tanks, restoring leased land to the condition it was in prior to construction of renewable generating stations, disposal of hazardous materials, and other decommissioning-related activities. See Note 1 — Basis of Presentation for additional information on the accounting policy for AROs.
The following table provides a rollforward of the non-nuclear AROs reflected in the Consolidated Balance Sheets from January 1, 2023 to December 31, 2024:
| | | | | | | | | | | |
| 2024 | | 2023 |
| Beginning balance as of January 1 | $ | 257 | | | $ | 239 | |
| Net increase (decrease) due to changes in, and timing of, estimated future cash flows | 19 | | | 14 | |
| Accretion expense | 15 | | | 14 | |
| Asset divestitures | — | | | (9) | |
| Costs incurred related to decommissioning plants | (3) | | | (1) | |
| | | |
| Ending balance as of December 31 | $ | 288 | | | $ | 257 | |
| | | |
11. Leases
Lessee
We have operating leases for which we are the lessee. The significant types of leases are contracted generation, real estate, and vehicles and equipment. The following table outlines other terms and conditions of the lease agreements as of December 31, 2024. We did not have material finance leases in 2024, 2023, or 2022.
| | | | | |
| In Years |
| Remaining lease terms | 1-31 |
| Options to extend the term | 2-30 |
| |
The components of operating lease costs were as follows:
| | | | | | | | | | | | | | | | | |
| For the Years Ended December 31, |
| 2024 | | 2023 | | 2022 |
| Operating lease costs | $ | 105 | | | $ | 96 | | | $ | 109 | |
| Variable lease costs | 145 | | | 146 | | | 169 | |
| | | | | |
| | | | | |
| | | | | |
| | | | | |
| | | | | |
Total lease costs(a) | $ | 250 | | | $ | 242 | | | $ | 278 | |
__________
(a)Excludes $50 million, $50 million, $49 million of sublease income recorded for the years ended December 31, 2024, 2023, and 2022, respectively.
Combined Notes to Consolidated Financial Statements
(Dollars in millions, unless otherwise noted)
Note 11 — Leases
The following table provides additional information regarding the presentation of operating lease ROU assets and lease liabilities in the Consolidated Balance Sheets:
| | | | | | | | | | | |
| As of December 31, |
| 2024 | | 2023 |
Operating lease ROU assets(a) | | | |
| Other deferred debits and other assets | $ | 436 | | | $ | 494 | |
| | | |
Operating lease liabilities(a) | | | |
| Other current liabilities | 72 | | | 67 | |
| Other deferred credits and other liabilities | 511 | | | 583 | |
| Total operating lease liabilities | $ | 583 | | | $ | 650 | |
__________
(a)The operating ROU assets and lease liabilities include $176 million and $289 million, respectively, related to contracted generation as of December 31, 2024, and $212 million and $334 million, respectively, as of December 31, 2023.
The weighted average remaining lease terms, in years, and the weighted average discount rates for operating leases were as follows:
| | | | | | | | | | | | | | | | | |
| As of December 31, |
| 2024 | | 2023 | | 2022 |
| Weighted average remaining lease term | 7.4 | | 8.4 | | 9.3 |
| Weighted average discount rate | 5.0 | % | | 5.0 | % | | 5.0 | % |
The following table reconciles the undiscounted cash flows for our operating leases to the operating lease liabilities recorded on our consolidated balance sheet as of December 31, 2024:
| | | | | |
| 2025 | $ | 105 | |
| 2026 | 105 | |
| 2027 | 104 | |
| 2028 | 105 | |
| 2029 | 103 | |
| 2030 and thereafter | 222 | |
| Total lease payments | 744 | |
| Less: Imputed interest | 161 | |
| Operating lease liabilities | $ | 583 | |
Supplemental cash flow information related to operating leases was as follows:
| | | | | | | | | | | | | | | | | |
| For the Years Ended December 31, |
| 2024 | | 2023 | | 2022 |
| Cash paid for amounts included in the measurement of operating lease liabilities | $ | 87 | | | $ | 102 | | | $ | 114 | |
| ROU assets obtained in exchange for operating lease obligations | 6 | | | 13 | | | 14 | |
Combined Notes to Consolidated Financial Statements
(Dollars in millions, unless otherwise noted)
Note 11 — Leases
Lessor
We have operating leases for which we are the lessor. The significant types of leases are contracted generation and real estate. The following table outlines other terms and conditions of the lease agreements as of December 31, 2024.
| | | | | |
| In Years |
| Remaining lease terms | 2-16 |
| Options to extend the term | 5-20 |
| |
The components of lease income were as follows:
| | | | | | | | | | | | | | | | | |
| For the Years Ended December 31, |
| 2024 | | 2023 | | 2022 |
| Operating lease income | $ | 51 | | | $ | 51 | | | $ | 51 | |
| Variable lease income | 244 | | | 248 | | | 258 | |
The following table presents the lease payments we expect to receive over the remaining terms as of December 31, 2024:
| | | | | |
| 2025 | $ | 48 | |
| 2026 | 49 | |
| 2027 | 49 | |
| 2028 | 48 | |
| 2029 | 48 | |
| 2030 and thereafter | 38 | |
| Total | $ | 280 | |
12. Intangible Assets
Goodwill
The following table presents the carrying amount of goodwill as of December 31, 2024, 2023 and 2022. There were no impairment losses during the years ended December 31, 2024, 2023, and 2022.
| | | | | | | | |
| | Goodwill |
| Balance at December 31, 2022 | | $ | 47 | |
Goodwill resulting from acquisition of STP(a) | | 378 | |
| Balance at December 31, 2023 | | 425 | |
Goodwill allocated to Assets held for sale(a) | | (5) | |
| Balance at December 31, 2024 | | $ | 420 | |
__________
(a)Within the 44% undivided ownership interest in STP, 2% interest was recorded as held for sale as of December 31, 2024. See Note 2 — Mergers, Acquisitions, and Dispositions for additional information on the STP acquisition in November 2023 and held for sale reclassification in 2024.
See Note 1 — Basis of Presentation for our policy regarding goodwill. Our operating segments are also considered reporting units for goodwill impairment assessment purposes. The goodwill recognized in 2023 has been assigned entirely to the ERCOT operating segment.
Combined Notes to Consolidated Financial Statements
(Dollars in millions, unless otherwise noted)
Note 12 — Intangible Assets
Other Intangible Assets and Liabilities
Our other intangible assets and liabilities included in Other current assets, Other deferred debits and other assets, Other current liabilities, and Other deferred credits and other liabilities in the Consolidated Balance Sheets, consisted of the following as of December 31, 2024 and 2023. The customer relationships are generally amortized on a straight line basis, while the unamortized energy contracts are amortized in relation to the expected realization of the underlying cash flows:
| | | | | | | | | | | | | | | | | | | | | | | | | | | | | | | | | | | |
| December 31, 2024 | | December 31, 2023 |
| Gross | | Accumulated Amortization | | Net | | Gross | | Accumulated Amortization | | Net |
| Unamortized Energy Contracts | $ | 1,850 | | | $ | (1,669) | | | $ | 181 | | | $ | 1,892 | | | $ | (1,631) | | | $ | 261 | |
| Customer Relationships | 244 | | | (189) | | | 55 | | | 242 | | | (167) | | | 75 | |
| | | | | | | | | | | |
| Total | $ | 2,094 | | | $ | (1,858) | | | $ | 236 | | | $ | 2,134 | | | $ | (1,798) | | | $ | 336 | |
The following table summarizes the amortization expense related to our other intangible assets and liabilities for the years ended December 31, 2024, 2023, and 2022:
| | | | | |
| For the Years Ended December 31, | Amortization Expense(a) |
| 2024 | $ | 60 | |
| 2023 | 58 | |
| 2022 | 61 | |
__________
(a)See Note 22 — Supplemental Financial Information for additional information related to the amortization of unamortized energy contracts.
The following table summarizes the estimated future amortization expense related to our other intangible assets and liabilities as of December 31, 2024:
| | | | | | |
| For the Years Ending December 31, | Estimated Future Amortization Expense | |
| 2025 | $ | 36 | | |
| 2026 | 40 | | |
| 2027 | 32 | | |
| 2028 | 28 | | |
| 2029 | 19 | | |
| 2030 and thereafter | 81 | | |
13. Income Taxes
Components of Income Tax Expense or Benefit
Income taxes are comprised of the following components:
| | | | | | | | | | | | | | | | | |
| For the Years Ended December 31, |
| 2024 | | 2023 | | 2022 |
| Federal | | | | | |
| Current | $ | 426 | | | $ | 464 | | | $ | 219 | |
| Deferred | 274 | | | 301 | | | (655) | |
| ITC amortization | (14) | | | (15) | | | (15) | |
| State | | | | | |
| Current | 127 | | | 142 | | | 34 | |
| Deferred | (39) | | | (33) | | | 29 | |
| Total income tax (benefit) expense | $ | 774 | | | $ | 859 | | | $ | (388) | |
Combined Notes to Consolidated Financial Statements
(Dollars in millions, unless otherwise noted)
Note 13 — Income Taxes
Rate Reconciliation
The effective income tax rate varies from the U.S. federal statutory rate principally due to the following:
| | | | | | | | | | | | | | | | | |
| For the Years Ended December 31, |
| 2024 | | 2023 | | 2022(a) |
| U.S. federal statutory rate | 21.0 | % | | 21.0 | % | | 21.0 | % |
| (Decrease) increase due to: | | | | | |
State income taxes, net of federal income tax benefit(b) | 1.5 | | | 3.5 | | | (9.2) | |
| Qualified NDT fund income and losses | 4.0 | | | 10.3 | | | 46.3 | |
| Amortization of ITC, including deferred taxes on basis differences | (0.2) | | | (0.5) | | | 2.2 | |
| | | | | |
| PTCs and other credits | (9.8) | | | (0.6) | | | 7.7 | |
| Noncontrolling interests | 0.1 | | | 0.4 | | | (0.3) | |
| | | | | |
| | | | | |
| Other | 0.6 | | | 1.0 | | | 3.9 | |
Effective income tax rate(c) | 17.1 | % | | 35.1 | % | | 71.6 | % |
_________
(a)As there was a pre-tax loss during 2022, negative percentages represent income tax expense. Positive percentages represent income tax benefit.
(b)Includes ($42) million, ($4) million and $30 million related to state rate changes and certain state tax positions in 2024, 2023, and 2022, respectively.
(c)The change in effective tax rate in 2024 is primarily due to the increase in pre-tax book income inclusive of the nuclear PTC, which is not taxable. The change in effective tax rate in 2023 is primarily due to the impacts of higher realized NDT Income and significant pretax income in 2023 compared to pretax loss in 2022.
Tax Differences and Carryforwards
The tax effects of temporary differences and carryforwards, which give rise to significant portions of the deferred tax assets (liabilities), as of December 31, 2024 and 2023 are presented below:
| | | | | | | | | | | |
| December 31, 2024 | | December 31, 2023 |
| Plant basis differences | $ | (3,138) | | | $ | (3,130) | |
| Accrual-based contracts | (30) | | | (32) | |
| Derivatives and other financial instruments | 700 | | | 984 | |
| Deferred pension and postretirement obligation | (336) | | | (314) | |
| Nuclear decommissioning activities | (256) | | | (640) | |
| Tax loss carryforward, net of valuation allowances | 16 | | | 47 | |
| Investment in partnerships | (204) | | | (193) | |
| Other, net | 242 | | | 460 | |
| Deferred income tax liabilities (net) | (3,006) | | | (2,818) | |
| Unamortized ITCs | (325) | | | (339) | |
Total deferred income tax liabilities (net) and
unamortized ITCs | $ | (3,331) | | | $ | (3,157) | |
Combined Notes to Consolidated Financial Statements
(Dollars in millions, unless otherwise noted)
Note 13 — Income Taxes
The following table provides our carryforwards, of which the state-related items are presented on a post-apportioned basis, and any corresponding valuation allowances as of December 31, 2024:
| | | | | |
| Federal | December 31, 2024 |
| |
| |
| Federal general business credits carryforwards and other carryforwards | $ | — | |
| |
| State | |
| State net operating losses and other carryforwards | 365 | |
| Deferred taxes on state tax attributes (net) | 14 | |
| Valuation allowance on state tax attributes | (3) | |
| Foreign | |
| Foreign net operating losses and other carryforwards | 20 | |
| Deferred taxes on foreign tax attributes (net) | 5 | |
Unrecognized Tax Benefits
Our unrecognized tax benefits were not material as of and for the years ended December 31, 2024, 2023, and 2022, and if recognized, would not significantly impact our effective tax rate. Further, these amounts are not expected to significantly increase or decrease within the next twelve months.
Total amounts of interest and penalties recognized
Interest and penalty expenses are recorded in Interest expense, net and Other, net, respectively, in the Consolidated Statements of Operations and Comprehensive Income. There was no material interest and penalty expense related to our tax positions for the years ended December 31, 2024, 2023, and 2022.
Description of tax years open to assessment by major jurisdiction
| | | | | |
| Major Jurisdiction | Open Years(a) |
| Federal consolidated income tax returns | 2010-2023 |
| Illinois unitary corporate income tax returns | 2012-2023 |
| Texas combined corporate income tax returns | 2020-2023 |
| New Jersey combined corporate income tax returns | 2020-2023 |
| Maryland separate corporate income tax returns | 2021-2023 |
| Massachusetts combined corporate income tax returns | 2021-2023 |
| New York combined corporate income tax returns | 2019-2023 |
| Pennsylvania separate corporate income tax returns | 2021-2023 |
| California combined corporate income tax returns | 2010-2023 |
| |
__________(a)Tax years open to assessment include years when we were consolidated by Exelon. See discussion below under the Tax Matters Agreement for responsibility of taxes of these open years.
Constellation participates in the IRS Compliance Assurance Process which provides the opportunity to resolve complex tax matters with the IRS prior to filing its federal income tax returns with a goal to achieve certainty with respect to tax matters. Constellation entered the program for the 2024 tax year.
Other Tax Matters
Tax Matters Agreement
In connection with the separation, we entered a TMA with Exelon. The TMA governs the respective rights, responsibilities, and obligations between us and Exelon after the separation with respect to tax liabilities and benefits, tax attributes, tax returns, tax contests and other tax sharing regarding U.S. federal, state, local and foreign income taxes, other tax matters and related tax returns.
Responsibility and Indemnification for Taxes. As a former subsidiary of Exelon, we have joint and several liability with Exelon to the IRS and certain state jurisdictions relating to the taxable periods that we were included
Combined Notes to Consolidated Financial Statements
(Dollars in millions, unless otherwise noted)
Note 13 — Income Taxes
in federal and state filings. However, the TMA specifies the portion of this tax liability for which we will bear contractual responsibility, and we and Exelon agreed to indemnify each other against any amounts for which such indemnified party is not responsible. Specifically, we will be liable for taxes due and payable in connection with tax returns that we are required to file. We will also be liable for our share of certain taxes required to be paid by Exelon with respect to taxable years or periods (or portions thereof) ending on or prior to the separation to the extent that we would have been responsible for such taxes under the Exelon tax sharing agreement then existing. As of December 31, 2024 and 2023, respectively, our Consolidated Balance Sheets reflect $39 million and $37 million in Other deferred credits and other liabilities, respectively, for tax liabilities where we maintain contractual responsibility to Exelon. There were no payables in Accounts payable and accrued expenses for both periods.
Tax Refunds and Attributes. The TMA provides for the allocation of certain pre-closing tax attributes between us and Exelon. Tax attributes will be allocated in accordance with the principles set forth in the existing Exelon tax sharing agreement, unless otherwise required by law. Under the TMA, we will be entitled to refunds for taxes for which we are responsible. In addition, it is expected that Exelon will have tax attributes that may be used to offset Exelon’s future tax liabilities. A significant portion of such attributes were generated by our business. As of December 31, 2024 and 2023, respectively, we had $138 million and $336 million in Other accounts receivable and $201 million and $178 million in Other deferred debits and other assets for the reclassified tax attributes expected to be utilized by Exelon after separation in accordance with the terms of the TMA.
14. Retirement Benefits
Defined Benefit Pension and OPEB
The majority of current employees participate in the defined benefit pension and OPEB plans that we sponsor. As the plan sponsor, our Consolidated Balance Sheets reflect underfunded pension and OPEB liabilities equal to an excess of either the PBO or APBO over the fair value of the plan assets, consistent with a single employer benefit plan. Newly hired employees are generally not eligible for either pension or OPEB benefits; instead, these employees are eligible to receive an enhanced non-discretionary fixed employer contribution under our sponsored defined contribution savings plan.
Benefit Obligations, Plan Assets, and Funded Status
As of February 1, 2022, we assumed from Exelon the PBO, APBO, and plan assets for our plan participants in connection with the separation. The defined benefit pension and OPEB plans were remeasured to determine the obligations and related plan assets to be transferred to us as of that date. The pension assets allocated to us were based on the rules prescribed by ERISA for transfers of assets in connection with a pension plan separation. A portion of the Exelon OPEB plan assets, which are held in VEBA trusts, were also allocated to us separately for each funding vehicle based on the ratio of the APBO assumed by us to the total APBO attributed to each funding vehicle. As a result of the remeasurement completed at separation we recognized $2,006 million (after-tax) in Accumulated other comprehensive income (loss) for actuarial losses and prior service costs that had accrued over the lives of the plans prior to separation, primarily based on our proportionate share of the total projected pension and OPEB obligations at Exelon prior to separation.
We use a December 31 measurement date for our pension and OPEB obligations and the related plan assets. The actuarial losses experienced upon remeasurement as of December 31, 2024 were offset against AOCI, net of deferred taxes. See the table below for changes associated with the pension valuation.
Combined Notes to Consolidated Financial Statements
(Dollars in millions, unless otherwise noted)
Note 14 — Retirement Benefits
The following tables provide a rollforward of the changes in the benefit obligations and plan assets for the years ended December 31, 2024 and 2023 for all plans combined:
| | | | | | | | | | | | | | | | | | | | | | | |
| Pension Benefits | | OPEB |
| 2024 | | 2023 | | 2024 | | 2023 |
| Change in benefit obligation: | | | | | | | |
| Benefit obligation as of the beginning of the year | $ | 7,770 | | | $ | 7,275 | | | $ | 1,443 | | | $ | 1,360 | |
| | | | | | | |
| Service cost | 90 | | | 89 | | | 17 | | | 16 | |
| Interest cost | 391 | | | 394 | | | 72 | | | 74 | |
| Plan participants' contributions | — | | | — | | | 24 | | | 23 | |
| Actuarial loss (gain), net | (269) | | | 368 | | | 12 | | | 99 | |
Acquisition-related adjustments(a) | (9) | | | 187 | | | (1) | | | 14 | |
| Settlements | (13) | | | — | | | — | | | — | |
| Gross benefits paid | (563) | | | (543) | | | (145) | | | (143) | |
| Benefit obligation as of the end of year | $ | 7,397 | | | $ | 7,770 | | | $ | 1,422 | | | $ | 1,443 | |
__________(a)Pension and OPEB adjustments related to held for sale impacts of the settlement agreement entered into in 2024 and acquisition of STP in 2023, respectively. See Note 2 — Mergers, Acquisitions, and Dispositions for additional information.
| | | | | | | | | | | | | | | | | | | | | | | |
| Pension Benefits | | OPEB |
| 2024 | | 2023 | | 2024 | | 2023 |
| Change in plan assets: | | | | | | | |
| Plan assets as of the beginning of year | $ | 6,687 | | | $ | 6,660 | | | $ | 692 | | | $ | 734 | |
| | | | | | | |
| Employer contributions | 177 | | | 26 | | | — | | | — | |
| Plan participants' contributions | — | | | — | | | 18 | | | 18 | |
| Actual return (loss) on plan assets | 37 | | | 374 | | | 22 | | | 50 | |
Acquisition-related adjustment(a) | (8) | | | 170 | | | — | | | — | |
| Settlements | (13) | | | — | | | — | | | — | |
| Gross benefits paid | (563) | | | (543) | | | (134) | | | (110) | |
| Fair value of plan assets as of the end of year | $ | 6,317 | | | $ | 6,687 | | | $ | 598 | | | $ | 692 | |
| | | | | | | |
| Over (under) funded status (Plan assets less benefit obligations) | $ | (1,080) | | | $ | (1,083) | | | $ | (824) | | | $ | (751) | |
__________
(a)Pension and OPEB adjustments related to held for sale impacts of the settlement agreement in 2024 and the acquisition of STP in 2023, respectively. See Note 2 — Mergers, Acquisitions, and Dispositions for additional information.
We present our benefit obligations net of plan assets on our Consolidated Balance Sheets within the following line items:
| | | | | | | | | | | | | | | | | | | | | | | |
| Pension Benefits | | OPEB |
| 2024 | | 2023 | | 2024 | | 2023 |
| | | | | | | |
| Other current liabilities | $ | (9) | | | $ | (13) | | | $ | (20) | | | $ | (19) | |
| Pension and non-pension benefit obligations | (1,071) | | | (1,070) | | | (804) | | | (732) | |
| | | | | | | |
The following table provides the ABO and fair value of plan assets for all pension plans with an ABO in excess of plan assets.
| | | | | | | | | | | |
| ABO in Excess of Plan Assets | December 31, 2024 | | December 31, 2023 |
| ABO | $ | (7,225) | | | $ | (7,567) | |
| Fair value of plan assets | 6,317 | | | 6,687 | |
Combined Notes to Consolidated Financial Statements
(Dollars in millions, unless otherwise noted)
Note 14 — Retirement Benefits
Components of Net Periodic Benefit (Credit) Cost
See Note 1 — Basis of Presentation for additional information on where we report the service cost and other non-service cost (credit) components for all plans.
The following table presents the components of our net periodic benefit (credits) costs, prior to capitalization and co-owner allocations, for the years ended December 31, 2024, 2023 and 2022:
| | | | | | | | | | | | | | | | | | | | | | | | | | | | | | | | | | | | | | | | | | | | | | | | | | | | | |
| Pension Benefits | | OPEB | | Total Pension Benefits and OPEB |
| 2024 | | 2023 | | 2022 | | 2024 | | 2023 | | 2022 | | 2024 | | 2023 | | 2022 |
| Components of net periodic benefit (credit) cost: | | | | | | | | | | | | | | | | | |
| Service cost | $ | 90 | | | $ | 89 | | | $ | 126 | | | $ | 17 | | | $ | 16 | | | $ | 25 | | | $ | 107 | | | $ | 105 | | | $ | 151 | |
| Non-service components of pension benefits & OPEB (credit) cost: | | | | | | | | | | | | | | | | | |
| Interest cost | 391 | | 404 | | | 290 | | | 72 | | | 76 | | | 55 | | | 463 | | | 480 | | | 345 | |
| Expected return on assets | (506) | | | (520) | | | (565) | | | (42) | | | (45) | | | (55) | | | (548) | | | (565) | | | (620) | |
| Amortization of: | | | | | | | | | | | | | | | | | |
| Prior service (credit) cost | 1 | | 1 | | | 1 | | | (6) | | (10) | | | (7) | | | (5) | | | (9) | | | (6) | |
Actuarial (gain) loss | 102 | | 48 | | | 148 | | | (9) | | (12) | | | (1) | | | 93 | | | 36 | | | 147 | |
| Settlement charges | 6 | | | — | | | 6 | | | — | | — | | | — | | | 6 | | | — | | | 6 | |
| | | | | | | | | | | | | | | | | |
| Non-service components of pension benefits & OPEB credit (cost) | (6) | | | (67) | | | (120) | | | 15 | | | 9 | | | (8) | | | 9 | | | (58) | | | (128) | |
Net periodic benefit (credit) cost(a(b) | $ | 84 | | | $ | 22 | | | $ | 6 | | | $ | 32 | | | $ | 25 | | | $ | 17 | | | $ | 116 | | | $ | 47 | | | $ | 23 | |
__________(a)Reflected above and in the Consolidated Statements of Operations and Comprehensive Income for the years ended December 31, 2024, 2023, and 2022, are pension benefit and OPEB service costs of $99 million, $94 million, and $131 million, respectively, and non-service costs (credits) of $8 million, ($54) million, and ($116) million, respectively.
(b)Our portion of the total net periodic benefit (credits) costs allocated to us from Exelon in January 2022 prior to separation was not material and remains in total Operating and maintenance expense.
Combined Notes to Consolidated Financial Statements
(Dollars in millions, unless otherwise noted)
Note 14 — Retirement Benefits
Components of AOCI
We recognize the overfunded or underfunded status of defined benefit pension and OPEB plans as an asset or liability on our balance sheet, with offsetting entries to AOCI. The following tables provide the pre-tax components of AOCI for the years ended December 31, 2024 and 2023, for all plans combined:
| | | | | | | | | | | | | | | | | | | | | | | |
| Pension Benefits | | OPEB |
| 2024 | | 2023 | | 2024 | | 2023 |
| Changes in plan assets and benefit obligations recognized in AOCI: | | | | | | | |
| Current year actuarial (gain) loss | $ | 202 | | | $ | 509 | | | $ | 33 | | | $ | 94 | |
| Amortization of actuarial (loss) gain | (102) | | | (46) | | | 9 | | | 14 | |
| | | | | | | |
| Amortization of prior service (cost) credit | (1) | | | (1) | | | 6 | | | 6 | |
| | | | | | | |
| Settlements | (6) | | | — | | | — | | | — | |
| Total recognized in AOCI | $ | 93 | | | $ | 462 | | | $ | 48 | | | $ | 114 | |
The following table provides the components of gross accumulated other comprehensive income (loss) that have not been recognized as components of periodic benefit cost as of December 31, 2024 and 2023, for all plans combined:
| | | | | | | | | | | | | | | | | | | | | | | |
| Pension Benefits | | OPEB |
| 2024 | | 2023 | | 2024 | | 2023 |
| Prior service (credit) cost | $ | 8 | | | $ | 9 | | | $ | (18) | | | $ | (24) | |
| Actuarial (gain) loss | 3,080 | | | 2,985 | | | (43) | | | (85) | |
| Total | $ | 3,088 | | | $ | 2,994 | | | $ | (61) | | | $ | (109) | |
Average Remaining Service Period
For pension benefits, we amortize the unrecognized prior service (credits) costs and certain actuarial gains and losses reflected in AOCI, as applicable, based on participants’ average remaining service periods.
For OPEB, we amortize the unrecognized prior service (credits) costs reflected in AOCI over participants’ average remaining service period to benefit eligibility age, and amortize certain actuarial gains and losses reflected in AOCI over participants’ average remaining service period to expected retirement.
The resulting average remaining service periods for pension and OPEB as of December 31, 2024 and 2023 were as follows:
| | | | | | | | | | | |
| December 31, 2024 | | December 31, 2023 |
| Pension plans | 11 | | 12 |
| OPEB plans: | | | |
| Benefit Eligibility Age | 8 | | 8 |
| Expected Retirement | 9 | | 8 |
Assumptions
The measurement of the plan obligations and costs of providing benefits under our defined benefit pension and OPEB plans involves various factors, including the development of valuation assumptions and inputs and accounting policy elections. The measurement of benefit obligations and costs is impacted by several assumptions and inputs, as shown below, among other factors. When developing the required assumptions, we consider historical information as well as future expectations.
Discount Rate. The discount rates are determined by developing a spot rate curve based on the yield to maturity of a universe of high-quality non-callable (or callable with make whole provisions) bonds with similar maturities to the related pension and OPEB obligations. The spot rates are used to discount the estimated future benefit distribution amounts under the pension and OPEB plans. The discount rate is the single level rate that
Combined Notes to Consolidated Financial Statements
(Dollars in millions, unless otherwise noted)
Note 14 — Retirement Benefits
produces the same result as the spot rate curve. We utilize an analytical tool developed by our actuaries to determine the discount rates.
Expected Rate of Return. To determine the EROA, we use third-party expectations for future long-term capital market performance, weighted by our target asset class allocations.
Mortality. The mortality assumption is composed of a base table that represents the current expectation of life expectancy of the population adjusted by an improvement scale that attempts to anticipate future improvements in life expectancy. Upon remeasurement as of December 31, 2024 and December 31, 2023, we utilized the mortality tables and projection scales released by the SOA.
The following assumptions were used to determine the benefit obligations for the plans as of December 31, 2024 and December 31, 2023. Assumptions used to determine year-end benefit obligations are the assumptions used to estimate the subsequent year’s net periodic benefit costs.
| | | | | | | | | | | | | | | | | | | | | | | |
| Pension Benefits | | OPEB |
| December 31, 2024 | | December 31, 2023 | | December 31, 2024 | | December 31, 2023 |
Discount rate(a) | 5.66 | % | | 5.17 | % | | 5.63 | % | | 5.15 | % |
Investment crediting rate(b) | 5.72 | % | | 5.07 | % | | N/A | | N/A |
Rate of compensation increase(c) | 4.25 | % | | 4.25 | % | | 4.25 | % | | 4.25 | % |
| Mortality table | Pri-2012 table with MP-2021 improvement scale (adjusted) | | Pri-2012 table with MP-2021 improvement scale (adjusted) | | Pri-2012 table with MP-2021 improvement scale (adjusted) | | Pri-2012 table with MP-2021 improvement scale (adjusted) |
| Healthcare cost trend on covered charges | N/A | | N/A | | 7.00% initial, 5.00% ultimate | | Initial and ultimate rate of 5.00% |
__________(a)The discount rates above represent the blended rates used to calculate the majority of Constellation's pension and OPEB costs.
(b)The investment crediting rate above represents a weighted average rate.
(c)Includes 4.25% average for the four-year period (2025-2028) and 3.75% average thereafter.
Combined Notes to Consolidated Financial Statements
(Dollars in millions, unless otherwise noted)
Note 14 — Retirement Benefits
The following assumptions were used to determine the net periodic benefit cost for the plans for the years ended December 31, 2024 and 2023.
| | | | | | | | | | | | | | | | | | | | | | | |
| Pension Benefits | | OPEB |
| 2024 | | 2023 | | 2024 | | 2023 |
Discount rate(a) | 5.17 | % | | 5.52 | % | | 5.15 | % | | 5.50 | % |
Investment crediting rate(b) | 5.07 | % | | 5.15 | % | | N/A | | N/A |
Expected return on plan assets(c) | 6.50 | % | | 6.50 | % | | 6.50 | % | | 6.51 | % |
Rate of compensation increase(d) | 4.25 | % | | 3.75 | % | | 4.25 | % | | 3.75 | % |
| Mortality table | Pri-2012 table with MP-2021 improvement scale (adjusted) | | Pri-2012 table with MP-2021 improvement scale (adjusted) | | Pri-2012 table with MP-2021 improvement scale (adjusted) | | Pri-2012 table with MP-2021 improvement scale (adjusted) |
| Healthcare cost trend on covered charges | N/A | | N/A | | Initial and ultimate rate of 5.00% | | Initial and ultimate rate of 5.00% |
__________
(a)The discount rates above represent the blended rates used to calculate the majority of Constellation's pension and OPEB costs.
(b)The investment crediting rate above represents a weighted average rate.
(c)Applicable to our pension and OPEB plans with plan assets, with the OPEB rate representing a weighted average.
(d)Includes 4.25% average for the five-year period (2025-2028) and 3.75% average thereafter.
Contributions
We consider various factors when making qualified pension funding decisions, including actuarially determined minimum contribution requirements under ERISA, contributions required to avoid benefit restrictions and at-risk status as defined by the Pension Protection Act, and management of the pension obligation. The Pension Protection Act requires the attainment of certain funding levels to avoid benefit restrictions (such as an inability to pay lump sums or to accrue benefits prospectively), and at-risk status (which triggers higher minimum contribution requirements and participant notification). The projected contributions below reflect a funding strategy to make levelized annual contributions to offset some of the growth of the liability (e.g., from service cost). Based on this funding strategy and current market conditions, which are both subject to change, we made our annual qualified pension contribution in February 2025.
Our non-qualified pension plans are not funded, given that they are not subject to statutory minimum contribution requirements. OPEB plans are also not subject to statutory minimum contribution requirements, though we have funded some of our plans. Annually, we evaluate whether additional funding for those plans is needed, and the OPEB values below reflect both plan contributions (if applicable) and benefit payments for unfunded plans.
The following table provides our contributions paid to our qualified pension plans, non-qualified pension plans, and OPEB plans for the years ended December 31, 2024, 2023, and 2022:
| | | | | | | | | | | | | | | | | |
| 2024 | | 2023 | | 2022 |
Pension contributions(a) | $ | 177 | | | $ | 26 | | | $ | 212 | |
| OPEB contributions | 7 | | | 28 | | | 26 | |
| Total contributions | $ | 184 | | | $ | 54 | | | $ | 238 | |
__________
(a)In 2024 and 2023, our annual qualified pension contributions were $161 million and $21 million, respectively. The benefit payments to the non-qualified pension plans in 2024 and 2023 were not material.
Combined Notes to Consolidated Financial Statements
(Dollars in millions, unless otherwise noted)
Note 14 — Retirement Benefits
The following table provides our planned contributions to our qualified pension plans, non-qualified pension plans, and OPEB plans in 2025 (including our benefit payments related to unfunded plans):
| | | | | | | | | | | | | | | | | | | | | | | |
| Qualified Pension Plans | | Non-Qualified Pension Plans | | OPEB | | Total |
| Planned contributions | $ | 163 | | | $ | 12 | | | $ | 20 | | | $ | 195 | |
Estimated Future Benefit Payments
Estimated future benefit payments to participants over the next ten years in all pension and OPEB plans as of December 31, 2024 are as follows:
| | | | | | | | | | | |
| Pension Benefits | | OPEB |
| 2025 | $ | 580 | | | $ | 122 | |
| 2026 | 575 | | | 122 | |
| 2027 | 584 | | | 122 | |
| 2028 | 591 | | | 121 | |
| 2029 | 586 | | | 120 | |
| 2030 through 2034 | 2,870 | | | 571 | |
| Total estimated future benefits payments through 2034 | $ | 5,786 | | | $ | 1,178 | |
Plan Assets
On a regular basis, we evaluate our investment strategy to ensure that plan assets will be sufficient to pay plan benefits when due. We have developed and implemented a liability hedging investment strategy for the majority of our qualified pension plans which has reduced the volatility of these pension assets relative to the associated pension obligations. We are likely to continue to gradually increase the liability hedging portfolios as the funded statuses of the plans improve. The overall objective is to achieve attractive risk-adjusted returns that will satisfy the liquidity requirements of the plans’ liabilities while striving to minimize the risk of significant losses. Trust assets for our OPEB plans are managed in a diversified investment strategy that prioritizes maximizing liquidity and returns while minimizing asset volatility.
Actual asset returns have an impact on the costs reported for the pension and OPEB plans. The actual asset returns across our pension and OPEB plans for the year ended December 31, 2024 were 0.70% and 6.80%, respectively, compared to an expected long-term return assumption of 6.50% and 6.50%, respectively. We used an EROA of 6.50% and 6.00% to estimate our 2025 pension and OPEB costs.
Our pension and OPEB plan target asset allocations as of December 31, 2024 and 2023 were as follows:
| | | | | | | | | | | | | | | | | | | | | | | |
| December 31, 2024 | | December 31, 2023 |
| Asset Category | Pension Benefits | | OPEB | | Pension Benefits | | OPEB |
| Equity securities | 21 | % | | 20 | % | | 21 | % | | 17 | % |
| Fixed income securities | 54 | % | | 66 | % | | 54 | % | | 70 | % |
Alternative investments(a) | 25 | % | | 14 | % | | 25 | % | | 13 | % |
| Total | 100 | % | | 100 | % | | 100 | % | | 100 | % |
__________
(a)Alternative investments include private equity, hedge funds, real assets, and private credit.
We evaluated our pension and OPEB plans’ asset portfolios for the existence of significant concentrations of credit risk as of December 31, 2024. Types of concentrations that were evaluated include, but are not limited to, investment concentrations in a single entity, type of industry, foreign country, and individual fund. As of December 31, 2024, our pension and OPEB plans held no credit risk concentrations surpassing 10% of plan assets.
Combined Notes to Consolidated Financial Statements
(Dollars in millions, unless otherwise noted)
Note 14 — Retirement Benefits
Fair Value Measurements
The following table presents pension and OPEB plan assets measured and recorded at fair value as a net component of Pension and non-pension postretirement benefit obligations in our Consolidated Balance Sheets on a recurring basis and their level within the fair value hierarchy as of December 31, 2024 and 2023:
| | | | | | | | | | | | | | | | | | | | | | | | | | | | | | | | | | | | | | | | | | | | | | | |
| December 31, 2024 | | December 31, 2023 |
| Level 1 | | Level 2 | | Level 3 | | Total | | Level 1 | | Level 2 | | Level 3 | | Total |
Pension plan assets(a) | | | | | | | | | | | | | | | |
| Cash equivalents | $ | 170 | | | $ | — | | | $ | — | | | $ | 170 | | | $ | 192 | | | $ | — | | | $ | — | | | $ | 192 | |
Equities(b) | 1,041 | | | — | | | — | | | 1,041 | | | 598 | | | — | | | — | | | 598 | |
| Fixed income | 675 | | | 1,795 | | | — | | | 2,470 | | | 740 | | | 2,137 | | | — | | | 2,877 | |
| | | | | | | | | | | | | | | |
| | | | | | | | | | | | | | | |
| | | | | | | | | | | | | | | |
| | | | | | | | | | | | | | | |
| Total assets measured at fair value | 1,886 | | | 1,795 | | | — | | | 3,681 | | | 1,530 | | | 2,137 | | | — | | | 3,667 | |
| Assets measured at NAV | — | | | — | | | — | | | 2,869 | | | — | | | — | | | — | | | 3,283 | |
| Pension plan assets subtotal | 1,886 | | | 1,795 | | | — | | | 6,550 | | | 1,530 | | | 2,137 | | | — | | | 6,950 | |
| | | | | | | | | | | | | | | |
OPEB plan assets(a) | | | | | | | | | | | | | | | |
| Cash equivalents | 18 | | | — | | | — | | | 18 | | | — | | | — | | | — | | | — | |
| Equities | 96 | | | — | | | — | | | 96 | | | 232 | | | — | | | — | | | 232 | |
| | | | | | | | | | | | | | | |
| | | | | | | | | | | | | | | |
| | | | | | | | | | | | | | | |
| | | | | | | | | | | | | | | |
| | | | | | | | | | | | | | | |
| Fixed income | 132 | | | 39 | | | — | | | 171 | | | 62 | | | 94 | | | — | | | 156 | |
| | | | | | | | | | | | | | | |
| | | | | | | | | | | | | | | |
| | | | | | | | | | | | | | | |
| | | | | | | | | | | | | | | |
| Total assets measured at fair value | 246 | | | 39 | | | — | | | 285 | | | 294 | | | 94 | | | — | | | 388 | |
| Assets measured at NAV | — | | | — | | | — | | | 309 | | | — | | | — | | | — | | | 304 | |
| OPEB plan assets subtotal | 246 | | | 39 | | | — | | | 594 | | | 294 | | | 94 | | | — | | | 692 | |
Total pension and OPEB plan assets(c) | $ | 2,132 | | | $ | 1,834 | | | $ | — | | | $ | 7,144 | | | $ | 1,824 | | | $ | 2,231 | | | $ | — | | | $ | 7,642 | |
__________(a)See Note 17 — Fair Value of Financial Assets and Liabilities for a description of levels within the fair value hierarchy.
(b)Includes total derivative assets and liabilities that are not material, which have total notional amounts of $2,635 million and $2,001 million as of December 31, 2024 and 2023, respectively. The notional principal amounts for these instruments provide one measure of the transaction volume outstanding as of the fiscal years ended and do not represent the amount of the company’s exposure to credit or market loss.
(c)Excludes net liabilities of $229 million and $263 million as of December 31, 2024 and 2023, respectively. These items are required to reconcile to the fair value of net plan assets and consist primarily of receivables or payables related to pending securities sales and purchases, and interest and dividends receivable.
There were no assets or liabilities valued at level 3 for the year ended December 31, 2024. The following table presents the reconciliation of Level 3 assets and liabilities measured at fair value for pension and OPEB plans for the year ended December 31, 2023:
| | | | | | | | | | | | | | | | | | | |
| | | | | | | |
| | | | | | | |
| | | | | | | |
| | | | | | | |
| | | | | | | |
| | | | | | | |
| | | | | | | |
| | | | | | | |
| | | | | | | |
| | | | | | | |
| | | | | | | |
| | | | | | | |
| Pension Assets | Fixed Income | | | | Private Equity | | Total |
| Balance as of January 1, 2023 | $ | 8 | | | | | $ | 180 | | | $ | 188 | |
| Actual return on plan assets: | | | | | | | |
| Relating to assets still held as of the reporting date | — | | | | | 12 | | | 12 | |
| Relating to assets sold during the period | — | | | | | (13) | | | (13) | |
| Purchases and settlements: | | | | | | | |
| Purchases | — | | | | | 8 | | | 8 | |
| | | | | | | |
Settlements(a) | — | | | | | (187) | | | (187) | |
| Transfers out of Level 3 | (8) | | | | | — | | | (8) | |
| Balance as of December 31, 2023 | $ | — | | | | | $ | — | | | $ | — | |
__________(a)Represents cash settlements only.
Combined Notes to Consolidated Financial Statements
(Dollars in millions, unless otherwise noted)
Note 14 — Retirement Benefits
Valuation Techniques Used to Determine Fair Value
The techniques used to determine the fair value of the pension and OPEB assets invested in cash equivalents, equities, fixed income, derivatives, private equity, real assets, and private credit investments are the same as the valuation techniques for these types of investments in the NDT funds. See Cash Equivalents and NDT Fund Investments in Note 17 — Fair Value of Financial Assets and Liabilities for further information.
Pension and OPEB assets also include investments in hedge funds. Hedge fund investments include those that employ a broad range of strategies to enhance returns and provide additional diversification. The fair value of hedge funds is determined using NAV or its equivalent as a practical expedient, and therefore, hedge funds are not classified within the fair value hierarchy. We have the ability to redeem these investments at NAV or its equivalent subject to certain restrictions, which may include a lock-up period or a gate.
Defined Contribution Savings Plan
We sponsor the Constellation Employee Savings Plan, a 401(k) defined contribution savings plan. The plan allows employees to contribute a portion of their pre-tax and/or after-tax income in accordance with specified guidelines. We match a percentage of the employee contributions up to certain limits. In addition, certain employees are eligible for a fixed non-discretionary employer contribution in lieu of a pension benefit. The employer contributions to the savings plan were $117 million, $106 million, and $90 million for the years ended December 31, 2024, 2023, and 2022, respectively.
15. Derivative Financial Instruments
We use derivative instruments to manage commodity price risk, interest rate risk, and foreign exchange risk related to ongoing business operations.
Authoritative guidance requires that derivative instruments be recognized as either assets or liabilities at fair value, with changes in fair value of the derivative recognized in earnings immediately. Other accounting treatments are available through special election and designation, provided they meet specific, restrictive criteria both at the time of designation and on an ongoing basis. These alternative permissible accounting treatments include NPNS, cash flow hedges, and fair value hedges. All derivative instruments, excluding NPNS and cash flow hedges, are recorded at fair value through earnings. For all NPNS derivative instruments, accounts receivable or accounts payable are recorded when derivatives settle, and revenue or expense is recognized in earnings as the underlying physical commodity is delivered.
Authoritative guidance about offsetting assets and liabilities requires the fair value of derivative instruments to be shown in the Combined Notes to Consolidated Financial Statements on a gross basis, even when the derivative instruments are subject to legally enforceable master netting agreements and qualify for net presentation in the Consolidated Balance Sheets. A master netting agreement is an agreement between two counterparties that may have derivative and non-derivative contracts with each other providing for the net settlement of all referenced contracts via one payment stream, which takes place as the contracts deliver, when collateral is requested or in the event of default. In the tables below, which present fair value balances, our energy-related economic hedges and proprietary trading derivatives are shown gross. The impact of the netting of fair value balances with the same counterparty that are subject to legally enforceable master netting agreements, as well as netting of cash collateral, including margin on exchange positions, is aggregated in the collateral and netting columns.
Our use of cash collateral is generally unrestricted unless we were downgraded below investment grade. As our senior unsecured debt rating is currently rated at BBB+ and Baa1 by S&P and Moody's, respectively, it would take a three-notch downgrade by S&P or Moody's for our rating to go below investment grade.
Commodity Price Risk
We employ established policies and procedures to manage our risks associated with market fluctuations in commodity prices by entering physical and financial derivative contracts, including swaps, futures, forwards, options, and short-term and long-term commitments to purchase and sell energy and energy-related products. We believe these instruments, which are either determined to be non-derivative or classified as economic hedges, mitigate exposure to fluctuations in commodity prices.
Combined Notes to Consolidated Financial Statements
(Dollars in millions, unless otherwise noted)
Note 15 — Derivative Financial Instruments
To the extent the amount of energy we produce or procure differs from the amount of energy we have contracted to sell, we are exposed to market fluctuations in the prices of electricity, natural gas, and other commodities. We use a variety of derivative and non-derivative instruments to manage the commodity price risk of our electric generation facilities, including power and gas sales, fuel and power purchases, natural gas transportation and pipeline capacity agreements, and other energy-related products marketed and purchased. To manage these risks, we may enter fixed-price derivative or non-derivative contracts to hedge the variability in future cash flows from expected sales of power and gas and purchases of power and fuel. The objectives for executing such hedges include fixing the price for a portion of anticipated future electricity sales at a level that provides an acceptable return. We are also exposed to differences between the locational settlement prices of certain economic hedges and the hedged generating units. This price difference is actively managed through other instruments which include derivative congestion products, whose changes in fair value are recognized in earnings each period, and auction revenue rights, which are accounted for on an accrual basis.
In general, increases and decreases in forward market prices have a positive and negative impact, respectively, on owned and contracted generation positions that have not been hedged. Beginning in 2024, our existing nuclear fleet is eligible for the nuclear PTC provided by the IRA, an important tool in managing commodity price risk for each nuclear unit not already receiving state support. The nuclear PTC provides increasing levels of support as unit revenues decline below levels established in the IRA and is further adjusted for inflation after 2024 through the duration of the program based on the GDP price deflator for the preceding calendar year. See Note 6 — Government Assistance for additional information on the nuclear PTC.
In locations and periods where our load serving activities do not naturally offset existing generation portfolio risk, remaining commodity price exposure is managed through portfolio hedging activities. Portfolio hedging activities are generally concentrated in the prompt three years, when customer demand and market liquidity enable effective price risk mitigation. During this prompt three-year period, we seek to mitigate the price risk associated with our load serving contracts, non-nuclear generation, and any residual price risk for our nuclear generation that the nuclear PTC and state programs may not fully mitigate. We also enter transactions that further optimize the economic benefits of our overall portfolio.
Additionally, we are exposed to certain market risks through our proprietary trading activities. The proprietary trading activities are a complement to our energy marketing portfolio but represent a small portion of our overall energy marketing activities and are subject to limits established by the Executive Committee. Proprietary trading includes all contracts executed with the intent of benefiting from shifts or changes in market prices as opposed to those executed with the intent of hedging or managing risk. Gains and losses associated with proprietary trading are reported as Operating revenues in the Consolidated Statements of Operations and Comprehensive Income and are included in the Net fair value changes related to derivatives line in the Consolidated Statements of Cash Flows. For the years ended December 31, 2024, 2023, and 2022, net pre-tax commodity mark-to-market gains and losses associated with proprietary trading activities were not material.
Combined Notes to Consolidated Financial Statements
(Dollars in millions, unless otherwise noted)
Note 15 — Derivative Financial Instruments
The following tables provide a summary of the derivative fair value balances recorded as of December 31, 2024 and 2023:
| | | | | | | | | | | | | | | | | | | | | | | | | | | | | | | | | | | | | | |
| December 31, 2024 | Economic Hedges | | Proprietary Trading | | Collateral (a)(b) | | Netting(a) | | Total | | | | | | | | | |
| Mark-to-market derivative assets (current) | $ | 5,518 | | | $ | — | | | $ | 152 | | | $ | (4,860) | | | $ | 810 | | | | | | | | | | |
| Mark-to-market derivative assets (noncurrent) | 3,672 | | | — | | | 120 | | | (3,421) | | | 371 | | | | | | | | | | |
| Total mark-to-market derivative assets | 9,190 | | | — | | | 272 | | | (8,281) | | | 1,181 | | | | | | | | | | |
| Mark-to-market derivative liabilities (current) | (5,498) | | | — | | | 173 | | | 4,860 | | | (465) | | | | | | | | | | |
| Mark-to-market derivative liabilities (noncurrent) | (3,961) | | | — | | | 141 | | | 3,421 | | | (399) | | | | | | | | | | |
| Total mark-to-market derivative liabilities | (9,459) | | | — | | | 314 | | | 8,281 | | | (864) | | | | | | | | | | |
| Total mark-to-market derivative net assets (liabilities) | $ | (269) | | | $ | — | | | $ | 586 | | | $ | — | | | $ | 317 | | | | | | | | | | |
| | | | | | | | | | | | | | | | | | |
| December 31, 2023 | | | | | | | | | | | | | | | | | | |
| Mark-to-market derivative assets (current) | $ | 7,927 | | | $ | 2 | | | $ | 703 | | | $ | (7,472) | | | $ | 1,160 | | | | | | | | | | |
| Mark-to-market derivative assets (noncurrent) | 3,345 | | | — | | | 330 | | | (2,682) | | | 993 | | | | | | | | | | |
| Total mark-to-market derivative assets | 11,272 | | | 2 | | | 1,033 | | | (10,154) | | | 2,153 | | | | | | | | | | |
| Mark-to-market derivative liabilities (current) | (9,019) | | | (2) | | | 922 | | | 7,472 | | | (627) | | | | | | | | | | |
| Mark-to-market derivative liabilities (noncurrent) | (3,545) | | | — | | | 445 | | | 2,682 | | | (418) | | | | | | | | | | |
| Total mark-to-market derivative liabilities | (12,564) | | | (2) | | | 1,367 | | | 10,154 | | | (1,045) | | | | | | | | | | |
| Total mark-to-market derivative net assets (liabilities) | $ | (1,292) | | | $ | — | | | $ | 2,400 | | | $ | — | | | $ | 1,108 | | | | | | | | | | |
_________
(a)We net all available amounts allowed in our Consolidated Balance Sheets in accordance with authoritative guidance for derivatives. These amounts include unrealized derivative transactions with the same counterparty under legally enforceable master netting agreements and cash collateral.
(b)Includes $351 million and $1,712 million of variation margin posted on the exchanges as of December 31, 2024 and 2023, respectively.
Economic Hedges (Commodity Price Risk)
For the years ended December 31, 2024, 2023, and 2022, we recognized the following net pre-tax commodity mark-to-market gains (losses), which are also included in the Net fair value changes related to derivatives line in the Consolidated Statements of Cash Flows.
| | | | | | | | | | | | | | | | | |
| |
| For the Years Ended December 31, |
| Income Statement Location | 2024 | | 2023 | | 2022 |
| |
| Operating revenues | $ | 313 | | | $ | 1,402 | | | $ | (1,193) | |
| Purchased power and fuel | 963 | | | (2,368) | | | 167 | |
| Total | $ | 1,276 | | | $ | (966) | | | $ | (1,026) | |
Interest Rate and Foreign Exchange Risk
We utilize interest rate swaps to manage our interest rate exposure and foreign currency derivatives to manage foreign exchange rate exposure associated with international commodity purchases in currencies other than U.S. dollars, both of which are treated as economic hedges. The notional amounts were $592 million and $562 million as of December 31, 2024 and 2023, respectively.
The mark-to-market derivative assets and liabilities for the years ended December 31, 2024 and 2023 and the mark-to-market gains and losses associated with management of interest rate and foreign currency risk for the years ended December 31, 2024, 2023, and 2022 were not material. The mark-to-market gains and losses associated with management of interest rate and foreign currency exchange rate risk are also included in the Net fair value changes related to derivatives line in the Consolidated Statements of Cash Flows.
Combined Notes to Consolidated Financial Statements
(Dollars in millions, unless otherwise noted)
Note 15 — Derivative Financial Instruments
Credit Risk
We would be exposed to credit-related losses in the event of non-performance by counterparties on executed derivative instruments. The credit exposure of derivative contracts, before collateral, is represented by the fair value of contracts as of the reporting date.
For commodity derivatives, we enter enabling agreements that allow for payment netting with our counterparties, which reduces our exposure to counterparty risk by providing for the offset of amounts payable to the counterparty against amounts receivable from the counterparty. Typically, each enabling agreement is for a specific commodity and, with respect to each individual counterparty, netting is limited to transactions involving that specific commodity product, except where master netting agreements exist with a counterparty that allows for cross product netting. In addition to payment netting language in the enabling agreement, our credit department establishes credit limits, margining thresholds and collateral requirements for each counterparty, which are defined in the derivative contracts. Counterparty credit limits are based on an internal credit review process that considers a variety of factors, including the results of a scoring model, leverage, liquidity, profitability, credit ratings by credit rating agencies, and other risk management criteria. To the extent that a counterparty’s margining thresholds are exceeded, the counterparty is required to post collateral with us, as specified in each enabling agreement. Our credit department monitors current and forward credit exposure to counterparties and their affiliates, both on an individual and an aggregate basis.
The following tables provide information on the credit exposure for all derivative instruments, NPNS and payables and receivables, net of collateral and instruments that are subject to master netting agreements, as of December 31, 2024. The tables further delineate that exposure by credit rating of the counterparties and provide guidance on the concentration of credit risk to individual counterparties. The amounts in the tables below exclude credit risk exposure from individual retail counterparties and exposure through RTOs, ISOs, as well as NYMEX, ICE, NASDAQ, NGX, and Nodal commodity exchanges.
| | | | | | | | | | | | | | | | | | | | | | | | | | | | | |
| Rating as of December 31, 2024 | Total Exposure Before Credit Collateral | | Credit Collateral(a) | | Net Exposure | | Number of Counterparties Greater than 10% of Net Exposure | | Net Exposure of Counterparties Greater than 10% of Net Exposure |
| Investment grade | $ | 842 | | | $ | 10 | | | $ | 832 | | | — | | | $ | — | |
| Non-investment grade | 25 | | | 3 | | | 22 | | | — | | | — | |
| No external ratings | | | | | | | | | |
| Internally rated — investment grade | 178 | | | 2 | | | 176 | | | — | | | — | |
| Internally rated — non-investment grade | 137 | | | 27 | | | 110 | | | — | | | — | |
| Total | $ | 1,182 | | | $ | 42 | | | $ | 1,140 | | | — | | | $ | — | |
__________(a)As of December 31, 2024, credit collateral held from counterparties where we had credit exposure included $3 million of cash and $39 million of letters of credit.
| | | | | |
| Net Credit Exposure by Type of Counterparty | As of December 31, 2024 |
| Investor-owned utilities, marketers, power producers | $ | 899 | |
| Energy cooperatives and municipalities | 108 | |
| Financial Institutions | 62 | |
| Other | 71 | |
| Total | $ | 1,140 | |
Credit-Risk-Related Contingent Features
As part of the normal course of business, we routinely enter physically or financially settled contracts for the purchase and sale of capacity, electricity, fuels, emissions allowances, and other energy-related products. Certain of our derivative instruments contain provisions that require us to post collateral. We also enter commodity transactions on exchanges where the exchanges act as the counterparty to each trade. Transactions on the exchanges must adhere to comprehensive collateral and margining requirements. This collateral may be
Combined Notes to Consolidated Financial Statements
(Dollars in millions, unless otherwise noted)
Note 15 — Derivative Financial Instruments
posted in the form of cash or credit support with thresholds contingent upon our credit ratings from S&P and Moody's. The collateral and credit support requirements vary by contract and by counterparty. These credit-risk-related contingent features stipulate that if we were to be downgraded or lose our investment grade credit ratings (based on our senior unsecured debt rating), we would be required to provide additional collateral. This incremental collateral requirement allows for the offsetting of derivative instruments that are assets with the same counterparty, where the contractual right of offset exists under applicable master netting agreements. In the absence of expressly agreed-to provisions that specify the collateral that must be provided, collateral requested will be a function of the facts and circumstances of the situation at the time of the demand. In this case, we believe an amount of several months of future payments (e.g., capacity payments) rather than a calculation of fair value is a reasonable estimate for the contingent collateral obligation, which has been factored into the disclosure below.
The aggregate fair value of all derivative instruments with credit-risk-related contingent features in a liability position that are not fully collateralized (excluding transactions on the exchanges that are fully collateralized) is detailed in the table below:
| | | | | | | | | | | |
| As of December 31, |
| Credit-Risk-Related Contingent Features | 2024 | | 2023 |
| Gross fair value of derivative contracts containing this feature | $ | (1,346) | | | $ | (1,894) | |
| Offsetting fair value of contracts under master netting arrangements | 602 | | | 925 | |
| Net fair value of derivative contracts containing this feature | $ | (744) | | | $ | (969) | |
As of December 31, 2024 and 2023, we posted or held the following amounts of cash collateral and letters of credit on derivative contracts with external counterparties, after giving consideration to offsetting derivative and non-derivative positions under master netting agreements.
| | | | | | | | | | | |
| As of December 31, |
| 2024 | | 2023 |
Cash collateral posted(a) | $ | 635 | | | $ | 2,449 | |
Letters of credit posted(a) | 890 | | | 777 | |
Cash collateral held(a) | 49 | | | 64 | |
Letters of credit held(a) | 91 | | | 61 | |
Additional collateral required in the event of a credit downgrade below investment grade (at BB+/Ba1)(b)(c)(d) | 1,949 | | | 1,914 | |
_________(a)The cash collateral and letters of credit amounts are inclusive of NPNS contracts.
(b)Certain of our contracts contain provisions that allow a counterparty to request additional collateral when there has been a subjective determination that our credit quality has deteriorated, generally termed “adequate assurance”. Due to the subjective nature of these provisions, we estimate the amount of collateral that we may ultimately be required to post in relation to the maximum exposure with the counterparty.
(c)The downgrade collateral is inclusive of all contracts in a liability position regardless of accounting treatment and excludes any contracts with individual retail counterparties.
(d)A loss of investment grade credit rating would require a three-notch downgrade from their current levels of BBB+ and Baa1 at S&P and Moody's, respectively.
We routinely enter supply forward contracts with certain utilities with one-sided collateral postings only from us. If market prices fall below the benchmark price levels in these contracts, the utilities are not required to post collateral. However, when market prices rise above the benchmark price levels, we are required to post collateral once certain unsecured credit limits are exceeded.
Combined Notes to Consolidated Financial Statements
(Dollars in millions, unless otherwise noted)
Note 16 — Debt and Credit Agreements
16. Debt and Credit Agreements
Short-Term Borrowings
We meet our short-term liquidity requirements primarily through the issuance of commercial paper. We may use our credit facility for general corporate purposes, including meeting short-term funding requirements and the issuance of letters of credit.
Credit Agreements
In February 2022, we entered into a credit agreement establishing a $3.5 billion five-year revolving credit facility (RCF) at a variable interest rate of SOFR plus 1.275% and we entered into a $1 billion five-year liquidity facility with the primary purpose of supporting our letter of credit issuances. In June 2024, we amended the RCF to increase the available aggregate commitment to $4.5 billion and extend the maturity date from January 2027 to June 2029. The RCF may be drawn down in the form of loans and/or to support commercial paper and letters of credit issuances.
The RCF fixed facility fee rate is 0.175% and borrowings under the RCF bear interest at a rate based upon either the Daily Simple SOFR rate or a Term SOFR rate, plus an adder based upon our credit ratings. The adders for the Daily Simple SOFR-based borrowings and Term SOFR borrowings are 7.5 basis points and 107.5 basis points, respectively. The letters of credit bear interest at a rate of 1.075%.
If we were to lose our investment grade credit rating, the maximum adders for Daily Simple SOFR rate borrowings and Term SOFR rate borrowings would be 100 basis points and 200 basis points, respectively. The credit agreements also require us to pay facility fees based upon the aggregate commitments. The fees vary depending upon our credit rating.
Accounts Receivable Facility
In December 2024, we amended the Facility to provide NER access to revolving loans from a number of financial institutions (Lenders) secured by certain customer accounts receivable. As part of the amendment, the maximum funding limit of the of the Facility was increased from $1.1 billion to $1.5 billion and the maturity date was extended to December 2027. Under previous terms of the Facility, certain customer accounts receivable were sold to the Purchasers. Immediately following the amendment, all receivables previously sold were assigned back to us and receivables will no longer be sold to the Purchasers under the amendment. Subsequent to the amendment, draws and repayments related to the Facility will be reflected as Proceeds from short-term borrowings and Repayments of short-term borrowings, respectively, in the Consolidated Statements of Cash Flows. Draws on the facility bear interest at a commercial paper rate or a Daily One Month Term SOFR or Term SOFR rate, plus an adder of 0.10% per annum. Interest is payable monthly. There were no draws on the Facility as of December 31, 2024.
The amended Facility requires the balance of eligible receivables to be maintained at or above the balance of cash proceeds received from the Lenders. To the extent the eligible receivables decrease below such balance, we are required to repay cash to the Lenders. When eligible receivables exceed cash proceeds, we have the ability to increase the cash proceeds received up to the maximum funding limit.
Combined Notes to Consolidated Financial Statements
(Dollars in millions, unless otherwise noted)
Note 16 — Debt and Credit Agreements
As of December 31, 2024 and 2023 we had the following aggregate bank commitments, credit facility borrowings and available capacity under our respective credit facilities:
| | | | | | | | | | | | | | | | | | | | | | | | | | | | | | | | | | | |
| December 31, 2024 | | | | | | | | | | | |
| Facility Type | | Aggregate Bank
Commitment | | Facility Draws | | Outstanding
Letters of Credit | | Outstanding Commercial Paper(a) | | Total Available Capacity | |
| Revolving Credit Facility | | $ | 4,500 | | | $ | — | | | $ | 51 | | | $ | — | | | $ | 4,449 | | |
Bilaterals(b) | | 1,850 | | | — | | | 1,095 | | | — | | | 755 | | |
| Accounts Receivable Facility | | 1,500 | | | — | | | — | | | — | | | 1,500 | | |
| Liquidity Facility | | 971 | | | — | | | 907 | | | — | | | 21 | | (c) |
| Project Finance | | 137 | | | — | | | 120 | | | — | | | 17 | | |
| Total | | $ | 8,958 | | | $ | — | | | $ | 2,173 | | | $ | — | | | $ | 6,742 | | |
| | | | | | | | | | | | | | | | | | | | | | | | | | | | | | | | | | | |
| December 31, 2023 | | | | | | | | | | | |
| Revolving Credit Facility | | $ | 3,500 | | | $ | — | | | $ | 60 | | | $ | 1,107 | | | $ | 2,333 | | |
| Bilaterals | | 1,500 | | | — | | | 878 | | | — | | | 622 | | |
| Liquidity Facility | | 971 | | | — | | | 720 | | | — | | | 191 | | (c) |
| Project Finance | | 137 | | | — | | | 117 | | | — | | | 20 | | |
| Total | | $ | 6,108 | | | $ | — | | | $ | 1,775 | | | $ | 1,107 | | | $ | 3,166 | | |
__________
(a)Our commercial paper program is supported by the revolving credit agreement. In order to maintain our commercial paper program in the amounts indicated above, we must have a credit facility in place, at least equal to the amount of our commercial paper program. As of December 31, 2024 and 2023, the maximum program size of our commercial paper program was $4.5 billion and $3.5 billion, respectively. We do not issue commercial paper in an aggregate amount exceeding the then available capacity under our credit facility. There were no commercial paper borrowings outstanding as of December 31, 2024. The weighted average interest rate on commercial paper borrowings was 5.66% as of December 31, 2023.
(b)Refer to table below for additional information on our bilateral credit agreements.
(c)The maximum amount of the bank commitment is not to exceed $971 million. The aggregate available capacity of the facility is subject to market fluctuations based on the value of U.S Treasury Securities which determines the amount of collateral held in the trust. We may post additional collateral to borrow up to the maximum bank commitment. As of December 31, 2024 and 2023, without posting additional collateral, the actual availability of facility, prior to outstanding letters of credit was $928 million and $911 million, respectively.
Bilateral Credit Agreements
The following table reflects the bilateral credit agreements at December 31, 2024:
| | | | | | | | | | | | | | | | | | | | |
Date Initiated(b) | | Latest Amendment Date | | Maturity Date(a) | | Amount |
| | | | | | |
| January 2016 | | April 2023 | | April 2026 | | $ | 150 | |
| | | | | | |
| October 2019 | | N/A | | N/A | | 200 |
| | | | | | |
| November 2019 | | N/A | | N/A | | 300 |
| November 2019 | | N/A | | N/A | | 100 |
| November 2019 | | June 2024 | | June 2026 | | 100 |
| May 2020 | | March 2023 | | N/A | | 300 |
| August 2022 | | N/A | | N/A | | 50 |
| March 2023 | | N/A | | March 2025 | | 100 |
| December 2023 | | N/A | | N/A | | 200 |
| March 2024 | | N/A | | N/A | | 200 |
| May 2024 | | N/A | | N/A | | 150 |
__________
(a)Credit facilities that do not contain a maturity date are specific to the agreements set within each contract. In some instances, credit facilities are automatically renewed based on the contingency standards set within the specific agreement.
(b)Bilateral credit agreements solely support the issuance of letters of credit and do not back our commercial paper program.
Combined Notes to Consolidated Financial Statements
(Dollars in millions, unless otherwise noted)
Note 16 — Debt and Credit Agreements
In January 2025, we initiated a new bilateral credit agreement for $200 million, with no maturity date.
Short-Term Loan Agreements
As of December 31, 2024 and 2023, we had the following short-term loan agreements:
| | | | | | | | | | | | | | | | | | | | | | | | | | |
| Month Initiated | | Interest Rate | | Maturity | | Outstanding Amount as of December 31, 2024 | | Outstanding Amount as of December 31, 2023 |
| January 2023 | | 1-month SOFR + 0.80% | | January 2024 | | $ | — | | | $ | 100 | |
| February 2023 | | 1-month SOFR + 1.05% | | February 2024 | | — | | | 400 |
Long-Term Debt
The following table presents the outstanding long-term debt as of December 31, 2024 and 2023:
| | | | | | | | | | | | | | | | | | | | | | | | | | | | | |
| | | | |
| | December 31, |
| Rates | | Maturity Date | 2024 | | 2023 |
| Long-term debt | | | | | | | | | |
| Senior unsecured notes | 3.25 | % | - | 6.50 | % | | 2025 - 2054 | | $ | 6,588 | | | $ | 5,688 | |
| Tax-exempt notes | 4.10 | % | - | 4.45 | % | | 2025 - 2053(a) | | 435 | | | 435 | |
| | | | | | | | | |
| | | | | | | | | |
| Notes payable and other | 2.20 | % | - | 6.10 | % | | 2025 - 2034 | | 51 | | | 34 | |
| Nonrecourse debt: | | | | | | | | | |
| Fixed rates | 2.29 | % | - | 6.00 | % | | 2031 - 2037 | | 720 | | | 780 | |
| Variable rates | 6.76 | % | - | 8.58 | % | | 2026 - 2027 | | 680 | | | 740 | |
| Total long-term debt | | | | | | | 8,474 | | | 7,677 | |
| Unamortized debt discount and premium, net | | | | | | | (4) | | | (4) | |
| Unamortized debt issuance costs | | | | | | | (58) | | | (56) | |
| | | | | | | | | |
| Long-term debt due within one year | | | | | | | (1,028) | | | (121) | |
| Long-term debt | | | | | | | $ | 7,384 | | | $ | 7,496 | |
________(a)The Tax-exempt notes have a maturity date of March 2025 to April 2053, and a mandatory purchase date that ranges from March 2025 to June 2029.
Long-term debt maturities in the periods 2025 through 2029 and thereafter are as follows:
| | | | | |
| 2025 | $ | 1,028 | |
| 2026 | 114 | |
| 2027 | 691 | |
| 2028 | 847 | |
| 2029 | 156 | |
| 2030 and thereafter | 5,638 | |
| Total | $ | 8,474 | |
Debt Covenants
As of December 31, 2024, we are in compliance with all debt covenants.
Nonrecourse Debt
We have also issued nonrecourse debt, for which approximately $2 billion of generating assets have been pledged as collateral as of both December 31, 2024 and 2023, respectively. Borrowings under these agreements
Combined Notes to Consolidated Financial Statements
(Dollars in millions, unless otherwise noted)
Note 16 — Debt and Credit Agreements
are secured by the assets and equity of each respective project. The lenders do not have recourse against us in the event of a default. If a specific project financing entity does not maintain compliance with its specific nonrecourse debt covenants, there could be a requirement to accelerate repayment of the associated debt or other borrowings earlier than the stated maturity dates. In these instances, if such repayment was not satisfied, the lenders or security holders would generally have rights to foreclose against the project-specific assets and related collateral. The potential requirement to satisfy the associated debt or other borrowings earlier than otherwise anticipated could lead to impairments due to a higher likelihood of disposing of the respective project-specific assets significantly before the end of their useful lives.
Antelope Valley Solar Ranch One. In December 2011, the DOE Loan Programs Office issued a guarantee for up to $646 million for a nonrecourse loan from the Federal Financing Bank to support the financing of the construction of the Antelope Valley facility. The project became fully operational in 2014. The loan will mature in January 2037. Interest rates on the loan were fixed upon each advance at a spread of 37.5 basis points above U.S. Treasuries of comparable maturity. The advances were completed in December 2015 and the outstanding loan balance bears interest at an average blended interest rate of 2.82%. As of December 31, 2024 and 2023, approximately $365 million and $390 million were outstanding, respectively. In addition, we have issued letters of credit to support the equity investment in the project, with $36 million outstanding as of December 31, 2024 and 2023. In December 2017, our interests in Antelope Valley were contributed to and are pledged as collateral for the CR financing structures referenced below.
Continental Wind, LLC. In September 2013, Continental Wind, our indirect subsidiary, completed the issuance and sale of $613 million senior secured notes. Continental Wind owns and operates a portfolio of wind farms in Idaho, Kansas, Michigan, Oregon, New Mexico and Texas with a total net capacity of 667 MWs. The net proceeds were distributed to us for general business purposes. The notes are scheduled to mature in February 2033. The notes bear interest at a fixed rate of 6.00% with interest payable semi-annually. As of December 31, 2024 and 2023, approximately $290 million and $315 million were outstanding, respectively.
In addition, Continental Wind has a $128 million letter of credit facility and $4 million working capital revolver facility. Continental Wind has issued letters of credit to satisfy certain of its credit support and security obligations. As of December 31, 2024 and 2023, the Continental Wind letter of credit facility had $119 million and $116 million in letters of credit outstanding related to the project, respectively.
In 2017, our interests in Continental Wind were contributed to CRP, whose assets were contributed to and are pledged as collateral for the CR financing structure referenced below.
Renewable Power Generation. In March 2016, RPG, our indirect subsidiary, issued $150 million aggregate principal amount of nonrecourse senior secured notes. The net proceeds were distributed to us for paydown of long-term debt obligations at Sacramento PV Energy and Constellation Solar Horizons and for general business purposes. The loan is scheduled to mature in March 2035. The term loan bears interest at a fixed rate of 4.11% payable semi-annually. As of December 31, 2024 and 2023, approximately $60 million and $70 million were outstanding, respectively. In 2017, our interests in RPG were contributed to CRP, whose assets were contributed to and are pledged as collateral for the CR financing structure referenced below.
Constellation Renewables. In December 2020, CR entered into a financing agreement for a $750 million nonrecourse senior secured term loan credit facility, scheduled to mature in December 2027. Beginning in July 2024, the term loan bears interest at a variable rate equal to 3-month SOFR + 2.25%, subject to a 1% SOFR floor with interest payable quarterly. Redemptions from June 2023 through June 2024 were based on 3-month SOFR + 2.76%. Redemptions prior to June 2023 were based on LIBOR + 2.50%. In addition to the financing, CR entered interest rate swaps to manage a portion of the interest rate exposure in connection with the financing. The swap had an initial notional amount of $516 million and fixed the 3-month LIBOR at 1.05%. Beginning in June 2023, the swap fixed the 3-month SOFR at 0.8295%. The swap expired in December 2024. In January 2024, CR entered an additional interest rate swap to manage a portion of the interest rate exposure in connection with the financing. The swap had a notional amount of $120M and fixed the 3-month SOFR to 3.98%.
Our interests in CRP and Antelope Valley are contributed to and pledged as collateral for this financing. As of December 31, 2024 and 2023, $630 million and $650 million was outstanding, respectively. See Note 21 — Variable Interest Entities for additional information on CRP and Note 15 — Derivative Financial Instruments for additional information on interest rate swaps.
Combined Notes to Consolidated Financial Statements
(Dollars in millions, unless otherwise noted)
Note 16 — Debt and Credit Agreements
West Medway II, LLC. In May 2021, West Medway II, LLC (West Medway II), our indirect subsidiary, entered into a financing agreement for a $150 million nonrecourse senior secured term loan credit facility with a maturity date in March 2026. Beginning in May 2023, the term loan bears interest at a variable rate equal to 1-month SOFR plus the variable interest rate of 2.975% - 3.225%, paid quarterly. Redemptions prior to May 2023 were based on LIBOR + 2.875%. In addition to the financing, West Medway II entered interest rate swaps to manage a portion of the interest rate exposure in connection with the financing. The swaps had an initial notional amount of $113 million and fixed the 1-month LIBOR at 0.61%. Beginning in May 2023, the swap fixed the 1-month SOFR at 0.5365%. We used the net proceeds for general corporate purposes. Our interests in West Medway II, were pledged as collateral for this financing. As of December 31, 2024 and 2023, approximately $50 million and $85 million was outstanding, respectively. See Note 15 — Derivative Financial Instruments for additional information on interest rate swaps.
17. Fair Value of Financial Assets and Liabilities
We measure and classify fair value measurements in accordance with the hierarchy as defined by GAAP. The hierarchy prioritizes the inputs to valuation techniques used to measure fair value into three levels as follows:
•Level 1 — quoted prices (unadjusted) in active markets for identical assets or liabilities that we have the ability to liquidate as of the reporting date
•Level 2 — inputs other than quoted prices included within Level 1 that are directly observable for the asset or liability or indirectly observable through corroboration with observable market data
•Level 3 — unobservable inputs, such as internally developed pricing models or third-party valuations for the asset or liability due to little or no market activity for the asset or liability
Fair Value of Financial Liabilities Recorded at Amortized Cost
The following tables present the carrying amounts and fair values of our long-term debt and the SNF obligation as of December 31, 2024 and 2023. We have no financial liabilities classified as Level 1.
The carrying amounts of the short-term liabilities as presented in the Consolidated Balance Sheets are representative of their fair value (Level 2) because of the short-term nature of these instruments.
| | | | | | | | | | | | | | | | | | | | | | | | | | | | | | | | | | | | | | | | | | | | | | | | | | |
| | December 31, 2024 | | December 31, 2023 |
| | Carrying Amount | | Fair Value | | Carrying Amount | | Fair Value |
| | | Level 2 | | Level 3 | | Total | | | Level 2 | | Level 3 | | Total |
| Long-Term Debt, including amounts due within one year | | $ | 8,412 | | | $ | 7,805 | | | $ | 716 | | | $ | 8,521 | | | $ | 7,617 | | | $ | 7,140 | | | $ | 774 | | | $ | 7,914 | |
| SNF Obligation | | 1,366 | | | 1,278 | | | — | | | 1,278 | | | 1,296 | | | 1,222 | | | — | | | 1,222 | |
Combined Notes to Consolidated Financial Statements
(Dollars in millions, unless otherwise noted)
Note 17 — Fair Value of Financial Assets and Liabilities
We use the following methods and assumptions to estimate fair value of our financial liabilities recorded at carrying cost:
| | | | | | | | |
| Type | Level | Valuation |
| Long-term Debt, including amounts due within one year |
| Taxable Debt Securities | 2 | The fair value is determined by a valuation model that is based on a conventional discounted cash flow methodology and utilizes assumptions of current market pricing curves. We obtain credit spreads based on trades of our existing debt securities as well as other issuers in the utility sector with similar credit ratings. The yields are then converted into discount rates of various tenors that are used for discounting the respective cash flows of the same tenor for each bond or note. |
| Variable Rate Financing Debt | 2 | Debt rates are reset on a regular basis and the carrying value approximates fair value. |
| Government-Backed Fixed Rate Project Financing Debt | 3 | The fair value is similar to the process for taxable debt securities. Due to the lack of market trading data on similar debt, the discount rates are derived based on the original loan interest rate spread to the applicable U.S. Treasury rate as well as a current market curve derived from government-backed securities. |
| Non-Government-Backed Fixed Rate Nonrecourse Debt | 3 | Fair value is based on market and quoted prices for its own and other nonrecourse debt with similar risk profiles. Given the low trading volume in the nonrecourse debt market, the price quotes used to determine fair value will reflect certain qualitative factors, such as market conditions, investor demand, new developments that might significantly impact the project cash flows or off-taker credit, and other circumstances related to the project. |
| SNF Obligation | | |
| SNF Obligation | 2 | The carrying amount is derived from a contract with the DOE to provide for disposal of SNF from certain of our nuclear generating stations. See Note 18 — Commitments and Contingencies for further details. When determining the fair value of the obligation, the future carrying amount of the SNF obligation is calculated by compounding the current book value of the SNF obligation at the 13-week U.S. Treasury rate. The compounded obligation amount is discounted back to present value using our discount rate, which is calculated using the same methodology as described above for the taxable debt securities, and an estimated maturity date of 2040 and 2035 for the years ended December 31, 2024 and 2023, respectively. |
Combined Notes to Consolidated Financial Statements
(Dollars in millions, unless otherwise noted)
Note 17 — Fair Value of Financial Assets and Liabilities
Recurring Fair Value Measurements
The following tables present assets and liabilities measured and recorded at fair value in the Consolidated Balance Sheets on a recurring basis and their level within the fair value hierarchy as of December 31, 2024 and 2023:
| | | | | | | | | | | | | | | | | | | | | | | | | | | | | | | | | | | | | | | | | | | | | | | | | | | |
| As of December 31, 2024 | | As of December 31, 2023 |
| Level 1 | | Level 2 | | Level 3 | | | | Total | | Level 1 | | Level 2 | | Level 3 | | | | Total |
| Assets | | | | | | | | | | | | | | | | | | | |
Cash equivalents(a) | $ | 120 | | | $ | — | | | $ | — | | | | | $ | 120 | | | $ | 42 | | | $ | — | | | $ | — | | | | | $ | 42 | |
| NDT fund investments | | | | | | | | | | | | | | | | | | | |
Cash equivalents(b) | 187 | | | 163 | | | — | | | | | 350 | | | 356 | | | 87 | | | — | | | | | 443 | |
| Equities | 5,230 | | | 1,897 | | | — | | | | | 7,127 | | | 4,574 | | | 1,990 | | | 1 | | | | | 6,565 | |
| | | | | | | | | | | | | | | | | | | |
| | | | | | | | | | | | | | | | | | | |
| | | | | | | | | | | | | | | | | | | |
| | | | | | | | | | | | | | | | | | | |
| | | | | | | | | | | | | | | | | | | |
| | | | | | | | | | | | | | | | | | | |
| Fixed income | 2,089 | | | 1,462 | | | 368 | | | | | 3,919 | | | 2,043 | | | 1,523 | | | 277 | | | | | 3,843 | |
| Private credit | — | | | — | | | 134 | | | | | 134 | | | — | | | — | | | 151 | | | | | 151 | |
| Assets measured at NAV | — | | | — | | | — | | | | | 5,791 | | | — | | | — | | | — | | | | | 5,396 | |
| | | | | | | | | | | | | | | | | | | |
| | | | | | | | | | | | | | | | | | | |
| | | | | | | | | | | | | | | | | | | |
NDT fund investments subtotal(c) | 7,506 | | | 3,522 | | | 502 | | | | | 17,321 | | | 6,973 | | | 3,600 | | | 429 | | | | | 16,398 | |
| Rabbi trust investments | 58 | | | 41 | | | 1 | | | | | 100 | | | 48 | | | 33 | | | 1 | | | | | 82 | |
| | | | | | | | | | | | | | | | | | | |
| | | | | | | | | | | | | | | | | | | |
| | | | | | | | | | | | | | | | | | | |
| | | | | | | | | | | | | | | | | | | |
| Investments in equities | 389 | | | — | | | — | | | | | 389 | | | 372 | | | — | | | — | | | | | 372 | |
| Mark-to-market derivative assets | | | | | | | | | | | | | | | | | | | |
| Economic hedges | 1,278 | | | 5,306 | | | 2,641 | | | | | 9,225 | | | 2,330 | | | 5,821 | | | 3,143 | | | | | 11,294 | |
| Proprietary trading | — | | | — | | | — | | | | | — | | | — | | | — | | | 2 | | | | | 2 | |
| Effect of netting and allocation of collateral | (1,097) | | | (4,790) | | | (2,123) | | | | | (8,010) | | | (1,996) | | | (5,195) | | | (1,931) | | | | | (9,122) | |
| Mark-to-market derivative assets subtotal | 181 | | | 516 | | | 518 | | | | | 1,215 | | | 334 | | | 626 | | | 1,214 | | | | | 2,174 | |
| DPP consideration | — | | | — | | | — | | | | | — | | | — | | | 1,216 | | | — | | | | | 1,216 | |
| Total assets measured at fair value | 8,254 | | | 4,079 | | | 1,021 | | | | | 19,145 | | | 7,769 | | | 5,475 | | | 1,644 | | | | | 20,284 | |
| | | | | | | | | | | | | | | | | | | |
| Liabilities | | | | | | | | | | | | | | | | | | | |
| Mark-to-market derivative liabilities | | | | | | | | | | | | | | | | | | | |
| Economic hedges | (1,222) | | | (5,462) | | | (2,778) | | | | | (9,462) | | | (2,681) | | | (7,154) | | | (2,736) | | | | | (12,571) | |
| Proprietary trading | — | | | — | | | — | | | | | — | | | — | | | — | | | (2) | | | | | (2) | |
| Effect of netting and allocation of collateral | 1,180 | | | 5,157 | | | 2,259 | | | | | 8,596 | | | 2,587 | | | 6,542 | | | 2,393 | | | | | 11,522 | |
| Mark-to-market derivative liabilities subtotal | (42) | | | (305) | | | (519) | | | | | (866) | | | (94) | | | (612) | | | (345) | | | | | (1,051) | |
| Deferred compensation obligation | — | | | (93) | | | — | | | | | (93) | | | — | | | (69) | | | — | | | | | (69) | |
| Total liabilities measured at fair value | (42) | | | (398) | | | (519) | | | | | (959) | | | (94) | | | (681) | | | (345) | | | | | (1,120) | |
| Total net assets | $ | 8,212 | | | $ | 3,681 | | | $ | 502 | | | | | $ | 18,186 | | | $ | 7,675 | | | $ | 4,794 | | | $ | 1,299 | | | | | $ | 19,164 | |
__________
(a)CEG Parent has $130 million and $54 million of Level 1 cash equivalents as of December 31, 2024 and 2023, respectively. We exclude cash of $2,924 million and $349 million, and restricted cash of $71 million and $49 million, as of December 31, 2024 and 2023, respectively. CEG Parent has excluded an additional $4 million and $2 million of cash as of December 31, 2024 and 2023, respectively.
(b)Includes net liabilities of $148 million and $115 million as of December 31, 2024 and 2023, respectively, which consist of receivables related to pending securities sales, interest and dividend receivables, repurchase agreement obligations, and payables related to pending securities purchases. The repurchase agreements are generally short-term in nature with durations generally of 30 days or less.
(c)Includes total NDT derivative assets and liabilities that are not material, which have total notional amounts of $1,119 million and $948 million as of December 31, 2024 and 2023, respectively. The notional principal amounts provide one measure of the transaction volume outstanding as of the periods ended and do not represent the amount of our exposure to credit or market loss.
Combined Notes to Consolidated Financial Statements
(Dollars in millions, unless otherwise noted)
Note 17 — Fair Value of Financial Assets and Liabilities
As of December 31, 2024, our NDTs have outstanding commitments to invest in private credit, private equity, and real assets of $482 million, $311 million, and $791 million, respectively. These commitments will be funded by our existing NDT funds.
Equity Security Investments without Readily Determinable Fair Values. We hold investments without readily determinable fair values with carrying amounts of $150 million and $103 million as of December 31, 2024 and 2023, respectively. Changes in fair value, cumulative adjustments, and impairments were not material for the years ended December 31, 2024 and 2023.
Reconciliation of Level 3 Assets and Liabilities
The following tables present the fair value reconciliation of Level 3 assets and liabilities measured at fair value on a recurring basis during the years ended December 31, 2024 and 2023:
| | | | | | | | | | | | | | | | | | | | | | | |
| For the Year Ended December 31, 2024 |
| NDT Fund Investments | | Mark-to-Market Derivatives | | Rabbi Trust Investments | | Total |
| Balance as of January 1, 2024 | $ | 429 | | | $ | 869 | | | $ | 1 | | | $ | 1,299 | |
| Total realized / unrealized gains (losses) | | | | | | | |
| Included in net income (loss) | 5 | | | (861) | | (a) | — | | | (856) | |
| Included in Payables related to Regulatory Agreement Units | 16 | | | — | | | — | | | 16 | |
| Change in collateral | — | | | (325) | | | — | | | (325) | |
| Purchases, sales, issuances and settlements | | | | | | | |
| Purchases | 66 | | | 61 | | | — | | | 127 | |
| Sales | — | | | (83) | | | — | | | (83) | |
| Settlements | (15) | | | 29 | |
| — | | | 14 | |
| Transfers into Level 3 | 1 | | | 44 | | (b) | — | | | 45 | |
| Transfers out of Level 3 | — | | | 265 | | (b) | — | | | 265 | |
| Balance as of December 31, 2024 | $ | 502 | | | $ | (1) | | | $ | 1 | | | $ | 502 | |
| The amount of total gains (losses) included in income attributed to the change in unrealized gains (losses) related to assets and liabilities as of December 31, 2024 | $ | 5 | | | $ | (126) | | | $ | — | | | $ | (121) | |
Combined Notes to Consolidated Financial Statements
(Dollars in millions, unless otherwise noted)
Note 17 — Fair Value of Financial Assets and Liabilities
| | | | | | | | | | | | | | | | | | | | | | | |
| For the Year Ended December 31, 2023 |
| NDT Fund Investments | | Mark-to-Market Derivatives | | Rabbi Trust Investments | | Total |
| Balance as of January 1, 2023 | $ | 423 | | | $ | 219 | | | $ | 1 | | | $ | 643 | |
| Total realized / unrealized gains (losses) | | | | | | | |
| Included in net income (loss) | 2 | | | 171 | | (a) | — | | | 173 | |
| Included in Payables related to Regulatory Agreement Units | 10 | | | — | | | — | | | 10 | |
| Change in collateral | — | | | 243 | | | — | | | 243 | |
| Purchases, sales, issuances and settlements | | | | | | | |
| Purchases | — | | | 160 | | | — | | | 160 | |
| Sales | 1 | | | (29) | | | — | | | (28) | |
| Settlements | (7) | | | 32 | | | — | | | 25 | |
| Transfers into Level 3 | — | | | 46 | | (b) | — | | | 46 | |
| Transfers out of Level 3 | — | | | 27 | | (b) | — | | | 27 | |
| Balance as of December 31, 2023 | $ | 429 | | | $ | 869 | | | $ | 1 | | | $ | 1,299 | |
| The amount of total gains (losses) included in income attributed to the change in unrealized gains (losses) related to assets and liabilities as of December 31, 2023 | $ | 2 | | | $ | 1,194 | | | $ | — | | | $ | 1,196 | |
__________
(a)Includes a reduction of ($706) million and ($991) million for realized gains due to the settlement of derivative contracts for the years ended December 31, 2024 and 2023, respectively.
(b)Transfers into and out of Level 3 generally occur when the contract tenor becomes less and more observable, respectively, primarily due to changes in market liquidity or assumptions for certain commodity contracts.
The following table presents the income statement classification of the total realized and unrealized gains (losses) included in income for Level 3 assets and liabilities measured at fair value on a recurring basis during the years ended December 31, 2024, 2023, and 2022:
| | | | | | | | | | | | | | | | | | | | | | | | | | | | | | | | | | | | | | | | | | | | | | | | | | | | | |
| Operating Revenues | | Purchased Power and Fuel | | Other, net |
| 2024 | | 2023 | | 2022 | | 2024 | | 2023 | | 2022 | | 2024 | | 2023 | | 2022 |
Total gains (losses) included in net income | $ | (539) | | | $ | 706 | | | $ | (860) | | | $ | (293) | | | $ | (503) | | | $ | 5 | | | $ | 5 | | | $ | 2 | | | $ | (4) | |
| | | | | | | | | | | | | | | | | |
Total unrealized gains (losses) | 207 | | | 1,673 | | | (1,330) | | | (333) | | | (479) | | | 65 | | | 5 | | | 2 | | | (2) | |
Valuation Techniques Used to Determine Fair Value
Cash Equivalents. Investments with original maturities of three months or less when purchased, including mutual and money market funds, are considered cash equivalents. The fair values are based on observable market prices and, therefore, are included in the recurring fair value measurements hierarchy as Level 1.
NDT Fund Investments. The trust fund investments have been established to satisfy our nuclear decommissioning obligations as required by the NRC. The NDT funds hold debt and equity securities directly and indirectly through commingled funds and mutual funds, which are included in equities and fixed income. Our NDT fund investments policies outline investment guidelines for the trusts and limit the trust funds’ exposures to investments in highly illiquid markets and other alternative investments, including private credit, private equity, and real assets. Investments with maturities of three months or less when purchased, including certain short-term fixed income securities are considered cash equivalents and included in the recurring fair value measurements hierarchy as Level 1 or Level 2.
Combined Notes to Consolidated Financial Statements
(Dollars in millions, unless otherwise noted)
Note 17 — Fair Value of Financial Assets and Liabilities
Equities. These investments consist of individually held equity securities, equity mutual funds, and equity commingled funds in domestic and foreign markets. With respect to individually held equity securities, the trustees obtain prices from pricing services, whose prices are generally obtained from direct feeds from market exchanges, which we are able to independently corroborate. Equity securities held individually, including real estate investment trusts, rights, and warrants, are primarily traded on exchanges that contain only actively traded securities due to the volume trading requirements imposed by these exchanges. The equity securities that are held directly by the trust funds are valued based on quoted prices in active markets and categorized as Level 1. Certain equity securities have been categorized as Level 2 because they are based on evaluated prices that reflect observable market information, such as actual trade information or similar securities. Certain private placement equity securities are categorized as Level 3 because they are not publicly traded and are priced using significant unobservable inputs.
Equity commingled funds and mutual funds are maintained by investment companies, and fund investments are held in accordance with a stated set of fund objectives. The values of some of these funds are publicly quoted. For mutual funds which are publicly quoted, the funds are valued based on quoted prices in active markets and have been categorized as Level 1. For equity commingled funds and mutual funds which are not publicly quoted, the fund administrators value the funds using the NAV per fund share, derived from the quoted prices in active markets on the underlying securities and are not classified within the fair value hierarchy. These investments can typically be redeemed monthly or more frequently, with 30 or less days of notice and without further restrictions.
Fixed income. For fixed income securities, which consist primarily of corporate debt securities, U.S. government securities, foreign government securities, municipal bonds, asset and mortgage-backed securities, commingled funds, mutual funds, and derivative instruments, the trustees obtain multiple prices from pricing vendors whenever possible, which enables cross-provider validations in addition to checks for unusual daily movements. A primary price source is identified based on asset type, class, or issue for each security. With respect to individually held fixed income securities, the trustees monitor prices supplied by pricing services and may use a supplemental price source or change the primary price source of a given security if the portfolio managers challenge an assigned price and the trustees determine that another price source is preferable. We have obtained an understanding of how these prices are derived, including the nature and observability of the inputs used in deriving such prices. Additionally, we selectively corroborate the fair values of securities by comparison to other market-based price sources. Investments in U.S. Treasury securities have been categorized as Level 1 because they trade in highly-liquid and transparent markets. Certain private placement fixed income securities have been categorized as Level 3 because they are priced using certain significant unobservable inputs and are typically illiquid. The remaining fixed income securities, including certain other fixed income investments, are based on evaluated prices that reflect observable market information, such as actual trade information of similar securities, adjusted for observable differences and are categorized as Level 2. This includes equity investments sold short during the period, which represent liabilities.
Other fixed income investments primarily consist of fixed income commingled funds and mutual funds, which are maintained by investment companies and hold fund investments in accordance with a stated set of fund objectives. The values of some of these funds are publicly quoted. For mutual funds which are publicly quoted, the funds are valued based on quoted prices in active markets and have been categorized as Level 1. For fixed income commingled funds and mutual funds which are not publicly quoted, the fund administrators value the funds using the NAV per fund share, derived from the quoted prices in active markets of the underlying securities and are not classified within the fair value hierarchy. These investments typically can be redeemed monthly or more frequently, with 30 or less days of notice and without further restrictions.
Derivative instruments. These instruments, consisting primarily of futures and swaps to manage risk, are recorded at fair value. Over-the-counter derivatives are valued daily, based on quoted prices in active markets and trade in open markets, and have been categorized as Level 1. Derivative instruments other than over-the-counter derivatives are valued based on external price data of comparable securities and have been categorized as Level 2.
Private credit. Private credit investments primarily consist of investments in private debt strategies. These investments are generally less liquid assets with an underlying term of 3 to 5 years and are intended to be held to maturity. The fair value of these investments is determined by the fund manager or administrator using a combination of valuation models including cost models, market models, and income models and typically cannot be redeemed until maturity of the term loan. Private credit investments held directly by us are categorized as Level 3 because they are based largely on inputs that are unobservable and utilize complex valuation models.
Combined Notes to Consolidated Financial Statements
(Dollars in millions, unless otherwise noted)
Note 17 — Fair Value of Financial Assets and Liabilities
For certain private credit funds, the fair value is determined using a combination of valuation models including cost models, market models, and income models and typically cannot be redeemed until maturity of the term loan. These investments are not classified within the fair value hierarchy because their fair value is determined using NAV or its equivalent as a practical expedient.
Private equity. These investments include those in limited partnerships that invest in operating companies that are not publicly traded on a stock exchange such as leveraged buyouts, growth capital, venture capital, distressed investments, and investments in natural resources. These investments typically cannot be redeemed and are generally liquidated over a period of 8 to 10 years from the initial investment date, which is based on our understanding of the investment funds. Private equity valuations are reported by the fund manager and are based on the valuation of the underlying investments, which include unobservable inputs such as cost, operating results, discounted future cash flows, and market-based comparable data. These valuation inputs are unobservable. The fair value of private equity investments is determined using NAV or its equivalent as a practical expedient, and therefore, these investments are not classified within the fair value hierarchy.
Real assets. These investments are funds with a direct investment in pools of real estate properties or infrastructure assets. These funds are reported by the fund manager and are generally based on independent appraisals of the underlying investments from sources with professional qualifications, typically using a combination of market-based comparable data and discounted cash flows. These valuation inputs are unobservable. Certain real asset investments cannot be redeemed and are generally liquidated over a period of 8 to 25 years from the initial investment date, which is based on our understanding of the investment funds. The remaining liquid real asset investments are generally redeemable from the investment vehicle quarterly, with 30 to 90 days of notice. The fair value of real asset investments is determined using NAV or its equivalent as a practical expedient, and therefore, these investments are not classified within the fair value hierarchy.
We evaluated our NDT portfolios for the existence of significant concentrations of credit risk as of December 31, 2024. Types of concentrations that were evaluated include, but are not limited to, investment concentrations in a single entity, type of industry, foreign country, and individual fund. As of December 31, 2024, there were no significant concentrations (generally defined as greater than 10 percent) of risk in the NDT assets.
See Note 10 — Asset Retirement Obligations for additional information on the NDT fund investments.
Rabbi Trust Investments. The Rabbi trusts were established to hold assets related to deferred compensation plans existing for certain active and retired members of executive management and directors. The Rabbi trusts' assets are included in investments in the Consolidated Balance Sheets and consist primarily of money market funds, mutual funds, and life insurance policies. Money market funds and mutual funds are publicly quoted and have been categorized as Level 1 given the clear observability of the prices. The life insurance policies are valued using the cash surrender value of the policies, net of loans against those policies, which is provided by a third-party. Certain life insurance policies, which consist primarily of mutual funds that are priced based on observable market data, have been categorized as Level 2 because the life insurance policies can be liquidated at the reporting date for the value of the underlying assets.
Deferred Compensation Obligations. Our deferred compensation plans allow participants to defer certain cash compensation into a notional investment account. We include such plans in other current and noncurrent liabilities in the Consolidated Balance Sheets. The value of our deferred compensation obligations is based on the market value of the participants’ notional investment accounts. The underlying notional investments are comprised primarily of equities, mutual funds, commingled funds, and fixed income securities which are based on directly and indirectly observable market prices. Since the deferred compensation obligations themselves are not exchanged in an active market, they are categorized as Level 2 in the fair value hierarchy.
The value of certain employment agreement obligations (which are included with the Deferred compensation obligation in the table above) are based on a known and certain stream of payments to be made over time and are categorized as Level 2 within the fair value hierarchy.
Investments in Equities. We hold certain investments in equity securities with readily determinable fair values in addition to those held within the NDT funds. These equity securities are valued based on quoted prices in active markets and are categorized as Level 1.
Combined Notes to Consolidated Financial Statements
(Dollars in millions, unless otherwise noted)
Note 17 — Fair Value of Financial Assets and Liabilities
Deferred Purchase Price Consideration. We had DPP consideration for the sale of certain receivables of retail electricity. This amount was valued based on the sales price of the receivables net of allowance for credit losses (see Note 1 — Basis of Presentation for additional details on our policy for credit losses). Since the DPP consideration was based on the sales price of the receivables, it was categorized as Level 2 in the fair value hierarchy. See Note 7 — Accounts Receivable for additional information on the sale of certain customer accounts receivables.
Mark-to-Market Derivatives. Derivative contracts are traded in both exchange-based and non-exchange-based markets. Exchange-based derivatives that are valued using unadjusted quoted prices in active markets are categorized in Level 1 in the fair value hierarchy. Certain derivatives’ pricing is verified using indicative price quotations available through brokers, over-the-counter, or exchanges and are categorized in Level 2. These price quotations reflect the average of the bid-ask, mid-point prices and are obtained from sources that we believe provide the most liquid market for the commodity. The price quotations are reviewed and corroborated to ensure the prices are observable and representative of an orderly transaction between market participants. This includes consideration of actual transaction volumes, market delivery points, bid-ask spreads, and contract duration. The remainder of derivative contracts are valued using the Black model, an industry standard option valuation model. The Black model considers inputs such as contract terms, including maturity, and market parameters, including assumptions of the future prices of energy, interest rates, volatility, credit worthiness, and credit spread. For derivatives that trade in liquid markets, such as generic forwards, swaps, and options, model inputs are generally observable. Such instruments are categorized in Level 2. Our derivatives are predominantly at liquid trading points. For derivatives that trade in less liquid markets with limited pricing information, model inputs generally would include both observable and unobservable inputs. These valuations may include an estimated basis adjustment from an illiquid trading point to a liquid trading point for which active price quotations are available. Such instruments are categorized in Level 3.
For valuations that include both observable and unobservable inputs, if the unobservable input is determined to be significant to the overall inputs, the entire valuation is categorized in Level 3. This includes derivatives valued using indicative price quotations whose contract tenure extends into unobservable periods. In instances where observable data is unavailable, consideration is given to the assumptions that market participants would use in valuing the asset or liability. This includes assumptions about market risks such as liquidity, volatility, and contract duration. Such instruments are categorized in Level 3 as the model inputs generally are not observable. We consider credit and non-performance risk in the valuation of derivative contracts categorized in Level 2 and 3, including both historical and current market data, in our assessment of credit and non-performance risk by counterparty. Due to master netting agreements and collateral posting requirements, the impacts of credit and non-performance risk were not material to the consolidated financial statements.
Disclosed below is detail surrounding our significant Level 3 valuations. The calculated fair value includes marketability discounts for margining provisions and other attributes. The Level 3 balance generally consists of forward sales and purchases of power and natural gas and certain transmission congestion contracts. We utilize various inputs and factors including market data and assumptions that market participants would use in pricing assets or liabilities as well as assumptions about the risks inherent in the inputs to the valuation technique. The inputs and factors include forward commodity prices, commodity price volatility, contractual volumes, delivery location, interest rates, credit quality of counterparties, and credit enhancements.
For commodity derivatives, the primary input to the valuation models is the forward commodity price curve for each instrument. All locations are reviewed and verified by risk management considering published exchange transaction prices, executed bilateral transactions, broker quotes, and other observable or public data sources. The relevant forward commodity curve used to value each of the derivatives depends on a number of factors, including commodity type, delivery location, and delivery period. Price volatility varies by commodity and location. When appropriate, we discount future cash flows using risk-free interest rates with adjustments to reflect the credit quality of each counterparty for assets and our own credit quality for liabilities. The level of observability of a forward commodity price varies generally due to the delivery location and delivery period. Certain delivery locations including PJM West Hub (for power) and Henry Hub (for natural gas) are more liquid and prices are observable for up to three years in the future. The observability period of volatility is generally shorter than the underlying power curve used in option valuations. The forward curve for a less liquid location is estimated by using the forward curve from the liquid location and applying a spread to represent the cost to transport the commodity to the delivery location. This spread does not typically represent a majority of the instrument’s market price. As a result, the change in fair value is closely tied to liquid market movements and not a change in the applied spread. The change in fair value associated with a change in the spread is generally immaterial. An
Combined Notes to Consolidated Financial Statements
(Dollars in millions, unless otherwise noted)
Note 17 — Fair Value of Financial Assets and Liabilities
average spread calculated across all Level 3 power and gas delivery locations is approximately $48.71 and $3.68 for power and natural gas, respectively as of December 31, 2024. Many of the commodity derivatives are short term in nature and thus a majority of the fair value may be based on observable inputs even though the contract as a whole must be classified as Level 3.
See Note 15 — Derivative Financial Instruments for additional information on mark-to-market derivatives.
The following table presents the significant inputs to the forward curve used to value these positions:
| | | | | | | | | | | | | | | | | | | | | | | | | | | | | | | | | | | | | | | | | | | | | | | | | | | | | |
| Type of trade | | Fair Value as of December 31, 2024 | | Fair Value as of December 31, 2023 | | Valuation Technique | | Unobservable Input | 2024 Range & Arithmetic Average | | 2023 Range & Arithmetic Average |
Mark-to-market derivatives—Economic hedges(a)(b) | | $ | (137) | | | $ | 407 | | | Discounted Cash Flow | | Forward power price | $2.57 | - | $140 | $49 | | $9.64 | - | $216 | $48 |
| | | | | | | | Forward gas price | $2.09 | - | $15 | $3.68 | | $1.20 | - | $14 | $3.09 |
| | | | | | Option Model | | Volatility percentage | 23% | - | 141% | 57% | | 23% | - | 200% | 87% |
| | | | | | | | | | | | | | | | | |
| | | | | | | | | | | | | | | | | |
__________
(a)The valuation techniques, unobservable inputs, ranges, and arithmetic averages are the same for the asset and liability positions.
(b)The fair values do not include cash collateral posted (received) on Level 3 positions of $136 million and $462 million as of December 31, 2024 and 2023, respectively.
The inputs listed above, which are as of the balance sheet date, would have a direct impact on the fair values of the above instruments if they were adjusted. The significant unobservable inputs used in the fair value measurement of our commodity derivatives are forward commodity prices and for options is price volatility. Increases (decreases) in the forward commodity price in isolation would result in significantly higher (lower) fair values for long positions (contracts that give us the obligation or option to purchase a commodity), with offsetting impacts to short positions (contracts that give us the obligation or right to sell a commodity). Increases (decreases) in volatility would increase (decrease) the value for the holder of the option (writer of the option). Generally, a change in the estimate of forward commodity prices is unrelated to a change in the estimate of volatility of prices. An increase to the heat rate or renewable factors would increase the fair value accordingly. Generally, interrelationships exist between market prices of natural gas and power. As such, an increase in natural gas pricing would potentially have a similar impact on forward power markets.
18. Commitments and Contingencies
Commercial Commitments. Commercial commitments as of December 31, 2024, representing commitments potentially triggered by future events, were as follows:
| | | | | | | | | | | | | | | | | | | | | | | | | | | | | | | | | | | | | | | | | |
| Expiration within | | |
| 2025 | | 2026 | | 2027 | | 2028 | | 2029 | | 2030 and beyond | | Total |
| Letters of credit | $ | 1,924 | | | $ | 127 | | | $ | 1 | | | $ | 120 | | | $ | — | | | $ | 1 | | | $ | 2,173 | |
Surety bonds(a) | 526 | | | 1 | | | — | | | 214 | | | — | | | — | | | 741 | |
| Total commercial commitments | $ | 2,450 | | | $ | 128 | | | $ | 1 | | | $ | 334 | | | $ | — | | | $ | 1 | | | $ | 2,914 | |
__________
(a)Surety bonds — Guarantees issued related to contract and commercial agreements, excluding bid bonds.
Nuclear Insurance
We are subject to liability, property damage and other risks associated with major incidents at any of our nuclear stations. Our financial exposure to these risks is mitigated through insurance and other industry risk-sharing provisions.
The Price-Anderson Act was enacted to ensure the availability of funds for public liability claims arising from an incident at any of the U.S. licensed nuclear facilities and to limit the liability of nuclear reactor owners for such
Combined Notes to Consolidated Financial Statements
(Dollars in millions, unless otherwise noted)
Note 18 — Commitments and Contingencies
claims from any single incident. As of December 31, 2024, the current liability limit per incident is $16.3 billion and is subject to change to account for the effects of inflation and changes in the number of licensed reactors at least once every five years with the last adjustment effective January 1, 2024. In accordance with the Price-Anderson Act, we maintain financial protection at levels equal to the amount of liability insurance available from private sources through the purchase of private nuclear energy liability insurance for public liability claims that could arise in the event of an incident. Effective January 1, 2024, the required amount of nuclear energy liability insurance purchased is $500 million for each operating site. Claims exceeding that amount are covered through mandatory participation in a financial protection pool, as required by the Price Anderson-Act, which could provide up to approximately an additional $15.8 billion per incident at any U.S. nuclear power reactor in funds available for public liability claims. Participation in this secondary financial protection pool requires the operator of each reactor to fund its proportionate share of costs for any single incident at any U.S. nuclear power reactor that exceeds the primary layer of financial protection. Our share of this secondary layer would be approximately $3.5 billion, based on our ownership interest in the insured nuclear reactors, however, any amounts payable under this secondary layer would be capped at $520 million per incident within one calendar year.
In addition, the U.S. Congress could impose revenue-raising measures on the nuclear industry to pay public liability claims exceeding the $16.3 billion limit for a single incident.
We are required by the NRC to maintain minimal levels of property insurance that demonstrates to the satisfaction of the NRC that we possess an equivalent amount of protection covering the licensee's obligation, in the event of an accident at the licensee's reactor, to stabilize and decontaminate the reactor and the reactor station site at which the reactor experiencing the accident is located. The insurance maintained for each facility is currently provided through insurance policies purchased from NEIL, an industry mutual insurance company of which we are a member. Currently, NRC requires that we maintain a minimum coverage limit for each reactor site of $1.06 billion, and we currently have coverage of $1.5 billion for each site.
NEIL may declare distributions to its members as a result of favorable operating experience. In recent years, NEIL has made distributions to its members. Our portion of the annual distribution declared by NEIL is estimated to be $43 million for 2024, and was $59 million and $30 million for 2023 and 2022, respectively. The distributions were recorded as a reduction to Operating and maintenance expense in the Consolidated Statements of Operations and Comprehensive Income.
Premiums paid to NEIL by its members are also subject to a potential assessment for adverse loss experience in the form of a retrospective premium obligation. NEIL has never assessed this retrospective premium since its formation in 1973, and we cannot predict the level of future assessments, if any. The current maximum aggregate annual retrospective premium obligation for our interests is approximately $268 million. NEIL requires its members to maintain an investment grade credit rating or to ensure collectability of their annual retrospective premium obligation by providing a financial guarantee, letter of credit, deposit premium, or some other means of assurance.
NEIL provides “all risk” property damage, decontamination, and premature decommissioning insurance for each station for losses resulting from damage to its nuclear plants, either due to accidents or acts of terrorism. If the decision is made to decommission the facility, a portion of the insurance proceeds will be allocated to a fund, which we are required by the NRC to maintain, to provide for decommissioning the facility. In the event of an insured loss, we are unable to predict the timing of the availability of insurance proceeds to us and the amount of such proceeds that would be available. In the event that one or more acts of terrorism cause accidental property damage within a twelve-month period from the first accidental property damage under one or more policies for all insured plants, the maximum recovery by us will be an aggregate of $3.2 billion plus such additional amounts as the insurer may recover for all such losses from reinsurance, indemnity and any other source, applicable to such losses.
For our insured losses, we are self-insured to the extent that losses are within the policy deductible or exceed the amount of insurance maintained. Uninsured losses and other expenses, to the extent not recoverable from insurers or the nuclear industry, could also be borne by us. Any such losses could have a material adverse effect on our consolidated financial statements.
Combined Notes to Consolidated Financial Statements
(Dollars in millions, unless otherwise noted)
Note 18 — Commitments and Contingencies
Spent Nuclear Fuel Obligation
Under the Nuclear Waste Policy Act of 1982 (NWPA), the DOE is responsible for the development of a geologic repository for and the disposal of SNF and high-level radioactive waste. As required by the NWPA, we are a party to contracts with the DOE (Standard Contracts) to provide for disposal of SNF from our nuclear generating stations. In accordance with the NWPA and the Standard Contracts, we had previously paid the DOE one mill ($0.001) per kWh of net nuclear generation for the cost of SNF disposal. The DOE reduced the SNF disposal fee to zero in May 2014. Until a new fee structure is in effect, we will not accrue any further costs related to SNF disposal fees. This fee may be adjusted prospectively to ensure full cost recovery.
We currently assume the DOE will begin accepting SNF in 2040 and use that date for purposes of estimating the nuclear decommissioning AROs. The SNF acceptance date assumption is based on management’s estimate of the amount of time required for DOE to select a site location and develop the necessary infrastructure for long-term SNF storage.
The NWPA and the Standard Contracts required the DOE to begin taking possession of SNF generated by nuclear generating units no later than January 31, 1998. The DOE, however, failed to meet that deadline and its performance has been, and is expected to remain, delayed. In August 2004, we and the DOJ, in close consultation with the DOE, reached a settlement under which the government agreed to reimburse us, subject to certain damage limitations based on the extent of the government’s breach, for costs associated with storage of SNF at our nuclear stations pending the DOE’s fulfillment of its obligations. That settlement agreement does not expire until all SNF has been collected from the sites that it covers. Calvert Cliffs, Ginna, NMP, Fitzpatrick, and STP each have separate settlement agreements in place with the DOE which were extended during 2023 to provide for the reimbursement of SNF storage costs through December 31, 2025. We and the DOE have the option to extend those settlements every three years upon mutual consent.
Under the settlement agreements, we received total cumulative cash reimbursements of $2,099 million through December 31, 2024 for costs incurred. After considering the amounts due to co-owners of certain nuclear stations and to the current owner of Oyster Creek Nuclear Generating Station, we received net cumulative cash reimbursements of $1,829 million. As of December 31, 2024 and 2023, the amount of SNF storage costs for which reimbursement has been or will be requested from the DOE under the DOE settlement agreements is as follows:
| | | | | | | | | | | |
| December 31, 2024 | | December 31, 2023 |
DOE receivable - current(a) | $ | 124 | | | $ | 229 | |
DOE receivable - noncurrent(b) | 42 | | | 40 | |
Amounts owed to co-owners(c) | (40) | | | (23) | |
__________
(a)Recorded in Other accounts receivable.
(b)Recorded in Other deferred debits and other assets.
(c)Recorded primarily in Accounts payable and accrued expenses and Other accounts receivable. Represents amounts owed to the co-owners of Peach Bottom, Quad Cities, and NMP Unit 2 generating facilities.
The Standard Contracts with the DOE also required the payment to the DOE of a one-time fee applicable to nuclear plants that generated SNF prior to April 7, 1983. The below table outlines the SNF liability recorded as of December 31, 2024 and 2023:
| | | | | | | | | | | |
| December 31, 2024 | | December 31, 2023 |
Former ComEd units(a) | $ | 1,219 | | | $ | 1,158 | |
Fitzpatrick(b) | 147 | | | 138 | |
| Total SNF Obligation | $ | 1,366 | | | $ | 1,296 | |
__________
(a)ComEd previously elected to defer payment of the one-time fee of $277 million for its units that began operations before April 7, 1983, with interest to the date of payment, until just prior to the first delivery of SNF to the DOE. The unfunded liabilities for SNF disposal costs, including the one-time fee, were transferred to us as part of Exelon’s 2001 corporate restructuring. See Note 10 — Asset Retirement Obligations for additional detail on Zion Station’s SNF obligation which is included in the table above.
(b)A prior owner of FitzPatrick elected to defer payment of the one-time fee of $34 million, with interest to the date of payment, for the FitzPatrick unit. As part of the FitzPatrick acquisition on March 31, 2017, we assumed a SNF liability for
Combined Notes to Consolidated Financial Statements
(Dollars in millions, unless otherwise noted)
Note 18 — Commitments and Contingencies
the DOE one-time fee obligation with interest related to FitzPatrick along with an offsetting asset, included in Other deferred debits and other assets, for the contractual right to reimbursement from NYPA, a prior owner of FitzPatrick, for amounts paid for the FitzPatrick DOE one-time fee obligation.
Interest for our SNF liabilities accrues at the 13-week Treasury Rate. The 13-week Treasury Rate in effect for calculation of the interest accrual at December 31, 2024 was 4.553% for the deferred amount transferred from ComEd and 4.615% for the deferred FitzPatrick amount.
The following table summarizes sites for which we do not have an outstanding SNF Obligation:
| | | | | |
| Description | Sites |
| Fees have been paid or began operations after April 7, 1983 | Former PECO units, Braidwood, Byron, Calvert Cliffs, Clinton, LaSalle Unit 2, NMP Unit 2, and STP |
| Outstanding SNF Obligation remains with former owners | NMP Unit 1, Ginna, and Crane |
| |
Environmental Remediation Matters
General. Our operations have in the past, and may in the future, require substantial expenditures to comply with environmental laws. Additionally, under Federal and state environmental laws, we are generally liable for the costs of remediating environmental contamination of property now or formerly owned by us and of property contaminated by hazardous substances generated by us. We own or lease several real estate parcels, including parcels on which our operations or the operations of others may have resulted in contamination by substances that are considered hazardous under environmental laws. In addition, we are currently involved in proceedings relating to sites where hazardous substances have been deposited and may be subject to additional proceedings in the future. Unless otherwise disclosed, we cannot reasonably estimate whether we will incur significant liabilities for additional investigation and remediation costs at these or additional sites identified by us, environmental agencies or others. Additional costs could have a material, unfavorable impact on our consolidated financial statements.
As of December 31, 2024 and 2023, we had accrued undiscounted amounts for environmental liabilities of $60 million and $61 million, respectively, in Accounts payable and accrued expenses and $169 million and $88 million, respectively, in Other deferred credits and other liabilities in the Consolidated Balance Sheets.
Cotter Corporation. The EPA has advised Cotter Corporation (N.S.L.) (Cotter), a former ComEd subsidiary, that it is potentially liable in connection with radiological contamination at two sites in Missouri. In 2000, ComEd sold Cotter to an unaffiliated third-party. As part of the sale, ComEd agreed to indemnify Cotter for any liability arising from these two Missouri superfund sites, West Lake Landfill and Latty Avenue. In connection with Exelon’s 2001 corporate restructuring, this responsibility to indemnify Cotter was transferred to us, and ultimately retained by us per the terms of our separation from Exelon. Refer to Note 1 — Basis of Presentation for additional information on the separation.
West Lake Landfill. Including Cotter, there are three PRPs currently participating in the West Lake Landfill remediation proceeding.
West Lake Landfill; Operable Unit 1 (OU1); Landfill Remediation. In September 2018, the EPA issued its Record of Decision Amendment (RODA) for the selection of a final remedy that requires partial excavation of the radiological materials and capping the landfill. The EPA and the PRPs have entered into a Consent Agreement to perform the Remedial Design, which is expected to be completed in 2025. In March 2019, the PRPs received Special Notice Letters from the EPA to perform the Remedial Action work. The total estimated cost of the remedy, considering the current EPA technical requirements, is approximately $530 million, including cost escalation on an undiscounted basis.
West Lake Landfill; Operable Unit 3 (OU3); Groundwater Study. In September 2018, the three identified PRPs, including Cotter, signed an Administrative Settlement Agreement and Order on Consent for the performance by the PRPs of the groundwater Remedial Investigation Feasibility Study (RI/FS). The purpose of this RI/FS is to define the nature and extent of any groundwater contamination from the West Lake Landfill site and evaluate remedial alternatives. We estimate the undiscounted cost for the groundwater RI/FS to be approximately $60 million. At this time we cannot predict the likelihood, or the extent to which remediation activities, if any, may be
Combined Notes to Consolidated Financial Statements
(Dollars in millions, unless otherwise noted)
Note 18 — Commitments and Contingencies
required and therefore cannot estimate a reasonably possible range of loss for response costs beyond those associated with the RI/FS component.
We determined a loss associated with the EPA's partial excavation and landfill cover remedy and the groundwater RI/FS is probable and have recorded a liability for each, both of which are included in the total amount as discussed above, that reflects management’s best estimate of Cotter’s allocable share of the cost among the PRPs. Given the joint and several nature of these two liabilities, the amount of our ultimate liability will depend on the actual costs incurred to implement the required remedy at OU1 and the required study at OU3, as well as on the nature and terms of any cost-sharing arrangements with the final group of PRPs. It is reasonably possible that the ultimate cost and Cotter's associated allocable share could differ significantly once these uncertainties are resolved, which could have a material impact on our consolidated financial statements.
Latty Avenue and Vicinity Properties. In August 2011, Cotter was notified by the DOJ that Cotter is considered a PRP with respect to the government’s clean-up costs for contamination attributable to low-level radioactive residues at a former storage and reprocessing facility named Latty Avenue near St. Louis, Missouri.
Latty Avenue was investigated and remediated by the United States Army Corps of Engineers pursuant to funding under the Formerly Utilized Sites Remedial Action Program. The PRPs reached a settlement of this matter and the government filed a motion for entry of a Consent Decree, which was entered by the Court on January 24, 2025. Payment of $50 million plus statutory interest was made on January 30, 2025. The consent decree settles past and future responses costs incurred by the United States Army Corp of Engineers and DOE for their response actions conducted in connection with the release or threatened release of hazardous substances, including radioactive substances at Latty Avenue and certain additional adjacent properties. The settlement amount for this matter is included in the total amount of environmental liabilities recognized as of December 31, 2024, referenced previously.
Litigation
General. We are involved in various other litigation matters that are being defended and handled in the ordinary course of business. The assessment of whether a loss is probable or reasonably possible, and whether the loss or a range of loss is estimable, often involves a series of complex judgments about future events. We maintain accruals for such losses that are probable of being incurred and subject to reasonable estimation. Management is sometimes unable to estimate an amount or range of reasonably possible loss, particularly where (1) the damages sought are indeterminate, (2) the proceedings are in the early stages, or (3) the matters involve novel or unsettled legal theories. In such cases, there is considerable uncertainty regarding the timing or ultimate resolution of such matters, including a possible eventual loss.
Impacts of the February 2021 Extreme Cold Weather Event and Texas-based Generating Assets Outages. Beginning on February 15, 2021, our Texas-based generating assets within the ERCOT market, specifically Colorado Bend II, Wolf Hollow II, and Handley, experienced outages as a result of extreme cold weather conditions.
Various lawsuits have been filed against us since the February 2021 event and outages. In March 2021, we, along with more than 150 power generators and transmission and distribution companies, were sued by approximately 160 individually named plaintiffs, purportedly on behalf of all Texans who allegedly suffered loss of life or sustained personal injury, property damage, or other losses as a result of the weather events. The plaintiffs alleged that the defendants failed to properly prepare for the cold weather and failed to properly conduct their operations, seeking compensatory as well as punitive damages. Thereafter, numerous other plaintiffs filed multiple lawsuits against more than 300 defendants, including us, involving similar allegations of liability and claims of personal injury and property damage all arising out of the February weather events. These additional lawsuits allege wrongful death, property damage, or other losses. Co-defendants in these lawsuits include ERCOT, transmission and distribution utilities and other generators.
In December 2021, approximately 130 insurance companies which insured Texas homeowners and businesses filed a subrogation lawsuit against multiple defendants alleging that defendants were at fault for the energy failure that resulted from the winter storm, causing significant property damage to the insureds. Subsequently, several hundred other insurance companies filed similar claims. All of these cases were combined in a Multi-District-Litigation (MDL) pending in Texas state court, which established a bellwether process to consider initial motions to dismiss by the different industry groups of defendants. Defendants filed motions to dismiss the amended
Combined Notes to Consolidated Financial Statements
(Dollars in millions, unless otherwise noted)
Note 18 — Commitments and Contingencies
complaints in five bellwether cases in July 2022. In February 2023, the court granted the motions to dismiss pertaining to us in part and denied them in part, leaving the plaintiffs' negligence and nuisance claims to proceed. Since the motions to dismiss were partially denied, thousands of new claimants, many in multiple mass tort actions, filed lawsuits in various Texas state courts naming us, among hundreds of other defendants. The majority of these cases were transferred to the MDL. The MDL involves over 200 cases brought by approximately 30,000 plaintiffs, including more than 1,300 insurance companies, and we are defendants in the majority of them. We are also named in an alleged class action that seeks to assert claims on behalf of over 4.1 million Texans within ERCOT who lost power during Winter Storm Uri.
In December 2023, the Court of Appeals for the First District of Texas granted the power generator defendants' Petition for a Writ of Mandamus in the five bellwether cases and ordered the MDL court to dismiss the remaining claims against the power generator defendants, including our entities. The motions to dismiss in the five bellwether cases are expected to be applied to all the claims against the power generator defendants in the MDL. In January 2024, plaintiffs filed motions for en banc reconsideration of the order with the full court of appeals in all five bellwether cases. In November 2024, the court denied plaintiffs' motions. In January 2025, plaintiffs petitioned the Supreme Court of Texas for mandamus review, requesting that the court reinstate the MDL court's denial of the generator defendants' motions to dismiss and thereby permit plaintiffs' claims to proceed.
In addition to the cases pending in the MDL in Texas state court, in January 2025, the Attorney General of the State of Oklahoma filed a lawsuit in state court against us, along with 10 other defendants, alleging antitrust and consumer protection act violations as well as unjust enrichment in connection with the sale, transport and marketing of natural gas to state agencies, municipalities and the people of the state of Oklahoma during the extreme cold weather event. The Attorney General seeks compensatory and punitive damages.
We dispute liability and deny that we are responsible for any of plaintiffs’ alleged claims and are vigorously contesting them. No loss contingencies have been reflected in the consolidated financial statements with respect to these matters, nor can we currently estimate a range of loss. It is reasonably possible, however, that resolution of these matters could have a material, unfavorable impact on our consolidated financial statements.
Asbestos Personal Injury Claims. We maintain a reserve for claims associated with asbestos-related personal injury actions at certain facilities that are currently owned by us or were previously owned by ComEd, PECO, or BGE. The estimated liabilities are recorded on an undiscounted basis and exclude the estimated legal costs associated with handling these matters, which could be material.
At December 31, 2024 and 2023, we recorded estimated liabilities of approximately $125 million and $131 million, respectively, in total for asbestos-related bodily injury claims. As of December 31, 2024, approximately $14 million of this amount related to 203 open claims presented to us, while the remaining $111 million is for estimated future asbestos-related bodily injury claims anticipated to arise through 2055, based on actuarial assumptions and analyses, which are updated on an annual basis. On a quarterly basis, we monitor actual experience against the number of forecasted claims to be received and expected claim payments and evaluate whether adjustments to the estimated liabilities are necessary.
19. Shareholders' Equity
Share Repurchase Program (CEG Parent)
Since 2023, our Board of Directors authorized the repurchase of up to $3 billion of the Company's outstanding common stock. Share repurchases may be made through a variety of methods, which may include open market transactions, privately negotiated transactions, or purchases pursuant to a Rule 10b5-1 trading plan, provided that the amounts spent do not exceed what is authorized. Any repurchased shares are constructively retired and cancelled. The program does not obligate us to acquire a minimum number of shares during any period and our repurchase of CEG's common stock may be limited, suspended, or discontinued at any time at our discretion and without prior notice. No other repurchase plans or programs have been authorized. As of December 31, 2024, there was $991 million of remaining authority to repurchase shares of the Company's outstanding common stock.
During 2024 and 2023, we repurchased from the open market approximately 1.2 million and 10.6 million shares, respectively, of our common stock for a total cost, inclusive of taxes and transaction costs, of $150 million and $1 billion, respectively.
Combined Notes to Consolidated Financial Statements
(Dollars in millions, unless otherwise noted)
Note 19 — Shareholders' Equity
In 2024, we entered into ASR agreements with financial institutions to initiate share repurchases of our common stock. Under the ASR agreements, we paid a specified amount to the financial institution and received an initial delivery of shares of common stock, which resulted in an immediate reduction in the number of our shares outstanding. Based on the terms of the ASR agreements below, we received an initial share delivery based on 80% of the ASR agreements' cost. Upon settlement of the ASR agreements, the financial institution delivers additional incremental shares. The total number of shares ultimately delivered, and therefore the average price paid per share, is determined at the end of the applicable purchase period of each ASR agreement based on the average of the daily volume weighted average share price, less a discount.
The following table summarizes each ASR agreement for the year ended December 31, 2024:
| | | | | | | | | | | | | | | | | | | | | | | | | | | | | | | | | | | | | | |
| (in millions, except average price paid per share) | | | | | | | | |
| ASR Agreement Initiation | | Total Cost | | Initial Shares Received | | ASR Agreement Settlement | | Additional Shares Received(a) | | Total Number of Shares Purchased | | Average Price Paid per Share |
| March 2024 | | $ | 354 | | | 1.7 | | | May 2024 | | 0.2 | | | 1.9 | | | $ | 182.65 | |
| May 2024 | | $ | 505 | | | 1.8 | | | July 2024 | | 0.6 | | | 2.4 | | | $ | 211.40 | |
__________(a)The 0.6 million additional shares received and settled in July 2024 were rounded for footing.
Changes in Accumulated Other Comprehensive Income (Loss) (All Registrants)
The following tables present changes in AOCI, net of tax, by component:
| | | | | | | | | | | | | | | | | | | | | | | |
| Gains (losses) on Cash Flow Hedges | | Pension and OPEB Plan Items(a) | | Foreign Currency Items | | Total |
| Balance at December 31, 2021 | $ | (8) | | | $ | — | | | $ | (23) | | | $ | (31) | |
| Separation-related adjustments | — | | | (2,006) | | | — | | | (2,006) | |
| OCI before reclassifications | (1) | | | 186 | | | (3) | | | 182 | |
| Amounts reclassified from AOCI | — | | | 95 | | | — | | | 95 | |
| Net current-period OCI | (1) | | | (1,725) | | | (3) | | | (1,729) | |
| Balance at December 31, 2022 | $ | (9) | | | $ | (1,725) | | | $ | (26) | | | $ | (1,760) | |
| | | | | | | |
| OCI before reclassifications | (2) | | | (453) | | | 2 | | | (453) | |
| Amounts reclassified from AOCI | 1 | | | 21 | | | — | | | 22 | |
| Net current-period OCI | (1) | | | (432) | | | 2 | | | (431) | |
| Balance at December 31, 2023 | $ | (10) | | | $ | (2,157) | | | $ | (24) | | | $ | (2,191) | |
| | | | | | | |
| OCI before reclassifications | — | | | (176) | | | (10) | | | (186) | |
| Amounts reclassified from AOCI | 4 | | | 71 | | | — | | | 75 | |
| Net current-period OCI | 4 | | | (105) | | | (10) | | | (111) | |
| Balance at December 31, 2024 | $ | (6) | | | $ | (2,262) | | | $ | (34) | | | $ | (2,302) | |
__________(a)AOCI amounts are included in the computation of net periodic pension and OPEB cost. See Note 14 — Retirement Benefits for additional information. See our Consolidated Statements of Operations and Comprehensive Income for individual components of AOCI.
The following table presents income tax (expense) benefit allocated to each component of our other comprehensive income (loss):
| | | | | | | | | | | | | | | | | |
| Year Ended December 31, |
| 2024 | | 2023 | | 2022 |
| Pension and OPEB plans: | | | | | |
| | | | | |
| Actuarial loss reclassified to periodic benefit cost | $ | (24) | | | $ | (10) | | | $ | (33) | |
Pension and OPEB plans valuation adjustment(a) | 59 | | | 151 | | | 619 | |
__________(a)Includes $680 million of income tax benefit related to the separation adjustment for the year ended December 31, 2022.
Combined Notes to Consolidated Financial Statements
(Dollars in millions, unless otherwise noted)
Note 20 — Stock-Based Compensation Plans
20. Stock-Based Compensation Plans
Effective February 1, 2022, we established our own LTIP and began granting cash and stock-based awards that primarily include performance share awards and restricted stock units. Our LTIP authorized 20,000,000 shares of common stock for these awards. The existing, unvested cash and stock-based awards issued through the Exelon LTIP were modified in connection with the separation to align with our performance metrics and maintain an equivalent value immediately before and after separation. The impact of this modification was not material to our stock-based compensation expense for the year ended December 31, 2022.
Our employees were granted stock-based awards through the Exelon LTIP prior to separation, which primarily included performance share awards and restricted stock units. We also granted cash awards.
The following table presents the stock-based compensation expense included in the Consolidated Statements of Operations and Comprehensive Income. The information does not include expenses related to the cash awards as they are not considered stock-based compensation plans under the applicable authoritative guidance:
| | | | | | | | | | | | | | | | | |
| For the Years Ended December 31, |
| 2024 | | 2023 | | 2022 |
| Total stock-based compensation expense included in operating and maintenance expense | $ | 332 | | | $ | 178 | | | $ | 116 | |
| Income tax benefit | (85) | | | (45) | | | (29) | |
| Total after-tax stock-based compensation expense | $ | 247 | | | $ | 133 | | | $ | 87 | |
We receive a tax deduction based on the intrinsic value of the award on the distribution date for performance share awards and restricted stock units. The tax deduction related to performance share awards and restricted stock units was not material for the years ended December 31, 2024, 2023, and 2022. For each award, throughout the requisite service period, we recognize the tax benefit related to compensation costs. For performance share awards and restricted stock units, our realized tax benefit when distributed was not material for the years ended December 31, 2024, 2023, and 2022.
Performance Share Awards
Performance share awards are granted under the LTIP. The performance share awards are typically settled 50% in common stock and 50% in cash at the end of the three-year performance period, subject to certain ownership thresholds that, if met, may result in cash settlement of the entire award.
The common stock portion of the performance share awards is considered an equity award and is valued based on our stock price on the grant date. The cash portion of the performance share awards is considered a liability award which is remeasured each reporting period based on the current stock price. As the value of the common stock and cash portions of the awards are based on the stock price during the performance period, coupled with changes in the total expected payout of the award, the compensation costs are subject to volatility until payment is made.
For nonretirement-eligible employees, performance share awards are recognized over the vesting period of three years using the straight-line method. For performance share awards granted to retirement-eligible employees, the value of the performance shares is recognized ratably over the vesting period, which is the year of grant. We process forfeitures as they occur for employees who do not complete the requisite service period.
Combined Notes to Consolidated Financial Statements
(Dollars in millions, unless otherwise noted)
Note 20 — Stock-Based Compensation Plans
The following table summarizes our unvested performance share awards activity:
| | | | | | | | | | | |
| Shares | | Weighted Average Grant Date Fair Value (per share) |
| Unvested at December 31, 2023 | 836,325 | | | $ | 61.47 | |
| Granted | 257,792 | | | 127.03 | |
| Change in performance | 116,090 | | | 130.06 | |
| | | |
| Forfeited | (11,526) | | | 96.27 | |
Undistributed vested awards(a) | (663,055) | | | 207.72 | |
| Unvested at December 31, 2024 | 535,626 | | | $ | 99.06 | |
__________(a)Represents performance share awards that vested but were not distributed to retirement-eligible employees during 2024 and 2023.
The following table summarizes the weighted average grant date fair value and the total fair value of performance share awards vested:
| | | | | | | | | | | |
| December 31, 2024(a) | | December 31, 2023(a) |
| Weighted average grant date fair value (per share) | $ | 127.03 | | | $ | 83.26 | |
| Total fair value of performance shares vested | 138 | | | 76 | |
| | | |
__________(a)As of December 31, 2024 and 2023, $50 million and $39 million of total unrecognized compensation costs related to unvested performance shares are expected to be recognized over the remaining weighted average period of 1.5 years and 1.6 years, respectively.
Restricted Stock Units
Restricted stock units are granted under the LTIP with the majority being settled in a specific number of shares of common stock after the service condition has been met. The corresponding cost is measured based on the grant date fair value of the restricted stock unit issued.
The value of the restricted stock units is expensed over the requisite service period using the straight-line method. The requisite service period for restricted stock units is generally three to five years. However, certain restricted stock unit awards become fully vested upon the employee reaching retirement eligibility. The value of the restricted stock units granted to retirement-eligible employees is recognized ratably over the vesting period, which is the year of grant. We process forfeitures as they occur for employees who do not complete the requisite service period.
The following table summarizes our unvested restricted stock unit activity:
| | | | | | | | | | | |
| Shares | | Weighted Average Grant Date Fair Value (per share) |
| Unvested at December 31, 2023 | 864,805 | | | $ | 69.42 | |
| Granted | 490,112 | | | 134.18 | |
| Vested | (376,121) | | | 60.19 | |
| Forfeited | (18,525) | | | 107.49 | |
Undistributed vested awards(a) | (151,178) | | | 129.44 | |
| Unvested at December 31, 2024 | 809,093 | | | $ | 96.53 | |
__________
(a)Represents restricted stock units that vested but were not distributed to retirement-eligible employees during 2024 and 2023.
Combined Notes to Consolidated Financial Statements
(Dollars in millions, unless otherwise noted)
Note 20 — Stock-Based Compensation Plans
The following table summarizes the weighted average grant date fair value and the total fair value of restricted stock units vested:
| | | | | | | | | | | |
| December 31, 2024(a) | | December 31, 2023(a) |
| Weighted average grant date fair value (per share) | $ | 134.18 | | | $ | 86.10 | |
| Total fair value of restricted stock units vested | 42 | | | 34 | |
__________
(a)As of December 31, 2024 and 2023, $41 million and $35 million of total unrecognized compensation costs related to unvested restricted stock units are expected to be recognized over the remaining weighted average period of 1.8 years and 1.9 years, respectively.
21. Variable Interest Entities
As of December 31, 2024 and 2023, we consolidated several VIEs or VIE groups for which we are the primary beneficiary (see Consolidated VIEs below) and had significant interests in several other VIEs for which we do not have the power to direct the entities’ activities and, accordingly, we were not the primary beneficiary (see Unconsolidated VIEs below). Consolidated and unconsolidated VIEs are aggregated to the extent that the entities have similar risk profiles.
Consolidated VIEs
The table below shows the carrying amounts and classification of the consolidated VIEs’ assets and liabilities included in the consolidated financial statements as of December 31, 2024 and 2023. The assets, except as noted in the footnotes to the table below, can only be used to settle obligations of the VIEs. The liabilities, except as noted in the footnotes to the table below, are such that creditors, or beneficiaries, do not have recourse to our general credit.
| | | | | | | | | | | |
| December 31, 2024 | | December 31, 2023 |
| Cash and cash equivalents | $ | 59 | | | $ | 48 | |
| Restricted cash and cash equivalents | 50 | | | 47 | |
| Accounts receivable | | | |
| Customer accounts receivable, net | 2,134 | | | 19 | |
| Other accounts receivable, net | 12 | | | 10 | |
| Inventories, net | | | |
| Materials and supplies | 13 | | | 14 | |
| Other current assets | 38 | | | 1,249 | |
| Total current assets | 2,306 | | | 1,387 | |
| Property, plant and equipment, net | 2,025 | | | 1,979 | |
| Other noncurrent assets | 142 | | | 166 | |
| Total noncurrent assets | 2,167 | | | 2,145 | |
Total assets(a) | $ | 4,473 | | | $ | 3,532 | |
| | | |
| Long-term debt due within one year | $ | 64 | | | $ | 63 | |
| Accounts payable and accrued expenses | 54 | | | 31 | |
| | | |
| Total current liabilities | 118 | | | 94 | |
| Long-term debt | 642 | | | 704 | |
| Asset retirement obligations | 206 | | | 190 | |
| Other noncurrent liabilities | 2 | | | 2 | |
| Total noncurrent liabilities | 850 | | | 896 | |
| Total liabilities | $ | 968 | | | $ | 990 | |
__________
(a)Our balances include unrestricted assets for current unamortized energy contract assets of $22 million and $22 million, disclosed within other current assets in the table above and noncurrent unamortized energy contract assets of $133 million and $155 million, disclosed within other noncurrent assets in the table above as of December 31, 2024 and 2023, respectively.
Combined Notes to Consolidated Financial Statements
(Dollars in millions, unless otherwise noted)
Note 21 — Variable Interest Entities
As of December 31, 2024 and 2023, our consolidated VIEs included the following:
| | | | | | | | |
| Consolidated VIE or VIE groups: | Reason entity is a VIE: | Reason we are the primary beneficiary: |
| CRP - A collection of wind and solar project entities. We have a 51% equity ownership in CRP. See additional discussion below. | Similar structure to a limited partnership and the limited partners do not have kick-out rights with respect to the general partner. | We conduct the operational activities. |
| Bluestem Wind Energy Holdings, LLC - A Tax Equity structure which is consolidated by CRP. | Similar structure to a limited partnership and the limited partners do not have kick-out rights with respect to the general partner. | We conduct the operational activities. |
| Antelope Valley - A solar generating facility, which is 100% owned by us. Antelope Valley sells all of its output to PG&E through a PPA. | The PPA contract absorbs variability through a performance guarantee. | We conduct all activities. |
NER - A bankruptcy remote, special purpose entity which is 100% owned by us, which purchases certain of our customer accounts receivable arising from the sale of retail electricity.
NER’s assets will be available first and foremost to satisfy the claims of the creditors of NER. Refer to Note 7 —Accounts Receivable for additional information on the sale of receivables. | Equity capitalization is insufficient to support its operations. | We conduct all activities. |
CRP - CRP is a collection of wind and solar project entities and some of these project entities are VIEs that are consolidated by CRP. While we or CRP own 100% of the solar entities and 100% of the majority of the wind entities, it has been determined that the wholly owned solar and wind entities are VIEs because the entities' customers absorb price variability from the entities through fixed price power and/or REC purchase agreements. Additionally, for the wind entities that have minority interests, it has been determined that these entities are VIEs because the governance rights of some investors are not proportional to their financial rights. We are the primary beneficiary of these solar and wind entities that qualify as VIEs because we control operations and direct all activities of the facilities. There is limited recourse to us related to certain solar and wind entities.
In 2017, our interests in CRP were contributed to and are pledged for the CR nonrecourse debt project financing structure. Refer to Note 16 — Debt and Credit Agreements for additional information.
Unconsolidated VIEs
Our variable interests in unconsolidated VIEs generally include equity investments and energy purchase and sale contracts. For the equity investments, the carrying amount of the investments is reflected in the Consolidated Balance Sheets in Investments. For the energy purchase and sale contracts (commercial agreements), the carrying amount of assets and liabilities in the Consolidated Balance Sheets that relate to our involvement with the VIEs are predominantly related to working capital accounts and generally represent the amounts owed by, or owed to us for the deliveries associated with the current billing cycles under the commercial agreements.
As of December 31, 2024 and 2023, we had significant unconsolidated variable interests in several VIEs for which we were not the primary beneficiary. These interests include certain equity method investments and certain commercial agreements.
Combined Notes to Consolidated Financial Statements
(Dollars in millions, unless otherwise noted)
Note 21 — Variable Interest Entities
The following table presents summary information about our significant unconsolidated VIE entities:
| | | | | | | | | | | | | | | | | | | | | | | | | | | | | | | | | | | |
| December 31, 2024 | | December 31, 2023 |
| Commercial Agreement VIEs | | Equity Investment VIEs | | Total | | Commercial Agreement VIEs | | Equity Investment VIEs | | Total |
Total assets(a) | $ | 617 | | | $ | — | | | $ | 617 | | | $ | 704 | | | $ | — | | | $ | 704 | |
Total liabilities(a) | 42 | | | — | | | 42 | | | 77 | | | — | | | 77 | |
| | | | | | | | | | | |
Other ownership interests in VIE(a) | 575 | | | — | | | 575 | | | 627 | | | — | | | 627 | |
| | | | | | | | | | | |
| | | | | | | | | | | |
| | | | | | | | | | | |
__________
(a)These items represent amounts on the unconsolidated VIE balance sheets, not in the Consolidated Balance Sheets. These items are included to provide information regarding the relative size of the unconsolidated VIEs. We do not have any exposure to loss as we do not have a carrying amount in the equity investment VIEs as of December 31, 2024 and 2023.
As of December 31, 2024 and 2023, the unconsolidated VIEs consist of:
| | | | | | | | |
| Unconsolidated VIE groups: | Reason entity is a VIE: | Reason we are not the primary beneficiary: |
| Energy Purchase and Sale agreements - We have several energy purchase and sale agreements with generating facilities. | PPA contracts that absorb variability through fixed pricing. | We do not conduct the operational activities. |
22. Supplemental Financial Information
Supplemental Statement of Operations and Comprehensive Income Information
The following tables provide additional information about material items recorded in the Consolidated Statements of Operations and Comprehensive Income.
| | | | | | | | | | | | | | | | | |
| Taxes other than income taxes |
| For the Years Ended December 31, |
| 2024 | | 2023 | | 2022 |
Gross receipts(a) | $ | 134 | | | $ | 139 | | | $ | 130 | |
| Property | 285 | | | 253 | | 274 |
| Payroll | 152 | | | 142 | | 130 |
__________
(a)Represent gross receipts taxes related to our retail operations. The offsetting collection of gross receipts taxes from customers is recorded in Operating revenues in the Consolidated Statements of Operations and Comprehensive Income.
Combined Notes to Consolidated Financial Statements
(Dollars in millions, unless otherwise noted)
Note 22 — Supplemental Financial Information
| | | | | | | | | | | | | | | | | |
| Other, net |
| For the Years Ended December 31, |
| 2024 | | 2023 | | 2022 |
| Decommissioning-related activities: |
Net realized income on NDT funds(a) |
| Regulatory Agreement Units | $ | 553 | | | $ | 657 | | | $ | 333 | |
| Non-Regulatory Agreement Units | 266 | | | 335 | | | 97 | |
| Net unrealized gains (losses) on NDT funds | | | | | |
| Regulatory Agreement Units | 184 | | | 397 | | | (1,354) | |
| Non-Regulatory Agreement Units | 156 | | | 259 | | | (798) | |
Regulatory offset to NDT fund-related activities(b) | (592) | | | (845) | | | 820 | |
| Total Decommissioning-related activities | 567 | | | 803 | | | (902) | |
| Non-service net periodic benefit credit (cost) | (8) | | | 54 | | | 110 | |
| Net realized and unrealized gains (losses) from equity investments | 11 | | | 307 | | | (13) | |
| | | | | |
| Other | 100 | | | 104 | | | 19 | |
| Total Other, net | $ | 670 | | | $ | 1,268 | | | $ | (786) | |
__________
(a)Realized income includes interest, dividends and realized gains and losses on sales of NDT fund investments.
(b)Includes the elimination of decommissioning-related activities and the elimination of income taxes related to all NDT fund activity for the Regulatory Agreement Units.
Supplemental Cash Flow Information
The following tables provide additional information about material items recorded in the Consolidated Statements of Cash Flows.
| | | | | | | | | | | | | | | | | |
| Depreciation, amortization and accretion |
| For the Years Ended December 31, |
| 2024 | | 2023 | | 2022 |
Property, plant, and equipment(a) | $ | 1,101 | | | $ | 1,073 | | | $ | 1,065 | |
Amortization of intangible assets, net(a) | 22 | | | 23 | | 26 |
Amortization of energy contract assets and liabilities(b) | 38 | | | 35 | | 35 |
Nuclear fuel(c) | 884 | | | 787 | | 758 |
ARO accretion(d) | 655 | | | 596 | | 543 |
| Total depreciation, amortization, and accretion | $ | 2,700 | | | $ | 2,514 | | | $ | 2,427 | |
_________(a)Included in Depreciation and amortization expense in the Consolidated Statements of Operations and Comprehensive Income.
(b)Included in Operating revenues or Purchased power and fuel expense in the Consolidated Statements of Operations and Comprehensive Income.
(c)Included in Purchased power and fuel expense in the Consolidated Statements of Operations and Comprehensive Income.
(d)Included in Operating and maintenance expense in the Consolidated Statements of Operations and Comprehensive Income.
| | | | | | | | | | | | | | | | | |
| Cash paid during the year |
| For the Years Ended December 31, |
| 2024 | | 2023 | | 2022 |
| Interest (net of amount capitalized) | $ | 375 | | | $ | 264 | | | $ | 230 | |
| Income taxes (net of refunds) | 436 | | | 466 | | 287 | |
Combined Notes to Consolidated Financial Statements
(Dollars in millions, unless otherwise noted)
Note 22 — Supplemental Financial Information
| | | | | | | | | | | | | | | | | | | | | | | | | | | | | | | | | | | |
| Other non-cash operating activities |
| CEG Parent | | Constellation |
| For the Years Ended December 31, | | For the Years Ended December 31, |
| 2024 | | 2023 | | 2022 | | 2024 | | 2023 | | 2022 |
| Pension and non-pension postretirement benefit costs | $ | 107 | | | $ | 47 | | | $ | 17 | | | $ | 107 | | | $ | 47 | | | $ | 17 | |
| | | | | | | | | | | |
Other decommissioning-related activity(a) | (485) | | | (534) | | | (263) | | | (485) | | | (534) | | | (263) | |
Energy-related options(b) | 32 | | | 183 | | | 293 | | | 32 | | | 183 | | | 293 | |
| | | | | | | | | | | |
| | | | | | | | | | | |
| | | | | | | | | | | |
| | | | | | | | | | | |
| | | | | | | | | | | |
| | | | | | | | | | | |
| | | | | | | | | | | |
| | | | | | | | | | | |
| | | | | | | | | | | |
Other(c) | 174 | | | 322 | | | 201 | | | 128 | | | 260 | | | 152 | |
| Total other non-cash operating activities | $ | (172) | | | $ | 18 | | | $ | 248 | | | $ | (218) | | | $ | (44) | | | $ | 199 | |
__________(a)Includes the elimination of decommissioning-related activities for the Regulatory Agreement Units, including the elimination of operating revenues, ARO accretion, ARC amortization, investment income, and income taxes related to all NDT fund activity for these units.
(b)Includes option premiums reclassified to realized at the settlement of the underlying contracts and recorded to results of operations.
(c)Includes items that are not individually material.
The following table provides a reconciliation of cash, restricted cash, and cash equivalents reported in the Consolidated Balance Sheets that sum to the total of the same amounts in the Consolidated Statements of Cash Flows.
| | | | | | | | | | | |
| December 31, 2024 | CEG Parent | | Constellation |
| Cash and cash equivalents | $ | 3,022 | | | $ | 3,018 | |
| Restricted cash and cash equivalents | 107 | | | 97 | |
| | | |
| Total cash, restricted cash, and cash equivalents | $ | 3,129 | | | $ | 3,115 | |
| | | | | | | | | | | |
| December 31, 2023 | CEG Parent | | Constellation |
| Cash and cash equivalents | $ | 368 | | | $ | 366 | |
| Restricted cash and cash equivalents | 86 | | | 74 | |
| Total cash, restricted cash, and cash equivalents | $ | 454 | | | $ | 440 | |
| | | | | | | | | | | |
| December 31, 2022 | CEG Parent | | Constellation |
| Cash and cash equivalents | $ | 422 | | | $ | 403 | |
| Restricted cash and cash equivalents | 106 | | 98 |
| | | |
| Total cash, restricted cash, and cash equivalents | $ | 528 | | | $ | 501 | |
For additional information on restricted cash, see Note 1 — Basis of Presentation.
Combined Notes to Consolidated Financial Statements
(Dollars in millions, unless otherwise noted)
Note 22 — Supplemental Financial Information
Supplemental Balance Sheet Information
The following tables provide additional information about material items recorded in the Consolidated Balance Sheets.
| | | | | | | | | | | |
| Investments |
| December 31, 2024 | | December 31, 2023 |
| | | |
| Equity method investments | $ | 2 | | | $ | 7 | |
| | | |
| Other investments: | | | |
Employee benefit trusts and investments(a) | 100 | | | 82 |
Equity investments with readily determinable fair values(b) | 387 | | | 369 |
| Equity investments without readily determinable fair values | 150 | | | 103 |
| Other available for sale debt security investments | 1 | | | 2 |
| Total investments | $ | 640 | | | $ | 563 | |
__________
(a)Debt and equity security investments are recorded at fair market value.
(b)Does not include the equity investments with readily determinable fair values that are recorded in Other current assets in the Consolidated Balance Sheets. See Note 17 — Fair Value of Financial Assets and Liabilities for additional information on Investments in equities.
| | | | | | | | | | | |
| Accounts payable and accrued expenses |
| December 31, 2024 | CEG Parent | | Constellation |
| Accounts payable | $ | 2,369 | | | $ | 2,348 | |
Compensation-related accruals(a) | 907 | | | 689 | |
Taxes accrued(b) | 232 | | | 223 | |
| | | | | | | | | | | |
| Accounts payable and accrued expenses |
| December 31, 2023 | CEG Parent | | Constellation |
| Accounts payable | $ | 1,302 | | | $ | 1,289 | |
Compensation-related accruals(a) | 680 | | | 576 | |
| Taxes accrued | 399 | | | 390 | |
__________
(a)Primarily includes accrued payroll, bonuses and other incentives, vacation, and benefits.
(b)Includes $150 million related to nuclear PTC that was used to offset the current tax liability. See Note 6 — Government Assistance for additional information on the nuclear PTC.
23. Related Party Transactions
Prior to completion of the separation on February 1, 2022, we engaged in transactions with affiliates of Exelon in the normal course of business. These affiliate transactions are summarized in the tables below. After February 1, 2022, all transactions with Exelon or its affiliates are no longer related party transactions.
Combined Notes to Consolidated Financial Statements
(Dollars in millions, unless otherwise noted)
Note 23 — Related Party Transactions
Operating revenues from affiliates
The following table presents our Operating revenues from affiliates:
| | | | | | | | | | |
| | | | | For the Year Ended December 31, 2022(a) |
ComEd(b) | | | | $ | 58 | |
PECO(c) | | | | 33 | |
BGE(d) | | | | 18 | |
| PHI | | | | 51 | |
Pepco(e) | | | | 39 | |
DPL(f) | | | | 10 | |
ACE(g) | | | | 2 | |
| | | | |
| Total operating revenues from affiliates | | | | $ | 160 | |
__________
(a)Represents only January 2022 revenues prior to separation on February 1, 2022.
(b)We have an ICC-approved RFP contract with ComEd to provide a portion of ComEd’s electricity supply requirements. We also sell RECs and ZECs to ComEd.
(c)We provide electric supply to PECO under contracts executed through PECO’s competitive procurement process. In addition, we have a ten-year agreement with PECO to sell solar AECs.
(d)We provide a portion of BGE’s energy requirements under its MDPSC-approved market-based SOS and gas commodity programs.
(e)We provide electric supply to Pepco under contracts executed through Pepco's competitive procurement process approved by the MDPSC and DCPSC.
(f)We provide a portion of DPL's energy requirements under its MDPSC and DEPSC approved market-based SOS commodity programs.
(g)We provide electric supply to ACE under contracts executed through ACE's competitive procurement process.
Service Company Costs for Corporate Support
We received a variety of corporate support services from Exelon. Through its business services subsidiary, BSC, Exelon provided support services at cost, including legal, human resources, financial, information technology, and supply management services. The costs of BSC were directly charged or allocated to us. Certain of these services continued after the separation and were covered by the TSA. See Note 1 — Basis of Presentation for additional information. The operating and maintenance service and the capitalized service company costs from affiliates allocated to us prior to separation were immaterial for the year ended December 31, 2022.
| | | | | |
| ITEM 9. | CHANGES IN AND DISAGREEMENTS WITH ACCOUNTANTS ON ACCOUNTING AND FINANCIAL DISCLOSURE |
None. | | | | | |
| ITEM 9A. | CONTROLS AND PROCEDURES |
Disclosure Controls and Procedures
During the fourth quarter of 2024, our principal executive officer and principal financial officer, evaluated the effectiveness of our disclosure controls and procedures related to the recording, processing, summarizing, and reporting of information in periodic reports that we file or submit with the SEC. These disclosure controls and procedures have been designed to ensure that (a) information relating to our consolidated subsidiaries, is accumulated and made known to our management, including our principal executive officer and principal financial officer, by other employees as appropriate to allow timely decisions regarding required disclosure, and (b) this information is recorded, processed, summarized, and reported, as applicable, within the time periods specified in the SEC’s rules and forms. Due to the inherent limitations of control systems, not all misstatements may be detected. These inherent limitations include the realities that judgments in decision-making can be faulty and that breakdowns can occur because of simple error or mistake. Additionally, controls could be circumvented by the individual acts of some persons or by collusion of two or more people.
Accordingly, as of December 31, 2024, our principal executive officer and principal financial officer concluded that our disclosure controls and procedures were effective to accomplish their objectives.
Changes in Internal Control Over Financial Reporting
We continually strive to improve our disclosure controls and procedures to enhance the quality of our financial reporting and to maintain dynamic systems that change as conditions warrant. There have been no changes in internal control over financial reporting that occurred during the fourth quarter of 2024 that have materially affected, or are reasonably likely to materially affect, any of our internal control over financial reporting.
Internal Control Over Financial Reporting
Management is required to assess and report on the effectiveness of its internal control over financial reporting as of December 31, 2024. As a result of that assessment, management determined that there were no material weaknesses as of December 31, 2024 and, therefore, concluded that our internal control over financial reporting was effective. Management’s Report on Internal Control Over Financial Reporting is included in ITEM 8. FINANCIAL STATEMENTS AND SUPPLEMENTARY DATA.
| | | | | |
| ITEM 9B. | OTHER INFORMATION |
Rule 10b5-1 Trading PlansDuring the three months ended December 31, 2024, none of our directors or executive officers (as defined in Rule 16a-1 under the Exchange Act) adopted or terminated any contract, instruction or written plan for the purchase or sale of our securities that was intended to satisfy the affirmative defense conditions of Rule 10b5-1(c) or any "non-Rule 10b5-1 trading arrangement" (as defined in Item 408 under Regulation S-K of the Exchange Act).
| | | | | |
| ITEM 9C. | DISCLOSURE REGARDING FOREIGN JURISDICTIONS THAT PREVENT INSPECTIONS |
Not Applicable.
PART III
Constellation Energy Generation, LLC meets the conditions set forth in General Instruction I(1)(a) and (b) of Form 10-K for a reduced disclosure format. Accordingly, all items in this section relating to Constellation are not presented.
| | | | | |
| ITEM 10. | DIRECTORS, EXECUTIVE OFFICERS, AND CORPORATE GOVERNANCE |
Information about our Executive Officers as of February 18, 2025 | | | | | | | | | | | | | | | | | | | | |
| Name | | Age | | Position | | Period |
| Dominguez, Joseph | | 62 | | President and Chief Executive Officer | | 2022 - Present |
| | | | President and Chief Executive Officer, Exelon Generation Company, LLC | | 2021 - 2022 |
| | | | Chief Executive Officer, ComEd | | 2018 - 2021 |
| | | | | | |
| Eggers, Daniel | | 49 | | Executive Vice President and Chief Financial Officer | | 2022 - Present |
| | | | Executive Vice President and Chief Financial Officer, Exelon Generation Company, LLC | | 2021 - 2022 |
| | | | Senior Vice President of Corporate Finance, Exelon | | 2018 - 2021 |
| | | | | | |
| | | | | | |
| Barrόn, Kathleen | | 54 | | Executive Vice President and Chief Strategy and Growth Officer | | 2024 - Present |
| | | | Executive Vice President and Chief Strategy Officer | | 2022 - 2024 |
| | | | Executive Vice President and Chief Strategy Officer, Exelon Generation Company, LLC | | 2021 - 2022 |
| | | | Executive Vice President of Government and Regulatory Affairs, Exelon | | 2018 - 2021 |
| | | | | | |
| Hanson, Bryan C. | | 59 | | Executive Vice President and Chief Generation Officer | | 2022 - Present |
| | | | Executive Vice President and Chief Generation Officer, Exelon Generation Company, LLC | | 2020 - 2022 |
| | | | President and Chief Nuclear Officer, Exelon Nuclear; Senior Vice President, Exelon Generation Company, LLC | | 2015 - 2020 |
| | | | | | |
| Koehler, Michael R. | | 58 | | Executive Vice President and Chief Administration Officer | | 2022 - Present |
| | | | Executive Vice President and Chief Administration Officer, Exelon Generation Company, LLC | | 2021 - 2022 |
| | | | Senior Vice President and Chief Information and Chief Digital Officer, Exelon | | 2016 - 2021 |
| | | | | | |
| McHugh, James | | 53 | | Executive Vice President and Chief Commercial Officer | | 2022 - Present |
| | | | Executive Vice President and Chief Commercial Officer, Exelon Generation Company, LLC | | 2021 - 2022 |
| | | | Executive Vice President, Exelon; Chief Executive Officer, competitive retail and commodities business, Exelon | | 2018 - 2021 |
| | | | | | |
| Dardis, David | | 52 | | Executive Vice President and Chief Legal and Policy Officer | | 2024 - Present |
| | | | Executive Vice President and General Counsel | | 2022 - 2024 |
| | | | Executive Vice President and General Counsel, Exelon Generation Company, LLC | | 2021 - 2022 |
| | | | Senior Vice President and General Counsel, Exelon Generation Company, LLC | | 2020 - 2021 |
| | | | Senior Vice President and General Counsel, competitive retail and commodities business, Exelon | | 2016 - 2020 |
| | | | | | |
| Bauer, Matthew | | 48 | | Senior Vice President and Controller | | 2022 - Present |
| | | | Vice President and Controller, Exelon Generation Company, LLC | | 2016 - 2022 |
| | | | | | |
| | | | | | |
| | | | | | |
| | | | | | |
| | | | | | |
| | | | | | |
| | | | | | |
| | | | | | |
| | | | | | |
Directors, Director Nomination Process and Audit Committee
The information required under ITEM 10 concerning directors and nominees for election as directors at the annual meeting of shareholders (Item 401 of Regulation S-K), the director nomination process (Item 407(c)(3)), the audit committee (Item 407(d)(4) and (d)(5)), and the beneficial reporting compliance (Sec. 16(a)) is incorporated herein by reference to information to be contained in our definitive 2025 proxy statement (2025 Constellation Proxy Statement) to be filed with the SEC on or before April 30, 2025 pursuant to Regulation 14A or 14C, as applicable, under the Securities Exchange Act of 1934.
Code of Conduct and Ethics
In connection with the completion of the separation from Exelon, our Board of Directors adopted a code of conduct and ethics (Code of Ethics), effective February 1, 2022, that applies to all of our directors, officers and employees, including our principal executive officer, principal financial officer, principal accounting officer and persons performing similar functions. The Code of Ethics was updated in July 2024, as approved by the Board of Directors, and is available upon written request to our corporate secretary or on our website at www.ConstellationEnergy.com. If we amend provisions of our Code of Ethics that apply to, or grant a waiver from a provision of our Code of Ethics for any executive officer, we will publicly disclose such amendment or waiver on our website and as required by applicable law or regulation. The information contained on, or accessible from, our website is not part of this annual report by reference or otherwise.
Insider Trading Policy
The Company has adopted an insider trading policy that governs the purchase, sale, and/or other transactions of our securities by our directors, officers and employees. A copy of our insider trading policy is filed as Exhibit 19-1 to this Annual Report on Form 10-K. In addition, with regard to the Company’s trading in its own securities, it is the Company’s policy to comply with the federal securities laws and the applicable exchange listing requirements.
| | | | | |
| ITEM 11. | EXECUTIVE COMPENSATION |
The information required by this item will be set forth under "Executive Compensation Data" and "Report of the Compensation Committee" in the Constellation Proxy Statement for the 2025 Annual Meeting of Shareholders which is incorporated herein by reference.
| | | | | |
| ITEM 12. | SECURITY OWNERSHIP OF CERTAIN BENEFICIAL OWNERS AND MANAGEMENT AND RELATED STOCKHOLDER MATTERS |
The information required by this item will be set forth under "Ownership of Constellation Stock" in the Constellation Proxy Statement for the 2025 Annual Meeting of Shareholders which is incorporated herein by reference.
Securities Authorized for Issuance under Constellation Equity Compensation Plans
| | | | | | | | | | | | | | | | | |
| [A] | | [B] | | [C] |
| Number of securities to be issued upon exercise of outstanding Options, warrants and rights (Note 1) | | Weighted-average price of outstanding Options, warrants and rights | | Number of securities remaining available for future issuance under equity compensation plans (excluding securities reflected in column [A]) (Note 2) |
| Equity compensation plans approved by security holders | 2,551,323 | | N/A | | 33,185,792 |
__________
(1)Balance includes outstanding performance shares and restricted stock units that were granted under the Constellation LTIP (including shares awarded under those plans and deferred into the stock deferral plan) and deferred stock units granted to directors as part of their compensation. Unvested performance shares are subject to performance metrics and to a credit rating modifier. In addition, pursuant to the terms of the Constellation LTIP plan, 50% of final payouts are made in the form of shares of common stock and 50% is made in form of in cash, or if the participant has exceeded 200% of their stock ownership requirement, 100% of the final payout is made in cash. For performance shares, the total includes the maximum number of shares that could be issued assuming all participants receive 50% of payouts in shares and assuming the performance and credit rating modifier metrics were both at maximum, representing best case performance, for a total of 1,138,603 shares. If the performance and total shareholder return modifier metrics were at "target", the number of securities to be issued for such awards would be 569,301. The balance also includes 155,358 shares to be issued upon the conversion of deferred stock units awarded to members of the Constellation board of directors. Conversion of the deferred stock units to shares of common stock occurs after a director terminates service on the Constellation board.
(2)Includes 16,867,563 shares remaining available for issuance from the employee stock purchase plan and 16,318,229 shares remaining available for issuance to former Constellation employees with outstanding awards made under the prior Constellation LTIP.
| | | | | |
| ITEM 13. | CERTAIN RELATIONSHIPS AND RELATED TRANSACTIONS AND DIRECTOR INDEPENDENCE |
The additional information required by this item will be set forth under "Related Persons Transactions" and "Director Independence" in the Constellation Proxy Statement for the 2025 Annual Meeting of Shareholders which is incorporated herein by reference. | | | | | |
| ITEM 14. | PRINCIPAL ACCOUNTING FEES AND SERVICES |
The information required by this item will be set forth under "The Ratification of PricewaterhouseCoopers LLP as Constellation's Independent Registered Public Accounting Firm for 2025" in the Constellation Proxy Statement for the 2025 Annual Meeting of Shareholders which is incorporated herein by reference.
PART IV
| | | | | |
| ITEM 15. | EXHIBITS, FINANCIAL STATEMENT SCHEDULES |
(a)The following documents are filed as a part of this report:
(1) Constellation Energy Corporation and Subsidiary Companies
| | | | | | | | |
| (i) | | Financial Statements (Item 8): |
| |
| | Report of Independent Registered Public Accounting Firm dated February 18, 2025 of PricewaterhouseCoopers LLP (PCAOB ID 238) |
| |
| | Consolidated Statements of Operations and Comprehensive Income for the Years Ended December 31, 2024, 2023, and 2022 |
| |
| | Consolidated Statements of Cash Flows for the Years Ended December 31, 2024, 2023, and 2022 |
| |
| | Consolidated Balance Sheets at December 31, 2024 and 2023 |
| |
| | Consolidated Statements of Changes in Equity for the Years Ended December 31, 2024, 2023, and 2022 |
| |
| | Combined Notes to Consolidated Financial Statements |
| |
| (ii) | | Financial Statement Schedule: |
| |
| | Schedule II—Valuation and Qualifying Accounts for the Years Ended December 31, 2024, 2023, and 2022 |
| |
| | Schedules not included are omitted because of the absence of conditions under which they are required or because the required information is provided in the consolidated financial statements, including the notes thereto |
Constellation Energy Corporation and Subsidiary Companies
Constellation Energy Generation, LLC and Subsidiary Companies
Schedule II – Valuation and Qualifying Accounts
| | | | | | | | | | | | | | | | | | | | | | | | | | | | | | | | |
| | | | Additions and adjustments | | | | |
| Description | | Balance at Beginning of Period | | Charged to Costs and Expenses | | Charged to Other Accounts | | Deductions | | Balance at End of Period |
| (In millions) | | | | | | | | | | |
| For the year ended December 31, 2024 | | | | | | | | | | |
| Allowance for credit losses | | $ | 61 | | | $ | 18 | | | $ | 138 | | | $ | (21) | | (a) | $ | 196 | |
| Deferred tax valuation allowance | | 10 | | | (7) | | | — | | | — | | | 3 | |
| Reserve for obsolete materials | | 246 | | | (4) | | | (4) | | | — | | | 238 | |
| For the year ended December 31, 2023 | | | | | | | | | | |
| Allowance for credit losses | | $ | 51 | | | $ | 25 | | | $ | — | | | $ | (15) | | (a) | $ | 61 | |
| Deferred tax valuation allowance | | 11 | | | — | | | (1) | | | — | | | 10 | |
| Reserve for obsolete materials | | 238 | | | 8 | | | 9 | | | (9) | | | 246 | |
| For the year ended December 31, 2022 | | | | | | | | | | |
| Allowance for credit losses | | $ | 59 | | | $ | 10 | | | $ | — | | | $ | (18) | | (a) | $ | 51 | |
| Deferred tax valuation allowance | | 22 | | | — | | | (11) | | | — | | | 11 | |
| Reserve for obsolete materials | | 250 | | | 11 | | | (6) | | | (17) | | | 238 | |
__________
(a)Write-offs, net of recoveries of individual accounts receivable.
(2) Constellation Energy Generation, LLC and Subsidiary Companies
| | | | | | | | |
| (i) | | Financial Statements (Item 8): |
| |
| | Report of Independent Registered Public Accounting Firm dated February 18, 2025 of PricewaterhouseCoopers LLP (PCAOB ID 238) |
| |
| | Consolidated Statements of Operations and Comprehensive Income for the Years Ended December 31, 2024, 2023, and 2022 |
| |
| | Consolidated Statements of Cash Flows for the Years Ended December 31, 2024, 2023, and 2022 |
| |
| | Consolidated Balance Sheets at December 31, 2024 and 2023 |
| |
| | Consolidated Statements of Changes in Equity for the Years Ended December 31, 2024, 2023, and 2022 |
| |
| | Combined Notes to Consolidated Financial Statements |
| |
| (ii) | | Financial Statement Schedule: |
| |
| | Schedule II—Valuation and Qualifying Accounts for the Years Ended December 31, 2024, 2023, and 2022 (a) |
| |
| | Schedules not included are omitted because of the absence of conditions under which they are required or because the required information is provided in the consolidated financial statements, including the notes thereto |
__________
(a)The Constellation Energy Generation, LLC Schedule II - Valuation and Qualifying Accounts for Years ended December 31, 2024, 2023, and 2022 is the same as the Constellation Energy Corporation Schedule II.
Exhibits required by Item 601 of Regulation S-K:
Certain of the following exhibits are incorporated herein by reference under Rule 12b-32 of the Exchange Act.
| | | | | |
| Exhibit No. | Description |
| |
| |
| Agreement and Plan of Merger, dated as of January 10, 2025, by and among Calpine Corporation, CPN CS Holdco Corp., CPN CKS Corp., Constellation Energy Corporation, Cascade Transco Inc., Cascade Transco – 1, LLC and Volt Energy Holdings GP, LLC, solely in its capacity as the representative of the stockholders of Calpine Corporation (File No. 001-41137, Form 8-K dated January 13, 2025, Exhibit 2.1) |
| |
| |
| |
| |
| |
| |
| |
| |
| |
| |
| |
| |
| |
| |
| |
| |
| |
| |
| |
| Indenture, dated as of September 30, 2013, among Continental Wind, LLC, the guarantors party thereto and Wilmington Trust, National Association, as trustee (File No. 333-85496, Form 8-K dated September 30, 2013, Exhibit 4.1) |
| |
| |
| |
| |
| |
| |
| |
| |
| |
| |
| |
| | | | | |
| |
| |
| |
| |
| |
| |
| |
| |
| |
| |
| |
| |
| |
| |
| |
| |
| |
| |
| |
| |
| |
| |
| Credit Agreement, dated as of November 28, 2017, as thereafter amended and conformed among Constellation Renewables, LLC, Constellation Renewables Holding, LLC, Morgan Stanley Senior Funding, Inc. as administrative agent, Wilmington Trust, National Association, as depository bank and collateral agent, and the lenders and other agents party thereto. (Certain portions of this exhibit have been omitted by redacting a portion of text, as indicated by asterisks in the text. This exhibit has been filed separately with the U.S. Securities and Exchange Commission pursuant to a request for confidential treatment.) (File No. 001-16169, Form 10-K dated February 9, 2018, Exhibit 10.94) |
| |
| Receivables Purchase Agreement, dated as of April 8, 2020, among Constellation NewEnergy, Inc. as servicer, and NewEnergy Receivables LLC, as seller, MUFG Bank, LTD., as Agent, the Conduits party thereto, the Financial Institutions party thereto and the Purchaser Agents party thereto (File No. 001-16169, Form 8-K dated April 9, 2020, Exhibit 10.1) |
| |
| Credit Agreement, among Constellation Renewables, LLC, the lenders party thereto, Jefferies Finance LLC, as administrative agent, and Wilmington Trust, National Association, as depositary bank and collateral agent, dated December 15, 2020 (File No. 333-85496, Form 8-K dated December 15, 2020, Exhibit 1.1) |
| |
| Amendment No. 2 to Receivables Purchase Agreement, dated as of March 29, 2021, among Constellation NewEnergy, Inc., as servicer, and NewEnergy Receivables LLC, as seller, MUFG Bank, LTD., as agent, the Conduits party thereto, the Financial Institutions party thereto and the Purchaser Agents party thereto (File No. 001-16169, Form 8-K, dated March 31, 2021, Exhibit 10.1) |
| |
| |
| |
| | | | | |
| |
| |
| $3,500,000,000 Credit Agreement dated as of February 1, 2022, among Constellation Energy Generation, JPMorgan Chase Bank, N.A., as Administrative Agent, and various financial institutions, as lenders (File No. 001-41137, Form 10-K dated February 25, 2022, Exhibit 10.10) |
| |
| |
| |
| |
| |
| |
| |
| |
| |
| |
| |
| |
| |
| |
| |
| |
| |
| |
| |
| |
| |
| |
| |
| |
| |
| |
| |
| |
| |
| |
| |
| |
| |
| Amendment No. 3 to Receivables Purchase Agreement, dated as of August 16, 2022, among Constellation NewEnergy, Inc., as servicer, and NewEnergy Receivables LLC, as seller, MUFG Bank, LTD., as agent, the Conduits party thereto, the Financial Institutions party thereto and the Purchaser Agents party thereto (File No. 001-41137, Form 8-K, dated August 18, 2022, Exhibit 10.1) |
| |
| |
| |
| | | | | |
| Receivables Financing Agreement, dated as of December 31, 2024, by and among NewEnergy Receivables, LLC, the various financial institutions party thereto, MUFG Bank, Ltd., as Agent, and Constellation NewEnergy, Inc. |
| |
| |
| |
| Subsidiaries |
| |
| |
| |
| |
| |
| Consent of Independent Registered Public Accountants |
| |
| |
| |
| |
| |
| Power of Attorney (Constellation Energy Corporation) |
| |
| |
| |
| |
| |
| |
| |
| |
| |
| |
| |
| |
| |
| |
| |
| |
| |
| |
| |
| |
| |
| |
| |
| |
| | | | | |
| Certifications Pursuant to Rule 13a-14(a) and 15d-14(a) of the Securities and Exchange Act of 1934 as to the Annual Report on Form 10-K for the year ended December 31, 2024 filed by the following officers for the following registrants: |
| |
| Exhibit No. | Description |
| |
| |
| |
| |
| |
| |
| |
| |
| Certifications Pursuant to Section 1350 of Chapter 63 of Title 18 United States Code as to the Annual Report on Form 10-K for the year ended December 31, 2024 filed by the following officers for the following registrants: |
| |
| Exhibit No. | Description |
| |
| |
| |
| |
| |
| |
| |
| |
101.INS
| Inline XBRL Instance Document - the instance document does not appear in the Interactive Data File because its XBRL tags are embedded within the Inline XBRL document. |
| |
| 101.SCH | Inline XBRL Taxonomy Extension Schema Document. |
| |
| 101.CAL | Inline XBRL Taxonomy Extension Calculation Linkbase Document. |
| |
| 101.DEF | Inline XBRL Taxonomy Extension Definition Linkbase Document. |
| |
| 101.LAB | Inline XBRL Taxonomy Extension Label Linkbase Document. |
| |
| 101.PRE | Inline XBRL Taxonomy Extension Presentation Linkbase Document. |
| |
| 104 | Cover Page Interactive Data File (formatted as Inline XBRL and contained in Exhibit 101) |
__________
* Management contract or compensatory plan or arrangement.
** Filed herewith.
| | | | | |
| ITEM 16. | FORM 10-K SUMMARY |
None.
SIGNATURES
Pursuant to the requirements of Section 13 or 15(d) of the Exchange Act, the Registrant has duly caused this report to be signed on its behalf by the undersigned, thereunto duly authorized, on the 18th day of February, 2025.
| | | | | | | | | | | |
| CONSTELLATION ENERGY CORPORATION | |
| | |
| By: | | /s/ JOSEPH DOMINGUEZ | |
| Name: | | Joseph Dominguez | |
| Title: | | President and Chief Executive Officer | |
Pursuant to the requirements of the Exchange Act, this report has been signed by the following persons on behalf of the Registrant and in the capacities indicated on the 18th day of February, 2025.
| | | | | | | | |
| Signature | | Title |
| |
| /s/ JOSEPH DOMINGUEZ | | President and Chief Executive Officer (Principal Executive Officer) |
| Joseph Dominguez | |
| |
| /s/ DANIEL L. EGGERS | | Executive Vice President and Chief Financial Officer (Principal Financial Officer) |
| Daniel L. Eggers | |
| |
| /s/ MATTHEW N. BAUER | | Senior Vice President and Controller (Principal Accounting Officer) |
| Matthew N. Bauer | |
This annual report has also been signed below by David Dardis, Attorney-in-Fact, on behalf of the following Directors on the date indicated:
| | | | | | | | |
| Yves C. de Balmann | | John Richardson |
| Bradley Halverson | | Nneka Rimmer |
| Charles Harrington | | Dhiaa Jamil |
| Julie Holzrichter | | Eileen Paterson |
| Ashish Khandpur | | Peter Oppenheimer |
| Robert Lawless | | |
| | | | | | | | | | | | | | |
| By: | | /s/ DAVID DARDIS | | February 18, 2025 |
| Name: | | David Dardis | | |
SIGNATURES
Pursuant to the requirements of Section 13 or 15(d) of the Exchange Act, the Registrant has duly caused this report to be signed on its behalf by the undersigned, thereunto duly authorized, on the 18th day of February, 2025.
| | | | | | | | | | | |
| CONSTELLATION ENERGY GENERATION, LLC | |
| | |
| By: | | /s/ JOSEPH DOMINGUEZ | |
| Name: | | Joseph Dominguez | |
| Title: | | President and Chief Executive Officer | |
Pursuant to the requirements of the Exchange Act, this report has been signed by the following persons on behalf of the Registrant and in the capacities indicated on the 18th day of February, 2025.
| | | | | | | | |
| Signature | | Title |
| |
| /s/ JOSEPH DOMINGUEZ | | President and Chief Executive Officer (Principal Executive Officer) |
| Joseph Dominguez | |
| |
| /s/ DANIEL L. EGGERS | | Executive Vice President and Chief Financial Officer (Principal Financial Officer) |
| Daniel L. Eggers | |
| |
| /s/ MATTHEW N. BAUER | | Senior Vice President and Controller (Principal Accounting Officer) |
| Matthew N. Bauer | |