which could adversely impact our business. See “Management’s Discussion and Analysis of Financial Condition and Results of Operations — AECOM Sale Transactions” for a definition and discussion of the AECOM Sale Transactions and “Risk Factors — Risks Related to our Projects — We have a limited operating history as an independent company and have been historically dependent on our prior owner, AECOM,” “— Risks Related to Our Business and Industry — We are involved in ongoing disputes with our prior owner, AECOM, which could adversely impact our business,” “— We may be required to make additional payments to AECOM pursuant to contractual arrangements” and “— If AECOM defaults on its contractual obligations to us or under agreements in which we are a beneficiary, our business could be materially and adversely impacted” for a discussion of risks related to AECOM.
For the six months ended June 30, 2023 and July 1, 2022, we generated revenue of $319.3 million and $293.6 million, respectively, and net (loss) income attributable to Shimmick Corporation of $(19.6) million and $3.7 million, respectively. Adjusted EBITDA was $(2.9) million and $31.9 million for the six months ended June 30, 2023 and July 1, 2022, respectively. Adjusted net (loss) income was $(12.0) million and $22.7 million for the six months ended June 30, 2023 and July 1, 2022, respectively. For the years ended December 30, 2022 and December 31, 2021, we generated revenue of $664.2 million and $572.7 million, respectively, and net income attributable to Shimmick Corporation of $3.8 million and $45.4 million, respectively. Adjusted EBITDA was $47.0 million and $(193.6) million for the years ended December 30, 2022 and December 31, 2021, respectively. Adjusted net income (loss) was $29.5 million and ($184.3) million for the years ended December 30, 2022 and December 31, 2021, respectively. For reconciliations of Adjusted EBITDA and Adjusted net (loss) income to net (loss) income, the most directly comparable GAAP financial measure, see “Prospectus Summary — Summary Selected Consolidated Financial Data.”
As of June 30, 2023, we had a backlog of projects in excess of $1 billion, with over half of that amount comprised of water projects. We believe we have the ability to self-perform many of these projects, enabling us to compete for complex projects and differentiating us from many of our competitors. Self-performance also enables us to better control the critical aspects of our projects, reducing the risk of cost and schedule overruns.
Our Customers
Our project revenue and contracts come primarily from public customers such as federal, state, and local governments, including water districts, sanitation districts, irrigation districts, and flood control districts. Government backing provides financial stability and reliability, as public projects are funded by government entities with the authority to collect taxes and allocate funds. Diverse funding sources — grants, appropriations, loans, state and local taxes, and user fees — reduce dependence on a single source and enhance overall market stability.
Throughout our history, we have maintained and cultivated a strong presence in California. In 2022, more than half of our revenue was generated in California, the largest construction market in the United States. The amount of construction put in place for water infrastructure in California was $4.9 billion in 2022, according to S&P. Our revenue from water projects in California was less than 10% of the total California water market, indicating ample opportunity for us to grow our market share in California, where we believe we possess significant competitive advantages.
For example, we have detailed knowledge of the California market and have developed long-standing relationships with significant customers, including the OCSD, the OCWD, the MWD, the Port of Long Beach, the Port of Los Angeles, the City of San Francisco, the City and County of Los Angeles, and other public agencies across the state. In addition to long-standing relationships with our customers, our decades of industry experience have supplied us with deep knowledge of the local workforce, subcontractors, and suppliers throughout the state, which we believe provides us with a distinct pricing advantage and enables us to better manage risk.
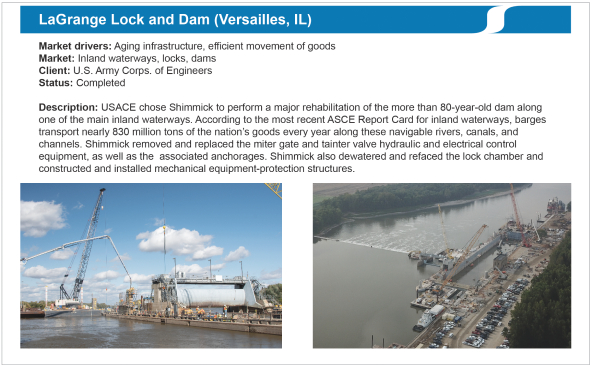
We also have a long history of delivering solutions for the federal government, primarily building locks, dams, levees, and flood protection along the nation’s inland waterways and coasts. Our federal clients include the Navy and numerous USACE districts, including the Louisville District in Kentucky, the Rock Island District in Illinois, and the Nashville District in Tennessee. This work supports efficient transportation, which helps boost trade, reduce congestion on roads, and enhance our nation’s economy.
78