UNITED STATES SECURITIES AND EXCHANGE COMMISSION
Washington, D.C. 20549
Form 10-K
| | | | | |
| ☒ | ANNUAL REPORT PURSUANT TO SECTION 13 OR 15(d) OF THE SECURITIES EXCHANGE ACT OF 1934 |
For the fiscal year ended December 28, 2024
or
| | | | | |
| ☐ | TRANSITION REPORT PURSUANT TO SECTION 13 OR 15(d) OF THE SECURITIES EXCHANGE ACT OF 1934 |
For the transition period from to .
Commission File Number 1-5480
Textron Inc.
(Exact name of registrant as specified in its charter)
| | | | | | | | |
| Delaware | | 05-0315468 |
| (State or other jurisdiction of incorporation or organization) | | (I.R.S. Employer Identification No.) |
| 40 Westminster Street, Providence, RI | | 02903 |
| (Address of principal executive offices) | | (Zip code) |
Registrant’s Telephone Number, Including Area Code: (401) 421-2800
Securities registered pursuant to Section 12(b) of the Act:
| | | | | | | | |
| Title of Each Class | Trading Symbol(s) | Name of Each Exchange on Which Registered |
| Common Stock — par value $0.125 | TXT | New York Stock Exchange |
Securities registered pursuant to Section 12(g) of the Act: None
______________________________________________
Indicate by check mark if the registrant is a well-known seasoned issuer, as defined in Rule 405 of the Securities Act. xYes ¨ No
Indicate by check mark if the registrant is not required to file reports pursuant to Section 13 or Section 15(d) of the Act . ¨ Yes x No
Indicate by check mark whether the registrant (1) has filed all reports required to be filed by Section 13 or 15(d) of the Securities Exchange Act of 1934 during the preceding 12 months (or for such shorter period that the registrant was required to file such reports), and (2) has been subject to such filing requirements for the past 90 days. x Yes ¨ No
Indicate by check mark whether the registrant has submitted electronically every Interactive Data File required to be submitted pursuant to Rule 405 of Regulation S-T during the preceding 12 months (or for such shorter period that the registrant was required to submit such files). x Yes ¨No
Indicate by check mark whether the registrant is a large accelerated filer, an accelerated filer, a non-accelerated filer, smaller reporting company, or an emerging growth company. See definitions of “large accelerated filer,” “accelerated filer,” “smaller reporting company” and “emerging growth company” in Rule 12b-2 of the Exchange Act (Check one):
| | | | | | | | | | | | | | | | | |
| Large accelerated filer | x | | | Accelerated filer | ☐ |
| Non-accelerated filer | ☐ | Smaller reporting company | ☐ | Emerging growth company | ☐ |
If an emerging growth company, indicate by check mark if the registrant has elected not to use the extended transition period for complying with any new or revised financial accounting standards provided pursuant to Section 13(a) of the Exchange Act. ◻
Indicate by check mark whether the registrant has filed a report on and attestation to its management’s assessment of the effectiveness of its internal control over financial reporting under Section 404(b) of the Sarbanes-Oxley Act (15 U.S.C. 7262(b)) by the registered public accounting firm that prepared or issued its audit report. ☒ Yes ¨ No
If securities are registered pursuant to Section 12(b) of the Act, indicate by check mark whether the financial statements of the registrant included in the filing reflect the correction of an error to previously issued financial statements. ☐
Indicate by check mark whether any of those error corrections are restatements that required a recovery analysis of incentive-based compensation received by any of the registrant's executive officers during the relevant recovery period pursuant to §240.10D-1(b) ☐
Indicate by check mark whether the registrant is a shell company (as defined in Rule 12b-2 of the Act). ☐ Yes ☒ No
The aggregate market value of the registrant’s Common Stock held by non-affiliates at June 29, 2024 was approximately $16.0 billion based on the New York Stock Exchange closing price for such shares on that date. The registrant has no non-voting common equity.
At February 1, 2025, 182,572,762 shares of Common Stock were outstanding.
| | |
| Documents Incorporated by Reference |
Part III of this Report incorporates information from certain portions of the registrant’s Definitive Proxy Statement for its Annual Meeting of Shareholders to be held on April 23, 2025.
Textron Inc.
Index to Annual Report on Form 10-K
For the Fiscal Year Ended December 28, 2024
PART I
Item 1. Business
Textron Inc. is a multi-industry company that leverages its global network of aircraft, defense, industrial and finance businesses to provide customers with innovative products and services around the world. References to “Textron Inc.,” the “Company,” “we,” “our” and “us” in this Annual Report on Form 10-K, unless otherwise indicated, refer to Textron Inc. and its consolidated subsidiaries.
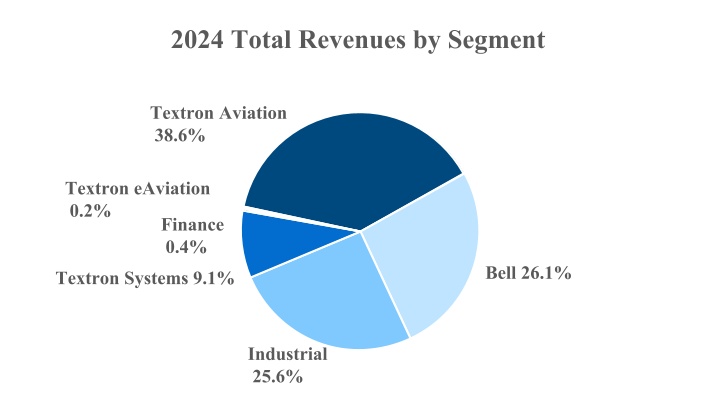
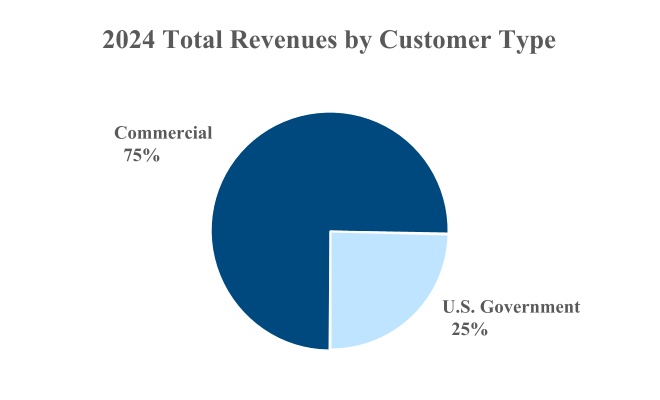
We conduct our business through six operating segments: Textron Aviation, Bell, Textron Systems, Industrial and Textron eAviation, which represent our manufacturing businesses, and Finance, which represents our captive finance business. Our segments include numerous separately incorporated subsidiaries. Total revenues for 2024 were $13.7 billion and are presented below by segment and customer type.
The following description of our business and operating segments should be read in conjunction with Item 7. Management’s Discussion and Analysis of Financial Condition and Results of Operations.
Textron Aviation Segment
Textron Aviation is a leader in general aviation. Textron Aviation manufactures, sells and services Cessna and Beechcraft aircraft, and services the Hawker brand of business jets. The segment has two principal product lines: aircraft and aftermarket parts and services. Aircraft includes sales of business jets, turboprop aircraft, military trainer and defense aircraft and piston engine aircraft. Aftermarket parts and services includes commercial parts sales and maintenance, inspection and repair services, and advanced flight training devices.
Textron Aviation's business jets include the Cessna Citation M2 Gen2, Citation CJ3+, Citation CJ4 Gen2, Citation XLS Gen2, Citation Latitude and the Citation Longitude. In October 2024, Textron Aviation introduced its next generation of light jets, the Citation M2 Gen3, CJ3 Gen3 and CJ4 Gen3, which will include the revolutionary Garmin Emergency Autoland technology. Currently under development, the CJ3 Gen2 is expected to enter into service in 2025, the CJ4 Gen3 is expected to enter into service in 2026, and the M2 Gen3 and CJ3 Gen3 are expected to enter into service in 2027. In addition, Textron Aviation is developing the Citation Ascend, a high-performance midsize business jet, which is continuing to progress through the Federal Aviation Administration's (FAA) certification process and is expected to enter into service in 2025.
Textron Aviation’s turboprop aircraft include the Beechcraft King Air 260, King Air 360ER and King Air 360, and the Cessna Caravan, Grand Caravan EX and SkyCourier. The Beechcraft Denali, a high-performance single engine turboprop aircraft under development, continues toward FAA certification. The Denali will be powered by an engine expected to be up to 20% more efficient than similarly sized engines.
Textron Aviation’s military trainer and defense aircraft include the Beechcraft T-6 trainer, which has been used to train pilots from more than 40 countries, and the AT-6 light attack military aircraft. Textron Aviation’s piston engine aircraft include the Cessna Skyhawk, Skylane, Turbo Skylane, Turbo Stationair HD and the Beechcraft Baron G58 and Bonanza G36.
Textron Aviation markets its products worldwide through its own sales force, as well as through a network of authorized independent sales representatives. With a product lineup ranging from introductory training aircraft through super mid-size business jets, Textron Aviation’s diverse customer base includes fractional aircraft businesses, charter and fleet operators, corporate aviation, individual buyers, training schools, airlines, and special mission, military and government operators.
In support of its family of aircraft, Textron Aviation operates a global network of more than 20 service centers. In addition, more than 300 authorized independent service centers are located throughout the world. Textron Aviation-owned service centers provide customers with 24-hour service and maintenance. Textron Aviation also provides its customers with around-the-clock parts support and offers a mobile support program with over 80 mobile service units.
Bell Segment
Bell is a leading supplier of military and commercial helicopters, tiltrotor aircraft, and related spare parts and services in the world. Tiltrotor aircraft are designed to provide the benefits of both helicopters and fixed-wing aircraft.
Bell supplies advanced military helicopters and provides parts and support services to the U.S. Government and to military customers outside the United States. Bell’s primary U.S. Government programs are for the development of a next generation tiltrotor aircraft for the U.S. Army’s Future Long Range Assault Aircraft (FLRAA) program and the production and support of the V-22 tiltrotor aircraft and H-1 helicopters. Under the U.S. Government-sponsored foreign military sales program, Bell offers the V-22 tiltrotor aircraft and H-1 helicopter products for sale to other countries.
The FLRAA development contract was awarded to Bell in December 2022. In 2024, the U.S. Army announced approval of Milestone B for the FLRAA program, establishing FLRAA as a program of record and transitioning the program to the Engineering and Manufacturing Development phase. This phase includes continued digital modeling, detailed hardware and software design, and fabrication of hardware, as Bell proceeds to critical design review and the first prototype flight planned for 2026.
Through its commercial business, Bell is a leading supplier of commercially certified helicopters and support to corporate, private, law enforcement, utility, public safety and emergency medical helicopter operators, and U.S. and foreign governments. Bell produces a variety of commercial aircraft types, including light single- and twin-engine helicopters and medium twin-engine helicopters, along with other related products. The commercial helicopters currently offered by Bell include the 429, 407GXi, 412EPX and 505 Jet Ranger X. Bell’s super medium commercial helicopter, the 525 Relentless, continues toward FAA certification.
For both its military programs and its commercial products, Bell provides post-sale support and service for an installed base of approximately 13,000 helicopters. Bell operates a global network of eight Company-operated service centers and four global parts distribution centers. In addition, approximately 85 independent service centers are located in about 35 countries. Collectively, these service sites offer a complete range of logistics support, including parts, support equipment, technical data, training devices, pilot and maintenance training, component repair and overhaul, engine repair and overhaul, aircraft modifications, aircraft customizing, accessory manufacturing, contractor maintenance, field service and product support engineering.
Textron Systems Segment
The businesses in our Textron Systems segment develop, manufacture and integrate a variety of products and services for U.S. and international military, government and commercial customers to support defense, homeland security, aerospace, infrastructure protection and other customer missions. Product and service offerings of this segment include electronic systems and solutions, advanced marine craft, piston aircraft engines, live military air-to-air and air-to-ship training, weapons and related components, unmanned aircraft systems and both manned and unmanned armored and specialty vehicles.
Notable products currently developed and produced by the Textron Systems segment include the Ship-to-Shore Connector, the U.S. Navy's next generation of Landing Craft Air Cushion vehicles; a family of test and simulation products; the Aerosonde Small Unmanned Aircraft System, a multi-mission capable unmanned aircraft system for commercial and military operations; and piston aircraft engines under the Lycoming brand. Notable service offerings of the segment include fee-for-service programs, using unmanned aircraft systems, and live military air-to-air and air-to-ship training and support services for U.S. Navy, Marine and Air Force personnel provided by Airborne Tactical Advantage Company.
Industrial Segment
Our Industrial segment designs and manufactures a variety of products within the Kautex and Textron Specialized Vehicles businesses.
Kautex is a leader in designing and manufacturing plastic fuel systems for automobiles and light trucks, including blow-molded solutions for conventional plastic fuel tanks and pressurized plastic fuel tanks for hybrid vehicle applications. Kautex also develops and manufactures clear-vision systems for automotive safety and advanced driver assistance systems (ADAS). Our cleaning systems are comprised of nozzles, reservoirs, inlets and pumps to support onboard cleaning for windscreens, headlamps and ADAS cameras and sensors. In addition, Kautex produces plastic tanks for selective catalytic reduction systems used to reduce emissions from diesel engines, and other fuel system components. Kautex also offers lightweight, composite Pentatonic battery systems, which include enclosures, underbody protection and thermal management systems, for use in electric vehicles, from hybrid to full battery-powered.
Kautex’s business model is focused on developing and maintaining long-term customer relationships with leading global original equipment manufacturers (OEMs). Kautex, which is headquartered in Bonn, Germany, operates over 30 plants in 13 countries in close proximity to its customers, along with 9 engineering/research and development locations around the world.
Our Textron Specialized Vehicles businesses manufacture and sell products under our E-Z-GO, Arctic Cat, TUG Technologies, Douglas Equipment, Premier, Safeaero, Ransomes, Jacobsen and Cushman brands. These businesses design, manufacture and sell golf cars; off-road utility vehicles; powersports products; light transportation vehicles; aviation ground support equipment; professional turf-maintenance equipment; and specialized turf-care vehicles. A significant portion of the products sold by these businesses are powered with lithium batteries, greatly reducing the products’ impact on the environment.
The diversified customer base for Textron Specialized Vehicles includes golf courses and resorts, government agencies and municipalities, consumers, outdoor enthusiasts, and commercial and industrial users such as factories, warehouses, airlines, planned communities, hunting preserves, educational and corporate campuses, sporting venues and landscaping professionals. Sales are made through a network of independent distributors and dealers worldwide and the Bass Pro Shops and Cabela's retail outlets, which sell our powersports products under the Tracker Off Road brand, as well as factory direct resources. In addition, we also manufacture powersports products for OEMs for resale to customers under the OEM’s branding.
Textron eAviation Segment
Our Textron eAviation segment is focused on research and development initiatives related to sustainable aviation solutions and includes Pipistrel, a manufacturer of light aircraft. Pipistrel offers a family of light aircraft and gliders with both electric and combustion engines, including the Velis Electro, which is the world’s first, and currently only, electric aircraft to receive full type certification from the European Union Aviation Safety Agency and from the UK Civil Aviation Authority. In 2024, the FAA granted a light-sport aircraft airworthiness exemption for the Pipistrel Velis Electro, allowing flight training in an electric aircraft within the United States.
The Textron eAviation segment is also developing both hybrid and electric propulsion aircraft, including Pipistrel's Nuuva V300, a long-range, large-capacity hybrid-electric vertical takeoff and landing aircraft, and an electric vertical takeoff and landing (eVTOL) aircraft. The Nuuva V300's first hover flight is expected in 2025 and initial testing on the Nexus, a full-scale technology demonstrator eVTOL, is expected to begin in 2025.
Finance Segment
Our Finance segment, or the Finance group, is a commercial finance business that consists of Textron Financial Corporation (TFC) and its consolidated subsidiaries. The Finance segment provides financing primarily to purchasers of new and pre-owned Textron Aviation aircraft and Bell helicopters. A substantial number of the originations in our finance receivable portfolio are cross-border transactions for aircraft sold outside of the U.S. In 2024 and 2023, our Finance group made payments of $109 million and $160 million, respectively, to finance the Manufacturing group's sale of Textron-manufactured products to third parties.
Backlog
Backlog represents amounts allocated to contracts that we expect to recognize as revenue in future periods when we perform under the contracts. Backlog excludes unexercised contract options and potential orders under ordering-type contracts, such as Indefinite Delivery, Indefinite Quantity contracts.
Our backlog at the end of 2024 and 2023 is summarized below:
| | | | | | | | |
| (In millions) | December 28,
2024 | December 30,
2023 |
| Textron Aviation | $ | 7,845 | | $ | 7,169 | |
| Bell | 7,469 | | 4,780 | |
| Textron Systems | 2,594 | | 1,950 | |
| Total backlog | $ | 17,908 | | $ | 13,899 | |
U.S. Government Contracts and Other Governmental Regulation
Our operations, products and services are subject to various government regulations, including regulations related to U.S. government business, international regulation of aviation products and services, and environmental regulations.
Contracts with the U.S. Government, including contracts under the U.S. Government-sponsored foreign military sales program, generated approximately 25% of our consolidated revenues in 2024, primarily in our Bell and Textron Systems segments. We must comply with and are affected by laws and regulations relating to the formation, administration and performance of U.S. Government contracts. These laws and regulations, among other things, require certification and disclosure of all cost and pricing
data in connection with contract negotiation; define allowable and unallowable costs and otherwise govern our right to reimbursement under certain cost-based U.S. Government contracts; and safeguard and restrict the use and dissemination of classified and covered defense information and the export of certain products and technical data. New laws, regulations or procurement requirements, or changes to current ones, can significantly increase our costs, reducing our profitability.
Our contracts with the U.S. Government generally may be terminated by the U.S. Government for convenience or if we default in whole or in part by failing to perform under the terms of the applicable contract. If the U.S. Government terminates a contract for convenience, we normally will be entitled to payment for the cost of contract work performed before the effective date of termination, including, if applicable, reasonable profit on such work, as well as reasonable termination costs. If, however, the U.S. Government terminates a contract for default, generally: (a) we will be paid the contract price for completed supplies delivered and accepted and services rendered, an agreed-upon amount for manufacturing materials delivered and accepted and for the protection and preservation of property, and an amount for partially completed products accepted by the U.S. Government; (b) the U.S. Government may not be liable for our costs with respect to unaccepted items and may be entitled to repayment of advance payments and progress payments related to the terminated portions of the contract; (c) the U.S. Government may not be liable for assets we own and utilize to provide services under the “fee-for-service” contracts; and (d) we may be liable for excess costs incurred by the U.S. Government in procuring undelivered items from another source. See the Aerospace and Defense Industry section in Item 1A. Risk Factors for additional information related to regulation of U.S. Government business.
Our commercial aircraft manufacturing businesses are regulated by the FAA in the U.S. and by similar aviation regulatory governing authorities internationally, including, the European Aviation Safety Agency. Maintenance facilities and aftermarket services must also comply with FAA and international regulations. These regulations address production and quality systems, airworthiness and installation approvals, repair procedures and continuing operational safety. For an aircraft to be manufactured and sold, the model must receive a type certificate from the appropriate aviation authority, and each aircraft must receive a certificate of airworthiness. Aircraft outfitting and completions also require approval by the appropriate aviation authority. See the Strategic Risks section in Item 1A. Risk Factors for additional information with respect to risks related to obtaining certification of new aircraft products.
Our operations are subject to numerous laws and regulations designed to protect the environment. For additional information regarding environmental matters, see Note 17 to the Consolidated Financial Statements in Item 8. Financial Statements and Supplementary Data, and the Business and Operational Risks and Risks Related to Regulatory, Legal and Other Matters sections in Item 1A. Risk Factors.
Based on current information and the applicable laws and regulations currently in effect, compliance with government regulations, including environmental regulations, has not had, and we do not expect it to have, a material effect on our capital expenditures, earnings or competitive position. However, laws and regulations may be changed or adopted that impose additional compliance requirements which could necessitate capital expenditures or otherwise increase our costs of doing business, reducing our profitability and negatively impacting our operating results.
Human Capital Resources
At December 28, 2024, we employed approximately 34,000 employees worldwide, with approximately 80% located in the U.S. and the remainder located outside of the U.S. Approximately 7,400, or 28%, of our U.S. employees, most of whom work for our Bell and Textron Aviation segments, are represented by unions under collective bargaining agreements, and certain of our non-U.S. employees are represented by organized works councils. From time to time, our collective bargaining agreements expire. Historically, we have been successful in negotiating renewals to expiring agreements without any material disruption of operating activities; however, on September 21, 2024, Textron Aviation’s largest union rejected a proposed new contract and initiated a strike. The strike impacted approximately 5,000 of Textron Aviation’s employees at its manufacturing, parts and distribution and service center facilities in Wichita, Kansas. On October 20, 2024, Textron Aviation and the union reached an agreement and a new five-year labor contract was ratified.
Our success is highly dependent upon our ability to hire, train and retain a workforce with the skills necessary for our businesses to develop and manufacture the products desired by our customers. We need highly skilled personnel in multiple areas including, among others, engineering, manufacturing, information technology, cybersecurity, flight operations, business development and strategy and management. In order to attract and retain highly skilled employees, we offer comprehensive compensation and benefit programs, career opportunities and an engaging, inclusive environment where employees are treated with dignity and respect.
Health and Safety
The health and safety of our employees, contractors and communities is a priority, and we strive to provide our employees with healthy working conditions and safe facilities. To maintain and enhance the safety of our employees, we promote a workplace safety culture of continuous improvement, shared responsibility, and individual accountability. We use an annual goal setting
process to drive injury rate improvements, and the injury rate reduction goal is a performance metric that is tracked and reported to senior leadership and the Audit Committee of the Board of Directors.
Talent and Career Development
Our talent development programs are designed to prepare our employees at all levels to take on new career and growth opportunities at Textron. Leadership, professional and functional training courses are tailored for employees at each stage of their careers and include a mix of enterprise-wide and business unit-specific programs. Textron University, an internal corporate function, provides (i) facilitated face-to-face professional and leadership development programs, (ii) web-based general and specialized functional and technical courses and (iii) an online portal to access advanced skills technical training, manage recertification of existing qualifications and other career planning tools and resources.
The current and future talent needs of each of our businesses are assessed annually through a formal talent review process which enables us to develop leadership succession plans and provide our employees with potential new career opportunities. In addition, leaders from functional areas within each business belong to enterprise-wide councils that conduct annual talent reviews. These processes enable us to fill talent needs by matching employees who are ready to assume significant leadership roles with opportunities that best fit their career path, which may be in other businesses within the enterprise.
We believe by employing highly talented employees who feel valued, respected and are able to contribute fully, we will improve performance, innovation, collaboration and talent retention, all of which contributes to stronger business results and reinforces our reputation as leaders in our industries and communities.
For discussion of certain risks relating to human capital management, see the Risks Related to Human Capital section in Item 1A. Risk Factors.
Patents and Trademarks
We own, or are licensed under, numerous patents throughout the world relating to products, services and methods of manufacturing. Patents developed while under contract with the U.S. Government may be subject to use by the U.S. Government. We also own or license active trademark registrations and pending trademark applications in the U.S. and in various foreign countries or regions, as well as trade names and service marks. While our intellectual property rights in the aggregate are important to the operation of our business, we do not believe that any existing patent, license, trademark or other intellectual property right is of such importance that its loss or termination would have a material adverse effect on our business taken as a whole.
Information about our Executive Officers
The following table sets forth certain information concerning our executive officers as of February 6, 2025.
| | | | | | | | |
| Name | Age | Current Position with Textron Inc. |
| Scott C. Donnelly | 63 | Chairman, President and Chief Executive Officer |
| Frank T. Connor | 65 | Executive Vice President and Chief Financial Officer |
| Julie G. Duffy | 59 | Executive Vice President and Chief Human Resources Officer |
| E. Robert Lupone | 65 | Executive Vice President, General Counsel, Secretary and Chief Compliance Officer |
Mr. Donnelly joined Textron in June 2008 as Executive Vice President and Chief Operating Officer and was promoted to President and Chief Operating Officer in January 2009. He was appointed to the Board of Directors in October 2009 and became Chief Executive Officer of Textron in December 2009. In July 2010, Mr. Donnelly was appointed Chairman of the Board of Directors effective September 1, 2010. Previously, Mr. Donnelly was the President and CEO of General Electric Company’s Aviation business unit, a position he had held since July 2005. GE’s Aviation business unit is a leading maker of commercial and military jet engines and components, as well as integrated digital, electric power and mechanical systems for aircraft. Prior to July 2005, Mr. Donnelly served as Senior Vice President of GE Global Research, one of the world’s largest and most diversified industrial research organizations with facilities in the U.S., India, China and Germany and held various other management positions since joining General Electric in 1989.
Mr. Connor joined Textron in August 2009 as Executive Vice President and Chief Financial Officer. Previously, Mr. Connor was head of Telecom Investment Banking at Goldman, Sachs & Co. from 2003 to 2008. Prior to that position, he served as Chief Operating Officer of Telecom, Technology and Media Investment Banking at Goldman, Sachs & Co. from 1998 to 2003. Mr. Connor joined the Corporate Finance Department of Goldman, Sachs & Co. in 1986 and became a Vice President in 1990 and a Managing Director in 1996.
On October 23, 2024, we announced that Mr. Connor will be retiring effective February 28, 2025. David Rosenberg, currently our Vice President – Investor Relations, has been appointed Executive Vice President and Chief Financial Officer to succeed Mr. Connor, effective March 1, 2025. Mr. Rosenberg, 48, has more than 24 years of experience in the aviation industry. Prior to his role as Vice President – Investor Relations, he served as Senior Vice President & Chief Financial Officer of Textron Aviation from 2018 through 2023, having previously held leadership positions in finance at Textron Aviation. Following Textron’s acquisition of Beechcraft in 2014, as Textron Aviation’s Vice President, Integration & Strategy, Mr. Rosenberg led the successful merger and integration of Beechcraft and Textron’s Cessna Aircraft business, which created today’s Textron Aviation segment. Prior to Textron’s acquisition of Beechcraft, Mr. Rosenberg held a series of leadership positions in financial planning, business management, strategic planning and operations with Beechcraft and its predecessor companies.
Ms. Duffy was named Executive Vice President, Human Resources in July 2017 and Executive Vice President and Chief Human Resources Officer in April 2022. Ms. Duffy joined Textron in 1997 as a member of the corporate legal team and has since held positions of increasing responsibility within the Company’s legal function, previously serving as Vice President and Deputy General Counsel – Litigation, a position she had held since 2011. In that role she was responsible for managing the corporate litigation staff with primary oversight of litigation throughout Textron. She has also played an active role in developing, implementing and standardizing human resources policies across the Company and served as the senior legal advisor on employment and benefits issues.
Mr. Lupone joined Textron in February 2012 as Executive Vice President, General Counsel, Secretary and Chief Compliance Officer. Previously, he was Senior Vice President and General Counsel of Siemens Corporation (U.S.) since 1999 and General Counsel of Siemens AG for the Americas since 2008. Prior to joining Siemens in 1992, Mr. Lupone was Vice President and General Counsel of Price Communications Corporation.
Available Information
We make available free of charge on our Internet Web site (www.textron.com) our Annual Report on Form 10-K, Quarterly Reports on Form 10-Q, Current Reports on Form 8-K and amendments to those reports filed or furnished pursuant to Section 13(a) or 15(d) of the Securities Exchange Act of 1934 as soon as reasonably practicable after we electronically file such material with, or furnish it to, the Securities and Exchange Commission.
Forward-Looking Information
Certain statements in this Annual Report on Form 10-K and other oral and written statements made by us from time to time are “forward-looking statements” within the meaning of the Private Securities Litigation Reform Act of 1995. These forward-looking statements, which may describe strategies, goals, outlook or other non-historical matters, or project revenues, income, returns or other financial measures, often include words such as “believe,” “expect,” “anticipate,” “intend,” “plan,” “estimate,” “guidance,” “project,” “target,” “potential,” “will,” “should,” “could,” “likely” or “may” and similar expressions intended to identify forward-looking statements. These statements are only predictions and involve known and unknown risks, uncertainties, and other factors that may cause our actual results to differ materially from those expressed or implied by such forward-looking statements. Given these uncertainties, you should not place undue reliance on these forward-looking statements. Forward-looking statements speak only as of the date on which they are made, and we undertake no obligation to update or revise any forward-looking statements. In addition to those factors described herein under “Risk Factors,” among the factors that could cause actual results to differ materially from past and projected future results are the following:
•Interruptions in the U.S. Government’s ability to fund its activities and/or pay its obligations;
•Changing priorities or reductions in the U.S. Government defense budget, including those related to military operations in foreign countries;
•Our ability to perform as anticipated and to control costs under contracts with the U.S. Government;
•The U.S. Government’s ability to unilaterally modify or terminate its contracts with us for the U.S. Government’s convenience or for our failure to perform, to change applicable procurement and accounting policies, or, under certain circumstances, to withhold payment or suspend or debar us as a contractor eligible to receive future contract awards;
•Changes in foreign military funding priorities or budget constraints and determinations, or changes in government regulations or policies on the export and import of military and commercial products;
•Volatility in the global economy or changes in worldwide political conditions that adversely impact demand for our products;
•Volatility in interest rates or foreign exchange rates and inflationary pressures;
•Risks related to our international business, including establishing and maintaining facilities in locations around the world and relying on joint venture partners, subcontractors, suppliers, representatives, consultants and other business partners in connection with international business, including in emerging market countries;
•Our Finance segment’s ability to maintain portfolio credit quality or to realize full value of receivables;
•Performance issues with key suppliers or subcontractors;
•Legislative or regulatory actions, both domestic and foreign, impacting our operations or demand for our products;
•Our ability to control costs and successfully implement various cost-reduction activities;
•The efficacy of research and development investments to develop new products or unanticipated expenses in connection with the launching of significant new products or programs;
•The timing of our new product launches or certifications of our new aircraft products;
•Our ability to keep pace with our competitors in the introduction of new products and upgrades with features and technologies desired by our customers;
•Pension plan assumptions and future contributions;
•Demand softness or volatility in the markets in which we do business;
•Cybersecurity threats, including the potential misappropriation of assets or sensitive information, corruption of data or operational disruption;
•Difficulty or unanticipated expenses in connection with integrating acquired businesses;
•The risk that acquisitions do not perform as planned, including, for example, the risk that acquired businesses will not achieve revenue and profit projections;
•The impact of changes in tax legislation;
•The risk of disruptions to our business and the business of our suppliers, customers and other business partners due to unexpected events, such as pandemics, natural disasters, acts of war, strikes, terrorism, social unrest or other societal, geopolitical or macroeconomic conditions;
•Risks related to changing U.S. and foreign trade policies, including increased trade restrictions or tariffs; and
•The ability of our businesses to hire, train and retain the highly skilled personnel necessary for our businesses to succeed.
Item 1A. Risk Factors
Our business, financial condition and results of operations are subject to various risks, including those discussed below, which may affect the value of our securities. The risks discussed below are those that we believe currently are the most significant to our business.
Aerospace and Defense Industry Risks
Demand for our aircraft products is cyclical and lower demand adversely affects our financial results.
Demand for business jets, turbo props and commercial helicopters has been cyclical and difficult to forecast. From time to time, the demand for our aircraft products has been adversely impacted by unexpected events and may be impacted by such events in the future. Therefore, future demand for these products could be significantly and unexpectedly less than anticipated and/or less than previous period deliveries. Similarly, there is uncertainty as to when or whether our existing commercial backlog for aircraft products will convert to revenues as the conversion depends on production capacity, customer needs and credit availability, among other factors. Changes in economic conditions have in the past caused, and in the future may cause, customers to request that firm orders be rescheduled, deferred or cancelled. Reduced demand for our aircraft products or delays or cancellations of orders previously has had and, in the future, could have a material adverse effect on our cash flows, results of operations and financial condition.
We have customer concentration with the U.S. Government; reduction in U.S. Government defense spending can adversely affect our results of operations and financial condition.
During 2024, we derived approximately 25% of our revenues from sales to a variety of U.S. Government entities. Our revenues from the U.S. Government largely result from contracts awarded to us under various U.S. Government defense-related programs. Considerable uncertainty exists regarding how future budget and program decisions will develop. We cannot predict the impact on existing, follow-on or future programs from changes in the threat environment, defense spending levels, government priorities, political leadership, procurement practices, inflation and other macroeconomic trends, military strategy, or broader societal changes. Significant changes in national and international priorities for defense spending could affect the funding, or the timing of funding, of our programs, which could negatively impact our results of operations and financial condition.
The funding of U.S. Government defense programs is subject to congressional appropriation decisions and the U.S. Government budget process which includes enacting relevant legislation, such as appropriations bills and accords on the debt ceiling. Although multiple-year contracts may be planned in connection with major procurements, Congress generally appropriates funds on a fiscal year basis even though a program may continue for several years. Consequently, programs often are only partially funded initially, and additional funds are committed only as Congress makes further appropriations. Further uncertainty with respect to ongoing programs could also result in the event that the U.S. Government finances its operations through temporary funding measures such as “continuing resolutions” rather than full-year appropriations or if a government shutdown were to occur and were to continue for an extended period of time. If we incur costs in advance or in excess of funds committed on a contract, we are at risk for non-reimbursement of those costs until additional funds are appropriated. The reduction, termination or delay in the timing of funding for U.S. Government programs for which we currently provide or propose to provide products or services from time to time has resulted and, in the future, may result in a loss of anticipated revenues. A loss of such revenues could materially
and adversely impact our results of operations and financial condition. In addition, because our U.S. Government contracts generally require us to continue to perform even if the U.S. Government is unable to make timely payments, we may need to finance our continued performance for the impacted contracts from our other resources on an interim basis. An extended delay in the timely payment by the U.S. Government could have a material adverse effect on our liquidity.
U.S. Government contracts can be terminated at any time and may contain other unfavorable provisions.
The U.S. Government typically can terminate or modify any of its contracts with us either for its convenience or if we default by failing to perform under the terms of the applicable contract. In the event of termination for the U.S. Government’s convenience, contractors are generally protected by provisions covering reimbursement for costs incurred on the contracts and profit on those costs but not the anticipated profit that would have been earned had the contract been completed. A termination arising out of our default for failure to perform could expose us to liability, including but not limited to, all costs incurred under the contract plus potential liability for re-procurement costs in excess of the total original contract amount, less the value of work performed and accepted by the customer under the contract. Such an event could also have an adverse effect on our ability to compete for future contracts and orders. If any of our contracts are terminated by the U.S. Government whether for convenience or default, our backlog would be reduced by the expected value of the remaining work under such contracts. We also enter into “fee for service” contracts with the U.S. Government where we retain ownership of, and consequently the risk of loss on, aircraft and equipment supplied to perform under these contracts. Termination of these contracts could materially and adversely impact our results of operations. On contracts for which we are teamed with others and are not the prime contractor, the U.S. Government could terminate a prime contract under which we are a subcontractor, irrespective of the quality of our products and services as a subcontractor. In addition, in the event that the U.S. Government is unable to make timely payments, failure to continue contract performance places the contractor at risk of termination for default. Any such event could have a material adverse effect on our cash flows, results of operations and financial condition.
As a U.S. Government contractor, we are subject to procurement rules and regulations; our failure to comply with these rules and regulations could adversely affect our business.
We must comply with and are affected by laws and regulations relating to the formation, administration and performance of U.S. Government contracts. These laws and regulations, among other things, require certification and disclosure of all cost and pricing data in connection with contract negotiation, define allowable and unallowable costs and otherwise govern our right to reimbursement under certain cost-based U.S. Government contracts, and safeguard and restrict the use and dissemination of classified information, covered defense information, and the exportation of certain products and technical data. New laws, regulations or procurement requirements or changes to current ones (including, for example, regulations related to cybersecurity) can significantly increase our costs, reducing our profitability. Our failure to comply with procurement regulations and requirements could allow the U.S. Government to suspend or debar us from receiving new contracts for a period of time, reduce the value of existing contracts, issue modifications to a contract, withhold cash on contract payments, and control and potentially prohibit the export of our products, services and associated materials, any of which could negatively impact our results of operations, financial condition or liquidity. A number of our U.S. Government contracts contain provisions that require us to make disclosure to the Inspector General of the agency that is our customer if we have credible evidence that we have violated U.S. criminal laws involving fraud, conflict of interest, or bribery; the U.S. civil False Claims Act; or received a significant overpayment under a U.S. Government contract. Failure to properly and timely make disclosures under these provisions may result in a termination for default or cause, suspension and/or debarment, and potential fines.
As a U.S. Government contractor, our businesses and systems are subject to audit and review by the Defense Contract Audit Agency (DCAA) and the Defense Contract Management Agency (DCMA).
We operate in a highly regulated environment and are routinely audited and reviewed by the U.S. Government and its agencies such as the DCAA and DCMA. These agencies review our performance under contracts, our cost structure and our compliance with laws and regulations applicable to U.S. Government contractors. The systems that are subject to review include, but are not limited to, our accounting, estimating, material management and accounting, earned value management, purchasing and government property systems. If an audit uncovers improper or illegal activities, we may be subject to civil and criminal penalties and administrative sanctions that may include the termination of our contracts, forfeiture or reduction of profits, suspension or reduction of payments, fines, and, under certain circumstances, suspension or debarment from future contracts for a period of time. Whether or not illegal activities are alleged, the U.S. Government also has the ability to decrease or withhold certain payments when it deems systems subject to its review to be inadequate. These laws and regulations affect how we conduct business with our government customers and, in some instances, impose added costs on our business.
Our profitability and cash flow varies depending on the mix of our government contracts and our ability to control costs.
Under fixed-price contracts, generally we receive a fixed price irrespective of the actual costs we incur, and, consequently, we absorb any costs in excess of the fixed price. Changes in underlying assumptions, circumstances or estimates used in developing the pricing for such contracts can adversely affect our results of operations. Additionally, fixed-price contracts generally require progress payments rather than performance-based payments which can delay our ability to recover a significant amount of costs
incurred on a contract and thus affect the timing of our cash flows. Under fixed-price incentive contracts, we share with the U.S. Government cost underrun savings, which are derived from total cost being less than target costs; we also share in cost overruns, which occur when total costs exceed target costs up to a negotiated cost ceiling; however, we are solely responsible for costs above the ceiling. Under time and materials contracts, we are paid for labor at negotiated hourly billing rates and for certain expenses. Under cost-reimbursement contracts that are subject to a contract-ceiling amount, we are reimbursed for allowable costs and paid a fee, which may be fixed or performance-based; however, if our costs exceed the contract ceiling or are not allowable under the provisions of the contract or applicable regulations, we may not be able to obtain reimbursement for all such costs. Due to the nature of our work under government contracts, we sometimes experience unforeseen technological or schedule difficulties and cost overruns due to inflation, labor shortages, supply chain challenges, bid protests, and/or other factors. Under each type of contract, if we are unable to control costs or if our initial cost estimates are incorrect, our cash flows, results of operations and financial condition could be adversely affected. Cost overruns also may adversely affect our ability to sustain existing programs and obtain future contract awards.
The market for U.S. Government defense business is highly competitive, and the competitive bidding process increases pricing pressure and cost which may affect our ability to win new contracts for major government programs.
Our defense businesses operate in highly competitive markets in which they participate in rigorous, increasingly competitive bidding processes against other defense companies for U.S. government business. The U.S. Government relies upon competitive contract award types, including indefinite-delivery, indefinite-quantity, other transaction agreements and multi-award contracts, which often create increased pricing pressure and increase our cost by requiring that we submit multiple bids or share in costs. In addition, multi-award contracts increase our cost as they require that we make sustained efforts to compete for task orders and delivery orders under the contract. Further, the competitive bidding process is costly, in some instances requires significant research and development and/or engineering efforts to participate and demands employee and managerial time to prepare bids and proposals for contracts that may not be awarded to us or may be split among competitors.
Despite our best efforts, the U.S. Government customer sometimes chooses competitor's offerings over our offerings and there can be no assurance that our businesses will be selected for government programs with significant long-term revenues. Even if we are successful in obtaining an award, we have in the past and may in the future encounter bid protests from unsuccessful bidders on new program awards. Bid protests could result in significant expenses associated with justifying the selection or due to potential program delays and could result in contract modifications that alter schedule or scope or even cause the loss of the contract award. Even when a bid protest does not result in the loss of a contract award, the resolution could postpone commencement of contract activity, resulting in additional cost and delay in the recognition of revenue and profit. If we are unable to continue to compete successfully against our current or future competitors, do not win government programs with significant long-term revenues or do not prevail in bid protests, we may experience declines in future revenues and profitability, which could have a material adverse effect on our financial position, results of operations or cash flows.
Strategic Risks
Developing new products and technologies entails significant risks and uncertainties.
To continue to grow our revenues and segment profit, we must successfully develop new products and technologies or modify our existing products and technologies for our current and future markets. Our future performance depends, in part, on our ability to identify emerging technological trends and customer requirements and to develop and maintain competitive products and services. Delays or cost overruns in the development and acceptance of new products or certification of new aircraft and other products occur from time to time and could adversely affect our results of operations. These delays or cost overruns could be caused by unanticipated technological hurdles, production changes to meet customer demands, unanticipated difficulties in obtaining required regulatory certifications of new aircraft or other products, or failure on the part of our suppliers to deliver components as agreed. We also could be adversely affected if our research and development efforts are less successful than expected or if these efforts require significantly more funding to achieve our goals than anticipated. In particular, the success of Textron eAviation depends in large part, on our ability to develop and certify new electric and hybrid electric aircraft products in order to achieve our long-term strategy of offering a family of sustainable aircraft for urban air mobility, general aviation, cargo and special mission roles. In addition, new products and technologies could generate unanticipated safety or other concerns resulting in expanded product liability risks, potential product recalls and other regulatory issues that could have an adverse impact on us. Furthermore, because of the lengthy research and development cycle involved in bringing certain of our products to market, we cannot predict the economic conditions that will exist when any new product is complete, and the market for our product offerings does not always develop or continue to expand as we anticipate.
A reduction in capital spending in the aerospace or defense industries could have a significant effect on the demand for new products and technologies under development, which could have an adverse effect on our financial condition and results of operations. In addition, our investments in equipment or technology that we believe will enable us to obtain future contracts for our U.S. Government or other customers may not result in contracts or revenues sufficient to offset such investment. We cannot be sure that our competitors will not develop competing technologies which gain superior market acceptance compared to our
products. A significant failure in our new product development efforts, a substantial change to schedule, a material change in an anticipated market or the failure of our products or services to achieve customer acceptance relative to our competitors’ products or services, could have an adverse effect on our financial condition and results of operations.
We have made and may continue to make acquisitions that increase the risks of our business.
We enter into acquisitions with the intention of expanding our business and enhancing shareholder value. Acquisitions involve risks and uncertainties that, in some cases, have resulted, and, in the future, could result in our not achieving expected benefits. Such risks include difficulties in integrating newly acquired businesses and operations in an efficient and cost-effective manner; challenges in achieving expected strategic objectives, cost savings and other benefits; the risk that the acquired businesses’ markets do not evolve as anticipated and that the acquired businesses’ products and technologies do not prove to be those needed to be successful in those markets; the risk that our due diligence reviews of the acquired business do not identify or adequately assess all of the material issues which impact valuation of the business or result in costs or liabilities in excess of what we anticipated; the risk that we pay a purchase price that exceeds what the future results of operations would have merited; the risk that the acquired business may have significant internal control deficiencies or exposure to regulatory sanctions; and the potential loss of key customers, suppliers and employees of the acquired businesses.
Business and Operational Risks
Risks arising from uncertainty in global macroeconomic conditions may harm our business.
We are sensitive to global macroeconomic conditions. Negative macroeconomic factors may have an adverse effect on our business, results of operations and financial condition, as well as on our distributors, customers, subcontractors and suppliers, and on activity in many of the industries and markets we serve. We cannot predict changes in worldwide or regional economic or political conditions and government policies as such factors are highly volatile and beyond our control. If current macroeconomic pressures, including from inflation and labor and supply chain challenges, continue or if global macroeconomic conditions deteriorate and remain at depressed levels for extended periods, our business, results of operations and financial condition could be materially adversely affected. In addition, changes in laws or policies governing the terms of foreign trade, and in particular increased trade restrictions, tariffs or taxes on imports from countries where we manufacture or sell our products or from where we import products or raw materials (either directly or through our suppliers) could adversely impact our competitive position, business operations and financial results.
Our business could be negatively impacted by cybersecurity threats and other disruptions.
Our information technology (IT) and related systems are critical to the efficient operation of our business and essential to our ability to perform day to day processes. We routinely face persistent security threats, including threats to our IT infrastructure and unlawful attempts to gain access to our confidential, classified or otherwise proprietary information via phishing/malware campaigns and other cyberattack methods, as well as threats to the physical security of our facilities and employees. The threats we face vary from those common to most industries, to attacks by more advanced and persistent, highly organized adversaries, including nation state actors, which target us for the national security information in our possession, for our role in developing advanced technology systems or with the goal of committing fraudulent activity. Our customers, suppliers and subcontractors are likewise targeted, and attack methods continue to evolve. Some cyberattacks depend on human error or manipulation, including phishing attacks or schemes that use social engineering or artificial intelligence to gain access to systems or carry out disbursement of funds or other frauds. Developments in artificial intelligence and machine learning provide threat actors with the capability to use more sophisticated means to attack our systems and may exacerbate cybersecurity risk.
While we have experienced cybersecurity attacks, such attacks have not resulted in a material information security breach and we have not suffered any material losses relating to such attacks. Due to the evolving nature of security threats, the possibility of future material incidents cannot be completely mitigated, and we may not always be successful in timely detecting, reporting or responding to cyber incidents. Future attacks or breaches of data security, whether of our systems, the systems of our customers, suppliers, subcontractors or other business partners, or the systems of our service providers or other third parties who may have access to our data for business purposes, could disrupt our operations, cause the loss of business information or compromise confidential information, exposing us to liability or regulatory action. Such an incident also could require significant management attention and resources, increase costs that may not be covered by insurance, and result in reputational damage, potentially adversely affecting our competitiveness and our results of operations. Products and services that we provide to our customers may themselves be subject to cyberthreats which may not be detected or effectively mitigated, resulting in potential losses that could adversely affect us and our customers. In addition, our customers, including the U.S. Government, are increasingly requiring cybersecurity protections and mandating cybersecurity standards in our products, and we may incur additional costs to comply with such demands. For information on our cybersecurity governance, risk management and strategy, see Item 1C. Cybersecurity.
Challenges faced by our subcontractors or suppliers could materially and adversely affect our performance.
We rely on other companies to provide raw materials, major components and subsystems for our products. Subcontractors also perform services that we provide to our customers in certain circumstances. We depend on these suppliers and subcontractors to meet our contractual obligations to our customers and conduct our operations. Our ability to meet our obligations to our customers could be adversely affected if suppliers or subcontractors do not provide the agreed-upon supplies or perform the agreed-upon services in compliance with customer requirements and in a timely and cost-effective manner. Likewise, the quality of our products could be adversely impacted if companies to whom we delegate manufacture of major components or subsystems for our products, or from whom we acquire such items, do not provide components or subsystems which meet required specifications and perform to our and our customers’ expectations. Our businesses are experiencing and may continue to experience manufacturing inefficiencies and production delays as a result of shortages and delays of critical components for our products and other issues related to our direct or indirect suppliers. Suppliers may be unable to quickly recover from natural disasters, acts of war, and other events beyond their control and may be subject to additional risks such as material or labor shortages, inflationary conditions or other financial problems that limit their ability to conduct their operations, resulting in their inability to perform as anticipated. As a result, we have experienced, and may continue to experience, cost increases for certain materials and components which, along with increased energy and shipping costs and other inflationary pressures, have negatively impacted, and may continue to negatively impact, our profitability. The risk of these adverse effects would likely be greater in circumstances where we rely on only one or two subcontractors or suppliers for a particular raw material, product or service. In particular, in the aircraft industry, most vendor parts are certified by the regulatory agencies as part of the overall Type Certificate for the aircraft being produced by the manufacturer. If a vendor does not or cannot supply its parts, then the manufacturer’s production line may be stopped until the manufacturer can design, manufacture and certify a similar part itself or identify and certify another similar vendor’s part, resulting in significant delays in the completion of aircraft. Such events may adversely affect our financial results, damage our reputation and relationships with our customers, and result in regulatory actions and/or litigation.
We are subject to risks of doing business globally that could adversely impact our business.
During 2024, we derived approximately 29% of our revenues from international business, including U.S. exports. Conducting business internationally exposes us to additional risks than if we conducted our business solely within the U.S. We maintain manufacturing facilities, service centers, supply centers and other facilities worldwide, including in various emerging market countries. Risks related to international operations include import, export, economic sanctions and other trade restrictions; changing U.S. and foreign procurement policies and practices; changes in international trade policies, including higher tariffs on imported goods and materials and renegotiation of free trade agreements; potential retaliatory tariffs imposed by foreign countries against U.S. goods; impacts on our non-U.S. suppliers and customers due to acts of war or terrorism occurring internationally; restrictions on technology transfer; difficulties in protecting intellectual property; increasing complexity of employment and environmental, health and safety regulations; foreign investment laws; exchange controls; repatriation of earnings or cash settlement challenges; compliance with increasingly rigorous data privacy and protection laws; competition from foreign and multinational firms with home country advantages; economic and government instability; acts of industrial espionage, acts of war and terrorism and related safety concerns. The impact of any one or more of these or other factors could adversely affect our business, financial condition or operating results.
Additionally, some international government customers require contractors to agree to specific in-country purchases, technology transfers, manufacturing agreements or financial support arrangements, known as offsets, as a condition for a contract award. These contracts generally extend over several years and may include penalties if we fail to perform in accordance with the offset requirements which are often subjective. We also are exposed to risks associated with using foreign representatives and consultants for international sales and operations and teaming with international subcontractors and suppliers in connection with international programs. In many foreign countries, particularly in those with developing economies, it is common to engage in business practices that are prohibited by laws and regulations applicable to us, such as the Foreign Corrupt Practices Act. Although we maintain policies and procedures designed to facilitate compliance with these laws, a violation of such laws by any of our international representatives, consultants, joint ventures, business partners, subcontractors or suppliers, even if prohibited by our policies, could have an adverse effect on our business and reputation.
Natural disasters or other events outside of our control have disrupted and may in the future disrupt our operations, adversely affect our results of operations and financial condition, and may not be fully covered by insurance.
Natural disasters, including hurricanes, fires, tornados, floods and other forms of severe weather, the intensity and frequency of which are being exacerbated by climate change, along with other impacts of climate change, such as rising sea waters, as well as other events outside of our control including public health crises, pandemics, power outages and industrial accidents, have in the past and could in the future disrupt our operations and adversely affect our business. Any of these events could result in physical damage to and/or complete or partial closure of one or more of our facilities and temporary or long-term disruption of our operations or the operations of our suppliers by causing business interruptions or by impacting the availability and cost of materials needed for manufacturing or otherwise impacting our ability to deliver products and services to our customers. Existing insurance arrangements may not provide full protection for the costs that may arise from such events. The occurrence of any of
these events could materially increase our costs and expenses and have a material adverse effect on our business, financial condition and results of operations.
Financial Risks
If our Finance segment has difficulty collecting on its finance receivables, our financial performance could be adversely affected.
The financial performance of our Finance segment depends on the quality of loans, leases and other assets in its portfolio. Portfolio quality can be adversely affected by several factors, including finance receivable underwriting procedures, collateral value, geographic or industry concentrations, and the effect of general economic conditions. In addition, a substantial number of the originations in our finance receivable portfolio are cross-border transactions for aircraft sold outside of the U.S. Cross-border transactions present additional challenges and risks in the event of borrower default, which can result in difficulty or delay in collecting on the related finance receivables. If our Finance segment has difficulty successfully collecting on its finance receivable portfolio, our cash flow, results of operations and financial condition could be adversely affected.
We periodically need to obtain financing and such financing may not be available to us on satisfactory terms, if at all.
We periodically need to obtain financing in order to meet our debt obligations as they come due, to support our operations and/or to make acquisitions. Our access to the debt capital markets and the cost of borrowings are affected by a number of factors including market conditions and the strength of our credit ratings. If we cannot obtain adequate sources of credit on favorable terms, or at all, our business, operating results, and financial condition could be adversely affected.
Unanticipated changes in our tax rates or exposure to additional income tax liabilities could affect our profitability.
We are subject to income taxes in the U.S. and various non-U.S. jurisdictions, and our domestic and international tax liabilities are subject to the location of income among these different jurisdictions. Our effective tax rate could be adversely affected by changes in the mix of earnings in countries with differing statutory tax rates, changes in the valuation of deferred tax assets and liabilities, changes in the amount of earnings indefinitely reinvested offshore, changes to unrecognized tax benefits or changes in tax laws, which could affect our profitability. In particular, the carrying value of deferred tax assets is dependent on our ability to generate future taxable income, as well as changes to applicable statutory tax rates. In addition, the amount of income taxes we pay is subject to audits in various jurisdictions, and a material assessment by a tax authority could affect our profitability.
Risks Related to Regulatory, Legal and Other Matters
We are subject to increasing compliance risks that could adversely affect our operating results.
As a global business, we are subject to laws and regulations in the U.S. and other countries in which we operate. International sales and global operations require importing and exporting goods, software and technology, some of which have military applications subjecting them to more stringent import-export controls across international borders on a regular basis. For example, we sometimes initially must obtain licenses and authorizations from various U.S. Government agencies before we are permitted to sell certain of our aerospace and defense products outside the U.S., and we are not always successful in obtaining these licenses or authorizations in a timely manner. Both U.S. and foreign laws and regulations applicable to us have been increasing in scope and complexity. For example, both U.S. and foreign governments and government agencies regulate the aviation industry, and they have previously and may in the future impose new regulations for additional aircraft security or other requirements or restrictions. New or changing laws and regulations or related interpretation and policies could increase our costs of doing business, affect how we conduct our operations, adversely impact demand for our products, and/or limit our ability to sell our products and services. Compliance with laws and regulations of increasing scope and complexity is even more challenging in our business environment in which reducing our operating costs is often necessary to remain competitive. In addition, a violation of U.S. and/or foreign laws by one of our employees or business partners could subject us or our employees to civil or criminal penalties, including material monetary fines, or other adverse actions, such as denial of import or export privileges and/or debarment as a government contractor which could damage our reputation and have an adverse effect on our business.
Certain of our products are subject to laws regulating consumer products and could be subject to repurchase or recall as a result of safety issues.
As a distributor of consumer products in the U.S., certain of our products are subject to the Consumer Product Safety Act, which empowers the U.S. Consumer Product Safety Commission (CPSC) to exclude from the market products that are found to be unsafe or hazardous. Under certain circumstances, the CPSC has in the past and could require in the future us to repair, replace or refund the purchase price of one or more of our products, or potentially even discontinue entire product lines. We also may voluntarily take such action and, from time to time, have done so, but within strictures recommended by the CPSC. The CPSC also can impose fines or penalties on a manufacturer for non-compliance with its requirements. Furthermore, failure to timely notify the CPSC of a potential safety hazard can result in significant fines being assessed against us. Any repurchases or recalls of our products or an imposition of fines or penalties could be costly to us and could damage the reputation or the value of our brands. Additionally, laws regulating certain consumer products exist in some states, as well as in other countries in which we sell our products, and more restrictive laws and regulations could be adopted in the future.
Increased regulation and stakeholder expectations related to global climate change could negatively affect our operating results.
Increased worldwide public awareness and concern regarding global climate change has resulted and is likely to continue to result in more legislative and regulatory efforts, in the U.S., the European Union and in other jurisdictions in which we operate, in an effort to address the negative impacts of climate change. Recently enacted laws and regulations include, and future such laws and regulations may include, more prescriptive required reporting on environmental metrics, climate change related risks and associated financial and other impacts, as well as increased oversight of and reporting on our supply chain and other compliance requirements. We expect that compliance with such laws and regulations will require additional internal and external resources. Stricter limits on greenhouse gas emissions generated by our facilities or by our products that produce carbon emissions, carbon pricing mechanisms and/or energy taxes could also be imposed. Compliance with stricter limits may necessitate larger investment in product development and manufacturing equipment and/or facilities, as well as sourcing from new suppliers and/or higher costs from existing suppliers. These increased regulatory requirements are expected to increase our direct and indirect costs and could negatively impact our business, results of operations, financial condition and competitive position. Our failure to adequately comply with such laws and regulations could jeopardize our ability to receive contract awards from the U.S. government and other customers.
Moreover, our investors, customers, employees and other stakeholders increasingly expect us to reduce greenhouse gas emissions generated by our operations by implementing more efficient manufacturing technologies and increasing the amount of renewable energy used within our facilities. While we are engaged in efforts to transition to a lower carbon economy by reducing the emissions generated by our operations and increasing our use of renewable energy, these efforts take time and resources and may increase our energy acquisition and other costs and require capital investment. In addition, our stakeholders expect us to reduce greenhouse gas emissions from the use of our products, including by developing and incorporating sustainable technologies into our products. We expect that most of our businesses will require significant research and development investment to succeed in developing the new technologies and products that will enable us to significantly reduce such emissions from the use of our products and successfully compete in a lower carbon economy. We may not realize the anticipated benefits of our investments and actions for a variety of reasons, including technological challenges, evolving government and customer requirements and our ability to anticipate them and develop the desired technologies and products on a timely basis. Our competitors may develop these technologies and products before we do and they may be deemed by our customers to be superior to technologies and products we may develop, and they may otherwise gain industry acceptance in advance of, or instead of, our products. In addition, as we and our competitors develop increasingly sustainable technologies, demand for our existing offerings may decrease or become nonexistent.
We are subject to legal proceedings and other claims.
We are subject to legal proceedings and other claims arising out of the conduct of our business, including proceedings and claims relating to commercial and financial transactions; government contracts; alleged lack of compliance with applicable laws and regulations; disputes with suppliers, production partners or other third parties; product liability; patent and trademark infringement; employment disputes; and environmental, safety and health matters. Due to the nature of our manufacturing business, we are regularly subject to liability claims arising from accidents involving our products, including claims for serious personal injuries or death caused by weather or by pilot, driver or user error. In the case of litigation matters for which reserves have not been established because the loss is not deemed probable, it is reasonably possible that such claims could be decided against us and could require us to pay damages or make other expenditures in amounts that are not presently estimable. In addition, we cannot be certain that our reserves are adequate and that our insurance coverage will be sufficient to cover one or more substantial claims. Furthermore, we may not be able to obtain insurance coverage at acceptable levels and costs in the future. Litigation is inherently unpredictable, and we could incur judgments, receive adverse arbitration awards or enter into settlements for current or future claims that could adversely affect our results of operations in any particular period.
Intellectual property infringement claims of others and the inability to protect our intellectual property rights could harm our business and our customers.
Intellectual property infringement claims are, from time to time, asserted by third parties against us or our customers. Any related indemnification payments or legal costs we are obliged to pay on behalf of our businesses, our customers or other third parties can be costly. Infringement claims also have resulted in legal restrictions on our businesses engaging in sales of allegedly infringing products. If such a restriction were imposed upon a material product line, our business and results of operations could be adversely impacted. In addition, we own the rights to many patents, trademarks, brand names, trade names and trade secrets that are important to our business. Our inability to enforce these intellectual property rights could have an adverse effect on our results of operations. Additionally, our intellectual property could be at risk due to cybersecurity threats.
Risks Related to Human Capital
Our success is highly dependent on our ability to hire, train and retain a qualified workforce.
Our success is highly dependent upon our ability to hire, train and retain a workforce with the skills necessary for our businesses to develop and manufacture the products desired by our customers. We need highly skilled personnel in multiple areas including, among others, engineering, manufacturing, information technology, cybersecurity, flight operations, business development and strategy and management. Because many of our businesses experience cyclical market demand, they face challenges in maintaining their workforce at levels aligned with market demand which in the past has necessitated workforce reductions at some of our businesses as demand decreased. Conversely, our businesses sometimes need to increase the size of their workforce in order to keep pace with production needs due to increased customer demand. Furthermore, for our defense businesses the uncertainty of being awarded follow-on contracts and the related timing can also present difficulties in matching workforce size with contract needs. Such challenges in aligning the size of our businesses’ workforces with current or future business needs have resulted and may, in the future result in increased costs, production delays or other adverse impacts on our business and results of operations.
In addition, from time to time we face challenges that may impact employee retention, such as workforce reductions and facility consolidations and closures, and some of our most experienced employees are retirement-eligible which may adversely impact retention. To the extent that we lose experienced personnel through retirement or otherwise, it is critical for us to develop other employees, hire new qualified employees and successfully manage the transfer of critical knowledge. Competition for skilled employees is intense, and we may incur higher labor, recruiting and/or training costs in order to attract and retain employees with the requisite skills. We may not be successful in hiring or retaining such employees which could adversely impact our business and results of operations.
The increasing costs of certain employee and retiree benefits could adversely affect our results.
Our results of operations and cash flows may be adversely impacted by increasing costs and funding requirements related to our employee benefit plans. The obligation for our defined benefit pension plans is driven by, among other things, our assumptions of the expected long-term rate of return on plan assets and the discount rate used for future payment obligations. Additionally, as part of our annual evaluation of these plans, significant changes in our assumptions, due to changes in economic, legislative and/or demographic experience or circumstances, or changes in our actual investment returns could negatively impact the funded status of our plans requiring us to substantially increase our pension liability with a resulting decrease in shareholders’ equity. Also, changes in pension legislation and regulations could increase the cost associated with our defined benefit pension plans.
Our business could be adversely affected by strikes or work stoppages and other labor issues.
Approximately 7,400, or 28%, of our U.S. employees are represented by labor unions under various collective bargaining agreements with varying durations and expiration dates, and many of our non-U.S. employees are represented by organized councils. From time to time, our collective bargaining agreements expire and are subject to renegotiation at that time. We may not be able to negotiate successor collective bargaining agreements upon expiration without experiencing labor disputes, including strikes or work stoppages, or we may be unable to renegotiate such contracts on favorable terms. For example, on September 21, 2024, Textron Aviation’s largest union rejected a proposed new contract and engaged in a strike that had an adverse effect on Textron Aviation's ability to meet its production and delivery schedules, and negatively impacted revenues and segment profit in 2024. If we experience any extended interruption of operations at any of our facilities as a result of labor disputes, strikes or other work stoppages, our business, financial condition or results of operations could be adversely affected. In addition, the workforces of many of our suppliers and customers are represented by labor unions. Work stoppages or strikes at the plants of our key suppliers could disrupt our manufacturing processes; similar actions at the plants of our customers could result in delayed or canceled orders for our products. Any of these events could adversely affect our results of operations.
Item 1B. Unresolved Staff Comments
None.
Item 1C. Cybersecurity
Overview
Our centrally defined cybersecurity policies and processes are based on industry best practices and are revisited regularly to ensure their appropriateness based on risk, threats and current technological capabilities. We use a multi-layered approach to security with processes and tools aligned with the National Institute of Standards and Technology Cybersecurity Framework. We monitor compliance with these policies and processes through frequent internal audits and a set of robust metrics that assist in protection of our environment. As a U.S. defense contractor, we are required to comply with extensive regulations, including requirements imposed by the Defense Federal Acquisition Regulation Supplement related to adequately safeguarding controlled unclassified information (CUI) and reporting cybersecurity incidents to the U.S. Department of Defense (DoD). We will also be
required to achieve Cybersecurity Maturity Model Certification which will certify our compliance with the federally mandated CUI program.
We maintain Information Systems Incident Management Standards applicable to all our businesses that are intended to ensure information security events and weaknesses associated with information systems are communicated and acted on in a timely manner. Our disclosure controls and procedures address cybersecurity and include processes intended to ensure that security breaches are reported to appropriate personnel and, if warranted, analyzed for potential disclosure. While we have experienced cybersecurity attacks, such attacks to date have not materially affected the Company or our business strategy, results of operations, or financial condition. For more information regarding the risks we face from cybersecurity threats, see Item 1A. Risk Factors.
Governance
Board Oversight of Cybersecurity Matters
Oversight of information security matters is conducted by our full Board of Directors. The Board annually receives a comprehensive presentation on information security and controls from our Chief Information Officer (CIO) and, as may be necessary for specific topics, follow up occurs at additional meetings during the course of the year.
Management of Cybersecurity Risks
Textron Information Services is led by our CIO who has held positions of increasing responsibility within our corporate, Bell and Textron Systems IT organizations since 2008, including leading the IT organizations at both segments in maintaining compliance with the DoD information security requirements, as well as with our enterprise information security policies and standards. He previously led strategic IT projects and teams responsible for delivering global IT solutions for several large U.S. based companies.
Our corporate information security organization, led by our Chief Information Security Officer (CISO), who reports to our CIO, is responsible for our overall information security strategy, policy, security engineering, operations and cyber threat detection and response. Our CISO has more than 20 years of experience in the field of information security and holds multiple cybersecurity certifications including the designation of Certified Information Systems Security Professional.
Risk Management
Cybersecurity related risks have been identified as material business risks, and identifying, assessing and managing these risks is integrated into our Enterprise Risk Management (ERM) process, which is designed to identify, assess and guide in managing material risks throughout Textron at both the business segment and enterprise levels. We maintain cyber risk/network protection mitigation plans through our ERM process to assist in management of these risks. Our full Board oversees our ERM process through discussions at our Board of Directors’ Annual Strategic Business and Risk Review and at an annual dedicated ERM Review. In addition, high risk areas, including cybersecurity matters, are reviewed and discussed with the full Board or other Board Committees, as appropriate. The Audit Committee, as reflected in its charter, has been designated to assist the Board in its oversight of our ERM process, including with respect to cybersecurity risk.
We maintain a detailed Cybersecurity Incident Response Plan that guides our incident response process. Upon the occurrence of a cybersecurity event, the cyber incident response team will follow a predefined process, documenting each step taken, to analyze and validate the event, and, if a cybersecurity incident is suspected to have occurred, quickly perform an initial analysis to determine the incident’s scope. The team will prioritize the response to each incident based on its estimate of the business impact caused by the incident and the estimated efforts required to recover from the incident. Notification of the incident is made to various stakeholders, including senior management and, if appropriate based upon the incident severity assessment, our Board. The team will also conduct incident containment, eradication and recovery, and post incident activity.
Strategy
Our Security Culture
We protect our information assets and manage risk by promoting a culture that communicates security risks, designs secure IT systems and operates according to approved processes to reduce the likelihood and impact of security incidents. We achieve this objective by:
•Designing, implementing and maintaining solutions with appropriate security controls.
•Sustaining solutions with required patching and vulnerability remediation.
•Creating and executing controls in support of policy as well as regulatory compliance.
•Ensuring that our policies, processes, practices and technologies proactively protect, shield, defend and remediate cyber threats.
•Delivering quality communications and annual training to stakeholders on cyber awareness and computing hygiene.
We believe that the conduct of our employees is critical to the success of our information security. Through our security awareness program, we keep our employees apprised of threats, risks and the part that they play in protecting both themselves and the company. We conduct periodic compliance training for our employees regarding the protection of sensitive information, which includes mandatory annual cyber safety training for all users with access to our computer network intended to reduce the likelihood of success of cyberattacks which target our employees. We also conduct regular phishing simulations to increase employee awareness on how to spot phishing attempts, and what to do if they suspect an email to be a phishing attack.
We execute penetration testing against our technical environment and processes, and continuously monitor our network and systems for signs of intrusion. We also retain consultants to enhance our penetration testing program with current trends and methodologies utilized against other companies, ensuring we are proactively reducing risk from emerging threats. In addition, we conduct tabletop exercises to prepare for responding to potential cybersecurity events.
We have a rigorous process, including a formal IT risk assessment, to assess our service providers prior to allowing our information to be processed, stored or transmitted by third parties, and we include standardized contractual requirements in each contract where appropriate. We validate our service providers’ security via questionnaires, open-source intelligence and, where appropriate, SOC1 reports on financially significant third-party service providers. Our process also includes regular monitoring of risk related to third parties on a periodic basis or when services or product purchases expand beyond their original scope or intended use.
Protections against insider threat is a critical component of our security strategy, particularly within our defense business units. Our insider threat detection processes are designed to identify and evaluate potential insider threats so that appropriate mitigation can be implemented.
Collaboration with our industry partners and government customers contributes to the protection of Textron’s computing environment as well as our military stakeholders. Textron is engaged with various industry groups such as Aerospace Industries Association, National Defense Information Sharing & Analysis Center and our Defense Industrial Base colleagues to ensure that we are aware of and are addressing the latest adversarial threats. Additionally, we share cyber best practices with industry peers to help to make the industry more secure.
Item 2. Properties
On December 28, 2024, we operated a total of 56 plants located throughout the U.S. and 44 plants outside the U.S. We own 60 plants and lease the remainder for a total manufacturing space of approximately 23.6 million square feet. We consider the productive capacity of the plants operated by each of our business segments to be adequate. We also own or lease offices, warehouses, training and service centers and other space at various locations. In general, our facilities are in good condition, are considered to be adequate for the uses to which they are being put and are substantially in regular use.
Item 3. Legal Proceedings
We are subject to actual and threatened legal proceedings and other claims arising out of the conduct of our business, including proceedings and claims relating to commercial and financial transactions; government contracts; alleged lack of compliance with applicable laws and regulations; disputes with suppliers, production partners or other third parties; product liability; patent and trademark infringement; employment disputes; and environmental, health and safety matters. Some of these legal proceedings and claims seek damages, fines or penalties in substantial amounts or remediation of environmental contamination. As a government contractor, we are subject to audits, reviews and investigations to determine whether our operations are being conducted in accordance with applicable regulatory requirements. Under federal government procurement regulations, certain claims brought by the U.S. Government could result in our suspension or debarment from U.S. Government contracting for a period of time. On the basis of information presently available, we do not believe that existing proceedings and claims will have a material effect on our financial position or results of operations.
Item 4. Mine Safety Disclosures
Not applicable.
PART II
Item 5. Market for Registrant’s Common Equity, Related Stockholder Matters and Issuer Purchases of Equity Securities
The principal market on which our common stock is traded is the New York Stock Exchange under the symbol "TXT." At December 28, 2024, there were approximately 4,800 record holders of Textron common stock.
Issuer Repurchases of Equity Securities
The following provides information about our fourth quarter 2024 repurchases of equity securities that are registered pursuant to Section 12 of the Securities Exchange Act of 1934, as amended:
| | | | | | | | | | | | | | |
Period (shares in thousands) | Total
Number of
Shares
Purchased * | Average Price
Paid per Share
(excluding
commissions) | Total Number of
Shares Purchased as
part of Publicly
Announced Plan * | Maximum
Number of Shares
that may yet be
Purchased under
the Plan |
| September 29, 2024 – November 2, 2024 | 500 | | $ | 82.32 | | 500 | | 17,881 | |
| November 3, 2024 – November 30, 2024 | 1,475 | | 84.88 | | 1,475 | | 16,406 | |
| December 1, 2024 – December 28, 2024 | 820 | | 80.60 | | 820 | | 15,586 | |
| Total | 2,795 | | $ | 83.17 | | 2,795 | | |
* These shares were purchased pursuant to a plan authorizing the repurchases of up to 35 million shares of Textron common stock that was approved on July 24, 2023 by our Board of Directors. This share repurchase program has no expiration date.
Stock Performance Graph
The following graph compares the total return on a cumulative basis at the end of each year of $100 invested in our common stock on December 31, 2019 with the Standard & Poor’s (S&P) 500 Stock Index, the S&P 500 Aerospace & Defense (A&D) Index and the S&P 500 Industrials Index, all of which include Textron. The values calculated assume dividend reinvestment.
| | | | | | | | | | | | | | | | | | | | |
| 2019 | 2020 | 2021 | 2022 | 2023 | 2024 |
| Textron Inc. | $ | 100.00 | | $ | 108.62 | | $ | 173.72 | | $ | 159.50 | | $ | 181.37 | | $ | 174.29 | |
| S&P 500 | 100.00 | | 118.40 | | 152.39 | | 124.79 | | 157.59 | | 199.99 | |
| S&P 500 A&D | 100.00 | | 83.94 | | 95.03 | | 111.54 | | 119.09 | | 138.18 | |
| S&P 500 Industrials | 100.00 | | 111.06 | | 134.52 | | 127.15 | | 150.20 | | 178.38 | |
Item 6. [Reserved]
Item 7. Management’s Discussion and Analysis of Financial Condition and Results of Operations
Overview
In 2024, our operating results were adversely impacted by a strike at the Textron Aviation segment. On September 21, 2024, the International Association of Machinists and Aerospace Workers (IAM) District 70, Local Lodge 774 called a strike against Textron Aviation. On October 20, 2024, an agreement was reached on a new five-year labor contract. As a result, our revenues and profit were unfavorably impacted in the second half of 2024 due to delayed aircraft deliveries and manufacturing inefficiencies associated with the labor disruption and the recovery of operating activities. At the Industrial segment, we experienced lower revenues and profit in 2024, largely resulting from a decline in demand in our end markets for Textron Specialized Vehicles products. We are in the process of conducting a strategic review of our powersports product line, as discussed in Note 15 to the Consolidated Financial Statements on page 62. At our Bell segment, the ramp up of the FLRAA program contributed to a 14% growth in its revenues for the year. In August, the U.S. Army announced approval of Milestone B for the FLRAA program, establishing it as a program of record and transitioning it to the Engineering and Manufacturing Development phase. In the second half of the year, Bell was awarded contracts totaling approximately $3.0 billion for this phase of the program that contributed to a total company backlog increase of $4.0 billion, 29%, to $17.9 billion at the end of 2024. This backlog increase included growth of $676 million at the Textron Aviation segment, reflecting steady customer demand supported by new products, and $644 million at the Textron Systems segment, which included new contract awards for the Ship-to-Shore Connector program.
Financial highlights for 2024 also include:
•Generated $1.0 billion of net cash from operating activities from our manufacturing businesses.
•Invested $491 million in research and development projects and $364 million in capital expenditures.
•Returned $1.1 billion to our shareholders through the repurchase of 12.9 million shares of our common stock.
For an overview of our business segments, including a discussion of our major products and services, refer to Item 1. Business. A discussion of our financial condition and operating results for 2024 compared with 2023 is provided below, while a discussion of 2023 compared with 2022 can be found in Item 7. Management’s Discussion and Analysis of Financial Condition and Results of Operations of our Annual Report on Form 10-K for the year ended December 30, 2023.
In November 2023, the Financial Accounting Standards Board issued Accounting Standard Update (ASU) No. 2023-07, Segment Reporting (Topic 280): Improvements to Reportable Segment Disclosures, which requires a public entity to disclose, on an annual and interim basis, significant segment expenses and other segment items that are regularly provided to the Chief Operating Decision Maker. The new standard is effective for fiscal years beginning after December 15, 2023. We adopted ASU 2023-07 in the fourth quarter of 2024 and have recast management’s discussion and analysis of the results of operations of our company to include a discussion of the additional expense categories. In connection with the adoption of this standard, research and development costs previously included within Cost of products sold are now reported on a separate line in our Consolidated Statements of Operations. Prior period amounts have been recast to conform to the new presentation.
The following discussion should be read in conjunction with our Consolidated Financial Statements and related Notes included in Item 8. Financial Statements and Supplementary Data.
Consolidated Results of Operations
| | | | | | | | | | | | | | | | | |
| | | | % Change |
| (Dollars in millions) | 2024 | 2023 | 2022 | 2024 | 2023 |
| Revenues | $ | 13,702 | $ | 13,683 | $ | 12,869 | —% | 6% |
| Cost of sales | 11,200 | 10,835 | 10,199 | 3% | 6% |
| Gross margin as a percentage of Manufacturing revenues | 18.0% | 20.5% | 20.4% | | |
| Research and development costs | 491 | 570 | 601 | (14)% | (5)% |
| Selling and administrative expense | 1,156 | 1,225 | 1,186 | (6)% | 3% |
| Interest expense, net | 97 | 77 | 107 | 26% | (28)% |
| Special charges | 78 | 126 | — | (38)% | 100% |
| Non-service components of pension and postretirement income, net | 263 | 237 | 240 | 11% | (1)% |
| | | | | |
Revenues
Revenues increased $19 million in 2024, compared with 2023, largely due to the following factors:
•Higher Bell revenues of $432 million, largely reflecting higher military aircraft and support revenues of $347 million, primarily due to higher volume on the FLRAA program, partially offset by lower volume on the V-22 program.
•Lower Industrial revenues of $326 million, due to lower revenues of $263 million at Textron Specialized Vehicles, principally in the powersports and personal transportation vehicles product lines due to reduced demand in their end markets, and lower revenues of $63 million at Kautex.
•Lower Textron Aviation revenues of $89 million, reflecting lower volume and mix of $270 million, principally a result of the strike discussed in the Segment Analysis section below, partially offset by higher pricing of $181 million in both the aircraft and aftermarket parts and services product lines.
Cost of Sales
Cost of sales includes cost of products and services sold for the Manufacturing group. In 2024, cost of sales increased $365 million, 3%, compared with 2023. The increase in cost was largely due to a $299 million impact from inflation and higher LIFO inventory provision and a $38 million inventory valuation charge to write down inventory to its net realizable value at Textron Specialized Vehicles as discussed in Note 15 to the Consolidated Financial Statements on page 62.
Consolidated gross margin as a percentage of Manufacturing revenues decreased 250 basis points in 2024, compared with 2023, primarily due to lower gross margin at the Bell segment, largely due to the mix of contracts discussed above, and at the Textron Aviation segment, reflecting the mix of aircraft sold and manufacturing inefficiencies, largely due to the strike. In addition, higher LIFO inventory provision and the inventory valuation charge noted above accounted for 80 basis points of the decrease.
Research and Development Costs
Research and development costs decreased $79 million, 14%, in 2024, compared with 2023, largely reflecting the winddown of the Future Attack Reconnaissance Aircraft Program at the Bell segment, partially offset by a $17 million increase at the Textron eAviation segment, largely due to development efforts on hybrid and electric propulsion aircraft.
Selling and Administrative Expense
Selling and administrative expense decreased $69 million, 6%, in 2024, compared with 2023, primarily reflecting lower compensation expense, which included lower shared-based and incentive compensation and savings from restructuring activities.
Interest Expense, Net
Interest expense, net includes interest expense for both the Finance and Manufacturing borrowing groups, with interest on intercompany borrowings eliminated, and interest income earned on cash and equivalents for the Manufacturing borrowing group. In 2024, interest expense, net increased $20 million, 26%, compared with 2023, primarily due to an increase in the weighted-average interest rate of our debt and $7 million in lower interest income. For 2024, 2023 and 2022, gross interest expense totaled $146 million, $133 million and $129 million, respectively.
Special Charges
Special charges of $78 million and $126 million in 2024 and 2023, respectively, include restructuring activities and asset impairment charges as described in Note 15 to the Consolidated Financial Statements on page 62. Non-service Components of Pension and Postretirement Income, Net
Non-service components of pension and postretirement income, net increased by $26 million, 11%, in 2024, compared with 2023. The increase is based on our annual valuation at the end of 2023 and is primarily driven by the impact of actual pension asset returns that exceeded our expected return on plan assets.
Income Taxes
| | | | | | | | | | | |
| 2024 | 2023 | 2022 |
| Effective tax rate | 12.5% | 15.2% | 15.2% |
In 2024, the effective tax rate of 12.5% was lower than the U.S. federal statutory tax rate of 21%, largely due to the favorable impact of research and development credits and the effective settlement of certain tax positions in the fourth quarter of 2024, which is discussed in Note 16 to the Consolidated Financial Statements on page 63. In 2023, the effective tax rate of 15.2% was lower than the U.S. federal statutory tax rate of 21%, largely due to the favorable impact of research and development credits and tax deductions for foreign-derived intangible income. For a full reconciliation of our effective tax rate to the U.S. federal statutory tax rate, see Note 16 to the Consolidated Financial Statements on page 63.
Segment Analysis
We operate in, and report financial information for, the following six operating segments: Textron Aviation, Bell, Textron Systems, Industrial, Textron eAviation and Finance. Segment profit is an important measure used for evaluating performance and for decision-making purposes. Segment profit for the manufacturing segments excludes the non-service components of pension and postretirement income, net; LIFO inventory provision; intangible asset amortization; interest expense, net for Manufacturing group; certain corporate expenses; gains/losses on major business dispositions; special charges and the inventory valuation charge to write down production-related powersports inventory. The operating costs used to derive segment profit for our manufacturing segments includes cost of sales, research and development costs and selling and administrative expense. The cost of sales discussed in this Segment Analysis section excludes the LIFO inventory provision, intangible asset amortization and the inventory valuation charge discussed above that are reported within Cost of products sold or Cost of services sold on the Consolidated Statement of Operations. The measurement for the Finance segment includes interest income and expense along with intercompany interest income and expense.
In our discussion of comparative results for the Manufacturing group, material changes in revenues and segment profit for our commercial businesses typically are expressed in terms of product line revenues, including volume and mix and pricing; foreign exchange; acquisitions and dispositions; inflation; manufacturing efficiency; and changes in research and development costs and selling and administrative expense. For revenues, volume and mix represents changes in revenues from increases or decreases in the number of units delivered or services provided and the composition of products and/or services sold. For segment profit, volume and mix represents a change due to the number of units delivered or services provided and the composition of products and/or services sold at different profit margins. Pricing represents changes in unit pricing. Foreign exchange is the change resulting from translating foreign-denominated amounts into U.S. dollars at exchange rates that are different from the prior period. Revenues generated by acquired businesses are reflected in Acquisitions for a twelve-month period, while reductions in revenues and segment profit from the sale of businesses are reflected as Dispositions. Inflation represents higher material, wages, benefits, pension service cost or other costs. Manufacturing efficiency includes changes in material, labor and overhead variances to standards, typically due to scrap rates, labor efficiency or inefficiencies, facility usage and other manufacturing productivity inputs.
Approximately 25% of our 2024 revenues were derived from contracts with the U.S. Government, including those under the U.S. Government-sponsored foreign military sales program. For our segments that contract with the U.S. Government, material changes in revenues related to these contracts are expressed in terms of volume. Changes in segment profit for these contracts are typically expressed in terms of volume and mix and contract performance, which includes cumulative catch-up adjustments associated with a) revisions to the transaction price that may reflect contract modifications or changes in assumptions related to award fees and other variable consideration or b) changes in the total estimated costs at completion due to improved or deteriorated operating performance.
Textron Aviation
| | | | | | | | | | | | | | | | | |
| | | | % Change |
| (Dollars in millions) | 2024 | 2023 | 2022 | 2024 | 2023 |
| Revenues: | | | | | |
| Aircraft | $ | 3,374 | $ | 3,577 | $ | 3,387 | (6)% | 6% |
| Aftermarket parts and services | 1,910 | 1,796 | 1,686 | 6% | 7% |
| Total revenues | 5,284 | 5,373 | 5,073 | (2)% | 6% |
| Cost of sales | 4,102 | 4,116 | 3,905 | —% | 5% |
| Research and development costs | 208 | 199 | 191 | 5% | 4% |
| Selling and administrative expense | 408 | 409 | 417 | —% | (2)% |
| Segment profit | $ | 566 | $ | 649 | $ | 560 | (13)% | 16% |
| Profit margin | 10.7% | 12.1% | 11.0% | | |
| Backlog | $ | 7,845 | $ | 7,169 | $ | 6,387 | 9% | 12% |
Textron Aviation’s revenues decreased $89 million, 2%, in 2024, compared with 2023, reflecting lower volume and mix of $270 million, which was principally a result of the strike discussed below, partially offset by higher pricing of $181 million. Aircraft revenues decreased $203 million, 6%, due to lower volume and mix, largely from Citation jet and commercial turboprop deliveries, partially offset by higher pricing. We delivered 151 Citation jets and 127 commercial turboprops in 2024, compared with 168 Citation jets and 153 commercial turboprops in 2023. Aftermarket parts and services revenues increased $114 million, 6%, due to higher pricing and volume.
On September 21, 2024, the IAM District 70, Local Lodge 774 called a strike against Textron Aviation. The strike impacted approximately 5,000 of Textron Aviation’s employees at the manufacturing, parts and distribution and service center facilities in Wichita. On October 20, 2024, Textron Aviation and the IAM reached an agreement on a new five-year labor contract. The strike had a significant adverse impact on Textron Aviation’s ability to meet its production and delivery schedules in the third quarter and continuing into the fourth quarter of 2024. As a result, our revenues and profit were unfavorably impacted in the second half of 2024 by delayed aircraft deliveries and manufacturing inefficiencies associated with the labor disruption and the recovery of operating activities.
Textron Aviation’s cost of sales decreased $14 million in 2024, compared with 2023. The impact of lower volume and mix on our cost of sales was offset by $127 million of inflation and $43 million in manufacturing inefficiencies, largely reflecting idle facilities costs resulting from the strike discussed above.
Textron Aviation’s segment profit decreased $83 million, 13%, in 2024, compared with 2023, primarily due to lower volume and mix and the manufacturing inefficiencies discussed above, partially offset by higher pricing, net of inflation.
Textron Aviation’s backlog increased $676 million, 9%, in 2024, reflecting orders in excess of deliveries.
Bell
| | | | | | | | | | | | | | | | | |
| | | | % Change |
| (Dollars in millions) | 2024 | 2023 | 2022 | 2024 | 2023 |
| Revenues: | | | | | |
| Military aircraft and support programs | $ | 2,048 | $ | 1,701 | $ | 1,740 | 20% | (2)% |
| Commercial helicopters, parts and services | 1,531 | 1,446 | 1,351 | 6% | 7% |
| Total revenues | 3,579 | 3,147 | 3,091 | 14% | 2% |
| Cost of sales | 2,899 | 2,392 | 2,316 | 21% | 3% |
| Research and development costs | 97 | 192 | 266 | (49)% | (28)% |
| Selling and administrative expense | 213 | 243 | 227 | (12)% | 7% |
| | | | | |
| Segment profit | $ | 370 | $ | 320 | $ | 282 | 16% | 13% |
| Profit margin | 10.3% | 10.2% | 9.1% | | |
| Backlog | $ | 7,469 | $ | 4,780 | $ | 4,781 | 56% | —% |
Bell’s military aircraft and support programs include a development contract for the U.S. Army's FLRAA program, as well as production, upgrade, and support contracts for the V-22 tiltrotor aircraft and H-1 helicopters. The FLRAA program represents an increasing portion of Bell’s revenues as development activities have ramped. In August 2024, the U.S. Army announced approval of Milestone B for the FLRAA program, establishing it as a program of record and transitioning it to the Engineering and Manufacturing Development phase. In the second half of 2024, Bell was awarded contracts totaling approximately $3.0 billion for this phase of the program.
Bell’s military and support programs revenues increased $347 million, 20%, in 2024, compared with 2023, primarily due to higher volume on the FLRAA program, partially offset by lower volume on the V-22 program. Commercial helicopters, parts and services increased $85 million, 6%. We delivered 172 commercial helicopters in 2024, compared with 171 commercial helicopters in 2023.
Bell's cost of sales increased $507 million, 21%, in 2024, compared with 2023, primarily due to the higher volume and mix discussed above.
Bell's research and development costs decreased $95 million, 49%, in 2024, compared with 2023, largely due to the winddown of the Future Attack Reconnaissance Aircraft Program.
Selling and administrative expense decreased at Bell by $30 million, 12%, in 2024, compared with 2023, primarily due to a gain on a legal settlement recorded in the first quarter of 2024 and lower bid and proposal costs.
Bell’s segment profit increased $50 million, 16%, in 2024, compared with 2023, primarily due to lower research and development costs, as described above, partially offset by an unfavorable impact from mix as volume increased on lower margin FLRAA development activities while volume decreased on higher margin V-22 program revenues.
Backlog increased $2.7 billion, 56%, at Bell due to orders in excess of revenues recognized and deliveries, largely related to the FLRAA program discussed above.
Textron Systems
| | | | | | | | | | | | | | | | | |
| | | | % Change |
| (Dollars in millions) | 2024 | 2023 | 2022 | 2024 | 2023 |
| Revenues | $ | 1,241 | $ | 1,235 | $ | 1,172 | —% | 5% |
| Cost of sales | 929 | 925 | 878 | —% | 5% |
| Research and development costs | 51 | 53 | 53 | (4)% | —% |
| Selling and administrative expense | 107 | 110 | 109 | (3)% | 1% |
| | | | | |
| Segment profit | $ | 154 | $ | 147 | $ | 132 | 5% | 11% |
| Profit margin | 12.4% | 11.9% | 11.3% | | |
| Backlog | $ | 2,594 | $ | 1,950 | $ | 2,098 | 33% | (7)% |
Textron Systems revenues and segment profit increased $6 million and $7 million, respectively, in 2024, compared with 2023. The impact on volume related to the cancellation of the Shadow program in the first quarter of 2024 was largely offset by higher volume on the Ship-to-Shore Connector program.
Textron Systems’ backlog increased $644 million, 33%, in 2024, compared with 2023, reflecting orders in excess of revenues recognized and deliveries, which included new contract awards for the Ship-to-Shore Connector program.
Industrial | | | | | | | | | | | | | | | | | |
| | | | % Change |
| (Dollars in millions) | 2024 | 2023 | 2022 | 2024 | 2023 |
| Revenues: | | | | | |
| Kautex | $ | 1,891 | $ | 1,954 | $ | 1,771 | (3)% | 10% |
| Textron Specialized Vehicles | 1,624 | 1,887 | 1,694 | (14)% | 11% |
| Total revenues | 3,515 | 3,841 | 3,465 | (8)% | 11% |
| Cost of sales | 2,993 | 3,221 | 2,959 | (7)% | 9% |
| Research and development costs | 72 | 80 | 71 | (10)% | 13% |
| Selling and administrative expense | 299 | 312 | 280 | (4)% | 11% |
| | | | | |
| Segment profit | $ | 151 | $ | 228 | $ | 155 | (34)% | 47% |
| Profit margin | 4.3% | 5.9% | 4.5% | | |
Industrial segment revenues decreased $326 million, 8%, in 2024, compared with 2023, largely due to lower volume and mix. Textron Specialized Vehicles' revenues decreased $263 million, 14%, reflecting lower volume, principally in the powersports and personal transportation vehicles products due to reduced demand in their end markets. Kautex revenues decreased $63 million, 3%, largely due to lower volume.
Industrial's cost of sales decreased $228 million, 7%, in 2024 compared with 2023, primarily reflecting the impact of lower volume and mix.
Segment profit for the Industrial segment decreased $77 million, 34%, in 2024, compared with 2023, largely due to a $105 million impact from lower volume and mix, partially offset by $22 million in manufacturing efficiencies and $21 million in lower selling and administrative expense and research and development costs, largely due to cost reduction activities.
Textron eAviation
| | | | | | | | | | | | | | | | | |
| | | | % Change |
| (Dollars in millions) | 2024 | 2023 | 2022 | 2024 | 2023 |
| Revenues | $ | 33 | | $ | 32 | | $ | 16 | | 3% | 100% |
| Cost of sales | 29 | | 35 | | 18 | | (17)% | 94% |
| Research and development costs | 63 | | 46 | | 20 | | 37% | 130% |
| Selling and administrative expense | 17 | | 14 | | 2 | | 21% | 600% |
| | | | | |
| Segment loss | $ | (76) | $ | (63) | $ | (24) | 21% | 163% |
| | | | | |
Textron eAviation segment revenues increased $1 million, 3%, in 2024, compared with 2023. Research and development costs increased $17 million, 37%, largely due to the ramp up of development efforts on hybrid and electric propulsion aircraft. Segment loss increased $13 million in 2024, compared with 2023, primarily reflecting the higher research and development costs.
Finance
| | | | | | | | | | | |
| (In millions) | 2024 | 2023 | 2022 |
| Revenues | $ | 50 | | $ | 55 | | $ | 52 | |
| Selling and administrative expense | (4) | | (6) | | 8 | |
| Interest expense, net | 19 | | 15 | | 13 | |
| Segment profit | $ | 35 | | $ | 46 | | $ | 31 | |
Finance segment revenues decreased $5 million and segment profit decreased $11 million in 2024, compared with 2023. Selling and administrative expense included recoveries of $10 million and $18 million in 2024 and 2023, respectively. The decrease in segment profit was primarily due to $8 million in lower recoveries of credit losses.
Liquidity and Capital Resources
Our financings are conducted through two separate borrowing groups. The Manufacturing group consists of Textron consolidated with its majority-owned subsidiaries that operate in the Textron Aviation, Bell, Textron Systems, Industrial and Textron eAviation segments. The Finance group, which also is the Finance segment, consists of Textron Financial Corporation and its consolidated subsidiaries. We designed this framework to enhance our borrowing power by separating the Finance group. Our Manufacturing group operations include the development, production and delivery of tangible products and services, while our Finance group provides financial services. Due to the fundamental differences between each borrowing group’s activities, investors, rating agencies and analysts use different measures to evaluate each group’s performance. To support those evaluations, we present balance sheet and cash flow information for each borrowing group within the Consolidated Financial Statements.
Assessment of Liquidity and Significant Future Cash Requirements
Key information that is utilized in assessing our liquidity is summarized below:
| | | | | | | | |
| (Dollars in millions) | December 28,
2024 | December 30,
2023 |
| Manufacturing group | | |
| Cash and equivalents | $ | 1,386 | $ | 2,121 |
| Debt | 3,247 | 3,526 |
| Shareholders’ equity | 7,204 | 6,987 |
| Capital (debt plus shareholders’ equity) | 10,451 | 10,513 |
| Net debt (net of cash and equivalents) to capital | 21% | 17% |
| Debt to capital | 31% | 34% |
| Finance group | | |
| Cash and equivalents | $ | 55 | $ | 60 |
| Debt | 341 | 348 |
We believe that our calculations of debt to capital and net debt to capital are useful measures as they provide a summary indication of the level of debt financing (i.e., leverage) that is in place to support our capital structure, as well as to provide an indication of our capacity to add further leverage.
We expect to have sufficient cash to meet our needs based on our existing cash balances, the cash we expect to generate from our manufacturing operations and the availability of our existing credit facility. In addition to our manufacturing operating cash requirements, future material cash outlays include our contractual combined debt and interest payments for the Manufacturing group of $473 million in 2025, $457 million in 2026, $444 million in 2027 and $2.5 billion thereafter, and for the Finance group of $46 million in 2025, $20 million in 2026, $69 million in 2027 and $507 million thereafter.
For the Manufacturing group, we also have purchase obligations that require material future cash outlays totaling $2.7 billion in 2025, $501 million in 2026 and $355 million thereafter. Purchase obligations include undiscounted amounts committed under contracts or purchase orders for goods and services with defined terms as to price, quantity and delivery dates, as well as property, plant and equipment. Approximately 28% of our purchase obligations represent purchase orders issued for goods and services to be delivered under firm contracts with the U.S. Government for which we have full recourse under customary contract termination clauses.
Credit Facilities and Other Sources of Capital
Textron has a senior unsecured revolving credit facility for an aggregate principal amount of $1.0 billion, of which $100 million is available for the issuance of letters of credit. We may elect to increase the aggregate amount of commitments under the facility to up to $1.3 billion by designating an additional lender or by an existing lender agreeing to increase its commitment. The facility expires in October 2027 and provides for two one-year extensions at our option with the consent of lenders representing a majority of the commitments under the facility. At December 28, 2024 and December 30, 2023, there were no amounts borrowed against the facility and there were $9 million of outstanding letters of credit issued under the facility.
We also maintain an effective shelf registration statement filed with the Securities and Exchange Commission that allows us to issue an unlimited amount of public debt and other securities. On March 1, 2024, we repaid our $350 million 4.30% Notes due March 2024.
Manufacturing Group Cash Flows
Cash flows from continuing operations for the Manufacturing group as presented in our Consolidated Statements of Cash Flows are summarized below:
| | | | | | | | | | | |
| (In millions) | 2024 | 2023 | 2022 |
| Operating activities | $ | 1,008 | | $ | 1,270 | | $ | 1,461 | |
| Investing activities | (288) | | (345) | | (511) | |
| Financing activities | (1,438) | | (776) | | (875) | |
Cash flows from operating activities were $1.0 billion in 2024, compared with $1.3 billion in 2023. The $262 million decrease in cash flows was largely due to changes in working capital and lower earnings, partially offset by $157 million in lower net tax payments. Net income tax payments were $181 million and $338 million in 2024 and 2023, respectively. Pension contributions were $44 million and $45 million in 2024 and 2023, respectively.
In 2024 and 2023, investing cash flows included capital expenditures of $364 million and $402 million, respectively, partially offset by net proceeds from corporate-owned life insurance policies of $85 million and $40 million, respectively.
Cash flows used by financing activities in 2024 included $1.1 billion of cash paid to repurchase an aggregate of 12.9 million shares of our common stock under the 2023 share repurchase plan described below and payments on long-term debt of $361 million. In 2023, cash flows used by financing activities included $1.2 billion of cash paid to repurchase an aggregate of 16.2 million shares of our common stock, partially offset by $348 million of net proceeds from the issuance of long-term debt.
In July 2023, Textron's Board of Directors approved a program for the repurchase of up to 35 million shares of our common stock. This share repurchase program allows us to continue our practice of repurchasing shares to offset the impact of dilution from stock-based compensation and benefit plans and for opportunistic capital management purposes. The repurchase program has no expiration date and there were 15.6 million shares remaining under the program at December 28, 2024.
Dividend payments to shareholders totaled $12 million and $16 million in 2024 and 2023, respectively. Due to the timing of our fiscal year-end, we made three dividend payments in 2024, compared with four dividend payments in 2023.
Finance Group Cash Flows
The cash flows from continuing operations for the Finance group as presented in our Consolidated Statements of Cash Flows are summarized below:
| | | | | | | | | | | |
| (In millions) | 2024 | 2023 | 2022 |
| Operating activities | $ | 8 | | $ | 14 | | $ | (7) | |
| Investing activities | 3 | | 11 | | 100 | |
| Financing activities | (16) | | (37) | | (216) | |
The Finance group’s cash flows from investing activities primarily included collections on finance receivables totaling $133 million and $169 million in 2024 and 2023, respectively, partially offset by finance receivable originations of $130 million and $160 million, respectively. Cash flows used in financing activities included payments on long-term and nonrecourse debt of $16 million and $37 million in 2024 and 2023, respectively.
Consolidated Cash Flows
The consolidated cash flows from continuing operations, after elimination of activity between the borrowing groups, are summarized below:
| | | | | | | | | | | |
| (In millions) | 2024 | 2023 | 2022 |
| Operating activities | $ | 1,015 | | $ | 1,267 | | $ | 1,490 | |
| Investing activities | (284) | | (317) | | (447) | |
| Financing activities | (1,454) | | (813) | | (1,091) | |
Consolidated cash flows from operating activities were $1.0 billion in 2024, compared with $1.3 billion in 2023. The decrease of $252 million in cash flows was largely due to changes in working capital and lower earnings, partially offset by $161 million in lower net tax payments. Net income tax payments were $191 million and $352 million in 2024 and 2023, respectively. Pension contributions were $44 million and $45 million in 2024 and 2023, respectively.
In 2024 and 2023, investing cash flows included capital expenditures of $364 million and $402 million, respectively, partially offset by net proceeds from corporate-owned life insurance policies of $85 million and $40 million, respectively.
Cash flows used by financing activities in 2024 included $1.1 billion of share repurchases and payments on long-term debt of $377 million. In 2023, cash flows used by financing activities included $1.2 billion of share repurchases, partially offset by $348 million of net proceeds from the issuance of long-term debt.
Captive Financing and Other Intercompany Transactions
The Finance group provides financing primarily to purchasers of new and pre-owned Textron Aviation aircraft and Bell helicopters manufactured by our Manufacturing group, otherwise known as captive financing. In the Consolidated Statements of Cash Flows, cash received from customers is reflected as operating activities when received from third parties. However, in the cash flow information provided for the separate borrowing groups, cash flows related to captive financing activities are reflected based on the operations of each group. For example, when product is sold by our Manufacturing group to a customer and is financed by the Finance group, the origination of the finance receivable is recorded within investing activities as a cash outflow in the Finance group’s statement of cash flows. Meanwhile, in the Manufacturing group’s statement of cash flows, the cash received from the Finance group on the customer’s behalf is recorded within operating cash flows as a cash inflow. Although cash is transferred between the two borrowing groups, there is no cash transaction reported in the consolidated cash flows at the time of the original financing. These captive financing activities, along with all significant intercompany transactions, are reclassified or eliminated from the Consolidated Statements of Cash Flows.
Reclassification adjustments included in the Consolidated Statements of Cash Flows on page 36 are summarized below: | | | | | | | | | | | |
| (In millions) | 2024 | 2023 | 2022 |
| Reclassification adjustments from investing activities to operating activities: | | | |
| Finance receivable originations for Manufacturing group inventory sales | $ | (109) | | $ | (160) | | $ | (92) | |
| Cash received from customers | 108 | | 143 | | 127 | |
| Other | — | | — | | 1 | |
| Total reclassification adjustments from investing activities to operating activities | $ | (1) | | $ | (17) | | $ | 36 | |
| | | |
| | | |
| | | |
Under a Support Agreement between Textron and TFC, Textron is required to maintain a controlling interest in TFC. The agreement, as amended in December 2015, also requires Textron to ensure that TFC maintains fixed charge coverage of no less than 125% and consolidated shareholders' equity of no less than $125 million. There were no cash contributions required to be paid to TFC in 2024 and 2023 to maintain compliance with the support agreement.
Critical Accounting Estimates
To prepare our Consolidated Financial Statements to be in conformity with generally accepted accounting principles, we must make complex and subjective judgments in the selection and application of accounting policies. The accounting policies that we believe are most critical to the portrayal of our financial condition and results of operations are listed below. We believe these policies require our most difficult, subjective and complex judgments in estimating the effect of inherent uncertainties. This section should be read in conjunction with Note 1 to the Consolidated Financial Statements on page 38, which includes other significant accounting policies.
Revenue Recognition
A substantial portion of our revenues is related to long-term contracts with the U.S. Government, including those under the U.S. Government-sponsored foreign military sales program, for the design, development, manufacture or modification of aerospace and defense products as well as related services. We generally use the cost-to-cost method to measure progress for these contracts because it best depicts the transfer of control to the customer that occurs as we incur costs on our contracts. Under this measure, the extent of progress towards completion is measured based on the ratio of costs incurred to date to the estimated costs at completion of the performance obligation, and revenue is recorded proportionally as costs are incurred.
Due to the number of years it may take to complete these contracts and the scope and nature of the work required to be performed on the contracts, the estimation of total transaction price and costs at completion is complicated and subject to many variables and, accordingly, is subject to change. In estimating total costs at completion, we are required to make numerous assumptions related to the complexity of design and related development work to be performed; engineering requirements; product performance; subcontractor performance; availability and cost of materials; labor productivity, availability and cost; overhead and capital costs; manufacturing efficiencies; the length of time to complete the contract (to estimate increases in wages and prices for materials); and costs of satisfying offset obligations, among other variables. Our cost estimation process is based on the professional knowledge and experience of engineers and program managers along with finance professionals. We review and update our cost projections quarterly or more frequently when circumstances significantly change. When our estimate of the total costs to be incurred on a contract exceeds the estimated total transaction price, a provision for the entire loss is recorded in the period in which the loss is determined.
At the outset of each contract, we estimate an initial profit booking rate considering the risks surrounding our ability to achieve the technical requirements (e.g., a newly developed product versus a mature product), schedule (e.g., the number and type of milestone events), and costs by contract requirements in the initial estimated costs at completion. Profit booking rates may increase during the performance of the contract if we successfully retire risks surrounding the technical, schedule and cost aspects of the contract. Conversely, the profit booking rate may decrease if we are not successful in retiring the risks; and, as a result, our estimated costs at completion increase. All estimates are subject to change during the performance of the contract and, therefore, may affect the profit booking rate.
Changes in our estimate of the total expected cost or in the transaction price for a contract typically impact our profit booking rate. We utilize the cumulative catch-up method of accounting to recognize the impact of these changes on our profit booking rate for a contract. Under this method, the inception-to-date impact of a profit adjustment on a contract is recognized in the period the adjustment is identified. The impact of our cumulative catch-up adjustments on segment profit recognized in prior periods is presented below:
| | | | | | | | | | | |
| (In millions) | 2024 | 2023 | 2022 |
| Gross favorable | $ | 122 | | $ | 106 | | $ | 101 | |
| Gross unfavorable | (91) | | (62) | | (117) | |
| Net adjustments | $ | 31 | | $ | 44 | | $ | (16) | |
Due to the significance of judgment in the estimation process described above, it is likely that materially different revenues and/or cost of sales amounts could be recorded if we used different assumptions or if the underlying circumstances were to change. Our earnings could be reduced by a material amount resulting in a charge to earnings if (a) total estimated contract costs are significantly higher than expected due to changes in customer specifications prior to contract amendment, (b) total estimated contract costs are significantly higher than previously estimated due to cost overruns or inflation, (c) there is a change in engineering efforts required during the development stage of the contract or (d) we are unable to meet contract milestones.
Goodwill
We evaluate the recoverability of goodwill annually in the fourth quarter or more frequently if events or changes in circumstances indicate a potential impairment of a reporting unit. We calculate the fair value of each reporting unit using discounted cash flows. These cash flows incorporate assumptions for revenue growth rates and operating margins that are based on our strategic plans and long-range planning forecasts, which include our best estimates of current and forecasted market conditions, cost structure and anticipated net cost reductions. The long-term revenue growth rate we use to determine the terminal value of the business is based on our assessment of its minimum expected terminal growth rate, as well as its past historical growth and broader economic considerations such as gross domestic product, inflation and the maturity of the markets we serve. The discount rates utilized in this analysis are based on each reporting unit’s weighted average cost of capital, which takes into account the relative weights of each component of capital structure (equity and debt) and represents the expected cost of new capital, adjusted as appropriate to consider the risk inherent in future cash flows of the respective reporting unit. We believe this approach yields a discount rate that is consistent with an implied rate of return that an independent investor or market participant would require for an investment in a company having similar risks and business characteristics to the reporting unit being assessed.
Based on our annual impairment review, the fair value calculated using the estimates discussed above exceeded the carrying value by an adequate amount for each reporting group. Accordingly, we do not believe that there is a reasonable possibility that any units might fail the impairment test in the foreseeable future.
Retirement Benefits
We sponsor funded and unfunded domestic and international pension plans for certain of our employees. Beginning on January 1, 2010, we initiated actions to commence the closure of the pension plans to new entrants. We provide employees hired subsequent to these closures with defined contribution benefits. Our pension benefit obligations are calculated based on actuarial valuations. Key assumptions used in determining these obligations and related expenses or benefits include the expected long-term rates of return on plan assets and discount rates. We also make assumptions regarding employee demographic factors such as retirement patterns, mortality, turnover and rate of compensation increases. We evaluate and update these assumptions annually.
To determine the weighted-average expected long-term rate of return on plan assets, we consider the current and expected asset allocation, as well as historical and expected returns on each plan asset class. A lower expected rate of return on plan assets will decrease pension income. For 2024 and 2023, the assumed expected long-term rate of return on plan assets used in calculating pension income was 7.16% and 7.14%, respectively. For 2024, the assumed rate of return for our domestic plans, which represent approximately 90% of our total pension assets, was 7.25%. Net periodic benefit income is sensitive to changes in the expected long-term rate of return on plan assets.
The discount rate enables us to state expected future benefit payments as a present value on the measurement date, reflecting the current rate at which the pension liabilities could be effectively settled. This rate should be in line with rates for high-quality fixed income investments available for the period to maturity of the pension benefits, which fluctuate as long-term interest rates change. A lower discount rate increases the present value of the benefit obligations and generally decreases pension income. In 2024, the weighted-average discount rate used in calculating pension income was 5.19%, compared with 5.51% in 2023. For our domestic plans, the assumed discount rate was 5.25% in 2024, compared with 5.55% in 2023. A change of 50 basis-points higher or lower, with all other assumptions held constant, in this weighted-average discount rate in 2024 would have changed our pension income for our domestic plans by approximately $10 million.
Item 7A. Quantitative and Qualitative Disclosures About Market Risk
Foreign Currency Exchange Risk
Our financial results are affected by changes in foreign currency exchange rates in the various countries in which our products are manufactured and/or sold. For our manufacturing operations, we manage our foreign currency transaction exposures by entering into foreign currency exchange contracts. These contracts generally are used to fix the local currency cost of purchased goods or services or selling prices denominated in currencies other than the functional currency. The notional amount of outstanding foreign currency exchange contracts was $464 million and $478 million at December 28, 2024 and December 30, 2023, respectively. We also may hedge exposures to certain of our foreign currency assets and earnings by funding those asset positions with debt in the same foreign currency so the exposures are naturally offset.
Interest Rate Risk
Our financial results are affected by changes in interest rates. As part of managing this risk, we seek to achieve a prudent balance between floating- and fixed-rate exposures. We continually monitor our mix of these exposures and adjust the mix, as necessary. For our Finance group, we generally limit our risk to changes in interest rates with a strategy of matching floating-rate assets with floating-rate liabilities. This strategy includes the use of interest rate swap agreements. We had interest rate swap agreements with a total notional amount of $289 million at December 28, 2024 and $210 million at December 30, 2023, which effectively converted certain floating-rate debt to a fixed-rate equivalent.
Quantitative Risk Measures
In the normal course of business, we enter into financial instruments for purposes other than trading. The financial instruments that are subject to market risk include finance receivables (excluding leases), debt (excluding finance lease obligations) and foreign currency exchange contracts. To quantify the market risk inherent in these financial instruments, we utilize a sensitivity analysis that includes a hypothetical change in fair value assuming a 10% decrease in interest rates and a 10% strengthening in foreign exchange rates against the U.S. dollar. The fair value of these financial instruments is estimated using discounted cash flow analysis and indicative market pricing as reported by leading financial news and data providers.
At the end of each year, the table below provides the carrying and fair values of these financial instruments along with the sensitivity of fair value to the hypothetical changes discussed above. This sensitivity analysis is most likely not indicative of actual results in the future.
| | | | | | | | | | | | | | | | | | | | |
| December 28, 2024 | December 30, 2023 |
(In millions) | Carrying
Value* | Fair
Value* | Sensitivity of
Fair Value
to a 10%
Change | Carrying
Value* | Fair
Value* | Sensitivity of
Fair Value
to a 10%
Change |
| Manufacturing group | | | | | | |
| Foreign currency exchange risk | | | | | | |
| | | | | | |
| Foreign currency exchange contracts | $ | (14) | | $ | (14) | | $ | 31 | | $ | 1 | | $ | 1 | | $ | 30 | |
| | | | | | |
| Interest rate risk | | | | | | |
| Debt | (3,164) | | (2,989) | | (49) | | (3,520) | | (3,342) | | (54) | |
| Finance group | | | | | | |
| Interest rate risk | | | | | | |
| Finance receivables | 439 | | 454 | | 9 | | 417 | | 423 | | 9 | |
| Debt | (341) | | (311) | | — | | (348) | | (293) | | (1) | |
* The value represents an asset or (liability).
Item 8. Financial Statements and Supplementary Data
Our Consolidated Financial Statements and the related report of our independent registered public accounting firm thereon are included in this Annual Report on Form 10-K on the pages indicated below:
| | | | | | | | | | | |
| Page |
| | | |
| |
| | | |
| |
| | | |
| |
| | | |
| |
| | | |
| |
| | | |
| |
| | | |
| | | |
| | | |
| | | |
| | | |
| | | |
| | | |
| | | |
| | | |
| | | |
| | | |
| | | |
| | | |
| | | |
| | | |
| | | |
| | | |
| | | |
| | | |
| | | |
| |
| | | |
| Supplementary Information: | |
| | | |
| | |
All other schedules are omitted either because they are not applicable or not required or because the required information is included in the financial statements or notes thereto.
Consolidated Statements of Operations
For each of the years in the three-year period ended December 28, 2024
| | | | | | | | | | | |
| (In millions, except per share data) | 2024 | 2023 | 2022 |
| Revenues | | | |
| Manufacturing product revenues | $ | 11,375 | | $ | 11,573 | | $ | 10,945 | |
| Manufacturing service revenues | 2,277 | | 2,055 | | 1,872 | |
| Finance revenues | 50 | | 55 | | 52 | |
| Total revenues | 13,702 | | 13,683 | | 12,869 | |
| Costs, expenses and other | | | |
| Cost of products sold | 9,403 | | 9,206 | | 8,787 | |
| Cost of services sold | 1,797 | | 1,629 | | 1,412 | |
| | | |
| Research and development costs | 491 | | 570 | | 601 | |
| Selling and administrative expense | 1,156 | | 1,225 | | 1,186 | |
| Interest expense, net | 97 | | 77 | | 107 | |
| Special charges | 78 | | 126 | | — | |
| Non-service components of pension and postretirement income, net | (263) | | (237) | | (240) | |
| | | |
| Total costs, expenses and other | 12,759 | | 12,596 | | 11,853 | |
| Income from continuing operations before income taxes | 943 | | 1,087 | | 1,016 | |
| Income tax expense | 118 | | 165 | | 154 | |
| Income from continuing operations | 825 | | 922 | | 862 | |
| Loss from discontinued operations | (1) | | (1) | | (1) | |
| Net income | $ | 824 | | $ | 921 | | $ | 861 | |
| Basic Earnings per share | | | |
| Continuing operations | $ | 4.38 | | $ | 4.62 | | $ | 4.05 | |
| Discontinued operations | — | | (0.01) | | — | |
| Basic Earnings per share | $ | 4.38 | | $ | 4.61 | | $ | 4.05 | |
| Diluted Earnings per share | | | |
| Continuing operations | $ | 4.34 | | $ | 4.57 | | $ | 4.01 | |
| Discontinued operations | (0.01) | | (0.01) | | — | |
| Diluted Earnings per share | $ | 4.33 | | $ | 4.56 | | $ | 4.01 | |
See Notes to the Consolidated Financial Statements.
Consolidated Statements of Comprehensive Income
For each of the years in the three-year period ended December 28, 2024
| | | | | | | | | | | |
| (In millions) | 2024 | 2023 | 2022 |
| Net income | $ | 824 | | $ | 921 | | $ | 861 | |
| Other comprehensive income (loss), net of tax | | | |
| Pension and postretirement benefits adjustments, net of reclassifications | 419 | | (82) | | 283 | |
| Foreign currency translation adjustments, net of reclassifications | (71) | | 45 | | (103) | |
| Deferred gains (losses) on hedge contracts, net of reclassifications | (8) | | 5 | | (3) | |
| Total other comprehensive income (loss), net of tax | 340 | | (32) | | 177 | |
| Comprehensive income | $ | 1,164 | | $ | 889 | | $ | 1,038 | |
See Notes to the Consolidated Financial Statements.
Consolidated Balance Sheets
| | | | | | | | |
| (In millions, except share data) | December 28,
2024 | December 30,
2023 |
| Assets | | |
| Manufacturing group | | |
| Cash and equivalents | $ | 1,386 | | $ | 2,121 | |
| Accounts receivable, net | 949 | | 868 | |
| Inventories | 4,071 | | 3,914 | |
| Other current assets | 687 | | 857 | |
| Total current assets | 7,093 | | 7,760 | |
| Property, plant and equipment, net | 2,529 | | 2,477 | |
| Goodwill | 2,288 | | 2,295 | |
| Other assets | 4,248 | | 3,663 | |
| Total Manufacturing group assets | 16,158 | | 16,195 | |
| Finance group | | |
| Cash and equivalents | 55 | | 60 | |
| Finance receivables, net | 603 | | 585 | |
| Other assets | 22 | | 16 | |
| Total Finance group assets | 680 | | 661 | |
| Total assets | $ | 16,838 | | $ | 16,856 | |
| Liabilities and shareholders’ equity | | |
| Liabilities | | |
| Manufacturing group | | |
| Current portion of long-term debt | $ | 357 | | $ | 357 | |
| Accounts payable | 943 | | 1,023 | |
| Other current liabilities | 3,094 | | 2,998 | |
| Total current liabilities | 4,394 | | 4,378 | |
| Other liabilities | 1,945 | | 1,904 | |
| Long-term debt | 2,890 | | 3,169 | |
| Total Manufacturing group liabilities | 9,229 | | 9,451 | |
| Finance group | | |
| Other liabilities | 64 | | 70 | |
| Debt | 341 | | 348 | |
| Total Finance group liabilities | 405 | | 418 | |
| Total liabilities | 9,634 | | 9,869 | |
| Shareholders’ equity | | |
Common stock (184.0 million and 195.0 million shares issued, respectively, and 183.0 million and 192.9 million shares outstanding, respectively) | 23 | | 24 | |
| Capital surplus | 1,960 | | 1,910 | |
| Treasury stock | (82) | | (165) | |
| Retained earnings | 5,607 | | 5,862 | |
| Accumulated other comprehensive loss | (304) | | (644) | |
| Total shareholders’ equity | 7,204 | | 6,987 | |
| Total liabilities and shareholders’ equity | $ | 16,838 | | $ | 16,856 | |
See Notes to the Consolidated Financial Statements.
Consolidated Statements of Shareholders’ Equity
| | | | | | | | | | | | | | | | | | | | |
| (In millions, except per share data) | Common
Stock | Capital
Surplus | Treasury
Stock | Retained
Earnings | Accumulated
Other
Comprehensive
Loss | Total
Shareholders’
Equity |
| Balance at January 1, 2022 | $ | 28 | | $ | 1,863 | | $ | (157) | | $ | 5,870 | | $ | (789) | | $ | 6,815 | |
| Net income | — | | — | | — | | 861 | | — | | 861 | |
| Other comprehensive income | — | | — | | — | | — | | 177 | | 177 | |
| Dividends declared ($0.08 per share) | — | | — | | — | | (17) | | — | | (17) | |
| Share-based compensation activity | — | | 144 | | — | | — | | — | | 144 | |
| Purchases of common stock | — | | — | | (867) | | — | | — | | (867) | |
| Retirement of treasury stock | (2) | | (127) | | 940 | | (811) | | — | | — | |
| | | | | | |
| Balance at December 31, 2022 | 26 | | 1,880 | | (84) | | 5,903 | | (612) | | 7,113 | |
| Net income | — | | — | | — | | 921 | | — | | 921 | |
| Other comprehensive loss | — | | — | | — | | — | | (32) | | (32) | |
| Dividends declared ($0.08 per share) | — | | — | | — | | (16) | | — | | (16) | |
| Share-based compensation activity | — | | 179 | | — | | — | | — | | 179 | |
| Purchases of common stock, including excise tax* | — | | — | | (1,178) | | — | | — | | (1,178) | |
| Retirement of treasury stock | (2) | | (149) | | 1,097 | | (946) | | — | | — | |
| | | | | | |
| Balance at December 30, 2023 | 24 | | 1,910 | | (165) | | 5,862 | | (644) | | 6,987 | |
| Net income | — | | — | | — | | 824 | | — | | 824 | |
| Other comprehensive income | — | | — | | — | | — | | 340 | | 340 | |
| Dividends declared ($0.08 per share) | — | | — | | — | | (16) | | — | | (16) | |
| Share-based compensation activity | 1 | | 199 | | — | | — | | — | | 200 | |
| Purchases of common stock, including excise tax* | — | | — | | (1,131) | | — | | — | | (1,131) | |
| Retirement of treasury stock | (2) | | (149) | | 1,214 | | (1,063) | | — | | — | |
| | | | | | |
| Balance at December 28, 2024 | $ | 23 | | $ | 1,960 | | $ | (82) | | $ | 5,607 | | $ | (304) | | $ | 7,204 | |
*Includes amounts accrued for excise tax imposed on common share repurchases that totaled $9 million in 2024 and $10 million in 2023.
See Notes to the Consolidated Financial Statements.
Consolidated Statements of Cash Flows
For each of the years in the three-year period ended December 28, 2024
| | | | | | | | | | | |
| Consolidated |
| (In millions) | 2024 | 2023 | 2022 |
| Cash flows from operating activities | | | |
| | | |
| | | |
| Income from continuing operations | $ | 825 | | $ | 922 | | $ | 862 | |
Adjustments to reconcile income from continuing operations to net cash provided by operating activities of continuing operations: | | | |
| Non-cash items: | | | |
| Depreciation and amortization | 382 | | 395 | | 397 | |
| Deferred income taxes | (48) | | (192) | | (220) | |
| Asset impairments and powersports inventory charge | 41 | | 88 | | 2 | |
| | | |
| Other, net | 102 | | 90 | | 94 | |
| Changes in assets and liabilities: | | | |
| Accounts receivable, net | (96) | | (9) | | (26) | |
| Inventories | (194) | | (359) | | (55) | |
| Other assets | 205 | | 267 | | 35 | |
| Accounts payable | (69) | | 2 | | 235 | |
| Other liabilities | 95 | | 276 | | 270 | |
| Income taxes, net | (26) | | 4 | | 18 | |
| Pension, net | (225) | | (202) | | (165) | |
| Captive finance receivables, net | (1) | | (17) | | 35 | |
| Other operating activities, net | 24 | | 2 | | 8 | |
| Net cash provided by operating activities of continuing operations | 1,015 | | 1,267 | | 1,490 | |
| Net cash used in operating activities of discontinued operations | (1) | | (1) | | (2) | |
| Net cash provided by operating activities | 1,014 | | 1,266 | | 1,488 | |
| Cash flows from investing activities | | | |
| Capital expenditures | (364) | | (402) | | (354) | |
| Net cash used in business acquisitions | (13) | | (1) | | (202) | |
| Net proceeds from corporate-owned life insurance policies | 85 | | 40 | | 23 | |
| Proceeds from sale of property, plant and equipment | 4 | | 18 | | 22 | |
| | | |
| Finance receivables repaid | 25 | | 26 | | 20 | |
| Finance receivables originated | (21) | | — | | — | |
| Other investing activities, net | — | | 2 | | 44 | |
| Net cash used in investing activities | (284) | | (317) | | (447) | |
| Cash flows from financing activities | | | |
| Decrease in short-term debt | (1) | | — | | (14) | |
| Net proceeds from long-term debt | — | | 348 | | — | |
| Principal payments on long-term debt and nonrecourse debt | (377) | | (44) | | (234) | |
| | | |
| | | |
| Purchases of Textron common stock | (1,122) | | (1,168) | | (867) | |
| Proceeds from exercise of stock options | 88 | | 73 | | 44 | |
| Dividends paid | (12) | | (16) | | (17) | |
| Other financing activities, net | (30) | | (6) | | (3) | |
| Net cash used in financing activities | (1,454) | | (813) | | (1,091) | |
| Effect of exchange rate changes on cash and equivalents | (16) | | 10 | | (32) | |
| Net increase (decrease) in cash and equivalents | (740) | | 146 | | (82) | |
| Cash and equivalents at beginning of year | 2,181 | | 2,035 | | 2,117 | |
| Cash and equivalents at end of year | $ | 1,441 | | $ | 2,181 | | $ | 2,035 | |
See Notes to the Consolidated Financial Statements.
Consolidated Statements of Cash Flows continued
For each of the years in the three-year period ended December 28, 2024
| | | | | | | | | | | | | | | | | | | | |
| Manufacturing Group | Finance Group |
| (In millions) | 2024 | 2023 | 2022 | 2024 | 2023 | 2022 |
| Cash flows from operating activities | | | | | | |
| Income from continuing operations | $ | 796 | | $ | 884 | | $ | 835 | | $ | 29 | | $ | 38 | | $ | 27 | |
Adjustments to reconcile income from continuing operations to net cash
provided by (used in) operating activities of continuing operations: | | | | | | |
| Non-cash items: | | | | | | |
| Depreciation and amortization | 382 | | 395 | | 396 | | — | | — | | 1 | |
| Deferred income taxes | (46) | | (188) | | (200) | | (2) | | (4) | | (20) | |
| Asset impairments and powersports inventory charge | 41 | | 88 | | 2 | | — | | — | | — | |
| | | | | | |
| Other, net | 115 | | 110 | | 103 | | (13) | | (20) | | (9) | |
| Changes in assets and liabilities: | | | | | | |
| Accounts receivable, net | (96) | | (9) | | (26) | | — | | — | | — | |
| Inventories | (194) | | (359) | | (55) | | — | | — | | — | |
| Other assets | 205 | | 261 | | 34 | | — | | 6 | | 1 | |
| Accounts payable | (69) | | 2 | | 235 | | — | | — | | — | |
| Other liabilities | 100 | | 281 | | 277 | | (5) | | (5) | | (7) | |
| Income taxes, net | (25) | | 5 | | 18 | | (1) | | (1) | | — | |
| Pension, net | (225) | | (202) | | (165) | | — | | — | | — | |
| | | | | | |
| Other operating activities, net | 24 | | 2 | | 7 | | — | | — | | — | |
| Net cash provided by (used in) operating activities of continuing operations | 1,008 | | 1,270 | | 1,461 | | 8 | | 14 | | (7) | |
| Net cash used in operating activities of discontinued operations | (1) | | (1) | | (2) | | — | | — | | — | |
| Net cash provided by (used in) operating activities | 1,007 | | 1,269 | | 1,459 | | 8 | | 14 | | (7) | |
| Cash flows from investing activities | | | | | | |
| Capital expenditures | (364) | | (402) | | (354) | | — | | — | | — | |
| Net cash used in business acquisitions | (13) | | (1) | | (202) | | — | | — | | — | |
| Net proceeds from corporate-owned life insurance policies | 85 | | 40 | | 23 | | — | | — | | — | |
| Proceeds from sale of property, plant and equipment | 4 | | 18 | | 22 | | — | | — | | — | |
| | | | | | |
| Finance receivables repaid | — | | — | | — | | 133 | | 169 | | 147 | |
| Finance receivables originated | — | | — | | — | | (130) | | (160) | | (92) | |
| Other investing activities, net | — | | — | | — | | — | | 2 | | 45 | |
| Net cash provided by (used in) investing activities | (288) | | (345) | | (511) | | 3 | | 11 | | 100 | |
| Cash flows from financing activities | | | | | | |
| Decrease in short-term debt | (1) | | — | | (14) | | — | | — | | — | |
| Net proceeds from long-term debt | — | | 348 | | — | | — | | — | | — | |
| Principal payments on long-term debt and nonrecourse debt | (361) | | (7) | | (18) | | (16) | | (37) | | (216) | |
| | | | | | |
| | | | | | |
| Purchases of Textron common stock | (1,122) | | (1,168) | | (867) | | — | | — | | — | |
| Proceeds from exercise of stock options | 88 | | 73 | | 44 | | — | | — | | — | |
| Dividends paid | (12) | | (16) | | (17) | | — | | — | | — | |
| Other financing activities, net | (30) | | (6) | | (3) | | — | | — | | — | |
| Net cash used in financing activities | (1,438) | | (776) | | (875) | | (16) | | (37) | | (216) | |
| Effect of exchange rate changes on cash and equivalents | (16) | | 10 | | (32) | | — | | — | | — | |
| Net increase (decrease) in cash and equivalents | (735) | | 158 | | 41 | | (5) | | (12) | | (123) | |
| Cash and equivalents at beginning of year | 2,121 | | 1,963 | | 1,922 | | 60 | | 72 | | 195 | |
| Cash and equivalents at end of year | $ | 1,386 | | $ | 2,121 | | $ | 1,963 | | $ | 55 | | $ | 60 | | $ | 72 | |
See Notes to the Consolidated Financial Statements.
Notes to the Consolidated Financial Statements
Note 1. Summary of Significant Accounting Policies
Principles of Consolidation and Financial Statement Presentation
Our Consolidated Financial Statements include the accounts of Textron Inc. and its majority-owned subsidiaries. Our financings are conducted through two separate borrowing groups. The Manufacturing group consists of Textron Inc. consolidated with its majority-owned subsidiaries that operate in the Textron Aviation, Bell, Textron Systems, Industrial and Textron eAviation segments. The Finance group, which also is the Finance segment, consists of Textron Financial Corporation (TFC) and its consolidated subsidiaries. We designed this framework to enhance our borrowing power by separating the Finance group. Our Manufacturing group operations include the development, production and delivery of tangible goods and services, while our Finance group provides financial services. Due to the fundamental differences between each borrowing group’s activities, investors, rating agencies and analysts use different measures to evaluate each group’s performance. To support those evaluations, we present balance sheet and cash flow information for each borrowing group within the Consolidated Financial Statements.
Our Finance group provides financing primarily to purchasers of new and pre-owned Textron Aviation aircraft and Bell helicopters manufactured by our Manufacturing group, otherwise known as captive financing. In the Consolidated Statements of Cash Flows, cash received from customers is reflected as operating activities when received from third parties. However, in the cash flow information provided for the separate borrowing groups, cash flows related to captive financing activities are reflected based on the operations of each group. For example, when product is sold by our Manufacturing group to a customer and is financed by the Finance group, the origination of the finance receivable is recorded within investing activities as a cash outflow in the Finance group’s statement of cash flows. Meanwhile, in the Manufacturing group’s statement of cash flows, the cash received from the Finance group on the customer’s behalf is recorded within operating cash flows as a cash inflow. Although cash is transferred between the two borrowing groups, there is no cash transaction reported in the consolidated cash flows at the time of the original financing. These captive financing activities, along with all significant intercompany transactions, are reclassified or eliminated in consolidation.
Collaborative Arrangements
Our Bell segment has a strategic alliance agreement with a third-party company to provide engineering, development and test services related to the V-22 aircraft, as well as to produce the V-22 aircraft, under a number of separate contracts with the U.S. Government (V-22 Contracts). The alliance created by this agreement is not a legal entity and has no employees, no assets and no true operations. This agreement creates contractual rights and does not represent an entity in which we have an equity interest. We account for this alliance as a collaborative arrangement with Bell and the third-party company reporting costs incurred and revenues generated from transactions with the U.S. Government in each company’s respective income statement. Neither Bell nor the third-party company is considered to be the principal participant for the transactions recorded under this agreement. Profits on cost-plus contracts are allocated between Bell and the third-party company on a 50%-50% basis. Negotiated profits on fixed-price contracts are also allocated 50%-50%; however, Bell and the third-party company are each responsible for their own cost overruns and are entitled to retain any cost underruns. Based on the contractual arrangement established under the alliance, Bell accounts for its rights and obligations under the specific requirements of the V-22 Contracts allocated to Bell under the work breakdown structure. We account for all of our rights and obligations, including warranty, product and any contingent liabilities, under the specific requirements of the V-22 Contracts allocated to us under the agreement. Revenues and cost of sales reflect our performance under the V-22 Contracts with revenues recognized using the cost-to-cost method. We include all assets used in performance of the V-22 Contracts that we own and all liabilities arising from our obligations under the V-22 Contracts in our Consolidated Balance Sheets.
Use of Estimates
We prepare our financial statements in conformity with generally accepted accounting principles, which require us to make estimates and assumptions that affect the amounts reported in the financial statements. Actual results could differ from those estimates. Our estimates and assumptions are reviewed periodically, and the effects of changes, if any, are reflected in the Consolidated Statements of Operations in the period that they are determined.
Revenue Recognition
Revenue is recognized when control of the product or service promised under the contract is transferred to the customer either at a point in time (e.g., upon delivery) or over time (e.g., as we perform under the contract). We account for a contract when it has approval and commitment from both parties, the rights and payment terms of the parties are identified, the contract has commercial substance and collectability of consideration is probable. Contracts are reviewed to determine whether there is one or multiple performance obligations. A performance obligation is a promise to transfer a distinct product or service to a customer and represents the unit of accounting for revenue recognition. For contracts with multiple performance obligations, the expected consideration, or the transaction price, is allocated to each performance obligation identified in the contract based on the relative standalone selling price of each performance obligation. Revenue is then recognized for the transaction price allocated to the
performance obligation when control of the promised product or service underlying the performance obligation is transferred. Contract consideration is not adjusted for the effects of a significant financing component when, at contract inception, the period between when control transfers and when the customer will pay for that good or service is one year or less.
Revenue is classified as product or service revenue based on the predominant attributes of each performance obligation.
Commercial Contracts
The majority of our contracts with commercial customers have a single performance obligation as there is only one product or service promised or the promise to transfer the product or service is not distinct or separately identifiable from other promises in the contract. Revenue is primarily recognized at a point in time, which is generally when the customer obtains control of the asset upon delivery and customer acceptance. Contract modifications that provide for additional distinct products or services at the standalone selling price are treated as separate contracts.
For commercial fixed-wing aircraft, we contract with our customers to sell fully outfitted aircraft, which may include configuration options. The aircraft typically represents a single performance obligation and revenue is recognized upon customer acceptance and delivery. For commercial helicopters, our customers generally contract with us for fully functional basic configuration aircraft and control is transferred upon customer acceptance and delivery. At times, customers may separately contract with us for the installation of accessories and customization to the basic aircraft. If these contracts are entered into at or near the same time of the basic aircraft contract, we assess whether the contracts meet the criteria to be combined. For contracts that are combined, the basic aircraft and the accessories and customization are typically considered to be distinct, and therefore, are separate performance obligations. For these contracts, revenue is recognized on the basic aircraft upon customer acceptance and transfer of title and risk of loss, and on the accessories and customization, upon delivery and customer acceptance. We utilize observable prices to determine the standalone selling prices when allocating the transaction price to these performance obligations.
The transaction price for our commercial contracts reflects our estimate of returns, rebates and discounts, which are based on historical, current and forecasted information. Amounts billed to customers for shipping and handling are included in the transaction price and generally are not treated as separate performance obligations as these costs fulfill a promise to transfer the product to the customer. Taxes collected from customers and remitted to government authorities are recorded on a net basis.
We primarily provide standard warranty programs for products in our commercial businesses for periods that typically range from one year to five years. These assurance-type programs typically cannot be purchased separately and do not meet the criteria to be considered a performance obligation.
U.S. Government Contracts
Our contracts with the U.S. Government generally include the design, development, manufacture or modification of aerospace and defense products and related support services. These contracts, which also include those under the U.S. Government-sponsored foreign military sales program, accounted for approximately 25% of total revenues in 2024. The customer typically contracts with us to provide a significant service of integrating a complex set of tasks and components into a single project or capability, which often results in the delivery of multiple units. Accordingly, the entire contract is accounted for as one performance obligation. In certain circumstances, a contract may include both production and support services, such as logistics and parts plans, which are considered to be distinct in the context of the contract and represent separate performance obligations. When a contract is separated into more than one performance obligation, we generally utilize the expected cost plus a margin approach to determine the standalone selling prices when allocating the transaction price.
Our contracts are frequently modified for changes in contract specifications and requirements. Most of our contract modifications with the U.S. Government are for products and services that are not distinct from the existing contract due to the significant integration service provided in the context of the contract and are accounted for as part of that existing contract. The effect of these contract modifications on our estimates is recognized using the cumulative catch-up method of accounting.
Contracts with the U.S. Government generally contain clauses that provide lien rights to work-in-process along with clauses that allow the customer to unilaterally terminate the contract for convenience, pay us for costs incurred plus a reasonable profit and take control of any work-in-process. Due to the continuous transfer of control to the U.S. Government, we recognize revenue over the time that we perform under the contract. Selecting the method to measure progress towards completion requires judgment and is based on the nature of the products or service to be provided. We generally use the cost-to-cost method to measure progress for our contracts because it best depicts the transfer of control to the customer that occurs as we incur costs on our contracts. Under this measure, the extent of progress towards completion is measured based on the ratio of costs incurred to date to the estimated costs at completion of the performance obligation, and revenue is recorded proportionally as costs are incurred.
The transaction price for our contracts represents our best estimate of the consideration we will receive and includes assumptions regarding variable consideration as applicable. Certain of our long-term contracts contain incentive fees or other provisions that can either increase or decrease the transaction price. These variable amounts generally are awarded upon achievement of certain performance metrics, program milestones or cost targets and can be based upon customer discretion. We include estimated amounts in the transaction price to the extent it is probable that a significant reversal of cumulative revenue recognized will not occur when the uncertainty associated with the variable consideration is resolved. Our estimates of variable consideration and determination of whether to include estimated amounts in the transaction price are based largely on an assessment of our anticipated performance, historical performance, and all other information that is reasonably available to us.
Total contract cost is estimated utilizing current contract specifications and expected engineering requirements. Contract costs typically are incurred over a period of several years, and the estimation of these costs requires substantial judgment. Our cost estimation process is based on the professional knowledge and experience of engineers and program managers along with finance professionals. We review and update our projections of costs quarterly or more frequently when circumstances significantly change.
Approximately 58% of our 2024 revenues with the U.S. Government were under fixed-price and fixed-price incentive contracts. Under the typical payment terms of these contracts, the customer pays us either performance-based or progress payments. Performance-based payments represent interim payments of up to 90% of the contract price based on quantifiable measures of performance or on the achievement of specified events or milestones. Progress payments are interim payments of up to 80% of costs incurred as the work progresses. Because the customer retains a small portion of the contract price until completion of the contract, these contracts generally result in revenue recognized in excess of billings. Amounts billed and due from our customers are classified in Accounts receivable, net. The portion of the payments retained by the customer until final contract settlement is not considered a significant financing component because the intent is to protect the customer. For cost-type contracts, we are generally paid for our actual costs incurred within a short period of time.
Finance Revenues
Finance revenues primarily include interest on finance receivables, finance lease earnings and portfolio gains/losses. We recognize interest using the interest method, which provides a constant rate of return over the terms of the receivables. Accrual of interest income is suspended if credit quality indicators suggest full collection of principal and interest is doubtful. In addition, we automatically suspend the accrual of interest income for accounts that are contractually delinquent by more than three months unless collection is not doubtful. Cash payments on nonaccrual accounts, including finance charges, generally are applied to reduce the net investment balance. Once we conclude that the collection of all principal and interest is no longer doubtful, we resume the accrual of interest and recognize previously suspended interest income at the time either a) the loan becomes contractually current through payment according to the original terms of the loan, or b) if the loan has been modified, following a period of performance under the terms of the modification.
Contract Estimates
For contracts where revenue is recognized over time, we recognize changes in estimated contract revenues, costs and profits using the cumulative catch-up method of accounting. This method recognizes the cumulative effect of changes on current and prior periods with the impact of the change from inception-to-date recorded in the current period. Anticipated losses on contracts are recognized in full in the period in which the losses become probable and estimable.
In 2024 and 2023, our cumulative catch-up adjustments increased segment profit by $31 million and $44 million, respectively, and net income by $24 million and $34 million, respectively ($0.12 and $0.17 per diluted share, respectively). In 2022, our cumulative catch-up adjustments decreased segment profit by $16 million and net income by $12 million ($0.06 per diluted share). Revenue was increased by $32 million and $42 million in 2024 and 2023, respectively, and reduced by $25 million in 2022, related to changes in profit booking rates for performance obligations satisfied in prior periods.
Contract Assets and Liabilities
Contract assets arise from contracts when revenue is recognized over time and the amount of revenue recognized exceeds the amount billed to the customer. These amounts are included in contract assets until the right to payment is no longer conditional on events other than the passage of time and are included in Other current assets in the Consolidated Balance Sheets. Contract liabilities, which are primarily included in Other current liabilities, include deposits, largely from our commercial aviation customers, and billings in excess of revenue recognized.
The incremental costs of obtaining a contract with a customer that is expected to be recovered is expensed as incurred when the period to be benefitted is one year or less.
Accounts Receivable, Net
Accounts receivable, net includes amounts billed to customers where the right to payment is unconditional. We maintain an allowance for credit losses for our commercial accounts receivable to provide for the estimated amount that will not be collected, even when the risk of loss is remote. The allowance is measured on a collective pool basis when similar risk characteristics exist and is established as a percentage of accounts receivable. We have identified pools with similar risk characteristics, based on customer and industry type and geographic location. The percentage is based on all available and relevant information including age of outstanding receivables and collateral value, if any, historical payment experience and loss history, current economic conditions, and, when reasonable and supportable factors exist, management’s expectation of future economic conditions. For amounts due from the U.S. Government, we have not established an allowance for credit losses as we have zero loss expectation based on a long history of no credit losses and the explicit guarantee of a sovereign entity.
Cash and Equivalents
Cash and equivalents consist of cash and short-term, highly liquid investments with original maturities of three months or less.
Inventories
Inventories are stated at the lower of cost or estimated realizable value. The majority of our inventories are valued using the last-in, first-out (LIFO) method, while the remaining inventories are generally valued using the first-in, first-out (FIFO) method.
Property, Plant and Equipment
Property, plant and equipment are recorded at cost and are depreciated primarily using the straight-line method. We capitalize expenditures for improvements that increase asset values and extend useful lives. Property, plant and equipment are reviewed for impairment whenever events or changes in circumstances indicate that the carrying amount of the asset may not be recoverable. If the carrying value of the asset exceeds the sum of the undiscounted expected future cash flows, the asset is written down to fair value.
Goodwill and Intangible Assets
Goodwill represents the excess of the consideration paid for the acquisition of a business over the fair values assigned to intangible and other net assets of the acquired business. Goodwill and intangible assets deemed to have indefinite lives are not amortized but are subject to an annual impairment test. We evaluate the recoverability of these assets in the fourth quarter of each year or more frequently if events or changes in circumstances, such as declines in sales, earnings or cash flows, or material adverse changes in the business climate, indicate a potential impairment.
For our goodwill impairment test, we calculate the fair value of each reporting unit using discounted cash flows. A reporting unit represents the operating segment unless discrete financial information is prepared and reviewed by segment management for businesses one level below that operating segment, in which case such component is the reporting unit. In certain instances, we have aggregated components of an operating segment into a single reporting unit based on similar economic characteristics. The discounted cash flows incorporate assumptions for revenue growth rates, operating margins and discount rates that represent our best estimates of current and forecasted market conditions, cost structure, anticipated net cost reductions, and the implied rate of return that we believe a market participant would require for an investment in a business having similar risks and characteristics to the reporting unit being assessed. The fair value of our indefinite-lived intangible assets is primarily determined using the relief of royalty method based on forecasted revenues and royalty rates. If the estimated fair value of the reporting unit or indefinite-lived intangible asset exceeds the carrying value, there is no impairment. Otherwise, an impairment loss is recognized for the amount by which the carrying value exceeds the estimated fair value.
Acquired intangible assets with finite lives are subject to amortization. These assets are reviewed for impairment whenever events or changes in circumstances indicate that the carrying amount of the asset may not be recoverable. Amortization of these intangible assets is recognized over their estimated useful lives using a method that reflects the pattern in which the economic benefits of the intangible assets are consumed or otherwise realized. The majority of our intangible assets are amortized based on the cash flow streams used to value the assets, with the remaining assets amortized using the straight-line method.
Finance Receivables
Finance receivables primarily include loans provided to purchasers of new and pre-owned Textron Aviation aircraft and Bell helicopters. Finance receivables are generally recorded at the amount of outstanding principal less allowance for credit losses.
We establish an allowance for credit losses to cover probable but specifically unknown losses existing in the portfolio. This allowance is established as a percentage of finance receivables categorized by pools with similar risk characteristics, such as collateral or customer type and geographic location. The percentage is based on a combination of factors, including historical loss experience, current delinquency and default trends, collateral values, current economic conditions, and, when reasonable and supportable factors exist, management’s expectation of future economic conditions.
For those finance receivables that do not have similar risk characteristics, including larger balance accounts specifically identified as impaired, a reserve is established against the carrying amount either based on comparing the expected future cash flows that are discounted at the finance receivable's effective interest rate, or based on the fair value of the underlying collateral if the finance receivable is collateral dependent. The expected future cash flows consider collateral value; financial performance and liquidity of our borrower; existence and financial strength of guarantors; estimated recovery costs, including legal expenses; and costs associated with the repossession and eventual disposal of collateral. When there is a range of potential outcomes, we perform multiple discounted cash flow analyses and weight the potential outcomes based on their relative likelihood of occurrence. The evaluation of our portfolio is inherently subjective, as it requires estimates, including the amount and timing of future cash flows expected to be received on impaired finance receivables and the estimated fair value of the underlying collateral, which may differ from actual results. While our analysis is specific to each individual account, critical factors included in this analysis include industry valuation guides, age and physical condition of the collateral, payment history, and existence and financial strength of guarantors.
Finance receivables are charged off at the earlier of the date the collateral is repossessed or when management no longer deems the receivable collectible. Repossessed assets are recorded at their fair value, less estimated cost to sell.
Pension and Postretirement Benefit Obligations
We maintain various pension and postretirement plans for our employees globally. Our pension plans include significant benefit obligations, which are calculated based on actuarial valuations. Key assumptions used in determining these obligations and related expenses include expected long-term rates of return on plan assets, discount rates and healthcare cost projections. We evaluate and update these assumptions annually in consultation with third-party actuaries and investment advisors. We also make assumptions regarding employee demographic factors such as retirement patterns, mortality, turnover and rate of compensation increases.
For our year-end measurement, our defined benefit plan assets and obligations are measured as of the month-end date closest to our fiscal year-end. We recognize the overfunded or underfunded status of our pension and postretirement plans in the Consolidated Balance Sheets and recognize changes in the funded status of our defined benefit plans in comprehensive income (loss) in the year in which they occur. To the extent actuarial gains and losses exceed 10% of the higher of the market-related value of assets or the benefit obligation in a year, the excess is recognized as a component of accumulated other comprehensive income (loss) and is amortized into net periodic pension cost over the remaining service period of the active participants. For plans in which all or almost all of the plan’s participants are inactive, the amortization period is the remaining life expectancy of the inactive participants. This determination is made on a plan-by-plan basis.
Derivatives and Hedging Activities
We are exposed to market risk primarily from changes in currency exchange rates and interest rates. We do not hold or issue derivative financial instruments for trading or speculative purposes. To manage the volatility relating to our exposures, we net these exposures on a consolidated basis to take advantage of natural offsets. For the residual portion, we enter into various derivative transactions pursuant to our policies in areas such as counterparty exposure and hedging practices. Credit risk related to derivative financial instruments is considered minimal and is managed by requiring high credit standards for counterparties and through periodic settlements of positions.
All derivative instruments are reported at fair value in the Consolidated Balance Sheets. Designation to support hedge accounting is performed on a specific exposure basis. For financial instruments qualifying as cash flow hedges, we record changes in the fair value of derivatives (to the extent they are effective as hedges) in other comprehensive income (loss), net of deferred taxes. Changes in fair value of derivatives not qualifying as hedges are recorded in earnings.
Foreign currency denominated assets and liabilities are translated into U.S. dollars. Adjustments from currency rate changes are recorded in the cumulative translation adjustment account in shareholders’ equity until the related foreign entity is sold or substantially liquidated.
Leases
We identify leases by evaluating our contracts to determine if the contract conveys the right to use an identified asset for a stated period of time in exchange for consideration. Specifically, we consider whether we can control the underlying asset and have the right to obtain substantially all of the economic benefits or outputs from the asset. For our contracts that contain both lease components (e.g., fixed payments including rent, real estate taxes and insurance costs) and non-lease components (e.g., common-area maintenance costs or other goods/services), we allocate the consideration in the contract to each component based on its standalone price. Leases with terms greater than 12 months are classified as either operating or finance leases at the commencement date. For these leases, we capitalize the lesser of a) the present value of the minimum lease payments over the lease term, or b) the fair value of the asset, as a right-of-use asset with an offsetting lease liability. The discount rate used to calculate the present value of the minimum lease payments is typically our incremental borrowing rate, as the rate implicit in the lease is generally not known or determinable. The lease term includes any noncancelable period for which we have the right to use the asset and may include options to extend or terminate the lease when it is reasonably certain that we will exercise the
option. Operating leases are recognized as a single lease cost on a straight-line basis over the lease term, while finance lease cost is recognized separately as amortization and interest expense.
Product Liabilities
We accrue for product liability claims and related defense costs when a loss is probable and reasonably estimable. Our estimates are generally based on the specifics of each claim or incident and our best estimate of the probable loss using historical experience.
Environmental Liabilities and Asset Retirement Obligations
Liabilities for environmental matters are recorded on a site-by-site basis when it is probable that an obligation has been incurred and the cost can be reasonably estimated. We estimate our accrued environmental liabilities using currently available facts, existing technology, and presently enacted laws and regulations, all of which are subject to a number of factors and uncertainties. Our environmental liabilities are not discounted and do not take into consideration possible future insurance proceeds or significant amounts from claims against other third parties.
We have incurred asset retirement obligations primarily related to costs to remove and dispose of underground storage tanks and asbestos materials used in insulation, adhesive fillers and floor tiles. Currently, there is no legal requirement to remove these items and there is no plan to remodel the related facilities or otherwise cause the impacted items to require disposal. Since these asset retirement obligations are not probable, there is no related liability recorded in the Consolidated Balance Sheets.
Warranty Liabilities
For our assurance-type warranty programs, we estimate the costs that may be incurred and record a liability in the amount of such costs at the time product revenues are recognized. Factors that affect this liability include the number of products sold, historical costs per claim, length of warranty period, contractual recoveries from vendors and historical and anticipated rates of warranty claims, including production and warranty patterns for new models. We assess the adequacy of our recorded warranty liability periodically and adjust the amounts as necessary. Additionally, we may establish a warranty liability related to the issuance of aircraft service bulletins for aircraft no longer covered under the limited warranty programs.
Research and Development Costs
Our customer-funded research and development costs are charged directly to the related contracts, which primarily consist of U.S. Government contracts. In accordance with government regulations, we recover a portion of company-funded research and development costs through overhead rate charges on our U.S. Government contracts. Research and development costs that are not reimbursable under a contract with the U.S. Government or another customer are charged to expense as incurred.
Income Taxes
The provision for income tax expense is calculated on reported income before income taxes based on current tax law and includes, in the current period, the cumulative effect of any changes in tax rates from those used previously in determining deferred tax assets and liabilities. Tax laws may require items to be included in the determination of taxable income at different times from when the items are reflected in the financial statements. Deferred tax balances reflect the effects of temporary differences between the financial reporting carrying amounts of assets and liabilities and their tax bases, as well as from net operating losses and tax credit carryforwards, and are stated at enacted tax rates in effect for the year taxes are expected to be paid or recovered.
Deferred tax assets represent tax benefits for tax deductions or credits available in future years and require certain estimates and assumptions to determine whether it is more likely than not that all or a portion of the benefit will not be realized. The recoverability of these future tax deductions and credits is determined by assessing the adequacy of future expected taxable income from all sources, including the future reversal of existing taxable temporary differences, taxable income in carryback years, estimated future taxable income and available tax planning strategies. Should a change in facts or circumstances lead to a change in judgment about the ultimate recoverability of a deferred tax asset, we record or adjust the related valuation allowance in the period that the change in facts and circumstances occurs, along with a corresponding increase or decrease in income tax expense.
We record tax benefits for uncertain tax positions based upon management’s evaluation of the information available at the reporting date. To be recognized in the financial statements, the tax position must meet the more-likely-than-not threshold that the position will be sustained upon examination by the tax authority based on technical merits assuming the tax authority has full knowledge of all relevant information. For positions meeting this recognition threshold, the benefit is measured as the largest amount of benefit that meets the more-likely-than-not threshold to be sustained. We periodically evaluate these tax positions based on the latest available information. For tax positions that do not meet the threshold requirement, we recognize net tax-related interest and penalties for continuing operations in income tax expense.
Note 2. Goodwill and Intangible Assets
Goodwill
The changes in the carrying amount of goodwill by segment are as follows:
| | | | | | | | | | | | | | | | | | | | |
| (In millions) | Textron
Aviation | Bell | Textron
Systems | Industrial | Textron eAviation | Total |
| Balance at December 31, 2022 | $ | 633 | | $ | 37 | | $ | 1,010 | | $ | 465 | | $ | 138 | | $ | 2,283 | |
| | | | | | |
| | | | | | |
| Foreign currency translation | — | | — | | — | | 5 | | 7 | | 12 | |
| Balance at December 30, 2023 | 633 | | 37 | | 1,010 | | 470 | | 145 | | 2,295 | |
| Acquisitions | — | | — | | — | | — | | 10 | | 10 | |
| | | | | | |
| Foreign currency translation | (1) | | — | | — | | (7) | | (9) | | (17) | |
| Balance at December 28, 2024 | $ | 632 | | $ | 37 | | $ | 1,010 | | $ | 463 | | $ | 146 | | $ | 2,288 | |
Intangible Assets
Our intangible assets are summarized below:
| | | | | | | | | | | | | | | | | | | | | | | |
| | December 28, 2024 | December 30, 2023 |
| (Dollars in millions) | Weighted-Average
Amortization
Period (in years) | Gross
Carrying
Amount | Accumulated
Amortization | Net | Gross
Carrying
Amount | Accumulated
Amortization | Net |
| Trade names and trademarks | 18 | $ | 199 | | $ | (11) | | $ | 188 | | $ | 200 | | $ | (9) | | $ | 191 | |
| Patents and technology | 15 | 509 | | (360) | | 149 | | 510 | | (333) | | 177 | |
Customer relationships and
contractual agreements | 15 | 356 | | (331) | | 25 | | 357 | | (326) | | 31 | |
| | | | | | | |
| Total | | $ | 1,064 | | $ | (702) | | $ | 362 | | $ | 1,067 | | $ | (668) | | $ | 399 | |
Trade names and trademarks in the table above include $169 million of indefinite-lived intangible assets at both December 28, 2024 and December 30, 2023. Amortization expense totaled $34 million, $39 million and $52 million, in 2024, 2023 and 2022, respectively. Amortization expense is estimated to be approximately $32 million, $29 million, $27 million, $26 million and $25 million in 2025, 2026, 2027, 2028 and 2029, respectively.
Note 3. Accounts Receivable and Finance Receivables
Accounts Receivable
Accounts receivable is composed of the following:
| | | | | | | | |
| (In millions) | December 28,
2024 | December 30,
2023 |
| Commercial | $ | 738 | | $ | 831 | |
| U.S. Government contracts | 230 | | 63 | |
| 968 | | 894 | |
| Allowance for credit losses | (19) | | (26) | |
| Total | $ | 949 | | $ | 868 | |
Finance Receivables
Finance receivables are presented in the following table:
| | | | | | | | |
| (In millions) | December 28,
2024 | December 30,
2023 |
| Finance receivables | $ | 622 | | $ | 609 | |
| Allowance for credit losses | (19) | | (24) | |
| Total finance receivables, net | $ | 603 | | $ | 585 | |
Finance receivables primarily includes loans provided to purchasers of new and pre-owned Textron Aviation aircraft and Bell helicopters. These loans generally have initial terms ranging from five years to twelve years and amortization terms ranging from five years to fifteen years; the average loan balance was $2.0 million at December 28, 2024. Loans generally require the customer to pay a significant down payment, along with periodic scheduled principal payments that reduce the outstanding balance through the term of the loan. Our finance receivables are diversified across geographic region and borrower industry. At December 28,
2024, 58% of our finance receivables were distributed internationally and 42% throughout the U.S., compared with 57% and 43%, respectively, at December 30, 2023.
Finance Receivable Portfolio Quality
We internally assess the quality of our finance receivables based on a number of key credit quality indicators and statistics such as delinquency, loan balance to estimated collateral value and the financial strength of individual borrowers and guarantors. Because many of these indicators are difficult to apply across an entire class of receivables, we evaluate individual loans on a quarterly basis and classify these loans into three categories based on the key credit quality indicators for the individual loan. These three categories are performing, watchlist and nonaccrual.
We classify finance receivables as nonaccrual if credit quality indicators suggest full collection of principal and interest is doubtful. In addition, we automatically classify accounts as nonaccrual once they are contractually delinquent by more than three months unless collection of principal and interest is not doubtful. Accounts are classified as watchlist when credit quality indicators have deteriorated as compared with typical underwriting criteria, and we believe collection of full principal and interest is probable but not certain. All other finance receivables that do not meet the watchlist or nonaccrual categories are classified as performing.
We measure delinquency based on the contractual payment terms of our finance receivables. In determining the delinquency aging category of an account, any/all principal and interest received is applied to the most past-due principal and/or interest amounts due. If a significant portion of the contractually due payment is delinquent, the entire finance receivable balance is reported in accordance with the most past-due delinquency aging category.
Finance receivables categorized based on the credit quality indicators and by delinquency aging category are summarized as follows:
| | | | | | | | |
| (Dollars in millions) | December 28,
2024 | December 30,
2023 |
| Performing | $ | 612 | | $ | 571 | |
| Watchlist | — | | 23 | |
| Nonaccrual | 10 | | 15 | |
| Nonaccrual as a percentage of finance receivables | 1.61% | 2.46% |
| Current and less than 31 days past due | $ | 609 | | $ | 589 | |
| 31-60 days past due | 13 | | 16 | |
| 61-90 days past due | — | | — | |
| Over 90 days past due | — | | 4 | |
| 60+ days contractual delinquency as a percentage of finance receivables | —% | 0.66% |
At December 28, 2024, 44% of our performing finance receivables were originated since the beginning of 2022 and 26% were originated from 2019 to 2021 with the remainder prior to 2019. For finance receivables categorized as nonaccrual, 100% were originated prior to 2021.
On a quarterly basis, we evaluate individual larger balance accounts for impairment. A finance receivable is considered impaired when it is probable that we will be unable to collect all amounts due according to the contractual terms of the loan agreement based on our review of the credit quality indicators described above. Impaired finance receivables include both nonaccrual accounts and accounts for which full collection of principal and interest remains probable, but the account’s original terms have been, or are expected to be, significantly modified. If the modification specifies an interest rate equal to or greater than a market rate for a finance receivable with comparable risk, the account is not considered impaired in years subsequent to the modification. Our impaired finance receivables were insignificant at December 28, 2024 and December 30, 2023.
Note 4. Inventories
Inventories are composed of the following:
| | | | | | | | |
| (In millions) | December 28,
2024 | December 30,
2023 |
| Finished goods | $ | 1,138 | | $ | 1,072 | |
| Work in process | 1,769 | | 1,736 | |
| Raw materials and components | 1,164 | | 1,106 | |
| Total | $ | 4,071 | | $ | 3,914 | |
At December 28, 2024, 69% of inventories were valued using the LIFO method, compared with 68% at December 30, 2023. Inventories valued at LIFO cost would have been higher by approximately $877 million and $701 million, at December 28, 2024 and December 30, 2023, respectively, if they had been valued using the FIFO method.
Note 5. Property, Plant and Equipment, Net
Our Manufacturing group’s property, plant and equipment, net is composed of the following:
| | | | | | | | | | | | | | | | | |
| (Dollars in millions) | Useful Lives
(in years) | December 28,
2024 | December 30,
2023 |
| Land, buildings and improvements | 2 | - | 40 | $ | 2,364 | | $ | 2,229 | |
| Machinery and equipment | 1 | - | 20 | 5,636 | | 5,495 | |
| | | | 8,000 | | 7,724 | |
| Accumulated depreciation and amortization | | | | (5,471) | | (5,247) | |
| Total | | | | $ | 2,529 | | $ | 2,477 | |
The Manufacturing group's depreciation expense totaled $344 million, $353 million and $340 million in 2024, 2023 and 2022, respectively.
Note 6. Accounts Payable and Liabilities
Accounts Payable
Supplier Financing Arrangement
We have a financing arrangement with one of our suppliers that extends payment terms for up to 190 days from the receipt of goods and provides for the supplier to be paid by a financial institution earlier than maturity. In June 2024, the maximum amount available under the financing arrangement was increased by $25 million to $200 million. This financing arrangement expires in April 2027. At December 28, 2024 and December 30, 2023, the amount due under the supplier financing arrangement was $50 million and $125 million, respectively. During 2024, the amounts added under this arrangement totaled $247 million and the amounts settled totaled $322 million.
Other Current Liabilities
The other current liabilities of our Manufacturing group are summarized below:
| | | | | | | | |
| (In millions) | December 28,
2024 | December 30,
2023 |
| Contract liabilities | $ | 1,734 | | $ | 1,595 | |
| Salaries, wages and employer taxes | 456 | | 466 | |
| Current portion of warranty and product repair and maintenance program liabilities | 177 | | 215 | |
| Other | 727 | | 722 | |
| Total | $ | 3,094 | | $ | 2,998 | |
Warranty Liability
Changes in our current and non-current warranty liability are as follows:
| | | | | | | | | | | |
| (In millions) | 2024 | 2023 | 2022 |
| Balance at beginning of year | $ | 172 | | $ | 149 | | $ | 127 | |
| Provision | 79 | | 76 | | 73 | |
| Settlements | (72) | | (69) | | (60) | |
| Adjustments* | (6) | | 16 | | 9 | |
| Balance at end of year | $ | 173 | | $ | 172 | | $ | 149 | |
* Adjustments include changes to prior year estimates, new issues on prior year sales, currency translation adjustments and acquisitions.
Note 7. Leases
We primarily lease certain manufacturing plants, offices, warehouses, training and service centers at various locations worldwide that are classified as either operating or finance leases. Our leases have remaining lease terms up to 24 years, which include options to extend the lease term for periods up to 20 years when it is reasonably certain the option will be exercised.
Operating lease cost totaled $74 million, $69 million and $69 million in 2024, 2023 and 2022, respectively. Cash paid for operating lease liabilities approximated the lease expense and is classified in cash flows from operating activities. Noncash transactions related to operating leases totaled $49 million, $54 million and $58 million in 2024, 2023 and 2022, respectively, reflecting the recognition of operating lease assets and liabilities for new or extended leases. In 2024, non-cash transactions included the recognition of a $72 million asset and liability related to a new finance lease that matures in 2028. Finance lease, variable and short-term lease costs were not significant.
Balance sheet and other information related to our leases is as follows:
| | | | | | | | |
| (Dollars in millions) | December 28,
2024 | December 30,
2023 |
| Operating leases: | | |
| Other assets | $ | 360 | | $ | 371 | |
| Other current liabilities | 55 | | 55 | |
| Other liabilities | 316 | | 326 | |
| Weighted-average remaining lease term (in years) | 10.0 | 10.3 |
| Weighted-average discount rate | 4.84% | 4.70% |
| Finance leases: | | |
Property, plant and equipment, less accumulated amortization of $9 million and $8 million, respectively | $ | 95 | | $ | 20 | |
| | |
| Long-term debt, including current portion | 97 | | 23 | |
| Weighted-average remaining lease term (in years) | 5.9 | 14.9 |
| Weighted-average discount rate | 6.72% | 4.55% |
At December 28, 2024, maturities of our operating lease liabilities on an undiscounted basis totaled $69 million for 2025, $56 million for 2026, $47 million for 2027, $45 million for 2028, $40 million for 2029 and $220 million thereafter.
Note 8. Debt and Credit Facilities
Our debt is summarized in the table below:
| | | | | | | | |
| (In millions) | December 28,
2024 | December 30,
2023 |
| Manufacturing group | | |
| 4.30% due 2024 | $ | — | | $ | 350 | |
| 3.875% due 2025 | 350 | | 350 | |
| 4.00% due 2026 | 350 | | 350 | |
| 3.65% due 2027 | 350 | | 350 | |
| 3.375% due 2028 | 300 | | 300 | |
| 3.90% due 2029 | 300 | | 300 | |
| 3.00% due 2030 | 650 | | 650 | |
| 2.45% due 2031 | 500 | | 500 | |
| 6.10% due 2033 | 350 | | 350 | |
| Other (weighted-average rate of 5.87% and 2.44%, respectively) | 97 | | 26 | |
| Total Manufacturing group debt | $ | 3,247 | | $ | 3,526 | |
| Less: Current portion of long-term debt | (357) | | (357) | |
| Total Long-term debt | $ | 2,890 | | $ | 3,169 | |
| Finance group | | |
| Variable-rate note due 2025 (weighted-average rate of 5.70% and 6.72%, respectively) | $ | 25 | | $ | 25 | |
| Fixed-rate note due 2027 (4.40%) | 50 | | 50 | |
| Floating Rate Junior Subordinated Notes due 2067 (6.52% and 7.38%, respectively) | 264 | | 264 | |
| Other | 2 | | 9 | |
| Total Finance group debt | $ | 341 | | $ | 348 | |
The following table shows required principal payments during the next five years on debt outstanding at December 28, 2024:
| | | | | | | | | | | | | | | | | |
| (In millions) | 2025 | 2026 | 2027 | 2028 | 2029 |
| Manufacturing group | $ | 357 | | $ | 355 | | $ | 355 | | $ | 375 | | $ | 301 | |
| Finance group | 26 | | 1 | | 50 | | — | | — | |
| Total | $ | 383 | | $ | 356 | | $ | 405 | | $ | 375 | | $ | 301 | |
Textron has a senior unsecured revolving credit facility for an aggregate principal amount of $1.0 billion, of which $100 million is available for the issuance of letters of credit. We may elect to increase the aggregate amount of commitments under the facility to up to $1.3 billion by designating an additional lender or by an existing lender agreeing to increase its commitment. The facility expires in October 2027 and provides for two one-year extensions at our option with the consent of lenders representing a majority of the commitments under the facility. At December 28, 2024 and December 30, 2023, there were no amounts borrowed against the facility and there were $9 million of outstanding letters of credit issued under the facility.
Floating Rate Junior Subordinated Notes
The Finance group’s $264 million of Floating Rate Junior Subordinated Notes are unsecured and rank junior to all of its existing and future senior debt. The notes mature on February 15, 2067; however, we have the right to redeem the notes at par at any time and we are obligated to redeem the notes beginning on February 15, 2042. In 2023, TFC repurchased $8 million of these notes. Interest is variable at the three-month CME Term Secured Overnight Financing Rate + 1.99661%.
Support Agreement
Under a Support Agreement between Textron and TFC, Textron is required to maintain a controlling interest in TFC. The agreement, as amended in December 2015, also requires Textron to ensure that TFC maintains fixed charge coverage of no less than 125% and consolidated shareholders' equity of no less than $125 million. There were no cash contributions required to be paid to TFC in 2024, 2023 and 2022 to maintain compliance with the support agreement.
Note 9. Derivative Instruments and Fair Value Measurements
We measure fair value at the price that would be received to sell an asset or paid to transfer a liability in an orderly transaction between market participants at the measurement date. We prioritize the assumptions that market participants would use in pricing the asset or liability into a three-tier fair value hierarchy. This fair value hierarchy gives the highest priority (Level 1) to quoted prices in active markets for identical assets or liabilities and the lowest priority (Level 3) to unobservable inputs in which little or no market data exist, requiring companies to develop their own assumptions. Observable inputs that do not meet the criteria of Level 1, which include quoted prices for similar assets or liabilities in active markets or quoted prices for identical assets and liabilities in markets that are not active, are categorized as Level 2. Level 3 inputs are those that reflect our estimates about the assumptions market participants would use in pricing the asset or liability based on the best information available in the circumstances. Valuation techniques for assets and liabilities measured using Level 3 inputs may include methodologies such as the market approach, the income approach or the cost approach and may use unobservable inputs such as projections, estimates and management’s interpretation of current market data. These unobservable inputs are utilized only to the extent that observable inputs are not available or cost effective to obtain.
Assets and Liabilities Recorded at Fair Value on a Recurring Basis
We manufacture and sell our products in a number of countries throughout the world, and, therefore, we are exposed to movements in foreign currency exchange rates. We primarily utilize foreign currency exchange contracts with maturities of no more than three years to manage this volatility. These contracts qualify as cash flow hedges and are intended to offset the effect of exchange rate fluctuations on forecasted sales, inventory purchases and overhead expenses. Net gains and losses recognized in earnings and Accumulated other comprehensive loss on cash flow hedges, including gains and losses related to hedge ineffectiveness, were not significant in the periods presented.
Our foreign currency exchange contracts are measured at fair value using the market method valuation technique. The inputs to this technique utilize current foreign currency exchange forward market rates published by third-party leading financial news and data providers. These are observable data that represent the rates that the financial institution uses for contracts entered into at that date; however, they are not based on actual transactions, so they are classified as Level 2. At December 28, 2024 and December 30, 2023, we had foreign currency exchange contracts with notional amounts upon which the contracts were based of $464 million and $478 million, respectively. At December 28, 2024, the fair value amounts of our foreign currency exchange contracts were a $5 million asset and a $19 million liability. At December 30, 2023, the fair value amount of our foreign currency exchange contracts was a $4 million asset and a $3 million liability.
Our Finance group enters into interest rate swap agreements to mitigate certain exposures to fluctuations in interest rates. By using these contracts, we are able to convert floating-rate cash flows to fixed-rate cash flows. These agreements are designated as cash flow hedges. The fair value of these interest rate swap agreements is determined using values published by third-party leading financial news and data providers. These values are observable data that represent the value that financial institutions use for contracts entered into at that date, but are not based on actual transactions, so they are classified as Level 2. The fair value of our outstanding interest rate swap agreements was an $8 million and a $4 million asset at December 28, 2024 and December 30, 2023, respectively.
At December 28, 2024, our Finance group had interest rate swap agreements related to its Floating Rate Junior Subordinated Notes for an aggregate notional amount of $264 million that effectively converts the variable-rate interest for these Notes to a weighted-average fixed rate of 5.20%. These agreements have maturities ranging from August 2025 to August 2029. In 2024, we also entered into a new swap agreement related to these Notes with a notional amount of $30 million and a weighted-average fixed rate of 5.10%; this agreement has a forward start date of August 15, 2025 and matures on August 15, 2030. At December 30, 2023, interest rate swap agreements related to these Notes had an aggregate notional amount of $185 million with a weighted-average fixed rate of 5.17%. At December 28, 2024 and December 30, 2023, we had an interest rate swap agreement with a notional amount of $25 million that matures in June 2025 and effectively converts variable-rate interest on a term loan to a fixed rate of 4.13%.
Assets and Liabilities Not Recorded at Fair Value
The carrying value and estimated fair value of our financial instruments that are not reflected in the financial statements at fair value are as follows:
| | | | | | | | | | | | | | |
| December 28, 2024 | December 30, 2023 |
| (In millions) | Carrying
Value | Estimated
Fair Value | Carrying
Value | Estimated
Fair Value |
| Manufacturing group | | | | |
| Debt, excluding leases | $ | (3,164) | | $ | (2,989) | | $ | (3,520) | | $ | (3,342) | |
| Finance group | | | | |
| Finance receivables, excluding leases | 439 | | 454 | | 417 | | 423 | |
| Debt | (341) | | (311) | | (348) | | (293) | |
Fair value for the Manufacturing group debt is determined using market observable data for similar transactions (Level 2). The fair value for the Finance group debt was determined primarily based on discounted cash flow analyses using observable market inputs from debt with similar duration, subordination and credit default expectations (Level 2). Fair value estimates for finance receivables were determined based on internally developed discounted cash flow models primarily utilizing significant unobservable inputs (Level 3), which include estimates of the rate of return, financing cost, capital structure and/or discount rate expectations of current market participants combined with estimated loan cash flows based on credit losses, payment rates and expectations of borrowers’ ability to make payments on a timely basis.
Note 10. Shareholders’ Equity
Capital Stock
We have authorization for 15 million shares of preferred stock with a par value of $0.01 and 500 million shares of common stock with a par value of $0.125. Outstanding common stock activity is presented below:
| | | | | | | | | | | |
| (In thousands) | 2024 | 2023 | 2022 |
| Balance at beginning of year | 192,898 | | 206,161 | | 216,935 | |
| Share repurchases | (12,890) | | (16,169) | | (13,075) | |
| Share-based compensation activity | 2,956 | | 2,906 | | 2,301 | |
| Balance at end of year | 182,964 | | 192,898 | | 206,161 | |
Earnings Per Share
We calculate basic and diluted earnings per share (EPS) based on net income, which approximates income available to common shareholders for each period. Basic EPS is calculated using the two-class method, which includes the weighted-average number of common shares outstanding during the period and restricted stock units to be paid in stock that are deemed participating securities as they provide nonforfeitable rights to dividends. Diluted EPS considers the dilutive effect of all potential future common stock, including stock options.
The weighted-average shares outstanding for basic and diluted EPS are as follows:
| | | | | | | | | | | |
| (In thousands) | 2024 | 2023 | 2022 |
| Basic weighted-average shares outstanding | 188,318 | | 199,719 | | 212,809 | |
| Dilutive effect of stock options | 1,989 | | 2,055 | | 2,164 | |
| Diluted weighted-average shares outstanding | 190,307 | | 201,774 | | 214,973 | |
In 2024, 2023 and 2022, stock options to purchase 0.9 million, 1.5 million and 1.0 million shares, respectively, of common stock were excluded from the calculation of diluted weighted-average shares outstanding as their effect would have been anti-dilutive.
Accumulated Other Comprehensive Loss
The components of Accumulated other comprehensive loss are presented below:
| | | | | | | | | | | | | | |
| (In millions) | Pension and
Postretirement
Benefits
Adjustments | Foreign
Currency
Translation
Adjustments | Deferred
Gains (Losses)
on Hedge
Contracts | Accumulated
Other
Comprehensive
Loss |
| Balance at December 31, 2022 | $ | (516) | | $ | (94) | | $ | (2) | | $ | (612) | |
| Other comprehensive loss before reclassifications | (82) | | 45 | | (1) | | (38) | |
| Reclassified from Accumulated other comprehensive loss | — | | — | | 6 | | 6 | |
| | | | |
| Balance at December 30, 2023 | $ | (598) | | $ | (49) | | $ | 3 | | $ | (644) | |
| Other comprehensive income before reclassifications | 418 | | (74) | | (9) | | 335 | |
| Reclassified from Accumulated other comprehensive loss | 1 | | 3 | | 1 | | 5 | |
| Balance at December 28, 2024 | $ | (179) | | $ | (120) | | $ | (5) | | $ | (304) | |
Other Comprehensive Income (Loss)
The before and after-tax components of other comprehensive income (loss) are presented below:
| | | | | | | | | | | | | | | | | | | | | | | | | | | | | |
| 2024 | 2023 | 2022 |
| (In millions) | Pre-Tax
Amount | Tax
(Expense)
Benefit | After-
Tax
Amount | Pre-Tax
Amount | Tax
(Expense)
Benefit | After-
Tax
Amount | Pre-Tax
Amount | Tax
(Expense)
Benefit | After-
Tax
Amount |
Pension and postretirement benefits
adjustments: | | | | | | | | | |
| Unrealized gains (losses) | $ | 568 | | $ | (136) | | $ | 432 | | $ | (102) | | $ | 25 | | $ | (77) | | $ | 285 | | $ | (67) | | $ | 218 | |
| Amortization of net actuarial (gain) loss* | (5) | | 1 | | (4) | | (7) | | 2 | | (5) | | 83 | | (20) | | 63 | |
| Amortization of prior service cost* | 8 | | (3) | | 5 | | 8 | | (3) | | 5 | | 8 | | (2) | | 6 | |
| Recognition of prior service cost | (19) | | 5 | | (14) | | (7) | | 2 | | (5) | | (4) | | — | | (4) | |
| | | | | | | | | |
Pension and postretirement benefits
adjustments, net | 552 | | (133) | | 419 | | (108) | | 26 | | (82) | | 372 | | (89) | | 283 | |
| Foreign currency translation adjustments: | | | | | | | | | |
| Foreign currency translation adjustments | (74) | | — | | (74) | | 45 | | — | | 45 | | (103) | | — | | (103) | |
| Other | 3 | | — | | 3 | | — | | — | | — | | — | | — | | — | |
| Foreign currency translation adjustments, net | (71) | | — | | (71) | | 45 | | — | | 45 | | (103) | | — | | (103) | |
| Deferred gains (losses) on hedge contracts: | | | | | | | | | |
| Current deferrals | (11) | | 2 | | (9) | | (2) | | 1 | | (1) | | (7) | | 4 | | (3) | |
| Reclassification adjustments | 2 | | (1) | | 1 | | 8 | | (2) | | 6 | | — | | — | | — | |
Deferred gains (losses) on hedge
contracts, net | (9) | | 1 | | (8) | | 6 | | (1) | | 5 | | (7) | | 4 | | (3) | |
| Total | $ | 472 | | $ | (132) | | $ | 340 | | $ | (57) | | $ | 25 | | $ | (32) | | $ | 262 | | $ | (85) | | $ | 177 | |
* These components of other comprehensive income (loss) are included in the computation of net periodic pension cost. See Note 14 for additional information.
Note 11. Segment Financial Information
We operate in, and report financial information for, the following six operating segments: Textron Aviation, Bell, Textron Systems, Industrial, Textron eAviation and Finance. The accounting policies of the segments are the same as those described in Note 1.
Textron Aviation products and services include Cessna Citation jets, Beechcraft and Cessna turboprop aircraft, military trainer and defense aircraft, piston engine aircraft, advanced flight training devices, aftermarket parts and maintenance, inspection and repair services. Textron Aviation has a diverse customer base including fractional aircraft businesses, charter and fleet operators, corporate aviation, individual buyers, training schools, airlines, and special mission, military and government operators.
Bell products and services include development of a next generation tiltrotor aircraft, the V-22 tiltrotor aircraft, advanced military helicopters, and aftermarket parts and support services to the U.S. and non-U.S. governments. Bell also supplies commercial helicopters and aftermarket parts and services to corporate, private, law enforcement, utility, public safety and emergency medical helicopter operators, and U.S. and foreign governments.
Textron Systems products and services include electronic systems and solutions, advanced marine craft, piston aircraft engines, live military air-to-air and air-to-ship training, weapons and related components, unmanned aircraft systems, and both manned and unmanned armored and specialty vehicles for U.S. and international military, government and commercial customers.
Industrial products and markets include the following:
•Kautex products include blow-molded plastic fuel systems, including conventional plastic fuel tanks and pressurized fuel tanks for hybrid vehicle applications, clear-vision systems, plastic tanks for selective catalytic reduction systems and battery systems for use in electric vehicles, from hybrid to full battery-powered, that are sold to automobile OEMs; and
•Textron Specialized Vehicles products include golf cars, off-road utility vehicles, powersports products, light transportation vehicles, aviation ground support equipment, professional turf-maintenance equipment and specialized turf-care vehicles that are marketed primarily to golf courses and resorts, government agencies and municipalities, consumers, outdoor enthusiasts, and commercial and industrial users.
The Textron eAviation segment is focused on research and development initiatives related to sustainable aviation solutions and also manufactures a family of light aircraft and gliders with both electric and combustion engines.
The Finance segment provides financing primarily to purchasers of new and pre-owned Textron Aviation aircraft and Bell helicopters.
In November 2023, the Financial Accounting Standards Board issued Accounting Standard Update (ASU) No. 2023-07, Segment Reporting (Topic 280): Improvements to Reportable Segment Disclosures, which requires a public entity to disclose, on an annual and interim basis, significant segment expenses and other segment items that are regularly provided to the Chief Operating Decision Maker (CODM). The new standard is effective for fiscal years beginning after December 15, 2023. We adopted ASU 2023-07 in the fourth quarter of 2024. In connection with the adoption of this standard, research and development costs previously included within Cost of products sold are now reported on a separate line in our Consolidated Statements of Operations. Prior period amounts have been recast to conform to the new presentation.
Textron’s CODM is its Chairman and Chief Executive Officer, Scott Donnelly. Mr. Donnelly utilizes segment profit to evaluate the performance of the segments to establish management's compensation and for decision-making purposes, including the allocation of capital resources between segments. Segment profit for the manufacturing segments excludes the non-service components of pension and postretirement income, net; LIFO inventory provision; intangible asset amortization; interest expense, net for Manufacturing group; certain corporate expenses; gains/losses on major business dispositions; special charges; and the inventory valuation charge to write down production-related powersports inventory discussed in Note 15. The measurement for the Finance segment includes interest income and expense along with intercompany interest income and expense.
Our revenues and expenses by segment are provided below:
| | | | | | | | | | | | | | | | | | | | | | | |
| (in millions) | Textron Aviation | Bell | Textron Systems | Industrial | Textron eAviation | Finance | Total |
| 2024 | | | | | | | |
| Revenues | $ | 5,284 | | $ | 3,579 | | $ | 1,241 | | $ | 3,515 | | $ | 33 | | $ | 50 | | $ | 13,702 | |
| Costs and expenses: | | | | | | | |
| Cost of sales | 4,102 | | 2,899 | | 929 | | 2,993 | | 29 | | — | | 10,952 | |
| Research and development costs | 208 | | 97 | | 51 | | 72 | | 63 | | — | | 491 | |
| Selling and administrative expense | 408 | | 213 | | 107 | | 299 | | 17 | | (4) | | 1,040 | |
| Interest expense, net | — | | — | | — | | — | | — | | 19 | | 19 | |
| Segment profit (loss) | $ | 566 | | $ | 370 | | $ | 154 | | $ | 151 | | $ | (76) | | $ | 35 | | $ | 1,200 | |
| 2023 | | | | | | | |
| Revenues | $ | 5,373 | | $ | 3,147 | | $ | 1,235 | | $ | 3,841 | | $ | 32 | | $ | 55 | | $ | 13,683 | |
| Costs and expenses: | | | | | | | |
| Cost of sales | 4,116 | | 2,392 | | 925 | | 3,221 | | 35 | | — | | 10,689 | |
| Research and development costs | 199 | | 192 | | 53 | | 80 | | 46 | | — | | 570 | |
| Selling and administrative expense | 409 | | 243 | | 110 | | 312 | | 14 | | (6) | | 1,082 | |
| Interest expense, net | — | | — | | — | | — | | — | | 15 | | 15 | |
| Segment profit (loss) | $ | 649 | | $ | 320 | | $ | 147 | | $ | 228 | | $ | (63) | | $ | 46 | | $ | 1,327 | |
| 2022 | | | | | | | |
| Revenues | $ | 5,073 | | $ | 3,091 | | $ | 1,172 | | $ | 3,465 | | $ | 16 | | $ | 52 | | $ | 12,869 | |
| Costs and expenses: | | | | | | | |
| Cost of sales | 3,905 | | 2,316 | | 878 | | 2,959 | | 18 | | — | | 10,076 | |
| Research and development costs | 191 | | 266 | | 53 | | 71 | | 20 | | — | | 601 | |
| Selling and administrative expense | 417 | | 227 | | 109 | | 280 | | 2 | | 8 | | 1,043 | |
| Interest expense, net | — | | — | | — | | — | | — | | 13 | | 13 | |
| Segment profit (loss) | $ | 560 | | $ | 282 | | $ | 132 | | $ | 155 | | $ | (24) | | $ | 31 | | $ | 1,136 | |
A reconciliation of segment profit to income from continuing operations before income taxes is presented below:
| | | | | | | | | | | |
| | | |
| (in millions) | 2024 | 2023 | 2022 |
| Segment profit | $ | 1,200 | | $ | 1,327 | | $ | 1,136 | |
| Unallocated amounts: | | | |
| Corporate expenses and other, net | (116) | | (143) | | (143) | |
| Interest expense, net for Manufacturing group | (78) | | (62) | | (94) | |
| LIFO inventory provision | (176) | | (107) | | (71) | |
| Intangible asset amortization | (34) | | (39) | | (52) | |
| Special charges* | (78) | | (126) | | — | |
| Inventory charge* | (38) | | — | | — | |
| Non-service components of pension and postretirement income, net | 263 | | 237 | | 240 | |
| Income from continuing operations before income taxes | $ | 943 | | $ | 1,087 | | $ | 1,016 | |
* See Note 15 for additional information.
Other information by segment is provided below:
| | | | | | | | | | | | | | | | | | | | | | | | | | |
| Assets | Capital Expenditures | Depreciation and Amortization |
| (In millions) | December 28,
2024 | December 30,
2023 | 2024 | 2023 | 2022 | 2024 | 2023 | 2022 |
| Textron Aviation | $ | 4,624 | | $ | 4,542 | | $ | 136 | | $ | 138 | | $ | 138 | | $ | 164 | | $ | 160 | | $ | 152 | |
| Bell | 2,992 | | 2,869 | | 122 | | 119 | | 80 | | 86 | | 89 | | 90 | |
| Textron Systems | 2,036 | | 2,008 | | 40 | | 48 | | 57 | | 48 | | 41 | | 49 | |
| Industrial | 2,378 | | 2,520 | | 62 | | 91 | | 78 | | 70 | | 89 | | 93 | |
| Textron eAviation | 286 | | 287 | | 4 | | 4 | | 1 | | 7 | | 7 | | 2 | |
| Finance | 680 | | 661 | | — | | — | | — | | — | | — | | 1 | |
| Corporate | 3,842 | | 3,969 | | — | | 2 | | — | | 7 | | 9 | | 10 | |
| Total | $ | 16,838 | | $ | 16,856 | | $ | 364 | | $ | 402 | | $ | 354 | | $ | 382 | | $ | 395 | | $ | 397 | |
At December 28, 2024 and December 30, 2023, 86% and 85%, respectively, of our property, plant and equipment, net was located in the United States.
Note 12. Revenues
Disaggregation of Revenues
Our revenues disaggregated by major product type are presented below:
| | | | | | | | | | | |
| (In millions) | 2024 | 2023 | 2022 |
| Aircraft | $ | 3,374 | | $ | 3,577 | | $ | 3,387 | |
| Aftermarket parts and services | 1,910 | | 1,796 | | 1,686 | |
| Textron Aviation | $ | 5,284 | | $ | 5,373 | | $ | 5,073 | |
| Military aircraft and support programs | 2,048 | | 1,701 | | 1,740 | |
| Commercial helicopters, parts and services | 1,531 | | 1,446 | | 1,351 | |
| Bell | $ | 3,579 | | $ | 3,147 | | $ | 3,091 | |
| Textron Systems | $ | 1,241 | | $ | 1,235 | | $ | 1,172 | |
| Fuel systems and functional components | 1,891 | | 1,954 | | 1,771 | |
| Specialized vehicles | 1,624 | | 1,887 | | 1,694 | |
| Industrial | $ | 3,515 | | $ | 3,841 | | $ | 3,465 | |
| Textron eAviation | $ | 33 | | $ | 32 | | $ | 16 | |
| Finance | $ | 50 | | $ | 55 | | $ | 52 | |
| Total revenues | $ | 13,702 | | $ | 13,683 | | $ | 12,869 | |
Our revenues for our segments by customer type and geographic location are presented below:
| | | | | | | | | | | | | | | | | | | | | | | |
| (In millions) | Textron
Aviation | Bell | Textron
Systems | Industrial | Textron eAviation | Finance | Total |
| 2024 | | | | | | | |
| Customer type: | | | | | | | |
| Commercial | $ | 4,985 | | $ | 1,490 | | $ | 292 | | $ | 3,482 | | $ | 33 | | $ | 50 | | $ | 10,332 | |
| U.S. Government | 299 | | 2,089 | | 949 | | 33 | | — | | — | | 3,370 | |
| Total revenues | $ | 5,284 | | $ | 3,579 | | $ | 1,241 | | $ | 3,515 | | $ | 33 | | $ | 50 | | $ | 13,702 | |
| Geographic location: | | | | | | | |
| United States | $ | 4,019 | | $ | 2,644 | | $ | 1,112 | | $ | 1,865 | | $ | 19 | | $ | 17 | | $ | 9,676 | |
| Europe | 371 | | 85 | | 45 | | 693 | | 11 | | 5 | | 1,210 | |
| | | | | | | |
| Other international | 894 | | 850 | | 84 | | 957 | | 3 | | 28 | | 2,816 | |
| Total revenues | $ | 5,284 | | $ | 3,579 | | $ | 1,241 | | $ | 3,515 | | $ | 33 | | $ | 50 | | $ | 13,702 | |
| 2023 | | | | | | | |
| Customer type: | | | | | | | |
| Commercial | $ | 5,155 | | $ | 1,407 | | $ | 282 | | $ | 3,819 | | $ | 32 | | $ | 55 | | $ | 10,750 | |
| U.S. Government | 218 | | 1,740 | | 953 | | 22 | | — | | — | | 2,933 | |
| Total revenues | $ | 5,373 | | $ | 3,147 | | $ | 1,235 | | $ | 3,841 | | $ | 32 | | $ | 55 | | $ | 13,683 | |
| Geographic location: | | | | | | | |
| United States | $ | 3,873 | | $ | 2,228 | | $ | 1,103 | | $ | 2,067 | | $ | 17 | | $ | 17 | | $ | 9,305 | |
| Europe | 432 | | 149 | | 54 | | 766 | | 11 | | 2 | | 1,414 | |
| | | | | | | |
| Other international | 1,068 | | 770 | | 78 | | 1,008 | | 4 | | 36 | | 2,964 | |
| Total revenues | $ | 5,373 | | $ | 3,147 | | $ | 1,235 | | $ | 3,841 | | $ | 32 | | $ | 55 | | $ | 13,683 | |
| 2022 | | | | | | | |
| Customer type: | | | | | | | |
| Commercial | $ | 4,959 | | $ | 1,284 | | $ | 274 | | $ | 3,450 | | $ | 16 | | $ | 52 | | $ | 10,035 | |
| U.S. Government | 114 | | 1,807 | | 898 | | 15 | | — | | — | | 2,834 | |
| Total revenues | $ | 5,073 | | $ | 3,091 | | $ | 1,172 | | $ | 3,465 | | $ | 16 | | $ | 52 | | $ | 12,869 | |
| Geographic location: | | | | | | | |
| United States | $ | 3,520 | | $ | 2,242 | | $ | 1,054 | | $ | 1,862 | | $ | 7 | | $ | 17 | | $ | 8,702 | |
| Europe | 579 | | 139 | | 42 | | 699 | | 6 | | 3 | | 1,468 | |
| | | | | | | |
| Other international | 974 | | 710 | | 76 | | 904 | | 3 | | 32 | | 2,699 | |
| Total revenues | $ | 5,073 | | $ | 3,091 | | $ | 1,172 | | $ | 3,465 | | $ | 16 | | $ | 52 | | $ | 12,869 | |
Remaining Performance Obligations
Our remaining performance obligations, which is the equivalent of our backlog, represent the expected transaction price allocated to our contracts that we expect to recognize as revenue in future periods when we perform under the contracts. These remaining obligations exclude unexercised contract options and potential orders under ordering-type contracts such as Indefinite Delivery, Indefinite Quantity contracts. At December 28, 2024, we had $17.9 billion in remaining performance obligations of which we expect to recognize revenues of approximately 76% through 2026, an additional 19% through 2028, and the balance thereafter.
Contract Assets and Liabilities
Assets and liabilities related to our contracts with customers are reported on a contract-by-contract basis at the end of each reporting period. At December 28, 2024 and December 30, 2023, contract assets totaled $345 million and $513 million, respectively, and contract liabilities totaled $1.9 billion and $1.8 billion, respectively, reflecting timing differences between revenues recognized, billings and payments from customers. During 2024, 2023 and 2022, we recognized revenues of $1.1 billion, $953 million and $873 million, respectively, that were included in the contract liability balance at the beginning of each year.
Note 13. Share-Based Compensation
In April 2024, our shareholders approved our 2024 Long-Term Incentive Plan (the 2024 Plan), which replaced our 2015 Long-Term Incentive Plan (the 2015 Plan). Under the 2024 Plan, consistent with the 2015 Plan, we have authorization to provide awards to selected employees and non-employee directors in the form of stock options, restricted stock, restricted stock units, stock appreciation rights, performance stock, performance share units and other awards. A maximum of 10 million shares is authorized for issuance for all purposes under the 2024 Plan plus any shares that become available upon cancellation, forfeiture or expiration of awards granted under the 2015 Plan. Under the 2024 Plan, the maximum number of shares that may be issued pursuant to awards payable in shares, such as restricted stock, restricted stock units, performance stock, performance share units, or other awards is 3.127 million, plus any shares that become available upon cancellation, forfeiture or expiration of such awards which were granted under the 2015 Plan. For 2024, 2023 and 2022, the awards granted under these plans primarily included stock options, restricted stock units and performance share units.
Share-based compensation costs are reflected primarily in selling and administrative expense. Compensation expense included in net income for our share-based compensation plans is as follows:
| | | | | | | | | | | |
| (In millions) | 2024 | 2023 | 2022 |
| Compensation expense | $ | 66 | | $ | 94 | | $ | 66 | |
| Income tax benefit | (16) | | (23) | | (16) | |
| Total compensation expense included in net income | $ | 50 | | $ | 71 | | $ | 50 | |
Compensation cost for awards subject only to service conditions that vest ratably is recognized on a straight-line basis over the requisite service period for each separately vesting portion of the award utilizing an estimated forfeiture rate. Our awards include continued vesting provisions for retirement eligible employees. Upon reaching retirement eligibility, the service requirement for these individuals is considered to have been satisfied and compensation expense for future awards is recognized on the date of the grant.
As of December 28, 2024, we had not recognized $27 million of total compensation costs associated with unvested awards subject only to service conditions. We expect to recognize compensation expense for these awards over a weighted-average period of approximately two years. We typically grant stock appreciation rights to selected non-U.S. employees. At December 28, 2024, outstanding stock appreciation rights totaled 391,414 with a weighted-average exercise price of $64.09 and a weighted-average remaining contractual life of 6.1 years; these units had an intrinsic value of $6 million, compared to $12 million at December 30, 2023.
Stock Options
Stock option compensation expense was $25 million, $23 million and $22 million in 2024, 2023 and 2022, respectively. Options to purchase our shares have a maximum term of ten years and generally vest ratably over a three-year period. Stock option compensation cost is calculated under the fair value approach using the Black-Scholes option-pricing model to determine the fair value of options granted on the date of grant. The expected volatility used in this model is based on historical volatilities and implied volatilities from traded options on our common stock. The expected term is based on historical option exercise data, which is adjusted to reflect any anticipated changes in expected behavior.
We grant options annually on the first day of March. The assumptions used in our option-pricing model for these grants and the weighted-average fair value for these options are as follows:
| | | | | | | | | | | |
| 2024 | 2023 | 2022 |
| Fair value of options at grant date | $ | 27.69 | $ | 23.83 | $ | 19.95 |
| Dividend yield | 0.1% | 0.1% | 0.1% |
| Expected volatility | 27.2% | 29.4% | 29.2% |
| Risk-free interest rate | 4.3% | 4.2% | 1.9% |
| Expected term (in years) | 4.8 | 4.8 | 4.8 |
The stock option activity during 2024 is provided below:
| | | | | | | | |
| (Options in thousands) | Number of
Options | Weighted-
Average
Exercise Price |
| Outstanding at beginning of year | 7,515 | | $ | 54.25 | |
| Granted | 1,094 | | 88.01 | |
| Exercised | (1,904) | | (46.95) | |
| Forfeited or expired | (56) | | (77.72) | |
| Outstanding at end of year | 6,649 | | $ | 61.70 | |
| Exercisable at end of year | 4,585 | | $ | 53.37 | |
At December 28, 2024, our outstanding options had an aggregate intrinsic value of $115 million and a weighted-average remaining contractual life of 5.7 years. Our exercisable options had an aggregate intrinsic value of $109 million and a weighted-average remaining contractual life of 4.5 years at December 28, 2024. The total intrinsic value of options exercised during 2024, 2023 and 2022 was $78 million, $50 million and $32 million, respectively.
Restricted Stock Units
We issue restricted stock units that include the right to receive dividend equivalents and are settled in either cash or stock. Beginning in 2020, new grants of restricted stock units vest in full on the third anniversary of the grant date. Restricted stock units granted prior to 2020 vest one-third each in the third, fourth and fifth year following the year of the grant. Compensation cost is determined using the fair value of these units based on the trading price of our common stock. For units payable in stock, we use the trading price on the grant date, while units payable in cash are remeasured using the price at each reporting period date.
The 2024 activity for restricted stock units is provided below:
| | | | | | | | | | | | | | | | | |
| Units Payable in Stock | | Units Payable in Cash |
| (Shares/Units in thousands) | Number of
Shares | Weighted-
Average Grant
Date Fair Value | | Number of
Units | Weighted-
Average Grant
Date Fair Value |
| Outstanding at beginning of year, nonvested | 396 | | $ | 61.73 | | | 810 | | $ | 63.06 | |
| Granted | 110 | | 89.45 | | | 221 | | 88.69 | |
| Vested | (175) | | (53.16) | | | (373) | | (52.50) | |
| Forfeited | — | | — | | | (27) | | (74.80) | |
| Outstanding at end of year, nonvested | 331 | | $ | 75.50 | | | 631 | | $ | 77.75 | |
The fair value of the restricted stock unit awards that vested and/or amounts paid under these awards is as follows:
| | | | | | | | | | | |
| (In millions) | 2024 | 2023 | 2022 |
| Fair value of awards vested | $ | 42 | | $ | 45 | | $ | 25 | |
| Cash paid | 33 | | 34 | | 17 | |
Performance Share Units
The fair value of share-based compensation awards accounted for as liabilities includes performance share units, which are generally paid in cash in the first quarter of the year following vesting. Performance share units are subject to performance goals set at the beginning of the three-year performance period and vest at the end of the performance period. These units are remeasured to fair value at the end of each reporting period based on the trading price of our common stock and the number of units, as adjusted based on assumptions with respect to performance on the relevant metrics.
The 2024 activity for our performance share units is as follows:
| | | | | | | | |
| (Units in thousands) | Number of
Units | Weighted-
Average Grant
Date Fair Value |
| Outstanding at beginning of year, nonvested | 366 | | $ | 72.23 | |
| Granted | 194 | | 88.68 | |
| Vested | (166) | | (71.07) | |
| | |
| Outstanding at end of year, nonvested | 394 | | $ | 80.81 | |
The fair value of the performance share units that vested and/or amounts paid under these awards is as follows:
| | | | | | | | | | | |
| (In millions) | 2024 | 2023 | 2022 |
| Fair value of awards vested | $ | 13 | | $ | 19 | | $ | 19 | |
| Cash paid | 35 | | 27 | | 15 | |
Note 14. Retirement Plans
We provide defined-contribution benefits to eligible employees, as well as some remaining defined-benefit pension and other post-retirement benefits covering certain of our U.S. and Non-U.S. employees. Substantially all of our employees are covered by defined contribution plans. The largest of these plans, the Textron Savings Plan, is a qualified 401(k) plan subject to the Employee Retirement Income Security Act of 1974 (ERISA). Our defined contribution plans cost $164 million, $154 million and $140 million in 2024, 2023 and 2022, respectively. We also provide postretirement benefits other than pensions for certain retired employees in the U.S. that include healthcare, dental care, Medicare Part B reimbursement and life insurance.
A portion of our U.S. employees participate in the legacy defined benefit pension plans which were closed to new participants beginning on January 1, 2010. These legacy plans include the Textron Master Retirement Plan (TMRP), the Bell Helicopter Textron Master Retirement Plan, and the CWC Castings Division of Textron Inc. Hourly-Rated Employees' Pension Plan, which are each subject to the provisions of ERISA and provide a minimum guaranteed benefit to participants. The primary factors affecting the benefits earned by participants in our pension plans are employees’ years of service and compensation levels. Employees hired subsequent to the closure of these plans receive an additional annual cash contribution to their Textron Savings Plan account based on their eligible compensation of up to 4%.
Periodic Benefit Cost (Income)
The components of net periodic benefit cost (income) and other amounts recognized in other comprehensive income (loss) (OCI) are as follows:
| | | | | | | | | | | | | | | | | | | | |
| Pension Benefits | Postretirement Benefits
Other than Pensions |
| (In millions) | 2024 | 2023 | 2022 | 2024 | 2023 | 2022 |
| Net periodic benefit cost (income) | | | | | | |
| Service cost | $ | 69 | | $ | 67 | | $ | 108 | | $ | 1 | | $ | 2 | | $ | 2 | |
| Interest cost | 362 | | 364 | | 272 | | 7 | | 8 | | 6 | |
| Expected return on plan assets | (635) | | (610) | | (609) | | — | | — | | — | |
| Amortization of prior service cost (credit) | 9 | | 11 | | 13 | | (1) | | (3) | | (5) | |
| Amortization of net actuarial loss (gain) | 3 | | 1 | | 87 | | (8) | | (8) | | (4) | |
| Net periodic benefit cost (income)* | $ | (192) | | $ | (167) | | $ | (129) | | $ | (1) | | $ | (1) | | $ | (1) | |
| Other changes in plan assets and benefit obligations recognized in OCI | | | | | | |
| Current year actuarial loss (gain) | $ | (561) | | $ | 109 | | $ | (246) | | $ | (7) | | $ | (7) | | $ | (39) | |
| Current year prior service cost | 19 | | 7 | | 4 | | — | | — | | — | |
| Amortization of net actuarial gain (loss) | (3) | | (1) | | (87) | | 8 | | 8 | | 4 | |
| Amortization of prior service credit (cost) | (9) | | (11) | | (13) | | 1 | | 3 | | 5 | |
| | | | | | |
| Total recognized in OCI, before taxes | $ | (554) | | $ | 104 | | $ | (342) | | $ | 2 | | $ | 4 | | $ | (30) | |
| Total recognized in net periodic benefit cost (income) and OCI | $ | (746) | | $ | (63) | | $ | (471) | | $ | 1 | | $ | 3 | | $ | (31) | |
* Excludes the cost associated with the defined contribution component that is included in certain of our U.S.-based defined benefit pension plans, of $10 million in 2024, and $11 million for both 2023 and 2022.
Obligations and Funded Status
All of our plans are measured as of our fiscal year-end. The changes in the projected benefit obligation and in the fair value of plan assets, along with our funded status, are as follows:
| | | | | | | | | | | | | | |
| Pension Benefits | Postretirement Benefits
Other than Pensions |
| (In millions) | December 28, 2024 | December 30, 2023 | December 28, 2024 | December 30, 2023 |
| Change in projected benefit obligation | | | | |
| Projected benefit obligation at beginning of year | $ | 7,205 | | $ | 6,848 | | $ | 136 | | $ | 150 | |
| Service cost | 69 | | 67 | | 1 | | 2 | |
| Interest cost | 362 | | 364 | | 7 | | 8 | |
| Plan participants’ contributions | — | | — | | 3 | | 3 | |
| Actuarial losses (gains) | (392) | | 330 | | (7) | | (7) | |
| Benefits paid | (454) | | (444) | | (19) | | (20) | |
| Plan amendment | 19 | | 7 | | — | | — | |
| Foreign exchange rate changes and other | (21) | | 33 | | — | | — | |
| Projected benefit obligation at end of year | $ | 6,788 | | $ | 7,205 | | $ | 121 | | $ | 136 | |
| Change in fair value of plan assets | | | | |
| Fair value of plan assets at beginning of year | $ | 8,413 | | $ | 7,943 | | | |
| Actual return on plan assets | 806 | | 832 | | | |
| Employer contributions | 34 | | 36 | | | |
| Benefits paid | (454) | | (444) | | | |
| Foreign exchange rate changes and other | (27) | | 46 | | | |
| Fair value of plan assets at end of year | $ | 8,772 | | $ | 8,413 | | | |
| Funded status at end of year | $ | 1,984 | | $ | 1,208 | | $ | (121) | | $ | (136) | |
Actuarial losses (gains) for 2024 and 2023 were largely the result of changes in the discount rate utilized.
Amounts recognized in our balance sheets are as follows:
| | | | | | | | | | | | | | |
| Pension Benefits | Postretirement Benefits
Other than Pensions |
| (In millions) | December 28, 2024 | December 30, 2023 | December 28, 2024 | December 30, 2023 |
| Non-current assets | $ | 2,311 | | $ | 1,569 | | $ | — | | $ | — | |
| Current liabilities | (29) | | (28) | | (15) | | (17) | |
| Non-current liabilities | (298) | | (333) | | (106) | | (119) | |
| Recognized in Accumulated other comprehensive loss, pre-tax: | | | | |
| Net loss (gain) | 167 | | 730 | | (69) | | (69) | |
| Prior service cost (credit) | 52 | | 42 | | (1) | | (3) | |
The accumulated benefit obligation for all defined benefit pension plans was $6.5 billion and $6.9 billion at December 28, 2024 and December 30, 2023, respectively, which included $316 million and $336 million, respectively, in accumulated benefit obligations for unfunded plans where funding is not permitted or in foreign environments where funding is not feasible.
Pension plans with accumulated benefit obligation exceeding the fair value of plan assets are as follows:
| | | | | | | | |
| (In millions) | December 28, 2024 | December 30, 2023 |
| Accumulated benefit obligation | $ | 316 | | $ | 336 | |
| Fair value of plan assets | — | | — | |
Pension plans with projected benefit obligation exceeding the fair value of plan assets are as follows:
| | | | | | | | |
| (In millions) | December 28, 2024 | December 30, 2023 |
| Projected benefit obligation | $ | 327 | | $ | 652 | |
| Fair value of plan assets | — | | 292 | |
Assumptions
The weighted-average assumptions we use for our pension and postretirement plans are as follows:
| | | | | | | | | | | | | | | | | | | | |
| Pension Benefits | Postretirement Benefits
Other than Pensions |
| 2024 | 2023 | 2022 | 2024 | 2023 | 2022 |
| Net periodic benefit cost | | | | | | |
| Discount rate | 5.19% | 5.51% | 2.99% | 5.40% | 5.70% | 2.80% |
| Expected long-term rate of return on assets | 7.16% | 7.14% | 7.10% | | | |
| Rate of compensation increase | 3.97% | 3.97% | 3.95% | | | |
| Benefit obligations at year-end | | | | | | |
| Discount rate | 5.73% | 5.19% | 5.51% | 5.75% | 5.40% | 5.70% |
| Rate of compensation increase | 3.97% | 3.97% | 3.97% | | | |
| Interest crediting rate for cash balance plans | 5.25% | 5.25% | 5.25% | | | |
Our assumed healthcare cost trend rate for both the medical and prescription drug cost was 6.50% in 2024 and 6.50% in 2023. We expect this rate to gradually decline to 4.75% by 2031 where we assume it will remain.
Pension Assets
The expected long-term rate of return on plan assets is determined based on a variety of considerations, including the established asset allocation targets and expectations for those asset classes, historical returns of the plans’ assets and other market considerations. We invest our pension assets with the objective of achieving a total rate of return over the long term that will be sufficient to fund future pension obligations and to minimize future pension contributions. We are willing to tolerate a commensurate level of risk to achieve this objective based on the funded status of the plans and the long-term nature of our pension liability. Risk is controlled by maintaining a portfolio of assets that is diversified across a variety of asset classes, investment styles and investment managers. Where possible, investment managers are prohibited from owning our securities in the portfolios that they manage on our behalf.
For U.S. plan assets, which represent the majority of our plan assets, asset allocation target ranges are established consistent with our investment objectives, and the assets are rebalanced periodically. For Non-U.S. plan assets, allocations are based on expected cash flow needs and assessments of the local practices and markets. Our target allocation ranges are as follows:
| | | | | | | | | | | |
| U.S. Plan Assets | | | |
| Domestic equity securities | 17 | % | to | 33% |
| International equity securities | 6 | % | to | 17% |
| Global equities | 5 | % | to | 17% |
| Debt securities | 27 | % | to | 38% |
| Real estate | 7 | % | to | 13% |
| Private investment partnerships | 7 | % | to | 13% |
| Non-U.S. Plan Assets | | | |
| Equity securities | 55 | % | to | 75% |
| Debt securities | 25 | % | to | 45% |
| Real estate | — | % | to | 13% |
The fair value of our pension plan assets by major category and valuation method is as follows:
| | | | | | | | | | | | | | | | | | | | | | | | | | |
| December 28, 2024 | December 30, 2023 |
| (In millions) | Level 1 | Level 2 | Level 3 | Not
Subject to
Leveling | Level 1 | Level 2 | Level 3 | Not
Subject to
Leveling |
| Cash and equivalents | $ | 159 | | $ | 1 | | $ | — | | $ | — | | $ | 231 | | $ | 1 | | $ | — | | $ | — | |
| Equity securities: | | | | | | | | |
| Domestic | 3,151 | | — | | — | | 307 | | 2,754 | | — | | — | | 299 | |
| International | 1,028 | | — | | — | | 290 | | 1,061 | | — | | — | | 281 | |
| Mutual funds | 194 | | — | | — | | — | | 117 | | — | | — | | — | |
| Debt securities: | | | | | | | | |
| National, state and local governments | 899 | | 60 | | — | | 13 | | 679 | | 142 | | — | | 88 | |
| Corporate debt | 46 | | 618 | | — | | 148 | | 164 | | 610 | | — | | 90 | |
| | | | | | | | |
| Private investment partnerships | — | | — | | — | | 974 | | — | | — | | — | | 1,000 | |
| Real estate | — | | — | | 479 | | 405 | | — | | — | | 508 | | 388 | |
| Total | $ | 5,477 | | $ | 679 | | $ | 479 | | $ | 2,137 | | $ | 5,006 | | $ | 753 | | $ | 508 | | $ | 2,146 | |
Cash and equivalents, equity securities and debt securities include commingled funds, which represent investments in funds offered to institutional investors that are similar to mutual funds in that they provide diversification by holding various equity and debt securities. Generally, the fair value of the majority of the commingled funds is determined and published by the fund's investment managers and is the basis for current transactions, therefore, they are categorized as Level 1 in the table above. Certain commingled funds, consisting of underlying equity and fixed income securities, are stated at their Net Asset Value (NAV) per share because such investments do not have readily determinable fair values and, therefore, are not subject to leveling within the fair value hierarchy. The NAV is the total value of the fund divided by the number of the fund’s shares outstanding. Debt securities are valued based on same day actual trading prices, if available. If such prices are not available, we use a matrix pricing model with historical prices, trends and other factors.
Private investment partnerships represents interests in funds which invest in equity, debt and other financial assets. These funds are generally not publicly traded so the interests therein are valued using income and market methods that include cash flow projections and market multiples for various comparable investments. Real estate includes owned properties and limited partnership interests in real estate partnerships. Owned properties are valued using certified appraisals at least every three years that are updated at least annually by the real estate investment manager based on current market trends and other available information. These appraisals generally use the standard methods for valuing real estate, including forecasting income and identifying current transactions for comparable real estate to arrive at a fair value. Limited partnership interests in real estate partnerships are valued similarly to private investment partnerships, with the general partner using standard real estate valuation methods to value the real estate properties and securities held within their portfolios. Neither private investment nor real estate partnerships are subject to leveling within the fair value hierarchy.
The table below presents a reconciliation of the fair value measurements for owned real estate properties, which use significant unobservable inputs (Level 3):
| | | | | | | | |
| (In millions) | 2024 | 2023 |
| Balance at beginning of year | $ | 508 | | $ | 569 | |
| Unrealized losses, net | (25) | | (60) | |
| Realized gains, net | 16 | | 10 | |
| Purchases, sales and settlements, net | (20) | | (11) | |
| Balance at end of year | $ | 479 | | $ | 508 | |
Estimated Future Cash Flow Impact
Defined benefits under salaried plans are based on salary and years of service. Hourly plans generally provide benefits based on stated amounts for each year of service. Our funding policy is consistent with applicable laws and regulations. In 2025, we expect to contribute approximately $50 million to our pension plans. Benefit payments provided below reflect expected future employee service, as appropriate, and are expected to be paid, net of estimated participant contributions. These payments are based on the same assumptions used to measure our benefit obligation at the end of 2024. While pension benefit payments primarily will be paid out of qualified pension trusts, we will pay postretirement benefits other than pensions out of our general corporate assets. Benefit payments that we expect to pay on an undiscounted basis are as follows:
| | | | | | | | | | | | | | | | | | | | |
| (In millions) | 2025 | 2026 | 2027 | 2028 | 2029 | 2030-2034 |
| Pension benefits | $ | 459 | | $ | 467 | | $ | 476 | | $ | 484 | | $ | 491 | | $ | 2,510 | |
| Postretirement benefits other than pensions | 16 | | 15 | | 14 | | 13 | | 13 | | 50 | |
Note 15. Special Charges
Special charges recorded in 2024 and 2023 by segment and type of cost are as follows:
| | | | | | | | | | | | | | | | | |
| (In millions) | Severance
Costs | Contract
Terminations
and Other | Asset
Impairments | Total | | | |
| 2024 | | | | | | | |
| Industrial | $ | 37 | | $ | 32 | | $ | 3 | | $ | 72 | | | | |
| Bell | 1 | | — | | — | | 1 | | | | |
| Textron Systems | 5 | | — | | — | | 5 | | | | |
| Total special charges | $ | 43 | | $ | 32 | | $ | 3 | | $ | 78 | | | | |
| 2023 | | | | | | | |
| Industrial | $ | 21 | | $ | — | | $ | 87 | | $ | 108 | | | | |
| Bell | 13 | | — | | — | | 13 | | | | |
| Textron Systems | 5 | | — | | — | | 5 | | | | |
| Total special charges | $ | 39 | | $ | — | | $ | 87 | | $ | 126 | | | | |
In the fourth quarter of 2023, we initiated a restructuring plan to reduce operating expenses through headcount reductions at the Industrial, Bell and Textron Systems segments. In the Industrial segment, the plan included headcount reductions at Textron Specialized Vehicles, resulting from lower demand for certain of our powersports products, and at Kautex, due to reduced demand for fuel systems from European automotive manufacturers. In the Bell and Textron Systems segments, the plan included targeted headcount reductions to improve the segments’ cost structures and realign their workforces as these segments transition from legacy production contracts to more development, engineering focused contracts. In April 2024, the plan was expanded for the Bell and Textron Systems segments to include headcount reductions resulting from the cancellations of the Future Attack Reconnaissance Aircraft and Shadow programs in 2024.
In December 2024, we approved additional actions under the 2023 plan at Textron Specialized Vehicles related to an indefinite pause in production of its powersports products. During 2024, the consumer end market demand for powersports products continued to remain soft. As a result, and in conjunction with its annual operating plan process, Textron Specialized Vehicles began to pause production of powersports products as Textron's management reviews strategic alternatives for the business. Upon completion of limited production runs to satisfy customer commitments, production of powersports products will be paused indefinitely in the first half of 2025.
In 2024, we recorded special charges totaling $78 million as a result of the above restructuring actions. Since inception of the 2023 plan, we have incurred $204 million in special charges including severance costs of $82 million, which included $58 million at the Industrial segment, $14 million at the Bell segment and $10 million at the Textron Systems segment; and contract termination and other costs of $32 million and asset impairment charges of $90 million at the Industrial segment. Headcount reductions since inception of the plan are expected to total approximately 1,800 positions, representing 5% of our global workforce. We expect the plan to be substantially completed and the majority of the $71 million restructuring reserve to be paid in the first half of 2025.
In the fourth quarter of 2024 and in connection with the actions taken under the restructuring plan at Textron Specialized Vehicles, we recorded an inventory valuation charge of $38 million, which is recorded in Cost of products sold, to write down production-related powersports inventory to its net realizable value.
In 2023, as a result of the lower demand described above, we recognized asset impairment charges of $75 million at Textron Specialized Vehicles related to both fixed and intangible assets and $12 million of fixed asset impairment charges at Kautex. The fair value of these assets was determined utilizing a discounted cash flow methodology that reflected the impact of lower anticipated demand for the powersports and fuel systems products on future revenues and profit.
Restructuring Reserve
Our restructuring reserve activity is summarized below:
| | | | | | | | | | | |
| (In millions) | Severance
Costs | Contract
Terminations
and Other | Total |
| Balance at December 31, 2022 | $ | 5 | | $ | 7 | | $ | 12 | |
| Provision for 2023 restructuring plan | 39 | | — | | 39 | |
| Cash paid | (3) | | (2) | | (5) | |
| | | |
| Foreign currency translation | 1 | | — | | 1 | |
| Balance at December 30, 2023 | $ | 42 | | $ | 5 | | $ | 47 | |
| Provision for 2023 restructuring plan | 49 | | 32 | | 81 | |
| Cash paid | (46) | | (3) | | (49) | |
| Reversals | (6) | | — | | (6) | |
| Foreign currency translation | (2) | | — | | (2) | |
| Balance at December 28, 2024 | $ | 37 | | $ | 34 | | $ | 71 | |
Note 16. Income Taxes
We conduct business globally and, as a result, file numerous consolidated and separate income tax returns within and outside the U.S. For all of our U.S. subsidiaries, we file a consolidated federal income tax return. Income from continuing operations before income taxes is as follows:
| | | | | | | | | | | |
| (In millions) | 2024 | 2023 | 2022 |
| U.S. | $ | 739 | | $ | 905 | | $ | 810 | |
| Non-U.S. | 204 | | 182 | | 206 | |
| Income from continuing operations before income taxes | $ | 943 | | $ | 1,087 | | $ | 1,016 | |
Income tax expense is summarized as follows:
| | | | | | | | | | | |
| (In millions) | 2024 | 2023 | 2022 |
| Current expense: | | | |
| Federal | $ | 84 | | $ | 267 | | $ | 272 | |
| State | 21 | | 18 | | 33 | |
| Non-U.S. | 61 | | 72 | | 69 | |
| 166 | | 357 | | 374 | |
| Deferred expense (benefit): | | | |
| Federal | (34) | | (181) | | (182) | |
| State | (24) | | 1 | | (29) | |
| Non-U.S. | 10 | | (12) | | (9) | |
| (48) | | (192) | | (220) | |
| Income tax expense | $ | 118 | | $ | 165 | | $ | 154 | |
The following table reconciles the U.S. Federal statutory income tax rate to our effective income tax rate:
| | | | | | | | | | | |
| 2024 | 2023 | 2022 |
| U.S. Federal statutory income tax rate | 21.0% | 21.0% | 21.0% |
| Increase (decrease) resulting from: | | | |
| State income taxes, net of federal tax benefit | (0.2) | 1.4 | 0.3 |
| Non-U.S. tax rate differential and foreign tax credits | 2.1 | 1.5 | 1.8 |
| Research and development tax credits | (5.4) | (4.7) | (5.0) |
| Uncertain tax positions release for 2012 to 2017 IRS audit | (2.9) | — | — |
| Foreign-derived intangible income deduction | (1.7) | (3.2) | (2.5) |
| | | |
| | | |
| | | |
| | | |
| | | |
| | | |
| Other, net | (0.4) | (0.8) | (0.4) |
| Effective income tax rate | 12.5% | 15.2% | 15.2% |
Unrecognized Tax Benefits
Our unrecognized tax benefits represent tax positions for which reserves have been established, with unrecognized state tax benefits reflected net of applicable federal tax benefits. If our unrecognized tax benefits were recognized in future periods, they would favorably impact our effective tax rate. A reconciliation of these unrecognized tax benefits is as follows:
| | | | | | | | | | | |
| (In millions) | 2024 | 2023 | 2022 |
| Balance at beginning of year | $ | 222 | | $ | 231 | | $ | 207 | |
| Additions for tax positions related to current year | 17 | | 16 | | 24 | |
| Additions for tax positions of prior years | 4 | | 3 | | — | |
| Reductions for tax positions of prior years | — | | (28) | | — | |
| Reductions for settlements | (28) | | — | | — | |
| Balance at end of year | $ | 215 | | $ | 222 | | $ | 231 | |
In November 2024, we received a Revenue Agent Report (RAR) from the Internal Revenue Service (IRS) for the tax years 2012 to 2017 that proposed adjustments related to research and development tax credits generated on amended returns filed in 2019 and 2021. We disagree with the proposed adjustments and are vigorously contesting them through the IRS’s Office of Appeals and, if necessary, will continue with legal proceedings. We believe it is more likely than not that we will prevail on our refund claim for these credits. As of December 28, 2024, we believe our allowance for uncertain tax positions related to this matter is adequate. We do not expect a final resolution to this matter in the next twelve months. In connection with the RAR for these years, other tax positions were effectively settled, resulting in a benefit upon the reversal of $27 million of uncertain tax positions in the fourth quarter of 2024.
We are currently under examination by the IRS for the tax years 2018 to 2021. In the normal course of business, we are subject to examination by tax authorities throughout the world. We are generally no longer subject to state and local income tax examinations for years before 2019 and non-U.S. income tax examinations for years before 2012.
Deferred Taxes
The significant components of our net deferred tax assets/(liabilities) are provided below:
| | | | | | | | |
| (In millions) | December 28,
2024 | December 30,
2023 |
| Capitalized research and development expenditures | $ | 631 | | $ | 520 | |
| Accrued liabilities (a) | 224 | | 228 | |
| U.S. operating loss and tax credit carryforwards (b) | 212 | | 216 | |
| Obligation for pension and postretirement benefits | 109 | | 123 | |
| Deferred compensation | 94 | | 103 | |
| Operating lease liabilities | 93 | | 102 | |
| Non-U.S. operating loss and tax credit carryforwards (c) | 88 | | 73 | |
| Prepaid pension benefits | (562) | | (387) | |
| Property, plant and equipment, principally depreciation | (198) | | (211) | |
| Amortization of goodwill and other intangibles | (184) | | (185) | |
| Operating lease right-of-use assets | (90) | | (99) | |
| Valuation allowance on deferred tax assets | (82) | | (82) | |
| Other leasing transactions, principally leveraged leases | (42) | | (47) | |
| Other, net | (32) | | (5) | |
| Deferred taxes, net | $ | 261 | | $ | 349 | |
(a)Accrued liabilities include warranty reserves, self-insured liabilities and interest.
(b)At December 28, 2024, U.S. operating loss and tax credit carryforward benefits of $166 million expire through 2044 if not utilized and $46 million may be carried forward indefinitely.
(c)At December 28, 2024, non-U.S. operating loss and tax credit carryforward benefits of $80 million may be carried forward indefinitely.
We believe earnings during the period when the temporary differences become deductible will be sufficient to realize the related future income tax benefits. For those jurisdictions where the expiration date of tax carryforwards or the projected operating results indicate that realization is not more than likely, a valuation allowance is provided.
The following table presents the breakdown of our deferred taxes:
| | | | | | | | |
| (In millions) | December 28,
2024 | December 30,
2023 |
| Manufacturing group: | | |
| Deferred tax assets, net of valuation allowance | $ | 394 | | $ | 443 | |
| Deferred tax liabilities | (96) | | (56) | |
| Finance group – Deferred tax liabilities | (37) | | (38) | |
| Net deferred tax asset | $ | 261 | | $ | 349 | |
Non-U.S. and U.S. state income taxes have not been provided for on basis differences in certain investments, primarily as a result of unremitted earnings in foreign subsidiaries that are indefinitely reinvested, totaling $1.8 billion at December 28, 2024 and $1.6 billion at December 30, 2023. Should these earnings be distributed in the future in the form of dividends or otherwise, we would be subject to withholding and local taxes to various non-U.S. jurisdictions and U.S. states. Determination of the deferred tax liability associated with indefinitely reinvested earnings is not practicable due to multiple factors, including the complexity of non-U.S. tax laws and tax treaty interpretations, exchange rate fluctuations, and the uncertainty of available credits or exemptions.
Note 17. Commitments and Contingencies
We are subject to actual and threatened legal proceedings and other claims arising out of the conduct of our business, including proceedings and claims relating to commercial and financial transactions; government contracts; alleged lack of compliance with applicable laws and regulations; disputes with suppliers, production partners or other third parties; product liability; patent and trademark infringement; employment disputes; and environmental, health and safety matters. Some of these legal proceedings and claims seek damages, fines or penalties in substantial amounts or remediation of environmental contamination. As a government contractor, we are subject to audits, reviews and investigations to determine whether our operations are being conducted in accordance with applicable regulatory requirements. Under federal government procurement regulations, certain claims brought by the U.S. Government could result in our suspension or debarment from U.S. Government contracting for a period of time. On the basis of information presently available, we do not believe that existing proceedings and claims will have a material effect on our financial position or results of operations.
In the ordinary course of business, we enter into standby letter of credit agreements and surety bonds with financial institutions to meet various performance and other obligations. These outstanding letter of credit arrangements and surety bonds aggregated to approximately $336 million and $338 million at December 28, 2024 and December 30, 2023, respectively.
Environmental Remediation
As with other industrial enterprises engaged in similar businesses, we are involved in a number of remedial actions under various federal and state laws and regulations relating to the environment that impose liability on companies to clean up, or contribute to the cost of cleaning up, sites on which hazardous wastes or materials were disposed or released. Our accrued environmental liabilities relate to installation of remediation systems, disposal costs, U.S. Environmental Protection Agency oversight costs, legal fees, and operating and maintenance costs for both currently and formerly owned or operated facilities. Circumstances that can affect the reliability and precision of the accruals include the identification of additional sites, environmental regulations, level of cleanup required, technologies available, number and financial condition of other contributors to remediation and the time period over which remediation may occur. We believe that any changes to the accruals that may result from these factors and uncertainties will not have a material effect on our financial position or results of operations.
Based upon information currently available, we estimate that our potential environmental liabilities are within the range of $40 million to $145 million. At December 28, 2024, environmental reserves of $72 million have been established to address these specific estimated liabilities. We estimate that we will likely pay our accrued environmental remediation liabilities over the next ten years and have classified $16 million as current liabilities. In 2024, 2023 and 2022, to evaluate and remediate contaminated sites, we incurred expense, net of recoveries received, of $9 million, $8 million and $9 million, respectively.
Note 18. Supplemental Cash Flow Information
Our cash payments and receipts are as follows:
| | | | | | | | | | | |
| (In millions) | 2024 | 2023 | 2022 |
| Interest paid: | | | |
| Manufacturing group | $ | 124 | | $ | 110 | | $ | 110 | |
| Finance group | 18 | | 12 | | 13 | |
| Net income taxes paid: | | | |
| Manufacturing group | 181 | | 338 | | 332 | |
| Finance group | 10 | | 14 | | 24 | |
Report of Independent Registered Public Accounting Firm
To the Shareholders and the Board of Directors of Textron Inc.
Opinion on the Financial Statements
We have audited the accompanying Consolidated Balance Sheets of Textron Inc. (the Company) as of December 28, 2024 and December 30, 2023, the related Consolidated Statements of Operations, Comprehensive Income, Shareholders’ Equity and Cash Flows for each of the three years in the period ended December 28, 2024, and the related notes and the financial statement schedule listed in the Index at Item 8 (collectively referred to as the “consolidated financial statements”). In our opinion, the consolidated financial statements present fairly, in all material respects, the financial position of the Company at December 28, 2024 and December 30, 2023 and the results of its operations and its cash flows for each of the three years in the period ended December 28, 2024, in conformity with U.S. generally accepted accounting principles.
We also have audited, in accordance with the standards of the Public Company Accounting Oversight Board (United States) (PCAOB), the Company’s internal control over financial reporting as of December 28, 2024, based on criteria established in Internal Control – Integrated Framework issued by the Committee of Sponsoring Organizations of the Treadway Commission (2013 Framework) and our report dated February 6, 2025 expressed an unqualified opinion thereon.
Basis for Opinion
These financial statements are the responsibility of the Company’s management. Our responsibility is to express an opinion on the Company’s financial statements based on our audits. We are a public accounting firm registered with the PCAOB and are required to be independent with respect to the Company in accordance with the U.S. federal securities laws and the applicable rules and regulations of the Securities and Exchange Commission and the PCAOB.
We conducted our audits in accordance with the standards of the PCAOB. Those standards require that we plan and perform the audit to obtain reasonable assurance about whether the financial statements are free of material misstatement, whether due to error or fraud. Our audits included performing procedures to assess the risks of material misstatement of the financial statements, whether due to error or fraud, and performing procedures that respond to those risks. Such procedures included examining, on a test basis, evidence regarding the amounts and disclosures in the financial statements. Our audits also included evaluating the accounting principles used and significant estimates made by management, as well as evaluating the overall presentation of the financial statements. We believe that our audits provide a reasonable basis for our opinion.
Critical Audit Matters
The critical audit matters communicated below are matters arising from the current period audit of the financial statements that were communicated or required to be communicated to the audit committee and that: (1) relate to accounts or disclosures that are material to the financial statements and (2) involved our especially challenging, subjective or complex judgments. The communication of critical audit matters does not alter in any way our opinion on the consolidated financial statements, taken as a whole, and we are not, by communicating the critical audit matters below, providing separate opinions on the critical audit matters or on the accounts or disclosures to which they relate.
| | | | | | | | |
| | Revenue Recognition - Estimates at Completion for Select Long Term Contracts |
| Description of the Matter | | As described in Note 1 to the consolidated financial statements, revenues under long-term contracts with the U.S. Government are generally recognized over time using the cost-to-cost method of accounting. Under this method, the extent of progress towards completion is measured based on the ratio of costs incurred to date to the estimated costs at completion, and revenue is recorded proportionally as costs are incurred. Contract costs, which are estimated utilizing current contract specifications and expected engineering requirements, typically are incurred over a period of several years, and the estimation of these costs at completion requires substantial judgment. The Company’s cost estimation process is based on professional knowledge and experience of engineers and program managers along with finance professionals. The Company updates its projections of costs quarterly or more frequently when circumstances significantly change. When adjustments are required, any changes from prior estimates are recognized using the cumulative catch-up method with the impact of the change from inception-to-date of the contract recorded in the current period and required disclosure is provided in the consolidated financial statements. Anticipated losses on contracts are recognized in full in the period in which losses become probable and estimable. |
| | | | | | | | |
| | Auditing the Company’s estimated costs at completion for select long-term contracts was complex due to the judgment involved in evaluating management’s assumptions and key estimates over the duration of these long-term contracts. The estimated costs at completion for the select long-term contracts consider risks surrounding the Company’s ability to achieve the technical requirements and specifications of the contract, schedule, and other cost elements of the contract, and depend on whether the Company is able to successfully retire risks surrounding such aspects of the contract. |
| How We Addressed the Matter in Our Audit | | We obtained an understanding, evaluated the design and tested the operating effectiveness of the controls related to the Company’s revenue recognition process, including controls over management’s review of the estimated costs at completion for the select long-term contracts and related key assumptions and management’s review that the data underlying the estimated costs at completion was complete and accurate. |
| | To test the accuracy of the Company’s estimated costs at completion for the select long-term contracts, our audit procedures included, among others, evaluating the key assumptions used by management to determine such estimate. This included evaluating the historical accuracy of management’s estimates by comparing planned costs to actual costs incurred to date. We also tested the completeness and accuracy of the underlying data back to source documents and contracts. |
| | Defined Benefit Pension Obligations |
| Description of the Matter | | As described in Note 14 to the consolidated financial statements, at December 28, 2024, the aggregate qualified defined benefit pension obligation was $6.8 billion and the fair value of pension plan assets was $8.8 billion, resulting in a net pension asset of $2.0 billion. As explained in Note 1 to the consolidated financial statements, the Company updates the estimates used to measure the defined benefit pension assets and obligations annually in the fourth quarter or more frequently upon the occurrence of certain events. |
| | Auditing the defined benefit pension obligations was complex and required the involvement of specialists as a result of the judgmental nature of certain actuarial assumptions including the discount rate and expected return on plan assets used in the measurement process. These assumptions have a significant effect on the projected benefit obligation. |
| How We Addressed the Matter in Our Audit | | We obtained an understanding, evaluated the design and tested the operating effectiveness of the controls that address the risks of material misstatement relating to the measurement and valuation of the defined benefit pension obligation. For example, we tested controls over management’s review of the defined benefit pension obligation actuarial calculations, the significant actuarial assumptions, and the data inputs provided to the actuaries. |
| | To test the defined benefit pension obligation, our audit procedures included, among others, evaluating the methodology used, the significant actuarial assumptions discussed above, and the underlying data used by management and its actuaries. We compared the actuarial assumptions used by management to historical trends and evaluated the change in the defined benefit pension obligation from the prior year due to the change in service cost, interest cost, benefit payments, actuarial gains and losses, contributions, and plan amendments, as applicable. In addition, we involved an actuarial specialist to assist in evaluating management’s methodology for determining the discount rate that reflects the maturity and duration of the benefit payments and is used to measure the defined benefit pension obligation. As part of this assessment, we compared the projected cash flows to prior year and compared the current year benefits paid to the prior year projected cash flows. We also tested the completeness and accuracy of the underlying data, including the participant data provided to the Company’s actuaries. Lastly, to evaluate the expected return on plan assets, we assessed whether management’s assumption is consistent with a range of returns for a portfolio of comparative investments. |
/s/ Ernst & Young LLP
We have served as the Company’s auditor since 1957.
Boston, Massachusetts
February 6, 2025
Schedule II — Valuation and Qualifying Accounts
| | | | | | | | | | | |
| (In millions) | 2024 | 2023 | 2022 |
| Allowance for credit losses on accounts receivable | | | |
| Balance at beginning of year | $ | 26 | | $ | 24 | | $ | 24 | |
| Provision (reversal) for credit losses | (4) | | 7 | | 2 | |
| Deductions from reserves* | (3) | | (5) | | (2) | |
| Balance at end of year | $ | 19 | | $ | 26 | | $ | 24 | |
| Allowance for credit losses on finance receivables | | | |
| Balance at beginning of year | $ | 24 | | $ | 24 | | $ | 25 | |
| Reversal for credit losses | (14) | | (18) | | (4) | |
| Charge-offs | (1) | | — | | — | |
| Recoveries | 10 | | 18 | | 3 | |
| Balance at end of year | $ | 19 | | $ | 24 | | $ | 24 | |
| Inventory FIFO reserves | | | |
| Balance at beginning of year | $ | 390 | | $ | 350 | | $ | 370 | |
| Charged to costs and expenses | 57 | | 63 | | 21 | |
| Deductions from reserves* | (15) | | (23) | | (41) | |
| Balance at end of year | $ | 432 | | $ | 390 | | $ | 350 | |
* Deductions primarily include amounts written off on uncollectible accounts (less recoveries), inventory disposals, changes to prior year estimates and currency translation adjustments.
Item 9. Changes In and Disagreements With Accountants on Accounting and Financial Disclosure
None.
Item 9A. Controls and Procedures
Disclosure Controls and Procedures
We performed an evaluation of the effectiveness of our disclosure controls and procedures as of December 28, 2024. The evaluation was performed with the participation of senior management of each business segment and key Corporate functions, under the supervision of our Chairman, President and Chief Executive Officer (CEO) and our Executive Vice President and Chief Financial Officer (CFO). Based on this evaluation, the CEO and CFO concluded that our disclosure controls and procedures were operating and effective as of December 28, 2024.
Changes in Internal Controls Over Financial Reporting
There were no changes in our internal control over financial reporting during the fourth quarter of the fiscal year covered by this report that materially affected, or are reasonably likely to materially affect, our internal control over financial reporting.
Management’s Report on Internal Control Over Financial Reporting
Management is responsible for establishing and maintaining adequate internal control over financial reporting for Textron Inc. as such term is defined in Exchange Act Rules 13a-15(f). Our internal control structure is designed to provide reasonable assurance, at appropriate cost, that assets are safeguarded and that transactions are properly executed and recorded. The internal control structure includes, among other things, established policies and procedures, an internal audit function, the selection and training of qualified personnel as well as management oversight.
With the participation of our management, we performed an evaluation of the effectiveness of our internal control over financial reporting based on criteria established in Internal Control – Integrated Framework issued by the Committee of Sponsoring Organizations of the Treadway Commission (2013 Framework). Based on our evaluation under the 2013 Framework, we have concluded that Textron Inc. maintained, in all material respects, effective internal control over financial reporting as of December 28, 2024.
The independent registered public accounting firm, Ernst & Young LLP (PCAOB ID: 42), has audited the Consolidated Financial Statements of Textron Inc. and has issued an attestation report on Textron’s internal controls over financial reporting as of December 28, 2024, as stated in its report, which is included herein.
Report of Independent Registered Public Accounting Firm
To the Shareholders and the Board of Directors of Textron Inc.
Opinion on Internal Control over Financial Reporting
We have audited Textron Inc.’s internal control over financial reporting as of December 28, 2024, based on criteria established in Internal Control— Integrated Framework issued by the Committee of Sponsoring Organizations of the Treadway Commission (2013 Framework), (the COSO criteria). In our opinion, Textron, Inc. (the Company) maintained, in all material respects, effective internal control over financial reporting as of December 28, 2024, based on the COSO criteria.
We also have audited, in accordance with the standards of the Public Company Accounting Oversight Board (United States) (PCAOB), the Consolidated Balance Sheets of the Company as of December 28, 2024 and December 30, 2023, and the related Consolidated Statements of Operations, Comprehensive Income, Shareholders' Equity and Cash Flows for each of the three years in the period ended December 28, 2024, and the related notes and the financial statement schedule listed in the Index at Item 8 of the Company and our report dated February 6, 2025 expressed an unqualified opinion thereon.
Basis for Opinion
The Company’s management is responsible for maintaining effective internal control over financial reporting and for its assessment of the effectiveness of internal control over financial reporting included in the accompanying Management’s Report on Internal Control Over Financial Reporting. Our responsibility is to express an opinion on the Company’s internal control over financial reporting based on our audit. We are a public accounting firm registered with the PCAOB and are required to be independent with respect to the Company in accordance with the U.S. federal securities laws and the applicable rules and regulations of the Securities and Exchange Commission and the PCAOB.
We conducted our audit in accordance with the standards of the PCAOB. Those standards require that we plan and perform the audit to obtain reasonable assurance about whether effective internal control over financial reporting was maintained in all material respects.
Our audit included obtaining an understanding of internal control over financial reporting, assessing the risk that a material weakness exists, testing and evaluating the design and operating effectiveness of internal control based on the assessed risk, and performing such other procedures as we considered necessary in the circumstances. We believe that our audit provides a reasonable basis for our opinion.
Definition and Limitations of Internal Control Over Financial Reporting
A company’s internal control over financial reporting is a process designed to provide reasonable assurance regarding the reliability of financial reporting and the preparation of financial statements for external purposes in accordance with generally accepted accounting principles. A company’s internal control over financial reporting includes those policies and procedures that (1) pertain to the maintenance of records that, in reasonable detail, accurately and fairly reflect the transactions and dispositions of the assets of the company; (2) provide reasonable assurance that transactions are recorded as necessary to permit preparation of financial statements in accordance with generally accepted accounting principles, and that receipts and expenditures of the company are being made only in accordance with authorizations of management and directors of the company; and (3) provide reasonable assurance regarding prevention or timely detection of unauthorized acquisition, use, or disposition of the company’s assets that could have a material effect on the financial statements.
Because of its inherent limitations, internal control over financial reporting may not prevent or detect misstatements. Also, projections of any evaluation of effectiveness to future periods are subject to the risk that controls may become inadequate because of changes in conditions, or that the degree of compliance with the policies or procedures may deteriorate.
/s/ Ernst & Young LLP
Boston, Massachusetts
February 6, 2025
Item 9B. Other Information
(a)As previously announced, Mr. Frank Connor will retire effective February 28, 2025 after having served as our CFO for fifteen years. During his tenure Mr. Connor has made significant contributions across Textron to drive financial and operational excellence. As part of his 2025 duties, Mr. Connor will oversee the completion of the Company’s post year-end financial reporting and related activities and will effect an orderly transition of the CFO role to Mr. Rosenberg and other succession planning within the finance organization. On February 5, 2025, the Organization and Compensation Committee approved Mr. Connor’s 2025 compensation to be set at $1,000,000, taking into account Mr. Connor’s expected duties through his retirement. Mr. Connor’s 2024 total target compensation was $6,300,000.”
(b)None of our directors or executive officers adopted or terminated a “Rule 10b5-1 trading arrangement” or adopted or terminated a “non-Rule 10b5-1 trading arrangement” (as such terms are defined in Item 408 of Regulation S-K) during the quarter ended December 28, 2024.
Item 9C. Disclosure Regarding Foreign Jurisdictions that Prevent Inspections
Not applicable.
PART III
Item 10. Directors, Executive Officers and Corporate Governance
The information appearing under “ELECTION OF DIRECTORS – Nominees for Director,” "SECURITY OWNERSHIP – Delinquent Section 16(a) Reports,” “CORPORATE GOVERNANCE – Board Committees – Audit Committee,” “– Corporate Governance Guidelines and Policies,” “– Code of Ethics,” and “– Insider Trading Policies and Procedures,” in the Proxy Statement for our 2025 Annual Meeting of Shareholders is incorporated by reference into this Annual Report on Form 10-K.
Information regarding our executive officers is contained in Part I of this Annual Report on Form 10-K.
Item 11. Executive Compensation
The information appearing under “CORPORATE GOVERNANCE – Compensation of Directors,” “COMPENSATION COMMITTEE REPORT,” “COMPENSATION DISCUSSION AND ANALYSIS” and “EXECUTIVE COMPENSATION” in the Proxy Statement for our 2025 Annual Meeting of Shareholders is incorporated by reference into this Annual Report on Form 10-K.
Item 12. Security Ownership of Certain Beneficial Owners and Management and Related Stockholder Matters
The information appearing under “SECURITY OWNERSHIP” and “EXECUTIVE COMPENSATION – Equity Compensation Plan Information” in the Proxy Statement for our 2025 Annual Meeting of Shareholders is incorporated by reference into this Annual Report on Form 10-K.
Item 13. Certain Relationships and Related Transactions and Director Independence
The information appearing under “CORPORATE GOVERNANCE – Director Independence” and “EXECUTIVE COMPENSATION – Transactions with Related Persons” in the Proxy Statement for our 2025 Annual Meeting of Shareholders is incorporated by reference into this Annual Report on Form 10-K.
Item 14. Principal Accountant Fees and Services
The information appearing under “RATIFICATION OF APPOINTMENT OF INDEPENDENT REGISTERED PUBLIC ACCOUNTING FIRM – Fees to Independent Auditors” in the Proxy Statement for our 2025 Annual Meeting of Shareholders is incorporated by reference into this Annual Report on Form 10-K.
PART IV
Item 15. Exhibits and Financial Statement Schedules
Financial Statements and Schedules — See Index on Page 31. | | | | | | | | |
| Exhibits | | |
| | |
| 3.1A | | |
| | |
| 3.1B | | |
| | |
| 3.2 | | |
| | |
| 4.1A | | |
| | |
| 4.1B | | |
| | |
| 4.2 | | |
| | |
| NOTE: | | Instruments defining the rights of holders of certain issues of long-term debt of Textron have not been filed as exhibits because the authorized principal amount of any one of such issues does not exceed 10% of the total assets of Textron and its subsidiaries on a consolidated basis. Textron agrees to furnish a copy of each such instrument to the Commission upon request. |
| | |
| NOTE: | | Exhibits 10.1 through 10.16 below are management contracts or compensatory plans, contracts or agreements. |
| | |
| 10.1A | | |
| | |
| 10.1B | | |
| | |
| 10.2A | | |
| | |
| 10.2B | | |
| | |
| 10.3A | | |
| | |
| 10.3B | | |
| | |
| 10.3C | | |
| | |
| 10.3D | | |
| | | | | | | | |
| | |
| 10.3E | | |
| | |
| 10.3F | | |
| | |
| 10.4 | | |
| | |
| 10.5A | | |
| | |
| 10.5B | | |
| | |
| 10.5C | | |
| | |
| 10.6 | | |
| | |
| 10.7A | | |
| | |
| 10.7B | | |
| | |
| 10.7C | | |
| | |
| 10.7D | | |
| | |
| 10.7E | | |
| | |
| 10.8A | | |
| | |
| 10.8B | | |
| | | | | | | | |
| | |
| 10.8C | | |
| | |
| 10.9 | | |
| | |
| 10.10 | | |
| | |
| 10.11A | | |
| | |
| 10.11B | | |
| | |
| 10.11C | | |
| | |
| 10.11D | | |
| | |
| 10.12A | | |
| | |
| 10.12B | | |
| | |
| 10.13 | | |
| | |
| 10.14A | | |
| | |
| 10.14B | | |
| | |
| 10.15 | | |
| | |
| 10.16 | | |
| | |
| | | | | | | | |
| 10.17 | | Credit Agreement, dated as of October 21, 2022, among Textron, the Lenders listed therein, JPMorgan Chase Bank, N.A., as Administrative Agent, Bank of America, N.A. and Citibank, N.A., as Syndication Agents, and MUFG Bank, Ltd., as Documentation Agent. Incorporated by reference to Exhibit 10.1 to Textron’s Quarterly Report on Form 10-Q for the fiscal quarter ended October 1, 2022. |
| | |
| 19 | | |
| | |
| 21 | | |
| | |
| 23 | | |
| | |
| 24 | | |
| | |
| 31.1 | | |
| | |
| 31.2 | | |
| | |
| 32.1 | | |
| | |
| 32.2 | | |
| | |
| 97 | | |
| | |
| 101 | | The following materials from Textron Inc.’s Annual Report on Form 10-K for the year ended December 28, 2024, formatted in Inline XBRL (eXtensible Business Reporting Language): (i) the Consolidated Statements of Operations, (ii) the Consolidated Statements of Comprehensive Income (iii) the Consolidated Balance Sheets, (iv) the Consolidated Statements of Shareholders’ Equity, (v) the Consolidated Statements of Cash Flows, (vi) the Notes to the Consolidated Financial Statements, and (vii) Schedule II – Valuation and Qualifying Accounts. |
| | |
| 104 | | Cover Page Interactive Data File (formatted as Inline XBRL and contained in Exhibit 101). |
Item 16. Form 10-K Summary
Not applicable.
Signatures
Pursuant to the requirement of Section 13 or 15(d) of the Securities Exchange Act of 1934, the registrant has duly caused this Annual Report on Form 10-K to be signed on its behalf by the undersigned, thereunto duly authorized on this 6th day of February 2025.
| | | | | | | | |
| | TEXTRON INC. |
| | Registrant |
| | |
| By: | /s/ Frank T. Connor |
| | Frank T. Connor
Executive Vice President and Chief Financial Officer |
Pursuant to the requirements of the Securities Exchange Act of 1934, this Annual Report on Form 10-K has been signed below on this 6th day of February 2025 by the following persons on behalf of the registrant and in the capacities indicated:
| | | | | | | | | | | |
| Name | | Title |
| | |
| /s/ Scott C. Donnelly | | |
| Scott C. Donnelly | | Chairman, President and Chief Executive Officer
(principal executive officer) |
| | | |
| * | | |
| Richard F. Ambrose | | Director |
| | | |
| * | | |
| Kathleen M. Bader | | Director |
| | | |
| * | | |
| R. Kerry Clark | | Director |
| | | |
| * | | |
| Michael X. Garrett | | Director |
| | | |
| * | | |
| Deborah Lee James | | Director |
| | | |
| * | | |
| Thomas A. Kennedy | | Director |
| | | |
| * | | |
| Lionel L. Nowell III | | Director |
| | | |
| * | | |
| James L. Ziemer | | Director |
| | | |
| * | | |
| Maria T. Zuber | | Director |
| | | |
| /s/ Frank T. Connor | | |
| Frank T. Connor | | Executive Vice President and Chief Financial Officer
(principal financial officer) |
| | | |
| /s/ Mark S. Bamford | | |
| Mark S. Bamford | | Vice President and Corporate Controller
(principal accounting officer) |
| | | |
| *By: | /s/ Jayne M. Donegan | | |
| Jayne M. Donegan, Attorney-in-fact | | |