UNITED STATES
SECURITIES AND EXCHANGE COMMISSION
Washington, D.C. 20549
FORM N-CSR
CERTIFIED SHAREHOLDER REPORT OF REGISTERED
MANAGEMENT INVESTMENT COMPANIES
Investment Company Act file number 811-1400
Fidelity Contrafund
(Exact name of registrant as specified in charter)
245 Summer St., Boston, Massachusetts 02210
(Address of principal executive offices) (Zip code)
Marc Bryant, Secretary
245 Summer St.
Boston, Massachusetts 02210
(Name and address of agent for service)
Registrant's telephone number, including area code:
617-563-7000
| |
Date of fiscal year end: | December 31 |
| |
Date of reporting period: | December 31, 2017 |
Item 1.
Reports to Stockholders
Fidelity® Contrafund®
Annual Report December 31, 2017 |
 |
Contents
To view a fund's proxy voting guidelines and proxy voting record for the 12-month period ended June 30, visit http://www.fidelity.com/proxyvotingresults or visit the Securities and Exchange Commission's (SEC) web site at http://www.sec.gov.
You may also call 1-800-544-8544 to request a free copy of the proxy voting guidelines.
Standard & Poor's, S&P and S&P 500 are registered service marks of The McGraw-Hill Companies, Inc. and have been licensed for use by Fidelity Distributors Corporation.
Other third-party marks appearing herein are the property of their respective owners.
All other marks appearing herein are registered or unregistered trademarks or service marks of FMR LLC or an affiliated company. © 2018 FMR LLC. All rights reserved.
This report and the financial statements contained herein are submitted for the general information of the shareholders of the Fund. This report is not authorized for distribution to prospective investors in the Fund unless preceded or accompanied by an effective prospectus.
A fund files its complete schedule of portfolio holdings with the SEC for the first and third quarters of each fiscal year on Form N-Q. Forms N-Q are available on the SEC’s web site at http://www.sec.gov. A fund's Forms N-Q may be reviewed and copied at the SEC’s Public Reference Room in Washington, DC. Information regarding the operation of the SEC's Public Reference Room may be obtained by calling 1-800-SEC-0330.
For a complete list of a fund's portfolio holdings, view the most recent holdings listing, semiannual report, or annual report on Fidelity's web site at http://www.fidelity.com, http://www.institutional.fidelity.com, or http://www.401k.com, as applicable.
NOT FDIC INSURED •MAY LOSE VALUE •NO BANK GUARANTEE
Neither the Fund nor Fidelity Distributors Corporation is a bank.
Performance: The Bottom Line
Average annual total return reflects the change in the value of an investment, assuming reinvestment of distributions from dividend income and capital gains (the profits earned upon the sale of securities that have grown in value, if any) and assuming a constant rate of performance each year. The hypothetical investment and the average annual total returns do not reflect the deduction of taxes that a shareholder would pay on fund distributions or the redemption of fund shares. During periods of reimbursement by Fidelity, a fund’s total return will be greater than it would be had the reimbursement not occurred. How a fund did yesterday is no guarantee of how it will do tomorrow.
Average Annual Total Returns
| For the periods ended December 31, 2017 | Past 1 year | Past 5 years | Past 10 years |
| Fidelity® Contrafund® | 32.21% | 16.42% | 8.95% |
$10,000 Over 10 Years
Let's say hypothetically that $10,000 was invested in Fidelity® Contrafund®, a class of the fund, on December 31, 2007.
The chart shows how the value of your investment would have changed, and also shows how the S&P 500® Index performed over the same period.
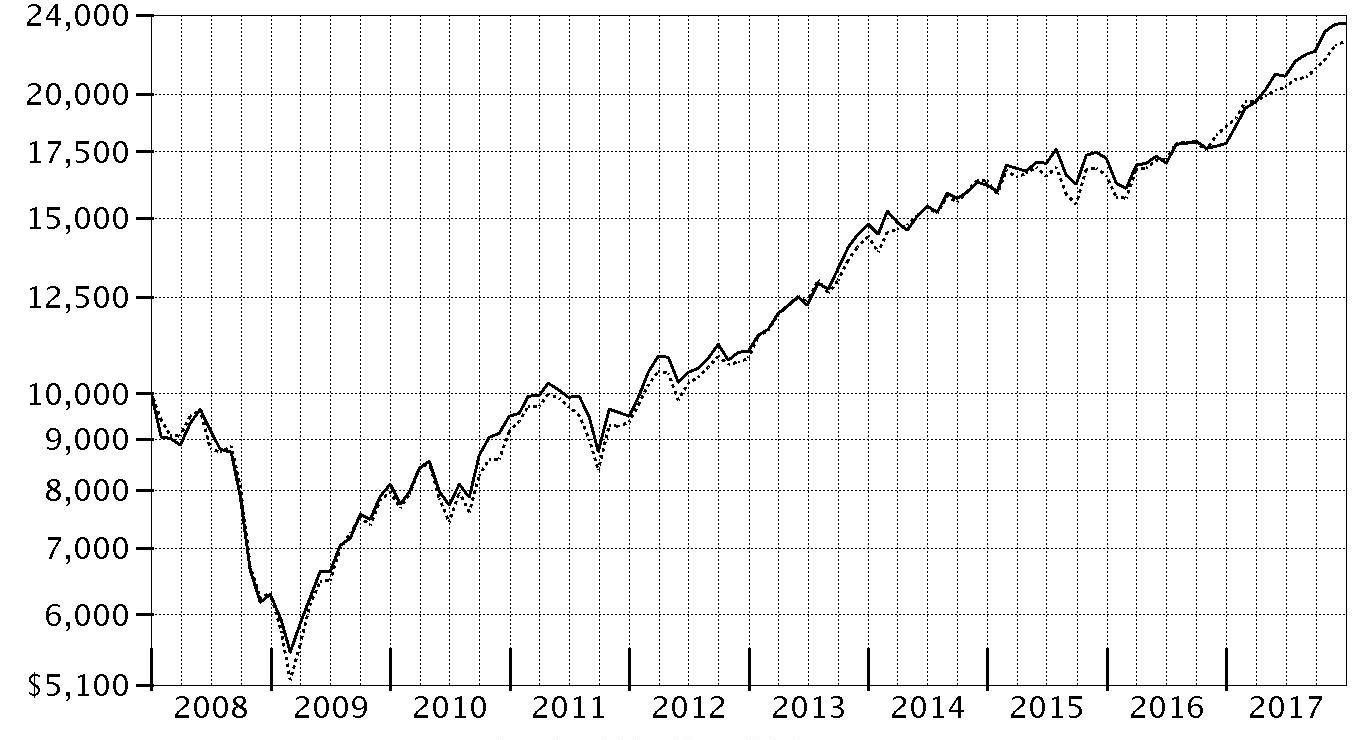
| Period Ending Values |
| $23,570 | Fidelity® Contrafund® |
| $22,603 | S&P 500® Index |
Management's Discussion of Fund Performance
Market Recap: U.S. equities gained 21.83% in 2017, as the S&P 500
® index rose steadily and closed the year just shy of an all-time high after a particularly strong three-month finish. Early on, equities rallied on optimism for President Trump’s pro-business agenda but leveled off in March amid fading optimism and stalled efforts by Congress to repeal and replace the Affordable Care Act. Upward momentum soon returned and continued through year-end with consumer sentiment and other market indicators staying positive. The lone exception was a brief cooldown in August, when geopolitical tension escalated and uncertainty grew regarding the future of health care, tax reform and the debt ceiling. Sector-wise, information technology fared best by a wide margin, rising 39% amid strong earnings growth from several major index constituents. A 24% gain in materials was spurred by increased demand, especially from China. Consumer discretionary gained 23%, despite many brick-and-mortar retailers suffering from online competition, and financials edged the broader market on an uptick in bond yields. Conversely, the defensive energy and telecom services sectors returned about -1% each. Rising interest rates held back real estate (+11%), while consumer staples (+13%) and utilities (+12%) struggled due to investors’ general preference for risk assets.
Comments from Portfolio Manager William Danoff: For the year, the fund's share classes gained about 32%, well ahead of the benchmark S&P 500
® index. A more business-friendly administration in the White House, a rebound in China’s economy and an extremely low interest rate environment worldwide produced synchronous global economic expansion. This strength propelled the stock market higher, particularly growth and technology shares. Contrafund was well-positioned for this rebound, and performed very well for the year. The fund's outperformance of the benchmark primarily was driven by a sizable position – 42% of assets, on average – in the market-leading information technology sector. Here, notable individual contributors included social-media firm Facebook and Google parent Alphabet, our two largest holdings. Other top contributors from the tech sector were gaming company Activision Blizzard and publishing software developer Adobe Systems. Our No. 2 relative contributor in 2017 was the fund’s de-emphasis of industrial conglomerate General Electric, which struggled the past year as demand for utility-grade generators softened. I am pleased that, given the fund beat its benchmark by more than 10 percentage points, there were no major detractors, although not owning enough of a few outperforming benchmark names hurt modestly. These included aircraft manufacturer Boeing and pharmaceutical firm AbbVie.
The views expressed above reflect those of the portfolio manager(s) only through the end of the period as stated on the cover of this report and do not necessarily represent the views of Fidelity or any other person in the Fidelity organization. Any such views are subject to change at any time based upon market or other conditions and Fidelity disclaims any responsibility to update such views. These views may not be relied on as investment advice and, because investment decisions for a Fidelity fund are based on numerous factors, may not be relied on as an indication of trading intent on behalf of any Fidelity fund.
Investment Summary (Unaudited)
Top Ten Stocks as of December 31, 2017
| | % of fund's net assets |
| Facebook, Inc. Class A | 7.2 |
| Berkshire Hathaway, Inc. Class A | 5.2 |
| Amazon.com, Inc. | 5.1 |
| Alphabet, Inc. Class A | 3.5 |
| Alphabet, Inc. Class C | 3.2 |
| Apple, Inc. | 3.2 |
| Microsoft Corp. | 3.1 |
| UnitedHealth Group, Inc. | 2.8 |
| Visa, Inc. Class A | 2.5 |
| Salesforce.com, Inc. | 2.3 |
| | 38.1 |
Top Five Market Sectors as of December 31, 2017
| | % of fund's net assets |
| Information Technology | 41.6 |
| Financials | 18.9 |
| Consumer Discretionary | 14.1 |
| Health Care | 9.2 |
| Industrials | 7.0 |
Asset Allocation (% of fund's net assets)
| As of December 31, 2017* |
| | Stocks | 97.6% |
| | Bonds | 0.1% |
| | Convertible Securities | 1.1% |
| | Short-Term Investments and Net Other Assets (Liabilities) | 1.2% |

* Foreign investments - 7.5%
Investments December 31, 2017
Showing Percentage of Net Assets
| Common Stocks - 97.6% | | | |
| | | Shares | Value (000s) |
| CONSUMER DISCRETIONARY - 14.0% | | | |
| Auto Components - 0.0% | | | |
| Aptiv PLC | | 461,281 | $39,130 |
| Delphi Technologies PLC (a) | | 153,760 | 8,068 |
| | | | 47,198 |
| Automobiles - 1.5% | | | |
| BYD Co. Ltd. (H Shares) (b) | | 7,553,000 | 65,617 |
| General Motors Co. | | 1,717,894 | 70,416 |
| Guangzhou Automobile Group Co. Ltd. (H Shares) | | 5,118,000 | 12,132 |
| Mahindra & Mahindra Ltd. | | 8,654,702 | 101,826 |
| Maruti Suzuki India Ltd. | | 1,533,074 | 233,648 |
| Tesla, Inc. (a)(b) | | 3,936,442 | 1,225,611 |
| Toyota Motor Corp. | | 963,400 | 61,397 |
| | | | 1,770,647 |
| Diversified Consumer Services - 0.1% | | | |
| Chegg, Inc. (a) | | 1,890,785 | 30,858 |
| Weight Watchers International, Inc. (a) | | 2,001,841 | 88,642 |
| | | | 119,500 |
| Hotels, Restaurants & Leisure - 1.6% | | | |
| Churchill Downs, Inc. | | 73,795 | 17,172 |
| Eldorado Resorts, Inc. (a) | | 403,827 | 13,387 |
| Hilton Worldwide Holdings, Inc. | | 4,135,969 | 330,298 |
| Las Vegas Sands Corp. | | 352,416 | 24,489 |
| Marriott International, Inc. Class A | | 5,092,258 | 691,172 |
| McDonald's Corp. | | 4,140,897 | 712,731 |
| Starbucks Corp. | | 1,628,818 | 93,543 |
| U.S. Foods Holding Corp. (a) | | 1,283,280 | 40,975 |
| Vail Resorts, Inc. | | 170,902 | 36,312 |
| | | | 1,960,079 |
| Household Durables - 0.4% | | | |
| D.R. Horton, Inc. | | 489,263 | 24,987 |
| Lennar Corp. Class A | | 2,049,726 | 129,625 |
| Mohawk Industries, Inc. (a) | | 1,223,799 | 337,646 |
| Roku, Inc. Class A | | 240,936 | 12,476 |
| | | | 504,734 |
| Internet & Direct Marketing Retail - 7.4% | | | |
| Amazon.com, Inc. (a) | | 5,292,465 | 6,189,379 |
| ASOS PLC (a) | | 114,477 | 10,379 |
| Blue Apron Holdings, Inc.: | | | |
| Class A | | 860,441 | 3,468 |
| Class B | | 3,463,673 | 13,819 |
| Netflix, Inc. (a) | | 10,101,885 | 1,939,158 |
| Priceline Group, Inc. (a) | | 435,601 | 756,961 |
| Start Today Co. Ltd. | | 2,801,200 | 85,149 |
| Takeaway.com Holding BV (a)(c) | | 556,400 | 33,967 |
| Zalando SE (a) | | 736,544 | 38,986 |
| | | | 9,071,266 |
| Leisure Products - 0.1% | | | |
| Mattel, Inc. (b) | | 3,849,245 | 59,201 |
| Polaris Industries, Inc. | | 282,800 | 35,064 |
| | | | 94,265 |
| Media - 0.9% | | | |
| Charter Communications, Inc. Class A (a) | | 558,040 | 187,479 |
| Liberty Global PLC Class A (a) | | 1,167,463 | 41,842 |
| Liberty Media Corp.: | | | |
| Liberty Formula One Group Series C (a) | | 7,524,117 | 257,024 |
| Liberty SiriusXM Series C (a) | | 5,081,799 | 201,544 |
| Live Nation Entertainment, Inc. (a) | | 1,069,735 | 45,539 |
| Sirius XM Holdings, Inc. (b) | | 24,568,249 | 131,686 |
| The Walt Disney Co. | | 2,678,714 | 287,989 |
| Weinstein Co. Holdings LLC Class A-1 (a)(d)(e)(f) | | 41,234 | 0 |
| | | | 1,153,103 |
| Multiline Retail - 0.2% | | | |
| B&M European Value Retail S.A. | | 10,861,792 | 62,121 |
| Dollar Tree, Inc. (a) | | 898,930 | 96,464 |
| Ollie's Bargain Outlet Holdings, Inc. (a) | | 1,492,501 | 79,476 |
| | | | 238,061 |
| Specialty Retail - 1.3% | | | |
| Burlington Stores, Inc. (a) | | 101,477 | 12,485 |
| Five Below, Inc. (a) | | 378,529 | 25,104 |
| Home Depot, Inc. | | 5,598,282 | 1,061,042 |
| TJX Companies, Inc. | | 6,258,914 | 478,557 |
| | | | 1,577,188 |
| Textiles, Apparel & Luxury Goods - 0.5% | | | |
| adidas AG | | 1,704,913 | 341,929 |
| Kering SA | | 140,003 | 66,017 |
| LVMH Moet Hennessy - Louis Vuitton SA | | 206,059 | 60,479 |
| NIKE, Inc. Class B | | 2,999,577 | 187,624 |
| | | | 656,049 |
|
| TOTAL CONSUMER DISCRETIONARY | | | 17,192,090 |
|
| CONSUMER STAPLES - 2.5% | | | |
| Beverages - 0.5% | | | |
| Constellation Brands, Inc. Class A (sub. vtg.) | | 701,895 | 160,432 |
| Kweichow Moutai Co. Ltd. (A Shares) | | 580,700 | 62,249 |
| Monster Beverage Corp. (a) | | 1,797,258 | 113,748 |
| The Coca-Cola Co. | | 4,081,865 | 187,276 |
| | | | 523,705 |
| Food & Staples Retailing - 0.5% | | | |
| Costco Wholesale Corp. | | 1,098,532 | 204,459 |
| Performance Food Group Co. (a) | | 2,616,872 | 86,618 |
| Sysco Corp. | | 488,474 | 29,665 |
| Wal-Mart Stores, Inc. | | 3,259,634 | 321,889 |
| | | | 642,631 |
| Food Products - 0.0% | | | |
| The Simply Good Foods Co. | | 1,453,963 | 20,734 |
| Household Products - 0.6% | | | |
| Colgate-Palmolive Co. | | 9,748,647 | 735,535 |
| Personal Products - 0.9% | | | |
| Estee Lauder Companies, Inc. Class A | | 8,185,407 | 1,041,511 |
| L'Oreal SA | | 232,429 | 51,502 |
| Shiseido Co. Ltd. | | 215,500 | 10,416 |
| Unilever NV (Certificaten Van Aandelen) (Bearer) | | 423,600 | 23,850 |
| | | | 1,127,279 |
|
| TOTAL CONSUMER STAPLES | | | 3,049,884 |
|
| ENERGY - 2.2% | | | |
| Oil, Gas & Consumable Fuels - 2.2% | | | |
| Andeavor | | 93,143 | 10,650 |
| Birchcliff Energy Ltd. (g) | | 20,925,111 | 73,246 |
| Birchcliff Energy Ltd. (a)(c)(g) | | 686,127 | 2,402 |
| Cabot Oil & Gas Corp. | | 916,075 | 26,200 |
| Canadian Natural Resources Ltd. | | 5,786,957 | 206,802 |
| Centennial Resource Development, Inc.: | | | |
| Class A (a)(g) | | 5,188,000 | 102,722 |
| Class A (a)(b)(g) | | 13,884,347 | 274,910 |
| Class A (e)(g) | | 2,340,926 | 46,350 |
| Concho Resources, Inc. (a) | | 557,731 | 83,782 |
| Continental Resources, Inc. (a) | | 4,454,752 | 235,968 |
| Diamondback Energy, Inc. (a) | | 1,924,391 | 242,954 |
| Encana Corp. | | 969,925 | 12,940 |
| EOG Resources, Inc. | | 5,452,517 | 588,381 |
| Growmax Resources Corp. (a)(c) | | 3,445,563 | 288 |
| Phillips 66 Co. | | 2,639,230 | 266,958 |
| Pioneer Natural Resources Co. | | 71,644 | 12,384 |
| PrairieSky Royalty Ltd. | | 2,752,474 | 70,202 |
| Reliance Industries Ltd. | | 24,199,564 | 349,139 |
| Valero Energy Corp. | | 1,169,574 | 107,496 |
| | | | 2,713,774 |
| FINANCIALS - 18.9% | | | |
| Banks - 10.0% | | | |
| Bank Ireland Group PLC (a) | | 14,781,261 | 126,807 |
| Bank of America Corp. | | 72,809,398 | 2,149,333 |
| Citigroup, Inc. | | 36,040,820 | 2,681,797 |
| HDFC Bank Ltd. sponsored ADR | | 6,969,684 | 708,608 |
| JPMorgan Chase & Co. | | 21,393,467 | 2,287,817 |
| Kotak Mahindra Bank Ltd. | | 11,135,666 | 176,210 |
| M&T Bank Corp. | | 1,950,074 | 333,443 |
| Metro Bank PLC (a)(b)(g) | | 5,947,525 | 287,797 |
| PNC Financial Services Group, Inc. | | 2,869,202 | 413,997 |
| Royal Bank of Canada | | 871,182 | 71,143 |
| The Toronto-Dominion Bank | | 2,008,195 | 117,664 |
| U.S. Bancorp | | 13,395,139 | 717,712 |
| Wells Fargo & Co. | | 35,507,366 | 2,154,232 |
| | | | 12,226,560 |
| Capital Markets - 2.3% | | | |
| Ashmore Group PLC | | 1,658,173 | 9,069 |
| Bank of New York Mellon Corp. | | 4,399,321 | 236,947 |
| BlackRock, Inc. Class A | | 585,999 | 301,034 |
| Brookfield Asset Management, Inc. Class A | | 633,498 | 27,578 |
| CBOE Holdings, Inc. | | 249,330 | 31,064 |
| Charles Schwab Corp. | | 11,360,770 | 583,603 |
| CME Group, Inc. | | 753,381 | 110,031 |
| Goldman Sachs Group, Inc. | | 121,821 | 31,035 |
| IntercontinentalExchange, Inc. | | 1,688,888 | 119,168 |
| Morgan Stanley | | 13,977,355 | 733,392 |
| MSCI, Inc. | | 1,571,223 | 198,823 |
| Oaktree Capital Group LLC Class A | | 2,369,843 | 99,770 |
| S&P Global, Inc. | | 1,814,956 | 307,454 |
| St. James's Place Capital PLC | | 1,549,863 | 25,655 |
| | | | 2,814,623 |
| Consumer Finance - 0.1% | | | |
| Synchrony Financial | | 4,059,167 | 156,724 |
| Diversified Financial Services - 5.2% | | | |
| Berkshire Hathaway, Inc. Class A (a) | | 21,535 | 6,408,816 |
| Insurance - 1.3% | | | |
| Admiral Group PLC | | 4,091,264 | 110,587 |
| AIA Group Ltd. | | 8,301,800 | 70,821 |
| Chubb Ltd. | | 7,137,990 | 1,043,074 |
| Fairfax Financial Holdings Ltd. (sub. vtg.) | | 181,083 | 96,425 |
| Marsh & McLennan Companies, Inc. | | 2,308,474 | 187,887 |
| | | | 1,508,794 |
|
| TOTAL FINANCIALS | | | 23,115,517 |
|
| HEALTH CARE - 8.9% | | | |
| Biotechnology - 2.2% | | | |
| AbbVie, Inc. | | 2,478,244 | 239,671 |
| Agios Pharmaceuticals, Inc. (a) | | 1,060,610 | 60,635 |
| Alnylam Pharmaceuticals, Inc. (a) | | 433,100 | 55,025 |
| Amgen, Inc. | | 852,604 | 148,268 |
| AnaptysBio, Inc. | | 447,716 | 45,094 |
| Biogen, Inc. (a) | | 291,588 | 92,891 |
| bluebird bio, Inc. (a) | | 177,359 | 31,588 |
| Blueprint Medicines Corp. (a) | | 232,134 | 17,505 |
| Celgene Corp. (a) | | 1,334,244 | 139,242 |
| Exact Sciences Corp. (a) | | 316,719 | 16,640 |
| FibroGen, Inc. (a) | | 1,931,049 | 91,532 |
| Genmab A/S (a) | | 908,578 | 150,680 |
| Gilead Sciences, Inc. | | 7,114,588 | 509,689 |
| Insmed, Inc. (a) | | 987,886 | 30,802 |
| Intrexon Corp. (b) | | 1,755,782 | 20,227 |
| Juno Therapeutics, Inc. (a) | | 608,075 | 27,795 |
| NantKwest, Inc. (a)(b) | | 826,782 | 3,712 |
| Neurocrine Biosciences, Inc. (a) | | 3,028,126 | 234,952 |
| OvaScience, Inc. (a) | | 1,449,250 | 2,029 |
| Portola Pharmaceuticals, Inc. (a) | | 795,959 | 38,747 |
| Regeneron Pharmaceuticals, Inc. (a) | | 365,411 | 137,380 |
| Sage Therapeutics, Inc. (a) | | 205,191 | 33,797 |
| Vertex Pharmaceuticals, Inc. (a) | | 3,662,663 | 548,887 |
| | | | 2,676,788 |
| Health Care Equipment & Supplies - 1.6% | | | |
| Baxter International, Inc. | | 6,286,643 | 406,369 |
| Becton, Dickinson & Co. | | 518,278 | 110,943 |
| Boston Scientific Corp. (a) | | 29,897,043 | 741,148 |
| Danaher Corp. | | 1,002,183 | 93,023 |
| Edwards Lifesciences Corp. (a) | | 284,557 | 32,072 |
| Intuitive Surgical, Inc. (a) | | 990,232 | 361,375 |
| Penumbra, Inc. (a) | | 475,311 | 44,727 |
| ResMed, Inc. | | 564,735 | 47,827 |
| Stryker Corp. | | 776,986 | 120,309 |
| | | | 1,957,793 |
| Health Care Providers & Services - 3.3% | | | |
| Aetna, Inc. | | 730,738 | 131,818 |
| Anthem, Inc. | | 92,947 | 20,914 |
| Cigna Corp. | | 219,037 | 44,484 |
| HealthEquity, Inc. (a) | | 1,695,286 | 79,102 |
| Henry Schein, Inc. (a) | | 2,416,332 | 168,853 |
| Humana, Inc. | | 801,287 | 198,775 |
| National Vision Holdings, Inc. | | 757,104 | 30,746 |
| OptiNose, Inc. | | 539,390 | 10,194 |
| UnitedHealth Group, Inc. | | 15,550,291 | 3,428,217 |
| | | | 4,113,103 |
| Health Care Technology - 0.1% | | | |
| Medidata Solutions, Inc. (a) | | 497,480 | 31,525 |
| NantHealth, Inc. (a) | | 8,726 | 27 |
| Veeva Systems, Inc. Class A (a) | | 2,249,125 | 124,332 |
| | | | 155,884 |
| Life Sciences Tools & Services - 1.2% | | | |
| Agilent Technologies, Inc. | | 911,425 | 61,038 |
| Eurofins Scientific SA | | 80,681 | 49,138 |
| Mettler-Toledo International, Inc. (a)(g) | | 1,739,519 | 1,077,667 |
| PRA Health Sciences, Inc. (a) | | 830,077 | 75,595 |
| Thermo Fisher Scientific, Inc. | | 759,640 | 144,240 |
| Waters Corp. (a) | | 389,119 | 75,174 |
| | | | 1,482,852 |
| Pharmaceuticals - 0.5% | | | |
| AstraZeneca PLC sponsored ADR | | 554,333 | 19,235 |
| Bristol-Myers Squibb Co. | | 2,415,687 | 148,033 |
| GW Pharmaceuticals PLC ADR (a) | | 68,246 | 9,009 |
| Johnson & Johnson | | 583,003 | 81,457 |
| Nektar Therapeutics (a) | | 3,788,992 | 226,279 |
| Teva Pharmaceutical Industries Ltd. sponsored ADR | | 4,657,942 | 88,268 |
| | | | 572,281 |
|
| TOTAL HEALTH CARE | | | 10,958,701 |
|
| INDUSTRIALS - 6.9% | | | |
| Aerospace & Defense - 1.0% | | | |
| General Dynamics Corp. | | 653,034 | 132,860 |
| Northrop Grumman Corp. | | 1,297,462 | 398,204 |
| Raytheon Co. | | 962,410 | 180,789 |
| Space Exploration Technologies Corp.: | | | |
| Class A (a)(e)(f) | | 295,578 | 39,903 |
| Class C (e)(f) | | 12,991 | 1,754 |
| The Boeing Co. | | 1,464,853 | 432,000 |
| | | | 1,185,510 |
| Air Freight & Logistics - 0.5% | | | |
| Expeditors International of Washington, Inc. | | 169,129 | 10,941 |
| FedEx Corp. | | 1,483,395 | 370,166 |
| XPO Logistics, Inc. (a) | | 2,523,969 | 231,170 |
| | | | 612,277 |
| Airlines - 1.0% | | | |
| Ryanair Holdings PLC sponsored ADR (a) | | 5,130,023 | 534,497 |
| Southwest Airlines Co. | | 11,022,876 | 721,447 |
| | | | 1,255,944 |
| Building Products - 0.8% | | | |
| A.O. Smith Corp. | | 999,856 | 61,271 |
| Fortune Brands Home & Security, Inc. | | 1,242,720 | 85,052 |
| Jeld-Wen Holding, Inc. | | 4,046,404 | 159,307 |
| Masco Corp. | | 12,610,412 | 554,102 |
| Toto Ltd. | | 2,928,000 | 172,809 |
| | | | 1,032,541 |
| Commercial Services & Supplies - 0.2% | | | |
| Cintas Corp. | | 999,272 | 155,717 |
| TulCo LLC (d)(e)(f) | | 125,827 | 44,039 |
| | | | 199,756 |
| Construction & Engineering - 0.1% | | | |
| Jacobs Engineering Group, Inc. | | 924,109 | 60,954 |
| Electrical Equipment - 0.4% | | | |
| AMETEK, Inc. | | 660,527 | 47,868 |
| Fortive Corp. | | 5,903,654 | 427,129 |
| | | | 474,997 |
| Industrial Conglomerates - 0.8% | | | |
| 3M Co. | | 4,018,929 | 945,935 |
| ITT, Inc. | | 111,805 | 5,967 |
| Roper Technologies, Inc. | | 86,532 | 22,412 |
| | | | 974,314 |
| Machinery - 1.3% | | | |
| Caterpillar, Inc. | | 1,576,543 | 248,432 |
| Deere & Co. | | 3,042,920 | 476,247 |
| Gardner Denver Holdings, Inc. | | 2,419,324 | 82,088 |
| IDEX Corp. | | 81,921 | 10,811 |
| Illinois Tool Works, Inc. | | 1,743,434 | 290,892 |
| Ingersoll-Rand PLC | | 997,971 | 89,009 |
| Oshkosh Corp. | | 122,649 | 11,148 |
| PACCAR, Inc. | | 1,821,301 | 129,458 |
| Parker Hannifin Corp. | | 1,182,314 | 235,966 |
| Rational AG | | 39,483 | 25,449 |
| Xylem, Inc. | | 507,782 | 34,631 |
| | | | 1,634,131 |
| Professional Services - 0.3% | | | |
| Equifax, Inc. | | 249,476 | 29,418 |
| Manpower, Inc. | | 244,255 | 30,803 |
| Recruit Holdings Co. Ltd. | | 2,548,600 | 63,333 |
| RELX PLC | | 557,096 | 13,080 |
| TransUnion Holding Co., Inc. (a) | | 4,450,959 | 244,625 |
| | | | 381,259 |
| Road & Rail - 0.4% | | | |
| CSX Corp. | | 7,293,748 | 401,229 |
| Union Pacific Corp. | | 743,753 | 99,737 |
| | | | 500,966 |
| Trading Companies & Distributors - 0.1% | | | |
| Air Lease Corp. Class A (c) | | 1,414,358 | 68,016 |
| Fastenal Co. | | 228,275 | 12,484 |
| United Rentals, Inc. (a) | | 113,766 | 19,558 |
| | | | 100,058 |
|
| TOTAL INDUSTRIALS | | | 8,412,707 |
|
| INFORMATION TECHNOLOGY - 41.1% | | | |
| Communications Equipment - 0.4% | | | |
| Arista Networks, Inc. (a) | | 1,863,639 | 439,036 |
| Electronic Equipment & Components - 1.8% | | | |
| Amphenol Corp. Class A (g) | | 22,863,610 | 2,007,425 |
| CDW Corp. | | 2,104,464 | 146,239 |
| Corning, Inc. | | 170,210 | 5,445 |
| Dolby Laboratories, Inc. Class A | | 871,583 | 54,038 |
| Keyence Corp. | | 19,600 | 10,980 |
| | | | 2,224,127 |
| Internet Software & Services - 15.3% | | | |
| Alibaba Group Holding Ltd. sponsored ADR (a) | | 2,327,884 | 401,397 |
| Alphabet, Inc.: | | | |
| Class A (a) | | 4,118,780 | 4,338,723 |
| Class C (a) | | 3,788,625 | 3,964,417 |
| CarGurus, Inc. Class A (b) | | 625,994 | 18,767 |
| Cloudera, Inc. (b) | | 1,616,953 | 26,712 |
| CoStar Group, Inc. (a) | | 14,889 | 4,421 |
| Dropbox, Inc. Class B (a)(e)(f) | | 5,464,028 | 77,808 |
| eBay, Inc. (a) | | 7,756,791 | 292,741 |
| Facebook, Inc. Class A (a) | | 49,685,082 | 8,767,436 |
| LogMeIn, Inc. | | 1,883,719 | 215,686 |
| New Relic, Inc. (a) | | 1,098,730 | 63,474 |
| Nutanix, Inc. Class B (c) | | 3,060,752 | 107,983 |
| Okta, Inc. | | 1,199,694 | 30,724 |
| Q2 Holdings, Inc. (a) | | 44,491 | 1,639 |
| Rightmove PLC | | 271,289 | 16,483 |
| Shopify, Inc. Class A (a) | | 466,460 | 47,169 |
| Tencent Holdings Ltd. | | 8,518,200 | 440,885 |
| | | | 18,816,465 |
| IT Services - 6.1% | | | |
| Accenture PLC Class A | | 1,028,249 | 157,415 |
| ASAC II LP (a)(e)(f) | | 39,494,500 | 6,635 |
| EPAM Systems, Inc. (a) | | 679,330 | 72,980 |
| Fiserv, Inc. (a) | | 2,105,345 | 276,074 |
| FleetCor Technologies, Inc. (a) | | 10,633 | 2,046 |
| Global Payments, Inc. | | 2,013,835 | 201,867 |
| Leidos Holdings, Inc. | | 346,875 | 22,398 |
| MasterCard, Inc. Class A | | 11,597,630 | 1,755,417 |
| PayPal Holdings, Inc. (a) | | 25,043,707 | 1,843,718 |
| Square, Inc. (a) | | 1,509,271 | 52,326 |
| Visa, Inc. Class A | | 27,278,040 | 3,110,242 |
| | | | 7,501,118 |
| Semiconductors & Semiconductor Equipment - 2.8% | | | |
| Analog Devices, Inc. | | 791,386 | 70,457 |
| Applied Materials, Inc. | | 11,389,500 | 582,231 |
| Broadcom Ltd. | | 1,944,125 | 499,446 |
| First Solar, Inc. (a) | | 713,233 | 48,157 |
| Lam Research Corp. | | 2,708,772 | 498,604 |
| NVIDIA Corp. | | 4,569,664 | 884,230 |
| Qualcomm, Inc. | | 1,316,152 | 84,260 |
| Taiwan Semiconductor Manufacturing Co. Ltd. sponsored ADR | | 5,174,027 | 205,150 |
| Texas Instruments, Inc. | | 5,006,384 | 522,867 |
| | | | 3,395,402 |
| Software - 11.5% | | | |
| Activision Blizzard, Inc. | | 34,531,460 | 2,186,532 |
| Adobe Systems, Inc. (a) | | 13,085,352 | 2,293,077 |
| Atlassian Corp. PLC (a) | | 3,108,052 | 141,479 |
| CDK Global, Inc. | | 1,477,549 | 105,320 |
| Constellation Software, Inc. | | 131,414 | 79,666 |
| Electronic Arts, Inc. (a) | | 8,596,245 | 903,121 |
| Intuit, Inc. | | 796,168 | 125,619 |
| Micro Focus International PLC | | 1,692,548 | 57,655 |
| Microsoft Corp. | | 44,162,151 | 3,777,630 |
| Nintendo Co. Ltd. | | 175,400 | 63,161 |
| Parametric Technology Corp. (a) | | 928,547 | 56,428 |
| Paycom Software, Inc. (a)(b) | | 1,710,940 | 137,440 |
| Red Hat, Inc. (a) | | 2,054,235 | 246,714 |
| RingCentral, Inc. (a) | | 1,715,421 | 83,026 |
| Salesforce.com, Inc. (a) | | 26,966,406 | 2,756,776 |
| Snap, Inc. Class A (a)(b) | | 1,592,804 | 23,271 |
| Tanium, Inc. Class B (e)(f) | | 2,944,100 | 15,103 |
| Trion World, Inc. (a)(e)(f) | | 4,607,810 | 0 |
| Trion World, Inc. warrants 10/3/18 (a)(e)(f) | | 183,516 | 0 |
| Ultimate Software Group, Inc. (a) | | 1,116,550 | 243,665 |
| Workday, Inc. Class A (a) | | 7,527,460 | 765,844 |
| | | | 14,061,527 |
| Technology Hardware, Storage & Peripherals - 3.2% | | | |
| Apple, Inc. | | 23,011,177 | 3,894,181 |
| Samsung Electronics Co. Ltd. | | 11,221 | 26,786 |
| | | | 3,920,967 |
|
| TOTAL INFORMATION TECHNOLOGY | | | 50,358,642 |
|
| MATERIALS - 2.6% | | | |
| Chemicals - 1.6% | | | |
| Air Products & Chemicals, Inc. | | 1,685,148 | 276,499 |
| DowDuPont, Inc. | | 11,482,761 | 817,802 |
| LyondellBasell Industries NV Class A | | 757,935 | 83,615 |
| Olin Corp. | | 1,272,798 | 45,286 |
| Sherwin-Williams Co. | | 1,396,767 | 572,730 |
| The Chemours Co. LLC | | 533,491 | 26,707 |
| Westlake Chemical Corp. | | 1,338,335 | 142,573 |
| | | | 1,965,212 |
| Construction Materials - 0.0% | | | |
| Eagle Materials, Inc. | | 76,646 | 8,684 |
| Containers & Packaging - 0.2% | | | |
| WestRock Co. | | 3,176,176 | 200,766 |
| Metals & Mining - 0.8% | | | |
| ArcelorMittal SA Class A unit (a)(b) | | 1,676,835 | 54,179 |
| Arizona Mining, Inc. (a) | | 885,695 | 2,438 |
| B2Gold Corp. (a)(g) | | 49,817,232 | 153,772 |
| Franco-Nevada Corp. | | 4,241,442 | 338,978 |
| Freeport-McMoRan, Inc. (a) | | 1,027,361 | 19,479 |
| Ivanhoe Mines Ltd. (a)(g) | | 51,261,868 | 172,912 |
| Ivanhoe Mines Ltd. (a)(c)(g) | | 14,742,100 | 49,727 |
| Kirkland Lake Gold Ltd. | | 2,926,470 | 44,863 |
| Newcrest Mining Ltd. | | 5,816,660 | 103,567 |
| Novagold Resources, Inc. (a) | | 8,115,004 | 31,892 |
| Nucor Corp. | | 503,030 | 31,983 |
| Randgold Resources Ltd. sponsored ADR | | 366,081 | 36,202 |
| | | | 1,039,992 |
|
| TOTAL MATERIALS | | | 3,214,654 |
|
| REAL ESTATE - 0.2% | | | |
| Equity Real Estate Investment Trusts (REITs) - 0.1% | | | |
| American Tower Corp. | | 838,884 | 119,684 |
| Real Estate Management & Development - 0.1% | | | |
| Five Point Holdings LLC Class A (a) | | 3,148,178 | 44,389 |
| WeWork Companies, Inc. Class A (a)(e)(f) | | 607,163 | 31,457 |
| | | | 75,846 |
|
| TOTAL REAL ESTATE | | | 195,530 |
|
| TELECOMMUNICATION SERVICES - 0.3% | | | |
| Wireless Telecommunication Services - 0.3% | | | |
| SoftBank Corp. | | 655,500 | 51,896 |
| T-Mobile U.S., Inc. (a) | | 5,547,574 | 352,326 |
| | | | 404,222 |
| TOTAL COMMON STOCKS | | | |
| (Cost $58,130,785) | | | 119,615,721 |
|
| Convertible Preferred Stocks - 1.1% | | | |
| CONSUMER DISCRETIONARY - 0.1% | | | |
| Diversified Consumer Services - 0.1% | | | |
| Airbnb, Inc.: | | | |
| Series D (a)(e)(f) | | 578,817 | 54,519 |
| Series E (a)(e)(f) | | 388,853 | 36,626 |
| Handy Technologies, Inc. Series C (a)(e)(f) | | 3,537,042 | 11,248 |
| | | | 102,393 |
| CONSUMER STAPLES - 0.0% | | | |
| Food & Staples Retailing - 0.0% | | | |
| Roofoods Ltd. Series F (e)(f) | | 154,611 | 54,666 |
| HEALTH CARE - 0.2% | | | |
| Biotechnology - 0.2% | | | |
| 23andMe, Inc.: | | | |
| Series E (a)(e)(f) | | 664,987 | 9,233 |
| Series F (e)(f) | | 3,348,986 | 46,498 |
| Intarcia Therapeutics, Inc. Series CC (a)(e)(f) | | 2,100,446 | 126,027 |
| | | | 181,758 |
| Health Care Providers & Services - 0.0% | | | |
| Get Heal, Inc. Series B (a)(e)(f) | | 35,877,127 | 3,197 |
| Mulberry Health, Inc. Series A8 (a)(e)(f) | | 7,960,894 | 50,631 |
| | | | 53,828 |
|
| TOTAL HEALTH CARE | | | 235,586 |
|
| INDUSTRIALS - 0.1% | | | |
| Aerospace & Defense - 0.1% | | | |
| Space Exploration Technologies Corp.: | | | |
| Series G (a)(e)(f) | | 558,215 | 75,359 |
| Series H (e)(f) | | 120,282 | 16,238 |
| | | | 91,597 |
| INFORMATION TECHNOLOGY - 0.5% | | | |
| Internet Software & Services - 0.4% | | | |
| Dropbox, Inc.: | | | |
| Series A (a)(e)(f) | | 1,260,898 | 17,955 |
| Series C (a)(e)(f) | | 698,385 | 10,769 |
| Lyft, Inc. Series H (e)(f) | | 1,553,259 | 61,736 |
| Pinterest, Inc.: | | | |
| Series E, 8.00% (a)(e)(f) | | 54,841,080 | 327,950 |
| Series F, 8.00% (a)(e)(f) | | 3,455,720 | 20,665 |
| Series G, 8.00% (a)(e)(f) | | 4,301,275 | 25,722 |
| Uber Technologies, Inc. Series D, 8.00% (a)(e)(f) | | 2,040,465 | 71,253 |
| | | | 536,050 |
| Software - 0.1% | | | |
| Carbon, Inc. Series D (f) | | 915,425 | 21,376 |
| Cloudflare, Inc. Series D 8.00% (a)(e)(f) | | 4,303,714 | 23,627 |
| Delphix Corp. Series D (a)(e)(f) | | 3,712,687 | 20,865 |
| | | | 65,868 |
|
| TOTAL INFORMATION TECHNOLOGY | | | 601,918 |
|
| REAL ESTATE - 0.2% | | | |
| Real Estate Management & Development - 0.2% | | | |
| WeWork Companies, Inc.: | | | |
| Series E (a)(e)(f) | | 5,464,465 | 283,114 |
| Series F (a)(e)(f) | | 253,732 | 13,146 |
| | | | 296,260 |
| TELECOMMUNICATION SERVICES - 0.0% | | | |
| Wireless Telecommunication Services - 0.0% | | | |
| Altiostar Networks, Inc. Series A1 (e)(f) | | 2,124,227 | 3,314 |
| TOTAL CONVERTIBLE PREFERRED STOCKS | | | |
| (Cost $945,661) | | | 1,385,734 |
| | | Principal Amount (000s) | Value (000s) |
|
| Corporate Bonds - 0.1% | | | |
| Convertible Bonds - 0.0% | | | |
| INFORMATION TECHNOLOGY - 0.0% | | | |
| Software - 0.0% | | | |
| Trion World, Inc. 10% 10/10/19 pay-in-kind (e)(f)(h) | | 1,956 | 773 |
| Nonconvertible Bonds - 0.1% | | | |
| HEALTH CARE - 0.1% | | | |
| Pharmaceuticals - 0.1% | | | |
| Valeant Pharmaceuticals International, Inc.: | | | |
| 6.125% 4/15/25 (c) | | 72,660 | 66,484 |
| 9% 12/15/25 (c) | | 81,146 | 84,570 |
| | | | 151,054 |
| TOTAL CORPORATE BONDS | | | |
| (Cost $147,201) | | | 151,827 |
| | | Shares | Value (000s) |
|
| Money Market Funds - 1.7% | | | |
| Fidelity Cash Central Fund, 1.36% (i) | | 1,796,125,900 | 1,796,485 |
| Fidelity Securities Lending Cash Central Fund 1.36% (i)(j) | | 221,910,908 | 221,955 |
| TOTAL MONEY MARKET FUNDS | | | |
| (Cost $2,018,405) | | | 2,018,440 |
| TOTAL INVESTMENT IN SECURITIES - 100.5% | | | |
| (Cost $61,242,052) | | | 123,171,722 |
| NET OTHER ASSETS (LIABILITIES) - (0.5)% | | | (598,696) |
| NET ASSETS - 100% | | | $122,573,026 |
Values shown as $0 may reflect amounts less than $500.
Legend
(a) Non-income producing
(b) Security or a portion of the security is on loan at period end.
(c) Security exempt from registration under Rule 144A of the Securities Act of 1933. These securities may be resold in transactions exempt from registration, normally to qualified institutional buyers. At the end of the period, the value of these securities amounted to $413,437,000 or 0.3% of net assets.
(d) Investment is owned by a wholly-owned subsidiary (Subsidiary) that is treated as a corporation for U.S. tax purposes.
(e) Restricted securities - Investment in securities not registered under the Securities Act of 1933 (excluding 144A issues). At the end of the period, the value of restricted securities (excluding 144A issues) amounted to $1,628,180,000 or 1.3% of net assets.
(f) Level 3 security
(g) Affiliated company
(h) Coupon rates for floating and adjustable rate securities reflect the rates in effect at period end.
(i) Affiliated fund that is generally available only to investment companies and other accounts managed by Fidelity Investments. The rate quoted is the annualized seven-day yield of the fund at period end. A complete unaudited listing of the fund's holdings as of its most recent quarter end is available upon request. In addition, each Fidelity Central Fund's financial statements, which are not covered by the Fund's Report of Independent Registered Public Accounting Firm, are available on the SEC's website or upon request.
(j) Investment made with cash collateral received from securities on loan.
Additional information on each restricted holding is as follows:
| Security | Acquisition Date | Acquisition Cost (000s) |
| 23andMe, Inc. Series E | 6/18/15 | $7,200 |
| 23andMe, Inc. Series F | 8/31/17 | $46,498 |
| Airbnb, Inc. Series D | 4/16/14 | $23,565 |
| Airbnb, Inc. Series E | 6/29/15 | $36,200 |
| Altiostar Networks, Inc. Series A1 | 1/10/17 | $9,771 |
| ASAC II LP | 10/10/13 | $3,041 |
| Centennial Resource Development, Inc. Class A | 12/28/16 | $34,037 |
| Cloudflare, Inc. Series D 8.00% | 11/5/14 - 6/24/15 | $26,827 |
| Delphix Corp. Series D | 7/10/15 | $33,414 |
| Dropbox, Inc. Class B | 5/2/12 | $49,445 |
| Dropbox, Inc. Series A | 5/29/12 | $11,410 |
| Dropbox, Inc. Series C | 1/30/14 | $13,340 |
| Get Heal, Inc. Series B | 11/7/16 | $10,944 |
| Handy Technologies, Inc. Series C | 10/14/15 | $20,727 |
| Intarcia Therapeutics, Inc. Series CC | 11/14/12 | $28,629 |
| Lyft, Inc. Series H | 11/22/17 | $61,736 |
| Mulberry Health, Inc. Series A8 | 1/20/16 | $53,774 |
| Pinterest, Inc. Series E, 8.00% | 10/23/13 | $159,376 |
| Pinterest, Inc. Series F, 8.00% | 5/15/14 | $11,739 |
| Pinterest, Inc. Series G, 8.00% | 2/27/15 | $30,879 |
| Roofoods Ltd. Series F | 9/12/17 | $54,666 |
| Space Exploration Technologies Corp. Class A | 10/16/15 - 9/11/17 | $30,689 |
| Space Exploration Technologies Corp. Class C | 9/11/17 | $1,754 |
| Space Exploration Technologies Corp. Series G | 1/20/15 | $43,239 |
| Space Exploration Technologies Corp. Series H | 8/4/17 | $16,238 |
| Tanium, Inc. Class B | 4/21/17 | $14,615 |
| Trion World, Inc. | 8/22/08 - 3/20/13 | $25,151 |
| Trion World, Inc. warrants 10/3/18 | 10/10/13 | $0 |
| Trion World, Inc. 10% 10/10/19 pay-in-kind | 10/10/13 - 10/10/17 | $1,953 |
| TulCo LLC | 8/24/17 - 12/14/17 | $44,039 |
| Uber Technologies, Inc. Series D, 8.00% | 6/6/14 | $31,654 |
| Weinstein Co. Holdings LLC Class A-1 | 10/19/05 | $41,234 |
| WeWork Companies, Inc. Class A | 6/23/15 | $19,969 |
| WeWork Companies, Inc. Series E | 6/23/15 | $179,724 |
| WeWork Companies, Inc. Series F | 12/1/16 | $12,735 |
Affiliated Central Funds
Information regarding fiscal year to date income earned by the Fund from investments in Fidelity Central Funds is as follows:
| Fund | Income earned |
| | (Amounts in thousands) |
| Fidelity Cash Central Fund | $12,254 |
| Fidelity Securities Lending Cash Central Fund | 13,046 |
| Total | $25,300 |
Amounts in the income column in the above table include any capital gain distributions from underlying funds, which are presented in the corresponding line-item in the Statement of Operations if applicable.
Other Affiliated Issuers
An affiliated company is a company in which the Fund has ownership of at least 5% of the voting securities. Fiscal year to date transactions with companies which are or were affiliates are as follows:
| Affiliate (Amounts in thousands) | Value, beginning of period | Purchases | Sales Proceeds* | Dividend Income | Realized Gain (loss) | Change in Unrealized appreciation (depreciation) | Value, end of period |
| Activision Blizzard, Inc. | $1,415,505 | $29,714 | $305,883 | $11,653 | $205,174 | $842,022 | $-- |
| Amphenol Corp. Class A | 1,616,746 | 12,845 | 106,511 | 16,399 | 78,562 | 405,783 | 2,007,425 |
| B2Gold Corp. | 133,433 | -- | 18,167 | -- | 3,230 | 35,276 | 153,772 |
| Birchcliff Energy Ltd. | 154,808 | 9,926 | 15,759 | 1,384 | (4,160) | (71,569) | 73,246 |
| Birchcliff Energy Ltd. | 4,788 | -- | -- | 45 | -- | (2,386) | 2,402 |
| Centennial Resource Development, Inc. Class A | 102,307 | -- | -- | -- | -- | 415 | 102,722 |
| Centennial Resource Development, Inc. Class A | 119,830 | 157,743 | 8,202 | -- | 1,999 | 3,540 | 274,910 |
| Centennial Resource Development, Inc. Class A | 41,547 | -- | -- | -- | -- | 4,803 | 46,350 |
| Ivanhoe Mines Ltd. | 84,945 | 30,762 | 7,412 | -- | 5,923 | 58,694 | 172,912 |
| Ivanhoe Mines Ltd. | 29,259 | -- | 2,331 | -- | (1,156) | 23,955 | 49,727 |
| Metro Bank PLC | 221,999 | 3,541 | 12,833 | -- | 9,282 | 65,808 | 287,797 |
| Mettler-Toledo International, Inc. | 755,194 | 32,460 | 73,514 | -- | 46,598 | 316,929 | 1,077,667 |
| Ultimate Software Group, Inc. | 341,510 | 17,628 | 162,118 | -- | 3,676 | 42,969 | -- |
| Total | $5,021,871 | $294,619 | $712,730 | $29,481 | $349,128 | $1,726,239 | $4,248,930 |
* Includes the value of securities delivered through in-kind transactions, if applicable.
Investment Valuation
The following is a summary of the inputs used, as of December 31, 2017, involving the Fund's assets and liabilities carried at fair value. The inputs or methodology used for valuing securities may not be an indication of the risk associated with investing in those securities. For more information on valuation inputs, and their aggregation into the levels used below, please refer to the Investment Valuation section in the accompanying Notes to Financial Statements.
| | Valuation Inputs at Reporting Date: |
| Description | Total | Level 1 | Level 2 | Level 3 |
| (Amounts in thousands) | | | | |
| Investments in Securities: | | | | |
| Equities: | | | | |
| Consumer Discretionary | $17,294,483 | $16,990,778 | $201,312 | $102,393 |
| Consumer Staples | 3,104,550 | 2,974,532 | 75,352 | 54,666 |
| Energy | 2,713,774 | 2,713,774 | -- | -- |
| Financials | 23,115,517 | 23,115,517 | -- | -- |
| Health Care | 11,194,287 | 10,958,701 | -- | 235,586 |
| Industrials | 8,504,304 | 8,327,011 | -- | 177,293 |
| Information Technology | 50,960,560 | 49,755,050 | 504,046 | 701,464 |
| Materials | 3,214,654 | 3,214,654 | -- | -- |
| Real Estate | 491,790 | 164,073 | -- | 327,717 |
| Telecommunication Services | 407,536 | 352,326 | 51,896 | 3,314 |
| Corporate Bonds | 151,827 | -- | 151,054 | 773 |
| Money Market Funds | 2,018,440 | 2,018,440 | -- | -- |
| Total Investments in Securities: | $123,171,722 | $120,584,856 | $983,660 | $1,603,206 |
The following is a reconciliation of Investments in Securities for which Level 3 inputs were used in determining value:
| (Amounts in thousands) | |
| Investments in Securities: | |
| Beginning Balance | $1,782,615 |
| Net Realized Gain (Loss) on Investment Securities | 25,264 |
| Net Unrealized Gain (Loss) on Investment Securities | (240,419) |
| Cost of Purchases | 283,771 |
| Proceeds of Sales | (219,215) |
| Amortization/Accretion | -- |
| Transfers into Level 3 | -- |
| Transfers out of Level 3 | (28,810) |
| Ending Balance | $1,603,206 |
| The change in unrealized gain (loss) for the period attributable to Level 3 securities held at December 31, 2017 | $(242,813) |
The information used in the above reconciliations represents fiscal year to date activity for any Investments in Securities identified as using Level 3 inputs at either the beginning or the end of the current fiscal period. Transfers in or out of Level 3 represent the beginning value of any Security or Instrument where a change in the pricing level occurred from the beginning to the end of the period. The cost of purchases and the proceeds of sales may include securities received or delivered through corporate actions or exchanges. Realized and unrealized gains (losses) disclosed in the reconciliations are included in Net Gain (Loss) on the Fund's Statement of Operations.
See accompanying notes which are an integral part of the financial statements.
Financial Statements
Statement of Assets and Liabilities
| Amounts in thousands (except per-share amounts) | | December 31, 2017 |
| Assets | | |
Investment in securities, at value (including securities loaned of $215,126) — See accompanying schedule:
Unaffiliated issuers (cost $57,544,676) | $116,904,352 | |
| Fidelity Central Funds (cost $2,018,405) | 2,018,440 | |
| Other affiliated issuers (cost $1,678,971) | 4,248,930 | |
| Total Investment in Securities (cost $61,242,052) | | $123,171,722 |
| Receivable for investments sold | | 1,003,585 |
| Receivable for fund shares sold | | 92,976 |
| Dividends receivable | | 36,680 |
| Interest receivable | | 1,248 |
| Distributions receivable from Fidelity Central Funds | | 2,626 |
| Prepaid expenses | | 198 |
| Other receivables | | 5,184 |
| Total assets | | 124,314,219 |
| Liabilities | | |
| Payable for investments purchased | $216,149 | |
| Payable for fund shares redeemed | 1,204,690 | |
| Accrued management fee | 69,259 | |
| Other affiliated payables | 11,773 | |
| Other payables and accrued expenses | 17,533 | |
| Collateral on securities loaned | 221,789 | |
| Total liabilities | | 1,741,193 |
| Net Assets | | $122,573,026 |
| Net Assets consist of: | | |
| Paid in capital | | $59,140,983 |
| Distributions in excess of net investment income | | (4,720) |
| Accumulated undistributed net realized gain (loss) on investments and foreign currency transactions | | 1,519,073 |
| Net unrealized appreciation (depreciation) on investments and assets and liabilities in foreign currencies | | 61,917,690 |
| Net Assets | | $122,573,026 |
| Contrafund: | | |
| Net Asset Value, offering price and redemption price per share ($89,874,001 ÷ 734,146 shares) | | $122.42 |
| Class K: | | |
| Net Asset Value, offering price and redemption price per share ($32,699,025 ÷ 267,265 shares) | | $122.35 |
See accompanying notes which are an integral part of the financial statements.
Statement of Operations
| Amounts in thousands | | Year ended December 31, 2017 |
| Investment Income | | |
| Dividends (including $29,481 earned from other affiliated issuers) | | $915,431 |
| Interest | | 1,658 |
| Income from Fidelity Central Funds | | 25,300 |
| Total income | | 942,389 |
| Expenses | | |
| Management fee | | |
| Basic fee | $622,082 | |
| Performance adjustment | 61,407 | |
| Transfer agent fees | 129,499 | |
| Accounting and security lending fees | 3,723 | |
| Custodian fees and expenses | 1,916 | |
| Independent trustees' fees and expenses | 448 | |
| Appreciation in deferred trustee compensation account | 5 | |
| Registration fees | 582 | |
| Audit | 241 | |
| Legal | 280 | |
| Interest | 17 | |
| Miscellaneous | 987 | |
| Total expenses before reductions | 821,187 | |
| Expense reductions | (2,631) | 818,556 |
| Net investment income (loss) | | 123,833 |
| Realized and Unrealized Gain (Loss) | | |
| Net realized gain (loss) on: | | |
| Investment securities: | | |
| Unaffiliated issuers | 11,047,559 | |
| Redemptions in-kind with affiliated entities | 960,358 | |
| Fidelity Central Funds | 52 | |
| Other affiliated issuers | 349,128 | |
| Foreign currency transactions | (834) | |
| Total net realized gain (loss) | | 12,356,263 |
| Change in net unrealized appreciation (depreciation) on: | | |
| Unaffiliated issuers (net of increase in deferred foreign taxes of $12,132) | 17,222,225 | |
| Fidelity Central Funds | 3 | |
| Other affiliated issuers | 1,726,239 | |
| Assets and liabilities in foreign currencies | 205 | |
| Total change in net unrealized appreciation (depreciation) | | 18,948,672 |
| Net gain (loss) | | 31,304,935 |
| Net increase (decrease) in net assets resulting from operations | | $31,428,768 |
See accompanying notes which are an integral part of the financial statements.
Statement of Changes in Net Assets
| Amounts in thousands | Year ended December 31, 2017 | Year ended December 31, 2016 |
| Increase (Decrease) in Net Assets | | |
| Operations | | |
| Net investment income (loss) | $123,833 | $338,180 |
| Net realized gain (loss) | 12,356,263 | 5,749,130 |
| Change in net unrealized appreciation (depreciation) | 18,948,672 | (2,528,496) |
| Net increase (decrease) in net assets resulting from operations | 31,428,768 | 3,558,814 |
| Distributions to shareholders from net investment income | (144,165) | (330,490) |
| Distributions to shareholders from net realized gain | (7,201,343) | (3,609,095) |
| Total distributions | (7,345,508) | (3,939,585) |
| Share transactions - net increase (decrease) | (3,575,375) | (6,837,671) |
| Total increase (decrease) in net assets | 20,507,885 | (7,218,442) |
| Net Assets | | |
| Beginning of period | 102,065,141 | 109,283,583 |
| End of period | $122,573,026 | $102,065,141 |
| Other Information | | |
| Undistributed net investment income end of period | $– | $11,928 |
| Distributions in excess of net investment income end of period | $(4,720) | $– |
See accompanying notes which are an integral part of the financial statements.
Financial Highlights
Fidelity Contrafund
| Years ended December 31, | 2017 | 2016 | 2015 | 2014 | 2013 |
| Selected Per–Share Data | | | | | |
| Net asset value, beginning of period | $98.45 | $98.92 | $97.97 | $96.14 | $77.57 |
| Income from Investment Operations | | | | | |
| Net investment income (loss)A | .10 | .29 | .33 | .30 | .33 |
| Net realized and unrealized gain (loss) | 31.42 | 2.99 | 5.89 | 8.67 | 25.70 |
| Total from investment operations | 31.52 | 3.28 | 6.22 | 8.97 | 26.03 |
| Distributions from net investment income | (.12) | (.29) | (.31) | (.25) | (.13) |
| Distributions from net realized gain | (7.43) | (3.46) | (4.96) | (6.89) | (7.33) |
| Total distributions | (7.55) | (3.75) | (5.27) | (7.14) | (7.46) |
| Net asset value, end of period | $122.42 | $98.45 | $98.92 | $97.97 | $96.14 |
| Total ReturnB | 32.21% | 3.36% | 6.46% | 9.56% | 34.15% |
| Ratios to Average Net AssetsC,D | | | | | |
| Expenses before reductions | .74% | .68% | .71% | .64% | .67% |
| Expenses net of fee waivers, if any | .74% | .68% | .71% | .64% | .67% |
| Expenses net of all reductions | .74% | .68% | .70% | .64% | .66% |
| Net investment income (loss) | .08% | .29% | .33% | .31% | .37% |
| Supplemental Data | | | | | |
| Net assets, end of period (in millions) | $89,874 | $73,035 | $77,724 | $75,057 | $74,962 |
| Portfolio turnover rateE | 29%F | 41%F | 35%F | 45%F | 46% |
A Calculated based on average shares outstanding during the period.
B Total returns would have been lower if certain expenses had not been reduced during the applicable periods shown.
C Fees and expenses of any underlying Fidelity Central Funds are not included in the Fund's expense ratio. The Fund indirectly bears its proportionate share of the expenses of any underlying Fidelity Central Funds.
D Expense ratios reflect operating expenses of the class. Expenses before reductions do not reflect amounts reimbursed by the investment adviser or reductions from brokerage service arrangements or reductions from other expense offset arrangements and do not represent the amount paid by the class during periods when reimbursements or reductions occur. Expenses net of fee waivers reflect expenses after reimbursement by the investment adviser but prior to reductions from brokerage service arrangements or other expense offset arrangements. Expenses net of all reductions represent the net expenses paid by the class.
E Amount does not include the portfolio activity of any underlying Fidelity Central Funds.
F Portfolio turnover rate excludes securities received or delivered in-kind.
See accompanying notes which are an integral part of the financial statements.
Fidelity Contrafund Class K
| Years ended December 31, | 2017 | 2016 | 2015 | 2014 | 2013 |
| Selected Per–Share Data | | | | | |
| Net asset value, beginning of period | $98.38 | $98.84 | $97.90 | $96.07 | $77.51 |
| Income from Investment Operations | | | | | |
| Net investment income (loss)A | .20 | .38 | .43 | .40 | .42 |
| Net realized and unrealized gain (loss) | 31.43 | 3.01 | 5.88 | 8.68 | 25.70 |
| Total from investment operations | 31.63 | 3.39 | 6.31 | 9.08 | 26.12 |
| Distributions from net investment income | (.23) | (.39) | (.41) | (.36) | (.23) |
| Distributions from net realized gain | (7.43) | (3.46) | (4.96) | (6.89) | (7.33) |
| Total distributions | (7.66) | (3.85) | (5.37) | (7.25) | (7.56) |
| Net asset value, end of period | $122.35 | $98.38 | $98.84 | $97.90 | $96.07 |
| Total ReturnB | 32.34% | 3.48% | 6.55% | 9.68% | 34.30% |
| Ratios to Average Net AssetsC,D | | | | | |
| Expenses before reductions | .65% | .58% | .61% | .54% | .56% |
| Expenses net of fee waivers, if any | .65% | .58% | .61% | .54% | .56% |
| Expenses net of all reductions | .65% | .58% | .61% | .54% | .56% |
| Net investment income (loss) | .17% | .39% | .43% | .41% | .48% |
| Supplemental Data | | | | | |
| Net assets, end of period (in millions) | $32,699 | $29,031 | $31,560 | $34,479 | $35,982 |
| Portfolio turnover rateE | 29%F | 41%F | 35%F | 45%F | 46% |
A Calculated based on average shares outstanding during the period.
B Total returns would have been lower if certain expenses had not been reduced during the applicable periods shown.
C Fees and expenses of any underlying Fidelity Central Funds are not included in the Fund's expense ratio. The Fund indirectly bears its proportionate share of the expenses of any underlying Fidelity Central Funds.
D Expense ratios reflect operating expenses of the class. Expenses before reductions do not reflect amounts reimbursed by the investment adviser or reductions from brokerage service arrangements or reductions from other expense offset arrangements and do not represent the amount paid by the class during periods when reimbursements or reductions occur. Expenses net of fee waivers reflect expenses after reimbursement by the investment adviser but prior to reductions from brokerage service arrangements or other expense offset arrangements. Expenses net of all reductions represent the net expenses paid by the class.
E Amount does not include the portfolio activity of any underlying Fidelity Central Funds.
F Portfolio turnover rate excludes securities received or delivered in-kind.
See accompanying notes which are an integral part of the financial statements.
Notes to Financial Statements
For the period ended December 31, 2017
(Amounts in thousands except percentages)
1. Organization.
Fidelity Contrafund (the Fund) is a fund of Fidelity Contrafund (the Trust) and is authorized to issue an unlimited number of shares. The Trust is registered under the Investment Company Act of 1940, as amended (the 1940 Act), as an open-end management investment company organized as a Massachusetts business trust. The Fund offers Contrafund and Class K, shares, each of which has equal rights as to assets and voting privileges. Each class has exclusive voting rights with respect to matters that affect that class.
2. Investments in Fidelity Central Funds.
The Fund invests in Fidelity Central Funds, which are open-end investment companies generally available only to other investment companies and accounts managed by the investment adviser and its affiliates. The Fund's Schedule of Investments lists each of the Fidelity Central Funds held as of period end, if any, as an investment of the Fund, but does not include the underlying holdings of each Fidelity Central Fund. As an Investing Fund, the Fund indirectly bears its proportionate share of the expenses of the underlying Fidelity Central Funds.
The Money Market Central Funds seek preservation of capital and current income and are managed by Fidelity Investments Money Management, Inc. (FIMM), an affiliate of the investment adviser. Annualized expenses of the Money Market Central Funds as of their most recent shareholder report date are less than .005%.
A complete unaudited list of holdings for each Fidelity Central Fund is available upon request or at the Securities and Exchange Commission (the SEC) website at www.sec.gov. In addition, the financial statements of the Fidelity Central Funds, which are not covered by the Fund's Report of Independent Registered Public Accounting Firm, are available on the SEC website or upon request.
3. Significant Accounting Policies.
The Fund is an investment company and applies the accounting and reporting guidance of the Financial Accounting Standards Board (FASB) Accounting Standards Codification Topic 946 Financial Services – Investments Companies. The financial statements have been prepared in conformity with accounting principles generally accepted in the United States of America (GAAP), which require management to make certain estimates and assumptions at the date of the financial statements. Actual results could differ from those estimates. Subsequent events, if any, through the date that the financial statements were issued have been evaluated in the preparation of the financial statements. The following summarizes the significant accounting policies of the Fund:
Investment Valuation. Investments are valued as of 4:00 p.m. Eastern time on the last calendar day of the period. The Board of Trustees (the Board) has delegated the day to day responsibility for the valuation of the Fund's investments to the Fair Value Committee (the Committee) established by the Fund's investment adviser. In accordance with valuation policies and procedures approved by the Board, the Fund attempts to obtain prices from one or more third party pricing vendors or brokers to value its investments. When current market prices, quotations or currency exchange rates are not readily available or reliable, investments will be fair valued in good faith by the Committee, in accordance with procedures adopted by the Board. Factors used in determining fair value vary by investment type and may include market or investment specific events, changes in interest rates and credit quality. The frequency with which these procedures are used cannot be predicted and they may be utilized to a significant extent. The Committee oversees the Fund's valuation policies and procedures and reports to the Board on the Committee's activities and fair value determinations. The Board monitors the appropriateness of the procedures used in valuing the Fund's investments and ratifies the fair value determinations of the Committee.
The Fund categorizes the inputs to valuation techniques used to value its investments into a disclosure hierarchy consisting of three levels as shown below:
- Level 1 – quoted prices in active markets for identical investments
- Level 2 – other significant observable inputs (including quoted prices for similar investments, interest rates, prepayment speeds, etc.)
- Level 3 – unobservable inputs (including the Fund's own assumptions based on the best information available)
Valuation techniques used to value the Fund's investments by major category are as follows:
Equity securities, including restricted securities, for which market quotations are readily available, are valued at the last reported sale price or official closing price as reported by a third party pricing vendor on the primary market or exchange on which they are traded and are categorized as Level 1 in the hierarchy. In the event there were no sales during the day or closing prices are not available, securities are valued at the last quoted bid price or may be valued using the last available price and are generally categorized as Level 2 in the hierarchy. For foreign equity securities, when market or security specific events arise, comparisons to the valuation of American Depositary Receipts (ADRs), futures contracts, Exchange-Traded Funds (ETFs) and certain indexes as well as quoted prices for similar securities may be used and would be categorized as Level 2 in the hierarchy. Utilizing these techniques may result in transfers between Level 1 and Level 2. For equity securities, including restricted securities, where observable inputs are limited, assumptions about market activity and risk are used and these securities may be categorized as Level 3 in the hierarchy. Equity securities, including restricted securities, for which observable inputs are not available are valued using alternate valuation approaches, including the market approach and the income approach and are categorized as Level 3 in the hierarchy. The market approach generally consists of using comparable market transactions while the income approach generally consists of using the net present value of estimated future cash flows, adjusted as appropriate for liquidity, credit, market and/or other risk factors.
Debt securities, including restricted securities, are valued based on evaluated prices received from third party pricing vendors or from brokers who make markets in such securities. Corporate bonds are valued by pricing vendors who utilize matrix pricing which considers yield or price of bonds of comparable quality, coupon, maturity and type or by broker-supplied prices. When independent prices are unavailable or unreliable, debt securities may be valued utilizing pricing methodologies which consider similar factors that would be used by third party pricing vendors. Debt securities are generally categorized as Level 2 in the hierarchy but may be Level 3 depending on the circumstances.
Investments in open-end mutual funds, including the Fidelity Central Funds, are valued at their closing net asset value (NAV) each business day and are categorized as Level 1 in the hierarchy.
The following provides information on Level 3 securities held by the Fund that were valued at period end based on unobservable inputs. These amounts exclude valuations provided by a broker.
| Asset Type | Fair Value | Valuation Technique (s) | Unobservable Input | Amount or Range / Weighted Average | Impact to Valuation from an Increase in Input(a) |
| Corporate Bonds | $773 | Recovery value | Recovery value | 39.5% | Increase |
| Equities | 1,602,433 | Market comparable | Enterprise value/Sales multiple (EV/S) | 0.8 - 13.1 / 6.4 | Increase |
| | | | Transaction price | $60.00 | Increase |
| | | | Discount rate | 28.0% | Decrease |
| | | | Discount for lack of marketability | 15.0% - 25.0% / 17.8% | Decrease |
| | | | Liquidity preference | $4.84 - $19.10 / $11.24 | Increase |
| | | | Premium rate | 7.5% - 108.0% / 65.2% | Increase |
| | | Market approach | Transaction price | $1.56 - $353.57 / $83.83 | Increase |
| | | Recovery value | Recovery value | 0.0% - 0.2% / 0.2% | Increase |
| | | Discount cash flow | Discount rate | 9.0% | Decrease |
| | | | Discount for lack of marketability | 20.0% | Decrease |
| | | | Growth rate | 3.0% | Increase |
(a) Represents the expected directional change in the fair value of the Level 3 investments that would result from an increase in the corresponding input. A decrease to the unobservable input would have the opposite effect. Significant changes in these inputs could result in significantly higher or lower fair value measurements.
Changes in valuation techniques may result in transfers in or out of an assigned level within the disclosure hierarchy. The aggregate value of investments by input level as of December 31, 2017, as well as a roll forward of Level 3 investments, is included at the end of the Fund's Schedule of Investments.
Foreign Currency. The Fund may use foreign currency contracts to facilitate transactions in foreign-denominated securities. Gains and losses from these transactions may arise from changes in the value of the foreign currency or if the counterparties do not perform under the contracts' terms.
Foreign-denominated assets, including investment securities, and liabilities are translated into U.S. dollars at the exchange rates at period end. Purchases and sales of investment securities, income and dividends received and expenses denominated in foreign currencies are translated into U.S. dollars at the exchange rate in effect on the transaction date.
The effects of exchange rate fluctuations on investments are included with the net realized and unrealized gain (loss) on investment securities. Other foreign currency transactions resulting in realized and unrealized gain (loss) are disclosed separately.
Investment Transactions and Income. For financial reporting purposes, the Fund's investment holdings and NAV include trades executed through the end of the last business day of the period. The NAV per share for processing shareholder transactions is calculated as of the close of business of the New York Stock Exchange (NYSE), normally 4:00 p.m. Eastern time and includes trades executed through the end of the prior business day. Gains and losses on securities sold are determined on the basis of identified cost and includes proceeds received from litigation. Dividend income is recorded on the ex-dividend date, except for certain dividends from foreign securities where the ex-dividend date may have passed, which are recorded as soon as the Fund is informed of the ex-dividend date. Non-cash dividends included in dividend income, if any, are recorded at the fair market value of the securities received. Income and capital gain distributions from Fidelity Central Funds, if any, are recorded on the ex-dividend date. Certain distributions received by the Fund represent a return of capital or capital gain. The Fund determines the components of these distributions subsequent to the ex-dividend date, based upon receipt of tax filings or other correspondence relating to the underlying investment. These distributions are recorded as a reduction of cost of investments and/or as a realized gain. Interest income is accrued as earned and includes coupon interest and amortization of premium and accretion of discount on debt securities as applicable. Paid in Kind (PIK) income is recorded at the fair market value of the securities received. Investment income is recorded net of foreign taxes withheld where recovery of such taxes is uncertain.
Class Allocations and Expenses. Investment income, realized and unrealized capital gains and losses, common expenses of the Fund, and certain fund-level expense reductions, if any, are allocated daily on a pro-rata basis to each class based on the relative net assets of each class to the total net assets of the Fund. Each class differs with respect to transfer agent fees incurred. Certain expense reductions may also differ by class. For the reporting period, the allocated portion of income and expenses to each class as a percent of its average net assets may vary due to the timing of recording these transactions in relation to fluctuating net assets of the classes. Expenses directly attributable to a fund are charged to that fund. Expenses attributable to more than one fund are allocated among the respective funds on the basis of relative net assets or other appropriate methods. Expense estimates are accrued in the period to which they relate and adjustments are made when actual amounts are known.
Deferred Trustee Compensation. Under a Deferred Compensation Plan (the Plan), independent Trustees may elect to defer receipt of a portion of their annual compensation. Deferred amounts are invested in a cross-section of Fidelity funds, are marked-to-market and remain in the Fund until distributed in accordance with the Plan. The investment of deferred amounts and the offsetting payable to the Trustees are included in the accompanying Statement of Assets and Liabilities.
Income Tax Information and Distributions to Shareholders. Each year, the Fund intends to qualify as a regulated investment company under Subchapter M of the Internal Revenue Code, including distributing substantially all of its taxable income and realized gains. As a result, no provision for U.S. Federal income taxes is required. As of December 31, 2017, the Fund did not have any unrecognized tax benefits in the financial statements; nor is the Fund aware of any tax positions for which it is reasonably possible that the total amounts of unrecognized tax benefits will significantly change in the next twelve months. The Fund files a U.S. federal tax return, in addition to state and local tax returns as required. The Fund's federal income tax returns are subject to examination by the Internal Revenue Service (IRS) for a period of three fiscal years after they are filed. State and local tax returns may be subject to examination for an additional fiscal year depending on the jurisdiction. Foreign taxes are provided for based on the Fund's understanding of the tax rules and rates that exist in the foreign markets in which it invests. The Fund is subject to a tax imposed on capital gains by certain countries in which it invests. An estimated deferred tax liability for net unrealized appreciation on the applicable securities is included in Other payables and accrued expenses on the Statement of Assets & Liabilities.
Distributions are declared and recorded on the ex-dividend date. Income dividends and capital gain distributions are declared separately for each class. Income and capital gain distributions are determined in accordance with income tax regulations, which may differ from GAAP. In addition, the Fund claimed a portion of the payment made to redeeming shareholders as a distribution for income tax purposes.
Capital accounts within the financial statements are adjusted for permanent book-tax differences. These adjustments have no impact on net assets or the results of operations. Capital accounts are not adjusted for temporary book-tax differences which will reverse in a subsequent period.
Book-tax differences are primarily due to foreign currency transactions, passive foreign investment companies (PFIC), market discount, redemptions in kind, partnerships, deferred trustees compensation and losses deferred due to wash sales.
As of period end, the cost and unrealized appreciation (depreciation) in securities, and derivatives if applicable, for federal income tax purposes were as follows:
| Gross unrealized appreciation | $62,179,558 |
| Gross unrealized depreciation | (577,254) |
| Net unrealized appreciation (depreciation) | $61,602,304 |
| Tax Cost | $61,569,418 |
The tax-based components of distributable earnings as of period end were as follows:
| Undistributed long-term capital gain | $1,846,495 |
| Net unrealized appreciation (depreciation) on securities and other investments | $61,602,486 |
The tax character of distributions paid was as follows:
| | December 31, 2017 | December 31, 2016 |
| Ordinary Income | $144,165 | $ 330,490 |
| Long-term Capital Gains | 7,201,343 | 3,609,095 |
| Total | $7,345,508 | $ 3,939,585 |
Restricted Securities. The Fund may invest in securities that are subject to legal or contractual restrictions on resale. These securities generally may be resold in transactions exempt from registration or to the public if the securities are registered. Disposal of these securities may involve time-consuming negotiations and expense, and prompt sale at an acceptable price may be difficult. Information regarding restricted securities is included at the end of the Fund's Schedule of Investments.
Consolidated Subsidiary. The Fund invests in certain investments through a wholly-owned subsidiary ("Subsidiary"), which may be subject to federal and state taxes upon disposition.
As of period end, the Fund held an investment of $44,039 in these Subsidiaries, representing .04% of the Fund's net assets. The financial statements have been consolidated and include accounts of the Fund and each Subsidiary. Accordingly, all inter-company transactions and balances have been eliminated.
4. Purchases and Sales of Investments.
Purchases and sales of securities, other than short-term securities and in-kind transactions, aggregated $33,205,350 and $39,923,192, respectively.
Redemptions In-Kind. During the period, 34,843 shares of the Fund held by unaffiliated entities were redeemed in-kind for investments and cash with a value of $3,859,301. The net realized gain of $2,473,373 on investments delivered through in-kind redemptions is included in the accompanying Statement of Operations. The amount of the in-kind redemptions is included in share transactions in the accompanying Statement of Changes in Net Assets as well as the Notes to Financial Statements. The Fund recognized no gain or loss for federal income tax purposes.
Prior Fiscal Year Redemptions In-Kind. During the prior period, 32,360 shares of the Fund held by unaffiliated entities were redeemed in-kind for investments and cash, including accrued interest, with a value of $3,198,227. The Fund had a net realized gain of $1,930,771 on investments delivered through the in-kind redemptions. The amount of the in-kind redemptions is included in share transactions in the accompanying Statement of Changes in Net Assets as well as the Notes to Financial Statements. The Fund recognized no gain or loss for federal income tax purposes.
5. Fees and Other Transactions with Affiliates.
Management Fee. Fidelity Management & Research Company (the investment adviser) and its affiliates provide the Fund with investment management related services for which the Fund pays a monthly management fee. The management fee is the sum of an individual fund fee rate that is based on an annual rate of .30% of the Fund's average net assets and an annualized group fee rate that averaged .24% during the period. The group fee rate is based upon the average net assets of all the mutual funds advised by the investment adviser, including any mutual funds previously advised by the investment adviser that are currently advised by Fidelity SelectCo, LLC, an affiliate of the investment adviser. The group fee rate decreases as assets under management increase and increases as assets under management decrease. In addition, the management fee is subject to a performance adjustment (up to a maximum of +/- .20% of the Fund's average net assets over a 36 month performance period). The upward or downward adjustment to the management fee is based on the relative investment performance of Contrafund as compared to its benchmark index, the S&P 500 Index, over the same 36 month performance period. For the reporting period, the total annual management fee rate, including the performance adjustment, was .60% of the Fund's average net assets. The performance adjustment included in the management fee rate may be higher or lower than the maximum performance adjustment rate due to the difference between the average net assets for the reporting and performance periods.
Transfer Agent Fees. Fidelity Investments Institutional Operations Company, Inc., (FIIOC), an affiliate of the investment adviser, is the transfer, dividend disbursing and shareholder servicing agent for each class of the Fund. FIIOC receives account fees and asset-based fees that vary according to the account size and type of account of the shareholders of Contrafund, except for Class K. FIIOC receives an asset-based fee of Class K's average net assets. FIIOC pays for typesetting, printing and mailing of shareholder reports, except proxy statements.
For the period, transfer agent fees for each class were as follows:
| | Amount | % of
Class-Level Average
Net Assets |
| Contrafund | $114,650 | .14 |
| Class K | 14,849 | .05 |
| | $129,499 | |
Accounting and Security Lending Fees. Fidelity Service Company, Inc. (FSC), an affiliate of the investment adviser, maintains the Fund's accounting records. The accounting fee is based on the level of average net assets for each month. Under a separate contract, FSC administers the security lending program. The security lending fee is based on the number and duration of lending transactions.
Brokerage Commissions. The Fund placed a portion of its portfolio transactions with brokerage firms which are affiliates of the investment adviser. Brokerage commissions are included in net realized gain (loss) and change in net unrealized appreciation (depreciation) in the Statement of Operations. The commissions paid to these affiliated firms were $904 for the period.
Interfund Lending Program. Pursuant to an Exemptive Order issued by the SEC, the Fund, along with other registered investment companies having management contracts with Fidelity Management & Research Company (FMR) or other affiliated entities of FMR, may participate in an interfund lending program. This program provides an alternative credit facility allowing the funds to borrow from, or lend money to, other participating affiliated funds. At period end, there were no interfund loans outstanding. The Fund's activity in this program during the period for which loans were outstanding was as follows:
| Borrower or Lender | Average Loan Balance | Weighted Average Interest Rate | Interest Expense |
| Borrower | $66,006 | .83% | $15 |
Interfund Trades. The Fund may purchase from or sell securities to other Fidelity Funds under procedures adopted by the Board. The procedures have been designed to ensure these interfund trades are executed in accordance with Rule 17a-7 of the 1940 Act. Interfund trades are included within the respective purchases and sales amounts shown in the Purchases and Sales of Investments note.
Redemptions In-Kind. During the period, 12,089 shares of the Fund held by an affiliated entity were redeemed in-kind for investments and cash with a value of $1,457,574. The net realized gain of $960,358 on investments delivered through in-kind redemptions is included in the accompanying Statement of Operations. The amount of the in-kind redemptions is included in share transactions in the accompanying Statement of Changes in Net Assets as well as the Notes to Financial Statements. The Fund recognized no gain or loss for federal income tax purposes.
6. Committed Line of Credit.
The Fund participates with other funds managed by the investment adviser or an affiliate in a $4.25 billion credit facility (the "line of credit") to be utilized for temporary or emergency purposes to fund shareholder redemptions or for other short-term liquidity purposes. The Fund has agreed to pay commitment fees on its pro-rata portion of the line of credit, which amounted to $351 and is reflected in Miscellaneous expenses on the Statement of Operations. During the period, the Fund did not borrow on this line of credit.
7. Security Lending.
The Fund lends portfolio securities through a lending agent from time to time in order to earn additional income. For equity securities, a lending agent is used and may loan securities to certain qualified borrowers, including Fidelity Capital Markets (FCM), a broker-dealer affiliated with the Fund. On the settlement date of the loan, the Fund receives collateral (in the form of U.S. Treasury obligations, letters of credit and/or cash) against the loaned securities and maintains collateral in an amount not less than 100% of the market value of the loaned securities during the period of the loan. The market value of the loaned securities is determined at the close of business of the Fund and any additional required collateral is delivered to the Fund on the next business day. The Fund or borrower may terminate the loan at any time, and if the borrower defaults on its obligation to return the securities loaned because of insolvency or other reasons, the Fund may apply collateral received from the borrower against the obligation. The Fund may experience delays and costs in recovering the securities loaned. Any cash collateral received is invested in the Fidelity Securities Lending Cash Central Fund. The value of loaned securities and cash collateral at period end are disclosed on the Fund's Statement of Assets and Liabilities. The value of securities loaned to FCM at period end was $10,928. Security lending income represents the income earned on investing cash collateral, less rebates paid to borrowers and any lending agent fees associated with the loan, plus any premium payments received for lending certain types of securities. Security lending income is presented in the Statement of Operations as a component of income from Fidelity Central Funds. Total security lending income during the period amounted to $13,046, including $211 from securities loaned to FCM.
8. Bank Borrowings.
The Fund is permitted to have bank borrowings for temporary or emergency purposes to fund shareholder redemptions or for other short-term liquidity requirements. The Fund has established borrowing arrangements with certain banks. The interest rate on the borrowings is the bank's base rate, as revised from time to time. The average loan balance during the period for which loans were outstanding amounted to $40,835. The weighted average interest rate was 1.16%. The interest expense amounted to $2 under the bank borrowing program. At period end, there were no bank borrowings outstanding.
9. Expense Reductions.
Commissions paid to certain brokers with whom the investment adviser, or its affiliates, places trades on behalf of the Fund include an amount in addition to trade execution, which may be rebated back to the Fund to offset certain expenses. This amount totaled $1,682 for the period. In addition, through arrangements with the Fund's custodian, credits realized as a result of certain uninvested cash balances were used to reduce the Fund's expenses. During the period, these credits reduced the Fund's custody expenses by $8.
In addition, during the period the investment adviser reimbursed and/or waived a portion of fund-level operating expenses in the amount of $941.
10. Distributions to Shareholders.
Distributions to shareholders of each class were as follows:
| | Year ended December 31, 2017 | Year ended December 31, 2016 |
| From net investment income | | |
| Contrafund | $84,830 | $214,155 |
| Class K | 59,335 | 116,335 |
| Total | $144,165 | $330,490 |
| From net realized gain | | |
| Contrafund | $5,246,866 | $2,569,613 |
| Class K | 1,954,477 | 1,039,482 |
| Total | $7,201,343 | $3,609,095 |
11. Share Transactions.
Share transactions for each class were as follows and may contain automatic conversions between classes or exchanges between affiliated funds:
| | Shares | Shares | Dollars | Dollars |
| | Year ended December 31, 2017 | Year ended December 31, 2016 | Year ended December 31, 2017 | Year ended December 31, 2016 |
| Contrafund | | | | |
| Shares sold | 71,526 | 78,941 | $8,237,249 | $7,647,980 |
| Reinvestment of distributions | 42,081 | 27,050 | 5,053,714 | 2,642,747 |
| Shares redeemed | (121,285)(a) | (149,912)(b) | (13,776,639)(a) | (14,712,987)(b) |
| Net increase (decrease) | (7,678) | (43,921) | $(485,676) | $(4,422,260) |
| Class K | | | | |
| Shares sold | 43,515 | 52,783 | $4,990,930 | $5,115,103 |
| Reinvestment of distributions | 16,789 | 11,835 | 2,013,806�� | 1,155,817 |
| Shares redeemed | (88,136)(a) | (88,812)(b) | (10,094,435)(a) | (8,686,331)(b) |
| Net increase (decrease) | (27,832) | (24,194) | $(3,089,699) | $(2,415,411) |
(a) Amount includes in-kind redemptions (see the Redemptions In-Kind note for additional details).
(b) Amount includes in-kind redemptions (see the Prior Fiscal Year Redemptions In-Kind note for additional details).
12. Other.
The Fund's organizational documents provide former and current trustees and officers with a limited indemnification against liabilities arising in connection with the performance of their duties to the Fund. In the normal course of business, the Fund may also enter into contracts that provide general indemnifications. The Fund's maximum exposure under these arrangements is unknown as this would be dependent on future claims that may be made against the Fund. The risk of material loss from such claims is considered remote.
Report of Independent Registered Public Accounting Firm
To the Trustees of Fidelity Contrafund and Shareholders of Fidelity Contrafund:
Opinion on the Financial Statements
We have audited the accompanying statement of assets and liabilities, including the schedule of investments, of Fidelity Contrafund (one of the funds constituting Fidelity Contrafund, referred to hereafter as the “Fund”) as of December 31, 2017, the related statement of operations for the year ended December 31, 2017, the statement of changes in net assets for each of the two years in the period ended December 31, 2017, including the related notes, and the financial highlights for each of the five years in the period ended December 31, 2017 (collectively referred to as the “financial statements”). In our opinion, the financial statements present fairly, in all material respects, the financial position of the Fund as of December 31, 2017, the results of its operations for the year then ended, the changes in its net assets for each of the two years in the period ended December 31, 2017 and the financial highlights for each of the five years in the period ended December 31, 2017 in conformity with accounting principles generally accepted in the United States of America.
Basis for Opinion
These financial statements are the responsibility of the Fund’s management. Our responsibility is to express an opinion on the Fund’s financial statements based on our audits. We are a public accounting firm registered with the Public Company Accounting Oversight Board (United States) (“PCAOB”) and are required to be independent with respect to the Fund in accordance with the U.S. federal securities laws and the applicable rules and regulations of the Securities and Exchange Commission and the PCAOB.
We conducted our audits of these financial statements in accordance with the standards of the PCAOB. Those standards require that we plan and perform the audit to obtain reasonable assurance about whether the financial statements are free of material misstatement, whether due to error or fraud.
Our audits included performing procedures to assess the risks of material misstatement of the financial statements, whether due to error or fraud, and performing procedures that respond to those risks. Such procedures included examining, on a test basis, evidence regarding the amounts and disclosures in the financial statements. Our audits also included evaluating the accounting principles used and significant estimates made by management, as well as evaluating the overall presentation of the financial statements. Our procedures included confirmation of securities owned as of December 31, 2017 by correspondence with the custodian and brokers; when replies were not received from brokers, we performed other auditing procedures. We believe that our audits provide a reasonable basis for our opinion.
PricewaterhouseCoopers LLP
Boston, Massachusetts
February 13, 2018
We have served as the auditor of one or more investment companies in the Fidelity group of funds since 1932.
Trustees and Officers
The Trustees, Members of the Advisory Board (if any), and officers of the trust and fund, as applicable, are listed below. The Board of Trustees governs the fund and is responsible for protecting the interests of shareholders. The Trustees are experienced executives who meet periodically throughout the year to oversee the fund's activities, review contractual arrangements with companies that provide services to the fund, oversee management of the risks associated with such activities and contractual arrangements, and review the fund's performance. Each of the Trustees oversees 190 funds.
The Trustees hold office without limit in time except that (a) any Trustee may resign; (b) any Trustee may be removed by written instrument, signed by at least two-thirds of the number of Trustees prior to such removal; (c) any Trustee who requests to be retired or who has become incapacitated by illness or injury may be retired by written instrument signed by a majority of the other Trustees; and (d) any Trustee may be removed at any special meeting of shareholders by a two-thirds vote of the outstanding voting securities of the trust. Each Trustee who is not an interested person (as defined in the 1940 Act) of the trust and the fund is referred to herein as an Independent Trustee. Each Independent Trustee shall retire not later than the last day of the calendar year in which his or her 75th birthday occurs. The Independent Trustees may waive this mandatory retirement age policy with respect to individual Trustees. Officers and Advisory Board Members hold office without limit in time, except that any officer or Advisory Board Member may resign or may be removed by a vote of a majority of the Trustees at any regular meeting or any special meeting of the Trustees. Except as indicated, each individual has held the office shown or other offices in the same company for the past five years.
The fund’s Statement of Additional Information (SAI) includes more information about the Trustees. To request a free copy, call Fidelity at 1-800-544-8544.
Experience, Skills, Attributes, and Qualifications of the Trustees. The Governance and Nominating Committee has adopted a statement of policy that describes the experience, qualifications, attributes, and skills that are necessary and desirable for potential Independent Trustee candidates (Statement of Policy). The Board believes that each Trustee satisfied at the time he or she was initially elected or appointed a Trustee, and continues to satisfy, the standards contemplated by the Statement of Policy. The Governance and Nominating Committee also engages professional search firms to help identify potential Independent Trustee candidates who have the experience, qualifications, attributes, and skills consistent with the Statement of Policy. From time to time, additional criteria based on the composition and skills of the current Independent Trustees, as well as experience or skills that may be appropriate in light of future changes to board composition, business conditions, and regulatory or other developments, have also been considered by the professional search firms and the Governance and Nominating Committee. In addition, the Board takes into account the Trustees' commitment and participation in Board and committee meetings, as well as their leadership of standing and ad hoc committees throughout their tenure.
In determining that a particular Trustee was and continues to be qualified to serve as a Trustee, the Board has considered a variety of criteria, none of which, in isolation, was controlling. The Board believes that, collectively, the Trustees have balanced and diverse experience, qualifications, attributes, and skills, which allow the Board to operate effectively in governing the fund and protecting the interests of shareholders. Information about the specific experience, skills, attributes, and qualifications of each Trustee, which in each case led to the Board's conclusion that the Trustee should serve (or continue to serve) as a trustee of the fund, is provided below.
Board Structure and Oversight Function. James C. Curvey is an interested person and currently serves as Chairman. The Trustees have determined that an interested Chairman is appropriate and benefits shareholders because an interested Chairman has a personal and professional stake in the quality and continuity of services provided to the fund. Independent Trustees exercise their informed business judgment to appoint an individual of their choosing to serve as Chairman, regardless of whether the Trustee happens to be independent or a member of management. The Independent Trustees have determined that they can act independently and effectively without having an Independent Trustee serve as Chairman and that a key structural component for assuring that they are in a position to do so is for the Independent Trustees to constitute a substantial majority for the Board. The Independent Trustees also regularly meet in executive session. Ned C. Lautenbach serves as Chairman of the Independent Trustees and as such (i) acts as a liaison between the Independent Trustees and management with respect to matters important to the Independent Trustees and (ii) with management prepares agendas for Board meetings.
Fidelity® funds are overseen by different Boards of Trustees. The fund's Board oversees Fidelity's high income and certain equity funds, and other Boards oversee Fidelity's investment-grade bond, money market, asset allocation, and sector funds. The asset allocation funds may invest in Fidelity® funds overseen by the fund's Board. The use of separate Boards, each with its own committee structure, allows the Trustees of each group of Fidelity® funds to focus on the unique issues of the funds they oversee, including common research, investment, and operational issues. On occasion, the separate Boards establish joint committees to address issues of overlapping consequences for the Fidelity® funds overseen by each Board.
The Trustees operate using a system of committees to facilitate the timely and efficient consideration of all matters of importance to the Trustees, the fund, and fund shareholders and to facilitate compliance with legal and regulatory requirements and oversight of the fund's activities and associated risks. The Board, acting through its committees, has charged FMR and its affiliates with (i) identifying events or circumstances the occurrence of which could have demonstrably adverse effects on the fund's business and/or reputation; (ii) implementing processes and controls to lessen the possibility that such events or circumstances occur or to mitigate the effects of such events or circumstances if they do occur; and (iii) creating and maintaining a system designed to evaluate continuously business and market conditions in order to facilitate the identification and implementation processes described in (i) and (ii) above. Because the day-to-day operations and activities of the fund are carried out by or through FMR, its affiliates, and other service providers, the fund's exposure to risks is mitigated but not eliminated by the processes overseen by the Trustees. While each of the Board's committees has responsibility for overseeing different aspects of the fund's activities, oversight is exercised primarily through the Operations, Audit, and Compliance Committees. In addition, the Independent Trustees have worked with FMR to enhance the Board's oversight of investment and financial risks, legal and regulatory risks, technology risks, and operational risks, including the development of additional risk reporting to the Board. For example, a working group comprised of Independent Trustees and FMR has worked and continues to work to review the Fidelity® funds' valuation-related activities, reporting and risk management. Appropriate personnel, including but not limited to the fund's Chief Compliance Officer (CCO), FMR's internal auditor, the independent accountants, the fund's Treasurer and portfolio management personnel, make periodic reports to the Board's committees, as appropriate, including an annual review of Fidelity's risk management program for the Fidelity® funds. The responsibilities of each standing committee, including their oversight responsibilities, are described further under "Standing Committees of the Trustees."
Interested Trustees*:
Correspondence intended for a Trustee who is an interested person may be sent to Fidelity Investments, 245 Summer Street, Boston, Massachusetts 02210.
Name, Year of Birth; Principal Occupations and Other Relevant Experience+
James C. Curvey (1935)
Year of Election or Appointment: 2007
Trustee
Chairman of the Board of Trustees
Mr. Curvey also serves as Trustee of other Fidelity® funds. Mr. Curvey is a Director of Fidelity Research & Analysis Co. (investment adviser firm, 2009-present), and Vice Chairman (2007-present) and Director of FMR LLC (diversified financial services company). In addition, Mr. Curvey serves as an Overseer for the Boston Symphony Orchestra and a member of the board of Artis-Naples, Naples, Florida, and as a Trustee for Brewster Academy, Wolfeboro, New Hampshire. Previously, Mr. Curvey served as a Director of Fidelity Investments Money Management, Inc. (investment adviser firm, 2009-2014) and a Director of FMR and FMR Co., Inc. (investment adviser firms, 2007-2014).
Charles S. Morrison (1960)
Year of Election or Appointment: 2014
Trustee
Mr. Morrison also serves as Trustee of other funds. He serves as President of Fidelity SelectCo, LLC (investment adviser firm, 2017-present) and Fidelity Management & Research Company (FMR) (investment adviser firm, 2016-present), a Director of Fidelity Investments Money Management, Inc. (FIMM) (investment adviser firm, 2014-present), Director of Fidelity SelectCo, LLC (investment adviser firm, 2014-present), President, Asset Management (2014-present), and is an employee of Fidelity Investments. Previously, Mr. Morrison served as Vice President of Fidelity's Fixed Income and Asset Allocation Funds (2012-2014), President, Fixed Income (2011-2014), Vice President of Fidelity's Money Market Funds (2005-2009), President, Money Market Group Leader of FMR (investment adviser firm, 2009), and Senior Vice President, Money Market Group of FMR (2004-2009). Mr. Morrison also served as Vice President of Fidelity's Bond Funds (2002-2005), certain Balanced Funds (2002-2005), and certain Asset Allocation Funds (2002-2007), and as Senior Vice President (2002-2005) of Fidelity's Bond Division.
* Determined to be an “Interested Trustee” by virtue of, among other things, his or her affiliation with the trust or various entities under common control with FMR.
+ The information includes the Trustee's principal occupation during the last five years and other information relating to the experience, attributes, and skills relevant to the Trustee's qualifications to serve as a Trustee, which led to the conclusion that the Trustee should serve as a Trustee for the fund.
Independent Trustees:
Correspondence intended for an Independent Trustee may be sent to Fidelity Investments, P.O. Box 55235, Boston, Massachusetts 02205-5235.
Name, Year of Birth; Principal Occupations and Other Relevant Experience+
Dennis J. Dirks (1948)
Year of Election or Appointment: 2005
Trustee
Mr. Dirks also serves as Trustee of other Fidelity® funds. Prior to his retirement in May 2003, Mr. Dirks was Chief Operating Officer and a member of the Board of The Depository Trust & Clearing Corporation (DTCC). He also served as President, Chief Operating Officer, and Board member of The Depository Trust Company (DTC) and President and Board member of the National Securities Clearing Corporation (NSCC). In addition, Mr. Dirks served as Chief Executive Officer and Board member of the Government Securities Clearing Corporation, Chief Executive Officer and Board member of the Mortgage-Backed Securities Clearing Corporation, as a Trustee and a member of the Finance Committee of Manhattan College (2005-2008), as a Trustee and a member of the Finance Committee of AHRC of Nassau County (2006-2008), as a member of the Independent Directors Council (IDC) Governing Council (2010-2015), and as a member of the Board of Directors for The Brookville Center for Children’s Services, Inc. (2009-2017). Mr. Dirks is a member of the Finance Committee (2016-present) and Board of Directors (2017-present) of the Asolo Repertory Theatre.
Alan J. Lacy (1953)
Year of Election or Appointment: 2008
Trustee
Mr. Lacy also serves as Trustee of other Fidelity® funds. Mr. Lacy serves as a Director of Bristol-Myers Squibb Company (global pharmaceuticals, 2008-present). He is a Trustee of the California Chapter of The Nature Conservancy (2015-present) and a Director of the Center for Advanced Study in the Behavioral Sciences at Stanford University (2015-present). In addition, Mr. Lacy served as Senior Adviser (2007-2014) of Oak Hill Capital Partners, L.P. (private equity) and also served as Chief Executive Officer (2005) and Vice Chairman (2005-2006) of Sears Holdings Corporation (retail) and Chief Executive Officer and Chairman of the Board of Sears, Roebuck and Co. (retail, 2000-2005). Previously, Mr. Lacy served as Chairman (2014-2017) and a member (2010-2017) of the Board of Directors of Dave & Buster’s Entertainment, Inc. (restaurant and entertainment complexes), as Chairman (2008-2011) and a member (2006-2015) of the Board of Trustees of the National Parks Conservation Association, and as a member of the Board of Directors for The Hillman Companies, Inc. (hardware wholesalers, 2010-2014), Earth Fare, Inc. (retail grocery, 2010-2014), and The Western Union Company (global money transfer, 2006-2011).
Ned C. Lautenbach (1944)
Year of Election or Appointment: 2000
Trustee
Chairman of the Independent Trustees
Mr. Lautenbach also serves as Trustee of other Fidelity® funds. Mr. Lautenbach currently serves as Vice Chair of the Board of Governors, State University System of Florida (2013-present) and is a member of the Council on Foreign Relations (1994-present). He is also a member and has most recently served as Chairman of the Board of Directors of Artis-Naples (2012-present). Previously, Mr. Lautenbach served as a member and then Lead Director of the Board of Directors of Eaton Corporation (diversified industrial, 1997-2016). He was also a Partner and Advisory Partner at Clayton, Dubilier & Rice, LLC (private equity investment, 1998-2010), as well as a Director of Sony Corporation (2006-2007). In addition, Mr. Lautenbach also had a 30-year career with IBM (technology company) during which time he served as Senior Vice President and a member of the Corporate Executive Committee (1968-1998).
Joseph Mauriello (1944)
Year of Election or Appointment: 2008
Trustee
Mr. Mauriello also serves as Trustee of other Fidelity® funds. Prior to his retirement in January 2006, Mr. Mauriello served in numerous senior management positions including Deputy Chairman and Chief Operating Officer (2004-2005), and Vice Chairman of Financial Services (2002-2004) of KPMG LLP US (professional services, 1965-2005). Mr. Mauriello currently serves as a member of the Board of Directors of XL Group plc. (global insurance and re-insurance, 2006-present) and the Independent Directors Council (IDC) Governing Council (2015-present). Previously, Mr. Mauriello served as a Director of the Hamilton Funds of the Bank of New York (2006-2007) and of Arcadia Resources Inc. (health care services and products, 2007-2012).
Cornelia M. Small (1944)
Year of Election or Appointment: 2005
Trustee
Ms. Small also serves as Trustee of other Fidelity® funds. Ms. Small is a member of the Board of Directors (2009-present) and Chair of the Investment Committee (2010-present) of the Teagle Foundation. Ms. Small also serves on the Investment Committee of the Berkshire Taconic Community Foundation (2008-present). Previously, Ms. Small served as Chairperson (2002-2008) and a member of the Investment Committee and Chairperson (2008-2012) and a member of the Board of Trustees of Smith College. In addition, Ms. Small served as Chief Investment Officer, Director of Global Equity Investments, and a member of the Board of Directors of Scudder, Stevens & Clark and Scudder Kemper Investments.
William S. Stavropoulos (1939)
Year of Election or Appointment: 2001
Trustee
Vice Chairman of the Independent Trustees
Mr. Stavropoulos also serves as Trustee of other Fidelity® funds. Mr. Stavropoulos serves as President and Founder of the Michigan Baseball Foundation, the Great Lakes Loons (2007-present). Mr. Stavropoulos is Chairman Emeritus of the Board of Directors of The Dow Chemical Company, where he previously served in numerous senior management positions, including President, CEO (1995-2000; 2002-2004), Chairman of the Executive Committee (2000-2006), and as a member of the Board of Directors (1990-2006). Currently, Mr. Stavropoulos is Chairman of the Board of Directors of Univar Inc. (global distributor of commodity and specialty chemicals), a Director of Teradata Corporation (data warehousing and technology solutions), and a member of the Advisory Board for Metalmark Capital LLC (private equity investment, 2005-present). Mr. Stavropoulos is an operating advisor to Clayton, Dubilier & Rice, LLC (private equity investment). In addition, Mr. Stavropoulos is a member of the University of Notre Dame Advisory Council for the College of Science, a Trustee of the Rollin L. Gerstacker Foundation, and a Director of Artis-Naples in Naples, Florida. Previously, Mr. Stavropoulos served as a Director of Chemical Financial Corporation (bank holding company, 1993-2012) and Tyco International, Ltd. (multinational manufacturing and services, 2007-2012).
David M. Thomas (1949)
Year of Election or Appointment: 2008
Trustee
Mr. Thomas also serves as Trustee of other Fidelity® funds. Mr. Thomas serves as Non-Executive Chairman of the Board of Directors of Fortune Brands Home and Security (home and security products, 2011-present), as a member of the Board of Directors (2004-present) and Presiding Director (2013-present) of Interpublic Group of Companies, Inc. (marketing communication), and as a member of the Board of Trustees of the University of Florida (2013-present). Previously, Mr. Thomas served as Executive Chairman (2005-2006) and Chairman and Chief Executive Officer (2000-2005) of IMS Health, Inc. (pharmaceutical and healthcare information solutions), and a Director of Fortune Brands, Inc. (consumer products, 2000-2011).
+ The information includes the Trustee's principal occupation during the last five years and other information relating to the experience, attributes, and skills relevant to the Trustee's qualifications to serve as a Trustee, which led to the conclusion that the Trustee should serve as a Trustee for the fund.
Advisory Board Members and Officers:
Correspondence intended for an officer or Peter S. Lynch may be sent to Fidelity Investments, 245 Summer Street, Boston, Massachusetts 02210. Officers appear below in alphabetical order.
Name, Year of Birth; Principal Occupation
Peter S. Lynch (1944)
Year of Election or Appointment: 2003
Member of the Advisory Board
Mr. Lynch also serves as Member of the Advisory Board of other Fidelity® funds. Mr. Lynch is Vice Chairman and a Director of FMR (investment adviser firm) and FMR Co., Inc. (investment adviser firm). In addition, Mr. Lynch serves as a Trustee of Boston College and as the Chairman of the Inner-City Scholarship Fund. Previously, Mr. Lynch served on the Special Olympics International Board of Directors (1997-2006).
Elizabeth Paige Baumann (1968)
Year of Election or Appointment: 2017
Anti-Money Laundering (AML) Officer
Ms. Baumann also serves as AML Officer of other funds. She is Chief AML Officer (2012-present) and Senior Vice President (2014-present) of FMR LLC (diversified financial services company) and is an employee of Fidelity Investments. Previously, Ms. Baumann served as AML Officer of the funds (2012-2016), and Vice President (2007-2014) and Deputy Anti-Money Laundering Officer (2007-2012) of FMR LLC.
Marc R. Bryant (1966)
Year of Election or Appointment: 2015
Secretary and Chief Legal Officer (CLO)
Mr. Bryant also serves as Secretary and CLO of other funds. Mr. Bryant serves as CLO, Secretary, and Senior Vice President of Fidelity Management & Research Company (investment adviser firm, 2015-present) and FMR Co., Inc. (investment adviser firm, 2015-present); Secretary of Fidelity SelectCo, LLC (investment adviser firm, 2015-present) and Fidelity Investments Money Management, Inc. (investment adviser firm, 2015-present); and CLO of Fidelity Management & Research (Hong Kong) Limited and FMR Investment Management (UK) Limited (investment adviser firms, 2015-present) and Fidelity Management & Research (Japan) Limited (investment adviser firm, 2016-present). He is Senior Vice President and Deputy General Counsel of FMR LLC (diversified financial services company). Previously, Mr. Bryant served as Secretary and CLO of Fidelity Rutland Square Trust II (2010-2014) and Assistant Secretary of Fidelity's Fixed Income and Asset Allocation Funds (2013-2015). Prior to joining Fidelity Investments, Mr. Bryant served as a Senior Vice President and the Head of Global Retail Legal for AllianceBernstein L.P. (2006-2010), and as the General Counsel for ProFund Advisors LLC (2001-2006).
William C. Coffey (1969)
Year of Election or Appointment: 2009
Assistant Secretary
Mr. Coffey also serves as Assistant Secretary of other funds. He is Senior Vice President and Deputy General Counsel of FMR LLC (diversified financial services company, 2010-present), and is an employee of Fidelity Investments. Previously, Mr. Coffey served as Vice President and Associate General Counsel of FMR LLC (2005-2009).
Jonathan Davis (1968)
Year of Election or Appointment: 2010
Assistant Treasurer
Mr. Davis also serves as Assistant Treasurer of other funds. Mr. Davis serves as Assistant Treasurer of FMR Capital, Inc. (2017-present) and is an employee of Fidelity Investments. Previously, Mr. Davis served as Vice President and Associate General Counsel of FMR LLC (diversified financial services company, 2003-2010).
Adrien E. Deberghes (1967)
Year of Election or Appointment: 2016
Assistant Treasurer
Mr. Deberghes also serves as an officer of other funds. He serves as Assistant Treasurer of FMR Capital, Inc. (2017-present), Executive Vice President of Fidelity Investments Money Management, Inc. (FIMM) (investment adviser firm, 2016-present), and is an employee of Fidelity Investments (2008-present). Prior to joining Fidelity Investments, Mr. Deberghes was Senior Vice President of Mutual Fund Administration at State Street Corporation (2007-2008), Senior Director of Mutual Fund Administration at Investors Bank & Trust (2005-2007), and Director of Finance for Dunkin' Brands (2000-2005). Previously, Mr. Deberghes served in other fund officer roles.
Stephanie J. Dorsey (1969)
Year of Election or Appointment: 2010
Assistant Treasurer
Ms. Dorsey also serves as an officer of other funds. Ms. Dorsey serves as Assistant Treasurer of FMR Capital, Inc. (2017-present), is an employee of Fidelity Investments (2008-present), and has served in other fund officer roles. Prior to joining Fidelity Investments, Ms. Dorsey served as Treasurer (2004-2008) of the JPMorgan Mutual Funds and Vice President (2004-2008) of JPMorgan Chase Bank.
Howard J. Galligan III (1966)
Year of Election or Appointment: 2014
Chief Financial Officer
Mr. Galligan also serves as Chief Financial Officer of other funds. Mr. Galligan serves as President of Fidelity Pricing and Cash Management Services (FPCMS) (2014-present) and as a Director of Strategic Advisers, Inc. (investment adviser firm, 2008-present). Previously, Mr. Galligan served as Chief Administrative Officer of Asset Management (2011-2014) and Chief Operating Officer and Senior Vice President of Investment Support for Strategic Advisers, Inc. (2003-2011).
Brian B. Hogan (1964)
Year of Election or Appointment: 2009
Vice President
Mr. Hogan also serves as Trustee or Vice President of other funds. Mr. Hogan serves as a Director of FMR Investment Management (UK) Limited (investment adviser firm, 2015-present) and Fidelity SelectCo, LLC (investment adviser firm, 2014-present) and President of the Equity Division of FMR (investment adviser firm, 2009-present). Previously, Mr. Hogan served as Senior Vice President, Equity Research of FMR (2006-2009) and as a portfolio manager. Mr. Brian B. Hogan is not related to Mr. Colm A. Hogan.
Colm A. Hogan (1973)
Year of Election or Appointment: 2016
Deputy Treasurer
Mr. Hogan also serves as an officer of other funds. Mr. Hogan serves as Assistant Treasurer of FMR Capital, Inc. (2017-present) and is an employee of Fidelity Investments (2005-present). Mr. Colm A. Hogan is not related to Mr. Brian B. Hogan.
Chris Maher (1972)
Year of Election or Appointment: 2013
Assistant Treasurer
Mr. Maher serves as Assistant Treasurer of other funds. Mr. Maher is Vice President of Valuation Oversight, serves as Assistant Treasurer of FMR Capital, Inc. (2017-present), and is an employee of Fidelity Investments. Previously, Mr. Maher served as Vice President of Asset Management Compliance (2013), Vice President of the Program Management Group of FMR (investment adviser firm, 2010-2013), and Vice President of Valuation Oversight (2008-2010).
Rieco E. Mello (1969)
Year of Election or Appointment: 2017
Assistant Treasurer
Mr. Mello also serves as Assistant Treasurer of other funds. Mr. Mello serves as Assistant Treasurer of FMR Capital, Inc. (2017-present) and is an employee of Fidelity Investments (1995-present).
Melissa M. Reilly (1971)
Year of Election or Appointment: 2014
Vice President of certain Equity Funds
Ms. Reilly also serves as Vice President of other funds. Ms. Reilly is an employee of Fidelity Investments (2004-present).
Kenneth B. Robins (1969)
Year of Election or Appointment: 2016
Chief Compliance Officer
Mr. Robins also serves as an officer of other funds. Mr. Robins serves as Compliance Officer of Fidelity Management & Research Company and FMR Co., Inc. (investment adviser firms, 2016-present) and is an employee of Fidelity Investments (2004-present). Previously, Mr. Robins served as Executive Vice President of Fidelity Investments Money Management, Inc. (investment adviser firm, 2013-2016) and served in other fund officer roles.
Stacie M. Smith (1974)
Year of Election or Appointment: 2016
President and Treasurer
Ms. Smith also serves as an officer of other funds. Ms. Smith serves as Assistant Treasurer of FMR Capital, Inc. (2017-present), is an employee of Fidelity Investments (2009-present), and has served in other fund officer roles. Prior to joining Fidelity Investments, Ms. Smith served as Senior Audit Manager of Ernst & Young LLP (accounting firm, 1996-2009). Previously, Ms. Smith served as Deputy Treasurer of certain Fidelity® funds (2013-2016).
Marc L. Spector (1972)
Year of Election or Appointment: 2016
Assistant Treasurer
Mr. Spector also serves as an officer of other funds. Mr. Spector serves as Assistant Treasurer of FMR Capital, Inc. (2017-present) and is an employee of Fidelity Investments (2016-present). Prior to joining Fidelity Investments, Mr. Spector served as Director at the Siegfried Group (accounting firm, 2013-2016), and prior to Siegfried Group as audit senior manager at Deloitte & Touche (accounting firm, 2005-2013).
Renee Stagnone (1975)
Year of Election or Appointment: 2016
Assistant Treasurer
Ms. Stagnone also serves as an officer of other funds. Ms. Stagnone serves as Assistant Treasurer of FMR Capital, Inc. (2017-present) and is an employee of Fidelity Investments (1997-present). Previously, Ms. Stagnone served as Deputy Treasurer of certain Fidelity® funds (2013-2016).
Shareholder Expense Example
As a shareholder of the Fund, you incur two types of costs: (1) transaction costs, and (2) ongoing costs, including management fees and other Fund expenses. This Example is intended to help you understand your ongoing costs (in dollars) of investing in the Fund and to compare these costs with the ongoing costs of investing in other mutual funds.
The Example is based on an investment of $1,000 invested at the beginning of the period and held for the entire period (July 1, 2017 to December 31, 2017).
Actual Expenses
The first line of the accompanying table for each class of the Fund provides information about actual account values and actual expenses. You may use the information in this line, together with the amount you invested, to estimate the expenses that you paid over the period. Simply divide your account value by $1,000.00 (for example, an $8,600 account value divided by $1,000.00 = 8.6), then multiply the result by the number in the first line for a class of the Fund under the heading entitled "Expenses Paid During Period" to estimate the expenses you paid on your account during this period. A small balance maintenance fee of $12.00 that is charged once a year may apply for certain accounts with a value of less than $2,000. This fee is not included in the table below. If it was, the estimate of expenses you paid during the period would be higher, and your ending account value lower, by this amount. In addition, the Fund, as a shareholder in the underlying Fidelity Central Funds, will indirectly bear its pro-rata share of the fees and expenses incurred by the underlying Fidelity Central Funds. These fees and expenses are not included in the Fund's annualized expense ratio used to calculate the expense estimate in the table below.
Hypothetical Example for Comparison Purposes
The second line of the accompanying table for each class of the Fund provides information about hypothetical account values and hypothetical expenses based on a Class' actual expense ratio and an assumed rate of return of 5% per year before expenses, which is not the Class' actual return. The hypothetical account values and expenses may not be used to estimate the actual ending account balance or expenses you paid for the period. You may use this information to compare the ongoing costs of investing in the Fund and other funds. To do so, compare this 5% hypothetical example with the 5% hypothetical examples that appear in the shareholder reports of the other funds. A small balance maintenance fee of $12.00 that is charged once a year may apply for certain accounts with a value of less than $2,000. This fee is not included in the table below. If it was, the estimate of expenses you paid during the period would be higher, and your ending account value lower, by this amount. In addition, the Fund, as a shareholder in the underlying Fidelity Central Funds, will indirectly bear its pro-rata share of the fees and expenses incurred by the underlying Fidelity Central Funds. These fees and expenses are not included in the Fund's annualized expense ratio used to calculate the expense estimate in the table below.
Please note that the expenses shown in the table are meant to highlight your ongoing costs only and do not reflect any transaction costs. Therefore, the second line of the table is useful in comparing ongoing costs only, and will not help you determine the relative total costs of owning different funds.
| | Annualized Expense Ratio-A | Beginning
Account Value
July 1, 2017 | Ending
Account Value
December 31, 2017 | Expenses Paid
During Period-B
July 1, 2017
to December 31, 2017 |
| Contrafund | .81% | | | |
| Actual | | $1,000.00 | $1,132.00 | $4.35 |
| Hypothetical-C | | $1,000.00 | $1,021.12 | $4.13 |
| Class K | .72% | | | |
| Actual | | $1,000.00 | $1,132.80 | $3.87 |
| Hypothetical-C | | $1,000.00 | $1,021.58 | $3.67 |
A Annualized expense ratio reflects expenses net of applicable fee waivers.
B Expenses are equal to each Class' annualized expense ratio, multiplied by the average account value over the period, multiplied by 184/365 (to reflect the one-half year period).
C 5% return per year before expenses
Distributions (Unaudited)
The Board of Trustees of the Fidelity Contrafund voted to pay to shareholders of record at the opening of business on record date, the following distributions per share derived from capital gains realized from sales of portfolio securities.
| | Pay Date | Record Date | Capital Gains |
| Contrafund | 02/12/2018 | 02/09/2018 | $1.858 |
| Class K | 02/12/2018 | 02/09/2018 | $1.858 |
|
The fund hereby designates as a capital gain dividend with respect to the taxable year ended December 31, 2017, $8,870,646,322, or, if subsequently determined to be different, the net capital gain of such year.
The fund designates 100% of the dividends distributed during the fiscal year as qualifying for the dividends–received deduction for corporate shareholders.
The fund designates 100% of the dividends distributed during the fiscal year as amounts which may be taken into account as a dividend for purposes of the maximum rate under section 1(h)(11) of the Internal Revenue Code.
The fund will notify shareholders in January 2018 of amounts for use in preparing 2017 income tax returns.
Board Approval of Investment Advisory Contracts and Management Fees
Fidelity Contrafund
Each year, the Board of Trustees, including the Independent Trustees (together, the Board), votes on the renewal of the management contract with Fidelity Management & Research Company (FMR) and the sub-advisory agreements (together, the Advisory Contracts) for the fund. FMR and the sub-advisers are referred to herein as the Investment Advisers. The Board, assisted by the advice of fund counsel and Independent Trustees' counsel, requests and considers a broad range of information relevant to the renewal of the Advisory Contracts throughout the year.
The Board meets regularly and, at each of its meetings, covers an extensive agenda of topics and materials and considers factors that are relevant to its annual consideration of the renewal of the fund's Advisory Contracts, including the services and support provided to the fund and its shareholders. The Board has established various standing committees (Committees), each composed of and chaired by Independent Trustees with varying backgrounds, to which the Board has assigned specific subject matter responsibilities in order to enhance effective decision-making by the Board. The Board, acting directly and through its Committees, requests and receives information concerning the annual consideration of the renewal of the fund's Advisory Contracts. The Board also meets as needed to review matters specifically related to the Board's annual consideration of the renewal of the Advisory Contracts. Members of the Board may also meet with trustees of other Fidelity funds through ad hoc joint committees to discuss certain matters relevant to all of the Fidelity funds.
At its July 2017 meeting, the Board unanimously determined to renew the fund's Advisory Contracts. In reaching its determination, the Board considered all factors it believed relevant, including (i) the nature, extent, and quality of the services to be provided to the fund and its shareholders (including the investment performance of the fund); (ii) the competitiveness of the fund's management fee and total expense ratio relative to peer funds; (iii) the total costs of the services to be provided by and the profits to be realized by Fidelity from its relationships with the fund; and (iv) the extent to which, if any, economies of scale exist and would be realized as the fund grows, and whether any economies of scale are appropriately shared with fund shareholders.
In considering whether to renew the Advisory Contracts for the fund, the Board reached a determination, with the assistance of fund counsel and Independent Trustees' counsel and through the exercise of its business judgment, that the renewal of the Advisory Contracts was in the best interests of the fund and its shareholders and that the compensation payable under the Advisory Contracts was fair and reasonable. The Board's decision to renew the Advisory Contracts was not based on any single factor, but rather was based on a comprehensive consideration of all the information provided to the Board at its meetings throughout the year. The Board, in reaching its determination to renew the Advisory Contracts, was aware that shareholders of the fund have a broad range of investment choices available to them, including a wide choice among funds offered by Fidelity's competitors, and that the fund's shareholders, who have the opportunity to review and weigh the disclosure provided by the fund in its prospectus and other public disclosures, have chosen to invest in this fund, which is part of the Fidelity family of funds.
Amendment to Group Fee Rate. The Board also approved an amendment to the management contract for the fund to add an additional breakpoint to the group fee schedule, effective October 1, 2017. The Board noted that the additional breakpoint would result in lower management fee rates as Fidelity's assets under management increase.
Nature, Extent, and Quality of Services Provided. The Board considered Fidelity's staffing as it relates to the fund, including the backgrounds of investment personnel of Fidelity, and also considered the fund's investment objective, strategies, and related investment philosophy. The Independent Trustees also had discussions with senior management of Fidelity's investment operations and investment groups. The Board considered the structure of the investment personnel compensation program and whether this structure provides appropriate incentives to act in the best interests of the fund. Additionally, the Board considered the portfolio managers' investments, if any, in the funds that they manage.
Resources Dedicated to Investment Management and Support Services. The Board and the Fund Oversight and Research Committees reviewed the general qualifications and capabilities of Fidelity's investment staff, including its size, education, experience, and resources, as well as Fidelity's approach to recruiting, training, managing, and compensating investment personnel. The Board noted that Fidelity has continued to increase the resources devoted to non-U.S. offices, including expansion of Fidelity's global investment organization. The Board also noted that Fidelity's analysts have extensive resources, tools and capabilities that allow them to conduct sophisticated quantitative and fundamental analysis, as well as credit analysis of issuers, counterparties and guarantors. Further, the Board considered that Fidelity's investment professionals have sufficient access to global information and data so as to provide competitive investment results over time, and that those professionals also have access to sophisticated tools that permit them to assess portfolio construction and risk and performance attribution characteristics continuously, as well as to transmit new information and research conclusions rapidly around the world. Additionally, in its deliberations, the Board considered Fidelity's trading, risk management, compliance, and technology and operations capabilities and resources, which are integral parts of the investment management process.
Shareholder and Administrative Services. The Board considered (i) the nature, extent, quality, and cost of advisory, administrative, and shareholder services performed by the Investment Advisers and their affiliates under the Advisory Contracts and under separate agreements covering transfer agency, pricing and bookkeeping, and securities lending services for the fund; (ii) the nature and extent of the supervision of third party service providers, principally custodians, subcustodians, and pricing vendors; and (iii) the resources devoted to, and the record of compliance with, the fund's compliance policies and procedures. The Board also reviewed the allocation of fund brokerage, including allocations to brokers affiliated with the Investment Advisers, the use of brokerage commissions to pay fund expenses, and the use of "soft" commission dollars to pay for research services.
The Board noted that the growth of fund assets over time across the complex allows Fidelity to reinvest in the development of services designed to enhance the value or convenience of the Fidelity funds as investment vehicles. These services include 24-hour access to account information and market information through telephone representatives and over the Internet, investor education materials and asset allocation tools, and the expanded availability of Fidelity Investor Centers.
In 2014, the Board formed an ad hoc Committee on Transfer Agency Fees to review the variety of transfer agency fee structures throughout the industry and Fidelity's competitive positioning with respect to industry participants.
Investment in a Large Fund Family. The Board considered the benefits to shareholders of investing in a Fidelity fund, including the benefits of investing in a fund that is part of a large family of funds offering a variety of investment disciplines and providing a large variety of mutual fund investor services. The Board noted that Fidelity had taken, or had made recommendations that resulted in the Fidelity funds taking, a number of actions over the previous year that benefited particular funds, including: (i) continuing to dedicate additional resources to Fidelity's investment research process, and to the support of the senior management team that oversees asset management; (ii) continuing efforts to enhance Fidelity's global research capabilities; (iii) launching new funds and making other enhancements to meet client needs; (iv) launching new share classes of existing funds; (v) eliminating purchase minimums and broadening eligibility requirements for certain lower-priced share classes; (vi) reducing management fees and total expenses for certain growth equity funds and index funds; (vii) lowering expense caps for certain existing funds and classes to reduce expenses borne by shareholders; (viii) eliminating short-term redemption fees for certain funds; (ix) introducing a new pricing structure for certain funds of funds that is expected to reduce overall expenses paid by shareholders; (x) rationalizing product lines and gaining increased efficiencies through proposals for fund mergers and share class consolidations; (xi) continuing to develop, acquire and implement systems and technology to improve services to the funds and shareholders, strengthen information security, and increase efficiency; and (xii) implementing enhancements to further strengthen Fidelity's product line to increase investors' probability of success in achieving their investment goals, including retirement income goals.
Investment Performance. The Board considered whether the fund has operated in accordance with its investment objective, as well as its record of compliance with its investment restrictions and its performance history.
The Board took into account discussions with representatives of the Investment Advisers about fund investment performance that occur at Board meetings throughout the year. In this regard the Board noted that as part of regularly scheduled fund reviews and other reports to the Board on fund performance, the Board considers annualized return information for the fund for different time periods, measured against a securities market index ("benchmark index") and a peer group of funds with similar objectives ("peer group"), if any. In its evaluation of fund investment performance, the Board gave particular attention to information indicating changes in performance of certain Fidelity funds for specific time periods and discussed with the Investment Advisers the reasons for any overperformance or underperformance.
In addition to reviewing absolute and relative fund performance, the Independent Trustees periodically consider the appropriateness of fund performance metrics in evaluating the results achieved. In general, the Independent Trustees believe that fund performance should be evaluated based on net performance (after fees and expenses) of both the highest performing and lowest performing fund share classes, where applicable, compared to appropriate benchmark indices, over appropriate time periods that may include full market cycles, and compared to peer groups, as applicable, over the same periods, taking into account relevant factors including the following: general market conditions; issuer-specific information; and fund cash flows and other factors.
The Independent Trustees recognize that shareholders evaluate performance on a net basis over their own holding periods, for which one-, three-, and five-year periods are often used as a proxy. For this reason, the performance information reviewed by the Board also included net cumulative calendar year total return information for the fund and an appropriate benchmark index and peer group for the most recent one-, three-, and five-year periods, as shown below. Returns are shown compared to the 25th percentile (top of box, 75% beaten) and 75th percentile (bottom of box, 25% beaten) of the peer universe.
Fidelity Contrafund
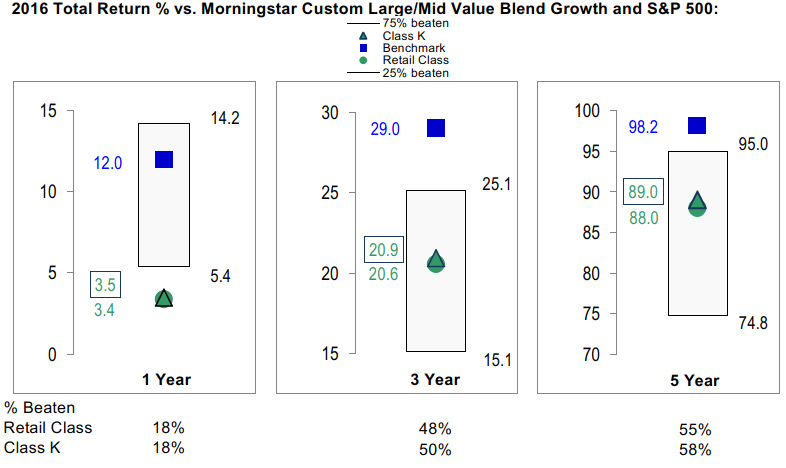
The Board also considered that the fund's management fee is subject to upward or downward adjustment depending upon whether, and to what extent, the fund's investment performance for the performance period (a rolling 36-month period) exceeds, or is exceeded by, a securities index, thus leading to a performance adjustment for the same period. The Board noted that the performance adjustment provides FMR with a strong economic incentive to seek to achieve superior long-term performance for the fund's shareholders and helps to more closely align the interests of FMR and the shareholders of the fund.
Based on its review, the Board concluded that the nature, extent, and quality of services provided to the fund under the Advisory Contracts should continue to benefit the shareholders of the fund.
Competitiveness of Management Fee and Total Expense Ratio. The Board considered the fund's management fee and total expense ratio compared to "mapped groups" of competitive funds and classes created for the purpose of facilitating the Trustees' competitive analysis of management fees and total expenses. Fidelity creates "mapped groups" by combining similar Lipper investment objective categories that have comparable investment mandates. Combining Lipper investment objective categories aids the Board's management fee and total expense ratio comparisons by broadening the competitive group used for comparison.
Management Fee. The Board considered two proprietary management fee comparisons for the 12-month periods shown in basis points (BP) in the chart below. The group of Lipper funds used by the Board for management fee comparisons is referred to below as the "Total Mapped Group." The Total Mapped Group comparison focuses on a fund's standing in terms of gross management fees before expense reimbursements or caps, and without giving effect to the fund's performance adjustment, relative to the total universe of funds with comparable investment mandates, regardless of whether their management fee structures also are comparable. Funds with comparable investment mandates offer exposure to similar types of securities. Funds with comparable management fee structures have similar management fee contractual arrangements (
e.g., flat rate charged for advisory services, all-inclusive fee rate,
etc.). "TMG %" represents the percentage of funds in the Total Mapped Group that had management fees that were lower than the fund's. For example, a hypothetical TMG % of 20% would mean that 80% of the funds in the Total Mapped Group had higher, and 20% had lower, management fees than the fund. The fund's actual TMG %s and the number of funds in the Total Mapped Group are in the chart below. The "Asset-Size Peer Group" (ASPG) comparison focuses on a fund's standing relative to a subset of non-Fidelity funds within the Total Mapped Group that are similar in size and management fee structure without taking into account performance adjustments, if any. For example, if a fund is in the first quartile of the ASPG, the fund's management fee ranks in the least expensive or lowest 25% of funds in the ASPG. The ASPG represents at least 15% of the funds in the Total Mapped Group with comparable asset size and management fee structures, subject to a minimum of 50 funds (or all funds in the Total Mapped Group if fewer than 50). Additional information, such as the ASPG quartile in which the fund's management fee rate ranked and the impact of the fund's performance adjustment, is also included in the chart and considered by the Board.
Fidelity Contrafund

The Board noted that the fund's management fee rate ranked below the median of its Total Mapped Group and below the median of its ASPG for 2016. The Board also noted the effect of the fund's performance adjustment, if any, on the fund's management fee ranking.
The Board noted that, in 2014, the Board and the boards of other Fidelity funds formed the ad hoc Committee on Group Fee to conduct an in-depth review of the "group fee" component of the management fee of funds with such management fee structures. The Committee's focus included the mechanics of the group fee, the competitive landscape of group fee structures, Fidelity funds with no group fee component and investment products not included in group fee assets. The Board also considered that, for funds subject to the group fee, FMR agreed to voluntarily waive fees over a specified period of time in amounts designed to account for assets converted from certain funds to certain collective investment trusts.
The Board also noted that, in 2013, the ad hoc Committee on Management Fees was formed to conduct an in-depth review of the management fee rates of Fidelity's active equity mutual funds. The Committee focused on the following areas: (i) standard fee structures; (ii) research consumption and trading evolution; (iii) management fee competitiveness/profitability by category; and (iv) factors that drive institutional pricing.
Based on its review, the Board concluded that the fund's management fee is fair and reasonable in light of the services that the fund receives and the other factors considered.
Total Expense Ratio. In its review of each class's total expense ratio, the Board considered the fund's management fee rate as well as other fund or class expenses, as applicable, such as transfer agent fees, pricing and bookkeeping fees, and custodial, legal, and audit fees. The Board noted the impact of the fund's performance adjustment. The Board also noted that Fidelity may agree to waive fees and expenses from time to time, and the extent to which, if any, it has done so for the fund. As part of its review, the Board also considered the current and historical total expense ratios of each class of the fund compared to competitive fund median expenses. Each class of the fund is compared to those funds and classes in the Total Mapped Group (used by the Board for management fee comparisons) that have a similar sales load structure.
The Board noted that the total expense ratio of each class ranked below the competitive median for 2016.
Fees Charged to Other Fidelity Clients. The Board also considered Fidelity fee structures and other information with respect to clients of Fidelity, such as other funds advised or subadvised by Fidelity, pension plan clients, and other institutional clients with similar mandates. The Board noted that an ad hoc joint committee created by it and the boards of other Fidelity funds periodically (most recently in 2013) reviews and compares Fidelity's institutional investment advisory business with its business of providing services to the Fidelity funds, including the differences in services provided, fees charged, and costs incurred, as well as competition in their respective marketplaces.
Based on its review of total expense ratios and fees charged to other Fidelity clients, the Board concluded that the total expense ratio of each class of the fund was reasonable in light of the services that the fund and its shareholders receive and the other factors considered.
Costs of the Services and Profitability. The Board considered the revenues earned and the expenses incurred by Fidelity in conducting the business of developing, marketing, distributing, managing, administering and servicing the fund and servicing the fund's shareholders. The Board also considered the level of Fidelity's profits in respect of all the Fidelity funds.
On an annual basis, Fidelity presents to the Board information about the profitability of its relationships with the fund. Fidelity calculates profitability information for each fund, as well as aggregate profitability information for groups of Fidelity funds and all Fidelity funds, using a series of detailed revenue and cost allocation methodologies which originate with the books and records of Fidelity on which Fidelity's audited financial statements are based. The Audit Committee of the Board reviews any significant changes from the prior year's methodologies.
PricewaterhouseCoopers LLP (PwC), independent registered public accounting firm and auditor to Fidelity and certain Fidelity funds, has been engaged annually by the Board as part of the Board's assessment of Fidelity's profitability analysis. PwC's engagement includes the review and assessment of the methodologies used by Fidelity in determining the revenues and expenses attributable to Fidelity's mutual fund business, and completion of agreed-upon procedures in respect of the mathematical accuracy of the fund profitability information and its conformity to established allocation methodologies. After considering PwC's reports issued under the engagement and information provided by Fidelity, the Board concluded that while other allocation methods may also be reasonable, Fidelity's profitability methodologies are reasonable in all material respects.
The Board also reviewed Fidelity's non-fund businesses and potential fall-out benefits related to the mutual fund business as well as cases where Fidelity's affiliates may benefit from or be related to the fund's business.
The Board considered the costs of the services provided by and the profits realized by Fidelity in connection with the operation of the fund and was satisfied that the profitability was not excessive.
Economies of Scale. The Board considered whether there have been economies of scale in respect of the management of the Fidelity funds, whether the Fidelity funds (including the fund) have appropriately benefited from any such economies of scale, and whether there is potential for realization of any further economies of scale. The Board considered the extent to which the fund will benefit from economies of scale as assets grow through increased services to the fund, through waivers or reimbursements, or through fee or expense ratio reductions. The Board also noted that a committee (the Economies of Scale Committee) created by it and the boards of other Fidelity funds periodically (most recently in 2013) analyzes whether Fidelity attains economies of scale in respect of the management and servicing of the Fidelity funds, whether the Fidelity funds have appropriately benefited from such economies of scale, and whether there is potential for realization of any further economies of scale.
The Board recognized that the fund's management contract incorporates a "group fee" structure, which provides for lower group fee rates as total group assets increase, and for higher group fee rates as total group assets decrease (with "group assets" defined to include fund assets under FMR's management plus the assets of sector funds previously under FMR's management). FMR calculates the group fee rates based on a tiered asset "breakpoint" schedule that varies based on asset class. The Board considered that the group fee is designed to deliver the benefits of economies of scale to fund shareholders when total Fidelity fund assets increase, even if assets of any particular fund are unchanged or have declined, because some portion of Fidelity's costs are attributable to services provided to all Fidelity funds, and all funds benefit if those costs can be allocated among more assets. The Board concluded that, given the group fee structure, fund shareholders will benefit from lower management fees as group assets increase at the fund complex level, regardless of whether Fidelity achieves any such economies of scale.
The Board concluded, taking into account the analysis of the Economies of Scale Committee, that economies of scale, if any, are being appropriately shared between fund shareholders and Fidelity.
Additional Information Requested by the Board. In order to develop fully the factual basis for consideration of the Fidelity funds' advisory contracts, the Board requested and received additional information on certain topics, including: (i) fund performance trends, in particular the underperformance of certain funds, and Fidelity's long-term strategies for certain funds; (ii) Fidelity's fund profitability methodology, profitability trends for certain funds, and the impact of certain factors on fund profitability results, including the impact of market trends on actively managed funds; (iii) the use of performance fees and the calculation of performance adjustments, including the impact of underperformance and fund outflows on performance adjustments; (iv) metrics for evaluating index fund performance; (v) Fidelity's group fee structure, including the group fee breakpoint schedules; (vi) the terms of Fidelity's contractual and voluntary expense cap arrangements with the funds; (vii) the methodology with respect to evaluating competitive fund data and peer group classifications and fee comparisons; (viii) the expense structures for different funds and classes; (ix) Fidelity's arrangements with affiliated sub-advisers on behalf of the funds; (x) information regarding other accounts managed by Fidelity, including institutional accounts and collective investment trusts; (xi) recent changes to the fee structure for certain funds of funds; and (xii) the impact of the Department of Labor's new fiduciary rule on the funds' comparative expense information.
Based on its evaluation of all of the conclusions noted above, and after considering all factors it believed relevant, the Board concluded that the advisory fee structures are fair and reasonable, and that the fund's Advisory Contracts should be renewed.

Corporate Headquarters
245 Summer St.
Boston, MA 02210
www.fidelity.com
CON-ANN-0218
1.540009.120
Fidelity® Contrafund® Class K
Annual Report December 31, 2017 |
|
Contents
To view a fund's proxy voting guidelines and proxy voting record for the 12-month period ended June 30, visit http://www.fidelity.com/proxyvotingresults or visit the Securities and Exchange Commission's (SEC) web site at http://www.sec.gov.
You may also call 1-800-835-5092 to request a free copy of the proxy voting guidelines.
Standard & Poor's, S&P and S&P 500 are registered service marks of The McGraw-Hill Companies, Inc. and have been licensed for use by Fidelity Distributors Corporation.
Other third-party marks appearing herein are the property of their respective owners.
All other marks appearing herein are registered or unregistered trademarks or service marks of FMR LLC or an affiliated company. © 2018 FMR LLC. All rights reserved.
This report and the financial statements contained herein are submitted for the general information of the shareholders of the Fund. This report is not authorized for distribution to prospective investors in the Fund unless preceded or accompanied by an effective prospectus.
A fund files its complete schedule of portfolio holdings with the SEC for the first and third quarters of each fiscal year on Form N-Q. Forms N-Q are available on the SEC’s web site at http://www.sec.gov. A fund's Forms N-Q may be reviewed and copied at the SEC’s Public Reference Room in Washington, DC. Information regarding the operation of the SEC's Public Reference Room may be obtained by calling 1-800-SEC-0330.
For a complete list of a fund's portfolio holdings, view the most recent holdings listing, semiannual report, or annual report on Fidelity's web site at http://www.fidelity.com, http://www.institutional.fidelity.com, or http://www.401k.com, as applicable.
NOT FDIC INSURED •MAY LOSE VALUE •NO BANK GUARANTEE
Neither the Fund nor Fidelity Distributors Corporation is a bank.
Performance: The Bottom Line
Average annual total return reflects the change in the value of an investment, assuming reinvestment of distributions from dividend income and capital gains (the profits earned upon the sale of securities that have grown in value, if any) and assuming a constant rate of performance each year. The hypothetical investment and the average annual total returns do not reflect the deduction of taxes that a shareholder would pay on fund distributions or the redemption of fund shares. During periods of reimbursement by Fidelity, a fund’s total return will be greater than it would be had the reimbursement not occurred. How a fund did yesterday is no guarantee of how it will do tomorrow.
Average Annual Total Returns
| For the periods ended December 31, 2017 | Past 1 year | Past 5 years | Past 10 years |
| Class K | 32.34% | 16.54% | 9.08% |
The initial offering of Class K shares took place on May 9, 2008. Returns prior to May 9, 2008 are those of Fidelity® Contrafund®, the original class of the fund.
$10,000 Over 10 Years
Let's say hypothetically that $10,000 was invested in Fidelity® Contrafund® - Class K on December 31, 2007.
The chart shows how the value of your investment would have changed, and also shows how the S&P 500® Index performed over the same period.
See above for additional information regarding the performance of Class K.

| Period Ending Values |
| $23,843 | Fidelity® Contrafund® - Class K |
| $22,603 | S&P 500® Index |
Management's Discussion of Fund Performance
Market Recap: U.S. equities gained 21.83% in 2017, as the S&P 500
® index rose steadily and closed the year just shy of an all-time high after a particularly strong three-month finish. Early on, equities rallied on optimism for President Trump’s pro-business agenda but leveled off in March amid fading optimism and stalled efforts by Congress to repeal and replace the Affordable Care Act. Upward momentum soon returned and continued through year-end with consumer sentiment and other market indicators staying positive. The lone exception was a brief cooldown in August, when geopolitical tension escalated and uncertainty grew regarding the future of health care, tax reform and the debt ceiling. Sector-wise, information technology fared best by a wide margin, rising 39% amid strong earnings growth from several major index constituents. A 24% gain in materials was spurred by increased demand, especially from China. Consumer discretionary gained 23%, despite many brick-and-mortar retailers suffering from online competition, and financials edged the broader market on an uptick in bond yields. Conversely, the defensive energy and telecom services sectors returned about -1% each. Rising interest rates held back real estate (+11%), while consumer staples (+13%) and utilities (+12%) struggled due to investors’ general preference for risk assets.
Comments from Portfolio Manager William Danoff: For the year, the fund's share classes gained about 32%, well ahead of the benchmark S&P 500
® index. A more business-friendly administration in the White House, a rebound in China’s economy and an extremely low interest rate environment worldwide produced synchronous global economic expansion. This strength propelled the stock market higher, particularly growth and technology shares. Contrafund was well-positioned for this rebound, and performed very well for the year. The fund's outperformance of the benchmark primarily was driven by a sizable position – 42% of assets, on average – in the market-leading information technology sector. Here, notable individual contributors included social-media firm Facebook and Google parent Alphabet, our two largest holdings. Other top contributors from the tech sector were gaming company Activision Blizzard and publishing software developer Adobe Systems. Our No. 2 relative contributor in 2017 was the fund’s de-emphasis of industrial conglomerate General Electric, which struggled the past year as demand for utility-grade generators softened. I am pleased that, given the fund beat its benchmark by more than 10 percentage points, there were no major detractors, although not owning enough of a few outperforming benchmark names hurt modestly. These included aircraft manufacturer Boeing and pharmaceutical firm AbbVie.
The views expressed above reflect those of the portfolio manager(s) only through the end of the period as stated on the cover of this report and do not necessarily represent the views of Fidelity or any other person in the Fidelity organization. Any such views are subject to change at any time based upon market or other conditions and Fidelity disclaims any responsibility to update such views. These views may not be relied on as investment advice and, because investment decisions for a Fidelity fund are based on numerous factors, may not be relied on as an indication of trading intent on behalf of any Fidelity fund.
Investment Summary (Unaudited)
Top Ten Stocks as of December 31, 2017
| | % of fund's net assets |
| Facebook, Inc. Class A | 7.2 |
| Berkshire Hathaway, Inc. Class A | 5.2 |
| Amazon.com, Inc. | 5.1 |
| Alphabet, Inc. Class A | 3.5 |
| Alphabet, Inc. Class C | 3.2 |
| Apple, Inc. | 3.2 |
| Microsoft Corp. | 3.1 |
| UnitedHealth Group, Inc. | 2.8 |
| Visa, Inc. Class A | 2.5 |
| Salesforce.com, Inc. | 2.3 |
| | 38.1 |
Top Five Market Sectors as of December 31, 2017
| | % of fund's net assets |
| Information Technology | 41.6 |
| Financials | 18.9 |
| Consumer Discretionary | 14.1 |
| Health Care | 9.2 |
| Industrials | 7.0 |
Asset Allocation (% of fund's net assets)
| As of December 31, 2017* |
| | Stocks | 97.6% |
| | Bonds | 0.1% |
| | Convertible Securities | 1.1% |
| | Short-Term Investments and Net Other Assets (Liabilities) | 1.2% |

* Foreign investments - 7.5%
Investments December 31, 2017
Showing Percentage of Net Assets
| Common Stocks - 97.6% | | | |
| | | Shares | Value (000s) |
| CONSUMER DISCRETIONARY - 14.0% | | | |
| Auto Components - 0.0% | | | |
| Aptiv PLC | | 461,281 | $39,130 |
| Delphi Technologies PLC (a) | | 153,760 | 8,068 |
| | | | 47,198 |
| Automobiles - 1.5% | | | |
| BYD Co. Ltd. (H Shares) (b) | | 7,553,000 | 65,617 |
| General Motors Co. | | 1,717,894 | 70,416 |
| Guangzhou Automobile Group Co. Ltd. (H Shares) | | 5,118,000 | 12,132 |
| Mahindra & Mahindra Ltd. | | 8,654,702 | 101,826 |
| Maruti Suzuki India Ltd. | | 1,533,074 | 233,648 |
| Tesla, Inc. (a)(b) | | 3,936,442 | 1,225,611 |
| Toyota Motor Corp. | | 963,400 | 61,397 |
| | | | 1,770,647 |
| Diversified Consumer Services - 0.1% | | | |
| Chegg, Inc. (a) | | 1,890,785 | 30,858 |
| Weight Watchers International, Inc. (a) | | 2,001,841 | 88,642 |
| | | | 119,500 |
| Hotels, Restaurants & Leisure - 1.6% | | | |
| Churchill Downs, Inc. | | 73,795 | 17,172 |
| Eldorado Resorts, Inc. (a) | | 403,827 | 13,387 |
| Hilton Worldwide Holdings, Inc. | | 4,135,969 | 330,298 |
| Las Vegas Sands Corp. | | 352,416 | 24,489 |
| Marriott International, Inc. Class A | | 5,092,258 | 691,172 |
| McDonald's Corp. | | 4,140,897 | 712,731 |
| Starbucks Corp. | | 1,628,818 | 93,543 |
| U.S. Foods Holding Corp. (a) | | 1,283,280 | 40,975 |
| Vail Resorts, Inc. | | 170,902 | 36,312 |
| | | | 1,960,079 |
| Household Durables - 0.4% | | | |
| D.R. Horton, Inc. | | 489,263 | 24,987 |
| Lennar Corp. Class A | | 2,049,726 | 129,625 |
| Mohawk Industries, Inc. (a) | | 1,223,799 | 337,646 |
| Roku, Inc. Class A | | 240,936 | 12,476 |
| | | | 504,734 |
| Internet & Direct Marketing Retail - 7.4% | | | |
| Amazon.com, Inc. (a) | | 5,292,465 | 6,189,379 |
| ASOS PLC (a) | | 114,477 | 10,379 |
| Blue Apron Holdings, Inc.: | | | |
| Class A | | 860,441 | 3,468 |
| Class B | | 3,463,673 | 13,819 |
| Netflix, Inc. (a) | | 10,101,885 | 1,939,158 |
| Priceline Group, Inc. (a) | | 435,601 | 756,961 |
| Start Today Co. Ltd. | | 2,801,200 | 85,149 |
| Takeaway.com Holding BV (a)(c) | | 556,400 | 33,967 |
| Zalando SE (a) | | 736,544 | 38,986 |
| | | | 9,071,266 |
| Leisure Products - 0.1% | | | |
| Mattel, Inc. (b) | | 3,849,245 | 59,201 |
| Polaris Industries, Inc. | | 282,800 | 35,064 |
| | | | 94,265 |
| Media - 0.9% | | | |
| Charter Communications, Inc. Class A (a) | | 558,040 | 187,479 |
| Liberty Global PLC Class A (a) | | 1,167,463 | 41,842 |
| Liberty Media Corp.: | | | |
| Liberty Formula One Group Series C (a) | | 7,524,117 | 257,024 |
| Liberty SiriusXM Series C (a) | | 5,081,799 | 201,544 |
| Live Nation Entertainment, Inc. (a) | | 1,069,735 | 45,539 |
| Sirius XM Holdings, Inc. (b) | | 24,568,249 | 131,686 |
| The Walt Disney Co. | | 2,678,714 | 287,989 |
| Weinstein Co. Holdings LLC Class A-1 (a)(d)(e)(f) | | 41,234 | 0 |
| | | | 1,153,103 |
| Multiline Retail - 0.2% | | | |
| B&M European Value Retail S.A. | | 10,861,792 | 62,121 |
| Dollar Tree, Inc. (a) | | 898,930 | 96,464 |
| Ollie's Bargain Outlet Holdings, Inc. (a) | | 1,492,501 | 79,476 |
| | | | 238,061 |
| Specialty Retail - 1.3% | | | |
| Burlington Stores, Inc. (a) | | 101,477 | 12,485 |
| Five Below, Inc. (a) | | 378,529 | 25,104 |
| Home Depot, Inc. | | 5,598,282 | 1,061,042 |
| TJX Companies, Inc. | | 6,258,914 | 478,557 |
| | | | 1,577,188 |
| Textiles, Apparel & Luxury Goods - 0.5% | | | |
| adidas AG | | 1,704,913 | 341,929 |
| Kering SA | | 140,003 | 66,017 |
| LVMH Moet Hennessy - Louis Vuitton SA | | 206,059 | 60,479 |
| NIKE, Inc. Class B | | 2,999,577 | 187,624 |
| | | | 656,049 |
|
| TOTAL CONSUMER DISCRETIONARY | | | 17,192,090 |
|
| CONSUMER STAPLES - 2.5% | | | |
| Beverages - 0.5% | | | |
| Constellation Brands, Inc. Class A (sub. vtg.) | | 701,895 | 160,432 |
| Kweichow Moutai Co. Ltd. (A Shares) | | 580,700 | 62,249 |
| Monster Beverage Corp. (a) | | 1,797,258 | 113,748 |
| The Coca-Cola Co. | | 4,081,865 | 187,276 |
| | | | 523,705 |
| Food & Staples Retailing - 0.5% | | | |
| Costco Wholesale Corp. | | 1,098,532 | 204,459 |
| Performance Food Group Co. (a) | | 2,616,872 | 86,618 |
| Sysco Corp. | | 488,474 | 29,665 |
| Wal-Mart Stores, Inc. | | 3,259,634 | 321,889 |
| | | | 642,631 |
| Food Products - 0.0% | | | |
| The Simply Good Foods Co. | | 1,453,963 | 20,734 |
| Household Products - 0.6% | | | |
| Colgate-Palmolive Co. | | 9,748,647 | 735,535 |
| Personal Products - 0.9% | | | |
| Estee Lauder Companies, Inc. Class A | | 8,185,407 | 1,041,511 |
| L'Oreal SA | | 232,429 | 51,502 |
| Shiseido Co. Ltd. | | 215,500 | 10,416 |
| Unilever NV (Certificaten Van Aandelen) (Bearer) | | 423,600 | 23,850 |
| | | | 1,127,279 |
|
| TOTAL CONSUMER STAPLES | | | 3,049,884 |
|
| ENERGY - 2.2% | | | |
| Oil, Gas & Consumable Fuels - 2.2% | | | |
| Andeavor | | 93,143 | 10,650 |
| Birchcliff Energy Ltd. (g) | | 20,925,111 | 73,246 |
| Birchcliff Energy Ltd. (a)(c)(g) | | 686,127 | 2,402 |
| Cabot Oil & Gas Corp. | | 916,075 | 26,200 |
| Canadian Natural Resources Ltd. | | 5,786,957 | 206,802 |
| Centennial Resource Development, Inc.: | | | |
| Class A (a)(g) | | 5,188,000 | 102,722 |
| Class A (a)(b)(g) | | 13,884,347 | 274,910 |
| Class A (e)(g) | | 2,340,926 | 46,350 |
| Concho Resources, Inc. (a) | | 557,731 | 83,782 |
| Continental Resources, Inc. (a) | | 4,454,752 | 235,968 |
| Diamondback Energy, Inc. (a) | | 1,924,391 | 242,954 |
| Encana Corp. | | 969,925 | 12,940 |
| EOG Resources, Inc. | | 5,452,517 | 588,381 |
| Growmax Resources Corp. (a)(c) | | 3,445,563 | 288 |
| Phillips 66 Co. | | 2,639,230 | 266,958 |
| Pioneer Natural Resources Co. | | 71,644 | 12,384 |
| PrairieSky Royalty Ltd. | | 2,752,474 | 70,202 |
| Reliance Industries Ltd. | | 24,199,564 | 349,139�� |
| Valero Energy Corp. | | 1,169,574 | 107,496 |
| | | | 2,713,774 |
| FINANCIALS - 18.9% | | | |
| Banks - 10.0% | | | |
| Bank Ireland Group PLC (a) | | 14,781,261 | 126,807 |
| Bank of America Corp. | | 72,809,398 | 2,149,333 |
| Citigroup, Inc. | | 36,040,820 | 2,681,797 |
| HDFC Bank Ltd. sponsored ADR | | 6,969,684 | 708,608 |
| JPMorgan Chase & Co. | | 21,393,467 | 2,287,817 |
| Kotak Mahindra Bank Ltd. | | 11,135,666 | 176,210 |
| M&T Bank Corp. | | 1,950,074 | 333,443 |
| Metro Bank PLC (a)(b)(g) | | 5,947,525 | 287,797 |
| PNC Financial Services Group, Inc. | | 2,869,202 | 413,997 |
| Royal Bank of Canada | | 871,182 | 71,143 |
| The Toronto-Dominion Bank | | 2,008,195 | 117,664 |
| U.S. Bancorp | | 13,395,139 | 717,712 |
| Wells Fargo & Co. | | 35,507,366 | 2,154,232 |
| | | | 12,226,560 |
| Capital Markets - 2.3% | | | |
| Ashmore Group PLC | | 1,658,173 | 9,069 |
| Bank of New York Mellon Corp. | | 4,399,321 | 236,947 |
| BlackRock, Inc. Class A | | 585,999 | 301,034 |
| Brookfield Asset Management, Inc. Class A | | 633,498 | 27,578 |
| CBOE Holdings, Inc. | | 249,330 | 31,064 |
| Charles Schwab Corp. | | 11,360,770 | 583,603 |
| CME Group, Inc. | | 753,381 | 110,031 |
| Goldman Sachs Group, Inc. | | 121,821 | 31,035 |
| IntercontinentalExchange, Inc. | | 1,688,888 | 119,168 |
| Morgan Stanley | | 13,977,355 | 733,392 |
| MSCI, Inc. | | 1,571,223 | 198,823 |
| Oaktree Capital Group LLC Class A | | 2,369,843 | 99,770 |
| S&P Global, Inc. | | 1,814,956 | 307,454 |
| St. James's Place Capital PLC | | 1,549,863 | 25,655 |
| | | | 2,814,623 |
| Consumer Finance - 0.1% | | | |
| Synchrony Financial | | 4,059,167 | 156,724 |
| Diversified Financial Services - 5.2% | | | |
| Berkshire Hathaway, Inc. Class A (a) | | 21,535 | 6,408,816 |
| Insurance - 1.3% | | | |
| Admiral Group PLC | | 4,091,264 | 110,587 |
| AIA Group Ltd. | | 8,301,800 | 70,821 |
| Chubb Ltd. | | 7,137,990 | 1,043,074 |
| Fairfax Financial Holdings Ltd. (sub. vtg.) | | 181,083 | 96,425 |
| Marsh & McLennan Companies, Inc. | | 2,308,474 | 187,887 |
| | | | 1,508,794 |
|
| TOTAL FINANCIALS | | | 23,115,517 |
|
| HEALTH CARE - 8.9% | | | |
| Biotechnology - 2.2% | | | |
| AbbVie, Inc. | | 2,478,244 | 239,671 |
| Agios Pharmaceuticals, Inc. (a) | | 1,060,610 | 60,635 |
| Alnylam Pharmaceuticals, Inc. (a) | | 433,100 | 55,025 |
| Amgen, Inc. | | 852,604 | 148,268 |
| AnaptysBio, Inc. | | 447,716 | 45,094 |
| Biogen, Inc. (a) | | 291,588 | 92,891 |
| bluebird bio, Inc. (a) | | 177,359 | 31,588 |
| Blueprint Medicines Corp. (a) | | 232,134 | 17,505 |
| Celgene Corp. (a) | | 1,334,244 | 139,242 |
| Exact Sciences Corp. (a) | | 316,719 | 16,640 |
| FibroGen, Inc. (a) | | 1,931,049 | 91,532 |
| Genmab A/S (a) | | 908,578 | 150,680 |
| Gilead Sciences, Inc. | | 7,114,588 | 509,689 |
| Insmed, Inc. (a) | | 987,886 | 30,802 |
| Intrexon Corp. (b) | | 1,755,782 | 20,227 |
| Juno Therapeutics, Inc. (a) | | 608,075 | 27,795 |
| NantKwest, Inc. (a)(b) | | 826,782 | 3,712 |
| Neurocrine Biosciences, Inc. (a) | | 3,028,126 | 234,952 |
| OvaScience, Inc. (a) | | 1,449,250 | 2,029 |
| Portola Pharmaceuticals, Inc. (a) | | 795,959 | 38,747 |
| Regeneron Pharmaceuticals, Inc. (a) | | 365,411 | 137,380 |
| Sage Therapeutics, Inc. (a) | | 205,191 | 33,797 |
| Vertex Pharmaceuticals, Inc. (a) | | 3,662,663 | 548,887 |
| | | | 2,676,788 |
| Health Care Equipment & Supplies - 1.6% | | | |
| Baxter International, Inc. | | 6,286,643 | 406,369 |
| Becton, Dickinson & Co. | | 518,278 | 110,943 |
| Boston Scientific Corp. (a) | | 29,897,043 | 741,148 |
| Danaher Corp. | | 1,002,183 | 93,023 |
| Edwards Lifesciences Corp. (a) | | 284,557 | 32,072 |
| Intuitive Surgical, Inc. (a) | | 990,232 | 361,375 |
| Penumbra, Inc. (a) | | 475,311 | 44,727 |
| ResMed, Inc. | | 564,735 | 47,827 |
| Stryker Corp. | | 776,986 | 120,309 |
| | | | 1,957,793 |
| Health Care Providers & Services - 3.3% | | | |
| Aetna, Inc. | | 730,738 | 131,818 |
| Anthem, Inc. | | 92,947 | 20,914 |
| Cigna Corp. | | 219,037 | 44,484 |
| HealthEquity, Inc. (a) | | 1,695,286 | 79,102 |
| Henry Schein, Inc. (a) | | 2,416,332 | 168,853 |
| Humana, Inc. | | 801,287 | 198,775 |
| National Vision Holdings, Inc. | | 757,104 | 30,746 |
| OptiNose, Inc. | | 539,390 | 10,194 |
| UnitedHealth Group, Inc. | | 15,550,291 | 3,428,217 |
| | | | 4,113,103 |
| Health Care Technology - 0.1% | | | |
| Medidata Solutions, Inc. (a) | | 497,480 | 31,525 |
| NantHealth, Inc. (a) | | 8,726 | 27 |
| Veeva Systems, Inc. Class A (a) | | 2,249,125 | 124,332 |
| | | | 155,884 |
| Life Sciences Tools & Services - 1.2% | | | |
| Agilent Technologies, Inc. | | 911,425 | 61,038 |
| Eurofins Scientific SA | | 80,681 | 49,138 |
| Mettler-Toledo International, Inc. (a)(g) | | 1,739,519 | 1,077,667 |
| PRA Health Sciences, Inc. (a) | | 830,077 | 75,595 |
| Thermo Fisher Scientific, Inc. | | 759,640 | 144,240 |
| Waters Corp. (a) | | 389,119 | 75,174 |
| | | | 1,482,852 |
| Pharmaceuticals - 0.5% | | | |
| AstraZeneca PLC sponsored ADR | | 554,333 | 19,235 |
| Bristol-Myers Squibb Co. | | 2,415,687 | 148,033 |
| GW Pharmaceuticals PLC ADR (a) | | 68,246 | 9,009 |
| Johnson & Johnson | | 583,003 | 81,457 |
| Nektar Therapeutics (a) | | 3,788,992 | 226,279 |
| Teva Pharmaceutical Industries Ltd. sponsored ADR | | 4,657,942 | 88,268 |
| | | | 572,281 |
|
| TOTAL HEALTH CARE | | | 10,958,701 |
|
| INDUSTRIALS - 6.9% | | | |
| Aerospace & Defense - 1.0% | | | |
| General Dynamics Corp. | | 653,034 | 132,860 |
| Northrop Grumman Corp. | | 1,297,462 | 398,204 |
| Raytheon Co. | | 962,410 | 180,789 |
| Space Exploration Technologies Corp.: | | | |
| Class A (a)(e)(f) | | 295,578 | 39,903 |
| Class C (e)(f) | | 12,991 | 1,754 |
| The Boeing Co. | | 1,464,853 | 432,000 |
| | | | 1,185,510 |
| Air Freight & Logistics - 0.5% | | | |
| Expeditors International of Washington, Inc. | | 169,129 | 10,941 |
| FedEx Corp. | | 1,483,395 | 370,166 |
| XPO Logistics, Inc. (a) | | 2,523,969 | 231,170 |
| | | | 612,277 |
| Airlines - 1.0% | | | |
| Ryanair Holdings PLC sponsored ADR (a) | | 5,130,023 | 534,497 |
| Southwest Airlines Co. | | 11,022,876 | 721,447 |
| | | | 1,255,944 |
| Building Products - 0.8% | | | |
| A.O. Smith Corp. | | 999,856 | 61,271 |
| Fortune Brands Home & Security, Inc. | | 1,242,720 | 85,052 |
| Jeld-Wen Holding, Inc. | | 4,046,404 | 159,307 |
| Masco Corp. | | 12,610,412 | 554,102 |
| Toto Ltd. | | 2,928,000 | 172,809 |
| | | | 1,032,541 |
| Commercial Services & Supplies - 0.2% | | | |
| Cintas Corp. | | 999,272 | 155,717 |
| TulCo LLC (d)(e)(f) | | 125,827 | 44,039 |
| | | | 199,756 |
| Construction & Engineering - 0.1% | | | |
| Jacobs Engineering Group, Inc. | | 924,109 | 60,954 |
| Electrical Equipment - 0.4% | | | |
| AMETEK, Inc. | | 660,527 | 47,868 |
| Fortive Corp. | | 5,903,654 | 427,129 |
| | | | 474,997 |
| Industrial Conglomerates - 0.8% | | | |
| 3M Co. | | 4,018,929 | 945,935 |
| ITT, Inc. | | 111,805 | 5,967 |
| Roper Technologies, Inc. | | 86,532 | 22,412 |
| | | | 974,314 |
| Machinery - 1.3% | | | |
| Caterpillar, Inc. | | 1,576,543 | 248,432 |
| Deere & Co. | | 3,042,920 | 476,247 |
| Gardner Denver Holdings, Inc. | | 2,419,324 | 82,088 |
| IDEX Corp. | | 81,921 | 10,811 |
| Illinois Tool Works, Inc. | | 1,743,434 | 290,892 |
| Ingersoll-Rand PLC | | 997,971 | 89,009 |
| Oshkosh Corp. | | 122,649 | 11,148 |
| PACCAR, Inc. | | 1,821,301 | 129,458 |
| Parker Hannifin Corp. | | 1,182,314 | 235,966 |
| Rational AG | | 39,483 | 25,449 |
| Xylem, Inc. | | 507,782 | 34,631 |
| | | | 1,634,131 |
| Professional Services - 0.3% | | | |
| Equifax, Inc. | | 249,476 | 29,418 |
| Manpower, Inc. | | 244,255 | 30,803 |
| Recruit Holdings Co. Ltd. | | 2,548,600 | 63,333 |
| RELX PLC | | 557,096 | 13,080 |
| TransUnion Holding Co., Inc. (a) | | 4,450,959 | 244,625 |
| | | | 381,259 |
| Road & Rail - 0.4% | | | |
| CSX Corp. | | 7,293,748 | 401,229 |
| Union Pacific Corp. | | 743,753 | 99,737 |
| | | | 500,966 |
| Trading Companies & Distributors - 0.1% | | | |
| Air Lease Corp. Class A (c) | | 1,414,358 | 68,016 |
| Fastenal Co. | | 228,275 | 12,484 |
| United Rentals, Inc. (a) | | 113,766 | 19,558 |
| | | | 100,058 |
|
| TOTAL INDUSTRIALS | | | 8,412,707 |
|
| INFORMATION TECHNOLOGY - 41.1% | | | |
| Communications Equipment - 0.4% | | | |
| Arista Networks, Inc. (a) | | 1,863,639 | 439,036 |
| Electronic Equipment & Components - 1.8% | | | |
| Amphenol Corp. Class A (g) | | 22,863,610 | 2,007,425 |
| CDW Corp. | | 2,104,464 | 146,239 |
| Corning, Inc. | | 170,210 | 5,445 |
| Dolby Laboratories, Inc. Class A | | 871,583 | 54,038 |
| Keyence Corp. | | 19,600 | 10,980 |
| | | | 2,224,127 |
| Internet Software & Services - 15.3% | | | |
| Alibaba Group Holding Ltd. sponsored ADR (a) | | 2,327,884 | 401,397 |
| Alphabet, Inc.: | | | |
| Class A (a) | | 4,118,780 | 4,338,723 |
| Class C (a) | | 3,788,625 | 3,964,417 |
| CarGurus, Inc. Class A (b) | | 625,994 | 18,767 |
| Cloudera, Inc. (b) | | 1,616,953 | 26,712 |
| CoStar Group, Inc. (a) | | 14,889 | 4,421 |
| Dropbox, Inc. Class B (a)(e)(f) | | 5,464,028 | 77,808 |
| eBay, Inc. (a) | | 7,756,791 | 292,741 |
| Facebook, Inc. Class A (a) | | 49,685,082 | 8,767,436 |
| LogMeIn, Inc. | | 1,883,719 | 215,686 |
| New Relic, Inc. (a) | | 1,098,730 | 63,474 |
| Nutanix, Inc. Class B (c) | | 3,060,752 | 107,983 |
| Okta, Inc. | | 1,199,694 | 30,724 |
| Q2 Holdings, Inc. (a) | | 44,491 | 1,639 |
| Rightmove PLC | | 271,289 | 16,483 |
| Shopify, Inc. Class A (a) | | 466,460 | 47,169 |
| Tencent Holdings Ltd. | | 8,518,200 | 440,885 |
| | | | 18,816,465 |
| IT Services - 6.1% | | | |
| Accenture PLC Class A | | 1,028,249 | 157,415 |
| ASAC II LP (a)(e)(f) | | 39,494,500 | 6,635 |
| EPAM Systems, Inc. (a) | | 679,330 | 72,980 |
| Fiserv, Inc. (a) | | 2,105,345 | 276,074 |
| FleetCor Technologies, Inc. (a) | | 10,633 | 2,046 |
| Global Payments, Inc. | | 2,013,835 | 201,867 |
| Leidos Holdings, Inc. | | 346,875 | 22,398 |
| MasterCard, Inc. Class A | | 11,597,630 | 1,755,417 |
| PayPal Holdings, Inc. (a) | | 25,043,707 | 1,843,718 |
| Square, Inc. (a) | | 1,509,271 | 52,326 |
| Visa, Inc. Class A | | 27,278,040 | 3,110,242 |
| | | | 7,501,118 |
| Semiconductors & Semiconductor Equipment - 2.8% | | | |
| Analog Devices, Inc. | | 791,386 | 70,457 |
| Applied Materials, Inc. | | 11,389,500 | 582,231 |
| Broadcom Ltd. | | 1,944,125 | 499,446 |
| First Solar, Inc. (a) | | 713,233 | 48,157 |
| Lam Research Corp. | | 2,708,772 | 498,604 |
| NVIDIA Corp. | | 4,569,664 | 884,230 |
| Qualcomm, Inc. | | 1,316,152 | 84,260 |
| Taiwan Semiconductor Manufacturing Co. Ltd. sponsored ADR | | 5,174,027 | 205,150 |
| Texas Instruments, Inc. | | 5,006,384 | 522,867 |
| | | | 3,395,402 |
| Software - 11.5% | | | |
| Activision Blizzard, Inc. | | 34,531,460 | 2,186,532 |
| Adobe Systems, Inc. (a) | | 13,085,352 | 2,293,077 |
| Atlassian Corp. PLC (a) | | 3,108,052 | 141,479 |
| CDK Global, Inc. | | 1,477,549 | 105,320 |
| Constellation Software, Inc. | | 131,414 | 79,666 |
| Electronic Arts, Inc. (a) | | 8,596,245 | 903,121 |
| Intuit, Inc. | | 796,168 | 125,619 |
| Micro Focus International PLC | | 1,692,548 | 57,655 |
| Microsoft Corp. | | 44,162,151 | 3,777,630 |
| Nintendo Co. Ltd. | | 175,400 | 63,161 |
| Parametric Technology Corp. (a) | | 928,547 | 56,428 |
| Paycom Software, Inc. (a)(b) | | 1,710,940 | 137,440 |
| Red Hat, Inc. (a) | | 2,054,235 | 246,714 |
| RingCentral, Inc. (a) | | 1,715,421 | 83,026 |
| Salesforce.com, Inc. (a) | | 26,966,406 | 2,756,776 |
| Snap, Inc. Class A (a)(b) | | 1,592,804 | 23,271 |
| Tanium, Inc. Class B (e)(f) | | 2,944,100 | 15,103 |
| Trion World, Inc. (a)(e)(f) | | 4,607,810 | 0 |
| Trion World, Inc. warrants 10/3/18 (a)(e)(f) | | 183,516 | 0 |
| Ultimate Software Group, Inc. (a) | | 1,116,550 | 243,665 |
| Workday, Inc. Class A (a) | | 7,527,460 | 765,844 |
| | | | 14,061,527 |
| Technology Hardware, Storage & Peripherals - 3.2% | | | |
| Apple, Inc. | | 23,011,177 | 3,894,181 |
| Samsung Electronics Co. Ltd. | | 11,221 | 26,786 |
| | | | 3,920,967 |
|
| TOTAL INFORMATION TECHNOLOGY | | | 50,358,642 |
|
| MATERIALS - 2.6% | | | |
| Chemicals - 1.6% | | | |
| Air Products & Chemicals, Inc. | | 1,685,148 | 276,499 |
| DowDuPont, Inc. | | 11,482,761 | 817,802 |
| LyondellBasell Industries NV Class A | | 757,935 | 83,615 |
| Olin Corp. | | 1,272,798 | 45,286 |
| Sherwin-Williams Co. | | 1,396,767 | 572,730 |
| The Chemours Co. LLC | | 533,491 | 26,707 |
| Westlake Chemical Corp. | | 1,338,335 | 142,573 |
| | | | 1,965,212 |
| Construction Materials - 0.0% | | | |
| Eagle Materials, Inc. | | 76,646 | 8,684 |
| Containers & Packaging - 0.2% | | | |
| WestRock Co. | | 3,176,176 | 200,766 |
| Metals & Mining - 0.8% | | | |
| ArcelorMittal SA Class A unit (a)(b) | | 1,676,835 | 54,179 |
| Arizona Mining, Inc. (a) | | 885,695 | 2,438 |
| B2Gold Corp. (a)(g) | | 49,817,232 | 153,772 |
| Franco-Nevada Corp. | | 4,241,442 | 338,978 |
| Freeport-McMoRan, Inc. (a) | | 1,027,361 | 19,479 |
| Ivanhoe Mines Ltd. (a)(g) | | 51,261,868 | 172,912 |
| Ivanhoe Mines Ltd. (a)(c)(g) | | 14,742,100 | 49,727 |
| Kirkland Lake Gold Ltd. | | 2,926,470 | 44,863 |
| Newcrest Mining Ltd. | | 5,816,660 | 103,567 |
| Novagold Resources, Inc. (a) | | 8,115,004 | 31,892 |
| Nucor Corp. | | 503,030 | 31,983 |
| Randgold Resources Ltd. sponsored ADR | | 366,081 | 36,202 |
| | | | 1,039,992 |
|
| TOTAL MATERIALS | | | 3,214,654 |
|
| REAL ESTATE - 0.2% | | | |
| Equity Real Estate Investment Trusts (REITs) - 0.1% | | | |
| American Tower Corp. | | 838,884 | 119,684 |
| Real Estate Management & Development - 0.1% | | | |
| Five Point Holdings LLC Class A (a) | | 3,148,178 | 44,389 |
| WeWork Companies, Inc. Class A (a)(e)(f) | | 607,163 | 31,457 |
| | | | 75,846 |
|
| TOTAL REAL ESTATE | | | 195,530 |
|
| TELECOMMUNICATION SERVICES - 0.3% | | | |
| Wireless Telecommunication Services - 0.3% | | | |
| SoftBank Corp. | | 655,500 | 51,896 |
| T-Mobile U.S., Inc. (a) | | 5,547,574 | 352,326 |
| | | | 404,222 |
| TOTAL COMMON STOCKS | | | |
| (Cost $58,130,785) | | | 119,615,721 |
|
| Convertible Preferred Stocks - 1.1% | | | |
| CONSUMER DISCRETIONARY - 0.1% | | | |
| Diversified Consumer Services - 0.1% | | | |
| Airbnb, Inc.: | | | |
| Series D (a)(e)(f) | | 578,817 | 54,519 |
| Series E (a)(e)(f) | | 388,853 | 36,626 |
| Handy Technologies, Inc. Series C (a)(e)(f) | | 3,537,042 | 11,248 |
| | | | 102,393 |
| CONSUMER STAPLES - 0.0% | | | |
| Food & Staples Retailing - 0.0% | | | |
| Roofoods Ltd. Series F (e)(f) | | 154,611 | 54,666 |
| HEALTH CARE - 0.2% | | | |
| Biotechnology - 0.2% | | | |
| 23andMe, Inc.: | | | |
| Series E (a)(e)(f) | | 664,987 | 9,233 |
| Series F (e)(f) | | 3,348,986 | 46,498 |
| Intarcia Therapeutics, Inc. Series CC (a)(e)(f) | | 2,100,446 | 126,027 |
| | | | 181,758 |
| Health Care Providers & Services - 0.0% | | | |
| Get Heal, Inc. Series B (a)(e)(f) | | 35,877,127 | 3,197 |
| Mulberry Health, Inc. Series A8 (a)(e)(f) | | 7,960,894 | 50,631 |
| | | | 53,828 |
|
| TOTAL HEALTH CARE | | | 235,586 |
|
| INDUSTRIALS - 0.1% | | | |
| Aerospace & Defense - 0.1% | | | |
| Space Exploration Technologies Corp.: | | | |
| Series G (a)(e)(f) | | 558,215 | 75,359 |
| Series H (e)(f) | | 120,282 | 16,238 |
| | | | 91,597 |
| INFORMATION TECHNOLOGY - 0.5% | | | |
| Internet Software & Services - 0.4% | | | |
| Dropbox, Inc.: | | | |
| Series A (a)(e)(f) | | 1,260,898 | 17,955 |
| Series C (a)(e)(f) | | 698,385 | 10,769 |
| Lyft, Inc. Series H (e)(f) | | 1,553,259 | 61,736 |
| Pinterest, Inc.: | | | |
| Series E, 8.00% (a)(e)(f) | | 54,841,080 | 327,950 |
| Series F, 8.00% (a)(e)(f) | | 3,455,720 | 20,665 |
| Series G, 8.00% (a)(e)(f) | | 4,301,275 | 25,722 |
| Uber Technologies, Inc. Series D, 8.00% (a)(e)(f) | | 2,040,465 | 71,253 |
| | | | 536,050 |
| Software - 0.1% | | | |
| Carbon, Inc. Series D (f) | | 915,425 | 21,376 |
| Cloudflare, Inc. Series D 8.00% (a)(e)(f) | | 4,303,714 | 23,627 |
| Delphix Corp. Series D (a)(e)(f) | | 3,712,687 | 20,865 |
| | | | 65,868 |
|
| TOTAL INFORMATION TECHNOLOGY | | | 601,918 |
|
| REAL ESTATE - 0.2% | | | |
| Real Estate Management & Development - 0.2% | | | |
| WeWork Companies, Inc.: | | | |
| Series E (a)(e)(f) | | 5,464,465 | 283,114 |
| Series F (a)(e)(f) | | 253,732 | 13,146 |
| | | | 296,260 |
| TELECOMMUNICATION SERVICES - 0.0% | | | |
| Wireless Telecommunication Services - 0.0% | | | |
| Altiostar Networks, Inc. Series A1 (e)(f) | | 2,124,227 | 3,314 |
| TOTAL CONVERTIBLE PREFERRED STOCKS | | | |
| (Cost $945,661) | | | 1,385,734 |
| | | Principal Amount (000s) | Value (000s) |
|
| Corporate Bonds - 0.1% | | | |
| Convertible Bonds - 0.0% | | | |
| INFORMATION TECHNOLOGY - 0.0% | | | |
| Software - 0.0% | | | |
| Trion World, Inc. 10% 10/10/19 pay-in-kind (e)(f)(h) | | 1,956 | 773 |
| Nonconvertible Bonds - 0.1% | | | |
| HEALTH CARE - 0.1% | | | |
| Pharmaceuticals - 0.1% | | | |
| Valeant Pharmaceuticals International, Inc.: | | | |
| 6.125% 4/15/25 (c) | | 72,660 | 66,484 |
| 9% 12/15/25 (c) | | 81,146 | 84,570 |
| | | | 151,054 |
| TOTAL CORPORATE BONDS | | | |
| (Cost $147,201) | | | 151,827 |
| | | Shares | Value (000s) |
|
| Money Market Funds - 1.7% | | | |
| Fidelity Cash Central Fund, 1.36% (i) | | 1,796,125,900 | 1,796,485 |
| Fidelity Securities Lending Cash Central Fund 1.36% (i)(j) | | 221,910,908 | 221,955 |
| TOTAL MONEY MARKET FUNDS | | | |
| (Cost $2,018,405) | | | 2,018,440 |
| TOTAL INVESTMENT IN SECURITIES - 100.5% | | | |
| (Cost $61,242,052) | | | 123,171,722 |
| NET OTHER ASSETS (LIABILITIES) - (0.5)% | | | (598,696) |
| NET ASSETS - 100% | | | $122,573,026 |
Values shown as $0 may reflect amounts less than $500.
Legend
(a) Non-income producing
(b) Security or a portion of the security is on loan at period end.
(c) Security exempt from registration under Rule 144A of the Securities Act of 1933. These securities may be resold in transactions exempt from registration, normally to qualified institutional buyers. At the end of the period, the value of these securities amounted to $413,437,000 or 0.3% of net assets.
(d) Investment is owned by a wholly-owned subsidiary (Subsidiary) that is treated as a corporation for U.S. tax purposes.
(e) Restricted securities - Investment in securities not registered under the Securities Act of 1933 (excluding 144A issues). At the end of the period, the value of restricted securities (excluding 144A issues) amounted to $1,628,180,000 or 1.3% of net assets.
(f) Level 3 security
(g) Affiliated company
(h) Coupon rates for floating and adjustable rate securities reflect the rates in effect at period end.
(i) Affiliated fund that is generally available only to investment companies and other accounts managed by Fidelity Investments. The rate quoted is the annualized seven-day yield of the fund at period end. A complete unaudited listing of the fund's holdings as of its most recent quarter end is available upon request. In addition, each Fidelity Central Fund's financial statements, which are not covered by the Fund's Report of Independent Registered Public Accounting Firm, are available on the SEC's website or upon request.
(j) Investment made with cash collateral received from securities on loan.
Additional information on each restricted holding is as follows:
| Security | Acquisition Date | Acquisition Cost (000s) |
| 23andMe, Inc. Series E | 6/18/15 | $7,200 |
| 23andMe, Inc. Series F | 8/31/17 | $46,498 |
| Airbnb, Inc. Series D | 4/16/14 | $23,565 |
| Airbnb, Inc. Series E | 6/29/15 | $36,200 |
| Altiostar Networks, Inc. Series A1 | 1/10/17 | $9,771 |
| ASAC II LP | 10/10/13 | $3,041 |
| Centennial Resource Development, Inc. Class A | 12/28/16 | $34,037 |
| Cloudflare, Inc. Series D 8.00% | 11/5/14 - 6/24/15 | $26,827 |
| Delphix Corp. Series D | 7/10/15 | $33,414 |
| Dropbox, Inc. Class B | 5/2/12 | $49,445 |
| Dropbox, Inc. Series A | 5/29/12 | $11,410 |
| Dropbox, Inc. Series C | 1/30/14 | $13,340 |
| Get Heal, Inc. Series B | 11/7/16 | $10,944 |
| Handy Technologies, Inc. Series C | 10/14/15 | $20,727 |
| Intarcia Therapeutics, Inc. Series CC | 11/14/12 | $28,629 |
| Lyft, Inc. Series H | 11/22/17 | $61,736 |
| Mulberry Health, Inc. Series A8 | 1/20/16 | $53,774 |
| Pinterest, Inc. Series E, 8.00% | 10/23/13 | $159,376 |
| Pinterest, Inc. Series F, 8.00% | 5/15/14 | $11,739 |
| Pinterest, Inc. Series G, 8.00% | 2/27/15 | $30,879 |
| Roofoods Ltd. Series F | 9/12/17 | $54,666 |
| Space Exploration Technologies Corp. Class A | 10/16/15 - 9/11/17 | $30,689 |
| Space Exploration Technologies Corp. Class C | 9/11/17 | $1,754 |
| Space Exploration Technologies Corp. Series G | 1/20/15 | $43,239 |
| Space Exploration Technologies Corp. Series H | 8/4/17 | $16,238 |
| Tanium, Inc. Class B | 4/21/17 | $14,615 |
| Trion World, Inc. | 8/22/08 - 3/20/13 | $25,151 |
| Trion World, Inc. warrants 10/3/18 | 10/10/13 | $0 |
| Trion World, Inc. 10% 10/10/19 pay-in-kind | 10/10/13 - 10/10/17 | $1,953 |
| TulCo LLC | 8/24/17 - 12/14/17 | $44,039 |
| Uber Technologies, Inc. Series D, 8.00% | 6/6/14 | $31,654 |
| Weinstein Co. Holdings LLC Class A-1 | 10/19/05 | $41,234 |
| WeWork Companies, Inc. Class A | 6/23/15 | $19,969 |
| WeWork Companies, Inc. Series E | 6/23/15 | $179,724 |
| WeWork Companies, Inc. Series F | 12/1/16 | $12,735 |
Affiliated Central Funds
Information regarding fiscal year to date income earned by the Fund from investments in Fidelity Central Funds is as follows:
| Fund | Income earned |
| | (Amounts in thousands) |
| Fidelity Cash Central Fund | $12,254 |
| Fidelity Securities Lending Cash Central Fund | 13,046 |
| Total | $25,300 |
Amounts in the income column in the above table include any capital gain distributions from underlying funds, which are presented in the corresponding line-item in the Statement of Operations if applicable.
Other Affiliated Issuers
An affiliated company is a company in which the Fund has ownership of at least 5% of the voting securities. Fiscal year to date transactions with companies which are or were affiliates are as follows:
| Affiliate (Amounts in thousands) | Value, beginning of period | Purchases | Sales Proceeds* | Dividend Income | Realized Gain (loss) | Change in Unrealized appreciation (depreciation) | Value, end of period |
| Activision Blizzard, Inc. | $1,415,505 | $29,714 | $305,883 | $11,653 | $205,174 | $842,022 | $-- |
| Amphenol Corp. Class A | 1,616,746 | 12,845 | 106,511 | 16,399 | 78,562 | 405,783 | 2,007,425 |
| B2Gold Corp. | 133,433 | -- | 18,167 | -- | 3,230 | 35,276 | 153,772 |
| Birchcliff Energy Ltd. | 154,808 | 9,926 | 15,759 | 1,384 | (4,160) | (71,569) | 73,246 |
| Birchcliff Energy Ltd. | 4,788 | -- | -- | 45 | -- | (2,386) | 2,402 |
| Centennial Resource Development, Inc. Class A | 102,307 | -- | -- | -- | -- | 415 | 102,722 |
| Centennial Resource Development, Inc. Class A | 119,830 | 157,743 | 8,202 | -- | 1,999 | 3,540 | 274,910 |
| Centennial Resource Development, Inc. Class A | 41,547 | -- | -- | -- | -- | 4,803 | 46,350 |
| Ivanhoe Mines Ltd. | 84,945 | 30,762 | 7,412 | -- | 5,923 | 58,694 | 172,912 |
| Ivanhoe Mines Ltd. | 29,259 | -- | 2,331 | -- | (1,156) | 23,955 | 49,727 |
| Metro Bank PLC | 221,999 | 3,541 | 12,833 | -- | 9,282 | 65,808 | 287,797 |
| Mettler-Toledo International, Inc. | 755,194 | 32,460 | 73,514 | -- | 46,598 | 316,929 | 1,077,667 |
| Ultimate Software Group, Inc. | 341,510 | 17,628 | 162,118 | -- | 3,676 | 42,969 | -- |
| Total | $5,021,871 | $294,619 | $712,730 | $29,481 | $349,128 | $1,726,239 | $4,248,930 |
* Includes the value of securities delivered through in-kind transactions, if applicable.
Investment Valuation
The following is a summary of the inputs used, as of December 31, 2017, involving the Fund's assets and liabilities carried at fair value. The inputs or methodology used for valuing securities may not be an indication of the risk associated with investing in those securities. For more information on valuation inputs, and their aggregation into the levels used below, please refer to the Investment Valuation section in the accompanying Notes to Financial Statements.
| | Valuation Inputs at Reporting Date: |
| Description | Total | Level 1 | Level 2 | Level 3 |
| (Amounts in thousands) | | | | |
| Investments in Securities: | | | | |
| Equities: | | | | |
| Consumer Discretionary | $17,294,483 | $16,990,778 | $201,312 | $102,393 |
| Consumer Staples | 3,104,550 | 2,974,532 | 75,352 | 54,666 |
| Energy | 2,713,774 | 2,713,774 | -- | -- |
| Financials | 23,115,517 | 23,115,517 | -- | -- |
| Health Care | 11,194,287 | 10,958,701 | -- | 235,586 |
| Industrials | 8,504,304 | 8,327,011 | -- | 177,293 |
| Information Technology | 50,960,560 | 49,755,050 | 504,046 | 701,464 |
| Materials | 3,214,654 | 3,214,654 | -- | -- |
| Real Estate | 491,790 | 164,073 | -- | 327,717 |
| Telecommunication Services | 407,536 | 352,326 | 51,896 | 3,314 |
| Corporate Bonds | 151,827 | -- | 151,054 | 773 |
| Money Market Funds | 2,018,440 | 2,018,440 | -- | -- |
| Total Investments in Securities: | $123,171,722 | $120,584,856 | $983,660 | $1,603,206 |
The following is a reconciliation of Investments in Securities for which Level 3 inputs were used in determining value:
| (Amounts in thousands) | |
| Investments in Securities: | |
| Beginning Balance | $1,782,615 |
| Net Realized Gain (Loss) on Investment Securities | 25,264 |
| Net Unrealized Gain (Loss) on Investment Securities | (240,419) |
| Cost of Purchases | 283,771 |
| Proceeds of Sales | (219,215) |
| Amortization/Accretion | -- |
| Transfers into Level 3 | -- |
| Transfers out of Level 3 | (28,810) |
| Ending Balance | $1,603,206 |
| The change in unrealized gain (loss) for the period attributable to Level 3 securities held at December 31, 2017 | $(242,813) |
The information used in the above reconciliations represents fiscal year to date activity for any Investments in Securities identified as using Level 3 inputs at either the beginning or the end of the current fiscal period. Transfers in or out of Level 3 represent the beginning value of any Security or Instrument where a change in the pricing level occurred from the beginning to the end of the period. The cost of purchases and the proceeds of sales may include securities received or delivered through corporate actions or exchanges. Realized and unrealized gains (losses) disclosed in the reconciliations are included in Net Gain (Loss) on the Fund's Statement of Operations.
See accompanying notes which are an integral part of the financial statements.
Financial Statements
Statement of Assets and Liabilities
| Amounts in thousands (except per-share amounts) | | December 31, 2017 |
| Assets | | |
Investment in securities, at value (including securities loaned of $215,126) — See accompanying schedule:
Unaffiliated issuers (cost $57,544,676) | $116,904,352 | |
| Fidelity Central Funds (cost $2,018,405) | 2,018,440 | |
| Other affiliated issuers (cost $1,678,971) | 4,248,930 | |
| Total Investment in Securities (cost $61,242,052) | | $123,171,722 |
| Receivable for investments sold | | 1,003,585 |
| Receivable for fund shares sold | | 92,976 |
| Dividends receivable | | 36,680 |
| Interest receivable | | 1,248 |
| Distributions receivable from Fidelity Central Funds | | 2,626 |
| Prepaid expenses | | 198 |
| Other receivables | | 5,184 |
| Total assets | | 124,314,219 |
| Liabilities | | |
| Payable for investments purchased | $216,149 | |
| Payable for fund shares redeemed | 1,204,690 | |
| Accrued management fee | 69,259 | |
| Other affiliated payables | 11,773 | |
| Other payables and accrued expenses | 17,533 | |
| Collateral on securities loaned | 221,789 | |
| Total liabilities | | 1,741,193 |
| Net Assets | | $122,573,026 |
| Net Assets consist of: | | |
| Paid in capital | | $59,140,983 |
| Distributions in excess of net investment income | | (4,720) |
| Accumulated undistributed net realized gain (loss) on investments and foreign currency transactions | | 1,519,073 |
| Net unrealized appreciation (depreciation) on investments and assets and liabilities in foreign currencies | | 61,917,690 |
| Net Assets | | $122,573,026 |
| Contrafund: | | |
| Net Asset Value, offering price and redemption price per share ($89,874,001 ÷ 734,146 shares) | | $122.42 |
| Class K: | | |
| Net Asset Value, offering price and redemption price per share ($32,699,025 ÷ 267,265 shares) | | $122.35 |
See accompanying notes which are an integral part of the financial statements.
Statement of Operations
| Amounts in thousands | | Year ended December 31, 2017 |
| Investment Income | | |
| Dividends (including $29,481 earned from other affiliated issuers) | | $915,431 |
| Interest | | 1,658 |
| Income from Fidelity Central Funds | | 25,300 |
| Total income | | 942,389 |
| Expenses | | |
| Management fee | | |
| Basic fee | $622,082 | |
| Performance adjustment | 61,407 | |
| Transfer agent fees | 129,499 | |
| Accounting and security lending fees | 3,723 | |
| Custodian fees and expenses | 1,916 | |
| Independent trustees' fees and expenses | 448 | |
| Appreciation in deferred trustee compensation account | 5 | |
| Registration fees | 582 | |
| Audit | 241 | |
| Legal | 280 | |
| Interest | 17 | |
| Miscellaneous | 987 | |
| Total expenses before reductions | 821,187 | |
| Expense reductions | (2,631) | 818,556 |
| Net investment income (loss) | | 123,833 |
| Realized and Unrealized Gain (Loss) | | |
| Net realized gain (loss) on: | | |
| Investment securities: | | |
| Unaffiliated issuers | 11,047,559 | |
| Redemptions in-kind with affiliated entities | 960,358 | |
| Fidelity Central Funds | 52 | |
| Other affiliated issuers | 349,128 | |
| Foreign currency transactions | (834) | |
| Total net realized gain (loss) | | 12,356,263 |
| Change in net unrealized appreciation (depreciation) on: | | |
| Unaffiliated issuers (net of increase in deferred foreign taxes of $12,132) | 17,222,225 | |
| Fidelity Central Funds | 3 | |
| Other affiliated issuers | 1,726,239 | |
| Assets and liabilities in foreign currencies | 205 | |
| Total change in net unrealized appreciation (depreciation) | | 18,948,672 |
| Net gain (loss) | | 31,304,935 |
| Net increase (decrease) in net assets resulting from operations | | $31,428,768 |
See accompanying notes which are an integral part of the financial statements.
Statement of Changes in Net Assets
| Amounts in thousands | Year ended December 31, 2017 | Year ended December 31, 2016 |
| Increase (Decrease) in Net Assets | | |
| Operations | | |
| Net investment income (loss) | $123,833 | $338,180 |
| Net realized gain (loss) | 12,356,263 | 5,749,130 |
| Change in net unrealized appreciation (depreciation) | 18,948,672 | (2,528,496) |
| Net increase (decrease) in net assets resulting from operations | 31,428,768 | 3,558,814 |
| Distributions to shareholders from net investment income | (144,165) | (330,490) |
| Distributions to shareholders from net realized gain | (7,201,343) | (3,609,095) |
| Total distributions | (7,345,508) | (3,939,585) |
| Share transactions - net increase (decrease) | (3,575,375) | (6,837,671) |
| Total increase (decrease) in net assets | 20,507,885 | (7,218,442) |
| Net Assets | | |
| Beginning of period | 102,065,141 | 109,283,583 |
| End of period | $122,573,026 | $102,065,141 |
| Other Information | | |
| Undistributed net investment income end of period | $– | $11,928 |
| Distributions in excess of net investment income end of period | $(4,720) | $– |
See accompanying notes which are an integral part of the financial statements.
Financial Highlights
Fidelity Contrafund
| Years ended December 31, | 2017 | 2016 | 2015 | 2014 | 2013 |
| Selected Per–Share Data | | | | | |
| Net asset value, beginning of period | $98.45 | $98.92 | $97.97 | $96.14 | $77.57 |
| Income from Investment Operations | | | | | |
| Net investment income (loss)A | .10 | .29 | .33 | .30 | .33 |
| Net realized and unrealized gain (loss) | 31.42 | 2.99 | 5.89 | 8.67 | 25.70 |
| Total from investment operations | 31.52 | 3.28 | 6.22 | 8.97 | 26.03 |
| Distributions from net investment income | (.12) | (.29) | (.31) | (.25) | (.13) |
| Distributions from net realized gain | (7.43) | (3.46) | (4.96) | (6.89) | (7.33) |
| Total distributions | (7.55) | (3.75) | (5.27) | (7.14) | (7.46) |
| Net asset value, end of period | $122.42 | $98.45 | $98.92 | $97.97 | $96.14 |
| Total ReturnB | 32.21% | 3.36% | 6.46% | 9.56% | 34.15% |
| Ratios to Average Net AssetsC,D | | | | | |
| Expenses before reductions | .74% | .68% | .71% | .64% | .67% |
| Expenses net of fee waivers, if any | .74% | .68% | .71% | .64% | .67% |
| Expenses net of all reductions | .74% | .68% | .70% | .64% | .66% |
| Net investment income (loss) | .08% | .29% | .33% | .31% | .37% |
| Supplemental Data | | | | | |
| Net assets, end of period (in millions) | $89,874 | $73,035 | $77,724 | $75,057 | $74,962 |
| Portfolio turnover rateE | 29%F | 41%F | 35%F | 45%F | 46% |
A Calculated based on average shares outstanding during the period.
B Total returns would have been lower if certain expenses had not been reduced during the applicable periods shown.
C Fees and expenses of any underlying Fidelity Central Funds are not included in the Fund's expense ratio. The Fund indirectly bears its proportionate share of the expenses of any underlying Fidelity Central Funds.
D Expense ratios reflect operating expenses of the class. Expenses before reductions do not reflect amounts reimbursed by the investment adviser or reductions from brokerage service arrangements or reductions from other expense offset arrangements and do not represent the amount paid by the class during periods when reimbursements or reductions occur. Expenses net of fee waivers reflect expenses after reimbursement by the investment adviser but prior to reductions from brokerage service arrangements or other expense offset arrangements. Expenses net of all reductions represent the net expenses paid by the class.
E Amount does not include the portfolio activity of any underlying Fidelity Central Funds.
F Portfolio turnover rate excludes securities received or delivered in-kind.
See accompanying notes which are an integral part of the financial statements.
Fidelity Contrafund Class K
| Years ended December 31, | 2017 | 2016 | 2015 | 2014 | 2013 |
| Selected Per–Share Data | | | | | |
| Net asset value, beginning of period | $98.38 | $98.84 | $97.90 | $96.07 | $77.51 |
| Income from Investment Operations | | | | | |
| Net investment income (loss)A | .20 | .38 | .43 | .40 | .42 |
| Net realized and unrealized gain (loss) | 31.43 | 3.01 | 5.88 | 8.68 | 25.70 |
| Total from investment operations | 31.63 | 3.39 | 6.31 | 9.08 | 26.12 |
| Distributions from net investment income | (.23) | (.39) | (.41) | (.36) | (.23) |
| Distributions from net realized gain | (7.43) | (3.46) | (4.96) | (6.89) | (7.33) |
| Total distributions | (7.66) | (3.85) | (5.37) | (7.25) | (7.56) |
| Net asset value, end of period | $122.35 | $98.38 | $98.84 | $97.90 | $96.07 |
| Total ReturnB | 32.34% | 3.48% | 6.55% | 9.68% | 34.30% |
| Ratios to Average Net AssetsC,D | | | | | |
| Expenses before reductions | .65% | .58% | .61% | .54% | .56% |
| Expenses net of fee waivers, if any | .65% | .58% | .61% | .54% | .56% |
| Expenses net of all reductions | .65% | .58% | .61% | .54% | .56% |
| Net investment income (loss) | .17% | .39% | .43% | .41% | .48% |
| Supplemental Data | | | | | |
| Net assets, end of period (in millions) | $32,699 | $29,031 | $31,560 | $34,479 | $35,982 |
| Portfolio turnover rateE | 29%F | 41%F | 35%F | 45%F | 46% |
A Calculated based on average shares outstanding during the period.
B Total returns would have been lower if certain expenses had not been reduced during the applicable periods shown.
C Fees and expenses of any underlying Fidelity Central Funds are not included in the Fund's expense ratio. The Fund indirectly bears its proportionate share of the expenses of any underlying Fidelity Central Funds.
D Expense ratios reflect operating expenses of the class. Expenses before reductions do not reflect amounts reimbursed by the investment adviser or reductions from brokerage service arrangements or reductions from other expense offset arrangements and do not represent the amount paid by the class during periods when reimbursements or reductions occur. Expenses net of fee waivers reflect expenses after reimbursement by the investment adviser but prior to reductions from brokerage service arrangements or other expense offset arrangements. Expenses net of all reductions represent the net expenses paid by the class.
E Amount does not include the portfolio activity of any underlying Fidelity Central Funds.
F Portfolio turnover rate excludes securities received or delivered in-kind.
See accompanying notes which are an integral part of the financial statements.
Notes to Financial Statements
For the period ended December 31, 2017
(Amounts in thousands except percentages)
1. Organization.
Fidelity Contrafund (the Fund) is a fund of Fidelity Contrafund (the Trust) and is authorized to issue an unlimited number of shares. The Trust is registered under the Investment Company Act of 1940, as amended (the 1940 Act), as an open-end management investment company organized as a Massachusetts business trust. The Fund offers Contrafund and Class K, shares, each of which has equal rights as to assets and voting privileges. Each class has exclusive voting rights with respect to matters that affect that class.
2. Investments in Fidelity Central Funds.
The Fund invests in Fidelity Central Funds, which are open-end investment companies generally available only to other investment companies and accounts managed by the investment adviser and its affiliates. The Fund's Schedule of Investments lists each of the Fidelity Central Funds held as of period end, if any, as an investment of the Fund, but does not include the underlying holdings of each Fidelity Central Fund. As an Investing Fund, the Fund indirectly bears its proportionate share of the expenses of the underlying Fidelity Central Funds.
The Money Market Central Funds seek preservation of capital and current income and are managed by Fidelity Investments Money Management, Inc. (FIMM), an affiliate of the investment adviser. Annualized expenses of the Money Market Central Funds as of their most recent shareholder report date are less than .005%.
A complete unaudited list of holdings for each Fidelity Central Fund is available upon request or at the Securities and Exchange Commission (the SEC) website at www.sec.gov. In addition, the financial statements of the Fidelity Central Funds, which are not covered by the Fund's Report of Independent Registered Public Accounting Firm, are available on the SEC website or upon request.
3. Significant Accounting Policies.
The Fund is an investment company and applies the accounting and reporting guidance of the Financial Accounting Standards Board (FASB) Accounting Standards Codification Topic 946 Financial Services – Investments Companies. The financial statements have been prepared in conformity with accounting principles generally accepted in the United States of America (GAAP), which require management to make certain estimates and assumptions at the date of the financial statements. Actual results could differ from those estimates. Subsequent events, if any, through the date that the financial statements were issued have been evaluated in the preparation of the financial statements. The following summarizes the significant accounting policies of the Fund:
Investment Valuation. Investments are valued as of 4:00 p.m. Eastern time on the last calendar day of the period. The Board of Trustees (the Board) has delegated the day to day responsibility for the valuation of the Fund's investments to the Fair Value Committee (the Committee) established by the Fund's investment adviser. In accordance with valuation policies and procedures approved by the Board, the Fund attempts to obtain prices from one or more third party pricing vendors or brokers to value its investments. When current market prices, quotations or currency exchange rates are not readily available or reliable, investments will be fair valued in good faith by the Committee, in accordance with procedures adopted by the Board. Factors used in determining fair value vary by investment type and may include market or investment specific events, changes in interest rates and credit quality. The frequency with which these procedures are used cannot be predicted and they may be utilized to a significant extent. The Committee oversees the Fund's valuation policies and procedures and reports to the Board on the Committee's activities and fair value determinations. The Board monitors the appropriateness of the procedures used in valuing the Fund's investments and ratifies the fair value determinations of the Committee.
The Fund categorizes the inputs to valuation techniques used to value its investments into a disclosure hierarchy consisting of three levels as shown below:
- Level 1 – quoted prices in active markets for identical investments
- Level 2 – other significant observable inputs (including quoted prices for similar investments, interest rates, prepayment speeds, etc.)
- Level 3 – unobservable inputs (including the Fund's own assumptions based on the best information available)
Valuation techniques used to value the Fund's investments by major category are as follows:
Equity securities, including restricted securities, for which market quotations are readily available, are valued at the last reported sale price or official closing price as reported by a third party pricing vendor on the primary market or exchange on which they are traded and are categorized as Level 1 in the hierarchy. In the event there were no sales during the day or closing prices are not available, securities are valued at the last quoted bid price or may be valued using the last available price and are generally categorized as Level 2 in the hierarchy. For foreign equity securities, when market or security specific events arise, comparisons to the valuation of American Depositary Receipts (ADRs), futures contracts, Exchange-Traded Funds (ETFs) and certain indexes as well as quoted prices for similar securities may be used and would be categorized as Level 2 in the hierarchy. Utilizing these techniques may result in transfers between Level 1 and Level 2. For equity securities, including restricted securities, where observable inputs are limited, assumptions about market activity and risk are used and these securities may be categorized as Level 3 in the hierarchy. Equity securities, including restricted securities, for which observable inputs are not available are valued using alternate valuation approaches, including the market approach and the income approach and are categorized as Level 3 in the hierarchy. The market approach generally consists of using comparable market transactions while the income approach generally consists of using the net present value of estimated future cash flows, adjusted as appropriate for liquidity, credit, market and/or other risk factors.
Debt securities, including restricted securities, are valued based on evaluated prices received from third party pricing vendors or from brokers who make markets in such securities. Corporate bonds are valued by pricing vendors who utilize matrix pricing which considers yield or price of bonds of comparable quality, coupon, maturity and type or by broker-supplied prices. When independent prices are unavailable or unreliable, debt securities may be valued utilizing pricing methodologies which consider similar factors that would be used by third party pricing vendors. Debt securities are generally categorized as Level 2 in the hierarchy but may be Level 3 depending on the circumstances.
Investments in open-end mutual funds, including the Fidelity Central Funds, are valued at their closing net asset value (NAV) each business day and are categorized as Level 1 in the hierarchy.
The following provides information on Level 3 securities held by the Fund that were valued at period end based on unobservable inputs. These amounts exclude valuations provided by a broker.
| Asset Type | Fair Value | Valuation Technique (s) | Unobservable Input | Amount or Range / Weighted Average | Impact to Valuation from an Increase in Input(a) |
| Corporate Bonds | $773 | Recovery value | Recovery value | 39.5% | Increase |
| Equities | 1,602,433 | Market comparable | Enterprise value/Sales multiple (EV/S) | 0.8 - 13.1 / 6.4 | Increase |
| | | | Transaction price | $60.00 | Increase |
| | | | Discount rate | 28.0% | Decrease |
| | | | Discount for lack of marketability | 15.0% - 25.0% / 17.8% | Decrease |
| | | | Liquidity preference | $4.84 - $19.10 / $11.24 | Increase |
| | | | Premium rate | 7.5% - 108.0% / 65.2% | Increase |
| | | Market approach | Transaction price | $1.56 - $353.57 / $83.83 | Increase |
| | | Recovery value | Recovery value | 0.0% - 0.2% / 0.2% | Increase |
| | | Discount cash flow | Discount rate | 9.0% | Decrease |
| | | | Discount for lack of marketability | 20.0% | Decrease |
| | | | Growth rate | 3.0% | Increase |
(a) Represents the expected directional change in the fair value of the Level 3 investments that would result from an increase in the corresponding input. A decrease to the unobservable input would have the opposite effect. Significant changes in these inputs could result in significantly higher or lower fair value measurements.
Changes in valuation techniques may result in transfers in or out of an assigned level within the disclosure hierarchy. The aggregate value of investments by input level as of December 31, 2017, as well as a roll forward of Level 3 investments, is included at the end of the Fund's Schedule of Investments.
Foreign Currency. The Fund may use foreign currency contracts to facilitate transactions in foreign-denominated securities. Gains and losses from these transactions may arise from changes in the value of the foreign currency or if the counterparties do not perform under the contracts' terms.
Foreign-denominated assets, including investment securities, and liabilities are translated into U.S. dollars at the exchange rates at period end. Purchases and sales of investment securities, income and dividends received and expenses denominated in foreign currencies are translated into U.S. dollars at the exchange rate in effect on the transaction date.
The effects of exchange rate fluctuations on investments are included with the net realized and unrealized gain (loss) on investment securities. Other foreign currency transactions resulting in realized and unrealized gain (loss) are disclosed separately.
Investment Transactions and Income. For financial reporting purposes, the Fund's investment holdings and NAV include trades executed through the end of the last business day of the period. The NAV per share for processing shareholder transactions is calculated as of the close of business of the New York Stock Exchange (NYSE), normally 4:00 p.m. Eastern time and includes trades executed through the end of the prior business day. Gains and losses on securities sold are determined on the basis of identified cost and includes proceeds received from litigation. Dividend income is recorded on the ex-dividend date, except for certain dividends from foreign securities where the ex-dividend date may have passed, which are recorded as soon as the Fund is informed of the ex-dividend date. Non-cash dividends included in dividend income, if any, are recorded at the fair market value of the securities received. Income and capital gain distributions from Fidelity Central Funds, if any, are recorded on the ex-dividend date. Certain distributions received by the Fund represent a return of capital or capital gain. The Fund determines the components of these distributions subsequent to the ex-dividend date, based upon receipt of tax filings or other correspondence relating to the underlying investment. These distributions are recorded as a reduction of cost of investments and/or as a realized gain. Interest income is accrued as earned and includes coupon interest and amortization of premium and accretion of discount on debt securities as applicable. Paid in Kind (PIK) income is recorded at the fair market value of the securities received. Investment income is recorded net of foreign taxes withheld where recovery of such taxes is uncertain.
Class Allocations and Expenses. Investment income, realized and unrealized capital gains and losses, common expenses of the Fund, and certain fund-level expense reductions, if any, are allocated daily on a pro-rata basis to each class based on the relative net assets of each class to the total net assets of the Fund. Each class differs with respect to transfer agent fees incurred. Certain expense reductions may also differ by class. For the reporting period, the allocated portion of income and expenses to each class as a percent of its average net assets may vary due to the timing of recording these transactions in relation to fluctuating net assets of the classes. Expenses directly attributable to a fund are charged to that fund. Expenses attributable to more than one fund are allocated among the respective funds on the basis of relative net assets or other appropriate methods. Expense estimates are accrued in the period to which they relate and adjustments are made when actual amounts are known.
Deferred Trustee Compensation. Under a Deferred Compensation Plan (the Plan), independent Trustees may elect to defer receipt of a portion of their annual compensation. Deferred amounts are invested in a cross-section of Fidelity funds, are marked-to-market and remain in the Fund until distributed in accordance with the Plan. The investment of deferred amounts and the offsetting payable to the Trustees are included in the accompanying Statement of Assets and Liabilities.
Income Tax Information and Distributions to Shareholders. Each year, the Fund intends to qualify as a regulated investment company under Subchapter M of the Internal Revenue Code, including distributing substantially all of its taxable income and realized gains. As a result, no provision for U.S. Federal income taxes is required. As of December 31, 2017, the Fund did not have any unrecognized tax benefits in the financial statements; nor is the Fund aware of any tax positions for which it is reasonably possible that the total amounts of unrecognized tax benefits will significantly change in the next twelve months. The Fund files a U.S. federal tax return, in addition to state and local tax returns as required. The Fund's federal income tax returns are subject to examination by the Internal Revenue Service (IRS) for a period of three fiscal years after they are filed. State and local tax returns may be subject to examination for an additional fiscal year depending on the jurisdiction. Foreign taxes are provided for based on the Fund's understanding of the tax rules and rates that exist in the foreign markets in which it invests. The Fund is subject to a tax imposed on capital gains by certain countries in which it invests. An estimated deferred tax liability for net unrealized appreciation on the applicable securities is included in Other payables and accrued expenses on the Statement of Assets & Liabilities.
Distributions are declared and recorded on the ex-dividend date. Income dividends and capital gain distributions are declared separately for each class. Income and capital gain distributions are determined in accordance with income tax regulations, which may differ from GAAP. In addition, the Fund claimed a portion of the payment made to redeeming shareholders as a distribution for income tax purposes.
Capital accounts within the financial statements are adjusted for permanent book-tax differences. These adjustments have no impact on net assets or the results of operations. Capital accounts are not adjusted for temporary book-tax differences which will reverse in a subsequent period.
Book-tax differences are primarily due to foreign currency transactions, passive foreign investment companies (PFIC), market discount, redemptions in kind, partnerships, deferred trustees compensation and losses deferred due to wash sales.
As of period end, the cost and unrealized appreciation (depreciation) in securities, and derivatives if applicable, for federal income tax purposes were as follows:
| Gross unrealized appreciation | $62,179,558 |
| Gross unrealized depreciation | (577,254) |
| Net unrealized appreciation (depreciation) | $61,602,304 |
| Tax Cost | $61,569,418 |
The tax-based components of distributable earnings as of period end were as follows:
| Undistributed long-term capital gain | $1,846,495 |
| Net unrealized appreciation (depreciation) on securities and other investments | $61,602,486 |
The tax character of distributions paid was as follows:
| | December 31, 2017 | December 31, 2016 |
| Ordinary Income | $144,165 | $ 330,490 |
| Long-term Capital Gains | 7,201,343 | 3,609,095 |
| Total | $7,345,508 | $ 3,939,585 |
Restricted Securities. The Fund may invest in securities that are subject to legal or contractual restrictions on resale. These securities generally may be resold in transactions exempt from registration or to the public if the securities are registered. Disposal of these securities may involve time-consuming negotiations and expense, and prompt sale at an acceptable price may be difficult. Information regarding restricted securities is included at the end of the Fund's Schedule of Investments.
Consolidated Subsidiary. The Fund invests in certain investments through a wholly-owned subsidiary ("Subsidiary"), which may be subject to federal and state taxes upon disposition.
As of period end, the Fund held an investment of $44,039 in these Subsidiaries, representing .04% of the Fund's net assets. The financial statements have been consolidated and include accounts of the Fund and each Subsidiary. Accordingly, all inter-company transactions and balances have been eliminated.
4. Purchases and Sales of Investments.
Purchases and sales of securities, other than short-term securities and in-kind transactions, aggregated $33,205,350 and $39,923,192, respectively.
Redemptions In-Kind. During the period, 34,843 shares of the Fund held by unaffiliated entities were redeemed in-kind for investments and cash with a value of $3,859,301. The net realized gain of $2,473,373 on investments delivered through in-kind redemptions is included in the accompanying Statement of Operations. The amount of the in-kind redemptions is included in share transactions in the accompanying Statement of Changes in Net Assets as well as the Notes to Financial Statements. The Fund recognized no gain or loss for federal income tax purposes.
Prior Fiscal Year Redemptions In-Kind. During the prior period, 32,360 shares of the Fund held by unaffiliated entities were redeemed in-kind for investments and cash, including accrued interest, with a value of $3,198,227. The Fund had a net realized gain of $1,930,771 on investments delivered through the in-kind redemptions. The amount of the in-kind redemptions is included in share transactions in the accompanying Statement of Changes in Net Assets as well as the Notes to Financial Statements. The Fund recognized no gain or loss for federal income tax purposes.
5. Fees and Other Transactions with Affiliates.
Management Fee. Fidelity Management & Research Company (the investment adviser) and its affiliates provide the Fund with investment management related services for which the Fund pays a monthly management fee. The management fee is the sum of an individual fund fee rate that is based on an annual rate of .30% of the Fund's average net assets and an annualized group fee rate that averaged .24% during the period. The group fee rate is based upon the average net assets of all the mutual funds advised by the investment adviser, including any mutual funds previously advised by the investment adviser that are currently advised by Fidelity SelectCo, LLC, an affiliate of the investment adviser. The group fee rate decreases as assets under management increase and increases as assets under management decrease. In addition, the management fee is subject to a performance adjustment (up to a maximum of +/- .20% of the Fund's average net assets over a 36 month performance period). The upward or downward adjustment to the management fee is based on the relative investment performance of Contrafund as compared to its benchmark index, the S&P 500 Index, over the same 36 month performance period. For the reporting period, the total annual management fee rate, including the performance adjustment, was .60% of the Fund's average net assets. The performance adjustment included in the management fee rate may be higher or lower than the maximum performance adjustment rate due to the difference between the average net assets for the reporting and performance periods.
Transfer Agent Fees. Fidelity Investments Institutional Operations Company, Inc., (FIIOC), an affiliate of the investment adviser, is the transfer, dividend disbursing and shareholder servicing agent for each class of the Fund. FIIOC receives account fees and asset-based fees that vary according to the account size and type of account of the shareholders of Contrafund, except for Class K. FIIOC receives an asset-based fee of Class K's average net assets. FIIOC pays for typesetting, printing and mailing of shareholder reports, except proxy statements.
For the period, transfer agent fees for each class were as follows:
| | Amount | % of
Class-Level Average
Net Assets |
| Contrafund | $114,650 | .14 |
| Class K | 14,849 | .05 |
| | $129,499 | |
Accounting and Security Lending Fees. Fidelity Service Company, Inc. (FSC), an affiliate of the investment adviser, maintains the Fund's accounting records. The accounting fee is based on the level of average net assets for each month. Under a separate contract, FSC administers the security lending program. The security lending fee is based on the number and duration of lending transactions.
Brokerage Commissions. The Fund placed a portion of its portfolio transactions with brokerage firms which are affiliates of the investment adviser. Brokerage commissions are included in net realized gain (loss) and change in net unrealized appreciation (depreciation) in the Statement of Operations. The commissions paid to these affiliated firms were $904 for the period.
Interfund Lending Program. Pursuant to an Exemptive Order issued by the SEC, the Fund, along with other registered investment companies having management contracts with Fidelity Management & Research Company (FMR) or other affiliated entities of FMR, may participate in an interfund lending program. This program provides an alternative credit facility allowing the funds to borrow from, or lend money to, other participating affiliated funds. At period end, there were no interfund loans outstanding. The Fund's activity in this program during the period for which loans were outstanding was as follows:
| Borrower or Lender | Average Loan Balance | Weighted Average Interest Rate | Interest Expense |
| Borrower | $66,006 | .83% | $15 |
Interfund Trades. The Fund may purchase from or sell securities to other Fidelity Funds under procedures adopted by the Board. The procedures have been designed to ensure these interfund trades are executed in accordance with Rule 17a-7 of the 1940 Act. Interfund trades are included within the respective purchases and sales amounts shown in the Purchases and Sales of Investments note.
Redemptions In-Kind. During the period, 12,089 shares of the Fund held by an affiliated entity were redeemed in-kind for investments and cash with a value of $1,457,574. The net realized gain of $960,358 on investments delivered through in-kind redemptions is included in the accompanying Statement of Operations. The amount of the in-kind redemptions is included in share transactions in the accompanying Statement of Changes in Net Assets as well as the Notes to Financial Statements. The Fund recognized no gain or loss for federal income tax purposes.
6. Committed Line of Credit.
The Fund participates with other funds managed by the investment adviser or an affiliate in a $4.25 billion credit facility (the "line of credit") to be utilized for temporary or emergency purposes to fund shareholder redemptions or for other short-term liquidity purposes. The Fund has agreed to pay commitment fees on its pro-rata portion of the line of credit, which amounted to $351 and is reflected in Miscellaneous expenses on the Statement of Operations. During the period, the Fund did not borrow on this line of credit.
7. Security Lending.
The Fund lends portfolio securities through a lending agent from time to time in order to earn additional income. For equity securities, a lending agent is used and may loan securities to certain qualified borrowers, including Fidelity Capital Markets (FCM), a broker-dealer affiliated with the Fund. On the settlement date of the loan, the Fund receives collateral (in the form of U.S. Treasury obligations, letters of credit and/or cash) against the loaned securities and maintains collateral in an amount not less than 100% of the market value of the loaned securities during the period of the loan. The market value of the loaned securities is determined at the close of business of the Fund and any additional required collateral is delivered to the Fund on the next business day. The Fund or borrower may terminate the loan at any time, and if the borrower defaults on its obligation to return the securities loaned because of insolvency or other reasons, the Fund may apply collateral received from the borrower against the obligation. The Fund may experience delays and costs in recovering the securities loaned. Any cash collateral received is invested in the Fidelity Securities Lending Cash Central Fund. The value of loaned securities and cash collateral at period end are disclosed on the Fund's Statement of Assets and Liabilities. The value of securities loaned to FCM at period end was $10,928. Security lending income represents the income earned on investing cash collateral, less rebates paid to borrowers and any lending agent fees associated with the loan, plus any premium payments received for lending certain types of securities. Security lending income is presented in the Statement of Operations as a component of income from Fidelity Central Funds. Total security lending income during the period amounted to $13,046, including $211 from securities loaned to FCM.
8. Bank Borrowings.
The Fund is permitted to have bank borrowings for temporary or emergency purposes to fund shareholder redemptions or for other short-term liquidity requirements. The Fund has established borrowing arrangements with certain banks. The interest rate on the borrowings is the bank's base rate, as revised from time to time. The average loan balance during the period for which loans were outstanding amounted to $40,835. The weighted average interest rate was 1.16%. The interest expense amounted to $2 under the bank borrowing program. At period end, there were no bank borrowings outstanding.
9. Expense Reductions.
Commissions paid to certain brokers with whom the investment adviser, or its affiliates, places trades on behalf of the Fund include an amount in addition to trade execution, which may be rebated back to the Fund to offset certain expenses. This amount totaled $1,682 for the period. In addition, through arrangements with the Fund's custodian, credits realized as a result of certain uninvested cash balances were used to reduce the Fund's expenses. During the period, these credits reduced the Fund's custody expenses by $8.
In addition, during the period the investment adviser reimbursed and/or waived a portion of fund-level operating expenses in the amount of $941.
10. Distributions to Shareholders.
Distributions to shareholders of each class were as follows:
| | Year ended December 31, 2017 | Year ended December 31, 2016 |
| From net investment income | | |
| Contrafund | $84,830 | $214,155 |
| Class K | 59,335 | 116,335 |
| Total | $144,165 | $330,490 |
| From net realized gain | | |
| Contrafund | $5,246,866 | $2,569,613 |
| Class K | 1,954,477 | 1,039,482 |
| Total | $7,201,343 | $3,609,095 |
11. Share Transactions.
Share transactions for each class were as follows and may contain automatic conversions between classes or exchanges between affiliated funds:
| | Shares | Shares | Dollars | Dollars |
| | Year ended December 31, 2017 | Year ended December 31, 2016 | Year ended December 31, 2017 | Year ended December 31, 2016 |
| Contrafund | | | | |
| Shares sold | 71,526 | 78,941 | $8,237,249 | $7,647,980 |
| Reinvestment of distributions | 42,081 | 27,050 | 5,053,714 | 2,642,747 |
| Shares redeemed | (121,285)(a) | (149,912)(b) | (13,776,639)(a) | (14,712,987)(b) |
| Net increase (decrease) | (7,678) | (43,921) | $(485,676) | $(4,422,260) |
| Class K | | | | |
| Shares sold | 43,515 | 52,783 | $4,990,930 | $5,115,103 |
| Reinvestment of distributions | 16,789 | 11,835 | 2,013,806 | 1,155,817 |
| Shares redeemed | (88,136)(a) | (88,812)(b) | (10,094,435)(a) | (8,686,331)(b) |
| Net increase (decrease) | (27,832) | (24,194) | $(3,089,699) | $(2,415,411) |
(a) Amount includes in-kind redemptions (see the Redemptions In-Kind note for additional details).
(b) Amount includes in-kind redemptions (see the Prior Fiscal Year Redemptions In-Kind note for additional details).
12. Other.
The Fund's organizational documents provide former and current trustees and officers with a limited indemnification against liabilities arising in connection with the performance of their duties to the Fund. In the normal course of business, the Fund may also enter into contracts that provide general indemnifications. The Fund's maximum exposure under these arrangements is unknown as this would be dependent on future claims that may be made against the Fund. The risk of material loss from such claims is considered remote.
Report of Independent Registered Public Accounting Firm
To the Trustees of Fidelity Contrafund and Shareholders of Fidelity Contrafund:
Opinion on the Financial Statements
We have audited the accompanying statement of assets and liabilities, including the schedule of investments, of Fidelity Contrafund (one of the funds constituting Fidelity Contrafund, referred to hereafter as the “Fund”) as of December 31, 2017, the related statement of operations for the year ended December 31, 2017, the statement of changes in net assets for each of the two years in the period ended December 31, 2017, including the related notes, and the financial highlights for each of the five years in the period ended December 31, 2017 (collectively referred to as the “financial statements”). In our opinion, the financial statements present fairly, in all material respects, the financial position of the Fund as of December 31, 2017, the results of its operations for the year then ended, the changes in its net assets for each of the two years in the period ended December 31, 2017 and the financial highlights for each of the five years in the period ended December 31, 2017 in conformity with accounting principles generally accepted in the United States of America.
Basis for Opinion
These financial statements are the responsibility of the Fund’s management. Our responsibility is to express an opinion on the Fund’s financial statements based on our audits. We are a public accounting firm registered with the Public Company Accounting Oversight Board (United States) (“PCAOB”) and are required to be independent with respect to the Fund in accordance with the U.S. federal securities laws and the applicable rules and regulations of the Securities and Exchange Commission and the PCAOB.
We conducted our audits of these financial statements in accordance with the standards of the PCAOB. Those standards require that we plan and perform the audit to obtain reasonable assurance about whether the financial statements are free of material misstatement, whether due to error or fraud.
Our audits included performing procedures to assess the risks of material misstatement of the financial statements, whether due to error or fraud, and performing procedures that respond to those risks. Such procedures included examining, on a test basis, evidence regarding the amounts and disclosures in the financial statements. Our audits also included evaluating the accounting principles used and significant estimates made by management, as well as evaluating the overall presentation of the financial statements. Our procedures included confirmation of securities owned as of December 31, 2017 by correspondence with the custodian and brokers; when replies were not received from brokers, we performed other auditing procedures. We believe that our audits provide a reasonable basis for our opinion.
PricewaterhouseCoopers LLP
Boston, Massachusetts
February 13, 2018
We have served as the auditor of one or more investment companies in the Fidelity group of funds since 1932.
Trustees and Officers
The Trustees, Members of the Advisory Board (if any), and officers of the trust and fund, as applicable, are listed below. The Board of Trustees governs the fund and is responsible for protecting the interests of shareholders. The Trustees are experienced executives who meet periodically throughout the year to oversee the fund's activities, review contractual arrangements with companies that provide services to the fund, oversee management of the risks associated with such activities and contractual arrangements, and review the fund's performance. Each of the Trustees oversees 190 funds.
The Trustees hold office without limit in time except that (a) any Trustee may resign; (b) any Trustee may be removed by written instrument, signed by at least two-thirds of the number of Trustees prior to such removal; (c) any Trustee who requests to be retired or who has become incapacitated by illness or injury may be retired by written instrument signed by a majority of the other Trustees; and (d) any Trustee may be removed at any special meeting of shareholders by a two-thirds vote of the outstanding voting securities of the trust. Each Trustee who is not an interested person (as defined in the 1940 Act) of the trust and the fund is referred to herein as an Independent Trustee. Each Independent Trustee shall retire not later than the last day of the calendar year in which his or her 75th birthday occurs. The Independent Trustees may waive this mandatory retirement age policy with respect to individual Trustees. Officers and Advisory Board Members hold office without limit in time, except that any officer or Advisory Board Member may resign or may be removed by a vote of a majority of the Trustees at any regular meeting or any special meeting of the Trustees. Except as indicated, each individual has held the office shown or other offices in the same company for the past five years.
The fund’s Statement of Additional Information (SAI) includes more information about the Trustees. To request a free copy, call Fidelity at 1-800-835-5092.
Experience, Skills, Attributes, and Qualifications of the Trustees. The Governance and Nominating Committee has adopted a statement of policy that describes the experience, qualifications, attributes, and skills that are necessary and desirable for potential Independent Trustee candidates (Statement of Policy). The Board believes that each Trustee satisfied at the time he or she was initially elected or appointed a Trustee, and continues to satisfy, the standards contemplated by the Statement of Policy. The Governance and Nominating Committee also engages professional search firms to help identify potential Independent Trustee candidates who have the experience, qualifications, attributes, and skills consistent with the Statement of Policy. From time to time, additional criteria based on the composition and skills of the current Independent Trustees, as well as experience or skills that may be appropriate in light of future changes to board composition, business conditions, and regulatory or other developments, have also been considered by the professional search firms and the Governance and Nominating Committee. In addition, the Board takes into account the Trustees' commitment and participation in Board and committee meetings, as well as their leadership of standing and ad hoc committees throughout their tenure.
In determining that a particular Trustee was and continues to be qualified to serve as a Trustee, the Board has considered a variety of criteria, none of which, in isolation, was controlling. The Board believes that, collectively, the Trustees have balanced and diverse experience, qualifications, attributes, and skills, which allow the Board to operate effectively in governing the fund and protecting the interests of shareholders. Information about the specific experience, skills, attributes, and qualifications of each Trustee, which in each case led to the Board's conclusion that the Trustee should serve (or continue to serve) as a trustee of the fund, is provided below.
Board Structure and Oversight Function. James C. Curvey is an interested person and currently serves as Chairman. The Trustees have determined that an interested Chairman is appropriate and benefits shareholders because an interested Chairman has a personal and professional stake in the quality and continuity of services provided to the fund. Independent Trustees exercise their informed business judgment to appoint an individual of their choosing to serve as Chairman, regardless of whether the Trustee happens to be independent or a member of management. The Independent Trustees have determined that they can act independently and effectively without having an Independent Trustee serve as Chairman and that a key structural component for assuring that they are in a position to do so is for the Independent Trustees to constitute a substantial majority for the Board. The Independent Trustees also regularly meet in executive session. Ned C. Lautenbach serves as Chairman of the Independent Trustees and as such (i) acts as a liaison between the Independent Trustees and management with respect to matters important to the Independent Trustees and (ii) with management prepares agendas for Board meetings.
Fidelity® funds are overseen by different Boards of Trustees. The fund's Board oversees Fidelity's high income and certain equity funds, and other Boards oversee Fidelity's investment-grade bond, money market, asset allocation, and sector funds. The asset allocation funds may invest in Fidelity® funds overseen by the fund's Board. The use of separate Boards, each with its own committee structure, allows the Trustees of each group of Fidelity® funds to focus on the unique issues of the funds they oversee, including common research, investment, and operational issues. On occasion, the separate Boards establish joint committees to address issues of overlapping consequences for the Fidelity® funds overseen by each Board.
The Trustees operate using a system of committees to facilitate the timely and efficient consideration of all matters of importance to the Trustees, the fund, and fund shareholders and to facilitate compliance with legal and regulatory requirements and oversight of the fund's activities and associated risks. The Board, acting through its committees, has charged FMR and its affiliates with (i) identifying events or circumstances the occurrence of which could have demonstrably adverse effects on the fund's business and/or reputation; (ii) implementing processes and controls to lessen the possibility that such events or circumstances occur or to mitigate the effects of such events or circumstances if they do occur; and (iii) creating and maintaining a system designed to evaluate continuously business and market conditions in order to facilitate the identification and implementation processes described in (i) and (ii) above. Because the day-to-day operations and activities of the fund are carried out by or through FMR, its affiliates, and other service providers, the fund's exposure to risks is mitigated but not eliminated by the processes overseen by the Trustees. While each of the Board's committees has responsibility for overseeing different aspects of the fund's activities, oversight is exercised primarily through the Operations, Audit, and Compliance Committees. In addition, the Independent Trustees have worked with FMR to enhance the Board's oversight of investment and financial risks, legal and regulatory risks, technology risks, and operational risks, including the development of additional risk reporting to the Board. For example, a working group comprised of Independent Trustees and FMR has worked and continues to work to review the Fidelity® funds' valuation-related activities, reporting and risk management. Appropriate personnel, including but not limited to the fund's Chief Compliance Officer (CCO), FMR's internal auditor, the independent accountants, the fund's Treasurer and portfolio management personnel, make periodic reports to the Board's committees, as appropriate, including an annual review of Fidelity's risk management program for the Fidelity® funds. The responsibilities of each standing committee, including their oversight responsibilities, are described further under "Standing Committees of the Trustees."
Interested Trustees*:
Correspondence intended for a Trustee who is an interested person may be sent to Fidelity Investments, 245 Summer Street, Boston, Massachusetts 02210.
Name, Year of Birth; Principal Occupations and Other Relevant Experience+
James C. Curvey (1935)
Year of Election or Appointment: 2007
Trustee
Chairman of the Board of Trustees
Mr. Curvey also serves as Trustee of other Fidelity® funds. Mr. Curvey is a Director of Fidelity Research & Analysis Co. (investment adviser firm, 2009-present), and Vice Chairman (2007-present) and Director of FMR LLC (diversified financial services company). In addition, Mr. Curvey serves as an Overseer for the Boston Symphony Orchestra and a member of the board of Artis-Naples, Naples, Florida, and as a Trustee for Brewster Academy, Wolfeboro, New Hampshire. Previously, Mr. Curvey served as a Director of Fidelity Investments Money Management, Inc. (investment adviser firm, 2009-2014) and a Director of FMR and FMR Co., Inc. (investment adviser firms, 2007-2014).
Charles S. Morrison (1960)
Year of Election or Appointment: 2014
Trustee
Mr. Morrison also serves as Trustee of other funds. He serves as President of Fidelity SelectCo, LLC (investment adviser firm, 2017-present) and Fidelity Management & Research Company (FMR) (investment adviser firm, 2016-present), a Director of Fidelity Investments Money Management, Inc. (FIMM) (investment adviser firm, 2014-present), Director of Fidelity SelectCo, LLC (investment adviser firm, 2014-present), President, Asset Management (2014-present), and is an employee of Fidelity Investments. Previously, Mr. Morrison served as Vice President of Fidelity's Fixed Income and Asset Allocation Funds (2012-2014), President, Fixed Income (2011-2014), Vice President of Fidelity's Money Market Funds (2005-2009), President, Money Market Group Leader of FMR (investment adviser firm, 2009), and Senior Vice President, Money Market Group of FMR (2004-2009). Mr. Morrison also served as Vice President of Fidelity's Bond Funds (2002-2005), certain Balanced Funds (2002-2005), and certain Asset Allocation Funds (2002-2007), and as Senior Vice President (2002-2005) of Fidelity's Bond Division.
* Determined to be an “Interested Trustee” by virtue of, among other things, his or her affiliation with the trust or various entities under common control with FMR.
+ The information includes the Trustee's principal occupation during the last five years and other information relating to the experience, attributes, and skills relevant to the Trustee's qualifications to serve as a Trustee, which led to the conclusion that the Trustee should serve as a Trustee for the fund.
Independent Trustees:
Correspondence intended for an Independent Trustee may be sent to Fidelity Investments, P.O. Box 55235, Boston, Massachusetts 02205-5235.
Name, Year of Birth; Principal Occupations and Other Relevant Experience+
Dennis J. Dirks (1948)
Year of Election or Appointment: 2005
Trustee
Mr. Dirks also serves as Trustee of other Fidelity® funds. Prior to his retirement in May 2003, Mr. Dirks was Chief Operating Officer and a member of the Board of The Depository Trust & Clearing Corporation (DTCC). He also served as President, Chief Operating Officer, and Board member of The Depository Trust Company (DTC) and President and Board member of the National Securities Clearing Corporation (NSCC). In addition, Mr. Dirks served as Chief Executive Officer and Board member of the Government Securities Clearing Corporation, Chief Executive Officer and Board member of the Mortgage-Backed Securities Clearing Corporation, as a Trustee and a member of the Finance Committee of Manhattan College (2005-2008), as a Trustee and a member of the Finance Committee of AHRC of Nassau County (2006-2008), as a member of the Independent Directors Council (IDC) Governing Council (2010-2015), and as a member of the Board of Directors for The Brookville Center for Children’s Services, Inc. (2009-2017). Mr. Dirks is a member of the Finance Committee (2016-present) and Board of Directors (2017-present) of the Asolo Repertory Theatre.
Alan J. Lacy (1953)
Year of Election or Appointment: 2008
Trustee
Mr. Lacy also serves as Trustee of other Fidelity® funds. Mr. Lacy serves as a Director of Bristol-Myers Squibb Company (global pharmaceuticals, 2008-present). He is a Trustee of the California Chapter of The Nature Conservancy (2015-present) and a Director of the Center for Advanced Study in the Behavioral Sciences at Stanford University (2015-present). In addition, Mr. Lacy served as Senior Adviser (2007-2014) of Oak Hill Capital Partners, L.P. (private equity) and also served as Chief Executive Officer (2005) and Vice Chairman (2005-2006) of Sears Holdings Corporation (retail) and Chief Executive Officer and Chairman of the Board of Sears, Roebuck and Co. (retail, 2000-2005). Previously, Mr. Lacy served as Chairman (2014-2017) and a member (2010-2017) of the Board of Directors of Dave & Buster’s Entertainment, Inc. (restaurant and entertainment complexes), as Chairman (2008-2011) and a member (2006-2015) of the Board of Trustees of the National Parks Conservation Association, and as a member of the Board of Directors for The Hillman Companies, Inc. (hardware wholesalers, 2010-2014), Earth Fare, Inc. (retail grocery, 2010-2014), and The Western Union Company (global money transfer, 2006-2011).
Ned C. Lautenbach (1944)
Year of Election or Appointment: 2000
Trustee
Chairman of the Independent Trustees
Mr. Lautenbach also serves as Trustee of other Fidelity® funds. Mr. Lautenbach currently serves as Vice Chair of the Board of Governors, State University System of Florida (2013-present) and is a member of the Council on Foreign Relations (1994-present). He is also a member and has most recently served as Chairman of the Board of Directors of Artis-Naples (2012-present). Previously, Mr. Lautenbach served as a member and then Lead Director of the Board of Directors of Eaton Corporation (diversified industrial, 1997-2016). He was also a Partner and Advisory Partner at Clayton, Dubilier & Rice, LLC (private equity investment, 1998-2010), as well as a Director of Sony Corporation (2006-2007). In addition, Mr. Lautenbach also had a 30-year career with IBM (technology company) during which time he served as Senior Vice President and a member of the Corporate Executive Committee (1968-1998).
Joseph Mauriello (1944)
Year of Election or Appointment: 2008
Trustee
Mr. Mauriello also serves as Trustee of other Fidelity® funds. Prior to his retirement in January 2006, Mr. Mauriello served in numerous senior management positions including Deputy Chairman and Chief Operating Officer (2004-2005), and Vice Chairman of Financial Services (2002-2004) of KPMG LLP US (professional services, 1965-2005). Mr. Mauriello currently serves as a member of the Board of Directors of XL Group plc. (global insurance and re-insurance, 2006-present) and the Independent Directors Council (IDC) Governing Council (2015-present). Previously, Mr. Mauriello served as a Director of the Hamilton Funds of the Bank of New York (2006-2007) and of Arcadia Resources Inc. (health care services and products, 2007-2012).
Cornelia M. Small (1944)
Year of Election or Appointment: 2005
Trustee
Ms. Small also serves as Trustee of other Fidelity® funds. Ms. Small is a member of the Board of Directors (2009-present) and Chair of the Investment Committee (2010-present) of the Teagle Foundation. Ms. Small also serves on the Investment Committee of the Berkshire Taconic Community Foundation (2008-present). Previously, Ms. Small served as Chairperson (2002-2008) and a member of the Investment Committee and Chairperson (2008-2012) and a member of the Board of Trustees of Smith College. In addition, Ms. Small served as Chief Investment Officer, Director of Global Equity Investments, and a member of the Board of Directors of Scudder, Stevens & Clark and Scudder Kemper Investments.
William S. Stavropoulos (1939)
Year of Election or Appointment: 2001
Trustee
Vice Chairman of the Independent Trustees
Mr. Stavropoulos also serves as Trustee of other Fidelity® funds. Mr. Stavropoulos serves as President and Founder of the Michigan Baseball Foundation, the Great Lakes Loons (2007-present). Mr. Stavropoulos is Chairman Emeritus of the Board of Directors of The Dow Chemical Company, where he previously served in numerous senior management positions, including President, CEO (1995-2000; 2002-2004), Chairman of the Executive Committee (2000-2006), and as a member of the Board of Directors (1990-2006). Currently, Mr. Stavropoulos is Chairman of the Board of Directors of Univar Inc. (global distributor of commodity and specialty chemicals), a Director of Teradata Corporation (data warehousing and technology solutions), and a member of the Advisory Board for Metalmark Capital LLC (private equity investment, 2005-present). Mr. Stavropoulos is an operating advisor to Clayton, Dubilier & Rice, LLC (private equity investment). In addition, Mr. Stavropoulos is a member of the University of Notre Dame Advisory Council for the College of Science, a Trustee of the Rollin L. Gerstacker Foundation, and a Director of Artis-Naples in Naples, Florida. Previously, Mr. Stavropoulos served as a Director of Chemical Financial Corporation (bank holding company, 1993-2012) and Tyco International, Ltd. (multinational manufacturing and services, 2007-2012).
David M. Thomas (1949)
Year of Election or Appointment: 2008
Trustee
Mr. Thomas also serves as Trustee of other Fidelity® funds. Mr. Thomas serves as Non-Executive Chairman of the Board of Directors of Fortune Brands Home and Security (home and security products, 2011-present), as a member of the Board of Directors (2004-present) and Presiding Director (2013-present) of Interpublic Group of Companies, Inc. (marketing communication), and as a member of the Board of Trustees of the University of Florida (2013-present). Previously, Mr. Thomas served as Executive Chairman (2005-2006) and Chairman and Chief Executive Officer (2000-2005) of IMS Health, Inc. (pharmaceutical and healthcare information solutions), and a Director of Fortune Brands, Inc. (consumer products, 2000-2011).
+ The information includes the Trustee's principal occupation during the last five years and other information relating to the experience, attributes, and skills relevant to the Trustee's qualifications to serve as a Trustee, which led to the conclusion that the Trustee should serve as a Trustee for the fund.
Advisory Board Members and Officers:
Correspondence intended for an officer or Peter S. Lynch may be sent to Fidelity Investments, 245 Summer Street, Boston, Massachusetts 02210. Officers appear below in alphabetical order.
Name, Year of Birth; Principal Occupation
Peter S. Lynch (1944)
Year of Election or Appointment: 2003
Member of the Advisory Board
Mr. Lynch also serves as Member of the Advisory Board of other Fidelity® funds. Mr. Lynch is Vice Chairman and a Director of FMR (investment adviser firm) and FMR Co., Inc. (investment adviser firm). In addition, Mr. Lynch serves as a Trustee of Boston College and as the Chairman of the Inner-City Scholarship Fund. Previously, Mr. Lynch served on the Special Olympics International Board of Directors (1997-2006).
Elizabeth Paige Baumann (1968)
Year of Election or Appointment: 2017
Anti-Money Laundering (AML) Officer
Ms. Baumann also serves as AML Officer of other funds. She is Chief AML Officer (2012-present) and Senior Vice President (2014-present) of FMR LLC (diversified financial services company) and is an employee of Fidelity Investments. Previously, Ms. Baumann served as AML Officer of the funds (2012-2016), and Vice President (2007-2014) and Deputy Anti-Money Laundering Officer (2007-2012) of FMR LLC.
Marc R. Bryant (1966)
Year of Election or Appointment: 2015
Secretary and Chief Legal Officer (CLO)
Mr. Bryant also serves as Secretary and CLO of other funds. Mr. Bryant serves as CLO, Secretary, and Senior Vice President of Fidelity Management & Research Company (investment adviser firm, 2015-present) and FMR Co., Inc. (investment adviser firm, 2015-present); Secretary of Fidelity SelectCo, LLC (investment adviser firm, 2015-present) and Fidelity Investments Money Management, Inc. (investment adviser firm, 2015-present); and CLO of Fidelity Management & Research (Hong Kong) Limited and FMR Investment Management (UK) Limited (investment adviser firms, 2015-present) and Fidelity Management & Research (Japan) Limited (investment adviser firm, 2016-present). He is Senior Vice President and Deputy General Counsel of FMR LLC (diversified financial services company). Previously, Mr. Bryant served as Secretary and CLO of Fidelity Rutland Square Trust II (2010-2014) and Assistant Secretary of Fidelity's Fixed Income and Asset Allocation Funds (2013-2015). Prior to joining Fidelity Investments, Mr. Bryant served as a Senior Vice President and the Head of Global Retail Legal for AllianceBernstein L.P. (2006-2010), and as the General Counsel for ProFund Advisors LLC (2001-2006).
William C. Coffey (1969)
Year of Election or Appointment: 2009
Assistant Secretary
Mr. Coffey also serves as Assistant Secretary of other funds. He is Senior Vice President and Deputy General Counsel of FMR LLC (diversified financial services company, 2010-present), and is an employee of Fidelity Investments. Previously, Mr. Coffey served as Vice President and Associate General Counsel of FMR LLC (2005-2009).
Jonathan Davis (1968)
Year of Election or Appointment: 2010
Assistant Treasurer
Mr. Davis also serves as Assistant Treasurer of other funds. Mr. Davis serves as Assistant Treasurer of FMR Capital, Inc. (2017-present) and is an employee of Fidelity Investments. Previously, Mr. Davis served as Vice President and Associate General Counsel of FMR LLC (diversified financial services company, 2003-2010).
Adrien E. Deberghes (1967)
Year of Election or Appointment: 2016
Assistant Treasurer
Mr. Deberghes also serves as an officer of other funds. He serves as Assistant Treasurer of FMR Capital, Inc. (2017-present), Executive Vice President of Fidelity Investments Money Management, Inc. (FIMM) (investment adviser firm, 2016-present), and is an employee of Fidelity Investments (2008-present). Prior to joining Fidelity Investments, Mr. Deberghes was Senior Vice President of Mutual Fund Administration at State Street Corporation (2007-2008), Senior Director of Mutual Fund Administration at Investors Bank & Trust (2005-2007), and Director of Finance for Dunkin' Brands (2000-2005). Previously, Mr. Deberghes served in other fund officer roles.
Stephanie J. Dorsey (1969)
Year of Election or Appointment: 2010
Assistant Treasurer
Ms. Dorsey also serves as an officer of other funds. Ms. Dorsey serves as Assistant Treasurer of FMR Capital, Inc. (2017-present), is an employee of Fidelity Investments (2008-present), and has served in other fund officer roles. Prior to joining Fidelity Investments, Ms. Dorsey served as Treasurer (2004-2008) of the JPMorgan Mutual Funds and Vice President (2004-2008) of JPMorgan Chase Bank.
Howard J. Galligan III (1966)
Year of Election or Appointment: 2014
Chief Financial Officer
Mr. Galligan also serves as Chief Financial Officer of other funds. Mr. Galligan serves as President of Fidelity Pricing and Cash Management Services (FPCMS) (2014-present) and as a Director of Strategic Advisers, Inc. (investment adviser firm, 2008-present). Previously, Mr. Galligan served as Chief Administrative Officer of Asset Management (2011-2014) and Chief Operating Officer and Senior Vice President of Investment Support for Strategic Advisers, Inc. (2003-2011).
Brian B. Hogan (1964)
Year of Election or Appointment: 2009
Vice President
Mr. Hogan also serves as Trustee or Vice President of other funds. Mr. Hogan serves as a Director of FMR Investment Management (UK) Limited (investment adviser firm, 2015-present) and Fidelity SelectCo, LLC (investment adviser firm, 2014-present) and President of the Equity Division of FMR (investment adviser firm, 2009-present). Previously, Mr. Hogan served as Senior Vice President, Equity Research of FMR (2006-2009) and as a portfolio manager. Mr. Brian B. Hogan is not related to Mr. Colm A. Hogan.
Colm A. Hogan (1973)
Year of Election or Appointment: 2016
Deputy Treasurer
Mr. Hogan also serves as an officer of other funds. Mr. Hogan serves as Assistant Treasurer of FMR Capital, Inc. (2017-present) and is an employee of Fidelity Investments (2005-present). Mr. Colm A. Hogan is not related to Mr. Brian B. Hogan.
Chris Maher (1972)
Year of Election or Appointment: 2013
Assistant Treasurer
Mr. Maher serves as Assistant Treasurer of other funds. Mr. Maher is Vice President of Valuation Oversight, serves as Assistant Treasurer of FMR Capital, Inc. (2017-present), and is an employee of Fidelity Investments. Previously, Mr. Maher served as Vice President of Asset Management Compliance (2013), Vice President of the Program Management Group of FMR (investment adviser firm, 2010-2013), and Vice President of Valuation Oversight (2008-2010).
Rieco E. Mello (1969)
Year of Election or Appointment: 2017
Assistant Treasurer
Mr. Mello also serves as Assistant Treasurer of other funds. Mr. Mello serves as Assistant Treasurer of FMR Capital, Inc. (2017-present) and is an employee of Fidelity Investments (1995-present).
Melissa M. Reilly (1971)
Year of Election or Appointment: 2014
Vice President of certain Equity Funds
Ms. Reilly also serves as Vice President of other funds. Ms. Reilly is an employee of Fidelity Investments (2004-present).
Kenneth B. Robins (1969)
Year of Election or Appointment: 2016
Chief Compliance Officer
Mr. Robins also serves as an officer of other funds. Mr. Robins serves as Compliance Officer of Fidelity Management & Research Company and FMR Co., Inc. (investment adviser firms, 2016-present) and is an employee of Fidelity Investments (2004-present). Previously, Mr. Robins served as Executive Vice President of Fidelity Investments Money Management, Inc. (investment adviser firm, 2013-2016) and served in other fund officer roles.
Stacie M. Smith (1974)
Year of Election or Appointment: 2016
President and Treasurer
Ms. Smith also serves as an officer of other funds. Ms. Smith serves as Assistant Treasurer of FMR Capital, Inc. (2017-present), is an employee of Fidelity Investments (2009-present), and has served in other fund officer roles. Prior to joining Fidelity Investments, Ms. Smith served as Senior Audit Manager of Ernst & Young LLP (accounting firm, 1996-2009). Previously, Ms. Smith served as Deputy Treasurer of certain Fidelity® funds (2013-2016).
Marc L. Spector (1972)
Year of Election or Appointment: 2016
Assistant Treasurer
Mr. Spector also serves as an officer of other funds. Mr. Spector serves as Assistant Treasurer of FMR Capital, Inc. (2017-present) and is an employee of Fidelity Investments (2016-present). Prior to joining Fidelity Investments, Mr. Spector served as Director at the Siegfried Group (accounting firm, 2013-2016), and prior to Siegfried Group as audit senior manager at Deloitte & Touche (accounting firm, 2005-2013).
Renee Stagnone (1975)
Year of Election or Appointment: 2016
Assistant Treasurer
Ms. Stagnone also serves as an officer of other funds. Ms. Stagnone serves as Assistant Treasurer of FMR Capital, Inc. (2017-present) and is an employee of Fidelity Investments (1997-present). Previously, Ms. Stagnone served as Deputy Treasurer of certain Fidelity® funds (2013-2016).
Shareholder Expense Example
As a shareholder of the Fund, you incur two types of costs: (1) transaction costs, and (2) ongoing costs, including management fees and other Fund expenses. This Example is intended to help you understand your ongoing costs (in dollars) of investing in the Fund and to compare these costs with the ongoing costs of investing in other mutual funds.
The Example is based on an investment of $1,000 invested at the beginning of the period and held for the entire period (July 1, 2017 to December 31, 2017).
Actual Expenses
The first line of the accompanying table for each class of the Fund provides information about actual account values and actual expenses. You may use the information in this line, together with the amount you invested, to estimate the expenses that you paid over the period. Simply divide your account value by $1,000.00 (for example, an $8,600 account value divided by $1,000.00 = 8.6), then multiply the result by the number in the first line for a class of the Fund under the heading entitled "Expenses Paid During Period" to estimate the expenses you paid on your account during this period. A small balance maintenance fee of $12.00 that is charged once a year may apply for certain accounts with a value of less than $2,000. This fee is not included in the table below. If it was, the estimate of expenses you paid during the period would be higher, and your ending account value lower, by this amount. In addition, the Fund, as a shareholder in the underlying Fidelity Central Funds, will indirectly bear its pro-rata share of the fees and expenses incurred by the underlying Fidelity Central Funds. These fees and expenses are not included in the Fund's annualized expense ratio used to calculate the expense estimate in the table below.
Hypothetical Example for Comparison Purposes
The second line of the accompanying table for each class of the Fund provides information about hypothetical account values and hypothetical expenses based on a Class' actual expense ratio and an assumed rate of return of 5% per year before expenses, which is not the Class' actual return. The hypothetical account values and expenses may not be used to estimate the actual ending account balance or expenses you paid for the period. You may use this information to compare the ongoing costs of investing in the Fund and other funds. To do so, compare this 5% hypothetical example with the 5% hypothetical examples that appear in the shareholder reports of the other funds. A small balance maintenance fee of $12.00 that is charged once a year may apply for certain accounts with a value of less than $2,000. This fee is not included in the table below. If it was, the estimate of expenses you paid during the period would be higher, and your ending account value lower, by this amount. In addition, the Fund, as a shareholder in the underlying Fidelity Central Funds, will indirectly bear its pro-rata share of the fees and expenses incurred by the underlying Fidelity Central Funds. These fees and expenses are not included in the Fund's annualized expense ratio used to calculate the expense estimate in the table below.
Please note that the expenses shown in the table are meant to highlight your ongoing costs only and do not reflect any transaction costs. Therefore, the second line of the table is useful in comparing ongoing costs only, and will not help you determine the relative total costs of owning different funds.
| | Annualized Expense Ratio-A | Beginning
Account Value
July 1, 2017 | Ending
Account Value
December 31, 2017 | Expenses Paid
During Period-B
July 1, 2017
to December 31, 2017 |
| Contrafund | .81% | | | |
| Actual | | $1,000.00 | $1,132.00 | $4.35 |
| Hypothetical-C | | $1,000.00 | $1,021.12 | $4.13 |
| Class K | .72% | | | |
| Actual | | $1,000.00 | $1,132.80 | $3.87 |
| Hypothetical-C | | $1,000.00 | $1,021.58 | $3.67 |
A Annualized expense ratio reflects expenses net of applicable fee waivers.
B Expenses are equal to each Class' annualized expense ratio, multiplied by the average account value over the period, multiplied by 184/365 (to reflect the one-half year period).
C 5% return per year before expenses
Distributions (Unaudited)
The Board of Trustees of the Fidelity Contrafund voted to pay to shareholders of record at the opening of business on record date, the following distributions per share derived from capital gains realized from sales of portfolio securities.
| | Pay Date | Record Date | Capital Gains |
| Contrafund | 02/12/2018 | 02/09/2018 | $1.858 |
| Class K | 02/12/2018 | 02/09/2018 | $1.858 |
|
The fund hereby designates as a capital gain dividend with respect to the taxable year ended December 31, 2017, $8,870,646,322, or, if subsequently determined to be different, the net capital gain of such year.
The fund designates 100% of the dividends distributed during the fiscal year as qualifying for the dividends–received deduction for corporate shareholders.
The fund designates 100% of the dividends distributed during the fiscal year as amounts which may be taken into account as a dividend for purposes of the maximum rate under section 1(h)(11) of the Internal Revenue Code.
The fund will notify shareholders in January 2018 of amounts for use in preparing 2017 income tax returns.
Board Approval of Investment Advisory Contracts and Management Fees
Fidelity Contrafund
Each year, the Board of Trustees, including the Independent Trustees (together, the Board), votes on the renewal of the management contract with Fidelity Management & Research Company (FMR) and the sub-advisory agreements (together, the Advisory Contracts) for the fund. FMR and the sub-advisers are referred to herein as the Investment Advisers. The Board, assisted by the advice of fund counsel and Independent Trustees' counsel, requests and considers a broad range of information relevant to the renewal of the Advisory Contracts throughout the year.
The Board meets regularly and, at each of its meetings, covers an extensive agenda of topics and materials and considers factors that are relevant to its annual consideration of the renewal of the fund's Advisory Contracts, including the services and support provided to the fund and its shareholders. The Board has established various standing committees (Committees), each composed of and chaired by Independent Trustees with varying backgrounds, to which the Board has assigned specific subject matter responsibilities in order to enhance effective decision-making by the Board. The Board, acting directly and through its Committees, requests and receives information concerning the annual consideration of the renewal of the fund's Advisory Contracts. The Board also meets as needed to review matters specifically related to the Board's annual consideration of the renewal of the Advisory Contracts. Members of the Board may also meet with trustees of other Fidelity funds through ad hoc joint committees to discuss certain matters relevant to all of the Fidelity funds.
At its July 2017 meeting, the Board unanimously determined to renew the fund's Advisory Contracts. In reaching its determination, the Board considered all factors it believed relevant, including (i) the nature, extent, and quality of the services to be provided to the fund and its shareholders (including the investment performance of the fund); (ii) the competitiveness of the fund's management fee and total expense ratio relative to peer funds; (iii) the total costs of the services to be provided by and the profits to be realized by Fidelity from its relationships with the fund; and (iv) the extent to which, if any, economies of scale exist and would be realized as the fund grows, and whether any economies of scale are appropriately shared with fund shareholders.
In considering whether to renew the Advisory Contracts for the fund, the Board reached a determination, with the assistance of fund counsel and Independent Trustees' counsel and through the exercise of its business judgment, that the renewal of the Advisory Contracts was in the best interests of the fund and its shareholders and that the compensation payable under the Advisory Contracts was fair and reasonable. The Board's decision to renew the Advisory Contracts was not based on any single factor, but rather was based on a comprehensive consideration of all the information provided to the Board at its meetings throughout the year. The Board, in reaching its determination to renew the Advisory Contracts, was aware that shareholders of the fund have a broad range of investment choices available to them, including a wide choice among funds offered by Fidelity's competitors, and that the fund's shareholders, who have the opportunity to review and weigh the disclosure provided by the fund in its prospectus and other public disclosures, have chosen to invest in this fund, which is part of the Fidelity family of funds.
Amendment to Group Fee Rate. The Board also approved an amendment to the management contract for the fund to add an additional breakpoint to the group fee schedule, effective October 1, 2017. The Board noted that the additional breakpoint would result in lower management fee rates as Fidelity's assets under management increase.
Nature, Extent, and Quality of Services Provided. The Board considered Fidelity's staffing as it relates to the fund, including the backgrounds of investment personnel of Fidelity, and also considered the fund's investment objective, strategies, and related investment philosophy. The Independent Trustees also had discussions with senior management of Fidelity's investment operations and investment groups. The Board considered the structure of the investment personnel compensation program and whether this structure provides appropriate incentives to act in the best interests of the fund. Additionally, the Board considered the portfolio managers' investments, if any, in the funds that they manage.
Resources Dedicated to Investment Management and Support Services. The Board and the Fund Oversight and Research Committees reviewed the general qualifications and capabilities of Fidelity's investment staff, including its size, education, experience, and resources, as well as Fidelity's approach to recruiting, training, managing, and compensating investment personnel. The Board noted that Fidelity has continued to increase the resources devoted to non-U.S. offices, including expansion of Fidelity's global investment organization. The Board also noted that Fidelity's analysts have extensive resources, tools and capabilities that allow them to conduct sophisticated quantitative and fundamental analysis, as well as credit analysis of issuers, counterparties and guarantors. Further, the Board considered that Fidelity's investment professionals have sufficient access to global information and data so as to provide competitive investment results over time, and that those professionals also have access to sophisticated tools that permit them to assess portfolio construction and risk and performance attribution characteristics continuously, as well as to transmit new information and research conclusions rapidly around the world. Additionally, in its deliberations, the Board considered Fidelity's trading, risk management, compliance, and technology and operations capabilities and resources, which are integral parts of the investment management process.
Shareholder and Administrative Services. The Board considered (i) the nature, extent, quality, and cost of advisory, administrative, and shareholder services performed by the Investment Advisers and their affiliates under the Advisory Contracts and under separate agreements covering transfer agency, pricing and bookkeeping, and securities lending services for the fund; (ii) the nature and extent of the supervision of third party service providers, principally custodians, subcustodians, and pricing vendors; and (iii) the resources devoted to, and the record of compliance with, the fund's compliance policies and procedures. The Board also reviewed the allocation of fund brokerage, including allocations to brokers affiliated with the Investment Advisers, the use of brokerage commissions to pay fund expenses, and the use of "soft" commission dollars to pay for research services.
The Board noted that the growth of fund assets over time across the complex allows Fidelity to reinvest in the development of services designed to enhance the value or convenience of the Fidelity funds as investment vehicles. These services include 24-hour access to account information and market information through telephone representatives and over the Internet, investor education materials and asset allocation tools, and the expanded availability of Fidelity Investor Centers.
In 2014, the Board formed an ad hoc Committee on Transfer Agency Fees to review the variety of transfer agency fee structures throughout the industry and Fidelity's competitive positioning with respect to industry participants.
Investment in a Large Fund Family. The Board considered the benefits to shareholders of investing in a Fidelity fund, including the benefits of investing in a fund that is part of a large family of funds offering a variety of investment disciplines and providing a large variety of mutual fund investor services. The Board noted that Fidelity had taken, or had made recommendations that resulted in the Fidelity funds taking, a number of actions over the previous year that benefited particular funds, including: (i) continuing to dedicate additional resources to Fidelity's investment research process, and to the support of the senior management team that oversees asset management; (ii) continuing efforts to enhance Fidelity's global research capabilities; (iii) launching new funds and making other enhancements to meet client needs; (iv) launching new share classes of existing funds; (v) eliminating purchase minimums and broadening eligibility requirements for certain lower-priced share classes; (vi) reducing management fees and total expenses for certain growth equity funds and index funds; (vii) lowering expense caps for certain existing funds and classes to reduce expenses borne by shareholders; (viii) eliminating short-term redemption fees for certain funds; (ix) introducing a new pricing structure for certain funds of funds that is expected to reduce overall expenses paid by shareholders; (x) rationalizing product lines and gaining increased efficiencies through proposals for fund mergers and share class consolidations; (xi) continuing to develop, acquire and implement systems and technology to improve services to the funds and shareholders, strengthen information security, and increase efficiency; and (xii) implementing enhancements to further strengthen Fidelity's product line to increase investors' probability of success in achieving their investment goals, including retirement income goals.
Investment Performance. The Board considered whether the fund has operated in accordance with its investment objective, as well as its record of compliance with its investment restrictions and its performance history.
The Board took into account discussions with representatives of the Investment Advisers about fund investment performance that occur at Board meetings throughout the year. In this regard the Board noted that as part of regularly scheduled fund reviews and other reports to the Board on fund performance, the Board considers annualized return information for the fund for different time periods, measured against a securities market index ("benchmark index") and a peer group of funds with similar objectives ("peer group"), if any. In its evaluation of fund investment performance, the Board gave particular attention to information indicating changes in performance of certain Fidelity funds for specific time periods and discussed with the Investment Advisers the reasons for any overperformance or underperformance.
In addition to reviewing absolute and relative fund performance, the Independent Trustees periodically consider the appropriateness of fund performance metrics in evaluating the results achieved. In general, the Independent Trustees believe that fund performance should be evaluated based on net performance (after fees and expenses) of both the highest performing and lowest performing fund share classes, where applicable, compared to appropriate benchmark indices, over appropriate time periods that may include full market cycles, and compared to peer groups, as applicable, over the same periods, taking into account relevant factors including the following: general market conditions; issuer-specific information; and fund cash flows and other factors.
The Independent Trustees recognize that shareholders evaluate performance on a net basis over their own holding periods, for which one-, three-, and five-year periods are often used as a proxy. For this reason, the performance information reviewed by the Board also included net cumulative calendar year total return information for the fund and an appropriate benchmark index and peer group for the most recent one-, three-, and five-year periods, as shown below. Returns are shown compared to the 25th percentile (top of box, 75% beaten) and 75th percentile (bottom of box, 25% beaten) of the peer universe.
Fidelity Contrafund

The Board also considered that the fund's management fee is subject to upward or downward adjustment depending upon whether, and to what extent, the fund's investment performance for the performance period (a rolling 36-month period) exceeds, or is exceeded by, a securities index, thus leading to a performance adjustment for the same period. The Board noted that the performance adjustment provides FMR with a strong economic incentive to seek to achieve superior long-term performance for the fund's shareholders and helps to more closely align the interests of FMR and the shareholders of the fund.
Based on its review, the Board concluded that the nature, extent, and quality of services provided to the fund under the Advisory Contracts should continue to benefit the shareholders of the fund.
Competitiveness of Management Fee and Total Expense Ratio. The Board considered the fund's management fee and total expense ratio compared to "mapped groups" of competitive funds and classes created for the purpose of facilitating the Trustees' competitive analysis of management fees and total expenses. Fidelity creates "mapped groups" by combining similar Lipper investment objective categories that have comparable investment mandates. Combining Lipper investment objective categories aids the Board's management fee and total expense ratio comparisons by broadening the competitive group used for comparison.
Management Fee. The Board considered two proprietary management fee comparisons for the 12-month periods shown in basis points (BP) in the chart below. The group of Lipper funds used by the Board for management fee comparisons is referred to below as the "Total Mapped Group." The Total Mapped Group comparison focuses on a fund's standing in terms of gross management fees before expense reimbursements or caps, and without giving effect to the fund's performance adjustment, relative to the total universe of funds with comparable investment mandates, regardless of whether their management fee structures also are comparable. Funds with comparable investment mandates offer exposure to similar types of securities. Funds with comparable management fee structures have similar management fee contractual arrangements (
e.g., flat rate charged for advisory services, all-inclusive fee rate,
etc.). "TMG %" represents the percentage of funds in the Total Mapped Group that had management fees that were lower than the fund's. For example, a hypothetical TMG % of 20% would mean that 80% of the funds in the Total Mapped Group had higher, and 20% had lower, management fees than the fund. The fund's actual TMG %s and the number of funds in the Total Mapped Group are in the chart below. The "Asset-Size Peer Group" (ASPG) comparison focuses on a fund's standing relative to a subset of non-Fidelity funds within the Total Mapped Group that are similar in size and management fee structure without taking into account performance adjustments, if any. For example, if a fund is in the first quartile of the ASPG, the fund's management fee ranks in the least expensive or lowest 25% of funds in the ASPG. The ASPG represents at least 15% of the funds in the Total Mapped Group with comparable asset size and management fee structures, subject to a minimum of 50 funds (or all funds in the Total Mapped Group if fewer than 50). Additional information, such as the ASPG quartile in which the fund's management fee rate ranked and the impact of the fund's performance adjustment, is also included in the chart and considered by the Board.
Fidelity Contrafund
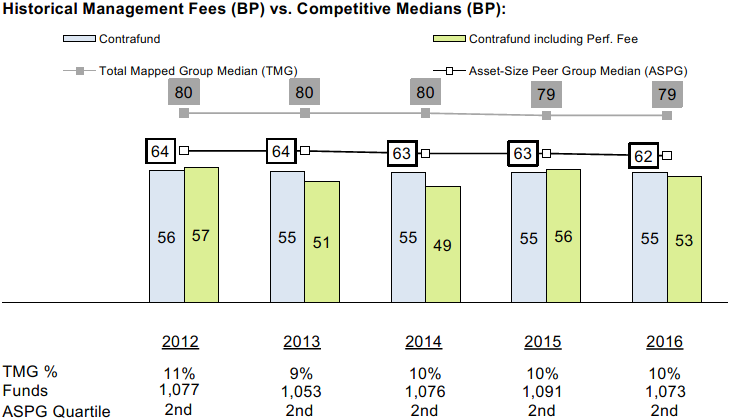
The Board noted that the fund's management fee rate ranked below the median of its Total Mapped Group and below the median of its ASPG for 2016. The Board also noted the effect of the fund's performance adjustment, if any, on the fund's management fee ranking.
The Board noted that, in 2014, the Board and the boards of other Fidelity funds formed the ad hoc Committee on Group Fee to conduct an in-depth review of the "group fee" component of the management fee of funds with such management fee structures. The Committee's focus included the mechanics of the group fee, the competitive landscape of group fee structures, Fidelity funds with no group fee component and investment products not included in group fee assets. The Board also considered that, for funds subject to the group fee, FMR agreed to voluntarily waive fees over a specified period of time in amounts designed to account for assets converted from certain funds to certain collective investment trusts.
The Board also noted that, in 2013, the ad hoc Committee on Management Fees was formed to conduct an in-depth review of the management fee rates of Fidelity's active equity mutual funds. The Committee focused on the following areas: (i) standard fee structures; (ii) research consumption and trading evolution; (iii) management fee competitiveness/profitability by category; and (iv) factors that drive institutional pricing.
Based on its review, the Board concluded that the fund's management fee is fair and reasonable in light of the services that the fund receives and the other factors considered.
Total Expense Ratio. In its review of each class's total expense ratio, the Board considered the fund's management fee rate as well as other fund or class expenses, as applicable, such as transfer agent fees, pricing and bookkeeping fees, and custodial, legal, and audit fees. The Board noted the impact of the fund's performance adjustment. The Board also noted that Fidelity may agree to waive fees and expenses from time to time, and the extent to which, if any, it has done so for the fund. As part of its review, the Board also considered the current and historical total expense ratios of each class of the fund compared to competitive fund median expenses. Each class of the fund is compared to those funds and classes in the Total Mapped Group (used by the Board for management fee comparisons) that have a similar sales load structure.
The Board noted that the total expense ratio of each class ranked below the competitive median for 2016.
Fees Charged to Other Fidelity Clients. The Board also considered Fidelity fee structures and other information with respect to clients of Fidelity, such as other funds advised or subadvised by Fidelity, pension plan clients, and other institutional clients with similar mandates. The Board noted that an ad hoc joint committee created by it and the boards of other Fidelity funds periodically (most recently in 2013) reviews and compares Fidelity's institutional investment advisory business with its business of providing services to the Fidelity funds, including the differences in services provided, fees charged, and costs incurred, as well as competition in their respective marketplaces.
Based on its review of total expense ratios and fees charged to other Fidelity clients, the Board concluded that the total expense ratio of each class of the fund was reasonable in light of the services that the fund and its shareholders receive and the other factors considered.
Costs of the Services and Profitability. The Board considered the revenues earned and the expenses incurred by Fidelity in conducting the business of developing, marketing, distributing, managing, administering and servicing the fund and servicing the fund's shareholders. The Board also considered the level of Fidelity's profits in respect of all the Fidelity funds.
On an annual basis, Fidelity presents to the Board information about the profitability of its relationships with the fund. Fidelity calculates profitability information for each fund, as well as aggregate profitability information for groups of Fidelity funds and all Fidelity funds, using a series of detailed revenue and cost allocation methodologies which originate with the books and records of Fidelity on which Fidelity's audited financial statements are based. The Audit Committee of the Board reviews any significant changes from the prior year's methodologies.
PricewaterhouseCoopers LLP (PwC), independent registered public accounting firm and auditor to Fidelity and certain Fidelity funds, has been engaged annually by the Board as part of the Board's assessment of Fidelity's profitability analysis. PwC's engagement includes the review and assessment of the methodologies used by Fidelity in determining the revenues and expenses attributable to Fidelity's mutual fund business, and completion of agreed-upon procedures in respect of the mathematical accuracy of the fund profitability information and its conformity to established allocation methodologies. After considering PwC's reports issued under the engagement and information provided by Fidelity, the Board concluded that while other allocation methods may also be reasonable, Fidelity's profitability methodologies are reasonable in all material respects.
The Board also reviewed Fidelity's non-fund businesses and potential fall-out benefits related to the mutual fund business as well as cases where Fidelity's affiliates may benefit from or be related to the fund's business.
The Board considered the costs of the services provided by and the profits realized by Fidelity in connection with the operation of the fund and was satisfied that the profitability was not excessive.
Economies of Scale. The Board considered whether there have been economies of scale in respect of the management of the Fidelity funds, whether the Fidelity funds (including the fund) have appropriately benefited from any such economies of scale, and whether there is potential for realization of any further economies of scale. The Board considered the extent to which the fund will benefit from economies of scale as assets grow through increased services to the fund, through waivers or reimbursements, or through fee or expense ratio reductions. The Board also noted that a committee (the Economies of Scale Committee) created by it and the boards of other Fidelity funds periodically (most recently in 2013) analyzes whether Fidelity attains economies of scale in respect of the management and servicing of the Fidelity funds, whether the Fidelity funds have appropriately benefited from such economies of scale, and whether there is potential for realization of any further economies of scale.
The Board recognized that the fund's management contract incorporates a "group fee" structure, which provides for lower group fee rates as total group assets increase, and for higher group fee rates as total group assets decrease (with "group assets" defined to include fund assets under FMR's management plus the assets of sector funds previously under FMR's management). FMR calculates the group fee rates based on a tiered asset "breakpoint" schedule that varies based on asset class. The Board considered that the group fee is designed to deliver the benefits of economies of scale to fund shareholders when total Fidelity fund assets increase, even if assets of any particular fund are unchanged or have declined, because some portion of Fidelity's costs are attributable to services provided to all Fidelity funds, and all funds benefit if those costs can be allocated among more assets. The Board concluded that, given the group fee structure, fund shareholders will benefit from lower management fees as group assets increase at the fund complex level, regardless of whether Fidelity achieves any such economies of scale.
The Board concluded, taking into account the analysis of the Economies of Scale Committee, that economies of scale, if any, are being appropriately shared between fund shareholders and Fidelity.
Additional Information Requested by the Board. In order to develop fully the factual basis for consideration of the Fidelity funds' advisory contracts, the Board requested and received additional information on certain topics, including: (i) fund performance trends, in particular the underperformance of certain funds, and Fidelity's long-term strategies for certain funds; (ii) Fidelity's fund profitability methodology, profitability trends for certain funds, and the impact of certain factors on fund profitability results, including the impact of market trends on actively managed funds; (iii) the use of performance fees and the calculation of performance adjustments, including the impact of underperformance and fund outflows on performance adjustments; (iv) metrics for evaluating index fund performance; (v) Fidelity's group fee structure, including the group fee breakpoint schedules; (vi) the terms of Fidelity's contractual and voluntary expense cap arrangements with the funds; (vii) the methodology with respect to evaluating competitive fund data and peer group classifications and fee comparisons; (viii) the expense structures for different funds and classes; (ix) Fidelity's arrangements with affiliated sub-advisers on behalf of the funds; (x) information regarding other accounts managed by Fidelity, including institutional accounts and collective investment trusts; (xi) recent changes to the fee structure for certain funds of funds; and (xii) the impact of the Department of Labor's new fiduciary rule on the funds' comparative expense information.
Based on its evaluation of all of the conclusions noted above, and after considering all factors it believed relevant, the Board concluded that the advisory fee structures are fair and reasonable, and that the fund's Advisory Contracts should be renewed.
Corporate Headquarters
245 Summer St.
Boston, MA 02210
www.fidelity.com
CON-K-ANN-0218
1.863188.109
Fidelity Advisor® New Insights Fund Class A, Class M (formerly Class T), Class C, Class I and Class Z
Annual Report December 31, 2017 |
|
Contents
To view a fund's proxy voting guidelines and proxy voting record for the 12-month period ended June 30, visit http://www.fidelity.com/proxyvotingresults or visit the Securities and Exchange Commission's (SEC) web site at http://www.sec.gov.
You may also call 1-877-208-0098 to request a free copy of the proxy voting guidelines.
Standard & Poor's, S&P and S&P 500 are registered service marks of The McGraw-Hill Companies, Inc. and have been licensed for use by Fidelity Distributors Corporation.
Other third-party marks appearing herein are the property of their respective owners.
All other marks appearing herein are registered or unregistered trademarks or service marks of FMR LLC or an affiliated company. © 2018 FMR LLC. All rights reserved.
This report and the financial statements contained herein are submitted for the general information of the shareholders of the Fund. This report is not authorized for distribution to prospective investors in the Fund unless preceded or accompanied by an effective prospectus.
A fund files its complete schedule of portfolio holdings with the SEC for the first and third quarters of each fiscal year on Form N-Q. Forms N-Q are available on the SEC’s web site at http://www.sec.gov. A fund's Forms N-Q may be reviewed and copied at the SEC’s Public Reference Room in Washington, DC. Information regarding the operation of the SEC's Public Reference Room may be obtained by calling 1-800-SEC-0330.
For a complete list of a fund's portfolio holdings, view the most recent holdings listing, semiannual report, or annual report on Fidelity's web site at http://www.fidelity.com, http://www.institutional.fidelity.com, or http://www.401k.com, as applicable.
NOT FDIC INSURED •MAY LOSE VALUE •NO BANK GUARANTEE
Neither the Fund nor Fidelity Distributors Corporation is a bank.
Performance: The Bottom Line
Average annual total return reflects the change in the value of an investment, assuming reinvestment of distributions from dividend income and capital gains (the profits earned upon the sale of securities that have grown in value, if any) and assuming a constant rate of performance each year. The hypothetical investment and the average annual total returns do not reflect the deduction of taxes that a shareholder would pay on fund distributions or the redemption of fund shares. During periods of reimbursement by Fidelity, a fund’s total return will be greater than it would be had the reimbursement not occurred. How a fund did yesterday is no guarantee of how it will do tomorrow.
Average Annual Total Returns
| For the periods ended December 31, 2017 | Past 1 year | Past 5 years | Past 10 years |
| Class A (incl. 5.75% sales charge) | 20.62% | 13.67% | 7.30% |
| Class M (incl. 3.50% sales charge) | 23.19% | 13.93% | 7.29% |
| Class C (incl. contingent deferred sales charge) | 25.99% | 14.17% | 7.13% |
| Class I | 28.30% | 15.32% | 8.21% |
| Class Z | 28.49% | 15.46% | 8.28% |
Class C shares' contingent deferred sales charges included in the past one year, past five years and past ten years total return figures are 1%, 0% and 0%, respectively.
The initial offering of Class Z shares took place on August 13, 2013. Returns prior to August 13, 2013, are those of Class I.
$10,000 Over 10 Years
Let's say hypothetically that $10,000 was invested in Fidelity Advisor® New Insights Fund - Class A on December 31, 2007, and the current 5.75% sales charge was paid.
The chart shows how the value of your investment would have changed, and also shows how the S&P 500® Index performed over the same period.
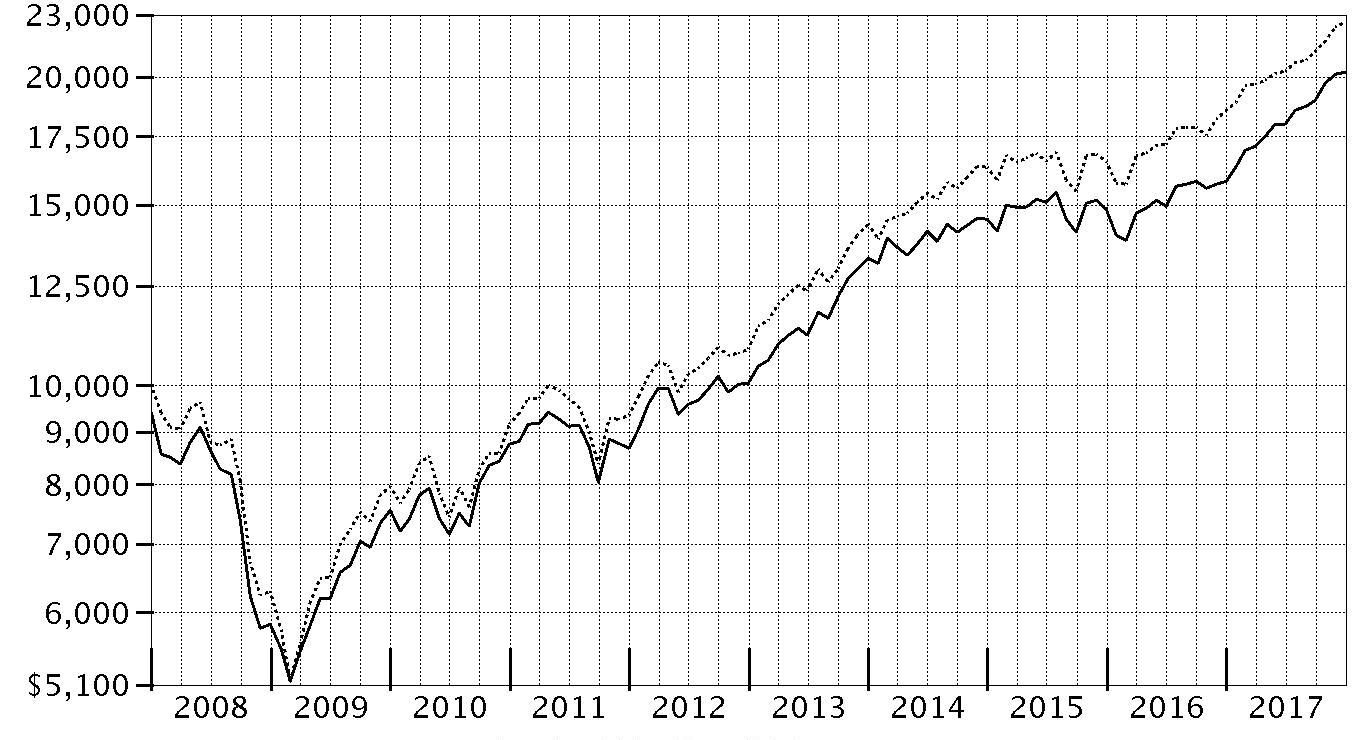
| Period Ending Values |
| $20,239 | Fidelity Advisor® New Insights Fund - Class A |
| $22,603 | S&P 500® Index |
Management's Discussion of Fund Performance
Market Recap: U.S. equities gained 21.83% in 2017, as the S&P 500
® index rose steadily and closed the year just shy of an all-time high after a particularly strong three-month finish. Early on, equities rallied on optimism for President Trump’s pro-business agenda but leveled off in March amid fading optimism and stalled efforts by Congress to repeal and replace the Affordable Care Act. Upward momentum soon returned and continued through year-end with consumer sentiment and other market indicators staying positive. The lone exception was a brief cooldown in August, when geopolitical tension escalated and uncertainty grew regarding the future of health care, tax reform and the debt ceiling. Sector-wise, information technology fared best by a wide margin, rising 39% amid strong earnings growth from several major index constituents. A 24% gain in materials was spurred by increased demand, especially from China. Consumer discretionary gained 23%, despite many brick-and-mortar retailers suffering from online competition, and financials edged the broader market on an uptick in bond yields. Conversely, the defensive energy and telecom services sectors returned about -1% each. Rising interest rates held back real estate (+11%), while consumer staples (+13%) and utilities (+12%) struggled due to investors’ general preference for risk assets.
Comments from Co-Portfolio Managers William Danoff and John Roth: For the year, the fund's share classes (excluding sales charges, if applicable) gained about 27% to 29%, well ahead of the benchmark S&P 500
® index. A more business-friendly administration in the White House, a rebound in China’s economy and an extremely low interest rate environment worldwide produced synchronous global economic expansion. This strength propelled the stock market higher, particularly growth and technology shares. The fund was well-positioned for this rebound, and performed very well for the year. The fund's outperformance of the benchmark primarily was driven by a sizable position – 34% of assets, on average – in the market-leading information technology sector. Here, notable individual contributors included social-media firm Facebook and Google parent Alphabet, our two largest holdings this year. Another big contributor from the tech sector was gaming company Activision Blizzard. Our top relative contributor in 2017 was the fund’s de-emphasis of industrial conglomerate General Electric, which struggled the past year as demand for utility-grade generators softened. I’ll also note that our foreign investments contributed overall, aided in part by a broadly weaker dollar. Conversely, notable detractors included underexposure to personal-electronics maker Apple and aircraft manufacturer Boeing, as well as the fund's stake in cash in a strong market.
The views expressed above reflect those of the portfolio manager(s) only through the end of the period as stated on the cover of this report and do not necessarily represent the views of Fidelity or any other person in the Fidelity organization. Any such views are subject to change at any time based upon market or other conditions and Fidelity disclaims any responsibility to update such views. These views may not be relied on as investment advice and, because investment decisions for a Fidelity fund are based on numerous factors, may not be relied on as an indication of trading intent on behalf of any Fidelity fund.
Investment Summary (Unaudited)
Top Ten Stocks as of December 31, 2017
| | % of fund's net assets |
| Facebook, Inc. Class A | 4.9 |
| Amazon.com, Inc. | 4.4 |
| Alphabet, Inc. Class A | 3.2 |
| Bank of America Corp. | 2.4 |
| Berkshire Hathaway, Inc. Class A | 2.4 |
| Microsoft Corp. | 2.3 |
| UnitedHealth Group, Inc. | 2.0 |
| Visa, Inc. Class A | 2.0 |
| Adobe Systems, Inc. | 1.7 |
| Citigroup, Inc. | 1.5 |
| | 26.8 |
Top Five Market Sectors as of December 31, 2017
| | % of fund's net assets |
| Information Technology | 31.9 |
| Financials | 16.3 |
| Consumer Discretionary | 14.8 |
| Health Care | 9.9 |
| Industrials | 8.1 |
Asset Allocation (% of fund's net assets)
| As of December 31, 2017* |
| | Stocks | 95.3% |
| | Bonds | 0.1% |
| | Convertible Securities | 1.3% |
| | Other Investments | 0.1% |
| | Short-Term Investments and Net Other Assets (Liabilities) | 3.2% |

* Foreign investments - 10.8%
Investments December 31, 2017
Showing Percentage of Net Assets
| Common Stocks - 95.0% | | | |
| | | Shares | Value (000s) |
| CONSUMER DISCRETIONARY - 14.4% | | | |
| Auto Components - 0.2% | | | |
| Magna International, Inc. Class A (sub. vtg.) | | 941,700 | $53,370 |
| Automobiles - 1.1% | | | |
| BYD Co. Ltd. (H Shares) | | 1,299,500 | 11,289 |
| Fiat Chrysler Automobiles NV | | 6,473,600 | 115,489 |
| Tesla, Inc. (a) | | 587,808 | 183,014 |
| Toyota Motor Corp. | | 133,300 | 8,495 |
| | | | 318,287 |
| Distributors - 0.1% | | | |
| Pool Corp. | | 222,400 | 28,834 |
| Diversified Consumer Services - 0.1% | | | |
| Chegg, Inc. (a)(b) | | 368,000 | 6,006 |
| Weight Watchers International, Inc. (a) | | 267,060 | 11,825 |
| | | | 17,831 |
| Hotels, Restaurants & Leisure - 2.2% | | | |
| ARAMARK Holdings Corp. | | 5,251,200 | 224,436 |
| Dunkin' Brands Group, Inc. | | 552,300 | 35,607 |
| Eldorado Resorts, Inc. (a) | | 55,300 | 1,833 |
| Hilton Worldwide Holdings, Inc. | | 574,033 | 45,842 |
| Las Vegas Sands Corp. | | 48,100 | 3,342 |
| Marriott International, Inc. Class A | | 729,300 | 98,988 |
| McDonald's Corp. | | 572,000 | 98,453 |
| U.S. Foods Holding Corp. (a) | | 2,162,500 | 69,049 |
| Vail Resorts, Inc. | | 24,627 | 5,232 |
| Whitbread PLC | | 755,482 | 40,801 |
| | | | 623,583 |
| Household Durables - 1.2% | | | |
| D.R. Horton, Inc. | | 2,006,424 | 102,468 |
| Lennar Corp. Class A | | 287,000 | 18,150 |
| Mohawk Industries, Inc. (a) | | 257,124 | 70,941 |
| NVR, Inc. (a) | | 17,200 | 60,341 |
| Roku, Inc. Class A | | 37,500 | 1,942 |
| Toll Brothers, Inc. | | 1,426,600 | 68,505 |
| | | | 322,347 |
| Internet & Direct Marketing Retail - 6.2% | | | |
| Amazon.com, Inc. (a) | | 1,042,040 | 1,218,635 |
| ASOS PLC (a) | | 20,500 | 1,859 |
| Blue Apron Holdings, Inc.: | | | |
| Class A | | 222,107 | 895 |
| Class B | | 888,430 | 3,545 |
| Netflix, Inc. (a) | | 1,944,000 | 373,170 |
| Priceline Group, Inc. (a) | | 64,717 | 112,461 |
| Start Today Co. Ltd. | | 414,156 | 12,589 |
| Takeaway.com Holding BV (a)(c) | | 84,600 | 5,165 |
| Zalando SE (a) | | 127,800 | 6,765 |
| | | | 1,735,084 |
| Leisure Products - 0.1% | | | |
| Mattel, Inc. (b) | | 1,930,153 | 29,686 |
| Polaris Industries, Inc. | | 41,000 | 5,084 |
| | | | 34,770 |
| Media - 0.6% | | | |
| Charter Communications, Inc. Class A (a) | | 89,947 | 30,219 |
| Liberty Global PLC Class A (a) | | 166,363 | 5,962 |
| Liberty Media Corp.: | | | |
| Liberty Formula One Group Series C (a) | | 986,200 | 33,689 |
| Liberty SiriusXM Series A (a) | | 536,080 | 21,261 |
| Live Nation Entertainment, Inc. (a) | | 151,400 | 6,445 |
| Sirius XM Holdings, Inc. (b) | | 4,042,800 | 21,669 |
| The Walt Disney Co. | | 121,200 | 13,030 |
| Weinstein Co. Holdings LLC Class A-1 (a)(d)(e)(f) | | 2,267 | 0 |
| WME Entertainment Parent, LLC Class A (a)(d)(e)(f) | | 12,765,400 | 31,914 |
| | | | 164,189 |
| Multiline Retail - 0.5% | | | |
| B&M European Value Retail S.A. | | 1,394,941 | 7,978 |
| Dollar General Corp. | | 695,000 | 64,642 |
| Dollar Tree, Inc. (a) | | 133,200 | 14,294 |
| Ollie's Bargain Outlet Holdings, Inc. (a) | | 906,610 | 48,277 |
| | | | 135,191 |
| Specialty Retail - 1.4% | | | |
| AutoZone, Inc. (a) | | 106,634 | 75,856 |
| Burlington Stores, Inc. (a) | | 15,800 | 1,944 |
| Five Below, Inc. (a) | | 53,100 | 3,522 |
| Home Depot, Inc. | | 743,400 | 140,897 |
| Tiffany & Co., Inc. | | 788,100 | 81,923 |
| TJX Companies, Inc. | | 925,567 | 70,769 |
| | | | 374,911 |
| Textiles, Apparel & Luxury Goods - 0.7% | | | |
| adidas AG | | 251,001 | 50,339 |
| Brunello Cucinelli SpA | | 1,809,352 | 58,637 |
| China Hongxing Sports Ltd. (a)(f) | | 6,000,000 | 258 |
| Hermes International SCA | | 77,200 | 41,335 |
| Kering SA | | 24,000 | 11,317 |
| LVMH Moet Hennessy - Louis Vuitton SA | | 29,298 | 8,599 |
| Under Armour, Inc. Class A (sub. vtg.) (a)(b) | | 914,200 | 13,192 |
| | | | 183,677 |
|
| TOTAL CONSUMER DISCRETIONARY | | | 3,992,074 |
|
| CONSUMER STAPLES - 3.7% | | | |
| Beverages - 0.6% | | | |
| Constellation Brands, Inc. Class A (sub. vtg.) | | 101,600 | 23,223 |
| Fever-Tree Drinks PLC | | 1,093,633 | 33,621 |
| Kweichow Moutai Co. Ltd. (A Shares) | | 81,600 | 8,747 |
| Molson Coors Brewing Co. Class B | | 923,000 | 75,751 |
| Monster Beverage Corp. (a) | | 261,000 | 16,519 |
| The Coca-Cola Co. | | 141,700 | 6,501 |
| | | | 164,362 |
| Food & Staples Retailing - 1.6% | | | |
| Costco Wholesale Corp. | | 633,125 | 117,837 |
| Kroger Co. | | 1,536,100 | 42,166 |
| Performance Food Group Co. (a) | | 481,500 | 15,938 |
| Wal-Mart Stores, Inc. | | 2,537,800 | 250,608 |
| | | | 426,549 |
| Food Products - 0.3% | | | |
| Associated British Foods PLC | | 1,036,892 | 39,479 |
| Greencore Group PLC | | 15,646,423 | 48,524 |
| The Simply Good Foods Co. | | 261,300 | 3,726 |
| | | | 91,729 |
| Personal Products - 1.2% | | | |
| Coty, Inc. Class A | | 2,225,600 | 44,267 |
| Estee Lauder Companies, Inc. Class A | | 1,827,502 | 232,531 |
| L'Oreal SA | | 223,101 | 49,435 |
| Shiseido Co. Ltd. | | 34,200 | 1,653 |
| Unilever NV (Certificaten Van Aandelen) (Bearer) | | 60,000 | 3,378 |
| | | | 331,264 |
|
| TOTAL CONSUMER STAPLES | | | 1,013,904 |
|
| ENERGY - 6.6% | | | |
| Energy Equipment & Services - 0.4% | | | |
| Borr Drilling Ltd. | | 15,662,000 | 66,001 |
| Oceaneering International, Inc. | | 1,829,917 | 38,684 |
| | | | 104,685 |
| Oil, Gas & Consumable Fuels - 6.2% | | | |
| Anadarko Petroleum Corp. | | 1,800,446 | 96,576 |
| Andeavor | | 14,500 | 1,658 |
| Birchcliff Energy Ltd. | | 2,772,774 | 9,706 |
| Birchcliff Energy Ltd. (a)(c) | | 585,400 | 2,049 |
| Cabot Oil & Gas Corp. | | 4,060,480 | 116,130 |
| Canadian Natural Resources Ltd. | | 976,800 | 34,907 |
| Centennial Resource Development, Inc.: | | | |
| Class A (a) | | 1,224,500 | 24,245 |
| Class A (a) | | 2,395,018 | 47,421 |
| Class A (e) | | 555,400 | 10,997 |
| Cheniere Energy, Inc. (a) | | 546,200 | 29,407 |
| Chevron Corp. | | 1,717,700 | 215,039 |
| Cimarex Energy Co. | | 94,300 | 11,506 |
| Concho Resources, Inc. (a) | | 83,300 | 12,513 |
| Concho Resources, Inc. (a) | | 25,680 | 3,858 |
| ConocoPhillips Co. | | 3,290,700 | 180,627 |
| Continental Resources, Inc. (a) | | 704,119 | 37,297 |
| Diamondback Energy, Inc. (a) | | 958,667 | 121,032 |
| EOG Resources, Inc. | | 711,400 | 76,767 |
| Golar LNG Ltd. | | 1,608,700 | 47,955 |
| GoviEx Uranium, Inc. (a) | | 851,865 | 183 |
| GoviEx Uranium, Inc. (a)(c) | | 23,200 | 5 |
| GoviEx Uranium, Inc. Class A (a)(c) | | 2,625,135 | 564 |
| Noble Energy, Inc. | | 1,454,861 | 42,395 |
| Phillips 66 Co. | | 386,400 | 39,084 |
| Pioneer Natural Resources Co. | | 388,000 | 67,066 |
| PrairieSky Royalty Ltd. | | 378,400 | 9,651 |
| Reliance Industries Ltd. | | 3,273,950 | 47,235 |
| Southwestern Energy Co. (a) | | 1,797,800 | 10,032 |
| The Williams Companies, Inc. | | 7,912,800 | 241,261 |
| Valero Energy Corp. | | 189,974 | 17,461 |
| Whiting Petroleum Corp. (a) | | 500,000 | 13,240 |
| Williams Partners LP | | 4,115,300 | 159,591 |
| | | | 1,727,458 |
|
| TOTAL ENERGY | | | 1,832,143 |
|
| FINANCIALS - 16.2% | | | |
| Banks - 8.8% | | | |
| Bank of America Corp. | | 22,792,527 | 672,835 |
| Citigroup, Inc. | | 5,651,500 | 420,528 |
| First Republic Bank | | 650,200 | 56,333 |
| HDFC Bank Ltd. sponsored ADR | | 1,954,472 | 198,711 |
| JPMorgan Chase & Co. | | 2,896,800 | 309,784 |
| Kotak Mahindra Bank Ltd. | | 1,515,995 | 23,989 |
| M&T Bank Corp. | | 284,712 | 48,683 |
| Metro Bank PLC (a) | | 1,189,532 | 57,561 |
| PNC Financial Services Group, Inc. | | 1,410,265 | 203,487 |
| Royal Bank of Canada | | 145,400 | 11,874 |
| SunTrust Banks, Inc. | | 1,243,800 | 80,337 |
| The Toronto-Dominion Bank | | 294,900 | 17,279 |
| U.S. Bancorp | | 3,809,214 | 204,098 |
| Wells Fargo & Co. | | 2,288,500 | 138,843 |
| | | | 2,444,342 |
| Capital Markets - 1.7% | | | |
| Ashmore Group PLC | | 325,300 | 1,779 |
| Bank of New York Mellon Corp. | | 639,039 | 34,419 |
| BlackRock, Inc. Class A | | 58,000 | 29,795 |
| Brookfield Asset Management, Inc. Class A | | 142,600 | 6,208 |
| CBOE Holdings, Inc. | | 62,200 | 7,749 |
| Charles Schwab Corp. | | 1,567,300 | 80,512 |
| CME Group, Inc. | | 112,100 | 16,372 |
| Goldman Sachs Group, Inc. | | 29,700 | 7,566 |
| IntercontinentalExchange, Inc. | | 216,400 | 15,269 |
| KKR & Co. LP | | 2,607,228 | 54,908 |
| Morgan Stanley | | 1,986,400 | 104,226 |
| MSCI, Inc. | | 260,209 | 32,927 |
| S&P Global, Inc. | | 197,190 | 33,404 |
| The NASDAQ OMX Group, Inc. | | 421,400 | 32,376 |
| | | | 457,510 |
| Consumer Finance - 0.1% | | | |
| Synchrony Financial | | 713,500 | 27,548 |
| Diversified Financial Services - 2.4% | | | |
| Berkshire Hathaway, Inc. Class A (a) | | 2,240 | 666,624 |
| Insurance - 3.2% | | | |
| Admiral Group PLC | | 606,269 | 16,387 |
| AIA Group Ltd. | | 8,224,200 | 70,159 |
| American International Group, Inc. | | 2,592,100 | 154,437 |
| Arch Capital Group Ltd. (a) | | 451,800 | 41,010 |
| Chubb Ltd. | | 1,826,388 | 266,890 |
| Fairfax Financial Holdings Ltd. (sub. vtg.) | | 67,300 | 35,837 |
| First American Financial Corp. | | 1,014,400 | 56,847 |
| FNF Group | | 2,216,500 | 86,975 |
| MetLife, Inc. | | 2,086,900 | 105,514 |
| The Travelers Companies, Inc. | | 356,300 | 48,329 |
| | | | 882,385 |
| Thrifts & Mortgage Finance - 0.0% | | | |
| Radian Group, Inc. | | 451,789 | 9,311 |
|
| TOTAL FINANCIALS | | | 4,487,720 |
|
| HEALTH CARE - 9.5% | | | |
| Biotechnology - 1.6% | | | |
| AbbVie, Inc. | | 355,600 | 34,390 |
| Agios Pharmaceuticals, Inc. (a) | | 828,962 | 47,392 |
| Alnylam Pharmaceuticals, Inc. (a) | | 59,500 | 7,559 |
| Amgen, Inc. | | 585,199 | 101,766 |
| AnaptysBio, Inc. | | 86,300 | 8,692 |
| Biogen, Inc. (a) | | 41,500 | 13,221 |
| bluebird bio, Inc. (a) | | 40,000 | 7,124 |
| Blueprint Medicines Corp. (a) | | 52,500 | 3,959 |
| Celgene Corp. (a) | | 110,500 | 11,532 |
| Exact Sciences Corp. (a) | | 53,700 | 2,821 |
| FibroGen, Inc. (a) | | 271,103 | 12,850 |
| Genmab A/S (a) | | 144,695 | 23,997 |
| Gilead Sciences, Inc. | | 706,200 | 50,592 |
| Insmed, Inc. (a) | | 178,000 | 5,550 |
| Intrexon Corp. (b) | | 482,746 | 5,561 |
| Juno Therapeutics, Inc. (a) | | 87,200 | 3,986 |
| Neurocrine Biosciences, Inc. (a) | | 174,760 | 13,560 |
| Olivo Labs (e)(f) | | 630,333 | 296 |
| Portola Pharmaceuticals, Inc. (a) | | 111,200 | 5,413 |
| Regeneron Pharmaceuticals, Inc. (a) | | 49,400 | 18,572 |
| Sage Therapeutics, Inc. (a) | | 46,600 | 7,675 |
| Vertex Pharmaceuticals, Inc. (a) | | 496,000 | 74,331 |
| | | | 460,839 |
| Health Care Equipment & Supplies - 1.9% | | | |
| Baxter International, Inc. | | 937,900 | 60,626 |
| Becton, Dickinson & Co. | | 450,204 | 96,371 |
| Boston Scientific Corp. (a) | | 7,709,873 | 191,128 |
| Danaher Corp. | | 621,700 | 57,706 |
| DexCom, Inc. (a) | | 736,700 | 42,279 |
| Edwards Lifesciences Corp. (a) | | 43,000 | 4,847 |
| I-Pulse, Inc. (a)(f) | | 58,562 | 305 |
| Intuitive Surgical, Inc. (a) | | 194,800 | 71,090 |
| Penumbra, Inc. (a) | | 58,300 | 5,486 |
| ResMed, Inc. | | 19,900 | 1,685 |
| | | | 531,523 |
| Health Care Providers & Services - 2.8% | | | |
| Aetna, Inc. | | 110,300 | 19,897 |
| Anthem, Inc. | | 14,400 | 3,240 |
| Cigna Corp. | | 42,500 | 8,631 |
| HealthEquity, Inc. (a) | | 31,100 | 1,451 |
| Henry Schein, Inc. (a) | | 1,000,962 | 69,947 |
| Humana, Inc. | | 116,000 | 28,776 |
| National Vision Holdings, Inc. | | 704,200 | 28,598 |
| UnitedHealth Group, Inc. | | 2,524,300 | 556,507 |
| Universal Health Services, Inc. Class B | | 500,200 | 56,698 |
| | | | 773,745 |
| Health Care Technology - 0.3% | | | |
| Castlight Health, Inc. (a) | | 1,325,100 | 4,969 |
| Cerner Corp. (a) | | 768,530 | 51,791 |
| Medidata Solutions, Inc. (a) | | 66,377 | 4,206 |
| Veeva Systems, Inc. Class A (a) | | 366,300 | 20,249 |
| | | | 81,215 |
| Life Sciences Tools & Services - 2.4% | | | |
| Agilent Technologies, Inc. | | 1,553,820 | 104,059 |
| Bruker Corp. | | 847,200 | 29,076 |
| Eurofins Scientific SA�� | | 400,375 | 243,846 |
| Mettler-Toledo International, Inc. (a) | | 244,500 | 151,473 |
| PRA Health Sciences, Inc. (a) | | 151,300 | 13,779 |
| Thermo Fisher Scientific, Inc. | | 484,369 | 91,972 |
| Waters Corp. (a) | | 155,891 | 30,117 |
| | | | 664,322 |
| Pharmaceuticals - 0.5% | | | |
| GlaxoSmithKline PLC | | 3,932,300 | 69,638 |
| GW Pharmaceuticals PLC ADR (a) | | 14,300 | 1,888 |
| Johnson & Johnson | | 95,500 | 13,343 |
| Nektar Therapeutics (a) | | 519,800 | 31,042 |
| Teva Pharmaceutical Industries Ltd. sponsored ADR | | 633,200 | 11,999 |
| | | | 127,910 |
|
| TOTAL HEALTH CARE | | | 2,639,554 |
|
| INDUSTRIALS - 8.0% | | | |
| Aerospace & Defense - 1.9% | | | |
| General Dynamics Corp. | | 853,500 | 173,645 |
| Northrop Grumman Corp. | | 653,954 | 200,705 |
| Space Exploration Technologies Corp.: | | | |
| Class A (a)(e)(f) | | 247,745 | 33,446 |
| Class C (e)(f) | | 4,546 | 614 |
| Teledyne Technologies, Inc. (a) | | 255,400 | 46,266 |
| The Boeing Co. | | 202,400 | 59,690 |
| | | | 514,366 |
| Air Freight & Logistics - 0.5% | | | |
| C.H. Robinson Worldwide, Inc. | | 854,200 | 76,101 |
| Expeditors International of Washington, Inc. | | 26,000 | 1,682 |
| FedEx Corp. | | 90,400 | 22,558 |
| XPO Logistics, Inc. (a) | | 386,000 | 35,354 |
| | | | 135,695 |
| Airlines - 1.1% | | | |
| Ryanair Holdings PLC sponsored ADR (a) | | 1,865,149 | 194,330 |
| Southwest Airlines Co. | | 1,610,800 | 105,427 |
| | | | 299,757 |
| Building Products - 1.3% | | | |
| A.O. Smith Corp. | | 197,090 | 12,078 |
| Fortune Brands Home & Security, Inc. | | 1,291,528 | 88,392 |
| Jeld-Wen Holding, Inc. | | 597,000 | 23,504 |
| Masco Corp. | | 1,953,000 | 85,815 |
| Toto Ltd. | | 2,600,300 | 153,468 |
| | | | 363,257 |
| Commercial Services & Supplies - 0.4% | | | |
| Cintas Corp. | | 166,876 | 26,004 |
| KAR Auction Services, Inc. | | 990,600 | 50,035 |
| Stericycle, Inc. (a) | | 439,500 | 29,882 |
| TulCo LLC (d)(e)(f) | | 17,377 | 6,082 |
| | | | 112,003 |
| Construction & Engineering - 0.0% | | | |
| Jacobs Engineering Group, Inc. | | 124,100 | 8,186 |
| Electrical Equipment - 0.2% | | | |
| AMETEK, Inc. | | 71,400 | 5,174 |
| Fortive Corp. | | 858,034 | 62,079 |
| | | | 67,253 |
| Industrial Conglomerates - 0.3% | | | |
| 3M Co. | | 319,800 | 75,271 |
| ITT, Inc. | | 25,200 | 1,345 |
| Roper Technologies, Inc. | | 12,800 | 3,315 |
| | | | 79,931 |
| Machinery - 1.1% | | | |
| Caterpillar, Inc. | | 229,200 | 36,117 |
| Deere & Co. | | 440,500 | 68,943 |
| Gardner Denver Holdings, Inc. | | 362,500 | 12,300 |
| IDEX Corp. | | 13,000 | 1,716 |
| Illinois Tool Works, Inc. | | 303,500 | 50,639 |
| Ingersoll-Rand PLC | | 136,700 | 12,192 |
| Oshkosh Corp. | | 18,800 | 1,709 |
| PACCAR, Inc. | | 340,800 | 24,224 |
| Parker Hannifin Corp. | | 170,000 | 33,929 |
| Pentair PLC | | 535,700 | 37,831 |
| Rational AG | | 55,300 | 35,644 |
| | | | 315,244 |
| Professional Services - 0.2% | | | |
| Manpower, Inc. | | 37,100 | 4,679 |
| Recruit Holdings Co. Ltd. | | 371,800 | 9,239 |
| TransUnion Holding Co., Inc. (a) | | 803,862 | 44,180 |
| | | | 58,098 |
| Road & Rail - 0.4% | | | |
| CSX Corp. | | 884,600 | 48,662 |
| Genesee & Wyoming, Inc. Class A (a) | | 556,500 | 43,813 |
| Union Pacific Corp. | | 106,000 | 14,215 |
| | | | 106,690 |
| Trading Companies & Distributors - 0.6% | | | |
| Air Lease Corp. Class A (c) | | 320,800 | 15,427 |
| Bunzl PLC | | 1,547,300 | 43,286 |
| Fastenal Co. | | 52,083 | 2,848 |
| United Rentals, Inc. (a) | | 628,500 | 108,045 |
| | | | 169,606 |
|
| TOTAL INDUSTRIALS | | | 2,230,086 |
|
| INFORMATION TECHNOLOGY - 31.2% | | | |
| Communications Equipment - 1.1% | | | |
| Arista Networks, Inc. (a) | | 278,804 | 65,681 |
| Cisco Systems, Inc. | | 5,930,300 | 227,130 |
| | | | 292,811 |
| Electronic Equipment & Components - 1.8% | | | |
| Amphenol Corp. Class A | | 4,692,469 | 411,999 |
| CDW Corp. | | 1,101,828 | 76,566 |
| Corning, Inc. | | 38,729 | 1,239 |
| Dolby Laboratories, Inc. Class A | | 127,242 | 7,889 |
| | | | 497,693 |
| Internet Software & Services - 10.7% | | | |
| Akamai Technologies, Inc. (a) | | 1,215,000 | 79,024 |
| Alibaba Group Holding Ltd. sponsored ADR (a) | | 276,200 | 47,625 |
| Alphabet, Inc.: | | | |
| Class A (a) | | 849,658 | 895,030 |
| Class C (a) | | 262,500 | 274,680 |
| CarGurus, Inc. Class A (b) | | 105,800 | 3,172 |
| Cloudera, Inc. | | 382,184 | 6,314 |
| CoStar Group, Inc. (a) | | 3,300 | 980 |
| Dropbox, Inc. Class B (a)(e)(f) | | 1,289,836 | 18,367 |
| eBay, Inc. (a) | | 1,171,500 | 44,212 |
| Facebook, Inc. Class A (a) | | 7,671,261 | 1,353,676 |
| GoDaddy, Inc. (a) | | 1,283,800 | 64,549 |
| LogMeIn, Inc. | | 586,944 | 67,205 |
| New Relic, Inc. (a) | | 117,100 | 6,765 |
| Nutanix, Inc. Class B(c) | | 783,938 | 27,657 |
| Okta, Inc. | | 215,300 | 5,514 |
| Q2 Holdings, Inc. (a) | | 5,197 | 192 |
| Shopify, Inc. Class A (a) | | 94,500 | 9,556 |
| SurveyMonkey (a)(e)(f) | | 2,069,881 | 26,453 |
| Tencent Holdings Ltd. | | 957,500 | 49,558 |
| | | | 2,980,529 |
| IT Services - 5.4% | | | |
| Accenture PLC Class A | | 174,640 | 26,736 |
| ASAC II LP (a)(e)(f) | | 9,408,021 | 1,581 |
| EPAM Systems, Inc. (a) | | 101,700 | 10,926 |
| Fidelity National Information Services, Inc. | | 416,230 | 39,163 |
| First Data Corp. Class A (a) | | 6,794,403 | 113,534 |
| Fiserv, Inc. (a) | | 613,457 | 80,443 |
| FleetCor Technologies, Inc. (a) | | 185,500 | 35,696 |
| Global Payments, Inc. | | 275,392 | 27,605 |
| Leidos Holdings, Inc. | | 1,167,300 | 75,373 |
| MasterCard, Inc. Class A | | 865,248 | 130,964 |
| PayPal Holdings, Inc. (a) | | 5,268,021 | 387,832 |
| Square, Inc. (a) | | 197,600 | 6,851 |
| Visa, Inc. Class A | | 4,837,667 | 551,591 |
| | | | 1,488,295 |
| Semiconductors & Semiconductor Equipment - 2.4% | | | |
| Analog Devices, Inc. | | 151,100 | 13,452 |
| Applied Materials, Inc. | | 1,434,100 | 73,311 |
| Broadcom Ltd. | | 142,786 | 36,682 |
| First Solar, Inc. (a) | | 101,900 | 6,880 |
| KLA-Tencor Corp. | | 245,194 | 25,763 |
| Lam Research Corp. | | 209,841 | 38,625 |
| NVIDIA Corp. | | 678,300 | 131,251 |
| Qualcomm, Inc. | | 4,093,700 | 262,079 |
| Taiwan Semiconductor Manufacturing Co. Ltd. sponsored ADR | | 230,400 | 9,135 |
| Texas Instruments, Inc. | | 645,139 | 67,378 |
| | | | 664,556 |
| Software - 9.1% | | | |
| Activision Blizzard, Inc. | | 6,264,134 | 396,645 |
| Adobe Systems, Inc. (a) | | 2,605,286 | 456,550 |
| ANSYS, Inc. (a) | | 402,900 | 59,464 |
| Atlassian Corp. PLC (a) | | 546,750 | 24,888 |
| Black Knight, Inc. (a) | | 679,650 | 30,007 |
| CDK Global, Inc. | | 224,594 | 16,009 |
| Constellation Software, Inc. | | 18,700 | 11,336 |
| Electronic Arts, Inc. (a) | | 1,563,506 | 164,262 |
| Intuit, Inc. | | 393,054 | 62,016 |
| Micro Focus International PLC | | 246,800 | 8,407 |
| Microsoft Corp. | | 7,325,931 | 626,660 |
| Nintendo Co. Ltd. | | 22,300 | 8,030 |
| Parametric Technology Corp. (a) | | 130,500 | 7,930 |
| Paycom Software, Inc. (a) | | 254,981 | 20,483 |
| Red Hat, Inc. (a) | | 287,568 | 34,537 |
| RingCentral, Inc. (a) | | 176,600 | 8,547 |
| Salesforce.com, Inc. (a) | | 4,095,900 | 418,724 |
| Tanium, Inc. Class B (e)(f) | | 692,100 | 3,550 |
| Trion World, Inc. (a)(e)(f) | | 702,569 | 0 |
| Trion World, Inc. warrants 10/3/18 (a)(e)(f) | | 27,981 | 0 |
| Ultimate Software Group, Inc. (a) | | 386,903 | 84,434 |
| Workday, Inc. Class A (a) | | 979,302 | 99,634 |
| | | | 2,542,113 |
| Technology Hardware, Storage & Peripherals - 0.7% | | | |
| Apple, Inc. | | 1,182,654 | 200,141 |
| Samsung Electronics Co. Ltd. | | 1,121 | 2,676 |
| | | | 202,817 |
|
| TOTAL INFORMATION TECHNOLOGY | | | 8,668,814 |
|
| MATERIALS - 2.5% | | | |
| Chemicals - 1.2% | | | |
| Air Products & Chemicals, Inc. | | 268,200 | 44,006 |
| DowDuPont, Inc. | | 1,632,100 | 116,238 |
| LyondellBasell Industries NV Class A | | 110,000 | 12,135 |
| Olin Corp. | | 185,000 | 6,582 |
| Potash Corp. of Saskatchewan, Inc. | | 1,809,300 | 37,107 |
| Sherwin-Williams Co. | | 245,200 | 100,542 |
| The Chemours Co. LLC | | 137,200 | 6,868 |
| Westlake Chemical Corp. | | 194,700 | 20,741 |
| | | | 344,219 |
| Construction Materials - 0.0% | | | |
| Eagle Materials, Inc. | | 15,800 | 1,790 |
| Containers & Packaging - 0.1% | | | |
| WestRock Co. | | 518,006 | 32,743 |
| Metals & Mining - 1.2% | | | |
| ArcelorMittal SA Class A unit (a) | | 268,300 | 8,669 |
| Arizona Mining, Inc. (a) | | 200,710 | 552 |
| B2Gold Corp. (a) | | 32,219,132 | 99,451 |
| Franco-Nevada Corp. | | 1,350,761 | 107,953 |
| Freeport-McMoRan, Inc. (a) | | 164,600 | 3,121 |
| Ivanhoe Mines Ltd. (a) | | 7,931,000 | 26,752 |
| Kirkland Lake Gold Ltd. | | 545,552 | 8,363 |
| Newcrest Mining Ltd. | | 2,598,575 | 46,268 |
| Novagold Resources, Inc. (a) | | 3,369,572 | 13,242 |
| Nucor Corp. | | 83,800 | 5,328 |
| Randgold Resources Ltd. sponsored ADR | | 54,100 | 5,350 |
| | | | 325,049 |
|
| TOTAL MATERIALS | | | 703,801 |
|
| REAL ESTATE - 0.6% | | | |
| Equity Real Estate Investment Trusts (REITs) - 0.4% | | | |
| American Tower Corp. | | 839,775 | 119,811 |
| Real Estate Management & Development - 0.2% | | | |
| Five Point Holdings LLC Class A (a) | | 552,300 | 7,787 |
| Realogy Holdings Corp. | | 1,812,200 | 48,023 |
| | | | 55,810 |
|
| TOTAL REAL ESTATE | | | 175,621 |
|
| TELECOMMUNICATION SERVICES - 0.7% | | | |
| Diversified Telecommunication Services - 0.5% | | | |
| Verizon Communications, Inc. | | 2,679,200 | 141,810 |
| Wireless Telecommunication Services - 0.2% | | | |
| T-Mobile U.S., Inc. (a) | | 912,500 | 57,953 |
|
| TOTAL TELECOMMUNICATION SERVICES | | | 199,763 |
|
| UTILITIES - 1.6% | | | |
| Electric Utilities - 1.6% | | | |
| Alliant Energy Corp. | | 1,739,000 | 74,099 |
| Duke Energy Corp. | | 1,073,400 | 90,284 |
| Exelon Corp. | | 2,076,800 | 81,847 |
| IDACORP, Inc. | | 400,000 | 36,544 |
| Southern Co. | | 1,079,600 | 51,918 |
| Xcel Energy, Inc. | | 1,942,200 | 93,439 |
| | | | 428,131 |
| TOTAL COMMON STOCKS | | | |
| (Cost $15,446,980) | | | 26,371,611 |
|
| Preferred Stocks - 1.6% | | | |
| Convertible Preferred Stocks - 1.3% | | | |
| CONSUMER DISCRETIONARY - 0.2% | | | |
| Household Durables - 0.0% | | | |
| Blu Homes, Inc. Series A, 5.00% (a)(e)(f) | | 7,091,632 | 142 |
| Leisure Products - 0.1% | | | |
| Peloton Interactive, Inc. Series E (e)(f) | | 692,463 | 16,127 |
| Textiles, Apparel & Luxury Goods - 0.1% | | | |
| Bolt Threads, Inc. Series D (e)(f) | | 1,324,673 | 21,247 |
| resTORbio, Inc. Series B (e) | | 1,198,179 | 12,629 |
| | | | 33,876 |
| TOTAL CONSUMER DISCRETIONARY | | | 50,145 |
| CONSUMER STAPLES - 0.0% | | | |
| Food & Staples Retailing - 0.0% | | | |
| Roofoods Ltd. Series F (e)(f) | | 21,314 | 7,536 |
| FINANCIALS - 0.1% | | | |
| Consumer Finance - 0.1% | | | |
| Oportun Finance Corp. Series H (a)(e)(f) | | 10,791,166 | 31,942 |
| HEALTH CARE - 0.2% | | | |
| Biotechnology - 0.2% | | | |
| 23andMe, Inc.: | | | |
| Series E (a)(e)(f) | | 166,247 | 2,308 |
| Series F (e)(f) | | 462,756 | 6,425 |
| Intarcia Therapeutics, Inc. Series CC (a)(e)(f) | | 516,522 | 30,991 |
| | | | 39,724 |
| Health Care Providers & Services - 0.0% | | | |
| Mulberry Health, Inc. Series A8 (a)(e)(f) | | 1,159,721 | 7,376 |
| TOTAL HEALTH CARE | | | 47,100 |
| INDUSTRIALS - 0.1% | | | |
| Aerospace & Defense - 0.1% | | | |
| Space Exploration Technologies Corp.: | | | |
| Series G (a)(e)(f) | | 145,254 | 19,609 |
| Series H (e)(f) | | 42,094 | 5,683 |
| | | | 25,292 |
| INFORMATION TECHNOLOGY - 0.7% | | | |
| Internet Software & Services - 0.6% | | | |
| Dropbox, Inc.: | | | |
| Series A (a)(e)(f) | | 299,518 | 4,265 |
| Series C (a)(e)(f) | | 161,770 | 2,494 |
| Lyft, Inc. Series H (e)(f) | | 697,377 | 27,718 |
| Pinterest, Inc.: | | | |
| Series E, 8.00% (a)(e)(f) | | 13,203,155 | 78,955 |
| Series F, 8.00% (a)(e)(f) | | 8,808,645 | 52,676 |
| Series G, 8.00% (a)(e)(f) | | 1,676,465 | 10,025 |
| | | | 176,133 |
| Software - 0.1% | | | |
| Magic Leap, Inc. Series D (e)(f) | | 555,556 | 15,000 |
| TOTAL INFORMATION TECHNOLOGY | | | 191,133 |
| REAL ESTATE - 0.0% | | | |
| Real Estate Management & Development - 0.0% | | | |
| WeWork Companies, Inc. Series F (a)(e)(f) | | 35,018 | 1,814 |
|
| TOTAL CONVERTIBLE PREFERRED STOCKS | | | 354,962 |
|
| Nonconvertible Preferred Stocks - 0.3% | | | |
| CONSUMER DISCRETIONARY - 0.2% | | | |
| Automobiles - 0.2% | | | |
| Porsche Automobil Holding SE (Germany) | | 750,798 | 62,861 |
| HEALTH CARE - 0.1% | | | |
| Health Care Equipment & Supplies - 0.1% | | | |
| Sartorius AG (non-vtg.) | | 357,200 | 34,090 |
|
| TOTAL NONCONVERTIBLE PREFERRED STOCKS | | | 96,951 |
|
| TOTAL PREFERRED STOCKS | | | |
| (Cost $359,359) | | | 451,913 |
| | | Principal Amount (000s) | Value (000s) |
|
| Corporate Bonds - 0.1% | | | |
| Convertible Bonds - 0.0% | | | |
| INFORMATION TECHNOLOGY - 0.0% | | | |
| Software - 0.0% | | | |
| Trion World, Inc. 10% 10/10/19 pay-in-kind (e)(f)(g) | | 298 | 118 |
| Nonconvertible Bonds - 0.1% | | | |
| ENERGY - 0.0% | | | |
| Energy Equipment & Services - 0.0% | | | |
| Pacific Drilling SA 5.375% 6/1/20(c)(h) | | 39,145 | 16,049 |
| HEALTH CARE - 0.1% | | | |
| Pharmaceuticals - 0.1% | | | |
| Valeant Pharmaceuticals International, Inc.: | | | |
| 6.125% 4/15/25 (c) | | 9,840 | 9,004 |
| 9% 12/15/25 (c) | | 11,048 | 11,514 |
| | | | 20,518 |
|
| TOTAL NONCONVERTIBLE BONDS | | | 36,567 |
|
| TOTAL CORPORATE BONDS | | | |
| (Cost $47,121) | | | 36,685 |
| | | Shares | Value (000s) |
|
| Other - 0.1% | | | |
| ENERGY - 0.1% | | | |
| Oil, Gas & Consumable Fuels - 0.1% | | | |
| Utica Shale Drilling Program (non-operating revenue interest) (d)(e)(f) | | | |
| (Cost $50,430) | | 50,430,153 | 38,831 |
|
| Money Market Funds - 3.2% | | | |
| Fidelity Cash Central Fund, 1.36% (i) | | 851,482,933 | 851,653 |
| Fidelity Securities Lending Cash Central Fund 1.36% (i)(j) | | 37,525,055 | 37,533 |
| TOTAL MONEY MARKET FUNDS | | | |
| (Cost $889,146) | | | 889,186 |
| TOTAL INVESTMENT IN SECURITIES - 100.0% | | | |
| (Cost $16,793,036) | | | 27,788,226 |
| NET OTHER ASSETS (LIABILITIES) - 0.0% | | | (13,312) |
| NET ASSETS - 100% | | | $27,774,914 |
Values shown as $0 may reflect amounts less than $500.
Legend
(a) Non-income producing
(b) Security or a portion of the security is on loan at period end.
(c) Security exempt from registration under Rule 144A of the Securities Act of 1933. These securities may be resold in transactions exempt from registration, normally to qualified institutional buyers. At the end of the period, the value of these securities amounted to $87,434,000 or 0.3% of net assets.
(d) Investment is owned by a wholly-owned subsidiary (Subsidiary) that is treated as a corporation for U.S. tax purposes.
(e) Restricted securities - Investment in securities not registered under the Securities Act of 1933 (excluding 144A issues). At the end of the period, the value of restricted securities (excluding 144A issues) amounted to $527,211,000 or 1.9% of net assets.
(f) Level 3 security
(g) Coupon rates for floating and adjustable rate securities reflect the rates in effect at period end.
(h) Non-income producing - Security is in default.
(i) Affiliated fund that is generally available only to investment companies and other accounts managed by Fidelity Investments. The rate quoted is the annualized seven-day yield of the fund at period end. A complete unaudited listing of the fund's holdings as of its most recent quarter end is available upon request. In addition, each Fidelity Central Fund's financial statements, which are not covered by the Fund's Report of Independent Registered Public Accounting Firm, are available on the SEC's website or upon request.
(j) Investment made with cash collateral received from securities on loan.
Additional information on each restricted holding is as follows:
| Security | Acquisition Date | Acquisition Cost (000s) |
| 23andMe, Inc. Series E | 6/18/15 | $1,800 |
| 23andMe, Inc. Series F | 8/31/17 | $6,425 |
| ASAC II LP | 10/10/13 | $725 |
| Blu Homes, Inc. Series A, 5.00% | 6/10/13 - 12/30/14 | $32,763 |
| Bolt Threads, Inc. Series D | 12/13/17 | $21,247 |
| Centennial Resource Development, Inc. Class A | 12/28/16 | $8,076 |
| Dropbox, Inc. Class B | 5/2/12 | $11,672 |
| Dropbox, Inc. Series A | 5/29/12 | $2,710 |
| Dropbox, Inc. Series C | 1/30/14 | $3,090 |
| Intarcia Therapeutics, Inc. Series CC | 11/14/12 | $7,040 |
| Lyft, Inc. Series H | 11/22/17 | $27,718 |
| Magic Leap, Inc. Series D | 10/6/17 | $15,000 |
| Mulberry Health, Inc. Series A8 | 1/20/16 | $7,834 |
| Olivo Labs | 2/8/17 | $763 |
| Oportun Finance Corp. Series H | 2/6/15 | $30,726 |
| Peloton Interactive, Inc. Series E | 3/31/17 | $15,000 |
| Pinterest, Inc. Series E, 8.00% | 10/23/13 | $38,370 |
| Pinterest, Inc. Series F, 8.00% | 5/15/14 | $29,923 |
| Pinterest, Inc. Series G, 8.00% | 2/27/15 | $12,035 |
| resTORbio, Inc. Series B | 11/29/17 | $10,000 |
| Roofoods Ltd. Series F | 9/12/17 | $7,536 |
| Space Exploration Technologies Corp. Class A | 10/16/15 - 9/11/17 | $25,597 |
| Space Exploration Technologies Corp. Class C | 9/11/17 | $614 |
| Space Exploration Technologies Corp. Series G | 1/20/15 | $11,251 |
| Space Exploration Technologies Corp. Series H | 8/4/17 | $5,682 |
| SurveyMonkey | 12/15/14 | $34,050 |
| Tanium, Inc. Class B | 4/21/17 | $3,436 |
| Trion World, Inc. | 8/22/08 - 3/20/13 | $3,834 |
| Trion World, Inc. warrants 10/3/18 | 10/10/13 | $0 |
| Trion World, Inc. 10% 10/10/19 pay-in-kind | 10/10/13 - 10/10/17 | $298 |
| TulCo LLC | 8/24/17 | $6,082 |
| Utica Shale Drilling Program (non-operating revenue interest) | 10/5/16 - 9/1/17 | $50,430 |
| Weinstein Co. Holdings LLC Class A-1 | 10/19/05 | $2,299 |
| WeWork Companies, Inc. Series F | 12/1/16 | $1,758 |
| WME Entertainment Parent, LLC Class A | 8/16/16 | $25,816 |
Affiliated Central Funds
Information regarding fiscal year to date income earned by the Fund from investments in Fidelity Central Funds is as follows:
| Fund | Income earned |
| | (Amounts in thousands) |
| Fidelity Cash Central Fund | $6,638 |
| Fidelity Securities Lending Cash Central Fund | 3,377 |
| Total | $10,015 |
Amounts in the income column in the above table include any capital gain distributions from underlying funds, which are presented in the corresponding line-item in the Statement of Operations if applicable.
Other Affiliated Issuers
An affiliated company is a company in which the Fund has ownership of at least 5% of the voting securities. Fiscal year to date transactions with companies which are or were affiliates are as follows:
| Affiliate (Amounts in thousands) | Value, beginning of period | Purchases | Sales Proceeds | Dividend Income | Realized Gain (loss) | Change in Unrealized appreciation (depreciation) | Value, end of period |
| Amplify Snack Brands, Inc. | $33,334 | $1,860 | $28,662 | $-- | $(25,138) | $18,606 | $-- |
| Total | $33,334 | $1,860 | $28,662 | $-- | $(25,138) | $18,606 | $-- |
Investment Valuation
The following is a summary of the inputs used, as of December 31, 2017, involving the Fund's assets and liabilities carried at fair value. The inputs or methodology used for valuing securities may not be an indication of the risk associated with investing in those securities. For more information on valuation inputs, and their aggregation into the levels used below, please refer to the Investment Valuation section in the accompanying Notes to Financial Statements.
| | Valuation Inputs at Reporting Date: |
| Description | Total | Level 1 | Level 2 | Level 3 |
| (Amounts in thousands) | | | | |
| Investments in Securities: | | | | |
| Equities: | | | | |
| Consumer Discretionary | $4,105,080 | $3,990,835 | $44,557 | $69,688 |
| Consumer Staples | 1,021,440 | 961,091 | 52,813 | 7,536 |
| Energy | 1,832,143 | 1,832,143 | -- | -- |
| Financials | 4,519,662 | 4,487,720 | -- | 31,942 |
| Health Care | 2,720,744 | 2,603,405 | 69,638 | 47,701 |
| Industrials | 2,255,378 | 2,189,944 | -- | 65,434 |
| Information Technology | 8,859,947 | 8,561,275 | 57,588 | 241,084 |
| Materials | 703,801 | 703,801 | -- | -- |
| Real Estate | 177,435 | 175,621 | -- | 1,814 |
| Telecommunication Services | 199,763 | 199,763 | -- | -- |
| Utilities | 428,131 | 428,131 | -- | -- |
| Corporate Bonds | 36,685 | -- | 36,567 | 118 |
| Other | 38,831 | -- | -- | 38,831 |
| Money Market Funds | 889,186 | 889,186 | -- | -- |
| Total Investments in Securities: | $27,788,226 | $27,022,915 | $261,163 | $504,148 |
The following is a reconciliation of Investments in Securities for which Level 3 inputs were used in determining value:
| (Amounts in thousands) | |
| Investments in Securities: | |
| Beginning Balance | $482,803 |
| Net Realized Gain (Loss) on Investment Securities | (23,245) |
| Net Unrealized Gain (Loss) on Investment Securities | (50,830) |
| Cost of Purchases | 200,674 |
| Proceeds of Sales | (105,254) |
| Amortization/Accretion | -- |
| Transfers into Level 3 | -- |
| Transfers out of Level 3 | -- |
| Ending Balance | $504,148 |
| The change in unrealized gain (loss) for the period attributable to Level 3 securities held at December 31, 2017 | $(64,933) |
The information used in the above reconciliations represents fiscal year to date activity for any Investments in Securities identified as using Level 3 inputs at either the beginning or the end of the current fiscal period. Transfers in or out of Level 3 represent the beginning value of any Security or Instrument where a change in the pricing level occurred from the beginning to the end of the period. The cost of purchases and the proceeds of sales may include securities received or delivered through corporate actions or exchanges. Realized and unrealized gains (losses) disclosed in the reconciliations are included in Net Gain (Loss) on the Fund's Statement of Operations.
Other Information
Distribution of investments by country or territory of incorporation, as a percentage of Total Net Assets, is as follows (Unaudited):
| United States of America | 89.2% |
| Canada | 1.8% |
| United Kingdom | 1.2% |
| Ireland | 1.1% |
| India | 1.0% |
| Switzerland | 1.0% |
| Others (Individually Less Than 1%) | 4.7% |
| | 100.0% |
See accompanying notes which are an integral part of the financial statements.
Financial Statements
Statement of Assets and Liabilities
| Amounts in thousands (except per-share amounts) | | December 31, 2017 |
| Assets | | |
Investment in securities, at value (including securities loaned of $35,580) — See accompanying schedule:
Unaffiliated issuers (cost $15,903,890) | $26,899,040 | |
| Fidelity Central Funds (cost $889,146) | 889,186 | |
| Total Investment in Securities (cost $16,793,036) | | $27,788,226 |
| Restricted cash | | 351 |
| Receivable for investments sold | | 96,380 |
| Receivable for fund shares sold | | 13,609 |
| Dividends receivable | | 12,196 |
| Interest receivable | | 1,117 |
| Distributions receivable from Fidelity Central Funds | | 1,042 |
| Prepaid expenses | | 46 |
| Other receivables | | 937 |
| Total assets | | 27,913,904 |
| Liabilities | | |
| Payable to custodian bank | $298 | |
| Payable for investments purchased | 36,360 | |
| Payable for fund shares redeemed | 40,796 | |
| Accrued management fee | 13,414 | |
| Distribution and service plan fees payable | 5,059 | |
| Other affiliated payables | 4,000 | |
| Other payables and accrued expenses | 1,597 | |
| Collateral on securities loaned | 37,466 | |
| Total liabilities | | 138,990 |
| Net Assets | | $27,774,914 |
| Net Assets consist of: | | |
| Paid in capital | | $16,238,644 |
| Distributions in excess of net investment income | | (20,743) |
| Accumulated undistributed net realized gain (loss) on investments and foreign currency transactions | | 562,297 |
| Net unrealized appreciation (depreciation) on investments and assets and liabilities in foreign currencies | | 10,994,716 |
| Net Assets | | $27,774,914 |
| Calculation of Maximum Offering Price | | |
| Class A: | | |
| Net Asset Value and redemption price per share ($5,611,608 ÷ 178,855 shares) | | $31.38 |
| Maximum offering price per share (100/94.25 of $31.38) | | $33.29 |
| Class M: | | |
| Net Asset Value and redemption price per share ($1,925,602 ÷ 63,371 shares) | | $30.39 |
| Maximum offering price per share (100/96.50 of $30.39) | | $31.49 |
| Class C: | | |
| Net Asset Value and offering price per share ($3,717,633 ÷ 134,550 shares)(a) | | $27.63 |
| Class I: | | |
| Net Asset Value, offering price and redemption price per share ($14,894,212 ÷ 465,005 shares) | | $32.03 |
| Class Z: | | |
| Net Asset Value, offering price and redemption price per share ($1,625,859 ÷ 50,720 shares) | | $32.06 |
(a) Redemption price per share is equal to net asset value less any applicable contingent deferred sales charge.
See accompanying notes which are an integral part of the financial statements.
Statement of Operations
| Amounts in thousands | | Year ended December 31, 2017 |
| Investment Income | | |
| Dividends | | $263,693 |
| Interest | | 4,780 |
| Income from Fidelity Central Funds | | 10,015 |
| Total income | | 278,488 |
| Expenses | | |
| Management fee | | |
| Basic fee | $143,817 | |
| Performance adjustment | (13,635) | |
| Transfer agent fees | 45,168 | |
| Distribution and service plan fees | 60,390 | |
| Accounting and security lending fees | 1,950 | |
| Custodian fees and expenses | 512 | |
| Independent trustees' fees and expenses | 104 | |
| Registration fees | 294 | |
| Audit | 120 | |
| Legal | 71 | |
| Miscellaneous | 214 | |
| Total expenses before reductions | 239,005 | |
| Expense reductions | (711) | 238,294 |
| Net investment income (loss) | | 40,194 |
| Realized and Unrealized Gain (Loss) | | |
| Net realized gain (loss) on: | | |
| Investment securities: | | |
| Unaffiliated issuers | 2,676,216 | |
| Fidelity Central Funds | 22 | |
| Other affiliated issuers | (25,138) | |
| Foreign currency transactions | (309) | |
| Total net realized gain (loss) | | 2,650,791 |
| Change in net unrealized appreciation (depreciation) on: | | |
| Unaffiliated issuers (net of increase in deferred foreign taxes of $546) | 3,764,443 | |
| Fidelity Central Funds | (11) | |
| Other affiliated issuers | 18,606 | |
| Assets and liabilities in foreign currencies | 109 | |
| Total change in net unrealized appreciation (depreciation) | | 3,783,147 |
| Net gain (loss) | | 6,433,938 |
| Net increase (decrease) in net assets resulting from operations | | $6,474,132 |
See accompanying notes which are an integral part of the financial statements.
Statement of Changes in Net Assets
| Amounts in thousands | Year ended December 31, 2017 | Year ended December 31, 2016 |
| Increase (Decrease) in Net Assets | | |
| Operations | | |
| Net investment income (loss) | $40,194 | $59,840 |
| Net realized gain (loss) | 2,650,791 | 1,325,816 |
| Change in net unrealized appreciation (depreciation) | 3,783,147 | 103,608 |
| Net increase (decrease) in net assets resulting from operations | 6,474,132 | 1,489,264 |
| Distributions to shareholders from net investment income | (45,645) | (60,850) |
| Distributions to shareholders from net realized gain | (2,034,583) | (1,185,388) |
| Total distributions | (2,080,228) | (1,246,238) |
| Share transactions - net increase (decrease) | (1,016,987) | (2,529,933) |
| Total increase (decrease) in net assets | 3,376,917 | (2,286,907) |
| Net Assets | | |
| Beginning of period | 24,397,997 | 26,684,904 |
| End of period | $27,774,914 | $24,397,997 |
| Other Information | | |
| Undistributed net investment income end of period | $– | $2,020 |
| Distributions in excess of net investment income end of period | $(20,743) | $– |
See accompanying notes which are an integral part of the financial statements.
Financial Highlights
Fidelity Advisor New Insights Fund Class A
| Years ended December 31, | 2017 | 2016 | 2015 | 2014 | 2013 |
| Selected Per–Share Data | | | | | |
| Net asset value, beginning of period | $26.44 | $26.14 | $26.67 | $26.32 | $22.75 |
| Income from Investment Operations | | | | | |
| Net investment income (loss)A | .04 | .06 | .05 | .04 | .01 |
| Net realized and unrealized gain (loss) | 7.29 | 1.56 | .57 | 2.34 | 7.21 |
| Total from investment operations | 7.33 | 1.62 | .62 | 2.38 | 7.22 |
| Distributions from net investment income | –B | (.04) | (.02) | – | – |
| Distributions from net realized gain | (2.39) | (1.28) | (1.13) | (2.03) | (3.65) |
| Total distributions | (2.39) | (1.32) | (1.15) | (2.03) | (3.65) |
| Net asset value, end of period | $31.38 | $26.44 | $26.14 | $26.67 | $26.32 |
| Total ReturnC,D | 27.98% | 6.31% | 2.39% | 9.20% | 32.36% |
| Ratios to Average Net AssetsE,F | | | | | |
| Expenses before reductions | .94% | .89% | .92% | .92% | .94% |
| Expenses net of fee waivers, if any | .94% | .89% | .91% | .92% | .94% |
| Expenses net of all reductions | .93% | .88% | .91% | .92% | .94% |
| Net investment income (loss) | .12% | .24% | .20% | .13% | .02% |
| Supplemental Data | | | | | |
| Net assets, end of period (in millions) | $5,612 | $6,873 | $7,920 | $8,475 | $8,634 |
| Portfolio turnover rateG | 30% | 42% | 47% | 62% | 79% |
A Calculated based on average shares outstanding during the period.
B Amount represents less than $.005 per share.
C Total returns would have been lower if certain expenses had not been reduced during the applicable periods shown.
D Total returns do not include the effect of the sales charges.
E Fees and expenses of any underlying Fidelity Central Funds are not included in the Fund's expense ratio. The Fund indirectly bears its proportionate share of the expenses of any underlying Fidelity Central Funds.
F Expense ratios reflect operating expenses of the class. Expenses before reductions do not reflect amounts reimbursed by the investment adviser or reductions from brokerage service arrangements or reductions from other expense offset arrangements and do not represent the amount paid by the class during periods when reimbursements or reductions occur. Expenses net of fee waivers reflect expenses after reimbursement by the investment adviser but prior to reductions from brokerage service arrangements or other expense offset arrangements. Expenses net of all reductions represent the net expenses paid by the class.
G Amount does not include the portfolio activity of any underlying Fidelity Central Funds.
See accompanying notes which are an integral part of the financial statements.
Fidelity Advisor New Insights Fund Class M
| Years ended December 31, | 2017 | 2016 | 2015 | 2014 | 2013 |
| Selected Per–Share Data | | | | | |
| Net asset value, beginning of period | $25.73 | $25.51 | $26.10 | $25.84 | $22.44 |
| Income from Investment Operations | | | | | |
| Net investment income (loss)A | (.04) | –B | (.01) | (.03) | (.06) |
| Net realized and unrealized gain (loss) | 7.09 | 1.50 | .55 | 2.31 | 7.11 |
| Total from investment operations | 7.05 | 1.50 | .54 | 2.28 | 7.05 |
| Distributions from net investment income | –B | –B | – | – | – |
| Distributions from net realized gain | (2.39) | (1.28) | (1.13) | (2.02) | (3.65) |
| Total distributions | (2.39) | (1.28) | (1.13) | (2.02) | (3.65) |
| Net asset value, end of period | $30.39 | $25.73 | $25.51 | $26.10 | $25.84 |
| Total ReturnC,D | 27.66% | 6.01% | 2.14% | 8.98% | 32.05% |
| Ratios to Average Net AssetsE,F | | | | | |
| Expenses before reductions | 1.18% | 1.14% | 1.17% | 1.17% | 1.18% |
| Expenses net of fee waivers, if any | 1.18% | 1.14% | 1.16% | 1.17% | 1.18% |
| Expenses net of all reductions | 1.18% | 1.13% | 1.16% | 1.17% | 1.18% |
| Net investment income (loss) | (.13)% | (.01)% | (.05)% | (.11)% | (.22)% |
| Supplemental Data | | | | | |
| Net assets, end of period (in millions) | $1,926 | $1,849 | $2,071 | $2,219 | $2,134 |
| Portfolio turnover rateG | 30% | 42% | 47% | 62% | 79% |
A Calculated based on average shares outstanding during the period.
B Amount represents less than $.005 per share.
C Total returns would have been lower if certain expenses had not been reduced during the applicable periods shown.
D Total returns do not include the effect of the sales charges.
E Fees and expenses of any underlying Fidelity Central Funds are not included in the Fund's expense ratio. The Fund indirectly bears its proportionate share of the expenses of any underlying Fidelity Central Funds.
F Expense ratios reflect operating expenses of the class. Expenses before reductions do not reflect amounts reimbursed by the investment adviser or reductions from brokerage service arrangements or reductions from other expense offset arrangements and do not represent the amount paid by the class during periods when reimbursements or reductions occur. Expenses net of fee waivers reflect expenses after reimbursement by the investment adviser but prior to reductions from brokerage service arrangements or other expense offset arrangements. Expenses net of all reductions represent the net expenses paid by the class.
G Amount does not include the portfolio activity of any underlying Fidelity Central Funds.
See accompanying notes which are an integral part of the financial statements.
Fidelity Advisor New Insights Fund Class C
| Years ended December 31, | 2017 | 2016 | 2015 | 2014 | 2013 |
| Selected Per–Share Data | | | | | |
| Net asset value, beginning of period | $23.69 | $23.70 | $24.45 | $24.45 | $21.49 |
| Income from Investment Operations | | | | | |
| Net investment income (loss)A | (.17) | (.12) | (.14) | (.16) | (.18) |
| Net realized and unrealized gain (loss) | 6.50 | 1.39 | .52 | 2.18 | 6.79 |
| Total from investment operations | 6.33 | 1.27 | .38 | 2.02 | 6.61 |
| Distributions from net investment income | –B | –B | – | – | – |
| Distributions from net realized gain | (2.39) | (1.28) | (1.13) | (2.02) | (3.65) |
| Total distributions | (2.39) | (1.28) | (1.13) | (2.02) | (3.65) |
| Net asset value, end of period | $27.63 | $23.69 | $23.70 | $24.45 | $24.45 |
| Total ReturnC,D | 26.99% | 5.49% | 1.63% | 8.43% | 31.41% |
| Ratios to Average Net AssetsE,F | | | | | |
| Expenses before reductions | 1.68% | 1.64% | 1.67% | 1.67% | 1.69% |
| Expenses net of fee waivers, if any | 1.68% | 1.64% | 1.66% | 1.67% | 1.69% |
| Expenses net of all reductions | 1.68% | 1.63% | 1.66% | 1.67% | 1.69% |
| Net investment income (loss) | (.63)% | (.51)% | (.55)% | (.62)% | (.73)% |
| Supplemental Data | | | | | |
| Net assets, end of period (in millions) | $3,718 | $3,521 | $3,841 | $3,889 | $3,459 |
| Portfolio turnover rateG | 30% | 42% | 47% | 62% | 79% |
A Calculated based on average shares outstanding during the period.
B Amount represents less than $.005 per share.
C Total returns would have been lower if certain expenses had not been reduced during the applicable periods shown.
D Total returns do not include the effect of the contingent deferred sales charge.
E Fees and expenses of any underlying Fidelity Central Funds are not included in the Fund's expense ratio. The Fund indirectly bears its proportionate share of the expenses of any underlying Fidelity Central Funds.
F Expense ratios reflect operating expenses of the class. Expenses before reductions do not reflect amounts reimbursed by the investment adviser or reductions from brokerage service arrangements or reductions from other expense offset arrangements and do not represent the amount paid by the class during periods when reimbursements or reductions occur. Expenses net of fee waivers reflect expenses after reimbursement by the investment adviser but prior to reductions from brokerage service arrangements or other expense offset arrangements. Expenses net of all reductions represent the net expenses paid by the class.
G Amount does not include the portfolio activity of any underlying Fidelity Central Funds.
See accompanying notes which are an integral part of the financial statements.
Fidelity Advisor New Insights Fund Class I
| Years ended December 31, | 2017 | 2016 | 2015 | 2014 | 2013 |
| Selected Per–Share Data | | | | | |
| Net asset value, beginning of period | $26.95 | $26.63 | $27.15 | $26.76 | $23.02 |
| Income from Investment Operations | | | | | |
| Net investment income (loss)A | .12 | .13 | .13 | .11 | .07 |
| Net realized and unrealized gain (loss) | 7.44 | 1.59 | .57 | 2.39 | 7.32 |
| Total from investment operations | 7.56 | 1.72 | .70 | 2.50 | 7.39 |
| Distributions from net investment income | (.09) | (.11) | (.09) | (.07) | – |
| Distributions from net realized gain | (2.39) | (1.28) | (1.13) | (2.04) | (3.65) |
| Total distributions | (2.48) | (1.40)B | (1.22) | (2.11) | (3.65) |
| Net asset value, end of period | $32.03 | $26.95 | $26.63 | $27.15 | $26.76 |
| Total ReturnC | 28.30% | 6.55% | 2.64% | 9.51% | 32.73% |
| Ratios to Average Net AssetsD,E | | | | | |
| Expenses before reductions | .68% | .63% | .66% | .67% | .68% |
| Expenses net of fee waivers, if any | .68% | .63% | .66% | .67% | .68% |
| Expenses net of all reductions | .67% | .63% | .66% | .67% | .68% |
| Net investment income (loss) | .38% | .50% | .45% | .39% | .28% |
| Supplemental Data | | | | | |
| Net assets, end of period (in millions) | $14,894 | $11,662 | $12,310 | $13,449 | $11,477 |
| Portfolio turnover rateF | 30% | 42% | 47% | 62% | 79% |
A Calculated based on average shares outstanding during the period.
B Total distributions of $1.40 per share is comprised of distributions from net investment income of $.114 and distributions from net realized gain of $1.281 per share.
C Total returns would have been lower if certain expenses had not been reduced during the applicable periods shown.
D Fees and expenses of any underlying Fidelity Central Funds are not included in the Fund's expense ratio. The Fund indirectly bears its proportionate share of the expenses of any underlying Fidelity Central Funds.
E Expense ratios reflect operating expenses of the class. Expenses before reductions do not reflect amounts reimbursed by the investment adviser or reductions from brokerage service arrangements or reductions from other expense offset arrangements and do not represent the amount paid by the class during periods when reimbursements or reductions occur. Expenses net of fee waivers reflect expenses after reimbursement by the investment adviser but prior to reductions from brokerage service arrangements or other expense offset arrangements. Expenses net of all reductions represent the net expenses paid by the class.
F Amount does not include the portfolio activity of any underlying Fidelity Central Funds.
See accompanying notes which are an integral part of the financial statements.
Fidelity Advisor New Insights Fund Class Z
| Years ended December 31, | 2017 | 2016 | 2015 | 2014 | 2013 A |
| Selected Per–Share Data | | | | | |
| Net asset value, beginning of period | $26.97 | $26.65 | $27.17 | $26.78 | $27.42 |
| Income from Investment Operations | | | | | |
| Net investment income (loss)B | .16 | .17 | .16 | .15 | .01 |
| Net realized and unrealized gain (loss) | 7.45 | 1.58 | .58 | 2.39 | 3.00 |
| Total from investment operations | 7.61 | 1.75 | .74 | 2.54 | 3.01 |
| Distributions from net investment income | (.13) | (.15) | (.12) | (.10) | – |
| Distributions from net realized gain | (2.39) | (1.28) | (1.13) | (2.04) | (3.65) |
| Total distributions | (2.52) | (1.43) | (1.26)C | (2.15)D | (3.65) |
| Net asset value, end of period | $32.06 | $26.97 | $26.65 | $27.17 | $26.78 |
| Total ReturnE,F | 28.49% | 6.68% | 2.78% | 9.65% | 11.50% |
| Ratios to Average Net AssetsG,H | | | | | |
| Expenses before reductions | .55% | .50% | .53% | .54% | .55%I |
| Expenses net of fee waivers, if any | .55% | .50% | .53% | .54% | .55%I |
| Expenses net of all reductions | .55% | .50% | .53% | .53% | .55%I |
| Net investment income (loss) | .50% | .63% | .58% | .52% | .14%I |
| Supplemental Data | | | | | |
| Net assets, end of period (in millions) | $1,626 | $492 | $436 | $294 | $77 |
| Portfolio turnover rateJ | 30% | 42% | 47% | 62% | 79% |
A For the period August 13, 2013 (commencement of sale of shares) to December 31, 2013.
B Calculated based on average shares outstanding during the period.
C Total distributions of $1.26 per share is comprised of distributions from net investment income of $.124 and distributions from net realized gain of $1.134 per share.
D Total distributions of $2.15 per share is comprised of distributions from net investment income of $.104 and distributions from net realized gain of $2.041 per share.
E Total returns for periods of less than one year are not annualized.
F Total returns would have been lower if certain expenses had not been reduced during the applicable periods shown.
G Fees and expenses of any underlying Fidelity Central Funds are not included in the Fund's expense ratio. The Fund indirectly bears its proportionate share of the expenses of any underlying Fidelity Central Funds.
H Expense ratios reflect operating expenses of the class. Expenses before reductions do not reflect amounts reimbursed by the investment adviser or reductions from brokerage service arrangements or reductions from other expense offset arrangements and do not represent the amount paid by the class during periods when reimbursements or reductions occur. Expense ratios before reductions for start-up periods may not be representative of longer-term operating periods. Expenses net of fee waivers reflect expenses after reimbursement by the investment adviser but prior to reductions from brokerage service arrangements or other expense offset arrangements. Expenses net of all reductions represent the net expenses paid by the class.
I Annualized
J Amount does not include the portfolio activity of any underlying Fidelity Central Funds.
See accompanying notes which are an integral part of the financial statements.
Notes to Financial Statements
For the period ended December 31, 2017
(Amounts in thousands except percentages)
1. Organization.
Fidelity Advisor New Insights Fund (the Fund) is a fund of Fidelity Contrafund (the Trust) and is authorized to issue an unlimited number of shares. The Trust is registered under the Investment Company Act of 1940, as amended (the 1940 Act), as an open-end management investment company organized as a Massachusetts business trust. The Fund offers Class A, Class M (formerly Class T), Class C, Class I and Class Z shares, each of which has equal rights as to assets and voting privileges. Each class has exclusive voting rights with respect to matters that affect that class.
After the close of business on June 24, 2016, all outstanding Class B shares were converted to Class A shares. All prior fiscal period dollar and share amounts for Class B presented in the Notes to Financial Statements are for the period January 1, 2016 through June 24, 2016.
2. Investments in Fidelity Central Funds.
The Fund invests in Fidelity Central Funds, which are open-end investment companies generally available only to other investment companies and accounts managed by the investment adviser and its affiliates. The Fund's Schedule of Investments lists each of the Fidelity Central Funds held as of period end, if any, as an investment of the Fund, but does not include the underlying holdings of each Fidelity Central Fund. As an Investing Fund, the Fund indirectly bears its proportionate share of the expenses of the underlying Fidelity Central Funds.
The Money Market Central Funds seek preservation of capital and current income and are managed by Fidelity Investments Money Management, Inc. (FIMM), an affiliate of the investment adviser. Annualized expenses of the Money Market Central Funds as of their most recent shareholder report date are less than .005%.
A complete unaudited list of holdings for each Fidelity Central Fund is available upon request or at the Securities and Exchange Commission (the SEC) website at www.sec.gov. In addition, the financial statements of the Fidelity Central Funds, which are not covered by the Fund's Report of Independent Registered Public Accounting Firm, are available on the SEC website or upon request.
3. Significant Accounting Policies.
The Fund is an investment company and applies the accounting and reporting guidance of the Financial Accounting Standards Board (FASB) Accounting Standards Codification Topic 946 Financial Services – Investments Companies. The financial statements have been prepared in conformity with accounting principles generally accepted in the United States of America (GAAP), which require management to make certain estimates and assumptions at the date of the financial statements. Actual results could differ from those estimates. Subsequent events, if any, through the date that the financial statements were issued have been evaluated in the preparation of the financial statements. The following summarizes the significant accounting policies of the Fund:
Investment Valuation. Investments are valued as of 4:00 p.m. Eastern time on the last calendar day of the period. The Board of Trustees (the Board) has delegated the day to day responsibility for the valuation of the Fund's investments to the Fair Value Committee (the Committee) established by the Fund's investment adviser. In accordance with valuation policies and procedures approved by the Board, the Fund attempts to obtain prices from one or more third party pricing vendors or brokers to value its investments. When current market prices, quotations or currency exchange rates are not readily available or reliable, investments will be fair valued in good faith by the Committee, in accordance with procedures adopted by the Board. Factors used in determining fair value vary by investment type and may include market or investment specific events, changes in interest rates and credit quality. The frequency with which these procedures are used cannot be predicted and they may be utilized to a significant extent. The Committee oversees the Fund's valuation policies and procedures and reports to the Board on the Committee's activities and fair value determinations. The Board monitors the appropriateness of the procedures used in valuing the Fund's investments and ratifies the fair value determinations of the Committee.
The Fund categorizes the inputs to valuation techniques used to value its investments into a disclosure hierarchy consisting of three levels as shown below:
- Level 1 – quoted prices in active markets for identical investments
- Level 2 – other significant observable inputs (including quoted prices for similar investments, interest rates, prepayment speeds, etc.)
- Level 3 – unobservable inputs (including the Fund's own assumptions based on the best information available)
Valuation techniques used to value the Fund's investments by major category are as follows:
Equity securities, including restricted securities, for which market quotations are readily available, are valued at the last reported sale price or official closing price as reported by a third party pricing vendor on the primary market or exchange on which they are traded and are categorized as Level 1 in the hierarchy. In the event there were no sales during the day or closing prices are not available, securities are valued at the last quoted bid price or may be valued using the last available price and are generally categorized as Level 2 in the hierarchy. For foreign equity securities, when market or security specific events arise, comparisons to the valuation of American Depositary Receipts (ADRs), futures contracts, Exchange-Traded Funds (ETFs) and certain indexes as well as quoted prices for similar securities may be used and would be categorized as Level 2 in the hierarchy. Utilizing these techniques may result in transfers between Level 1 and Level 2. For equity securities, including restricted securities, where observable inputs are limited, assumptions about market activity and risk are used and these securities may be categorized as Level 3 in the hierarchy. Equity securities, including restricted securities, for which observable inputs are not available are valued using alternate valuation approaches, including the market approach and the income approach and are categorized as Level 3 in the hierarchy. The market approach generally consists of using comparable market transactions while the income approach generally consists of using the net present value of estimated future cash flows, adjusted as appropriate for liquidity, credit, market and/or other risk factors.
Debt securities, including restricted securities, are valued based on evaluated prices received from third party pricing vendors or from brokers who make markets in such securities. Corporate bonds are valued by pricing vendors who utilize matrix pricing which considers yield or price of bonds of comparable quality, coupon, maturity and type or by broker-supplied prices. When independent prices are unavailable or unreliable, debt securities may be valued utilizing pricing methodologies which consider similar factors that would be used by third party pricing vendors. Debt securities are generally categorized as Level 2 in the hierarchy but may be Level 3 depending on the circumstances.
Investments in open-end mutual funds, including the Fidelity Central Funds, are valued at their closing net asset value (NAV) each business day and are categorized as Level 1 in the hierarchy.
The following provides information on Level 3 securities held by the Fund that were valued at period end based on unobservable inputs. These amounts exclude valuations provided by a broker.
| Asset Type | Fair Value | Valuation Technique(s) | Unobservable Input | Amount or Range/Weighted Average | Impact to Valuation from an Increase in Input(a) |
| Corporate Bonds | $118 | Recovery value | Recovery value | 39.5% | Increase |
| Equities | $465,199 | Market comparable | Enterprise value/Sales multiple (EV/S) | 0.8 - 13.1 / 6.5 | Increase |
| | | | Transaction price | $60.00 | Increase |
| | | | Discount rate | 0.9% - 25.0% / 14.1% | Decrease |
| | | | Price/Earnings multiple (P/E) | 15.2 | Increase |
| | | | Enterprise value/Gross profit (EV/GP) | 5.1 | Increase |
| | | | Discount for lack of marketability | 15.0% - 20.0% / 15.4% | Decrease |
| | | | Enterprise value/EBITDA multiple (EV/EBITDA) | 22.9 | Increase |
| | | | Liquidity preference | $4.84 - $19.10 / $12.20 | Increase |
| | | | Premium rate | 108.0% | Increase |
| | | Market approach | Transaction price | $2.50 - $353.57 / $83.20 | Increase |
| | | | Discount rate | 39% - 50.0% / 44.0% | Decrease |
| | | Recovery value | Recovery value | 0.0% - 0.2% / 0.2% | Increase |
| | | Book value | Book value multiple | 1.0 | Increase |
| | | Discount cash flow | Discount rate | 9.0% | Decrease |
| | | | Discount for lack of marketability | 20.0% | Decrease |
| | | | Growth rate | 3.0% | Increase |
| Other | $38,831 | Market approach | Discount rate | 23.0% | Decrease |
(a) Represents the expected directional change in the fair value of the Level 3 investments that would result from an increase in the corresponding input. A decrease to the unobservable input would have the opposite effect. Significant changes in these inputs could result in significantly higher or lower fair value measurements.
Changes in valuation techniques may result in transfers in or out of an assigned level within the disclosure hierarchy. The aggregate value of investments by input level as of December 31, 2017, as well as a roll forward of Level 3 investments, is included at the end of the Fund's Schedule of Investments.
Foreign Currency. The Fund may use foreign currency contracts to facilitate transactions in foreign-denominated securities. Gains and losses from these transactions may arise from changes in the value of the foreign currency or if the counterparties do not perform under the contracts' terms.
Foreign-denominated assets, including investment securities, and liabilities are translated into U.S. dollars at the exchange rates at period end. Purchases and sales of investment securities, income and dividends received and expenses denominated in foreign currencies are translated into U.S. dollars at the exchange rate in effect on the transaction date.
The effects of exchange rate fluctuations on investments are included with the net realized and unrealized gain (loss) on investment securities. Other foreign currency transactions resulting in realized and unrealized gain (loss) are disclosed separately.
Investment Transactions and Income. For financial reporting purposes, the Fund's investment holdings and NAV include trades executed through the end of the last business day of the period. The NAV per share for processing shareholder transactions is calculated as of the close of business of the New York Stock Exchange (NYSE), normally 4:00 p.m. Eastern time and includes trades executed through the end of the prior business day. Gains and losses on securities sold are determined on the basis of identified cost and includes proceeds received from litigation. Dividend income is recorded on the ex-dividend date, except for certain dividends from foreign securities where the ex-dividend date may have passed, which are recorded as soon as the Fund is informed of the ex-dividend date. Non-cash dividends included in dividend income, if any, are recorded at the fair market value of the securities received. Income and capital gain distributions from Fidelity Central Funds, if any, are recorded on the ex-dividend date. Certain distributions received by the Fund represent a return of capital or capital gain. The Fund determines the components of these distributions subsequent to the ex-dividend date, based upon receipt of tax filings or other correspondence relating to the underlying investment. These distributions are recorded as a reduction of cost of investments and/or as a realized gain. Interest income is accrued as earned and includes coupon interest and amortization of premium and accretion of discount on debt securities as applicable. Paid in Kind (PIK) income is recorded at the fair market value of the securities received. Investment income is recorded net of foreign taxes withheld where recovery of such taxes is uncertain.
Class Allocations and Expenses. Investment income, realized and unrealized capital gains and losses, common expenses of the Fund, and certain fund-level expense reductions, if any, are allocated daily on a pro-rata basis to each class based on the relative net assets of each class to the total net assets of the Fund. Each class differs with respect to transfer agent and distribution and service plan fees incurred. Certain expense reductions may also differ by class. For the reporting period, the allocated portion of income and expenses to each class as a percent of its average net assets may vary due to the timing of recording these transactions in relation to fluctuating net assets of the classes. Expenses directly attributable to a fund are charged to that fund. Expenses attributable to more than one fund are allocated among the respective funds on the basis of relative net assets or other appropriate methods. Expense estimates are accrued in the period to which they relate and adjustments are made when actual amounts are known.
Deferred Trustee Compensation. Under a Deferred Compensation Plan (the Plan), independent Trustees may elect to defer receipt of a portion of their annual compensation. Deferred amounts are invested in a cross-section of Fidelity funds, are marked-to-market and remain in the Fund until distributed in accordance with the Plan. The investment of deferred amounts and the offsetting payable to the Trustees are included in the accompanying Statement of Assets and Liabilities.
Income Tax Information and Distributions to Shareholders. Each year, the Fund intends to qualify as a regulated investment company under Subchapter M of the Internal Revenue Code, including distributing substantially all of its taxable income and realized gains. As a result, no provision for U.S. Federal income taxes is required. As of December 31, 2017, the Fund did not have any unrecognized tax benefits in the financial statements; nor is the Fund aware of any tax positions for which it is reasonably possible that the total amounts of unrecognized tax benefits will significantly change in the next twelve months. The Fund files a U.S. federal tax return, in addition to state and local tax returns as required. The Fund's federal income tax returns are subject to examination by the Internal Revenue Service (IRS) for a period of three fiscal years after they are filed. State and local tax returns may be subject to examination for an additional fiscal year depending on the jurisdiction. Foreign taxes are provided for based on the Fund's understanding of the tax rules and rates that exist in the foreign markets in which it invests. The Fund is subject to a tax imposed on capital gains by certain countries in which it invests. An estimated deferred tax liability for net unrealized appreciation on the applicable securities is included in Other payables and accrued expenses on the Statement of Assets & Liabilities.
Distributions are declared and recorded on the ex-dividend date. Income dividends and capital gain distributions are declared separately for each class. Income and capital gain distributions are determined in accordance with income tax regulations, which may differ from GAAP. In addition, the Fund claimed a portion of the payment made to redeeming shareholders as a distribution for income tax purposes.
Capital accounts within the financial statements are adjusted for permanent book-tax differences. These adjustments have no impact on net assets or the results of operations. Capital accounts are not adjusted for temporary book-tax differences which will reverse in a subsequent period.
Book-tax differences are primarily due to foreign currency transactions, passive foreign investment companies (PFIC), market discount, partnerships, deferred trustees compensation, and losses deferred due to wash sales.
As of period end, the cost and unrealized appreciation (depreciation) in securities, and derivatives if applicable, for federal income tax purposes were as follows:
| Gross unrealized appreciation | $11,343,107 |
| Gross unrealized depreciation | (388,277) |
| Net unrealized appreciation (depreciation) | $10,954,830 |
| Tax Cost | $16,833,396 |
The tax-based components of distributable earnings as of period end were as follows:
| Undistributed long-term capital gain | $600,621 |
| Net unrealized appreciation (depreciation) on securities and other investments | $10,936,009 |
The tax character of distributions paid was as follows:
| | December 31, 2017 | December 31, 2016 |
| Ordinary Income | $45,645 | $ 60,850 |
| Long-term Capital Gains | 2,034,583 | 1,185,388 |
| Total | $2,080,228 | $ 1,246,238 |
Restricted Securities. The Fund may invest in securities that are subject to legal or contractual restrictions on resale. These securities generally may be resold in transactions exempt from registration or to the public if the securities are registered. Disposal of these securities may involve time-consuming negotiations and expense, and prompt sale at an acceptable price may be difficult. Information regarding restricted securities is included at the end of the Fund's Schedule of Investments.
Consolidated Subsidiary. The Fund invests in certain investments through a wholly-owned subsidiary ("Subsidiary"), which may be subject to federal and state taxes upon disposition.
As of period end, the Fund held an investment of $77,178 in these Subsidiaries, representing .28% of the Fund's net assets. The financial statements have been consolidated and include accounts of the Fund and each Subsidiary. Accordingly, all inter-company transactions and balances have been eliminated.
Any cash held by the Subsidiaries is restricted as to its use and is presented as Restricted cash in the Statement of Assets and Liabilities.
4. Purchases and Sales of Investments.
Purchases and sales of securities, other than short-term securities, aggregated $7,800,711 and $11,414,486, respectively.
5. Fees and Other Transactions with Affiliates.
Management Fee. Fidelity Management & Research Company (the investment adviser) and its affiliates provide the Fund with investment management related services for which the Fund pays a monthly management fee. The management fee is the sum of an individual fund fee rate that is based on an annual rate of .30% of the Fund's average net assets and an annualized group fee rate that averaged .24% during the period. The group fee rate is based upon the average net assets of all the mutual funds advised by the investment adviser, including any mutual funds previously advised by the investment adviser that are currently advised by Fidelity SelectCo, LLC, an affiliate of the investment adviser. The group fee rate decreases as assets under management increase and increases as assets under management decrease. In addition, the management fee is subject to a performance adjustment (up to a maximum of +/- .20% of the Fund's average net assets over a 36 month performance period). The upward or downward adjustment to the management fee is based on the investment performance of Class I of the Fund as compared to its benchmark index, the S&P 500 Index, over the same 36 month performance period. For the reporting period, the total annual management fee rate, including the performance adjustment, was .49% of the Fund's average net assets. The performance adjustment included in the management fee rate may be higher or lower than the maximum performance adjustment rate due to the difference between the average net assets for the reporting and performance periods.
Distribution and Service Plan Fees. In accordance with Rule 12b-1 of the 1940 Act, the Fund has adopted separate Distribution and Service Plans for each class of shares. Certain classes pay Fidelity Distributors Corporation (FDC), an affiliate of the investment adviser, separate Distribution and Service Fees, each of which is based on an annual percentage of each class' average net assets. In addition, FDC may pay financial intermediaries for selling shares of the Fund and providing shareholder support services. For the period, the Distribution and Service Fee rates, total fees and amounts retained by FDC were as follows:
| | Distribution
Fee | Service
Fee | Total Fees | Retained
by FDC |
| Class A | -% | .25% | $14,495 | $– |
| Class M | .25% | .25% | 9,395 | – |
| Class C | .75% | .25% | 36,500 | 1,648 |
| | | | $60,390 | $1,648 |
Sales Load. FDC may receive a front-end sales charge of up to 5.75% for selling Class A shares and 3.50% for selling Class M shares, some of which is paid to financial intermediaries for selling shares of the Fund. Depending on the holding period, FDC may receive contingent deferred sales charges levied on Class A, Class M and Class C redemptions. The deferred sales charges are 1.00% for Class C shares, 1.00% for certain purchases of Class A shares and .25% for certain purchases of Class M shares.
For the period, sales charge amounts retained by FDC were as follows:
| | Retained
by FDC |
| Class A | $1,031 |
| Class M | 141 |
| Class C(a) | 149 |
| | $1,321 |
(a) When Class C shares are initially sold, FDC pays commissions from its own resources to financial intermediaries through which the sales are made.
Transfer Agent Fees. Fidelity Investments Institutional Operations Company, Inc., (FIIOC), an affiliate of the investment adviser, is the transfer, dividend disbursing and shareholder servicing agent for each class of the Fund. FIIOC receives account fees and asset-based fees that vary according to the account size and type of account of the shareholders of the respective classes of the Fund, except for Class Z. FIIOC receives an asset-based fee of Class Z's average net assets. FIIOC pays for typesetting, printing and mailing of shareholder reports, except proxy statements.
For the period, transfer agent fees for each class were as follows:
| | Amount | % of
Class-Level Average
Net Assets |
| Class A | $10,452 | .18 |
| Class M | 3,357 | .18 |
| Class C | 6,550 | .18 |
| Class I | 24,339 | .17 |
| Class Z | 470 | .05 |
| | $45,168 | |
Accounting and Security Lending Fees. Fidelity Service Company, Inc. (FSC), an affiliate of the investment adviser, maintains the Fund's accounting records. The accounting fee is based on the level of average net assets for each month. Under a separate contract, FSC administers the security lending program. The security lending fee is based on the number and duration of lending transactions.
Brokerage Commissions. The Fund placed a portion of its portfolio transactions with brokerage firms which are affiliates of the investment adviser. Brokerage commissions are included in net realized gain (loss) and change in net unrealized appreciation (depreciation) in the Statement of Operations. The commissions paid to these affiliated firms were $233 for the period.
Interfund Trades. The Fund may purchase from or sell securities to other Fidelity Funds under procedures adopted by the Board. The procedures have been designed to ensure these interfund trades are executed in accordance with Rule 17a-7 of the 1940 Act. Interfund trades are included within the respective purchases and sales amounts shown in the Purchases and Sales of Investments note.
6. Committed Line of Credit.
The Fund participates with other funds managed by the investment adviser or an affiliate in a $4.25 billion credit facility (the "line of credit") to be utilized for temporary or emergency purposes to fund shareholder redemptions or for other short-term liquidity purposes. The Fund has agreed to pay commitment fees on its pro-rata portion of the line of credit, which amounted to $82 and is reflected in Miscellaneous expenses on the Statement of Operations. During the period, the Fund did not borrow on this line of credit.
7. Security Lending.
The Fund lends portfolio securities through a lending agent from time to time in order to earn additional income. For equity securities, a lending agent is used and may loan securities to certain qualified borrowers, including Fidelity Capital Markets (FCM), a broker-dealer affiliated with the Fund. On the settlement date of the loan, the Fund receives collateral (in the form of U.S. Treasury obligations, letters of credit and/or cash) against the loaned securities and maintains collateral in an amount not less than 100% of the market value of the loaned securities during the period of the loan. The market value of the loaned securities is determined at the close of business of the Fund and any additional required collateral is delivered to the Fund on the next business day. The Fund or borrower may terminate the loan at any time, and if the borrower defaults on its obligation to return the securities loaned because of insolvency or other reasons, the Fund may apply collateral received from the borrower against the obligation. The Fund may experience delays and costs in recovering the securities loaned. Any cash collateral received is invested in the Fidelity Securities Lending Cash Central Fund. The value of loaned securities and cash collateral at period end are disclosed on the Fund's Statement of Assets and Liabilities. The value of securities loaned to FCM at period end was $2,357. Security lending income represents the income earned on investing cash collateral, less rebates paid to borrowers and any lending agent fees associated with the loan, plus any premium payments received for lending certain types of securities. Security lending income is presented in the Statement of Operations as a component of income from Fidelity Central Funds. Total security lending income during the period amounted to $3,377, including $123 from securities loaned to FCM.
8. Expense Reductions.
Commissions paid to certain brokers with whom the investment adviser, or its affiliates, places trades on behalf of the Fund include an amount in addition to trade execution, which may be rebated back to the Fund to offset certain expenses. This amount totaled $487 for the period. In addition, through arrangements with the Fund's custodian, credits realized as a result of certain uninvested cash balances were used to reduce the Fund's expenses. During the period, these credits reduced the Fund's by $1.
In addition, during the period the investment adviser reimbursed and/or waived a portion of fund-level operating expenses in the amount of $223.
9. Distributions to Shareholders.
Distributions to shareholders of each class were as follows:
| | Year ended December 31, 2017 | Year ended December 31, 2016 |
| From net investment income | | |
| Class A | $26 | $9,732 |
| Class M | 10 | 160 |
| Class B | – | 8 |
| Class C | 28 | 321 |
| Class I | 39,275 | 48,005 |
| Class Z | 6,306 | 2,624 |
| Total | $45,645 | $60,850 |
| From net realized gain | | |
| Class A | $427,236 | $335,159 |
| Class M | 145,488 | 91,690 |
| Class B | – | 950 |
| Class C | 306,428 | 189,033 |
| Class I | 1,050,323 | 546,373 |
| Class Z | 105,108 | 22,183 |
| Total | $2,034,583 | $1,185,388 |
10. Share Transactions.
Share transactions for each class were as follows and may contain automatic conversions between classes or exchanges between affiliated funds:
| | Shares | Shares | Dollars | Dollars |
| | Year ended December 31, 2017 | Year ended December 31, 2016 | Year ended December 31, 2017 | Year ended December 31, 2016 |
| Class A | | | | |
| Shares sold | 21,157 | 31,092 | $628,417 | $804,383 |
| Reinvestment of distributions | 13,511 | 12,732 | 413,099 | 330,633 |
| Shares redeemed | (115,780) | (86,801) | (3,360,118) | (2,268,773) |
| Net increase (decrease) | (81,112) | (42,977) | $(2,318,602) | $(1,133,757) |
| Class M | | | | |
| Shares sold | 5,607 | 6,672 | $162,678 | $168,809 |
| Reinvestment of distributions | 4,649 | 3,415 | 138,255 | 86,299 |
| Shares redeemed | (18,763) | (19,407) | (539,042) | (495,009) |
| Net increase (decrease) | (8,507) | (9,320) | $(238,109) | $(239,901) |
| Class B | | | | |
| Shares sold | – | 17 | $– | $362 |
| Reinvestment of distributions | – | 41 | – | 854 |
| Shares redeemed | – | (4,619) | – | (105,628) |
| Net increase (decrease) | – | (4,561) | $– | $(104,412) |
| Class C | | | | |
| Shares sold | 11,284 | 13,063 | $299,290 | $305,241 |
| Reinvestment of distributions | 10,179 | 6,915 | 275,929 | 161,406 |
| Shares redeemed | (35,552) | (33,439) | (942,119) | (790,437) |
| Net increase (decrease) | (14,089) | (13,461) | $(366,900) | $(323,790) |
| Class I | | | | |
| Shares sold | 138,420 | 79,363 | $4,117,210 | $2,114,950 |
| Reinvestment of distributions | 31,259 | 19,665 | 981,809 | 522,588 |
| Shares redeemed | (137,376) | (128,588) | (4,201,843) | (3,416,498) |
| Net increase (decrease) | 32,303 | (29,560) | $897,176 | $(778,960) |
| Class Z | | | | |
| Shares sold | 35,679 | 5,437 | $1,107,419 | $146,103 |
| Reinvestment of distributions | 3,070 | 921 | 97,071 | 24,588 |
| Shares redeemed | (6,280) | (4,458) | (195,042) | (119,804) |
| Net increase (decrease) | 32,469 | 1,900 | $1,009,448 | $50,887 |
11. Other.
The Fund's organizational documents provide former and current trustees and officers with a limited indemnification against liabilities arising in connection with the performance of their duties to the Fund. In the normal course of business, the Fund may also enter into contracts that provide general indemnifications. The Fund's maximum exposure under these arrangements is unknown as this would be dependent on future claims that may be made against the Fund. The risk of material loss from such claims is considered remote.
Report of Independent Registered Public Accounting Firm
To the Trustees of Fidelity Contrafund and Shareholders of Fidelity Advisor New Insights Fund:
Opinion on the Financial Statements
We have audited the accompanying statement of assets and liabilities, including the schedule of investments, of Fidelity Advisor New Insights Fund (one of the funds constituting Fidelity Contrafund, referred to hereafter as the “Fund”) as of December 31, 2017, the related statement of operations for the year ended December 31, 2017, the statement of changes in net assets for each of the two years in the period ended December 31, 2017, including the related notes, and the financial highlights for each of the periods indicated therein (collectively referred to as the “financial statements”). In our opinion, the financial statements present fairly, in all material respects, the financial position of the Fund as of December 31, 2017, the results of its operations for the year then ended, the changes in its net assets for each of the two years in the period ended December 31, 2017 and the financial highlights for each of the periods indicated therein in conformity with accounting principles generally accepted in the United States of America.
Basis for Opinion
These financial statements are the responsibility of the Fund’s management. Our responsibility is to express an opinion on the Fund’s financial statements based on our audits. We are a public accounting firm registered with the Public Company Accounting Oversight Board (United States) (“PCAOB”) and are required to be independent with respect to the Fund in accordance with the U.S. federal securities laws and the applicable rules and regulations of the Securities and Exchange Commission and the PCAOB.
We conducted our audits of these financial statements in accordance with the standards of the PCAOB. Those standards require that we plan and perform the audit to obtain reasonable assurance about whether the financial statements are free of material misstatement, whether due to error or fraud.
Our audits included performing procedures to assess the risks of material misstatement of the financial statements, whether due to error or fraud, and performing procedures that respond to those risks. Such procedures included examining, on a test basis, evidence regarding the amounts and disclosures in the financial statements. Our audits also included evaluating the accounting principles used and significant estimates made by management, as well as evaluating the overall presentation of the financial statements. Our procedures included confirmation of securities owned as of December 31, 2017 by correspondence with the custodian and brokers; when replies were not received from brokers, we performed other auditing procedures. We believe that our audits provide a reasonable basis for our opinion.
PricewaterhouseCoopers LLP
Boston, Massachusetts
February 20, 2018
We have served as the auditor of one or more investment companies in the Fidelity group of funds since 1932.
Trustees and Officers
The Trustees, Members of the Advisory Board (if any), and officers of the trust and fund, as applicable, are listed below. The Board of Trustees governs the fund and is responsible for protecting the interests of shareholders. The Trustees are experienced executives who meet periodically throughout the year to oversee the fund's activities, review contractual arrangements with companies that provide services to the fund, oversee management of the risks associated with such activities and contractual arrangements, and review the fund's performance. Each of the Trustees oversees 190 funds.
The Trustees hold office without limit in time except that (a) any Trustee may resign; (b) any Trustee may be removed by written instrument, signed by at least two-thirds of the number of Trustees prior to such removal; (c) any Trustee who requests to be retired or who has become incapacitated by illness or injury may be retired by written instrument signed by a majority of the other Trustees; and (d) any Trustee may be removed at any special meeting of shareholders by a two-thirds vote of the outstanding voting securities of the trust. Each Trustee who is not an interested person (as defined in the 1940 Act) of the trust and the fund is referred to herein as an Independent Trustee. Each Independent Trustee shall retire not later than the last day of the calendar year in which his or her 75th birthday occurs. The Independent Trustees may waive this mandatory retirement age policy with respect to individual Trustees. Officers and Advisory Board Members hold office without limit in time, except that any officer or Advisory Board Member may resign or may be removed by a vote of a majority of the Trustees at any regular meeting or any special meeting of the Trustees. Except as indicated, each individual has held the office shown or other offices in the same company for the past five years.
The fund’s Statement of Additional Information (SAI) includes more information about the Trustees. To request a free copy, call Fidelity at 1-877-208-0098.
Experience, Skills, Attributes, and Qualifications of the Trustees. The Governance and Nominating Committee has adopted a statement of policy that describes the experience, qualifications, attributes, and skills that are necessary and desirable for potential Independent Trustee candidates (Statement of Policy). The Board believes that each Trustee satisfied at the time he or she was initially elected or appointed a Trustee, and continues to satisfy, the standards contemplated by the Statement of Policy. The Governance and Nominating Committee also engages professional search firms to help identify potential Independent Trustee candidates who have the experience, qualifications, attributes, and skills consistent with the Statement of Policy. From time to time, additional criteria based on the composition and skills of the current Independent Trustees, as well as experience or skills that may be appropriate in light of future changes to board composition, business conditions, and regulatory or other developments, have also been considered by the professional search firms and the Governance and Nominating Committee. In addition, the Board takes into account the Trustees' commitment and participation in Board and committee meetings, as well as their leadership of standing and ad hoc committees throughout their tenure.
In determining that a particular Trustee was and continues to be qualified to serve as a Trustee, the Board has considered a variety of criteria, none of which, in isolation, was controlling. The Board believes that, collectively, the Trustees have balanced and diverse experience, qualifications, attributes, and skills, which allow the Board to operate effectively in governing the fund and protecting the interests of shareholders. Information about the specific experience, skills, attributes, and qualifications of each Trustee, which in each case led to the Board's conclusion that the Trustee should serve (or continue to serve) as a trustee of the fund, is provided below.
Board Structure and Oversight Function. James C. Curvey is an interested person and currently serves as Chairman. The Trustees have determined that an interested Chairman is appropriate and benefits shareholders because an interested Chairman has a personal and professional stake in the quality and continuity of services provided to the fund. Independent Trustees exercise their informed business judgment to appoint an individual of their choosing to serve as Chairman, regardless of whether the Trustee happens to be independent or a member of management. The Independent Trustees have determined that they can act independently and effectively without having an Independent Trustee serve as Chairman and that a key structural component for assuring that they are in a position to do so is for the Independent Trustees to constitute a substantial majority for the Board. The Independent Trustees also regularly meet in executive session. Ned C. Lautenbach serves as Chairman of the Independent Trustees and as such (i) acts as a liaison between the Independent Trustees and management with respect to matters important to the Independent Trustees and (ii) with management prepares agendas for Board meetings.
Fidelity® funds are overseen by different Boards of Trustees. The fund's Board oversees Fidelity's high income and certain equity funds, and other Boards oversee Fidelity's investment-grade bond, money market, asset allocation, and sector funds. The asset allocation funds may invest in Fidelity® funds overseen by the fund's Board. The use of separate Boards, each with its own committee structure, allows the Trustees of each group of Fidelity® funds to focus on the unique issues of the funds they oversee, including common research, investment, and operational issues. On occasion, the separate Boards establish joint committees to address issues of overlapping consequences for the Fidelity® funds overseen by each Board.
The Trustees operate using a system of committees to facilitate the timely and efficient consideration of all matters of importance to the Trustees, the fund, and fund shareholders and to facilitate compliance with legal and regulatory requirements and oversight of the fund's activities and associated risks. The Board, acting through its committees, has charged FMR and its affiliates with (i) identifying events or circumstances the occurrence of which could have demonstrably adverse effects on the fund's business and/or reputation; (ii) implementing processes and controls to lessen the possibility that such events or circumstances occur or to mitigate the effects of such events or circumstances if they do occur; and (iii) creating and maintaining a system designed to evaluate continuously business and market conditions in order to facilitate the identification and implementation processes described in (i) and (ii) above. Because the day-to-day operations and activities of the fund are carried out by or through FMR, its affiliates, and other service providers, the fund's exposure to risks is mitigated but not eliminated by the processes overseen by the Trustees. While each of the Board's committees has responsibility for overseeing different aspects of the fund's activities, oversight is exercised primarily through the Operations, Audit, and Compliance Committees. In addition, the Independent Trustees have worked with FMR to enhance the Board's oversight of investment and financial risks, legal and regulatory risks, technology risks, and operational risks, including the development of additional risk reporting to the Board. For example, a working group comprised of Independent Trustees and FMR has worked and continues to work to review the Fidelity® funds' valuation-related activities, reporting and risk management. Appropriate personnel, including but not limited to the fund's Chief Compliance Officer (CCO), FMR's internal auditor, the independent accountants, the fund's Treasurer and portfolio management personnel, make periodic reports to the Board's committees, as appropriate, including an annual review of Fidelity's risk management program for the Fidelity® funds. The responsibilities of each standing committee, including their oversight responsibilities, are described further under "Standing Committees of the Trustees."
Interested Trustees*:
Correspondence intended for a Trustee who is an interested person may be sent to Fidelity Investments, 245 Summer Street, Boston, Massachusetts 02210.
Name, Year of Birth; Principal Occupations and Other Relevant Experience+
James C. Curvey (1935)
Year of Election or Appointment: 2007
Trustee
Chairman of the Board of Trustees
Mr. Curvey also serves as Trustee of other Fidelity® funds. Mr. Curvey is a Director of Fidelity Research & Analysis Co. (investment adviser firm, 2009-present), and Vice Chairman (2007-present) and Director of FMR LLC (diversified financial services company). In addition, Mr. Curvey serves as an Overseer for the Boston Symphony Orchestra and a member of the board of Artis-Naples, Naples, Florida, and as a Trustee for Brewster Academy, Wolfeboro, New Hampshire. Previously, Mr. Curvey served as a Director of Fidelity Investments Money Management, Inc. (investment adviser firm, 2009-2014) and a Director of FMR and FMR Co., Inc. (investment adviser firms, 2007-2014).
Charles S. Morrison (1960)
Year of Election or Appointment: 2014
Trustee
Mr. Morrison also serves as Trustee of other funds. He serves as President of Fidelity SelectCo, LLC (investment adviser firm, 2017-present) and Fidelity Management & Research Company (FMR) (investment adviser firm, 2016-present), a Director of Fidelity Investments Money Management, Inc. (FIMM) (investment adviser firm, 2014-present), Director of Fidelity SelectCo, LLC (investment adviser firm, 2014-present), President, Asset Management (2014-present), and is an employee of Fidelity Investments. Previously, Mr. Morrison served as Vice President of Fidelity's Fixed Income and Asset Allocation Funds (2012-2014), President, Fixed Income (2011-2014), Vice President of Fidelity's Money Market Funds (2005-2009), President, Money Market Group Leader of FMR (investment adviser firm, 2009), and Senior Vice President, Money Market Group of FMR (2004-2009). Mr. Morrison also served as Vice President of Fidelity's Bond Funds (2002-2005), certain Balanced Funds (2002-2005), and certain Asset Allocation Funds (2002-2007), and as Senior Vice President (2002-2005) of Fidelity's Bond Division.
* Determined to be an “Interested Trustee” by virtue of, among other things, his or her affiliation with the trust or various entities under common control with FMR.
+ The information includes the Trustee's principal occupation during the last five years and other information relating to the experience, attributes, and skills relevant to the Trustee's qualifications to serve as a Trustee, which led to the conclusion that the Trustee should serve as a Trustee for the fund.
Independent Trustees:
Correspondence intended for an Independent Trustee may be sent to Fidelity Investments, P.O. Box 55235, Boston, Massachusetts 02205-5235.
Name, Year of Birth; Principal Occupations and Other Relevant Experience+
Dennis J. Dirks (1948)
Year of Election or Appointment: 2005
Trustee
Mr. Dirks also serves as Trustee of other Fidelity® funds. Prior to his retirement in May 2003, Mr. Dirks was Chief Operating Officer and a member of the Board of The Depository Trust & Clearing Corporation (DTCC). He also served as President, Chief Operating Officer, and Board member of The Depository Trust Company (DTC) and President and Board member of the National Securities Clearing Corporation (NSCC). In addition, Mr. Dirks served as Chief Executive Officer and Board member of the Government Securities Clearing Corporation, Chief Executive Officer and Board member of the Mortgage-Backed Securities Clearing Corporation, as a Trustee and a member of the Finance Committee of Manhattan College (2005-2008), as a Trustee and a member of the Finance Committee of AHRC of Nassau County (2006-2008), as a member of the Independent Directors Council (IDC) Governing Council (2010-2015), and as a member of the Board of Directors for The Brookville Center for Children’s Services, Inc. (2009-2017). Mr. Dirks is a member of the Finance Committee (2016-present) and Board of Directors (2017-present) of the Asolo Repertory Theatre.
Alan J. Lacy (1953)
Year of Election or Appointment: 2008
Trustee
Mr. Lacy also serves as Trustee of other Fidelity® funds. Mr. Lacy serves as a Director of Bristol-Myers Squibb Company (global pharmaceuticals, 2008-present). He is a Trustee of the California Chapter of The Nature Conservancy (2015-present) and a Director of the Center for Advanced Study in the Behavioral Sciences at Stanford University (2015-present). In addition, Mr. Lacy served as Senior Adviser (2007-2014) of Oak Hill Capital Partners, L.P. (private equity) and also served as Chief Executive Officer (2005) and Vice Chairman (2005-2006) of Sears Holdings Corporation (retail) and Chief Executive Officer and Chairman of the Board of Sears, Roebuck and Co. (retail, 2000-2005). Previously, Mr. Lacy served as Chairman (2014-2017) and a member (2010-2017) of the Board of Directors of Dave & Buster’s Entertainment, Inc. (restaurant and entertainment complexes), as Chairman (2008-2011) and a member (2006-2015) of the Board of Trustees of the National Parks Conservation Association, and as a member of the Board of Directors for The Hillman Companies, Inc. (hardware wholesalers, 2010-2014), Earth Fare, Inc. (retail grocery, 2010-2014), and The Western Union Company (global money transfer, 2006-2011).
Ned C. Lautenbach (1944)
Year of Election or Appointment: 2000
Trustee
Chairman of the Independent Trustees
Mr. Lautenbach also serves as Trustee of other Fidelity® funds. Mr. Lautenbach currently serves as Vice Chair of the Board of Governors, State University System of Florida (2013-present) and is a member of the Council on Foreign Relations (1994-present). He is also a member and has most recently served as Chairman of the Board of Directors of Artis-Naples (2012-present). Previously, Mr. Lautenbach served as a member and then Lead Director of the Board of Directors of Eaton Corporation (diversified industrial, 1997-2016). He was also a Partner and Advisory Partner at Clayton, Dubilier & Rice, LLC (private equity investment, 1998-2010), as well as a Director of Sony Corporation (2006-2007). In addition, Mr. Lautenbach also had a 30-year career with IBM (technology company) during which time he served as Senior Vice President and a member of the Corporate Executive Committee (1968-1998).
Joseph Mauriello (1944)
Year of Election or Appointment: 2008
Trustee
Mr. Mauriello also serves as Trustee of other Fidelity® funds. Prior to his retirement in January 2006, Mr. Mauriello served in numerous senior management positions including Deputy Chairman and Chief Operating Officer (2004-2005), and Vice Chairman of Financial Services (2002-2004) of KPMG LLP US (professional services, 1965-2005). Mr. Mauriello currently serves as a member of the Board of Directors of XL Group plc. (global insurance and re-insurance, 2006-present) and the Independent Directors Council (IDC) Governing Council (2015-present). Previously, Mr. Mauriello served as a Director of the Hamilton Funds of the Bank of New York (2006-2007) and of Arcadia Resources Inc. (health care services and products, 2007-2012).
Cornelia M. Small (1944)
Year of Election or Appointment: 2005
Trustee
Ms. Small also serves as Trustee of other Fidelity® funds. Ms. Small is a member of the Board of Directors (2009-present) and Chair of the Investment Committee (2010-present) of the Teagle Foundation. Ms. Small also serves on the Investment Committee of the Berkshire Taconic Community Foundation (2008-present). Previously, Ms. Small served as Chairperson (2002-2008) and a member of the Investment Committee and Chairperson (2008-2012) and a member of the Board of Trustees of Smith College. In addition, Ms. Small served as Chief Investment Officer, Director of Global Equity Investments, and a member of the Board of Directors of Scudder, Stevens & Clark and Scudder Kemper Investments.
William S. Stavropoulos (1939)
Year of Election or Appointment: 2001
Trustee
Vice Chairman of the Independent Trustees
Mr. Stavropoulos also serves as Trustee of other Fidelity® funds. Mr. Stavropoulos serves as President and Founder of the Michigan Baseball Foundation, the Great Lakes Loons (2007-present). Mr. Stavropoulos is Chairman Emeritus of the Board of Directors of The Dow Chemical Company, where he previously served in numerous senior management positions, including President, CEO (1995-2000; 2002-2004), Chairman of the Executive Committee (2000-2006), and as a member of the Board of Directors (1990-2006). Currently, Mr. Stavropoulos is Chairman of the Board of Directors of Univar Inc. (global distributor of commodity and specialty chemicals), a Director of Teradata Corporation (data warehousing and technology solutions), and a member of the Advisory Board for Metalmark Capital LLC (private equity investment, 2005-present). Mr. Stavropoulos is an operating advisor to Clayton, Dubilier & Rice, LLC (private equity investment). In addition, Mr. Stavropoulos is a member of the University of Notre Dame Advisory Council for the College of Science, a Trustee of the Rollin L. Gerstacker Foundation, and a Director of Artis-Naples in Naples, Florida. Previously, Mr. Stavropoulos served as a Director of Chemical Financial Corporation (bank holding company, 1993-2012) and Tyco International, Ltd. (multinational manufacturing and services, 2007-2012).
David M. Thomas (1949)
Year of Election or Appointment: 2008
Trustee
Mr. Thomas also serves as Trustee of other Fidelity® funds. Mr. Thomas serves as Non-Executive Chairman of the Board of Directors of Fortune Brands Home and Security (home and security products, 2011-present), as a member of the Board of Directors (2004-present) and Presiding Director (2013-present) of Interpublic Group of Companies, Inc. (marketing communication), and as a member of the Board of Trustees of the University of Florida (2013-present). Previously, Mr. Thomas served as Executive Chairman (2005-2006) and Chairman and Chief Executive Officer (2000-2005) of IMS Health, Inc. (pharmaceutical and healthcare information solutions), and a Director of Fortune Brands, Inc. (consumer products, 2000-2011).
+ The information includes the Trustee's principal occupation during the last five years and other information relating to the experience, attributes, and skills relevant to the Trustee's qualifications to serve as a Trustee, which led to the conclusion that the Trustee should serve as a Trustee for the fund.
Advisory Board Members and Officers:
Correspondence intended for an officer or Peter S. Lynch may be sent to Fidelity Investments, 245 Summer Street, Boston, Massachusetts 02210. Officers appear below in alphabetical order.
Name, Year of Birth; Principal Occupation
Peter S. Lynch (1944)
Year of Election or Appointment: 2003
Member of the Advisory Board
Mr. Lynch also serves as Member of the Advisory Board of other Fidelity® funds. Mr. Lynch is Vice Chairman and a Director of FMR (investment adviser firm) and FMR Co., Inc. (investment adviser firm). In addition, Mr. Lynch serves as a Trustee of Boston College and as the Chairman of the Inner-City Scholarship Fund. Previously, Mr. Lynch served on the Special Olympics International Board of Directors (1997-2006).
Elizabeth Paige Baumann (1968)
Year of Election or Appointment: 2017
Anti-Money Laundering (AML) Officer
Ms. Baumann also serves as AML Officer of other funds. She is Chief AML Officer (2012-present) and Senior Vice President (2014-present) of FMR LLC (diversified financial services company) and is an employee of Fidelity Investments. Previously, Ms. Baumann served as AML Officer of the funds (2012-2016), and Vice President (2007-2014) and Deputy Anti-Money Laundering Officer (2007-2012) of FMR LLC.
Marc R. Bryant (1966)
Year of Election or Appointment: 2015
Secretary and Chief Legal Officer (CLO)
Mr. Bryant also serves as Secretary and CLO of other funds. Mr. Bryant serves as CLO, Secretary, and Senior Vice President of Fidelity Management & Research Company (investment adviser firm, 2015-present) and FMR Co., Inc. (investment adviser firm, 2015-present); Secretary of Fidelity SelectCo, LLC (investment adviser firm, 2015-present) and Fidelity Investments Money Management, Inc. (investment adviser firm, 2015-present); and CLO of Fidelity Management & Research (Hong Kong) Limited and FMR Investment Management (UK) Limited (investment adviser firms, 2015-present) and Fidelity Management & Research (Japan) Limited (investment adviser firm, 2016-present). He is Senior Vice President and Deputy General Counsel of FMR LLC (diversified financial services company). Previously, Mr. Bryant served as Secretary and CLO of Fidelity Rutland Square Trust II (2010-2014) and Assistant Secretary of Fidelity's Fixed Income and Asset Allocation Funds (2013-2015). Prior to joining Fidelity Investments, Mr. Bryant served as a Senior Vice President and the Head of Global Retail Legal for AllianceBernstein L.P. (2006-2010), and as the General Counsel for ProFund Advisors LLC (2001-2006).
William C. Coffey (1969)
Year of Election or Appointment: 2009
Assistant Secretary
Mr. Coffey also serves as Assistant Secretary of other funds. He is Senior Vice President and Deputy General Counsel of FMR LLC (diversified financial services company, 2010-present), and is an employee of Fidelity Investments. Previously, Mr. Coffey served as Vice President and Associate General Counsel of FMR LLC (2005-2009).
Jonathan Davis (1968)
Year of Election or Appointment: 2010
Assistant Treasurer
Mr. Davis also serves as Assistant Treasurer of other funds. Mr. Davis serves as Assistant Treasurer of FMR Capital, Inc. (2017-present) and is an employee of Fidelity Investments. Previously, Mr. Davis served as Vice President and Associate General Counsel of FMR LLC (diversified financial services company, 2003-2010).
Adrien E. Deberghes (1967)
Year of Election or Appointment: 2016
Assistant Treasurer
Mr. Deberghes also serves as an officer of other funds. He serves as Assistant Treasurer of FMR Capital, Inc. (2017-present), Executive Vice President of Fidelity Investments Money Management, Inc. (FIMM) (investment adviser firm, 2016-present), and is an employee of Fidelity Investments (2008-present). Prior to joining Fidelity Investments, Mr. Deberghes was Senior Vice President of Mutual Fund Administration at State Street Corporation (2007-2008), Senior Director of Mutual Fund Administration at Investors Bank & Trust (2005-2007), and Director of Finance for Dunkin' Brands (2000-2005). Previously, Mr. Deberghes served in other fund officer roles.
Stephanie J. Dorsey (1969)
Year of Election or Appointment: 2010
Assistant Treasurer
Ms. Dorsey also serves as an officer of other funds. Ms. Dorsey serves as Assistant Treasurer of FMR Capital, Inc. (2017-present), is an employee of Fidelity Investments (2008-present), and has served in other fund officer roles. Prior to joining Fidelity Investments, Ms. Dorsey served as Treasurer (2004-2008) of the JPMorgan Mutual Funds and Vice President (2004-2008) of JPMorgan Chase Bank.
Howard J. Galligan III (1966)
Year of Election or Appointment: 2014
Chief Financial Officer
Mr. Galligan also serves as Chief Financial Officer of other funds. Mr. Galligan serves as President of Fidelity Pricing and Cash Management Services (FPCMS) (2014-present) and as a Director of Strategic Advisers, Inc. (investment adviser firm, 2008-present). Previously, Mr. Galligan served as Chief Administrative Officer of Asset Management (2011-2014) and Chief Operating Officer and Senior Vice President of Investment Support for Strategic Advisers, Inc. (2003-2011).
Brian B. Hogan (1964)
Year of Election or Appointment: 2009
Vice President
Mr. Hogan also serves as Trustee or Vice President of other funds. Mr. Hogan serves as a Director of FMR Investment Management (UK) Limited (investment adviser firm, 2015-present) and Fidelity SelectCo, LLC (investment adviser firm, 2014-present) and President of the Equity Division of FMR (investment adviser firm, 2009-present). Previously, Mr. Hogan served as Senior Vice President, Equity Research of FMR (2006-2009) and as a portfolio manager. Mr. Brian B. Hogan is not related to Mr. Colm A. Hogan.
Colm A. Hogan (1973)
Year of Election or Appointment: 2016
Deputy Treasurer
Mr. Hogan also serves as an officer of other funds. Mr. Hogan serves as Assistant Treasurer of FMR Capital, Inc. (2017-present) and is an employee of Fidelity Investments (2005-present). Mr. Colm A. Hogan is not related to Mr. Brian B. Hogan.
Chris Maher (1972)
Year of Election or Appointment: 2013
Assistant Treasurer
Mr. Maher serves as Assistant Treasurer of other funds. Mr. Maher is Vice President of Valuation Oversight, serves as Assistant Treasurer of FMR Capital, Inc. (2017-present), and is an employee of Fidelity Investments. Previously, Mr. Maher served as Vice President of Asset Management Compliance (2013), Vice President of the Program Management Group of FMR (investment adviser firm, 2010-2013), and Vice President of Valuation Oversight (2008-2010).
Rieco E. Mello (1969)
Year of Election or Appointment: 2017
Assistant Treasurer
Mr. Mello also serves as Assistant Treasurer of other funds. Mr. Mello serves as Assistant Treasurer of FMR Capital, Inc. (2017-present) and is an employee of Fidelity Investments (1995-present).
Melissa M. Reilly (1971)
Year of Election or Appointment: 2014
Vice President of certain Equity Funds
Ms. Reilly also serves as Vice President of other funds. Ms. Reilly is an employee of Fidelity Investments (2004-present).
Kenneth B. Robins (1969)
Year of Election or Appointment: 2016
Chief Compliance Officer
Mr. Robins also serves as an officer of other funds. Mr. Robins serves as Compliance Officer of Fidelity Management & Research Company and FMR Co., Inc. (investment adviser firms, 2016-present) and is an employee of Fidelity Investments (2004-present). Previously, Mr. Robins served as Executive Vice President of Fidelity Investments Money Management, Inc. (investment adviser firm, 2013-2016) and served in other fund officer roles.
Stacie M. Smith (1974)
Year of Election or Appointment: 2016
President and Treasurer
Ms. Smith also serves as an officer of other funds. Ms. Smith serves as Assistant Treasurer of FMR Capital, Inc. (2017-present), is an employee of Fidelity Investments (2009-present), and has served in other fund officer roles. Prior to joining Fidelity Investments, Ms. Smith served as Senior Audit Manager of Ernst & Young LLP (accounting firm, 1996-2009). Previously, Ms. Smith served as Deputy Treasurer of certain Fidelity® funds (2013-2016).
Marc L. Spector (1972)
Year of Election or Appointment: 2016
Assistant Treasurer
Mr. Spector also serves as an officer of other funds. Mr. Spector serves as Assistant Treasurer of FMR Capital, Inc. (2017-present) and is an employee of Fidelity Investments (2016-present). Prior to joining Fidelity Investments, Mr. Spector served as Director at the Siegfried Group (accounting firm, 2013-2016), and prior to Siegfried Group as audit senior manager at Deloitte & Touche (accounting firm, 2005-2013).
Renee Stagnone (1975)
Year of Election or Appointment: 2016
Assistant Treasurer
Ms. Stagnone also serves as an officer of other funds. Ms. Stagnone serves as Assistant Treasurer of FMR Capital, Inc. (2017-present) and is an employee of Fidelity Investments (1997-present). Previously, Ms. Stagnone served as Deputy Treasurer of certain Fidelity® funds (2013-2016).
Shareholder Expense Example
As a shareholder of the Fund, you incur two types of costs: (1) transaction costs, including sales charges (loads) on purchase payments or redemption proceeds, and (2) ongoing costs, including management fees, distribution and/or service (12b-1) fees and other Fund expenses. This Example is intended to help you understand your ongoing costs (in dollars) of investing in the Fund and to compare these costs with the ongoing costs of investing in other mutual funds.
The Example is based on an investment of $1,000 invested at the beginning of the period and held for the entire period (July 1, 2017 to December 31, 2017).
Actual Expenses
The first line of the accompanying table for each class of the Fund provides information about actual account values and actual expenses. You may use the information in this line, together with the amount you invested, to estimate the expenses that you paid over the period. Simply divide your account value by $1,000.00 (for example, an $8,600 account value divided by $1,000.00 = 8.6), then multiply the result by the number in the first line for a class of the Fund under the heading entitled "Expenses Paid During Period" to estimate the expenses you paid on your account during this period. In addition, the Fund, as a shareholder in the underlying Fidelity Central Funds, will indirectly bear its pro-rata share of the fees and expenses incurred by the underlying Fidelity Central Funds. These fees and expenses are not included in the Fund's annualized expense ratio used to calculate the expense estimate in the table below.
Hypothetical Example for Comparison Purposes
The second line of the accompanying table for each class of the Fund provides information about hypothetical account values and hypothetical expenses based on a Class' actual expense ratio and an assumed rate of return of 5% per year before expenses, which is not the Class' actual return. The hypothetical account values and expenses may not be used to estimate the actual ending account balance or expenses you paid for the period. You may use this information to compare the ongoing costs of investing in the Fund and other funds. To do so, compare this 5% hypothetical example with the 5% hypothetical examples that appear in the shareholder reports of the other funds. In addition, the Fund, as a shareholder in the underlying Fidelity Central Funds, will indirectly bear its pro-rata share of the fees and expenses incurred by the underlying Fidelity Central Funds. These fees and expenses are not included in the Fund's annualized expense ratio used to calculate the expense estimate in the table below.
Please note that the expenses shown in the table are meant to highlight your ongoing costs only and do not reflect any transaction costs. Therefore, the second line of the table is useful in comparing ongoing costs only, and will not help you determine the relative total costs of owning different funds. In addition, if these transactional costs were included, your costs would have been higher.
| | Annualized Expense Ratio-A | Beginning
Account Value
July 1, 2017 | Ending
Account Value
December 31, 2017 | Expenses Paid
During Period-B
July 1, 2017
to December 31, 2017 |
| Class A | 1.01% | | | |
| Actual | | $1,000.00 | $1,125.00 | $5.41 |
| Hypothetical-C | | $1,000.00 | $1,020.11 | $5.14 |
| Class M | 1.25% | | | |
| Actual | | $1,000.00 | $1,123.90 | $6.69 |
| Hypothetical-C | | $1,000.00 | $1,018.90 | $6.36 |
| Class C | 1.75% | | | |
| Actual | | $1,000.00 | $1,120.60 | $9.35 |
| Hypothetical-C | | $1,000.00 | $1,016.38 | $8.89 |
| Class I | .74% | | | |
| Actual | | $1,000.00 | $1,126.40 | $3.97 |
| Hypothetical-C | | $1,000.00 | $1,021.48 | $3.77 |
| Class Z | .59% | | | |
| Actual | | $1,000.00 | $1,127.40 | $3.16 |
| Hypothetical-C | | $1,000.00 | $1,022.23 | $3.01 |
A Annualized expense ratio reflects expenses net of applicable fee waivers.
B Expenses are equal to each Class' annualized expense ratio, multiplied by the average account value over the period, multiplied by 184/365 (to reflect the one-half year period).
C 5% return per year before expenses
Distributions (Unaudited)
The Board of Trustees of Fidelity Advisor New Insights Fund voted to pay to shareholders of record at the opening of business on record date, the following distributions per share derived from capital gains realized from sales of portfolio securities:
| | Pay Date | Record Date | Capital Gains |
| Insert Fund Name | | | |
| Class A | 02/12/2018 | 02/09/2018 | $0.684 |
| Class M | 02/12/2018 | 02/09/2018 | $0.684 |
| Class C | 02/12/2018 | 02/09/2018 | $0.684 |
| Class I | 02/12/2018 | 02/09/2018 | $0.684 |
| Class Z | 02/12/2018 | 02/09/2018 | $0.684 |
| | | | |
The fund hereby designates as a capital gain dividend with respect to the taxable year ended December 31, 2017 $2,565,438,931, or, if subsequently determined to be different, the net capital gain of such year.
Class I, and Class Z designate 100% of the dividends distributed during the fiscal year as qualifying for the dividends received deduction for corporate shareholders.
Class I, and Class Z designate 100% of the dividends distributed during the fiscal year as amounts which may be taken into account as a dividend for purposes of the maximum rate under section 1(h)(11) of the Internal Revenue Code.
The fund will notify shareholders in January 2018 of amounts for use in preparing 2017 income tax returns.
Board Approval of Investment Advisory Contracts and Management Fees
Fidelity Advisor New Insights Fund
Each year, the Board of Trustees, including the Independent Trustees (together, the Board), votes on the renewal of the management contract with Fidelity Management & Research Company (FMR) and the sub-advisory agreements (together, the Advisory Contracts) for the fund. FMR and the sub-advisers are referred to herein as the Investment Advisers. The Board, assisted by the advice of fund counsel and Independent Trustees' counsel, requests and considers a broad range of information relevant to the renewal of the Advisory Contracts throughout the year.
The Board meets regularly and, at each of its meetings, covers an extensive agenda of topics and materials and considers factors that are relevant to its annual consideration of the renewal of the fund's Advisory Contracts, including the services and support provided to the fund and its shareholders. The Board has established various standing committees (Committees), each composed of and chaired by Independent Trustees with varying backgrounds, to which the Board has assigned specific subject matter responsibilities in order to enhance effective decision-making by the Board. The Board, acting directly and through its Committees, requests and receives information concerning the annual consideration of the renewal of the fund's Advisory Contracts. The Board also meets as needed to review matters specifically related to the Board's annual consideration of the renewal of the Advisory Contracts. Members of the Board may also meet with trustees of other Fidelity funds through ad hoc joint committees to discuss certain matters relevant to all of the Fidelity funds.
At its July 2017 meeting, the Board unanimously determined to renew the fund's Advisory Contracts. In reaching its determination, the Board considered all factors it believed relevant, including (i) the nature, extent, and quality of the services to be provided to the fund and its shareholders (including the investment performance of the fund); (ii) the competitiveness of the fund's management fee and total expense ratio relative to peer funds; (iii) the total costs of the services to be provided by and the profits to be realized by Fidelity from its relationships with the fund; and (iv) the extent to which, if any, economies of scale exist and would be realized as the fund grows, and whether any economies of scale are appropriately shared with fund shareholders.
In considering whether to renew the Advisory Contracts for the fund, the Board reached a determination, with the assistance of fund counsel and Independent Trustees' counsel and through the exercise of its business judgment, that the renewal of the Advisory Contracts was in the best interests of the fund and its shareholders and that the compensation payable under the Advisory Contracts was fair and reasonable. The Board's decision to renew the Advisory Contracts was not based on any single factor, but rather was based on a comprehensive consideration of all the information provided to the Board at its meetings throughout the year. The Board, in reaching its determination to renew the Advisory Contracts, was aware that shareholders of the fund have a broad range of investment choices available to them, including a wide choice among funds offered by Fidelity's competitors, and that the fund's shareholders, who have the opportunity to review and weigh the disclosure provided by the fund in its prospectus and other public disclosures, have chosen to invest in this fund, which is part of the Fidelity family of funds.
Amendment to Group Fee Rate. The Board also approved an amendment to the management contract for the fund to add an additional breakpoint to the group fee schedule, effective October 1, 2017. The Board noted that the additional breakpoint would result in lower management fee rates as Fidelity's assets under management increase.
Nature, Extent, and Quality of Services Provided. The Board considered Fidelity's staffing as it relates to the fund, including the backgrounds of investment personnel of Fidelity, and also considered the fund's investment objective, strategies, and related investment philosophy. The Independent Trustees also had discussions with senior management of Fidelity's investment operations and investment groups. The Board considered the structure of the investment personnel compensation program and whether this structure provides appropriate incentives to act in the best interests of the fund. Additionally, the Board considered the portfolio managers' investments, if any, in the funds that they manage.
Resources Dedicated to Investment Management and Support Services. The Board and the Fund Oversight and Research Committees reviewed the general qualifications and capabilities of Fidelity's investment staff, including its size, education, experience, and resources, as well as Fidelity's approach to recruiting, training, managing, and compensating investment personnel. The Board noted that Fidelity has continued to increase the resources devoted to non-U.S. offices, including expansion of Fidelity's global investment organization. The Board also noted that Fidelity's analysts have extensive resources, tools and capabilities that allow them to conduct sophisticated quantitative and fundamental analysis, as well as credit analysis of issuers, counterparties and guarantors. Further, the Board considered that Fidelity's investment professionals have sufficient access to global information and data so as to provide competitive investment results over time, and that those professionals also have access to sophisticated tools that permit them to assess portfolio construction and risk and performance attribution characteristics continuously, as well as to transmit new information and research conclusions rapidly around the world. Additionally, in its deliberations, the Board considered Fidelity's trading, risk management, compliance, and technology and operations capabilities and resources, which are integral parts of the investment management process.
Shareholder and Administrative Services. The Board considered (i) the nature, extent, quality, and cost of advisory, administrative, and shareholder services performed by the Investment Advisers and their affiliates under the Advisory Contracts and under separate agreements covering transfer agency, pricing and bookkeeping, and securities lending services for the fund; (ii) the nature and extent of the supervision of third party service providers, principally custodians, subcustodians, and pricing vendors; and (iii) the resources devoted to, and the record of compliance with, the fund's compliance policies and procedures. The Board also reviewed the allocation of fund brokerage, including allocations to brokers affiliated with the Investment Advisers, the use of brokerage commissions to pay fund expenses, and the use of "soft" commission dollars to pay for research services.
The Board noted that the growth of fund assets over time across the complex allows Fidelity to reinvest in the development of services designed to enhance the value or convenience of the Fidelity funds as investment vehicles. These services include 24-hour access to account information and market information through telephone representatives and over the Internet, investor education materials and asset allocation tools, and the expanded availability of Fidelity Investor Centers.
In 2014, the Board formed an ad hoc Committee on Transfer Agency Fees to review the variety of transfer agency fee structures throughout the industry and Fidelity's competitive positioning with respect to industry participants.
Investment in a Large Fund Family. The Board considered the benefits to shareholders of investing in a Fidelity fund, including the benefits of investing in a fund that is part of a large family of funds offering a variety of investment disciplines and providing a large variety of mutual fund investor services. The Board noted that Fidelity had taken, or had made recommendations that resulted in the Fidelity funds taking, a number of actions over the previous year that benefited particular funds, including: (i) continuing to dedicate additional resources to Fidelity's investment research process, and to the support of the senior management team that oversees asset management; (ii) continuing efforts to enhance Fidelity's global research capabilities; (iii) launching new funds and making other enhancements to meet client needs; (iv) launching new share classes of existing funds; (v) eliminating purchase minimums and broadening eligibility requirements for certain lower-priced share classes; (vi) reducing management fees and total expenses for certain growth equity funds and index funds; (vii) lowering expense caps for certain existing funds and classes to reduce expenses borne by shareholders; (viii) eliminating short-term redemption fees for certain funds; (ix) introducing a new pricing structure for certain funds of funds that is expected to reduce overall expenses paid by shareholders; (x) rationalizing product lines and gaining increased efficiencies through proposals for fund mergers and share class consolidations; (xi) continuing to develop, acquire and implement systems and technology to improve services to the funds and shareholders, strengthen information security, and increase efficiency; and (xii) implementing enhancements to further strengthen Fidelity's product line to increase investors' probability of success in achieving their investment goals, including retirement income goals.
Investment Performance. The Board considered whether the fund has operated in accordance with its investment objective, as well as its record of compliance with its investment restrictions and its performance history.
The Board took into account discussions with representatives of the Investment Advisers about fund investment performance that occur at Board meetings throughout the year. In this regard the Board noted that as part of regularly scheduled fund reviews and other reports to the Board on fund performance, the Board considers annualized return information for the fund for different time periods, measured against a securities market index ("benchmark index") and a peer group of funds with similar objectives ("peer group"), if any. In its evaluation of fund investment performance, the Board gave particular attention to information indicating changes in performance of certain Fidelity funds for specific time periods and discussed with the Investment Advisers the reasons for any overperformance or underperformance.
In addition to reviewing absolute and relative fund performance, the Independent Trustees periodically consider the appropriateness of fund performance metrics in evaluating the results achieved. In general, the Independent Trustees believe that fund performance should be evaluated based on net performance (after fees and expenses) of both the highest performing and lowest performing fund share classes, where applicable, compared to appropriate benchmark indices, over appropriate time periods that may include full market cycles, and compared to peer groups, as applicable, over the same periods, taking into account relevant factors including the following: general market conditions; issuer-specific information; and fund cash flows and other factors.
The Independent Trustees recognize that shareholders evaluate performance on a net basis over their own holding periods, for which one-, three-, and five-year periods are often used as a proxy. For this reason, the performance information reviewed by the Board also included net cumulative calendar year total return information for the fund and an appropriate benchmark index and peer group for the most recent one-, three-, and five-year periods, as shown below. Returns are shown compared to the 25th percentile (top of box, 75% beaten) and 75th percentile (bottom of box, 25% beaten) of the peer universe.
Fidelity Advisor New Insights Fund
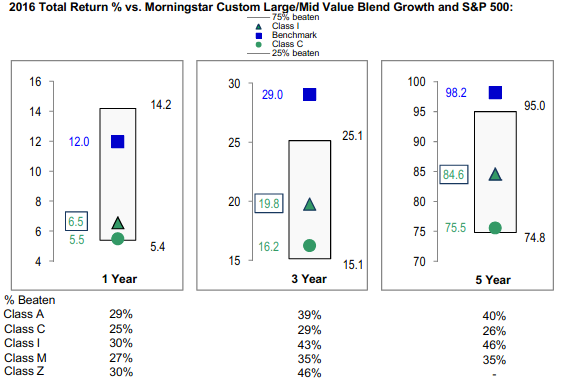
The Board has discussed the fund's underperformance (based on the December 31, 2016 data presented herein) with FMR, including the fund's investment strategy, the portfolio management team, and broader trends in the market that may have impacted the fund's performance, and has engaged with FMR to consider what steps might be taken to remediate the fund's underperformance. The Board noted that the fund's performance has improved since the period shown. The Board noted that there was a portfolio management change for the fund in September 2013.
The Board also considered that the fund's management fee is subject to upward or downward adjustment depending upon whether, and to what extent, the fund's investment performance for the performance period (a rolling 36-month period) exceeds, or is exceeded by, a securities index, thus leading to a performance adjustment for the same period. The Board noted that the performance adjustment provides FMR with a strong economic incentive to seek to achieve superior long-term performance for the fund's shareholders and helps to more closely align the interests of FMR and the shareholders of the fund.
Based on its review, the Board concluded that the nature, extent, and quality of services provided to the fund under the Advisory Contracts should continue to benefit the shareholders of the fund.
Competitiveness of Management Fee and Total Expense Ratio. The Board considered the fund's management fee and total expense ratio compared to "mapped groups" of competitive funds and classes created for the purpose of facilitating the Trustees' competitive analysis of management fees and total expenses. Fidelity creates "mapped groups" by combining similar Lipper investment objective categories that have comparable investment mandates. Combining Lipper investment objective categories aids the Board's management fee and total expense ratio comparisons by broadening the competitive group used for comparison.
Management Fee. The Board considered two proprietary management fee comparisons for the 12-month periods shown in basis points (BP) in the chart below. The group of Lipper funds used by the Board for management fee comparisons is referred to below as the "Total Mapped Group." The Total Mapped Group comparison focuses on a fund's standing in terms of gross management fees before expense reimbursements or caps, and without giving effect to the fund's performance adjustment, relative to the total universe of funds with comparable investment mandates, regardless of whether their management fee structures also are comparable. Funds with comparable investment mandates offer exposure to similar types of securities. Funds with comparable management fee structures have similar management fee contractual arrangements (
e.g., flat rate charged for advisory services, all-inclusive fee rate,
etc.). "TMG %" represents the percentage of funds in the Total Mapped Group that had management fees that were lower than the fund's. For example, a hypothetical TMG % of 20% would mean that 80% of the funds in the Total Mapped Group had higher, and 20% had lower, management fees than the fund. The fund's actual TMG %s and the number of funds in the Total Mapped Group are in the chart below. The "Asset-Size Peer Group" (ASPG) comparison focuses on a fund's standing relative to a subset of non-Fidelity funds within the Total Mapped Group that are similar in size and management fee structure without taking into account performance adjustments, if any. For example, if a fund is in the first quartile of the ASPG, the fund's management fee ranks in the least expensive or lowest 25% of funds in the ASPG. The ASPG represents at least 15% of the funds in the Total Mapped Group with comparable asset size and management fee structures, subject to a minimum of 50 funds (or all funds in the Total Mapped Group if fewer than 50). Additional information, such as the ASPG quartile in which the fund's management fee rate ranked and the impact of the fund's performance adjustment, is also included in the chart and considered by the Board.
Fidelity Advisor New Insights Fund
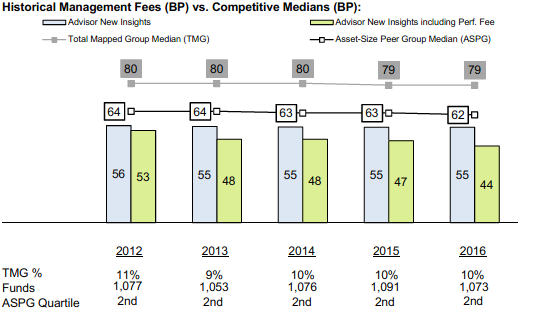
The Board noted that the fund's management fee rate ranked below the median of its Total Mapped Group and below the median of its ASPG for 2016. The Board also noted the effect of the fund's performance adjustment, if any, on the fund's management fee ranking.
The Board noted that, in 2014, the Board and the boards of other Fidelity funds formed the ad hoc Committee on Group Fee to conduct an in-depth review of the "group fee" component of the management fee of funds with such management fee structures. The Committee's focus included the mechanics of the group fee, the competitive landscape of group fee structures, Fidelity funds with no group fee component and investment products not included in group fee assets. The Board also considered that, for funds subject to the group fee, FMR agreed to voluntarily waive fees over a specified period of time in amounts designed to account for assets converted from certain funds to certain collective investment trusts.
The Board also noted that, in 2013, the ad hoc Committee on Management Fees was formed to conduct an in-depth review of the management fee rates of Fidelity's active equity mutual funds. The Committee focused on the following areas: (i) standard fee structures; (ii) research consumption and trading evolution; (iii) management fee competitiveness/profitability by category; and (iv) factors that drive institutional pricing.
Based on its review, the Board concluded that the fund's management fee is fair and reasonable in light of the services that the fund receives and the other factors considered.
Total Expense Ratio. In its review of each class's total expense ratio, the Board considered the fund's management fee rate as well as other fund or class expenses, as applicable, such as transfer agent fees, pricing and bookkeeping fees, fund-paid 12b-1 fees, and custodial, legal, and audit fees. The Board noted the impact of the fund's performance adjustment. The Board also noted that Fidelity may agree to waive fees and expenses from time to time, and the extent to which, if any, it has done so for the fund. As part of its review, the Board also considered the current and historical total expense ratios of each class of the fund compared to competitive fund median expenses. Each class of the fund is compared to those funds and classes in the Total Mapped Group (used by the Board for management fee comparisons) that have a similar sales load structure.
The Board noted that the total expense ratio of each class ranked below the competitive median for 2016.
Fees Charged to Other Fidelity Clients. The Board also considered Fidelity fee structures and other information with respect to clients of Fidelity, such as other funds advised or subadvised by Fidelity, pension plan clients, and other institutional clients with similar mandates. The Board noted that an ad hoc joint committee created by it and the boards of other Fidelity funds periodically (most recently in 2013) reviews and compares Fidelity's institutional investment advisory business with its business of providing services to the Fidelity funds, including the differences in services provided, fees charged, and costs incurred, as well as competition in their respective marketplaces.
Based on its review of total expense ratios and fees charged to other Fidelity clients, the Board concluded that the total expense ratio of each class of the fund was reasonable in light of the services that the fund and its shareholders receive and the other factors considered.
Costs of the Services and Profitability. The Board considered the revenues earned and the expenses incurred by Fidelity in conducting the business of developing, marketing, distributing, managing, administering and servicing the fund and servicing the fund's shareholders. The Board also considered the level of Fidelity's profits in respect of all the Fidelity funds.
On an annual basis, Fidelity presents to the Board information about the profitability of its relationships with the fund. Fidelity calculates profitability information for each fund, as well as aggregate profitability information for groups of Fidelity funds and all Fidelity funds, using a series of detailed revenue and cost allocation methodologies which originate with the books and records of Fidelity on which Fidelity's audited financial statements are based. The Audit Committee of the Board reviews any significant changes from the prior year's methodologies.
PricewaterhouseCoopers LLP (PwC), independent registered public accounting firm and auditor to Fidelity and certain Fidelity funds, has been engaged annually by the Board as part of the Board's assessment of Fidelity's profitability analysis. PwC's engagement includes the review and assessment of the methodologies used by Fidelity in determining the revenues and expenses attributable to Fidelity's mutual fund business, and completion of agreed-upon procedures in respect of the mathematical accuracy of the fund profitability information and its conformity to established allocation methodologies. After considering PwC's reports issued under the engagement and information provided by Fidelity, the Board concluded that while other allocation methods may also be reasonable, Fidelity's profitability methodologies are reasonable in all material respects.
The Board also reviewed Fidelity's non-fund businesses and potential fall-out benefits related to the mutual fund business as well as cases where Fidelity's affiliates may benefit from or be related to the fund's business.
The Board considered the costs of the services provided by and the profits realized by Fidelity in connection with the operation of the fund and was satisfied that the profitability was not excessive.
Economies of Scale. The Board considered whether there have been economies of scale in respect of the management of the Fidelity funds, whether the Fidelity funds (including the fund) have appropriately benefited from any such economies of scale, and whether there is potential for realization of any further economies of scale. The Board considered the extent to which the fund will benefit from economies of scale as assets grow through increased services to the fund, through waivers or reimbursements, or through fee or expense ratio reductions. The Board also noted that a committee (the Economies of Scale Committee) created by it and the boards of other Fidelity funds periodically (most recently in 2013) analyzes whether Fidelity attains economies of scale in respect of the management and servicing of the Fidelity funds, whether the Fidelity funds have appropriately benefited from such economies of scale, and whether there is potential for realization of any further economies of scale.
The Board recognized that the fund's management contract incorporates a "group fee" structure, which provides for lower group fee rates as total group assets increase, and for higher group fee rates as total group assets decrease (with "group assets" defined to include fund assets under FMR's management plus the assets of sector funds previously under FMR's management). FMR calculates the group fee rates based on a tiered asset "breakpoint" schedule that varies based on asset class. The Board considered that the group fee is designed to deliver the benefits of economies of scale to fund shareholders when total Fidelity fund assets increase, even if assets of any particular fund are unchanged or have declined, because some portion of Fidelity's costs are attributable to services provided to all Fidelity funds, and all funds benefit if those costs can be allocated among more assets. The Board concluded that, given the group fee structure, fund shareholders will benefit from lower management fees as group assets increase at the fund complex level, regardless of whether Fidelity achieves any such economies of scale.
The Board concluded, taking into account the analysis of the Economies of Scale Committee, that economies of scale, if any, are being appropriately shared between fund shareholders and Fidelity.
Additional Information Requested by the Board. In order to develop fully the factual basis for consideration of the Fidelity funds' advisory contracts, the Board requested and received additional information on certain topics, including: (i) fund performance trends, in particular the underperformance of certain funds, and Fidelity's long-term strategies for certain funds; (ii) Fidelity's fund profitability methodology, profitability trends for certain funds, and the impact of certain factors on fund profitability results, including the impact of market trends on actively managed funds; (iii) the use of performance fees and the calculation of performance adjustments, including the impact of underperformance and fund outflows on performance adjustments; (iv) metrics for evaluating index fund performance; (v) Fidelity's group fee structure, including the group fee breakpoint schedules; (vi) the terms of Fidelity's contractual and voluntary expense cap arrangements with the funds; (vii) the methodology with respect to evaluating competitive fund data and peer group classifications and fee comparisons; (viii) the expense structures for different funds and classes; (ix) Fidelity's arrangements with affiliated sub-advisers on behalf of the funds; (x) information regarding other accounts managed by Fidelity, including institutional accounts and collective investment trusts; (xi) recent changes to the fee structure for certain funds of funds; and (xii) the impact of the Department of Labor's new fiduciary rule on the funds' comparative expense information.
Based on its evaluation of all of the conclusions noted above, and after considering all factors it believed relevant, the Board concluded that the advisory fee structures are fair and reasonable, and that the fund's Advisory Contracts should be renewed.
ANIF-ANN-0218
1.796407.114
Fidelity® Series Opportunistic Insights Fund
Annual Report December 31, 2017 |
|
Contents
To view a fund's proxy voting guidelines and proxy voting record for the 12-month period ended June 30, visit http://www.fidelity.com/proxyvotingresults or visit the Securities and Exchange Commission's (SEC) web site at http://www.sec.gov.
You may also call 1-800-544-8544 to request a free copy of the proxy voting guidelines.
Standard & Poor's, S&P and S&P 500 are registered service marks of The McGraw-Hill Companies, Inc. and have been licensed for use by Fidelity Distributors Corporation.
Other third-party marks appearing herein are the property of their respective owners.
All other marks appearing herein are registered or unregistered trademarks or service marks of FMR LLC or an affiliated company. © 2018 FMR LLC. All rights reserved.
This report and the financial statements contained herein are submitted for the general information of the shareholders of the Fund. This report is not authorized for distribution to prospective investors in the Fund unless preceded or accompanied by an effective prospectus.
A fund files its complete schedule of portfolio holdings with the SEC for the first and third quarters of each fiscal year on Form N-Q. Forms N-Q are available on the SEC’s web site at http://www.sec.gov. A fund's Forms N-Q may be reviewed and copied at the SEC’s Public Reference Room in Washington, DC. Information regarding the operation of the SEC's Public Reference Room may be obtained by calling 1-800-SEC-0330.
For a complete list of a fund's portfolio holdings, view the most recent holdings listing, semiannual report, or annual report on Fidelity's web site at http://www.fidelity.com, http://www.institutional.fidelity.com, or http://www.401k.com, as applicable.
NOT FDIC INSURED •MAY LOSE VALUE •NO BANK GUARANTEE
Neither the Fund nor Fidelity Distributors Corporation is a bank.
Performance: The Bottom Line
Average annual total return reflects the change in the value of an investment, assuming reinvestment of distributions from dividend income and capital gains (the profits earned upon the sale of securities that have grown in value, if any) and assuming a constant rate of performance each year. The hypothetical investment and the average annual total returns do not reflect the deduction of taxes that a shareholder would pay on fund distributions or the redemption of fund shares. During periods of reimbursement by Fidelity, a fund’s total return will be greater than it would be had the reimbursement not occurred. How a fund did yesterday is no guarantee of how it will do tomorrow.
Average Annual Total Returns
| For the periods ended December 31, 2017 | Past 1 year | Past 5 years | Life of fundA |
| Fidelity® Series Opportunistic Insights Fund | 32.96% | 17.61% | 17.40% |
A From December 6, 2012
$10,000 Over Life of Fund
Let's say hypothetically that $10,000 was invested in Fidelity® Series Opportunistic Insights Fund, a class of the fund, on December 6, 2012, when the fund started.
The chart shows how the value of your investment would have changed, and also shows how the Russell 3000® Index performed over the same period.
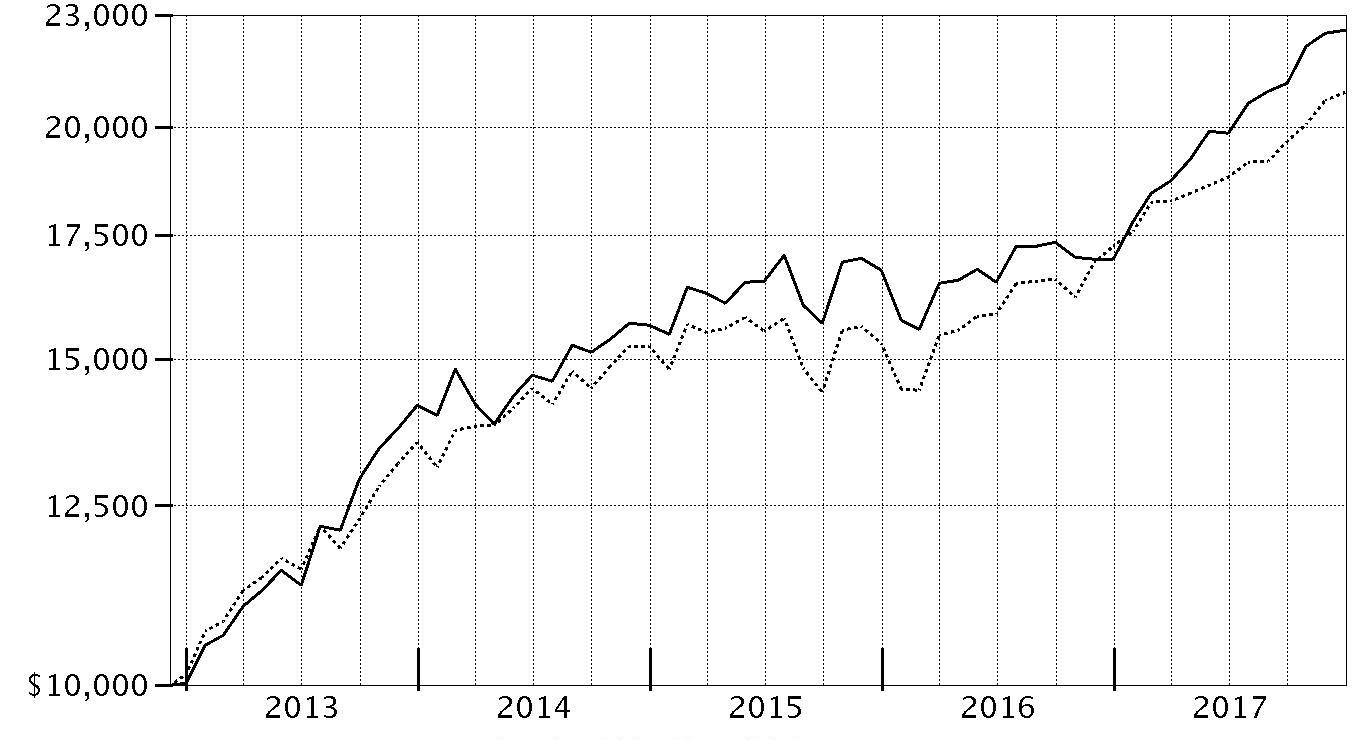
| Period Ending Values |
| $22,560 | Fidelity® Series Opportunistic Insights Fund |
| $20,894 | Russell 3000® Index |
Management's Discussion of Fund Performance
Market Recap: U.S. equities gained 21.83% in 2017, as the S&P 500
® index rose steadily and closed the year just shy of an all-time high after a particularly strong three-month finish. Early on, equities rallied on optimism for President Trump’s pro-business agenda but leveled off in March amid fading optimism and stalled efforts by Congress to repeal and replace the Affordable Care Act. Upward momentum soon returned and continued through year-end with consumer sentiment and other market indicators staying positive. The lone exception was a brief cooldown in August, when geopolitical tension escalated and uncertainty grew regarding the future of health care, tax reform and the debt ceiling. Sector-wise, information technology fared best by a wide margin, rising 39% amid strong earnings growth from several major index constituents. A 24% gain in materials was spurred by increased demand, especially from China. Consumer discretionary gained 23%, despite many brick-and-mortar retailers suffering from online competition, and financials edged the broader market on an uptick in bond yields. Conversely, the defensive energy and telecom services sectors returned about -1% each. Rising interest rates held back real estate (+11%), while consumer staples (+13%) and utilities (+12%) struggled due to investors’ general preference for risk assets.
Comments from Portfolio Manager William Danoff: For the year, the fund gained 32.96%, well ahead of the 21.13% advance of the benchmark Russell 3000
® Index. A more business-friendly administration in the White House, an extremely low interest rate environment worldwide and synchronous global economic expansion propelled the stock market higher. The fund performed very well against this backdrop, with active positioning adding value in nearly all market sectors. Our outperformance of the benchmark primarily was driven by a sizable commitment – about 43% of assets, on average – to the market-leading information technology sector. Here, notable individual contributors included social-media firm Facebook and Google parent Alphabet. Other winners from tech were cloud-computing firm Salesforce.com, publishing software developer Adobe Systems and gaming company Activision Blizzard. Our sizable stake in Amazon.com also meaningfully aided results, as did sidestepping industrial conglomerate General Electric. Given the fund beat its benchmark by roughly 12 percentage points, there were no major detractors, although not owning enough of a few strong benchmark names hurt modestly. These included aircraft manufacturer Boeing and pharmaceutical firm AbbVie. Our largest relative detractor was an overweighting in Henry Schein, a distributor of health care products.
The views expressed above reflect those of the portfolio manager(s) only through the end of the period as stated on the cover of this report and do not necessarily represent the views of Fidelity or any other person in the Fidelity organization. Any such views are subject to change at any time based upon market or other conditions and Fidelity disclaims any responsibility to update such views. These views may not be relied on as investment advice and, because investment decisions for a Fidelity fund are based on numerous factors, may not be relied on as an indication of trading intent on behalf of any Fidelity fund.
Investment Summary (Unaudited)
Top Ten Stocks as of December 31, 2017
| | % of fund's net assets |
| Facebook, Inc. Class A | 8.2 |
| Amazon.com, Inc. | 5.0 |
| Berkshire Hathaway, Inc. Class A | 4.0 |
| Bank of America Corp. | 3.5 |
| Salesforce.com, Inc. | 3.1 |
| JPMorgan Chase & Co. | 2.9 |
| Alphabet, Inc. Class A | 2.7 |
| Alphabet, Inc. Class C | 2.5 |
| Citigroup, Inc. | 2.4 |
| UnitedHealth Group, Inc. | 2.2 |
| | 36.5 |
Top Five Market Sectors as of December 31, 2017
| | % of fund's net assets |
| Information Technology | 40.9 |
| Financials | 20.2 |
| Consumer Discretionary | 14.7 |
| Health Care | 8.8 |
| Industrials | 6.9 |
Asset Allocation (% of fund's net assets)
| As of December 31, 2017* |
| | Stocks | 97.0% |
| | Bonds | 0.1% |
| | Convertible Securities | 2.3% |
| | Short-Term Investments and Net Other Assets (Liabilities) | 0.6% |

* Foreign investments - 7.9%
Investments December 31, 2017
Showing Percentage of Net Assets
| Common Stocks - 97.0% | | | |
| | | Shares | Value |
| CONSUMER DISCRETIONARY - 14.6% | | | |
| Auto Components - 0.0% | | | |
| Aptiv PLC | | 26,100 | $2,214,063 |
| Delphi Technologies PLC (a) | | 8,700 | 456,489 |
| | | | 2,670,552 |
| Automobiles - 1.2% | | | |
| BYD Co. Ltd. (H Shares) | | 412,000 | 3,579,251 |
| General Motors Co. | | 29,900 | 1,225,601 |
| Guangzhou Automobile Group Co. Ltd. (H Shares) | | 284,000 | 673,209 |
| Mahindra & Mahindra Ltd. | | 516,850 | 6,080,922 |
| Maruti Suzuki India Ltd. | | 90,105 | 13,732,473 |
| Tesla, Inc. (a) | | 143,016 | 44,528,032 |
| Toyota Motor Corp. | | 51,900 | 3,307,587 |
| | | | 73,127,075 |
| Diversified Consumer Services - 0.2% | | | |
| Chegg, Inc. (a) | | 99,400 | 1,622,208 |
| Weight Watchers International, Inc. (a) | | 293,700 | 13,005,036 |
| | | | 14,627,244 |
| Hotels, Restaurants & Leisure - 2.0% | | | |
| Churchill Downs, Inc. | | 4,600 | 1,070,420 |
| Eldorado Resorts, Inc. (a) | | 20,900 | 692,835 |
| Hilton Worldwide Holdings, Inc. | | 222,704 | 17,785,141 |
| Las Vegas Sands Corp. | | 18,300 | 1,271,667 |
| Marriott International, Inc. Class A | | 467,484 | 63,451,603 |
| McDonald's Corp. | | 223,400 | 38,451,608 |
| U.S. Foods Holding Corp. (a) | | 66,500 | 2,123,345 |
| Vail Resorts, Inc. | | 11,040 | 2,345,669 |
| | | | 127,192,288 |
| Household Durables - 0.5% | | | |
| D.R. Horton, Inc. | | 29,300 | 1,496,351 |
| Lennar Corp. Class A | | 107,800 | 6,817,272 |
| Mohawk Industries, Inc. (a) | | 71,107 | 19,618,421 |
| Roku, Inc. Class A | | 14,300 | 740,454 |
| | | | 28,672,498 |
| Internet & Direct Marketing Retail - 7.2% | | | |
| Amazon.com, Inc. (a) | | 267,717 | 313,087,000 |
| ASOS PLC (a) | | 8,800 | 797,831 |
| Blue Apron Holdings, Inc.: | | | |
| Class A | | 48,023 | 193,533 |
| Class B | | 192,093 | 766,393 |
| Netflix, Inc. (a) | | 519,699 | 99,761,420 |
| Priceline Group, Inc. (a) | | 17,550 | 30,497,337 |
| Start Today Co. Ltd. | | 164,500 | 5,000,333 |
| Takeaway.com Holding BV (a)(b) | | 34,300 | 2,093,959 |
| Zalando SE (a) | | 44,347 | 2,347,348 |
| | | | 454,545,154 |
| Leisure Products - 0.1% | | | |
| Mattel, Inc. (c) | | 206,100 | 3,169,818 |
| Polaris Industries, Inc. | | 15,500 | 1,921,845 |
| | | | 5,091,663 |
| Media - 1.3% | | | |
| Charter Communications, Inc. Class A (a) | | 42,805 | 14,380,768 |
| Liberty Broadband Corp.: | | | |
| Class A (a) | | 12,484 | 1,061,764 |
| Class C (a) | | 59,474 | 5,064,806 |
| Liberty Global PLC Class A (a) | | 65,821 | 2,359,025 |
| Liberty Media Corp.: | | | |
| Liberty Formula One Group Series C (a)(c) | | 536,943 | 18,341,973 |
| Liberty SiriusXM Series A (a) | | 16,500 | 654,390 |
| Liberty SiriusXM Series C (a) | | 690,196 | 27,373,173 |
| Live Nation Entertainment, Inc. (a) | | 57,900 | 2,464,803 |
| Sirius XM Holdings, Inc. (c) | | 1,442,312 | 7,730,792 |
| The Walt Disney Co. | | 28,300 | 3,042,533 |
| | | | 82,474,027 |
| Multiline Retail - 0.6% | | | |
| B&M European Value Retail S.A. | | 569,520 | 3,257,219 |
| Dollar Tree, Inc. (a) | | 50,400 | 5,408,424 |
| Ollie's Bargain Outlet Holdings, Inc. (a) | | 498,919 | 26,567,437 |
| | | | 35,233,080 |
| Specialty Retail - 1.1% | | | |
| Burlington Stores, Inc. (a) | | 6,000 | 738,180 |
| Five Below, Inc. (a) | | 20,100 | 1,333,032 |
| Home Depot, Inc. | | 321,500 | 60,933,895 |
| TJX Companies, Inc. | | 120,627 | 9,223,140 |
| | | | 72,228,247 |
| Textiles, Apparel & Luxury Goods - 0.4% | | | |
| adidas AG | | 98,170 | 19,688,477 |
| Kering SA | | 7,689 | 3,625,679 |
| LVMH Moet Hennessy - Louis Vuitton SA | | 11,094 | 3,256,149 |
| | | | 26,570,305 |
|
| TOTAL CONSUMER DISCRETIONARY | | | 922,432,133 |
|
| CONSUMER STAPLES - 2.2% | | | |
| Beverages - 0.4% | | | |
| Constellation Brands, Inc. Class A (sub. vtg.) | | 39,100 | 8,937,087 |
| Kweichow Moutai Co. Ltd. (A Shares) | | 31,000 | 3,323,091 |
| Monster Beverage Corp. (a) | | 101,100 | 6,398,619 |
| The Coca-Cola Co. | | 55,200 | 2,532,576 |
| | | | 21,191,373 |
| Food & Staples Retailing - 0.7% | | | |
| Costco Wholesale Corp. | | 113,900 | 21,199,068 |
| Performance Food Group Co. (a) | | 153,400 | 5,077,540 |
| Wal-Mart Stores, Inc. | | 171,110 | 16,897,113 |
| | | | 43,173,721 |
| Food Products - 0.0% | | | |
| The Simply Good Foods Co. | | 84,000 | 1,197,840 |
| Household Products - 0.0% | | | |
| Colgate-Palmolive Co. | | 9,341 | 704,778 |
| Personal Products - 1.1% | | | |
| Estee Lauder Companies, Inc. Class A | | 522,108 | 66,433,022 |
| L'Oreal SA | | 11,478 | 2,543,305 |
| Shiseido Co. Ltd. | | 13,000 | 628,338 |
| Unilever NV (Certificaten Van Aandelen) (Bearer) | | 21,100 | 1,187,993 |
| | | | 70,792,658 |
|
| TOTAL CONSUMER STAPLES | | | 137,060,370 |
|
| ENERGY - 2.2% | | | |
| Oil, Gas & Consumable Fuels - 2.2% | | | |
| Andeavor | | 5,500 | 628,870 |
| Birchcliff Energy Ltd. | | 1,033,500 | 3,617,661 |
| Cabot Oil & Gas Corp. | | 50,800 | 1,452,880 |
| Canadian Natural Resources Ltd. | | 350,600 | 12,528,999 |
| Cenovus Energy, Inc. | | 191,800 | 1,751,682 |
| Centennial Resource Development, Inc.: | | | |
| Class A (a) | | 278,900 | 5,522,220 |
| Class A (a)(c) | | 778,459 | 15,413,488 |
| Class A (d) | | 129,800 | 2,570,040 |
| Concho Resources, Inc. (a) | | 31,500 | 4,731,930 |
| Continental Resources, Inc. (a) | | 227,749 | 12,063,865 |
| Diamondback Energy, Inc. (a) | | 77,218 | 9,748,773 |
| Encana Corp. | | 50,000 | 667,064 |
| EOG Resources, Inc. | | 179,224 | 19,340,062 |
| Phillips 66 Co. | | 144,400 | 14,606,060 |
| Pioneer Natural Resources Co. | | 3,700 | 639,545 |
| PrairieSky Royalty Ltd. | | 145,200 | 3,703,351 |
| Reliance Industries Ltd. | | 1,324,279 | 19,106,002 |
| Tamarack Valley Energy Ltd. (a) | | 1,103,700 | 2,511,203 |
| Valero Energy Corp. | | 64,600 | 5,937,386 |
| | | | 136,541,081 |
| FINANCIALS - 20.1% | | | |
| Banks - 11.5% | | | |
| Bank of America Corp. | | 7,512,196 | 221,760,026 |
| Citigroup, Inc. | | 2,059,827 | 153,271,727 |
| HDFC Bank Ltd. sponsored ADR | | 421,741 | 42,878,407 |
| JPMorgan Chase & Co. | | 1,745,710 | 186,686,227 |
| Kotak Mahindra Bank Ltd. | | 666,239 | 10,542,523 |
| M&T Bank Corp. | | 110,233 | 18,848,741 |
| Metro Bank PLC (a) | | 7,079 | 342,548 |
| PNC Financial Services Group, Inc. | | 164,300 | 23,706,847 |
| Royal Bank of Canada | | 47,700 | 3,895,310 |
| The Toronto-Dominion Bank | | 113,200 | 6,632,601 |
| U.S. Bancorp | | 284,500 | 15,243,510 |
| Wells Fargo & Co. | | 758,994 | 46,048,166 |
| | | | 729,856,633 |
| Capital Markets - 3.5% | | | |
| Ashmore Group PLC | | 87,479 | 478,463 |
| Bank of New York Mellon Corp. | | 237,300 | 12,780,978 |
| BlackRock, Inc. Class A | | 39,553 | 20,318,772 |
| Brookfield Asset Management, Inc. Class A | | 33,900 | 1,475,742 |
| CBOE Holdings, Inc. | | 26,500 | 3,301,635 |
| Charles Schwab Corp. | | 613,900 | 31,536,043 |
| CME Group, Inc. | | 44,600 | 6,513,830 |
| Goldman Sachs Group, Inc. | | 92,500 | 23,565,300 |
| IntercontinentalExchange, Inc. | | 104,500 | 7,373,520 |
| Morgan Stanley | | 1,507,100 | 79,077,537 |
| MSCI, Inc. | | 89,475 | 11,322,167 |
| Oaktree Capital Group LLC Class A | | 202,090 | 8,507,989 |
| S&P Global, Inc. | | 75,116 | 12,724,650 |
| St. James's Place Capital PLC | | 86,200 | 1,426,855 |
| | | | 220,403,481 |
| Consumer Finance - 0.2% | | | |
| Synchrony Financial | | 266,300 | 10,281,843 |
| Diversified Financial Services - 4.0% | | | |
| Berkshire Hathaway, Inc. Class A (a) | | 861 | 256,233,609 |
| Insurance - 0.9% | | | |
| Admiral Group PLC | | 208,444 | 5,634,242 |
| Chubb Ltd. | | 250,805 | 36,650,135 |
| Fairfax Financial Holdings Ltd. (sub. vtg.) | | 11,700 | 6,230,134 |
| Marsh & McLennan Companies, Inc. | | 90,178 | 7,339,587 |
| | | | 55,854,098 |
|
| TOTAL FINANCIALS | | | 1,272,629,664 |
|
| HEALTH CARE - 8.6% | | | |
| Biotechnology - 2.2% | | | |
| AbbVie, Inc. | | 132,800 | 12,843,088 |
| Aduro Biotech, Inc. (a) | | 14,752 | 110,640 |
| Agios Pharmaceuticals, Inc. (a) | | 60,997 | 3,487,198 |
| Alnylam Pharmaceuticals, Inc. (a) | | 22,400 | 2,845,920 |
| Amgen, Inc. | | 12,862 | 2,236,702 |
| AnaptysBio, Inc. | | 26,000 | 2,618,720 |
| Biogen, Inc. (a) | | 15,800 | 5,033,406 |
| bluebird bio, Inc. (a) | | 9,300 | 1,656,330 |
| Blueprint Medicines Corp. (a) | | 12,200 | 920,002 |
| Celgene Corp. (a) | | 91,500 | 9,548,940 |
| Exact Sciences Corp. (a) | | 16,400 | 861,656 |
| FibroGen, Inc. (a) | | 105,037 | 4,978,754 |
| Genmab A/S (a) | | 47,213 | 7,829,899 |
| Gilead Sciences, Inc. | | 272,100 | 19,493,244 |
| Insmed, Inc. (a) | | 53,800 | 1,677,484 |
| Intrexon Corp. (c) | | 97,567 | 1,123,972 |
| Juno Therapeutics, Inc. (a) | | 33,000 | 1,508,430 |
| NantKwest, Inc. (a) | | 40,442 | 181,585 |
| Neurocrine Biosciences, Inc. (a) | | 183,842 | 14,264,301 |
| OvaScience, Inc. (a) | | 1,137,174 | 1,592,044 |
| Portola Pharmaceuticals, Inc. (a) | | 42,800 | 2,083,504 |
| Regeneron Pharmaceuticals, Inc. (a) | | 24,300 | 9,135,828 |
| Sage Therapeutics, Inc. (a) | | 10,600 | 1,745,926 |
| Vertex Pharmaceuticals, Inc. (a) | | 193,800 | 29,042,868 |
| | | | 136,820,441 |
| Health Care Equipment & Supplies - 1.8% | | | |
| Baxter International, Inc. | | 359,500 | 23,238,080 |
| Becton, Dickinson & Co. | | 36,618 | 7,838,449 |
| Boston Scientific Corp. (a) | | 1,807,688 | 44,812,586 |
| Danaher Corp. | | 89,334 | 8,291,982 |
| Edwards Lifesciences Corp. (a) | | 16,400 | 1,848,444 |
| Intuitive Surgical, Inc. (a) | | 53,754 | 19,616,985 |
| Penumbra, Inc. (a) | | 29,798 | 2,803,992 |
| ResMed, Inc. | | 33,104 | 2,803,578 |
| | | | 111,254,096 |
| Health Care Providers & Services - 2.9% | | | |
| Aetna, Inc. | | 42,400 | 7,648,536 |
| Anthem, Inc. | | 5,500 | 1,237,555 |
| Cigna Corp. | | 12,947 | 2,629,406 |
| HealthEquity, Inc. (a) | | 98,759 | 4,608,095 |
| Henry Schein, Inc. (a) | | 199,694 | 13,954,617 |
| Humana, Inc. | | 44,281 | 10,984,788 |
| National Vision Holdings, Inc. | | 43,300 | 1,758,413 |
| OptiNose, Inc. | | 28,700 | 542,430 |
| UnitedHealth Group, Inc. | | 637,366 | 140,513,708 |
| | | | 183,877,548 |
| Health Care Technology - 0.1% | | | |
| Medidata Solutions, Inc. (a) | | 25,184 | 1,595,910 |
| Veeva Systems, Inc. Class A (a) | | 131,910 | 7,291,985 |
| | | | 8,887,895 |
| Life Sciences Tools & Services - 1.1% | | | |
| Agilent Technologies, Inc. | | 90,755 | 6,077,862 |
| Eurofins Scientific SA | | 5,300 | 3,227,932 |
| Mettler-Toledo International, Inc. (a) | | 76,106 | 47,149,189 |
| PRA Health Sciences, Inc. (a) | | 45,152 | 4,111,993 |
| Thermo Fisher Scientific, Inc. | | 31,100 | 5,905,268 |
| Waters Corp. (a) | | 12,865 | 2,485,389 |
| | | | 68,957,633 |
| Pharmaceuticals - 0.5% | | | |
| AstraZeneca PLC sponsored ADR | | 35,700 | 1,238,790 |
| Bristol-Myers Squibb Co. | | 194,132 | 11,896,409 |
| GW Pharmaceuticals PLC ADR (a) | | 3,500 | 462,035 |
| Johnson & Johnson | | 39,200 | 5,477,024 |
| Nektar Therapeutics (a) | | 196,100 | 11,711,092 |
| Teva Pharmaceutical Industries Ltd. sponsored ADR (c) | | 242,800 | 4,601,060 |
| | | | 35,386,410 |
|
| TOTAL HEALTH CARE | | | 545,184,023 |
|
| INDUSTRIALS - 6.8% | | | |
| Aerospace & Defense - 1.0% | | | |
| General Dynamics Corp. | | 36,717 | 7,470,074 |
| Northrop Grumman Corp. | | 75,420 | 23,147,152 |
| Raytheon Co. | | 29,300 | 5,504,005 |
| Space Exploration Technologies Corp.: | | | |
| Class A (a)(d)(e) | | 16,000 | 2,160,000 |
| Class C (d)(e) | | 687 | 92,745 |
| The Boeing Co. | | 79,700 | 23,504,327 |
| | | | 61,878,303 |
| Air Freight & Logistics - 0.6% | | | |
| Expeditors International of Washington, Inc. | | 9,900 | 640,431 |
| FedEx Corp. | | 93,000 | 23,207,220 |
| XPO Logistics, Inc. (a) | | 140,458 | 12,864,548 |
| | | | 36,712,199 |
| Airlines - 0.7% | | | |
| Ryanair Holdings PLC sponsored ADR (a) | | 244,257 | 25,449,137 |
| Southwest Airlines Co. | | 338,600 | 22,161,370 |
| | | | 47,610,507 |
| Building Products - 1.0% | | | |
| A.O. Smith Corp. | | 57,374 | 3,515,879 |
| Fortune Brands Home & Security, Inc. | | 123,369 | 8,443,374 |
| Jeld-Wen Holding, Inc. | | 220,700 | 8,688,959 |
| Masco Corp. | | 710,805 | 31,232,772 |
| Toto Ltd. | | 170,900 | 10,086,399 |
| | | | 61,967,383 |
| Commercial Services & Supplies - 0.2% | | | |
| Cintas Corp. | | 58,793 | 9,161,713 |
| TulCo LLC (d)(e)(f) | | 6,639 | 2,323,650 |
| | | | 11,485,363 |
| Construction & Engineering - 0.0% | | | |
| Jacobs Engineering Group, Inc. | | 47,500 | 3,133,100 |
| Electrical Equipment - 0.5% | | | |
| AMETEK, Inc. | | 36,400 | 2,637,908 |
| Fortive Corp. | | 374,260 | 27,077,711 |
| | | | 29,715,619 |
| Industrial Conglomerates - 0.5% | | | |
| 3M Co. | | 133,652 | 31,457,671 |
| ITT, Inc. | | 5,874 | 313,495 |
| Roper Technologies, Inc. | | 4,800 | 1,243,200 |
| | | | 33,014,366 |
| Machinery - 1.5% | | | |
| Caterpillar, Inc. | | 86,200 | 13,583,396 |
| Deere & Co. | | 172,941 | 27,066,996 |
| Gardner Denver Holdings, Inc. | | 125,000 | 4,241,250 |
| IDEX Corp. | | 4,400 | 580,668 |
| Illinois Tool Works, Inc. | | 108,234 | 18,058,843 |
| Ingersoll-Rand PLC | | 58,900 | 5,253,291 |
| Oshkosh Corp. | | 7,200 | 654,408 |
| PACCAR, Inc. | | 107,841 | 7,665,338 |
| Parker Hannifin Corp. | | 68,000 | 13,571,440 |
| Rational AG | | 2,700 | 1,740,310 |
| Xylem, Inc. | | 30,500 | 2,080,100 |
| | | | 94,496,040 |
| Professional Services - 0.4% | | | |
| Equifax, Inc. | | 32,791 | 3,866,715 |
| Manpower, Inc. | | 13,400 | 1,689,874 |
| Recruit Holdings Co. Ltd. | | 146,900 | 3,650,499 |
| RELX PLC | | 33,700 | 791,246 |
| TransUnion Holding Co., Inc. (a) | | 255,885 | 14,063,440 |
| | | | 24,061,774 |
| Road & Rail - 0.4% | | | |
| CSX Corp. | | 360,600 | 19,836,606 |
| Union Pacific Corp. | | 40,300 | 5,404,230 |
| | | | 25,240,836 |
| Trading Companies & Distributors - 0.0% | | | |
| Fastenal Co. | | 11,817 | 646,272 |
| United Rentals, Inc. (a) | | 6,663 | 1,145,436 |
| | | | 1,791,708 |
|
| TOTAL INDUSTRIALS | | | 431,107,198 |
|
| INFORMATION TECHNOLOGY - 39.3% | | | |
| Communications Equipment - 0.4% | | | |
| Arista Networks, Inc. (a) | | 113,998 | 26,855,649 |
| Electronic Equipment & Components - 2.0% | | | |
| Amphenol Corp. Class A | | 1,292,402 | 113,472,896 |
| CDW Corp. | | 129,500 | 8,998,955 |
| Corning, Inc. | | 9,800 | 313,502 |
| Dolby Laboratories, Inc. Class A | | 45,800 | 2,839,600 |
| Keyence Corp. | | 1,200 | 672,234 |
| | | | 126,297,187 |
| Internet Software & Services - 14.9% | | | |
| Alibaba Group Holding Ltd. sponsored ADR (a) | | 130,332 | 22,473,147 |
| Alphabet, Inc.: | | | |
| Class A (a) | | 158,961 | 167,449,517 |
| Class C (a) | | 150,043 | 157,004,995 |
| CarGurus, Inc. Class A (c) | | 32,900 | 986,342 |
| Cloudera, Inc. | | 86,640 | 1,431,293 |
| CoStar Group, Inc. (a) | | 800 | 237,560 |
| eBay, Inc. (a) | | 472,998 | 17,850,945 |
| Facebook, Inc. Class A (a) | | 2,926,494 | 516,409,130 |
| LogMeIn, Inc. | | 106,739 | 12,221,616 |
| New Relic, Inc. (a) | | 37,100 | 2,143,267 |
| Nutanix, Inc. Class B (b) | | 171,960 | 6,066,749 |
| Okta, Inc. | | 26,893 | 688,730 |
| Q2 Holdings, Inc. (a) | | 2,344 | 86,376 |
| Rightmove PLC | | 19,809 | 1,203,530 |
| Shopify, Inc. Class A (a) | | 25,100 | 2,538,155 |
| SurveyMonkey (a)(d)(e) | | 458,038 | 5,853,726 |
| Tencent Holdings Ltd. | | 524,900 | 27,167,750 |
| | | | 941,812,828 |
| IT Services - 5.5% | | | |
| Accenture PLC Class A | | 63,257 | 9,684,014 |
| ASAC II LP (a)(d)(e) | | 1,788,160 | 300,411 |
| EPAM Systems, Inc. (a) | | 35,755 | 3,841,160 |
| FleetCor Technologies, Inc. (a) | | 600 | 115,458 |
| Global Payments, Inc. | | 115,696 | 11,597,367 |
| Leidos Holdings, Inc. | | 10,057 | 649,380 |
| MasterCard, Inc. Class A | | 739,810 | 111,977,642 |
| PayPal Holdings, Inc. (a) | | 1,409,234 | 103,747,807 |
| Square, Inc. (a) | | 87,900 | 3,047,493 |
| Visa, Inc. Class A | | 902,960 | 102,955,499 |
| | | | 347,916,231 |
| Semiconductors & Semiconductor Equipment - 3.1% | | | |
| Analog Devices, Inc. | | 88,786 | 7,904,618 |
| Applied Materials, Inc. | | 841,249 | 43,004,649 |
| Broadcom Ltd. | | 103,986 | 26,714,003 |
| First Solar, Inc. (a) | | 38,800 | 2,619,776 |
| Lam Research Corp. | | 77,806 | 14,321,750 |
| NVIDIA Corp. | | 266,708 | 51,607,998 |
| Taiwan Semiconductor Manufacturing Co. Ltd. sponsored ADR | | 423,357 | 16,786,105 |
| Texas Instruments, Inc. | | 284,455 | 29,708,480 |
| | | | 192,667,379 |
| Software - 11.4% | | | |
| Activision Blizzard, Inc. | | 1,108,789 | 70,208,519 |
| Adobe Systems, Inc. (a) | | 783,369 | 137,277,584 |
| Atlassian Corp. PLC (a) | | 177,185 | 8,065,461 |
| CDK Global, Inc. | | 84,440 | 6,018,883 |
| Constellation Software, Inc. | | 7,500 | 4,546,659 |
| Electronic Arts, Inc. (a) | | 548,500 | 57,625,410 |
| Intuit, Inc. | | 100,091 | 15,792,358 |
| Micro Focus International PLC | | 95,300 | 3,246,326 |
| Microsoft Corp. | | 1,437,500 | 122,963,750 |
| Nintendo Co. Ltd. | | 9,400 | 3,384,908 |
| Parametric Technology Corp. (a) | | 49,500 | 3,008,115 |
| Paycom Software, Inc. (a)(c) | | 91,507 | 7,350,757 |
| Red Hat, Inc. (a) | | 116,962 | 14,047,136 |
| RingCentral, Inc. (a) | | 99,049 | 4,793,972 |
| Salesforce.com, Inc. (a) | | 1,909,086 | 195,165,862 |
| Snap, Inc. Class A (a)(c) | | 111,677 | 1,631,601 |
| Tanium, Inc. Class B (d)(e) | | 165,100 | 846,963 |
| Ultimate Software Group, Inc. (a) | | 107,610 | 23,483,730 |
| Workday, Inc. Class A (a) | | 405,335 | 41,238,783 |
| | | | 720,696,777 |
| Technology Hardware, Storage & Peripherals - 2.0% | | | |
| Apple, Inc. | | 731,021 | 123,710,684 |
| Xaar PLC | | 175,812 | 877,685 |
| | | | 124,588,369 |
|
| TOTAL INFORMATION TECHNOLOGY | | | 2,480,834,420 |
|
| MATERIALS - 2.6% | | | |
| Chemicals - 1.7% | | | |
| Air Products & Chemicals, Inc. | | 57,800 | 9,483,824 |
| DowDuPont, Inc. | | 658,920 | 46,928,282 |
| LyondellBasell Industries NV Class A | | 41,900 | 4,622,408 |
| Olin Corp. | | 71,300 | 2,536,854 |
| Sherwin-Williams Co. | | 88,114 | 36,130,265 |
| Westlake Chemical Corp. | | 67,000 | 7,137,510 |
| | | | 106,839,143 |
| Construction Materials - 0.0% | | | |
| Eagle Materials, Inc. | | 4,800 | 543,840 |
| Containers & Packaging - 0.2% | | | |
| WestRock Co. | | 171,500 | 10,840,515 |
| Metals & Mining - 0.7% | | | |
| ArcelorMittal SA Class A unit (a)(c) | | 102,100 | 3,298,851 |
| Arizona Mining, Inc. (a) | | 49,537 | 136,355 |
| B2Gold Corp. (a) | | 1,135,802 | 3,505,896 |
| Franco-Nevada Corp. | | 216,000 | 17,262,816 |
| Freeport-McMoRan, Inc. (a) | | 51,900 | 984,024 |
| Ivanhoe Mines Ltd. (a) | | 2,741,800 | 9,248,395 |
| Kirkland Lake Gold Ltd. | | 166,376 | 2,550,569 |
| Newcrest Mining Ltd. | | 145,015 | 2,582,036 |
| Novagold Resources, Inc. (a) | | 385,155 | 1,513,656 |
| Nucor Corp. | | 31,900 | 2,028,202 |
| Randgold Resources Ltd. sponsored ADR | | 20,300 | 2,007,467 |
| | | | 45,118,267 |
|
| TOTAL MATERIALS | | | 163,341,765 |
|
| REAL ESTATE - 0.2% | | | |
| Equity Real Estate Investment Trusts (REITs) - 0.1% | | | |
| American Tower Corp. | | 38,900 | 5,549,863 |
| Real Estate Management & Development - 0.1% | | | |
| Five Point Holdings LLC Class A (a) | | 182,600 | 2,574,660 |
| WeWork Companies, Inc. Class A (a)(d)(e) | | 33,900 | 1,756,359 |
| | | | 4,331,019 |
|
| TOTAL REAL ESTATE | | | 9,880,882 |
|
| TELECOMMUNICATION SERVICES - 0.4% | | | |
| Wireless Telecommunication Services - 0.4% | | | |
| SoftBank Corp. | | 41,200 | 3,261,828 |
| T-Mobile U.S., Inc. (a) | | 338,481 | 21,496,928 |
| | | | 24,758,756 |
| TOTAL COMMON STOCKS | | | |
| (Cost $3,404,887,272) | | | 6,123,770,292 |
|
| Convertible Preferred Stocks - 2.3% | | | |
| CONSUMER DISCRETIONARY - 0.1% | | | |
| Diversified Consumer Services - 0.1% | | | |
| Airbnb, Inc.: | | | |
| Series D (a)(d)(e) | | 30,930 | 2,913,297 |
| Series E (a)(d)(e) | | 13,964 | 1,315,269 |
| | | | 4,228,566 |
| Household Durables - 0.0% | | | |
| Blu Homes, Inc. Series A, 5.00% (a)(d)(e) | | 1,349,024 | 26,980 |
|
| TOTAL CONSUMER DISCRETIONARY | | | 4,255,546 |
|
| CONSUMER STAPLES - 0.0% | | | |
| Food & Staples Retailing - 0.0% | | | |
| Roofoods Ltd. Series F (d)(e) | | 8,137 | 2,877,004 |
| FINANCIALS - 0.1% | | | |
| Consumer Finance - 0.1% | | | |
| Oportun Finance Corp. Series H (a)(d)(e) | | 2,372,991 | 7,024,053 |
| HEALTH CARE - 0.1% | | | |
| Biotechnology - 0.1% | | | |
| 23andMe, Inc.: | | | |
| Series E (a)(d)(e) | | 41,008 | 569,363 |
| Series F (d)(e) | | 176,099 | 2,444,994 |
| | | | 3,014,357 |
| Health Care Providers & Services - 0.0% | | | |
| Mulberry Health, Inc. Series A8 (a)(d)(e) | | 418,866 | 2,663,988 |
|
| TOTAL HEALTH CARE | | | 5,678,345 |
|
| INDUSTRIALS - 0.1% | | | |
| Aerospace & Defense - 0.1% | | | |
| Space Exploration Technologies Corp.: | | | |
| Series G (a)(d)(e) | | 32,066 | 4,328,910 |
| Series H (d)(e) | | 6,366 | 859,410 |
| | | | 5,188,320 |
| INFORMATION TECHNOLOGY - 1.6% | | | |
| Internet Software & Services - 0.7% | | | |
| Dropbox, Inc. Series C (a)(d)(e) | | 394,740 | 6,086,891 |
| Lyft, Inc. Series H (d)(e) | | 79,253 | 3,149,998 |
| Pinterest, Inc.: | | | |
| Series E, 8.00% (a)(d)(e) | | 2,594,015 | 15,512,210 |
| Series F, 8.00% (a)(d)(e) | | 2,122,845 | 12,694,613 |
| Series G, 8.00% (a)(d)(e) | | 369,335 | 2,208,623 |
| Uber Technologies, Inc. Series D, 8.00% (a)(d)(e) | | 111,031 | 3,877,203 |
| | | | 43,529,538 |
| Software - 0.9% | | | |
| Cloudflare, Inc. Series D 8.00% (a)(d)(e) | | 246,150 | 1,351,364 |
| Delphix Corp. Series D (a)(d)(e) | | 204,875 | 1,151,398 |
| Magic Leap, Inc.: | | | |
| Series B, 8.00% (a)(d)(e) | | 1,675,597 | 45,241,119 |
| Series C (a)(d)(e) | | 15,286 | 412,722 |
| Series D (d)(e) | | 412,286 | 11,131,722 |
| | | | 59,288,325 |
|
| TOTAL INFORMATION TECHNOLOGY | | | 102,817,863 |
|
| REAL ESTATE - 0.3% | | | |
| Real Estate Management & Development - 0.3% | | | |
| WeWork Companies, Inc.: | | | |
| Series E (a)(d)(e) | | 305,106 | 15,807,542 |
| Series F (a)(d)(e) | | 14,184 | 734,873 |
| | | | 16,542,415 |
| TELECOMMUNICATION SERVICES - 0.0% | | | |
| Wireless Telecommunication Services - 0.0% | | | |
| Altiostar Networks, Inc. Series A1 (d)(e) | | 122,552 | 191,181 |
| TOTAL CONVERTIBLE PREFERRED STOCKS | | | |
| (Cost $102,842,548) | | | 144,574,727 |
| | | Principal Amount | Value |
|
| Nonconvertible Bonds - 0.1% | | | |
| HEALTH CARE - 0.1% | | | |
| Pharmaceuticals - 0.1% | | | |
| Valeant Pharmaceuticals International, Inc.: | | | |
| 6.125% 4/15/25 (b) | | 3,730,000 | 3,412,950 |
| 9% 12/15/25 (b) | | 4,193,000 | 4,369,945 |
| | | | |
| TOTAL NONCONVERTIBLE BONDS | | | |
| (Cost $7,484,157) | | | 7,782,895 |
| | | | |
| | | Shares | Value |
|
| Money Market Funds - 1.5% | | | |
| Fidelity Cash Central Fund, 1.36% (g) | | 58,785,259 | 58,797,016 |
| Fidelity Securities Lending Cash Central Fund 1.36% (g)(h) | | 36,004,493 | 36,011,694 |
| TOTAL MONEY MARKET FUNDS | | | |
| (Cost $94,803,968) | | | 94,808,710 |
| TOTAL INVESTMENT IN SECURITIES - 100.9% | | | |
| (Cost $3,610,017,945) | | | 6,370,936,624 |
| NET OTHER ASSETS (LIABILITIES) - (0.9)% | | | (53,748,435) |
| NET ASSETS - 100% | | | $6,317,188,189 |
Legend
(a) Non-income producing
(b) Security exempt from registration under Rule 144A of the Securities Act of 1933. These securities may be resold in transactions exempt from registration, normally to qualified institutional buyers. At the end of the period, the value of these securities amounted to $15,943,603 or 0.3% of net assets.
(c) Security or a portion of the security is on loan at period end.
(d) Restricted securities - Investment in securities not registered under the Securities Act of 1933 (excluding 144A issues). At the end of the period, the value of restricted securities (excluding 144A issues) amounted to $160,478,621 or 2.5% of net assets.
(e) Level 3 security
(f) Investment is owned by a wholly-owned subsidiary (Subsidiary) that is treated as a corporation for U.S. tax purposes.
(g) Affiliated fund that is generally available only to investment companies and other accounts managed by Fidelity Investments. The rate quoted is the annualized seven-day yield of the fund at period end. A complete unaudited listing of the fund's holdings as of its most recent quarter end is available upon request. In addition, each Fidelity Central Fund's financial statements, which are not covered by the Fund's Report of Independent Registered Public Accounting Firm, are available on the SEC's website or upon request.
(h) Investment made with cash collateral received from securities on loan.
Additional information on each restricted holding is as follows:
| Security | Acquisition Date | Acquisition Cost |
| 23andMe, Inc. Series E | 6/18/15 | $444,005 |
| 23andMe, Inc. Series F | 8/31/17 | $2,444,994 |
| Airbnb, Inc. Series D | 4/16/14 | $1,259,254 |
| Airbnb, Inc. Series E | 6/29/15 | $1,299,970 |
| Altiostar Networks, Inc. Series A1 | 1/10/17 | $563,739 |
| ASAC II LP | 10/10/13 | $137,706 |
| Blu Homes, Inc. Series A, 5.00% | 6/10/13 - 12/30/14 | $6,232,491 |
| Centennial Resource Development, Inc. Class A | 12/28/16 | $1,887,292 |
| Cloudflare, Inc. Series D 8.00% | 11/5/14 - 6/24/15 | $1,533,709 |
| Delphix Corp. Series D | 7/10/15 | $1,843,875 |
| Dropbox, Inc. Series C | 1/30/14 | $7,540,008 |
| Lyft, Inc. Series H | 11/22/17 | $3,149,998 |
| Magic Leap, Inc. Series B, 8.00% | 10/17/14 | $19,369,901 |
| Magic Leap, Inc. Series C | 12/23/15 | $352,082 |
| Magic Leap, Inc. Series D | 10/6/17 | $11,131,722 |
| Mulberry Health, Inc. Series A8 | 1/20/16 | $2,829,335 |
| Oportun Finance Corp. Series H | 2/6/15 | $6,756,617 |
| Pinterest, Inc. Series E, 8.00% | 10/23/13 | $7,538,571 |
| Pinterest, Inc. Series F, 8.00% | 5/15/14 | $7,211,381 |
| Pinterest, Inc. Series G, 8.00% | 2/27/15 | $2,651,490 |
| Roofoods Ltd. Series F | 9/12/17 | $2,877,004 |
| Space Exploration Technologies Corp. Class A | 10/16/15 - 9/11/17 | $1,655,886 |
| Space Exploration Technologies Corp. Class C | 9/11/17 | $92,745 |
| Space Exploration Technologies Corp. Series G | 1/20/15 | $2,483,832 |
| Space Exploration Technologies Corp. Series H | 8/4/17 | $859,410 |
| SurveyMonkey | 12/15/14 | $7,534,725 |
| Tanium, Inc. Class B | 4/21/17 | $819,606 |
| TulCo LLC | 8/24/17 - 12/14/17 | $2,323,650 |
| Uber Technologies, Inc. Series D, 8.00% | 6/6/14 | $1,722,429 |
| WeWork Companies, Inc. Class A | 6/23/15 | $1,114,956 |
| WeWork Companies, Inc. Series E | 6/23/15 | $10,034,805 |
| WeWork Companies, Inc. Series F | 12/1/16 | $711,927 |
Affiliated Central Funds
Information regarding fiscal year to date income earned by the Fund from investments in Fidelity Central Funds is as follows:
| Fund | Income earned |
| Fidelity Cash Central Fund | $833,648 |
| Fidelity Securities Lending Cash Central Fund | 1,324,376 |
| Total | $2,158,024 |
Amounts in the income column in the above table include any capital gain distributions from underlying funds, which are presented in the corresponding line-item in the Statement of Operations if applicable.
Investment Valuation
The following is a summary of the inputs used, as of December 31, 2017, involving the Fund's assets and liabilities carried at fair value. The inputs or methodology used for valuing securities may not be an indication of the risk associated with investing in those securities. For more information on valuation inputs, and their aggregation into the levels used below, please refer to the Investment Valuation section in the accompanying Notes to Financial Statements.
| | Valuation Inputs at Reporting Date: |
| Description | Total | Level 1 | Level 2 | Level 3 |
| Investments in Securities: | | | | |
| Equities: | | | | |
| Consumer Discretionary | $926,687,679 | $911,522,753 | $10,909,380 | $4,255,546 |
| Consumer Staples | 139,937,374 | 133,329,072 | 3,731,298 | 2,877,004 |
| Energy | 136,541,081 | 136,541,081 | -- | -- |
| Financials | 1,279,653,717 | 1,272,629,664 | -- | 7,024,053 |
| Health Care | 550,862,368 | 545,184,023 | -- | 5,678,345 |
| Industrials | 436,295,518 | 426,530,803 | -- | 9,764,715 |
| Information Technology | 2,583,652,283 | 2,443,280,662 | 30,552,658 | 109,818,963 |
| Materials | 163,341,765 | 163,341,765 | -- | -- |
| Real Estate | 26,423,297 | 8,124,523 | -- | 18,298,774 |
| Telecommunication Services | 24,949,937 | 21,496,928 | 3,261,828 | 191,181 |
| Corporate Bonds | 7,782,895 | -- | 7,782,895 | -- |
| Money Market Funds | 94,808,710 | 94,808,710 | -- | -- |
| Total Investments in Securities: | $6,370,936,624 | $6,156,789,984 | $56,238,059 | $157,908,581 |
The following is a reconciliation of Investments in Securities for which Level 3 inputs were used in determining value:
| Investments in Securities: | |
| Equities - Information Technology | |
| Beginning Balance | $116,935,278 |
| Net Realized Gain (Loss) on Investment Securities | 2,683,051 |
| Net Unrealized Gain (Loss) on Investment Securities | (15,710,613) |
| Cost of Purchases | 15,101,326 |
| Proceeds of Sales | (7,640,255) |
| Amortization/Accretion | -- |
| Transfers into Level 3 | -- |
| Transfers out of Level 3 | (1,549,824) |
| Ending Balance | $109,818,963 |
| The change in unrealized gain (loss) for the period attributable to Level 3 securities held at December 31, 2017 | $(14,908,999) |
| Equities - Other Investments in Securities | |
| Beginning Balance | $47,407,675 |
| Net Realized Gain (Loss) on Investment Securities | (1,400,362) |
| Net Unrealized Gain (Loss) on Investment Securities | (3,423,680) |
| Cost of Purchases | 9,842,077 |
| Proceeds of Sales | (4,336,092) |
| Amortization/Accretion | -- |
| Transfers into Level 3 | -- |
| Transfers out of Level 3 | -- |
| Ending Balance | $48,089,618 |
| The change in unrealized gain (loss) for the period attributable to Level 3 securities held at December 31, 2017 | $(4,435,838) |
The information used in the above reconciliations represents fiscal year to date activity for any Investments in Securities identified as using Level 3 inputs at either the beginning or the end of the current fiscal period. Transfers in or out of Level 3 represent the beginning value of any Security or Instrument where a change in the pricing level occurred from the beginning to the end of the period. The cost of purchases and the proceeds of sales may include securities received or delivered through corporate actions or exchanges. Realized and unrealized gains (losses) disclosed in the reconciliations are included in Net Gain (Loss) on the Fund's Statement of Operations.
See accompanying notes which are an integral part of the financial statements.
Financial Statements
Statement of Assets and Liabilities
| | | December 31, 2017 |
| Assets | | |
Investment in securities, at value (including securities loaned of $34,857,774) — See accompanying schedule:
Unaffiliated issuers (cost $3,515,213,977) | $6,276,127,914 | |
| Fidelity Central Funds (cost $94,803,968) | 94,808,710 | |
| Total Investment in Securities (cost $3,610,017,945) | | $6,370,936,624 |
| Receivable for investments sold | | 13,985,556 |
| Receivable for fund shares sold | | 41,620 |
| Dividends receivable | | 1,625,174 |
| Interest receivable | | 63,260 |
| Distributions receivable from Fidelity Central Funds | | 27,358 |
| Other receivables | | 23,060 |
| Total assets | | 6,386,702,652 |
| Liabilities | | |
| Payable for investments purchased | $12,595,444 | |
| Payable for fund shares redeemed | 19,604,749 | |
| Other payables and accrued expenses | 1,308,625 | |
| Collateral on securities loaned | 36,005,645 | |
| Total liabilities | | 69,514,463 |
| Net Assets | | $6,317,188,189 |
| Net Assets consist of: | | |
| Paid in capital | | $3,426,792,572 |
| Distributions in excess of net investment income | | (958,007) |
| Accumulated undistributed net realized gain (loss) on investments and foreign currency transactions | | 131,655,969 |
| Net unrealized appreciation (depreciation) on investments and assets and liabilities in foreign currencies | | 2,759,697,655 |
| Net Assets | | $6,317,188,189 |
| Series Opportunistic Insights: | | |
| Net Asset Value, offering price and redemption price per share ($6,317,188,189 ÷ 364,753,858 shares) | | $17.32 |
See accompanying notes which are an integral part of the financial statements.
Statement of Operations
| | | Year ended December 31, 2017 |
| Investment Income | | |
| Dividends | | $45,800,829 |
| Interest | | 79,655 |
| Income from Fidelity Central Funds | | 2,158,024 |
| Total income | | 48,038,508 |
| Expenses | | |
| Management fee | | |
| Basic fee | $13,921,609 | |
| Performance adjustment | (307,065) | |
| Transfer agent fees | 1,540,827 | |
| Accounting and security lending fees | 481,323 | |
| Custodian fees and expenses | 201,249 | |
| Independent trustees' fees and expenses | 24,505 | |
| Audit | 44,043 | |
| Legal | 2,351 | |
| Interest | 18,331 | |
| Miscellaneous | 37,917 | |
| Total expenses before reductions | 15,965,090 | |
| Expense reductions | (155,540) | 15,809,550 |
| Net investment income (loss) | | 32,228,958 |
| Realized and Unrealized Gain (Loss) | | |
| Net realized gain (loss) on: | | |
| Investment securities: | | |
| Unaffiliated issuers | 808,951,152 | |
| Fidelity Central Funds | 28,635 | |
| Foreign currency transactions | (60,361) | |
| Total net realized gain (loss) | | 808,919,426 |
| Change in net unrealized appreciation (depreciation) on: | | |
| Unaffiliated issuers (net of increase in deferred foreign taxes of $1,226,531) | 910,385,031 | |
| Fidelity Central Funds | (22,430) | |
| Assets and liabilities in foreign currencies | 9,579 | |
| Total change in net unrealized appreciation (depreciation) | | 910,372,180 |
| Net gain (loss) | | 1,719,291,606 |
| Net increase (decrease) in net assets resulting from operations | | $1,751,520,564 |
See accompanying notes which are an integral part of the financial statements.
Statement of Changes in Net Assets
| | Year ended December 31, 2017 | Year ended December 31, 2016 |
| Increase (Decrease) in Net Assets | | |
| Operations | | |
| Net investment income (loss) | $32,228,958 | $7,053,059 |
| Net realized gain (loss) | 808,919,426 | 126,036,623 |
| Change in net unrealized appreciation (depreciation) | 910,372,180 | (51,918,142) |
| Net increase (decrease) in net assets resulting from operations | 1,751,520,564 | 81,171,540 |
| Distributions to shareholders from net investment income | (33,809,799) | (7,171,425) |
| Distributions to shareholders from net realized gain | (687,222,461) | (147,965,723) |
| Total distributions | (721,032,260) | (155,137,148) |
| Share transactions - net increase (decrease) | (449,052,236) | (10,970,970) |
| Total increase (decrease) in net assets | 581,436,068 | (84,936,578) |
| Net Assets | | |
| Beginning of period | 5,735,752,121 | 5,820,688,699 |
| End of period | $6,317,188,189 | $5,735,752,121 |
| Other Information | | |
| Distributions in excess of net investment income end of period | $(958,007) | $– |
See accompanying notes which are an integral part of the financial statements.
Financial Highlights
Fidelity Series Opportunistic Insights Fund
| Years ended December 31, | 2017 | 2016 | 2015 | 2014 | 2013 |
| Selected Per–Share Data | | | | | |
| Net asset value, beginning of period | $14.69 | $14.89 | $14.89 | $13.98 | $10.02 |
| Income from Investment Operations | | | | | |
| Net investment income (loss)A | .09 | –B | –B | (.01) | –B |
| Net realized and unrealized gain (loss) | 4.75 | .19 | 1.04 | 1.48 | 4.11 |
| Total from investment operations | 4.84 | .19 | 1.04 | 1.47 | 4.11 |
| Distributions from net investment income | (.10) | –B | –B | – | – |
| Distributions from net realized gain | (2.10) | (.38) | (1.04) | (.56) | (.15) |
| Total distributions | (2.21)C | (.39)D | (1.04) | (.56) | (.15) |
| Net asset value, end of period | $17.32 | $14.69 | $14.89 | $14.89 | $13.98 |
| Total ReturnE,F | 32.96% | 1.33% | 7.10% | 10.47% | 41.14% |
| Ratios to Average Net AssetsG,H | | | | | |
| Expenses before reductions | .27% | .83% | .90% | .84% | .78% |
| Expenses net of fee waivers, if any | .27% | .83% | .90% | .84% | .78% |
| Expenses net of all reductions | .27% | .82% | .90% | .84% | .77% |
| Net investment income (loss) | .50% | .03% | .02% | (.04)% | (.04)% |
| Supplemental Data | | | | | |
| Net assets, end of period (000 omitted) | $6,317,188 | $2,240,033 | $2,329,415 | $2,596,300 | $2,594,672 |
| Portfolio turnover rateI | 37% | 40% | 35% | 46% | 52% |
A Calculated based on average shares outstanding during the period.
B Amount represents less than $.005 per share.
C Total distributions of $2.21 per share is comprised of distributions from net investment income of $.104 and distributions from net realized gain of $2.103 per share.
D Total distributions of $.39 per share is comprised of distributions from net investment income of $.004 and distributions from net realized gain of $.383 per share.
E Total returns for periods of less than one year are not annualized.
F Total returns would have been lower if certain expenses had not been reduced during the applicable periods shown.
G Fees and expenses of any underlying Fidelity Central Funds are not included in the Fund's expense ratio. The Fund indirectly bears its proportionate share of the expenses of any underlying Fidelity Central Funds.
H Expense ratios reflect operating expenses of the class. Expenses before reductions do not reflect amounts reimbursed by the investment adviser or reductions from brokerage service arrangements or reductions from other expense offset arrangements and do not represent the amount paid by the class during periods when reimbursements or reductions occur. Expenses net of fee waivers reflect expenses after reimbursement by the investment adviser but prior to reductions from brokerage service arrangements or other expense offset arrangements. Expenses net of all reductions represent the net expenses paid by the class.
I Amount does not include the portfolio activity of any underlying Fidelity Central Funds.
See accompanying notes which are an integral part of the financial statements.
Notes to Financial Statements
For the period ended December 31, 2017
1. Organization.
Fidelity Series Opportunistic Insights Fund (the Fund) is a fund of Fidelity Contrafund (the Trust) and is authorized to issue an unlimited number of shares. The Trust is registered under the Investment Company Act of 1940, as amended (the 1940 Act), as an open-end management investment company organized as a Massachusetts business trust. Effective August 28, 2017, the Fund no longer offered Class F, and all outstanding shares of Class F were exchanged for shares of Series Opportunistic Insights.
2. Investments in Fidelity Central Funds.
The Fund invests in Fidelity Central Funds, which are open-end investment companies generally available only to other investment companies and accounts managed by the investment adviser and its affiliates. The Fund's Schedule of Investments lists each of the Fidelity Central Funds held as of period end, if any, as an investment of the Fund, but does not include the underlying holdings of each Fidelity Central Fund. As an Investing Fund, the Fund indirectly bears its proportionate share of the expenses of the underlying Fidelity Central Funds.
The Money Market Central Funds seek preservation of capital and current income and are managed by Fidelity Investments Money Management, Inc. (FIMM), an affiliate of the investment adviser. Annualized expenses of the Money Market Central Funds as of their most recent shareholder report date are less than .005%.
A complete unaudited list of holdings for each Fidelity Central Fund is available upon request or at the Securities and Exchange Commission (the SEC) website at www.sec.gov. In addition, the financial statements of the Fidelity Central Funds, which are not covered by the Fund's Report of Independent Registered Public Accounting Firm, are available on the SEC website or upon request.
3. Significant Accounting Policies.
The Fund is an investment company and applies the accounting and reporting guidance of the Financial Accounting Standards Board (FASB) Accounting Standards Codification Topic 946 Financial Services – Investments Companies. The financial statements have been prepared in conformity with accounting principles generally accepted in the United States of America (GAAP), which require management to make certain estimates and assumptions at the date of the financial statements. Actual results could differ from those estimates. Subsequent events, if any, through the date that the financial statements were issued have been evaluated in the preparation of the financial statements. The following summarizes the significant accounting policies of the Fund:
Investment Valuation. Investments are valued as of 4:00 p.m. Eastern time on the last calendar day of the period. The Board of Trustees (the Board) has delegated the day to day responsibility for the valuation of the Fund's investments to the Fair Value Committee (the Committee) established by the Fund's investment adviser. In accordance with valuation policies and procedures approved by the Board, the Fund attempts to obtain prices from one or more third party pricing vendors or brokers to value its investments. When current market prices, quotations or currency exchange rates are not readily available or reliable, investments will be fair valued in good faith by the Committee, in accordance with procedures adopted by the Board. Factors used in determining fair value vary by investment type and may include market or investment specific events, changes in interest rates and credit quality. The frequency with which these procedures are used cannot be predicted and they may be utilized to a significant extent. The Committee oversees the Fund's valuation policies and procedures and reports to the Board on the Committee's activities and fair value determinations. The Board monitors the appropriateness of the procedures used in valuing the Fund's investments and ratifies the fair value determinations of the Committee.
The Fund categorizes the inputs to valuation techniques used to value its investments into a disclosure hierarchy consisting of three levels as shown below:
- Level 1 – quoted prices in active markets for identical investments
- Level 2 – other significant observable inputs (including quoted prices for similar investments, interest rates, prepayment speeds, etc.)
- Level 3 – unobservable inputs (including the Fund's own assumptions based on the best information available)
Valuation techniques used to value the Fund's investments by major category are as follows:
Equity securities, including restricted securities, for which market quotations are readily available, are valued at the last reported sale price or official closing price as reported by a third party pricing vendor on the primary market or exchange on which they are traded and are categorized as Level 1 in the hierarchy. In the event there were no sales during the day or closing prices are not available, securities are valued at the last quoted bid price or may be valued using the last available price and are generally categorized as Level 2 in the hierarchy. For foreign equity securities, when market or security specific events arise, comparisons to the valuation of American Depositary Receipts (ADRs), futures contracts, Exchange-Traded Funds (ETFs) and certain indexes as well as quoted prices for similar securities may be used and would be categorized as Level 2 in the hierarchy. Utilizing these techniques may result in transfers between Level 1 and Level 2. For equity securities, including restricted securities, where observable inputs are limited, assumptions about market activity and risk are used and these securities may be categorized as Level 3 in the hierarchy. Equity securities, including restricted securities, for which observable inputs are not available are valued using alternate valuation approaches, including the market approach and the income approach and are categorized as Level 3 in the hierarchy. The market approach generally consists of using comparable market transactions while the income approach generally consists of using the net present value of estimated future cash flows, adjusted as appropriate for liquidity, credit, market and/or other risk factors.
Debt securities, including restricted securities, are valued based on evaluated prices received from third party pricing vendors or from brokers who make markets in such securities. Corporate bonds are valued by pricing vendors who utilize matrix pricing which considers yield or price of bonds of comparable quality, coupon, maturity and type or by broker-supplied prices. When independent prices are unavailable or unreliable, debt securities may be valued utilizing pricing methodologies which consider similar factors that would be used by third party pricing vendors. Debt securities are generally categorized as Level 2 in the hierarchy but may be Level 3 depending on the circumstances.
Investments in open-end mutual funds, including the Fidelity Central Funds, are valued at their closing net asset value (NAV) each business day and are categorized as Level 1 in the hierarchy.
The following provides information on Level 3 securities held by the Fund that were valued at period end based on unobservable inputs. These amounts exclude valuations provided by a broker.
| Asset Type | Fair Value | Valuation
Technique(s) | Unobservable Input | Amount or Range/Weighted Average | Impact to Valuation from an Increase in Input(a) |
| Equities | 157,908,581 | Market
comparable | Enterprise value/Sales multiple (EV/S) | 0.8 – 13.1/6.6 | Increase |
| | | | Discount rate | 0.9% - 25.0%/14.0% | Decrease |
| | | | Price/Earnings multiple (P/E) | 15.2 | Increase |
| | | | Discount for lack of marketability | 15.0% - 25.0%/16.7% | Decrease |
| | | | Enterprise value/EBITDA multiple (EV/EBITDA) | 22.9 | Increase |
| | | | Liquidity preference | $4.84 - $19.10/$14.42 | Increase |
| | | | Premium rate | 7.5% - 108.0%/67.9% | Increase |
| | | Market
approach | Transaction price | $1.56 - $353.57/$55.42 | Increase |
| | | Recovery
value | Recovery value | 0.0% - 0.2%/0.2% | Increase |
| | | Discount
cash flow | Discount rate | 9.0% | Decrease |
| | | | Discount for lack of marketability | 20.0% | Decrease |
| | | | Growth rate | 3.0% | Increase |
(a) Represents the expected directional change in the fair value of the Level 3 investments that would result from an increase in the corresponding input. A decrease to the unobservable input would have the opposite effect. Significant changes in these inputs could result in significantly higher or lower fair value measurements.
Changes in valuation techniques may result in transfers in or out of an assigned level within the disclosure hierarchy. The aggregate value of investments by input level as of December 31, 2017, as well as a roll forward of Level 3 investments, is included at the end of the Fund's Schedule of Investments.
Foreign Currency. The Fund may use foreign currency contracts to facilitate transactions in foreign-denominated securities. Gains and losses from these transactions may arise from changes in the value of the foreign currency or if the counterparties do not perform under the contracts' terms.
Foreign-denominated assets, including investment securities, and liabilities are translated into U.S. dollars at the exchange rates at period end. Purchases and sales of investment securities, income and dividends received and expenses denominated in foreign currencies are translated into U.S. dollars at the exchange rate in effect on the transaction date.
The effects of exchange rate fluctuations on investments are included with the net realized and unrealized gain (loss) on investment securities. Other foreign currency transactions resulting in realized and unrealized gain (loss) are disclosed separately.
Investment Transactions and Income. For financial reporting purposes, the Fund's investment holdings and NAV include trades executed through the end of the last business day of the period. The NAV per share for processing shareholder transactions is calculated as of the close of business of the New York Stock Exchange (NYSE), normally 4:00 p.m. Eastern time and includes trades executed through the end of the prior business day. Gains and losses on securities sold are determined on the basis of identified cost and includes proceeds received from litigation. Dividend income is recorded on the ex-dividend date, except for certain dividends from foreign securities where the ex-dividend date may have passed, which are recorded as soon as the Fund is informed of the ex-dividend date. Non-cash dividends included in dividend income, if any, are recorded at the fair market value of the securities received. Income and capital gain distributions from Fidelity Central Funds, if any, are recorded on the ex-dividend date. Certain distributions received by the Fund represent a return of capital or capital gain. The Fund determines the components of these distributions subsequent to the ex-dividend date, based upon receipt of tax filings or other correspondence relating to the underlying investment. These distributions are recorded as a reduction of cost of investments and/or as a realized gain. Interest income is accrued as earned and includes coupon interest and amortization of premium and accretion of discount on debt securities as applicable. Investment income is recorded net of foreign taxes withheld where recovery of such taxes is uncertain.
Class Allocations and Expenses. Investment income, realized and unrealized capital gains and losses, common expenses of the Fund, and certain fund-level expense reductions, if any, are allocated daily on a pro-rata basis to each class based on the relative net assets of each class to the total net assets of the Fund. Each class differs with respect to transfer agent fees incurred. Certain expense reductions may also differ by class. For the reporting period, the allocated portion of income and expenses to each class as a percent of its average net assets may vary due to the timing of recording these transactions in relation to fluctuating net assets of the classes. Expenses directly attributable to a fund are charged to that fund. Expenses attributable to more than one fund are allocated among the respective funds on the basis of relative net assets or other appropriate methods. Expense estimates are accrued in the period to which they relate and adjustments are made when actual amounts are known.
Income Tax Information and Distributions to Shareholders. Each year, the Fund intends to qualify as a regulated investment company under Subchapter M of the Internal Revenue Code, including distributing substantially all of its taxable income and realized gains. As a result, no provision for U.S. Federal income taxes is required. As of December 31, 2017, the Fund did not have any unrecognized tax benefits in the financial statements; nor is the Fund aware of any tax positions for which it is reasonably possible that the total amounts of unrecognized tax benefits will significantly change in the next twelve months. The Fund files a U.S. federal tax return, in addition to state and local tax returns as required. The Fund's federal income tax returns are subject to examination by the Internal Revenue Service (IRS) for a period of three fiscal years after they are filed. State and local tax returns may be subject to examination for an additional fiscal year depending on the jurisdiction. Foreign taxes are provided for based on the Fund's understanding of the tax rules and rates that exist in the foreign markets in which it invests. The Fund is subject to a tax imposed on capital gains by certain countries in which it invests. An estimated deferred tax liability for net unrealized appreciation on the applicable securities is included in Other payables and accrued expenses on the Statement of Assets & Liabilities.
Distributions are declared and recorded on the ex-dividend date. Income dividends and capital gain distributions are declared separately for each class. Income and capital gain distributions are determined in accordance with income tax regulations, which may differ from GAAP.
Capital accounts within the financial statements are adjusted for permanent book-tax differences. These adjustments have no impact on net assets or the results of operations. Capital accounts are not adjusted for temporary book-tax differences which will reverse in a subsequent period.
Book-tax differences are primarily due to foreign currency transactions, passive foreign investment companies (PFIC), market discount, partnerships and losses deferred due to wash sales and excise tax regulations.
As of period end, the cost and unrealized appreciation (depreciation) in securities, and derivatives if applicable, for federal income tax purposes were as follows:
| Gross unrealized appreciation | $2,797,117,521 |
| Gross unrealized depreciation | (48,209,956) |
| Net unrealized appreciation (depreciation) | $2,748,907,565 |
| Tax Cost | $3,622,029,059 |
The tax-based components of distributable earnings as of period end were as follows:
| Undistributed long-term capital gain | $146,639,829 |
| Net unrealized appreciation (depreciation) on securities and other investments | $2,748,913,072 |
The Fund intends to elect to defer to its next fiscal year $3,930,754 of capital losses recognized during the period November 1, 2017 to December 31, 2017.
The tax character of distributions paid was as follows:
| | December 31, 2017 | December 31, 2016 |
| Ordinary Income | $39,986,589 | $ 10,247,886 |
| Long-term Capital Gains | 681,045,671 | 144,889,262 |
| Total | $721,032,260 | $ 155,137,148 |
Restricted Securities. The Fund may invest in securities that are subject to legal or contractual restrictions on resale. These securities generally may be resold in transactions exempt from registration or to the public if the securities are registered. Disposal of these securities may involve time-consuming negotiations and expense, and prompt sale at an acceptable price may be difficult. Information regarding restricted securities is included at the end of the Fund's Schedule of Investments.
Consolidated Subsidiary. The Fund invests in certain investments through a wholly-owned subsidiary ("Subsidiary"), which may be subject to federal and state taxes upon disposition.
As of period end, the Fund held an investment of $2,323,650 in this Subsidiary, representing .00% of the Fund's net assets. The financial statements have been consolidated and include accounts of the Fund and the Subsidiary. Accordingly, all inter-company transactions and balances have been eliminated.
4. Purchases and Sales of Investments.
Purchases and sales of securities, other than short-term securities, aggregated $2,249,571,344 and $3,251,352,679, respectively.
5. Fees and Other Transactions with Affiliates.
Management Fee. Effective June 1, 2017, under the management contract approved by the Board and shareholders, Fidelity Management & Research Company (the investment adviser) and its affiliates provide the Fund with investment management related services for which the Fund does not pay a management fee. In addition, the investment adviser pays all ordinary operating expenses of the Fund, except custody fees, fees and expenses of the independent Trustees, and certain miscellaneous expenses such as proxy and shareholder meeting expenses.
Prior to June 1, 2017, the investment adviser and its affiliates provided the Fund with investment management related services for which the Fund paid a monthly management fee. The management fee was the sum of an individual fund fee rate that was based on an annual rate of .30% of the Fund's average net assets and an annualized group fee rate that averaged .25% during the period. The group fee rate was based upon the average net assets of all the mutual funds advised by the investment adviser, including any mutual funds previously advised by the investment adviser that are currently advised by Fidelity SelectCo, LLC, an affiliate of the investment adviser. The group fee rate decreased as assets under management increased and increased as assets under management decreased. In addition, the management fee was subject to a performance adjustment (up to a maximum of +/- .20% of the Fund's average net assets over a 36 month performance period). The upward or downward adjustment to the management fee was based on the relative investment performance of Series Opportunistic Insights as compared to its benchmark index, the Russell 3000 Index, over the same 36 month performance period. The performance adjustment included in the management fee rate may be higher or lower than the maximum performance adjustment rate due to the difference between the average net assets for the reporting and performance periods.
Transfer Agent Fees. Fidelity Investments Institutional Operations Company, Inc., (FIIOC), an affiliate of the investment adviser, is the transfer, dividend disbursing and shareholder servicing agent for each class of the Fund. Effective June 1, 2017, fees for these services are no longer charged to the classes. Prior to June 1, 2017, FIIOC received account fees and asset-based fees that varied according to the account size and type of account of the shareholders of Series Opportunistic Insights. FIIOC received no fees for providing transfer agency services to Class F. FIIOC pays for typesetting, printing and mailing of shareholder reports, except proxy statements.
For the period, transfer agent fees for each applicable class were as follows:
| | Amount | % of
Class-Level Average
Net Assets |
| Series Opportunistic Insights | $1,540,827 | .04 |
Accounting and Security Lending Fees. Fidelity Service Company, Inc. (FSC), an affiliate of the investment adviser, maintains the Fund's accounting records. The accounting fee is based on the level of average net assets for each month. Under a separate contract, FSC administers the security lending program. The security lending fee is based on the number and duration of lending transactions. Effective June 1, 2017, these fees are paid by the investment adviser or an affiliate.
Brokerage Commissions. The Fund placed a portion of its portfolio transactions with brokerage firms which are affiliates of the investment adviser. Brokerage commissions are included in net realized gain (loss) and change in net unrealized appreciation (depreciation) in the Statement of Operations. The commissions paid to these affiliated firms were $74,337 for the period.
Interfund Lending Program. Pursuant to an Exemptive Order issued by the SEC, the Fund, along with other registered investment companies having management contracts with Fidelity Management & Research Company (FMR) or other affiliated entities of FMR, may participate in an interfund lending program. This program provides an alternative credit facility allowing the funds to borrow from, or lend money to, other participating affiliated funds. At period end, there were no interfund loans outstanding. The Fund's activity in this program during the period for which loans were outstanding was as follows:
| Borrower or Lender | Average Loan Balance | Weighted Average Interest Rate | Interest Expense |
| Borrower | $74,828,000 | 1.26% | $18,331 |
Interfund Trades. The Fund may purchase from or sell securities to other Fidelity Funds under procedures adopted by the Board. The procedures have been designed to ensure these interfund trades are executed in accordance with Rule 17a-7 of the 1940 Act. Interfund trades are included within the respective purchases and sales amounts shown in the Purchases and Sales of Investments note.
6. Committed Line of Credit.
The Fund participates with other funds managed by the investment adviser or an affiliate in a $4.25 billion credit facility (the "line of credit") to be utilized for temporary or emergency purposes to fund shareholder redemptions or for other short-term liquidity purposes. The Fund has agreed to pay commitment fees on its pro-rata portion of the line of credit, which amounted to $19,438 and is reflected in Miscellaneous expenses on the Statement of Operations. During the period, the Fund did not borrow on this line of credit.
7. Security Lending.
The Fund lends portfolio securities through a lending agent from time to time in order to earn additional income. For equity securities, a lending agent is used and may loan securities to certain qualified borrowers, including Fidelity Capital Markets (FCM), a broker-dealer affiliated with the Fund. On the settlement date of the loan, the Fund receives collateral (in the form of U.S. Treasury obligations, letters of credit and/or cash) against the loaned securities and maintains collateral in an amount not less than 100% of the market value of the loaned securities during the period of the loan. The market value of the loaned securities is determined at the close of business of the Fund and any additional required collateral is delivered to the Fund on the next business day. The Fund or borrower may terminate the loan at any time, and if the borrower defaults on its obligation to return the securities loaned because of insolvency or other reasons, the Fund may apply collateral received from the borrower against the obligation. The Fund may experience delays and costs in recovering the securities loaned. Any cash collateral received is invested in the Fidelity Securities Lending Cash Central Fund. The value of loaned securities and cash collateral at period end are disclosed on the Fund's Statement of Assets and Liabilities. Security lending income represents the income earned on investing cash collateral, less rebates paid to borrowers and any lending agent fees associated with the loan, plus any premium payments received for lending certain types of securities. Security lending income is presented in the Statement of Operations as a component of income from Fidelity Central Funds. Total security lending income during the period amounted to $1,324,376. During the period, there were no securities loaned to FCM.
8. Expense Reductions.
Commissions paid to certain brokers with whom the investment adviser, or its affiliates, places trades on behalf of the Fund include an amount in addition to trade execution, which may be rebated back to the Fund to offset certain expenses. This amount totaled $101,924 for the period. In addition, through arrangements with the Fund's custodian, credits realized as a result of certain uninvested cash balances were used to reduce the Fund's expenses. During the period, these credits reduced the Fund's custody expenses by $1,208.
In addition, during the period the investment adviser reimbursed and/or waived a portion of fund-level operating expenses in the amount of $52,408.
9. Distributions to Shareholders.
Distributions to shareholders of each class were as follows:
| | Year ended
December 31, 2017 | Year ended December 31, 2016 |
| From net investment income | | |
| Series Opportunistic Insights | $33,809,799 | $599,365 |
| Class F | – | 6,572,060 |
| Total | $33,809,799 | $7,171,425 |
| From net realized gain | | |
| Series Opportunistic Insights | $673,643,675 | $58,072,304 |
| Class F | 13,578,786 | 89,893,419 |
| Total | $687,222,461 | $147,965,723 |
10. Share Transactions.
Transactions for each class of shares were as follows:
| | Shares | Shares | Dollars | Dollars |
| | Year ended December 31, 2017 | Year ended December 31, 2016 | Year ended December 31, 2017 | Year ended December 31, 2016 |
| Series Opportunistic Insights | | | | |
| Shares sold | 230,824,270 | 13,833,020 | $4,087,845,532 | $201,333,298 |
| Reinvestment of distributions | 40,736,258 | 4,094,660 | 707,453,474 | 58,671,669 |
| Shares redeemed | (59,247,027) | (21,930,662) | (1,056,827,348) | (319,402,166) |
| Net increase (decrease) | 212,313,501 | (4,002,982) | $3,738,471,658 | $(59,397,199) |
| Class F | | | | |
| Shares sold | 16,795,285 | 35,422,507 | $276,622,082 | $516,456,216 |
| Reinvestment of distributions | 863,790 | 6,698,176 | 13,578,786 | 96,465,479 |
| Shares redeemed | (255,199,500) | (38,722,931) | (4,477,724,762) | (564,495,466) |
| Net increase (decrease) | (237,540,425) | 3,397,752 | $(4,187,523,894) | $48,426,229 |
11. Other.
The Fund's organizational documents provide former and current trustees and officers with a limited indemnification against liabilities arising in connection with the performance of their duties to the Fund. In the normal course of business, the Fund may also enter into contracts that provide general indemnifications. The Fund's maximum exposure under these arrangements is unknown as this would be dependent on future claims that may be made against the Fund. The risk of material loss from such claims is considered remote.
At the end of the period, mutual funds managed by the investment adviser or its affiliates were the owners of record of all of the outstanding shares of the Fund.
Report of Independent Registered Public Accounting Firm
To the Board of Trustees of Fidelity Contrafund and Shareholders of Fidelity Series Opportunistic Insights Fund:
Opinion on the Financial Statements
We have audited the accompanying statement of assets and liabilities, including the schedule of investments, of Fidelity Series Opportunistic Insights Fund (one of the funds constituting Fidelity Contrafund, referred to hereafter as the “Fund”) as of December 31, 2017, the related statement of operations for the year ended December 31, 2017, the statement of changes in net assets for each of the two years in the period ended December 31, 2017,including the related notes, and the financial highlights for each of the five years in the period ended December 31, 2017 (collectively referred to as the “financial statements”). In our opinion, the financial statements present fairly, in all material respects, the financial position of the Fund as of December 31, 2017, the results of its operations for the year then ended, the changes in its net assets for each of the two years in the period ended December 31, 2017 and the financial highlights for each of the five years in the period ended December 31, 2017 in conformity with accounting principles generally accepted in the United States of America.
Basis for Opinion
These financial statements are the responsibility of the Fund’s management. Our responsibility is to express an opinion on the Fund’s financial statements based on our audits. We are a public accounting firm registered with the Public Company Accounting Oversight Board (United States) (“PCAOB”) and are required to be independent with respect to the Fund in accordance with the U.S. federal securities laws and the applicable rules and regulations of the Securities and Exchange Commission and the PCAOB.
We conducted our audits of these financial statements in accordance with the standards of the PCAOB. Those standards require that we plan and perform the audit to obtain reasonable assurance about whether the financial statements are free of material misstatement, whether due to error or fraud.
Our audits included performing procedures to assess the risks of material misstatement of the financial statements, whether due to error or fraud, and performing procedures that respond to those risks. Such procedures included examining, on a test basis, evidence regarding the amounts and disclosures in the financial statements. Our audits also included evaluating the accounting principles used and significant estimates made by management, as well as evaluating the overall presentation of the financial statements. Our procedures included confirmation of securities owned as of December 31, 2017 by correspondence with the custodian and brokers; when replies were not received from brokers, we performed other auditing procedures. We believe that our audits provide a reasonable basis for our opinion.
PricewaterhouseCoopers LLP
Boston, Massachusetts
February 13, 2018
We have served as the auditor of one or more investment companies in the Fidelity group of funds since 1932.
Trustees and Officers
The Trustees, Members of the Advisory Board (if any), and officers of the trust and fund, as applicable, are listed below. The Board of Trustees governs the fund and is responsible for protecting the interests of shareholders. The Trustees are experienced executives who meet periodically throughout the year to oversee the fund's activities, review contractual arrangements with companies that provide services to the fund, oversee management of the risks associated with such activities and contractual arrangements, and review the fund's performance. Each of the Trustees oversees 190 funds.
The Trustees hold office without limit in time except that (a) any Trustee may resign; (b) any Trustee may be removed by written instrument, signed by at least two-thirds of the number of Trustees prior to such removal; (c) any Trustee who requests to be retired or who has become incapacitated by illness or injury may be retired by written instrument signed by a majority of the other Trustees; and (d) any Trustee may be removed at any special meeting of shareholders by a two-thirds vote of the outstanding voting securities of the trust. Each Trustee who is not an interested person (as defined in the 1940 Act) of the trust and the fund is referred to herein as an Independent Trustee. Each Independent Trustee shall retire not later than the last day of the calendar year in which his or her 75th birthday occurs. The Independent Trustees may waive this mandatory retirement age policy with respect to individual Trustees. Officers and Advisory Board Members hold office without limit in time, except that any officer or Advisory Board Member may resign or may be removed by a vote of a majority of the Trustees at any regular meeting or any special meeting of the Trustees. Except as indicated, each individual has held the office shown or other offices in the same company for the past five years.
The fund’s Statement of Additional Information (SAI) includes more information about the Trustees. To request a free copy, call Fidelity at 1-800-544-8544.
Experience, Skills, Attributes, and Qualifications of the Trustees. The Governance and Nominating Committee has adopted a statement of policy that describes the experience, qualifications, attributes, and skills that are necessary and desirable for potential Independent Trustee candidates (Statement of Policy). The Board believes that each Trustee satisfied at the time he or she was initially elected or appointed a Trustee, and continues to satisfy, the standards contemplated by the Statement of Policy. The Governance and Nominating Committee also engages professional search firms to help identify potential Independent Trustee candidates who have the experience, qualifications, attributes, and skills consistent with the Statement of Policy. From time to time, additional criteria based on the composition and skills of the current Independent Trustees, as well as experience or skills that may be appropriate in light of future changes to board composition, business conditions, and regulatory or other developments, have also been considered by the professional search firms and the Governance and Nominating Committee. In addition, the Board takes into account the Trustees' commitment and participation in Board and committee meetings, as well as their leadership of standing and ad hoc committees throughout their tenure.
In determining that a particular Trustee was and continues to be qualified to serve as a Trustee, the Board has considered a variety of criteria, none of which, in isolation, was controlling. The Board believes that, collectively, the Trustees have balanced and diverse experience, qualifications, attributes, and skills, which allow the Board to operate effectively in governing the fund and protecting the interests of shareholders. Information about the specific experience, skills, attributes, and qualifications of each Trustee, which in each case led to the Board's conclusion that the Trustee should serve (or continue to serve) as a trustee of the fund, is provided below.
Board Structure and Oversight Function. James C. Curvey is an interested person and currently serves as Chairman. The Trustees have determined that an interested Chairman is appropriate and benefits shareholders because an interested Chairman has a personal and professional stake in the quality and continuity of services provided to the fund. Independent Trustees exercise their informed business judgment to appoint an individual of their choosing to serve as Chairman, regardless of whether the Trustee happens to be independent or a member of management. The Independent Trustees have determined that they can act independently and effectively without having an Independent Trustee serve as Chairman and that a key structural component for assuring that they are in a position to do so is for the Independent Trustees to constitute a substantial majority for the Board. The Independent Trustees also regularly meet in executive session. Ned C. Lautenbach serves as Chairman of the Independent Trustees and as such (i) acts as a liaison between the Independent Trustees and management with respect to matters important to the Independent Trustees and (ii) with management prepares agendas for Board meetings.
Fidelity® funds are overseen by different Boards of Trustees. The fund's Board oversees Fidelity's high income and certain equity funds, and other Boards oversee Fidelity's investment-grade bond, money market, asset allocation, and sector funds. The asset allocation funds may invest in Fidelity® funds overseen by the fund's Board. The use of separate Boards, each with its own committee structure, allows the Trustees of each group of Fidelity® funds to focus on the unique issues of the funds they oversee, including common research, investment, and operational issues. On occasion, the separate Boards establish joint committees to address issues of overlapping consequences for the Fidelity® funds overseen by each Board.
The Trustees operate using a system of committees to facilitate the timely and efficient consideration of all matters of importance to the Trustees, the fund, and fund shareholders and to facilitate compliance with legal and regulatory requirements and oversight of the fund's activities and associated risks. The Board, acting through its committees, has charged FMR and its affiliates with (i) identifying events or circumstances the occurrence of which could have demonstrably adverse effects on the fund's business and/or reputation; (ii) implementing processes and controls to lessen the possibility that such events or circumstances occur or to mitigate the effects of such events or circumstances if they do occur; and (iii) creating and maintaining a system designed to evaluate continuously business and market conditions in order to facilitate the identification and implementation processes described in (i) and (ii) above. Because the day-to-day operations and activities of the fund are carried out by or through FMR, its affiliates, and other service providers, the fund's exposure to risks is mitigated but not eliminated by the processes overseen by the Trustees. While each of the Board's committees has responsibility for overseeing different aspects of the fund's activities, oversight is exercised primarily through the Operations, Audit, and Compliance Committees. In addition, the Independent Trustees have worked with FMR to enhance the Board's oversight of investment and financial risks, legal and regulatory risks, technology risks, and operational risks, including the development of additional risk reporting to the Board. For example, a working group comprised of Independent Trustees and FMR has worked and continues to work to review the Fidelity® funds' valuation-related activities, reporting and risk management. Appropriate personnel, including but not limited to the fund's Chief Compliance Officer (CCO), FMR's internal auditor, the independent accountants, the fund's Treasurer and portfolio management personnel, make periodic reports to the Board's committees, as appropriate, including an annual review of Fidelity's risk management program for the Fidelity® funds. The responsibilities of each standing committee, including their oversight responsibilities, are described further under "Standing Committees of the Trustees."
Interested Trustees*:
Correspondence intended for a Trustee who is an interested person may be sent to Fidelity Investments, 245 Summer Street, Boston, Massachusetts 02210.
Name, Year of Birth; Principal Occupations and Other Relevant Experience+
James C. Curvey (1935)
Year of Election or Appointment: 2007
Trustee
Chairman of the Board of Trustees
Mr. Curvey also serves as Trustee of other Fidelity® funds. Mr. Curvey is a Director of Fidelity Research & Analysis Co. (investment adviser firm, 2009-present), and Vice Chairman (2007-present) and Director of FMR LLC (diversified financial services company). In addition, Mr. Curvey serves as an Overseer for the Boston Symphony Orchestra and a member of the board of Artis-Naples, Naples, Florida, and as a Trustee for Brewster Academy, Wolfeboro, New Hampshire. Previously, Mr. Curvey served as a Director of Fidelity Investments Money Management, Inc. (investment adviser firm, 2009-2014) and a Director of FMR and FMR Co., Inc. (investment adviser firms, 2007-2014).
Charles S. Morrison (1960)
Year of Election or Appointment: 2014
Trustee
Mr. Morrison also serves as Trustee of other funds. He serves as President of Fidelity SelectCo, LLC (investment adviser firm, 2017-present) and Fidelity Management & Research Company (FMR) (investment adviser firm, 2016-present), a Director of Fidelity Investments Money Management, Inc. (FIMM) (investment adviser firm, 2014-present), Director of Fidelity SelectCo, LLC (investment adviser firm, 2014-present), President, Asset Management (2014-present), and is an employee of Fidelity Investments. Previously, Mr. Morrison served as Vice President of Fidelity's Fixed Income and Asset Allocation Funds (2012-2014), President, Fixed Income (2011-2014), Vice President of Fidelity's Money Market Funds (2005-2009), President, Money Market Group Leader of FMR (investment adviser firm, 2009), and Senior Vice President, Money Market Group of FMR (2004-2009). Mr. Morrison also served as Vice President of Fidelity's Bond Funds (2002-2005), certain Balanced Funds (2002-2005), and certain Asset Allocation Funds (2002-2007), and as Senior Vice President (2002-2005) of Fidelity's Bond Division.
* Determined to be an “Interested Trustee” by virtue of, among other things, his or her affiliation with the trust or various entities under common control with FMR.
+ The information includes the Trustee's principal occupation during the last five years and other information relating to the experience, attributes, and skills relevant to the Trustee's qualifications to serve as a Trustee, which led to the conclusion that the Trustee should serve as a Trustee for the fund.
Independent Trustees:
Correspondence intended for an Independent Trustee may be sent to Fidelity Investments, P.O. Box 55235, Boston, Massachusetts 02205-5235.
Name, Year of Birth; Principal Occupations and Other Relevant Experience+
Dennis J. Dirks (1948)
Year of Election or Appointment: 2005
Trustee
Mr. Dirks also serves as Trustee of other Fidelity® funds. Prior to his retirement in May 2003, Mr. Dirks was Chief Operating Officer and a member of the Board of The Depository Trust & Clearing Corporation (DTCC). He also served as President, Chief Operating Officer, and Board member of The Depository Trust Company (DTC) and President and Board member of the National Securities Clearing Corporation (NSCC). In addition, Mr. Dirks served as Chief Executive Officer and Board member of the Government Securities Clearing Corporation, Chief Executive Officer and Board member of the Mortgage-Backed Securities Clearing Corporation, as a Trustee and a member of the Finance Committee of Manhattan College (2005-2008), as a Trustee and a member of the Finance Committee of AHRC of Nassau County (2006-2008), as a member of the Independent Directors Council (IDC) Governing Council (2010-2015), and as a member of the Board of Directors for The Brookville Center for Children’s Services, Inc. (2009-2017). Mr. Dirks is a member of the Finance Committee (2016-present) and Board of Directors (2017-present) of the Asolo Repertory Theatre.
Alan J. Lacy (1953)
Year of Election or Appointment: 2008
Trustee
Mr. Lacy also serves as Trustee of other Fidelity® funds. Mr. Lacy serves as a Director of Bristol-Myers Squibb Company (global pharmaceuticals, 2008-present). He is a Trustee of the California Chapter of The Nature Conservancy (2015-present) and a Director of the Center for Advanced Study in the Behavioral Sciences at Stanford University (2015-present). In addition, Mr. Lacy served as Senior Adviser (2007-2014) of Oak Hill Capital Partners, L.P. (private equity) and also served as Chief Executive Officer (2005) and Vice Chairman (2005-2006) of Sears Holdings Corporation (retail) and Chief Executive Officer and Chairman of the Board of Sears, Roebuck and Co. (retail, 2000-2005). Previously, Mr. Lacy served as Chairman (2014-2017) and a member (2010-2017) of the Board of Directors of Dave & Buster’s Entertainment, Inc. (restaurant and entertainment complexes), as Chairman (2008-2011) and a member (2006-2015) of the Board of Trustees of the National Parks Conservation Association, and as a member of the Board of Directors for The Hillman Companies, Inc. (hardware wholesalers, 2010-2014), Earth Fare, Inc. (retail grocery, 2010-2014), and The Western Union Company (global money transfer, 2006-2011).
Ned C. Lautenbach (1944)
Year of Election or Appointment: 2000
Trustee
Chairman of the Independent Trustees
Mr. Lautenbach also serves as Trustee of other Fidelity® funds. Mr. Lautenbach currently serves as Vice Chair of the Board of Governors, State University System of Florida (2013-present) and is a member of the Council on Foreign Relations (1994-present). He is also a member and has most recently served as Chairman of the Board of Directors of Artis-Naples (2012-present). Previously, Mr. Lautenbach served as a member and then Lead Director of the Board of Directors of Eaton Corporation (diversified industrial, 1997-2016). He was also a Partner and Advisory Partner at Clayton, Dubilier & Rice, LLC (private equity investment, 1998-2010), as well as a Director of Sony Corporation (2006-2007). In addition, Mr. Lautenbach also had a 30-year career with IBM (technology company) during which time he served as Senior Vice President and a member of the Corporate Executive Committee (1968-1998).
Joseph Mauriello (1944)
Year of Election or Appointment: 2008
Trustee
Mr. Mauriello also serves as Trustee of other Fidelity® funds. Prior to his retirement in January 2006, Mr. Mauriello served in numerous senior management positions including Deputy Chairman and Chief Operating Officer (2004-2005), and Vice Chairman of Financial Services (2002-2004) of KPMG LLP US (professional services, 1965-2005). Mr. Mauriello currently serves as a member of the Board of Directors of XL Group plc. (global insurance and re-insurance, 2006-present) and the Independent Directors Council (IDC) Governing Council (2015-present). Previously, Mr. Mauriello served as a Director of the Hamilton Funds of the Bank of New York (2006-2007) and of Arcadia Resources Inc. (health care services and products, 2007-2012).
Cornelia M. Small (1944)
Year of Election or Appointment: 2005
Trustee
Ms. Small also serves as Trustee of other Fidelity® funds. Ms. Small is a member of the Board of Directors (2009-present) and Chair of the Investment Committee (2010-present) of the Teagle Foundation. Ms. Small also serves on the Investment Committee of the Berkshire Taconic Community Foundation (2008-present). Previously, Ms. Small served as Chairperson (2002-2008) and a member of the Investment Committee and Chairperson (2008-2012) and a member of the Board of Trustees of Smith College. In addition, Ms. Small served as Chief Investment Officer, Director of Global Equity Investments, and a member of the Board of Directors of Scudder, Stevens & Clark and Scudder Kemper Investments.
William S. Stavropoulos (1939)
Year of Election or Appointment: 2001
Trustee
Vice Chairman of the Independent Trustees
Mr. Stavropoulos also serves as Trustee of other Fidelity® funds. Mr. Stavropoulos serves as President and Founder of the Michigan Baseball Foundation, the Great Lakes Loons (2007-present). Mr. Stavropoulos is Chairman Emeritus of the Board of Directors of The Dow Chemical Company, where he previously served in numerous senior management positions, including President, CEO (1995-2000; 2002-2004), Chairman of the Executive Committee (2000-2006), and as a member of the Board of Directors (1990-2006). Currently, Mr. Stavropoulos is Chairman of the Board of Directors of Univar Inc. (global distributor of commodity and specialty chemicals), a Director of Teradata Corporation (data warehousing and technology solutions), and a member of the Advisory Board for Metalmark Capital LLC (private equity investment, 2005-present). Mr. Stavropoulos is an operating advisor to Clayton, Dubilier & Rice, LLC (private equity investment). In addition, Mr. Stavropoulos is a member of the University of Notre Dame Advisory Council for the College of Science, a Trustee of the Rollin L. Gerstacker Foundation, and a Director of Artis-Naples in Naples, Florida. Previously, Mr. Stavropoulos served as a Director of Chemical Financial Corporation (bank holding company, 1993-2012) and Tyco International, Ltd. (multinational manufacturing and services, 2007-2012).
David M. Thomas (1949)
Year of Election or Appointment: 2008
Trustee
Mr. Thomas also serves as Trustee of other Fidelity® funds. Mr. Thomas serves as Non-Executive Chairman of the Board of Directors of Fortune Brands Home and Security (home and security products, 2011-present), as a member of the Board of Directors (2004-present) and Presiding Director (2013-present) of Interpublic Group of Companies, Inc. (marketing communication), and as a member of the Board of Trustees of the University of Florida (2013-present). Previously, Mr. Thomas served as Executive Chairman (2005-2006) and Chairman and Chief Executive Officer (2000-2005) of IMS Health, Inc. (pharmaceutical and healthcare information solutions), and a Director of Fortune Brands, Inc. (consumer products, 2000-2011).
+ The information includes the Trustee's principal occupation during the last five years and other information relating to the experience, attributes, and skills relevant to the Trustee's qualifications to serve as a Trustee, which led to the conclusion that the Trustee should serve as a Trustee for the fund.
Advisory Board Members and Officers:
Correspondence intended for an officer or Peter S. Lynch may be sent to Fidelity Investments, 245 Summer Street, Boston, Massachusetts 02210. Officers appear below in alphabetical order.
Name, Year of Birth; Principal Occupation
Peter S. Lynch (1944)
Year of Election or Appointment: 2003
Member of the Advisory Board
Mr. Lynch also serves as Member of the Advisory Board of other Fidelity® funds. Mr. Lynch is Vice Chairman and a Director of FMR (investment adviser firm) and FMR Co., Inc. (investment adviser firm). In addition, Mr. Lynch serves as a Trustee of Boston College and as the Chairman of the Inner-City Scholarship Fund. Previously, Mr. Lynch served on the Special Olympics International Board of Directors (1997-2006).
Elizabeth Paige Baumann (1968)
Year of Election or Appointment: 2017
Anti-Money Laundering (AML) Officer
Ms. Baumann also serves as AML Officer of other funds. She is Chief AML Officer (2012-present) and Senior Vice President (2014-present) of FMR LLC (diversified financial services company) and is an employee of Fidelity Investments. Previously, Ms. Baumann served as AML Officer of the funds (2012-2016), and Vice President (2007-2014) and Deputy Anti-Money Laundering Officer (2007-2012) of FMR LLC.
Marc R. Bryant (1966)
Year of Election or Appointment: 2015
Secretary and Chief Legal Officer (CLO)
Mr. Bryant also serves as Secretary and CLO of other funds. Mr. Bryant serves as CLO, Secretary, and Senior Vice President of Fidelity Management & Research Company (investment adviser firm, 2015-present) and FMR Co., Inc. (investment adviser firm, 2015-present); Secretary of Fidelity SelectCo, LLC (investment adviser firm, 2015-present) and Fidelity Investments Money Management, Inc. (investment adviser firm, 2015-present); and CLO of Fidelity Management & Research (Hong Kong) Limited and FMR Investment Management (UK) Limited (investment adviser firms, 2015-present) and Fidelity Management & Research (Japan) Limited (investment adviser firm, 2016-present). He is Senior Vice President and Deputy General Counsel of FMR LLC (diversified financial services company). Previously, Mr. Bryant served as Secretary and CLO of Fidelity Rutland Square Trust II (2010-2014) and Assistant Secretary of Fidelity's Fixed Income and Asset Allocation Funds (2013-2015). Prior to joining Fidelity Investments, Mr. Bryant served as a Senior Vice President and the Head of Global Retail Legal for AllianceBernstein L.P. (2006-2010), and as the General Counsel for ProFund Advisors LLC (2001-2006).
William C. Coffey (1969)
Year of Election or Appointment: 2009
Assistant Secretary
Mr. Coffey also serves as Assistant Secretary of other funds. He is Senior Vice President and Deputy General Counsel of FMR LLC (diversified financial services company, 2010-present), and is an employee of Fidelity Investments. Previously, Mr. Coffey served as Vice President and Associate General Counsel of FMR LLC (2005-2009).
Jonathan Davis (1968)
Year of Election or Appointment: 2010
Assistant Treasurer
Mr. Davis also serves as Assistant Treasurer of other funds. Mr. Davis serves as Assistant Treasurer of FMR Capital, Inc. (2017-present) and is an employee of Fidelity Investments. Previously, Mr. Davis served as Vice President and Associate General Counsel of FMR LLC (diversified financial services company, 2003-2010).
Adrien E. Deberghes (1967)
Year of Election or Appointment: 2016
Assistant Treasurer
Mr. Deberghes also serves as an officer of other funds. He serves as Assistant Treasurer of FMR Capital, Inc. (2017-present), Executive Vice President of Fidelity Investments Money Management, Inc. (FIMM) (investment adviser firm, 2016-present), and is an employee of Fidelity Investments (2008-present). Prior to joining Fidelity Investments, Mr. Deberghes was Senior Vice President of Mutual Fund Administration at State Street Corporation (2007-2008), Senior Director of Mutual Fund Administration at Investors Bank & Trust (2005-2007), and Director of Finance for Dunkin' Brands (2000-2005). Previously, Mr. Deberghes served in other fund officer roles.
Stephanie J. Dorsey (1969)
Year of Election or Appointment: 2010
Assistant Treasurer
Ms. Dorsey also serves as an officer of other funds. Ms. Dorsey serves as Assistant Treasurer of FMR Capital, Inc. (2017-present), is an employee of Fidelity Investments (2008-present), and has served in other fund officer roles. Prior to joining Fidelity Investments, Ms. Dorsey served as Treasurer (2004-2008) of the JPMorgan Mutual Funds and Vice President (2004-2008) of JPMorgan Chase Bank.
Howard J. Galligan III (1966)
Year of Election or Appointment: 2014
Chief Financial Officer
Mr. Galligan also serves as Chief Financial Officer of other funds. Mr. Galligan serves as President of Fidelity Pricing and Cash Management Services (FPCMS) (2014-present) and as a Director of Strategic Advisers, Inc. (investment adviser firm, 2008-present). Previously, Mr. Galligan served as Chief Administrative Officer of Asset Management (2011-2014) and Chief Operating Officer and Senior Vice President of Investment Support for Strategic Advisers, Inc. (2003-2011).
Brian B. Hogan (1964)
Year of Election or Appointment: 2009
Vice President
Mr. Hogan also serves as Trustee or Vice President of other funds. Mr. Hogan serves as a Director of FMR Investment Management (UK) Limited (investment adviser firm, 2015-present) and Fidelity SelectCo, LLC (investment adviser firm, 2014-present) and President of the Equity Division of FMR (investment adviser firm, 2009-present). Previously, Mr. Hogan served as Senior Vice President, Equity Research of FMR (2006-2009) and as a portfolio manager. Mr. Brian B. Hogan is not related to Mr. Colm A. Hogan.
Colm A. Hogan (1973)
Year of Election or Appointment: 2016
Deputy Treasurer
Mr. Hogan also serves as an officer of other funds. Mr. Hogan serves as Assistant Treasurer of FMR Capital, Inc. (2017-present) and is an employee of Fidelity Investments (2005-present). Mr. Colm A. Hogan is not related to Mr. Brian B. Hogan.
Chris Maher (1972)
Year of Election or Appointment: 2013
Assistant Treasurer
Mr. Maher serves as Assistant Treasurer of other funds. Mr. Maher is Vice President of Valuation Oversight, serves as Assistant Treasurer of FMR Capital, Inc. (2017-present), and is an employee of Fidelity Investments. Previously, Mr. Maher served as Vice President of Asset Management Compliance (2013), Vice President of the Program Management Group of FMR (investment adviser firm, 2010-2013), and Vice President of Valuation Oversight (2008-2010).
Rieco E. Mello (1969)
Year of Election or Appointment: 2017
Assistant Treasurer
Mr. Mello also serves as Assistant Treasurer of other funds. Mr. Mello serves as Assistant Treasurer of FMR Capital, Inc. (2017-present) and is an employee of Fidelity Investments (1995-present).
Melissa M. Reilly (1971)
Year of Election or Appointment: 2014
Vice President of certain Equity Funds
Ms. Reilly also serves as Vice President of other funds. Ms. Reilly is an employee of Fidelity Investments (2004-present).
Kenneth B. Robins (1969)
Year of Election or Appointment: 2016
Chief Compliance Officer
Mr. Robins also serves as an officer of other funds. Mr. Robins serves as Compliance Officer of Fidelity Management & Research Company and FMR Co., Inc. (investment adviser firms, 2016-present) and is an employee of Fidelity Investments (2004-present). Previously, Mr. Robins served as Executive Vice President of Fidelity Investments Money Management, Inc. (investment adviser firm, 2013-2016) and served in other fund officer roles.
Stacie M. Smith (1974)
Year of Election or Appointment: 2016
President and Treasurer
Ms. Smith also serves as an officer of other funds. Ms. Smith serves as Assistant Treasurer of FMR Capital, Inc. (2017-present), is an employee of Fidelity Investments (2009-present), and has served in other fund officer roles. Prior to joining Fidelity Investments, Ms. Smith served as Senior Audit Manager of Ernst & Young LLP (accounting firm, 1996-2009). Previously, Ms. Smith served as Deputy Treasurer of certain Fidelity® funds (2013-2016).
Marc L. Spector (1972)
Year of Election or Appointment: 2016
Assistant Treasurer
Mr. Spector also serves as an officer of other funds. Mr. Spector serves as Assistant Treasurer of FMR Capital, Inc. (2017-present) and is an employee of Fidelity Investments (2016-present). Prior to joining Fidelity Investments, Mr. Spector served as Director at the Siegfried Group (accounting firm, 2013-2016), and prior to Siegfried Group as audit senior manager at Deloitte & Touche (accounting firm, 2005-2013).
Renee Stagnone (1975)
Year of Election or Appointment: 2016
Assistant Treasurer
Ms. Stagnone also serves as an officer of other funds. Ms. Stagnone serves as Assistant Treasurer of FMR Capital, Inc. (2017-present) and is an employee of Fidelity Investments (1997-present). Previously, Ms. Stagnone served as Deputy Treasurer of certain Fidelity® funds (2013-2016).
Shareholder Expense Example
As a shareholder of the Fund, you incur two types of costs: (1) transaction costs, and (2) ongoing costs, including other Fund expenses. This Example is intended to help you understand your ongoing costs (in dollars) of investing in the Fund and to compare these costs with the ongoing costs of investing in other mutual funds.
The Example is based on an investment of $1,000 invested at the beginning of the period and held for the entire period (July 1, 2017 to December 31, 2017).
Actual Expenses
The first line of the accompanying table provides information about actual account values and actual expenses. You may use the information in this line, together with the amount you invested, to estimate the expenses that you paid over the period. Simply divide your account value by $1,000.00 (for example, an $8,600 account value divided by $1,000.00 = 8.6), then multiply the result by the number in the first line under the heading entitled "Expenses Paid During Period" to estimate the expenses you paid on your account during this period. In addition, the Fund, as a shareholder in the underlying Fidelity Central Funds, will indirectly bear its pro-rata share of the fees and expenses incurred by the underlying Fidelity Central Funds. These fees and expenses are not included in the Fund's annualized expense ratio used to calculate the expense estimate in the table below.
Hypothetical Example for Comparison Purposes
The second line of the accompanying table provides information about hypothetical account values and hypothetical expenses based on the Fund's actual expense ratio and an assumed rate of return of 5% per year before expenses, which is not the Fund's actual return. The hypothetical account values and expenses may not be used to estimate the actual ending account balance or expenses you paid for the period. You may use this information to compare the ongoing costs of investing in the Fund and other funds. To do so, compare this 5% hypothetical example with the 5% hypothetical examples that appear in the shareholder reports of the other funds. In addition, the Fund, as a shareholder in the underlying Fidelity Central Funds, will indirectly bear its pro-rata share of the fees and expenses incurred by the underlying Fidelity Central Funds. These fees and expenses are not included in the Fund's annualized expense ratio used to calculate the expense estimate in the table below.
Please note that the expenses shown in the table are meant to highlight your ongoing costs only and do not reflect any transaction costs. Therefore, the second line of the table is useful in comparing ongoing costs only, and will not help you determine the relative total costs of owning different funds.
| | Annualized Expense Ratio-A | Beginning
Account Value
July 1, 2017 | Ending
Account Value
December 31, 2017 | Expenses Paid
During Period-B
July 1, 2017
to December 31, 2017 |
| Series Opportunistic Insights | - % | | | |
| Actual | | $1,000.00 | $1,136.70 | $- |
| Hypothetical-C | | $1,000.00 | $1,025.21 | $- |
A Annualized expense ratio reflects expenses net of applicable fee waivers.
B Expenses are equal to the Fund's annualized expense ratio, multiplied by the average account value over the period, multiplied by 184/365 (to reflect the one-half year period).
C 5% return per year before expenses
Distributions (Unaudited)
The Board of Trustees of Fidelity Series Opportunistic Insights Fund voted to pay to shareholders of record on February 12, 2018, to shareholders of record at the opening of business on February 9, 2018, a distribution of $0.422 per share derived from capital gains realized from sales of portfolio securities.
The fund hereby designates as a capital gain dividend with respect to the taxable year ended December 31, 2017, $807,160,906, or, if subsequently determined to be different, the net capital gain of such year.
Fidelity Series Opportunistic Insights Fund designates 100% of the dividends distributed in December 2017, as qualifying for the dividends–received deduction for corporate shareholders.
Fidelity Series Opportunistic Insights Fund designates 100% of the dividends distributed during the fiscal year as amounts which may be taken into account as a dividend for purposes of the maximum rate under section 1(h)(11) of the Internal Revenue Code.
The fund will notify shareholders in January 2018 of amounts for use in preparing 2017 income tax returns.
Board Approval of Investment Advisory Contracts and Management Fees
Fidelity Series Opportunistic Insights Fund
Each year, the Board of Trustees, including the Independent Trustees (together, the Board), votes on the renewal of the management contract with Fidelity Management & Research Company (FMR) and the sub-advisory agreements (together, the Advisory Contracts) for the fund. FMR and the sub-advisers are referred to herein as the Investment Advisers. The Board, assisted by the advice of fund counsel and Independent Trustees' counsel, requests and considers a broad range of information relevant to the renewal of the Advisory Contracts throughout the year.
The Board meets regularly and, at each of its meetings, covers an extensive agenda of topics and materials and considers factors that are relevant to its annual consideration of the renewal of the fund's Advisory Contracts, including the services and support provided to the fund and its shareholders. The Board has established various standing committees (Committees), each composed of and chaired by Independent Trustees with varying backgrounds, to which the Board has assigned specific subject matter responsibilities in order to enhance effective decision-making by the Board. The Board, acting directly and through its Committees, requests and receives information concerning the annual consideration of the renewal of the fund's Advisory Contracts. The Board also meets as needed to review matters specifically related to the Board's annual consideration of the renewal of the Advisory Contracts. Members of the Board may also meet with trustees of other Fidelity funds through ad hoc joint committees to discuss certain matters relevant to all of the Fidelity funds.
At its July 2017 meeting, the Board unanimously determined to renew the fund's Advisory Contracts. In reaching its determination, the Board considered that the Advisory Contracts currently in place had become effective on June 1, 2017 in connection with shareholders of certain other Fidelity funds that invest in the fund (referred to herein as Freedom Funds) voting to approve new management contracts for the Freedom Funds. The Board noted the Advisory Contracts implemented a new fee structure pursuant to which the fund does not pay a management fee to FMR. The Board also approved certain amendments to the sub-advisory agreements for the fund to ensure consistency in the sub-advisory fees paid under the new fee structure compared to the sub-advisory fees paid under the prior fee structure. The Board noted that the amendments will not result in any changes to the nature, extent, and quality of services provided to the fund.
In considering whether to renew the Advisory Contracts for the fund, the Board considered all factors it believed relevant and reached a determination, with the assistance of fund counsel and Independent Trustees' counsel and through the exercise of its business judgment, that the renewal of the Advisory Contracts was in the best interests of the fund and its shareholders and the fact that no fee is payable under the management contract was fair and reasonable.
Nature, Extent, and Quality of Services Provided. The Board considered Fidelity's staffing as it relates to the fund, including the backgrounds of investment personnel of Fidelity, and also considered the fund's investment objective, strategies, and related investment philosophy. The Independent Trustees also had discussions with senior management of Fidelity's investment operations and investment groups. The Board considered the structure of the investment personnel compensation program and whether this structure provides appropriate incentives to act in the best interests of the fund.
Resources Dedicated to Investment Management and Support Services. The Board and the Fund Oversight and Research Committees reviewed the general qualifications and capabilities of Fidelity's investment staff, including its size, education, experience, and resources, as well as Fidelity's approach to recruiting, training, managing, and compensating investment personnel. The Board noted that Fidelity has continued to increase the resources devoted to non-U.S. offices, including expansion of Fidelity's global investment organization. The Board also noted that Fidelity's analysts have extensive resources, tools and capabilities that allow them to conduct sophisticated quantitative and fundamental analysis, as well as credit analysis of issuers, counterparties and guarantors. Further, the Board considered that Fidelity's investment professionals have sufficient access to global information and data so as to provide competitive investment results over time, and that those professionals also have access to sophisticated tools that permit them to assess portfolio construction and risk and performance attribution characteristics continuously, as well as to transmit new information and research conclusions rapidly around the world. Additionally, in its deliberations, the Board considered Fidelity's trading, risk management, compliance, and technology and operations capabilities and resources, which are integral parts of the investment management process.
Administrative Services. The Board considered (i) the nature, extent, quality, and cost of advisory and administrative services performed by the Investment Advisers and their affiliates under the Advisory Contracts and under separate agreements covering transfer agency, pricing and bookkeeping, and securities lending services for the fund; (ii) the nature and extent of the supervision of third party service providers, principally custodians, subcustodians, and pricing vendors; and (iii) the resources devoted to, and the record of compliance with, the fund's compliance policies and procedures. The Board also reviewed the allocation of fund brokerage, including allocations to brokers affiliated with the Investment Advisers, the use of brokerage commissions to pay fund expenses, and the use of "soft" commission dollars to pay for research services.
Investment Performance. The Board considered whether the fund has operated in accordance with its investment objective, as well as its record of compliance with its investment restrictions. The Board reviewed the fund's absolute investment performance, as well as the fund's relative investment performance, but did not consider performance to be a material factor in its decision to renew the fund's Advisory Contracts, as the fund is not publicly offered as a stand-alone investment product. In this regard, the Board noted that the fund is designed to offer an investment option for other investment companies managed by Fidelity and ultimately to enhance the performance of those investment companies.
Based on its review, the Board concluded that the nature, extent, and quality of services provided to the fund under the Advisory Contracts should continue to benefit the shareholders of the fund.
Competitiveness of Management Fee and Total Expense Ratio. The Board considered that the fund does not pay FMR a management fee for investment advisory services. The Board also noted that FMR or an affiliate undertakes to pay all operating expenses of the fund, except transfer agent fees, 12b-1 fees, Independent Trustee fees and expenses, custodian fees and expenses, proxy and shareholder meeting expenses, interest, taxes, brokerage expenses, and extraordinary expenses (such as litigation expenses).
The Board further considered that, effective June 1, 2017, FMR has contractually agreed to reimburse the fund to the extent that total operating expenses (excluding interest, certain taxes, certain securities lending costs, brokerage commissions, fees and expenses of the Independent Trustees, proxy and shareholder meeting expenses, extraordinary expenses, and acquired fund fees and expenses, if any), as a percentage of its average net assets, exceed 0.014% through February 28, 2021.
Based on its review, the Board considered that the fund does not pay a management fee and concluded that the total expense ratio of each class of the fund was reasonable in light of the services that the fund and its shareholders receive and the other factors considered.
Costs of the Services and Profitability. The Board considered the level of Fidelity's profits in respect of all the Fidelity funds.
PricewaterhouseCoopers LLP (PwC), independent registered public accounting firm and auditor to Fidelity and certain Fidelity funds, has been engaged annually by the Board as part of the Board's assessment of Fidelity's profitability analysis. PwC's engagement includes the review and assessment of the methodologies used by Fidelity in determining the revenues and expenses attributable to Fidelity's mutual fund business, and completion of agreed-upon procedures in respect of the mathematical accuracy of the fund profitability information and its conformity to established allocation methodologies. After considering PwC's reports issued under the engagement and information provided by Fidelity, the Board concluded that while other allocation methods may also be reasonable, Fidelity's profitability methodologies are reasonable in all material respects.
The Board also reviewed Fidelity's non-fund businesses and potential fall-out benefits related to the mutual fund business as well as cases where Fidelity's affiliates may benefit from or be related to the fund's business.
The Board concluded that the costs of the services provided by and the profits realized by Fidelity in connection with the operation of the fund were not relevant to the renewal of the Advisory Contracts because the fund pays no advisory fees and FMR or an affiliate bears all expenses of the fund, with limited exceptions.
Economies of Scale. The Board concluded that because the fund pays no advisory fees and FMR or an affiliate bears all expenses of the fund, with limited exceptions, economies of scale cannot be realized by the fund.
Additional Information Requested by the Board. In order to develop fully the factual basis for consideration of the Fidelity funds' advisory contracts, the Board requested and received additional information on certain topics, including: (i) fund performance trends, in particular the underperformance of certain funds, and Fidelity's long-term strategies for certain funds; (ii) Fidelity's fund profitability methodology, profitability trends for certain funds, and the impact of certain factors on fund profitability results, including the impact of market trends on actively managed funds; (iii) the use of performance fees and the calculation of performance adjustments, including the impact of underperformance and fund outflows on performance adjustments; (iv) metrics for evaluating index fund performance; (v) Fidelity's group fee structure, including the group fee breakpoint schedules; (vi) the terms of Fidelity's contractual and voluntary expense cap arrangements with the funds; (vii) the methodology with respect to evaluating competitive fund data and peer group classifications and fee comparisons; (viii) the expense structures for different funds and classes; (ix) Fidelity's arrangements with affiliated sub-advisers on behalf of the funds; (x) information regarding other accounts managed by Fidelity, including institutional accounts and collective investment trusts; (xi) recent changes to the fee structure for certain funds of funds; and (xii) the impact of the Department of Labor's new fiduciary rule on the funds' comparative expense information.
Based on its evaluation of all of the conclusions noted above, and after considering all factors it believed relevant, the Board concluded that the advisory fee structures are fair and reasonable, and that the fund's Advisory Contracts should be renewed.
Corporate Headquarters
245 Summer St.
Boston, MA 02210
www.fidelity.com
O1T-ANN-0218
1.951052.105
Fidelity Advisor® Series Opportunistic Insights Fund
Annual Report December 31, 2017 |
|
Contents
To view a fund's proxy voting guidelines and proxy voting record for the 12-month period ended June 30, visit http://www.fidelity.com/proxyvotingresults or visit the Securities and Exchange Commission's (SEC) web site at http://www.sec.gov.
You may also call 1-877-208-0098 to request a free copy of the proxy voting guidelines.
Standard & Poor's, S&P and S&P 500 are registered service marks of The McGraw-Hill Companies, Inc. and have been licensed for use by Fidelity Distributors Corporation.
Other third-party marks appearing herein are the property of their respective owners.
All other marks appearing herein are registered or unregistered trademarks or service marks of FMR LLC or an affiliated company. © 2018 FMR LLC. All rights reserved.
This report and the financial statements contained herein are submitted for the general information of the shareholders of the Fund. This report is not authorized for distribution to prospective investors in the Fund unless preceded or accompanied by an effective prospectus.
A fund files its complete schedule of portfolio holdings with the SEC for the first and third quarters of each fiscal year on Form N-Q. Forms N-Q are available on the SEC’s web site at http://www.sec.gov. A fund's Forms N-Q may be reviewed and copied at the SEC’s Public Reference Room in Washington, DC. Information regarding the operation of the SEC's Public Reference Room may be obtained by calling 1-800-SEC-0330.
For a complete list of a fund's portfolio holdings, view the most recent holdings listing, semiannual report, or annual report on Fidelity's web site at http://www.fidelity.com, http://www.institutional.fidelity.com, or http://www.401k.com, as applicable.
NOT FDIC INSURED •MAY LOSE VALUE •NO BANK GUARANTEE
Neither the Fund nor Fidelity Distributors Corporation is a bank.
Performance: The Bottom Line
Average annual total return reflects the change in the value of an investment, assuming reinvestment of distributions from dividend income and capital gains (the profits earned upon the sale of securities that have grown in value, if any) and assuming a constant rate of performance each year. The hypothetical investment and the average annual total returns do not reflect the deduction of taxes that a shareholder would pay on fund distributions or the redemption of fund shares. During periods of reimbursement by Fidelity, a fund’s total return will be greater than it would be had the reimbursement not occurred. How a fund did yesterday is no guarantee of how it will do tomorrow.
Average Annual Total Returns
| For the periods ended December 31, 2017 | Past 1 year | Past 5 years | Life of fundA |
| Fidelity Advisor® Series Opportunistic Insights Fund | 34.44% | 17.99% | 17.85% |
A From December 6, 2012
$10,000 Over Life of Fund
Let's say hypothetically that $10,000 was invested in Fidelity Advisor® Series Opportunistic Insights Fund on December 6, 2012, when the fund started.
The chart shows how the value of your investment would have changed, and also shows how the Russell 3000® Index performed over the same period.
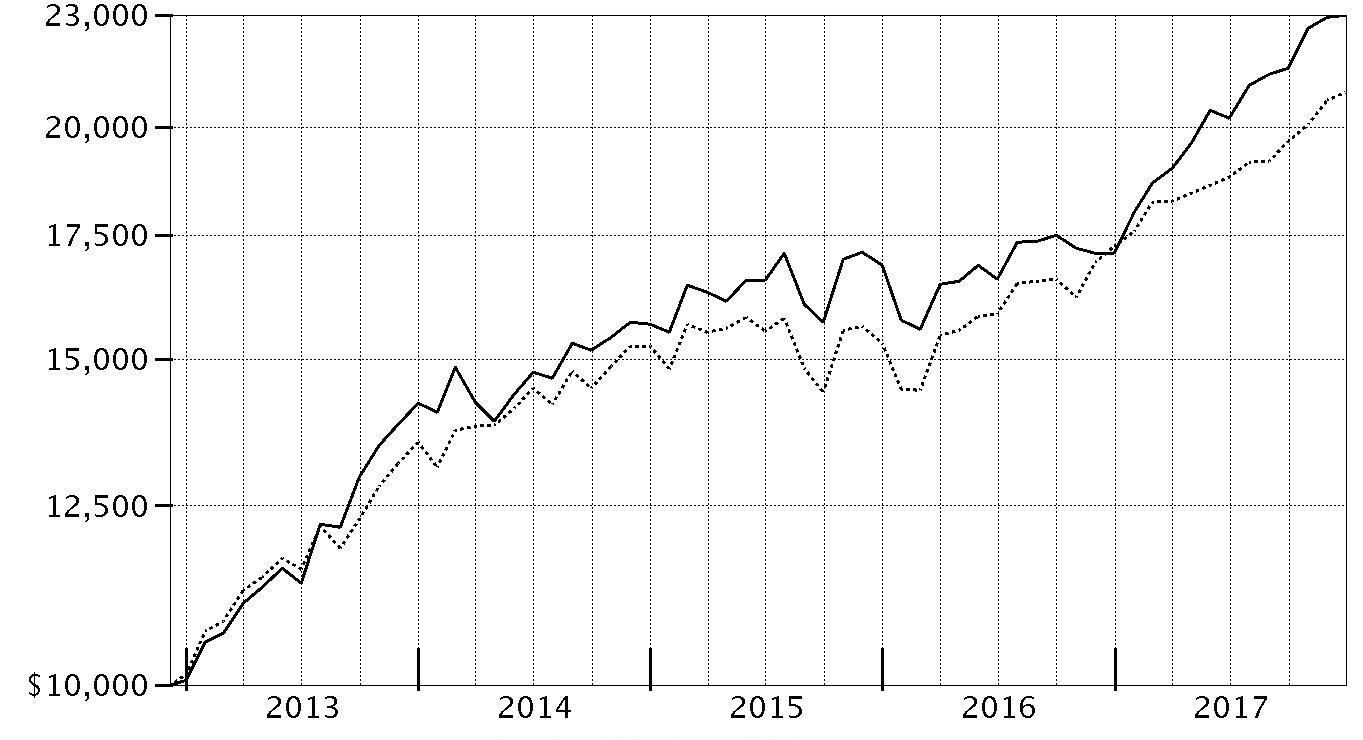
| Period Ending Values |
| $22,996 | Fidelity Advisor® Series Opportunistic Insights Fund |
| $20,894 | Russell 3000® Index |
Management's Discussion of Fund Performance
Market Recap: U.S. equities gained 21.83% in 2017, as the S&P 500
® index rose steadily and closed the year just shy of an all-time high after a particularly strong three-month finish. Early on, equities rallied on optimism for President Trump’s pro-business agenda but leveled off in March amid fading optimism and stalled efforts by Congress to repeal and replace the Affordable Care Act. Upward momentum soon returned and continued through year-end with consumer sentiment and other market indicators staying positive. The lone exception was a brief cooldown in August, when geopolitical tension escalated and uncertainty grew regarding the future of health care, tax reform and the debt ceiling. Sector-wise, information technology fared best by a wide margin, rising 39% amid strong earnings growth from several major index constituents. A 24% gain in materials was spurred by increased demand, especially from China. Consumer discretionary gained 23%, despite many brick-and-mortar retailers suffering from online competition, and financials edged the broader market on an uptick in bond yields. Conversely, the defensive energy and telecom services sectors returned about -1% each. Rising interest rates held back real estate (+11%), while consumer staples (+13%) and utilities (+12%) struggled due to investors’ general preference for risk assets.
Comments from Portfolio Manager William Danoff: For the year, the fund gained 34.44%, well ahead of the 21.13% advance of the benchmark Russell 3000
® Index. A more business-friendly administration in the White House, an extremely low interest rate environment worldwide and synchronous global economic expansion propelled the stock market higher. The fund performed very well against this backdrop, with active positioning adding value in nearly all market sectors. Our outperformance of the benchmark primarily was driven by a sizable commitment – about 44% of assets, on average – to the market-leading information technology sector. Here, notable individual contributors included social-media firm Facebook and Google parent Alphabet. Other winners from tech were cloud-computing firm Salesforce.com, publishing software developer Adobe Systems and gaming company Activision Blizzard. Our sizable stake in Amazon.com also meaningfully aided results, as did shying away from industrial conglomerate General Electric. Given the fund beat its benchmark by roughly 13 percentage points, there were no major detractors, although not owning enough of a few outperforming benchmark names hurt modestly. These included aircraft manufacturer Boeing and pharmaceutical firm AbbVie. It also hurt to overweight Henry Schein, a distributor of health care products.
The views expressed above reflect those of the portfolio manager(s) only through the end of the period as stated on the cover of this report and do not necessarily represent the views of Fidelity or any other person in the Fidelity organization. Any such views are subject to change at any time based upon market or other conditions and Fidelity disclaims any responsibility to update such views. These views may not be relied on as investment advice and, because investment decisions for a Fidelity fund are based on numerous factors, may not be relied on as an indication of trading intent on behalf of any Fidelity fund.
Investment Summary (Unaudited)
Top Ten Stocks as of December 31, 2017
| | % of fund's net assets |
| Amazon.com, Inc. | 7.3 |
| Facebook, Inc. Class A | 7.3 |
| Alphabet, Inc. Class A | 4.2 |
| Salesforce.com, Inc. | 4.1 |
| Berkshire Hathaway, Inc. Class A | 3.8 |
| Alphabet, Inc. Class C | 3.6 |
| Netflix, Inc. | 2.9 |
| Citigroup, Inc. | 2.4 |
| Adobe Systems, Inc. | 2.3 |
| Bank of America Corp. | 2.2 |
| | 40.1 |
Top Five Market Sectors as of December 31, 2017
| | % of fund's net assets |
| Information Technology | 42.9 |
| Consumer Discretionary | 17.3 |
| Financials | 16.3 |
| Health Care | 8.0 |
| Industrials | 7.4 |
Asset Allocation (% of fund's net assets)
| As of December 31, 2017* |
| | Stocks | 97.2% |
| | Convertible Securities | 2.3% |
| | Bonds | 0.1% |
| | Short-Term Investments and Net Other Assets (Liabilities) | 0.4% |

* Foreign investments - 7.5%
Investments December 31, 2017
Showing Percentage of Net Assets
| Common Stocks - 97.2% | | | |
| | | Shares | Value |
| CONSUMER DISCRETIONARY - 17.2% | | | |
| Auto Components - 0.0% | | | |
| Aptiv PLC | | 3,600 | $305,388 |
| Delphi Technologies PLC (a) | | 1,200 | 62,964 |
| | | | 368,352 |
| Automobiles - 0.8% | | | |
| BYD Co. Ltd. (H Shares) | | 57,000 | 495,188 |
| Guangzhou Automobile Group Co. Ltd. (H Shares) | | 40,000 | 94,818 |
| Tesla, Inc. (a) | | 18,289 | 5,694,280 |
| Toyota Motor Corp. | | 7,100 | 452,483 |
| | | | 6,736,769 |
| Diversified Consumer Services - 0.2% | | | |
| Chegg, Inc. (a)(b) | | 13,700 | 223,584 |
| Weight Watchers International, Inc. (a) | | 44,042 | 1,950,180 |
| | | | 2,173,764 |
| Hotels, Restaurants & Leisure - 2.0% | | | |
| Churchill Downs, Inc. | | 1,000 | 232,700 |
| Eldorado Resorts, Inc. (a) | | 2,900 | 96,135 |
| Hilton Worldwide Holdings, Inc. | | 30,263 | 2,416,803 |
| Las Vegas Sands Corp. | | 2,500 | 173,725 |
| Marriott International, Inc. Class A | | 60,100 | 8,157,373 |
| McDonald's Corp. | | 30,200 | 5,198,024 |
| U.S. Foods Holding Corp. (a) | | 9,100 | 290,563 |
| Vail Resorts, Inc. | | 2,400 | 509,928 |
| | | | 17,075,251 |
| Household Durables - 0.5% | | | |
| D.R. Horton, Inc. | | 4,000 | 204,280 |
| Lennar Corp. Class A | | 15,000 | 948,600 |
| Mohawk Industries, Inc. (a) | | 10,100 | 2,786,590 |
| Roku, Inc. Class A | | 1,900 | 98,382 |
| | | | 4,037,852 |
| Internet & Direct Marketing Retail - 10.9% | | | |
| Amazon.com, Inc. (a) | | 53,493 | 62,558,457 |
| ASOS PLC (a) | | 1,300 | 117,861 |
| Blue Apron Holdings, Inc.: | | | |
| Class A | | 6,003 | 24,192 |
| Class B | | 24,012 | 95,801 |
| Netflix, Inc. (a) | | 130,027 | 24,959,983 |
| Priceline Group, Inc. (a) | | 2,500 | 4,344,350 |
| Start Today Co. Ltd. | | 24,157 | 734,304 |
| Takeaway.com Holding BV (a)(c) | | 5,200 | 317,452 |
| Zalando SE (a) | | 6,943 | 367,503 |
| | | | 93,519,903 |
| Leisure Products - 0.1% | | | |
| Mattel, Inc. (b) | | 28,100 | 432,178 |
| Polaris Industries, Inc. | | 2,100 | 260,379 |
| | | | 692,557 |
| Media - 1.0% | | | |
| Charter Communications, Inc. Class A (a) | | 285 | 95,749 |
| Liberty Broadband Corp.: | | | |
| Class A (a) | | 1,716 | 145,946 |
| Class C (a) | | 5,551 | 472,723 |
| Liberty Global PLC Class A (a) | | 8,000 | 286,720 |
| Liberty Media Corp.: | | | |
| Liberty Formula One Group Series C (a)(b) | | 73,656 | 2,516,089 |
| Liberty SiriusXM Series A (a) | | 2,400 | 95,184 |
| Liberty SiriusXM Series C (a) | | 84,204 | 3,339,531 |
| Live Nation Entertainment, Inc. (a) | | 8,000 | 340,560 |
| Sirius XM Holdings, Inc. (b) | | 215,700 | 1,156,152 |
| The Walt Disney Co. | | 3,900 | 419,289 |
| | | | 8,867,943 |
| Multiline Retail - 0.6% | | | |
| B&M European Value Retail S.A. | | 80,801 | 462,120 |
| Dollar Tree, Inc. (a) | | 6,900 | 740,439 |
| Ollie's Bargain Outlet Holdings, Inc. (a) | | 67,300 | 3,583,725 |
| | | | 4,786,284 |
| Specialty Retail - 0.7% | | | |
| Burlington Stores, Inc. (a) | | 800 | 98,424 |
| Five Below, Inc. (a) | | 2,700 | 179,064 |
| Home Depot, Inc. | | 30,400 | 5,761,712 |
| TJX Companies, Inc. | | 813 | 62,162 |
| | | | 6,101,362 |
| Textiles, Apparel & Luxury Goods - 0.4% | | | |
| adidas AG | | 14,203 | 2,848,482 |
| Kering SA | | 1,200 | 565,849 |
| LVMH Moet Hennessy - Louis Vuitton SA | | 1,509 | 442,900 |
| | | | 3,857,231 |
|
| TOTAL CONSUMER DISCRETIONARY | | | 148,217,268 |
|
| CONSUMER STAPLES - 1.8% | | | |
| Beverages - 0.3% | | | |
| Constellation Brands, Inc. Class A (sub. vtg.) | | 5,200 | 1,188,564 |
| Kweichow Moutai Co. Ltd. (A Shares) | | 4,600 | 493,104 |
| Monster Beverage Corp. (a) | | 13,800 | 873,402 |
| The Coca-Cola Co. | | 7,600 | 348,688 |
| | | | 2,903,758 |
| Food & Staples Retailing - 0.5% | | | |
| Costco Wholesale Corp. | | 9,458 | 1,760,323 |
| Performance Food Group Co. (a) | | 20,500 | 678,550 |
| Wal-Mart Stores, Inc. | | 23,200 | 2,291,000 |
| | | | 4,729,873 |
| Food Products - 0.0% | | | |
| The Simply Good Foods Co. | | 11,900 | 169,694 |
| Household Products - 0.1% | | | |
| Colgate-Palmolive Co. | | 8,157 | 615,446 |
| Personal Products - 0.9% | | | |
| Estee Lauder Companies, Inc. Class A | | 54,244 | 6,902,007 |
| L'Oreal SA | | 1,322 | 292,930 |
| Shiseido Co. Ltd. | | 1,800 | 87,001 |
| Unilever NV (Certificaten Van Aandelen) (Bearer) | | 2,900 | 163,279 |
| | | | 7,445,217 |
|
| TOTAL CONSUMER STAPLES | | | 15,863,988 |
|
| ENERGY - 2.4% | | | |
| Oil, Gas & Consumable Fuels - 2.4% | | | |
| Andeavor | | 800 | 91,472 |
| Birchcliff Energy Ltd. | | 153,900 | 538,711 |
| Cabot Oil & Gas Corp. | | 8,000 | 228,800 |
| Canadian Natural Resources Ltd. | | 51,500 | 1,840,398 |
| Cenovus Energy, Inc. | | 26,900 | 245,674 |
| Centennial Resource Development, Inc.: | | | |
| Class A (a) | | 40,200 | 795,960 |
| Class A (a)(b) | | 118,875 | 2,353,725 |
| Class A (d) | | 18,800 | 372,240 |
| Concho Resources, Inc. (a) | | 4,300 | 645,946 |
| Continental Resources, Inc. (a) | | 32,200 | 1,705,634 |
| Diamondback Energy, Inc. (a) | | 10,600 | 1,338,250 |
| Encana Corp. | | 6,900 | 92,055 |
| EOG Resources, Inc. | | 35,515 | 3,832,424 |
| Phillips 66 Co. | | 19,900 | 2,012,885 |
| Pioneer Natural Resources Co. | | 500 | 86,425 |
| PrairieSky Royalty Ltd. | | 19,800 | 505,002 |
| Reliance Industries Ltd. | | 186,293 | 2,687,738 |
| Tamarack Valley Energy Ltd. (a) | | 159,600 | 363,131 |
| Valero Energy Corp. | | 9,011 | 828,201 |
| | | | 20,564,671 |
| FINANCIALS - 16.2% | | | |
| Banks - 8.2% | | | |
| Bank of America Corp. | | 641,350 | 18,932,652 |
| Citigroup, Inc. | | 282,773 | 21,041,139 |
| HDFC Bank Ltd. sponsored ADR | | 58,888 | 5,987,143 |
| JPMorgan Chase & Co. | | 124,800 | 13,346,112 |
| Kotak Mahindra Bank Ltd. | | 44,137 | 698,421 |
| M&T Bank Corp. | | 15,300 | 2,616,147 |
| Metro Bank PLC (a) | | 2,900 | 140,329 |
| PNC Financial Services Group, Inc. | | 23,100 | 3,333,099 |
| Royal Bank of Canada | | 6,400 | 522,641 |
| The Toronto-Dominion Bank | | 15,400 | 902,315 |
| U.S. Bancorp | | 39,900 | 2,137,842 |
| Wells Fargo & Co. | | 21,704 | 1,316,782 |
| | | | 70,974,622 |
| Capital Markets - 2.9% | | | |
| Ashmore Group PLC | | 13,013 | 71,174 |
| Bank of New York Mellon Corp. | | 33,400 | 1,798,924 |
| BlackRock, Inc. Class A | | 7,247 | 3,722,856 |
| Brookfield Asset Management, Inc. Class A | | 4,600 | 200,248 |
| CBOE Holdings, Inc. | | 3,900 | 485,901 |
| Charles Schwab Corp. | | 86,100 | 4,422,957 |
| CME Group, Inc. | | 6,400 | 934,720 |
| Goldman Sachs Group, Inc. | | 3,000 | 764,280 |
| IntercontinentalExchange, Inc. | | 16,900 | 1,192,464 |
| Morgan Stanley | | 115,900 | 6,081,273 |
| MSCI, Inc. | | 15,425 | 1,951,880 |
| Oaktree Capital Group LLC Class A | | 28,108 | 1,183,347 |
| S&P Global, Inc. | | 11,253 | 1,906,258 |
| St. James's Place Capital PLC | | 12,000 | 198,634 |
| | | | 24,914,916 |
| Consumer Finance - 0.2% | | | |
| Synchrony Financial | | 37,600 | 1,451,736 |
| Diversified Financial Services - 3.8% | | | |
| Berkshire Hathaway, Inc. Class A (a) | | 111 | 33,033,601 |
| Insurance - 1.1% | | | |
| Admiral Group PLC | | 30,900 | 835,227 |
| Chubb Ltd. | | 35,965 | 5,255,565 |
| Fairfax Financial Holdings Ltd. (sub. vtg.) | | 1,600 | 851,984 |
| Marsh & McLennan Companies, Inc. | | 27,008 | 2,198,181 |
| | | | 9,140,957 |
|
| TOTAL FINANCIALS | | | 139,515,832 |
|
| HEALTH CARE - 7.8% | | | |
| Biotechnology - 2.2% | | | |
| AbbVie, Inc. | | 18,800 | 1,818,148 |
| Agios Pharmaceuticals, Inc. (a) | | 7,600 | 434,492 |
| Alnylam Pharmaceuticals, Inc. (a) | | 3,100 | 393,855 |
| AnaptysBio, Inc. | | 3,600 | 362,592 |
| Biogen, Inc. (a) | | 2,400 | 764,568 |
| bluebird bio, Inc. (a) | | 1,300 | 231,530 |
| Blueprint Medicines Corp. (a) | | 1,700 | 128,197 |
| Celgene Corp. (a) | | 10,500 | 1,095,780 |
| Exact Sciences Corp. (a) | | 2,400 | 126,096 |
| FibroGen, Inc. (a) | | 14,731 | 698,249 |
| Genmab A/S (a) | | 6,677 | 1,107,327 |
| Gilead Sciences, Inc. | | 37,400 | 2,679,336 |
| Insmed, Inc. (a) | | 8,300 | 258,794 |
| Juno Therapeutics, Inc. (a) | | 4,500 | 205,695 |
| Neurocrine Biosciences, Inc. (a) | | 27,874 | 2,162,744 |
| OvaScience, Inc. (a) | | 149,980 | 209,972 |
| Portola Pharmaceuticals, Inc. (a) | | 5,900 | 287,212 |
| Regeneron Pharmaceuticals, Inc. (a) | | 4,700 | 1,767,012 |
| Sage Therapeutics, Inc. (a) | | 1,500 | 247,065 |
| Vertex Pharmaceuticals, Inc. (a) | | 26,409 | 3,957,653 |
| | | | 18,936,317 |
| Health Care Equipment & Supplies - 1.5% | | | |
| Baxter International, Inc. | | 50,500 | 3,264,320 |
| Becton, Dickinson & Co. | | 5,094 | 1,090,422 |
| Boston Scientific Corp. (a) | | 159,500 | 3,954,005 |
| Danaher Corp. | | 9,820 | 911,492 |
| Edwards Lifesciences Corp. (a) | | 2,100 | 236,691 |
| Intuitive Surgical, Inc. (a) | | 6,600 | 2,408,604 |
| Penumbra, Inc. (a) | | 4,800 | 451,680 |
| ResMed, Inc. | | 5,600 | 474,264 |
| | | | 12,791,478 |
| Health Care Providers & Services - 2.3% | | | |
| Aetna, Inc. | | 6,200 | 1,118,418 |
| Anthem, Inc. | | 700 | 157,507 |
| Cigna Corp. | | 2,491 | 505,897 |
| HealthEquity, Inc. (a) | | 15,425 | 719,731 |
| Henry Schein, Inc. (a) | | 25,786 | 1,801,926 |
| Humana, Inc. | | 6,019 | 1,493,133 |
| National Vision Holdings, Inc. | | 5,900 | 239,599 |
| OptiNose, Inc. | | 3,900 | 73,710 |
| UnitedHealth Group, Inc. | | 63,534 | 14,006,706 |
| | | | 20,116,627 |
| Health Care Technology - 0.1% | | | |
| Medidata Solutions, Inc. (a) | | 312 | 19,771 |
| Veeva Systems, Inc. Class A (a) | | 19,900 | 1,100,072 |
| | | | 1,119,843 |
| Life Sciences Tools & Services - 1.1% | | | |
| Agilent Technologies, Inc. | | 14,100 | 944,277 |
| Eurofins Scientific SA | | 1,300 | 791,757 |
| Mettler-Toledo International, Inc. (a) | | 10,060 | 6,232,371 |
| PRA Health Sciences, Inc. (a) | | 7,000 | 637,490 |
| Thermo Fisher Scientific, Inc. | | 2,400 | 455,712 |
| Waters Corp. (a) | | 1,313 | 253,658 |
| | | | 9,315,265 |
| Pharmaceuticals - 0.6% | | | |
| AstraZeneca PLC sponsored ADR | | 4,900 | 170,030 |
| Bristol-Myers Squibb Co. | | 29,168 | 1,787,415 |
| GW Pharmaceuticals PLC ADR (a) | | 500 | 66,005 |
| Johnson & Johnson | | 5,700 | 796,404 |
| Nektar Therapeutics (a) | | 26,800 | 1,600,496 |
| Teva Pharmaceutical Industries Ltd. sponsored ADR (b) | | 32,700 | 619,665 |
| | | | 5,040,015 |
|
| TOTAL HEALTH CARE | | | 67,319,545 |
|
| INDUSTRIALS - 7.3% | | | |
| Aerospace & Defense - 1.1% | | | |
| General Dynamics Corp. | | 5,600 | 1,139,320 |
| Northrop Grumman Corp. | | 11,100 | 3,406,701 |
| Raytheon Co. | | 4,200 | 788,970 |
| Space Exploration Technologies Corp.: | | | |
| Class A (a)(d)(e) | | 2,191 | 295,785 |
| Class C (d)(e) | | 96 | 12,960 |
| The Boeing Co. | | 11,200 | 3,302,992 |
| | | | 8,946,728 |
| Air Freight & Logistics - 0.5% | | | |
| Expeditors International of Washington, Inc. | | 1,300 | 84,097 |
| FedEx Corp. | | 9,800 | 2,445,492 |
| XPO Logistics, Inc. (a) | | 20,474 | 1,875,214 |
| | | | 4,404,803 |
| Airlines - 0.8% | | | |
| Ryanair Holdings PLC sponsored ADR (a) | | 35,235 | 3,671,135 |
| Southwest Airlines Co. | | 51,000 | 3,337,950 |
| | | | 7,009,085 |
| Building Products - 1.0% | | | |
| A.O. Smith Corp. | | 8,400 | 514,752 |
| Fortune Brands Home & Security, Inc. | | 17,470 | 1,195,647 |
| Jeld-Wen Holding, Inc. | | 32,100 | 1,263,777 |
| Masco Corp. | | 103,863 | 4,563,740 |
| Toto Ltd. | | 23,600 | 1,392,856 |
| | | | 8,930,772 |
| Commercial Services & Supplies - 0.2% | | | |
| Cintas Corp. | | 9,500 | 1,480,385 |
| TulCo LLC (d)(e)(f) | | 910 | 318,500 |
| | | | 1,798,885 |
| Construction & Engineering - 0.1% | | | |
| Jacobs Engineering Group, Inc. | | 6,400 | 422,144 |
| Electrical Equipment - 0.5% | | | |
| AMETEK, Inc. | | 4,900 | 355,103 |
| Fortive Corp. | | 50,160 | 3,629,076 |
| | | | 3,984,179 |
| Industrial Conglomerates - 0.5% | | | |
| 3M Co. | | 17,923 | 4,218,537 |
| ITT, Inc. | | 1,000 | 53,370 |
| Roper Technologies, Inc. | | 600 | 155,400 |
| | | | 4,427,307 |
| Machinery - 1.7% | | | |
| Caterpillar, Inc. | | 11,800 | 1,859,444 |
| Deere & Co. | | 24,600 | 3,850,146 |
| Gardner Denver Holdings, Inc. | | 17,200 | 583,596 |
| IDEX Corp. | | 700 | 92,379 |
| Illinois Tool Works, Inc. | | 22,493 | 3,752,957 |
| Ingersoll-Rand PLC | | 8,800 | 784,872 |
| Oshkosh Corp. | | 1,000 | 90,890 |
| PACCAR, Inc. | | 14,800 | 1,051,984 |
| Parker Hannifin Corp. | | 9,600 | 1,915,968 |
| Rational AG | | 600 | 386,736 |
| Xylem, Inc. | | 4,900 | 334,180 |
| | | | 14,703,152 |
| Professional Services - 0.5% | | | |
| Equifax, Inc. | | 8,922 | 1,052,082 |
| Manpower, Inc. | | 2,200 | 277,442 |
| Recruit Holdings Co. Ltd. | | 20,800 | 516,885 |
| RELX PLC | | 5,100 | 119,743 |
| TransUnion Holding Co., Inc. (a) | | 40,400 | 2,220,384 |
| | | | 4,186,536 |
| Road & Rail - 0.4% | | | |
| CSX Corp. | | 50,300 | 2,767,003 |
| Union Pacific Corp. | | 5,600 | 750,960 |
| | | | 3,517,963 |
| Trading Companies & Distributors - 0.0% | | | |
| Fastenal Co. | | 1,700 | 92,973 |
| United Rentals, Inc. (a) | | 1,300 | 223,483 |
| | | | 316,456 |
|
| TOTAL INDUSTRIALS | | | 62,648,010 |
|
| INFORMATION TECHNOLOGY - 41.3% | | | |
| Communications Equipment - 0.5% | | | |
| Arista Networks, Inc. (a) | | 17,400 | 4,099,092 |
| Electronic Equipment & Components - 1.9% | | | |
| Amphenol Corp. Class A | | 159,914 | 14,040,449 |
| CDW Corp. | | 19,941 | 1,385,700 |
| Corning, Inc. | | 2,700 | 86,373 |
| Dolby Laboratories, Inc. Class A | | 7,000 | 434,000 |
| Keyence Corp. | | 200 | 112,039 |
| | | | 16,058,561 |
| Internet Software & Services - 16.8% | | | |
| Alibaba Group Holding Ltd. sponsored ADR (a) | | 18,800 | 3,241,684 |
| Alphabet, Inc.: | | | |
| Class A (a) | | 34,339 | 36,172,703 |
| Class C (a) | | 29,600 | 30,973,440 |
| CarGurus, Inc. Class A (b) | | 5,200 | 155,896 |
| Cloudera, Inc. | | 13,118 | 216,709 |
| CoStar Group, Inc. (a) | | 300 | 89,085 |
| eBay, Inc. (a) | | 68,700 | 2,592,738 |
| Facebook, Inc. Class A (a) | | 354,506 | 62,556,129 |
| LogMeIn, Inc. | | 16,040 | 1,836,580 |
| New Relic, Inc. (a) | | 5,700 | 329,289 |
| Nutanix, Inc. Class B (c) | | 24,249 | 855,505 |
| Okta, Inc. | | 6,000 | 153,660 |
| Q2 Holdings, Inc. (a) | | 300 | 11,055 |
| Rightmove PLC | | 3,339 | 202,867 |
| Shopify, Inc. Class A (a) | | 4,000 | 404,487 |
| SurveyMonkey (a)(d)(e) | | 62,998 | 805,114 |
| Tencent Holdings Ltd. | | 74,700 | 3,866,319 |
| | | | 144,463,260 |
| IT Services - 4.8% | | | |
| ASAC II LP (a)(d)(e) | | 224,957 | 37,793 |
| EPAM Systems, Inc. (a) | | 5,300 | 569,379 |
| FleetCor Technologies, Inc. (a) | | 300 | 57,729 |
| Global Payments, Inc. | | 17,100 | 1,714,104 |
| Leidos Holdings, Inc. | | 1,300 | 83,941 |
| MasterCard, Inc. Class A | | 69,890 | 10,578,550 |
| PayPal Holdings, Inc. (a) | | 206,162 | 15,177,646 |
| Square, Inc. (a) | | 12,802 | 443,845 |
| Visa, Inc. Class A | | 111,140 | 12,672,183 |
| | | | 41,335,170 |
| Semiconductors & Semiconductor Equipment - 2.8% | | | |
| Analog Devices, Inc. | | 7,700 | 685,531 |
| Applied Materials, Inc. | | 104,900 | 5,362,488 |
| Broadcom Ltd. | | 7,900 | 2,029,510 |
| First Solar, Inc. (a) | | 5,200 | 351,104 |
| Lam Research Corp. | | 10,400 | 1,914,328 |
| NVIDIA Corp. | | 39,012 | 7,548,822 |
| Taiwan Semiconductor Manufacturing Co. Ltd. sponsored ADR | | 58,300 | 2,311,595 |
| Texas Instruments, Inc. | | 41,400 | 4,323,816 |
| | | | 24,527,194 |
| Software - 12.7% | | | |
| Activision Blizzard, Inc. | | 135,651 | 8,589,421 |
| Adobe Systems, Inc. (a) | | 112,580 | 19,728,519 |
| Atlassian Corp. PLC (a) | | 30,035 | 1,367,193 |
| CDK Global, Inc. | | 13,200 | 940,896 |
| Constellation Software, Inc. | | 1,100 | 666,843 |
| Electronic Arts, Inc. (a) | | 81,109 | 8,521,312 |
| Intuit, Inc. | | 14,513 | 2,289,861 |
| Micro Focus International PLC | | 12,900 | 439,429 |
| Microsoft Corp. | | 205,100 | 17,544,254 |
| Nintendo Co. Ltd. | | 1,300 | 468,126 |
| Parametric Technology Corp. (a) | | 6,700 | 407,159 |
| Paycom Software, Inc. (a)(b) | | 14,900 | 1,196,917 |
| Red Hat, Inc. (a) | | 16,700 | 2,005,670 |
| RingCentral, Inc. (a) | | 16,000 | 774,400 |
| Salesforce.com, Inc. (a) | | 341,526 | 34,914,203 |
| Snap, Inc. Class A (a)(b) | | 16,186 | 236,477 |
| Tanium, Inc. Class B (d)(e) | | 23,400 | 120,042 |
| Ultimate Software Group, Inc. (a) | | 14,651 | 3,197,288 |
| Workday, Inc. Class A (a) | | 58,300 | 5,931,442 |
| | | | 109,339,452 |
| Technology Hardware, Storage & Peripherals - 1.8% | | | |
| Apple, Inc. | | 91,741 | 15,525,329 |
| Xaar PLC | | 24,188 | 120,751 |
| | | | 15,646,080 |
|
| TOTAL INFORMATION TECHNOLOGY | | | 355,468,809 |
|
| MATERIALS - 2.6% | | | |
| Chemicals - 1.7% | | | |
| Air Products & Chemicals, Inc. | | 7,900 | 1,296,232 |
| DowDuPont, Inc. | | 92,349 | 6,577,096 |
| LyondellBasell Industries NV Class A | | 5,600 | 617,792 |
| Olin Corp. | | 9,600 | 341,568 |
| Sherwin-Williams Co. | | 11,331 | 4,646,163 |
| Westlake Chemical Corp. | | 9,000 | 958,770 |
| | | | 14,437,621 |
| Construction Materials - 0.0% | | | |
| Eagle Materials, Inc. | | 800 | 90,640 |
| Containers & Packaging - 0.2% | | | |
| WestRock Co. | | 23,700 | 1,498,077 |
| Metals & Mining - 0.7% | | | |
| ArcelorMittal SA Class A unit (a)(b) | | 13,800 | 445,878 |
| Arizona Mining, Inc. (a) | | 18,810 | 51,776 |
| B2Gold Corp. (a) | | 160,600 | 495,726 |
| Franco-Nevada Corp. | | 31,700 | 2,533,478 |
| Freeport-McMoRan, Inc. (a) | | 7,600 | 144,096 |
| Ivanhoe Mines Ltd. (a) | | 424,222 | 1,430,948 |
| Kirkland Lake Gold Ltd. | | 23,600 | 361,792 |
| Newcrest Mining Ltd. | | 23,651 | 421,113 |
| Novagold Resources, Inc. (a) | | 54,238 | 213,155 |
| Nucor Corp. | | 4,300 | 273,394 |
| Randgold Resources Ltd. sponsored ADR | | 2,700 | 267,003 |
| | | | 6,638,359 |
|
| TOTAL MATERIALS | | | 22,664,697 |
|
| REAL ESTATE - 0.2% | | | |
| Equity Real Estate Investment Trusts (REITs) - 0.1% | | | |
| American Tower Corp. | | 5,600 | 798,952 |
| Real Estate Management & Development - 0.1% | | | |
| Five Point Holdings LLC Class A (a) | | 25,900 | 365,190 |
| WeWork Companies, Inc. Class A (a)(d)(e) | | 4,695 | 243,248 |
| | | | 608,438 |
|
| TOTAL REAL ESTATE | | | 1,407,390 |
|
| TELECOMMUNICATION SERVICES - 0.4% | | | |
| Wireless Telecommunication Services - 0.4% | | | |
| SoftBank Corp. | | 6,100 | 482,941 |
| T-Mobile U.S., Inc. (a) | | 50,700 | 3,219,957 |
| | | | 3,702,898 |
| TOTAL COMMON STOCKS | | | |
| (Cost $462,270,418) | | | 837,373,108 |
|
| Convertible Preferred Stocks - 2.3% | | | |
| CONSUMER DISCRETIONARY - 0.1% | | | |
| Diversified Consumer Services - 0.1% | | | |
| Airbnb, Inc.: | | | |
| Series D (a)(d)(e) | | 4,308 | 405,771 |
| Series E (a)(d)(e) | | 2,148 | 202,320 |
| | | | 608,091 |
| Household Durables - 0.0% | | | |
| Blu Homes, Inc. Series A, 5.00% (a)(d)(e) | | 174,063 | 3,481 |
|
| TOTAL CONSUMER DISCRETIONARY | | | 611,572 |
|
| CONSUMER STAPLES - 0.0% | | | |
| Food & Staples Retailing - 0.0% | | | |
| Roofoods Ltd. Series F (d)(e) | | 1,117 | 394,938 |
| FINANCIALS - 0.1% | | | |
| Consumer Finance - 0.1% | | | |
| Oportun Finance Corp. Series H (a)(d)(e) | | 331,477 | 981,172 |
| HEALTH CARE - 0.1% | | | |
| Biotechnology - 0.1% | | | |
| 23andMe, Inc.: | | | |
| Series E (a)(d)(e) | | 5,172 | 71,809 |
| Series F (d)(e) | | 24,200 | 335,998 |
| | | | 407,807 |
| Health Care Providers & Services - 0.0% | | | |
| Mulberry Health, Inc. Series A8 (a)(d)(e) | | 62,105 | 394,988 |
|
| TOTAL HEALTH CARE | | | 802,795 |
|
| INDUSTRIALS - 0.1% | | | |
| Aerospace & Defense - 0.1% | | | |
| Space Exploration Technologies Corp.: | | | |
| Series G (a)(d)(e) | | 4,394 | 593,190 |
| Series H (d)(e) | | 890 | 120,150 |
| | | | 713,340 |
| INFORMATION TECHNOLOGY - 1.6% | | | |
| Internet Software & Services - 0.7% | | | |
| Dropbox, Inc. Series C (a)(d)(e) | | 53,923 | 831,493 |
| Lyft, Inc. Series H (d)(e) | | 10,869 | 432,000 |
| Pinterest, Inc.: | | | |
| Series E, 8.00% (a)(d)(e) | | 318,795 | 1,906,394 |
| Series F, 8.00% (a)(d)(e) | | 331,500 | 1,982,370 |
| Series G, 8.00% (a)(d)(e) | | 51,970 | 310,781 |
| Uber Technologies, Inc. Series D, 8.00% (a)(d)(e) | | 15,399 | 537,733 |
| | | | 6,000,771 |
| Software - 0.9% | | | |
| Cloudflare, Inc. Series D 8.00% (a)(d)(e) | | 34,105 | 187,236 |
| Delphix Corp. Series D (a)(d)(e) | | 27,980 | 157,248 |
| Magic Leap, Inc.: | | | |
| Series B, 8.00% (a)(d)(e) | | 231,802 | 6,258,654 |
| Series C (a)(d)(e) | | 2,268 | 61,236 |
| Series D (d)(e) | | 57,537 | 1,553,499 |
| | | | 8,217,873 |
|
| TOTAL INFORMATION TECHNOLOGY | | | 14,218,644 |
|
| REAL ESTATE - 0.3% | | | |
| Real Estate Management & Development - 0.3% | | | |
| WeWork Companies, Inc.: | | | |
| Series E (a)(d)(e) | | 42,252 | 2,189,076 |
| Series F (a)(d)(e) | | 2,051 | 106,262 |
| | | | 2,295,338 |
| TELECOMMUNICATION SERVICES - 0.0% | | | |
| Wireless Telecommunication Services - 0.0% | | | |
| Altiostar Networks, Inc. Series A1 (d)(e) | | 17,021 | 26,553 |
| TOTAL CONVERTIBLE PREFERRED STOCKS | | | |
| (Cost $14,237,427) | | | 20,044,352 |
| | | Principal Amount | Value |
|
| Nonconvertible Bonds - 0.1% | | | |
| HEALTH CARE - 0.1% | | | |
| Pharmaceuticals - 0.1% | | | |
| Valeant Pharmaceuticals International, Inc.: | | | |
| 6.125% 4/15/25 (c) | | 510,000 | 466,650 |
| 9% 12/15/25 (c) | | 572,000 | 596,138 |
| (Cost $1,021,975) | | | 1,062,788 |
| | | Shares | Value |
|
| Money Market Funds - 1.7% | | | |
| Fidelity Cash Central Fund, 1.36% (g) | | 7,125,140 | 7,126,565 |
| Fidelity Securities Lending Cash Central Fund 1.36% (g)(h) | | 6,928,848 | 6,930,233 |
| TOTAL MONEY MARKET FUNDS | | | |
| (Cost $14,055,893) | | | 14,056,798 |
| TOTAL INVESTMENT IN SECURITIES - 101.3% | | | |
| (Cost $491,585,713) | | | 872,537,046 |
| NET OTHER ASSETS (LIABILITIES) - (1.3)% | | | (11,152,818) |
| NET ASSETS - 100% | | | $861,384,228 |
Legend
(a) Non-income producing
(b) Security or a portion of the security is on loan at period end.
(c) Security exempt from registration under Rule 144A of the Securities Act of 1933. These securities may be resold in transactions exempt from registration, normally to qualified institutional buyers. At the end of the period, the value of these securities amounted to $2,235,745 or 0.3% of net assets.
(d) Restricted securities - Investment in securities not registered under the Securities Act of 1933 (excluding 144A issues). At the end of the period, the value of restricted securities (excluding 144A issues) amounted to $22,250,034 or 2.6% of net assets.
(e) Level 3 security
(f) Investment is owned by a wholly-owned subsidiary (Subsidiary) that is treated as a corporation for U.S. tax purposes.
(g) Affiliated fund that is generally available only to investment companies and other accounts managed by Fidelity Investments. The rate quoted is the annualized seven-day yield of the fund at period end. A complete unaudited listing of the fund's holdings as of its most recent quarter end is available upon request. In addition, each Fidelity Central Fund's financial statements, which are not covered by the Fund's Report of Independent Registered Public Accounting Firm, are available on the SEC's website or upon request.
(h) Investment made with cash collateral received from securities on loan.
Additional information on each restricted holding is as follows:
| Security | Acquisition Date | Acquisition Cost |
| 23andMe, Inc. Series E | 6/18/15 | $55,999 |
| 23andMe, Inc. Series F | 8/31/17 | $335,998 |
| Airbnb, Inc. Series D | 4/16/14 | $175,392 |
| Airbnb, Inc. Series E | 6/29/15 | $199,967 |
| Altiostar Networks, Inc. Series A1 | 1/10/17 | $78,297 |
| ASAC II LP | 10/10/13 | $17,324 |
| Blu Homes, Inc. Series A, 5.00% | 6/10/13 - 12/30/14 | $804,171 |
| Centennial Resource Development, Inc. Class A | 12/28/16 | $273,352 |
| Cloudflare, Inc. Series D 8.00% | 11/5/14 - 6/24/15 | $212,499 |
| Delphix Corp. Series D | 7/10/15 | $251,820 |
| Dropbox, Inc. Series C | 1/30/14 | $1,029,994 |
| Lyft, Inc. Series H | 11/22/17 | $432,000 |
| Magic Leap, Inc. Series B, 8.00% | 10/17/14 | $2,679,631 |
| Magic Leap, Inc. Series C | 12/23/15 | $52,239 |
| Magic Leap, Inc. Series D | 10/6/17 | $1,553,499 |
| Mulberry Health, Inc. Series A8 | 1/20/16 | $419,504 |
| Oportun Finance Corp. Series H | 2/6/15 | $943,814 |
| Pinterest, Inc. Series E, 8.00% | 10/23/13 | $926,463 |
| Pinterest, Inc. Series F, 8.00% | 5/15/14 | $1,126,117 |
| Pinterest, Inc. Series G, 8.00% | 2/27/15 | $373,097 |
| Roofoods Ltd. Series F | 9/12/17 | $394,938 |
| Space Exploration Technologies Corp. Class A | 10/16/15 - 9/11/17 | $227,383 |
| Space Exploration Technologies Corp. Class C | 9/11/17 | $12,960 |
| Space Exploration Technologies Corp. Series G | 1/20/15 | $340,359 |
| Space Exploration Technologies Corp. Series H | 8/4/17 | $120,150 |
| SurveyMonkey | 12/15/14 | $1,036,317 |
| Tanium, Inc. Class B | 4/21/17 | $116,165 |
| TulCo LLC | 8/24/17 - 12/14/17 | $318,500 |
| Uber Technologies, Inc. Series D, 8.00% | 6/6/14 | $238,886 |
| WeWork Companies, Inc. Class A | 6/23/15 | $154,417 |
| WeWork Companies, Inc. Series E | 6/23/15 | $1,389,650 |
| WeWork Companies, Inc. Series F | 12/1/16 | $102,944 |
Affiliated Central Funds
Information regarding fiscal year to date income earned by the Fund from investments in Fidelity Central Funds is as follows:
| Fund | Income earned |
| Fidelity Cash Central Fund | $53,933 |
| Fidelity Securities Lending Cash Central Fund | 187,814 |
| Total | $241,747 |
Amounts in the income column in the above table include any capital gain distributions from underlying funds, which are presented in the corresponding line-item in the Statement of Operations if applicable.
Investment Valuation
The following is a summary of the inputs used, as of December 31, 2017, involving the Fund's assets and liabilities carried at fair value. The inputs or methodology used for valuing securities may not be an indication of the risk associated with investing in those securities. For more information on valuation inputs, and their aggregation into the levels used below, please refer to the Investment Valuation section in the accompanying Notes to Financial Statements.
| | Valuation Inputs at Reporting Date: |
| Description | Total | Level 1 | Level 2 | Level 3 |
| Investments in Securities: | | | | |
| Equities: | | | | |
| Consumer Discretionary | $148,828,840 | $146,730,896 | $1,486,372 | $611,572 |
| Consumer Staples | 16,258,926 | 15,407,779 | 456,209 | 394,938 |
| Energy | 20,564,671 | 20,564,671 | -- | -- |
| Financials | 140,497,004 | 139,515,832 | -- | 981,172 |
| Health Care | 68,122,340 | 67,319,545 | -- | 802,795 |
| Industrials | 63,361,350 | 62,020,765 | -- | 1,340,585 |
| Information Technology | 369,687,453 | 350,171,415 | 4,334,445 | 15,181,593 |
| Materials | 22,664,697 | 22,664,697 | -- | -- |
| Real Estate | 3,702,728 | 1,164,142 | -- | 2,538,586 |
| Telecommunication Services | 3,729,451 | 3,219,957 | 482,941 | 26,553 |
| Corporate Bonds | 1,062,788 | -- | 1,062,788 | -- |
| Money Market Funds | 14,056,798 | 14,056,798 | -- | -- |
| Total Investments in Securities: | $872,537,046 | $842,836,497 | $7,822,755 | $21,877,794 |
The following is a reconciliation of Investments in Securities for which Level 3 inputs were used in determining value:
| Investments in Securities: | |
| Equities - Information Technology | |
| Beginning Balance | $16,182,421 |
| Net Realized Gain (Loss) on Investment Securities | 372,101 |
| Net Unrealized Gain (Loss) on Investment Securities | (2,175,351) |
| Cost of Purchases | 2,101,664 |
| Proceeds of Sales | (1,071,254) |
| Amortization/Accretion | -- |
| Transfers into Level 3 | -- |
| Transfers out of Level 3 | (227,988) |
| Ending Balance | $15,181,593 |
| The change in unrealized gain (loss) for the period attributable to Level 3 securities held at December 31, 2017 | $(2,065,271) |
| Other Investments in Securities | |
| Beginning Balance | $6,547,685 |
| Net Realized Gain (Loss) on Investment Securities | (194,663) |
| Net Unrealized Gain (Loss) on Investment Securities | (455,143) |
| Cost of Purchases | 1,355,883 |
| Proceeds of Sales | (557,561) |
| Amortization/Accretion | -- |
| Transfers into Level 3 | -- |
| Transfers out of Level 3 | -- |
| Ending Balance | $6,696,201 |
| The change in unrealized gain (loss) for the period attributable to Level 3 securities held at December 31, 2017 | $(597,266) |
The information used in the above reconciliations represents fiscal year to date activity for any Investments in Securities identified as using Level 3 inputs at either the beginning or the end of the current fiscal period. Transfers in or out of Level 3 represent the beginning value of any Security or Instrument where a change in the pricing level occurred from the beginning to the end of the period. The cost of purchases and the proceeds of sales may include securities received or delivered through corporate actions or exchanges. Realized and unrealized gains (losses) disclosed in the reconciliations are included in Net Gain (Loss) on the Fund's Statement of Operations.
See accompanying notes which are an integral part of the financial statements.
Financial Statements
Statement of Assets and Liabilities
| | | December 31, 2017 |
| Assets | | |
Investment in securities, at value (including securities loaned of $6,710,357) — See accompanying schedule:
Unaffiliated issuers (cost $477,529,820) | $858,480,248 | |
| Fidelity Central Funds (cost $14,055,893) | 14,056,798 | |
| Total Investment in Securities (cost $491,585,713) | | $872,537,046 |
| Receivable for investments sold | | 1,904,488 |
| Receivable for fund shares sold | | 3,616 |
| Dividends receivable | | 219,636 |
| Interest receivable | | 8,645 |
| Distributions receivable from Fidelity Central Funds | | 9,352 |
| Other receivables | | 3,086 |
| Total assets | | 874,685,869 |
| Liabilities | | |
| Payable for investments purchased | $1,737,163 | |
| Payable for fund shares redeemed | 4,473,328 | |
| Other payables and accrued expenses | 158,862 | |
| Collateral on securities loaned | 6,932,288 | |
| Total liabilities | | 13,301,641 |
| Net Assets | | $861,384,228 |
| Net Assets consist of: | | |
| Paid in capital | | $461,600,996 |
| Undistributed net investment income | | 398 |
| Accumulated undistributed net realized gain (loss) on investments and foreign currency transactions | | 18,939,558 |
| Net unrealized appreciation (depreciation) on investments and assets and liabilities in foreign currencies | | 380,843,276 |
| Net Assets, for 49,354,200 shares outstanding | | $861,384,228 |
| Net Asset Value, offering price and redemption price per share ($861,384,228 ÷ 49,354,200 shares) | | $17.45 |
See accompanying notes which are an integral part of the financial statements.
Statement of Operations
| | | Year ended December 31, 2017 |
| Investment Income | | |
| Dividends | | $5,517,994 |
| Interest | | 11,031 |
| Income from Fidelity Central Funds | | 241,747 |
| Total income | | 5,770,772 |
| Expenses | | |
| Management fee | | |
| Basic fee | $1,982,848 | |
| Performance adjustment | 82,708 | |
| Transfer agent fees | 614,397 | |
| Accounting and security lending fees | 125,277 | |
| Custodian fees and expenses | 91,989 | |
| Independent trustees' fees and expenses | 3,437 | |
| Audit | 40,395 | |
| Legal | 1,183 | |
| Interest | 3,831 | |
| Miscellaneous | 5,457 | |
| Total expenses before reductions | 2,951,522 | |
| Expense reductions | (21,493) | 2,930,029 |
| Net investment income (loss) | | 2,840,743 |
| Realized and Unrealized Gain (Loss) | | |
| Net realized gain (loss) on: | | |
| Investment securities: | | |
| Unaffiliated issuers | 120,706,048 | |
| Fidelity Central Funds | (2,148) | |
| Foreign currency transactions | (5,343) | |
| Total net realized gain (loss) | | 120,698,557 |
| Change in net unrealized appreciation (depreciation) on: | | |
| Unaffiliated issuers (net of increase in deferred foreign taxes of $108,877) | 132,224,259 | |
| Fidelity Central Funds | 197 | |
| Assets and liabilities in foreign currencies | 1,359 | |
| Total change in net unrealized appreciation (depreciation) | | 132,225,815 |
| Net gain (loss) | | 252,924,372 |
| Net increase (decrease) in net assets resulting from operations | | $255,765,115 |
See accompanying notes which are an integral part of the financial statements.
Statement of Changes in Net Assets
| | Year ended December 31, 2017 | Year ended December 31, 2016 |
| Increase (Decrease) in Net Assets | | |
| Operations | | |
| Net investment income (loss) | $2,840,743 | $(844,855) |
| Net realized gain (loss) | 120,698,557 | 14,601,202 |
| Change in net unrealized appreciation (depreciation) | 132,225,815 | (2,221,727) |
| Net increase (decrease) in net assets resulting from operations | 255,765,115 | 11,534,620 |
| Distributions to shareholders from net investment income | (3,049,964) | – |
| Distributions to shareholders from net realized gain | (102,885,981) | (22,648,925) |
| Total distributions | (105,935,945) | (22,648,925) |
| Share transactions | | |
| Proceeds from sales of shares | 60,803,160 | 119,713,092 |
| Reinvestment of distributions | 105,935,945 | 22,648,925 |
| Cost of shares redeemed | (282,134,253) | (171,368,367) |
| Net increase (decrease) in net assets resulting from share transactions | (115,395,148) | (29,006,350) |
| Total increase (decrease) in net assets | 34,434,022 | (40,120,655) |
| Net Assets | | |
| Beginning of period | 826,950,206 | 867,070,861 |
| End of period | $861,384,228 | $826,950,206 |
| Other Information | | |
| Undistributed net investment income end of period | $398 | $– |
| Shares | | |
| Sold | 3,505,355 | 8,179,394 |
| Issued in reinvestment of distributions | 6,061,152 | 1,627,479 |
| Redeemed | (16,147,105) | (11,696,628) |
| Net increase (decrease) | (6,580,598) | (1,889,755) |
See accompanying notes which are an integral part of the financial statements.
Financial Highlights
Fidelity Advisor Series Opportunistic Insights Fund
| Years ended December 31, | 2017 | 2016 | 2015 | 2014 | 2013 |
| Selected Per–Share Data | | | | | |
| Net asset value, beginning of period | $14.78 | $14.99 | $15.02 | $13.99 | $10.05 |
| Income from Investment Operations | | | | | |
| Net investment income (loss)A | .06 | (.01) | (.01) | (.01) | (.01) |
| Net realized and unrealized gain (loss) | 5.03 | .20 | 1.14 | 1.46 | 4.14 |
| Total from investment operations | 5.09 | .19 | 1.13 | 1.45 | 4.13 |
| Distributions from net investment income | (.07) | – | – | – | – |
| Distributions from net realized gain | (2.35) | (.40) | (1.16) | (.42) | (.19) |
| Total distributions | (2.42) | (.40) | (1.16) | (.42) | (.19) |
| Net asset value, end of period | $17.45 | $14.78 | $14.99 | $15.02 | $13.99 |
| Total ReturnB | 34.44% | 1.45% | 7.62% | 10.34% | 41.23% |
| Ratios to Average Net AssetsC,D | | | | | |
| Expenses before reductions | .34% | .88% | .94% | .88% | .82% |
| Expenses net of fee waivers, if any | .34% | .88% | .94% | .88% | .82% |
| Expenses net of all reductions | .34% | .88% | .93% | .87% | .80% |
| Net investment income (loss) | .33% | (.10)% | (.04)% | (.07)% | (.07)% |
| Supplemental Data | | | | | |
| Net assets, end of period (000 omitted) | $861,384 | $826,950 | $867,071 | $870,334 | $808,847 |
| Portfolio turnover rateE | 33% | 41% | 47% | 47% | 52% |
A Calculated based on average shares outstanding during the period.
B Total returns would have been lower if certain expenses had not been reduced during the applicable periods shown.
C Fees and expenses of any underlying Fidelity Central Funds are not included in the Fund's expense ratio. The Fund indirectly bears its proportionate share of the expenses of any underlying Fidelity Central Funds.
D Expense ratios reflect operating expenses of the Fund. Expenses before reductions do not reflect amounts reimbursed by the investment adviser or reductions from brokerage service arrangements or reductions from other expense offset arrangements and do not represent the amount paid by the Fund during periods when reimbursements or reductions occur. Expenses net of fee waivers reflect expenses after reimbursement by the investment adviser but prior to reductions from brokerage service arrangements or other expense offset arrangements. Expenses net of all reductions represent the net expenses paid by the Fund.
E Amount does not include the portfolio activity of any underlying Fidelity Central Funds.
See accompanying notes which are an integral part of the financial statements.
Notes to Financial Statements
For the period ended December 31, 2017
1. Organization.
Fidelity Advisor Series Opportunistic Insights Fund (the Fund) is a fund of Fidelity Contrafund (the Trust) and is authorized to issue an unlimited number of shares. Shares of the Fund are only available for purchase by mutual funds for which Fidelity Management & Research Company (FMR) or an affiliate serves as an investment manager. The Trust is registered under the Investment Company Act of 1940, as amended (the 1940 Act), as an open-end management investment company organized as a Massachusetts business trust.
2. Investments in Fidelity Central Funds.
The Fund invests in Fidelity Central Funds, which are open-end investment companies generally available only to other investment companies and accounts managed by the investment adviser and its affiliates. The Fund's Schedule of Investments lists each of the Fidelity Central Funds held as of period end, if any, as an investment of the Fund, but does not include the underlying holdings of each Fidelity Central Fund. As an Investing Fund, the Fund indirectly bears its proportionate share of the expenses of the underlying Fidelity Central Funds.
The Money Market Central Funds seek preservation of capital and current income and are managed by Fidelity Investments Money Management, Inc. (FIMM), an affiliate of the investment adviser. Annualized expenses of the Money Market Central Funds as of their most recent shareholder report date are less than .005%.
A complete unaudited list of holdings for each Fidelity Central Fund is available upon request or at the Securities and Exchange Commission (the SEC) website at www.sec.gov. In addition, the financial statements of the Fidelity Central Funds, which are not covered by the Fund's Report of Independent Registered Public Accounting Firm, are available on the SEC website or upon request.
3. Significant Accounting Policies.
The Fund is an investment company and applies the accounting and reporting guidance of the Financial Accounting Standards Board (FASB) Accounting Standards Codification Topic 946 Financial Services – Investments Companies. The financial statements have been prepared in conformity with accounting principles generally accepted in the United States of America (GAAP), which require management to make certain estimates and assumptions at the date of the financial statements. Actual results could differ from those estimates. Subsequent events, if any, through the date that the financial statements were issued have been evaluated in the preparation of the financial statements. The following summarizes the significant accounting policies of the Fund:
Investment Valuation. Investments are valued as of 4:00 p.m. Eastern time on the last calendar day of the period. The Board of Trustees (the Board) has delegated the day to day responsibility for the valuation of the Fund's investments to the Fair Value Committee (the Committee) established by the Fund's investment adviser. In accordance with valuation policies and procedures approved by the Board, the Fund attempts to obtain prices from one or more third party pricing vendors or brokers to value its investments. When current market prices, quotations or currency exchange rates are not readily available or reliable, investments will be fair valued in good faith by the Committee, in accordance with procedures adopted by the Board. Factors used in determining fair value vary by investment type and may include market or investment specific events, changes in interest rates and credit quality. The frequency with which these procedures are used cannot be predicted and they may be utilized to a significant extent. The Committee oversees the Fund's valuation policies and procedures and reports to the Board on the Committee's activities and fair value determinations. The Board monitors the appropriateness of the procedures used in valuing the Fund's investments and ratifies the fair value determinations of the Committee.
The Fund categorizes the inputs to valuation techniques used to value its investments into a disclosure hierarchy consisting of three levels as shown below:
- Level 1 – quoted prices in active markets for identical investments
- Level 2 – other significant observable inputs (including quoted prices for similar investments, interest rates, prepayment speeds, etc.)
- Level 3 – unobservable inputs (including the Fund's own assumptions based on the best information available)
Valuation techniques used to value the Fund's investments by major category are as follows:
Equity securities, including restricted securities, for which market quotations are readily available, are valued at the last reported sale price or official closing price as reported by a third party pricing vendor on the primary market or exchange on which they are traded and are categorized as Level 1 in the hierarchy. In the event there were no sales during the day or closing prices are not available, securities are valued at the last quoted bid price or may be valued using the last available price and are generally categorized as Level 2 in the hierarchy. For foreign equity securities, when market or security specific events arise, comparisons to the valuation of American Depositary Receipts (ADRs), futures contracts, Exchange-Traded Funds (ETFs) and certain indexes as well as quoted prices for similar securities may be used and would be categorized as Level 2 in the hierarchy. Utilizing these techniques may result in transfers between Level 1 and Level 2. For equity securities, including restricted securities, where observable inputs are limited, assumptions about market activity and risk are used and these securities may be categorized as Level 3 in the hierarchy. Equity securities, including restricted securities, for which observable inputs are not available are valued using alternate valuation approaches, including the market approach and the income approach and are categorized as Level 3 in the hierarchy. The market approach generally consists of using comparable market transactions while the income approach generally consists of using the net present value of estimated future cash flows, adjusted as appropriate for liquidity, credit, market and/or other risk factors.
Debt securities, including restricted securities, are valued based on evaluated prices received from third party pricing vendors or from brokers who make markets in such securities. Corporate bonds are valued by pricing vendors who utilize matrix pricing which considers yield or price of bonds of comparable quality, coupon, maturity and type or by broker-supplied prices. When independent prices are unavailable or unreliable, debt securities may be valued utilizing pricing methodologies which consider similar factors that would be used by third party pricing vendors. Debt securities are generally categorized as Level 2 in the hierarchy but may be Level 3 depending on the circumstances.
Investments in open-end mutual funds, including the Fidelity Central Funds, are valued at their closing net asset value (NAV) each business day and are categorized as Level 1 in the hierarchy
The following provides information on Level 3 securities held by the Fund that were valued at period end based on unobservable inputs. These amounts exclude valuations provided by a broker.
| Asset Type | Fair Value | Valuation
Technique(s) | Unobservable Input | Amount or Range/Weighted Average | Impact to Valuation from an Increase in Input(a) |
| Equities | $21,877,794 | Market comparable | Enterprise value/Sales multiple (EV/S) | 0.8 - 13.1 / 6.5 | Increase |
| | | | Discount rate | 0.9% - 25.0% / 14.1% | Decrease |
| | | | Price/Earnings multiple (P/E) | 15.2 | Increase |
| | | | Discount for lack of marketability | 15.0% - 25.0% / 16.7% | Decrease |
| | | | Enterprise value/EBITDA multiple (EV/EBITDA) | 22.9 | Increase |
| | | | Liquidity preference | $4.84 - $19.10 / $14.21 | Increase |
| | | | Premium rate | 7.5% - 108.0% / 68.4% | Increase |
| | | Market approach | Transaction price | $1.56 - $353.57 / $55.26 | Increase |
| | | Recovery value | Recovery value | 0.0% - 0.2% / 0.2% | Increase |
| | | Discount cash flow | Discount rate | 9.0% | Decrease |
| | | | Discount for lack of marketability | 20.0% | Decrease |
| | | | Growth rate | 3.0% | Increase |
(a) Represents the expected directional change in the fair value of the Level 3 investments that would result from an increase in the corresponding input. A decrease to the unobservable input would have the opposite effect. Significant changes in these inputs could result in significantly higher or lower fair value measurements.
Changes in valuation techniques may result in transfers in or out of an assigned level within the disclosure hierarchy. The aggregate value of investments by input level as of December 31, 2017, as well as a roll forward of Level 3 investments, is included at the end of the Fund's Schedule of Investments.
Foreign Currency. The Fund may use foreign currency contracts to facilitate transactions in foreign-denominated securities. Gains and losses from these transactions may arise from changes in the value of the foreign currency or if the counterparties do not perform under the contracts' terms.
Foreign-denominated assets, including investment securities, and liabilities are translated into U.S. dollars at the exchange rates at period end. Purchases and sales of investment securities, income and dividends received and expenses denominated in foreign currencies are translated into U.S. dollars at the exchange rate in effect on the transaction date.
The effects of exchange rate fluctuations on investments are included with the net realized and unrealized gain (loss) on investment securities. Other foreign currency transactions resulting in realized and unrealized gain (loss) are disclosed separately.
Investment Transactions and Income. For financial reporting purposes, the Fund's investment holdings and NAV include trades executed through the end of the last business day of the period. The NAV per share for processing shareholder transactions is calculated as of the close of business of the New York Stock Exchange (NYSE), normally 4:00 p.m. Eastern time and includes trades executed through the end of the prior business day. Gains and losses on securities sold are determined on the basis of identified cost and includes proceeds received from litigation. Dividend income is recorded on the ex-dividend date, except for certain dividends from foreign securities where the ex-dividend date may have passed, which are recorded as soon as the Fund is informed of the ex-dividend date. Non-cash dividends included in dividend income, if any, are recorded at the fair market value of the securities received. Income and capital gain distributions from Fidelity Central Funds, if any, are recorded on the ex-dividend date. Certain distributions received by the Fund represent a return of capital or capital gain. The Fund determines the components of these distributions subsequent to the ex-dividend date, based upon receipt of tax filings or other correspondence relating to the underlying investment. These distributions are recorded as a reduction of cost of investments and/or as a realized gain. Interest income is accrued as earned and includes coupon interest and amortization of premium and accretion of discount on debt securities as applicable. Investment income is recorded net of foreign taxes withheld where recovery of such taxes is uncertain.
Expenses. Expenses directly attributable to a fund are charged to that fund. Expenses attributable to more than one fund are allocated among the respective funds on the basis of relative net assets or other appropriate methods. Expense estimates are accrued in the period to which they relate and adjustments are made when actual amounts are known.
Income Tax Information and Distributions to Shareholders. Each year, the Fund intends to qualify as a regulated investment company under Subchapter M of the Internal Revenue Code, including distributing substantially all of its taxable income and realized gains. As a result, no provision for U.S. Federal income taxes is required. As of December 31, 2017, the Fund did not have any unrecognized tax benefits in the financial statements; nor is the Fund aware of any tax positions for which it is reasonably possible that the total amounts of unrecognized tax benefits will significantly change in the next twelve months. The Fund files a U.S. federal tax return, in addition to state and local tax returns as required. The Fund's federal income tax returns are subject to examination by the Internal Revenue Service (IRS) for a period of three fiscal years after they are filed. State and local tax returns may be subject to examination for an additional fiscal year depending on the jurisdiction. Foreign taxes are provided for based on the Fund's understanding of the tax rules and rates that exist in the foreign markets in which it invests. The Fund is subject to a tax imposed on capital gains by certain countries in which it invests. An estimated deferred tax liability for net unrealized appreciation on the applicable securities is included in Other payables and accrued expenses on the Statement of Assets & Liabilities.
Distributions are declared and recorded on the ex-dividend date. Income and capital gain distributions are determined in accordance with income tax regulations, which may differ from GAAP.
Capital accounts within the financial statements are adjusted for permanent book-tax differences. These adjustments have no impact on net assets or the results of operations. Capital accounts are not adjusted for temporary book-tax differences which will reverse in a subsequent period.
Book-tax differences are primarily due to passive foreign investment companies (PFIC), market discount, foreign currency transactions, partnerships, losses deferred due to wash sales and excise tax regulations.
As of period end, the cost and unrealized appreciation (depreciation) in securities, and derivatives if applicable, for federal income tax purposes were as follows:
| Gross unrealized appreciation | $385,295,818 |
| Gross unrealized depreciation | (6,123,674) |
| Net unrealized appreciation (depreciation) | $379,172,144 |
| Tax Cost | $493,364,902 |
The tax-based components of distributable earnings as of period end were as follows:
| Undistributed long-term capital gain | $21,118,386 |
| Net unrealized appreciation (depreciation) on securities and other investments | $379,172,964 |
The Fund intends to elect to defer to its next fiscal year $399,240 of capital losses recognized during the period November 1, 2017 to December 31, 2017.
The tax character of distributions paid was as follows:
| | December 31, 2017 | December 31, 2016 |
| Ordinary Income | $5,446,364 | $– |
| Long-term Capital Gains | 100,489,581 | 22,648,925 |
| Total | $105,935,945 | $ 22,648,925 |
Restricted Securities. The Fund may invest in securities that are subject to legal or contractual restrictions on resale. These securities generally may be resold in transactions exempt from registration or to the public if the securities are registered. Disposal of these securities may involve time-consuming negotiations and expense, and prompt sale at an acceptable price may be difficult. Information regarding restricted securities is included at the end of the Fund's Schedule of Investments.
Consolidated Subsidiary. The Fund invests in certain investments through a wholly-owned subsidiary ("Subsidiary"), which may be subject to federal and state taxes upon disposition.
As of period end, the Fund held an investment of $318,500 in this Subsidiary, representing .04% of the Fund's net assets. The financial statements have been consolidated and include accounts of the Fund and the Subsidiary. Accordingly, all inter-company transactions and balances have been eliminated.
4. Purchases and Sales of Investments.
Purchases and sales of securities, other than short-term securities, aggregated $282,782,978 and $495,655,678, respectively.
5. Fees and Other Transactions with Affiliates.
Management Fee. Effective June 1, 2017, under the management contract approved by the Board and shareholders, Fidelity Management & Research Company (the investment adviser) and its affiliates provide the Fund with investment management related services for which the Fund does not pay a management fee. In addition, the investment adviser pays all ordinary operating expenses of the Fund, except custody fees, fees and expenses of the independent Trustees, and certain miscellaneous expenses such as proxy and shareholder meeting expenses.
Prior to June 1, 2017, the investment adviser and its affiliates provided the Fund with investment management related services for which the Fund paid a monthly management fee. The management fee was the sum of an individual fund fee rate that was based on an annual rate of .30% of the Fund's average net assets and an annualized group fee rate that averaged .25% during the period. The group fee rate was based upon the average net assets of all the mutual funds advised by the investment adviser, including any mutual funds previously advised by the investment adviser that are currently advised by Fidelity SelectCo, LLC, an affiliate of the investment adviser. The group fee rate decreased as assets under management increased and increased as assets under management decreased. In addition, the management fee was subject to a performance adjustment (up to a maximum of +/- .20% of the Fund's average net assets over a 36 month performance period). The upward or downward adjustment to the management fee was based on the Fund's relative investment performance as compared to its benchmark index, the Russell 3000 Index, over the same 36 month performance period. The performance adjustment included in the management fee rate may be higher or lower than the maximum performance adjustment rate due to the difference between the average net assets for the reporting and performance periods.
Transfer Agent Fees. Fidelity Investments Institutional Operations Company, Inc. (FIIOC), an affiliate of the investment adviser, is the Fund's transfer, dividend disbursing and shareholder servicing agent. Effective June 1, 2017, fees for these services are no longer charged to the classes. Prior to June 1, 2017, FIIOC received account fees and asset-based fees that varied according to account size and type of account. FIIOC pays for typesetting, printing and mailing of shareholder reports, except proxy statements. For the period, the transfer agent fees were equivalent to a rate of .07% of average net assets.
Accounting and Security Lending Fees. Fidelity Service Company, Inc. (FSC), an affiliate of the investment adviser, maintains the Fund's accounting records. The accounting fee is based on the level of average net assets for each month. Under a separate contract, FSC administers the security lending program. The security lending fee is based on the number and duration of lending transactions. Effective June 1, 2017, these fees are paid by the investment adviser or an affiliate.
Brokerage Commissions. The Fund placed a portion of its portfolio transactions with brokerage firms which are affiliates of the investment adviser. Brokerage commissions are included in net realized gain (loss) and change in net unrealized appreciation (depreciation) in the Statement of Operations. The commissions paid to these affiliated firms were $8,614 for the period.
Interfund Lending Program. Pursuant to an Exemptive Order issued by the SEC, the Fund, along with other registered investment companies having management contracts with FMR or other affiliated entities of FMR, may participate in an interfund lending program. This program provides an alternative credit facility allowing the funds to borrow from, or lend money to, other participating affiliated funds. At period end, there were no interfund loans outstanding. The Fund's activity in this program during the period for which loans were outstanding was as follows:
| Borrower or Lender | Average Loan Balance | Weighted Average Interest Rate | Interest Expense |
| Borrower | $11,155,300 | 1.24% | $3,831 |
Interfund Trades. The Fund may purchase from or sell securities to other Fidelity Funds under procedures adopted by the Board. The procedures have been designed to ensure these interfund trades are executed in accordance with Rule 17a-7 of the 1940 Act. Interfund trades are included within the respective purchases and sales amounts shown in the Purchases and Sales of Investments note.
6. Committed Line of Credit.
The Fund participates with other funds managed by the investment adviser or an affiliate in a $4.25 billion credit facility (the "line of credit") to be utilized for temporary or emergency purposes to fund shareholder redemptions or for other short-term liquidity purposes. The Fund has agreed to pay commitment fees on its pro-rata portion of the line of credit, which amounted to $2,763 and is reflected in Miscellaneous expenses on the Statement of Operations.
7. Security Lending.
The Fund lends portfolio securities through a lending agent from time to time in order to earn additional income. For equity securities, a lending agent is used and may loan securities to certain qualified borrowers, including Fidelity Capital Markets (FCM), a broker-dealer affiliated with the Fund. On the settlement date of the loan, the Fund receives collateral (in the form of U.S. Treasury obligations, letters of credit and/or cash) against the loaned securities and maintains collateral in an amount not less than 100% of the market value of the loaned securities during the period of the loan. The market value of the loaned securities is determined at the close of business of the Fund and any additional required collateral is delivered to the Fund on the next business day. The Fund or borrower may terminate the loan at any time, and if the borrower defaults on its obligation to return the securities loaned because of insolvency or other reasons, the Fund may apply collateral received from the borrower against the obligation. The Fund may experience delays and costs in recovering the securities loaned. Any cash collateral received is invested in the Fidelity Securities Lending Cash Central Fund. The value of loaned securities and cash collateral at period end are disclosed on the Fund's Statement of Assets and Liabilities. The value of securities loaned to FCM at period end was $5,360. Security lending income represents the income earned on investing cash collateral, less rebates paid to borrowers and any lending agent fees associated with the loan plus any premium payments received for lending certain types of securities. Security lending income is presented in the Statement of Operations as a component of income from Fidelity Central Funds. Total security lending income during the period amounted to $187,814, including $7,434 from securities loaned to FCM.
8. Expense Reductions.
Commissions paid to certain brokers with whom the investment adviser, or its affiliates, places trades on behalf of the Fund include an amount in addition to trade execution, which may be rebated back to the Fund to offset certain expenses. This amount totaled $13,926 for the period
In addition, during the period the investment adviser reimbursed and/or waived a portion of operating expenses in the amount of $7,567.
9. Other.
The Fund's organizational documents provide former and current trustees and officers with a limited indemnification against liabilities arising in connection with the performance of their duties to the Fund. In the normal course of business, the Fund may also enter into contracts that provide general indemnifications. The Fund's maximum exposure under these arrangements is unknown as this would be dependent on future claims that may be made against the Fund. The risk of material loss from such claims is considered remote.
At the end of the period, mutual funds managed by the investment adviser or its affiliates were the owners of record of all of the outstanding shares of the Fund.
Report of Independent Registered Public Accounting Firm
To the Trustees of Fidelity Contrafund and Shareholders of Fidelity Advisor Series Opportunistic Insights Fund:
Opinion on the Financial Statements
We have audited the accompanying statement of assets and liabilities, including the schedule of investments, of Fidelity Advisor Series Opportunistic Insights Fund(one of the funds constituting Fidelity Contrafund, referred to hereafter as the “Fund”) as of December 31, 2017, the related statement of operations for the year ended December 31, 2017, the statement of changes in net assets for each of the two years in the period ended December 31, 2017, including the related notes, and the financial highlights for each of the five years in the period ended December 31, 2017 (collectively referred to as the “financial statements”). In our opinion, the financial statements present fairly, in all material respects, the financial position of the Fund as of December 31, 2017, the results of its operations for the year then ended, the changes in its net assets for each of the two years in the period ended December 31, 2017 and the financial highlights for each of the five years in the period ended December 31, 2017 in conformity with accounting principles generally accepted in the United States of America.
Basis for Opinion
These financial statements are the responsibility of the Fund’s management. Our responsibility is to express an opinion on the Fund’s financial statements based on our audits. We are a public accounting firm registered with the Public Company Accounting Oversight Board (United States) (“PCAOB”) and are required to be independent with respect to the Fund in accordance with the U.S. federal securities laws and the applicable rules and regulations of the Securities and Exchange Commission and the PCAOB.
We conducted our audits of these financial statements in accordance with the standards of the PCAOB. Those standards require that we plan and perform the audit to obtain reasonable assurance about whether the financial statements are free of material misstatement, whether due to error or fraud.
Our audits included performing procedures to assess the risks of material misstatement of the financial statements, whether due to error or fraud, and performing procedures that respond to those risks. Such procedures included examining, on a test basis, evidence regarding the amounts and disclosures in the financial statements. Our audits also included evaluating the accounting principles used and significant estimates made by management, as well as evaluating the overall presentation of the financial statements. Our procedures included confirmation of securities owned as of December 31, 2017 by correspondence with the custodian and brokers; when replies were not received from brokers, we performed other auditing procedures. We believe that our audits provide a reasonable basis for our opinion.
PricewaterhouseCoopers LLP
Boston, Massachusetts
February 13, 2018
We have served as the auditor of one or more investment companies in the Fidelity group of funds since 1932.
Trustees and Officers
The Trustees, Members of the Advisory Board (if any), and officers of the trust and fund, as applicable, are listed below. The Board of Trustees governs the fund and is responsible for protecting the interests of shareholders. The Trustees are experienced executives who meet periodically throughout the year to oversee the fund's activities, review contractual arrangements with companies that provide services to the fund, oversee management of the risks associated with such activities and contractual arrangements, and review the fund's performance. Each of the Trustees oversees 190 funds.
The Trustees hold office without limit in time except that (a) any Trustee may resign; (b) any Trustee may be removed by written instrument, signed by at least two-thirds of the number of Trustees prior to such removal; (c) any Trustee who requests to be retired or who has become incapacitated by illness or injury may be retired by written instrument signed by a majority of the other Trustees; and (d) any Trustee may be removed at any special meeting of shareholders by a two-thirds vote of the outstanding voting securities of the trust. Each Trustee who is not an interested person (as defined in the 1940 Act) of the trust and the fund is referred to herein as an Independent Trustee. Each Independent Trustee shall retire not later than the last day of the calendar year in which his or her 75th birthday occurs. The Independent Trustees may waive this mandatory retirement age policy with respect to individual Trustees. Officers and Advisory Board Members hold office without limit in time, except that any officer or Advisory Board Member may resign or may be removed by a vote of a majority of the Trustees at any regular meeting or any special meeting of the Trustees. Except as indicated, each individual has held the office shown or other offices in the same company for the past five years.
The fund’s Statement of Additional Information (SAI) includes more information about the Trustees. To request a free copy, call Fidelity at 1-877-208-0098.
Experience, Skills, Attributes, and Qualifications of the Trustees. The Governance and Nominating Committee has adopted a statement of policy that describes the experience, qualifications, attributes, and skills that are necessary and desirable for potential Independent Trustee candidates (Statement of Policy). The Board believes that each Trustee satisfied at the time he or she was initially elected or appointed a Trustee, and continues to satisfy, the standards contemplated by the Statement of Policy. The Governance and Nominating Committee also engages professional search firms to help identify potential Independent Trustee candidates who have the experience, qualifications, attributes, and skills consistent with the Statement of Policy. From time to time, additional criteria based on the composition and skills of the current Independent Trustees, as well as experience or skills that may be appropriate in light of future changes to board composition, business conditions, and regulatory or other developments, have also been considered by the professional search firms and the Governance and Nominating Committee. In addition, the Board takes into account the Trustees' commitment and participation in Board and committee meetings, as well as their leadership of standing and ad hoc committees throughout their tenure.
In determining that a particular Trustee was and continues to be qualified to serve as a Trustee, the Board has considered a variety of criteria, none of which, in isolation, was controlling. The Board believes that, collectively, the Trustees have balanced and diverse experience, qualifications, attributes, and skills, which allow the Board to operate effectively in governing the fund and protecting the interests of shareholders. Information about the specific experience, skills, attributes, and qualifications of each Trustee, which in each case led to the Board's conclusion that the Trustee should serve (or continue to serve) as a trustee of the fund, is provided below.
Board Structure and Oversight Function. James C. Curvey is an interested person and currently serves as Chairman. The Trustees have determined that an interested Chairman is appropriate and benefits shareholders because an interested Chairman has a personal and professional stake in the quality and continuity of services provided to the fund. Independent Trustees exercise their informed business judgment to appoint an individual of their choosing to serve as Chairman, regardless of whether the Trustee happens to be independent or a member of management. The Independent Trustees have determined that they can act independently and effectively without having an Independent Trustee serve as Chairman and that a key structural component for assuring that they are in a position to do so is for the Independent Trustees to constitute a substantial majority for the Board. The Independent Trustees also regularly meet in executive session. Ned C. Lautenbach serves as Chairman of the Independent Trustees and as such (i) acts as a liaison between the Independent Trustees and management with respect to matters important to the Independent Trustees and (ii) with management prepares agendas for Board meetings.
Fidelity® funds are overseen by different Boards of Trustees. The fund's Board oversees Fidelity's high income and certain equity funds, and other Boards oversee Fidelity's investment-grade bond, money market, asset allocation, and sector funds. The asset allocation funds may invest in Fidelity® funds overseen by the fund's Board. The use of separate Boards, each with its own committee structure, allows the Trustees of each group of Fidelity® funds to focus on the unique issues of the funds they oversee, including common research, investment, and operational issues. On occasion, the separate Boards establish joint committees to address issues of overlapping consequences for the Fidelity® funds overseen by each Board.
The Trustees operate using a system of committees to facilitate the timely and efficient consideration of all matters of importance to the Trustees, the fund, and fund shareholders and to facilitate compliance with legal and regulatory requirements and oversight of the fund's activities and associated risks. The Board, acting through its committees, has charged FMR and its affiliates with (i) identifying events or circumstances the occurrence of which could have demonstrably adverse effects on the fund's business and/or reputation; (ii) implementing processes and controls to lessen the possibility that such events or circumstances occur or to mitigate the effects of such events or circumstances if they do occur; and (iii) creating and maintaining a system designed to evaluate continuously business and market conditions in order to facilitate the identification and implementation processes described in (i) and (ii) above. Because the day-to-day operations and activities of the fund are carried out by or through FMR, its affiliates, and other service providers, the fund's exposure to risks is mitigated but not eliminated by the processes overseen by the Trustees. While each of the Board's committees has responsibility for overseeing different aspects of the fund's activities, oversight is exercised primarily through the Operations, Audit, and Compliance Committees. In addition, the Independent Trustees have worked with FMR to enhance the Board's oversight of investment and financial risks, legal and regulatory risks, technology risks, and operational risks, including the development of additional risk reporting to the Board. For example, a working group comprised of Independent Trustees and FMR has worked and continues to work to review the Fidelity® funds' valuation-related activities, reporting and risk management. Appropriate personnel, including but not limited to the fund's Chief Compliance Officer (CCO), FMR's internal auditor, the independent accountants, the fund's Treasurer and portfolio management personnel, make periodic reports to the Board's committees, as appropriate, including an annual review of Fidelity's risk management program for the Fidelity® funds. The responsibilities of each standing committee, including their oversight responsibilities, are described further under "Standing Committees of the Trustees."
Interested Trustees*:
Correspondence intended for a Trustee who is an interested person may be sent to Fidelity Investments, 245 Summer Street, Boston, Massachusetts 02210.
Name, Year of Birth; Principal Occupations and Other Relevant Experience+
James C. Curvey (1935)
Year of Election or Appointment: 2007
Trustee
Chairman of the Board of Trustees
Mr. Curvey also serves as Trustee of other Fidelity® funds. Mr. Curvey is a Director of Fidelity Research & Analysis Co. (investment adviser firm, 2009-present), and Vice Chairman (2007-present) and Director of FMR LLC (diversified financial services company). In addition, Mr. Curvey serves as an Overseer for the Boston Symphony Orchestra and a member of the board of Artis-Naples, Naples, Florida, and as a Trustee for Brewster Academy, Wolfeboro, New Hampshire. Previously, Mr. Curvey served as a Director of Fidelity Investments Money Management, Inc. (investment adviser firm, 2009-2014) and a Director of FMR and FMR Co., Inc. (investment adviser firms, 2007-2014).
Charles S. Morrison (1960)
Year of Election or Appointment: 2014
Trustee
Mr. Morrison also serves as Trustee of other funds. He serves as President of Fidelity SelectCo, LLC (investment adviser firm, 2017-present) and Fidelity Management & Research Company (FMR) (investment adviser firm, 2016-present), a Director of Fidelity Investments Money Management, Inc. (FIMM) (investment adviser firm, 2014-present), Director of Fidelity SelectCo, LLC (investment adviser firm, 2014-present), President, Asset Management (2014-present), and is an employee of Fidelity Investments. Previously, Mr. Morrison served as Vice President of Fidelity's Fixed Income and Asset Allocation Funds (2012-2014), President, Fixed Income (2011-2014), Vice President of Fidelity's Money Market Funds (2005-2009), President, Money Market Group Leader of FMR (investment adviser firm, 2009), and Senior Vice President, Money Market Group of FMR (2004-2009). Mr. Morrison also served as Vice President of Fidelity's Bond Funds (2002-2005), certain Balanced Funds (2002-2005), and certain Asset Allocation Funds (2002-2007), and as Senior Vice President (2002-2005) of Fidelity's Bond Division.
* Determined to be an “Interested Trustee” by virtue of, among other things, his or her affiliation with the trust or various entities under common control with FMR.
+ The information includes the Trustee's principal occupation during the last five years and other information relating to the experience, attributes, and skills relevant to the Trustee's qualifications to serve as a Trustee, which led to the conclusion that the Trustee should serve as a Trustee for the fund.
Independent Trustees:
Correspondence intended for an Independent Trustee may be sent to Fidelity Investments, P.O. Box 55235, Boston, Massachusetts 02205-5235.
Name, Year of Birth; Principal Occupations and Other Relevant Experience+
Dennis J. Dirks (1948)
Year of Election or Appointment: 2005
Trustee
Mr. Dirks also serves as Trustee of other Fidelity® funds. Prior to his retirement in May 2003, Mr. Dirks was Chief Operating Officer and a member of the Board of The Depository Trust & Clearing Corporation (DTCC). He also served as President, Chief Operating Officer, and Board member of The Depository Trust Company (DTC) and President and Board member of the National Securities Clearing Corporation (NSCC). In addition, Mr. Dirks served as Chief Executive Officer and Board member of the Government Securities Clearing Corporation, Chief Executive Officer and Board member of the Mortgage-Backed Securities Clearing Corporation, as a Trustee and a member of the Finance Committee of Manhattan College (2005-2008), as a Trustee and a member of the Finance Committee of AHRC of Nassau County (2006-2008), as a member of the Independent Directors Council (IDC) Governing Council (2010-2015), and as a member of the Board of Directors for The Brookville Center for Children’s Services, Inc. (2009-2017). Mr. Dirks is a member of the Finance Committee (2016-present) and Board of Directors (2017-present) of the Asolo Repertory Theatre.
Alan J. Lacy (1953)
Year of Election or Appointment: 2008
Trustee
Mr. Lacy also serves as Trustee of other Fidelity® funds. Mr. Lacy serves as a Director of Bristol-Myers Squibb Company (global pharmaceuticals, 2008-present). He is a Trustee of the California Chapter of The Nature Conservancy (2015-present) and a Director of the Center for Advanced Study in the Behavioral Sciences at Stanford University (2015-present). In addition, Mr. Lacy served as Senior Adviser (2007-2014) of Oak Hill Capital Partners, L.P. (private equity) and also served as Chief Executive Officer (2005) and Vice Chairman (2005-2006) of Sears Holdings Corporation (retail) and Chief Executive Officer and Chairman of the Board of Sears, Roebuck and Co. (retail, 2000-2005). Previously, Mr. Lacy served as Chairman (2014-2017) and a member (2010-2017) of the Board of Directors of Dave & Buster’s Entertainment, Inc. (restaurant and entertainment complexes), as Chairman (2008-2011) and a member (2006-2015) of the Board of Trustees of the National Parks Conservation Association, and as a member of the Board of Directors for The Hillman Companies, Inc. (hardware wholesalers, 2010-2014), Earth Fare, Inc. (retail grocery, 2010-2014), and The Western Union Company (global money transfer, 2006-2011).
Ned C. Lautenbach (1944)
Year of Election or Appointment: 2000
Trustee
Chairman of the Independent Trustees
Mr. Lautenbach also serves as Trustee of other Fidelity® funds. Mr. Lautenbach currently serves as Vice Chair of the Board of Governors, State University System of Florida (2013-present) and is a member of the Council on Foreign Relations (1994-present). He is also a member and has most recently served as Chairman of the Board of Directors of Artis-Naples (2012-present). Previously, Mr. Lautenbach served as a member and then Lead Director of the Board of Directors of Eaton Corporation (diversified industrial, 1997-2016). He was also a Partner and Advisory Partner at Clayton, Dubilier & Rice, LLC (private equity investment, 1998-2010), as well as a Director of Sony Corporation (2006-2007). In addition, Mr. Lautenbach also had a 30-year career with IBM (technology company) during which time he served as Senior Vice President and a member of the Corporate Executive Committee (1968-1998).
Joseph Mauriello (1944)
Year of Election or Appointment: 2008
Trustee
Mr. Mauriello also serves as Trustee of other Fidelity® funds. Prior to his retirement in January 2006, Mr. Mauriello served in numerous senior management positions including Deputy Chairman and Chief Operating Officer (2004-2005), and Vice Chairman of Financial Services (2002-2004) of KPMG LLP US (professional services, 1965-2005). Mr. Mauriello currently serves as a member of the Board of Directors of XL Group plc. (global insurance and re-insurance, 2006-present) and the Independent Directors Council (IDC) Governing Council (2015-present). Previously, Mr. Mauriello served as a Director of the Hamilton Funds of the Bank of New York (2006-2007) and of Arcadia Resources Inc. (health care services and products, 2007-2012).
Cornelia M. Small (1944)
Year of Election or Appointment: 2005
Trustee
Ms. Small also serves as Trustee of other Fidelity® funds. Ms. Small is a member of the Board of Directors (2009-present) and Chair of the Investment Committee (2010-present) of the Teagle Foundation. Ms. Small also serves on the Investment Committee of the Berkshire Taconic Community Foundation (2008-present). Previously, Ms. Small served as Chairperson (2002-2008) and a member of the Investment Committee and Chairperson (2008-2012) and a member of the Board of Trustees of Smith College. In addition, Ms. Small served as Chief Investment Officer, Director of Global Equity Investments, and a member of the Board of Directors of Scudder, Stevens & Clark and Scudder Kemper Investments.
William S. Stavropoulos (1939)
Year of Election or Appointment: 2001
Trustee
Vice Chairman of the Independent Trustees
Mr. Stavropoulos also serves as Trustee of other Fidelity® funds. Mr. Stavropoulos serves as President and Founder of the Michigan Baseball Foundation, the Great Lakes Loons (2007-present). Mr. Stavropoulos is Chairman Emeritus of the Board of Directors of The Dow Chemical Company, where he previously served in numerous senior management positions, including President, CEO (1995-2000; 2002-2004), Chairman of the Executive Committee (2000-2006), and as a member of the Board of Directors (1990-2006). Currently, Mr. Stavropoulos is Chairman of the Board of Directors of Univar Inc. (global distributor of commodity and specialty chemicals), a Director of Teradata Corporation (data warehousing and technology solutions), and a member of the Advisory Board for Metalmark Capital LLC (private equity investment, 2005-present). Mr. Stavropoulos is an operating advisor to Clayton, Dubilier & Rice, LLC (private equity investment). In addition, Mr. Stavropoulos is a member of the University of Notre Dame Advisory Council for the College of Science, a Trustee of the Rollin L. Gerstacker Foundation, and a Director of Artis-Naples in Naples, Florida. Previously, Mr. Stavropoulos served as a Director of Chemical Financial Corporation (bank holding company, 1993-2012) and Tyco International, Ltd. (multinational manufacturing and services, 2007-2012).
David M. Thomas (1949)
Year of Election or Appointment: 2008
Trustee
Mr. Thomas also serves as Trustee of other Fidelity® funds. Mr. Thomas serves as Non-Executive Chairman of the Board of Directors of Fortune Brands Home and Security (home and security products, 2011-present), as a member of the Board of Directors (2004-present) and Presiding Director (2013-present) of Interpublic Group of Companies, Inc. (marketing communication), and as a member of the Board of Trustees of the University of Florida (2013-present). Previously, Mr. Thomas served as Executive Chairman (2005-2006) and Chairman and Chief Executive Officer (2000-2005) of IMS Health, Inc. (pharmaceutical and healthcare information solutions), and a Director of Fortune Brands, Inc. (consumer products, 2000-2011).
+ The information includes the Trustee's principal occupation during the last five years and other information relating to the experience, attributes, and skills relevant to the Trustee's qualifications to serve as a Trustee, which led to the conclusion that the Trustee should serve as a Trustee for the fund.
Advisory Board Members and Officers:
Correspondence intended for an officer or Peter S. Lynch may be sent to Fidelity Investments, 245 Summer Street, Boston, Massachusetts 02210. Officers appear below in alphabetical order.
Name, Year of Birth; Principal Occupation
Peter S. Lynch (1944)
Year of Election or Appointment: 2003
Member of the Advisory Board
Mr. Lynch also serves as Member of the Advisory Board of other Fidelity® funds. Mr. Lynch is Vice Chairman and a Director of FMR (investment adviser firm) and FMR Co., Inc. (investment adviser firm). In addition, Mr. Lynch serves as a Trustee of Boston College and as the Chairman of the Inner-City Scholarship Fund. Previously, Mr. Lynch served on the Special Olympics International Board of Directors (1997-2006).
Elizabeth Paige Baumann (1968)
Year of Election or Appointment: 2017
Anti-Money Laundering (AML) Officer
Ms. Baumann also serves as AML Officer of other funds. She is Chief AML Officer (2012-present) and Senior Vice President (2014-present) of FMR LLC (diversified financial services company) and is an employee of Fidelity Investments. Previously, Ms. Baumann served as AML Officer of the funds (2012-2016), and Vice President (2007-2014) and Deputy Anti-Money Laundering Officer (2007-2012) of FMR LLC.
Marc R. Bryant (1966)
Year of Election or Appointment: 2015
Secretary and Chief Legal Officer (CLO)
Mr. Bryant also serves as Secretary and CLO of other funds. Mr. Bryant serves as CLO, Secretary, and Senior Vice President of Fidelity Management & Research Company (investment adviser firm, 2015-present) and FMR Co., Inc. (investment adviser firm, 2015-present); Secretary of Fidelity SelectCo, LLC (investment adviser firm, 2015-present) and Fidelity Investments Money Management, Inc. (investment adviser firm, 2015-present); and CLO of Fidelity Management & Research (Hong Kong) Limited and FMR Investment Management (UK) Limited (investment adviser firms, 2015-present) and Fidelity Management & Research (Japan) Limited (investment adviser firm, 2016-present). He is Senior Vice President and Deputy General Counsel of FMR LLC (diversified financial services company). Previously, Mr. Bryant served as Secretary and CLO of Fidelity Rutland Square Trust II (2010-2014) and Assistant Secretary of Fidelity's Fixed Income and Asset Allocation Funds (2013-2015). Prior to joining Fidelity Investments, Mr. Bryant served as a Senior Vice President and the Head of Global Retail Legal for AllianceBernstein L.P. (2006-2010), and as the General Counsel for ProFund Advisors LLC (2001-2006).
William C. Coffey (1969)
Year of Election or Appointment: 2009
Assistant Secretary
Mr. Coffey also serves as Assistant Secretary of other funds. He is Senior Vice President and Deputy General Counsel of FMR LLC (diversified financial services company, 2010-present), and is an employee of Fidelity Investments. Previously, Mr. Coffey served as Vice President and Associate General Counsel of FMR LLC (2005-2009).
Jonathan Davis (1968)
Year of Election or Appointment: 2010
Assistant Treasurer
Mr. Davis also serves as Assistant Treasurer of other funds. Mr. Davis serves as Assistant Treasurer of FMR Capital, Inc. (2017-present) and is an employee of Fidelity Investments. Previously, Mr. Davis served as Vice President and Associate General Counsel of FMR LLC (diversified financial services company, 2003-2010).
Adrien E. Deberghes (1967)
Year of Election or Appointment: 2016
Assistant Treasurer
Mr. Deberghes also serves as an officer of other funds. He serves as Assistant Treasurer of FMR Capital, Inc. (2017-present), Executive Vice President of Fidelity Investments Money Management, Inc. (FIMM) (investment adviser firm, 2016-present), and is an employee of Fidelity Investments (2008-present). Prior to joining Fidelity Investments, Mr. Deberghes was Senior Vice President of Mutual Fund Administration at State Street Corporation (2007-2008), Senior Director of Mutual Fund Administration at Investors Bank & Trust (2005-2007), and Director of Finance for Dunkin' Brands (2000-2005). Previously, Mr. Deberghes served in other fund officer roles.
Stephanie J. Dorsey (1969)
Year of Election or Appointment: 2010
Assistant Treasurer
Ms. Dorsey also serves as an officer of other funds. Ms. Dorsey serves as Assistant Treasurer of FMR Capital, Inc. (2017-present), is an employee of Fidelity Investments (2008-present), and has served in other fund officer roles. Prior to joining Fidelity Investments, Ms. Dorsey served as Treasurer (2004-2008) of the JPMorgan Mutual Funds and Vice President (2004-2008) of JPMorgan Chase Bank.
Howard J. Galligan III (1966)
Year of Election or Appointment: 2014
Chief Financial Officer
Mr. Galligan also serves as Chief Financial Officer of other funds. Mr. Galligan serves as President of Fidelity Pricing and Cash Management Services (FPCMS) (2014-present) and as a Director of Strategic Advisers, Inc. (investment adviser firm, 2008-present). Previously, Mr. Galligan served as Chief Administrative Officer of Asset Management (2011-2014) and Chief Operating Officer and Senior Vice President of Investment Support for Strategic Advisers, Inc. (2003-2011).
Brian B. Hogan (1964)
Year of Election or Appointment: 2009
Vice President
Mr. Hogan also serves as Trustee or Vice President of other funds. Mr. Hogan serves as a Director of FMR Investment Management (UK) Limited (investment adviser firm, 2015-present) and Fidelity SelectCo, LLC (investment adviser firm, 2014-present) and President of the Equity Division of FMR (investment adviser firm, 2009-present). Previously, Mr. Hogan served as Senior Vice President, Equity Research of FMR (2006-2009) and as a portfolio manager. Mr. Brian B. Hogan is not related to Mr. Colm A. Hogan.
Colm A. Hogan (1973)
Year of Election or Appointment: 2016
Deputy Treasurer
Mr. Hogan also serves as an officer of other funds. Mr. Hogan serves as Assistant Treasurer of FMR Capital, Inc. (2017-present) and is an employee of Fidelity Investments (2005-present). Mr. Colm A. Hogan is not related to Mr. Brian B. Hogan.
Chris Maher (1972)
Year of Election or Appointment: 2013
Assistant Treasurer
Mr. Maher serves as Assistant Treasurer of other funds. Mr. Maher is Vice President of Valuation Oversight, serves as Assistant Treasurer of FMR Capital, Inc. (2017-present), and is an employee of Fidelity Investments. Previously, Mr. Maher served as Vice President of Asset Management Compliance (2013), Vice President of the Program Management Group of FMR (investment adviser firm, 2010-2013), and Vice President of Valuation Oversight (2008-2010).
Rieco E. Mello (1969)
Year of Election or Appointment: 2017
Assistant Treasurer
Mr. Mello also serves as Assistant Treasurer of other funds. Mr. Mello serves as Assistant Treasurer of FMR Capital, Inc. (2017-present) and is an employee of Fidelity Investments (1995-present).
Melissa M. Reilly (1971)
Year of Election or Appointment: 2014
Vice President of certain Equity Funds
Ms. Reilly also serves as Vice President of other funds. Ms. Reilly is an employee of Fidelity Investments (2004-present).
Kenneth B. Robins (1969)
Year of Election or Appointment: 2016
Chief Compliance Officer
Mr. Robins also serves as an officer of other funds. Mr. Robins serves as Compliance Officer of Fidelity Management & Research Company and FMR Co., Inc. (investment adviser firms, 2016-present) and is an employee of Fidelity Investments (2004-present). Previously, Mr. Robins served as Executive Vice President of Fidelity Investments Money Management, Inc. (investment adviser firm, 2013-2016) and served in other fund officer roles.
Stacie M. Smith (1974)
Year of Election or Appointment: 2016
President and Treasurer
Ms. Smith also serves as an officer of other funds. Ms. Smith serves as Assistant Treasurer of FMR Capital, Inc. (2017-present), is an employee of Fidelity Investments (2009-present), and has served in other fund officer roles. Prior to joining Fidelity Investments, Ms. Smith served as Senior Audit Manager of Ernst & Young LLP (accounting firm, 1996-2009). Previously, Ms. Smith served as Deputy Treasurer of certain Fidelity® funds (2013-2016).
Marc L. Spector (1972)
Year of Election or Appointment: 2016
Assistant Treasurer
Mr. Spector also serves as an officer of other funds. Mr. Spector serves as Assistant Treasurer of FMR Capital, Inc. (2017-present) and is an employee of Fidelity Investments (2016-present). Prior to joining Fidelity Investments, Mr. Spector served as Director at the Siegfried Group (accounting firm, 2013-2016), and prior to Siegfried Group as audit senior manager at Deloitte & Touche (accounting firm, 2005-2013).
Renee Stagnone (1975)
Year of Election or Appointment: 2016
Assistant Treasurer
Ms. Stagnone also serves as an officer of other funds. Ms. Stagnone serves as Assistant Treasurer of FMR Capital, Inc. (2017-present) and is an employee of Fidelity Investments (1997-present). Previously, Ms. Stagnone served as Deputy Treasurer of certain Fidelity® funds (2013-2016).
Shareholder Expense Example
As a shareholder of the Fund, you incur two types of costs: (1) transaction costs and (2) ongoing costs, including other Fund expenses. This Example is intended to help you understand your ongoing costs (in dollars) of investing in the Fund and to compare these costs with the ongoing costs of investing in other mutual funds.
The Example is based on an investment of $1,000 invested at the beginning of the period and held for the entire period (July 1, 2017 to December 31, 2017).
Actual Expenses
The first line of the accompanying table provides information about actual account values and actual expenses. You may use the information in this line, together with the amount you invested, to estimate the expenses that you paid over the period. Simply divide your account value by $1,000.00 (for example, an $8,600 account value divided by $1,000.00 = 8.6), then multiply the result by the number in the first line under the heading entitled "Expenses Paid During Period" to estimate the expenses you paid on your account during this period. In addition, the Fund, as a shareholder in the underlying Fidelity Central Funds, will indirectly bear its pro-rata share of the fees and expenses incurred by the underlying Fidelity Central Funds. These fees and expenses are not included in the Fund's annualized expense ratio used to calculate the expense estimate in the table below.
Hypothetical Example for Comparison Purposes
The second line of the accompanying table provides information about hypothetical account values and hypothetical expenses based on the Fund's actual expense ratio and an assumed rate of return of 5% per year before expenses, which is not the Fund's actual return. The hypothetical account values and expenses may not be used to estimate the actual ending account balance or expenses you paid for the period. You may use this information to compare the ongoing costs of investing in the Fund and other funds. To do so, compare this 5% hypothetical example with the 5% hypothetical examples that appear in the shareholder reports of the other funds. In addition, the Fund, as a shareholder in the underlying Fidelity Central Funds, will indirectly bear its pro-rata share of the fees and expenses incurred by the underlying Fidelity Central Funds. These fees and expenses are not included in the Fund's annualized expense ratio used to calculate the expense estimate in the table below.
Please note that the expenses shown in the table are meant to highlight your ongoing costs only and do not reflect any transaction costs. Therefore, the second line of the table is useful in comparing ongoing costs only, and will not help you determine the relative total costs of owning different funds.
| | Annualized Expense Ratio-A | Beginning
Account Value
July 1, 2017 | Ending
Account Value
December 31, 2017 | Expenses Paid
During Period-B
July 1, 2017
to December 31, 2017 |
| Actual | .01% | $1,000.00 | $1,136.70 | $.05 |
| Hypothetical-C | | $1,000.00 | $1,025.16 | $.05 |
A Annualized expense ratio reflects expenses net of applicable fee waivers.
B Expenses are equal to the Fund's annualized expense ratio, multiplied by the average account value over the period, multiplied by 184/365 (to reflect the one-half year period).
C 5% return per year before expenses
Distributions (Unaudited)
The Board of Trustees of Fidelity Advisor Series Opportunistic Insights Fund voted to pay on February 12, 2018, to shareholders of record at the opening of business on February 9, 2018, a distribution of $0.446 per share derived from capital gains realized from sales of portfolio securities.
The fund hereby designates as a capital gain dividend with respect to the taxable year ended December 31, 2017, $118,853,020, or, if subsequently determined to be different, the net capital gain of such year.
The fund will notify shareholders in January 2018 of amounts for use in preparing 2017 income tax returns.
Board Approval of Investment Advisory Contracts and Management Fees
Fidelity Advisor Series Opportunistic Insights Fund
Each year, the Board of Trustees, including the Independent Trustees (together, the Board), votes on the renewal of the management contract with Fidelity Management & Research Company (FMR) and the sub-advisory agreements (together, the Advisory Contracts) for the fund. FMR and the sub-advisers are referred to herein as the Investment Advisers. The Board, assisted by the advice of fund counsel and Independent Trustees' counsel, requests and considers a broad range of information relevant to the renewal of the Advisory Contracts throughout the year.
The Board meets regularly and, at each of its meetings, covers an extensive agenda of topics and materials and considers factors that are relevant to its annual consideration of the renewal of the fund's Advisory Contracts, including the services and support provided to the fund and its shareholders. The Board has established various standing committees (Committees), each composed of and chaired by Independent Trustees with varying backgrounds, to which the Board has assigned specific subject matter responsibilities in order to enhance effective decision-making by the Board. The Board, acting directly and through its Committees, requests and receives information concerning the annual consideration of the renewal of the fund's Advisory Contracts. The Board also meets as needed to review matters specifically related to the Board's annual consideration of the renewal of the Advisory Contracts. Members of the Board may also meet with trustees of other Fidelity funds through ad hoc joint committees to discuss certain matters relevant to all of the Fidelity funds.
At its July 2017 meeting, the Board unanimously determined to renew the fund's Advisory Contracts. In reaching its determination, the Board considered that the Advisory Contracts currently in place had become effective on June 1, 2017 in connection with shareholders of certain other Fidelity funds that invest in the fund (referred to herein as Freedom Funds) voting to approve new management contracts for the Freedom Funds. The Board noted the Advisory Contracts implemented a new fee structure pursuant to which the fund does not pay a management fee to FMR. The Board also approved certain amendments to the sub-advisory agreements for the fund to ensure consistency in the sub-advisory fees paid under the new fee structure compared to the sub-advisory fees paid under the prior fee structure. The Board noted that the amendments will not result in any changes to the nature, extent, and quality of services provided to the fund.
In considering whether to renew the Advisory Contracts for the fund, the Board considered all factors it believed relevant and reached a determination, with the assistance of fund counsel and Independent Trustees' counsel and through the exercise of its business judgment, that the renewal of the Advisory Contracts was in the best interests of the fund and its shareholders and the fact that no fee is payable under the management contract was fair and reasonable.
Nature, Extent, and Quality of Services Provided. The Board considered Fidelity's staffing as it relates to the fund, including the backgrounds of investment personnel of Fidelity, and also considered the fund's investment objective, strategies, and related investment philosophy. The Independent Trustees also had discussions with senior management of Fidelity's investment operations and investment groups. The Board considered the structure of the investment personnel compensation program and whether this structure provides appropriate incentives to act in the best interests of the fund.
Resources Dedicated to Investment Management and Support Services. The Board and the Fund Oversight and Research Committees reviewed the general qualifications and capabilities of Fidelity's investment staff, including its size, education, experience, and resources, as well as Fidelity's approach to recruiting, training, managing, and compensating investment personnel. The Board noted that Fidelity has continued to increase the resources devoted to non-U.S. offices, including expansion of Fidelity's global investment organization. The Board also noted that Fidelity's analysts have extensive resources, tools and capabilities that allow them to conduct sophisticated quantitative and fundamental analysis, as well as credit analysis of issuers, counterparties and guarantors. Further, the Board considered that Fidelity's investment professionals have sufficient access to global information and data so as to provide competitive investment results over time, and that those professionals also have access to sophisticated tools that permit them to assess portfolio construction and risk and performance attribution characteristics continuously, as well as to transmit new information and research conclusions rapidly around the world. Additionally, in its deliberations, the Board considered Fidelity's trading, risk management, compliance, and technology and operations capabilities and resources, which are integral parts of the investment management process.
Administrative Services. The Board considered (i) the nature, extent, quality, and cost of advisory and administrative services performed by the Investment Advisers and their affiliates under the Advisory Contracts and under separate agreements covering transfer agency, pricing and bookkeeping, and securities lending services for the fund; (ii) the nature and extent of the supervision of third party service providers, principally custodians, subcustodians, and pricing vendors; and (iii) the resources devoted to, and the record of compliance with, the fund's compliance policies and procedures. The Board also reviewed the allocation of fund brokerage, including allocations to brokers affiliated with the Investment Advisers, the use of brokerage commissions to pay fund expenses, and the use of "soft" commission dollars to pay for research services.
Investment Performance. The Board considered whether the fund has operated in accordance with its investment objective, as well as its record of compliance with its investment restrictions. The Board reviewed the fund's absolute investment performance, as well as the fund's relative investment performance, but did not consider performance to be a material factor in its decision to renew the fund's Advisory Contracts, as the fund is not publicly offered as a stand-alone investment product. In this regard, the Board noted that the fund is designed to offer an investment option for other investment companies managed by Fidelity and ultimately to enhance the performance of those investment companies.
Based on its review, the Board concluded that the nature, extent, and quality of services provided to the fund under the Advisory Contracts should continue to benefit the shareholders of the fund.
Competitiveness of Management Fee and Total Expense Ratio. The Board considered that the fund does not pay FMR a management fee for investment advisory services. The Board also noted that FMR or an affiliate undertakes to pay all operating expenses of the fund, except transfer agent fees, 12b-1 fees, Independent Trustee fees and expenses, custodian fees and expenses, proxy and shareholder meeting expenses, interest, taxes, brokerage expenses, and extraordinary expenses (such as litigation expenses).
The Board further considered that, effective June 1, 2017, FMR has contractually agreed to reimburse the fund to the extent that total operating expenses (excluding interest, certain taxes, certain securities lending costs, brokerage commissions, fees and expenses of the Independent Trustees, proxy and shareholder meeting expenses, extraordinary expenses, and acquired fund fees and expenses, if any), as a percentage of its average net assets, exceed 0.014% through February 28, 2021.
Based on its review, the Board considered that the fund does not pay a management fee and concluded that the fund's total expense ratio was reasonable in light of the services that the fund and its shareholders receive and the other factors considered.
Costs of the Services and Profitability. The Board considered the level of Fidelity's profits in respect of all the Fidelity funds.
PricewaterhouseCoopers LLP (PwC), independent registered public accounting firm and auditor to Fidelity and certain Fidelity funds, has been engaged annually by the Board as part of the Board's assessment of Fidelity's profitability analysis. PwC's engagement includes the review and assessment of the methodologies used by Fidelity in determining the revenues and expenses attributable to Fidelity's mutual fund business, and completion of agreed-upon procedures in respect of the mathematical accuracy of the fund profitability information and its conformity to established allocation methodologies. After considering PwC's reports issued under the engagement and information provided by Fidelity, the Board concluded that while other allocation methods may also be reasonable, Fidelity's profitability methodologies are reasonable in all material respects.
The Board also reviewed Fidelity's non-fund businesses and potential fall-out benefits related to the mutual fund business as well as cases where Fidelity's affiliates may benefit from or be related to the fund's business.
The Board concluded that the costs of the services provided by and the profits realized by Fidelity in connection with the operation of the fund were not relevant to the renewal of the Advisory Contracts because the fund pays no advisory fees and FMR or an affiliate bears all expenses of the fund, with limited exceptions.
Economies of Scale. The Board concluded that because the fund pays no advisory fees and FMR or an affiliate bears all expenses of the fund, with limited exceptions, economies of scale cannot be realized by the fund.
Additional Information Requested by the Board. In order to develop fully the factual basis for consideration of the Fidelity funds' advisory contracts, the Board requested and received additional information on certain topics, including: (i) fund performance trends, in particular the underperformance of certain funds, and Fidelity's long-term strategies for certain funds; (ii) Fidelity's fund profitability methodology, profitability trends for certain funds, and the impact of certain factors on fund profitability results, including the impact of market trends on actively managed funds; (iii) the use of performance fees and the calculation of performance adjustments, including the impact of underperformance and fund outflows on performance adjustments; (iv) metrics for evaluating index fund performance; (v) Fidelity's group fee structure, including the group fee breakpoint schedules; (vi) the terms of Fidelity's contractual and voluntary expense cap arrangements with the funds; (vii) the methodology with respect to evaluating competitive fund data and peer group classifications and fee comparisons; (viii) the expense structures for different funds and classes; (ix) Fidelity's arrangements with affiliated sub-advisers on behalf of the funds; (x) information regarding other accounts managed by Fidelity, including institutional accounts and collective investment trusts; (xi) recent changes to the fee structure for certain funds of funds; and (xii) the impact of the Department of Labor's new fiduciary rule on the funds' comparative expense information.
Based on its evaluation of all of the conclusions noted above, and after considering all factors it believed relevant, the Board concluded that the advisory fee structures are fair and reasonable, and that the fund's Advisory Contracts should be renewed.
Corporate Headquarters
245 Summer St.
Boston, MA 02210
www.fidelity.com
AO1TI-ANN-0218
1.950951.105
Fidelity® Contrafund® K6
Annual Report December 31, 2017 |
|
Contents
To view a fund's proxy voting guidelines and proxy voting record for the 12-month period ended June 30, visit http://www.fidelity.com/proxyvotingresults or visit the Securities and Exchange Commission's (SEC) web site at http://www.sec.gov.
You may also call 1-800-835-5092 to request a free copy of the proxy voting guidelines.
Standard & Poor's, S&P and S&P 500 are registered service marks of The McGraw-Hill Companies, Inc. and have been licensed for use by Fidelity Distributors Corporation.
Other third-party marks appearing herein are the property of their respective owners.
All other marks appearing herein are registered or unregistered trademarks or service marks of FMR LLC or an affiliated company. © 2018 FMR LLC. All rights reserved.
This report and the financial statements contained herein are submitted for the general information of the shareholders of the Fund. This report is not authorized for distribution to prospective investors in the Fund unless preceded or accompanied by an effective prospectus.
A fund files its complete schedule of portfolio holdings with the SEC for the first and third quarters of each fiscal year on Form N-Q. Forms N-Q are available on the SEC’s web site at http://www.sec.gov. A fund's Forms N-Q may be reviewed and copied at the SEC’s Public Reference Room in Washington, DC. Information regarding the operation of the SEC's Public Reference Room may be obtained by calling 1-800-SEC-0330.
For a complete list of a fund's portfolio holdings, view the most recent holdings listing, semiannual report, or annual report on Fidelity's web site at http://www.fidelity.com, http://www.institutional.fidelity.com, or http://www.401k.com, as applicable.
NOT FDIC INSURED •MAY LOSE VALUE •NO BANK GUARANTEE
Neither the Fund nor Fidelity Distributors Corporation is a bank.
Performance: The Bottom Line
Average annual total return reflects the change in the value of an investment, assuming reinvestment of distributions from dividend income and capital gains (the profits earned upon the sale of securities that have grown in value, if any) and assuming a constant rate of performance each year. The hypothetical investment and the average annual total returns do not reflect the deduction of taxes that a shareholder would pay on fund distributions or the redemption of fund shares. During periods of reimbursement by Fidelity, a fund’s total return will be greater than it would be had the reimbursement not occurred. How a fund did yesterday is no guarantee of how it will do tomorrow.
Average annual total returns for Fidelity® Contrafund® K6 will be reported once the fund is a year old.
$10,000 Over Life of Fund
Let's say hypothetically that $10,000 was invested in Fidelity® Contrafund® K6 on May 25, 2017, when the fund started.
The chart shows how the value of your investment would have changed, and also shows how the S&P 500® Index performed over the same period.
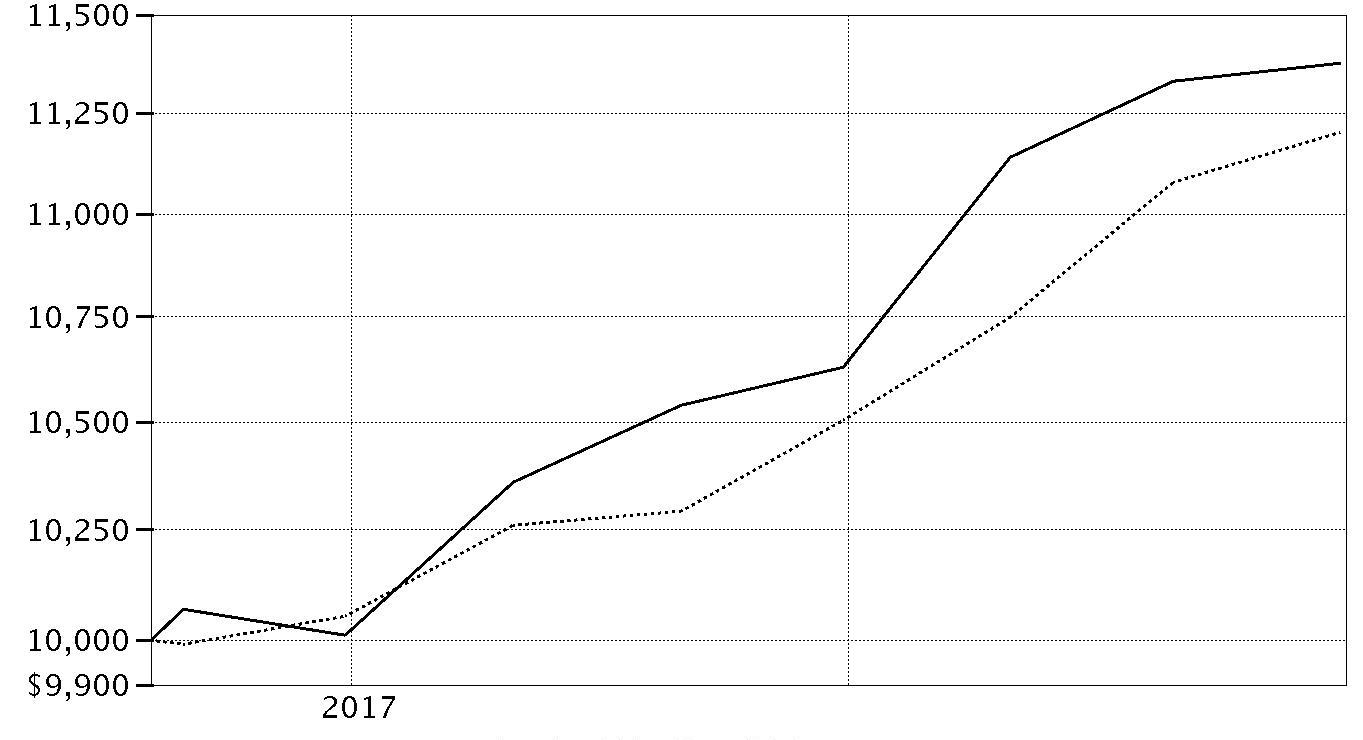
| Period Ending Values |
| $11,377 | Fidelity® Contrafund® K6 |
| $11,202 | S&P 500® Index |
Management's Discussion of Fund Performance
Market Recap: U.S. equities gained 21.83% in 2017, as the S&P 500
® index rose steadily and closed the year just shy of an all-time high after a particularly strong three-month finish. Early on, equities rallied on optimism for President Trump’s pro-business agenda but leveled off in March amid fading optimism and stalled efforts by Congress to repeal and replace the Affordable Care Act. Upward momentum soon returned and continued through year-end with consumer sentiment and other market indicators staying positive. The lone exception was a brief cooldown in August, when geopolitical tension escalated and uncertainty grew regarding the future of health care, tax reform and the debt ceiling. Sector-wise, information technology fared best by a wide margin, rising 39% amid strong earnings growth from several major index constituents. A 24% gain in materials was spurred by increased demand, especially from China. Consumer discretionary gained 23%, despite many brick-and-mortar retailers suffering from online competition, and financials edged the broader market on an uptick in bond yields. Conversely, the defensive energy and telecom services sectors returned about -1% each. Rising interest rates held back real estate (+11%), while consumer staples (+13%) and utilities (+12%) struggled due to investors’ general preference for risk assets.
Comments from Portfolio Manager William Danoff: From its inception on May 25, 2017, through December 31, 2017, the fund gained 13.77%, outpacing the 12.02% advance of the benchmark S&P 500
®. A more business-friendly administration in the White House, an extremely low interest rate environment worldwide and synchronous global economic expansion propelled the stock market higher, particularly growth and technology shares. Contrafund was well-positioned for this environment and performed well for the period, driven largely by a sizable stake – 44% of assets, on average – in the surging information technology sector. Here, notable individual relative contributors included online payment processor PayPal Holdings and China's Alibaba Group Holding, an online retailer and non-benchmark stock. Other winners from tech included mobile-payment processor Square and social-media giant Facebook. The top contributor this period was the fund’s de-emphasis of industrial conglomerate General Electric, which has struggled. Conversely, the biggest relative detractors were out-of-index investments in electric car maker Tesla and Veeva Systems, a provider of cloud computing for the life sciences industry. Unfavorable positioning in several health care names, including big pharma AbbVie, also hurt, as did a modest cash position in a strong up market.
The views expressed above reflect those of the portfolio manager(s) only through the end of the period as stated on the cover of this report and do not necessarily represent the views of Fidelity or any other person in the Fidelity organization. Any such views are subject to change at any time based upon market or other conditions and Fidelity disclaims any responsibility to update such views. These views may not be relied on as investment advice and, because investment decisions for a Fidelity fund are based on numerous factors, may not be relied on as an indication of trading intent on behalf of any Fidelity fund.
Investment Summary (Unaudited)
Top Ten Stocks as of December 31, 2017
| | % of fund's net assets |
| Facebook, Inc. Class A | 7.2 |
| Berkshire Hathaway, Inc. Class A | 5.2 |
| Amazon.com, Inc. | 5.1 |
| Alphabet, Inc. Class A | 3.6 |
| Alphabet, Inc. Class C | 3.2 |
| Microsoft Corp. | 3.1 |
| Apple, Inc. | 3.1 |
| UnitedHealth Group, Inc. | 2.8 |
| Visa, Inc. Class A | 2.5 |
| Salesforce.com, Inc. | 2.3 |
| | 38.1 |
Top Five Market Sectors as of December 31, 2017
| | % of fund's net assets |
| Information Technology | 41.0 |
| Financials | 18.8 |
| Consumer Discretionary | 13.9 |
| Health Care | 9.0 |
| Industrials | 6.8 |
Asset Allocation (% of fund's net assets)
| As of December 31, 2017* |
| | Stocks | 97.0% |
| | Bonds | 0.1% |
| | Convertible Securities | 0.1% |
| | Short-Term Investments and Net Other Assets (Liabilities) | 2.8% |

* Foreign investments - 7.2%
Investments December 31, 2017
Showing Percentage of Net Assets
| Common Stocks - 97.0% | | | |
| | | Shares | Value |
| CONSUMER DISCRETIONARY - 13.9% | | | |
| Auto Components - 0.0% | | | |
| Aptiv PLC | | 6,462 | $548,171 |
| Delphi Technologies PLC (a) | | 2,154 | 113,020 |
| | | | 661,191 |
| Automobiles - 1.4% | | | |
| BYD Co. Ltd. (H Shares) | | 107,000 | 929,563 |
| General Motors Co. | | 24,212 | 992,450 |
| Guangzhou Automobile Group Co. Ltd. (H Shares) | | 74,000 | 175,414 |
| Mahindra & Mahindra Ltd. | | 94,670 | 1,113,826 |
| Maruti Suzuki India Ltd. | | 16,769 | 2,555,683 |
| Tesla, Inc. (a) | | 53,737 | 16,731,015 |
| Toyota Motor Corp. | | 13,500 | 860,355 |
| | | | 23,358,306 |
| Diversified Consumer Services - 0.1% | | | |
| Chegg, Inc. (a) | | 26,510 | 432,643 |
| Weight Watchers International, Inc. (a) | | 28,251 | 1,250,954 |
| | | | 1,683,597 |
| Hotels, Restaurants & Leisure - 1.6% | | | |
| Churchill Downs, Inc. | | 1,056 | 245,731 |
| Eldorado Resorts, Inc. (a) | | 5,476 | 181,529 |
| Hilton Worldwide Holdings, Inc. | | 58,539 | 4,674,925 |
| Las Vegas Sands Corp. | | 4,820 | 334,942 |
| Marriott International, Inc. Class A | | 72,160 | 9,794,277 |
| McDonald's Corp. | | 58,739 | 10,110,157 |
| Starbucks Corp. | | 23,400 | 1,343,862 |
| U.S. Foods Holding Corp. (a) | | 17,743 | 566,534 |
| Vail Resorts, Inc. | | 2,411 | 512,265 |
| | | | 27,764,222 |
| Household Durables - 0.4% | | | |
| D.R. Horton, Inc. | | 6,742 | 344,314 |
| Lennar Corp. Class A | | 29,039 | 1,836,426 |
| Mohawk Industries, Inc. (a) | | 17,311 | 4,776,105 |
| Roku, Inc. Class A | | 3,297 | 170,719 |
| | | | 7,127,564 |
| Internet & Direct Marketing Retail - 7.4% | | | |
| Amazon.com, Inc. (a) | | 75,032 | 87,747,673 |
| ASOS PLC (a) | | 1,507 | 136,629 |
| Blue Apron Holdings, Inc. Class A | | 11,144 | 44,910 |
| Netflix, Inc. (a) | | 143,250 | 27,498,270 |
| Priceline Group, Inc. (a) | | 6,056 | 10,523,753 |
| Start Today Co. Ltd. | | 39,600 | 1,203,728 |
| Takeaway.com Holding BV (a)(b) | | 7,766 | 474,102 |
| Zalando SE (a) | | 10,440 | 552,604 |
| | | | 128,181,669 |
| Leisure Products - 0.1% | | | |
| Mattel, Inc. | | 53,585 | 824,137 |
| Polaris Industries, Inc. | | 3,960 | 491,000 |
| | | | 1,315,137 |
| Media - 0.9% | | | |
| Charter Communications, Inc. Class A (a) | | 7,955 | 2,672,562 |
| Liberty Global PLC Class A (a) | | 16,224 | 581,468 |
| Liberty Media Corp.: | | | |
| Liberty Formula One Group Series C (a) | | 106,710 | 3,645,214 |
| Liberty SiriusXM Series C (a) | | 71,706 | 2,843,860 |
| Live Nation Entertainment, Inc. (a) | | 15,199 | 647,021 |
| Sirius XM Holdings, Inc. | | 346,438 | 1,856,908 |
| The Walt Disney Co. | | 37,981 | 4,083,337 |
| | | | 16,330,370 |
| Multiline Retail - 0.2% | | | |
| B&M European Value Retail S.A. | | 153,164 | 875,981 |
| Dollar Tree, Inc. (a) | | 12,720 | 1,364,983 |
| Ollie's Bargain Outlet Holdings, Inc. (a) | | 21,161 | 1,126,823 |
| | | | 3,367,787 |
| Specialty Retail - 1.3% | | | |
| Burlington Stores, Inc. (a) | | 1,394 | 171,504 |
| Five Below, Inc. (a) | | 5,296 | 351,231 |
| Home Depot, Inc. | | 79,384 | 15,045,650 |
| TJX Companies, Inc. | | 88,690 | 6,781,237 |
| | | | 22,349,622 |
| Textiles, Apparel & Luxury Goods - 0.5% | | | |
| adidas AG | | 24,041 | 4,821,541 |
| Kering SA | | 1,998 | 942,139 |
| LVMH Moet Hennessy - Louis Vuitton SA | | 2,906 | 852,927 |
| NIKE, Inc. Class B | | 42,352 | 2,649,118 |
| | | | 9,265,725 |
|
| TOTAL CONSUMER DISCRETIONARY | | | 241,405,190 |
|
| CONSUMER STAPLES - 2.5% | | | |
| Beverages - 0.4% | | | |
| Constellation Brands, Inc. Class A (sub. vtg.) | | 9,990 | 2,283,414 |
| Kweichow Moutai Co. Ltd. (A Shares) | | 6,400 | 686,058 |
| Monster Beverage Corp. (a) | | 25,461 | 1,611,427 |
| The Coca-Cola Co. | | 57,866 | 2,654,892 |
| | | | 7,235,791 |
| Food & Staples Retailing - 0.6% | | | |
| Costco Wholesale Corp. | | 15,606 | 2,904,589 |
| Performance Food Group Co. (a) | | 37,054 | 1,226,487 |
| Sysco Corp. | | 7,230 | 439,078 |
| Wal-Mart Stores, Inc. | | 46,175 | 4,559,781 |
| | | | 9,129,935 |
| Food Products - 0.0% | | | |
| The Simply Good Foods Co. | | 20,617 | 293,998 |
| Household Products - 0.6% | | | |
| Colgate-Palmolive Co. | | 138,173 | 10,425,153 |
| Personal Products - 0.9% | | | |
| Estee Lauder Companies, Inc. Class A | | 115,998 | 14,759,586 |
| L'Oreal SA (a) | | 2,932 | 649,675 |
| Shiseido Co. Ltd. | | 3,000 | 145,001 |
| Unilever NV (Certificaten Van Aandelen) (Bearer) | | 5,900 | 332,188 |
| | | | 15,886,450 |
|
| TOTAL CONSUMER STAPLES | | | 42,971,327 |
|
| ENERGY - 2.1% | | | |
| Oil, Gas & Consumable Fuels - 2.1% | | | |
| Andeavor | | 1,237 | 141,439 |
| Birchcliff Energy Ltd. | | 301,920 | 1,056,840 |
| Cabot Oil & Gas Corp. | | 12,379 | 354,039 |
| Canadian Natural Resources Ltd. | | 80,164 | 2,864,731 |
| Centennial Resource Development, Inc. Class A (a) | | 247,227 | 4,895,095 |
| Concho Resources, Inc. (a) | | 7,921 | 1,189,893 |
| Continental Resources, Inc. (a) | | 63,109 | 3,342,884 |
| Diamondback Energy, Inc. (a) | | 27,212 | 3,435,515 |
| Encana Corp. | | 12,756 | 170,181 |
| EOG Resources, Inc. | | 77,333 | 8,345,004 |
| Growmax Resources Corp. (a)(b) | | 44,000 | 3,675 |
| Phillips 66 Co. | | 37,362 | 3,779,166 |
| Pioneer Natural Resources Co. | | 1,037 | 179,245 |
| PrairieSky Royalty Ltd. | | 39,052 | 996,028 |
| Reliance Industries Ltd. | | 264,706 | 3,819,039 |
| Valero Energy Corp. | | 16,550 | 1,521,111 |
| | | | 36,093,885 |
| FINANCIALS - 18.8% | | | |
| Banks - 10.0% | | | |
| Bank Ireland Group PLC (a) | | 206,272 | 1,769,593 |
| Bank of America Corp. | | 1,032,249 | 30,471,990 |
| Citigroup, Inc. | | 510,980 | 38,022,022 |
| HDFC Bank Ltd. sponsored ADR | | 98,765 | 10,041,438 |
| JPMorgan Chase & Co. | | 303,291 | 32,433,940 |
| Kotak Mahindra Bank Ltd. (a) | | 121,807 | 1,927,466 |
| M&T Bank Corp. | | 27,659 | 4,729,412 |
| Metro Bank PLC (a) | | 83,871 | 4,058,465 |
| PNC Financial Services Group, Inc. | | 40,726 | 5,876,355 |
| Royal Bank of Canada | | 11,844 | 967,213 |
| The Toronto-Dominion Bank | | 27,620 | 1,618,308 |
| U.S. Bancorp | | 189,925 | 10,176,182 |
| Wells Fargo & Co. | | 503,393 | 30,540,853 |
| | | | 172,633,237 |
| Capital Markets - 2.3% | | | |
| Ashmore Group PLC | | 23,829 | 130,332 |
| Bank of New York Mellon Corp. | | 62,396 | 3,360,649 |
| BlackRock, Inc. Class A | | 8,315 | 4,271,499 |
| Brookfield Asset Management, Inc. Class A | | 9,034 | 393,270 |
| CBOE Holdings, Inc. | | 3,575 | 445,409 |
| Charles Schwab Corp. | | 160,836 | 8,262,145 |
| CME Group, Inc. | | 10,612 | 1,549,883 |
| Goldman Sachs Group, Inc. | | 1,726 | 439,716 |
| IntercontinentalExchange, Inc. | | 23,912 | 1,687,231 |
| Morgan Stanley | | 198,116 | 10,395,147 |
| MSCI, Inc. | | 22,312 | 2,823,360 |
| Oaktree Capital Group LLC Class A | | 29,929 | 1,260,011 |
| S&P Global, Inc. | | 25,687 | 4,351,378 |
| St. James's Place Capital PLC | | 21,897 | 362,458 |
| | | | 39,732,488 |
| Consumer Finance - 0.1% | | | |
| Synchrony Financial | | 58,589 | 2,262,121 |
| Diversified Financial Services - 5.2% | | | |
| Berkshire Hathaway, Inc. Class A (a) | | 305 | 90,768,003 |
| Insurance - 1.2% | | | |
| Admiral Group PLC | | 57,651 | 1,558,307 |
| AIA Group Ltd. | | 117,200 | 999,812 |
| Chubb Ltd. | | 101,186 | 14,786,310 |
| Fairfax Financial Holdings Ltd. (sub. vtg.) | | 2,529 | 1,346,667 |
| Marsh & McLennan Companies, Inc. | | 32,775 | 2,667,557 |
| | | | 21,358,653 |
|
| TOTAL FINANCIALS | | | 326,754,502 |
|
| HEALTH CARE - 8.9% | | | |
| Biotechnology - 2.2% | | | |
| AbbVie, Inc. | | 35,120 | 3,396,455 |
| Agios Pharmaceuticals, Inc. (a) | | 13,596 | 777,283 |
| Alnylam Pharmaceuticals, Inc. (a) | | 5,964 | 757,726 |
| Amgen, Inc. | | 12,083 | 2,101,234 |
| AnaptysBio, Inc. | | 6,229 | 627,385 |
| Biogen, Inc. (a) | | 4,107 | 1,308,367 |
| bluebird bio, Inc. (a) | | 2,514 | 447,743 |
| Blueprint Medicines Corp. (a) | | 3,272 | 246,742 |
| Celgene Corp. (a) | | 18,887 | 1,971,047 |
| Exact Sciences Corp. (a) | | 4,567 | 239,950 |
| FibroGen, Inc. (a) | | 27,418 | 1,299,613 |
| Genmab A/S (a) | | 12,828 | 2,127,421 |
| Gilead Sciences, Inc. | | 100,949 | 7,231,986 |
| Insmed, Inc. (a) | | 13,916 | 433,901 |
| Intrexon Corp. (c) | | 24,531 | 282,597 |
| Juno Therapeutics, Inc. (a) | | 8,462 | 386,798 |
| NantKwest, Inc. (a) | | 11,506 | 51,662 |
| Neurocrine Biosciences, Inc. (a) | | 42,297 | 3,281,824 |
| OvaScience, Inc. (a) | | 18,198 | 25,477 |
| Portola Pharmaceuticals, Inc. (a) | | 11,246 | 547,455 |
| Regeneron Pharmaceuticals, Inc. (a) | | 5,167 | 1,942,585 |
| Sage Therapeutics, Inc. (a) | | 2,846 | 468,765 |
| Vertex Pharmaceuticals, Inc. (a) | | 51,886 | 7,775,636 |
| | | | 37,729,652 |
| Health Care Equipment & Supplies - 1.6% | | | |
| Baxter International, Inc. | | 89,094 | 5,759,036 |
| Becton, Dickinson & Co. | | 7,389 | 1,581,689 |
| Boston Scientific Corp. (a) | | 415,331 | 10,296,055 |
| Danaher Corp. | | 14,186 | 1,316,745 |
| Edwards Lifesciences Corp. (a) | | 4,124 | 464,816 |
| Intuitive Surgical, Inc. (a) | | 14,064 | 5,132,516 |
| Penumbra, Inc. (a) | | 6,597 | 620,778 |
| ResMed, Inc. | | 7,984 | 676,165 |
| Stryker Corp. | | 11,022 | 1,706,646 |
| | | | 27,554,446 |
| Health Care Providers & Services - 3.3% | | | |
| Aetna, Inc. | | 10,693 | 1,928,910 |
| Anthem, Inc. | | 1,294 | 291,163 |
| Cigna Corp. | | 3,090 | 627,548 |
| HealthEquity, Inc. (a) | | 24,333 | 1,135,378 |
| Henry Schein, Inc. (a) | | 34,321 | 2,398,351 |
| Humana, Inc. | | 11,348 | 2,815,098 |
| National Vision Holdings, Inc. | | 10,753 | 436,679 |
| OptiNose, Inc. | | 7,383 | 139,539 |
| UnitedHealth Group, Inc. | | 220,424 | 48,594,675 |
| | | | 58,367,341 |
| Health Care Technology - 0.1% | | | |
| Medidata Solutions, Inc. (a) | | 7,079 | 448,596 |
| NantHealth, Inc. (a) | | 111 | 339 |
| Veeva Systems, Inc. Class A (a) | | 31,684 | 1,751,492 |
| | | | 2,200,427 |
| Life Sciences Tools & Services - 1.2% | | | |
| Agilent Technologies, Inc. | | 12,922 | 865,386 |
| Eurofins Scientific SA | | 1,191 | 725,371 |
| Mettler-Toledo International, Inc. (a) | | 24,664 | 15,279,841 |
| PRA Health Sciences, Inc. (a) | | 11,656 | 1,061,512 |
| Thermo Fisher Scientific, Inc. | | 10,986 | 2,086,022 |
| Waters Corp. (a) | | 5,557 | 1,073,557 |
| | | | 21,091,689 |
| Pharmaceuticals - 0.5% | | | |
| AstraZeneca PLC sponsored ADR | | 7,942 | 275,587 |
| Bristol-Myers Squibb Co. | | 34,064 | 2,087,442 |
| GW Pharmaceuticals PLC ADR (a) | | 897 | 118,413 |
| Johnson & Johnson | | 8,206 | 1,146,542 |
| Nektar Therapeutics (a) | | 53,672 | 3,205,292 |
| Teva Pharmaceutical Industries Ltd. sponsored ADR | | 65,988 | 1,250,473 |
| | | | 8,083,749 |
|
| TOTAL HEALTH CARE | | | 155,027,304 |
|
| INDUSTRIALS - 6.8% | | | |
| Aerospace & Defense - 0.9% | | | |
| General Dynamics Corp. | | 9,319 | 1,895,951 |
| Northrop Grumman Corp. | | 18,424 | 5,654,510 |
| Raytheon Co. | | 13,689 | 2,571,479 |
| The Boeing Co. | | 20,723 | 6,111,420 |
| | | | 16,233,360 |
| Air Freight & Logistics - 0.5% | | | |
| Expeditors International of Washington, Inc. | | 2,290 | 148,140 |
| FedEx Corp. | | 20,569 | 5,132,788 |
| XPO Logistics, Inc. (a) | | 35,810 | 3,279,838 |
| | | | 8,560,766 |
| Airlines - 1.0% | | | |
| Ryanair Holdings PLC sponsored ADR (a) | | 72,285 | 7,531,374 |
| Southwest Airlines Co. | | 156,300 | 10,229,835 |
| | | | 17,761,209 |
| Building Products - 0.8% | | | |
| A.O. Smith Corp. | | 14,122 | 865,396 |
| Fortune Brands Home & Security, Inc. | | 17,521 | 1,199,137 |
| Jeld-Wen Holding, Inc. | | 57,354 | 2,258,027 |
| Masco Corp. | | 178,808 | 7,856,824 |
| Toto Ltd. | | 41,300 | 2,437,497 |
| | | | 14,616,881 |
| Commercial Services & Supplies - 0.2% | | | |
| Cintas Corp. | | 14,149 | 2,204,839 |
| TulCo LLC (d)(e)(f) | | 996 | 348,600 |
| | | | 2,553,439 |
| Construction & Engineering - 0.1% | | | |
| Jacobs Engineering Group, Inc. | | 12,877 | 849,367 |
| Electrical Equipment - 0.4% | | | |
| AMETEK, Inc. | | 9,181 | 665,347 |
| Fortive Corp. | | 83,701 | 6,055,767 |
| | | | 6,721,114 |
| Industrial Conglomerates - 0.8% | | | |
| 3M Co. | | 57,024 | 13,421,739 |
| ITT, Inc. | | 1,824 | 97,347 |
| Roper Technologies, Inc. | | 1,262 | 326,858 |
| | | | 13,845,944 |
| Machinery - 1.3% | | | |
| Caterpillar, Inc. | | 22,400 | 3,529,792 |
| Deere & Co. | | 43,113 | 6,747,616 |
| Gardner Denver Holdings, Inc. | | 34,322 | 1,164,545 |
| IDEX Corp. | | 1,259 | 166,150 |
| Illinois Tool Works, Inc. | | 24,688 | 4,119,193 |
| Ingersoll-Rand PLC | | 14,171 | 1,263,911 |
| Oshkosh Corp. | | 1,686 | 153,241 |
| PACCAR, Inc. | | 25,689 | 1,825,974 |
| Parker Hannifin Corp. | | 16,804 | 3,353,742 |
| Rational AG | | 603 | 388,669 |
| Xylem, Inc. | | 7,202 | 491,176 |
| | | | 23,204,009 |
| Professional Services - 0.3% | | | |
| Equifax, Inc. | | 3,577 | 421,800 |
| Manpower, Inc. | | 3,807 | 480,101 |
| Recruit Holdings Co. Ltd. | | 35,900 | 892,123 |
| RELX PLC | | 7,865 | 184,663 |
| TransUnion Holding Co., Inc. (a) | | 63,088 | 3,467,316 |
| | | | 5,446,003 |
| Road & Rail - 0.4% | | | |
| CSX Corp. | | 103,420 | 5,689,134 |
| Union Pacific Corp. | | 10,562 | 1,416,364 |
| | | | 7,105,498 |
| Trading Companies & Distributors - 0.1% | | | |
| Air Lease Corp. Class A (b) | | 18,063 | 868,650 |
| Fastenal Co. | | 3,261 | 178,344 |
| United Rentals, Inc. (a) | | 1,568 | 269,555 |
| | | | 1,316,549 |
|
| TOTAL INDUSTRIALS | | | 118,214,139 |
|
| INFORMATION TECHNOLOGY - 40.9% | | | |
| Communications Equipment - 0.4% | | | |
| Arista Networks, Inc. (a) | | 26,410 | 6,221,668 |
| Electronic Equipment & Components - 1.8% | | | |
| Amphenol Corp. Class A | | 324,174 | 28,462,477 |
| CDW Corp. | | 29,962 | 2,082,059 |
| Corning, Inc. | | 3,993 | 127,736 |
| Dolby Laboratories, Inc. Class A | | 13,161 | 815,982 |
| Keyence Corp. | | 200 | 112,039 |
| | | | 31,600,293 |
| Internet Software & Services - 15.3% | | | |
| Alibaba Group Holding Ltd. sponsored ADR (a) | | 32,973 | 5,685,534 |
| Alphabet, Inc.: | | | |
| Class A (a) | | 58,434 | 61,554,376 |
| Class C (a) | | 53,711 | 56,203,190 |
| CarGurus, Inc. Class A | | 9,193 | 275,606 |
| Cloudera, Inc. | | 23,324 | 385,312 |
| CoStar Group, Inc. (a) | | 336 | 99,775 |
| eBay, Inc. (a) | | 110,004 | 4,151,551 |
| Facebook, Inc. Class A (a) | | 704,420 | 124,301,956 |
| LogMeIn, Inc. | | 26,753 | 3,063,219 |
| New Relic, Inc. (a) | | 15,503 | 895,608 |
| Nutanix, Inc. Class A (a) | | 37,200 | 1,312,416 |
| Okta, Inc. | | 16,620 | 425,638 |
| Q2 Holdings, Inc. (a) | | 524 | 19,309 |
| Rightmove PLC | | 3,863 | 234,703 |
| Shopify, Inc. Class A (a) | | 6,657 | 673,167 |
| Tencent Holdings Ltd. | | 120,400 | 6,231,658 |
| | | | 265,513,018 |
| IT Services - 6.1% | | | |
| Accenture PLC Class A | | 14,549 | 2,227,306 |
| EPAM Systems, Inc. (a) | | 9,718 | 1,044,005 |
| Fiserv, Inc. (a) | | 29,855 | 3,914,886 |
| FleetCor Technologies, Inc. (a) | | 320 | 61,578 |
| Global Payments, Inc. | | 28,575 | 2,864,358 |
| Leidos Holdings, Inc. | | 4,819 | 311,163 |
| MasterCard, Inc. Class A | | 164,442 | 24,889,941 |
| PayPal Holdings, Inc. (a) | | 355,080 | 26,140,990 |
| Square, Inc. (a) | | 21,419 | 742,597 |
| Visa, Inc. Class A | | 386,720 | 44,093,814 |
| | | | 106,290,638 |
| Semiconductors & Semiconductor Equipment - 2.7% | | | |
| Analog Devices, Inc. | | 11,247 | 1,001,320 |
| Applied Materials, Inc. | | 158,477 | 8,101,344 |
| Broadcom Ltd. | | 26,813 | 6,888,260 |
| First Solar, Inc. (a) | | 9,966 | 672,904 |
| Lam Research Corp. | | 37,835 | 6,964,288 |
| NVIDIA Corp. | | 64,781 | 12,535,124 |
| Qualcomm, Inc. | | 19,039 | 1,218,877 |
| Taiwan Semiconductor Manufacturing Co. Ltd. sponsored ADR | | 72,749 | 2,884,498 |
| Texas Instruments, Inc. | | 70,887 | 7,403,438 |
| | | | 47,670,053 |
| Software - 11.5% | | | |
| Activision Blizzard, Inc. | | 489,510 | 30,995,773 |
| Adobe Systems, Inc. (a) | | 185,469 | 32,501,588 |
| Atlassian Corp. PLC (a) | | 44,079 | 2,006,476 |
| CDK Global, Inc. | | 21,721 | 1,548,273 |
| Constellation Software, Inc. | | 1,846 | 1,119,084 |
| Electronic Arts, Inc. (a) | | 121,902 | 12,807,024 |
| Intuit, Inc. | | 11,519 | 1,817,468 |
| Micro Focus International PLC | | 23,833 | 811,854 |
| Microsoft Corp. | | 626,105 | 53,557,022 |
| Nintendo Co. Ltd. | | 2,400 | 864,232 |
| Parametric Technology Corp. (a) | | 13,140 | 798,518 |
| Paycom Software, Inc. (a) | | 24,073 | 1,933,784 |
| Red Hat, Inc. (a) | | 29,138 | 3,499,474 |
| RingCentral, Inc. (a) | | 24,931 | 1,206,660 |
| Salesforce.com, Inc. (a) | | 382,312 | 39,083,756 |
| Snap, Inc. Class A (a) | | 22,125 | 323,246 |
| Ultimate Software Group, Inc. (a) | | 15,823 | 3,453,053 |
| Workday, Inc. Class A (a) | | 106,676 | 10,853,216 |
| | | | 199,180,501 |
| Technology Hardware, Storage & Peripherals - 3.1% | | | |
| Apple, Inc. | | 314,951 | 53,299,158 |
| Samsung Electronics Co. Ltd. | | 112 | 267,362 |
| | | | 53,566,520 |
|
| TOTAL INFORMATION TECHNOLOGY | | | 710,042,691 |
|
| MATERIALS - 2.6% | | | |
| Chemicals - 1.6% | | | |
| Air Products & Chemicals, Inc. | | 23,886 | 3,919,215 |
| DowDuPont, Inc. | | 163,670 | 11,656,577 |
| LyondellBasell Industries NV Class A | | 10,781 | 1,189,360 |
| Olin Corp. | | 17,910 | 637,238 |
| Sherwin-Williams Co. | | 19,783 | 8,111,821 |
| The Chemours Co. LLC | | 7,597 | 380,306 |
| Westlake Chemical Corp. | | 18,968 | 2,020,661 |
| | | | 27,915,178 |
| Construction Materials - 0.0% | | | |
| Eagle Materials, Inc. | | 1,442 | 163,379 |
| Containers & Packaging - 0.2% | | | |
| WestRock Co. | | 45,049 | 2,847,547 |
| Metals & Mining - 0.8% | | | |
| ArcelorMittal SA Class A unit (a)(c) | | 24,256 | 783,711 |
| Arizona Mining, Inc. (a) | | 22,890 | 63,007 |
| B2Gold Corp. (a) | | 702,589 | 2,168,692 |
| Franco-Nevada Corp. | | 60,180 | 4,809,612 |
| Freeport-McMoRan, Inc. (a) | | 13,763 | 260,946 |
| Ivanhoe Mines Ltd. (a) | | 690,328 | 2,328,553 |
| Ivanhoe Mines Ltd. (a)(b) | | 187,745 | 633,285 |
| Kirkland Lake Gold Ltd. | | 41,520 | 636,508 |
| Newcrest Mining Ltd. | | 82,022 | 1,460,427 |
| Novagold Resources, Inc. (a) | | 114,471 | 449,870 |
| Nucor Corp. | | 7,257 | 461,400 |
| Randgold Resources Ltd. sponsored ADR | | 5,230 | 517,195 |
| | | | 14,573,206 |
|
| TOTAL MATERIALS | | | 45,499,310 |
|
| REAL ESTATE - 0.2% | | | |
| Equity Real Estate Investment Trusts (REITs) - 0.1% | | | |
| American Tower Corp. | | 11,931 | 1,702,196 |
| Real Estate Management & Development - 0.1% | | | |
| Five Point Holdings LLC Class A (a) | | 44,337 | 625,152 |
|
| TOTAL REAL ESTATE | | | 2,327,348 |
|
| TELECOMMUNICATION SERVICES - 0.3% | | | |
| Wireless Telecommunication Services - 0.3% | | | |
| SoftBank Corp. | | 9,200 | 728,369 |
| T-Mobile U.S., Inc. (a) | | 78,664 | 4,995,951 |
| | | | 5,724,320 |
| TOTAL COMMON STOCKS | | | |
| (Cost $1,577,469,675) | | | 1,684,060,016 |
|
| Convertible Preferred Stocks - 0.1% | | | |
| CONSUMER STAPLES - 0.0% | | | |
| Food & Staples Retailing - 0.0% | | | |
| Roofoods Ltd. Series F (e)(f) | | 1,222 | 432,063 |
| HEALTH CARE - 0.0% | | | |
| Biotechnology - 0.0% | | | |
| 23andMe, Inc. Series F (e)(f) | | 26,649 | 370,000 |
| INFORMATION TECHNOLOGY - 0.1% | | | |
| Internet Software & Services - 0.1% | | | |
| Lyft, Inc. Series H (e)(f) | | 16,404 | 651,995 |
| Software - 0.0% | | | |
| Carbon, Inc. Series D (f) | | 9,678 | 225,990 |
|
| TOTAL INFORMATION TECHNOLOGY | | | 877,985 |
|
| TOTAL CONVERTIBLE PREFERRED STOCKS | | | |
| (Cost $1,680,048) | | | 1,680,048 |
| | | Principal Amount | Value |
|
| Nonconvertible Bonds - 0.1% | | | |
| HEALTH CARE - 0.1% | | | |
| Pharmaceuticals - 0.1% | | | |
| Valeant Pharmaceuticals International, Inc.: | | | |
| 6.125% 4/15/25 (b) | | 770,000 | 704,550 |
| 9% 12/15/25 (b) | | 870,000 | 906,714 |
| (Cost $1,549,288) | | | 1,611,264 |
| | | Shares | Value |
|
| Money Market Funds - 2.0% | | | |
| Fidelity Cash Central Fund, 1.36% (g) | | 34,264,902 | 34,271,755 |
| Fidelity Securities Lending Cash Central Fund 1.36% (g)(h) | | 711,510 | 711,652 |
| TOTAL MONEY MARKET FUNDS | | | |
| (Cost $34,983,335) | | | 34,983,407 |
| TOTAL INVESTMENT IN SECURITIES - 99.2% | | | |
| (Cost $1,615,682,346) | | | 1,722,334,735 |
| NET OTHER ASSETS (LIABILITIES) - 0.8% | | | 13,419,495 |
| NET ASSETS - 100% | | | $1,735,754,230 |
Legend
(a) Non-income producing
(b) Security exempt from registration under Rule 144A of the Securities Act of 1933. These securities may be resold in transactions exempt from registration, normally to qualified institutional buyers. At the end of the period, the value of these securities amounted to $3,590,976 or 0.2% of net assets.
(c) Security or a portion of the security is on loan at period end.
(d) Investment is owned by a wholly-owned subsidiary (Subsidiary) that is treated as a corporation for U.S. tax purposes.
(e) Restricted securities - Investment in securities not registered under the Securities Act of 1933 (excluding 144A issues). At the end of the period, the value of restricted securities (excluding 144A issues) amounted to $1,802,658 or 0.1% of net assets.
(f) Level 3 security
(g) Affiliated fund that is generally available only to investment companies and other accounts managed by Fidelity Investments. The rate quoted is the annualized seven-day yield of the fund at period end. A complete unaudited listing of the fund's holdings as of its most recent quarter end is available upon request. In addition, each Fidelity Central Fund's financial statements, which are not covered by the Fund's Report of Independent Registered Public Accounting Firm, are available on the SEC's website or upon request.
(h) Investment made with cash collateral received from securities on loan.
Additional information on each restricted holding is as follows:
| Security | Acquisition Date | Acquisition Cost |
| 23andMe, Inc. Series F | 8/31/17 | $370,000 |
| Lyft, Inc. Series H | 11/22/17 | $651,995 |
| Roofoods Ltd. Series F | 9/12/17 | $432,063 |
| TulCo LLC | 8/24/17 | $348,600 |
Affiliated Central Funds
Information regarding fiscal year to date income earned by the Fund from investments in Fidelity Central Funds is as follows:
| Fund | Income earned |
| Fidelity Cash Central Fund | $129,119 |
| Fidelity Securities Lending Cash Central Fund | 1,014 |
| Total | $130,133 |
Amounts in the income column in the above table include any capital gain distributions from underlying funds, which are presented in the corresponding line-item in the Statement of Operations if applicable.
Investment Valuation
The following is a summary of the inputs used, as of December 31, 2017, involving the Fund's assets and liabilities carried at fair value. The inputs or methodology used for valuing securities may not be an indication of the risk associated with investing in those securities. For more information on valuation inputs, and their aggregation into the levels used below, please refer to the Investment Valuation section in the accompanying Notes to Financial Statements.
| | Valuation Inputs at Reporting Date: |
| Description | Total | Level 1 | Level 2 | Level 3 |
| Investments in Securities: | | | | |
| Equities: | | | | |
| Consumer Discretionary | $241,405,190 | $238,762,345 | $2,642,845 | $-- |
| Consumer Staples | 43,403,390 | 41,989,464 | 981,863 | 432,063 |
| Energy | 36,093,885 | 36,093,885 | -- | -- |
| Financials | 326,754,502 | 326,754,502 | -- | -- |
| Health Care | 155,397,304 | 155,027,304 | -- | 370,000 |
| Industrials | 118,214,139 | 117,865,539 | -- | 348,600 |
| Information Technology | 710,920,676 | 702,946,801 | 7,095,890 | 877,985 |
| Materials | 45,499,310 | 45,499,310 | -- | -- |
| Real Estate | 2,327,348 | 2,327,348 | -- | -- |
| Telecommunication Services | 5,724,320 | 4,995,951 | 728,369 | -- |
| Corporate Bonds | 1,611,264 | -- | 1,611,264 | -- |
| Money Market Funds | 34,983,407 | 34,983,407 | -- | -- |
| Total Investments in Securities: | $1,722,334,735 | $1,707,245,856 | $13,060,231 | $2,028,648 |
See accompanying notes which are an integral part of the financial statements.
Financial Statements
Statement of Assets and Liabilities
| | | December 31, 2017 |
| Assets | | |
Investment in securities, at value (including securities loaned of $689,283) — See accompanying schedule:
Unaffiliated issuers (cost $1,580,699,011) | $1,687,351,328 | |
| Fidelity Central Funds (cost $34,983,335) | 34,983,407 | |
| Total Investment in Securities (cost $1,615,682,346) | | $1,722,334,735 |
| Cash | | 48,307 |
| Foreign currency held at value (cost $129) | | 129 |
| Receivable for investments sold | | 1,939,542 |
| Receivable for fund shares sold | | 257,276,479 |
| Dividends receivable | | 412,427 |
| Interest receivable | | 13,074 |
| Distributions receivable from Fidelity Central Funds | | 34,761 |
| Other receivables | | 3,476 |
| Total assets | | 1,982,062,930 |
| Liabilities | | |
| Payable for investments purchased | $243,522,486 | |
| Payable for fund shares redeemed | 1,471,055 | |
| Accrued management fee | 525,288 | |
| Other payables and accrued expenses | 78,271 | |
| Collateral on securities loaned | 711,600 | |
| Total liabilities | | 246,308,700 |
| Net Assets | | $1,735,754,230 |
| Net Assets consist of: | | |
| Paid in capital | | $1,638,915,460 |
| Distributions in excess of net investment income | | (977) |
| Accumulated undistributed net realized gain (loss) on investments and foreign currency transactions | | (9,735,918) |
| Net unrealized appreciation (depreciation) on investments and assets and liabilities in foreign currencies | | 106,575,665 |
| Net Assets, for 152,825,807 shares outstanding | | $1,735,754,230 |
| Net Asset Value, offering price and redemption price per share ($1,735,754,230 ÷ 152,825,807 shares) | | $11.36 |
See accompanying notes which are an integral part of the financial statements.
Statement of Operations
| | | For the period
May 25, 2017 (commencement of operations) to
December 31, 2017 |
| Investment Income | | |
| Dividends | | $3,825,990 |
| Interest | | 6,690 |
| Income from Fidelity Central Funds | | 130,133 |
| Total income | | 3,962,813 |
| Expenses | | |
| Management fee | $2,151,326 | |
| Independent trustees' fees and expenses | 1,368 | |
| Total expenses before reductions | 2,152,694 | |
| Expense reductions | (7,137) | 2,145,557 |
| Net investment income (loss) | | 1,817,256 |
| Realized and Unrealized Gain (Loss) | | |
| Net realized gain (loss) on: | | |
| Investment securities: | | |
| Unaffiliated issuers | (9,711,060) | |
| Fidelity Central Funds | (30) | |
| Foreign currency transactions | (6,457) | |
| Total net realized gain (loss) | | (9,717,547) |
| Change in net unrealized appreciation (depreciation) on: | | |
| Unaffiliated issuers (net of increase in deferred foreign taxes of $78,272) | 106,574,045 | |
| Fidelity Central Funds | 72 | |
| Assets and liabilities in foreign currencies | 1,548 | |
| Total change in net unrealized appreciation (depreciation) | | 106,575,665 |
| Net gain (loss) | | 96,858,118 |
| Net increase (decrease) in net assets resulting from operations | | $98,675,374 |
See accompanying notes which are an integral part of the financial statements.
Statement of Changes in Net Assets
| | For the period
May 25, 2017 (commencement of operations) to
December 31, 2017 |
| Increase (Decrease) in Net Assets | |
| Operations | |
| Net investment income (loss) | $1,817,256 |
| Net realized gain (loss) | (9,717,547) |
| Change in net unrealized appreciation (depreciation) | 106,575,665 |
| Net increase (decrease) in net assets resulting from operations | 98,675,374 |
| Distributions to shareholders from net investment income | (2,026,235) |
| Share transactions | |
| Proceeds from sales of shares | 1,746,357,993 |
| Reinvestment of distributions | 2,026,235 |
| Cost of shares redeemed | (109,279,137) |
| Net increase (decrease) in net assets resulting from share transactions | 1,639,105,091 |
| Total increase (decrease) in net assets | 1,735,754,230 |
| Net Assets | |
| Beginning of period | – |
| End of period | $1,735,754,230 |
| Other Information | |
| Distributions in excess of net investment income end of period | $(977) |
| Shares | |
| Sold | 162,722,156 |
| Issued in reinvestment of distributions | 179,313 |
| Redeemed | (10,075,662) |
| Net increase (decrease) | 152,825,807 |
See accompanying notes which are an integral part of the financial statements.
Financial Highlights
Fidelity Contrafund K6
| Years ended December 31, | 2017 A |
| Selected Per–Share Data | |
| Net asset value, beginning of period | $10.00 |
| Income from Investment Operations | |
| Net investment income (loss)B | .02 |
| Net realized and unrealized gain (loss) | 1.36 |
| Total from investment operations | 1.38 |
| Distributions from net investment income | (.02) |
| Total distributions | (.02) |
| Net asset value, end of period | $11.36 |
| Total ReturnC,D | 13.77% |
| Ratios to Average Net AssetsE,F | |
| Expenses before reductions | .45%G |
| Expenses net of fee waivers, if any | .45%G |
| Expenses net of all reductions | .45%G |
| Net investment income (loss) | .38%G |
| Supplemental Data | |
| Net assets, end of period (000 omitted) | $1,735,754 |
| Portfolio turnover rateH,I | 48%G |
A For the period May 25, 2017 (commencement of operations) to December 31, 2017.
B Calculated based on average shares outstanding during the period.
C Total returns for periods of less than one year are not annualized.
D Total returns would have been lower if certain expenses had not been reduced during the applicable periods shown.
E Fees and expenses of any underlying Fidelity Central Funds are not included in the Fund's expense ratio. The Fund indirectly bears its proportionate share of the expenses of any underlying Fidelity Central Funds.
F Expense ratios reflect operating expenses of the Fund. Expenses before reductions do not reflect amounts reimbursed by the investment adviser or reductions from brokerage service arrangements or reductions from other expense offset arrangements and do not represent the amount paid by the Fund during periods when reimbursements or reductions occur. Expense ratios before reductions for start-up periods may not be representative of longer term operating periods. Expenses net of fee waivers reflect expenses after reimbursement by the investment adviser but prior to reductions from brokerage service arrangements or other expense offset arrangements. Expenses net of all reductions represent the net expenses paid by the Fund.
G Annualized
H Amount does not include the portfolio activity of any underlying Fidelity Central Funds.
I Portfolio turnover rate excludes securities received or delivered in-kind.
See accompanying notes which are an integral part of the financial statements.
Notes to Financial Statements
For the period ended December 31, 2017
1. Organization.
Fidelity Contrafund K6 (the Fund) is a fund of Fidelity Contrafund (the Trust) and is authorized to issue an unlimited number of shares. Share transactions on the Statement of Changes in Net Assets may contain exchanges between affiliated funds. The Trust is registered under the Investment Company Act of 1940, as amended (the 1940 Act), as an open-end management investment company organized as a Massachusetts business trust. Shares generally are available only to employer-sponsored retirement plans that are recordkept by Fidelity, or to certain employer-sponsored retirement plans that are not recordkept by Fidelity.
2. Investments in Fidelity Central Funds.
The Fund invests in Fidelity Central Funds, which are open-end investment companies generally available only to other investment companies and accounts managed by the investment adviser and its affiliates. The Fund's Schedule of Investments lists each of the Fidelity Central Funds held as of period end, if any, as an investment of the Fund, but does not include the underlying holdings of each Fidelity Central Fund. As an Investing Fund, the Fund indirectly bears its proportionate share of the expenses of the underlying Fidelity Central Funds.
The Money Market Central Funds seek preservation of capital and current income and are managed by Fidelity Investments Money Management, Inc. (FIMM), an affiliate of the investment adviser. Annualized expenses of the Money Market Central Funds as of their most recent shareholder report date are less than .005%.
A complete unaudited list of holdings for each Fidelity Central Fund is available upon request or at the Securities and Exchange Commission (the SEC) website at www.sec.gov. In addition, the financial statements of the Fidelity Central Funds, which are not covered by the Fund's Report of Independent Registered Public Accounting Firm, are available on the SEC website or upon request.
3. Significant Accounting Policies.
The Fund is an investment company and applies the accounting and reporting guidance of the Financial Accounting Standards Board (FASB) Accounting Standards Codification Topic 946 Financial Services – Investments Companies. The financial statements have been prepared in conformity with accounting principles generally accepted in the United States of America (GAAP), which require management to make certain estimates and assumptions at the date of the financial statements. Actual results could differ from those estimates. Subsequent events, if any, through the date that the financial statements were issued have been evaluated in the preparation of the financial statements. The following summarizes the significant accounting policies of the Fund:
Investment Valuation. Investments are valued as of 4:00 p.m. Eastern time on the last calendar day of the period. The Board of Trustees (the Board) has delegated the day to day responsibility for the valuation of the Fund's investments to the Fair Value Committee (the Committee) established by the Fund's investment adviser. In accordance with valuation policies and procedures approved by the Board, the Fund attempts to obtain prices from one or more third party pricing vendors or brokers to value its investments. When current market prices, quotations or currency exchange rates are not readily available or reliable, investments will be fair valued in good faith by the Committee, in accordance with procedures adopted by the Board. Factors used in determining fair value vary by investment type and may include market or investment specific events, including changes in interest rates and credit quality. The frequency with which these procedures are used cannot be predicted and they may be utilized to a significant extent. The Committee oversees the Fund's valuation policies and procedures and reports to the Board on the Committee's activities and fair value determinations. The Board monitors the appropriateness of the procedures used in valuing the Fund's investments and ratifies the fair value determinations of the Committee.
The Fund categorizes the inputs to valuation techniques used to value its investments into a disclosure hierarchy consisting of three levels as shown below:
- Level 1 – quoted prices in active markets for identical investments
- Level 2 – other significant observable inputs (including quoted prices for similar investments, interest rates, prepayment speeds, etc.)
- Level 3 – unobservable inputs (including the Fund's own assumptions based on the best information available)
Valuation techniques used to value the Fund's investments by major category are as follows:
Equity securities, including restricted securities, for which market quotations are readily available, are valued at the last reported sale price or official closing price as reported by a third party pricing vendor on the primary market or exchange on which they are traded and are categorized as Level 1 in the hierarchy. In the event there were no sales during the day or closing prices are not available, securities are valued at the last quoted bid price or may be valued using the last available price and are generally categorized as Level 2 in the hierarchy. For foreign equity securities, when market or security specific events arise, comparisons to the valuation of American Depositary Receipts (ADRs), futures contracts, Exchange-Traded Funds (ETFs) and certain indexes as well as quoted prices for similar securities may be used and would be categorized as Level 2 in the hierarchy. Utilizing these techniques may result in transfers between Level 1 and Level 2. For equity securities, including restricted securities, where observable inputs are limited, assumptions about market activity and risk are used and these securities may be categorized as Level 3 in the hierarchy.
Debt securities, including restricted securities, are valued based on evaluated prices received from third party pricing vendors or from brokers who make markets in such securities. Corporate bonds are valued by pricing vendors who utilize matrix pricing which considers yield or price of bonds of comparable quality, coupon, maturity and type or by broker-supplied prices. When independent prices are unavailable or unreliable, debt securities may be valued utilizing pricing methodologies which consider similar factors that would be used by third party pricing vendors. Debt securities are generally categorized as Level 2 in the hierarchy but may be Level 3 depending on the circumstances.
Investments in open-end mutual funds, including the Fidelity Central Funds, are valued at their closing net asset value (NAV) each business day and are categorized as Level 1 in the hierarchy.
Changes in valuation techniques may result in transfers in or out of an assigned level within the disclosure hierarchy. The aggregate value of investments by input level as of December 31, 2017 is included at the end of the Fund's Schedule of Investments.
Foreign Currency. The Fund may use foreign currency contracts to facilitate transactions in foreign-denominated securities. Gains and losses from these transactions may arise from changes in the value of the foreign currency or if the counterparties do not perform under the contracts' terms.
Foreign-denominated assets, including investment securities, and liabilities are translated into U.S. dollars at the exchange rates at period end. Purchases and sales of investment securities, income and dividends received and expenses denominated in foreign currencies are translated into U.S. dollars at the exchange rate in effect on the transaction date.
The effects of exchange rate fluctuations on investments are included with the net realized and unrealized gain (loss) on investment securities. Other foreign currency transactions resulting in realized and unrealized gain (loss) are disclosed separately.
Investment Transactions and Income. For financial reporting purposes, the Fund's investment holdings and NAV include trades executed through the end of the last business day of the period. The NAV per share for processing shareholder transactions is calculated as of the close of business of the New York Stock Exchange (NYSE), normally 4:00 p.m. Eastern time and includes trades executed through the end of the prior business day. Gains and losses on securities sold are determined on the basis of identified cost. Dividend income is recorded on the ex-dividend date, except for certain dividends from foreign securities where the ex-dividend date may have passed, which are recorded as soon as the Fund is informed of the ex-dividend date. Non-cash dividends included in dividend income, if any, are recorded at the fair market value of the securities received. Income and capital gain distributions from Fidelity Central Funds, if any, are recorded on the ex-dividend date. Certain distributions received by the Fund represent a return of capital or capital gain. The Fund determines the components of these distributions subsequent to the ex-dividend date, based upon receipt of tax filings or other correspondence relating to the underlying investment. These distributions are recorded as a reduction of cost of investments and/or as a realized gain. Interest income is accrued as earned and includes coupon interest and amortization of premium and accretion of discount on debt securities as applicable. Investment income is recorded net of foreign taxes withheld where recovery of such taxes is uncertain.
Expenses. Expenses directly attributable to a fund are charged to that fund. Expenses attributable to more than one fund are allocated among the respective funds on the basis of relative net assets or other appropriate methods. Expense estimates are accrued in the period to which they relate and adjustments are made when actual amounts are known.
Income Tax Information and Distributions to Shareholders. Each year, the Fund intends to qualify as a regulated investment company under Subchapter M of the Internal Revenue Code, including distributing substantially all of its taxable income and realized gains. As a result, no provision for U.S. Federal income taxes is required. As of December 31, 2017, the Fund did not have any unrecognized tax benefits in the financial statements; nor is the Fund aware of any tax positions for which it is reasonably possible that the total amounts of unrecognized tax benefits will significantly change in the next twelve months. The Fund files a U.S. federal tax return, in addition to state and local tax returns as required. The Fund's federal income tax returns are subject to examination by the Internal Revenue Service (IRS) for a period of three fiscal years after they are filed. State and local tax returns may be subject to examination for an additional fiscal year depending on the jurisdiction. Foreign taxes are provided for based on the Fund's understanding of the tax rules and rates that exist in the foreign markets in which it invests. The Fund is subject to a tax imposed on capital gains by certain countries in which it invests. An estimated deferred tax liability for net unrealized appreciation on the applicable securities is included in Other payables and accrued expenses on the Statement of Assets & Liabilities.
Distributions are declared and recorded on the ex-dividend date. Income and capital gain distributions are determined in accordance with income tax regulations, which may differ from GAAP.
Capital accounts within the financial statements are adjusted for permanent book-tax differences. These adjustments have no impact on net assets or the results of operations. Capital accounts are not adjusted for temporary book-tax differences which will reverse in a subsequent period.
Book-tax differences are primarily due to foreign currency transactions, passive foreign investment companies (PFIC), partnerships, capital loss carryforwards and losses deferred due to wash sales and excise tax regulations.
As of period end, the cost and unrealized appreciation (depreciation) in securities, and derivatives if applicable, for federal income tax purposes were as follows:
| Gross unrealized appreciation | $118,082,909 |
| Gross unrealized depreciation | (13,592,204) |
| Net unrealized appreciation (depreciation) | $104,490,705 |
| Tax Cost | $1,617,844,030 |
The tax-based components of distributable earnings as of period end were as follows:
| Capital loss carryforward | $(7,573,626) |
| Net unrealized appreciation (depreciation) on securities and other investments | $104,492,570 |
Capital loss carryforwards are only available to offset future capital gains of the Fund to the extent provided by regulations and may be limited. Under the Regulated Investment Company Modernization Act of 2010 (the Act), the Fund is permitted to carry forward capital losses incurred in taxable years beginning after December 22, 2010 for an unlimited period and such capital losses are required to be used prior to any losses that expire. The capital loss carryforward information presented below, including any applicable limitation, is estimated as of fiscal period end and is subject to adjustment.
| No expiration | |
| Short-term | $(7,573,626) |
| Total capital loss carryforward | $(7,573,626) |
The Fund indends to elect to defer to its next fiscal year $1,902 of ordinary losses recognized during the period November 1, 2017 to December 31, 2017.
The tax character of distributions paid was as follows:
| | December 31, 2017 |
| Ordinary Income | $2,026,235 |
| Total | $2,026,235 |
Restricted Securities. The Fund may invest in securities that are subject to legal or contractual restrictions on resale. These securities generally may be resold in transactions exempt from registration or to the public if the securities are registered. Disposal of these securities may involve time-consuming negotiations and expense, and prompt sale at an acceptable price may be difficult. Information regarding restricted securities is included at the end of the Fund's Schedule of Investments.
Consolidated Subsidiary. The Fund invests in certain investments through a wholly-owned subsidiary ("Subsidiary"), which may be subject to federal and state taxes upon disposition.
As of period end, the Fund held an investment of $348,600 in this Subsidiary, representing .02% of the Fund's net assets. The financial statements have been consolidated and include accounts of the Fund and each Subsidiary. Accordingly, all inter-company transactions and balances have been eliminated.
4. Purchases and Sales of Investments.
Purchases and sales of securities, other than short-term securities and in-kind transactions, aggregated $350,621,232 and $198,495,745, respectively.
5. Fees and Other Transactions with Affiliates.
Management Fee. Fidelity Management & Research Company (the investment adviser) and its affiliates provide the Fund with investment management related services for which the Fund pays a monthly management fee that is based on an annual rate of .45% of average net assets. Under the management contract, the investment adviser or an affiliate pays all other expenses of the Fund, excluding fees and expenses of the independent Trustees, and certain miscellaneous expenses such as proxy and shareholder meeting expenses.
Brokerage Commissions. The Fund placed a portion of its portfolio transactions with brokerage firms which are affiliates of the investment adviser. Brokerage commissions are included in net realized gain (loss) and change in net unrealized appreciation (depreciation) in the Statement of Operations. The commissions paid to these affiliated firms were $4,343 for the period.
Interfund Trades. The Fund may purchase from or sell securities to other Fidelity Funds under procedures adopted by the Board. The procedures have been designed to ensure these interfund trades are executed in accordance with Rule 17a-7 of the 1940 Act. Interfund trades are included within the respective purchases and sales amounts shown in the Purchases and Sales of Investments note.
Exchanges In-Kind. During the period, an affiliated entity completed an exchange in-kind with the Fund. The affiliated entity delivered investments and cash valued at $1,457,573,987 in exchange for 136,093,357 shares of the Fund. The amount of in-kind exchanges is included in share transactions in the accompanying Statement of Changes in Net Assets. The Fund recognized no gain or loss for federal income tax purposes.
6. Security Lending.
The Fund lends portfolio securities through a lending agent from time to time in order to earn additional income. For equity securities, a lending agent is used and may loan securities to certain qualified borrowers, including Fidelity Capital Markets (FCM), a broker-dealer affiliated with the Fund. On the settlement date of the loan, the Fund receives collateral (in the form of U.S. Treasury obligations, letters of credit and/or cash) against the loaned securities and maintains collateral in an amount not less than 100% of the market value of the loaned securities during the period of the loan. The market value of the loaned securities is determined at the close of business of the Fund and any additional required collateral is delivered to the Fund on the next business day. The Fund or borrower may terminate the loan at any time, and if the borrower defaults on its obligation to return the securities loaned because of insolvency or other reasons, the Fund may apply collateral received from the borrower against the obligation. The Fund may experience delays and costs in recovering the securities loaned. Any cash collateral received is invested in the Fidelity Securities Lending Cash Central Fund. The value of loaned securities and cash collateral at period end are disclosed on the Fund's Statement of Assets and Liabilities. The value of securities loaned to FCM at period end was $149,760. Security lending income represents the income earned on investing cash collateral, less rebates paid to borrowers and any lending agent fees associated with the loan, plus any premium payments received for lending certain types of securities. Security lending income is presented in the Statement of Operations as a component of income from Fidelity Central Funds. Total security lending income during the period amounted to $1,014, including $227 from securities loaned to FCM.
7. Expense Reductions.
Commissions paid to certain brokers with whom the investment adviser, or its affiliates, places trades on behalf of the Fund include an amount in addition to trade execution, which may be rebated back to the Fund to offset certain expenses. This amount totaled $6,966 for the period. In addition, through arrangements with the Fund's custodian, credits realized as a result of certain uninvested cash balances were used to reduce the Fund's expenses. During the period, these credits reduced the Fund's management fee by $171.
8. Other.
The Fund's organizational documents provide former and current trustees and officers with a limited indemnification against liabilities arising in connection with the performance of their duties to the Fund. In the normal course of business, the Fund may also enter into contracts that provide general indemnifications. The Fund's maximum exposure under these arrangements is unknown as this would be dependent on future claims that may be made against the Fund. The risk of material loss from such claims is considered remote.
Report of Independent Registered Public Accounting Firm
To the Trustees of Fidelity Contrafund and Shareholders of Fidelity Contrafund K6:
Opinion on the Financial Statements
We have audited the accompanying statement of assets and liabilities, including the schedule of investments, of Fidelity Contrafund K6 (one of the funds constituting Fidelity Contrafund, referred to hereafter as the “Fund”) as of December 31, 2017, and the related statement of operations and changes in net assets, including the related notes, and the financial highlights for the period May 25, 2017 (commencement of operations) through December 31, 2017 (collectively referred to as the “financial statements”). In our opinion, the financial statements present fairly, in all material respects, the financial position of the Fund as of December 31, 2017, and the results of its operations, changes in its net assets, and the financial highlights for the period May 25, 2017 (commencement of operations) through December 31, 2017 in conformity with accounting principles generally accepted in the United States of America.
Basis for Opinion
These financial statements are the responsibility of the Fund’s management. Our responsibility is to express an opinion on the Fund’s financial statements based on our audit. We are a public accounting firm registered with the Public Company Accounting Oversight Board (United States) (“PCAOB”) and are required to be independent with respect to the Fund in accordance with the U.S. federal securities laws and the applicable rules and regulations of the Securities and Exchange Commission and the PCAOB.
We conducted our audit of these financial statements in accordance with the standards of the PCAOB. Those standards require that we plan and perform the audit to obtain reasonable assurance about whether the financial statements are free of material misstatement, whether due to error or fraud.
Our audit included performing procedures to assess the risks of material misstatement of the financial statements, whether due to error or fraud, and performing procedures that respond to those risks. Such procedures included examining, on a test basis, evidence regarding the amounts and disclosures in the financial statements. Our audit also included evaluating the accounting principles used and significant estimates made by management, as well as evaluating the overall presentation of the financial statements. Our procedures included confirmation of securities owned as of December 31, 2017 by correspondence with the custodian and brokers; when replies were not received from brokers, we performed other auditing procedures. We believe that our audit provides a reasonable basis for our opinion.
PricewaterhouseCoopers LLP
Boston, Massachusetts
February 16, 2018
We have served as the auditor of one or more investment companies in the Fidelity group of funds since 1932.
Trustees and Officers
The Trustees, Members of the Advisory Board (if any), and officers of the trust and fund, as applicable, are listed below. The Board of Trustees governs the fund and is responsible for protecting the interests of shareholders. The Trustees are experienced executives who meet periodically throughout the year to oversee the fund's activities, review contractual arrangements with companies that provide services to the fund, oversee management of the risks associated with such activities and contractual arrangements, and review the fund's performance. Each of the Trustees oversees 190 funds.
The Trustees hold office without limit in time except that (a) any Trustee may resign; (b) any Trustee may be removed by written instrument, signed by at least two-thirds of the number of Trustees prior to such removal; (c) any Trustee who requests to be retired or who has become incapacitated by illness or injury may be retired by written instrument signed by a majority of the other Trustees; and (d) any Trustee may be removed at any special meeting of shareholders by a two-thirds vote of the outstanding voting securities of the trust. Each Trustee who is not an interested person (as defined in the 1940 Act) of the trust and the fund is referred to herein as an Independent Trustee. Each Independent Trustee shall retire not later than the last day of the calendar year in which his or her 75th birthday occurs. The Independent Trustees may waive this mandatory retirement age policy with respect to individual Trustees. Officers and Advisory Board Members hold office without limit in time, except that any officer or Advisory Board Member may resign or may be removed by a vote of a majority of the Trustees at any regular meeting or any special meeting of the Trustees. Except as indicated, each individual has held the office shown or other offices in the same company for the past five years.
The fund’s Statement of Additional Information (SAI) includes more information about the Trustees. To request a free copy, call Fidelity at1-800-835-5092.
Experience, Skills, Attributes, and Qualifications of the Trustees. The Governance and Nominating Committee has adopted a statement of policy that describes the experience, qualifications, attributes, and skills that are necessary and desirable for potential Independent Trustee candidates (Statement of Policy). The Board believes that each Trustee satisfied at the time he or she was initially elected or appointed a Trustee, and continues to satisfy, the standards contemplated by the Statement of Policy. The Governance and Nominating Committee also engages professional search firms to help identify potential Independent Trustee candidates who have the experience, qualifications, attributes, and skills consistent with the Statement of Policy. From time to time, additional criteria based on the composition and skills of the current Independent Trustees, as well as experience or skills that may be appropriate in light of future changes to board composition, business conditions, and regulatory or other developments, have also been considered by the professional search firms and the Governance and Nominating Committee. In addition, the Board takes into account the Trustees' commitment and participation in Board and committee meetings, as well as their leadership of standing and ad hoc committees throughout their tenure.
In determining that a particular Trustee was and continues to be qualified to serve as a Trustee, the Board has considered a variety of criteria, none of which, in isolation, was controlling. The Board believes that, collectively, the Trustees have balanced and diverse experience, qualifications, attributes, and skills, which allow the Board to operate effectively in governing the fund and protecting the interests of shareholders. Information about the specific experience, skills, attributes, and qualifications of each Trustee, which in each case led to the Board's conclusion that the Trustee should serve (or continue to serve) as a trustee of the fund, is provided below.
Board Structure and Oversight Function. James C. Curvey is an interested person and currently serves as Chairman. The Trustees have determined that an interested Chairman is appropriate and benefits shareholders because an interested Chairman has a personal and professional stake in the quality and continuity of services provided to the fund. Independent Trustees exercise their informed business judgment to appoint an individual of their choosing to serve as Chairman, regardless of whether the Trustee happens to be independent or a member of management. The Independent Trustees have determined that they can act independently and effectively without having an Independent Trustee serve as Chairman and that a key structural component for assuring that they are in a position to do so is for the Independent Trustees to constitute a substantial majority for the Board. The Independent Trustees also regularly meet in executive session. Ned C. Lautenbach serves as Chairman of the Independent Trustees and as such (i) acts as a liaison between the Independent Trustees and management with respect to matters important to the Independent Trustees and (ii) with management prepares agendas for Board meetings.
Fidelity® funds are overseen by different Boards of Trustees. The fund's Board oversees Fidelity's high income and certain equity funds, and other Boards oversee Fidelity's investment-grade bond, money market, asset allocation, and sector funds. The asset allocation funds may invest in Fidelity® funds overseen by the fund's Board. The use of separate Boards, each with its own committee structure, allows the Trustees of each group of Fidelity® funds to focus on the unique issues of the funds they oversee, including common research, investment, and operational issues. On occasion, the separate Boards establish joint committees to address issues of overlapping consequences for the Fidelity® funds overseen by each Board.
The Trustees operate using a system of committees to facilitate the timely and efficient consideration of all matters of importance to the Trustees, the fund, and fund shareholders and to facilitate compliance with legal and regulatory requirements and oversight of the fund's activities and associated risks. The Board, acting through its committees, has charged FMR and its affiliates with (i) identifying events or circumstances the occurrence of which could have demonstrably adverse effects on the fund's business and/or reputation; (ii) implementing processes and controls to lessen the possibility that such events or circumstances occur or to mitigate the effects of such events or circumstances if they do occur; and (iii) creating and maintaining a system designed to evaluate continuously business and market conditions in order to facilitate the identification and implementation processes described in (i) and (ii) above. Because the day-to-day operations and activities of the fund are carried out by or through FMR, its affiliates, and other service providers, the fund's exposure to risks is mitigated but not eliminated by the processes overseen by the Trustees. While each of the Board's committees has responsibility for overseeing different aspects of the fund's activities, oversight is exercised primarily through the Operations, Audit, and Compliance Committees. In addition, the Independent Trustees have worked with FMR to enhance the Board's oversight of investment and financial risks, legal and regulatory risks, technology risks, and operational risks, including the development of additional risk reporting to the Board. For example, a working group comprised of Independent Trustees and FMR has worked and continues to work to review the Fidelity® funds' valuation-related activities, reporting and risk management. Appropriate personnel, including but not limited to the fund's Chief Compliance Officer (CCO), FMR's internal auditor, the independent accountants, the fund's Treasurer and portfolio management personnel, make periodic reports to the Board's committees, as appropriate, including an annual review of Fidelity's risk management program for the Fidelity® funds. The responsibilities of each standing committee, including their oversight responsibilities, are described further under "Standing Committees of the Trustees."
Interested Trustees*:
Correspondence intended for a Trustee who is an interested person may be sent to Fidelity Investments, 245 Summer Street, Boston, Massachusetts 02210.
Name, Year of Birth; Principal Occupations and Other Relevant Experience+
James C. Curvey (1935)
Year of Election or Appointment: 2007
Trustee
Chairman of the Board of Trustees
Mr. Curvey also serves as Trustee of other Fidelity® funds. Mr. Curvey is a Director of Fidelity Research & Analysis Co. (investment adviser firm, 2009-present), and Vice Chairman (2007-present) and Director of FMR LLC (diversified financial services company). In addition, Mr. Curvey serves as an Overseer for the Boston Symphony Orchestra and a member of the board of Artis-Naples, Naples, Florida, and as a Trustee for Brewster Academy, Wolfeboro, New Hampshire. Previously, Mr. Curvey served as a Director of Fidelity Investments Money Management, Inc. (investment adviser firm, 2009-2014) and a Director of FMR and FMR Co., Inc. (investment adviser firms, 2007-2014).
Charles S. Morrison (1960)
Year of Election or Appointment: 2014
Trustee
Mr. Morrison also serves as Trustee of other funds. He serves as President of Fidelity SelectCo, LLC (investment adviser firm, 2017-present) and Fidelity Management & Research Company (FMR) (investment adviser firm, 2016-present), a Director of Fidelity Investments Money Management, Inc. (FIMM) (investment adviser firm, 2014-present), Director of Fidelity SelectCo, LLC (investment adviser firm, 2014-present), President, Asset Management (2014-present), and is an employee of Fidelity Investments. Previously, Mr. Morrison served as Vice President of Fidelity's Fixed Income and Asset Allocation Funds (2012-2014), President, Fixed Income (2011-2014), Vice President of Fidelity's Money Market Funds (2005-2009), President, Money Market Group Leader of FMR (investment adviser firm, 2009), and Senior Vice President, Money Market Group of FMR (2004-2009). Mr. Morrison also served as Vice President of Fidelity's Bond Funds (2002-2005), certain Balanced Funds (2002-2005), and certain Asset Allocation Funds (2002-2007), and as Senior Vice President (2002-2005) of Fidelity's Bond Division.
* Determined to be an “Interested Trustee” by virtue of, among other things, his or her affiliation with the trust or various entities under common control with FMR.
+ The information includes the Trustee's principal occupation during the last five years and other information relating to the experience, attributes, and skills relevant to the Trustee's qualifications to serve as a Trustee, which led to the conclusion that the Trustee should serve as a Trustee for the fund.
Independent Trustees:
Correspondence intended for an Independent Trustee may be sent to Fidelity Investments, P.O. Box 55235, Boston, Massachusetts 02205-5235.
Name, Year of Birth; Principal Occupations and Other Relevant Experience+
Dennis J. Dirks (1948)
Year of Election or Appointment: 2005
Trustee
Mr. Dirks also serves as Trustee of other Fidelity® funds. Prior to his retirement in May 2003, Mr. Dirks was Chief Operating Officer and a member of the Board of The Depository Trust & Clearing Corporation (DTCC). He also served as President, Chief Operating Officer, and Board member of The Depository Trust Company (DTC) and President and Board member of the National Securities Clearing Corporation (NSCC). In addition, Mr. Dirks served as Chief Executive Officer and Board member of the Government Securities Clearing Corporation, Chief Executive Officer and Board member of the Mortgage-Backed Securities Clearing Corporation, as a Trustee and a member of the Finance Committee of Manhattan College (2005-2008), as a Trustee and a member of the Finance Committee of AHRC of Nassau County (2006-2008), as a member of the Independent Directors Council (IDC) Governing Council (2010-2015), and as a member of the Board of Directors for The Brookville Center for Children’s Services, Inc. (2009-2017). Mr. Dirks is a member of the Finance Committee (2016-present) and Board of Directors (2017-present) of the Asolo Repertory Theatre.
Alan J. Lacy (1953)
Year of Election or Appointment: 2008
Trustee
Mr. Lacy also serves as Trustee of other Fidelity® funds. Mr. Lacy serves as a Director of Bristol-Myers Squibb Company (global pharmaceuticals, 2008-present). He is a Trustee of the California Chapter of The Nature Conservancy (2015-present) and a Director of the Center for Advanced Study in the Behavioral Sciences at Stanford University (2015-present). In addition, Mr. Lacy served as Senior Adviser (2007-2014) of Oak Hill Capital Partners, L.P. (private equity) and also served as Chief Executive Officer (2005) and Vice Chairman (2005-2006) of Sears Holdings Corporation (retail) and Chief Executive Officer and Chairman of the Board of Sears, Roebuck and Co. (retail, 2000-2005). Previously, Mr. Lacy served as Chairman (2014-2017) and a member (2010-2017) of the Board of Directors of Dave & Buster’s Entertainment, Inc. (restaurant and entertainment complexes), as Chairman (2008-2011) and a member (2006-2015) of the Board of Trustees of the National Parks Conservation Association, and as a member of the Board of Directors for The Hillman Companies, Inc. (hardware wholesalers, 2010-2014), Earth Fare, Inc. (retail grocery, 2010-2014), and The Western Union Company (global money transfer, 2006-2011).
Ned C. Lautenbach (1944)
Year of Election or Appointment: 2000
Trustee
Chairman of the Independent Trustees
Mr. Lautenbach also serves as Trustee of other Fidelity® funds. Mr. Lautenbach currently serves as Vice Chair of the Board of Governors, State University System of Florida (2013-present) and is a member of the Council on Foreign Relations (1994-present). He is also a member and has most recently served as Chairman of the Board of Directors of Artis-Naples (2012-present). Previously, Mr. Lautenbach served as a member and then Lead Director of the Board of Directors of Eaton Corporation (diversified industrial, 1997-2016). He was also a Partner and Advisory Partner at Clayton, Dubilier & Rice, LLC (private equity investment, 1998-2010), as well as a Director of Sony Corporation (2006-2007). In addition, Mr. Lautenbach also had a 30-year career with IBM (technology company) during which time he served as Senior Vice President and a member of the Corporate Executive Committee (1968-1998).
Joseph Mauriello (1944)
Year of Election or Appointment: 2008
Trustee
Mr. Mauriello also serves as Trustee of other Fidelity® funds. Prior to his retirement in January 2006, Mr. Mauriello served in numerous senior management positions including Deputy Chairman and Chief Operating Officer (2004-2005), and Vice Chairman of Financial Services (2002-2004) of KPMG LLP US (professional services, 1965-2005). Mr. Mauriello currently serves as a member of the Board of Directors of XL Group plc. (global insurance and re-insurance, 2006-present) and the Independent Directors Council (IDC) Governing Council (2015-present). Previously, Mr. Mauriello served as a Director of the Hamilton Funds of the Bank of New York (2006-2007) and of Arcadia Resources Inc. (health care services and products, 2007-2012).
Cornelia M. Small (1944)
Year of Election or Appointment: 2005
Trustee
Ms. Small also serves as Trustee of other Fidelity® funds. Ms. Small is a member of the Board of Directors (2009-present) and Chair of the Investment Committee (2010-present) of the Teagle Foundation. Ms. Small also serves on the Investment Committee of the Berkshire Taconic Community Foundation (2008-present). Previously, Ms. Small served as Chairperson (2002-2008) and a member of the Investment Committee and Chairperson (2008-2012) and a member of the Board of Trustees of Smith College. In addition, Ms. Small served as Chief Investment Officer, Director of Global Equity Investments, and a member of the Board of Directors of Scudder, Stevens & Clark and Scudder Kemper Investments.
William S. Stavropoulos (1939)
Year of Election or Appointment: 2001
Trustee
Vice Chairman of the Independent Trustees
Mr. Stavropoulos also serves as Trustee of other Fidelity® funds. Mr. Stavropoulos serves as President and Founder of the Michigan Baseball Foundation, the Great Lakes Loons (2007-present). Mr. Stavropoulos is Chairman Emeritus of the Board of Directors of The Dow Chemical Company, where he previously served in numerous senior management positions, including President, CEO (1995-2000; 2002-2004), Chairman of the Executive Committee (2000-2006), and as a member of the Board of Directors (1990-2006). Currently, Mr. Stavropoulos is Chairman of the Board of Directors of Univar Inc. (global distributor of commodity and specialty chemicals), a Director of Teradata Corporation (data warehousing and technology solutions), and a member of the Advisory Board for Metalmark Capital LLC (private equity investment, 2005-present). Mr. Stavropoulos is an operating advisor to Clayton, Dubilier & Rice, LLC (private equity investment). In addition, Mr. Stavropoulos is a member of the University of Notre Dame Advisory Council for the College of Science, a Trustee of the Rollin L. Gerstacker Foundation, and a Director of Artis-Naples in Naples, Florida. Previously, Mr. Stavropoulos served as a Director of Chemical Financial Corporation (bank holding company, 1993-2012) and Tyco International, Ltd. (multinational manufacturing and services, 2007-2012).
David M. Thomas (1949)
Year of Election or Appointment: 2008
Trustee
Mr. Thomas also serves as Trustee of other Fidelity® funds. Mr. Thomas serves as Non-Executive Chairman of the Board of Directors of Fortune Brands Home and Security (home and security products, 2011-present), as a member of the Board of Directors (2004-present) and Presiding Director (2013-present) of Interpublic Group of Companies, Inc. (marketing communication), and as a member of the Board of Trustees of the University of Florida (2013-present). Previously, Mr. Thomas served as Executive Chairman (2005-2006) and Chairman and Chief Executive Officer (2000-2005) of IMS Health, Inc. (pharmaceutical and healthcare information solutions), and a Director of Fortune Brands, Inc. (consumer products, 2000-2011).
+ The information includes the Trustee's principal occupation during the last five years and other information relating to the experience, attributes, and skills relevant to the Trustee's qualifications to serve as a Trustee, which led to the conclusion that the Trustee should serve as a Trustee for the fund.
Advisory Board Members and Officers:
Correspondence intended for an officer or Peter S. Lynch may be sent to Fidelity Investments, 245 Summer Street, Boston, Massachusetts 02210. Officers appear below in alphabetical order.
Name, Year of Birth; Principal Occupation
Peter S. Lynch (1944)
Year of Election or Appointment: 2003
Member of the Advisory Board
Mr. Lynch also serves as Member of the Advisory Board of other Fidelity® funds. Mr. Lynch is Vice Chairman and a Director of FMR (investment adviser firm) and FMR Co., Inc. (investment adviser firm). In addition, Mr. Lynch serves as a Trustee of Boston College and as the Chairman of the Inner-City Scholarship Fund. Previously, Mr. Lynch served on the Special Olympics International Board of Directors (1997-2006).
Elizabeth Paige Baumann (1968)
Year of Election or Appointment: 2017
Anti-Money Laundering (AML) Officer
Ms. Baumann also serves as AML Officer of other funds. She is Chief AML Officer (2012-present) and Senior Vice President (2014-present) of FMR LLC (diversified financial services company) and is an employee of Fidelity Investments. Previously, Ms. Baumann served as AML Officer of the funds (2012-2016), and Vice President (2007-2014) and Deputy Anti-Money Laundering Officer (2007-2012) of FMR LLC.
Marc R. Bryant (1966)
Year of Election or Appointment: 2015
Secretary and Chief Legal Officer (CLO)
Mr. Bryant also serves as Secretary and CLO of other funds. Mr. Bryant serves as CLO, Secretary, and Senior Vice President of Fidelity Management & Research Company (investment adviser firm, 2015-present) and FMR Co., Inc. (investment adviser firm, 2015-present); Secretary of Fidelity SelectCo, LLC (investment adviser firm, 2015-present) and Fidelity Investments Money Management, Inc. (investment adviser firm, 2015-present); and CLO of Fidelity Management & Research (Hong Kong) Limited and FMR Investment Management (UK) Limited (investment adviser firms, 2015-present) and Fidelity Management & Research (Japan) Limited (investment adviser firm, 2016-present). He is Senior Vice President and Deputy General Counsel of FMR LLC (diversified financial services company). Previously, Mr. Bryant served as Secretary and CLO of Fidelity Rutland Square Trust II (2010-2014) and Assistant Secretary of Fidelity's Fixed Income and Asset Allocation Funds (2013-2015). Prior to joining Fidelity Investments, Mr. Bryant served as a Senior Vice President and the Head of Global Retail Legal for AllianceBernstein L.P. (2006-2010), and as the General Counsel for ProFund Advisors LLC (2001-2006).
William C. Coffey (1969)
Year of Election or Appointment: 2009
Assistant Secretary
Mr. Coffey also serves as Assistant Secretary of other funds. He is Senior Vice President and Deputy General Counsel of FMR LLC (diversified financial services company, 2010-present), and is an employee of Fidelity Investments. Previously, Mr. Coffey served as Vice President and Associate General Counsel of FMR LLC (2005-2009).
Jonathan Davis (1968)
Year of Election or Appointment: 2010
Assistant Treasurer
Mr. Davis also serves as Assistant Treasurer of other funds. Mr. Davis serves as Assistant Treasurer of FMR Capital, Inc. (2017-present) and is an employee of Fidelity Investments. Previously, Mr. Davis served as Vice President and Associate General Counsel of FMR LLC (diversified financial services company, 2003-2010).
Adrien E. Deberghes (1967)
Year of Election or Appointment: 2016
Assistant Treasurer
Mr. Deberghes also serves as an officer of other funds. He serves as Assistant Treasurer of FMR Capital, Inc. (2017-present), Executive Vice President of Fidelity Investments Money Management, Inc. (FIMM) (investment adviser firm, 2016-present), and is an employee of Fidelity Investments (2008-present). Prior to joining Fidelity Investments, Mr. Deberghes was Senior Vice President of Mutual Fund Administration at State Street Corporation (2007-2008), Senior Director of Mutual Fund Administration at Investors Bank & Trust (2005-2007), and Director of Finance for Dunkin' Brands (2000-2005). Previously, Mr. Deberghes served in other fund officer roles.
Stephanie J. Dorsey (1969)
Year of Election or Appointment: 2010
Assistant Treasurer
Ms. Dorsey also serves as an officer of other funds. Ms. Dorsey serves as Assistant Treasurer of FMR Capital, Inc. (2017-present), is an employee of Fidelity Investments (2008-present), and has served in other fund officer roles. Prior to joining Fidelity Investments, Ms. Dorsey served as Treasurer (2004-2008) of the JPMorgan Mutual Funds and Vice President (2004-2008) of JPMorgan Chase Bank.
Howard J. Galligan III (1966)
Year of Election or Appointment: 2014
Chief Financial Officer
Mr. Galligan also serves as Chief Financial Officer of other funds. Mr. Galligan serves as President of Fidelity Pricing and Cash Management Services (FPCMS) (2014-present) and as a Director of Strategic Advisers, Inc. (investment adviser firm, 2008-present). Previously, Mr. Galligan served as Chief Administrative Officer of Asset Management (2011-2014) and Chief Operating Officer and Senior Vice President of Investment Support for Strategic Advisers, Inc. (2003-2011).
Brian B. Hogan (1964)
Year of Election or Appointment: 2009
Vice President
Mr. Hogan also serves as Trustee or Vice President of other funds. Mr. Hogan serves as a Director of FMR Investment Management (UK) Limited (investment adviser firm, 2015-present) and Fidelity SelectCo, LLC (investment adviser firm, 2014-present) and President of the Equity Division of FMR (investment adviser firm, 2009-present). Previously, Mr. Hogan served as Senior Vice President, Equity Research of FMR (2006-2009) and as a portfolio manager. Mr. Brian B. Hogan is not related to Mr. Colm A. Hogan.
Colm A. Hogan (1973)
Year of Election or Appointment: 2016
Deputy Treasurer
Mr. Hogan also serves as an officer of other funds. Mr. Hogan serves as Assistant Treasurer of FMR Capital, Inc. (2017-present) and is an employee of Fidelity Investments (2005-present). Mr. Colm A. Hogan is not related to Mr. Brian B. Hogan.
Chris Maher (1972)
Year of Election or Appointment: 2013
Assistant Treasurer
Mr. Maher serves as Assistant Treasurer of other funds. Mr. Maher is Vice President of Valuation Oversight, serves as Assistant Treasurer of FMR Capital, Inc. (2017-present), and is an employee of Fidelity Investments. Previously, Mr. Maher served as Vice President of Asset Management Compliance (2013), Vice President of the Program Management Group of FMR (investment adviser firm, 2010-2013), and Vice President of Valuation Oversight (2008-2010).
Rieco E. Mello (1969)
Year of Election or Appointment: 2017
Assistant Treasurer
Mr. Mello also serves as Assistant Treasurer of other funds. Mr. Mello serves as Assistant Treasurer of FMR Capital, Inc. (2017-present) and is an employee of Fidelity Investments (1995-present).
Melissa M. Reilly (1971)
Year of Election or Appointment: 2014
Vice President of certain Equity Funds
Ms. Reilly also serves as Vice President of other funds. Ms. Reilly is an employee of Fidelity Investments (2004-present).
Kenneth B. Robins (1969)
Year of Election or Appointment: 2016
Chief Compliance Officer
Mr. Robins also serves as an officer of other funds. Mr. Robins serves as Compliance Officer of Fidelity Management & Research Company and FMR Co., Inc. (investment adviser firms, 2016-present) and is an employee of Fidelity Investments (2004-present). Previously, Mr. Robins served as Executive Vice President of Fidelity Investments Money Management, Inc. (investment adviser firm, 2013-2016) and served in other fund officer roles.
Stacie M. Smith (1974)
Year of Election or Appointment: 2016
President and Treasurer
Ms. Smith also serves as an officer of other funds. Ms. Smith serves as Assistant Treasurer of FMR Capital, Inc. (2017-present), is an employee of Fidelity Investments (2009-present), and has served in other fund officer roles. Prior to joining Fidelity Investments, Ms. Smith served as Senior Audit Manager of Ernst & Young LLP (accounting firm, 1996-2009). Previously, Ms. Smith served as Deputy Treasurer of certain Fidelity® funds (2013-2016).
Marc L. Spector (1972)
Year of Election or Appointment: 2016
Assistant Treasurer
Mr. Spector also serves as an officer of other funds. Mr. Spector serves as Assistant Treasurer of FMR Capital, Inc. (2017-present) and is an employee of Fidelity Investments (2016-present). Prior to joining Fidelity Investments, Mr. Spector served as Director at the Siegfried Group (accounting firm, 2013-2016), and prior to Siegfried Group as audit senior manager at Deloitte & Touche (accounting firm, 2005-2013).
Renee Stagnone (1975)
Year of Election or Appointment: 2016
Assistant Treasurer
Ms. Stagnone also serves as an officer of other funds. Ms. Stagnone serves as Assistant Treasurer of FMR Capital, Inc. (2017-present) and is an employee of Fidelity Investments (1997-present). Previously, Ms. Stagnone served as Deputy Treasurer of certain Fidelity® funds (2013-2016).
Shareholder Expense Example
As a shareholder of the Fund, you incur two types of costs: (1) transaction costs, and (2) ongoing costs, including management fees and other Fund expenses. This Example is intended to help you understand your ongoing costs (in dollars) of investing in the Fund and to compare these costs with the ongoing costs of investing in other mutual funds.
The Example is based on an investment of $1,000 invested at the beginning of the period and held for the entire period (July 1, 2017 to December 31, 2017).
Actual Expenses
The first line of the accompanying table provides information about actual account values and actual expenses. You may use the information in this line, together with the amount you invested, to estimate the expenses that you paid over the period. Simply divide your account value by $1,000.00 (for example, an $8,600 account value divided by $1,000.00 = 8.6), then multiply the result by the number in the first line under the heading entitled "Expenses Paid During Period" to estimate the expenses you paid on your account during this period. In addition, the Fund, as a shareholder in the underlying Fidelity Central Funds, will indirectly bear its pro-rata share of the fees and expenses incurred by the underlying Fidelity Central Funds. These fees and expenses are not included in the Fund's annualized expense ratio used to calculate the expense estimate in the table below.
Hypothetical Example for Comparison Purposes
The second line of the accompanying table provides information about hypothetical account values and hypothetical expenses based on the Fund's actual expense ratio and an assumed rate of return of 5% per year before expenses, which is not the Fund's actual return. The hypothetical account values and expenses may not be used to estimate the actual ending account balance or expenses you paid for the period. You may use this information to compare the ongoing costs of investing in the Fund and other funds. To do so, compare this 5% hypothetical example with the 5% hypothetical examples that appear in the shareholder reports of the other funds. In addition, the Fund, as a shareholder in the underlying Fidelity Central Funds, will indirectly bear its pro-rata share of the fees and expenses incurred by the underlying Fidelity Central Funds. These fees and expenses are not included in the Fund's annualized expense ratio used to calculate the expense estimate in the table below.
Please note that the expenses shown in the table are meant to highlight your ongoing costs only and do not reflect any transaction costs. Therefore, the second line of the table is useful in comparing ongoing costs only, and will not help you determine the relative total costs of owning different funds.
| | Annualized Expense Ratio-A | Beginning
Account Value
July 1, 2017 | Ending
Account Value
December 31, 2017 | Expenses Paid
During Period-B
July 1, 2017
to December 31, 2017 |
| Actual | .45% | $1,000.00 | $1,136.60 | $2.42 |
| Hypothetical-C | | $1,000.00 | $1,022.94 | $2.29 |
A Annualized expense ratio reflects expenses net of applicable fee waivers.
B Expenses are equal to the Fund's annualized expense ratio, multiplied by the average account value over the period, multiplied by 184/365 (to reflect the one-half year period).
C 5% return per year before expenses
Distributions (Unaudited)
The fund designates 100% of the dividends distributed during the fiscal year as qualifying for the dividends–received deduction for corporate shareholders.
The fund designates 100% of the dividends distributed during the fiscal year as amounts which may be taken into account as a dividend for the purposes of the maximum rate under section 1(h)(11) of the Internal Revenue Code.
The fund will notify shareholders in January 2018 of amounts for use in preparing 2017 income tax returns.
Corporate Headquarters
245 Summer St.
Boston, MA 02210
www.fidelity.com
CONK6-ANN-0218
1.9883979.100
Fidelity Flex℠ Funds Fidelity Flex℠ Opportunistic Insights Fund
Annual Report December 31, 2017 |
|
Contents
To view a fund's proxy voting guidelines and proxy voting record for the 12-month period ended June 30, visit http://www.fidelity.com/proxyvotingresults or visit the Securities and Exchange Commission's (SEC) web site at http://www.sec.gov.
You may also call 1-800-835-5092 to request a free copy of the proxy voting guidelines.
Standard & Poor's, S&P and S&P 500 are registered service marks of The McGraw-Hill Companies, Inc. and have been licensed for use by Fidelity Distributors Corporation.
Other third-party marks appearing herein are the property of their respective owners.
All other marks appearing herein are registered or unregistered trademarks or service marks of FMR LLC or an affiliated company. © 2018 FMR LLC. All rights reserved.
This report and the financial statements contained herein are submitted for the general information of the shareholders of the Fund. This report is not authorized for distribution to prospective investors in the Fund unless preceded or accompanied by an effective prospectus.
A fund files its complete schedule of portfolio holdings with the SEC for the first and third quarters of each fiscal year on Form N-Q. Forms N-Q are available on the SEC’s web site at http://www.sec.gov. A fund's Forms N-Q may be reviewed and copied at the SEC’s Public Reference Room in Washington, DC. Information regarding the operation of the SEC's Public Reference Room may be obtained by calling 1-800-SEC-0330.
For a complete list of a fund's portfolio holdings, view the most recent holdings listing, semiannual report, or annual report on Fidelity's web site at http://www.fidelity.com, http://www.institutional.fidelity.com, or http://www.401k.com, as applicable.
NOT FDIC INSURED •MAY LOSE VALUE •NO BANK GUARANTEE
Neither the Fund nor Fidelity Distributors Corporation is a bank.
Performance: The Bottom Line
Average annual total return reflects the change in the value of an investment, assuming reinvestment of distributions from dividend income and capital gains (the profits earned upon the sale of securities that have grown in value, if any) and assuming a constant rate of performance each year. The hypothetical investment and the average annual total returns do not reflect the deduction of taxes that a shareholder would pay on fund distributions or the redemption of fund shares. During periods of reimbursement by Fidelity, a fund’s total return will be greater than it would be had the reimbursement not occurred. How a fund did yesterday is no guarantee of how it will do tomorrow.
Average annual total returns for Fidelity Flex℠ Opportunistic Insights Fund will be reported once the fund is a year old.
$10,000 Over Life of Fund
Let's say hypothetically that $10,000 was invested in Fidelity Flex℠ Opportunistic Insights Fund on March 8, 2017, when the fund started.
The chart shows how the value of your investment would have changed, and also shows how the Russell 3000® Index performed over the same period.
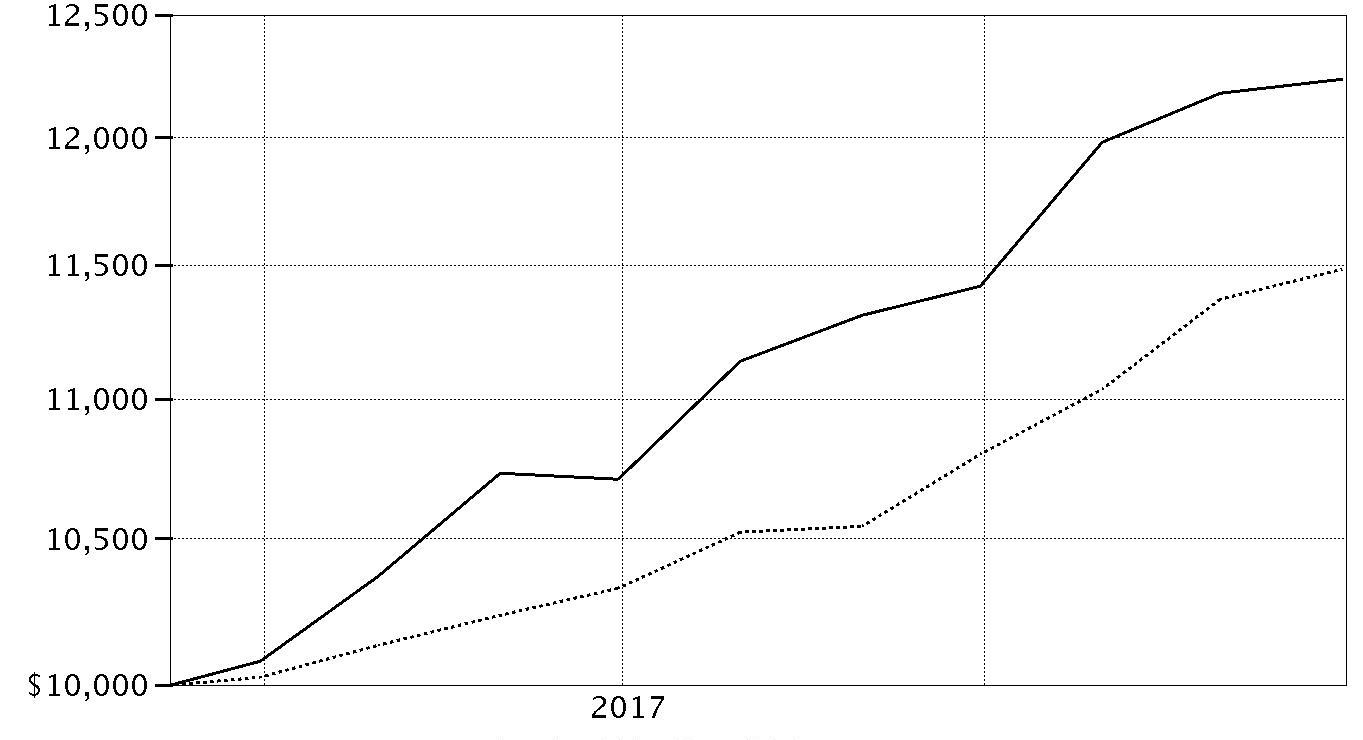
| Period Ending Values |
| $12,237 | Fidelity Flex℠ Opportunistic Insights Fund |
| $11,484 | Russell 3000® Index |
Management's Discussion of Fund Performance
Market Recap: U.S. equities gained 21.83% in 2017, as the S&P 500
® index rose steadily and closed the year just shy of an all-time high after a particularly strong three-month finish. Early on, equities rallied on optimism for President Trump’s pro-business agenda but leveled off in March amid fading optimism and stalled efforts by Congress to repeal and replace the Affordable Care Act. Upward momentum soon returned and continued through year-end with consumer sentiment and other market indicators staying positive. The lone exception was a brief cooldown in August, when geopolitical tension escalated and uncertainty grew regarding the future of health care, tax reform and the debt ceiling. Sector-wise, information technology fared best by a wide margin, rising 39% amid strong earnings growth from several major index constituents. A 24% gain in materials was spurred by increased demand, especially from China. Consumer discretionary gained 23%, despite many brick-and-mortar retailers suffering from online competition, and financials edged the broader market on an uptick in bond yields. Conversely, the defensive energy and telecom services sectors returned about -1% each. Rising interest rates held back real estate (+11%), while consumer staples (+13%) and utilities (+12%) struggled due to investors’ general preference for risk assets.
Comments from Portfolio Manager William Danoff: Since its inception on March 8, 2017, through December 31, 2017, the fund gained 22.37%, well ahead of the 14.84% advance of the benchmark Russell 3000
® Index. A more business-friendly administration in the White House, an extremely low interest rate environment worldwide and synchronous global economic expansion propelled the stock market higher. The fund performed very well against this backdrop, with active positioning adding value in nearly all market sectors. Our outperformance of the benchmark primarily was driven by a sizable commitment – about 43% of assets, on average – to the market-leading information technology sector. Here, notable individual contributors included social-media firm Facebook and Google parent Alphabet. Other winners from tech were online payment processor PayPal Holdings and publishing software developer Adobe Systems. Our sizable stake in Amazon.com also meaningfully aided results, as did avoiding industrial conglomerate General Electric. Conversely, our largest detractor was an overweighting in Henry Schein, a distributor of health care products. Our investments here returned -19% for the period. It also hurt to not own enough of a few strong-performing benchmark names. These included pharmaceutical firm AbbVie and aircraft manufacturer Boeing.
The views expressed above reflect those of the portfolio manager(s) only through the end of the period as stated on the cover of this report and do not necessarily represent the views of Fidelity or any other person in the Fidelity organization. Any such views are subject to change at any time based upon market or other conditions and Fidelity disclaims any responsibility to update such views. These views may not be relied on as investment advice and, because investment decisions for a Fidelity fund are based on numerous factors, may not be relied on as an indication of trading intent on behalf of any Fidelity fund.
Investment Summary (Unaudited)
Top Ten Stocks as of December 31, 2017
| | % of fund's net assets |
| Facebook, Inc. Class A | 8.3 |
| Amazon.com, Inc. | 5.0 |
| Berkshire Hathaway, Inc. Class A | 4.1 |
| Bank of America Corp. | 3.5 |
| Salesforce.com, Inc. | 3.1 |
| JPMorgan Chase & Co. | 3.0 |
| Alphabet, Inc. Class A | 2.7 |
| Alphabet, Inc. Class C | 2.5 |
| Citigroup, Inc. | 2.4 |
| UnitedHealth Group, Inc. | 2.2 |
| | 36.8 |
Top Five Market Sectors as of December 31, 2017
| | % of fund's net assets |
| Information Technology | 40.3 |
| Financials | 20.1 |
| Consumer Discretionary | 15.1 |
| Health Care | 8.6 |
| Industrials | 6.7 |
Asset Allocation (% of fund's net assets)
| As of December 31, 2017* |
| | Stocks | 97.8% |
| | Bonds | 0.1% |
| | Convertible Securities | 0.1% |
| | Short-Term Investments and Net Other Assets (Liabilities) | 2.0% |

* Foreign investments - 7.8%
Investments December 31, 2017
Showing Percentage of Net Assets
| Common Stocks - 97.8% | | | |
| | | Shares | Value |
| CONSUMER DISCRETIONARY - 15.1% | | | |
| Auto Components - 0.0% | | | |
| Aptiv PLC | | 55 | $4,666 |
| Delphi Technologies PLC (a) | | 18 | 944 |
| | | | 5,610 |
| Automobiles - 1.3% | | | |
| BYD Co. Ltd. (H Shares) | | 1,080 | 9,383 |
| General Motors Co. | | 63 | 2,582 |
| Mahindra & Mahindra Ltd. | | 1,198 | 14,095 |
| Maruti Suzuki India Ltd. | | 209 | 31,853 |
| Tesla, Inc. (a) | | 387 | 120,492 |
| Toyota Motor Corp. | | 100 | 6,373 |
| | | | 184,778 |
| Diversified Consumer Services - 0.2% | | | |
| Chegg, Inc. (a) | | 158 | 2,579 |
| Weight Watchers International, Inc. (a) | | 681 | 30,155 |
| | | | 32,734 |
| Hotels, Restaurants & Leisure - 2.0% | | | |
| Churchill Downs, Inc. | | 4 | 931 |
| Hilton Worldwide Holdings, Inc. | | 460 | 36,736 |
| Las Vegas Sands Corp. | | 42 | 2,919 |
| Marriott International, Inc. Class A | | 1,083 | 146,996 |
| McDonald's Corp. | | 508 | 87,437 |
| U.S. Foods Holding Corp. (a) | | 200 | 6,386 |
| Vail Resorts, Inc. | | 23 | 4,887 |
| | | | 286,292 |
| Household Durables - 0.4% | | | |
| D.R. Horton, Inc. | | 61 | 3,115 |
| Lennar Corp. Class A | | 249 | 15,747 |
| Mohawk Industries, Inc. (a) | | 165 | 45,524 |
| | | | 64,386 |
| Internet & Direct Marketing Retail - 7.7% | | | |
| Amazon.com, Inc. (a) | | 620 | 725,071 |
| ASOS PLC (a) | | 24 | 2,176 |
| Netflix, Inc. (a) | | 1,204 | 231,120 |
| Priceline Group, Inc. (a) | | 77 | 133,806 |
| Start Today Co. Ltd. | | 354 | 10,761 |
| Takeaway.com Holding BV (a)(b) | | 72 | 4,395 |
| Zalando SE (a) | | 93 | 4,923 |
| | | | 1,112,252 |
| Leisure Products - 0.1% | | | |
| Mattel, Inc. | | 500 | 7,690 |
| Polaris Industries, Inc. | | 22 | 2,728 |
| | | | 10,418 |
| Media - 1.4% | | | |
| Charter Communications, Inc. Class A (a) | | 130 | 43,675 |
| Liberty Broadband Corp.: | | | |
| Class A (a) | | 16 | 1,361 |
| Class C (a) | | 129 | 10,986 |
| Liberty Global PLC Class A (a) | | 267 | 9,569 |
| Liberty Media Corp.: | | | |
| Liberty Formula One Group Series C (a) | | 1,244 | 42,495 |
| Liberty SiriusXM Series A (a) | | 14 | 555 |
| Liberty SiriusXM Series C (a) | | 1,599 | 63,416 |
| Live Nation Entertainment, Inc. (a) | | 70 | 2,980 |
| Sirius XM Holdings, Inc. | | 3,015 | 16,160 |
| The Walt Disney Co. | | 40 | 4,300 |
| | | | 195,497 |
| Multiline Retail - 0.5% | | | |
| B&M European Value Retail S.A. | | 1,191 | 6,812 |
| Dollar Tree, Inc. (a) | | 100 | 10,731 |
| Ollie's Bargain Outlet Holdings, Inc. (a) | | 1,099 | 58,522 |
| | | | 76,065 |
| Specialty Retail - 1.1% | | | |
| Five Below, Inc. (a) | | 47 | 3,117 |
| Home Depot, Inc. | | 716 | 135,703 |
| TJX Companies, Inc. | | 271 | 20,721 |
| | | | 159,541 |
| Textiles, Apparel & Luxury Goods - 0.4% | | | |
| adidas AG | | 227 | 45,526 |
| Kering SA | | 13 | 6,130 |
| LVMH Moet Hennessy - Louis Vuitton SA | | 23 | 6,751 |
| | | | 58,407 |
|
| TOTAL CONSUMER DISCRETIONARY | | | 2,185,980 |
|
| CONSUMER STAPLES - 2.1% | | | |
| Beverages - 0.3% | | | |
| Constellation Brands, Inc. Class A (sub. vtg.) | | 84 | 19,200 |
| Kweichow Moutai Co. Ltd. (A Shares) | | 100 | 10,720 |
| Monster Beverage Corp. (a) | | 234 | 14,810 |
| The Coca-Cola Co. | | 115 | 5,276 |
| | | | 50,006 |
| Food & Staples Retailing - 0.6% | | | |
| Costco Wholesale Corp. | | 249 | 46,344 |
| Performance Food Group Co. (a) | | 321 | 10,625 |
| Wal-Mart Stores, Inc. | | 381 | 37,624 |
| | | | 94,593 |
| Food Products - 0.0% | | | |
| The Simply Good Foods Co. | | 79 | 1,127 |
| Household Products - 0.1% | | | |
| Colgate-Palmolive Co. | | 137 | 10,337 |
| Personal Products - 1.1% | | | |
| Estee Lauder Companies, Inc. Class A | | 1,208 | 153,706 |
|
| TOTAL CONSUMER STAPLES | | | 309,769 |
|
| ENERGY - 2.0% | | | |
| Oil, Gas & Consumable Fuels - 2.0% | | | |
| Birchcliff Energy Ltd. | | 2,160 | 7,561 |
| Cabot Oil & Gas Corp. | | 200 | 5,720 |
| Canadian Natural Resources Ltd. | | 790 | 28,231 |
| Cenovus Energy, Inc. | | 401 | 3,662 |
| Centennial Resource Development, Inc. Class A (a) | | 2,564 | 50,767 |
| Concho Resources, Inc. (a) | | 63 | 9,464 |
| Continental Resources, Inc. (a) | | 476 | 25,214 |
| Diamondback Energy, Inc. (a) | | 123 | 15,529 |
| Encana Corp. | | 100 | 1,334 |
| EOG Resources, Inc. | | 387 | 41,761 |
| Phillips 66 Co. | | 290 | 29,334 |
| PrairieSky Royalty Ltd. | | 353 | 9,003 |
| Reliance Industries Ltd. | | 3,069 | 44,278 |
| Tamarack Valley Energy Ltd. (a) | | 1,776 | 4,041 |
| Valero Energy Corp. | | 200 | 18,382 |
| | | | 294,281 |
| FINANCIALS - 20.1% | | | |
| Banks - 11.6% | | | |
| Bank of America Corp. | | 17,341 | 511,906 |
| Citigroup, Inc. | | 4,750 | 353,448 |
| HDFC Bank Ltd. sponsored ADR | | 963 | 97,908 |
| JPMorgan Chase & Co. | | 4,028 | 430,754 |
| Kotak Mahindra Bank Ltd. (a) | | 1,544 | 24,432 |
| M&T Bank Corp. | | 255 | 43,602 |
| Metro Bank PLC (a) | | 2 | 97 |
| PNC Financial Services Group, Inc. | | 380 | 54,830 |
| Royal Bank of Canada | | 83 | 6,778 |
| The Toronto-Dominion Bank | | 191 | 11,191 |
| U.S. Bancorp | | 697 | 37,345 |
| Wells Fargo & Co. | | 1,785 | 108,296 |
| | | | 1,680,587 |
| Capital Markets - 3.4% | | | |
| Ashmore Group PLC | | 300 | 1,641 |
| Bank of New York Mellon Corp. | | 496 | 26,715 |
| BlackRock, Inc. Class A | | 86 | 44,179 |
| Brookfield Asset Management, Inc. Class A | | 200 | 8,706 |
| CBOE Holdings, Inc. | | 98 | 12,210 |
| Charles Schwab Corp. | | 1,364 | 70,069 |
| CME Group, Inc. | | 120 | 17,526 |
| Goldman Sachs Group, Inc. | | 227 | 57,831 |
| IntercontinentalExchange, Inc. | | 256 | 18,063 |
| Morgan Stanley | | 3,488 | 183,015 |
| MSCI, Inc. | | 187 | 23,663 |
| S&P Global, Inc. | | 174 | 29,476 |
| St. James's Place Capital PLC | | 180 | 2,980 |
| | | | 496,074 |
| Consumer Finance - 0.1% | | | |
| Synchrony Financial | | 601 | 23,205 |
| Diversified Financial Services - 4.1% | | | |
| Berkshire Hathaway, Inc. Class A (a) | | 2 | 595,200 |
| Insurance - 0.9% | | | |
| Admiral Group PLC | | 436 | 11,785 |
| Chubb Ltd. | | 589 | 86,071 |
| Fairfax Financial Holdings Ltd. (sub. vtg.) | | 24 | 12,780 |
| Marsh & McLennan Companies, Inc. | | 175 | 14,243 |
| | | | 124,879 |
|
| TOTAL FINANCIALS | | | 2,919,945 |
|
| HEALTH CARE - 8.5% | | | |
| Biotechnology - 1.9% | | | |
| AbbVie, Inc. | | 307 | 29,690 |
| Aduro Biotech, Inc. (a) | | 12 | 90 |
| Amgen, Inc. | | 56 | 9,738 |
| AnaptysBio, Inc. | | 60 | 6,043 |
| Biogen, Inc. (a) | | 37 | 11,787 |
| Celgene Corp. (a) | | 267 | 27,864 |
| Exact Sciences Corp. (a) | | 18 | 946 |
| FibroGen, Inc. (a) | | 249 | 11,803 |
| Genmab A/S (a) | | 99 | 16,418 |
| Gilead Sciences, Inc. | | 610 | 43,700 |
| Insmed, Inc. (a) | | 100 | 3,118 |
| Intrexon Corp. | | 204 | 2,350 |
| Juno Therapeutics, Inc. (a) | | 51 | 2,331 |
| Neurocrine Biosciences, Inc. (a) | | 173 | 13,423 |
| OvaScience, Inc. (a) | | 1,500 | 2,100 |
| Portola Pharmaceuticals, Inc. (a) | | 100 | 4,868 |
| Regeneron Pharmaceuticals, Inc. (a) | | 61 | 22,934 |
| Vertex Pharmaceuticals, Inc. (a) | | 449 | 67,287 |
| | | | 276,490 |
| Health Care Equipment & Supplies - 1.8% | | | |
| Baxter International, Inc. | | 832 | 53,780 |
| Becton, Dickinson & Co. | | 124 | 26,543 |
| Boston Scientific Corp. (a) | | 3,925 | 97,301 |
| Danaher Corp. | | 229 | 21,256 |
| Edwards Lifesciences Corp. (a) | | 38 | 4,283 |
| Intuitive Surgical, Inc. (a) | | 148 | 54,011 |
| Penumbra, Inc. (a) | | 52 | 4,893 |
| ResMed, Inc. | | 58 | 4,912 |
| | | | 266,979 |
| Health Care Providers & Services - 3.0% | | | |
| Aetna, Inc. | | 133 | 23,992 |
| Cigna Corp. | | 27 | 5,483 |
| HealthEquity, Inc. (a) | | 206 | 9,612 |
| Henry Schein, Inc. (a) | | 570 | 39,832 |
| Humana, Inc. | | 98 | 24,311 |
| National Vision Holdings, Inc. | | 100 | 4,061 |
| OptiNose, Inc. | | 100 | 1,890 |
| UnitedHealth Group, Inc. | | 1,470 | 324,076 |
| | | | 433,257 |
| Health Care Technology - 0.1% | | | |
| Veeva Systems, Inc. Class A (a) | | 276 | 15,257 |
| Life Sciences Tools & Services - 1.1% | | | |
| Agilent Technologies, Inc. | | 233 | 15,604 |
| Eurofins Scientific SA | | 9 | 5,481 |
| Mettler-Toledo International, Inc. (a) | | 176 | 109,036 |
| PRA Health Sciences, Inc. (a) | | 94 | 8,561 |
| Thermo Fisher Scientific, Inc. | | 86 | 16,330 |
| Waters Corp. (a) | | 27 | 5,216 |
| | | | 160,228 |
| Pharmaceuticals - 0.6% | | | |
| AstraZeneca PLC sponsored ADR | | 100 | 3,470 |
| Bristol-Myers Squibb Co. | | 497 | 30,456 |
| Johnson & Johnson | | 82 | 11,457 |
| Nektar Therapeutics (a) | | 443 | 26,456 |
| Teva Pharmaceutical Industries Ltd. sponsored ADR | | 600 | 11,370 |
| | | | 83,209 |
|
| TOTAL HEALTH CARE | | | 1,235,420 |
|
| INDUSTRIALS - 6.7% | | | |
| Aerospace & Defense - 1.0% | | | |
| General Dynamics Corp. | | 122 | 24,821 |
| Northrop Grumman Corp. | | 170 | 52,175 |
| Raytheon Co. | | 61 | 11,459 |
| The Boeing Co. | | 179 | 52,789 |
| | | | 141,244 |
| Air Freight & Logistics - 0.5% | | | |
| FedEx Corp. | | 203 | 50,657 |
| XPO Logistics, Inc. (a) | | 294 | 26,927 |
| | | | 77,584 |
| Airlines - 0.8% | | | |
| Ryanair Holdings PLC sponsored ADR (a) | | 579 | 60,326 |
| Southwest Airlines Co. | | 838 | 54,847 |
| | | | 115,173 |
| Building Products - 1.0% | | | |
| A.O. Smith Corp. | | 120 | 7,354 |
| Fortune Brands Home & Security, Inc. | | 258 | 17,658 |
| Jeld-Wen Holding, Inc. | | 511 | 20,118 |
| Masco Corp. | | 1,612 | 70,831 |
| Toto Ltd. | | 403 | 23,785 |
| | | | 139,746 |
| Commercial Services & Supplies - 0.2% | | | |
| Cintas Corp. | | 136 | 21,193 |
| Construction & Engineering - 0.0% | | | |
| Jacobs Engineering Group, Inc. | | 100 | 6,596 |
| Electrical Equipment - 0.5% | | | |
| AMETEK, Inc. | | 64 | 4,638 |
| Fortive Corp. | | 867 | 62,727 |
| | | | 67,365 |
| Industrial Conglomerates - 0.5% | | | |
| 3M Co. | | 310 | 72,965 |
| ITT, Inc. | | 100 | 5,337 |
| | | | 78,302 |
| Machinery - 1.4% | | | |
| Caterpillar, Inc. | | 162 | 25,528 |
| Deere & Co. | | 381 | 59,630 |
| Gardner Denver Holdings, Inc. | | 289 | 9,806 |
| Illinois Tool Works, Inc. | | 233 | 38,876 |
| Ingersoll-Rand PLC | | 145 | 12,933 |
| Oshkosh Corp. | | 9 | 818 |
| PACCAR, Inc. | | 225 | 15,993 |
| Parker Hannifin Corp. | | 150 | 29,937 |
| Rational AG | | 5 | 3,223 |
| Xylem, Inc. | | 46 | 3,137 |
| | | | 199,881 |
| Professional Services - 0.4% | | | |
| Equifax, Inc. | | 134 | 15,801 |
| Manpower, Inc. | | 18 | 2,270 |
| Recruit Holdings Co. Ltd. | | 272 | 6,759 |
| RELX PLC | | 28 | 657 |
| TransUnion Holding Co., Inc. (a) | | 593 | 32,591 |
| | | | 58,078 |
| Road & Rail - 0.4% | | | |
| CSX Corp. | | 855 | 47,034 |
| Union Pacific Corp. | | 100 | 13,410 |
| | | | 60,444 |
| Trading Companies & Distributors - 0.0% | | | |
| Fastenal Co. | | 100 | 5,469 |
|
| TOTAL INDUSTRIALS | | | 971,075 |
|
| INFORMATION TECHNOLOGY - 40.2% | | | |
| Communications Equipment - 0.4% | | | |
| Arista Networks, Inc. (a) | | 277 | 65,256 |
| Electronic Equipment & Components - 2.1% | | | |
| Amphenol Corp. Class A | | 3,011 | 264,366 |
| CDW Corp. | | 310 | 21,542 |
| Corning, Inc. | | 200 | 6,398 |
| Dolby Laboratories, Inc. Class A | | 106 | 6,572 |
| | | | 298,878 |
| Internet Software & Services - 15.0% | | | |
| Alibaba Group Holding Ltd. sponsored ADR (a) | | 344 | 59,316 |
| Alphabet, Inc.: | | | |
| Class A (a) | | 371 | 390,811 |
| Class C (a) | | 349 | 365,194 |
| CarGurus, Inc. Class A | | 100 | 2,998 |
| Cloudera, Inc. | | 100 | 1,652 |
| eBay, Inc. (a) | | 1,019 | 38,457 |
| Facebook, Inc. Class A (a) | | 6,773 | 1,195,156 |
| LogMeIn, Inc. | | 247 | 28,282 |
| New Relic, Inc. (a) | | 78 | 4,506 |
| Nutanix, Inc. Class A (a) | | 354 | 12,489 |
| Okta, Inc. | | 50 | 1,281 |
| Rightmove PLC | | 26 | 1,580 |
| Shopify, Inc. Class A (a) | | 58 | 5,865 |
| Tencent Holdings Ltd. | | 1,293 | 66,923 |
| | | | 2,174,510 |
| IT Services - 5.6% | | | |
| Accenture PLC Class A | | 132 | 20,208 |
| EPAM Systems, Inc. (a) | | 100 | 10,743 |
| Global Payments, Inc. | | 268 | 26,864 |
| MasterCard, Inc. Class A | | 1,714 | 259,431 |
| PayPal Holdings, Inc. (a) | | 3,266 | 240,443 |
| Square, Inc. (a) | | 347 | 12,030 |
| Visa, Inc. Class A | | 2,092 | 238,530 |
| | | | 808,249 |
| Semiconductors & Semiconductor Equipment - 3.5% | | | |
| Analog Devices, Inc. | | 217 | 19,320 |
| Applied Materials, Inc. | | 2,220 | 113,486 |
| Broadcom Ltd. | | 258 | 66,280 |
| First Solar, Inc. (a) | | 90 | 6,077 |
| Lam Research Corp. | | 292 | 53,748 |
| NVIDIA Corp. | | 640 | 123,840 |
| Taiwan Semiconductor Manufacturing Co. Ltd. sponsored ADR | | 1,467 | 58,167 |
| Texas Instruments, Inc. | | 627 | 65,484 |
| | | | 506,402 |
| Software - 11.6% | | | |
| Activision Blizzard, Inc. | | 2,547 | 161,276 |
| Adobe Systems, Inc. (a) | | 1,815 | 318,061 |
| Atlassian Corp. PLC (a) | | 370 | 16,842 |
| CDK Global, Inc. | | 152 | 10,835 |
| Constellation Software, Inc. | | 16 | 9,700 |
| Electronic Arts, Inc. (a) | | 1,409 | 148,030 |
| Intuit, Inc. | | 222 | 35,027 |
| Micro Focus International PLC | | 166 | 5,655 |
| Microsoft Corp. | | 3,314 | 283,480 |
| Nintendo Co. Ltd. | | 4 | 1,440 |
| Parametric Technology Corp. (a) | | 68 | 4,132 |
| Paycom Software, Inc. (a) | | 180 | 14,459 |
| Red Hat, Inc. (a) | | 295 | 35,430 |
| RingCentral, Inc. (a) | | 229 | 11,084 |
| Salesforce.com, Inc. (a) | | 4,424 | 452,266 |
| Snap, Inc. Class A (a) | | 240 | 3,506 |
| Tanium, Inc. Class B (c)(d) | | 100 | 513 |
| Ultimate Software Group, Inc. (a) | | 315 | 68,742 |
| Workday, Inc. Class A (a) | | 954 | 97,060 |
| | | | 1,677,538 |
| Technology Hardware, Storage & Peripherals - 2.0% | | | |
| Apple, Inc. | | 1,749 | 295,983 |
| Xaar PLC | | 368 | 1,837 |
| | | | 297,820 |
|
| TOTAL INFORMATION TECHNOLOGY | | | 5,828,653 |
|
| MATERIALS - 2.5% | | | |
| Chemicals - 1.7% | | | |
| Air Products & Chemicals, Inc. | | 134 | 21,987 |
| DowDuPont, Inc. | | 1,504 | 107,115 |
| LyondellBasell Industries NV Class A | | 97 | 10,701 |
| Olin Corp. | | 149 | 5,301 |
| Sherwin-Williams Co. | | 200 | 82,008 |
| Westlake Chemical Corp. | | 155 | 16,512 |
| | | | 243,624 |
| Containers & Packaging - 0.2% | | | |
| WestRock Co. | | 382 | 24,146 |
| Metals & Mining - 0.6% | | | |
| ArcelorMittal SA Class A unit (a) | | 200 | 6,462 |
| Arizona Mining, Inc. (a) | | 605 | 1,665 |
| B2Gold Corp. (a) | | 2,374 | 7,328 |
| Franco-Nevada Corp. | | 501 | 40,040 |
| Freeport-McMoRan, Inc. (a) | | 200 | 3,792 |
| Ivanhoe Mines Ltd. (a) | | 2,863 | 9,657 |
| Kirkland Lake Gold Ltd. | | 354 | 5,427 |
| Newcrest Mining Ltd. | | 303 | 5,395 |
| Novagold Resources, Inc. (a) | | 584 | 2,295 |
| Nucor Corp. | | 100 | 6,358 |
| Randgold Resources Ltd. sponsored ADR | | 31 | 3,066 |
| | | | 91,485 |
|
| TOTAL MATERIALS | | | 359,255 |
|
| REAL ESTATE - 0.1% | | | |
| Equity Real Estate Investment Trusts (REITs) - 0.1% | | | |
| American Tower Corp. | | 91 | 12,983 |
| Real Estate Management & Development - 0.0% | | | |
| Five Point Holdings LLC Class A (a) | | 318 | 4,484 |
|
| TOTAL REAL ESTATE | | | 17,467 |
|
| TELECOMMUNICATION SERVICES - 0.5% | | | |
| Wireless Telecommunication Services - 0.5% | | | |
| SoftBank Corp. | | 152 | 12,034 |
| T-Mobile U.S., Inc. (a) | | 838 | 53,221 |
| | | | 65,255 |
| TOTAL COMMON STOCKS | | | |
| (Cost $12,896,109) | | | 14,187,100 |
|
| Convertible Preferred Stocks - 0.1% | | | |
| CONSUMER STAPLES - 0.0% | | | |
| Food & Staples Retailing - 0.0% | | | |
| Roofoods Ltd. Series F (c)(d) | | 8 | 2,829 |
| HEALTH CARE - 0.0% | | | |
| Biotechnology - 0.0% | | | |
| 23andMe, Inc. Series F (c)(d) | | 144 | 1,999 |
| INFORMATION TECHNOLOGY - 0.1% | | | |
| Internet Software & Services - 0.1% | | | |
| Lyft, Inc. Series H (c)(d) | | 126 | 5,008 |
| TOTAL CONVERTIBLE PREFERRED STOCKS | | | |
| (Cost $9,836) | | | 9,836 |
| | | Principal Amount | Value |
|
| Nonconvertible Bonds - 0.1% | | | |
| HEALTH CARE - 0.1% | | | |
| Pharmaceuticals - 0.1% | | | |
| Valeant Pharmaceuticals International, Inc.: | | | |
| 6.125% 4/15/25 (b) | | 10,000 | 9,150 |
| 9% 12/15/25 (b) | | 9,000 | 9,380 |
| (Cost $17,587) | | | 18,530 |
| | | Shares | Value |
|
| Money Market Funds - 1.7% | | | |
| Fidelity Cash Central Fund, 1.36% (e) | | | |
| (Cost $243,183) | | 243,134 | 243,183 |
| TOTAL INVESTMENT IN SECURITIES - 99.7% | | | |
| (Cost $13,166,715) | | | 14,458,649 |
| NET OTHER ASSETS (LIABILITIES) - 0.3% | | | 42,429 |
| NET ASSETS - 100% | | | $14,501,078 |
Legend
(a) Non-income producing
(b) Security exempt from registration under Rule 144A of the Securities Act of 1933. These securities may be resold in transactions exempt from registration, normally to qualified institutional buyers. At the end of the period, the value of these securities amounted to $22,925 or 0.2% of net assets.
(c) Restricted securities - Investment in securities not registered under the Securities Act of 1933 (excluding 144A issues). At the end of the period, the value of restricted securities (excluding 144A issues) amounted to $10,349 or 0.1% of net assets.
(d) Level 3 security
(e) Affiliated fund that is generally available only to investment companies and other accounts managed by Fidelity Investments. The rate quoted is the annualized seven-day yield of the fund at period end. A complete unaudited listing of the fund's holdings as of its most recent quarter end is available upon request. In addition, each Fidelity Central Fund's financial statements, which are not covered by the Fund's Report of Independent Registered Public Accounting Firm, are available on the SEC's website or upon request.
Additional information on each restricted holding is as follows:
| Security | Acquisition Date | Acquisition Cost |
| 23andMe, Inc. Series F | 8/31/17 | $1,999 |
| Lyft, Inc. Series H | 11/22/17 | $5,008 |
| Roofoods Ltd. Series F | 9/12/17 | $2,829 |
| Tanium, Inc. Class B | 4/21/17 | $496 |
Affiliated Central Funds
Information regarding fiscal year to date income earned by the Fund from investments in Fidelity Central Funds is as follows:
| Fund | Income earned |
| Fidelity Cash Central Fund | $1,823 |
| Total | $1,823 |
Amounts in the income column in the above table include any capital gain distributions from underlying funds, which are presented in the corresponding line-item in the Statement of Operations if applicable.
Investment Valuation
The following is a summary of the inputs used, as of December 31, 2017, involving the Fund's assets and liabilities carried at fair value. The inputs or methodology used for valuing securities may not be an indication of the risk associated with investing in those securities. For more information on valuation inputs, and their aggregation into the levels used below, please refer to the Investment Valuation section in the accompanying Notes to Financial Statements.
| | Valuation Inputs at Reporting Date: |
| Description | Total | Level 1 | Level 2 | Level 3 |
| Investments in Securities: | | | | |
| Equities: | | | | |
| Consumer Discretionary | $2,185,980 | $2,163,473 | $22,507 | $-- |
| Consumer Staples | 312,598 | 309,769 | -- | 2,829 |
| Energy | 294,281 | 294,281 | -- | -- |
| Financials | 2,919,945 | 2,919,945 | -- | -- |
| Health Care | 1,237,419 | 1,235,420 | -- | 1,999 |
| Industrials | 971,075 | 971,075 | -- | -- |
| Information Technology | 5,833,661 | 5,759,777 | 68,363 | 5,521 |
| Materials | 359,255 | 359,255 | -- | -- |
| Real Estate | 17,467 | 17,467 | -- | -- |
| Telecommunication Services | 65,255 | 53,221 | 12,034 | -- |
| Corporate Bonds | 18,530 | -- | 18,530 | -- |
| Money Market Funds | 243,183 | 243,183 | -- | -- |
| Total Investments in Securities: | $14,458,649 | $14,326,866 | $121,434 | $10,349 |
See accompanying notes which are an integral part of the financial statements.
Financial Statements
Statement of Assets and Liabilities
| | | December 31, 2017 |
| Assets | | |
Investment in securities, at value — See accompanying schedule:
Unaffiliated issuers (cost $12,923,532) | $14,215,466 | |
| Fidelity Central Funds (cost $243,183) | 243,183 | |
| Total Investment in Securities (cost $13,166,715) | | $14,458,649 |
| Cash | | 25,302 |
| Receivable for investments sold | | 15,245 |
| Receivable for fund shares sold | | 9,409 |
| Dividends receivable | | 3,499 |
| Interest receivable | | 162 |
| Distributions receivable from Fidelity Central Funds | | 284 |
| Other receivables | | 22 |
| Total assets | | 14,512,572 |
| Liabilities | | |
| Payable for investments purchased | $5,762 | |
| Payable for fund shares redeemed | 5,331 | |
| Other payables and accrued expenses | 401 | |
| Total liabilities | | 11,494 |
| Net Assets | | $14,501,078 |
| Net Assets consist of: | | |
| Paid in capital | | $13,226,409 |
| Distributions in excess of net investment income | | (310) |
| Accumulated undistributed net realized gain (loss) on investments and foreign currency transactions | | (16,558) |
| Net unrealized appreciation (depreciation) on investments and assets and liabilities in foreign currencies | | 1,291,537 |
| Net Assets, for 1,189,851 shares outstanding | | $14,501,078 |
| Net Asset Value, offering price and redemption price per share ($14,501,078 ÷ 1,189,851 shares) | | $12.19 |
See accompanying notes which are an integral part of the financial statements.
Statement of Operations
| | | For the period
March 8, 2017 (commencement of operations) to
December 31, 2017 |
| Investment Income | | |
| Dividends | | $42,875 |
| Interest | | 87 |
| Income from Fidelity Central Funds | | 1,823 |
| Total income | | 44,785 |
| Expenses | | |
| Independent trustees' fees and expenses | $18 | |
| Miscellaneous | 9 | |
| Total expenses before reductions | 27 | |
| Expense reductions | (22) | 5 |
| Net investment income (loss) | | 44,780 |
| Realized and Unrealized Gain (Loss) | | |
| Net realized gain (loss) on: | | |
| Investment securities: | | |
| Unaffiliated issuers | (8,675) | |
| Foreign currency transactions | 103 | |
| Total net realized gain (loss) | | (8,572) |
| Change in net unrealized appreciation (depreciation) on: | | |
| Unaffiliated issuers (net of increase in deferred foreign taxes of $401) | 1,291,533 | |
| Assets and liabilities in foreign currencies | 4 | |
| Total change in net unrealized appreciation (depreciation) | | 1,291,537 |
| Net gain (loss) | | 1,282,965 |
| Net increase (decrease) in net assets resulting from operations | | $1,327,745 |
See accompanying notes which are an integral part of the financial statements.
Statement of Changes in Net Assets
| | For the period
March 8, 2017 (commencement of operations) to
December 31, 2017 |
| Increase (Decrease) in Net Assets | |
| Operations | |
| Net investment income (loss) | $44,780 |
| Net realized gain (loss) | (8,572) |
| Change in net unrealized appreciation (depreciation) | 1,291,537 |
| Net increase (decrease) in net assets resulting from operations | 1,327,745 |
| Distributions to shareholders from net investment income | (45,175) |
| Distributions to shareholders from net realized gain | (9,267) |
| Total distributions | (54,442) |
| Share transactions | |
| Proceeds from sales of shares | 13,802,111 |
| Reinvestment of distributions | 54,442 |
| Cost of shares redeemed | (628,778) |
| Net increase (decrease) in net assets resulting from share transactions | 13,227,775 |
| Total increase (decrease) in net assets | 14,501,078 |
| Net Assets | |
| Beginning of period | – |
| End of period | $14,501,078 |
| Other Information | |
| Distributions in excess of net investment income end of period | $(310) |
| Shares | |
| Sold | 1,237,605 |
| Issued in reinvestment of distributions | 4,451 |
| Redeemed | (52,205) |
| Net increase (decrease) | 1,189,851 |
See accompanying notes which are an integral part of the financial statements.
Financial Highlights
Fidelity Flex Opportunistic Insights Fund
| Year ended December 31, | 2017 A |
| Selected Per–Share Data | |
| Net asset value, beginning of period | $10.00 |
| Income from Investment Operations | |
| Net investment income (loss)B | .07 |
| Net realized and unrealized gain (loss) | 2.17 |
| Total from investment operations | 2.24 |
| Distributions from net investment income | (.04) |
| Distributions from net realized gain | (.01) |
| Total distributions | (.05) |
| Net asset value, end of period | $12.19 |
| Total ReturnC,D | 22.37% |
| Ratios to Average Net AssetsE,F | |
| Expenses before reductions | - %G,H |
| Expenses net of fee waivers, if any | - %G,H |
| Expenses net of all reductions | - %G,H |
| Net investment income (loss) | .78%G |
| Supplemental Data | |
| Net assets, end of period (000 omitted) | $14,501 |
| Portfolio turnover rateI | 28%G |
A For the period March 8, 2017 (commencement of operations) to December 31, 2017.
B Calculated based on average shares outstanding during the period.
C Total returns for periods of less than one year are not annualized.
D Total returns would have been lower if certain expenses had not been reduced during the applicable periods shown.
E Fees and expenses of any underlying Fidelity Central Funds are not included in the Fund's expense ratio. The Fund indirectly bears its proportionate share of the expenses of any underlying Fidelity Central Funds.
F Expense ratios reflect operating expenses of the Fund. Expenses before reductions do not reflect amounts reimbursed by the investment adviser or reductions from brokerage service arrangements or reductions from other expense offset arrangements and do not represent the amount paid by the Fund during periods when reimbursements or reductions occur. Expense ratios before reductions for start-up periods may not be representative of longer term operating periods. Expenses net of fee waivers reflect expenses after reimbursement by the investment adviser but prior to reductions from brokerage service arrangements or other expense offset arrangements. Expenses net of all reductions represent the net expenses paid by the Fund.
G Annualized
H Amount represents less than .005%.
I Amount does not include the portfolio activity of any underlying Fidelity Central Funds.
See accompanying notes which are an integral part of the financial statements.
Notes to Financial Statements
For the period ended December 31, 2017
1. Organization.
Fidelity Flex Opportunistic Insights Fund (the Fund) is a fund of Fidelity Contrafund (the Trust) and is authorized to issue an unlimited number of shares. Share transactions on the Statement of Changes in Net Assets may contain exchanges between affiliated funds. The Trust is registered under the Investment Company Act of 1940, as amended (the 1940 Act), as an open-end management investment company organized as a Massachusetts business trust. The Fund is available only to certain fee-based accounts offered by Fidelity.
2. Investments in Fidelity Central Funds.
The Fund invests in Fidelity Central Funds, which are open-end investment companies generally available only to other investment companies and accounts managed by the investment adviser and its affiliates. The Fund's Schedule of Investments lists each of the Fidelity Central Funds held as of period end, if any, as an investment of the Fund, but does not include the underlying holdings of each Fidelity Central Fund. As an Investing Fund, the Fund indirectly bears its proportionate share of the expenses of the underlying Fidelity Central Funds.
The Money Market Central Funds seek preservation of capital and current income and are managed by Fidelity Investments Money Management, Inc. (FIMM), an affiliate of the investment adviser. Annualized expenses of the Money Market Central Funds as of their most recent shareholder report date are less than .005%.
A complete unaudited list of holdings for each Fidelity Central Fund is available upon request or at the Securities and Exchange Commission (the SEC) website at www.sec.gov. In addition, the financial statements of the Fidelity Central Funds, which are not covered by the Fund's Report of Independent Registered Public Accounting Firm, are available on the SEC website or upon request.
3. Significant Accounting Policies.
The Fund is an investment company and applies the accounting and reporting guidance of the Financial Accounting Standards Board (FASB) Accounting Standards Codification Topic 946 Financial Services – Investments Companies. The financial statements have been prepared in conformity with accounting principles generally accepted in the United States of America (GAAP), which require management to make certain estimates and assumptions at the date of the financial statements. Actual results could differ from those estimates. Subsequent events, if any, through the date that the financial statements were issued have been evaluated in the preparation of the financial statements. The following summarizes the significant accounting policies of the Fund:
Investment Valuation. Investments are valued as of 4:00 p.m. Eastern time on the last calendar day of the period. The Board of Trustees (the Board) has delegated the day to day responsibility for the valuation of the Fund's investments to the Fair Value Committee (the Committee) established by the Fund's investment adviser. In accordance with valuation policies and procedures approved by the Board, the Fund attempts to obtain prices from one or more third party pricing vendors or brokers to value its investments. When current market prices, quotations or currency exchange rates are not readily available or reliable, investments will be fair valued in good faith by the Committee, in accordance with procedures adopted by the Board. Factors used in determining fair value vary by investment type and may include market or investment specific events, changes in interest rates and credit quality. The frequency with which these procedures are used cannot be predicted and they may be utilized to a significant extent. The Committee oversees the Fund's valuation policies and procedures and reports to the Board on the Committee's activities and fair value determinations. The Board monitors the appropriateness of the procedures used in valuing the Fund's investments and ratifies the fair value determinations of the Committee.
The Fund categorizes the inputs to valuation techniques used to value its investments into a disclosure hierarchy consisting of three levels as shown below:
- Level 1 – quoted prices in active markets for identical investments
- Level 2 – other significant observable inputs (including quoted prices for similar investments, interest rates, prepayment speeds, etc.)
- Level 3 – unobservable inputs (including the Fund's own assumptions based on the best information available)
Valuation techniques used to value the Fund's investments by major category are as follows:
Equity securities, including restricted securities, for which market quotations are readily available, are valued at the last reported sale price or official closing price as reported by a third party pricing vendor on the primary market or exchange on which they are traded and are categorized as Level 1 in the hierarchy. In the event there were no sales during the day or closing prices are not available, securities are valued at the last quoted bid price or may be valued using the last available price and are generally categorized as Level 2 in the hierarchy. For foreign equity securities, when market or security specific events arise, comparisons to the valuation of American Depositary Receipts (ADRs), futures contracts, Exchange-Traded Funds (ETFs) and certain indexes as well as quoted prices for similar securities may be used and would be categorized as Level 2 in the hierarchy. Utilizing these techniques may result in transfers between Level 1 and Level 2. For equity securities, including restricted securities, where observable inputs are limited, assumptions about market activity and risk are used and these securities may be categorized as Level 3 in the hierarchy.
Debt securities, including restricted securities, are valued based on evaluated prices received from third party pricing vendors or from brokers who make markets in such securities. Corporate bonds are valued by pricing vendors who utilize matrix pricing which considers yield or price of bonds of comparable quality, coupon, maturity and type or by broker-supplied prices. When independent prices are unavailable or unreliable, debt securities may be valued utilizing pricing methodologies which consider similar factors that would be used by third party pricing vendors. Debt securities are generally categorized as Level 2 in the hierarchy but may be Level 3 depending on the circumstances.
Investments in open-end mutual funds, including the Fidelity Central Funds, are valued at their closing net asset value (NAV) each business day and are categorized as Level 1 in the hierarchy.
Changes in valuation techniques may result in transfers in or out of an assigned level within the disclosure hierarchy. The aggregate value of investments by input level as of December 31, 2017 is included at the end of the Fund's Schedule of Investments.
Foreign Currency. The Fund may use foreign currency contracts to facilitate transactions in foreign-denominated securities. Gains and losses from these transactions may arise from changes in the value of the foreign currency or if the counterparties do not perform under the contracts' terms.
Foreign-denominated assets, including investment securities, and liabilities are translated into U.S. dollars at the exchange rates at period end. Purchases and sales of investment securities, income and dividends received and expenses denominated in foreign currencies are translated into U.S. dollars at the exchange rate in effect on the transaction date.
The effects of exchange rate fluctuations on investments are included with the net realized and unrealized gain (loss) on investment securities. Other foreign currency transactions resulting in realized and unrealized gain (loss) are disclosed separately.
Investment Transactions and Income. For financial reporting purposes, the Fund's investment holdings and NAV include trades executed through the end of the last business day of the period. The NAV per share for processing shareholder transactions is calculated as of the close of business of the New York Stock Exchange (NYSE), normally 4:00 p.m. Eastern time and includes trades executed through the end of the prior business day. Gains and losses on securities sold are determined on the basis of identified cost. Dividend income is recorded on the ex-dividend date, except for certain dividends from foreign securities where the ex-dividend date may have passed, which are recorded as soon as the Fund is informed of the ex-dividend date. Non-cash dividends included in dividend income, if any, are recorded at the fair market value of the securities received. Income and capital gain distributions from Fidelity Central Funds, if any, are recorded on the ex-dividend date. Certain distributions received by the Fund represent a return of capital or capital gain. The Fund determines the components of these distributions subsequent to the ex-dividend date, based upon receipt of tax filings or other correspondence relating to the underlying investment. These distributions are recorded as a reduction of cost of investments and/or as a realized gain. Interest income is accrued as earned and includes coupon interest and amortization of premium and accretion of discount on debt securities as applicable. Investment income is recorded net of foreign taxes withheld where recovery of such taxes is uncertain.
Expenses. Expenses directly attributable to a fund are charged to that fund. Expenses attributable to more than one fund are allocated among the respective funds on the basis of relative net assets or other appropriate methods. Expense estimates are accrued in the period to which they relate and adjustments are made when actual amounts are known.
Income Tax Information and Distributions to Shareholders. Each year, the Fund intends to qualify as a regulated investment company under Subchapter M of the Internal Revenue Code, including distributing substantially all of its taxable income and realized gains. As a result, no provision for U.S. Federal income taxes is required. As of December 31, 2017, the Fund did not have any unrecognized tax benefits in the financial statements; nor is the Fund aware of any tax positions for which it is reasonably possible that the total amounts of unrecognized tax benefits will significantly change in the next twelve months. The Fund files a U.S. federal tax return, in addition to state and local tax returns as required. The Fund's federal income tax returns are subject to examination by the Internal Revenue Service (IRS) for a period of three fiscal years after they are filed. State and local tax returns may be subject to examination for an additional fiscal year depending on the jurisdiction. Foreign taxes are provided for based on the Fund's understanding of the tax rules and rates that exist in the foreign markets in which it invests. The Fund is subject to a tax imposed on capital gains by certain countries in which it invests. An estimated deferred tax liability for net unrealized appreciation on the applicable securities is included in Other payables and accrued expenses on the Statement of Assets & Liabilities.
Distributions are declared and recorded on the ex-dividend date. Income and capital gain distributions are determined in accordance with income tax regulations, which may differ from GAAP.
Capital accounts within the financial statements are adjusted for permanent book-tax differences. These adjustments have no impact on net assets or the results of operations. Capital accounts are not adjusted for temporary book-tax differences which will reverse in a subsequent period.
Book-tax differences are primarily due to foreign currency transactions, passive foreign investment companies (PFIC), market discount, losses deferred due to wash sales and excise tax regulations.
As of period end, the cost and unrealized appreciation (depreciation) in securities, and derivatives if applicable, for federal income tax purposes were as follows:
| Gross unrealized appreciation | $1,424,118 |
| Gross unrealized depreciation | (145,657) |
| Net unrealized appreciation (depreciation) | $1,278,461 |
| Tax Cost | $13,180,188 |
The tax-based components of distributable earnings as of period end were as follows:
| Net unrealized appreciation (depreciation) on securities and other investments | $1,278,465 |
The Fund intends to elect to defer to its next fiscal year $320 of ordinary losses recognized during the period November 1, 2017 to December 31, 2107.
The Fund intends to elect to defer to its next fiscal year $3,075 of capital losses recognized during the period November 1, 2017 to December 31, 2107.
The tax character of distributions paid was as follows:
| | December 31, 2017(a) |
| Ordinary Income | $54,442 |
(a) For the period March 8, 2017 (commencement of operations) to December 31, 2017.
Restricted Securities. The Fund may invest in securities that are subject to legal or contractual restrictions on resale. These securities generally may be resold in transactions exempt from registration or to the public if the securities are registered. Disposal of these securities may involve time-consuming negotiations and expense, and prompt sale at an acceptable price may be difficult. Information regarding restricted securities is included at the end of the Fund's Schedule of Investments.
4. Purchases and Sales of Investments.
Purchases and sales of securities, other than short-term securities, aggregated $14,595,616 and $1,663,060, respectively.
5. Fees and Other Transactions with Affiliates.
Management Fee. Fidelity Management & Research Company (the investment adviser) and its affiliates provide the Fund with investment management related services and the Fund does not pay any fees for these services. Under the management contract, the investment adviser or an affiliate pays all other expenses of the Fund, excluding fees and expenses of the independent Trustees, and certain miscellaneous expenses such as proxy and shareholder meeting expenses.
Brokerage Commissions. The Fund placed a portion of its portfolio transactions with brokerage firms which are affiliates of the investment adviser. Brokerage commissions are included in net realized gain (loss) and change in net unrealized appreciation (depreciation) in the Statement of Operations. The commissions paid to these affiliated firms were $321 for the period.
Interfund Trades. The Fund may purchase from or sell securities to other Fidelity Funds under procedures adopted by the Board. The procedures have been designed to ensure these interfund trades are executed in accordance with Rule 17a-7 of the 1940 Act. Interfund trades are included within the respective purchases and sales amounts shown in the Purchases and Sales of Investments note.
6. Committed Line of Credit.
The Fund participates with other funds managed by the investment adviser or an affiliate in a $4.25 billion credit facility (the "line of credit") to be utilized for temporary or emergency purposes to fund shareholder redemptions or for other short-term liquidity purposes. The Fund has agreed to pay commitment fees on its pro-rata portion of the line of credit, which amounted to $9 and is reflected in Miscellaneous expenses on the Statement of Operations. During the period, the Fund did not borrow on this line of credit.
7. Expense Reductions.
Commissions paid to certain brokers with whom the investment adviser, or its affiliates, places trades on behalf of the Fund include an amount in addition to trade execution, which may be rebated back to the Fund to offset certain expenses. This amount totaled $22 for the period.
8. Other.
The Fund's organizational documents provide former and current trustees and officers with a limited indemnification against liabilities arising in connection with the performance of their duties to the Fund. In the normal course of business, the Fund may also enter into contracts that provide general indemnifications. The Fund's maximum exposure under these arrangements is unknown as this would be dependent on future claims that may be made against the Fund. The risk of material loss from such claims is considered remote.
At the end of the period, the investment adviser or its affiliates were the owners of record of 42% of the total outstanding shares of the Fund.
Report of Independent Registered Public Accounting Firm
To the Board of Trustees of Fidelity Contrafund and Shareholders of Fidelity Flex Opportunistic Insights Fund:
Opinion on the Financial Statements
We have audited the accompanying statement of assets and liabilities, including the schedule of investments, of Fidelity Flex Opportunistic Insights Fund (one of the funds constituting Fidelity Contrafund, referred to hereafter as the “Fund”) as of December 31, 2017, and the related statements of operations and changes in net assets, including the related notes, and the financial highlights for the period March 8, 2017 (commencement of operations) through December 31, 2017 (collectively referred to as the “financial statements”). In our opinion, the financial statements present fairly, in all material respects, the financial position of the Fund as of December 31, 2017, and the results of its operations, changes in its net assets, and the financial highlights for the period March 8, 2017 (commencement of operations) through December 31, 2017 in conformity with accounting principles generally accepted in the United States of America.
Basis for Opinion
These financial statements are the responsibility of the Fund’s management. Our responsibility is to express an opinion on the Fund’s financial statements based on our audit. We are a public accounting firm registered with the Public Company Accounting Oversight Board (United States) (“PCAOB”) and are required to be independent with respect to the Fund in accordance with the U.S. federal securities laws and the applicable rules and regulations of the Securities and Exchange Commission and the PCAOB.
We conducted our audit of these financial statements in accordance with the standards of the PCAOB. Those standards require that we plan and perform the audit to obtain reasonable assurance about whether the financial statements are free of material misstatement, whether due to error or fraud.
Our audit included performing procedures to assess the risks of material misstatement of the financial statements, whether due to error or fraud, and performing procedures that respond to those risks. Such procedures included examining, on a test basis, evidence regarding the amounts and disclosures in the financial statements. Our audit also included evaluating the accounting principles used and significant estimates made by management, as well as evaluating the overall presentation of the financial statements. Our procedures included confirmation of securities owned as of December 31, 2017 by correspondence with the custodian and brokers; when replies were not received from brokers, we performed other auditing procedures. We believe that our audit provides a reasonable basis for our opinion.
PricewaterhouseCoopers LLP
Boston, Massachusetts
February 16, 2018
We have served as the auditor of one or more investment companies in the Fidelity group of funds since 1932.
Trustees and Officers
The Trustees, Members of the Advisory Board (if any), and officers of the trust and fund, as applicable, are listed below. The Board of Trustees governs the fund and is responsible for protecting the interests of shareholders. The Trustees are experienced executives who meet periodically throughout the year to oversee the fund's activities, review contractual arrangements with companies that provide services to the fund, oversee management of the risks associated with such activities and contractual arrangements, and review the fund's performance. Each of the Trustees oversees 190 funds.
The Trustees hold office without limit in time except that (a) any Trustee may resign; (b) any Trustee may be removed by written instrument, signed by at least two-thirds of the number of Trustees prior to such removal; (c) any Trustee who requests to be retired or who has become incapacitated by illness or injury may be retired by written instrument signed by a majority of the other Trustees; and (d) any Trustee may be removed at any special meeting of shareholders by a two-thirds vote of the outstanding voting securities of the trust. Each Trustee who is not an interested person (as defined in the 1940 Act) of the trust and the fund is referred to herein as an Independent Trustee. Each Independent Trustee shall retire not later than the last day of the calendar year in which his or her 75th birthday occurs. The Independent Trustees may waive this mandatory retirement age policy with respect to individual Trustees. Officers and Advisory Board Members hold office without limit in time, except that any officer or Advisory Board Member may resign or may be removed by a vote of a majority of the Trustees at any regular meeting or any special meeting of the Trustees. Except as indicated, each individual has held the office shown or other offices in the same company for the past five years.
The fund’s Statement of Additional Information (SAI) includes more information about the Trustees. To request a free copy, call Fidelity at 1-800-835-5092.
Experience, Skills, Attributes, and Qualifications of the Trustees. The Governance and Nominating Committee has adopted a statement of policy that describes the experience, qualifications, attributes, and skills that are necessary and desirable for potential Independent Trustee candidates (Statement of Policy). The Board believes that each Trustee satisfied at the time he or she was initially elected or appointed a Trustee, and continues to satisfy, the standards contemplated by the Statement of Policy. The Governance and Nominating Committee also engages professional search firms to help identify potential Independent Trustee candidates who have the experience, qualifications, attributes, and skills consistent with the Statement of Policy. From time to time, additional criteria based on the composition and skills of the current Independent Trustees, as well as experience or skills that may be appropriate in light of future changes to board composition, business conditions, and regulatory or other developments, have also been considered by the professional search firms and the Governance and Nominating Committee. In addition, the Board takes into account the Trustees' commitment and participation in Board and committee meetings, as well as their leadership of standing and ad hoc committees throughout their tenure.
In determining that a particular Trustee was and continues to be qualified to serve as a Trustee, the Board has considered a variety of criteria, none of which, in isolation, was controlling. The Board believes that, collectively, the Trustees have balanced and diverse experience, qualifications, attributes, and skills, which allow the Board to operate effectively in governing the fund and protecting the interests of shareholders. Information about the specific experience, skills, attributes, and qualifications of each Trustee, which in each case led to the Board's conclusion that the Trustee should serve (or continue to serve) as a trustee of the fund, is provided below.
Board Structure and Oversight Function. James C. Curvey is an interested person and currently serves as Chairman. The Trustees have determined that an interested Chairman is appropriate and benefits shareholders because an interested Chairman has a personal and professional stake in the quality and continuity of services provided to the fund. Independent Trustees exercise their informed business judgment to appoint an individual of their choosing to serve as Chairman, regardless of whether the Trustee happens to be independent or a member of management. The Independent Trustees have determined that they can act independently and effectively without having an Independent Trustee serve as Chairman and that a key structural component for assuring that they are in a position to do so is for the Independent Trustees to constitute a substantial majority for the Board. The Independent Trustees also regularly meet in executive session. Ned C. Lautenbach serves as Chairman of the Independent Trustees and as such (i) acts as a liaison between the Independent Trustees and management with respect to matters important to the Independent Trustees and (ii) with management prepares agendas for Board meetings.
Fidelity® funds are overseen by different Boards of Trustees. The fund's Board oversees Fidelity's high income and certain equity funds, and other Boards oversee Fidelity's investment-grade bond, money market, asset allocation, and sector funds. The asset allocation funds may invest in Fidelity® funds overseen by the fund's Board. The use of separate Boards, each with its own committee structure, allows the Trustees of each group of Fidelity® funds to focus on the unique issues of the funds they oversee, including common research, investment, and operational issues. On occasion, the separate Boards establish joint committees to address issues of overlapping consequences for the Fidelity® funds overseen by each Board.
The Trustees operate using a system of committees to facilitate the timely and efficient consideration of all matters of importance to the Trustees, the fund, and fund shareholders and to facilitate compliance with legal and regulatory requirements and oversight of the fund's activities and associated risks. The Board, acting through its committees, has charged FMR and its affiliates with (i) identifying events or circumstances the occurrence of which could have demonstrably adverse effects on the fund's business and/or reputation; (ii) implementing processes and controls to lessen the possibility that such events or circumstances occur or to mitigate the effects of such events or circumstances if they do occur; and (iii) creating and maintaining a system designed to evaluate continuously business and market conditions in order to facilitate the identification and implementation processes described in (i) and (ii) above. Because the day-to-day operations and activities of the fund are carried out by or through FMR, its affiliates, and other service providers, the fund's exposure to risks is mitigated but not eliminated by the processes overseen by the Trustees. While each of the Board's committees has responsibility for overseeing different aspects of the fund's activities, oversight is exercised primarily through the Operations, Audit, and Compliance Committees. In addition, the Independent Trustees have worked with FMR to enhance the Board's oversight of investment and financial risks, legal and regulatory risks, technology risks, and operational risks, including the development of additional risk reporting to the Board. For example, a working group comprised of Independent Trustees and FMR has worked and continues to work to review the Fidelity® funds' valuation-related activities, reporting and risk management. Appropriate personnel, including but not limited to the fund's Chief Compliance Officer (CCO), FMR's internal auditor, the independent accountants, the fund's Treasurer and portfolio management personnel, make periodic reports to the Board's committees, as appropriate, including an annual review of Fidelity's risk management program for the Fidelity® funds. The responsibilities of each standing committee, including their oversight responsibilities, are described further under "Standing Committees of the Trustees."
Interested Trustees*:
Correspondence intended for a Trustee who is an interested person may be sent to Fidelity Investments, 245 Summer Street, Boston, Massachusetts 02210.
Name, Year of Birth; Principal Occupations and Other Relevant Experience+
James C. Curvey (1935)
Year of Election or Appointment: 2007
Trustee
Chairman of the Board of Trustees
Mr. Curvey also serves as Trustee of other Fidelity® funds. Mr. Curvey is a Director of Fidelity Research & Analysis Co. (investment adviser firm, 2009-present), and Vice Chairman (2007-present) and Director of FMR LLC (diversified financial services company). In addition, Mr. Curvey serves as an Overseer for the Boston Symphony Orchestra and a member of the board of Artis-Naples, Naples, Florida, and as a Trustee for Brewster Academy, Wolfeboro, New Hampshire. Previously, Mr. Curvey served as a Director of Fidelity Investments Money Management, Inc. (investment adviser firm, 2009-2014) and a Director of FMR and FMR Co., Inc. (investment adviser firms, 2007-2014).
Charles S. Morrison (1960)
Year of Election or Appointment: 2014
Trustee
Mr. Morrison also serves as Trustee of other funds. He serves as President of Fidelity SelectCo, LLC (investment adviser firm, 2017-present) and Fidelity Management & Research Company (FMR) (investment adviser firm, 2016-present), a Director of Fidelity Investments Money Management, Inc. (FIMM) (investment adviser firm, 2014-present), Director of Fidelity SelectCo, LLC (investment adviser firm, 2014-present), President, Asset Management (2014-present), and is an employee of Fidelity Investments. Previously, Mr. Morrison served as Vice President of Fidelity's Fixed Income and Asset Allocation Funds (2012-2014), President, Fixed Income (2011-2014), Vice President of Fidelity's Money Market Funds (2005-2009), President, Money Market Group Leader of FMR (investment adviser firm, 2009), and Senior Vice President, Money Market Group of FMR (2004-2009). Mr. Morrison also served as Vice President of Fidelity's Bond Funds (2002-2005), certain Balanced Funds (2002-2005), and certain Asset Allocation Funds (2002-2007), and as Senior Vice President (2002-2005) of Fidelity's Bond Division.
* Determined to be an “Interested Trustee” by virtue of, among other things, his or her affiliation with the trust or various entities under common control with FMR.
+ The information includes the Trustee's principal occupation during the last five years and other information relating to the experience, attributes, and skills relevant to the Trustee's qualifications to serve as a Trustee, which led to the conclusion that the Trustee should serve as a Trustee for the fund.
Independent Trustees:
Correspondence intended for an Independent Trustee may be sent to Fidelity Investments, P.O. Box 55235, Boston, Massachusetts 02205-5235.
Name, Year of Birth; Principal Occupations and Other Relevant Experience+
Dennis J. Dirks (1948)
Year of Election or Appointment: 2005
Trustee
Mr. Dirks also serves as Trustee of other Fidelity® funds. Prior to his retirement in May 2003, Mr. Dirks was Chief Operating Officer and a member of the Board of The Depository Trust & Clearing Corporation (DTCC). He also served as President, Chief Operating Officer, and Board member of The Depository Trust Company (DTC) and President and Board member of the National Securities Clearing Corporation (NSCC). In addition, Mr. Dirks served as Chief Executive Officer and Board member of the Government Securities Clearing Corporation, Chief Executive Officer and Board member of the Mortgage-Backed Securities Clearing Corporation, as a Trustee and a member of the Finance Committee of Manhattan College (2005-2008), as a Trustee and a member of the Finance Committee of AHRC of Nassau County (2006-2008), as a member of the Independent Directors Council (IDC) Governing Council (2010-2015), and as a member of the Board of Directors for The Brookville Center for Children’s Services, Inc. (2009-2017). Mr. Dirks is a member of the Finance Committee (2016-present) and Board of Directors (2017-present) of the Asolo Repertory Theatre.
Alan J. Lacy (1953)
Year of Election or Appointment: 2008
Trustee
Mr. Lacy also serves as Trustee of other Fidelity® funds. Mr. Lacy serves as a Director of Bristol-Myers Squibb Company (global pharmaceuticals, 2008-present). He is a Trustee of the California Chapter of The Nature Conservancy (2015-present) and a Director of the Center for Advanced Study in the Behavioral Sciences at Stanford University (2015-present). In addition, Mr. Lacy served as Senior Adviser (2007-2014) of Oak Hill Capital Partners, L.P. (private equity) and also served as Chief Executive Officer (2005) and Vice Chairman (2005-2006) of Sears Holdings Corporation (retail) and Chief Executive Officer and Chairman of the Board of Sears, Roebuck and Co. (retail, 2000-2005). Previously, Mr. Lacy served as Chairman (2014-2017) and a member (2010-2017) of the Board of Directors of Dave & Buster’s Entertainment, Inc. (restaurant and entertainment complexes), as Chairman (2008-2011) and a member (2006-2015) of the Board of Trustees of the National Parks Conservation Association, and as a member of the Board of Directors for The Hillman Companies, Inc. (hardware wholesalers, 2010-2014), Earth Fare, Inc. (retail grocery, 2010-2014), and The Western Union Company (global money transfer, 2006-2011).
Ned C. Lautenbach (1944)
Year of Election or Appointment: 2000
Trustee
Chairman of the Independent Trustees
Mr. Lautenbach also serves as Trustee of other Fidelity® funds. Mr. Lautenbach currently serves as Vice Chair of the Board of Governors, State University System of Florida (2013-present) and is a member of the Council on Foreign Relations (1994-present). He is also a member and has most recently served as Chairman of the Board of Directors of Artis-Naples (2012-present). Previously, Mr. Lautenbach served as a member and then Lead Director of the Board of Directors of Eaton Corporation (diversified industrial, 1997-2016). He was also a Partner and Advisory Partner at Clayton, Dubilier & Rice, LLC (private equity investment, 1998-2010), as well as a Director of Sony Corporation (2006-2007). In addition, Mr. Lautenbach also had a 30-year career with IBM (technology company) during which time he served as Senior Vice President and a member of the Corporate Executive Committee (1968-1998).
Joseph Mauriello (1944)
Year of Election or Appointment: 2008
Trustee
Mr. Mauriello also serves as Trustee of other Fidelity® funds. Prior to his retirement in January 2006, Mr. Mauriello served in numerous senior management positions including Deputy Chairman and Chief Operating Officer (2004-2005), and Vice Chairman of Financial Services (2002-2004) of KPMG LLP US (professional services, 1965-2005). Mr. Mauriello currently serves as a member of the Board of Directors of XL Group plc. (global insurance and re-insurance, 2006-present) and the Independent Directors Council (IDC) Governing Council (2015-present). Previously, Mr. Mauriello served as a Director of the Hamilton Funds of the Bank of New York (2006-2007) and of Arcadia Resources Inc. (health care services and products, 2007-2012).
Cornelia M. Small (1944)
Year of Election or Appointment: 2005
Trustee
Ms. Small also serves as Trustee of other Fidelity® funds. Ms. Small is a member of the Board of Directors (2009-present) and Chair of the Investment Committee (2010-present) of the Teagle Foundation. Ms. Small also serves on the Investment Committee of the Berkshire Taconic Community Foundation (2008-present). Previously, Ms. Small served as Chairperson (2002-2008) and a member of the Investment Committee and Chairperson (2008-2012) and a member of the Board of Trustees of Smith College. In addition, Ms. Small served as Chief Investment Officer, Director of Global Equity Investments, and a member of the Board of Directors of Scudder, Stevens & Clark and Scudder Kemper Investments.
William S. Stavropoulos (1939)
Year of Election or Appointment: 2001
Trustee
Vice Chairman of the Independent Trustees
Mr. Stavropoulos also serves as Trustee of other Fidelity® funds. Mr. Stavropoulos serves as President and Founder of the Michigan Baseball Foundation, the Great Lakes Loons (2007-present). Mr. Stavropoulos is Chairman Emeritus of the Board of Directors of The Dow Chemical Company, where he previously served in numerous senior management positions, including President, CEO (1995-2000; 2002-2004), Chairman of the Executive Committee (2000-2006), and as a member of the Board of Directors (1990-2006). Currently, Mr. Stavropoulos is Chairman of the Board of Directors of Univar Inc. (global distributor of commodity and specialty chemicals), a Director of Teradata Corporation (data warehousing and technology solutions), and a member of the Advisory Board for Metalmark Capital LLC (private equity investment, 2005-present). Mr. Stavropoulos is an operating advisor to Clayton, Dubilier & Rice, LLC (private equity investment). In addition, Mr. Stavropoulos is a member of the University of Notre Dame Advisory Council for the College of Science, a Trustee of the Rollin L. Gerstacker Foundation, and a Director of Artis-Naples in Naples, Florida. Previously, Mr. Stavropoulos served as a Director of Chemical Financial Corporation (bank holding company, 1993-2012) and Tyco International, Ltd. (multinational manufacturing and services, 2007-2012).
David M. Thomas (1949)
Year of Election or Appointment: 2008
Trustee
Mr. Thomas also serves as Trustee of other Fidelity® funds. Mr. Thomas serves as Non-Executive Chairman of the Board of Directors of Fortune Brands Home and Security (home and security products, 2011-present), as a member of the Board of Directors (2004-present) and Presiding Director (2013-present) of Interpublic Group of Companies, Inc. (marketing communication), and as a member of the Board of Trustees of the University of Florida (2013-present). Previously, Mr. Thomas served as Executive Chairman (2005-2006) and Chairman and Chief Executive Officer (2000-2005) of IMS Health, Inc. (pharmaceutical and healthcare information solutions), and a Director of Fortune Brands, Inc. (consumer products, 2000-2011).
+ The information includes the Trustee's principal occupation during the last five years and other information relating to the experience, attributes, and skills relevant to the Trustee's qualifications to serve as a Trustee, which led to the conclusion that the Trustee should serve as a Trustee for the fund.
Advisory Board Members and Officers:
Correspondence intended for an officer or Peter S. Lynch may be sent to Fidelity Investments, 245 Summer Street, Boston, Massachusetts 02210. Officers appear below in alphabetical order.
Name, Year of Birth; Principal Occupation
Peter S. Lynch (1944)
Year of Election or Appointment: 2003
Member of the Advisory Board
Mr. Lynch also serves as Member of the Advisory Board of other Fidelity® funds. Mr. Lynch is Vice Chairman and a Director of FMR (investment adviser firm) and FMR Co., Inc. (investment adviser firm). In addition, Mr. Lynch serves as a Trustee of Boston College and as the Chairman of the Inner-City Scholarship Fund. Previously, Mr. Lynch served on the Special Olympics International Board of Directors (1997-2006).
Elizabeth Paige Baumann (1968)
Year of Election or Appointment: 2017
Anti-Money Laundering (AML) Officer
Ms. Baumann also serves as AML Officer of other funds. She is Chief AML Officer (2012-present) and Senior Vice President (2014-present) of FMR LLC (diversified financial services company) and is an employee of Fidelity Investments. Previously, Ms. Baumann served as AML Officer of the funds (2012-2016), and Vice President (2007-2014) and Deputy Anti-Money Laundering Officer (2007-2012) of FMR LLC.
Marc R. Bryant (1966)
Year of Election or Appointment: 2015
Secretary and Chief Legal Officer (CLO)
Mr. Bryant also serves as Secretary and CLO of other funds. Mr. Bryant serves as CLO, Secretary, and Senior Vice President of Fidelity Management & Research Company (investment adviser firm, 2015-present) and FMR Co., Inc. (investment adviser firm, 2015-present); Secretary of Fidelity SelectCo, LLC (investment adviser firm, 2015-present) and Fidelity Investments Money Management, Inc. (investment adviser firm, 2015-present); and CLO of Fidelity Management & Research (Hong Kong) Limited and FMR Investment Management (UK) Limited (investment adviser firms, 2015-present) and Fidelity Management & Research (Japan) Limited (investment adviser firm, 2016-present). He is Senior Vice President and Deputy General Counsel of FMR LLC (diversified financial services company). Previously, Mr. Bryant served as Secretary and CLO of Fidelity Rutland Square Trust II (2010-2014) and Assistant Secretary of Fidelity's Fixed Income and Asset Allocation Funds (2013-2015). Prior to joining Fidelity Investments, Mr. Bryant served as a Senior Vice President and the Head of Global Retail Legal for AllianceBernstein L.P. (2006-2010), and as the General Counsel for ProFund Advisors LLC (2001-2006).
William C. Coffey (1969)
Year of Election or Appointment: 2009
Assistant Secretary
Mr. Coffey also serves as Assistant Secretary of other funds. He is Senior Vice President and Deputy General Counsel of FMR LLC (diversified financial services company, 2010-present), and is an employee of Fidelity Investments. Previously, Mr. Coffey served as Vice President and Associate General Counsel of FMR LLC (2005-2009).
Jonathan Davis (1968)
Year of Election or Appointment: 2010
Assistant Treasurer
Mr. Davis also serves as Assistant Treasurer of other funds. Mr. Davis serves as Assistant Treasurer of FMR Capital, Inc. (2017-present) and is an employee of Fidelity Investments. Previously, Mr. Davis served as Vice President and Associate General Counsel of FMR LLC (diversified financial services company, 2003-2010).
Adrien E. Deberghes (1967)
Year of Election or Appointment: 2016
Assistant Treasurer
Mr. Deberghes also serves as an officer of other funds. He serves as Assistant Treasurer of FMR Capital, Inc. (2017-present), Executive Vice President of Fidelity Investments Money Management, Inc. (FIMM) (investment adviser firm, 2016-present), and is an employee of Fidelity Investments (2008-present). Prior to joining Fidelity Investments, Mr. Deberghes was Senior Vice President of Mutual Fund Administration at State Street Corporation (2007-2008), Senior Director of Mutual Fund Administration at Investors Bank & Trust (2005-2007), and Director of Finance for Dunkin' Brands (2000-2005). Previously, Mr. Deberghes served in other fund officer roles.
Stephanie J. Dorsey (1969)
Year of Election or Appointment: 2010
Assistant Treasurer
Ms. Dorsey also serves as an officer of other funds. Ms. Dorsey serves as Assistant Treasurer of FMR Capital, Inc. (2017-present), is an employee of Fidelity Investments (2008-present), and has served in other fund officer roles. Prior to joining Fidelity Investments, Ms. Dorsey served as Treasurer (2004-2008) of the JPMorgan Mutual Funds and Vice President (2004-2008) of JPMorgan Chase Bank.
Howard J. Galligan III (1966)
Year of Election or Appointment: 2014
Chief Financial Officer
Mr. Galligan also serves as Chief Financial Officer of other funds. Mr. Galligan serves as President of Fidelity Pricing and Cash Management Services (FPCMS) (2014-present) and as a Director of Strategic Advisers, Inc. (investment adviser firm, 2008-present). Previously, Mr. Galligan served as Chief Administrative Officer of Asset Management (2011-2014) and Chief Operating Officer and Senior Vice President of Investment Support for Strategic Advisers, Inc. (2003-2011).
Brian B. Hogan (1964)
Year of Election or Appointment: 2009
Vice President
Mr. Hogan also serves as Trustee or Vice President of other funds. Mr. Hogan serves as a Director of FMR Investment Management (UK) Limited (investment adviser firm, 2015-present) and Fidelity SelectCo, LLC (investment adviser firm, 2014-present) and President of the Equity Division of FMR (investment adviser firm, 2009-present). Previously, Mr. Hogan served as Senior Vice President, Equity Research of FMR (2006-2009) and as a portfolio manager. Mr. Brian B. Hogan is not related to Mr. Colm A. Hogan.
Colm A. Hogan (1973)
Year of Election or Appointment: 2016
Deputy Treasurer
Mr. Hogan also serves as an officer of other funds. Mr. Hogan serves as Assistant Treasurer of FMR Capital, Inc. (2017-present) and is an employee of Fidelity Investments (2005-present). Mr. Colm A. Hogan is not related to Mr. Brian B. Hogan.
Chris Maher (1972)
Year of Election or Appointment: 2013
Assistant Treasurer
Mr. Maher serves as Assistant Treasurer of other funds. Mr. Maher is Vice President of Valuation Oversight, serves as Assistant Treasurer of FMR Capital, Inc. (2017-present), and is an employee of Fidelity Investments. Previously, Mr. Maher served as Vice President of Asset Management Compliance (2013), Vice President of the Program Management Group of FMR (investment adviser firm, 2010-2013), and Vice President of Valuation Oversight (2008-2010).
Rieco E. Mello (1969)
Year of Election or Appointment: 2017
Assistant Treasurer
Mr. Mello also serves as Assistant Treasurer of other funds. Mr. Mello serves as Assistant Treasurer of FMR Capital, Inc. (2017-present) and is an employee of Fidelity Investments (1995-present).
Melissa M. Reilly (1971)
Year of Election or Appointment: 2014
Vice President of certain Equity Funds
Ms. Reilly also serves as Vice President of other funds. Ms. Reilly is an employee of Fidelity Investments (2004-present).
Kenneth B. Robins (1969)
Year of Election or Appointment: 2016
Chief Compliance Officer
Mr. Robins also serves as an officer of other funds. Mr. Robins serves as Compliance Officer of Fidelity Management & Research Company and FMR Co., Inc. (investment adviser firms, 2016-present) and is an employee of Fidelity Investments (2004-present). Previously, Mr. Robins served as Executive Vice President of Fidelity Investments Money Management, Inc. (investment adviser firm, 2013-2016) and served in other fund officer roles.
Stacie M. Smith (1974)
Year of Election or Appointment: 2016
President and Treasurer
Ms. Smith also serves as an officer of other funds. Ms. Smith serves as Assistant Treasurer of FMR Capital, Inc. (2017-present), is an employee of Fidelity Investments (2009-present), and has served in other fund officer roles. Prior to joining Fidelity Investments, Ms. Smith served as Senior Audit Manager of Ernst & Young LLP (accounting firm, 1996-2009). Previously, Ms. Smith served as Deputy Treasurer of certain Fidelity® funds (2013-2016).
Marc L. Spector (1972)
Year of Election or Appointment: 2016
Assistant Treasurer
Mr. Spector also serves as an officer of other funds. Mr. Spector serves as Assistant Treasurer of FMR Capital, Inc. (2017-present) and is an employee of Fidelity Investments (2016-present). Prior to joining Fidelity Investments, Mr. Spector served as Director at the Siegfried Group (accounting firm, 2013-2016), and prior to Siegfried Group as audit senior manager at Deloitte & Touche (accounting firm, 2005-2013).
Renee Stagnone (1975)
Year of Election or Appointment: 2016
Assistant Treasurer
Ms. Stagnone also serves as an officer of other funds. Ms. Stagnone serves as Assistant Treasurer of FMR Capital, Inc. (2017-present) and is an employee of Fidelity Investments (1997-present). Previously, Ms. Stagnone served as Deputy Treasurer of certain Fidelity® funds (2013-2016).
Shareholder Expense Example
As a shareholder of the Fund, you incur two types of costs: (1) transaction costs, and (2) ongoing costs, including other Fund expenses. This Example is intended to help you understand your ongoing costs (in dollars) of investing in the Fund and to compare these costs with the ongoing costs of investing in other mutual funds.
The Example is based on an investment of $1,000 invested at the beginning of the period and held for the entire period (July 1, 2017 to December 31, 2017).
Actual Expenses
The first line of the accompanying table provides information about actual account values and actual expenses. You may use the information in this line, together with the amount you invested, to estimate the expenses that you paid over the period. Simply divide your account value by $1,000.00 (for example, an $8,600 account value divided by $1,000.00 = 8.6), then multiply the result by the number in the first line under the heading entitled "Expenses Paid During Period" to estimate the expenses you paid on your account during this period. In addition, the Fund, as a shareholder in the underlying Fidelity Central Funds, will indirectly bear its pro-rata share of the fees and expenses incurred by the underlying Fidelity Central Funds. These fees and expenses are not included in the Fund's annualized expense ratio used to calculate the expense estimate in the table below.
Hypothetical Example for Comparison Purposes
The second line of the accompanying table provides information about hypothetical account values and hypothetical expenses based on the Fund's actual expense ratio and an assumed rate of return of 5% per year before expenses, which is not the Fund's actual return. The hypothetical account values and expenses may not be used to estimate the actual ending account balance or expenses you paid for the period. You may use this information to compare the ongoing costs of investing in the Fund and other funds. To do so, compare this 5% hypothetical example with the 5% hypothetical examples that appear in the shareholder reports of the other funds. In addition, the Fund, as a shareholder in the underlying Fidelity Central Funds, will indirectly bear its pro-rata share of the fees and expenses incurred by the underlying Fidelity Central Funds. These fees and expenses are not included in the Fund's annualized expense ratio used to calculate the expense estimate in the table below.
Please note that the expenses shown in the table are meant to highlight your ongoing costs only and do not reflect any transaction costs. Therefore, the second line of the table is useful in comparing ongoing costs only, and will not help you determine the relative total costs of owning different funds.
| | Annualized Expense Ratio-A | Beginning
Account Value
July 1, 2017 | Ending
Account Value
December 31, 2017 | Expenses Paid
During Period
July 1, 2017
to December 31, 2017-B |
| Actual | - %-C | $1,000.00 | $1,142.60 | $- |
| Hypothetical-D | | $1,000.00 | $1,025.21 | $- |
A Annualized expense ratio reflects expenses net of applicable fee waivers.
B Expenses are equal to the Fund's annualized expense ratio, multiplied by the average account value over the period, multiplied by 184/365 (to reflect the one-half year period).
C Amount represents less than .005%.
D 5% return per year before expenses
Distributions (Unaudited)
The fund designates 69% of the dividend distributed during the fiscal year as qualifying for the dividends–received deduction for corporate shareholders.
The fund designates 77% of the dividend distributed during the fiscal year as amounts which may be taken into account as a dividend for the purposes of the maximum rate under section 1(h)(11) of the Internal Revenue Code.
The fund will notify shareholders in January 2018 of amounts for use in preparing 2017 income tax returns.
Corporate Headquarters
245 Summer St.
Boston, MA 02210
www.fidelity.com
ZPI-ANN-0218
1.9881595.100
Item 2.
Code of Ethics
As of the end of the period, December 31, 2017, Fidelity Contrafund (the trust) has adopted a code of ethics, as defined in Item 2 of Form N-CSR, that applies to its President and Treasurer and its Chief Financial Officer. A copy of the code of ethics is filed as an exhibit to this Form N-CSR.
Item 3.
Audit Committee Financial Expert
The Board of Trustees of the trust has determined that Joseph Mauriello is an audit committee financial expert, as defined in Item 3 of Form N-CSR. Mr. Mauriello is independent for purposes of Item 3 of Form N-CSR.
Item 4.
Principal Accountant Fees and Services
Fees and Services
The following table presents fees billed by PricewaterhouseCoopers LLP (“PwC”) in each of the last two fiscal years for services rendered to Fidelity Advisor New Insights Fund, Fidelity Advisor Series Opportunistic Insights Fund, Fidelity Contrafund, Fidelity Contrafund K6, Fidelity Flex Opportunistic Insights Fund and Fidelity Series Opportunistic Insights Fund (the “Funds”):
Services Billed by PwC
December 31, 2017 FeesA,B
| | | | |
| Audit Fees | Audit-Related Fees | Tax Fees | All Other Fees |
Fidelity Advisor New Insights Fund | $87,000 | $7,000 | $69,000 | $3,400 |
Fidelity Advisor Series Opportunistic Insights Fund | $70,000 | $6,200 | $4,600 | $3,000 |
Fidelity Contrafund | $167,000 | $13,400 | $32,700 | $6,400 |
Fidelity Contrafund K6 | $65,000 | $3,400 | $3,800 | $1,600 |
Fidelity Flex Opportunistic Insights Fund | $52,000 | $3,600 | $4,600 | $1,700 |
Fidelity Series Opportunistic Insights Fund | $77,000 | $6,800 | $4,600 | $3,300 |
| | | | |
December 31, 2016 FeesA,B,C
| | | | |
| Audit Fees | Audit-Related Fees | Tax Fees | All Other Fees |
Fidelity Advisor New Insights Fund | $87,000 | $6,900 | $6,700 | $3,200 |
Fidelity Advisor Series Opportunistic Insights Fund | $73,000 | $6,000 | $5,400 | $2,800 |
Fidelity Contrafund | $217,000 | $14,800 | $20,000 | $7,000 |
Fidelity Contrafund K6 | $- | $- | $- | $- |
Fidelity Flex Opportunistic Insights Fund | $- | $- | $- | $- |
Fidelity Series Opportunistic Insights Fund | $79,000 | $6,600 | $4,800 | $3,100 |
| | | | |
| | | | |
A Amounts may reflect rounding.
B Fidelity Contrafund K6 commenced operations on May 25, 2017 and Fidelity Flex Opportunistic Insights Fund commenced operations on March 8, 2017.
C Certain amounts have been reclassified to align with current period presentation.
The following table presents fees billed by PwC that were required to be approved by the Audit Committee for services that relate directly to the operations and financial reporting of the Funds and that are rendered on behalf of Fidelity Management & Research Company (“FMR”) and entities controlling, controlled by, or under common control with FMR (not including any sub-adviser whose role is primarily portfolio management and is subcontracted with or overseen by another investment adviser) that provide ongoing services to the Funds (“Fund Service Providers”):
Services Billed by PwC
| | |
| December 31, 2017A,B | December 31, 2016A,B |
Audit-Related Fees | $8,470,00 | $6,240,000 |
Tax Fees | $160,000 | $10,000 |
All Other Fees | $- | $- |
A Amounts may reflect rounding.
B May include amounts billed prior to the Fidelity Contrafund K6 and Fidelity Flex Opportunistic Insights Fund’s commencement of operations.
“Audit-Related Fees” represent fees billed for assurance and related services that are reasonably related to the performance of the fund audit or the review of the fund's financial statements and that are not reported under Audit Fees.
“Tax Fees” represent fees billed for tax compliance, tax advice or tax planning that relate directly to the operations and financial reporting of the fund.
“All Other Fees” represent fees billed for services provided to the fund or Fund Service Provider, a significant portion of which are assurance related, that relate directly to the operations and financial reporting of the fund, excluding those services that are reported under Audit Fees, Audit-Related Fees or Tax Fees.
Assurance services must be performed by an independent public accountant.
* * *
The aggregate non-audit fees billed by PwC for services rendered to the Funds, FMR (not including any sub-adviser whose role is primarily portfolio management and is subcontracted with or overseen by another investment adviser), and any Fund Service Provider for each of the last two fiscal years of the Funds are as follows:
| | |
Billed By | December 31, 2017A,B | December 31, 2016A,B,C |
PwC | $10,895,000 | $7,720,000 |
A Amounts may reflect rounding.
B May include amounts billed prior to the Fidelity Contrafund K6 and Fidelity Flex Opportunistic Insights Fund’s commencement of operations.
C Certain amounts have been reclassified to align with current period presentation.
The trust's Audit Committee has considered non-audit services that were not pre-approved that were provided by PwC to Fund Service Providers to be compatible with maintaining the independence of PwC in its audit of the Funds, taking into account representations from PwC, in accordance with Public Company Accounting Oversight Board rules, regarding its independence from the Funds and their related entities and FMR’s review of the appropriateness and permissibility under applicable law of such non-audit services prior to their provision to the Fund Service Providers.
Audit Committee Pre-Approval Policies and Procedures
The trust’s Audit Committee must pre-approve all audit and non-audit services provided by a fund’s independent registered public accounting firm relating to the operations or financial reporting of the fund. Prior to the commencement of any audit or non-audit services to a fund, the Audit Committee reviews the services to determine whether they are appropriate and permissible under applicable law.
The Audit Committee has adopted policies and procedures to, among other purposes, provide a framework for the Committee’s consideration of non-audit services by the audit firms that audit the Fidelity funds. The policies and procedures require that any non-audit service provided by a fund audit firm to a Fidelity fund and any non-audit service provided by a fund auditor to a Fund Service Provider that relates directly to the operations and financial reporting of a Fidelity fund (“Covered Service”) are subject to approval by the Audit Committee before such service is provided.
All Covered Services must be approved in advance of provision of the service either: (i) by formal resolution of the Audit Committee, or (ii) by oral or written approval of the service by the Chair of the Audit Committee (or if the Chair is unavailable, such other member of the Audit Committee as may be designated by the Chair to act in the Chair’s absence). The approval contemplated by (ii) above is permitted where the Treasurer determines that action on such an engagement is necessary before the next meeting of the Audit Committee.
Non-audit services provided by a fund audit firm to a Fund Service Provider that do not relate directly to the operations and financial reporting of a Fidelity fund are reported to the Audit Committee on a periodic basis.
Non-Audit Services Approved Pursuant to Rule 2-01(c)(7)(i)(C) and (ii) of Regulation S-X (“De Minimis Exception”)
There were no non-audit services approved or required to be approved by the Audit Committee pursuant to the De Minimis Exception during the Funds’ last two fiscal years relating to services provided to (i) the Funds or (ii) any Fund Service Provider that relate directly to the operations and financial reporting of the Funds.
Item 5.
Audit Committee of Listed Registrants
Not applicable.
Item 6.
Investments
(a)
Not applicable.
(b)
Not applicable
Item 7.
Disclosure of Proxy Voting Policies and Procedures for Closed-End Management Investment Companies
Not applicable.
Item 8.
Portfolio Managers of Closed-End Management Investment Companies
Not applicable.
Item 9.
Purchase of Equity Securities by Closed-End Management Investment Company and Affiliated Purchasers
Not applicable.
Item 10.
Submission of Matters to a Vote of Security Holders
There were no material changes to the procedures by which shareholders may recommend nominees to the trust’s Board of Trustees.
Item 11.
Controls and Procedures
(a)(i) The President and Treasurer and the Chief Financial Officer have concluded that the trust’s disclosure controls and procedures (as defined in Rule 30a-3(c) under the Investment Company Act) provide reasonable assurances that material information relating to the trust is made known to them by the appropriate persons, based on their evaluation of these controls and procedures as of a date within 90 days of the filing date of this report.
(a)(ii) There was no change in the trust’s internal control over financial reporting (as defined in Rule 30a-3(d) under the Investment Company Act) that occurred during the second fiscal quarter of the period covered by this report that has materially affected, or is reasonably likely to materially affect, the trust’s internal control over financial reporting.
Item 12.
Exhibits
| | |
(a) | (1) | Code of Ethics pursuant to Item 2 of Form N-CSR is filed and attached hereto as EX-99.CODE ETH. |
(a) | (2) | Certification pursuant to Rule 30a-2(a) under the Investment Company Act of 1940 (17 CFR 270.30a-2(a)) is filed and attached hereto as Exhibit 99.CERT. |
(a) | (3) | Not applicable. |
(b) | | Certification pursuant to Rule 30a-2(b) under the Investment Company Act of 1940 (17 CFR 270.30a-2(b)) is furnished and attached hereto as Exhibit 99.906CERT. |
SIGNATURES
Pursuant to the requirements of the Securities Exchange Act of 1934 and the Investment Company Act of 1940, the registrant has duly caused this report to be signed on its behalf by the undersigned, thereunto duly authorized.
Fidelity Contrafund
| |
By: | /s/Stacie M. Smith |
| Stacie M. Smith |
| President and Treasurer |
| |
Date: | February 26, 2018 |
Pursuant to the requirements of the Securities Exchange Act of 1934 and the Investment Company Act of 1940, this report has been signed below by the following persons on behalf of the registrant and in the capacities and on the dates indicated.
| |
By: | /s/ Stacie M. Smith |
| Stacie M. Smith |
| President and Treasurer |
| |
Date: | February 26, 2018 |
| |
By: | /s/Howard J. Galligan III |
| Howard J. Galligan III |
| Chief Financial Officer |
| |
Date: | February 26, 2018 |