UNITED STATES
SECURITIES AND EXCHANGE COMMISSION
WASHINGTON, D.C. 20549
FORM 10-K
(MARK ONE)
x | ANNUAL REPORT PURSUANT TO SECTION 13 OR 15 (d) OF THE SECURITIES EXCHANGE ACT OF 1934 |
For the fiscal year ended September 29, 2012
OR
o | TRANSITION REPORT PURSUANT TO SECTION 13 OR 15 (d) OF THE SECURITIES EXCHANGE ACT OF 1934 |
For the transition period from to
Commission file number 0-7597
Courier Corporation
A Massachusetts corporation
I.R.S. Employer Identification No. 04-2502514
15 Wellman Avenue, North Chelmsford, Massachusetts 01863, Telephone No. 978-251-6000
Securities registered pursuant to Section 12(b) of the Act:
Common Stock, $1 par value; Preferred Stock Purchase Rights
Securities registered pursuant to Section 12(g) of the Act: None
Indicate by check mark whether the registrant is a well-known seasoned issuer, as defined in Rule 405 of the Securities Act. Yes o No x
Indicate by check mark if the registrant is not required to file reports pursuant to Section 13 of 15(d) of the Act. Yes o No x
Indicate by check mark whether the registrant (1) has filed all reports required to be filed by Section 13 or 15(d) of the Securities Exchange Act of 1934 during the preceding 12 months (or for such shorter period that the registrant was required to file such reports), and (2) has been subject to such filing requirements for the past 90 days. Yes x No o
Indicate by check mark whether the registrant has submitted electronically and posted on its corporate Web site, if any, every Interactive Data File required to be submitted and posted pursuant to Rule 405 of Regulation S-T during the preceding 12 months (or for such shorter period that the registrant was required to submit and post such files). Yes x No o
Indicate by check mark if disclosure of delinquent filers pursuant to Item 405 of Regulation S-K is not contained herein, and will not be contained, to the best of the registrant’s knowledge, in definitive proxy or information statements incorporated by reference in Part III of the Form 10-K or any amendment to this Form 10-K. o
Indicate by check mark whether the registrant is a large accelerated filer, an accelerated filer, a non-accelerated filer or a smaller reporting company. (See the definitions of “large accelerated filer”, “accelerated filer” and “smaller reporting company” in Rule 12b-2 of the Exchange Act.)
Large accelerated filer o |
| Accelerated filer x |
|
|
|
Non-accelerated filer o |
| Smaller reporting company o |
(Do not check if a smaller reporting company) |
|
|
Indicate by check mark whether the registrant is a shell company (as defined in Rule 12b-2 of the Exchange Act). Yes o No x
State the aggregate market value of the voting and non-voting common equity held by non-affiliates computed by reference to the price at which the common equity was last sold as of the last business day of the registrant’s most recently completed second fiscal quarter (March 24, 2012).
Common Stock, $1 par value - $101,282,034
Indicate the number of shares outstanding of each of the registrant’s classes of common stock as of November 26, 2012.
Common Stock $1 par value — 11,528,425
DOCUMENTS INCORPORATED BY REFERENCE
Portions of the registrant’s proxy statement related to its Annual Meeting of Stockholders scheduled to be held on January 22, 2013 are incorporated herein by reference to Part III of this Form 10-K.
Form 10-K |
|
|
|
|
Item No. |
| Name of Item |
| Page |
|
|
|
|
|
|
|
|
| |
|
| 1 | ||
|
| 5 | ||
|
| 11 | ||
|
| 11 | ||
|
| 12 | ||
|
| 12 | ||
|
|
|
|
|
|
|
|
| |
|
| 12 | ||
|
| 13 | ||
| Management’s Discussion and Analysis of Financial Condition and Results of Operations |
| 13 | |
|
| 14 | ||
|
| 14 | ||
| Changes in and Disagreements with Accountants on Accounting and Financial Disclosure |
| 14 | |
|
| 14 | ||
|
| 16 | ||
|
|
|
|
|
|
|
|
| |
|
| 17 | ||
|
| 17 | ||
| Security Ownership of Certain Beneficial Owners and Management and Related Stockholder Matters |
| 17 | |
| Certain Relationships and Related Transactions and Director Independence |
| 18 | |
|
| 18 | ||
|
|
|
|
|
|
|
|
| |
|
| 19 | ||
|
|
| 24 |
INTRODUCTION
Courier Corporation, together with its subsidiaries, (“Courier,” the “Company,” “We,” “Our,” or “Us”) is among America’s largest book manufacturers and a leader in content management and customization in new and traditional media. The Company also publishes books under three brands offering award-winning content and thousands of titles. Courier Corporation, founded in 1824, was incorporated under the laws of Massachusetts on June 30, 1972. The Company has two operating segments: book manufacturing and publishing.
The book manufacturing segment focuses on streamlining the process of bringing books from the point of creation to the point of use. Based on sales, Courier is the third largest book manufacturer in the United States, offering services from prepress and production through storage and distribution, as well as innovative content management, customization, and state-of-the-art digital print capabilities. Courier’s principal book manufacturing markets are religious, education and specialty trade. Revenues from this segment accounted for approximately 89% of Courier’s consolidated sales in fiscal 2012.
The publishing segment consists of Dover Publications, Inc. (“Dover”), Research & Education Association, Inc. (“REA”), and Federal Marketing Corporation, d/b/a Creative Homeowner (“Creative Homeowner”). Dover publishes over 9,000 titles in more than 30 specialty categories including children’s books, literature, art, music, crafts, mathematics, science, religion and architecture. REA publishes test preparation and study guide books for high school, college and graduate students, and professionals. Creative Homeowner publishes books on home design, decorating, landscaping and gardening, and also sells home plans. Revenues in this segment were approximately 15% of consolidated sales in fiscal 2012.
The combination of Dover’s, REA’s, and Creative Homeowner’s publishing, sales and distribution skills with Courier’s book manufacturing, digital content conversion, and e-commerce skills provides a comprehensive end-to-end solution for Courier’s customers.
Sales by segment |
| 2012 |
| % |
| 2011 |
| % |
| 2010 |
| % |
| |||
|
|
|
|
|
|
|
|
|
|
|
|
|
| |||
Book Manufacturing |
| $ | 233.0 |
| 89 | % | $ | 230.2 |
| 89 | % | $ | 222.8 |
| 87 | % |
Publishing |
| 38.4 |
| 15 | % | 40.8 |
| 16 | % | 46.0 |
| 18 | % | |||
Intersegment sales |
| (10.1 | ) | (4 | )% | (11.7 | ) | (5 | )% | (11.7 | ) | (5 | )% | |||
Total |
| $ | 261.3 |
| 100 | % | $ | 259.4 |
| 100 | % | $ | 257.1 |
| 100 | % |
Additional segment information, including the amounts of operating income and total assets, for each of the last three fiscal years, is contained in Note L in the Notes to Consolidated Financial Statements included in this Annual Report on Form 10-K.
OPERATING SEGMENTS
BOOK MANUFACTURING SEGMENT
Courier’s book manufacturing segment produces hard and softcover books, manages content and provides warehousing and distribution services for its customers, which include publishers, religious organizations and other information providers. Courier provides book manufacturing and related services from five facilities in Westford and North Chelmsford, Massachusetts; Philadelphia, Pennsylvania; and Kendallville and Terre Haute, Indiana.
On January 15, 2010, the Company acquired the assets of Highcrest Media LLC (“Highcrest Media”), a Massachusetts-based provider of solutions that streamline the production of customized textbooks and other materials for use in colleges, universities and businesses. The acquisition of Highcrest Media complements the Company’s investments during fiscal years 2011 and 2010 in digital
printing technology. The $3 million cash acquisition, with additional potential “earn out” payments of up to $1.2 million, was accounted for as a purchase, and accordingly, Highcrest Media’s financial results are included in the book manufacturing segment in the consolidated financial statements from the date of acquisition.
In the second quarter of fiscal 2011, the Company closed its Stoughton, Massachusetts manufacturing facility due to the impact of technology and competitive pressures affecting the one-color paperback books in which the plant specialized. The Company consolidated the Stoughton operations into its other manufacturing facilities. In fiscal 2012, the Company further reduced its one-color offset press capacity at its Westford, Massachusetts facility.
Courier’s book manufacturing operations utilize both offset and digital print technologies, combined with various binding capabilities, to produce both soft and hard cover books. Each of Courier’s five facilities work together, although each has certain specialties adapted to the needs of the market niches Courier serves, such as printing on lightweight paper, book cover production, four-color book manufacturing, and digital printing. These services are primarily sold to publishers of educational, religious and trade books. Since 2004, the Company has expanded its four-color offset book manufacturing capabilities with the addition of four new four-color manroland offset presses at its Kendallville, Indiana facility. During 2010, the Company built a state-of-the-art digital printing operation at its North Chelmsford, Massachusetts facility through a relationship with HP, installed two more digital presses in fiscal 2011 and announced plans to install another digital press in Kendallville in 2013. These digital print capabilities, combined with Highcrest Media, comprise the Company’s newest market offering, Courier Digital Solutions. In addition, Highcrest Media manages content for leading financial services companies.
During fiscal 2009, the Company was awarded Chain-of-Custody certification by two leading environmental organizations, the Sustainable Forestry Initiative (SFI) and the Programme for the Endorsement of Forestry Certification (PEFC). This new dual certification complements Courier’s existing certification by the Forest Stewardship Council (FSC) and marks the Company as “triple-certified” for its systematic adherence to environmentally responsible practices in the use of paper and other forest products throughout its manufacturing locations.
Courier’s book manufacturing sales force of 15 people is responsible for all of the Company’s sales to almost 400 book-manufacturing customers. Courier’s salespeople operate out of sales offices located in New York, New York; Philadelphia, Pennsylvania; Terre Haute, Indiana; and North Chelmsford, Massachusetts.
Sales to Pearson Education, Inc. aggregated approximately 30% of consolidated sales in fiscal years 2012 and 2011 and 25% in fiscal 2010. Sales to The Gideons International aggregated approximately 25% of consolidated sales in fiscal 2012, 23% in fiscal 2011 and 22% in fiscal 2010. A significant reduction in order volumes or price levels from these customers could have a material adverse effect on the Company. No other customer accounted for more than 10% of consolidated sales in any of the past three fiscal years. The Company distributes products around the world; export sales, as a percentage of consolidated sales, were approximately 21% in fiscal 2012, 20% in fiscal 2011 and 19% in fiscal 2010. Approximately 92% of the export sales were in the book manufacturing segment in fiscal year 2012 and 90% in both fiscal years 2011 and 2010.
All phases of Courier’s business are highly competitive. The printing industry includes over 30,000 companies. While most of these companies are relatively small, several of the Company’s competitors are considerably larger or are affiliated with companies that are considerably larger and have greater financial resources than Courier. In recent years, consolidation of both customers and competitors within the Company’s markets has increased pricing pressures. The major competitive factors in Courier’s book manufacturing business in addition to price are product quality, speed of delivery, customer service, availability of appropriate printing capacity and paper, related services and technology support.
PUBLISHING SEGMENT
Dover, a subsidiary of the Company, is a publisher of books in over 30 specialty categories, including fine and commercial arts, children’s books, crafts, music scores, graphic design, mathematics, physics and other areas of science, puzzles, games, social science, stationery items, and classics of literature for both juvenile and adult markets, including the Dover Thrift Editionsä. In 2005, Dover began developing proprietary packaged products under its Dover Fun Kitsä line. In 2008, Dover introduced a new premium series of hardcover reproductions, Dover Calla Editionsä and in 2012, launched a new adult coloring series, Creative Havenä and an online image store, DoverPicturaä.
Dover sells its products through most American bookstore chains, online retailers, independent booksellers, mass merchandisers, children’s stores, craft stores and gift shops, as well as a diverse range of distributors around the world. Dover sells its e-books through all of the major e-book platforms. Dover has also sold its books directly to consumers for over 50 years through its specialty catalogs and over the Internet at www.doverpublications.com. Dover mails its proprietary catalogs to nearly 400,000 consumers and annually sends almost 180 million emails to electing customers. Dover also maintains www.DoverDirect.com, which is a business-to-business site for its retailers and distributors, and its image store at www.DoverPictura.com.
In the second quarter of fiscal 2009, due to a decline in sales and profits at Dover resulting from the continued downturn in the economic environment and in consumer spending, the Company recorded a non-cash, pre-tax impairment charge of $15.6 million, which represented 100% of Dover’s goodwill.
REA publishes more than 800 test preparation and study guide titles. Product lines include Problem Solvers®, Essentials®, Super Reviews® and Test Preparation books, including its new Crash Courseä and All Access Seriesä. REA sells its products around the world through major bookseller chains, online retailers, college bookstores, and teachers’ supply stores, as well as directly to teachers and other consumers through catalogs and over the Internet at www.REA.com. REA sells its e-books through all of the major e-book platforms.
In the third quarter of fiscal 2011, faced with the prospect of Borders Group, Inc.’s liquidation, significant store closings and the permanent loss of what was an important customer, the Company concluded that the carrying value of REA’s goodwill exceeded its estimated fair market value and a pre-tax impairment charge of $8.6 million was recorded, representing 100% of REA’s goodwill as well as approximately $200,000 for prepublication costs related to underperforming titles.
Creative Homeowner is a publisher of books, home plans, and related products for the home and garden retail book market. Creative Homeowner’s 110 titles include books on home decoration, design and improvement, as well as gardening and landscaping. Its products are sold primarily through home and garden centers and online retailers, as well as bookstores and direct to consumers over the Internet at www.creativehomeowner.com. From its line of home plan books, Creative Homeowner offers over 10,000 home plans from which consumers can order blueprints directly over the Internet at www.ultimateplans.com.
In the third quarter of fiscal 2008, Creative Homeowner experienced a precipitous decline in sales and profits, due in large part to the downturn in the housing market and reduction in store traffic at home improvement centers and other large retail chain stores. As a result, the Company recorded a non-cash, pre-tax impairment charge of $23.6 million in fiscal 2008. In addition to other remedial measures, the Company decided to cease Creative Homeowner’s book distribution operation that served a single customer, allowing it to concentrate on its principal publishing operations. This transition was completed in the second quarter of fiscal 2009. During the third quarter of fiscal 2010, the Company continued to integrate functions across this segment and consolidated Creative Homeowner’s warehousing with the other publishing businesses in order to reduce costs. Despite these cost cutting measures, the prolonged weakness in the housing market led to a further decline in sales and operating results in the fourth quarter. As a result, the Company impaired the remaining goodwill and other intangible assets of Creative Homeowner, as well as $0.5 million of prepublication costs, resulting in a non-cash, pre-tax
impairment charge of $4.7 million. In 2012, the Company reduced costs at Creative Homeowner by further integrating functions across the segment.
As part of Courier’s company-wide green initiative, in 2008 Dover, REA and Creative Homeowner launched a new trade mark, Green Editionä, owned by Courier. In order to be eligible to bear the mark, books must not only be manufactured from recycled paper but also be manufactured in the United States with its stringent environmental standards. Books that carry this mark have a smaller environmental impact than most books. The mark is currently being licensed on a royalty-free basis to other publishing customers who have also expressed a desire to use it.
The U.S. publishing market is comprised of thousands of publishers, many of these publishers are much larger than Dover, REA, or Creative Homeowner, or are part of much larger organizations. In addition, newer sources of competition have emerged with large retailers launching or expanding publishing operations and with the continued adoption of e-books by consumers. In addition, new web-based publishing businesses are starting up. Dover distinguishes its products by offering an extremely wide variety of high quality books at modest prices. REA offers high quality study guides, test preparation books and software products in almost every academic area including many specialized areas such as teacher certification, adult education, and professional licensing. Creative Homeowner provides books on home improvement and landscaping that include high-quality photographs, illustrations and written content.
MATERIALS AND SUPPLIES
Courier purchases its principal raw materials, primarily paper, but also plate materials, ink, adhesives, cover stock, casebinding materials and cartons, from numerous suppliers, and is not dependent upon any one source for its requirements. Many of Courier’s book manufacturing customers purchase their own paper and furnish it at no charge to Courier for book production. Dover, REA and Creative Homeowner purchase a significant portion of their books from Courier’s book manufacturing operations. Paper prices have been relatively stable over the last eighteen months.
ENVIRONMENTAL REGULATIONS
The Company’s operations are subject to federal, state and local environmental laws and regulations relating to, among other things: air emissions; waste generation, handling, management and disposal; wastewater treatment and discharge; and remediation of soil and groundwater contamination. The Company periodically makes capital expenditures so that its operations comply, in all material respects, with applicable environmental laws and regulations. No significant expenditures for this purpose were made in 2012 or are anticipated in 2013. In 2007, the Company adopted an “Environmental, Health and Safety Policy” which is available on the Company’s website at www.courier.com. The Company does not believe that its compliance with applicable environmental laws and regulations will have a material impact on the Company’s financial condition or liquidity.
EMPLOYEES
The Company employed 1,501 persons at September 29, 2012 compared to 1,568 a year ago. The Company’s relations with its employees are satisfactory.
OTHER
Courier’s educational sales, which represent over a third of its business, has seasonal demand which is highest in the second half of our fiscal year, with the peak season being in the Company’s fourth quarter. The remainder of Courier’s business is not significantly seasonal in nature. There is no portion of Courier’s business subject to cancellation of government contracts or renegotiation of profits.
Courier does not hold any material patents, licenses, franchises or concessions upon which our operations are dependent, but does have trademarks, service marks, and Universal Resource Locators (URL’s) on the Internet in connection with each of its business segments. Through its acquisition of
Highcrest Media, the Company owns certain customization software utilized by its customers in the publishing and financial services industries. Substantially all of REA’s and Creative Homeowner’s publications and a majority of Dover’s publications are protected by copyright, either in its own name, in the name of the author of the work, or in the name of a predecessor publisher from whom rights were acquired. Many of Dover’s publications include works that are in the public domain.
The Company makes available free of charge (as soon as reasonably practicable after they are filed with the Securities and Exchange Commission) copies of its Annual Report on Form 10-K, as well as all other reports required to be filed by Section 13(a) or 15(d) of the Securities Exchange Act of 1934, via the Internet at www.courier.com or upon written request to Peter M. Folger, Senior Vice President and Chief Financial Officer, Courier Corporation, 15 Wellman Avenue, North Chelmsford, MA 01863.
The Company’s consolidated results of operations, financial condition and cash flows can be adversely affected by various risks. Our business is influenced by many factors that are difficult to predict, involve uncertainties that may materially affect actual results and are often beyond our control. We discuss below the risks that we believe are material. You should carefully consider all of these factors. For other factors that may cause actual results to differ materially from those indicated in any forward-looking statement contained in this report, see Forward-Looking Information in Management’s Discussion and Analysis of Financial Condition and Results of Operations.
Industry competition and consolidation may increase pricing pressures and adversely impact our margins or result in a loss of customers.
The book industry is extremely competitive. In the book manufacturing segment, consolidation over the past few years of both customers and competitors within the markets in which the Company competes has caused downward pricing pressures. In addition, excess capacity and competition from printing companies in lower cost countries may increase competitive pricing pressures. Furthermore, some of our competitors have greater sales, assets and financial resources than us, and those in foreign countries may derive significant advantages from local governmental regulation, including tax holidays and other subsidies. All or any of these competitive pressures could affect prices or customers’ demand for our products, impacting our profit margins and/or resulting in a loss of customers and market share.
A reduction in orders or pricing from, or the loss of, any of our significant customers may adversely impact our operating results.
We derived approximately 55% and 53% of our fiscal 2012 and 2011 revenues, respectively, from two major customers. We expect similar concentrations in fiscal 2013. We do business with these customers on a purchase order basis and they are not bound to purchase at particular volume levels. As a result, any of these customers could determine to reduce their order volume with us, especially if our pricing is not deemed competitive. A significant reduction in order volumes from, or the loss of, either of these customers could have a material adverse effect on our results of operations and financial condition. In addition, our publishing segment is dependent on Amazon as a primary sales channel. Any change in pricing or order volume could have a material adverse effect on our results.
Because a significant portion of publishing sales are made to or through retailers and distributors, the insolvency of any of these parties could have an adverse impact on our financial condition and operating results.
In our specialty publishing segment, sales to retailers and distributors are highly concentrated on a small group, which previously included Borders Group, Inc. (“Borders”). During fiscal 2011, we recorded a bad debt expense of $700,000 related to the Borders’ bankruptcy and liquidation. Sales to Borders for our publishing segment in fiscal 2011 declined $3.3 million compared to fiscal 2010. In addition, the Company experienced a 9% reduction in sales in the trade market of its book manufacturing segment in fiscal 2011 compared with the prior year.
As a result of the impact of the Borders situation, in the third quarter of fiscal 2011, the Company recorded a pre-tax impairment charge of $8.6 million, representing 100% of REA’s goodwill as well as approximately $200,000 for prepublication costs related to underperforming titles.
Similarly, any bankruptcy, liquidation, insolvency or other failure of another major retailer or distributor could also have a material impact on the Company.
Electronic delivery of content may adversely affect our business.
Electronic delivery of content offers an alternative to the traditional delivery through print. Widespread consumer acceptance of electronic delivery of books is uncertain, as is the extent to which consumers are willing to replace print materials with online hosted media content. If our customers’ acceptance of electronic delivery of books and online hosted media content continues to grow, demand for and/or pricing of our printed products may be adversely affected. To the extent that we do not successfully adapt to provide our content in electronic form, demand for and sales of our content may suffer.
We could face significant liability as a result of our participation in multi-employer pension plans.
We participate in two multi-employer defined benefit pension plans for certain union employees. Multi-employer pension plans cover employees of and receive contributions from two or more unrelated employers under one or more union contracts, and the assets contributed by each employer may be used to fund the benefits of all employees covered by the plan. We make periodic contributions to these plans pursuant to our union contracts to allow the plans to meet the pension benefit obligations to plan participants. Both union contracts are scheduled to expire within the next five months and we have begun contract negotiations. We currently expect that we would be required to contribute approximately $418,000 to these two plans in fiscal 2013, but these contributions could significantly increase due to other employers’ withdrawals or changes in the funded status of the plans. Further, if we continue to participate in such pension plans, our contributions may increase depending on the outcome of our union negotiations and applicable law as well as any reduction in participation or withdrawal by other employees from the plans. In the event we withdraw from participation in one or both of these plans, we could be required to make an additional lump-sum contribution to the plan, which would be reflected as an expense in our consolidated statements of operations and a liability on our consolidated balance sheet. Our withdrawal liability for any multiemployer plan would depend on the extent of the plan’s funding of benefit obligations as well as our plan contributions. Both plans are estimated to be underfunded as of September 29, 2012 and have a Pension Protection Act zone status of critical (“red”); such status identifies plans that are less than 65% funded. In addition, our contributions for one of the plans represented more than 5% of total contributions in each of the last three years, with fiscal 2012 being approximately 70% of total contributions. This plan currently includes only three other contributing employers. A future withdrawal from either of the two remaining multi-employer pension plans in which we participate could result in a withdrawal liability for us, the amount of which could be material to our results of operations, cash flows and financial condition.
A failure to successfully adapt to changing book sales channels may have an adverse impact on our business.
Over the last several years, the “bricks & mortar” bookstore channel has experienced a significant contraction, including the bankruptcy of Borders Group, Inc. and Nebraska Book Co., the closure of many independent bookstores, and the reduction in inventory and shelf space for books in other national chains. In addition to expanding our online and direct to consumer sales, we have responded by seeking alternative channels for our products, such as mass merchandising chains. However, there is no guarantee that we will be able to address the challenges in these channels, including creating price competitive products that will successfully penetrate these markets and accurately predicting the volume of returns.
Declines in general economic conditions may adversely impact our business.
Economic conditions have the potential to impact our financial results significantly. Within the book manufacturing and publishing segments, we may be adversely affected by the current worldwide economic downturn, including as a result of changes in government, business and consumer spending. Examples of how our financial results may be impacted include:
· Fluctuations in federal or state government spending on education, including a reduction in tax revenues due to the current economic environment, could lead to a corresponding decrease in the demand for educational materials, which are produced in our book manufacturing segment and comprise a portion of our publishing products.
· Consumer demand for books can be impacted by reductions in disposable income when costs such as electricity and gasoline reduce discretionary spending.
· Tightness in credit markets may result in customers delaying orders to reduce inventory levels and may impact their ability to pay their debts as they become due and may disrupt supplies from vendors, and may result in customers becoming insolvent.
· Changes in the housing market may impact the sale of Creative Homeowner’s products.
· Reduced fundraising by religious customers may decrease their order levels.
· A slowdown in book purchases may result in retailers returning an unusually large number of books to publishers to reduce their inventories.
A failure to keep pace with rapid industrial and technological change may have an adverse impact on our business.
The printing industry is in a period of rapid technological evolution. Our future financial
performance will depend, in part, upon the ability to anticipate and adapt to rapid industrial and technological changes occurring in the industry and upon the ability to offer, on a timely basis, services that meet evolving industry standards. If we are unable to adapt to such technological changes, we may lose customers and may not be able to maintain our competitive position. In addition, we may encounter difficulties in the implementation and start-up of new equipment and technology.
We are unable to predict which of the many possible future product and service offerings will be important to establish and maintain a competitive position or what expenditures will be required to develop and provide these products and services. We cannot assure investors that one or more of these factors will not vary unpredictably, which could have a material adverse effect on us. In addition, we cannot assure investors, even if these factors turn out as we anticipate, that we will be able to implement our strategy or that the strategy will be successful in this rapidly evolving market.
Our operating results are unpredictable and fluctuate significantly, which may adversely affect our stock price.
Our quarterly and annual operating results have fluctuated in the past and are likely to fluctuate in the future due to a variety of factors, some of which are outside of our control. Factors that may affect our future operating results include:
· the timing and size of the orders for our books;
· the availability of markets for sales or distribution by our major customers;
· the lengthy and unpredictable sales cycles associated with sales of textbooks to the elementary and high school market;
· the migration of educators and students towards electronic delivery of content;
· our customers’ willingness and success in shifting orders from the peak textbook season to the off-peak season to even out our manufacturing load over the year;
· fluctuations in the currency market may make manufacturing in the United States more or less attractive and make equipment more or less expensive for us to purchase;
· issues that might arise from the integration of acquired businesses, including their inability to achieve expected results; and
· tightness in credit markets affecting the availability of capital for ourselves, our vendors, and/or our customers.
As a result of these and other factors, period-to-period comparisons of our operating results are not necessarily meaningful or indicative of future performance. In addition, the factors noted above may make it difficult for us to forecast and provide in a timely manner public guidance (including updates to prior guidance) related to our projected financial performance. Furthermore, it is possible that in future quarters our operating results could fall below the expectations of securities analysts or investors. If this occurs, the trading price of our common stock could decline.
Our financial results could be negatively impacted by impairments of goodwill or other intangible assets, or other long-lived assets.
We perform an annual assessment for impairment of goodwill and other intangible assets, as well as other long-lived assets, at the end of our fiscal year or whenever events or changes in circumstances occur that would more likely than not reduce the fair value of a reporting unit below its carrying value, including a downturn in the market value of the Company’s stock. A downward revision in the fair value of one of our acquired businesses could result in impairments of goodwill and non-cash charges. Any impairment charge could have a significant negative effect on our reported results of operations. For example, at the end of the third quarter of fiscal 2011, the Company determined that the fair value of REA was below its carrying value and a pre-tax impairment charge of $8.6 million was recorded, which represented 100% of REA’s goodwill as well as approximately $200,000 for prepublication costs related to underperforming titles and long-lived assets.
Fluctuations in the cost and availability of paper and other raw materials may cause disruption and impact margins.
Purchases of paper and other raw materials represent a large portion of our costs. In our book manufacturing segment, paper is normally supplied by our customers at their expense or price increases are passed through to our customers. In our specialty publishing segment, cost increases have generally been passed on to customers through higher prices or we have substituted a less expensive grade of paper. However, if we are unable to continue to pass on these increases or substitute a less expensive grade of paper, our margins and profits could be adversely affected.
Availability of paper is important to both our book manufacturing and publishing segments. Although we generally have not experienced difficulty in obtaining adequate supplies of paper, unexpected changes in the paper markets could result in a shortage of supply. If this were to occur in the future, it could cause disruption to the business or increase paper costs, adversely impacting either or both net sales or profits.
Fluctuations in the costs and availability of other raw materials could adversely affect operating costs or customer demand and thereby negatively impact our operating results, financial condition or cash flows.
In addition, fluctuations in the markets for paper and raw materials may adversely affect the market for our waste byproducts, including recycled paper, and used plates, and therefore adversely affect our income from such sales.
Energy costs and availability may negatively impact our financial results.
Energy costs are incurred directly to run production equipment and facilities and indirectly through expenses such as freight and raw materials such as ink. In a competitive market environment, increases to these direct and indirect energy related costs might not be able to be passed through to customers through price increases or mitigated through other means. In such instances, increased energy costs could adversely impact operating costs or customer demand. In addition, interruption in the availability of energy could disrupt operations, adversely impacting operating results.
Inadequate intellectual property protection for our publications could negatively impact our financial results.
Certain of our publications are protected by copyright, primarily held in the Company’s name. Such copyrights protect our exclusive right to publish the work in the United States and in many other countries for specified periods. Our ability to continue to achieve anticipated results depends in part on our ability to defend our intellectual property against infringement. Our operating results may be adversely affected by inadequate legal and technological protections for intellectual property and proprietary rights in some jurisdictions and markets. In addition, some of our publications are of works in the public domain, for which there is nearly no intellectual property protection. Our operating results may be adversely affected by the increased availability of such works elsewhere, including on the Internet, either for free or for a lower price.
A failure to maintain or improve our operating efficiencies could adversely impact our profitability.
Because the markets in which we operate are highly competitive, we must continue to improve our operating efficiency in order to maintain or improve our profitability. Although we have been able to expand our capacity, improve our productivity and reduce costs in the past, there is no assurance that we will be able to do so in the future. In addition, reducing operating costs in the future may require significant initial costs to reduce headcount, close or consolidate operations, or upgrade equipment and technology.
Changes in postal rates and postal regulations may adversely impact our business.
Postal costs are a significant component of our direct marketing cost structure and postal rate changes can influence the number of catalogs that we may mail. In addition, increased postal rates can impact the cost of delivering our products to customers. The occurrence of either of these events could adversely affect consumer demand and our results of operations.
Our facilities are subject to stringent environmental laws and regulations, which may subject us to liability or increase our costs.
We use various materials in our operations that contain substances considered hazardous or toxic under environmental laws. In addition, our operations are subject to federal, state, and local environmental laws relating to, among other things, air emissions, waste generation, handling, management and disposal, waste water treatment and discharge and remediation of soil and groundwater contamination. Permits are required for the operation of certain of our businesses and these permits are subject to renewal, modification and in some circumstances, revocation. Under certain environmental laws, including the Comprehensive Environmental Response, Compensation and Liability Act, as amended (“CERCLA,” commonly referred to as “Superfund”), and similar state laws and regulations, we may be liable for costs and damages relating to soil and groundwater contamination at off-site disposal locations or at our facilities. Future changes to environmental laws and regulations may give rise to additional costs or liabilities that could have a material adverse impact on our financial position and results of operations.
A failure to successfully integrate acquired businesses may have a material adverse effect on our business or operations.
Over the past several years, we have completed several acquisitions, and may continue to make acquisitions in the future. We believe that these acquisitions provide strategic growth opportunities for us. Achieving the anticipated benefits of these acquisitions will depend in part upon our ability to integrate these businesses in an efficient and effective manner. The challenges involved in successfully integrating acquisitions include:
· we may find that the acquired company or assets do not further our business strategy, or that we overpaid for the company or assets, or that economic conditions have changed, all of which
may result in a future impairment charge;
· we may have difficulty integrating the operations and personnel of the acquired business and may have difficulty retaining the customers and/or the key personnel of the acquired business;
· we may have difficulty incorporating and integrating acquired technologies into our business;
· our ongoing business and management’s attention may be disrupted or diverted by transition or integration issues and the complexity of managing diverse locations;
· we may have difficulty maintaining uniform standards, controls, procedures and policies across locations;
· an acquisition may result in litigation from terminated employees of the acquired business or third parties; and
· we may experience significant problems or liabilities associated with technology and legal contingencies of the acquired business.
These factors could have a material adverse effect on our business, results of operations and financial condition or cash flows, particularly in the case of a larger acquisition or multiple acquisitions in a short period of time. From time to time, we may enter into negotiations for acquisitions that are not ultimately consummated. Such negotiations could result in significant diversion of management’s time from our business as well as significant out-of-pocket costs. Tightness in credit markets may also affect our ability to consummate such acquisitions.
The consideration that we pay in connection with an acquisition could affect our financial results. If we were to proceed with one or more significant acquisitions in which the consideration included cash, we could be required to use a substantial portion of our available cash and credit facilities to consummate such acquisitions. To the extent we issue shares of stock or other rights to purchase stock, including options or other rights, our existing stockholders may experience dilution in their share ownership in our company and their earnings per share may decrease. In addition, acquisitions may result in the incurrence of debt, large one-time write-offs and restructuring charges. They may also result in goodwill and other intangible assets that are subject to impairment tests, which could result in future impairment charges. Any of these factors may materially and adversely affect our business and operations.
A failure to hire and train key executives and other qualified employees could adversely affect our business.
Our success depends, in part, on our ability to continue to retain our executive officers and key management personnel. Our business strategy also depends on our ability to attract, develop, motivate and retain employees who have relevant experience in the printing and publishing industries. There can be no assurance that we can continue to attract and retain the necessary talented employees, including executive officers and other key members of management and, if we fail to do so, it could adversely affect our business.
A lack of skilled employees to manufacture our products may adversely affect our business.
If we experience problems hiring and retaining skilled employees, our business may be negatively affected. The timely manufacture and delivery of our products requires an adequate supply of skilled employees, and the operating costs of our manufacturing facilities can be adversely affected by high turnover in skilled positions. Accordingly, our ability to increase sales, productivity and net earnings could be impacted by our ability to employ the skilled employees necessary to meet our requirements. Although our book manufacturing locations are geographically dispersed, individual locations may encounter strong competition with other manufacturers for skilled employees. There can be no assurance that we will be able to maintain an adequate skilled labor force necessary to efficiently operate our facilities. In addition, unions represent certain groups of employees at one of our locations, and periodically, contracts with those unions come up for renewal. The outcome of those negotiations
could have an adverse effect on our operations at that location. Also, changes in federal and/or state laws may facilitate the organization of unions at locations that do not currently have unions, which could have an adverse effect on our operations.
We are subject to various laws and regulations that may require significant expenditures.
We are subject to federal, state and local laws and regulations affecting our business, including those promulgated under the Consumer Product Safety Act, the rules and regulations of the Consumer Products Safety Commission as well as laws and regulations relating to personal information. We may be required to make significant expenditures to comply with such governmental laws and regulations and any amendments thereto. Complying with existing or future laws or regulations may materially limit our business and increase our costs. Failure to comply with such laws may expose us to potential liability and have a material adverse effect on our results of operations.
Item 1B. Unresolved Staff Comments.
None.
REAL PROPERTIES
The following schedule lists the facilities owned or leased by Courier at September 29, 2012. Courier considers its plants and other facilities to be well maintained and suitable for the purposes intended.
|
| Owned/ |
| Square |
|
Principal Activity and Location (Year Constructed) |
| Leased |
| Feet |
|
Corporate headquarters and book manufacturing |
|
|
|
|
|
North Chelmsford, MA (1973, 1996) |
| Owned |
| 69,000 | (1) |
Book manufacturing and warehousing |
|
|
|
|
|
Westford plant, Westford, MA (1922, 1963, 1966, 1967, 1974, 1980, 1990) |
| Owned |
| 303,000 |
|
Kendallville plant, Kendallville, IN (1978, 2004, 2006) |
| Owned |
| 273,000 |
|
Kendallville warehouse, Kendallville, IN (2009, 2010) |
| Owned |
| 200,000 |
|
National plant, Philadelphia, PA (1974, 1997) |
| Owned |
| 229,000 |
|
Stoughton plant, Stoughton, MA (1980) |
| Leased |
| 169,000 | (2) |
Moore Langen plant, Terre Haute, IN (1969, 1987) |
| Owned |
| 43,000 |
|
Dover offices and warehouses |
|
|
|
|
|
Mineola, New York (1948-1983) |
| Leased |
| 106,000 |
|
Westford, MA (1959, 1963, 1966) |
| Owned |
| 90,000 |
|
REA offices and warehouse |
|
|
|
|
|
Piscataway, New Jersey (1987) |
| Leased |
| 39,000 |
|
Creative Homeowner offices |
|
|
|
|
|
Upper Saddle River, New Jersey (1987) |
| Leased |
| 6,000 |
|
(1) Houses corporate headquarters and Courier Digital Solutions, as well as sales and marketing offices supporting both the book manufacturing and publishing segments.
(2) The Stoughton plant was closed in March 2011 and its operations consolidated into the Company’s other manufacturing facilities. A portion of the facility was used for warehousing at September 29, 2012. A 40,000 square foot section will be sublet effective March 2013 through October 2015, which is the end of the lease term.
EQUIPMENT
The Company’s products are manufactured on equipment that in most cases is owned by the Company, although it leases certain computers and other equipment, which are subject to more rapid obsolescence. Capital expenditures amounted to approximately $9.9 million in 2012, $15.7 million in
2011, and $28.4 million in 2010. Capital expenditures for fiscal 2013 are expected to be between $17 and $19 million, approximately $13 million of which relates to expansion of the Company’s digital print capabilities. Courier considers its equipment to be in good operating condition and adequate for its present needs.
ENCUMBRANCES AND RENTAL OBLIGATIONS
For a description of encumbrances on certain properties and equipment, see Note D of Notes to Consolidated Financial Statements of this Annual Report on Form 10-K. Information concerning leased properties and equipment is disclosed in Note E of Notes to Consolidated Financial Statements of this Annual Report on Form 10-K.
In the ordinary course of business, the Company is subject to various legal proceedings and claims. The Company believes that the ultimate outcome of these matters will not have a material adverse effect on its financial statements.
Item 4. Mine Safety Disclosures.
None.
Item 5. Market for the Registrant’s Common Equity, Related Stockholder Matters and Issuer Purchases of Equity Securities.
On April 19, 2012, the Company announced the approval by its Board of Directors for the repurchase of up to $10 million of the Company’s outstanding common stock from time to time on the open market or in privately negotiated transactions, including pursuant to a Rule 10b5-1 nondiscretionary trading plan. Through September 29, 2012, the Company repurchased 823,970 shares of common stock for approximately $10.0 million. The following table summarizes the purchases under this program during the fourth quarter of fiscal 2012.
ISSUER PURCHASES OF EQUITY SECURITIES
Fiscal Period |
| (a) Total |
| (b) |
| (c) Total |
| (d) Maximum |
| ||
June 24, 2012 to July 21, 2012 |
| 281,448 |
| $ | 13.584 |
| 281,448 |
| $ | 1,326,200 |
|
July 22, 2012 to August 25, 2012 |
| 97,472 |
| $ | 13.575 |
| 97,472 |
| — |
| |
August 26, 2012 to September 29, 2012 |
| — |
| — |
| — |
| — |
| ||
Total |
| 378,920 |
| $ | 13.581 |
| 378,920 |
| — |
| |
On November 20, 2012, the Company announced the approval by its Board of Directors for the repurchase of up to $10 million of the Company’s outstanding common stock from time to time on the open market or in privately negotiated transactions, including pursuant to a Rule 10b5-1 nondiscretionary trading plan.
PEER PERFORMANCE TABLE
The graph below compares the Company’s cumulative total stockholder return on its Common Stock with the cumulative total return on the Standard & Poor’s 500 stock index (the “S&P 500 Index”), a peer group of companies selected by the Corporation for purposes of the comparison and described more fully below (the “Peer Group”). This graph assumes the investment of $100 on October 1, 2007 in each of Courier Common Stock, the S&P 500 Index, and the Peer Group Common Stock, and reinvestment of quarterly dividends at the monthly closing stock prices. The returns of each company have been weighted annually for their respective stock market capitalizations in computing the S&P 500 and Peer Group indices.
COMPARISON OF 5 YEAR CUMULATIVE TOTAL RETURN
Courier Corporation, S&P 500 Index, Peer Group
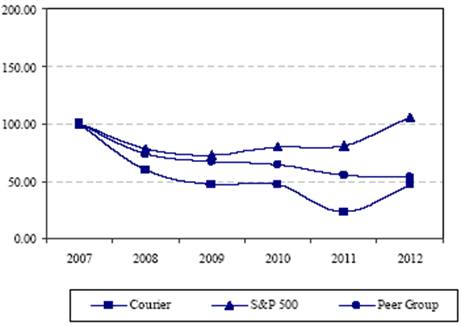
The Peer Group includes the following companies: Barnes & Noble, Inc., Consolidated Graphics, Ennis Business Forms, Inc., Quad/Graphics, Inc., R. R. Donnelley & Sons Company, Scholastic Corporation, The Standard Register Company, and John Wiley & Sons, Inc.
Other information required by this Item is contained in the section captioned “Selected Quarterly Financial Data (Unaudited)” appearing on page F-36 of this Annual Report on Form 10-K and in Part III, Item 12, captioned “Security Ownership of Certain Beneficial Owners and Management and Related Stockholder Matters.”
Item 6. Selected Financial Data.
The information required by this Item is contained in the section captioned “Five-Year Financial Summary” appearing on page F-24 of this Annual Report on Form 10-K.
Item 7. Management’s Discussion and Analysis of Financial Condition and Results of Operations.
The information required by this Item is contained in the section captioned “Management’s Discussion and Analysis” on pages F-25 through F-35 of this Annual Report on Form 10-K.
Item 7A. Quantitative and Qualitative Disclosures About Market Risk.
The Company does not hold any derivative financial instruments, derivative commodity instruments or other financial instruments except as noted in Note A of Notes to Consolidated Financial Statements of this Annual Report on Form 10-K. The Company engages neither in speculative nor derivative trading activities. The Company is exposed to market risk for changes in interest rates on invested funds as well as borrowed funds. The Company’s revolving bank credit facility bears interest at a floating rate, with further information contained in Note D of Notes to Consolidated Financial Statements of this Annual Report on Form 10-K. The Company believes it is remote that this could have a material impact on results of operations.
Item 8. Financial Statements and Supplementary Data.
The information required by this Item is contained on pages F-1 through F-23 of this Annual Report on Form 10-K.
Item 9. Changes in and Disagreements With Accountants on Accounting and Financial Disclosure.
None.
Item 9A. Controls and Procedures
(a) Disclosure Controls and Procedures
As of the end of the period covered by this Annual Report on Form 10-K, we carried out an evaluation under the supervision and with the participation of our management, including the Chief Executive Officer and the Chief Financial Officer, of the effectiveness of the design and operation of our disclosure controls and procedures pursuant to Exchange Act Rules 13a-15(e) and 15d-15(e). Disclosure controls are procedures that are designed to ensure that information required to be disclosed in our reports filed under the Securities Exchange Act of 1934 (the “Exchange Act”) is recorded, processed, summarized and reported within the time periods specified by the Securities and Exchange Commission. Disclosure controls are also designed to ensure that such information is accumulated and communicated to our management, including our Chief Executive Officer and Chief Financial Officer, as appropriate to allow timely decisions regarding required disclosure. Based upon that evaluation, our Chief Executive Officer and Chief Financial Officer concluded that our disclosure controls and procedures were effective as of the end of the period covered by this report.
(b) Changes in Internal Controls over Financial Reporting
There were no changes in the Company’s internal control over financial reporting during the fourth quarter of fiscal year 2012 that have materially affected, or that are reasonably likely to materially affect, the Company’s internal control over financial reporting.
(c) Management’s Responsibility for Financial Statements
Management of the Company is responsible for the preparation, integrity and objectivity of the Company’s consolidated financial statements and other financial information contained in its Annual Report to Stockholders. Those consolidated financial statements were prepared in conformity with accounting principles generally accepted in the United States. In preparing those consolidated financial statements, the Company’s management was required to make certain estimates and judgments, which are based upon currently available information and management’s view of current conditions and circumstances.
The Audit Committee of the Board of Directors (“Audit Committee”), which consists solely of independent directors, oversees the Company’s process of reporting financial information and the audit of its consolidated financial statements. The Audit Committee stays informed of the financial condition of the Company and regularly reviews management’s financial policies and procedures, the independence
of the independent auditors, the Company’s internal control and the objectivity of its financial reporting. The independent registered public accounting firm has free access to the Audit Committee and to meet with the Audit Committee periodically, both with and without management present.
The Company has filed with the Securities and Exchange Commission the required certifications related to its consolidated financial statements as of and for the year ended September 29, 2012. These certifications are exhibits to this Annual Report on Form 10-K for the year ended September 29, 2012.
(d) Management’s Report on Internal Control Over Financial Reporting
Management has responsibility for establishing and maintaining adequate internal control over financial reporting. Internal control over financial reporting is a process designed to provide reasonable assurance regarding the reliability of financial reporting and the preparation of financial statements for external reporting purposes in accordance with accounting principles generally accepted in the United States. Because of its inherent limitations, internal control over financial reporting may not prevent or detect misstatements. Management has assessed the effectiveness of the Company’s internal control over financial reporting as of September 29, 2012.
In making its assessment of the Company’s internal control over financial reporting, the Company’s management has utilized the criteria set forth by the Committee of Sponsoring Organizations (“COSO”) of the Treadway Commission in Internal Control-Integrated Framework. Management concluded that based on its assessment, the Company’s internal control over financial reporting was effective as of September 29, 2012. Deloitte & Touche LLP, an independent registered public accounting firm that audited the consolidated financial statements included in this Annual Report, has issued its attestation report on the effectiveness of the Company’s internal control over financial reporting as of September 29, 2012, which appears below.
REPORT OF INDEPENDENT REGISTERED PUBLIC ACCOUNTING FIRM
To the Board of Directors and Stockholders of Courier Corporation
North Chelmsford, Massachusetts
We have audited the internal control over financial reporting of Courier Corporation and subsidiaries (the “Company”) as of September 29, 2012, based on criteria established in Internal Control — Integrated Framework issued by the Committee of Sponsoring Organizations of the Treadway Commission. The Company’s management is responsible for maintaining effective internal control over financial reporting and for its assessment of the effectiveness of internal control over financial reporting, included in the accompanying Management’s Report on Internal Control over Financial Reporting. Our responsibility is to express an opinion on the Company’s internal control over financial reporting based on our audit.
We conducted our audit in accordance with the standards of the Public Company Accounting Oversight Board (United States). Those standards require that we plan and perform the audit to obtain reasonable assurance about whether effective internal control over financial reporting was maintained in all material respects. Our audit included obtaining an understanding of internal control over financial reporting, assessing the risk that a material weakness exists, testing and evaluating the design and operating effectiveness of internal control based on the assessed risk, and performing such other procedures as we considered necessary in the circumstances. We believe that our audit provides a reasonable basis for our opinion.
A company’s internal control over financial reporting is a process designed by, or under the supervision of, the company’s principal executive and principal financial officers, or persons performing similar functions, and effected by the company’s board of directors, management, and other personnel to provide reasonable assurance regarding the reliability of financial reporting and the preparation of financial statements for external purposes in accordance with generally accepted accounting principles. A company’s internal control over financial reporting includes those policies and procedures that (1) pertain to the maintenance of records that, in reasonable detail, accurately and fairly reflect the transactions and
dispositions of the assets of the company; (2) provide reasonable assurance that transactions are recorded as necessary to permit preparation of financial statements in accordance with generally accepted accounting principles, and that receipts and expenditures of the company are being made only in accordance with authorizations of management and directors of the company; and (3) provide reasonable assurance regarding prevention or timely detection of unauthorized acquisition, use, or disposition of the company’s assets that could have a material effect on the financial statements.
Because of the inherent limitations of internal control over financial reporting, including the possibility of collusion or improper management override of controls, material misstatements due to error or fraud may not be prevented or detected on a timely basis. Also, projections of any evaluation of the effectiveness of the internal control over financial reporting to future periods are subject to the risk that the controls may become inadequate because of changes in conditions, or that the degree of compliance with the policies or procedures may deteriorate.
In our opinion, the Company maintained, in all material respects, effective internal control over financial reporting as of September 29, 2012, based on the criteria established in Internal Control — Integrated Framework issued by the Committee of Sponsoring Organizations of the Treadway Commission.
We have also audited, in accordance with the standards of the Public Company Accounting Oversight Board (United States), the consolidated financial statements and financial statement schedule as of and for the year ended September 29, 2012 of the Company and our report dated November 30, 2012 expressed an unqualified opinion on those financial statements and financial statement schedule.
/s/Deloitte & Touche LLP
Boston, Massachusetts
November 30, 2012
(e) Limitations on Design and Effectiveness of Controls
The Company’s management, including our Chief Executive Officer and Chief Financial Officer, believes that our disclosure controls and procedures and internal control over financial reporting are effective at the reasonable assurance level. However, the Company’s management does not expect that our disclosure controls and procedures or our internal control over financial reporting will prevent all errors and all fraud. A control system, no matter how well conceived and operated, can provide only reasonable, not absolute, assurance that the objectives of the control system are met. In addition, the design of a control system must take into consideration resource constraints, and the benefits of controls must be considered relative to their costs. Because of the inherent limitations in all control systems, no evaluation of controls can provide absolute assurance that all control issues and instances of fraud, if any, within the Company have been detected in a timely manner. These inherent limitations include the fact that controls can be circumvented by individual acts, by collusion of two or more people or by management override of the controls. The design of any system of controls also is based in part upon certain assumptions about the likelihood of future events, and there can be no assurance that any design will succeed in achieving its stated goals under all potential future conditions. Finally, over time, controls may become inadequate because of changes in conditions, or the degree of compliance with policies or procedures may deteriorate. Because of the inherent limitations in a cost-effective control system, misstatements due to error or fraud may occur and not be detected.
None.
Item 10. Directors and Executive Officers and Corporate Governance.
Courier’s executive officers, together with their ages and all positions and offices with the Company presently held by each person named, are as follows:
James F. Conway III | 60 | Chairman, President and Chief Executive Officer |
|
|
|
Peter M. Folger | 59 | Senior Vice President and Chief Financial Officer |
|
|
|
Rajeev Balakrishna | 42 | Senior Vice President, General Counsel, Secretary and Clerk |
The terms of office of all of the above executive officers continue until the first meeting of the Board of Directors following the next annual meeting of stockholders and the election or appointment and qualification of their successors, unless any officer sooner dies, resigns, is removed or becomes disqualified.
Mr. Conway III was elected Chairman of the Board in September 1994 after serving as acting Chairman since December 1992. He has been Chief Executive Officer since December 1992 and President since July 1988.
Mr. Folger became Senior Vice President and Chief Financial Officer in November 2006. He had previously been Controller since 1982 and Vice President since November 1992. In November 2011, Mr. Folger assumed responsibility for the Company’s book manufacturing operations.
Mr. Balakrishna was promoted to Senior Vice President in November 2011 and assumed responsibility for the Company’s publishing operations. He became Secretary and Clerk in January 2008. He joined Courier in February 2007 as Vice President and General Counsel. Prior to that, since 1996, he was an attorney at the law firms of Proskauer Rose LLP and Goodwin Procter LLP and in house Counsel at John Hancock Financial Services, Inc.
The Company has adopted a code of ethics entitled “Courier Corporation Business Conduct Guidelines,” which is applicable to all of the Company’s directors, officers, and employees. These Business Conduct Guidelines are available on the Company’s Internet website, located at www.courier.com.
All other information called for by Item 10 is contained in the definitive Proxy Statement, under the captions “Item 1: Election of Directors,” “Corporate Governance” and “Section 16(a) Beneficial Ownership Reporting Compliance,” to be delivered to stockholders in connection with the Annual Meeting of Stockholders scheduled to be held on Tuesday, January 22, 2013. Such information is incorporated herein by reference.
Item 11. Executive Compensation.
Information called for by Item 11 is contained in the definitive Proxy Statement, under the caption “Compensation Discussion and Analysis,” to be delivered to stockholders in connection with the Annual Meeting of Stockholders scheduled to be held on Tuesday, January 22, 2013. Such information is incorporated herein by reference.
Item 12. Security Ownership of Certain Beneficial Owners and Management and Related Stockholder Matters.
The following table provides information as of September 29, 2012 regarding shares of
common stock of the Company that may be issued under its existing compensation plans, including the Courier Corporation 2011 Stock Option and Incentive Plan (the “2011 Plan”), the Courier Corporation Amended and Restated 1993 Stock Incentive Plan (the “1993 Plan”), which was replaced by the 2011 Plan, the Courier Corporation 1999 Employee Stock Purchase Plan, the Courier Corporation 2010 Stock Equity Plan for Non-Employee Directors (the “2010 Plan”), and the Courier Corporation 2005 Stock Equity Plan for Non-Employee Directors (the “2005 Plan”), which was replaced by the 2010 Plan.
Equity Compensation Plan Information |
| |||||||
Plan category |
| Number of securities |
| Weighted-average |
| Number of securities |
| |
|
| (a) |
| (b) |
| (c) |
| |
Equity compensation plans approved by security holders |
| 611,595 |
| $ | 15.11 |
| 668,923 |
|
|
|
|
|
|
|
|
| |
Equity compensation plans not approved by security holders |
| — |
| — |
| — |
| |
Total |
| 611,595 |
| $ | 15.11 |
| 668,923 |
|
(1) Does not include any restricted stock as such shares are already reflected in the Company’s outstanding shares.
(2) 186,921 shares of these 668,923 shares were reserved for future issuance under the Company’s Employee Stock Purchase Plan.
(3) Includes up to 482,002 securities that may be issued in the form of restricted stock.
All other information called for by Item 12 is contained in the definitive Proxy Statement, under the captions “Security Ownership of Certain Beneficial Owners and Management” and “Compensation Discussion and Analysis,” to be delivered to stockholders in connection with the Annual Meeting of Stockholders scheduled to be held on Tuesday, January 22, 2013. Such information is incorporated herein by reference.
Item 13. Certain Relationships and Related Transactions and Director Independence.
Information called for by Item 13 is contained in the definitive Proxy Statement, under the captions “Director Independence” and “Related Party Transactions,” to be delivered to stockholders in connection with the Annual Meeting of Stockholders scheduled to be held on Tuesday, January 22, 2013. Such information is incorporated herein by reference.
Item 14. Principal Accounting Fees and Services
Information called for by Item 14 is contained in the definitive Proxy Statement, under the caption “Item 2: Ratification and Approval of Selection of Independent Auditors,” to be delivered to stockholders in connection with the Annual Meeting of Stockholders scheduled to be held on Tuesday, January 22, 2013. Such information is incorporated herein by reference.
Item 15. Exhibits and Financial Statement Schedules.
(a) Documents filed as part of this report
1. |
| Financial statements |
|
|
|
|
|
| Page(s) |
|
|
|
|
|
|
| F-1 | ||
|
| F-2 | ||
| Consolidated Balance Sheets as of September 29, 2012 and September 24, 2011 |
| F-3 to F-4 | |
|
| F-5 | ||
|
| F-6 | ||
|
| F-7 to F-23 | ||
|
|
|
|
|
2. |
| Financial statement schedule |
|
|
|
|
|
|
|
|
| Schedule II - Consolidated Valuation and Qualifying Accounts |
| S-1 |
3. Exhibits
Exhibit No. |
| Description of Exhibit |
|
|
|
3A-1 |
| Articles of Organization of Courier Corporation, as of June 29, 1972 (filed as Exhibit 3A-1 to the Company’s Annual Report on Form 10-K for the fiscal year ended September 26, 1981, and incorporated herein by reference). |
|
|
|
3A-2 |
| Articles of Amendment of Courier Corporation (changing stockholder vote required for merger or consolidation), as of January 20, 1977 (filed as Exhibit 3A-2 to the Company’s Annual Report on Form 10-K for the fiscal year ended September 26, 1981, and incorporated herein by reference). |
|
|
|
3A-3 |
| Articles of Amendment of Courier Corporation (providing for staggered election of directors), as of January 20, 1977 (filed as Exhibit 3A-3 to the Company’s Annual Report on Form 10-K for the fiscal year ended September 26, 1981, and incorporated herein by reference). |
|
|
|
3A-4 |
| Articles of Amendment of Courier Corporation (authorizing class of Preferred Stock), as of February 15, 1978 (filed as Exhibit 3A-4 to the Company’s Annual Report on Form 10-K for the fiscal year ended September 26, 1981, and incorporated herein by reference). |
|
|
|
3A-5 |
| Articles of Amendment of Courier Corporation (increasing number of shares of authorized Common Stock), as of January 16, 1986 (described in item #2 of the Company’s Proxy Statement for the Annual Meeting of Stockholders held on January 16, 1986, and incorporated herein by reference). |
|
|
|
3A-6 |
| Articles of Amendment of Courier Corporation (providing for fair pricing procedures for stock to be sold in certain business combinations), as of January 16, 1986 (filed as Exhibit A to the Company’s Proxy Statement for the Annual Meeting of Stockholders held on January 16, 1986, and incorporated herein by reference). |
3A-7 |
| Articles of Amendment of Courier Corporation (limiting personal liability of directors to the Corporation or to any of its stockholders for monetary damages for breach of fiduciary duty), as of January 28, 1988 (filed as Exhibit 3A-7 to the Company’s Annual Report on Form 10-K for the fiscal year ended September 24, 1988, and incorporated herein by reference). |
|
|
|
3A-8 |
| Articles of Amendment of Courier Corporation (establishing Series A Preferred Stock), as of November 8, 1988 (filed as Exhibit 3A-8 to the Company’s Annual Report on Form 10-K for the fiscal year ended September 24, 1988, and incorporated herein by reference). |
|
|
|
3A-9 |
| Articles of Amendment of Courier Corporation (increasing number of shares of authorized Common Stock), as of January 17, 2002 (filed as Exhibit 3 to the Company’s Quarterly Report on Form 10-Q for the period ended March 30, 2002, and incorporated herein by reference). |
|
|
|
3A-10 |
| Articles of Amendment to the Articles of Organization of Courier Corporation for Amended and Restated Resolutions of Directors (establishing Series B Junior Participating Cumulative Preferred Stock), as of March 19, 2009, (filed as Exhibit 3.1 to the Company’s Current Report on Form 8-K, dated March 19, 2009, and incorporated herein by reference). |
|
|
|
3B-1 |
| By-Laws of Courier Corporation, amended and restated as of March 24, 2005 (filed as Exhibit 3 to the Company’s Current Report on Form 8-K, dated March 24, 2005, and incorporated herein by reference). |
|
|
|
3B-2 |
| Amendment No. 1 to Amended and Restated Bylaws dated as of August 6, 2008 (filed as Exhibit 3.1 to the Company’s Current Report on Form 8-K, dated August 7, 2008, and incorporated herein by reference). |
|
|
|
3B-3 |
| Amendment No. 2 to Amended and Restated Bylaws dated as of November 15, 2012 (filed as Exhibit 3.1 to the Company’s Current Report on Form 8-K, dated November 20, 2012, and incorporated herein by reference). |
|
|
|
10A+ |
| Letter Agreement, dated February 8, 1990, of Courier Corporation relating to supplemental retirement benefit and consulting agreement with James F. Conway, Jr. (filed as Exhibit 10B to the Company’s Annual Report on Form 10-K for the fiscal year ended September 29, 1990, and incorporated herein by reference). |
|
|
|
10B-1+ |
| The Courier Executive Compensation Program, as amended and restated on December 5, 2005 (filed as Exhibit 10.2 to the Company’s Current Report on Form 8-K on December 7, 2005, and incorporated herein by reference). |
|
|
|
10B-2+ |
| Amendment No. 1, effective September 18, 2007, to the Courier Executive Compensation Program, as amended and restated on December 5, 2005 (filed as Exhibit 10.1 to the Company’s Annual Report on Form 10-K for the fiscal year ended September 29, 2007, and incorporated herein by reference). |
|
|
|
10B-3+ |
| Amendment No. 2, effective September 17, 2010, to the Courier Executive Compensation Program, as amended and restated on December 5, 2005 (filed as Exhibit 10.1 to the Company’s Annual Report on Form 10-K for the fiscal year ended September 25, 2010, and incorporated herein by reference). |
|
|
|
10C-1+ |
| Courier Corporation Senior Executive Severance Program, as amended and restated on December 5, 2005 (filed as Exhibit 10.3 to the Company’s Current Report on Form 8-K on December 7, 2005, and incorporated herein by reference). |
10C-2+ |
| Amendment, effective March 14, 2007, to the Courier Corporation Senior Executive Severance Program, as amended and restated on December 5, 2005 (filed as Exhibit 10.1 to the Company’s Quarterly Report on Form 10-Q for the period ended March 31, 2007, and incorporated herein by reference). |
|
|
|
10D |
| Rights Agreement between Courier Corporation and Computershare Trust Company, N.A., as Rights Agent, dated March 18, 2009 (filed as Exhibit 4.1 to the Company’s Current Report on Form 8-K, dated March 18, 2009, and incorporated herein by reference). |
|
|
|
10E-1+ |
| Courier Corporation 1999 Employee Stock Purchase Plan (filed as Exhibit A to the Company’s Proxy Statement for the Annual Meeting of Stockholders held on January 21, 1999, and incorporated herein by reference). |
|
|
|
10E-2+ |
| Amendment, effective March 1, 2005, to the Courier Corporation 1999 Employee Stock Purchase Plan (filed as Exhibit 10.1 to the Company’s Annual Report on Form 10-K for the fiscal year ended September 24, 2005, and incorporated herein by reference). |
|
|
|
10E-3+ |
| Amendment No. 1, effective September 23, 2009, to the Courier Corporation 1999 Employee Stock Purchase Plan (filed as Exhibit A to the Company’s Definitive Proxy Statement, as filed on December 4, 2009, and incorporated herein by reference). |
|
|
|
10F-1+ |
| Agreement, as of March 3, 1993, of Courier Corporation relating to employment contract and supplemental retirement benefit with George Q. Nichols (filed as Exhibit 10J to the Company’s Annual Report on Form 10-K for the fiscal year ended September 25, 1993, and incorporated herein by reference). |
|
|
|
10F-2+ |
| Amendment, as of April 16, 1997, to supplemental retirement benefit agreement with George Q. Nichols (filed as Exhibit 10J-2 to the Company’s Annual Report on Form 10-K for the fiscal year ended September 27, 1997, and incorporated herein by reference). |
|
|
|
10F-3+ |
| Amendment, as of November 9, 2000, to supplemental retirement benefit agreement with George Q. Nichols (filed as Exhibit 10I-3 to the Company’s Annual Report on Form 10-K for the fiscal year ended September 29, 2001, and incorporated herein by reference). |
|
|
|
10G-1 |
| Second Amended and Restated Revolving Credit Agreement, dated May 23, 2008, between Courier Corporation, RBS Citizens, KeyBank, Wells Fargo Bank, and J P Morgan Chase Bank providing for a $100 million revolving credit facility (filed as Exhibit 10 to the Company’s Current Report on Form 8-K on May 29, 2008, and incorporated herein by reference). |
|
|
|
10G-2 |
| Amendment No. 1 and Waiver to Second Amended and Restated Revolving Credit Agreement, dated March 22, 2012, between Courier Corporation, RBS Citizens, KeyBank, TD Bank N.A., and J P Morgan Chase Bank (filed as Exhibit 10.1 to the Company’s Current Report on Form 8-K on March 27, 2012, and incorporated herein by reference). |
|
|
|
10H-1+ |
| Courier Corporation Amended and Restated 1993 Stock Incentive Plan (filed January 19, 2005 as Exhibit 10.5 to the Company’s Registration Statement No. 333-122136 and incorporated herein by reference). |
|
|
|
10H-2+ |
| Amendment, effective July 15, 2009, to the Courier Corporation Amended and Restated 1993 Stock Incentive Plan (filed as Exhibit 10.1 to the Company’s Quarterly Report on Form 10-Q for the period ended June 27, 2009 and incorporated herein by |
|
| reference). |
|
|
|
10H-3+ |
| Form of Incentive Stock Option Agreement for the Courier Corporation 1993 Stock Incentive Plan (filed as Exhibit 10.1 to the Company’s Annual Report on Form 10-K for the fiscal year ended September 25, 2004, and incorporated herein by reference). |
|
|
|
10H-4+ |
| Form of Non-Qualified Stock Option Agreement for the Courier Corporation 1993 Stock Incentive Plan (filed as Exhibit 10.2 to the Company’s Annual Report on Form 10-K for the fiscal year ended September 25, 2004, and incorporated herein by reference). |
|
|
|
10H-5+ |
| Form of Stock Grant Agreement for the Courier Corporation 1993 Stock Incentive Plan (filed as Exhibit 10.3 to the Company’s Annual Report on Form 10-K for the fiscal year ended September 25, 2004, and incorporated herein by reference). |
|
|
|
10I-1+ |
| Courier Corporation 2005 Stock Equity Plan for Non-Employee Directors (filed January 19, 2005 as Exhibit 10.1 to the Company’s Registration Statement No. 333-122137 and incorporated herein by reference). |
|
|
|
10I-2+ |
| Amendment, effective July 15, 2009, to the Courier Corporation 2005 Stock Equity Plan for Non-Employee Directors (filed as Exhibit 10.2 to the Company’s Quarterly Report on Form 10-Q for the period ended June 27, 2009 and incorporated herein by reference). |
|
|
|
10I-3+ |
| Form of Non-Qualified Stock Option Agreement for the Courier Corporation 2005 Stock Equity Plan for Non-employee Directors (filed as Exhibit 10.15 to the Company’s Annual Report on Form 10-K for the fiscal year ended September 25, 2004, and incorporated herein by reference). |
|
|
|
10I-4+ |
| Form of Stock Unit Agreement for the Courier Corporation 2005 Stock Equity Plan for Non-employee Directors (filed as Exhibit 10.16 to the Company’s Annual Report on Form 10-K for the fiscal year ended September 25, 2004, and incorporated herein by reference). |
|
|
|
10J+ |
| Courier Corporation 2010 Stock Equity Plan for Non-Employee Directors, effective September 23, 2009 (filed as Exhibit B to the Company’s Definitive Proxy Statement, as filed on December 4, 2009, and incorporated herein by reference). |
|
|
|
10K-1+ |
| Courier Corporation Deferred Compensation Program as Amended and Restated as of January 1, 2009 (filed as Exhibit 10.1 to the Company’s Annual Report on Form 10-K for the fiscal year ended September 26, 2009, and incorporated herein by reference). |
|
|
|
10K-2+ |
| First Amendment to Terms and Conditions of Courier Corporation Deferred Compensation Program as Amended and Restated as of January 1, 2009, effective January 1, 2010 (filed as Exhibit 10.2 to the Company’s Annual Report on Form 10-K for the fiscal year ended September 26, 2009, and incorporated herein by reference). |
|
|
|
10L-1+ |
| Courier Corporation 2011 Stock Option and Incentive Plan (filed as Exhibit A to the Company’s Definitive Proxy Statement, as filed on December 3, 2010, and incorporated herein by reference). |
|
|
|
10L-2+ |
| Form of Incentive Stock Option Agreement for the Courier Corporation 2011 Stock Option and Incentive Plan (filed as Exhibit 10.2 to the Company’s Quarterly Report on Form 10-Q for the period ended December 25, 2010 and incorporated herein by reference). |
|
|
|
10L-3+ |
| Form of Non-Qualified Stock Option Agreement for the Courier Corporation 2011 |
|
| Stock Option and Incentive Plan (filed as Exhibit 10.3 to the Company’s Quarterly Report on Form 10-Q for the period ended December 25, 2010 and incorporated herein by reference). |
|
|
|
10L-4+ |
| Form of Stock Grant Agreement for the Courier Corporation 2011 Stock Option and Incentive Plan (filed as Exhibit 10.4 to the Company’s Quarterly Report on Form 10-Q for the period ended December 25, 2010 and incorporated herein by reference). |
|
|
|
10M+ |
| Agreement by and between Courier Corporation and Mr. Robert P. Story, Jr. dated November 14, 2011 (filed as Exhibit 10.1 to the Company’s Current Report on Form 8-K on November 15, 2011, and incorporated herein by reference). |
|
|
|
10N+ |
| Agreement by and between Courier Corporation and Mr. Eric J. Zimmerman dated November 15, 2011 (filed as Exhibit 10.2 to the Company’s Current Report on Form 8-K on November 15, 2011, and incorporated herein by reference). |
|
|
|
21* |
| Schedule of Subsidiaries. |
|
|
|
23* |
| Consent of Deloitte & Touche LLP, independent registered public accounting firm. |
|
|
|
31.1* |
| Certification of Chief Executive Officer pursuant to 15 U.S.C. Section 10A, as adopted pursuant to Section 302 of the Sarbanes-Oxley Act of 2002. |
|
|
|
31.2* |
| Certification of Chief Financial Officer pursuant to 15 U.S.C. Section 10A, as adopted pursuant to Section 302 of the Sarbanes-Oxley Act of 2002. |
|
|
|
32.1* |
| Certification of Chief Executive Officer pursuant to 18 U.S.C. Section 1350, as adopted pursuant to Section 906 of the Sarbanes-Oxley Act of 2002. |
|
|
|
32.2* |
| Certification of Chief Financial Officer pursuant to 18 U.S.C. Section 1350, as adopted pursuant to Section 906 of the Sarbanes-Oxley Act of 2002. |
|
|
|
101.INS* |
| XBRL Instance Document |
|
|
|
101.SCH* |
| XBRL Taxonomy Extension Schema Document |
|
|
|
101.CAL* |
| XBRL Taxonomy Extension Calculation Linkbase Document |
|
|
|
101.DEF* |
| XBRL Taxonomy Extension Definition Linkbase Document |
|
|
|
101.LAB* |
| XBRL Taxonomy Extension Label Linkbase Document |
|
|
|
101.PRE* |
| XBRL Taxonomy Extension Presentation Linkbase Document |
* Exhibit is furnished herewith.
+ Designates a Company compensation plan or arrangement.
Pursuant to the requirements of Section 13 or 15(d) of the Securities Exchange Act of 1934, the Company has duly caused this report to be signed on its behalf by the undersigned, thereunto duly authorized, on November 30, 2012.
| COURIER CORPORATION | |
|
| |
| By: | s/Peter M. Folger |
|
| Peter M. Folger |
|
| Senior Vice President and |
Pursuant to the requirements of the Securities Exchange Act of 1934, this report has been signed below by the following persons on behalf of the registrant in the capacities indicated, on November 30, 2012.
s/James F. Conway III |
| s/Peter M. Folger |
James F. Conway III |
| Peter M. Folger |
Chairman, President and |
| Senior Vice President and |
Chief Executive Officer |
| Chief Financial Officer |
|
|
|
s/Paul Braverman |
| s/Kathleen M. Leon |
Paul Braverman |
| Kathleen M. Leon |
Director |
| Vice President and Controller |
|
|
|
s/Kathleen Foley Curley |
| s/Ronald L. Skates |
Kathleen Foley Curley |
| Ronald L. Skates |
Director |
| Director |
|
|
|
s/Edward J. Hoff |
| s/W. Nicholas Thorndike |
Edward J. Hoff |
| W. Nicholas Thorndike |
Director |
| Director |
|
|
|
s/Peter K. Markell |
| s/Susan L. Wagner |
Peter K. Markell |
| Susan L. Wagner |
Director |
| Director |
REPORT OF INDEPENDENT REGISTERED PUBLIC ACCOUNTING FIRM
To the Board of Directors and Stockholders of Courier Corporation
North Chelmsford, Massachusetts
We have audited the accompanying consolidated balance sheets of Courier Corporation and subsidiaries (the “Company”) as of September 29, 2012 and September 24, 2011, and the related consolidated statements of operations and comprehensive income, changes in stockholders’ equity, and cash flows for each of the three years in the period ended September 29, 2012. Our audits also included the financial statement schedule listed in the Index at Item 15(a)2. These financial statements and financial statement schedule are the responsibility of the Company’s management. Our responsibility is to express an opinion on the financial statements and financial statement schedule based on our audits.
We conducted our audits in accordance with the standards of the Public Company Accounting Oversight Board (United States). Those standards require that we plan and perform the audit to obtain reasonable assurance about whether the financial statements are free of material misstatement. An audit includes examining, on a test basis, evidence supporting the amounts and disclosures in the financial statements. An audit also includes assessing the accounting principles used and significant estimates made by management, as well as evaluating the overall financial statement presentation. We believe that our audits provide a reasonable basis for our opinion.
In our opinion, such consolidated financial statements present fairly, in all material respects, the financial position of Courier Corporation and subsidiaries as of September 29, 2012 and September 24, 2011, and the results of their operations and their cash flows for each of the three years in the period ended September 29, 2012, in conformity with accounting principles generally accepted in the United States of America. Also, in our opinion, such financial statement schedule, when considered in relation to the basic consolidated financial statements taken as a whole, present fairly, in all material respects, the information set forth therein.
We have also audited, in accordance with the standards of the Public Company Accounting Oversight Board (United States), the Company’s internal control over financial reporting as of September 29, 2012, based on the criteria established in Internal Control—Integrated Framework issued by the Committee of Sponsoring Organizations of the Treadway Commission and our report dated November 30, 2012 expressed an unqualified opinion on the Company’s internal control over financial reporting.
/s/ Deloitte & Touche LLP
Boston, Massachusetts
November 30, 2012
COURIER CORPORATION
CONSOLIDATED STATEMENTS OF OPERATIONS
AND COMPREHENSIVE INCOME
(Dollars in thousands except per share amounts)
|
| For the Years Ended |
| |||||||
|
| September 29, |
| September 24, |
| September 25, |
| |||
|
| 2012 |
| 2011 |
| 2010 |
| |||
|
|
|
|
|
|
|
| |||
Net sales (Note A) |
| $ | 261,320 |
| $ | 259,375 |
| $ | 257,140 |
|
Cost of sales (Note I) |
| 199,113 |
| 203,341 |
| 193,129 |
| |||
|
|
|
|
|
|
|
| |||
Gross profit |
| 62,207 |
| 56,034 |
| 64,011 |
| |||
|
|
|
|
|
|
|
| |||
Selling and administrative expenses (Note I) |
| 47,137 |
| 47,447 |
| 47,017 |
| |||
Impairment charges (Note G) |
| — |
| 8,608 |
| 4,734 |
| |||
|
|
|
|
|
|
|
| |||
Operating income (loss) |
| 15,070 |
| (21 | ) | 12,260 |
| |||
|
|
|
|
|
|
|
| |||
Interest expense, net (Notes A and D) |
| 895 |
| 921 |
| 611 |
| |||
Other income (Note O) |
| (587 | ) | — |
| — |
| |||
|
|
|
|
|
|
|
| |||
Pretax income (loss) |
| 14,762 |
| (942 | ) | 11,649 |
| |||
|
|
|
|
|
|
|
| |||
Income tax provision (benefit) (Note C) |
| 5,595 |
| (1,076 | ) | 4,535 |
| |||
|
|
|
|
|
|
|
| |||
Net income |
| $ | 9,167 |
| $ | 134 |
| $ | 7,114 |
|
|
|
|
|
|
|
|
| |||
Net income per share (Notes A and J): |
|
|
|
|
|
|
| |||
|
|
|
|
|
|
|
| |||
Basic |
| $ | 0.77 |
| $ | 0.01 |
| $ | 0.60 |
|
|
|
|
|
|
|
|
| |||
Diluted |
| $ | 0.77 |
| $ | 0.01 |
| $ | 0.60 |
|
|
|
|
|
|
|
|
| |||
Cash dividends declared per share |
| $ | 0.84 |
| $ | 0.84 |
| $ | 0.84 |
|
|
|
|
|
|
|
|
| |||
Comprehensive income (loss): |
|
|
|
|
|
|
| |||
Net income |
| $ | 9,167 |
| $ | 134 |
| $ | 7,114 |
|
Other comprehensive loss, net of tax: |
|
|
|
|
|
|
| |||
Defined benefit pension plan (Note N) |
| (95 | ) | (156 | ) | (71 | ) | |||
Comprehensive income (loss) |
| $ | 9,072 |
| $ | (22 | ) | $ | 7,043 |
|
The accompanying notes are an integral part of the consolidated financial statements.
Fiscal year 2012 was a 53-week period.
COURIER CORPORATION
(Dollars in thousands)
|
| September 29, |
| September 24, |
| ||
|
| 2012 |
| 2011 |
| ||
ASSETS |
|
|
|
|
| ||
|
|
|
|
|
| ||
Current assets: |
|
|
|
|
| ||
Cash and cash equivalents (Note A) |
| $ | 64 |
| $ | 104 |
|
Investments (Note A) |
| 765 |
| 1,141 |
| ||
Accounts receivable, less allowance for uncollectible accounts of $944 in 2012 and $789 in 2011 (Note A) |
| 35,152 |
| 35,320 |
| ||
Inventories (Note B) |
| 36,364 |
| 39,353 |
| ||
Deferred income taxes (Note C) |
| 4,273 |
| 4,431 |
| ||
Other current assets |
| 950 |
| 1,443 |
| ||
|
|
|
|
|
| ||
Total current assets |
| 77,568 |
| 81,792 |
| ||
|
|
|
|
|
| ||
Property, plant and equipment (Note A): |
|
|
|
|
| ||
Land |
| 1,934 |
| 1,934 |
| ||
Buildings and improvements |
| 47,513 |
| 45,799 |
| ||
Machinery and equipment |
| 231,508 |
| 231,155 |
| ||
Furniture and fixtures |
| 1,727 |
| 1,641 |
| ||
Construction in progress |
| 6,537 |
| 2,912 |
| ||
|
| 289,219 |
| 283,441 |
| ||
Less — Accumulated depreciation and amortization |
| (199,267 | ) | (182,918 | ) | ||
|
|
|
|
|
| ||
Property, plant and equipment, net |
| 89,952 |
| 100,523 |
| ||
|
|
|
|
|
| ||
Goodwill (Notes A, G, L and M) |
| 15,988 |
| 16,025 |
| ||
Other intangibles, net (Notes A, G, L and M) |
| 1,892 |
| 2,302 |
| ||
Prepublication costs, net (Notes A and G) |
| 7,135 |
| 7,334 |
| ||
Deferred income taxes (Note C) |
| 3,451 |
| 3,772 |
| ||
Other assets |
| 1,374 |
| 1,278 |
| ||
|
|
|
|
|
| ||
Total assets |
| $ | 197,360 |
| $ | 213,026 |
|
The accompanying notes are an integral part of the consolidated financial statements.
COURIER CORPORATION
CONSOLIDATED BALANCE SHEETS
(Dollars in thousands)
|
| September 29, |
| September 24, |
| ||
|
| 2012 |
| 2011 |
| ||
LIABILITIES AND STOCKHOLDERS’ EQUITY |
|
|
|
|
| ||
|
|
|
|
|
| ||
Current liabilities: |
|
|
|
|
| ||
Current maturities of long-term debt (Note D) |
| $ | 1,872 |
| $ | 1,804 |
|
Accounts payable (Note A) |
| 11,364 |
| 12,061 |
| ||
Accrued payroll |
| 8,360 |
| 7,737 |
| ||
Accrued taxes (Note C) |
| 3,857 |
| 2,185 |
| ||
Other current liabilities (Notes I and N) |
| 7,417 |
| 7,696 |
| ||
|
|
|
|
|
| ||
Total current liabilities |
| 32,870 |
| 31,483 |
| ||
|
|
|
|
|
| ||
Long-term debt (Notes A and D) |
| 13,696 |
| 19,718 |
| ||
Other liabilities (Notes I and N) |
| 6,283 |
| 7,502 |
| ||
|
|
|
|
|
| ||
Total liabilities |
| 52,849 |
| 58,703 |
| ||
|
|
|
|
|
| ||
Commitments and contingencies (Note E) |
|
|
|
|
| ||
|
|
|
|
|
| ||
Stockholders’ equity (Notes A, F and N): |
|
|
|
|
| ||
Preferred stock, $1 par value — authorized 1,000,000 shares; none issued |
| — |
| — |
| ||
Common stock, $1 par value - authorized 18,000,000 shares; issued 11,464,000 in 2012 and 12,237,000 in 2011 |
| 11,464 |
| 12,237 |
| ||
Additional paid-in capital |
| 18,958 |
| 19,129 |
| ||
Retained earnings |
| 115,038 |
| 123,811 |
| ||
Accumulated other comprehensive loss |
| (949 | ) | (854 | ) | ||
|
|
|
|
|
| ||
Total stockholders’ equity |
| 144,511 |
| 154,323 |
| ||
|
|
|
|
|
| ||
Total liabilities and stockholders’ equity |
| $ | 197,360 |
| $ | 213,026 |
|
The accompanying notes are an integral part of the consolidated financial statements.
COURIER CORPORATION
CONSOLIDATED STATEMENTS OF CASH FLOWS
(Dollars in thousands)
|
| For the Years Ended |
| |||||||
|
| September 29, |
| September 24, |
| September 25, |
| |||
|
| 2012 |
| 2011 |
| 2010 |
| |||
Operating Activities: |
|
|
|
|
|
|
| |||
Net income |
| $ | 9,167 |
| $ | 134 |
| $ | 7,114 |
|
Adjustments to reconcile net income to cash provided from operating activities: |
|
|
|
|
|
|
| |||
Depreciation and amortization |
| 25,060 |
| 23,162 |
| 20,681 |
| |||
Impairment charges (Note G) |
| — |
| 8,608 |
| 4,734 |
| |||
Stock-based compensation (Note F) |
| 1,429 |
| 1,440 |
| 1,287 |
| |||
Deferred income taxes (Note C) |
| 479 |
| (5,479 | ) | 1,561 |
| |||
Gain on disposition of assets (Note O) |
| (587 | ) | — |
| (183 | ) | |||
Changes in assets and liabilities: |
|
|
|
|
|
|
| |||
Accounts receivable |
| 168 |
| (197 | ) | (568 | ) | |||
Inventory |
| 2,989 |
| 580 |
| (1,866 | ) | |||
Accounts payable |
| (697 | ) | (2,338 | ) | 3,136 |
| |||
Accrued and recoverable taxes |
| 1,672 |
| 2,825 |
| (2,415 | ) | |||
Other elements of working capital |
| 1,112 |
| 103 |
| 986 |
| |||
Other long-term, net |
| (1,809 | ) | 3,475 |
| (274 | ) | |||
|
|
|
|
|
|
|
| |||
Cash provided from operating activities |
| 38,983 |
| 32,313 |
| 34,193 |
| |||
|
|
|
|
|
|
|
| |||
Investment Activities: |
|
|
|
|
|
|
| |||
Capital expenditures |
| (9,934 | ) | (15,666 | ) | (28,426 | ) | |||
Acquisition of business (Note M) |
| — |
| — |
| (3,000 | ) | |||
Prepublication costs (Note A) |
| (4,069 | ) | (4,345 | ) | (4,162 | ) | |||
Proceeds from disposition of assets (Note O) |
| 587 |
| — |
| 590 |
| |||
Short-term investments |
| 376 |
| (51 | ) | (73 | ) | |||
|
|
|
|
|
|
|
| |||
Cash used for investment activities |
| (13,040 | ) | (20,062 | ) | (35,071 | ) | |||
|
|
|
|
|
|
|
| |||
Financing Activities: |
|
|
|
|
|
|
| |||
Long-term debt (repayments) Borrowings |
| (5,954 | ) | (2,176 | ) | 10,088 |
| |||
Cash dividends |
| (10,098 | ) | (10,151 | ) | (10,068 | ) | |||
Share repurchases (Note K) |
| (10,000 | ) | — |
| — |
| |||
Proceeds from stock plans |
| 344 |
| 413 |
| 473 |
| |||
Contingent consideration (Note M) |
| (275 | ) | (340 | ) | — |
| |||
|
|
|
|
|
|
|
| |||
Cash (used for) provided from financing Activities |
| (25,983 | ) | (12,254 | ) | 493 |
| |||
|
|
|
|
|
|
|
| |||
Decrease in cash and cash equivalents |
| (40 | ) | (3 | ) | (385 | ) | |||
|
|
|
|
|
|
|
| |||
Cash and cash equivalents: |
|
|
|
|
|
|
| |||
At the beginning of the period |
| 104 |
| 107 |
| 492 |
| |||
|
|
|
|
|
|
|
| |||
At the end of the period |
| $ | 64 |
| $ | 104 |
| $ | 107 |
|
|
|
|
|
|
|
|
| |||
Supplemental cash flow information: |
|
|
|
|
|
|
| |||
Interest paid |
| $ | 609 |
| $ | 635 |
| $ | 469 |
|
Income taxes paid (net of refunds) |
| $ | 3,960 |
| $ | 1,814 |
| $ | 6,972 |
|
The accompanying notes are an integral part of the consolidated financial statements.
COURIER CORPORATION
CHANGES IN STOCKHOLDERS’ EQUITY
(Dollars in thousands)
|
|
|
|
|
|
|
|
|
| Accumulated |
| |||||
|
| Total |
|
|
| Additional |
|
|
| Other |
| |||||
|
| Stockholders’ |
| Common |
| Paid-In |
| Retained |
| Comprehensive |
| |||||
|
| Equity |
| Stock |
| Capital |
| Earnings |
| Loss |
| |||||
|
|
|
|
|
|
|
|
|
|
|
| |||||
Balance, September 26, 2009 |
| $ | 164,590 |
| $ | 11,956 |
| $ | 16,479 |
| $ | 136,782 |
| $ | (627 | ) |
|
|
|
|
|
|
|
|
|
|
|
| |||||
Net income |
| 7,114 |
| — |
| — |
| 7,114 |
| — |
| |||||
Cash dividends |
| (10,068 | ) | — |
| — |
| (10,068 | ) | — |
| |||||
Change in pension obligation, net of tax (Notes A and N) |
| (71 | ) | — |
| — |
| — |
| (71 | ) | |||||
Stock-based compensation (Note F) |
| 1,287 |
| 12 |
| 1,275 |
| — |
| — |
| |||||
Other stock plan activity |
| 97 |
| 89 |
| 8 |
| — |
| — |
| |||||
|
|
|
|
|
|
|
|
|
|
|
| |||||
Balance, September 25, 2010 |
| $ | 162,949 |
| $ | 12,057 |
| $ | 17,762 |
| $ | 133,828 |
| $ | (698 | ) |
|
|
|
|
|
|
|
|
|
|
|
| |||||
Net income |
| 134 |
| — |
| — |
| 134 |
| — |
| |||||
Cash dividends |
| (10,151 | ) | — |
| — |
| (10,151 | ) | — |
| |||||
Change in pension obligation, net of tax (Notes A and N) |
| (156 | ) | — |
| — |
| — |
| (156 | ) | |||||
Stock-based compensation (Note F) |
| 1,440 |
| 12 |
| 1,428 |
| — |
| — |
| |||||
Other stock plan activity |
| 107 |
| 168 |
| (61 | ) | — |
| — |
| |||||
|
|
|
|
|
|
|
|
|
|
|
| |||||
Balance, September 24, 2011 |
| $ | 154,323 |
| $ | 12,237 |
| $ | 19,129 |
| $ | 123,811 |
| $ | (854 | ) |
|
|
|
|
|
|
|
|
|
|
|
| |||||
Net income |
| 9,167 |
| — |
| — |
| 9,167 |
| — |
| |||||
Cash dividends |
| (10,098 | ) | — |
| — |
| (10,098 | ) | — |
| |||||
Change in pension obligation, net of tax (Notes A and N) |
| (95 | ) | — |
| — |
| — |
| (95 | ) | |||||
Share repurchase (Note K) |
| (10,000 | ) | (824 | ) | (1,334 | ) | (7,842 | ) | — |
| |||||
Stock-based compensation (Note F) |
| 1,429 |
| 15 |
| 1,414 |
| — |
| — |
| |||||
Other stock plan activity |
| (215 | ) | 36 |
| (251 | ) | — |
| — |
| |||||
|
|
|
|
|
|
|
|
|
|
|
| |||||
Balance, September 29, 2012 |
| $ | 144,511 |
| $ | 11,464 |
| $ | 18,958 |
| $ | 115,038 |
| $ | (949 | ) |
The accompanying notes are an integral part of the consolidated financial statements.
NOTES TO CONSOLIDATED FINANCIAL STATEMENTS
A. Summary of Significant Accounting Policies
Business: Courier Corporation and its subsidiaries (“Courier” or the “Company”) print, publish and sell books, providing content management and customization in new and traditional media. Courier has two operating segments: book manufacturing and publishing. In January 2010, the Company acquired Highcrest Media LLC (“Highcrest Media”), a Massachusetts-based provider of solutions that streamline the production of customized textbooks and other materials for use in colleges, universities and businesses (see Note M). Highcrest Media is included in the book manufacturing segment.
Principles of Consolidation and Presentation: The consolidated financial statements, prepared on a fiscal year basis, include the accounts of Courier Corporation and its subsidiaries after elimination of all intercompany transactions. Such financial statements have been prepared in conformity with accounting principles generally accepted in the United States of America (“generally accepted accounting principles”). Fiscal year 2012 was a 53-week period compared with fiscal years 2011 and 2010, which were 52-week periods.
Fair Value Measurements: Certain assets and liabilities are required to be recorded at fair value on a recurring basis, while other assets and liabilities are recorded at fair value on a nonrecurring basis, generally as a result of impairment charges (see Note G). Fair value is determined based on the exchange price that would be received for an asset or paid to transfer a liability (an exit price) in the principal or most advantageous market for the asset or liability in an orderly transaction between market participants. Assets measured at fair value on a nonrecurring basis include long-lived assets and goodwill and other intangible assets. The three-tier value hierarchy, which prioritizes the inputs used in the valuation methodologies, is:
Level 1—Valuations based on quoted prices for identical assets and liabilities in active markets.
Level 2—Valuations based on observable inputs other than quoted prices included in Level 1, such as quoted prices for similar assets and liabilities in active markets, quoted prices for identical or similar assets and liabilities in markets that are not active, or other inputs that are observable or can be corroborated by observable market data.
Level 3—Valuations based on unobservable inputs reflecting the Company’s own assumptions, consistent with reasonably available assumptions made by other market participants.
Financial Instruments: Financial instruments consist primarily of cash, investments in mutual funds, accounts receivable, accounts payable, debt obligations, and contingent consideration (see Note M). At September 29, 2012 and September 24, 2011, the fair value of the Company’s financial instruments approximated their carrying values. The Company classifies as cash and cash equivalents amounts on deposit in banks and instruments with maturities of three months or less at time of purchase. The fair value of the Company’s revolving credit facility approximates its carrying value due to the variable interest rate and the Company’s current rate standing (see Note D).
Investments consist of mutual fund investments for which underlying funds primarily invest in equity securities. Such short-term instruments are held for trading purposes. These investments are classified as trading securities and are recorded at fair value utilizing quoted prices in active markets at year end. Earnings from such investments were $238,000 in fiscal 2012 and $72,000 in 2010; a loss of $40,000 was incurred on these instruments in 2011. Such amounts are included in the caption “Interest expense, net” in the accompanying consolidated statements of operations.
Property, Plant and Equipment: Property, plant and equipment are recorded at cost, including interest on funds borrowed to finance the acquisition or construction of major capital additions. Interest capitalized was $30,000 in 2011 and $55,000 in 2010; no such interest was capitalized in 2012. The Company provides for depreciation of property, plant and equipment on a straight-line basis over periods ranging from 10 to 40 years on buildings and improvements and from 3 to 11 years on equipment and furnishings.
Expenditures for maintenance and repairs are charged against income as incurred; betterments that increase the value or materially extend the life of the related assets are capitalized. When assets are sold or retired, the cost and accumulated depreciation are removed from the accounts and any gain or loss is included in income.
Goodwill and Other Intangibles: The Company evaluates possible impairment annually at the end of its fiscal year or whenever events or changes in circumstances indicate that the carrying value of the assets may not be recoverable. These tests are performed at the reporting unit level, which is the operating segment or one level below the operating segment. The goodwill impairment test is a two-step test. In the first step, the Company compares the fair value of the reporting unit to its carrying value. If the fair value of the reporting unit exceeds the carrying value of its net assets, then goodwill is not impaired and the Company is not required to perform further testing. If the carrying value of the net assets of the reporting unit exceeds its fair value, then a second step is performed in order to determine the implied fair value of the reporting unit’s goodwill and compare it to the carrying value of its goodwill (see Note G).
“Other intangibles” include trade names, customer lists and technology. Trade names with indefinite lives are not subject to amortization and are reviewed at least annually for potential impairment at the end of the fiscal year or whenever events or changes in circumstances indicate that the carrying value of the assets may not be recoverable.
Prepublication Costs: Prepublication costs, associated with creating new titles in the publishing segment, are amortized to cost of sales using the straight-line method over estimated useful lives of two to four years. In fiscal 2011, an impairment charge of approximately $200,000 was recorded related to underperforming titles at Research & Education Association, Inc. (“REA”) and in fiscal 2010, a $475,000 impairment charge was recorded for underperforming titles at Federal Marketing Corporation, d/b/a Creative Homeowner (“Creative Homeowner”) (see Note G).
Long-Lived Assets: Management periodically reviews long-lived assets for impairment. In fiscal 2011, the Company recorded impairments of long-lived assets of approximately $200,000 for REA, as discussed above in the caption “Prepublication Costs” and in Note G, “Goodwill and Other Intangibles.”
Income Taxes: Deferred income tax liabilities and assets are determined based upon the differences between the financial statement and tax bases of assets and liabilities, and are measured by applying enacted tax rates and laws for the taxable years in which these differences are expected to reverse.
Revenue Recognition: Revenue is recognized upon shipment of goods to customers or upon the transfer of ownership for those customers for whom the Company provides manufacturing and distribution services. Revenue for distribution services is recognized as services are provided. Shipping and handling fees billed to customers are classified as revenue. In the publishing segment, revenue is recognized net of an allowance for sales returns. The process which the Company uses to determine its net sales, including the related reserve allowance for returns, is based upon applying an estimated return rate to current year sales. This estimated return rate is based on actual historical return experience. In the Company’s book manufacturing segment, sales returns are not permitted.
Use of Estimates: The process of preparing financial statements in conformity with generally accepted accounting principles requires management to make estimates of assets and liabilities and disclosure of contingent assets and liabilities and assumptions that affect the reported amounts at the date of the financial statements. Actual results may differ from these estimates.
Net Income per Share: Basic net income per share is based on the weighted average number of common shares outstanding each period. Diluted net income per share also includes potentially dilutive items such as stock options (Note J).
New Accounting Pronouncements: In May 2011, the Financial Accounting Standards Board (“FASB”) issued amendments to disclosure requirements for common fair value measurement. These amendments, effective for interim and annual periods beginning on or after December 15, 2011, result in common definitions of fair value and common requirements for measurement of and disclosure requirements between accounting principles generally accepted in the United States and International Financial Reporting Standards. Consequently, the amendments change some fair value measurement principles and disclosure requirements. The implementation of this amended accounting guidance is not expected to have a material impact on the Company’s consolidated financial statements.
In September 2011, the FASB issued new guidance on testing goodwill for impairment. This new guidance gives entities, subject to certain conditions, the option of first performing a qualitative assessment to determine whether the existence of events or circumstances leads to a determination that it is more likely than not that the fair value of the reporting unit is less than its carrying amount. The guidance is effective prospectively for annual and interim goodwill impairment tests performed for fiscal years beginning after December 15, 2011, with early adoption permitted. The implementation of this amended accounting guidance is not expected to have a material impact on the Company’s consolidated financial statements.
In June 2011, the FASB issued amendments to disclosure requirements for the presentation of comprehensive income. This guidance, effective for the interim and annual periods beginning on or after December 15, 2011, requires the presentation of total comprehensive income, the components of net income, and the components of other comprehensive income either in a single continuous statement of comprehensive income or in two separate but consecutive statements. The implementation of this amended accounting guidance, adopted by the Company in fiscal 2012, did not have a material impact on the Company’s consolidated financial statements.
B. Inventories
Inventories are valued at the lower of cost or market. Cost is determined using the last-in, first-out (LIFO) method for approximately 57% and 53% of the Company’s inventories at September 29, 2012 and September 24, 2011, respectively. Other inventories, primarily in the publishing segment, are determined on a first-in, first-out (FIFO) basis.
Inventories consisted of the following at September 29, 2012 and September 24, 2011:
|
| (000’s omitted) |
| ||||
|
| 2012 |
| 2011 |
| ||
|
|
|
|
|
| ||
Raw materials |
| $ | 4,523 |
| $ | 5,574 |
|
Work in process |
| 8,763 |
| 8,698 |
| ||
Finished goods |
| 23,078 |
| 25,081 |
| ||
Total |
| $ | 36,364 |
| $ | 39,353 |
|
On a FIFO basis, reported year-end inventories would have been higher by $5.0 million and $5.3 million in fiscal 2012 and fiscal 2011, respectively.
C. Income Taxes
The income tax provision (benefit) differs from that computed using the statutory federal income tax rates for the following reasons:
|
| (000’s omitted) |
| |||||||
|
| 2012 |
| 2011 |
| 2010 |
| |||
|
|
|
|
|
|
|
| |||
Federal taxes at statutory rate |
| $ | 5,166 |
| $ | (330 | ) | $ | 3,960 |
|
State taxes, net of federal tax benefit |
| 1,104 |
| (170 | ) | 750 |
| |||
Federal manufacturer’s deduction |
| (458 | ) | (390 | ) | (164 | ) | |||
Tax credits |
| (235 | ) | (181 | ) | — |
| |||
Other |
| 18 |
| (5 | ) | (11 | ) | |||
Total |
| $ | 5,595 |
| $ | (1,076 | ) | $ | 4,535 |
|
Federal tax benefits were recognized in fiscal years 2011 and 2010 related to impairment charges for REA and Creative Homeowner intangible assets (see Note G). A state tax benefit of approximately 7% was also recognized on the impairment charge in fiscal 2011 for REA, however, a valuation allowance of approximately $200,000 was deemed necessary in the current year. No state tax benefit was recognized on the impairment charge for Creative Homeowner as the Company provided a valuation allowance on the related deferred state tax asset.
The provision for income taxes consisted of the following:
|
| (000’s omitted) |
| ||||||||
|
| 2012 |
| 2011 |
| 2010 |
| ||||
|
|
|
|
|
|
|
| ||||
Current: | Federal |
| $ | 3,977 |
| $ | 3,735 |
| $ | 2,057 |
|
| State |
| 1,055 |
| 668 |
| 917 |
| |||
|
|
| 5,032 |
| 4,403 |
| 2,974 |
| |||
|
|
|
|
|
|
|
|
| |||
Deferred: | Federal |
| 90 |
| (4,417 | ) | 1,257 |
| |||
| State |
| 473 |
| (1,062 | ) | 304 |
| |||
|
| 563 |
| (5,479 | ) | 1,561 |
| ||||
Total |
| $ | 5,595 |
| $ | (1,076 | ) | $ | 4,535 |
| |
The following is a summary of the significant components of deferred tax assets and liabilities as of September 29, 2012 and September 24, 2011:
|
| (000’s omitted) |
| ||||
|
| 2012 |
| 2011 |
| ||
Current deferred tax assets: |
|
|
|
|
| ||
Vacation accrual not currently deductible |
| $ | 767 |
| $ | 767 |
|
Other accruals not currently deductible |
| 684 |
| 553 |
| ||
Non-deductible reserves |
| 3,158 |
| 2,990 |
| ||
Other |
| 58 |
| 231 |
| ||
Total current deferred tax assets |
| 4,667 |
| 4,541 |
| ||
Valuation allowances |
| (394 | ) | (110 | ) | ||
Total current deferred tax assets, net |
| 4,273 |
| 4,431 |
| ||
|
|
|
|
|
| ||
Continued:
|
| (000’s omitted) |
| ||||
|
| 2012 |
| 2011 |
| ||
|
|
|
|
|
| ||
Non-current deferred tax assets (liabilities): |
|
|
|
|
| ||
Deferred compensation arrangements |
| 1,646 |
| 1,975 |
| ||
Goodwill and other intangibles |
| 8,506 |
| 10,069 |
| ||
Accelerated depreciation |
| (7,898 | ) | (9,506 | ) | ||
State NOL and credit carryforwards |
| 3,497 |
| 2,777 |
| ||
Pension obligation (Note N) |
| 217 |
| 314 |
| ||
Restructuring reserve |
| 1,141 |
| 1,350 |
| ||
Other |
| 543 |
| 463 |
| ||
Total non-current deferred tax assets |
| 7,652 |
| 7,442 |
| ||
Valuation allowances |
| (4,201 | ) | (3,670 | ) | ||
Total non-current deferred tax assets (liabilities), net |
| 3,451 |
| 3,772 |
| ||
|
|
|
|
|
| ||
Total deferred tax assets |
| $ | 7,724 |
| $ | 8,203 |
|
The Company fully provided valuation allowances for net operating loss and credit carryforwards in states where the Company does not expect to realize the benefit. The losses and credits expire in fiscal years 2013 through 2033. The Company increased its valuation allowance by $0.8 million in 2012 and decreased its valuation allowance by $1.1 million in 2011.
During fiscal years 2012, 2011 and 2010 certain federal and state statutes of limitations expired. As such, the unrecognized tax benefits and accrued interest were reduced by approximately $22,000 in fiscal year 2010. There were no such liability balances remaining at the end of fiscal years 2012 and 2011 and the Company does not anticipate any significant changes in the amount of unrecognized tax benefits over the next twelve months. The Company recognizes interest and penalties related to unrecognized tax benefits in income tax expense.
The Company files federal and state income tax returns in various jurisdictions of the United States. With few exceptions, the Company is no longer subject to income tax examinations for years prior to fiscal 2009. Substantially all U.S. federal tax years prior to fiscal 2011 have been audited by the Internal Revenue Service and closed.
D. Long-Term Debt
The Company has a $100 million long-term revolving credit facility in place under which the Company can borrow at a rate not to exceed LIBOR plus 2.25%. On March 22, 2012, the Company amended this credit facility and extended the maturity date by three years to March 31, 2016. The Company also added TD Bank, N.A. to the bank group, replacing Wells Fargo, N.A. The Company’s interest rate at September 29, 2012 was 1.5%. At September 29, 2012 and September 24, 2011, the Company had $12.6 million and $16.7 million, respectively, in borrowings under its long-term revolving credit facility.
On March 26, 2010, the Company entered into a four-year term loan to finance the purchase of digital print assets and provided a lien on the assets acquired with the proceeds. At September 29, 2012, $3.0 million of debt was outstanding under this arrangement, with $1.2 million at a fixed annual interest rate of 3.9% and $1.8 million at a fixed annual interest rate of 3.6%. Current maturities for this loan were $1.9 million at September 29, 2012.
At September 29, 2012, scheduled aggregate principal payments under these obligations were $1,872,000 in 2013, $1,125,000 in 2014 and $12,571,000 in 2016.
The revolving credit facility and four-year term loan contain restrictive covenants including provisions relating to the incurrence of additional indebtedness and a quarterly test of EBITDA to debt service. The company was in compliance with all such covenants at September 29, 2012. The revolving credit facility also provides for a commitment fee not to exceed 3/8% per annum on the unused portion. These fees are
included in the caption “Interest expense, net” in the accompanying Consolidated Statements of Operations. The revolving credit facility is available to the Company for both its long-term and short-term financing needs.
E. Commitments and Contingencies
The Company is committed under various operating leases to make annual rental payments for certain buildings and equipment. Amounts charged to operations under such leases approximated $1,350,000 in 2012, $1,835,000 in 2011, and $1,827,000 in 2010. As of September 29, 2012, minimum annual rental commitments under the Company’s long-term operating leases were approximately $1,181,000 in 2013, $1,031,000 in 2014, $795,000 in 2015, $762,000 in 2016, $754,000 in 2017 and $2,228,000 in the aggregate thereafter. These rental commitments exclude the Company’s lease obligation for the Stoughton, Massachusetts facility, which was included in restructuring costs (see Note I). At both September 29, 2012 and September 24, 2011, the Company had letters of credit outstanding of $2,180,000. The Company was committed to purchase $5.9 million of equipment at September 29, 2012.
In the ordinary course of business, the Company is subject to various legal proceedings and claims. The Company believes that the ultimate outcome of these matters will not have a material adverse effect on its consolidated financial statements.
F. Stock Arrangements
The Company records stock-based compensation expense for the cost of stock options and stock grants as well as shares issued under the Company’s 1999 Employee Stock Purchase Plan, as amended (the “ESPP”). The fair value of each option awarded is calculated on the date of grant using the Black-Scholes option-pricing model.
Stock-based compensation recognized in selling and administrative expenses in the accompanying financial statements, and the related tax benefit, were as follows:
|
| (000’s omitted) |
| |||||||
|
| 2012 |
| 2011 |
| 2010 |
| |||
|
|
|
|
|
|
|
| |||
Stock-based compensation expense |
| $ | 1,429 |
| $ | 1,440 |
| $ | 1,287 |
|
Related tax benefit |
| (519 | ) | (517 | ) | (457 | ) | |||
Stock-based compensation, net of tax |
| $ | 910 |
| $ | 923 |
| $ | 830 |
|
Unrecognized stock-based compensation cost at September 29, 2012 was $1.3 million to be recognized over a weighted-average period of 1.6 years.
Stock Incentive Plan: In January 2011, stockholders approved the adoption of the Courier Corporation 2011 Stock Option and Incentive Plan (the “2011 Plan”). Under the 2011 Plan provisions, stock grants as well as both non-qualified and incentive stock options to purchase shares of the Company’s common stock may be granted to key employees up to a total of 600,000 shares. The 2011 Plan replaced the Company’s Amended and Restated 1993 Stock Incentive Plan (the “1993 Plan”). No further options will be granted under the 1993 Plan. Under the 2011 Plan, the option price per share may not be less than the fair market value of stock at the time the option is granted and incentive stock options must expire not later than ten years from the date of grant. The Company annually issues a combination of stock options and stock grants to its key employees. Such options and grants, historically issued in September each year, were awarded in November 2012. As such, no annual awards were issued during the fiscal year ended September 29, 2012. Stock options and stock grants generally vest over three years.
The following is a summary of all option activity for these plans:
|
|
|
| Weighted Average |
| |||
|
|
|
| Exercise |
| Remaining |
| |
|
| Shares |
| Price |
| Term (Years) |
| |
Outstanding at September 26, 2009 |
| 463,886 |
| $ | 24.74 |
|
|
|
Issued |
| 152,085 |
| 14.35 |
|
|
| |
Cancelled |
| (5,413 | ) | 19.34 |
|
|
| |
Expired |
| (92,121 | ) | 23.67 |
|
|
| |
Outstanding at September 25, 2010 |
| 518,437 |
| $ | 21.94 |
|
|
|
Issued |
| 97,540 |
| 7.40 |
|
|
| |
Expired |
| (28,281 | ) | 27.35 |
|
|
| |
Outstanding at September 24, 2011 |
| 587,696 |
| $ | 19.27 |
|
|
|
Issued |
| 1,575 |
| 8.47 |
|
|
| |
Cancelled |
| (62,732 | ) | 11.91 |
|
|
| |
Expired |
| (154,864 | ) | 32.70 |
|
|
| |
Outstanding at September 29, 2012 |
| 371,675 |
| $ | 14.86 |
| 2.3 |
|
|
|
|
|
|
|
|
| |
Exercisable at September 29, 2012 |
| 284,011 |
| $ | 16.26 |
| 1.9 |
|
Available for future grants |
| 425,607 |
|
|
|
|
| |
The aggregate intrinsic value for options outstanding at September 29, 2012 was $360,000. There were 171,837 non-vested stock grants outstanding at the beginning of fiscal 2012 with a weighted-average fair value of $10.32 per share. During 2012, 3,900 stock grants were awarded with a weighted-average fair value of $8.47 per share. There were 40,684 stock grants that vested in 2012 with a weighted-average fair value of $13.24 per share. During 2012, there were 19,973 stock grants forfeited, which had a weighted-average fair value of $10.13 per share. At September 29, 2012, there were 115,080 non-vested stock grants outstanding with a weighted-average fair value of $9.26.
Directors’ Stock Equity Plans: In January 2010, stockholders approved the Courier Corporation 2010 Stock Equity Plan for Non-Employee Directors (the “2010 Plan”). Under the plan provisions, stock grants as well as non-qualified stock options to purchase shares of the Company’s common stock may be granted to non-employee directors up to a total of 300,000 shares. The 2010 Plan replaces the previous non-employee directors’ plan, which had been adopted in 2005 (the “2005 Plan”). No further options will be granted under the 2005 Plan. Under the 2010 Plan, the option price per share is the fair market value of stock at the time the option is granted and options must expire not later than ten years from the date of grant. Stock options and stock grants generally vest over three years.
The following is a summary of all option activity for these plans:
|
|
|
| Weighted Average |
| |||
|
|
|
| Exercise |
| Remaining |
| |
|
| Shares |
| Price |
| Term (Years) |
| |
Outstanding at September 26, 2009 |
| 186,687 |
| $ | 28.89 |
|
|
|
Issued |
| 53,179 |
| 13.71 |
|
|
| |
Expired |
| (33,000 | ) | 32.65 |
|
|
| |
Outstanding at September 25, 2010 |
| 206,866 |
| $ | 24.39 |
|
|
|
Issued |
| 43,477 |
| 14.76 |
|
|
| |
Expired |
| (49,572 | ) | 32.89 |
|
|
| |
Outstanding at September 24, 2011 |
| 200,771 |
| 20.20 |
|
|
| |
Issued |
| 67,697 |
| 11.50 |
|
|
| |
Expired |
| (28,548 | ) | 39.18 |
|
|
| |
Outstanding at September 29, 2012 |
| 239,920 |
| 15.49 |
| 2.6 |
| |
|
|
|
|
|
|
|
| |
Exercisable at September 29, 2012 |
| 125,519 |
| $ | 18.06 |
| 1.5 |
|
Available for future grants |
| 56,395 |
|
|
|
|
| |
The aggregate intrinsic value for options outstanding at September 29, 2012 was $49,000. Under the 2010 Plan, there were 20,552 non-vested stock grants outstanding at the beginning of fiscal 2012 with a weighted-average fair value of $14.31 per share. During 2012, 15,596 stock grants were awarded with a weighted-average fair value of $11.50 per share. There were 8,316 stock grants that vested in 2012 with a weighted-average fair value of $14.21 per share. At September 29, 2012, there were 27,832 non-vested stock grants outstanding with a weighted-average fair value of $12.77.
Directors may also elect to receive their annual retainer and committee chair fees as shares of stock in lieu of cash. Such shares issued in 2012, 2011 and 2010 were 14,784 shares, 11,520 shares, and 12,404 shares at a fair market value of $11.50, $14.76 and $13.71, respectively.
Employee Stock Purchase Plan: The ESPP allows eligible employees to purchase shares of Company common stock at not less than 85% of fair market value at the end of the grant period. On January 20, 2010, stockholders approved an amendment to the ESPP increasing the shares authorized under the plan by 300,000 to an aggregate of 637,500 shares of Company common stock available for issuance under the plan. During 2012, 2011, and 2010, 36,808 shares, 48,774 shares, and 39,273 shares, respectively, were issued under the plan at an average price of $9.35 per share, $8.46 per share, and $12.05 per share, respectively. Since inception, 450,579 shares have been issued. At September 29, 2012, an additional 186,921 shares were reserved for future issuances.
Stockholders’ Rights Plan: On March 18, 2009, the Board of Directors renewed its ten-year stockholders’ rights plan. Under the plan, the Company’s stockholders of record at March 19, 2009 received a right to purchase a unit (“Unit”) comprised of one one-thousandth of a share of preferred stock for each share of common stock held on that date at a price of $100, subject to adjustment. Until such rights become exercisable, one such right will also attach to subsequently issued shares of common stock. The rights become exercisable if a person or group acquires 15% or more of the Company’s common stock or after commencement of a tender or exchange offer which would result in a person or group beneficially owning 15% or more of the Company’s common stock. When exercisable, under certain conditions, each right entitles the holder thereof to purchase Units or shares of common stock of the acquirer, in each case having a market value at that time of twice the right’s exercise price. The Board of Directors will be entitled to redeem the rights at one cent per right, under certain circumstances. The rights expire in 2019.
Stock-Based Compensation: The fair value of each option grant was estimated on the date of the grant using the Black-Scholes option-pricing model. The fair value is then amortized on a straight-line basis over the requisite service periods of the awards, which is generally the vesting period. Expected volatility was calculated primarily based on the historical volatility of the Company’s stock. The average estimated life was based on the contractual term of the option and historic exercise experience. The following key assumptions were used to value options issued:
|
| 2012 |
| 2011 |
| 2010 |
|
Risk-free interest rate |
| 0.9%–1.0% |
| 1.0%–2.0% |
| 1.4%–2.8% |
|
Expected volatility |
| 49%–50% |
| 48%–49% |
| 46%–49% |
|
Expected dividend yield |
| 7.3%–11.4% |
| 5.7%–11.4% |
| 5.8%–6.1% |
|
Estimated life for grants under: |
|
|
|
|
|
|
|
Stock Incentive Plan |
| 5 years |
| 5 years |
| 5 years |
|
Directors’ Stock Equity Plans |
| 5 years |
| 5 years |
| 5 years |
|
ESPP |
| 0.5 years |
| 0.5 years |
| 0.5 years |
|
The weighted average fair value per share of options granted during fiscal years 2012, 2011 and 2010 were $1.12, $1.12 and $3.73, respectively, under the Company’s Employee 2011 Plan and $2.70, $3.98 and $3.46, respectively, under the Directors’ 2010 Plan. For all options issued, the exercise price was equal to the stock price on the grant date.
G. Goodwill and Other Intangibles
The Company evaluates possible impairment annually at the end of its fiscal year or whenever events or changes in circumstances indicate that the carrying value of the assets may not be recoverable (a “triggering event”). These tests are performed at the reporting unit level, which is the operating segment
or one level below the operating segment. The goodwill impairment test is a two-step test. There were no such events or changes in circumstances in the period ended September 29, 2012.
In the third quarter of fiscal 2011, the Company recorded a pre-tax impairment charge of $8.4 million, representing all of REA’s goodwill. In addition, an impairment charge of approximately $200,000 for prepublication costs was recorded in the third quarter of fiscal 2011 relating to underperforming titles (see Notes A and G). In the fourth quarter of fiscal 2010, a $4.3 million pre-tax impairment charge was recorded for all of the remaining intangible assets of Creative Homeowner, including $1.8 million of goodwill, $1.9 million for customer lists and $0.6 million related to trade name.
During the second quarter of fiscal 2010, the Company acquired Highcrest Media (see Note M). The acquisition of Highcrest Media was recorded by allocating the fair value of consideration of the acquisition to the identified assets acquired, including intangible assets and liabilities assumed, based on their estimated fair value at the acquisition date. The excess of the fair value of consideration of the acquisition over the net amounts assigned to the fair value of the assets acquired and liabilities assumed was recorded as goodwill of $1.5 million. In addition, the Company recorded intangibles related to customer lists and technology totaling $1.9 million.
The following table reflects the components of “Goodwill” for each period presented:
|
| (000’s omitted) |
| |||||||
|
| Book |
| Publishing |
| Total |
| |||
Goodwill |
| $ | 14,772 |
| $ | 41,102 |
| $ | 55,874 |
|
Accumulated impairment charges |
| — |
| (30,894 | ) | (30,894 | ) | |||
Balance at September 26, 2009 |
| 14,772 |
| 10,208 |
| 24,980 |
| |||
Acquisition of Highcrest Media (Note M) |
| 1,517 |
| — |
| 1,517 |
| |||
Impairment charge |
| — |
| (1,800 | ) | (1,800 | ) | |||
Balance at September 25, 2010 |
| 16,289 |
| 8,408 |
| 24,697 |
| |||
Impairment charge and other |
| (264 | ) | (8,408 | ) | (8,672 | ) | |||
Balance at September 24, 2011 |
| 16,025 |
| — |
| 16,025 |
| |||
Deferred tax adjustment |
| (37 | ) | — |
| (37 | ) | |||
Balance at September 29, 2012 |
| $ | 15,988 |
| — |
| $ | 15,988 |
| |
The following table reflects the components of “Other intangibles” for each period presented:
|
| (000’s omitted) |
| ||||||||||||||||
|
| Book Manufacturing |
| Publishing |
|
|
| ||||||||||||
|
| Trade |
| Customer |
| Technology |
| Trade |
| Customer |
| Total |
| ||||||
Balance at September 26, 2009 |
| $ | 931 |
| $ | 150 |
| — |
| $ | 550 |
| $ | 2,089 |
| $ | 3,720 |
| |
Acquisition (Note M) |
| — |
| 700 |
| 1,230 |
| — |
| — |
| 1,930 |
| ||||||
Amortization expense |
| — |
| (124 | ) | (175 | ) | — |
| (180 | ) | (479 | ) | ||||||
Impairment charge |
| — |
| — |
| — |
| (550 | ) | (1,909 | ) | (2,459 | ) | ||||||
Balance at September 25, 2010 |
| 931 |
| 726 |
| 1,055 |
| — |
| — |
| 2,712 |
| ||||||
Amortization expense |
| — |
| (164 | ) | (246 | ) | — |
| — |
| (410 | ) | ||||||
Balance at September 24, 2011 |
| 931 |
| 562 |
| 809 |
| — |
| — |
| 2,302 |
| ||||||
Amortization expense |
| — |
| (164 | ) | (246 | ) | — |
| — |
| (410 | ) | ||||||
Balance at September 29, 2012 |
| $ | 931 |
| $ | 398 |
| $ | 563 |
| — |
| — |
| $ | 1,892 |
| ||
“Other intangibles” at September 29, 2012 included customer lists related to Moore-Langen Printing Company, Inc. (“Moore Langen”), which are being amortized over a 10-year period, as well as customer lists, technology and other intangibles related to the acquisition of Highcrest Media, which are being amortized over a 5-year period. Amortization expense was $410,000 in fiscal 2012, $410,000 in fiscal 2011, and $479,000 in fiscal 2010. Annual amortization expense over the next two years will be $410,000; decreasing to $135,000 and $6,000 in the third and fourth years, respectively. At September
29, 2012, “other intangibles” were net of accumulated amortization of $1.2 million for the book manufacturing segment.
H. Fair Value Measurements
Certain assets and liabilities are required to be recorded at fair value on a recurring basis. The Company’s only assets and liabilities adjusted to fair value on a recurring basis are short-term investments in mutual funds and contingent consideration (see Note M). In addition to assets and liabilities that are recorded at fair value on a recurring basis, the Company is required to record certain assets and liabilities on a nonrecurring basis, generally as a result of acquisitions (see Note M) or the remeasurement of assets resulting in impairment charges.
The following table shows the assets and liabilities carried at fair value measured on a recurring basis as of September 29, 2012 and September 24, 2011 classified in one of the three levels as described in Note A:
|
| (000’s Omitted) |
| ||||||||
|
| Total |
| Quoted |
| Significant |
| Significant |
| ||
As of September 29, 2012: |
|
|
|
|
|
|
|
|
| ||
Short-term investments in mutual funds |
| $ | 765 |
| $ | 765 |
| — |
| — |
|
Contingent consideration liability |
| (385 | ) | — |
| — |
| (385 | ) | ||
|
|
|
|
|
|
|
|
|
| ||
As of September 24, 2011: |
|
|
|
|
|
|
|
|
| ||
Short-term investments in mutual funds |
| $ | 1,141 |
| $ | 1,141 |
| — |
| — |
|
Contingent consideration liability |
| (685 | ) | — |
| — |
| (685 | ) | ||
During fiscal year 2011, assets remeasured at fair value on a nonrecurring basis subsequent to initial recognition are summarized below:
|
| Impairment |
| Fair Value |
| Net Book |
| |||
Fiscal year ended September 24, 2011: |
|
|
|
|
|
|
| |||
Goodwill |
| $ | 8,408 |
| — |
| — |
| ||
Prepublication costs |
| 200 |
| $ | 7,334 |
| $ | 7,334 |
| |
|
| $ | 8,608 |
| $ | 7,334 |
| $ | 7,334 |
|
In the third quarter of fiscal 2011, the Company determined that the fair value of REA was below its carrying value using a valuation methodology based on a discounted cash flow and a market value approach (Level 3). Key assumptions and estimates included revenue and operating income forecasts and the assessed growth rate after the forecast period. The Company recorded a pre-tax impairment charge of $8.4 million, representing all of REA’s goodwill (see Note G). In addition, an impairment charge of approximately $200,000 for prepublication costs was recorded relating to underperforming titles (see Note A).
I. Restructuring Costs
In fiscal 2012, approximately $3.3 million of pre-tax restructuring charges were recorded for cost reduction measures taken throughout the year in the Company’s operating segments, including a reduction in the Company’s one-color offset press capacity. Severance and post-retirement benefit expenses were $1.9 million and accelerated depreciation on an unutilized one-color press was $1.4 million. Approximately $1.7 million of these costs were included in cost of sales in the Company’s book manufacturing segment. Approximately $1.0 million and $0.6 million of these costs were included in
selling and administrative expenses in the Company’s book manufacturing segment and publishing segment, respectively. At September 29, 2012, approximately $0.5 million of the remaining restructuring payments were included in “Other current liabilities” and approximately $0.2 million, which will be paid by December 2013, were included in “Other liabilities” in the accompanying consolidated balance sheet.
In fiscal 2011, the Company recorded restructuring costs of $7.7 million associated with closing and consolidating its Stoughton, Massachusetts manufacturing facility due to the impact of technology and competitive pressures affecting the one-color paperback books in which the plant specialized. Restructuring costs included $2.3 million for employee severance and benefit costs, $2.1 million for an early withdrawal liability from a multi-employer pension plan, and $3.3 million for lease termination and other facility closure costs; no sub-lease income was assumed at the time due to local real estate market conditions. Subsequently, a portion of the facility will be sublet effective March 2013; the benefit of the sublease was largely offset by additional building closure costs. Of the total $7.7 million of restructuring costs in the book manufacturing segment, $7.3 million was included in cost of sales and $0.4 million was included in selling and administrative expenses. Remaining payments of approximately $3.8 million will be made over periods ranging from 3 years for the building lease obligation to 19 years for the liability related to the multi-employer pension plan. At September 29, 2012, approximately $0.9 million of the restructuring payments were included in “Other current liabilities” and $3.1 million were included in “Other liabilities” in the accompanying consolidated balance sheet.
The following table depicts the accrual balances for these restructuring costs.
|
| (000’s omitted) |
| ||||||||||
|
| Accrual at |
| Charges |
| Costs |
| Accrual at |
| ||||
|
| September 24, |
| or |
| Paid or |
| September 29, |
| ||||
|
| 2011 |
| Reversals |
| Settled |
| 2012 |
| ||||
Employee severance, post-retirement and other benefit costs |
| $ | 285 |
| $ | 1,814 |
| $ | (1,229 | ) | $ | 870 |
|
Early withdrawal from multi-employer pension plan |
| 2,119 |
| — |
| (47 | ) | 2,072 |
| ||||
Accelerated depreciation of equipment |
| — |
| 1,433 |
| (1,433 | ) | — |
| ||||
Lease termination, facility closure and other costs |
| 2,345 |
| 78 |
| (758 | ) | 1,665 |
| ||||
Total |
| $ | 4,749 |
| $ | 3,325 |
| $ | (3,467 | ) | $ | 4,607 |
|
J. Net Income per Share
Following is a reconciliation of the outstanding shares used in the calculation of basic and diluted net income per share. Potentially dilutive shares, calculated using the treasury stock method, consist of shares issued under the Company’s stock option plans.
|
| (000’s omitted) |
| ||||
|
| 2012 |
| 2011 |
| 2010 |
|
Weighted average shares for basic |
| 11,849 |
| 11,985 |
| 11,916 |
|
Effect of potentially dilutive shares |
| 79 |
| 37 |
| 19 |
|
Weighted average shares for dilutive |
| 11,928 |
| 12,022 |
| 11,935 |
|
K. Share Repurchase Plan
On April 19, 2012, the Company announced the approval by its Board of Directors for the repurchase of up to $10 million of the Company’s outstanding common stock from time to time on the open market or in privately negotiated transactions, including pursuant to a Rule 10b5-1 nondiscretionary trading plan. Through September 29, 2012, the Company repurchased 823,970 shares of common stock for approximately $10.0 million.
In addition, on November 20, 2012, the Company announced the approval by its Board of Directors for the repurchase of up to $10 million of the Company’s outstanding common stock from time to time on the open market or in privately negotiated transactions, including pursuant to a Rule 10b5-1 nondiscretionary trading plan.
L. Operating Segments
The Company has two operating segments: book manufacturing and publishing. The book manufacturing segment offers a full range of services from production through storage and distribution for religious, educational and specialty trade book publishers. In January 2010, the Company acquired Highcrest Media, which has been included in the book manufacturing segment (see Note M). The publishing segment consists of Dover, Creative Homeowner and REA.
Segment performance is evaluated based on several factors, of which the primary financial measure is operating income. Operating income is defined as gross profit (sales less cost of sales) less selling and administrative expenses, and includes severance and other restructuring costs but excludes stock-based compensation. As such, segment performance is evaluated exclusive of interest, income taxes, stock-based compensation, intersegment profit, other income, and impairment charges. The elimination of intersegment sales and related profit represents sales from the book manufacturing segment to the publishing segment.
Stock-based compensation, as well as the elimination of intersegment sales and related profit, are reflected as “unallocated” in the following table. Impairment charges (discussed more fully in Note G) are also included in “unallocated” in the following table. Corporate expenses that are allocated to the segments include various support functions such as information technology services, finance, legal, human resources and engineering, and include depreciation and amortization expense related to corporate assets. The corresponding corporate asset balances are not allocated to the segments. Unallocated corporate assets consist primarily of cash and cash equivalents and fixed assets used by the corporate support functions.
Dollar amounts in the following table are presented in thousands.
|
| Total |
| Book |
| Publishing |
| Unallocated |
| ||||
Fiscal 2012 |
|
|
|
|
|
|
|
|
| ||||
Net sales |
| $ | 261,320 |
| $ | 233,040 |
| $ | 38,355 |
| $ | (10,075 | ) |
Operating income (loss) |
| 15,070 |
| 20,713 |
| (4,364 | ) | (1,279 | ) | ||||
Total assets |
| 197,360 |
| 155,487 |
| 28,968 |
| 12,905 |
| ||||
Goodwill, net |
| 15,988 |
| 15,988 |
| — |
| — |
| ||||
Depreciation |
| 20,381 |
| 19,317 |
| 394 |
| 670 |
| ||||
Amortization |
| 4,679 |
| 410 |
| 4,269 |
| — |
| ||||
Capital expenditures and prepublication costs |
| 14,003 |
| 8,661 |
| 4,670 |
| 672 |
| ||||
Interest expense, net |
| 895 |
| — |
| — |
| 895 |
| ||||
|
|
|
|
|
|
|
|
|
| ||||
Fiscal 2011 |
|
|
|
|
|
|
|
|
| ||||
Net sales |
| $ | 259,375 |
| $ | 230,229 |
| $ | 40,829 |
| $ | (11,683 | ) |
Operating income (loss) |
| (21 | ) | 14,822 |
| (4,821 | ) | (10,022 | ) | ||||
Total assets |
| 213,026 |
| 169,758 |
| 32,874 |
| 10,394 |
| ||||
Goodwill, net |
| 16,025 |
| 16,025 |
| — |
| — |
| ||||
Depreciation |
| 18,129 |
| 17,061 |
| 355 |
| 713 |
| ||||
Amortization |
| 5,033 |
| 410 |
| 4,623 |
| — |
| ||||
Capital expenditures and prepublication costs |
| 20,011 |
| 15,128 |
| 4,522 |
| 361 |
| ||||
Interest expense, net |
| 921 |
| — |
| — |
| 921 |
| ||||
|
|
|
|
|
|
|
|
|
| ||||
Fiscal 2010 |
|
|
|
|
|
|
|
|
| ||||
Net sales |
| $ | 257,140 |
| $ | 222,777 |
| $ | 46,030 |
| $ | (11,667 | ) |
Operating income (loss) |
| 12,260 |
| 19,070 |
| (714 | ) | (6,096 | ) | ||||
Total assets |
| 222,194 |
| 167,878 |
| 44,437 |
| 9,879 |
| ||||
Goodwill, net |
| 24,697 |
| 16,289 |
| 8,408 |
| — |
| ||||
Depreciation |
| 15,000 |
| 13,873 |
| 361 |
| 766 |
| ||||
Amortization |
| 5,681 |
| 299 |
| 5,382 |
| — |
| ||||
Capital expenditures and prepublication costs |
| 32,588 |
| 27,360 |
| 4,331 |
| 897 |
| ||||
Interest expense, net |
| 611 |
| — |
| — |
| 611 |
| ||||
Export sales as a percentage of consolidated sales were approximately 21% in 2012, 20% in 2011 and 19% in 2010. Approximately 92% of export sales were in the book manufacturing segment in fiscal year 2012, and 90% in both fiscal years 2011 and 2010. Sales to the Company’s largest customer amounted to approximately 30% of consolidated sales in 2012 and 2011 and 25% in 2010. In addition, sales to another customer amounted to approximately 25% of consolidated sales in fiscal 2012, 23% in 2011 and 22% in 2010. These two customers are in the book manufacturing segment and no other customer accounted for more than 10% of consolidated sales. Customers are granted credit on an unsecured basis. Receivables for the customers that account for more than 10% of consolidated sales, as a percentage of consolidated accounts receivable, were 43% and 37% at September 29, 2012 and September 24, 2011, respectively.
M. Business Acquisition
On January 15, 2010, the Company acquired the assets of Highcrest Media, a Massachusetts-based provider of solutions that streamline the production of customized textbooks and other materials for use in colleges, universities and businesses. The acquisition also complements the Company’s investment in digital printing technology. The $3 million cash acquisition, with additional potential “earn out” payments of up to $1.2 million, was accounted for as a purchase, and accordingly, Highcrest Media’s
financial results are included in the book manufacturing segment in the consolidated financial statements from the date of acquisition.
The acquisition of Highcrest Media was recorded by allocating the fair value of consideration of the acquisition to the identified assets acquired, including intangible assets and liabilities assumed, based on their estimated fair value at the acquisition date. The excess of the fair value of consideration of the acquisition over the net amounts assigned to the fair value of the assets acquired and liabilities assumed was recorded as goodwill. Intangible assets other than goodwill are being amortized over a 5-year period. Goodwill and other intangibles are tax deductible. The Company also assumed operating leases for some of Highcrest Media’s equipment. The purchase price allocation was as follows:
|
| (000’s omitted) |
| |
|
|
|
| |
Accounts receivable |
| $ | 379 |
|
Inventories |
| 41 |
| |
Machinery, equipment and other long-term assets |
| 272 |
| |
Amortizable intangibles |
| 1,930 |
| |
Goodwill |
| 1,517 |
| |
Accounts payable and accrued liabilities |
| (289 | ) | |
Fair value of contingent “earn out” consideration |
| (850 | ) | |
Net cash paid |
| $ | 3,000 |
|
The future earn out potential payments were valued at acquisition at $850,000 using a probability weighted discounted cash flow model and may be paid out over three years based on achieving certain revenue targets. A fair value assessment of the contingent earn out consideration payable was performed at year end resulting in recognition of $100,000 and $165,000 of expense in fiscal 2012 and 2011, respectively. The revenue target was achieved in both fiscal 2012 and 2011 resulting in a $400,000 payment in the second quarter of both fiscal 2012 and 2011, leaving a liability of $385,000 at September 29, 2012.
N. Retirement Plans
The Company and its consolidated subsidiaries maintain various defined contribution retirement plans covering substantially all of its employees. Dover, acquired in September 2000, also provides retirement benefits through a defined benefit plan as described below.
Retirement costs of multi-employer union plans consist of contributions determined in accordance with the respective collective bargaining agreements. Retirement benefits for non-union employees are provided through the Courier Profit Sharing and Savings Plan (“PSSP”), which includes an Employee Stock Ownership Plan (“ESOP”). Retirement costs included in the accompanying financial statements amounted to approximately $3,085,000 in 2012, $3,286,000 in 2011, and $3,224,000 in 2010. At both September 29, 2012 and September 24, 2011, the Company had $1.2 million accrued for the PSSP, which is included in the accompanying consolidated balance sheet under the caption “Other current liabilities.”
The PSSP is qualified under Section 401(k) of the Internal Revenue Code. The plan allows eligible employees to contribute up to 100% of their compensation, subject to IRS limitations, with the Company matching 100% of the first 2% of pay plus 25% of the next 4% of pay contributed by the employee. The Company also makes contributions to the plan annually based on profits each year for the benefit of all eligible non-union employees.
Shares of Company common stock may be allocated to participants’ ESOP accounts annually based on their compensation as defined in the plan. During the last three years, no such shares were allocated to eligible participants. At September 29, 2012, the ESOP held 311,370 shares on behalf of the participants.
Dover has a noncontributory, defined benefit pension plan covering substantially all of its employees. As of December 31, 2001, Dover employees became eligible to participate in the PSSP. As such, plan benefits under the Dover defined benefit plan (the “Dover plan”) were frozen as of that date.
In September 2006, the FASB issued authoritative literature regarding accounting for defined benefit pension and other postretirement plans, which requires that employers recognize the funded status of defined benefit pension and other postretirement benefit plans as a net asset or liability on the balance sheet and recognize as a component of other comprehensive income, net of tax, the gains or losses and prior service costs or credits that arise during the period but are not recognized as a component of net periodic benefit cost. Additional financial statement disclosures are also required. The Company adopted these recognition and disclosure provisions at the end of fiscal 2007, and accordingly, recognized an after-tax reduction of $0.5 million in accumulated other comprehensive income, a component of shareholders’ equity. In addition, companies are required to measure plan assets and benefit obligations as of their fiscal year end. The Company previously used this date as the measurement date so there was no impact on the consolidated financials as it relates to this portion of the adopted guidance.
The following tables provide information regarding the Dover plan:
Other changes in plan assets and obligations |
| (000’s omitted) |
| ||||
recognized in other comprehensive income (loss): |
| 2012 |
| 2011 |
| ||
Accumulated other comprehensive loss at beginning of year |
| $ | (854 | ) | $ | (698 | ) |
Net loss incurred in year, net of tax |
| (169 | ) | (214 | ) | ||
Amortization of actuarial net losses, net of tax |
| 74 |
| 58 |
| ||
Accumulated other comprehensive loss at end of year |
| $ | (949 | ) | $ | (854 | ) |
|
| (000’s omitted) |
| ||||
Change in projected benefit obligation: |
| 2012 |
| 2011 |
| ||
Benefit obligation at beginning of year |
| $ | 3,001 |
| $ | 2,927 |
|
Administrative cost |
| 7 |
| 7 |
| ||
Interest cost |
| 116 |
| 128 |
| ||
Actuarial loss |
| 264 |
| 305 |
| ||
Benefits paid |
| (205 | ) | (366 | ) | ||
Benefit obligation at end of year |
| $ | 3,183 |
| $ | 3,001 |
|
|
| (000’s omitted) |
| ||||
Change in plan assets: |
| 2012 |
| 2011 |
| ||
Fair value of plan assets at beginning of year |
| $ | 2,266 |
| $ | 2,393 |
|
Actual return on plan assets |
| 120 |
| 139 |
| ||
Employer contributions |
| 142 |
| 101 |
| ||
Benefits paid |
| (205 | ) | (367 | ) | ||
Fair value of plan assets at end of year |
| $ | 2,323 |
| $ | 2,266 |
|
|
|
|
|
|
| ||
Funded status at end of year |
| $ | (860 | ) | $ | (735 | ) |
Components of net periodic benefit cost: |
| 2012 |
| 2011 |
| 2010 |
| |||
Administrative cost |
| $ | 7 |
| $ | 7 |
| $ | 7 |
|
Interest cost |
| 116 |
| 128 |
| 144 |
| |||
Expected return on plan assets |
| (129 | ) | (138 | ) | (157 | ) | |||
Amortization of unrecognized net loss |
| 116 |
| 91 |
| 84 |
| |||
Net periodic benefit cost |
| $ | 110 |
| $ | 88 |
| $ | 78 |
|
Weighted-average assumptions used to determine:
Projected benefit obligation |
| 2012 |
| 2011 |
| 2010 |
|
Discount rate |
| 3.25 | % | 4.00 | % | 4.50 | % |
Rate of compensation increase |
| None |
| None |
| None |
|
Expected return on plan assets |
| 6.00 | % | 6.00 | % | 6.00 | % |
Net periodic benefit cost |
| 2012 |
| 2011 |
| 2010 |
|
Discount rate |
| 4.00 | % | 4.50 | % | 5.25 | % |
Rate of compensation increase |
| None |
| None |
| None |
|
Expected return on plan assets |
| 6.00 | % | 6.00 | % | 7.00 | % |
The discount rate and expected return on plan assets used for calculating costs and benefit obligations are determined by the Company’s management after considering actuary recommendations. The assumed discount rates are based on the yield on high quality corporate bonds as of the applicable measurement date. Accrued pension cost of $860,000 at September 29, 2012 and $735,000 at September 24, 2011 was included in the accompanying consolidated balance sheet under the caption “Other liabilities.”
The Company expects to make cash contributions of approximately $49,000 to its pension plan in 2013. The Company’s strategy is generally to achieve a long-term rate of return sufficient to satisfy plan liabilities while minimizing plan expenses and mitigating downside risks. Assets are currently allocated 100% to Guaranteed Insurance Contracts, however, the Company reviews this weighting from time to time in order to achieve overall objectives in light of current circumstances. The fair value of the insurance contracts was based on negotiated value and the underlying investments, and considers the credit worthiness of the issuer of such contracts. Insurance contracts held by the Dover plan are issued by a well-known, highly rated insurance company. The underlying investments are government, asset-backed and fixed income securities.
The Company contributes to two multi-employer pension plans under collective bargaining agreements covering certain employees at its book manufacturing facility in Philadelphia. The risk of participating in these multi-employer pension plans differs significantly from the risk associated with the Company’s other retirement plans described above. Multi-employer pension plans cover employees of and receive contributions from two or more unrelated employers pursuant to one or more collective bargaining agreements, and the assets contributed by each employer may be used to fund the benefits of all employees covered by the plan. The Company is required to make contributions to the multi-employer plans in accordance with two separate collective bargaining agreements covering the Company’s employees in each plan as well as the terms of such plan. Both collective bargaining agreements are scheduled to expire within the next five months and the Company has begun contract negotiations.
The following table provides key information relative to each of the multi-employer pension plans for the fiscal years ended September 29, 2012, September 24, 2011 and September 25, 2010:
Multi-employer Pension Plan |
| Company Contributions |
| Expiration |
| |||||||||
Name |
| EIN Number |
| 2012 |
| 2011 |
| 2010 |
| Agreement |
| |||
Bindery Industry Employers |
|
|
|
|
|
|
|
|
|
|
| |||
GCC/IBT Pension Plan |
| 23-6209755 |
| $ | 198 |
| $ | 193 |
| $ | 173 |
| 01/05/13 |
|
GCIU — Employer |
|
|
|
|
|
|
|
|
|
|
| |||
Retirement Benefit Plan |
| 91-6024903 |
| 131 |
| 143 |
| 144 |
| 04/30/13 |
| |||
The Company’s contributions for the Bindery Industry Employers GCC/IBT Pension Plan represented more than 5% of total contributions in each of the last three years, with fiscal 2012 being approximately 70% of total contributions. This plan currently includes only three other contributing employers. The Company contributed less than 5% of total contributions to the GCIU — Employer Retirement Benefit Plan in the past three years. Both multi-employer pension plans were subject to surcharges during fiscal 2012 due to the underfunding of the plans. The Company currently estimates that it would be required to contribute approximately $418,000 to these two plans in fiscal 2013, but
these contributions could significantly increase due to other employers’ withdrawals or changes in the funded status of the plans. Both plans are estimated to be underfunded as of September 29, 2012 and have a Pension Protection Act zone status of critical (“red”); such status identifies plans that are less than 65% funded. Rehabilitation plans have been adopted for each plan and are pending approval during the upcoming contract negotiations. While it is not currently possible to quantify the potential impact of future actions, further reductions in participation or withdrawals by other employers from these multi-employer pension plans could have a material adverse impact on the Company’s results of operations, cash flows and financial condition.
During fiscal 2011, the Company recorded a $2.1 million pre-tax charge related to the complete withdrawal from a multi-employer pension plan resulting from the closure of its Stoughton, Massachusetts manufacturing facility. This charge was included in restructuring costs in fiscal 2011 and is discussed further in Note I.
O. Other Income
The Company historically leased non-operating real property to cell phone companies for two cell-tower sites on a month-to-month basis. In the first quarter of fiscal 2012, the Company recorded a gain of $587,000 associated with the sales and assignments of both of these interests. The Company does not have further financial obligations under these arrangements.
* * * * *
COURIER CORPORATION
FIVE-YEAR FINANCIAL SUMMARY
(Dollars in millions except per share data)
|
| 2012 |
| 2011 |
| 2010 |
| 2009 |
| 2008 |
| |||||
|
|
|
|
|
|
|
|
|
|
|
| |||||
Operating Data |
|
|
|
|
|
|
|
|
|
|
| |||||
Net sales |
| $ | 261.3 |
| $ | 259.4 |
| $ | 257.1 |
| $ | 248.8 |
| $ | 280.3 |
|
Gross profit |
| 62.2 |
| 56.0 |
| 64.0 |
| 57.7 |
| 77.9 |
| |||||
Net income (loss) |
| 9.2 |
| 0.1 |
| 7.1 |
| (3.1 | ) | (0.4 | ) | |||||
Net income (loss) per diluted share |
| 0.77 |
| 0.01 |
| 0.60 |
| (0.27 | ) | (0.03 | ) | |||||
Dividends declared per share |
| 0.84 |
| 0.84 |
| 0.84 |
| 0.84 |
| 0.80 |
| |||||
|
|
|
|
|
|
|
|
|
|
|
| |||||
Balance Sheet and Cash Flow Data |
|
|
|
|
|
|
|
|
|
|
| |||||
Total assets |
| 197.4 |
| 213.0 |
| 222.2 |
| 208.4 |
| 240.5 |
| |||||
Long-term debt |
| 13.7 |
| 19.7 |
| 21.9 |
| 13.5 |
| 23.6 |
| |||||
Stockholders’ equity |
| 144.5 |
| 154.3 |
| 162.9 |
| 164.6 |
| 176.2 |
| |||||
Working capital |
| 44.9 |
| 50.3 |
| 50.6 |
| 52.4 |
| 56.8 |
| |||||
Current ratio |
| 2.4 |
| 2.6 |
| 2.6 |
| 2.9 |
| 2.7 |
| |||||
Capital expenditures and prepublication costs |
| 14.0 |
| 20.0 |
| 32.6 |
| 14.9 |
| 17.9 |
| |||||
Depreciation and amortization |
| 25.1 |
| 23.2 |
| 20.7 |
| 21.4 |
| 21.4 |
| |||||
|
|
|
|
|
|
|
|
|
|
|
| |||||
Additional items |
|
|
|
|
|
|
|
|
|
|
| |||||
Long-term debt as a percentage of capitalization |
| 8.7 | % | 11.3 | % | 11.8 | % | 7.6 | % | 11.8 | % | |||||
Stockholders’ equity per share |
| 12.61 |
| 12.61 |
| 13.51 |
| 13.77 |
| 14.84 |
| |||||
Shares outstanding (in 000’s) |
| 11,464 |
| 12,237 |
| 12,057 |
| 11,956 |
| 11,878 |
| |||||
Number of employees |
| 1,501 |
| 1,568 |
| 1,662 |
| 1,603 |
| 1,825 |
| |||||
Fiscal 2011, 2010, and 2009 results include non-cash pre-tax impairment charges of $8.6, $4.7 and $15.6 million, respectively (Note G).
Fiscal year 2012 was a 53-week period.
Net income (loss) per diluted share is based on weighted average shares outstanding; stockholders’ equity per share is based on shares outstanding at year end.
MANAGEMENT’S DISCUSSION AND ANALYSIS
FORWARD-LOOKING INFORMATION
Statements contained herein include forward-looking statements. Statements that describe future expectations, plans or strategies are considered “forward-looking statements” as that term is defined under the Private Securities Litigation Reform Act of 1995 and releases issued by the Securities and Exchange Commission. The words “believe,” “expect,” “anticipate,” “intend,” “estimate” and other expressions which are predictions of or indicate future events and trends and which do not relate to historical matters identify forward-looking statements. Such statements are subject to risks and uncertainties that could cause actual results to differ materially from those currently anticipated. Some of the factors that could affect actual results are discussed in Item 1A of this Form 10-K and include, among others, changes in customers’ demand for the Company’s products, including seasonal changes in customer orders and shifting orders to lower cost regions, changes in market growth rates, changes in raw material costs and availability, pricing actions by competitors and other competitive pressures in the markets in which the Company competes, consolidation among customers and competitors, insolvency of key customers or vendors, changes in the Company’s labor relations, changes in obligations of multiemployer pension plans, success in the execution of acquisitions and the performance and integration of acquired businesses including carrying value of intangible assets, restructuring and impairment charges required under generally accepted accounting principles, changes in operating expenses including medical and energy costs, changes in technology including migration from paper-based books to digital, difficulties in the start up of new equipment or information technology systems, changes in copyright laws, changes in consumer product safety regulations, changes in environmental regulations, changes in tax regulations, changes in the Company’s effective income tax rate and general changes in economic conditions, including currency fluctuations, changes in interest rates, changes in consumer confidence, changes in the housing market, and tightness in the credit markets. Although the Company believes that the assumptions underlying the forward-looking statements are reasonable, any of the assumptions could be inaccurate, and therefore, there can be no assurance that the forward-looking statements will prove to be accurate. The forward-looking statements included herein are made as of the date hereof, and the Company undertakes no obligation to update publicly such statements to reflect subsequent events or circumstances.
OVERVIEW
Courier Corporation, founded in 1824, is among America’s leading book manufacturers and a leader in content management and customization in new and traditional media. The Company also publishes books under three brands offering award-winning content and thousands of titles. The Company has two operating segments: book manufacturing and publishing. The book manufacturing segment streamlines the process of bringing books from the point of creation to the point of use. Based on sales, Courier is the third largest book manufacturer in the United States offering services from prepress and production through storage and distribution, as well as innovative content management, customization and state-of-the-art digital print capabilities. The publishing segment consists of Dover Publications, Inc. (“Dover”), Research & Education Association, Inc. (“REA”), and Federal Marketing Corporation d/b/a Creative Homeowner (“Creative Homeowner”). Dover publishes over 9,000 titles in more than 30 specialty categories including children’s books, literature, art, music, crafts, mathematics, science, religion and architecture. REA publishes test preparation and study-guide books and software for high school, college and graduate students, and professionals. Creative Homeowner publishes books on home design, decorating, landscaping and gardening, and also sells home plans.
OUTLOOK
In the past year, the Company achieved many goals despite another challenging year for the book industry in a sluggish economy. Despite the challenges posed by the Borders Group, Inc. (“Borders”) liquidation and the growth of e-books, the Company experienced achievements in both of its operating segments. In the book manufacturing segment, the Company increasingly benefitted from recent investments in four-color digital inkjet technology, innovative content management solutions, and distribution and fulfillment capabilities. In the publishing segment, all three of the Company’s brands experienced growth in sales through online retailers and added to their own digital offerings with over 3,000 titles available in e-book form on all the major platforms.
In the book manufacturing segment, the Company continued to benefit from its leadership and investment in four-color book manufacturing technology with an increase in four-color offset sales from both new and existing trade customers. In addition, revenues from the Company’s digital operations increased 48% during the year reflecting growth in demand for customized versions of college textbooks as well as shorter runs of trade books. By printing shorter runs, publishers are able to anticipate demand more accurately and avoid obsolescence and excess inventory issues. Publishers are increasingly utilizing digital printing in combination with offset to capture the full life-cycle potential of every title. In October 2012, the Company announced plans to add both a new HP digital cover press at its North Chelmsford, Massachusetts digital print facility and a new HP digital production line at its flagship four-color offset plant in Kendallville, Indiana.
The Company’s publishing segment experienced a decline in sales in 2012 as it continued to adjust through a difficult economy and the channel challenges of the post-Borders retail environment. Overall, sales growth at Dover was offset by declines in sales at REA and Creative Homeowner, although sales through online retailers grew for the segment. During the year, the Company’s publishers continued to expand the content that consumers can access directly online with products including Dover’s DoverPictura.com online image library, REA’s All Access program, and Creative Homeowner’s ultimateplans.com home plans business. In addition, investments in e-book conversions in 2012 have resulted in thousands of titles available to consumers across all four leading e-book platforms of Amazon, Apple, Barnes & Noble and Google.
Key challenges facing the Company and the book industry continue to include the sluggish economy, competitive pricing pressures, changes in retail channels and growth in electronic delivery of books. However, the Company is well positioned compared to its peers due to its relatively low level of debt and significant liquidity, which has allowed for investment in growth opportunities. In addition, the Company enjoys strong relationships with its major customers in key long-term markets. Coupled with its industry leading customer service and technology, the Company believes that it will be able to achieve further volume growth with its integrated solutions for customized textbook production, provide additional short-run opportunities among trade publishers, and continue the steady expansion of products and services on behalf of its largest religious customer. In the publishing segment, the Company hopes to benefit from sales growth from its investments in e-books and other digital content to complement its print offerings. Through its targeted capital expenditures, other investments and cost cutting measures, the Company is confident it will be able to weather the challenges ahead and take advantage of opportunities to further its long-term objectives.
RESULTS OF OPERATIONS
FINANCIAL HIGHLIGHTS
(Dollars in thousands except per share amounts)
|
|
|
|
|
|
|
| Percent Change |
| |||||
|
|
|
|
|
|
|
| 2012 |
| 2011 |
| |||
|
|
|
|
|
|
|
| vs. |
| vs. |
| |||
|
| 2012 |
| 2011 |
| 2010 |
| 2011 |
| 2010 |
| |||
|
|
|
|
|
|
|
|
|
|
|
| |||
Net sales |
| $ | 261,320 |
| $ | 259,375 |
| $ | 257,140 |
| 1 | % | 1 | % |
Gross profit |
| 62,207 |
| 56,034 |
| 64,011 |
| 11 | % | -12 | % | |||
As a percentage of sales |
| 23.8 | % | 21.6 | % | 24.9 | % |
|
|
|
| |||
Selling and administrative expenses |
| 47,137 |
| 47,447 |
| 47,017 |
| -1 | % | 1 | % | |||
Impairment charges |
| — |
| 8,608 |
| 4,734 |
|
|
|
|
| |||
Operating income (loss) |
| 15,070 |
| (21 | ) | 12,260 |
|
|
|
|
| |||
Interest expense, net |
| 895 |
| 921 |
| 611 |
| -3 | % | 51 | % | |||
Other income |
| (587 | ) | — |
| — |
|
|
|
|
| |||
Pretax income (loss) |
| 14,762 |
| (942 | ) | 11,649 |
|
|
|
|
| |||
Income tax provision (benefit) |
| 5,595 |
| (1,076 | ) | 4,535 |
|
|
|
|
| |||
Net income |
| $ | 9,167 |
| $ | 134 |
| $ | 7,114 |
|
|
|
|
|
|
|
|
|
|
|
|
|
|
|
|
| |||
Net income per diluted share |
| $ | 0.77 |
| $ | 0.01 |
| $ | 0.60 |
|
|
|
|
|
Fiscal 2012 was a 53-week period compared with 52-week periods in fiscal years 2011 and 2010.
Revenues in fiscal 2012 were $261 million, up slightly from $259 million in fiscal 2011. In the book manufacturing segment, revenues increased 1% to $233 million with growth in specialty trade and religious sales offset in part by a decline in education sales. Revenues in the publishing segment decreased 6% to $38 million compared with fiscal 2011 reflecting a challenging retail environment. Overall net income for fiscal 2012 was $9.2 million, or $.77 per diluted share, which included pre-tax restructuring costs of $3.3 million, or $.17 per diluted share, as well as a pre-tax gain of $0.6 million, or $.03 per diluted share, from the sale of certain non-operating assets.
For fiscal 2011, overall revenues grew 1% to $259 million compared to fiscal 2010. In the book manufacturing segment, sales increased 3% over fiscal 2010 to $230 million, with growth in religious and education revenues, particularly to the college textbook market. This growth was offset in part by a decline in trade sales. In February 2011, Borders Group, Inc. (“Borders”) filed for bankruptcy and completed the liquidation of its store inventories in September 2011, which temporarily saturated the trade book market and eliminated a major outlet for books. The bankruptcy and liquidation adversely impacted the publishing industry and in turn, both of the Company’s operating segments. In the publishing segment, revenues decreased 11% to $41 million compared to the prior year, including a decline in sales to Borders of $3.3 million. Overall net income for fiscal 2011 was $134,000, which included a pre-tax impairment charge at Research & Education Association, Inc. (“REA”), related to Borders, of $8.6 million, or $.42 per diluted share. In addition, the Company recorded pre-tax restructuring costs of $7.7 million, or $.42 per diluted share, associated with the closing of its smallest and least versatile one-color manufacturing facility located in Stoughton, Massachusetts.
Restructuring Costs
In fiscal 2012, approximately $3.3 million of pre-tax restructuring charges were recorded for cost reduction measures taken throughout the year in both of the Company’s operating segments, including a reduction in the Company’s one-color offset press capacity. Severance and post-retirement benefit expenses were $1.9 million and accelerated depreciation on an unutilized one-color press was $1.4 million. Approximately $1.7 million of these costs were included in cost of sales in the Company’s book manufacturing segment. Approximately $1.0 million and $0.6 million of these costs were included in selling and administrative expenses in the Company’s book manufacturing segment and publishing segment, respectively. At September 29, 2012, approximately $0.5 million of the remaining restructuring payments were included in “Other current liabilities” and approximately $0.2 million, which will be paid by December 2013, were included in “Other liabilities” in the accompanying consolidated balance sheet.
In fiscal 2011, the Company recorded restructuring costs of $7.7 million associated with closing and consolidating its Stoughton, Massachusetts manufacturing facility due to the impact of technology and competitive pressures affecting the one-color paperback books in which the plant specialized. Restructuring costs included $2.3 million for employee severance and benefit costs, $2.1 million for an early withdrawal liability from a multi-employer pension plan, and $3.3 million for lease termination and other facility closure costs; no sub-lease income was assumed at the time due to local real estate market conditions. Subsequently, a portion of the facility will be sublet effective March 2013; the benefit of the sublease was largely offset by additional building closure costs. Of the total $7.7 million of restructuring costs in the book manufacturing segment, $7.3 million was included in cost of sales and $0.4 million was included in selling and administrative expenses. Remaining payments of approximately $3.8 million will be made over periods ranging from 3 years for the building lease obligation to 19 years for the liability related to the multi-employer pension plan. At September 29, 2012, approximately $0.9 million of the restructuring payments were included in “Other current liabilities” and $3.1 million were included in “Other liabilities” in the accompanying consolidated balance sheet.
The following table depicts the accrual balances for these restructuring costs.
|
| (000’s omitted) |
| ||||||||||
|
| Accrual at |
| Charges |
| Costs |
| Accrual at |
| ||||
|
| September 24, |
| or |
| Paid or |
| September 29, |
| ||||
|
| 2011 |
| Reversals |
| Settled |
| 2012 |
| ||||
Employee severance, post-retirement and other benefit costs |
| $ | 285 |
| $ | 1,814 |
| $ | (1,229 | ) | $ | 870 |
|
Early withdrawal from multi-employer pension plan |
| 2,119 |
| — |
| (47 | ) | 2,072 |
| ||||
Accelerated depreciation of equipment |
|
|
| 1,433 |
| (1,433 | ) | — |
| ||||
Lease termination, facility closure and other costs |
| 2,345 |
| 78 |
| (758 | ) | 1,665 |
| ||||
Total |
| $ | 4,749 |
| $ | 3,325 |
| $ | (3,467 | ) | $ | 4,607 |
|
Impairment Charges
The Company evaluates possible impairment at the reporting unit level, which is the operating segment or one level below the operating segment, on an annual basis at the end of its fiscal year or whenever events or changes in circumstances indicate that the carrying value of the assets may not be recoverable. In the third quarter of fiscal 2011, the Company recorded a non-cash, pre-tax impairment charge of $8.4 million, representing all of REA’s goodwill. In addition, an impairment charge of approximately $200,000 for prepublication costs was recorded in the third quarter of fiscal 2011 relating to underperforming titles. Borders had been one of REA’s most significant customers and the Borders bankruptcy and liquidation had a direct impact on REA’s sales and operating results. On an after-tax basis, the total impairment charge was $5.0 million, or $.42 per diluted share.
In the fourth quarter of fiscal 2010, the Company concluded that the carrying value of Creative Homeowner’s goodwill and other intangible assets exceeded their estimated fair market value following a
decline in sales and operating results. As such, the Company recorded a $4.7 million non-cash, pre-tax impairment charge for Creative Homeowner’s goodwill, trade name, and customer list intangible assets as well as approximately $0.5 million related to prepublication costs. On an after-tax basis, the total impairment charge was $3.1 million, or $.26 per diluted share.
Business Acquisition
On January 15, 2010, the Company acquired the assets of Highcrest Media LLC (“Highcrest Media”), a Massachusetts-based provider of solutions that streamline the production of customized textbooks and other materials for use in colleges, universities and businesses. The acquisition also complemented the Company’s investment during fiscal 2010 in digital inkjet printing technology. The $3 million cash acquisition, with additional potential “earn out” payments of up to $1.2 million, of which $800,000 has been paid to date, was accounted for as a purchase, and accordingly, Highcrest Media’s financial results are included in the book manufacturing segment in the consolidated financial statements from the date of acquisition. Also, during fiscal 2010, the Company built a state-of-the-art digital printing operation at its North Chelmsford, Massachusetts facility. The Company purchased one of the first HP digital inkjet web presses and finishing systems designed specifically for book manufacturing and purchased two additional digital inkjet presses and finishing systems in fiscal 2011. These digital print capabilities, combined with Highcrest Media, comprise Courier Digital Solutions, providing a complete complement of services to the Company’s book manufacturing customers.
Book Manufacturing Segment
SEGMENT HIGHLIGHTS
(Dollars in thousands)
|
|
|
|
|
|
|
| Percent Change |
| |||||
|
|
|
|
|
|
|
| 2012 |
| 2011 |
| |||
|
|
|
|
|
|
|
| vs. |
| vs. |
| |||
|
| 2012 |
| 2011 |
| 2010 |
| 2011 |
| 2010 |
| |||
|
|
|
|
|
|
|
|
|
|
|
| |||
Net sales |
| $ | 233,040 |
| $ | 230,229 |
| $ | 222,777 |
| 1 | % | 3 | % |
Gross profit |
| 49,961 |
| 42,586 |
| 46,757 |
| 17 | % | -9 | % | |||
As a percentage of sales |
| 21.4 | % | 18.5 | % | 21.0 | % |
|
|
|
| |||
Selling and administrative expenses |
| 29,248 |
| 27,764 |
| 27,687 |
| 5 | % | — |
| |||
Operating income |
| $ | 20,713 |
| $ | 14,822 |
| $ | 19,070 |
| 40 | % | -22 | % |
Revenues
Within this segment, the Company focuses on three key publishing markets: education, religious and specialty trade. Sales to the education market in fiscal 2012 were $98 million, down 3% compared with fiscal 2011, due to continued weakness in elementary and high school sales and shorter run lengths for certain college textbooks. However, sales of customized versions of college textbooks grew during fiscal 2012 using the Company’s digital printing capabilities. Sales to the religious market were up 2% to $68 million compared to the prior year, with sales to the Company’s largest religious customer up 5% for the year. During the first quarter of last year, the Company entered into a multi-year agreement with this customer, a leading global missionary organization, which provides incentives for growth through 2020. Sales to the specialty trade market in fiscal 2012 increased 11% to $60 million compared to fiscal 2011, reflecting increased four-color offset sales to new and existing customers. In addition, the Company experienced sales growth in digital printing for the specialty trade market as publishers increasingly used a combination of digital and offset printing to maximize the life cycle of certain titles.
In fiscal 2011, sales to the education market rose 9% to $100 million compared to fiscal 2010, primarily from sales of four-color college textbooks, including growth from the Company’s new digital print facility and from the acquisition of Highcrest Media. Sales of elementary and high school books declined compared to the prior year reflecting continued budget pressures on school systems nationwide and fewer textbook adoption opportunities. Sales to the religious market were up 5% in fiscal 2011 to $66 million compared to the previous year. Sales to the specialty trade market decreased 9% to $54 million in fiscal 2011 compared with fiscal 2010, as publishers adjusted their ordering in reaction to Borders’ bankruptcy and related store liquidation, as well as the growth of e-books.
In January 2011, the Company reached a multi-year book manufacturing arrangement with Pearson Education, the world’s largest educational publisher, which anticipates sales growth with this customer. To support this growth, in fiscal 2011, the Company installed two additional HP digital inkjet presses at its North Chelmsford, Massachusetts facility to provide needed capacity for four-color custom textbooks. In addition, in December 2010, installation was completed on the Company’s fourth high-speed four-color manroland offset press at its Kendallville, Indiana facility. Each of these presses experienced smooth startups.
In October 2012, the Company announced plans to install a fourth HP digital production line, with greater capacity and flexibility, at its Kendallville facility. The new press is expected to serve a larger customer base across a full range of run lengths as many publishers are moving to utilize both offset and inkjet print technology to maximize the lifespan of their titles and capture short-term opportunities, while reducing inventory and obsolescence costs. In addition, the Company also announced that it was installing an HP Indigo 10000 cover press in North Chelmsford and would install one in Kendallville to complement the new press.
Cost of Sales /Gross Profit
Cost of sales in the book manufacturing segment decreased by $4.6 million, or 2%, compared with fiscal 2011. Restructuring costs included in cost of sales were $1.7 million in fiscal 2012, reflecting a further reduction in the Company’s one-color offset capacity, including $1.4 million of accelerated depreciation on an unutilized one-color press. In fiscal 2011, cost of sales included $7.3 million of restructuring costs associated with closing and consolidating the Stoughton facility. Cost of sales in fiscal 2012 also included a reduction in recycling income compared with the prior year. Gross profit increased by 17% to $50 million in fiscal 2012 compared to fiscal 2011 reflecting the impact of restructuring costs. The improvement in gross profit also reflects a favorable sales mix, gains in operating efficiency due to recent technology investments and the consolidation of one-color printing, despite continued industry-wide pricing pressures and the reduction in recycling income for our waste byproducts, including paper.
In fiscal 2011, cost of sales in the book manufacturing segment increased by $11.6 million, or 7%, compared to fiscal 2010, including $7.3 million of restructuring costs associated with closing and consolidating the Stoughton facility. Also, depreciation expense increased by almost $4 million in fiscal 2011 related to the addition of four-color offset and digital press capacity. Gross profit decreased by 9% to $43 million compared with fiscal 2010, reflecting the impact of the $7.3 million of restructuring costs in fiscal 2011 and continued competitive pricing pressures. The decline in gross profit was offset in part by gains from a favorable shift in sales mix, increased revenue from recycling programs, and operating efficiencies resulting from recent technology investments. In addition, the Company realized cost savings subsequent to the March 2011 closing of the Stoughton manufacturing facility.
Selling and Administrative Expenses
Selling and administrative expenses in the book manufacturing segment in fiscal 2012 increased 5% to $29 million compared with fiscal 2011. Severance-related restructuring costs of $1.0 million and $0.4 million were included in fiscal 2012 and 2011, respectively. Cost savings from staff reductions were offset in part by an increase in selling and administrative expenses related to the growth of the digital printing operation and an increase in variable compensation in fiscal 2012.
In fiscal 2011, selling and administrative expenses in the book manufacturing segment were $28 million, comparable to fiscal 2010. Such expenses for fiscal 2011 included $0.4 million of restructuring costs related to closing the Stoughton facility which were offset by a decrease in variable compensation.
Operating Income
Operating income in the Company’s book manufacturing segment in fiscal 2012 grew by $5.9 million to $20.7 million compared with fiscal 2011. This improvement includes the impact of restructuring costs in fiscal 2012 of $2.7 million compared with $7.7 million in the prior year. In addition, the increase in operating income reflects a favorable sales mix, investments in technology and increased operating efficiencies and the consolidation of one-color capacity.
In fiscal 2011, operating income in this segment decreased by $4 million to $15 million compared with fiscal 2010, including the impact of $7.7 million of restructuring costs. Offsetting improvements in
operating income reflect sales growth in fiscal 2011, investments in technology, closing a manufacturing facility with excess capacity and increased operating efficiencies.
Publishing Segment
SEGMENT HIGHLIGHTS
(Dollars in thousands)
|
|
|
|
|
|
|
| Percent Change |
| |||||
|
|
|
|
|
|
|
| 2012 |
| 2011 |
| |||
|
|
|
|
|
|
|
| vs. |
| vs. |
| |||
|
| 2012 |
| 2011 |
| 2010 |
| 2011 |
| 2010 |
| |||
|
|
|
|
|
|
|
|
|
|
|
| |||
Net sales |
| $ | 38,355 |
| $ | 40,829 |
| $ | 46,030 |
| -6 | % | -11 | % |
Gross profit |
| 12,096 |
| 13,423 |
| 17,332 |
| -10 | % | -23 | % | |||
As a percentage of sales |
| 31.5 | % | 32.9 | % | 37.7 | % |
|
|
|
| |||
Selling and administrative expenses |
| 16,460 |
| 18,244 |
| 18,046 |
| -10 | % | 1 | % | |||
Operating loss |
| $ | (4,364 | ) | $ | (4,821 | ) | $ | (714 | ) |
|
|
|
|
Revenues
The Company’s publishing segment is comprised of Dover, Creative Homeowner and REA. Revenues were down $2.5 million to $38 million compared with fiscal 2011, reflecting a challenging retail environment. Approximately $0.8 million of the decline in sales in this segment was attributable to the loss of Borders as a customer, whose bankruptcy and liquidation in 2011 eliminated an important retail channel and also temporarily flooded the book market with low-priced inventory. Sales at REA decreased 10% to $5 million compared to the prior year when Borders had been one of REA’s largest customers. At Dover, sales grew 1% to $29 million, primarily due to sales through online retailers. For Creative Homeowner, sales were down 35% to $4 million compared to fiscal 2011 as demand for books on home improvement continued to be depressed amid the weak housing market as well as the availability of information online. In March 2012, Home Depot announced it would be discontinuing the sale of books in its home centers; in fiscal 2011, Home Depot stores accounted for less than 10% of Creative Homeowner’s sales. During fiscal 2012, the Company continued to expand the platforms offering its e-books with the March signing of an agreement with Amazon and a July agreement with Barnes & Noble, in addition to existing arrangements with Apple and Google. E-book revenues in fiscal 2012 were relatively modest, as the length of the conversion process resulted in fewer than expected e-book titles being available for much of the year.
In fiscal 2011, revenues decreased $5 million to $41 million compared to fiscal 2010, largely due to a $3.3 million decline in sales to Borders. The Borders liquidation had the largest impact on REA, where sales decreased 27% to $5 million compared to last year. Sales at Creative Homeowner were down 13% to $7 million for the year versus fiscal 2010 due to continued softness in the housing market as well as a decline in sales to Borders. At Dover, sales were down 7% to $29 million for fiscal 2011 compared with the prior year. The reduction in Dover’s sales also reflects the impact of the decline in sales to Borders, which more than offset growth in both international sales and sales to online retailers. Dover achieved double-digit growth during fiscal 2011 in sales to online retailers and mass merchandising chains.
Cost of Sales/Gross Profit
Cost of sales in the publishing segment decreased 4% to $26 million in fiscal 2012 compared to fiscal 2011, reflecting lower sales and an improved cost structure in the segment. Gross profit in this segment decreased 10% to $12 million in fiscal 2012 and, as a percentage of sales, decreased to 31.5% from 33% in the prior year. These declines in gross profit resulted from the lower sales volume as well as changes in product and sales mix.
In fiscal 2011, cost of sales in this segment decreased 5% to $27 million compared to fiscal 2010, reflecting lower sales, offset in part by an increase in the segment’s obsolescence reserve resulting from the impact of the Borders’ store liquidation. Gross profit in this segment decreased 23% to $13 million in fiscal 2011 and, as a percentage of sales, decreased to 33% from 38% last year. This decline in gross profit resulted from the lower sales volume and an increase in the allowance for inventory obsolescence as well as changes in product and sales mix.
Selling and Administrative Expenses
Selling and administrative expenses in the publishing segment decreased $1.8 million to $16.5 million in fiscal 2012 compared to fiscal 2011. These expenses in fiscal 2012 included $0.6 million of restructuring charges for severance and post-retirement benefit costs, while last year included a bad-debt provision of $0.7 million for Borders. The cost reduction measures taken in fiscal 2012 are expected to reduce selling and administrative expenses in this segment by approximately $1.5 million on an annual basis.
In fiscal 2011, selling and administrative expenses in this segment increased approximately $200,000 in fiscal 2011 to $18 million compared with fiscal 2010, including $700,000 for the write-off of Borders’ receivables. Selling and administrative expenses in fiscal 2011 also included $125,000 attributable to the bankruptcy of Creative Homeowner’s Canadian distributor.
Operating Loss
The operating loss for the publishing segment in fiscal 2012 was $4.4 million, compared to $4.8 million in fiscal 2011, reflecting the benefit of recent cost reduction measures.
In fiscal 2011, the operating loss for this segment was $4.8 million compared to $0.7 million in fiscal 2010, reflecting the impact of the Borders’ bankruptcy on sales, as well as the related $700,000 write-down of receivables and the indirect effect of the $550,000 increased allowance for inventory obsolescence.
Total Consolidated Company
Interest expense, net of interest income, decreased to $895,000 in fiscal 2012 from $921,000 in the prior year primarily due to lower average borrowings. Interest expense, net of interest income, increased to $921,000 in fiscal 2011 compared to $611,000 in fiscal 2010 primarily due to higher average borrowings and interest rates. In addition to its $100 million revolving credit facility, the Company entered into a four-year term loan in March 2010 to finance assets of the new digital print operation. The following table summarizes the Company’s average borrowings and average annual interest rate under its revolving credit and the term loan arrangements for the past three fiscal years.
|
| (Dollars in millions) |
| |||||||
|
| 2012 |
| 2011 |
| 2010 |
| |||
|
|
|
|
|
|
|
| |||
Average borrowings |
| $ | 20.8 |
| $ | 27.4 |
| $ | 16.5 |
|
Average annual interest rate |
| 1.7 | % | 1.3 | % | 0.9 | % | |||
In addition, approximately $165,000 of interest expense was amortized in fiscal 2012 associated with the restructuring costs incurred in fiscal 2011, compared with approximately $30,000 last year. Interest expense also includes commitment fees and other costs associated with maintaining the Company’s revolving credit facility. Interest capitalized in fiscal years 2011 and 2010 was $30,000 and $55,000, respectively, primarily related to the digital print operation. No interest was capitalized in fiscal 2012.
In the first quarter of fiscal 2012, the Company recorded other income of $587,000 from the sale of its interests in non-operating real property relating to cell towers.
The Company’s effective income tax rate in fiscal 2012 was 37.9%. In fiscal 2011, the Company recorded a tax benefit which was primarily attributable to the impairment and restructuring charges. Excluding the impact of such charges, the effective tax rate was 33.6% in fiscal 2011. The increase in the effective tax in fiscal 2012 was primarily due to a higher effective state tax rate, including valuation allowances recorded on certain deferred state tax assets. In fiscal 2011, excluding the impact of impairment and restructuring charges, the effective tax rate was 33.6% compared to 37.8% in fiscal 2010, reflecting an increased benefit from the manufacturer’s deduction, a lower overall effective state tax rate and benefits associated with research and investment credits.
For purposes of computing net income per diluted share, weighted average shares outstanding decreased by approximately 94,000 for fiscal year 2012 reflecting the Company’s repurchase of approximately 824,000 shares in the second half of the year, offset in part by shares issued under the Company’s stock
plans. Weighted average shares outstanding for fiscal year 2011 increased by approximately 87,000 from fiscal 2010, primarily due to shares issued under the Company’s stock plans.
LIQUIDITY AND CAPITAL RESOURCES
Operating activities in fiscal 2012 provided $39.0 million of cash, compared to $32.3 million in fiscal 2011. Net income was $9.2 million and stock-based compensation was $1.4 million. Depreciation was $20.4 million, amortization of prepublication costs was $4.3 million and amortization of other intangibles was $0.4 million for the year. Changes in assets and liabilities provided $3.4 million of cash in fiscal 2012, largely due to a reduction in inventory.
Investment activities in fiscal 2012 used $13.0 million of cash. Capital expenditures were $9.9 million, including deposits of $2 million for a new HP digital cover press at the Company’s North Chelmsford, Massachusetts facility and for a complete new digital production line at its Kendallville, Indiana facility. Capital expenditures for fiscal 2013 are expected to be between $17 and $19 million, with approximately $13 million related to expanding digital capabilities. Prepublication costs in the specialty publishing segment in fiscal 2012 were $4.1 million compared to $4.3 million in the prior year. These costs are expected to be approximately $4 million in fiscal 2013.
On April 19, 2012, the Company announced the approval by its Board of Directors for the repurchase of up to $10 million of the Company’s outstanding common stock from time to time on the open market or in privately negotiated transactions, including pursuant to a Rule 10b5-1 nondiscretionary trading plan. The program was completed during fiscal 2012, with approximately 824,000 shares of common stock repurchased for approximately $10 million. On November 20, 2012, the Company announced the approval by its Board of Directors for the repurchase of up to $10 million of the Company’s outstanding common stock from time to time on the open market or in privately negotiated transactions, including pursuant to a Rule 10b5-1 nondiscretionary trading plan. This share repurchase authorization is effective for a period of twelve months.
Financing activities in fiscal 2012 used $26.0 million of cash. Cash dividends of $10.1 million were paid, $10.0 million of common stock was repurchased by the Company, and borrowings decreased by $6.0 million for the year. At September 29, 2012, borrowings under a term loan used to finance the purchase of the Company’s new digital print assets were $3.0 million, with $1.2 million at a fixed annual interest rate of 3.9% and $1.8 million at a fixed annual interest rate of 3.6%. The Company also has a $100 million long-term revolving credit facility in place under which the Company can borrow at a rate not to exceed LIBOR plus 2.25%. On March 22, 2012, the Company amended this credit facility and extended the maturity date by three years to March 31, 2016. The Company also added TD Bank, N.A. to the bank group, replacing Wells Fargo, N.A. At September 29, 2012, the Company had $12.6 million in borrowings under this facility at an interest rate of 1.5%. The revolving credit facility contains restrictive covenants including provisions relating to the incurrence of additional indebtedness and a quarterly test of EBITDA to debt service. The Company was in compliance with all such covenants at September 29, 2012. The facility also provides for a commitment fee not to exceed 3/8% per annum on the unused portion. The revolving credit facility is used by the Company for both its long-term and short-term financing needs. The Company believes that its cash on hand, cash from operations and the available credit facility will be sufficient to meet its cash requirements through fiscal 2013.
The following table summarizes the Company’s contractual obligations and commitments at September 29, 2012 to make future payments as well as its existing commercial commitments. The amounts in the table do not include interest expense. Purchase obligations represent commitments for capital expenditures.
|
|
|
| (000’s omitted) |
| |||||||||||
|
|
|
| Payments due by period |
| |||||||||||
Contractual |
|
|
| Less than |
| 1 to 3 |
| 3 to 5 |
| More than |
| |||||
Payments: |
| Total |
| 1 Year |
| Years |
| Years |
| 5 Years |
| |||||
Long-Term Debt |
| $ | 15,568 |
| 1,872 |
| $ | 1,125 |
| $ | 12,571 |
| $ | — |
| |
Operating Leases |
| 6,750 |
| 1,181 |
| 1,826 |
| 1,515 |
| 2,228 |
| |||||
Purchase Obligations |
| 5,875 |
| 5,875 |
| — |
| — |
| — |
| |||||
Other Long-Term Liabilities |
| 7,825 |
| 1,539 |
| 2,496 |
| 685 |
| 3,105 |
| |||||
Total |
| $ | 36,018 |
| $ | 10,467 |
| $ | 5,447 |
| $ | 14,771 |
| $ | 5,333 |
|
Long-term debt includes $12.6 million under the Company’s long-term revolving credit facility, which has a maturity date of March 2016. Other long-term liabilities include approximately $3.1 million of restructuring costs related to closing the Stoughton, Massachusetts facility, in addition to a current liability of $0.9 million. Operating leases exclude the Stoughton building lease obligation which is included above in other long-term liabilities.
NEW ACCOUNTING PRONOUNCEMENTS
In May 2011, the Financial Accounting Standards Board (“FASB”) issued amendments to disclosure requirements for common fair value measurement. These amendments, effective for interim and annual periods beginning on or after December 15, 2011, result in common definitions of fair value and common requirements for measurement of and disclosure requirements between accounting principles generally accepted in the United States and International Financial Reporting Standards. Consequently, the amendments change some fair value measurement principles and disclosure requirements. The implementation of this amended accounting guidance is not expected to have a material impact on the Company’s consolidated financial statements.
In September 2011, the FASB issued new guidance on testing goodwill for impairment. This new guidance gives entities, subject to certain conditions, the option of first performing a qualitative assessment to determine whether the existence of events or circumstances leads to a determination that it is more likely than not that the fair value of the reporting unit is less than its carrying amount. The guidance is effective prospectively for annual and interim goodwill impairment tests performed for fiscal years beginning after December 15, 2011, with early adoption permitted. The implementation of this amended accounting guidance is not expected to have a material impact on the Company’s consolidated financial statements.
In June 2011, the FASB issued amendments to disclosure requirements for the presentation of comprehensive income. This guidance, effective for the interim and annual periods beginning on or after December 15, 2011, requires the presentation of total comprehensive income, the components of net income, and the components of other comprehensive income either in a single continuous statement of comprehensive income or in two separate but consecutive statements. The implementation of this amended accounting guidance, adopted by the Company in fiscal 2012, did not have a material impact on the Company’s consolidated financial statements.
RISKS
Our businesses operate in markets that are highly competitive. In book manufacturing, the Company faces competition on the basis of price, product quality, speed of delivery, customer service, availability of appropriate printing capacity and paper, related services and technology support. In the publishing
segment, competitive factors include quality of content, product offerings, technology and marketing. Some of our competitors have greater sales, assets and financial resources than our Company and others, particularly those in foreign countries, may derive significant advantages from local governmental regulation, including tax holidays and other subsidies. These competitive pressures could affect prices or customers’ demand for our products, impacting both revenue and profit margins and/or resulting in a loss of customers and market share. The Company derived approximately 55% and 54% of its fiscal 2012 and 2011 revenues, respectively, from two major customers. A significant reduction in order volumes or price levels from either of these customers could have a material adverse effect on the Company.
CRITICAL ACCOUNTING POLICIES AND ESTIMATES
The Company’s consolidated financial statements have been prepared in accordance with accounting principles generally accepted in the United States of America. The preparation of these financial statements requires management to make estimates and assumptions that affect the amounts reported in these financial statements and accompanying notes. On an ongoing basis, management evaluates its estimates and judgments, including those related to collectibility of accounts receivable, recovery of inventories, impairment of goodwill and other intangibles, and prepublication costs. Management bases its estimates and judgments on historical experience and various other factors believed to be reasonable under the circumstances, the results of which form the basis for making judgments about the carrying value of assets and liabilities at the date of the financial statements and the reported amounts of revenues and expenses during the periods presented. Actual results may differ from these estimates. The significant accounting policies which management believes are most critical to aid in fully understanding and evaluating the Company’s reported financial results include the following:
Accounts Receivable. Management performs ongoing credit evaluations of the Company’s customers and adjusts credit limits based upon payment history and the customer’s current credit worthiness. Collections and payments from customers are continuously monitored. A provision for estimated credit losses is determined based upon historical experience and any specific customer collection risks that have been identified. If the financial condition of the Company’s customers were to deteriorate, resulting in an impairment of their ability to make payments, additional allowances may be required.
Inventories. Management records reductions in the cost basis of inventory for excess and obsolete inventory based primarily upon historical and forecasted product demand. If actual market conditions are less favorable than those projected by management, additional inventory charges may be required.
Goodwill and Other Intangibles. Other intangibles include customer lists and technology, which are amortized on a straight-line basis over periods ranging from five to ten years and an indefinite-lived trade name. The Company evaluates possible impairment of goodwill and other intangibles at the reporting unit level, which is the operating segment or one level below the operating segment, on an annual basis or whenever events or changes in circumstances indicate that the carrying value of the assets may not be recoverable. The Company completed its annual impairment test at September 29, 2012, which resulted in no change to the nature or carrying amounts of its intangible assets in the book manufacturing segment. In fiscal 2011, the Company had recorded a pre-tax impairment charge of $8.6 million, which represented 100% of REA’s goodwill as well as approximately $200,000 of prepublication costs related to underperforming titles. No goodwill or other intangible assets remain in the publishing segment. Changes in market conditions or poor operating results could result in a decline in the fair value of the Company’s goodwill and other intangible assets thereby potentially requiring an additional impairment charge in the future.
Prepublication Costs. The Company capitalizes prepublication costs, which include the costs of acquiring rights to publish a work and costs associated with bringing a manuscript to publication such as artwork and editorial efforts. Prepublication costs are amortized on a straight-line basis over periods ranging from three to four years. In fiscal 2011, an impairment charge of approximately $200,000 was recorded for REA’s underperforming titles. Management regularly evaluates the sales and profitability of the products based upon historical and forecasted demand. If actual market conditions are less favorable than those projected by management, additional amortization expense may be required.
COURIER CORPORATION
SELECTED QUARTERLY FINANCIAL DATA (UNAUDITED)
(Dollars in thousands except per share data)
Fiscal 2012 |
| First |
| Second |
| Third |
| Fourth |
| ||||
|
|
|
|
|
|
|
|
|
| ||||
Operating Results: |
|
|
|
|
|
|
|
|
| ||||
Net sales |
| $ | 62,936 |
| $ | 62,388 |
| $ | 58,896 |
| $ | 77,100 |
|
Gross profit |
| 15,598 |
| 12,198 |
| 13,032 |
| 21,379 |
| ||||
Net income |
| 1,454 |
| 440 |
| 1,564 |
| 5,709 |
| ||||
Net income per diluted share |
| 0.12 |
| 0.04 |
| 0.13 |
| 0.50 |
| ||||
Dividends declared per share |
| 0.21 |
| 0.21 |
| 0.21 |
| 0.21 |
| ||||
Stock price per share: |
|
|
|
|
|
|
|
|
| ||||
Highest |
| 12.09 |
| 13.05 |
| 12.95 |
| 14.66 |
| ||||
Lowest |
| 5.86 |
| 10.61 |
| 9.53 |
| 10.59 |
| ||||
|
|
|
|
|
|
|
|
|
| ||||
Fiscal 2011 |
| First |
| Second |
| Third |
| Fourth |
| ||||
|
|
|
|
|
|
|
|
|
| ||||
Operating Results: |
|
|
|
|
|
|
|
|
| ||||
Net sales |
| $ | 61,152 |
| $ | 62,662 |
| $ | 61,894 |
| $ | 73,667 |
|
Gross profit |
| 15,305 |
| 5,174 |
| 14,720 |
| 20,835 |
| ||||
Impairment charge |
| — |
| — |
| (8,608 | ) | — |
| ||||
Net income (loss) |
| 1,656 |
| (4,807 | ) | (3,129 | ) | 6,414 |
| ||||
Net income (loss) per diluted share |
| 0.14 |
| (0.40 | ) | (0.26 | ) | 0.53 |
| ||||
Dividends declared per share |
| 0.21 |
| 0.21 |
| 0.21 |
| 0.21 |
| ||||
Stock price per share: |
|
|
|
|
|
|
|
|
| ||||
Highest |
| 15.96 |
| 15.97 |
| 14.02 |
| 11.61 |
| ||||
Lowest |
| 13.74 |
| 12.49 |
| 10.56 |
| 6.61 |
| ||||
Diluted share amounts are based on weighted average shares outstanding.
Common shares of the Company are traded over-the-counter on the Nasdaq Global Select Market — symbol “CRRC.”
There were 1,004 stockholders of record as of September 29, 2012.
COURIER CORPORATION
CONSOLIDATED VALUATION AND QUALIFYING ACCOUNTS
|
|
|
| ADDITIONS |
|
|
|
|
| ||||
|
| BALANCE AT |
| CHARGED TO |
|
|
| BALANCE |
| ||||
|
| BEGINNING |
| REVENUES AND |
|
|
| AT END |
| ||||
|
| OF PERIOD |
| EXPENSES |
| DEDUCTIONS |
| OF PERIOD |
| ||||
|
|
|
|
|
|
|
|
|
| ||||
Allowance for uncollectible accounts: |
|
|
|
|
|
|
|
|
| ||||
|
|
|
|
|
|
|
|
|
| ||||
Fiscal year ended September 29, 2012 |
| $ | 789,000 |
| $ | 199,000 |
| $ | 44,000 |
| $ | 944,000 |
|
|
|
|
|
|
|
|
|
|
| ||||
Fiscal year ended September 24, 2011 |
| 968,000 |
| 868,000 |
| 1,047,000 |
| 789,000 |
| ||||
|
|
|
|
|
|
|
|
|
| ||||
Fiscal year ended September 25, 2010 |
| 1,600,000 |
| (32,000 | ) | 600,000 |
| 968,000 |
| ||||
|
|
|
|
|
|
|
|
|
| ||||
Returns allowance: |
|
|
|
|
|
|
|
|
| ||||
|
|
|
|
|
|
|
|
|
| ||||
Fiscal year ended September 29, 2012 |
| $ | 2,377,000 |
| $ | 3,332,000 |
| $ | 3,213,000 |
| $ | 2,496,000 |
|
|
|
|
|
|
|
|
|
|
| ||||
Fiscal year ended September 24, 2011 |
| 2,108,000 |
| 3,823,000 |
| 3,554,000 |
| 2,377,000 |
| ||||
|
|
|
|
|
|
|
|
|
| ||||
Fiscal year ended September 25, 2010 |
| 1,945,000 |
| 3,691,000 |
| 3,528,000 |
| 2,108,000 |
| ||||