 the STRENGTH of WORKING TOGETHER SM Second Quarter 2008 Earnings Conference Call Monday, August 4, 2008 Exhibit 99.2 |
 2 Second Quarter Earnings Review August 4, 2008 • Founded in 1941, Crawford is the largest independent global provider of claims management solutions and a fully integrated global provider of these solutions for the growing multi-national market. • Crawford is divided into four reporting segments that support the strategic positioning of the Company in a changing market place: – U.S. Property & Casualty • Serves the U.S. insurance company market – International Operations • Serves the global insurance industry and multinational corporations – Broadspire • Serves large national accounts, carriers and self-insured entities – Legal Settlement Administration • Provides administration for class action settlements and bankruptcy matters • The Company’s independence, global presence and diversified business lines are key competitive advantages which set Crawford apart from its competitors. |
 3 Forward-looking Statements and Segment Operating Earnings Forward Looking Statements: Some of the matters discussed and included in this presentation include forward-looking statements that involve risks and uncertainties. The Company’s actual results achieved in any future periods may differ materially from results that might be implied by such forward-looking statements. The Company undertakes no obligation to publicly release any revisions to any forward-looking statement made in this presentation to reflect events or circumstances occurring after the date of this presentation, or to reflect the occurrence of unanticipated events. For a complete discussion regarding factors which could affect the Company’s financial performance, please refer to the Company’s Form 10-K for the year ended December 31, 2007 filed with the Securities and Exchange Commission, particularly the information under the headings “Business”, “Risk Factors”, “Legal Proceedings”, and “Management’s Discussion and Analysis of Financial Condition and Results of Operations”. Segment Operating Earnings: Segment operating earnings represent earnings before net corporate interest expense, amortization of customer-relationship intangible assets, stock option expense, income tax expense, unallocated corporate and shared costs, and gains on asset sales. On January 1, 2008 the Company’s Strategic Warranty Services unit was moved from the Legal Settlement Administration segment to the U.S. Property & Casualty segment. Prior period results for both segments have been restated to reflect this transfer. Subsequent to March 31, 2007, the Company changed its method of allocating certain corporate overhead costs to each of its operating segments. Prior period results have been restated to reflect the current allocation method. |
 4 “The Strength of Working Together” “The Strength of Working Together” is unifying the Company around consistent goals: Adaptive leadership team responding to changing economic conditions Increasing emphasis on sources of additional revenue growth – Selling Crawford services into the existing client base through key account management Driving technology forward – Creating operational efficiencies – Global economies of scale Being a target-driven organization – Setting long term goals, 2009 to 2011 |
 5 Second Quarter 2008 Overview • Strong performance in a difficult operating environment Revenue growth of 9.4% supported by cost reduction initiatives Net income up 167% over 2007 quarter, adjusting for 2007 gain on sale of office building • Strong revenue growth internationally and in U.S. Property & Casualty offset declines in other businesses International growth of 27.9% U.S. Property & Casualty revenues up 7.2% • Improved earnings per share to $0.16 from $0.12 Improved operating margins SG&A costs increased 5% but declined 90 bps as a percent of revenue • Improvement in cash and balance sheet metrics Cash flow from operations increased 200 210 220 230 240 250 260 270 2Q 2008 2Q 2007 Revenue $ in millions 5 5.5 6 6.5 7 7.5 8 2Q 2008 2Q 2007 Net Income $ in millions $263.3 $240.5 $7.9 $6.1 |
 6 Second Quarter 2008 Highlights • U.S. Property & Casualty Revenue growth of 7.2% Operating margin increased to 9.9% in 2008 from 2.5% in 2007 Catastrophe revenue up $2.2 million Technology-driven efficiencies realized Claims referred declined 3.4% 100 105 110 115 120 2Q 2008 2Q 2007 USP&C Claims Claims referred in 000s 113.7 117.7 145 147 149 151 153 155 157 159 2Q 2008 2Q 2007 International Claims Claims referred in 000s 155.4 151.3 • International Operations Strong global revenue growth of 27.9% Operating margin increased to 9.2% in 2008 from 5.2% in 2007 Claims referred increased 2.7% |
 7 Second Quarter 2008 Highlights • Legal Settlement Administration Revenue declined 6.8% Operating margin increased to 16.1% in 2008 from 14.4% in 2007 Growing backlog of $52.8 million 30 35 40 45 50 55 60 1Q 2008 1Q 2007 Backlog Backlog in millions $52.8 $41.1 55 57 59 61 63 65 67 69 71 2Q 2008 2Q 2007 Broadspire Claims Claims referred in 000s 62.9 71.0 • Broadspire Revenue decline of 4.9% Positive operating earnings of $2.5 million in the quarter RiskTech deployment on schedule 94% retention rate Claims referred declined 11.4% |
 8 2008 Outlook • Consolidated revenue before reimbursements between $1.02 billion and $1.03 billion • Consolidated operating earnings between $63.4 million and $68.1 million • After reflecting stock-based compensation expense, net corporate interest expense, amortization of customer-relationship intangible assets and income taxes, consolidated net income on a GAAP basis between $25.6 million and $27.7 million • Earnings per share of $.50 to $.54 |
 the STRENGTH of WORKING TOGETHER SM Second Quarter 2008 Financial Review |
 10 Second Quarter 2008 Financials Quarter Ended June 30 2008 2007 % Change Revenues: Revenues Before Reimbursements $263,265 $240,537 9% Reimbursements 26,001 15,694 66% Total Revenues 289,266 256,231 13% Costs and Expenses: Cost of Services Before Reimbursements 190,626 178,949 7% Reimbursements 26,001 15,694 66% Total Cost of Services 216,627 194,643 11% Selling, General, and Administrative Expenses 55,265 52,705 5% Corporate Interest Expense, Net 4,656 4,232 10% Total Costs and Expenses 276,548 251,580 10% Gain on Sale of Former Corporate Headquarters - 4,844 nm Income Before Income Taxes 12,718 9,495 34% Income Taxes 4,786 3,443 39% Net Income $7,932 $6,052 31% Diluted Earnings Per Share - After Gain on Disposal $0.16 $0.12 31% Diluted Earnings Per Share - Before Gain on Disposal $0.16 $0.06 167% nm = not meaningful CRAWFORD & COMPANY CONDENSED CONSOLIDATED STATEMENTS OF INCOME (In Thousands, Except Per Share Amounts) Unaudited |
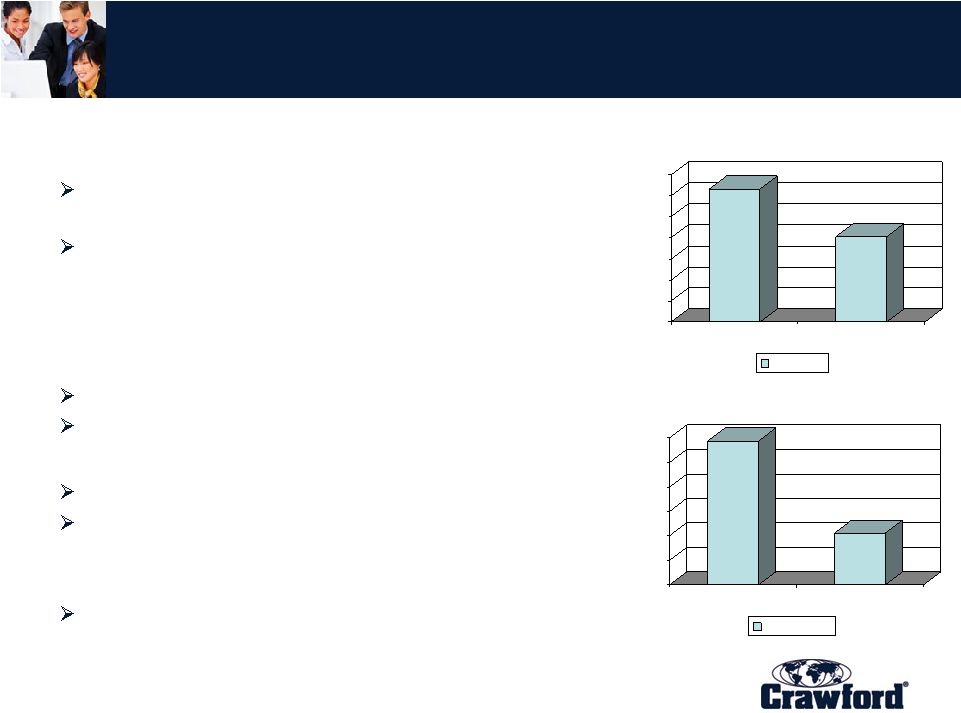
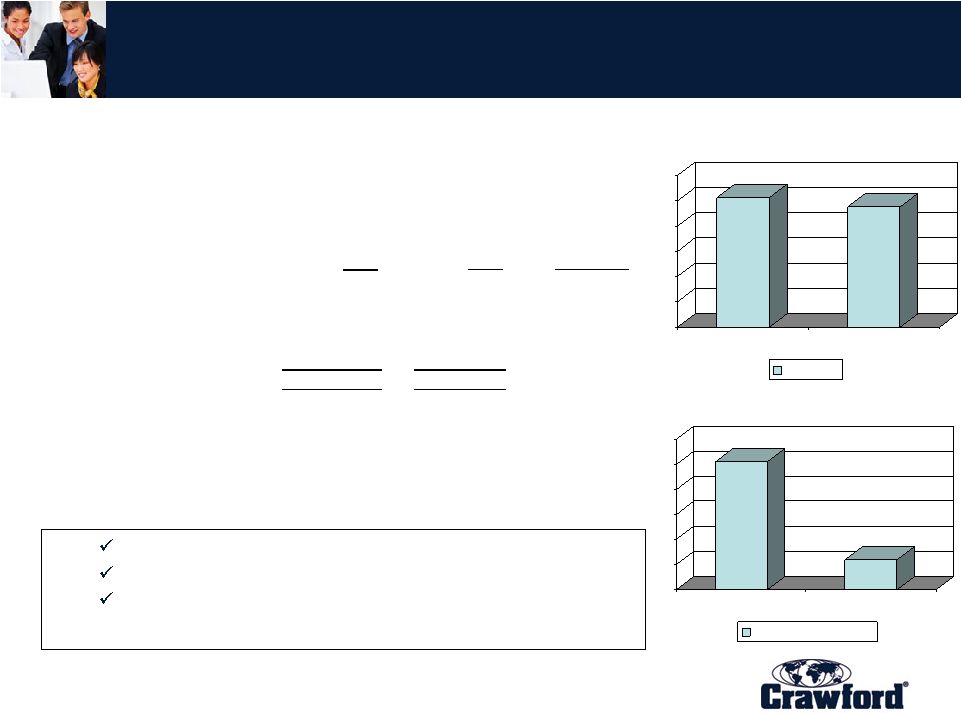
 11 60 70 80 90 100 110 120 2Q 2008 2Q 2007 Revenue 0 2 4 6 8 10 12 2Q 2008 2Q 2007 Operating Earnings $ in millions $ in millions Second Quarter 2008 Financials $113.4 $88.7 $10.4 $4.6 Revenue increased 20.0% on a constant dollar basis. Significant client wins. Summary Results, International For the quarter ended June 30, 2008 and 2007 in Thousands Except Percentages Unaudited 2008 2007 % Change Revenues 113,433 $ 88,655 $ 27.9% Total Operating Expenses 102,987 84,089 22.5% Operating Earnings 10,446 $ 4,566 $ 128.8% Operating Margin 9.2% 5.2% |
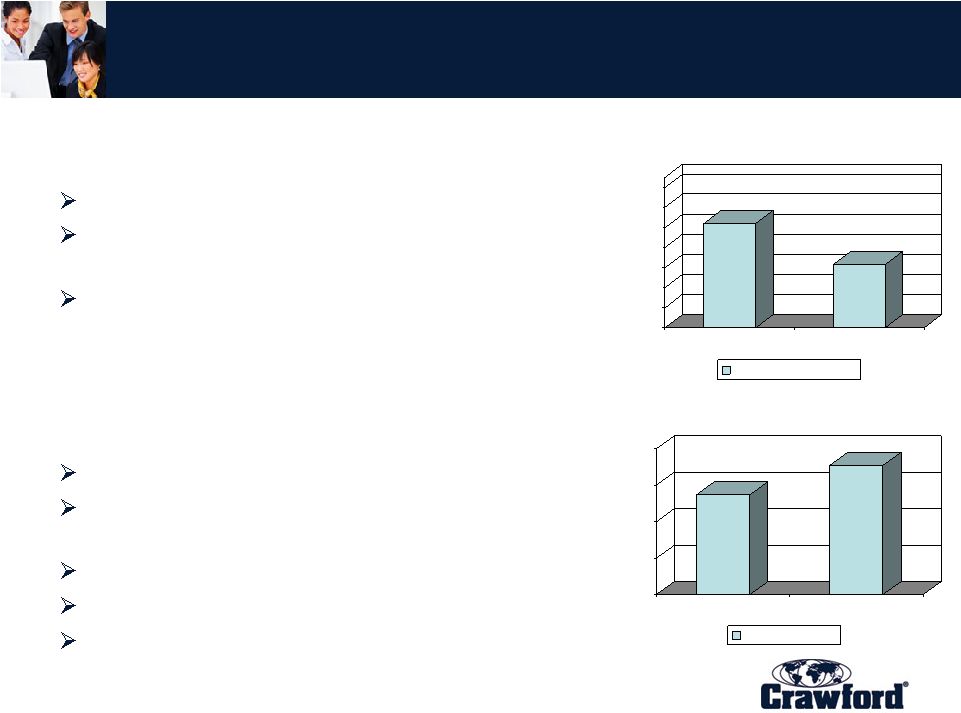
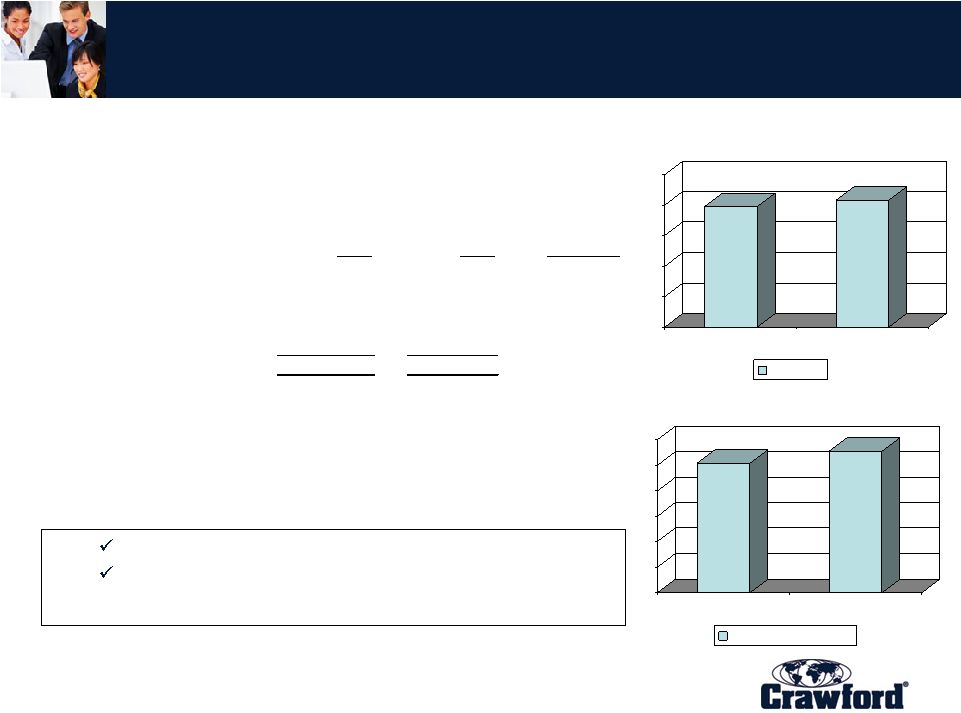
 12 0 10 20 30 40 50 60 2Q 2008 2Q 2007 Revenue 0 1 2 3 4 5 6 2Q 2008 2Q 2007 Operating Earnings $ in millions $ in millions Second Quarter 2008 Financials $47.7 $51.2 $1.2 $5.1 Improved margins through strong cost management. Catastrophe revenue up $2.2 million from 2007 to 2008. Reduction in claim referrals due to client decision to in- source high volume, low margin vehicle claims. Summary Results, U.S. Property & Casualty For the quarter ended June 30, 2008 and 2007 in Thousands Except Percentages Unaudited 2008 2007 % Change Revenues 51,198 $ 47,748 $ 7.2% Total Operating Expenses 46,106 46,551 -1.0% Operating Earnings 5,092 $ 1,197 $ 325.4% Operating Margin 9.9% 2.5% |
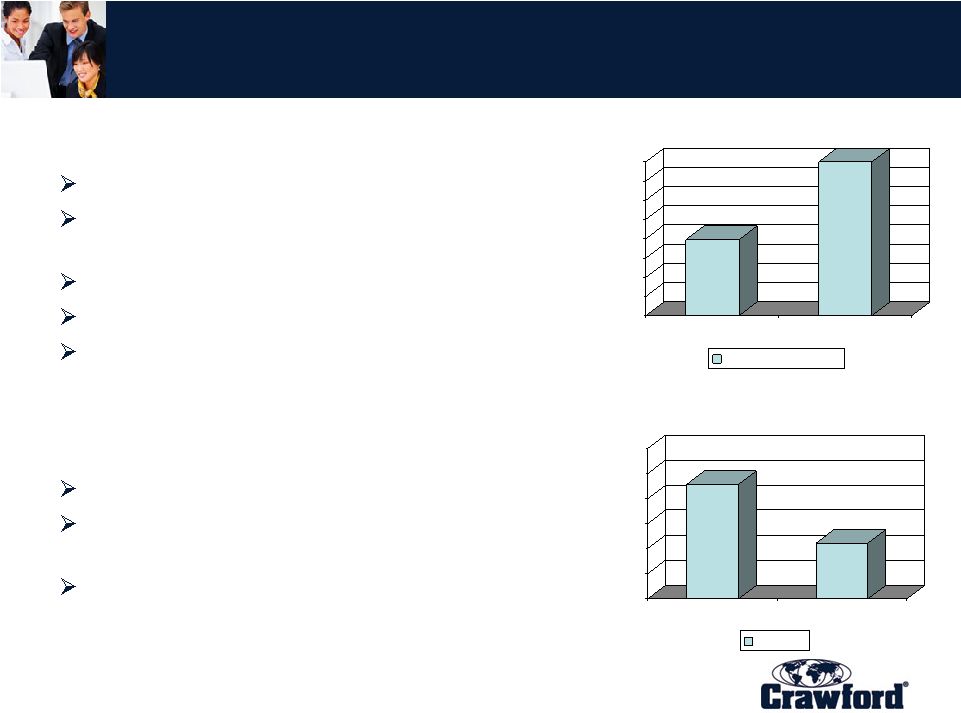
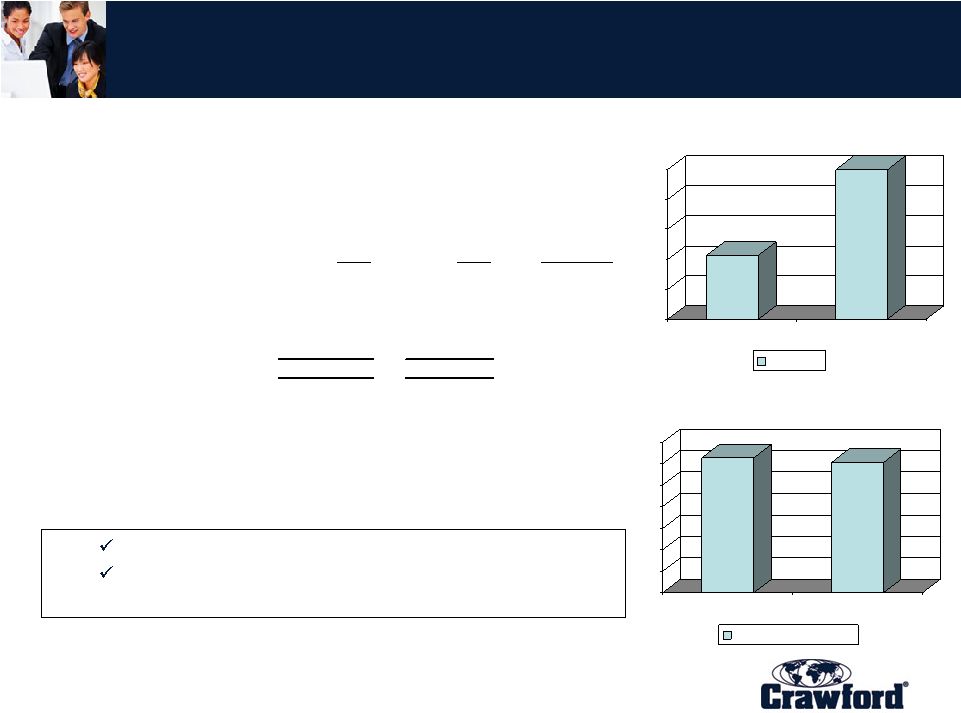
 13 0 20 40 60 80 100 2Q 2008 2Q 2007 Revenue 0 0.5 1 1.5 2 2.5 3 2Q 2008 2Q 2007 Operating Earnings $ in millions $ in millions Second Quarter 2008 Financials $79.1 $83.1 $2.8 $2.5 Worker’s Comp market continues challenging. Strong client retention and cross-selling partially offset run-off revenue decline. Summary Results, Broadspire For the quarter ended June 30, 2008 and 2007 in Thousands Except Percentages Unaudited 2008 2007 % Change Revenues 79,065 $ 83,138 $ -4.9% Total Operating Expenses 76,525 80,359 -4.8% Operating Earnings 2,540 $ 2,779 $ -8.6% Operating Margin 3.2% 3.3% |
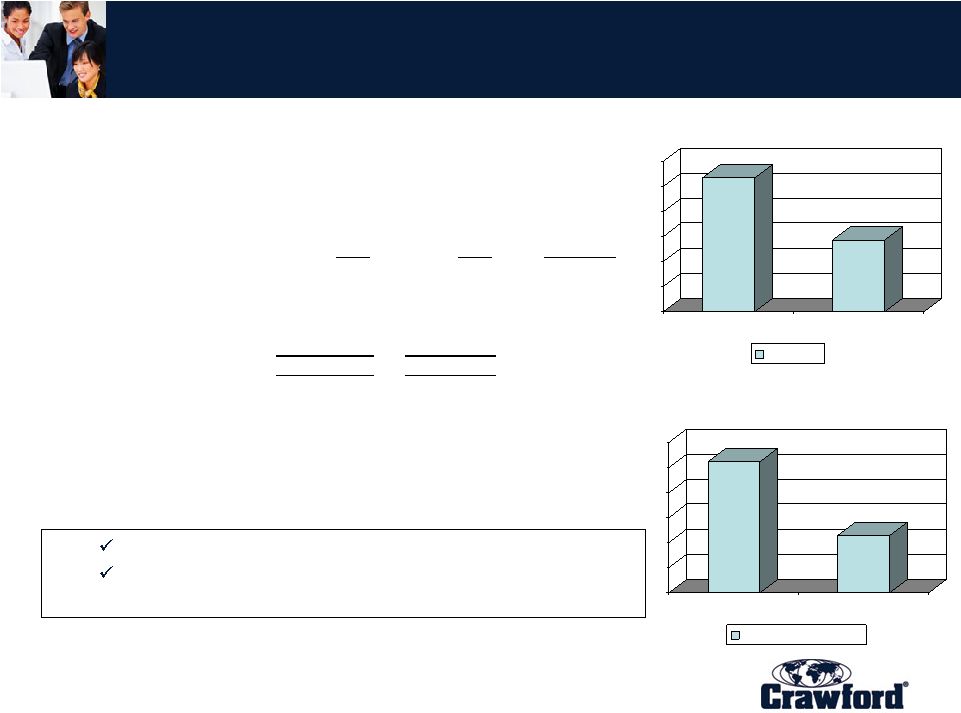
 14 18.5 19 19.5 20 20.5 21 2Q 2008 2Q 2007 Revenue 0 0.5 1 1.5 2 2.5 3 3.5 2Q 2008 2Q 2007 Operating Earnings $ in millions $ in millions Second Quarter 2008 Financials $19.6 $21.0 $3.0 $3.1 Improved margins through strong cost management. Backlog of over $52 million. Summary Results, Legal Settlement Administration For the quarter ended June 30, 2008 and 2007 in Thousands Except Percentages Unaudited 2008 2007 % Change Revenues 19,569 $ 20,996 $ -6.8% Total Operating Expenses 16,427 17,963 -8.6% Operating Earnings 3,142 $ 3,033 $ 3.6% Operating Margin 16.1% 14.4% |
 15 Second Quarter 2008 Financials Crawford & Company Balance Sheet Highlights As of June 30, 2008 and December 31, 2007 (Unaudited, in thousands) June 30, December 31, 2008 2007 Change Cash, cash equivalents, and short-term investments $48,346 $50,855 ($2,509) Accounts receivable, net 191,980 178,528 13,452 Work in process 131,899 136,652 (4,753) Total receivables 323,879 315,180 8,699 Deferred revenues, net 102,905 109,603 (6,698) Pension liabilities 67,375 76,977 (9,602) Current portion of long-term debt, capital leases and short-term borrowings 35,724 31,864 3,860 Long-term debt 182,381 183,449 (1,068) Total debt 218,105 215,313 2,792 Total stockholders' equity 272,576 254,215 18,361 Net debt* 169,759 164,458 5,301 Total debt / capitalization 44% 46% *Net debt is defined by the Company as long-term debt, capital leases and short-term borrowings, net of cash, cash equivalents, and short-term investments. |
 16 Second Quarter 2008 Financials Free Cash Flow For the year-to-date period ended June 30, 2008 and 2007 Unaudited (In Thousands) June 30, June 30, 2008 2007 Change Net Income $17,000 $9,359 $7,641 Plus: Depreciation / Non-Cash Items 14,837 14,540 297 Less: Special Credits - (8,824) 8,824 Less: Working Capital Growth (17,962) (21,435) 3,473 Less: U.S. Pension Contributions (2,900) - (2,900) Operating Cash Flow 10,975 (6,360) 17,335 Less: Capital Expenditures (7,054) (7,039) (15) Less: Internally Developed Software (6,183) (4,977) (1,206) Less: Mandatory Principal Payments (1,050) (1,050) - Free Cash Flow ($3,312) ($19,426) $16,114 |
 the STRENGTH of WORKING TOGETHER SM |