 the STRENGTH of WORKING TOGETHER SM Third Quarter 2008 Earnings Conference Call Monday, November 3, 2008 Exhibit 99.2 |
 2 Third Quarter Earnings Review November 3, 2008 • Founded in 1941, Crawford is the largest independent global provider of claims management solutions and a fully integrated global provider of these solutions for the growing multi-national market. • Crawford is divided into four reporting segments that support the strategic positioning of the Company in a changing market place: – U.S. Property & Casualty • Serves the U.S. insurance company market – International Operations • Serves the global insurance industry and multinational corporations – Broadspire • Serves large national accounts, carriers and self-insured entities – Legal Settlement Administration • Provides administration for class action settlements and bankruptcy matters • The Company’s independence, global presence and diversified business lines are key competitive advantages which set Crawford apart from its competitors. |
 3 Forward-looking Statements and Segment Operating Earnings Forward Looking Statements: This presentation contains forward-looking statements, including statements about the future financial condition, results of operations and earnings outlook of Crawford & Company. Statements, both qualitative and quantitative, that are not historical facts may be “forward-looking” statements as defined in the Private Securities Litigation Reform Act of 1995. Forward-looking statements involve a number of risks and uncertainties that could cause actual results to differ materially from historical experience or Crawford & Company’s present expectations. Accordingly, no one should place undue reliance on forward-looking statements, which speak only as of the date on which they are made. Crawford & Company does not undertake to update forward- looking statements to reflect the impact of circumstances or events that may arise or not arise after the date the forward-looking statements are made. For further information regarding Crawford & Company, and the risks and uncertainties involved in forward-looking statements, please read Crawford & Company reports filed with the United States Securities and Exchange Commission and available at www.sec.gov or in the Investor Relations section of Crawford & Company’s website at www.crawfordandcompany.com. Segment Operating Earnings: Segment operating earnings represent earnings before net corporate interest expense, amortization of customer-relationship intangible assets, stock option expense, income tax expense, unallocated corporate and shared costs, and gains on asset sales. On January 1, 2008 the Company’s Strategic Warranty Services unit was moved from the Legal Settlement Administration segment to the U.S. Property & Casualty segment. Prior period results for both segments have been restated to reflect this transfer. Subsequent to March 31, 2007, the Company changed its method of allocating certain corporate overhead costs to each of its operating segments. Prior period results have been restated to reflect the current allocation method. Segment revenues and expenses do not include reimbursements for out-of-pocket expenses. |
 4 “The Strength of Working Together” “The Strength of Working Together” is unifying the Company around consistent goals: Adaptive leadership team responding to changing economic conditions Sustained emphasis on sources of additional revenue growth – Selling Crawford services into the existing client base through key account management Driving technology forward – Creating operational efficiencies – Global economies of scale Being a target-driven organization – Setting goals for 2009 to 2011 |
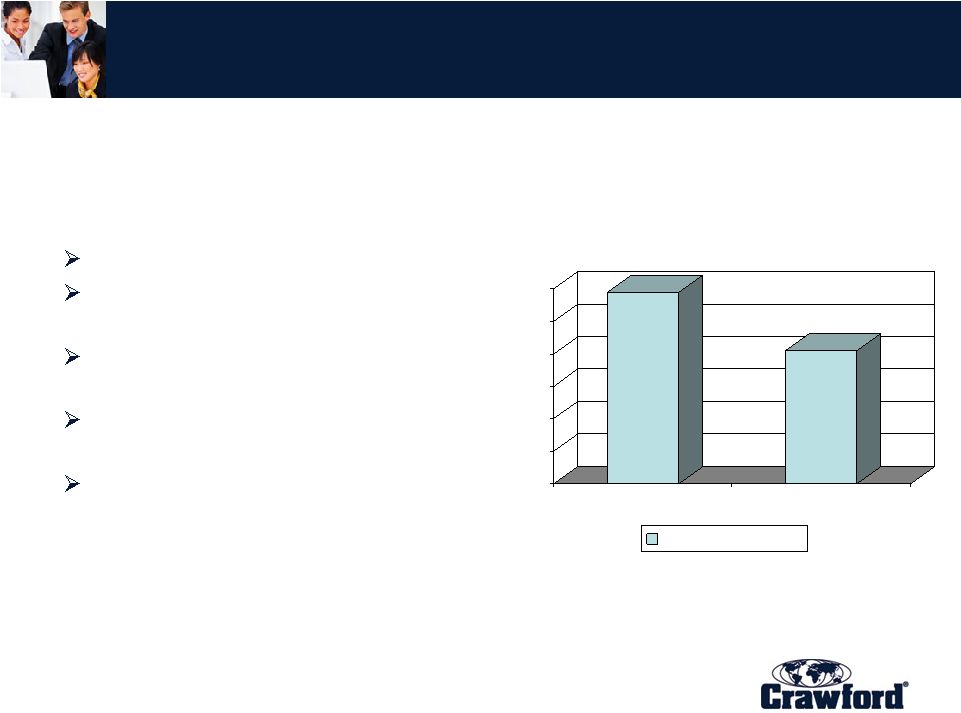
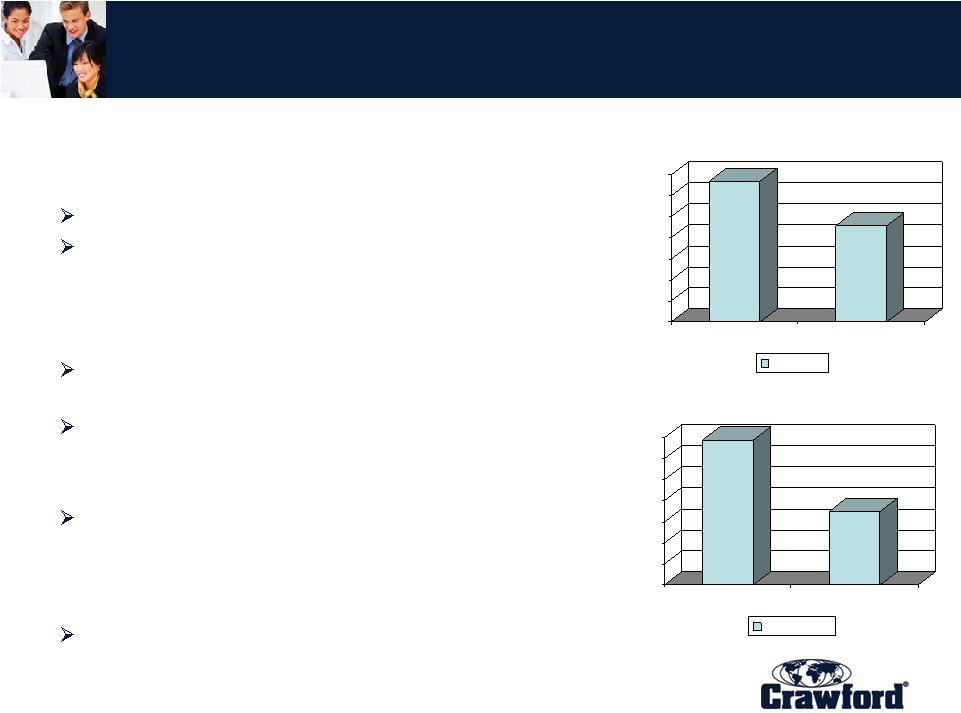 5 Third Quarter 2008 Overview • Strong performance in a difficult operating environment Revenue growth of 8.6% over 2007 quarter Net income up 100% over 2007 quarter • Sustained growth internationally and in U.S. Property & Casualty offset declines in other businesses International revenue growth of 19.3% over 2007 quarter U.S. Property & Casualty revenue up 12.5% with catastrophe revenue up $2.9 million. • Improved earnings per share to $0.13 from $0.07 Improved operating margins in U.S. Property & Casualty, International Operations, and Legal Settlement Administration. • Improvement in cash and balance sheet metrics $29.3 million improvement in cash flow from operations over prior year-to-date period 200 210 220 230 240 250 260 270 3Q 2008 3Q 2007 Revenue $ in millions 0 1 2 3 4 5 6 7 3Q 2008 3Q 2007 Net Income $ in millions $266.9 $245.8 $6.9 $3.5 |
 the STRENGTH of WORKING TOGETHER SM Third Quarter 2008 Financial Review |
 7 Third Quarter 2008 Financials Three Months Ended September 30 2008 2007 % Change Revenues: Revenues Before Reimbursements $266,916 $245,774 9% Reimbursements 24,416 20,196 21% Total Revenues 291,332 265,970 10% Costs and Expenses: Cost of Services Provided, Before Reimbursements 196,874 185,533 6% Reimbursements 24,416 20,196 21% Total Cost of Services 221,290 205,729 8% Selling, General, and Administrative Expenses 56,222 53,159 6% Corporate Interest Expense, Net 4,334 4,572 -5% Total Costs and Expenses 281,846 263,460 7% Income Before Income Taxes 9,486 2,510 278% Provision for Income Taxes 2,564 (943) 372% Net Income $6,922 $3,453 100% Earnings Per Share: Basic $0.14 $0.07 100% Diluted $0.13 $0.07 86% CRAWFORD & COMPANY CONDENSED CONSOLIDATED STATEMENTS OF INCOME Unaudited (In Thousands, Except Earnings Per Share and Percentages) |
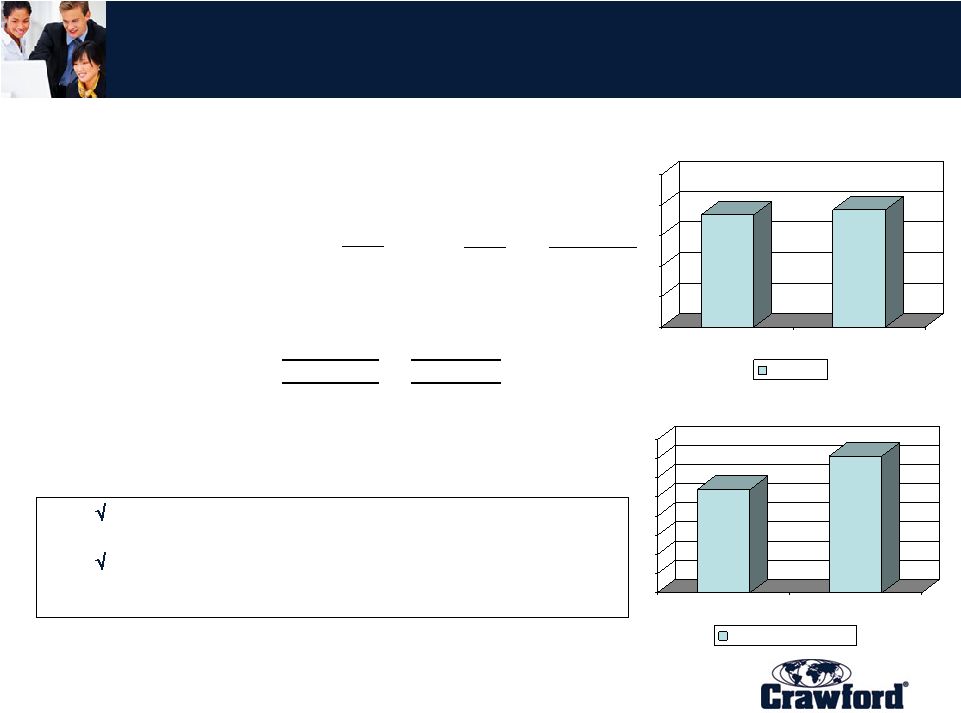
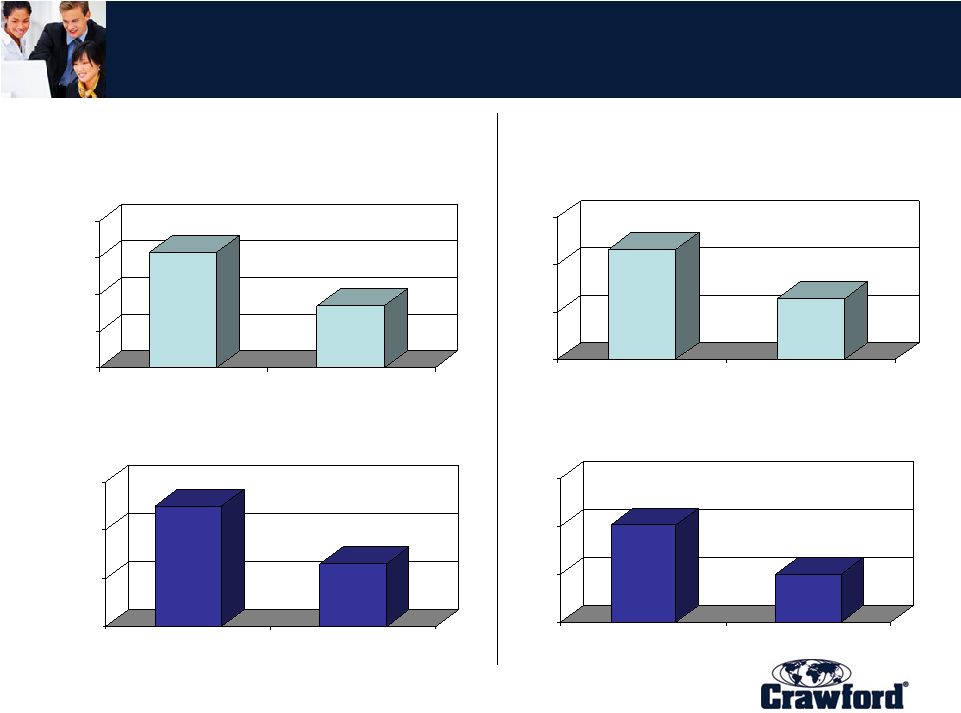
 8 60 70 80 90 100 110 120 3Q 2008 3Q 2007 Revenue 0 2 4 6 8 10 3Q 2008 3Q 2007 Operating Earnings $ in millions $ in millions Third Quarter 2008 Financials $115.4 $96.7 $8.6 $6.3 Operating earnings improve on both revenue and margin gains. Revenue increased 14.6% on a constant dollar basis. Summary Results, International Operations For the quarters ended September 30, 2008 and 2007 in Thousands Except Percentages Unaudited 2008 2007 % Change Revenues 115,362 $ 96,735 $ 19.3% Total Operating Expenses 106,768 90,455 18.0% Operating Earnings 8,594 $ 6,280 $ 36.8% Operating Margin 7.4% 6.5% |
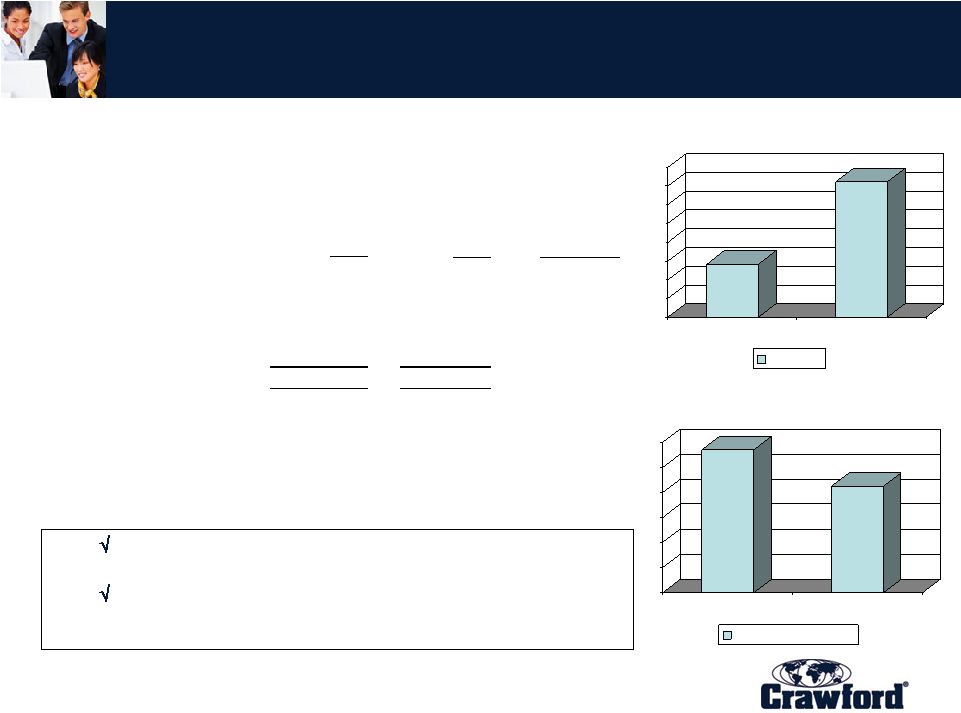
 9 40 50 60 70 80 90 3Q 2008 3Q 2007 Revenue 0 0.2 0.4 0.6 0.8 1 1.2 1.4 1.6 3Q 2008 3Q 2007 Operating Earnings $ in millions $ in millions Third Quarter 2008 Financials $76.9 $78.4 $1.4 $1.1 Operating margin and earnings decline due to contracting revenue base. Worker’s compensation market continues to be challenging due to claim frequency declines. Summary Results, Broadspire For the quarters ended September 30, 2008 and 2007 in Thousands Except Percentages Unaudited 2008 2007 % Change Revenues 76,911 $ 78,434 $ -1.9% Total Operating Expenses 75,832 77,003 -1.5% Operating Earnings 1,079 $ 1,431 $ -24.6% Operating Margin 1.4% 1.8% |
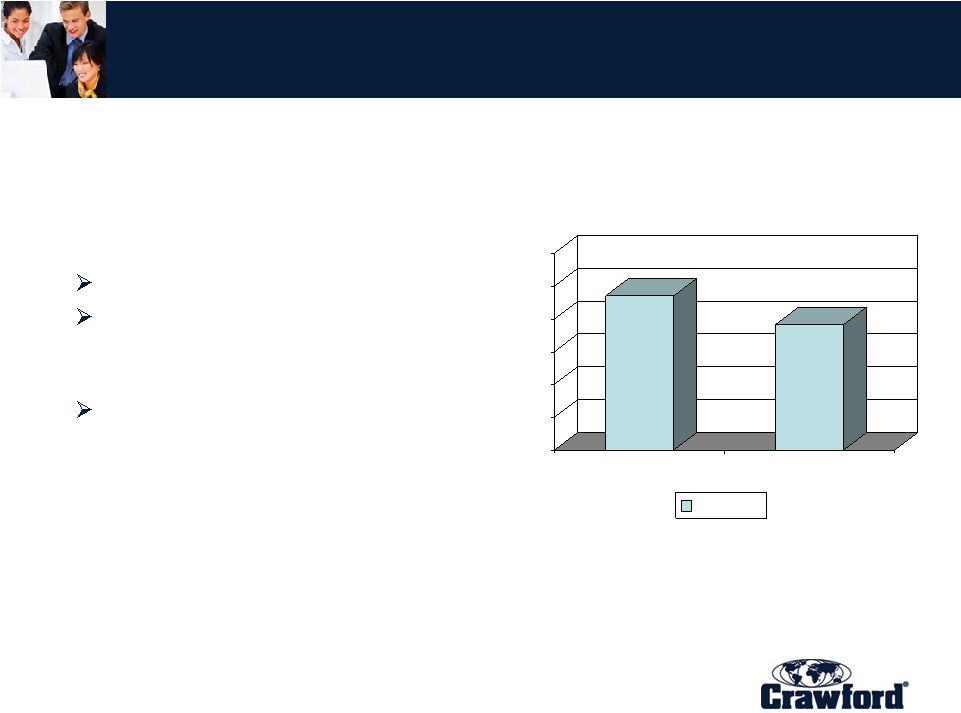
 10 17 17.5 18 18.5 19 19.5 20 20.5 21 3Q 2008 3Q 2007 Revenue 0 0.5 1 1.5 2 2.5 3 3Q 2008 3Q 2007 Operating Earnings $ in millions $ in millions Third Quarter 2008 Financials $18.4 $20.6 $2.1 $2.9 Operating earnings increase 34% despite lower revenue due to improvements in cost control. Backlog of $43.5 million. Summary Results, Legal Settlement Administration For the quarters ended September 30, 2008 and 2007 in Thousands Except Percentages Unaudited 2008 2007 % Change Revenues 18,416 $ 20,622 $ -10.7% Total Operating Expenses 15,563 18,496 -15.9% Operating Earnings 2,853 $ 2,126 $ 34.2% Operating Margin 15.5% 10.3% |
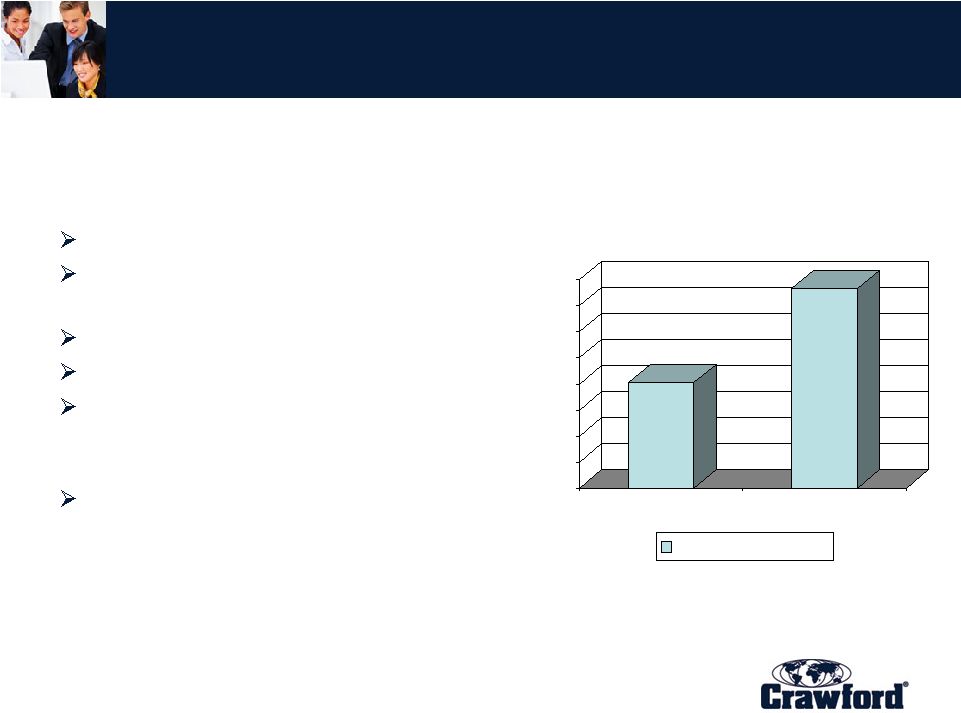
 11 0 10 20 30 40 50 60 3Q 2008 3Q 2007 Revenue 0 1 2 3 4 5 6 7 3Q 2008 3Q 2007 Operating Earnings $ in millions $ in millions Third Quarter 2008 Financials $50.0 $56.2 $3.5 $6.8 Operating earnings up 93% on revenue growth and technology-led operating efficiencies. Catastrophe revenue up $2.9 million from hurricanes Gustav and Ike. Cases up over 15% in quarter. Summary Results, U.S. Property & Casualty For the quarters ended September 30, 2008 and 2007 in Thousands Except Percentages Unaudited 2008 2007 % Change Revenues 56,227 $ 49,983 $ 12.5% Total Operating Expenses 49,446 46,469 6.4% Operating Earnings 6,781 $ 3,514 $ 93.0% Operating Margin 12.1% 7.0% |
 12 Third Quarter 2008 Financials Crawford & Company Balance Sheet Highlights As of September 30, 2008 and December 31, 2007 In thousands, except percentages Unaudited September 30, December 31, 2008 2007 Change Cash and cash equivalents $56,819 $50,855 $5,964 Accounts receivable, net 178,429 178,528 (99) Unbilled revenues 131,752 136,652 (4,900) Total receivables 310,181 315,180 (4,999) Deferred revenues, net 99,567 111,036 (11,469) Accrued pension liabilities 52,190 76,977 (24,787) Current portion of long-term debt, capital leases and short-term borrowings 30,199 31,864 (1,665) Long-term debt 181,790 183,449 (1,659) Total debt 211,989 215,313 (3,324) Total stockholders' equity 281,822 254,215 27,607 Net debt* 155,170 164,458 (9,288) Total debt / capitalization 43% 46% *Net debt is defined by the Company as long-term debt, capital leases and short-term borrowings, net of cash and cash equivalents. |
 13 Third Quarter 2008 Financials Crawford & Company Free Cash Flow (a non-GAAP measurement) For the year-to-date periods ended September 30, 2008 and 2007 In thousands Unaudited September 30, September 30, 2008 2007 Variance Net Income $23,922 $12,812 $11,110 Depreciation / Non-Cash Items 22,737 22,146 591 Special Credits - (8,824) 8,824 Change in Working Capital 1,382 (21,713) 23,095 U.S. Pension Contributions (14,916) (549) (14,367) Cash Flow from Operating Activities 33,125 3,872 29,253 Capital Expenditures for PP&E (12,753) (15,614) 2,861 Internally Developed Software (9,133) (5,452) (3,681) Mandatory Principal Payments (1,575) (1,575) - Free Cash Flow (non-GAAP) $9,664 ($18,769) $28,433 |
 the STRENGTH of WORKING TOGETHER SM Third Quarter 2008 Operations Review |
 15 Third Quarter 2008 Highlights 150 155 160 165 170 3Q 2008 3Q 2007 International Claims Claims referred in 000s 159.4 168.4 • International Operations Strong global revenue growth of 19.3%. Operating margin increased to 7.4% in 2008 from 6.5% in 2007. Claims referred decreased 5.3% due to absence of 2007 CAT claims. Revenue increased 14.6% on a constant dollar basis. Strong working capital management. |
 16 Third Quarter 2008 Highlights • U.S. Property & Casualty Revenue growth of 12.5%. Operating margin increased to 12.1% in 2008 from 7.0% in 2007. Catastrophe revenue up $2.9 million. Technology-driven efficiencies realized. Claims referred increased 15.6% due to increases in property and CAT related claims. 75 85 95 105 115 125 135 3Q 2008 3Q 2007 U.S. P&C Claims Claims referred in 000s 134.0 116.0 |
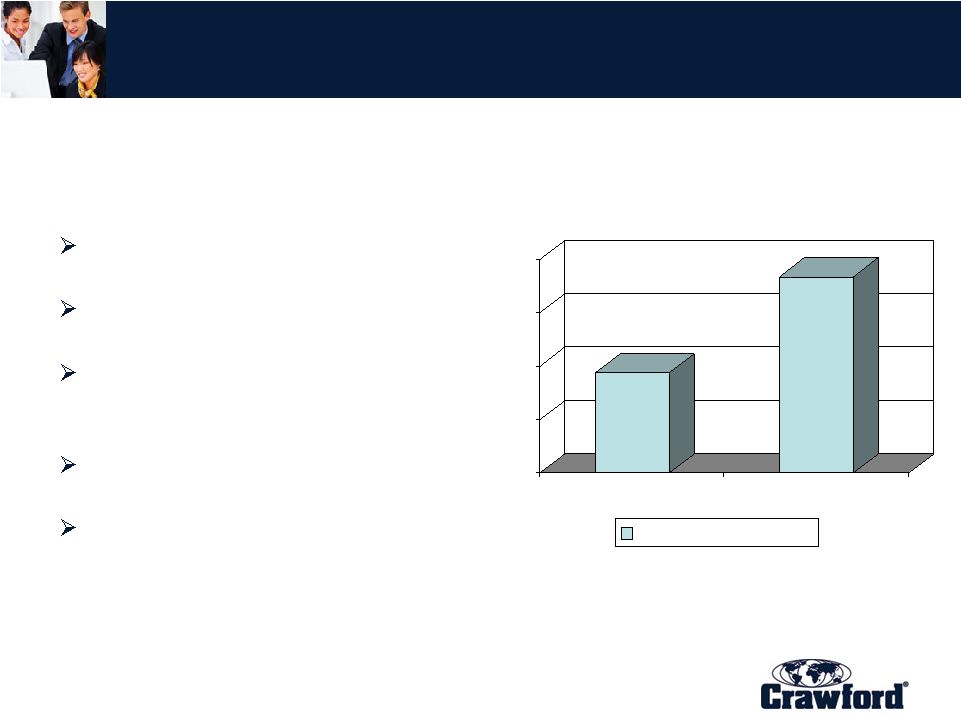
 17 Crawford U.S. Catastrophe (CAT) Activity 0 5 10 15 2008 2007 CAT Cases 12.5 6.5 0 10 20 30 2008 2007 CAT Cases 20.2 9.9 0 2 4 6 8 2008 2007 CAT Revenues $6.3 $3.4 $ in millions 0 5 10 15 2008 2007 CAT Revenues $11.6 $6.5 $ in millions Quarter ended Sept. 30: Nine months ended Sept. 30: In 000s In 000s |
 18 Third Quarter 2008 Highlights Claims referred in 000s 63.1 70.3 • Broadspire Revenue decline of 1.9% Operating earnings of $1.1 million in the quarter. RiskTech deployment on schedule 93% retention rate. Worker’s Comp market continues challenging as claims referred declined 10.3%. Strong client retention and cross-selling partially offset run-off revenue decline. 55 57 59 61 63 65 67 69 71 3Q 2008 3Q 2007 Broadspire Claims |
 19 Third Quarter 2008 Highlights • Legal Settlement Administration Revenue declined 10.7%. Operating margin increased to 15.5% from 10.3% in 2007 through strong cost management. Backlog of $43.5 million. 20 25 30 35 40 45 50 3Q 2008 3Q 2007 Backlog Backlog in millions $43.5 $39.1 |
 20 Outlook • Full Year 2008: – Consolidated revenue before reimbursements between $1.04 billion and $1.05 billion. – Consolidated operating earnings between $68.1 million and $72.4 million. – After reflecting stock-based compensation expense, net corporate interest expense, customer-relationship intangible amortization expense, special credits and charges and income taxes, consolidated net income on a GAAP basis between $28.3 million and $30.4 million. – Earnings per share of $.54 to $.58. • 2009: – While our practice continues to be to provide initial earnings guidance for the coming year with our fourth quarter earnings release, our 10-Q that will be filed with the SEC next week will discuss the expectation of increases in our defined benefit plan expense and funding in the U.S. and U.K. in 2009. This anticipated pension expense increase is a result of the recent stock market declines and downturns in the global economy which have negatively affected the asset values in our pension plans as they have affected many other companies. We cannot specifically determine the impact at this time, but we believe that it is likely to materially affect reported results in fiscal 2009. |
 the STRENGTH of WORKING TOGETHER SM |