Janus Emerging Markets Fund
Additional Information (unaudited)
· For Perkins Small Cap Value Fund, the Trustees noted that the Fund’s performance was in the bottom Broadridge quartile for the 36 months ended May 31, 2015 and the second Broadridge quartile for the 12 months ended May 31, 2015. The Trustees noted the reasons for the Fund’s underperformance, noting that the Fund has a performance fee structure that results in lower management fees during periods of underperformance, the steps Janus Capital and Perkins had taken or were taking to improve performance, and that the performance trend was improving.
· For Perkins Value Plus Income Fund, the Trustees noted that the Fund’s performance was in the second Broadridge quartile for the 36 months ended May 31, 2015 and the second Broadridge quartile for the 12 months ended May 31, 2015.
Mathematical Funds
· For INTECH Emerging Markets Managed Volatility Fund, the Trustees noted that, due to limited performance for the Fund, performance history was not a material factor.
· For INTECH Global Income Managed Volatility Fund, the Trustees noted that the Fund’s performance was in the first Broadridge quartile for the 36 months ended May 31, 2015 and the third Broadridge quartile for the 12 months ended May 31, 2015.
· For INTECH International Managed Volatility Fund, the Trustees noted that the Fund’s performance was in the bottom Broadridge quartile for the 36 months ended May 31, 2015 and the bottom Broadridge quartile for the 12 months ended May 31, 2015. The Trustees noted the reasons for the Fund’s underperformance and the steps Janus Capital and INTECH had taken or were taking to improve performance.
· For INTECH U.S. Core Fund, the Trustees noted that the Fund’s performance was in the second Broadridge quartile for the 36 months ended May 31, 2015 and the second Broadridge quartile for the 12 months ended May 31, 2015.
· For INTECH U.S. Managed Volatility Fund, the Trustees noted that the Fund’s performance was in the second Broadridge quartile for the 36 months ended May 31, 2015 and the third Broadridge quartile for the 12 months ended May 31, 2015.
Growth and Core Funds
· For Janus Balanced Fund, the Trustees noted that the Fund’s performance was in the first Broadridge quartile for the 36 months ended May 31, 2015 and the first Broadridge quartile for the 12 months ended May 31, 2015.
· For Janus Contrarian Fund, the Trustees noted that the Fund’s performance was in the first Broadridge quartile for the 36 months ended May 31, 2015 and the bottom Broadridge quartile for the 12 months ended May 31, 2015.
· For Janus Enterprise Fund, the Trustees noted that the Fund’s performance was in the second Broadridge quartile for the 36 months ended May 31, 2015 and the first Broadridge quartile for the 12 months ended May 31, 2015.
· For Janus Forty Fund, the Trustees noted that the Fund’s performance was in the second Broadridge quartile for the 36 months ended May 31, 2015 and the first Broadridge quartile for the 12 months ended May 31, 2015.
· For Janus Fund, the Trustees noted that the Fund’s performance was in the second Broadridge quartile for the 36 months ended May 31, 2015 and the first Broadridge quartile for the 12 months ended May 31, 2015.
· For Janus Growth and Income Fund, the Trustees noted that the Fund’s performance was in the third Broadridge quartile for the 36 months ended May 31, 2015 and in the third Broadridge quartile for the 12 months ended May 31, 2015. The Trustees noted the reasons for the Fund’s underperformance and the steps Janus Capital had taken or was taking to improve performance.
· For Janus Research Fund, the Trustees noted that the Fund’s performance was in the first Broadridge quartile for the 36 months ended May 31, 2015 and the first Broadridge quartile for the 12 months ended May 31, 2015.
Janus Emerging Markets Fund
Additional Information (unaudited)
· For Janus Triton Fund, the Trustees noted that the Fund’s performance was in the second Broadridge quartile for the 36 months ended May 31, 2015 and the first Broadridge quartile for the 12 months ended May 31, 2015.
· For Janus Twenty Fund, the Trustees noted that the Fund’s performance was in the third Broadridge quartile for the 36 months ended May 31, 2015 and the bottom Broadridge quartile for the 12 months ended May 31, 2015. The Trustees noted the reasons for the Fund’s underperformance, noting that the Fund has a performance fee structure that results in lower management fees during periods of underperformance, and the steps Janus Capital had taken or was taking to improve performance.
· For Janus Venture Fund, the Trustees noted that the Fund’s performance was in the first Broadridge quartile for the 36 months ended May 31, 2015 and the first Broadridge quartile for the 12 months ended May 31, 2015.
Global and International Funds
· For Janus Asia Equity Fund, the Trustees noted that the Fund’s performance was in the third Broadridge quartile for the 36 months ended May 31, 2015 and the first Broadridge quartile for the 12 months ended May 31, 2015. The Trustees noted the reasons for the Fund’s underperformance, noting that the Fund has a performance fee structure that results in lower management fees during periods of underperformance, the steps Janus Capital had taken or was taking to improve performance, and that the performance trend was improving.
· For Janus Emerging Markets Fund, the Trustees noted that the Fund’s performance was in the second Broadridge quartile for the 36 months ended May 31, 2015 and the first Broadridge quartile for the 12 months ended May 31, 2015.
· For Janus Global Life Sciences Fund, the Trustees noted that the Fund’s performance was in the first Broadridge quartile for the 36 months ended May 31, 2015 and the first Broadridge quartile for the 12 months ended May 31, 2015.
· For Janus Global Real Estate Fund, the Trustees noted that the Fund’s performance was in the first Broadridge quartile for the 36 months ended May 31, 2015 and the first Broadridge quartile for the 12 months ended May 31, 2015.
· For Janus Global Research Fund, the Trustees noted that the Fund’s performance was in the second Broadridge quartile for the 36 months ended May 31, 2015 and the first Broadridge quartile for the 12 months ended May 31, 2015.
· For Janus Global Select Fund, the Trustees noted that the Fund’s performance was in the second Broadridge quartile for the 36 months ended May 31, 2015 and the first Broadridge quartile for the 12 months ended May 31, 2015.
· For Janus Global Technology Fund, the Trustees noted that the Fund’s performance was in the third Broadridge quartile for the 36 months ended May 31, 2015 and the third Broadridge quartile for the 12 months ended May 31, 2015. The Trustees noted the reasons for the Fund’s underperformance and the steps Janus Capital had taken or was taking to improve performance.
· For Janus International Equity Fund, the Trustees noted that the Fund’s performance was in the second Broadridge quartile for the 36 months ended May 31, 2015 and the second Broadridge quartile for the 12 months ended May 31, 2015.
· For Janus Overseas Fund, the Trustees noted that the Fund’s performance was in the bottom Broadridge quartile for the 36 months ended May 31, 2015 and the bottom Broadridge quartile for the 12 months ended May 31, 2015. The Trustees noted the reasons for the Fund’s underperformance, noting that the Fund has a performance fee structure that results in lower management fees during periods of underperformance, and the steps Janus Capital had taken or was taking to improve performance.
Janus Emerging Markets Fund
Additional Information (unaudited)
Janus Aspen Series
· For Janus Aspen Balanced Portfolio, the Trustees noted that the Fund’s performance was in the first Broadridge quartile for the 36 months ended May 31, 2015 and the first Broadridge quartile for the 12 months ended May 31, 2015.
· For Janus Aspen Enterprise Portfolio, the Trustees noted that the Fund’s performance was in the second Broadridge quartile for the 36 months ended May 31, 2015 and the first Broadridge quartile for the 12 months ended May 31, 2015.
· For Janus Aspen Flexible Bond Portfolio, the Trustees noted that the Fund’s performance was in the second Broadridge quartile for the 36 months ended May 31, 2015 and the second Broadridge quartile for the 12 months ended May 31, 2015.
· For Janus Aspen Forty Portfolio, the Trustees noted that the Fund’s performance was in the second Broadridge quartile for the 36 months ended May 31, 2015 and the first Broadridge quartile for the 12 months ended May 31, 2015.
· For Janus Aspen Global Allocation Portfolio – Moderate, the Trustees noted that the Fund’s performance was in the first Broadridge quartile for the 36 months ended May 31, 2015 and the bottom Broadridge quartile for the 12 months ended May 31, 2015.
· For Janus Aspen Global Research Portfolio, the Trustees noted that the Fund’s performance was in the first Broadridge quartile for the 36 months ended May 31, 2015 and the second Broadridge quartile for the 12 months ended May 31, 2015.
· For Janus Aspen Global Technology Portfolio, the Trustees noted that the Fund’s performance was in the second Broadridge quartile for the 36 months ended May 31, 2015 and the third Broadridge quartile for the 12 months ended May 31, 2015.
· For Janus Aspen Global Unconstrained Bond Portfolio, the Trustees noted that, due to limited performance for the Fund, performance history was not a material factor.
· For Janus Aspen INTECH U.S. Low Volatility Portfolio, the Trustees noted that the Fund’s performance was in the first Broadridge quartile for the 12 months ended May 31, 2015.
· For Janus Aspen Janus Portfolio, the Trustees noted that the Fund’s performance was in the second Broadridge quartile for the 36 months ended May 31, 2015 and the first Broadridge quartile for the 12 months ended May 31, 2015.
· For Janus Aspen Overseas Portfolio, the Trustees noted that the Fund’s performance was in the bottom Broadridge quartile for the 36 months ended May 31, 2015 and the bottom Broadridge quartile for the 12 months ended May 31, 2015. The Trustees noted the reasons for the Fund’s underperformance, noting that the Fund has a performance fee structure that results in lower management fees during periods of underperformance, and the steps Janus Capital had taken or was taking to improve performance.
· For Janus Aspen Perkins Mid Cap Value Portfolio, the Trustees noted that the Fund’s performance was in the bottom Broadridge quartile for the 36 months ended May 31, 2015 and the bottom Broadridge quartile for the 12 months ended May 31, 2015. The Trustees noted the reasons for the Fund’s underperformance, noting that the Fund has a performance fee structure that results in lower management fees during periods of underperformance, and the steps Janus Capital and Perkins had taken or were taking to improve performance.
In consideration of each Fund’s performance, the Trustees concluded that, taking into account the factors relevant to performance, as well as other considerations, including steps taken to improve performance, the Fund’s performance warranted continuation of the Fund’s investment advisory and subadvisory agreement(s).
Costs of Services Provided
The Trustees examined information regarding the fees and expenses of each Fund in comparison to similar information for other comparable funds as provided by Broadridge, an independent data provider. They also reviewed an analysis of that information provided by their independent fee consultant and noted that the rate of management (investment advisory and any administration, but excluding out-of-pocket costs) fees for many of the Funds, after applicable waivers,
Janus Emerging Markets Fund
Additional Information (unaudited)
was below the mean management fee rate of the respective peer group of funds selected by an independent data provider. The Trustees also examined information regarding the subadvisory fees charged for subadvisory services, as applicable, noting that all such fees were paid by Janus Capital out of its management fees collected from such Fund.
The independent fee consultant provided its belief that the management fees charged by Janus Capital to each of the Funds under the current investment advisory and administration agreements are reasonable in relation to the services provided by Janus Capital. The independent fee consultant found: (1) the total expenses and management fees of the Funds to be reasonable relative to other mutual funds; (2) total expenses, on average, were 14% below the mean total expenses of their respective Broadridge Expense Group peers and 24% below the mean total expenses for their Broadridge Expense Universes; (3) management fees for the Funds, on average, were 15% below the mean management fees for their Expense Groups and 19% below the mean for their Expense Universes; and (4) Fund expenses at the functional level for each asset and share class category were reasonable. The Trustees also considered the total expenses for each share class of each Fund compared to the mean total expenses for its Broadridge Expense Group peers and to mean total expenses for its Broadridge Expense Universe.
The independent fee consultant concluded that, based on its strategic review of expenses at the complex, category and individual fund level, Fund expenses were found to be reasonable relative to both Expense Group and Expense Universe benchmarks. Further, for certain Funds, the independent fee consultant also performed a systematic “focus list” analysis of expenses in the context of the performance or service delivered to each set of investors in each share class in each selected Fund. Based on this analysis, the independent fee consultant found that the combination of service quality/performance and expenses on these individual Funds and share classes were reasonable in light of performance trends, performance histories, and existence of performance fees, breakpoints, and expense waivers on such Funds.
The Trustees considered the methodology used by Janus Capital and each subadviser in determining compensation payable to portfolio managers, the competitive environment for investment management talent, and the competitive market for mutual funds in different distribution channels.
The Trustees also reviewed management fees charged by Janus Capital and each subadviser to comparable separate account clients and to comparable non-affiliated funds subadvised by Janus Capital or by a subadviser (for which Janus Capital or the subadviser provides only or primarily portfolio management services). Although in most instances subadvisory and separate account fee rates for various investment strategies were lower than management fee rates for Funds having a similar strategy, the Trustees considered that Janus Capital noted that, under the terms of the management agreements with the Funds, Janus Capital performs significant additional services for the Funds that it does not provide to those other clients, including administration services, oversight of the Funds’ other service providers, trustee support, regulatory compliance and numerous other services, and that, in serving the Funds, Janus Capital assumes many legal risks and other costs that it does not assume in servicing its other clients. Moreover, they noted that the independent fee consultant found that: (1) the management fees Janus Capital charges to the Funds are reasonable in relation to the management fees Janus Capital charges to its institutional and subadvised accounts; (2) these institutional and subadvised accounts have different service and infrastructure needs; (3) the average spread between management fees charged to the Funds and those charged to Janus Capital’s institutional accounts is reasonable relative to the average spreads seen in the industry; and (4) by one estimation methodology, the fee margins implied by Janus Capital’s subadvised fees when compared to its mutual fund fees are reasonable relative to the estimated fee margins in the industry and relative to estimated fee margins of fund managers using Janus Capital as a subadviser.
The Trustees considered the fees for each Fund for its fiscal year ended in 2014, and noted the following with regard to each Fund’s total expenses, net of applicable fee waivers (the Fund’s “total expenses”):
Fixed-Income Funds and Money Market Funds
· For Janus Flexible Bond Fund, the Trustees noted that, although the Fund’s total expenses exceeded the peer group mean for certain share classes, overall the Fund’s total expenses were reasonable. The Trustees also noted that Janus Capital has contractually agreed to limit the Fund’s expenses, although this limit did not apply because the Fund’s total expenses were already below the applicable fee limit.
Janus Emerging Markets Fund
Additional Information (unaudited)
· For Janus Global Bond Fund, the Trustees noted that although the Fund’s total expenses exceeded the peer group mean for certain share classes, overall the Fund’s total expenses were reasonable. The Trustees also noted that Janus Capital has contractually agreed to limit the Fund’s expenses.
· For Janus Global Unconstrained Bond Fund, the Trustees noted that although the Fund’s total expenses exceeded the peer group mean for certain share classes, overall the Fund’s total expenses were reasonable. The Trustees also noted that Janus Capital has contractually agreed to limit the Fund’s expenses.
· For Janus High-Yield Fund, the Trustees noted that, although the Fund’s total expenses exceeded the peer group mean for certain share classes, overall the Fund’s total expenses were reasonable. The Trustees also noted that Janus Capital has contractually agreed to limit the Fund’s expenses, although this limit did not apply because the Fund’s total expenses were already below the applicable fee limit.
· For Janus Multi-Sector Income Fund, the Trustees noted that, although the Fund’s total expenses exceeded the peer group mean for certain share classes, overall the Fund’s total expenses were reasonable. The Trustees also noted that Janus has contractually agreed to limit the Fund’s expenses.
· For Janus Real Return Fund, the Trustees noted that, although the Fund’s total expenses exceeded the peer group mean for all share classes, overall the Fund’s total expenses were reasonable. The Trustees also noted that Janus Capital has contractually agreed to limit the Fund’s expenses.
· For Janus Short-Term Bond Fund, the Trustees noted that, although the Fund’s total expenses exceeded the peer group mean for all share classes, overall the Fund’s total expenses were reasonable. The Trustees also noted that Janus Capital has contractually agreed to limit the Fund’s expenses.
· For Janus Government Money Market Fund, the Trustees noted that the Fund’s total expenses exceeded the peer group mean for both share classes. The Trustees considered that management fees for this Fund are higher than the peer group mean due to the Fund’s management fee including other costs, such as custody and transfer agent services, while many funds in the peer group pay these expenses separately from their management fee. In addition, the Trustees considered that Janus Capital voluntarily waives one-half of its advisory fee and other expenses in order to maintain a positive yield.
· For Janus Money Market Fund, the Trustees noted that the Fund’s total expenses were below the peer group mean for both share classes. In addition, the Trustees considered that Janus Capital voluntarily waives one-half of its advisory fee and other expenses in order to maintain a positive yield.
Asset Allocation Funds
· For Janus Global Allocation Fund – Conservative, the Trustees noted that the Fund’s total expenses were below the peer group mean for all share classes.
· For Janus Global Allocation Fund – Growth, the Trustees noted that the Fund’s total expenses were below the peer group mean for all share classes.
· For Janus Global Allocation Fund – Moderate, the Trustees noted that, although the Fund’s total expenses exceeded the peer group mean for certain share classes, overall the Fund’s total expenses were reasonable. The Trustees also noted that Janus Capital has contractually agreed to limit the Fund’s expenses.
Alternative Fund
· For Janus Diversified Alternatives Fund, the Trustees noted that, although the Fund’s total expenses exceeded the peer group mean for one share class, overall the Fund’s total expenses were reasonable. The Trustees also noted that Janus Capital has contractually agreed to limit the Fund’s expenses.
Value Funds
· For Perkins International Value Fund, the Trustees noted that, although the Fund’s total expenses exceeded the peer group mean for certain share classes, overall the Fund’s total expenses were reasonable. The Trustees also noted that Janus Capital has contractually agreed to limit the Fund’s expenses.
· For Perkins Global Value Fund, the Trustees noted that, although the Fund’s total expenses exceeded the peer group mean for one share class, overall the Fund’s total expenses were reasonable.
Janus Emerging Markets Fund
Additional Information (unaudited)
· For Perkins Large Cap Value Fund, the Trustees noted that, although the Fund’s total expenses exceeded the peer group mean for certain share classes, overall the Fund’s total expenses were reasonable. The Trustees also noted that Janus Capital has contractually agreed to limit the Fund’s expenses.
· For Perkins Mid Cap Value Fund, the Trustees noted that, although the Fund’s total expenses exceeded the peer group mean for one share class, overall the Fund’s total expenses were reasonable. The Trustees also noted that Janus Capital has contractually agreed to limit the Fund’s expenses, although this limit did not apply because the Fund’s total expenses were already below the applicable fee limit.
· For Perkins Select Value Fund, the Trustees noted that, although the Fund’s total expenses exceeded the peer group mean for one share class, overall the Fund’s total expenses were reasonable. The Trustees also noted that Janus Capital has contractually agreed to limit the Fund’s expenses.
· For Perkins Small Cap Value Fund, the Trustees noted that the Fund’s total expenses were below the peer group mean for all share classes.
· For Perkins Value Plus Income Fund, the Trustees noted that although the Fund’s total expenses exceeded the peer group mean for one share class, overall the Fund’s total expenses were reasonable. The Trustees also noted that Janus Capital had contractually agreed to limit the Fund’s expenses.
Mathematical Funds
· For INTECH Emerging Markets Managed Volatility Fund, the Trustees noted that although the Fund’s total expenses exceeded the peer group mean for certain share classes, overall the Fund’s total expenses were reasonable. The Trustees also noted that Janus Capital has contractually agreed to limit the Fund’s expenses.
· For INTECH Global Income Managed Volatility Fund, the Trustees noted that the Fund’s total expenses were below the peer group mean for all share classes.
· For INTECH International Managed Volatility Fund, the Trustees noted that although the Fund’s total expenses exceeded the peer group mean for one share class, overall the Fund’s total expenses were reasonable. The Trustees also noted that Janus Capital had contractually agreed to limit the Fund’s expenses, although this limit did not apply because the Fund’s total expenses were already below the applicable fee limit.
· For INTECH U.S. Core Fund, the Trustees noted that although the Fund’s total expenses exceeded the peer group mean for one share class, overall the Fund’s total expenses were reasonable. The Trustees also noted that Janus Capital has contractually agreed to limit the Fund’s expenses, although this limit did not apply because the Fund’s total expenses were already below the applicable fee limit.
· For INTECH U.S. Managed Volatility Fund, the Trustees noted that the Fund’s total expenses exceeded the peer group mean for one share class. The Trustees also noted that Janus Capital had contractually agreed to limit the Fund’s expenses.
Growth and Core Funds
· For Janus Balanced Fund, the Trustees noted that, although the Fund’s total expenses exceeded the peer group mean for one share class, overall the Fund’s total expenses were reasonable. The Trustees also noted that Janus Capital has contractually agreed to limit the Fund’s expenses, although this limit did not apply because the Fund’s total expenses were already below the applicable fee limit.
· For Janus Contrarian Fund, the Trustees noted that, although the Fund’s total expenses exceeded the peer group mean for certain share classes, overall the Fund’s total expenses were reasonable. The Trustees also noted that Janus Capital has contractually agreed to limit the Fund’s expenses, although this limit did not apply because the Fund’s total expenses were already below the applicable fee limit.
· For Janus Enterprise Fund, the Trustees noted that, although the Fund’s total expenses exceeded the peer group mean for certain share classes, overall the Fund’s total expenses were reasonable. The Trustees also noted that Janus Capital has contractually agreed to limit the Fund’s expenses, although this limit did not apply because the Fund’s total expenses were already below the applicable fee limit.
· For Janus Forty Fund, the Trustees noted that the Fund’s total expenses were below the peer group mean for all share classes.
Janus Emerging Markets Fund
Additional Information (unaudited)
· For Janus Fund, the Trustees noted that the Fund’s total expenses were below the peer group mean for all share classes.
· For Janus Growth and Income Fund, the Trustees noted that, although the Fund’s total expenses exceeded the peer group mean for certain share classes, overall the Fund’s total expenses were reasonable. The Trustees also noted that Janus Capital has contractually agreed to limit the Fund’s expenses, although this limit did not apply because the Fund’s total expenses were already below the applicable fee limit.
· For Janus Research Fund, the Trustees noted that the Fund’s total expenses were below the peer group mean for all share classes.
· For Janus Triton Fund, the Trustees noted that, although the Fund’s total expenses exceeded the peer group mean for one share class, overall the Fund’s total expenses were reasonable. The Trustees also noted that Janus Capital has contractually agreed to limit the Fund’s expenses, although this limit did not apply because the Fund’s total expenses were already below the applicable fee limit.
· For Janus Twenty Fund, the Trustees noted that the Fund’s total expenses were below the peer group mean for all share classes.
· For Janus Venture Fund, the Trustees noted that, although the Fund’s total expenses exceeded the peer group mean for one share class, overall the Fund’s total expenses were reasonable. The Trustees also noted that Janus Capital has contractually agreed to limit the Fund’s expenses, although this limit did not apply because the Fund’s total expenses were already below the applicable fee limit.
Global and International Funds
· For Janus Asia Equity Fund, the Trustees noted that the Fund’s total expenses were below the peer group mean for all share classes.
· For Janus Emerging Markets Fund, the Trustees noted that, although the Fund’s total expenses exceeded the peer group mean for certain share classes, overall the Fund’s total expenses were reasonable. The Trustees also noted that Janus Capital has contractually agreed to limit the Fund’s expenses.
· For Janus Global Life Sciences Fund, the Trustees noted that the Fund’s total expenses were below the peer group mean for all share classes.
· For Janus Global Real Estate Fund, the Trustees noted that, although the Fund’s total expenses exceeded the peer group mean for one share class, overall the Fund’s total expenses were reasonable. The Trustees also noted that Janus Capital has contractually agreed to limit the Fund’s expenses.
· For Janus Global Research Fund, the Trustees noted that the Fund’s total expenses were below the peer group mean for all share classes.
· For Janus Global Select Fund, the Trustees noted that the Fund’s total expenses were below the peer group mean for all share classes.
· For Janus Global Technology Fund, the Trustees noted that the Fund’s total expenses were below the peer group mean for all share classes.
· For Janus International Equity Fund, the Trustees noted that, although the Fund’s total expenses exceeded the peer group mean for one share class, overall the Fund’s total expenses were reasonable. The Trustees also noted that Janus Capital has contractually agreed to limit the Fund’s expenses, although this limit did not apply because the Fund’s total expenses were already below the applicable fee limit.
· For Janus Overseas Fund, the Trustees noted that the Fund’s total expenses were below the peer group mean for all share classes.
Janus Aspen Series
· For Janus Aspen Balanced Portfolio, the Trustees noted that the Fund’s total expenses were below the peer group mean for both share classes.
Janus Emerging Markets Fund
Additional Information (unaudited)
· For Janus Aspen Enterprise Portfolio, the Trustees noted that the Fund’s total expenses were below the peer group mean for both share classes.
· For Janus Aspen Flexible Bond Portfolio, the Trustees noted that, although the Fund’s total expenses exceeded the peer group mean for one share class, overall the Fund’s total expenses were reasonable. The Trustees also noted that Janus Capital had contractually agreed to limit the Fund’s expenses.
· For Janus Aspen Forty Portfolio, the Trustees noted that the Fund’s total expenses were below the peer group mean for both share classes.
· For Janus Aspen Global Allocation Portfolio - Moderate, the Trustees noted that, although the Fund’s total expenses exceeded the peer group mean for both share classes, overall the Fund’s total expenses were reasonable. The Trustees also noted that Janus Capital has contractually agreed to limit the Fund’s expenses.
· For Janus Aspen Global Research Portfolio, the Trustees noted that the Fund’s total expenses were below the peer group mean for both share classes.
· For Janus Aspen Global Technology Portfolio, the Trustees noted that the Fund’s total expenses were below the peer group mean for both share classes.
· For Janus Aspen Global Unconstrained Bond Portfolio, the Trustees noted that, although the Fund’s total expenses exceeded the peer group mean for both share classes, overall the Fund’s total expenses were reasonable. The Trustees also noted that Janus Capital had contractually agreed to limit the Fund’s expenses.
· For Janus Aspen INTECH U.S. Low Volatility Portfolio, the Trustees noted that the Fund’s total expenses were below the peer group mean for its sole share class.
· For Janus Aspen Janus Portfolio, the Trustees noted that the Fund’s total expenses were below the peer group mean for both share classes.
· For Janus Aspen Overseas Portfolio, the Trustees noted that the Fund’s total expenses were below the peer group mean for both share classes.
�� For Janus Aspen Perkins Mid Cap Value Portfolio, the Trustees noted that the Fund’s total expenses were below the peer group mean for both share classes.
The Trustees reviewed information on the profitability to Janus Capital and its affiliates of their relationships with each Fund, as well as an explanation of the methodology utilized by Janus Capital when allocating various expenses of Janus Capital and its affiliates with respect to contractual relationships with the Funds and other clients. The Trustees also reviewed the financial statements and corporate structure of Janus Capital’s parent company. In their review, the Trustees considered whether Janus Capital and each subadviser receive adequate incentives and resources to manage the Funds effectively. The Trustees recognized that profitability comparisons among fund managers are difficult because very little comparative information is publicly available, and the profitability of any fund manager is affected by numerous factors, including the organizational structure of the particular fund manager, the types of funds and other accounts it manages, possible other lines of business, the methodology for allocating expenses, and the fund manager’s capital structure and cost of capital. However, taking into account those factors and the analysis provided by the Trustees’ independent fee consultant, and based on the information available, the Trustees concluded that Janus Capital’s profitability with respect to each Fund in relation to the services rendered was reasonable.
The independent fee consultant found that, while assessing the reasonableness of expenses in light of Janus Capital’s profits is dependent on comparisons with other publicly-traded mutual fund advisers, and that these comparisons are limited in accuracy by differences in complex size, business mix, institutional account orientation, and other factors, after accepting these limitations, the level of profit earned by Janus Capital from managing the Funds is reasonable.
The Trustees concluded that the management fees payable by each Fund to Janus Capital and its affiliates, as well as the fees paid by Janus Capital to the subadvisers of subadvised Funds, were reasonable in relation to the nature, extent, and quality of the services provided, taking into account the fees charged by other advisers for managing comparable mutual funds with similar strategies, the fees Janus Capital and the subadvisers charge to other clients, and, as applicable, the impact of fund performance on management fees payable by the Funds. The Trustees also concluded that each Fund’s total expenses were reasonable, taking into account the size of the Fund, the quality of services
Janus Emerging Markets Fund
Additional Information (unaudited)
provided by Janus Capital and any subadviser, the investment performance of the Fund, and any expense limitations agreed to or provided by Janus Capital.
Economies of Scale
The Trustees considered information about the potential for Janus Capital to realize economies of scale as the assets of the Funds increase. They noted that their independent fee consultant provided an analysis of economies of scale, which included discussion of analysis from prior years. They also noted that, although many Funds pay advisory fees at a base fixed rate as a percentage of net assets, without any breakpoints, their independent fee consultant concluded that 85% of these Funds have contractual management fees (gross of waivers) below their Broadridge expense group averages and, overall, 80% of the Funds are below their respective expense group averages for contractual management fees. They also noted that for those Funds whose expenses are being reduced by the contractual expense limitations of Janus Capital, Janus Capital is subsidizing the Funds because they have not reached adequate scale. Moreover, as the assets of some of the Funds have declined in the past few years, certain Funds have benefited from having advisory fee rates that have remained constant rather than increasing as assets declined. In addition, performance fee structures have been implemented for various Funds that have caused the effective rate of advisory fees payable by such a Fund to vary depending on the investment performance of the Fund relative to its benchmark index over the measurement period; and a few Funds have fee schedules with breakpoints and reduced fee rates above certain asset levels. The Trustees also noted that the Funds share directly in economies of scale through the lower charges of third-party service providers that are based in part on the combined scale of all of the Funds. Based on all of the information they reviewed, including research and analysis conducted by the Trustees’ independent fee consultant, the Trustees concluded that the current fee structure of each Fund was reasonable and that the current rates of fees do reflect a sharing between Janus Capital and the Fund of any economies of scale that may be present at the current asset level of the Fund.
The independent fee consultant concluded that, given the limitations of various analytical approaches to economies of scale considered in prior years, and their conflicting results, its analyses could not confirm or deny the existence of economies of scale in the Janus complex. Further, the independent fee consultant provided its belief that Fund investors are well-served by the fee levels and performance fee structures in place on the Funds in light of any economies of scale that may be present at Janus Capital.
Other Benefits to Janus Capital
The Trustees also considered benefits that accrue to Janus Capital and its affiliates and subadvisers to the Funds from their relationships with the Funds. They recognized that two affiliates of Janus Capital separately serve the Funds as transfer agent and distributor, respectively, and the transfer agent receives compensation directly from the non-money market funds for services provided. The Trustees also considered Janus Capital’s past and proposed use of commissions paid by the Funds on portfolio brokerage transactions to obtain proprietary and third-party research products and services benefiting the Fund and/or other clients of Janus Capital and/or Janus Capital, and/or a subadviser to a Fund. The Trustees concluded that Janus Capital’s and the subadvisers’ use of these types of client commission arrangements to obtain proprietary and third-party research products and services was consistent with regulatory requirements and guidelines and was likely to benefit each Fund. The Trustees also concluded that, other than the services provided by Janus Capital and its affiliates and subadvisers pursuant to the agreements and the fees to be paid by each Fund therefor, the Funds and Janus Capital and the subadvisers may potentially benefit from their relationship with each other in other ways. They concluded that Janus Capital and/or the subadvisers benefits from the receipt of research products and services acquired through commissions paid on portfolio transactions of the Funds and that the Funds benefit from Janus Capital’s and/or the subadvisers’ receipt of those products and services as well as research products and services acquired through commissions paid by other clients of Janus Capital and/or other clients of the subadvisers. They further concluded that the success of any Fund could attract other business to Janus Capital, the subadvisers or other Janus funds, and that the success of Janus Capital and the subadvisers could enhance Janus Capital’s and the subadvisers’ ability to serve the Funds.
Janus Emerging Markets Fund
Useful Information About Your Fund Report (unaudited)
Management Commentary
The Management Commentary in this report includes valuable insight as well as statistical information to help you understand how your Fund’s performance and characteristics stack up against those of comparable indices.
If the Fund invests in foreign securities, this report may include information about country exposure. Country exposure is based primarily on the country of risk. A company may be allocated to a country based on other factors such as location of the company’s principal office, the location of the principal trading market for the company’s securities, or the country where a majority of the company’s revenues are derived.
Please keep in mind that the opinions expressed in the Management Commentary are just that: opinions. They are a reflection based on best judgment at the time this report was compiled, which was March 31, 2016. As the investing environment changes, so could opinions. These views are unique and are not necessarily shared by fellow employees or by Janus in general.
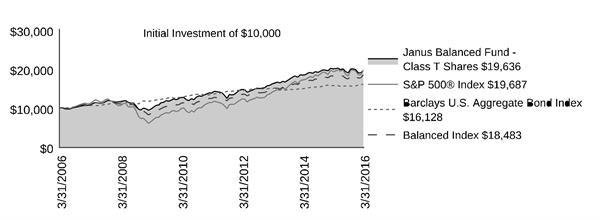
Performance Overviews
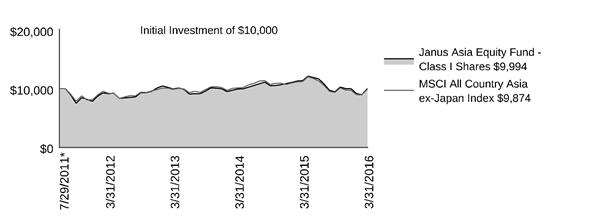
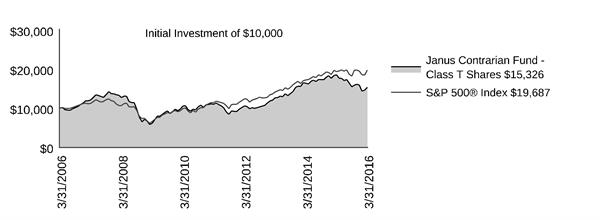
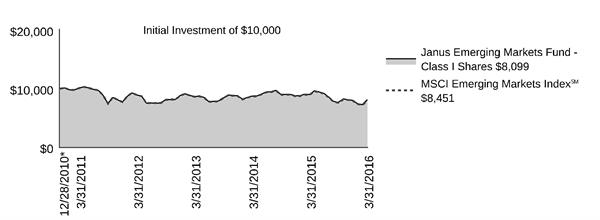
Performance overview graphs compare the performance of a hypothetical $10,000 investment in the Fund with one or more widely used market indices. When comparing the performance of the Fund with an index, keep in mind that market indices are not available for investment and do not reflect deduction of expenses.
Average annual total returns are quoted for a Fund with more than one year of performance history. Average annual total return is calculated by taking the growth or decline in value of an investment over a period of time, including reinvestment of dividends and distributions, then calculating the annual compounded percentage rate that would have produced the same result had the rate of growth been constant throughout the period. Average annual total return does not reflect the deduction of taxes that a shareholder would pay on Fund distributions or redemptions of Fund shares.
Cumulative total returns are quoted for a Fund with less than one year of performance history. Cumulative total return is the growth or decline in value of an investment over time, independent of the period of time involved. Cumulative total return does not reflect the deduction of taxes that a shareholder would pay on Fund distributions or redemptions of Fund shares.
Pursuant to federal securities rules, expense ratios shown in the performance chart reflect subsidized (if applicable) and unsubsidized ratios. The total annual fund operating expenses ratio is gross of any fee waivers, reflecting the Fund’s unsubsidized expense ratio. The net annual fund operating expenses ratio (if applicable) includes contractual waivers of Janus Capital and reflects the Fund’s subsidized expense ratio. Ratios may be higher or lower than those shown in the “Financial Highlights” in this report.
Schedule of Investments
Following the performance overview section is the Fund’s Schedule of Investments. This schedule reports the types of securities held in the Fund on the last day of the reporting period. Securities are usually listed by type (common stock, corporate bonds, U.S. Government obligations, etc.) and by industry classification (banking, communications, insurance, etc.). Holdings are subject to change without notice.
The value of each security is quoted as of the last day of the reporting period. The value of securities denominated in foreign currencies is converted into U.S. dollars.
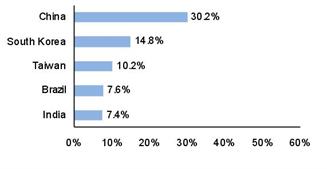
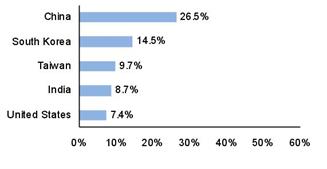
If the Fund invests in foreign securities, it will also provide a summary of investments by country. This summary reports the Fund exposure to different countries by providing the percentage of securities invested in each country. The country of each security represents the country of risk. The Fund’s Schedule of Investments relies upon the industry group and country classifications published by Barclays and/or MSCI Inc.
Tables listing details of individual forward currency contracts, futures, written options, and swaps follow the Fund’s Schedule of Investments (if applicable).
Statement of Assets and Liabilities
This statement is often referred to as the “balance sheet.” It lists the assets and liabilities of the Fund on the last day of the reporting period.
Janus Emerging Markets Fund
Useful Information About Your Fund Report (unaudited)
The Fund’s assets are calculated by adding the value of the securities owned, the receivable for securities sold but not yet settled, the receivable for dividends declared but not yet received on securities owned, and the receivable for Fund shares sold to investors but not yet settled. The Fund’s liabilities include payables for securities purchased but not yet settled, Fund shares redeemed but not yet paid, and expenses owed but not yet paid. Additionally, there may be other assets and liabilities such as unrealized gain or loss on forward currency contracts.
The section entitled “Net Assets Consist of” breaks down the components of the Fund’s net assets. Because the Fund must distribute substantially all earnings, you will notice that a significant portion of net assets is shareholder capital.
The last section of this statement reports the net asset value (“NAV”) per share on the last day of the reporting period. The NAV is calculated by dividing the Fund’s net assets for each share class (assets minus liabilities) by the number of shares outstanding.
Statement of Operations
This statement details the Fund’s income, expenses, realized gains and losses on securities and currency transactions, and changes in unrealized appreciation or depreciation of Fund holdings.
The first section in this statement, entitled “Investment Income,” reports the dividends earned from securities and interest earned from interest-bearing securities in the Fund.
The next section reports the expenses incurred by the Fund, including the advisory fee paid to the investment adviser, transfer agent fees and expenses, and printing and postage for mailing statements, financial reports and prospectuses. Expense offsets and expense reimbursements, if any, are also shown.
The last section lists the amounts of realized gains or losses from investment and foreign currency transactions, and changes in unrealized appreciation or depreciation of investments and foreign currency-denominated assets and liabilities. The Fund will realize a gain (or loss) when it sells its position in a particular security. A change in unrealized gain (or loss) refers to the change in net appreciation or depreciation of the Fund during the reporting period. “Net Realized and Unrealized Gain/(Loss) on Investments” is affected both by changes in the market value of Fund holdings and by gains (or losses) realized during the reporting period.
Statements of Changes in Net Assets
These statements report the increase or decrease in the Fund’s net assets during the reporting period. Changes in the Fund’s net assets are attributable to investment operations, dividends and distributions to investors, and capital share transactions. This is important to investors because it shows exactly what caused the Fund’s net asset size to change during the period.
The first section summarizes the information from the Statement of Operations regarding changes in net assets due to the Fund’s investment operations. The Fund’s net assets may also change as a result of dividend and capital gains distributions to investors. If investors receive their dividends and/or distributions in cash, money is taken out of the Fund to pay the dividend and/or distribution. If investors reinvest their dividends and/or distributions, the Fund’s net assets will not be affected. If you compare the Fund’s “Net Decrease from Dividends and Distributions” to “Reinvested Dividends and Distributions,” you will notice that dividends and distributions have little effect on the Fund’s net assets. This is because the majority of the Fund’s investors reinvest their dividends and/or distributions.
The reinvestment of dividends and distributions is included under “Capital Share Transactions.” “Capital Shares” refers to the money investors contribute to the Fund through purchases or withdrawals via redemptions. The Fund’s net assets will increase and decrease in value as investors purchase and redeem shares from the Fund.
Financial Highlights
This schedule provides a per-share breakdown of the components that affect the Fund’s NAV for current and past reporting periods as well as total return, asset size, ratios, and portfolio turnover rate.
The first line in the table reflects the NAV per share at the beginning of the reporting period. The next line reports the net investment income/(loss) per share. Following is the per share total of net gains/(losses), realized and unrealized. Per share dividends and distributions to investors are then subtracted to arrive at the NAV per share at the end of the period. The next line reflects the total return for the period. Also included are ratios of expenses and net investment income to average net assets.
Janus Emerging Markets Fund
Useful Information About Your Fund Report (unaudited)
The Fund’s expenses may be reduced through expense offsets and expense reimbursements. The ratios shown reflect expenses before and after any such offsets and reimbursements.
The ratio of net investment income/(loss) summarizes the income earned less expenses, divided by the average net assets of the Fund during the reporting period. Do not confuse this ratio with the Fund’s yield. The net investment income ratio is not a true measure of the Fund’s yield because it does not take into account the dividends distributed to the Fund’s investors.
The next figure is the portfolio turnover rate, which measures the buying and selling activity in the Fund. Portfolio turnover is affected by market conditions, changes in the asset size of the Fund, fluctuating volume of shareholder purchase and redemption orders, the nature of the Fund’s investments, and the investment style and/or outlook of the portfolio manager(s) and/or investment personnel. A 100% rate implies that an amount equal to the value of the entire portfolio was replaced once during the fiscal year; a 50% rate means that an amount equal to the value of half the portfolio is traded in a year; and a 200% rate means that an amount equal to the value of the entire portfolio is traded every six months.
Janus provides access to a wide range of investment disciplines.
Alternative
Janus alternative funds seek to deliver strong risk-adjusted returns over a full market cycle with lower correlation to equity markets than traditional investments.
Asset Allocation
Janus’ asset allocation funds utilize our fundamental, bottom-up research to balance risk over the long term. From fund options that meet investors’ risk tolerance and objectives to a method that incorporates non-traditional investment choices to seek non-correlated sources of risk and return, Janus’ asset allocation funds aim to allocate risk more effectively.
Fixed Income
Janus fixed income funds attempt to provide less risk relative to equities while seeking to deliver a competitive total return through high current income and appreciation. Janus money market funds seek capital preservation and liquidity with current income as a secondary objective.
Global & International
Janus global and international funds seek to leverage Janus’ research capabilities by taking advantage of inefficiencies in foreign markets, where accurate information and analytical insight are often at a premium.
Growth & Core
Janus growth funds focus on companies believed to be the leaders in their respective industries, with solid management teams, expanding market share, margins and efficiencies. Janus core funds seek investments in more stable and predictable companies. Our core funds look for a strategic combination of steady growth and, for certain funds, some degree of income.
Mathematical
Our mathematical funds seek to outperform their respective indices while maintaining a risk profile equal to or lower than the index itself. Managed by INTECH® (a Janus subsidiary), these funds use a mathematical process in an attempt to build a more “efficient” portfolio than the index.
Value
Our value funds, managed by Perkins® (a Janus subsidiary), seek to identify companies with favorable reward to risk characteristics by conducting rigorous downside analysis before determining upside potential.
For more information about our funds, contact your investment professional or go to janus.com/advisor/mutual-funds (or janus.com/allfunds if you hold Shares directly with Janus).
| | | | | | | | | | | | | |
| | | | | |

| | | | |
| | | | | |
Please consider the charges, risks, expenses and investment objectives carefully before investing. For a prospectus or, if available, a summary prospectus containing this and other information, please call Janus at 877.33JANUS (52687) (or 800.525.3713 if you hold Shares directly with Janus); or download the file from janus.com/info (or janus.com/reports if you hold Shares directly with Janus). Read it carefully before you invest or send money. |
Janus, INTECH and Perkins are registered trademarks of Janus International Holding LLC. © Janus International Holding LLC. Funds distributed by Janus Distributors LLC |
Investment products offered are: | NOT FDIC-INSURED | MAY LOSE VALUE | NO BANK GUARANTEE | |
C-0516-1628 | | | | 125-24-93039 05-16 |
| | | | |
| | | |
| | | SEMIANNUAL REPORT March 31, 2016 |
| | |
| | Janus Enterprise Fund |
| | |
| | Janus Investment Fund |
| | | |
| | | HIGHLIGHTS · Portfolio management perspective · Investment strategy behind your fund · Fund performance, characteristics
and holdings |
| | | |
| | | 
|
Table of Contents
Janus Enterprise Fund
| | |
Management Commentary and Schedule of Investments | 1 |
Notes to Schedule of Investments and Other Information | 12 |
Statement of Assets and Liabilities | 14 |
Statement of Operations | 16 |
Statements of Changes in Net Assets | 17 |
Financial Highlights | 18 |
Notes to Financial Statements | 22 |
Additional Information | 36 |
Useful Information About Your Fund Report | 48 |
Janus Enterprise Fund (unaudited)
| | | | | | |
FUND SNAPSHOT We believe that investing in companies with sustainable growth and high return on invested capital can drive consistent returns and allow us to outperform our benchmark and peers over time with moderate risk. We seek to identify mid-cap companies with high-quality management teams that wisely allocate capital to fund and drive growth over time. | | | | | 
Brian Demain portfolio manager |
| | | |
PERFORMANCE OVERVIEW
Janus Enterprise Fund’s Class T Shares returned 7.71% over the six-month period ended March 31, 2016. The Fund’s benchmark, the Russell Midcap Growth Index, returned 4.72%.
INVESTMENT ENVIRONMENT
U.S. indices rallied early in the period, continuing their recovery from the summer sell-off. Volatility returned in November as corporate earnings, in aggregate, were subdued and manufacturing data weighed on sentiment. Monetary policy again influenced markets in December as the Federal Reserve (Fed) raised interest rates for the first time in nearly a decade. Weak manufacturing data and an underwhelming holiday shopping season caused some to question whether the U.S. economy was sufficiently healthy to merit the cadence of rate hikes that the Fed had projected. As the calendar turned to 2016, worries re-emerged about the trajectory of the global economy. Crude oil prices resumed their slide, dropping to levels not seen in over a decade. Stocks also fell, once again entering correction territory. However, stocks rallied again toward the end of the period as investors began to price in the expectation that the Fed would lower its expected rate hike trajectory.
PERFORMANCE DISCUSSION
The Fund outperformed its benchmark, the Russell Midcap Growth Index, for the period. Our Fund tends to emphasize companies that we believe have more predictable business models, recurring revenue streams and strong competitive positioning that allows them to take market share and experience sustainable long-term growth. As part of our focus on companies with more sustainable growth profiles, we also tend to favor companies that have strong free cash flow growth and high levels of return on invested capital. In an environment in which the market questioned the ability of some companies to carry out growth initiatives without access to cheap debt markets, the Fund’s focus on these companies with more durable growth profiles added to our relative performance.
Our performance this period was driven by strong results from a number of companies in our portfolio. Semiconductor company KLA-Tencor was our top contributor to performance. The stock was up after it was announced early in the period that KLA-Tencor would be acquired by Lam Research Corp. We were not surprised to see KLA-Tencor become an acquisition target. In our view, the company is a leader in the production of metrology and inspection equipment that is used by semiconductor manufacturers. That equipment is in increasing demand as semiconductor manufacturers keep making semiconductors smaller and smaller. We believe KLA’s business likely will be a good complement to Lam Research, which supplies wafer fabrication equipment to semiconductor manufacturers.
Lamar Advertising, which has an extensive network of billboards, was also a leading contributor. We like the company’s growth potential as it uses more digital billboards, which allow it to display more advertisements on each sign. We also like that outdoor billboard advertisements are more insulated from the transition of traditional media advertising spending to digital media.
Another top contributor during the period was Henry Schein, the leading office based distributor for dental, veterinary and medical supplies on a global basis. Henry Schein participates in markets that are generally gross domestic product (GDP) plus growers and they get an additional growth kicker by taking share from small competitors. Henry Schein’s size and scale allow it to offer competitive pricing to customers while earning higher margins and returns than competitors through better fixed cost leverage and procurement. This scale advantage and long term growth record has resulted in strong free-cash-flow generation and high returns on invested capital over a multi-year period.
Janus Enterprise Fund (unaudited)
While generally pleased with our performance during the period, we did hold some stocks that had disappointing results. LPL Financial was our largest detractor from performance. We originally initiated our investment in LPL as we see more financial advisors leaving wire-houses and moving to independent broker dealers and registered investment advisors. As the largest platform for independent advisors in the U.S., LPL has benefited from this trend. The firm is also well positioned to gain from the shift to an environment of rising interest rates, which we expect will boost earnings related to cash held on customers’ balance sheets.
LPL’s share price suffered during the period due to a range of factors. First, the firm has faced compliance difficulties and fines associated with its out-of-date operational technology systems. Though the company is spending to get its systems up to speed, progress has been slow. Secondly, the firm initiated a stock buy-back in the fourth quarter of 2015, just ahead of the market downturn. Finally, LPL is grappling with regulatory concerns related to certain parts of its business model, as well as declining revenues linked to certain commissions-based products that have become out of favor. Going forward, LPL faces significant pressure to deliver on its margin goals. In its favor is the fact that the company has a high level of discretionary expenses that could be cut to manage its bottom line. We believe our expectations for the stock are appropriately set.
Sensata Technologies, a producer of sensors and controls used in automotive, appliance, aircraft and industrial manufacturing, also detracted. Sensata’s share price fell at the beginning of 2016, along with other industrial companies with exposure to the automobile market, following the release of data that showed slowing auto sales. In addition, Sensata had lower than expected earnings for the fourth quarter of 2015, driven by weakness in its sensors and controls business, which is closely linked to consumer electronics. Sensata’s highly leveraged balance sheet has also remained a concern among investors.
Once valued as a growth stock, Sensata is now valued more like a cyclical company. Nevertheless, the company has demonstrated its ability to grow through full market cycles, and we believe is poised to continue that record. We expect moderate growth to continue at Sensata, with high returns on capital in the months ahead. For these reasons, we continue to hold our shares.
Endo International also detracted. The stock declined during the fourth quarter of 2015 on the company’s announcement of a write-down of an acquisition completed earlier this year. Investor concerns also arose over the purchase price Endo paid for Par Pharmaceutical in September, with the conclusion being that Endo overpaid for the acquisition. We sold our shares in Endo during the fourth quarter of 2015 due to concerns about the company’s ability to successfully generate value through its strategy of acquiring other pharmaceutical companies.
Please see the Derivative Instruments section in the “Notes to Financial Statements” for derivatives used by the Fund.
OUTLOOK
In the months ahead, we expect heightened volatility to continue, driven by uncertainty in the political environment and global geopolitical arena. During times of heightened uncertainty, a company’s financial strength becomes that much more important, especially in an environment like today’s where interest rates are expected to edge higher and the cost of capital is on the rise.
We will continue to pursue investment opportunities for the Fund on a stock by stock basis, staying focused on companies with strategic competitive advantages, reasonable valuations, strong balance sheets, and durable growth prospects.
Thank you for your investment in Janus Enterprise Fund.
Janus Enterprise Fund (unaudited)
Fund At A Glance
March 31, 2016
| | | | | | | |
| | | | | | | |
| | | | | | | |
| | | | | | | |
| | 5 Top Performers - Holdings | | | | 5 Bottom Performers - Holdings | |
| | | | Contribution | | | Contribution |
| | KLA-Tencor Corp. | | 0.50% | | LPL Financial Holdings, Inc. | -0.58% |
| | Lamar Advertising Co. - Class A | | 0.49% | | Sensata Technologies Holding NV | -0.34% |
| | Henry Schein, Inc. | | 0.48% | | Endo International PLC | -0.30% |
| | Crown Castle International Corp. | | 0.42% | | Wolverine World Wide, Inc. | -0.18% |
| | Jack Henry & Associates, Inc. | | 0.40% | | Polaris Industries, Inc. | -0.13% |
| | | | | | | |
| | 5 Top Performers - Sectors* | | | | | |
| | | | | | Fund Weighting | Russell Midcap® Growth Index |
| | | | Fund Contribution | | (Average % of Equity) | Weighting |
| | Information Technology | | 2.48% | | 31.59% | 19.69% |
| | Health Care | | 1.79% | | 16.66% | 13.05% |
| | Financials | | 0.45% | | 13.58% | 11.93% |
| | Consumer Discretionary | | 0.32% | | 10.88% | 24.76% |
| | Energy | | 0.26% | | 0.80% | 0.77% |
| | | | | | | |
| | 5 Bottom Performers - Sectors* | | | | | |
| | | | | | Fund Weighting | Russell Midcap® Growth Index |
| | | | Fund Contribution | | (Average % of Equity) | Weighting |
| | Industrials | | -0.68% | | 19.05% | 15.87% |
| | Consumer Staples | | -0.57% | | 1.00% | 8.43% |
| | Materials | | -0.38% | | 1.14% | 5.01% |
| | Other** | | -0.13% | | 5.30% | 0.00% |
| | Utilities | | -0.02% | | 0.00% | 0.10% |
| | | | | | | |
| | Security contribution to performance is measured by using an algorithm that multiplies the daily performance of each security with the previous day’s ending weight in the portfolio and is gross of advisory fees. Fixed income securities and certain equity securities, such as private placements and some share classes of equity securities, are excluded. |
* | Based on sector classification according to the Global Industry Classification Standard (“GICS”) codes, which are the exclusive property and a service mark of MSCI Inc. and Standard & Poor’s. |
** | Not a GICS classified sector. | | | | | |
Janus Enterprise Fund (unaudited)
Fund At A Glance
March 31, 2016
| | |
5 Largest Equity Holdings - (% of Net Assets) |
Crown Castle International Corp. | |
Real Estate Investment Trusts (REITs) | 3.1% |
Sensata Technologies Holding NV | |
Electrical Equipment | 2.6% |
Verisk Analytics, Inc. | |
Professional Services | 2.6% |
Lamar Advertising Co. - Class A | |
Real Estate Investment Trusts (REITs) | 2.5% |
Amdocs, Ltd. (U.S. Shares) | |
Information Technology Services | 2.1% |
| | 12.9% |
| | | | | | |
Asset Allocation - (% of Net Assets) |
Common Stocks | | 95.1% |
Investment Companies | | 12.9% |
Other | | (8.0)% |
| | | 100.0% |
| | |
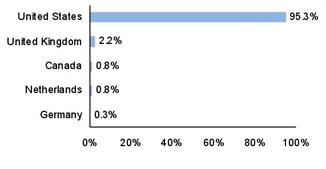
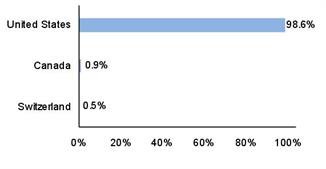
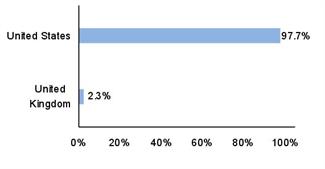
Top Country Allocations - Long Positions - (% of Investment Securities) |
As of March 31, 2016 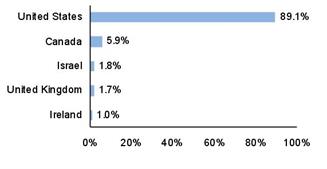
| As of September 30, 2015 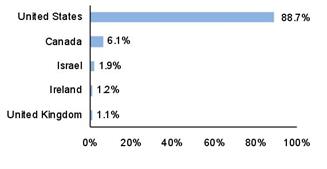
|
Janus Enterprise Fund (unaudited)
Performance
| |
See important disclosures on the next page. |

| | | | | | | | | | | |
| | | | | | | | | | |
| | | | | | | | | | | Expense Ratios - |
Average Annual Total Return - for the periods ended March 31, 2016 | | | per the January 28, 2016 prospectuses |
| | Fiscal
Year-to-Date | One
Year | Five
Year | Ten
Year | Since
Inception* | | | Total Annual Fund
Operating Expenses |
Class A Shares at NAV | | 7.60% | -1.01% | 10.77% | 8.72% | 10.41% | | | 1.14% |
Class A Shares at MOP | | 1.41% | -6.71% | 9.46% | 8.08% | 10.13% | | | |
Class C Shares at NAV | | 7.25% | -1.66% | 9.99% | 7.89% | 9.62% | | | 1.78% |
Class C Shares at CDSC | | 6.25% | -2.61% | 9.99% | 7.89% | 9.62% | | | |
Class D Shares(1) | | 7.76% | -0.74% | 11.06% | 8.93% | 10.53% | | | 0.84% |
Class I Shares | | 7.79% | -0.65% | 11.16% | 8.88% | 10.51% | | | 0.74% |
Class N Shares | | 7.83% | -0.57% | 10.98% | 8.88% | 10.51% | | | 0.67% |
Class R Shares | | 7.44% | -1.31% | 10.42% | 8.32% | 10.02% | | | 1.42% |
Class S Shares | | 7.58% | -1.07% | 10.71% | 8.60% | 10.28% | | | 1.17% |
Class T Shares | | 7.71% | -0.81% | 10.98% | 8.88% | 10.51% | | | 0.92% |
Russell Midcap® Growth Index | | 4.72% | -4.75% | 9.99% | 7.43% | 9.71% | | | |
Morningstar Quartile - Class T Shares | | - | 1st | 1st | 1st | 2nd | | | |
Morningstar Ranking - based on total returns for Mid-Cap Growth Funds | | - | 52/736 | 50/672 | 36/616 | 47/160 | | | |
Returns quoted are past performance and do not guarantee future results; current performance may be lower or higher. Investment returns and principal value will vary; there may be a gain or loss when shares are sold. For the most recent month-end performance call 877.33JANUS(52687) (or 800.525.3713 if you hold shares directly with Janus Capital) or visit janus.com/advisor/mutual-funds (or janus.com/allfunds if you hold shares directly with Janus Capital).
Maximum Offering Price (MOP) returns include the maximum sales charge of 5.75%. Net Asset Value (NAV) returns exclude this charge, which would have reduced returns.
CDSC returns include a 1% contingent deferred sales charge (CDSC) on Shares redeemed within 12 months of purchase. Net Asset Value (NAV) returns exclude this charge, which would have reduced returns.
Janus Enterprise Fund (unaudited)
Performance
A Fund’s performance may be affected by risks that include those associated with nondiversification, non-investment grade debt securities, high-yield/high-risk securities, undervalued or overlooked companies, investments in specific industries or countries and potential conflicts of interest. Additional risks to a Fund may also include, but are not limited to, those associated with investing in foreign securities, emerging markets, initial public offerings, real estate investment trusts (REITs), derivatives, short sales, commodity-linked investments and companies with relatively small market capitalizations. Each Fund has different risks. Please see a Janus prospectus for more information about risks, Fund holdings and other details.
Foreign securities are subject to additional risks including currency fluctuations, political and economic uncertainty, increased volatility, lower liquidity and differing financial and information reporting standards, all of which are magnified in emerging markets.
Returns include reinvestment of all dividends and distributions and do not reflect the deduction of taxes that a shareholder would pay on Fund distributions or redemptions of Fund shares. The returns do not include adjustments in accordance with generally accepted accounting principles required at the period end for financial reporting purposes.
See Financial Highlights for actual expense ratios during the reporting period.
Class A Shares, Class C Shares, Class R Shares, and Class S Shares commenced operations on July 6, 2009. Performance shown for each class for periods prior to July 6, 2009, reflects the performance of the Fund’s Class J Shares, the initial share class (renamed Class T Shares effective February 16, 2010), calculated using the fees and expenses of each respective class, without the effect of any fee and expense limitations or waivers.
Class D Shares commenced operations on February 16, 2010. Performance shown for periods prior to February 16, 2010, reflects the performance of the Fund’s former Class J Shares, calculated using the fees and expenses in effect during the periods shown, net of any applicable fee and expense limitations or waivers.
Class I Shares commenced operations on July 6, 2009. Performance shown for periods prior to July 6, 2009, reflects the performance of the Fund’s former Class J Shares, calculated using the fees and expenses of Class J Shares, net of any applicable fee and expense limitations or waivers.
Class N Shares commenced operations on July 12, 2012. Performance shown for periods prior to July 12, 2012, reflects the performance of the Fund's Class T Shares, calculated using the fees and expenses of Class T Shares, net of any applicable fee and expense limitations or waivers.
If each share class of the Fund had been available during periods prior to its commencement, the performance shown may have been different. The performance shown for periods following the Fund’s commencement of each share class reflects the fees and expenses of each respective share class, net of any applicable fee and expense limitations or waivers. Please refer to the Fund’s prospectuses for further details concerning historical performance.
Ranking is for the share class shown only; other classes may have different performance characteristics. When an expense waiver is in effect, it may have a material effect on the total return, and therefore the ranking for the period.
© 2016 Morningstar, Inc. All Rights Reserved.
There is no assurance that the investment process will consistently lead to successful investing.
See Notes to Schedule of Investments and Other Information for index definitions.
A Fund’s portfolio may differ significantly from the securities held in an index. An index is unmanaged and not available for direct investment; therefore, its performance does not reflect the expenses associated with the active management of an actual portfolio.
See “Useful Information About Your Fund Report.”
*The Fund’s inception date – September 1, 1992
(1) Closed to certain new investors.
Janus Enterprise Fund (unaudited)
Expense Examples
As a shareholder of the Fund, you incur two types of costs: (1) transaction costs, such as sales charges (loads) on purchase payments (applicable to Class A Shares only); and (2) ongoing costs, including management fees; 12b-1 distribution and shareholder servicing fees; transfer agent fees and expenses payable pursuant to the Transfer Agency Agreement; and other Fund expenses. This example is intended to help you understand your ongoing costs (in dollars) of investing in the Fund and to compare these costs with the ongoing costs of investing in other mutual funds. To do so, compare this 5% hypothetical example with the 5% hypothetical examples that appear in the shareholder reports of the other funds. The example is based upon an investment of $1,000 invested at the beginning of the period and held for the six-months indicated, unless noted otherwise in the table and footnotes below.
Actual Expenses
The information in the table under the heading “Actual” provides information about actual account values and actual expenses. You may use the information in these columns, together with the amount you invested, to estimate the expenses that you paid over the period. Simply divide your account value by $1,000 (for example, an $8,600 account value divided by $1,000 = 8.6), then multiply the result by the number in the appropriate column for your share class under the heading entitled “Expenses Paid During Period” to estimate the expenses you paid on your account during the period.
Hypothetical Example for Comparison Purposes
The information in the table under the heading “Hypothetical (5% return before expenses)” provides information about hypothetical account values and hypothetical expenses based upon the Fund’s actual expense ratio and an assumed rate of return of 5% per year before expenses, which is not the Fund’s actual return. The hypothetical account values and expenses may not be used to estimate the actual ending account balance or expenses you paid for the period. You may use this information to compare the ongoing costs of investing in the Fund and other funds. To do so, compare this 5% hypothetical example with the 5% hypothetical examples that appear in the shareholder reports of the other funds. Additionally, for an analysis of the fees associated with an investment in any share class or other similar funds, please visit www.finra.org/fundanalyzer.
Please note that the expenses shown in the table are meant to highlight your ongoing costs only and do not reflect any transaction costs. These fees are fully described in the Fund’s prospectuses. Therefore, the hypothetical examples are useful in comparing ongoing costs only, and will not help you determine the relative total costs of owning different funds. In addition, if these transaction costs were included, your costs would have been higher.
| | | | | | | | | | | |
| | | | | | | | | |
| | | | Actual | | Hypothetical
(5% return before expenses) | |
| Beginning
Account
Value
(10/1/15) | Ending
Account
Value
(3/31/16) | Expenses
Paid During
Period
(10/1/15 - 3/31/16)† | | Beginning
Account
Value
(10/1/15) | Ending
Account
Value
(3/31/16) | Expenses
Paid During
Period
(10/1/15 - 3/31/16)† | Net Annualized
Expense Ratio
(10/1/15 - 3/31/16) |
Class A Shares | $1,000.00 | $1,076.00 | $5.92 | | $1,000.00 | $1,019.30 | $5.76 | 1.14% |
Class C Shares | $1,000.00 | $1,072.50 | $9.33 | | $1,000.00 | $1,016.00 | $9.07 | 1.80% |
Class D Shares | $1,000.00 | $1,077.60 | $4.36 | | $1,000.00 | $1,020.80 | $4.24 | 0.84% |
Class I Shares | $1,000.00 | $1,077.90 | $4.00 | | $1,000.00 | $1,021.15 | $3.89 | 0.77% |
Class N Shares | $1,000.00 | $1,078.30 | $3.48 | | $1,000.00 | $1,021.65 | $3.39 | 0.67% |
Class R Shares | $1,000.00 | $1,074.40 | $7.36 | | $1,000.00 | $1,017.90 | $7.16 | 1.42% |
Class S Shares | $1,000.00 | $1,075.80 | $6.07 | | $1,000.00 | $1,019.15 | $5.91 | 1.17% |
Class T Shares | $1,000.00 | $1,077.10 | $4.78 | | $1,000.00 | $1,020.40 | $4.65 | 0.92% |
† | Expenses Paid During Period are equal to the Net Annualized Expense Ratio multiplied by the average account value over the period, multiplied by 183/366 (to reflect the one-half year period). Expenses in the examples include the effect of applicable fee waivers and/or expense reimbursements, if any. Had such waivers and/or reimbursements not been in effect, your expenses would have been higher. Please refer to the Notes to Financial Statements or the Fund’s prospectuses for more information regarding waivers and/or reimbursements. |
Janus Enterprise Fund
Schedule of Investments (unaudited)
March 31, 2016
| | | | | | | | |
Shares
| | | Value | |
Common Stocks – 95.1% | | | |
Aerospace & Defense – 2.2% | | | |
| | HEICO Corp. - Class A | | 903,513 | | | $43,007,219 | |
| | Teledyne Technologies, Inc.* | | 933,067 | | | 82,240,525 | |
| | TransDigm Group, Inc.*,# | | 161,765 | | | 35,643,300 | |
| | | 160,891,044 | |
Air Freight & Logistics – 1.3% | | | |
| | Expeditors International of Washington, Inc.# | | 1,976,829 | | | 96,489,023 | |
Airlines – 1.0% | | | |
| | Ryanair Holdings PLC (ADR) | | 881,324 | | | 75,635,226 | |
Biotechnology – 2.7% | | | |
| | AbbVie, Inc. | | 497,534 | | | 28,419,142 | |
| | Celgene Corp.*,† | | 863,429 | | | 86,420,609 | |
| | Medivation, Inc.* | | 1,839,912 | | | 84,599,154 | |
| | | 199,438,905 | |
Building Products – 0.6% | | | |
| | AO Smith Corp. | | 622,356 | | | 47,491,986 | |
Capital Markets – 2.5% | | | |
| | LPL Financial Holdings, Inc.# | | 2,512,177 | | | 62,301,990 | |
| | TD Ameritrade Holding Corp. | | 3,781,716 | | | 119,237,505 | |
| | | 181,539,495 | |
Chemicals – 0.4% | | | |
| | Potash Corp. of Saskatchewan, Inc. (U.S. Shares) | | 1,920,011 | | | 32,678,587 | |
Commercial Services & Supplies – 2.3% | | | |
| | Edenred# | | 2,164,709 | | | 42,039,640 | |
| | Ritchie Bros Auctioneers, Inc. (U.S. Shares)† | | 4,696,766 | | | 127,188,423 | |
| | | 169,228,063 | |
Containers & Packaging – 0.8% | | | |
| | Sealed Air Corp. | | 1,176,459 | | | 56,481,797 | |
Diversified Consumer Services – 1.2% | | | |
| | ServiceMaster Global Holdings, Inc.* | | 2,286,046 | | | 86,138,213 | |
Diversified Financial Services – 3.3% | | | |
| | FactSet Research Systems, Inc. | | 172,635 | | | 26,159,382 | |
| | Markit, Ltd.*,# | | 3,002,941 | | | 106,153,964 | |
| | MSCI, Inc. | | 1,459,402 | | | 108,112,500 | |
| | | 240,425,846 | |
Electrical Equipment – 3.3% | | | |
| | AMETEK, Inc. | | 986,751 | | | 49,317,815 | |
| | Sensata Technologies Holding NV* | | 5,004,909 | | | 194,390,666 | |
| | | 243,708,481 | |
Electronic Equipment, Instruments & Components – 5.8% | | | |
| | Amphenol Corp. - Class A | | 1,334,772 | | | 77,176,517 | |
| | Belden, Inc. | | 1,192,310 | | | 73,183,988 | |
| | Flextronics International, Ltd.* | | 7,386,063 | | | 89,075,920 | |
| | National Instruments Corp.# | | 2,747,143 | | | 82,716,476 | |
| | TE Connectivity, Ltd. (U.S. Shares) | | 1,674,153 | | | 103,663,554 | |
| | | 425,816,455 | |
Food Products – 0.9% | | | |
| | Mead Johnson Nutrition Co. | | 825,531 | | | 70,145,369 | |
Health Care Equipment & Supplies – 6.7% | | | |
| | Boston Scientific Corp.* | | 7,851,452 | | | 147,685,812 | |
| | Masimo Corp.* | | 870,802 | | | 36,434,356 | |
| | STERIS PLC | | 563,905 | | | 40,065,450 | |
| | Teleflex, Inc.# | | 774,025 | | | 121,529,665 | |
| | Varian Medical Systems, Inc.*,# | | 1,839,446 | | | 147,192,469 | |
| | | 492,907,752 | |
Health Care Providers & Services – 1.7% | | | |
| | Henry Schein, Inc.*,† | | 728,487 | | | 125,758,711 | |
Health Care Technology – 2.1% | | | |
| | athenahealth, Inc.*,# | | 696,508 | | | 96,661,380 | |
| | |
See Notes to Schedule of Investments and Other Information and Notes to Financial Statements. |
| |
8 | MARCH 31, 2016 |
Janus Enterprise Fund
Schedule of Investments (unaudited)
March 31, 2016
| | | | | | | | |
Shares
| | | Value | |
Common Stocks – (continued) | | | |
Health Care Technology – (continued) | | | |
| | IMS Health Holdings, Inc.* | | 2,271,880 | | | $60,318,414 | |
| | | 156,979,794 | |
Hotels, Restaurants & Leisure – 2.2% | | | |
| | Aramark | | 1,167,484 | | | 38,667,070 | |
| | Dunkin' Brands Group, Inc.# | | 2,586,422 | | | 122,001,526 | |
| | | 160,668,596 | |
Industrial Conglomerates – 0.9% | | | |
| | Roper Industries, Inc. | | 344,960 | | | 63,048,339 | |
Information Technology Services – 10.5% | | | |
| | Amdocs, Ltd. (U.S. Shares) | | 2,581,679 | | | 155,985,045 | |
| | Broadridge Financial Solutions, Inc. | | 2,216,905 | | | 131,484,636 | |
| | Fidelity National Information Services, Inc. | | 1,419,575 | | | 89,873,293 | |
| | Gartner, Inc.* | | 744,155 | | | 66,490,249 | |
| | Global Payments, Inc. | | 1,218,326 | | | 79,556,688 | |
| | Jack Henry & Associates, Inc. | | 1,544,084 | | | 130,583,184 | |
| | WEX, Inc.*,# | | 1,455,812 | | | 121,356,488 | |
| | | 775,329,583 | |
Insurance – 1.8% | | | |
| | Aon PLC | | 1,289,437 | | | 134,681,695 | |
Internet Software & Services – 2.6% | | | |
| | Cimpress NV*,# | | 1,034,246 | | | 93,795,770 | |
| | CoStar Group, Inc.*,# | | 523,965 | | | 98,594,494 | |
| | | 192,390,264 | |
Leisure Products – 0.6% | | | |
| | Polaris Industries, Inc.# | | 426,761 | | | 42,027,423 | |
Life Sciences Tools & Services – 3.7% | | | |
| | Bio-Techne Corp. | | 332,010 | | | 31,381,585 | |
| | Mettler-Toledo International, Inc.* | | 83,705 | | | 28,858,136 | |
| | PerkinElmer, Inc. | | 2,651,733 | | | 131,154,714 | |
| | Waters Corp.* | | 599,958 | | | 79,146,459 | |
| | | 270,540,894 | |
Machinery – 2.3% | | | |
| | Middleby Corp.*,# | | 552,743 | | | 59,016,370 | |
| | Rexnord Corp.*,† | | 3,904,927 | | | 78,957,624 | |
| | Wabtec Corp.# | | 420,064 | | | 33,306,875 | |
| | | 171,280,869 | |
Media – 1.5% | | | |
| | Omnicom Group, Inc.# | | 1,349,054 | | | 112,281,764 | |
Multiline Retail – 1.1% | | | |
| | Dollar General Corp. | | 526,813 | | | 45,095,193 | |
| | Dollar Tree, Inc.* | | 468,746 | | | 38,652,795 | |
| | | 83,747,988 | |
Oil, Gas & Consumable Fuels – 0.6% | | | |
| | World Fuel Services Corp. | | 894,025 | | | 43,431,735 | |
Professional Services – 2.6% | | | |
| | Verisk Analytics, Inc.*,# | | 2,373,526 | | | 189,692,198 | |
Real Estate Investment Trusts (REITs) – 5.6% | | | |
| | Crown Castle International Corp. | | 2,612,278 | | | 225,962,047 | |
| | Lamar Advertising Co. - Class A | | 3,045,705 | | | 187,310,858 | |
| | | 413,272,905 | |
Road & Rail – 0.8% | | | |
| | Canadian Pacific Railway, Ltd. (U.S. Shares) | | 467,277 | | | 62,002,985 | |
Semiconductor & Semiconductor Equipment – 6.0% | | | |
| | Atmel Corp. | | 6,301,764 | | | 51,170,324 | |
| | KLA-Tencor Corp. | | 1,243,170 | | | 90,515,208 | |
| | Lam Research Corp.# | | 850,320 | | | 70,236,432 | |
| | Microchip Technology, Inc.# | | 1,331,796 | | | 64,192,567 | |
| | ON Semiconductor Corp.* | | 7,326,543 | | | 70,261,547 | |
| | |
See Notes to Schedule of Investments and Other Information and Notes to Financial Statements. |
| |
Janus Investment Fund | 9 |
Janus Enterprise Fund
Schedule of Investments (unaudited)
March 31, 2016
| | | | | | | | | |
Shares
| | | Value | |
Common Stocks – (continued) | | | |
Semiconductor & Semiconductor Equipment – (continued) | | | |
| | Xilinx, Inc. | | 2,071,340 | | | $98,243,656 | |
| | | 444,619,734 | |
Software – 8.5% | | | |
| | Apptio, Inc.*,§ | | 181,903 | | | 4,128,216 | |
| | Atlassian Corp PLC - Class A* | | 1,236,369 | | | 31,094,680 | |
| | Cadence Design Systems, Inc.* | | 5,185,404 | | | 122,271,826 | |
| | Constellation Software, Inc. | | 273,917 | | | 112,171,817 | |
| | Intuit, Inc. | | 954,670 | | | 99,295,227 | |
| | NICE Systems, Ltd. (ADR)# | | 2,269,298 | | | 147,027,817 | |
| | SS&C Technologies Holdings, Inc.# | | 1,753,656 | | | 111,216,864 | |
| | | 627,206,447 | |
Specialty Retail – 1.0% | | | |
| | Monro Muffler Brake, Inc.# | | 323,388 | | | 23,112,540 | |
| | Williams-Sonoma, Inc. | | 885,643 | | | 48,480,098 | |
| | | 71,592,638 | |
Textiles, Apparel & Luxury Goods – 3.5% | | | |
| | Carter's, Inc. | | 609,600 | | | 64,239,648 | |
| | Gildan Activewear, Inc. | | 4,355,395 | | | 132,883,101 | |
| | Wolverine World Wide, Inc. | | 3,224,442 | | | 59,394,222 | |
| | | 256,516,971 | |
Trading Companies & Distributors – 0.5% | | | |
| | Fastenal Co.# | | 735,087 | | | 36,019,263 | |
Total Common Stocks (cost $5,462,844,876) | | 7,012,107,038 | |
Investment Companies – 12.9% | | | |
Investments Purchased with Cash Collateral from Securities Lending – 7.2% | | | |
| | Janus Cash Collateral Fund LLC, 0.4107%ºº,£ | | 525,494,588 | | | 525,494,588 | |
Money Markets – 5.7% | | | |
| | Janus Cash Liquidity Fund LLC, 0.3874%ºº,£ | | 422,017,369 | | | 422,017,369 | |
Total Investment Companies (cost $947,511,957) | | 947,511,957 | |
Total Investments (total cost $6,410,356,833) – 108.0% | | 7,959,618,995 | |
Liabilities, net of Cash, Receivables and Other Assets – (8.0)% | | (587,739,950) | |
Net Assets – 100% | | $7,371,879,045 | |
| | | | | | |
Summary of Investments by Country - (Long Positions) (unaudited) |
| |
| | | | | % of Investment Securities | |
| | | | | |
Country | | Value | | |
United States | | $7,090,742,755 | | 89.1 | % |
Canada | | 466,924,913 | | 5.9 | |
Israel | | 147,027,817 | | 1.8 | |
United Kingdom | | 137,248,644 | | 1.7 | |
Ireland | | 75,635,226 | | 1.0 | |
France | | 42,039,640 | | 0.5 | |
| | | | | | |
| | | | | | |
Total | | $7,959,618,995 | | 100.0 | % |
| | |
See Notes to Schedule of Investments and Other Information and Notes to Financial Statements. |
| |
10 | MARCH 31, 2016 |
Janus Enterprise Fund
Schedule of Investments (unaudited)
March 31, 2016
| | | | | | | |
Schedule of Foreign Currency Contracts, Open | | | | | | |
| | | | | | | | | |
Counterparty/ Currency | Settlement Date | Currency Units Sold | | Currency Value | | Unrealized Appreciation/ (Depreciation) | |
Bank of America: | | | | | | | |
Euro | 4/14/16 | 10,500,000 | $ | 11,949,590 | $ | (293,014) | |
Citibank NA: | | | | | | | |
Canadian Dollar | 4/28/16 | 25,192,000 | | 19,400,250 | | (307,590) | |
Euro | 4/28/16 | 1,800,000 | | 2,049,410 | | 2,960 | |
Euro | 4/28/16 | 24,598,000 | | 28,006,333 | | (501,833) | |
| | | | | | | | |
| | | | | 49,455,993 | | (806,463) | |
Credit Suisse International: | | | | | | | |
Canadian Dollar | 5/12/16 | 5,317,000 | | 4,094,652 | | 5,915 | |
Euro | 5/12/16 | 1,100,000 | | 1,253,005 | | 522 | |
| | | | | | | | |
| | | | | 5,347,657 | | 6,437 | |
HSBC Securities (USA), Inc.: | | | | | | | |
Canadian Dollar | 4/28/16 | 20,168,000 | | 15,531,289 | | (246,213) | |
Euro | 4/28/16 | 18,300,000 | | 20,835,673 | | (358,028) | |
| | | | | | | | |
| | | | | 36,366,962 | | (604,241) | |
JPMorgan Chase & Co.: | | | | | | | |
Euro | 4/14/16 | 21,040,000 | | 23,944,701 | | (539,448) | |
RBC Capital Markets Corp.: | | | | | | | |
Canadian Dollar | 5/12/16 | 25,310,000 | | 19,491,374 | | 53,087 | |
Euro | 5/12/16 | 21,200,000 | | 24,148,817 | | 20,243 | |
| | | | | | | | |
| | | | | 43,640,191 | | 73,330 | |
Total | | | $ | 170,705,094 | $ | (2,163,399) | |
| | |
See Notes to Schedule of Investments and Other Information and Notes to Financial Statements. |
| |
Janus Investment Fund | 11 |
Janus Enterprise Fund
Notes to Schedule of Investments and Other Information (unaudited)
| | |
Russell Midcap® Growth Index | Measures the performance of those Russell Midcap® companies with higher price-to-book ratios and higher forecasted growth values. The stocks are also members of the Russell 1000® Growth Index. |
| | |
ADR | American Depositary Receipt |
LLC | Limited Liability Company |
PLC | Public Limited Company |
U.S. Shares | Securities of foreign companies trading on an American stock exchange. |
| | |
* | Non-income producing security. |
| | |
† | A portion of this security has been segregated to cover margin or segregation requirements on open futures contracts, forward currency contracts, options contracts, short sales, swap agreements, and/or securities with extended settlement dates, the value of which, as of March 31, 2016, is $148,312,938. |
| | |
ºº | Rate shown is the 7-day yield as of March 31, 2016. |
| | |
# | Loaned security; a portion of the security is on loan at March 31, 2016. |
| | |
£ | The Fund may invest in certain securities that are considered affiliated companies. As defined by the Investment Company Act of 1940, as amended, an affiliated company is one in which the Fund owns 5% or more of the outstanding voting securities, or a company which is under common ownership or control. The following securities were considered affiliated companies for all or some portion of the period ended March 31, 2016. Unless otherwise indicated, all information in the table is for the period ended March 31, 2016. |
| | | | | | | | | | | | | | | |
| | | Share | | | | | | Share | | | | | | |
| | | Balance | | | | | | Balance | | Realized | | Dividend | | Value |
| | | at 9/30/15 | | Purchases | | Sales | | at 3/31/16 | | Gain/(Loss) | | Income | | at 3/31/16 |
| | | | | | | | | | | | | | | |
Janus Cash Collateral Fund LLC | | 264,914,184 | | 1,038,663,560 | | (778,083,156) | | 525,494,588 | | $— | | $2,007,572(1) | | $525,494,588 |
Janus Cash Liquidity Fund LLC | | 336,826,661 | | 855,902,708 | | (770,712,000) | | 422,017,369 | | — | | 486,728 | | 422,017,369 |
| | | | | | | | | | | | | | | |
Total | | | | | | | | | | $— | | $2,494,300 | | $947,511,957 |
(1) Net of income paid to the securities lending agent and rebates paid to the borrowing counterparties. |
| | | | | | | | | | | |
§ | Schedule of Restricted and Illiquid Securities (as of March 31, 2016) |
| | | | | | | | Value as a | |
| | Acquisition | | | | | | % of Net | |
| | Date | | Cost | | Value | | Assets | |
Apptio, Inc. | 5/2/13 | $ | 4,128,216 | $ | 4,128,216 | | 0.1 | % |
| | | | | | | | | |
| | | | | | | | | |
The Fund has registration rights for certain restricted securities held as of March 31, 2016. The issuer incurs all registration costs. | |
Janus Enterprise Fund
Notes to Schedule of Investments and Other Information (unaudited)
| | | | |
The following is a summary of the inputs that were used to value the Fund's investments in securities and other financial instruments as of March 31, 2016. See Notes to Financial Statements for more information. |
Valuation Inputs Summary | | | |
| Level 1 -
Quoted Prices | Level 2 -
Other Significant
Observable Inputs | Level 3 -
Significant
Unobservable Inputs |
Assets | | | |
Investments in Securities: | | | |
Common Stocks | | | |
Software | $ 623,078,231 | $ - | $ 4,128,216 |
All Other | 6,384,900,591 | - | - |
Investment Companies | - | 947,511,957 | - |
Total Investments in Securities | $ 7,007,978,822 | $ 947,511,957 | $ 4,128,216 |
Other Financial Instruments(a): | | | |
Forward Currency Contracts | $ - | $ 82,727 | $ - |
Total Assets | $ 7,007,978,822 | $ 947,594,684 | $ 4,128,216 |
Liabilities | | | |
Other Financial Instruments(a): | | | |
Forward Currency Contracts | $ - | $ 2,246,126 | $ - |
(a) Other financial instruments include forward currency, futures, written options, and swap contracts. Forward currency contracts are reported at their unrealized appreciation/(depreciation) at measurement date, which represents the change in the contract's value from trade date. Futures are reported at their variation margin at measurement date, which represents the amount due to/from the Fund at that date. Options and swap contracts are reported at their market value at measurement date. |
Janus Enterprise Fund
Statement of Assets and Liabilities (unaudited)
March 31, 2016
| |
See footnotes at the end of the Statement. |
| | | | | | | |
| | | | | | |
Assets: | | | | |
| | Investments, at cost | | $ | 6,410,356,833 | |
| | Unaffiliated investments, at value |