UNITED STATES
SECURITIES AND EXCHANGE COMMISSION
Washington, D.C. 20549
FORM N-CSR
CERTIFIED SHAREHOLDER REPORT OF REGISTERED MANAGEMENT
INVESTMENT COMPANIES
Investment Company Act file number | 811-0523 | |||||
|
| |||||
| The Dreyfus Fund Incorporated |
| ||||
| (Exact name of Registrant as specified in charter) |
| ||||
|
|
| ||||
|
c/o The Dreyfus Corporation 200 Park Avenue New York, New York 10166 |
| ||||
| (Address of principal executive offices) (Zip code) |
| ||||
|
|
| ||||
| Michael A. Rosenberg, Esq. 200 Park Avenue New York, New York 10166 |
| ||||
| (Name and address of agent for service) |
| ||||
| ||||||
Registrant's telephone number, including area code: | (212) 922-6000 | |||||
|
| |||||
Date of fiscal year end:
| 12/31 |
| ||||
Date of reporting period: | 06/30/2010 |
| ||||
|
| The Dreyfus Fund |
| Incorporated |
| SEMIANNUAL | REPORT |
| June 30, 2010 |
Save time. Save paper. View your next shareholder report online as soon as it’s available. Log into www.dreyfus.com and sign up for Dreyfus eCommunications. It’s simple and only takes a few minutes.
The views expressed in this report reflect those of the portfolio manager only through the end of the period covered and do not necessarily represent the views of Dreyfus or any other person in the Dreyfus organization. Any such views are subject to change at any time based upon market or other conditions and Dreyfus disclaims any responsibility to update such views.These views may not be relied on as investment advice and, because investment decisions for a Dreyfus fund are based on numerous factors, may not be relied on as an indication of trading intent on behalf of any Dreyfus fund.

Contents | |
THE FUND | |
| 2 | A Letter from the Chairman and CEO |
| 3 | Discussion of Fund Performance |
| 6 | Understanding Your Fund’s Expenses |
| 6 | Comparing Your Fund’s Expenses With Those of Other Funds |
| 7 | Statement of Investments |
| 12 | Statement of Assets and Liabilities |
| 13 | Statement of Operations |
| 14 | Statement of Changes in Net Assets |
| 15 | Financial Highlights |
| 16 | Notes to Financial Statements |
FOR MORE INFORMATION | |
Back Cover |
The Dreyfus Fund
Incorporated
The Fund

A LETTER FROM THE CHAIRMAN AND CEO
Dear Shareholder:
We are pleased to present this semiannual report for The Dreyfus Fund Incorporated, covering the six-month period from January 1, 2010, through June 30, 2010.
After posting solid gains over the first quarter of 2010, stocks encountered renewed volatility in the second quarter, which caused most equity indices to erase their previous gains and end the reporting period lower than where they began. The second-quarter correction occurred despite positive GDP reports, as manufacturing activity improved and unemployment began to moderate in a recovery that has so far proved sustainable but milder than historical averages. Indeed, many of the headlines that have affected investors emanated from overseas markets, including the sovereign debt crisis in Europe and inflation fears in China.
Despite recent headlines about the current state of the U.S. economy, we still believe that it is unlikely that we’ll encounter a “double-dip” recession. Instead, we expect current financial strains to ease and the domestic economy to expand at a moderate pace over the second half of the year. However, we currently see a number of downside risks across the global markets that could result in volatility over the short term, which is why we still believe that a long-term investment focus with an emphasis on high-quality stocks may be suitable for many investors. As always, your financial advisor can help you assess both the risks and opportunities provided by the global financial markets in this investment climate.
For information about how the fund performed during the reporting period, as well as general market perspectives, we provide a Discussion of Fund Performance on the pages that follow.
Thank you for your continued confidence and support.
Jonathan R. Baum
Chairman and Chief Executive Officer
The Dreyfus Corporation
July 15, 2010
2

DISCUSSION OF FUND PERFORMANCE
For the period of January 1, 2010, through June 30, 2010, as provided by Sean P. Fitzgibbon, Portfolio Manager
Market and Fund Performance Overview
For the six-month period ended June 30, 2010, The Dreyfus Fund Incorporated produced a total return of –6.18%.1 In comparison, the Standard & Poor’s 500 Composite Stock Price Index (“S&P 500 Index”), the fund’s benchmark, provided a total return of –6.64% for the same period.2
Stocks were driven lower late in the reporting period by a variety of global and domestic economic setbacks. While the fund’s performance was influenced by these developments, our cautious approach to valuations and risk positioned the fund to weather the downdraft relatively well.As a result, the fund’s return modestly outpaced that of its benchmark over the first half of 2010.
The Fund’s Investment Approach
The fund seeks long-term capital growth consistent with the preservation of capital. Current income is a secondary goal. To pursue these goals, the fund focuses on large-capitalization U.S. companies with strong positions in their industries and catalysts that can trigger a price increase. We use fundamental analysis to create a broadly diversified portfolio composed of a blend of growth stocks, value stocks and stocks that exhibit characteristics of both investment styles. We select stocks based on how shares are priced relative to the underlying company’s perceived intrinsic worth, the sustainability or growth of earnings or cash flow, and the company’s financial health.
Economic Concerns Outweighed Corporate Performance
From the beginning of the reporting period through April 2010, the U.S. economy continued to recover from the steep recession of 2008 and 2009. Most U.S. corporations posted strong earnings and revenues, propelling stock prices significantly higher. However, in early May 2010, a sovereign debt crisis in Greece threatened to spread to other
| The Fund | 3 |
DISCUSSION OF FUND PERFORMANCE (continued)
members of the European Union. Over the ensuing weeks, investor confidence was further undermined by rising inflationary pressures in China, as well as ongoing troubles in U.S. housing markets, persistently high levels of U.S. unemployment and a major oil spill in the Gulf of Mexico.As a result, U.S. stocks gave up their earlier gains and generally ended the reporting period with negative returns.
The Fund Maintained a Cautious Posture
At the start of 2010, with stock prices rising and the market in recovery mode, the fund’s disciplined analytical process suggested that stock valuations were outrunning business fundamentals.Some stocks appeared vulnerable to a slowdown in the pace of economic recovery, a development that seemed likely in light of historical precedent and the scheduled end of certain government stimulus programs. Accordingly, we maintained a close watch on the fund’s valuation and risk levels, trimming positions as they reached our price targets. This cautious investment approach positioned the fund to maintain its exposure to the economic recovery while outperforming its benchmark as the market declined.
Outperforming Across a Wide Range of Sectors
The fund outperformed its benchmark in eight of 10 market sectors. The consumer staples sector proved a particularly strong area for relative returns, led by high-end consumer names, such as personal care products maker Estee Lauder, and organic grocery chain Whole Foods Market. Returns were further bolstered by gains in several beverage companies, particularly bottler Coca-Cola Enterprises, whose North American operations were acquired by The Coca-Cola Company.
Other top performers included the energy, materials and industrials sectors. Among energy holdings, the fund generally avoided companies with significant refinery operations, focusing instead on independent oil-and-gas producers with opportunities to increase production levels, such as Newfield Exploration and Occidental Petroleum. In the materials sector, the fund enhanced returns by avoiding most mining-and-minerals stocks, and gained further ground with good stock selections among chemicals companies, such as E.I. du Pont de Nemours
4
and Co.Among industrials, top holdings ranged from machinery makers, such as Cummins and Parker-Hannifin, to transportation stocks, including Norfolk Southern and Delta Air Lines. Strong performers in other sectors included technology holdingsVMware and Apple.
The fund’s most significant disappointments were concentrated primarily in the financials sector, where relatively light exposure to rebounding-but-volatile commercial banks undermined performance, as did declines in financial services providers, such as JPMorgan Chase & Co. and Bank of America. In the consumer discretionary sector, declines in office supplies vendor Staples and media company News Corp. detracted from the fund’s relative returns. Notably weak performers in other sectors included Eni SpA, an integrated energy company based in Italy, biotechnology developer Human Genome Sciences, online media giant Google, and pharmaceutical makers King Pharmaceuticals and Pfizer.
Remaining Cautiously Opportunistic
We believe the market’s recent dip has created attractive opportunities in stocks with attractive growth potential. Given our view that the U.S. economy appears poised for continued recovery, and recognizing that the pace of recovery may slow in the coming months, we have maintained the fund’s opportunistic, valuation-conscious and risk-conscious investment approach.
July 15, 2010
Please note, the position in any security highlighted with italicized typeface was sold during the reporting period.
Equity funds are subject generally to market, market sector, market liquidity, issuer and investment style risks, among other factors, to varying degrees, all of which are more fully described in the fund’s prospectus.
| 1 | Total return includes reinvestment of dividends and any capital gains paid. Past performance is no |
| guarantee of future results. Share price and investment return fluctuate such that upon redemption, | |
| fund shares may be worth more or less than their original cost. | |
| 2 | SOURCE: LIPPER INC. — Reflects reinvestment of dividends and, where applicable, capital |
| gain distributions.The Standard & Poor’s 500 Composite Stock Price Index is a widely accepted, | |
| unmanaged index of U.S. stock market performance. Investors cannot invest directly in an index. |
| The Fund | 5 |
UNDERSTANDING YOUR FUND’S EXPENSES (Unaudited)
As a mutual fund investor, you pay ongoing expenses, such as management fees and other expenses. Using the information below, you can estimate how these expenses affect your investment and compare them with the expenses of other funds.You also may pay one-time transaction expenses, including sales charges (loads) and redemption fees, which are not shown in this section and would have resulted in higher total expenses. For more information, see your fund’s prospectus or talk to your financial adviser.
Review your fund’s expenses
The table below shows the expenses you would have paid on a $1,000 investment in The Dreyfus Fund Incorporated from January 1, 2010 to June 30, 2010. It also shows how much a $1,000 investment would be worth at the close of the period, assuming actual returns and expenses.
Expenses and Value of a $1,000 Investment
assuming actual returns for the six months ended June 30, 2010
| Expenses paid per $1,000† | $3.80 |
| Ending value (after expenses) | $938.20 |
COMPARING YOUR FUND’S EXPENSES
WITH THOSE OF OTHER FUNDS (Unaudited)
Using the SEC’s method to compare expenses
The Securities and Exchange Commission (SEC) has established guidelines to help investors assess fund expenses. Per these guidelines, the table below shows your fund’s expenses based on a $1,000 investment, assuming a hypothetical 5% annualized return. You can use this information to compare the ongoing expenses (but not transaction expenses or total cost) of investing in the fund with those of other funds.All mutual fund shareholder reports will provide this information to help you make this comparison. Please note that you cannot use this information to estimate your actual ending account balance and expenses paid during the period.
Expenses and Value of a $1,000 Investment
assuming a hypothetical 5% annualized return for the six months ended June 30, 2010
| Expenses paid per $1,000† | $3.96 |
| Ending value (after expenses) | $1,020.88 |
| † Expenses are equal to the fund’s annualized expense ratio of .79%, multiplied by the average account value over the |
| period, multiplied by 181/365 (to reflect the one-half year period). |
6
| STATEMENT OF INVESTMENTS |
| June 30, 2010 (Unaudited) |
| Common Stocks—99.9% | Shares | Value ($) |
| Consumer Discretionary—11.0% | ||
| Autoliv | 155,940 | 7,461,729 |
| Carnival | 262,040 | 7,924,090 |
| Home Depot | 393,608 | 11,048,577 |
| News, Cl. A | 1,303,266 | 15,587,061 |
| Nordstrom | 182,790 | 5,884,010 |
| Omnicom Group | 214,030 | 7,341,229 |
| Stanley Black and Decker | 92,330 | 4,664,512 |
| Staples | 444,080 | 8,459,724 |
| Target | 199,050 | 9,787,288 |
| Time Warner | 250,982 | 7,255,890 |
| Walt Disney | 354,940 | 11,180,610 |
| 96,594,720 | ||
| Consumer Staples—11.0% | ||
| Clorox | 120,650 | 7,499,604 |
| Dr. Pepper Snapple Group | 184,500 | 6,898,455 |
| Energizer Holdings | 152,310 a | 7,658,147 |
| Estee Lauder, Cl. A | 106,960 | 5,960,881 |
| Kraft Foods, Cl. A | 274,330 | 7,681,240 |
| PepsiCo | 344,570 | 21,001,541 |
| Philip Morris International | 323,435 | 14,826,260 |
| Procter & Gamble | 303,700 | 18,215,926 |
| Whole Foods Market | 180,530 a | 6,502,691 |
| 96,244,745 | ||
| Energy—11.5% | ||
| Alpha Natural Resources | 120,970 a | 4,097,254 |
| Anadarko Petroleum | 174,690 | 6,304,562 |
| Chevron | 213,390 | 14,480,645 |
| ENI, ADR | 202,120 | 7,387,486 |
| ENSCO, ADR | 203,740 | 8,002,907 |
| EOG Resources | 77,500 | 7,623,675 |
| Halliburton | 250,252 | 6,143,687 |
| Hess | 161,840 | 8,147,026 |
| Newfield Exploration | 240,380 a | 11,744,967 |
| The Fund | 7 |
STATEMENT OF INVESTMENTS (Unaudited) (continued)
| Common Stocks (continued) | Shares | Value ($) |
| Energy (continued) | ||
| Occidental Petroleum | 265,860 | 20,511,099 |
| Valero Energy | 320,410 | 5,760,972 |
| 100,204,280 | ||
| Financial—14.7% | ||
| American Express | 339,390 | 13,473,783 |
| Bank of America | 1,710,970 | 24,586,639 |
| Capital One Financial | 314,170 | 12,661,051 |
| Franklin Resources | 68,440 | 5,898,844 |
| Genworth Financial, Cl. A | 600,700 a | 7,851,149 |
| Goldman Sachs Group | 30,370 | 3,986,670 |
| JPMorgan Chase & Co. | 676,190 | 24,755,316 |
| Lincoln National | 310,380 | 7,539,130 |
| MetLife | 257,260 | 9,714,138 |
| Morgan Stanley | 195,100 | 4,528,271 |
| Wells Fargo & Co. | 423,210 | 10,834,176 |
| XL Capital, Cl. A | 161,540 | 2,586,255 |
| 128,415,422 | ||
| Health Care—15.5% | ||
| Alexion Pharmaceuticals | 209,450 a | 10,721,745 |
| AmerisourceBergen | 217,040 | 6,891,020 |
| Amgen | 160,560 a | 8,445,456 |
| Amylin Pharmaceuticals | 546,290 a | 10,270,252 |
| CIGNA | 202,630 | 6,293,688 |
| Covidien | 160,665 | 6,455,520 |
| Hospira | 112,690 a | 6,474,041 |
| Human Genome Sciences | 419,800 a | 9,512,668 |
| King Pharmaceuticals | 527,000 a | 3,999,930 |
| Mednax | 82,460 a | 4,585,601 |
| Merck & Co. | 575,018 | 20,108,379 |
| Pfizer | 1,460,480 | 20,826,445 |
| St. Jude Medical | 123,170 a | 4,445,205 |
| Thermo Fisher Scientific | 98,000 a | 4,806,900 |
8
| Common Stocks (continued) | Shares | Value ($) |
| Health Care (continued) | ||
| Universal Health Services, Cl. B | 153,420 | 5,852,973 |
| WellPoint | 113,410 a | 5,549,151 |
| 135,238,974 | ||
| Industrial—10.8% | ||
| AMR | 559,950 a | 3,796,461 |
| Caterpillar | 208,280 | 12,511,380 |
| Cummins | 119,440 | 7,779,127 |
| Dover | 257,900 | 10,777,641 |
| General Electric | 468,420 | 6,754,616 |
| KBR | 272,635 | 5,545,396 |
| Norfolk Southern | 339,550 | 18,013,127 |
| Raytheon | 210,030 | 10,163,352 |
| Textron | 401,300 | 6,810,061 |
| Tyco International | 355,415 | 12,521,270 |
| 94,672,431 | ||
| Information Technology—18.3% | ||
| Apple | 121,216 a | 30,489,460 |
| Cisco Systems | 824,313 a | 17,566,110 |
| EMC | 586,310 a | 10,729,473 |
| Google, Cl. A | 38,143 a | 16,971,728 |
| International Business Machines | 184,640 | 22,799,347 |
| Lam Research | 190,390 a | 7,246,243 |
| Microsoft | 936,200 | 21,541,962 |
| Oracle | 624,608 | 13,404,088 |
| Research In Motion | 115,210 a | 5,675,245 |
| Salesforce.com | 81,760 a | 7,016,643 |
| VMware, Cl. A | 102,188 a | 6,395,947 |
| 159,836,246 | ||
| Materials—1.8% | ||
| Dow Chemical | 209,260 | 4,963,647 |
| E.I. du Pont de Nemours & Co. | 324,000 | 11,207,160 |
| 16,170,807 |
| The Fund | 9 |
STATEMENT OF INVESTMENTS (Unaudited) (continued)
| Common Stocks (continued) | Shares | Value ($) |
| Telecommunication Services—2.5% | ||
| AT & T | 886,640 | 21,447,822 |
| Utilities—2.8% | ||
| American Electric Power | 184,870 | 5,971,301 |
| Entergy | 100,400 | 7,190,648 |
| Public Service Enterprise Group | 375,880 | 11,776,321 |
| 24,938,270 | ||
| Total Common Stocks | ||
| (cost $818,003,930) | 873,763,717 | |
| Limited Partnership Interests—.0% | ||
| Consumer Discretionary—.0% | ||
| SK Equity Fund, LPa,c | 28,863 | |
| Health Care—.0% | ||
| Galen Partners II, LPa,c | 60,204 | |
| Total Limited Partnership Interests | ||
| (cost $825,919) | 89,067 | |
| Other Investment—.2% | ||
| Registered Investment Company; | ||
| Dreyfus Institutional Preferred | ||
| Plus Money Market Fund | ||
| (cost $1,789,000) | 1,789,000 c | 1,789,000 |
| Total Investments (cost $820,618,849) | 100.1% | 875,641,784 |
| Liabilities, Less Cash and Receivables | (.1%) | (535,409) |
| Net Assets | 100.0% | 875,106,375 |
| ADR—American Depository Receipts |
| a Non-income producing security. |
| b Investment in affiliated money market mutual fund. |
| c Securities restricted as to public resale. Investment in restricted securities with aggregate market value of $89,067 |
| representing 0.01% of net assets (see below). |
10
| Acquisition | Net | |||
| Issuer | Date | Cost ($) | Assets (%) | Valuation ($)† |
| Galen Partners II, LP | 5/1/96-1/3/97 | 442,626 | .01 | 60,204 |
| SK Equity Fund, LP | 3/8/95-9/18/96 | 383,293 | .00 | 28,863 |
| 89,067 |
| † The valuation of these securities has been determined in good faith by management under the direction of the |
| Board of Directors. |
| Portfolio Summary (Unaudited)†† | |||
| Value (%) | Value (%) | ||
| Information Technology | 18.3 | Industrial | 10.8 |
| Health Care | 15.5 | Utilities | 2.8 |
| Financial | 14.7 | Telecommunication Services | 2.5 |
| Energy | 11.5 | Materials | 1.8 |
| Consumer Discretionary | 11.0 | Money Market Investment | .2 |
| Consumer Staples | 11.0 | 100.1 | |
| †† Based on net assets. | |||
| See notes to financial statements. | |||
| The Fund | 11 |
| STATEMENT OF ASSETS AND LIABILITIES |
| June 30, 2010 (Unaudited) |
| Cost | Value | |
| Assets ($): | ||
| Investments in securities—See Statement of Investments: | ||
| Unaffiliated issuers | 818,829,849 | 873,852,784 |
| Affiliated issuers | 1,789,000 | 1,789,000 |
| Dividends and interest receivable | 895,625 | |
| Receivable for shares of Common Stock subscribed | 7,643 | |
| Prepaid expenses | 11,931 | |
| 876,556,983 | ||
| Liabilities ($): | ||
| Due to The Dreyfus Corporation and affiliates—Note 3(a) | 690,062 | |
| Cash overdraft due to Custodian | 239,783 | |
| Payable for shares of Common Stock redeemed | 292,754 | |
| Accrued expenses | 228,009 | |
| 1,450,608 | ||
| Net Assets ($) | 875,106,375 | |
| Composition of Net Assets ($): | ||
| Paid-in capital | 983,784,145 | |
| Accumulated undistributed investment income—net | 1,511,091 | |
| Accumulated net realized gain (loss) on investments | (165,211,796) | |
| Accumulated net unrealized appreciation | ||
| (depreciation) on investments | 55,022,935 | |
| Net Assets ($) | 875,106,375 | |
| Shares Outstanding | ||
| (500 million shares $1 par value Common Stock authorized) | 120,038,678 | |
| Net Asset Value, offering and redemption price per share ($) | 7.29 | |
| See notes to financial statements. | ||
12
| STATEMENT OF OPERATIONS | |
| Six Months Ended June 30, 2010 (Unaudited) | |
| Investment Income ($): | |
| Income: | |
| Cash dividends (net of $70,470 foreign taxes withheld at source): | |
| Unaffiliated issuers | 7,240,855 |
| Affiliated issuers | 2,829 |
| Income from securities lending—Note 1(b) | 722 |
| Total Income | 7,244,406 |
| Expenses: | |
| Management fee—Note 3(a) | 3,165,058 |
| Shareholder servicing costs—Note 3(b) | 439,660 |
| Prospectus and shareholders’ reports | 58,082 |
| Professional fees | 44,236 |
| Custodian fees—Note 3(b) | 37,905 |
| Registration fees | 14,309 |
| Loan commitment fees—Note 2 | 11,249 |
| Directors’ fees and expenses—Note 3(c) | 8,131 |
| Interest expense—Note 2 | 44 |
| Miscellaneous | 19,389 |
| Total Expenses | 3,798,063 |
| Less—reduction in fees due to earnings credits—Note 1(b) | (2,434) |
| Net Expenses | 3,795,629 |
| Investment Income—Net | 3,448,777 |
| Realized and Unrealized Gain (Loss) on Investments—Note 4 ($): | |
| Net realized gain (loss) on investments | 38,210,327 |
| Net unrealized appreciation (depreciation) on investments | (98,651,899) |
| Net Realized and Unrealized Gain (Loss) on Investments | (60,441,572) |
| Net (Decrease) in Net Assets Resulting from Operations | (56,992,795) |
| See notes to financial statements. | |
| The Fund | 13 |
STATEMENT OF CHANGES IN NET ASSETS
| Six Months Ended | ||
| June 30, 2010 | Year Ended | |
| (Unaudited) | December 31, 2009 | |
| Operations ($): | ||
| Investment income—net | 3,448,777 | 9,821,020 |
| Net realized gain (loss) on investments | 38,210,327 | (104,547,711) |
| Net unrealized appreciation | ||
| (depreciation) on investments | (98,651,899) | 313,228,053 |
| Net Increase (Decrease) in Net Assets | ||
| Resulting from Operations | (56,992,795) | 218,501,362 |
| Dividends to Shareholders from ($): | ||
| Investment income—net | (3,624,086) | (11,032,978) |
| Capital Stock Transactions ($): | ||
| Net proceeds from shares sold | 5,158,600 | 5,367,992 |
| Dividends reinvested | 3,096,889 | 9,413,428 |
| Cost of shares redeemed | (38,649,663) | (72,008,197) |
| Increase (Decrease) in Net Assets | ||
| from Capital Stock Transactions | (30,394,174) | (57,226,777) |
| Total Increase (Decrease) in Net Assets | (91,011,055) | 150,241,607 |
| Net Assets ($): | ||
| Beginning of Period | 966,117,430 | 815,875,823 |
| End of Period | 875,106,375 | 966,117,430 |
| Undistributed investment income—net | 1,511,091 | 1,686,400 |
| Capital Share Transactions (Shares): | ||
| Shares sold | 636,911 | 821,741 |
| Shares issued for dividends reinvested | 398,329 | 1,451,107 |
| Shares redeemed | (4,806,768) | (11,330,452) |
| Net Increase (Decrease) in Shares Outstanding | (3,771,528) | (9,057,604) |
| See notes to financial statements. | ||
14
FINANCIAL HIGHLIGHTS
The following table describes the performance for the fiscal periods indicated. Total return shows how much your investment in the fund would have increased (or decreased) during each period, assuming you had reinvested all dividends and distributions.These figures have been derived from the fund’s financial statements.
| Six Months Ended | ||||||
| June 30, 2010 | Year Ended December 31, | |||||
| (Unaudited) | 2009 | 2008 | 2007 | 2006 | 2005 | |
| Per Share Data ($): | ||||||
| Net asset value, | ||||||
| beginning of period | 7.80 | 6.14 | 10.25 | 10.48 | 10.28 | 10.25 |
| Investment Operations: | ||||||
| Investment income—neta | .03 | .08 | .13 | .17 | .14 | .11 |
| Net realized and unrealized | ||||||
| gain (loss) on investments (.51) | 1.67 | (3.98) | .65 | 1.43 | .43 | |
| Total from | ||||||
| Investment Operations | (.48) | 1.75 | (3.85) | .82 | 1.57 | .54 |
| Distributions: | ||||||
| Dividends from | ||||||
| investment income—net | (.03) | (.09) | (.13) | (.17) | (.14) | (.11) |
| Dividends from net realized | ||||||
| gain on investments | — | — | (.13) | (.88) | (1.23) | (.40) |
| Total Distributions | (.03) | (.09) | (.26) | (1.05) | (1.37) | (.51) |
| Net asset value, | ||||||
| end of period | 7.29 | 7.80 | 6.14 | 10.25 | 10.48 | 10.28 |
| Total Return (%) | (6.18)b | 28.75 | (38.21) | 7.89 | 15.58 | 5.28 |
| Ratios/Supplemental | ||||||
| Data (%): | ||||||
| Ratio of total expenses | ||||||
| to average net assets | .79c | .80 | .76 | .73 | .74 | .74 |
| Ratio of net expenses | ||||||
| to average net assets | .79c,d | .79 | .75 | .73 | .74d | .74 |
| Ratio of net investment | ||||||
| income to average | ||||||
| net assets | .71c | 1.18 | 1.48 | 1.60 | 1.35 | 1.13 |
| Portfolio Turnover Rate | 28.78b | 77.88 | 76.31 | 44.08 | 54.66 | 58.50 |
| Net Assets, end of period | ||||||
| ($ x 1,000) | 875,106 | 966,117 | 815,876 | 1,427,655 | 1,453,898 | 1,411,351 |
| a | Based on average shares outstanding at each month end. |
| b | Not annualized. |
| c | Annualized. |
| d | Expense waivers and/or reimbursements amounted to less than .01%. |
| See notes to financial statements. | |
| The Fund | 15 |
NOTES TO FINANCIAL STATEMENTS (Unaudited)
NOTE 1—Significant Accounting Policies:
The Dreyfus Fund Incorporated (the “fund”) is registered under the Investment Company Act of 1940, as amended (the “Act”), as a diversified open-end management investment company.The fund’s investment objective is to provide investors with long-term capital growth consistent with the preservation of capital. The Dreyfus Corporation (the “Manager” or “Dreyfus”), a wholly-owned subsidiary of The Bank of New York Mellon Corporation (“BNY Mellon”), serves as the fund’s investment adviser. MBSC Securities Corporation (the “Distributor”), a wholly-owned subsidiary of the Manager, is the distributor of the fund’s shares, which are sold to the public without a sales charge.
The Financial Accounting Standards Board (“FASB”) Accounting Standards Codification (“ASC”) is the exclusive reference of authoritative U.S. generally accepted accounting principles (“GAAP”) recognized by the FASB to be applied by nongovernmental entities.Rules and interpretive releases of the Securities and Exchange Commission (“SEC”) under authority of federal laws are also sources of authoritative GAAP for SEC registrants. The fund’s financial statements are prepared in accordance with GAAP, which may require the use of management estimates and assumptions.Actual results could differ from those estimates.
The fund enters into contracts that contain a variety of indemnifications. The fund’s maximum exposure under these arrangements is unknown.The fund does not anticipate recognizing any loss related to these arrangements.
(a) Portfolio valuation: Investments in securities are valued at the last sales price on the securities exchange or national securities market on which such securities are primarily traded. Securities listed on the National Market System for which market quotations are available are valued at the official closing price or, if there is no official closing price that day, at the last sales price. Securities not listed on an exchange or the national securities market, or securities for which there were no
16
transactions, are valued at the average of the most recent bid and asked prices, except for open short positions, where the asked price is used for valuation purposes. Bid price is used when no asked price is available. Registered investment companies that are not traded on an exchange are valued at their net asset value.When market quotations or official closing prices are not readily available, or are determined not to reflect accurately fair value, such as when the value of a security has been significantly affected by events after the close of the exchange or market on which the security is principally traded (for example, a foreign exchange or market), but before the fund calculates its net asset value, the fund may value these investments at fair value as determined in accordance with the procedures approved by the Board of Directors. Fair valuing of securities may be determined with the assistance of a pricing service us ing calculations based on indices of domestic securities and other appropriate indicators, such as prices of relevant ADRs and futures contracts. For other securities that are fair valued by the Board of Directors, certain factors may be considered such as: fundamental analytical data, the nature and duration of restrictions on disposition, an evaluation of the forces that influence the market in which the securities are purchased and sold and public trading in similar securities of the issuer or comparable issuers. Financial futures are valued at the last sales price.
The fair value of a financial instrument is the amount that would be received to sell an asset or paid to transfer a liability in an orderly transaction between market participants at the measurement date (i.e. the exit price). GAAP establishes a fair value hierarchy that prioritizes the inputs of valuation techniques used to measure fair value.This hierarchy gives the highest priority to unadjusted quoted prices in active markets for identical assets or liabilities (Level 1 measurements) and the lowest priority to unobservable inputs (Level 3 measurements).
| The Fund | 17 |
NOTES TO FINANCIAL STATEMENTS (Unaudited) (continued)
Additionally, GAAP provides guidance on determining whether the volume and activity in a market has decreased significantly and whether such a decrease in activity results in transactions that are not orderly. GAAP requires enhanced disclosures around valuation inputs and techniques used during annual and interim periods.
Various inputs are used in determining the value of the fund’s investments relating to fair value measurements.These inputs are summarized in the three broad levels listed below:
Level 1—unadjusted quoted prices in active markets for
identical investments.
Level 2—other significant observable inputs (including quoted
prices for similar investments, interest rates, prepayment speeds,
credit risk, etc.).
Level 3—significant unobservable inputs (including the fund’s own
assumptions in determining the fair value of investments).
The inputs or methodology used for valuing securities are not necessarily an indication of the risk associated with investing in those securities.
The following is a summary of the inputs used as of June 30, 2010 in valuing the fund’s investments:
| Level 2—Other | Level 3— | |||
| Level 1— | Significant | Significant | ||
| Unadjusted | Observable | Unobservable | ||
| Quoted Prices | Inputs | Inputs | Total | |
| Assets ($) | ||||
| Investments in Securities: | ||||
| Equity Securities— | ||||
| Domestic† | 845,236,350 | — | — | 845,236,350 |
| Equity Securities— | ||||
| Foreign† | 28,527,367 | — | — | 28,527,367 |
| Limited Partnership | ||||
| Interests | — | — | 89,067 | 89,067 |
| Mutual Funds | 1,789,000 | — | — | 1,789,000 |
| † | See Statement of Investments for industry classification. |
18
The following is a reconciliation of Level 3 assets for which significant unobservable inputs were used to determine fair value:
| Investments in | |
| Limited Partnership | |
| Interests | |
| Balance as of 12/31/2009 | 89,067 |
| Realized gain (loss) | (360) |
| Change in unrealized appreciation (depreciation) | 1,448 |
| Net purchases (sales) | (1,088) |
| Transfers in and/or out of Level 3 | — |
| Balance as of 6/30/2010 | 89,067 |
In January 2010, FASB issued Accounting Standards Update (“ASU”) No. 2010-06 “Improving Disclosures about FairValue Measurements”. The portions of ASU No. 2010-06 which require reporting entities to prepare new disclosures surrounding amounts and reasons for significant transfers in and out of Level 1 and Level 2 fair value measurements as well as inputs and valuation techniques used to measure fair value for both recurring and nonrecurring fair value measurements that fall in either Level 2 or Level 3 have been adopted by the fund.The remaining portion of ASU No. 2010-06 requires reporting entities to make new disclosures about information on purchases, sales, issuances and settlements on a gross basis in the reconciliation of activity in Level 3 fair value measurements.These new and revised disclosures are required to be implemented for fiscal years beginning after December 15, 2010. Management is currentl y evaluating the impact that the adoption of this remaining portion of ASU No. 2010-06 may have on the fund’s financial statement disclosures.
| The Fund | 19 |
NOTES TO FINANCIAL STATEMENTS (Unaudited) (continued)
(b) Securities transactions and investment income: Securities transactions are recorded on a trade date basis. Realized gains and losses from securities transactions are recorded on the identified cost basis. Dividend income is recognized on the ex-dividend date and interest income, including, where applicable, accretion of discount and amortization of premium on investments, is recognized on the accrual basis.
The fund has arrangements with the custodian and cash management bank whereby the fund may receive earnings credits when positive cash balances are maintained, which are used to offset custody and cash management fees. For financial reporting purposes, the fund includes net earnings credits as an expense offset in the Statement of Operations.
Pursuant to a securities lending agreement with The Bank of New York Mellon, a subsidiary of BNY Mellon and an affiliate of Dreyfus, the fund may lend securities to qualified institutions. It is the fund’s policy, that at origination, all loans are secured by collateral of at least 102% of the value of U.S. securities loaned and 105% of the value of foreign securities loaned. Collateral equivalent to at least 100% of the market value of securities on loan is maintained at all times. Collateral is either in the form of cash, which can be invested in certain money market mutual funds managed by the Manager, U.S. Government and Agency securities or letters of credit.The fund is entitled to receive all income on securities loaned, in addition to income earned as a result of the lending transaction. Although each security loaned is fully collateralized, the fund bears the risk of delay in recovery of, or loss of rights in, the securities loaned should a borrower fail to return the securities in a timely manner. During the period ended June 30, 2010, The Bank of New York Mellon earned $309 from lending portfolio securities, pursuant to the securities lending agreement. At June 30, 2010, there were no securities out on loan.
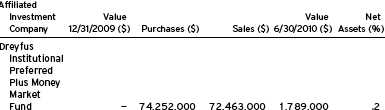
(c) Affiliated issuers: Investments in other investment companies advised by Dreyfus are defined as “affiliated” in the Act.
20
The fund may invest in shares of certain affiliated investment companies also advised or managed by Dreyfus. Investments in affiliated investment companies for the period ended June 30, 2010 were as follows:
(d) Dividends to shareholders: Dividends are recorded on the ex-dividend date. Dividends from investment income-net are declared and paid on a quarterly basis. Dividends from net realized capital gains, if any, are normally declared and paid annually, but the fund may make distributions on a more frequent basis to comply with the distribution requirements of the Internal Revenue Code of 1986, as amended (the “Code”).To the extent that net realized capital gains can be offset by capital loss carryovers, it is the policy of the fund not to distribute such gains. Income and capital gain distributions are determined in accordance with income tax regulations, which may differ from GAAP.
(e) Federal income taxes: It is the policy of the fund to continue to qualify as a regulated investment company, if such qualification is in the best interests of its shareholders, by complying with the applicable provisions of the Code, and to make distributions of taxable income sufficient to relieve it from substantially all federal income and excise taxes.
As of and during the period ended June 30, 2010, the fund did not have any liabilities for any uncertain tax positions.The fund recognizes interest and penalties, if any, related to uncertain tax positions as income tax expense in the Statement of Operations. During the period, the fund did not incur any interest or penalties.
| The Fund | 21 |
NOTES TO FINANCIAL STATEMENTS (Unaudited) (continued)
Each of the tax years in the three-year period ended December 31, 2009 remains subject to examination by the Internal Revenue Service and state taxing authorities.
The fund has an unused capital loss carryover of $203,422,123 available for federal income tax purposes to be applied against future net securities profits, if any, realized subsequent to December 31, 2009. If not applied, $28,939,878 of the carryover expires in fiscal 2016 and $174,482,245 expires in fiscal 2017.
The tax character of distributions paid to shareholders during the fiscal year ended December 31, 2009 was as follows: ordinary income $11,032,978. The tax character of current year distributions will be determined at the end of the current fiscal year.
NOTE 2—Bank Lines of Credit:
The fund participates with other Dreyfus-managed funds in a $225 million unsecured credit facility led by Citibank, N.A. and a $300 million unsecured credit facility provided by The Bank of New York Mellon (each, a “Facility”), each to be utilized primarily for temporary or emergency purposes, including the financing of redemptions. In connection therewith, the fund has agreed to pay its pro rata portion of commitment fees for each Facility. Interest is charged to the fund based on rates determined pursuant to the terms of the respective Facility at the time of borrowing.
The average amount of borrowings outstanding under the Facilities during the period ended June 30, 2010 was approximately $6,100 with a related weighted average annualized interest rate of 1.45%.
NOTE 3—Management Fee and Other Transactions With Affiliates:
(a) Pursuant to a management agreement (the “Agreement”) with the Manager, the management fee is payable monthly, based on the following annual percentages of the value of the fund’s average daily net assets: .65% of the first $1.5 billion; .625% of the next $500 million; .60% of the next $500 million; and .55% over $2.5 billion.
22
The Agreement also provides for an expense reimbursement from the Manager should the fund’s aggregate expenses, exclusive of taxes and brokerage commissions, exceed 1% of the value of the fund’s average daily net assets for any full fiscal year. No expense reimbursement was required pursuant to the Agreement for the period ended June 30, 2010.
(b) The fund compensates Dreyfus Transfer, Inc., a wholly-owned subsidiary of the Manager, under a transfer agency agreement for providing personnel and facilities to perform transfer agency services for the fund. During the period ended June 30, 2010, the fund was charged $233,274 pursuant to the transfer agency agreement, which is included in Shareholder servicing costs in the Statement of Operations.
The fund compensates The Bank of New York Mellon under a cash management agreement for performing cash management services related to fund subscriptions and redemptions. During the period ended June 30, 2010, the fund was charged $35,208 pursuant to the cash management agreement, which is included in Shareholder servicing costs in the Statement of Operations.These fees were partially offset by earnings credits of $2,434.
The fund also compensates The Bank of New York Mellon under a custody agreement for providing custodial services for the fund. During the period ended June 30, 2010, the fund was charged $37,905 pursuant to the custody agreement.
During the period ended June 30, 2010, the fund was charged $2,742 for services performed by the Chief Compliance Officer.
The components of “Due to The Dreyfus Corporation and affiliates” in the Statement of Assets and Liabilities consist of: management fees $501,643, custodian fees $24,306, chief compliance officer fees $4,113 and transfer agency per account fees $160,000.
(c) Each Board member also serves as a Board member of other funds within the Dreyfus complex. Annual retainer fees and attendance fees are allocated to each fund based on net assets.
| The Fund | 23 |
NOTES TO FINANCIAL STATEMENTS (Unaudited) (continued)
NOTE 4—Securities Transactions:
The aggregate amount of purchases and sales of investment securities, excluding short-term securities, during the period ended June 30, 2010, amounted to $274,030,623 and $303,026,664, respectively.
The provisions of ASC Topic 815 “Derivatives and Hedging” require qualitative disclosures about objectives and strategies for using derivatives, quantitative disclosures about fair value amounts of gains and losses on derivative instruments and disclosures about credit-risk-related contingent features in derivative agreements.The fund held no derivatives during the period ended June 30, 2010. These disclosures did not impact the notes to the financial statements.
At June 30, 2010, accumulated net unrealized appreciation on investments was $55,022,935, consisting of $110,936,496 gross unrealized appreciation and $55,913,561 gross unrealized depreciation.
At June 30, 2010, the cost of investments for federal income tax purposes was substantially the same as the cost for financial reporting purposes (see the Statement of Investments).
24
For More Information

Ticker Symbol: DREVX
| Telephone 1-800-645-6561 |
| Mail The Dreyfus Family of Funds, 144 Glenn Curtiss Boulevard, Uniondale, NY 11556-0144 |
| E-mail Send your request to info@dreyfus.com |
| Internet Information can be viewed online or downloaded at: http://www.dreyfus.com |
The fund files its complete schedule of portfolio holdings with the Securities and Exchange Commission (“SEC”) for the first and third quarters of each fiscal year on Form N-Q. The fund’s Forms N-Q are available on the SEC’s website at http://www.sec.gov and may be reviewed and copied at the SEC’s Public Reference Room in Washington, DC. Information on the operation of the Public Reference Room may be obtained by calling 1-800-SEC-0330.
A description of the policies and procedures that the fund uses to determine how to vote proxies relating to portfolio securities, and information regarding how the fund voted these proxies for the most recent 12-month period ended June 30 is available at http://www.dreyfus.com and on the SEC’s website at http://www.sec.gov. The description of the policies and procedures is also available without charge, upon request, by calling 1-800-645-6561.

Item 2. Code of Ethics.
Not applicable.
Item 3. Audit Committee Financial Expert.
Not applicable.
Item 4. Principal Accountant Fees and Services.
Not applicable.
Item 5. Audit Committee of Listed Registrants.
Not applicable.
Item 6. Investments.
(a) Not applicable.
Item 7. Disclosure of Proxy Voting Policies and Procedures for Closed-End Management Investment Companies.
Not applicable.
Item 8. Portfolio Managers of Closed-End Management Investment Companies.
Not applicable.
Item 9. Purchases of Equity Securities by Closed-End Management Investment Companies and Affiliated Purchasers.
Not applicable. [CLOSED END FUNDS ONLY]
Item 10. Submission of Matters to a Vote of Security Holders.
There have been no material changes to the procedures applicable to Item 10.
Item 11. Controls and Procedures.
(a) The Registrant's principal executive and principal financial officers have concluded, based on their evaluation of the Registrant's disclosure controls and procedures as of a date within 90 days of the filing date of this report, that the Registrant's disclosure controls and procedures are reasonably designed to ensure that information required to be disclosed by the Registrant on Form N-CSR is recorded, processed, summarized and reported within the required time periods and that information required to be disclosed by the Registrant in the reports that it files or submits on Form N-CSR is accumulated and communicated to the Registrant's management, including its principal executive and principal financial officers, as appropriate to allow timely decisions regarding required disclosure.
|
(b) There were no changes to the Registrant's internal control over financial reporting that occurred during the second fiscal quarter of the period covered by this report that have materially affected, or are reasonably likely to materially affect, the Registrant's internal control over financial reporting.
Item 12. Exhibits.
(a)(1) Not applicable.
(a)(2) Certifications of principal executive and principal financial officers as required by Rule 30a-2(a) under the Investment Company Act of 1940.
(a)(3) Not applicable.
(b) Certification of principal executive and principal financial officers as required by Rule 30a-2(b) under the Investment Company Act of 1940.
|
SIGNATURES
Pursuant to the requirements of the Securities Exchange Act of 1934 and the Investment Company Act of 1940, the Registrant has duly caused this Report to be signed on its behalf by the undersigned, thereunto duly authorized.
The Dreyfus Fund Incorporated
By: /s/ Bradley J. Skapyak | |
Bradley J. Skapyak President
| |
Date: | August 23, 2010 |
| |
Pursuant to the requirements of the Securities Exchange Act of 1934 and the Investment Company Act of 1940, this Report has been signed below by the following persons on behalf of the Registrant and in the capacities and on the dates indicated. | |
| |
By: /s/ Bradley J. Skapyak | |
Bradley J. Skapyak President
| |
Date: | August 23, 2010 |
| |
By: /s/ James Windels | |
James Windels, Treasurer
| |
Date: | August 23, 2010 |
| |
|
EXHIBIT INDEX
(a)(2) Certifications of principal executive and principal financial officers as required by Rule 30a-2(a) under the Investment Company Act of 1940. (EX-99.CERT)
(b) Certification of principal executive and principal financial officers as required by Rule 30a-2(b) under the Investment Company Act of 1940. (EX-99.906CERT)
|