UNITED STATES
SECURITIES AND EXCHANGE COMMISSION
WASHINGTON, D.C. 20549
FORM 10-K
| |
☒ | ANNUAL REPORT PURSUANT TO SECTION 13 OR 15(d) OF THE SECURITIES EXCHANGE ACT OF 1934 |
For the fiscal year ended December 31, 2024
OR
| |
☐ | TRANSITION REPORT PURSUANT TO SECTION 13 OR 15(d) OF THE SECURITIES EXCHANGE ACT OF 1934 |
Commission File Number: 001-12209
RANGE RESOURCES CORPORATION
(Exact Name of Registrant as Specified in Its Charter)
| | |
Delaware |
| 34-1312571 |
(State or Other Jurisdiction of Incorporation or Organization) |
| (IRS Employer Identification No.) |
| |
100 Throckmorton Street, Suite 1200, Fort Worth, Texas |
| 76102 |
(Address of Principal Executive Offices) |
| (Zip Code) |
Registrant’s telephone number, including area code (817) 870-2601
Securities registered pursuant to Section 12(b) of the Act:
| | | | |
Title of Each Class | | Trading Symbol |
| Name of each exchange on which registered |
Common Stock, $.01 par value | | RRC |
| New York Stock Exchange |
Securities registered pursuant to Section 12(g) of the Act: None
Indicate by check mark if the registrant is a well-known seasoned issuer, as defined in Rule 405 of the Securities Act. Yes ☒ No ☐
Indicate by check mark if the registrant is not required to file reports pursuant to Section 13 or Section 15(d) of the Act. Yes ☐ No ☒
Indicate by check mark whether the registrant (1) has filed all reports required to be filed by Section 13 or 15(d) of the Securities Exchange Act of 1934 during the preceding 12 months (or for such shorter period that the registrant was required to file such reports), and (2) has been subject to such filing requirements for the past 90 days. Yes ☒ No ☐
Indicate by check mark whether the registrant has submitted electronically every Interactive Data File required to be submitted pursuant to Rule 405 of Regulation S-T during the preceding 12 months (or for such shorter period that the registrant was required to submit such files). Yes ☒ No ☐
Indicate by check mark whether the registrant is a large accelerated filer, an accelerated filer, a non-accelerated filer, a smaller reporting company or an emerging growth company. See the definitions of "large accelerated filer," "accelerated filer," "smaller reporting company" and "emerging growth company" in Rule 12b-2 of the Exchange Act.
| | | | | | |
Large accelerated filer |
| ☒ |
| Smaller reporting company |
| ☐ |
Accelerated filer | | ☐ |
| Emerging growth company |
| ☐ |
Non-accelerated filer |
| ☐ |
| |
| |
If an emerging growth company, indicate by check mark if the registrant has elected not to use the extended transition period for complying with any new or revised financial accounting standards provided pursuant to Section 13(a) of the Exchange Act: ☐
Indicate by check mark whether the registrant has filed a report on and attestation to its management’s assessment of the effectiveness of its internal control over financial reporting under Section 404(b) of the Sarbanes-Oxley Act (15 U.S.C. 7262(b)) by the registered public accounting firm that prepared or issued its audit report. ☒
If securities are registered pursuant to Section 12(b) of the Act, indicate by check mark whether the financial statements of the registrant included in the filing reflect the correction of an error to previously issued financial statements. ☐
Indicate by check mark whether any of those error corrections are restatements that required a recovery analysis of incentive-based compensation received by any of the registrant's executive officers during the relevant recovery period pursuant to §240.10D-1(b). ☐
Indicate by check mark whether the registrant is a shell company (as defined in Rule 12b-2 of the Act). Yes ☐ No ☒
The aggregate market value of the voting and non-voting common equity held by non-affiliates as of June 30, 2024 was $8,033,163,000. This amount is based on the closing price of the registrant's common stock on the New York Stock Exchange on the last trading day of the month. Shares of common stock held by executive officers and directors of the registrant and treasury shares held by the registrant are not included in the computation.
As of February 21, 2025, there were 241,330,871 shares of Range Resources Corporation common stock outstanding.
DOCUMENTS INCORPORATED BY REFERENCE
Portions of the registrant’s definitive proxy statement to be furnished to stockholders in connection with its 2025 Annual Meeting of Stockholders, which will be filed with the Securities and Exchange Commission within 120 days after the end of the fiscal year to which this report relates, are incorporated by reference in Part II, Item 5 and Part III, Items 10-14 of this report.
RANGE RESOURCES CORPORATION
Unless the context otherwise indicates, all references in this report to "Range," "we," "us" or "our" are to Range Resources Corporation and its directly and indirectly owned subsidiaries. Unless otherwise noted, all information in the report relating to natural gas, natural gas liquids and oil reserves and the estimated future net cash flows attributable to those reserves are based on estimates and are net to our interest. If you are not familiar with the oil and gas terms used in this report, please refer to the explanation of such terms under the caption "Glossary of Certain Defined Terms."
TABLE OF CONTENTS
TABLE OF CONTENTS (continued)
GLOSSARY OF CERTAIN DEFINED TERMS
The terms defined in this glossary are used in this report.
bbl. One stock tank barrel, or 42 U.S. gallons liquid volumes, used herein in reference to crude oil or other liquid hydrocarbons.
bcf. One billion cubic feet of gas.
bcfe. One billion cubic feet of natural gas equivalents, based on a ratio of 6 mcf for each barrel of oil or NGLs, which reflects relative energy content.
btu. One British thermal unit, an energy equivalence measure. A British thermal unit is the heat required to raise the temperature of one pound of water from 58.5 to 59.5 degrees Fahrenheit.
Development well. A well drilled within the proved area of an oil or natural gas reservoir to the depth of a stratigraphic horizon known to be productive.
Developed Oil and Gas Reserves. Oil and natural gas reserves of any category that can be expected to be recovered through existing wells with existing equipment and operating methods or in which the cost of the required equipment is relatively minor compared to the cost of a new well and through installed extraction equipment and infrastructure operational at the time of the reserves estimate if the extraction is by means not involving a well.
Dry hole. A well found to be incapable of producing oil or natural gas in sufficient economic quantities.
Exploratory well. A well drilled to find a new field or to find a new reservoir in a field previously found to be productive of oil or natural gas in another reservoir. Generally, an exploratory well is any well that is not a development well, an extension well, a service well, or a stratigraphic test well.
Extension well. An extension well is a well drilled to extend the limits of a known reservoir.
Gross acres or gross wells. The total acres or wells, as the case may be, in which a working interest is owned.
Henry Hub price. A natural gas benchmark price quoted at settlement date average.
mbbl. One thousand barrels of oil or other liquid hydrocarbons.
mcf. One thousand cubic feet of gas.
mcf per day. One thousand cubic feet of gas per day.
mcfe. One thousand cubic feet of natural gas equivalents, based on a ratio of 6 mcf for each barrel of oil or NGLs, which reflects relative energy content.
mmbbl. One million barrels of oil or other liquid hydrocarbons.
mmbtu. One million British thermal units.
mmcf. One million cubic feet of gas.
mmcfe. One million cubic feet of gas equivalents.
NGLs. Natural gas liquids, which are naturally occurring substances found in natural gas, including ethane, butane, isobutane, propane and natural gasoline that can be collectively removed from produced natural gas, separated into these substances and sold.
Net acres or Net wells. The sum of the fractional working interests owned in gross acres or gross wells.
NYMEX. New York Mercantile Exchange.
Performance Share Unit (PSU). An equity-based compensation award that vests based upon the achievement of performance conditions.
Present Value (PV). The present value of future net cash flows, using a 10% discount rate, from estimated proved reserves, using constant prices and costs in effect on the date of the report (unless such prices or costs are subject to change pursuant to contractual provisions). The after-tax present value is the Standardized Measure.
Productive well. A well that is producing oil or gas or that is capable of production.
Proved developed non-producing reserves. Reserves that consist of (i) proved reserves from wells which have been completed and tested but are not producing due to lack of market or minor completion problems which are expected to be corrected and (ii) proved reserves currently behind the pipe in existing wells and which are expected to be productive due to both the well log characteristics and analogous production in the immediate vicinity of the wells.
Proved developed reserves. Proved reserves that can be expected to be recovered (i) through existing wells with existing equipment and operating methods or in which the cost of the required equipment is relatively minor compared to the cost of a new well and (ii) through installed extracting equipment and infrastructure operational at the time of the reserve estimate if the extraction is by means not involving a well.
Proved reserves. The quantities of crude oil, natural gas and NGLs, which by analysis of geological and engineering data, can estimate with reasonable certainty to be economically producible from a given date forward, from known reservoirs under existing economic conditions, operating methods and government regulations prior to the time at which contracts providing the right to operate expire, unless evidence indicates that renewal is reasonably certain, regardless of whether deterministic or probabilistic methods are used for the estimation. The project to extract the hydrocarbons must have commenced or the operator must be reasonably certain that it will commence the project within a reasonable time.
Proved undeveloped reserves. Proved reserves that are expected to be recovered from new wells on undrilled acreage, or from existing wells where a relatively major expenditure is required for recompletion.
Recompletion. The completion for production of an existing well bore in another formation from that in which the well has been previously completed.
Reserve life index. Proved reserves at a point in time divided by the then production rate (annually or quarterly).
Reserves. Estimated remaining quantities of oil and gas and related substances anticipated to be economically producible, as of a given date, by application of development projects to known accumulations. In addition, there must exist, or there must be a reasonable expectation that there will exist, the legal right to produce or a revenue interest in the production, installed means of delivering oil and gas or related substances to market, and all permits and financing required to implement the project.
Royalty acreage. Acreage represented by a fee mineral or royalty interest which entitles the owner to receive free and clear of all production costs a specified portion of the oil and gas produced or a specified portion of the value of such production.
Royalty interest. An interest in an oil and gas property entitling the owner to a share of oil and natural gas production free of costs of production.
Standardized Measure. The present value, discounted at 10%, of future net cash flows from estimated proved reserves after income taxes, calculated holding prices and costs constant at amounts in effect on the date of the report (unless such prices or costs are subject to change pursuant to contractual provisions) and otherwise in accordance with the SEC's rules for inclusion of oil and gas reserve information in financial statements filed with the SEC.
Stratigraphic test well. A stratigraphic test well is a drilling effort, geologically directed, to obtain information pertaining to a specific geologic condition. Such wells customarily are drilled without the intent of being completed for hydrocarbon production. The classification also includes tests identified as core tests and all types of expendable holes related to hydrocarbon exploration. Stratigraphic tests are classified as “exploratory type” if not drilled in a known area or “development type” if drilled in a known area.
tcfe. One trillion cubic feet of natural gas equivalents, with one barrel of NGLs or oil being equivalent to 6,000 cubic feet of natural gas.
Unconventional play. A term used in the oil and gas industry to refer to a play in which the targeted reservoirs generally fall into one of three categories: (1) tight sands, (2) coal beds or (3) shales. The reservoirs tend to cover large areas and lack the readily apparent traps, seals and discrete hydrocarbon-water boundaries that typically define conventional reservoirs. These reservoirs generally require fracture stimulation or other special recovery processes in order to achieve economic flow rates.
Undeveloped Oil and Gas Reserves. Oil and natural gas reserves of any category that are expected to be recovered from new wells on undrilled acreage or from existing wells where a relatively major expenditure is required for recompletion.
Unproved properties. Properties with no proved reserves.
Working interest. The operating interest that gives the owner the right to drill, produce and conduct operating activities on the property and a share of production, subject to all royalties, overriding royalties and other burdens, and to all costs of exploration, development and operations, and all risks in connection therewith.
Disclosures Regarding Forward-Looking Statements
This Annual Report on Form 10-K contains forward-looking statements within the meaning of Section 27A of the Securities Act of 1933, as amended ("Securities Act") and Section 21E of the Securities Exchange Act of 1934, as amended ("Exchange Act"). These are statements, other than statements of historical fact, that give current expectations or forecasts of future events, including without limitation, operational and financial strategies: drilling plans; planned wells; rig count; our 2025 capital budget; reserve estimates; financial flexibility; expectations regarding future economic and market conditions and their effects on us; our financial and operational outlook and ability to fulfill that outlook; our financial position, balance sheet, liquidity and capital resources and the benefits thereof. These statements typically contain words such as "anticipates," "believes," "estimates," "expects," "intend," "may," "outlook," "plans," "projects," "targets," "should," "would" or similar words, indicating that future outcomes are uncertain. Such forward-looking statements are intended to be subject to the safe harbor protections provided by the federal securities law. While we believe our assumptions concerning future events are reasonable, these expectations may not prove to be correct. A number of factors could cause results to differ materially from those indicated by such forward looking statements including, but not limited to:
•conditions in the oil and gas industry, including supply and demand levels for natural gas, NGLs and oil and the resulting impact on price;
•the availability and volatility of securities, capital or credit markets and the cost of capital to fund our operation and business strategy;
•accuracy and fluctuations in our reserves estimates due to regulations, reservoir performance or sustained low commodity prices;
•lack of, or disruption in, access to pipelines or other transportation methods;
•ability to develop existing reserves or add new reserves;
•drilling and operating risks;
•changes in the regulatory climate, either nationally or in our key operating market, that result in difficulty obtaining necessary approvals and permits;
•changes in geopolitical or economic conditions, including changes in interest rates and inflation rates, both domestically and internationally and more specifically in our key operating market;
•prices and availability of goods and services, including drilling rigs, completions equipment, materials, labor and third-party infrastructure;
•unforeseen hazards such as weather conditions, health pandemics, acts of war or terrorist acts;
•security threats, including cybersecurity threats and disruptions to our business and operations from breaches of our information technology systems or breaches of the information technology systems, facilities and infrastructure of third parties with which we transact business;
•changes in safety, health, environmental, tax and other regulations or requirements or initiatives including those addressing the impact of global climate change, air emissions, waste or water management;
•the availability, cost, terms and timing of issuance or execution of competition for and challenges to mineral licenses and leases and governmental and other permits and right-of-way and our ability to retain mineral leases;
•other geological, operating and economic considerations;
•risks related to our derivative activities;
•non-performance by third parties of their contractual obligations; or
•other factors discussed in Items 1 and 2. Business and Properties, Item 1A. Risk Factors, Item 7. Management Discussion and Analysis of Financial Condition and Results of Operations, Item 7A. Quantitative and Qualitative Disclosures about Market Risk and elsewhere in this report.
All forward-looking statements included in this report are based on information available to us on the date of this report. Except as required by law, we undertake no obligation to publicly update or revise any forward-looking statements after the date they are made, whether as a result of new information, future events or otherwise. All subsequent written and oral forward-looking statements attributable to us or persons acting on our behalf are expressly qualified in their entirety by the cautionary statements contained throughout this report.
PART I
ITEMS 1 AND 2. BUSINESS AND PROPERTIES
General
Range Resources Corporation ("Range"), a Delaware corporation, is a Fort Worth, Texas-based independent producer of natural gas, NGLs and oil (predominately condensate but referred to herein as "oil"), engaged in the exploration, development and acquisition of natural gas and oil properties in the Appalachian region of the United States. Our principal area of operations is the Marcellus Shale in Pennsylvania. Our corporate offices are located at 100 Throckmorton Street, Suite 1200, Fort Worth, Texas 76102 (telephone (817) 870-2601). We also maintain field offices in our area of operations. Our common stock is listed and traded on the New York Stock Exchange (the "NYSE") under the ticker symbol "RRC." Range Resources Corporation was incorporated in 1980.
As of December 31, 2024, we had 1,509 gross (1,431 net) operating producing wells that produced average daily production of 2.18 Bcfe per day for the year. As of December 31, 2024 we had estimated net proved reserves of 18.1 Tcfe of which 66% was proved developed and 64% was gas, 35% was NGLs and 1% was oil.
Available Information
Our corporate website is available at http://www.rangeresources.com. Information contained on or connected to our website is not incorporated by reference into this Form 10-K and should not be considered part of this report or any other filing we make with the SEC. We make available, free of charge on our website, the annual report on Form 10-K, our proxy statement, quarterly reports on Form 10-Q, current reports on Form 8-K and amendments to those reports, as soon as reasonably practicable after filing such reports with the SEC. Other information such as presentations, our corporate sustainability report, our Corporate Governance Guidelines, the charters of each board committee and the Code of Business Conduct and Ethics are available on our website and in print to any stockholder who provides a written request to the Corporate Secretary at 100 Throckmorton Street, Suite 1200, Fort Worth, Texas 76102. Our Code of Business Conduct and Ethics applies to all directors, officers and employees, including our President and Chief Executive Officer and Chief Financial Officer.
The SEC maintains a website that contains reports, proxy and information statements and other information regarding issuers, including Range, that file electronically with the SEC. The public can obtain any document we file with the SEC at http://www.sec.gov.
Our Business Strategy
Our overarching business objective is to build stockholder value through returns-focused development of our natural gas, NGLs and oil properties. The strategy to achieve our business objectives is to generate consistent cash flows from reserves and production through internally generated drilling projects. We routinely evaluate complementary, value-based acquisitions and dispositions. Our strategy requires us to make significant investments and financial commitments in technical staff, acreage, seismic data, drilling and completion technology and gathering and transportation arrangements to build drilling inventory and market our products. Our strategy has the following key elements that are anchored by our interests in the Marcellus Shale located in Pennsylvania which is anticipated to have remaining productive life in excess of 50 years.
Commit to Environmental Protection and Worker and Community Safety. We strive to implement technologies and commercial practices to minimize potential adverse impacts from the development of our properties on the environment, worker health and safety and the safety of the communities where we operate. We analyze and review performance while striving for continual improvement by working with peer companies, regulators, non-governmental organizations, industries not related to the oil and natural gas industry and other engaged stakeholders. We expect every employee to maintain safe operations, minimize environmental impact and conduct their daily business with the highest ethical standards. We have published on our website our 2024 Corporate Sustainability Report which includes more information related to our sustainability practices.
Concentrate in Our Core Operating Area. We currently operate in Pennsylvania. Concentrating our drilling and producing activities allows us to develop the regional expertise needed to interpret specific geological and operating conditions and develop economies of scale. Our management team has extensive experience in executing a multi-rig development drilling program, planning long-term logistics, marketing production and prudent capital allocation. Operating in our core area also allows us to pursue our goal of consistent production at attractive returns. We intend to further develop our acreage and improve our operating and financial results through the use of technology and detailed analysis of our properties. We periodically evaluate and pursue acquisition opportunities (including opportunities to acquire particular natural gas and oil properties or entities owning natural gas and oil assets) and at any given time we may be in various stages of evaluating such opportunities.
Focus on Cost Efficiency. We concentrate in areas which we believe to have sizable hydrocarbon deposits in place that will allow economic production while controlling costs. Because there is little long-term competitive sales price advantage available to a
commodity producer, the costs to find, develop, and produce a commodity are important to organizational sustainability and long-term stockholder value creation. We endeavor to control costs such that our cost to find, develop and produce natural gas, NGLs and oil is one of the lowest in the industry. We operate almost all of our total net production and believe that our extensive knowledge of the geologic and operating conditions in the areas where we operate provides us with the ability to achieve operational efficiencies.
Maintain a High-Quality Multi-Year Drilling Inventory. We focus on areas with multiple prospective and productive horizons and development opportunities. We use our technical expertise to build and maintain a multi-year drilling inventory. We believe that a large, high-quality multi-year inventory of drilling projects increases our ability to efficiently plan for economic production. Currently, we have an estimated 31.9 million lateral feet of drilling inventory in the Marcellus Shale, both proved and unproved.
Maintain a Long-Life Reserve Base with a Low Base Decline Rate. Long-life natural gas and oil reserves provide a more stable platform than short-life reserves. Long-life reserves with relatively low decline rates reduce reinvestment risk as they lessen the amount of reinvestment capital deployed each year to replace production. Long-life natural gas and oil reserves also assist us in minimizing costs as stable production makes it easier to build and maintain operating economies of scale and also offer upside from technology enhancements.
Market Our Products to a Large Number of Customers in Diverse Markets Under a Variety of Commercial Terms. We market our natural gas, NGLs, and oil to a large number of customers in both domestic and international markets to maximize cash flow and diversify risk. We hold numerous firm transportation contracts on multiple pipelines to enable us to transport and sell natural gas and NGLs in the Midwest, Gulf Coast, Southeast, Northeast and international markets. We sell our products under a variety of price indices and price formulas that assist us in optimizing regional price differentials and commodity price volatility.
Maintain Operational and Financial Flexibility. Because of the risks involved in drilling, coupled with changing commodity prices, we are flexible and may adjust our capital budget or other projections throughout the year. We are the operator of almost all of our total net production. This operating control allows us to better execute our strategies of enhancing returns through operational and cost efficiencies and increasing recovery of hydrocarbons by seeking to continually improve our drilling techniques, completion methodologies and reservoir evaluation process. We believe our asset base, revenue diversity, low-cost structure and strong balance sheet provide us the flexibility we need to thrive across various commodity price environments. We also believe in maintaining ample liquidity, using commodity derivatives to help stabilize our realized prices, and focusing on financial discipline. We believe this provides more predictable cash flows and financial results. With a year-end 2024 cash balance of $304.5 million and $1.3 billion in available and committed borrowing capacity under our bank credit facility, we are well-positioned to invest in the business through cycles while also returning capital to stockholders.
Provide Employee Equity Ownership and Incentive Compensation Aligned with Our Stakeholders’ Interests. We want our employees to think and act like business owners. To achieve this, we reward and encourage them through equity ownership in Range. All full-time employees are eligible to receive equity grants. As of December 31, 2024, our employees and directors owned equity securities in our benefit plans (vested and unvested) that had an aggregate market value of approximately $168.6 million. We seek to align our incentive compensation with stakeholders’ interests and key business objectives and members of our board of directors annually engage with stockholders to discuss our incentive compensation framework.
Outlook for 2025
For 2025, we expect our capital budget to be in the range of $650 million to $690 million for natural gas, NGLs, and oil related activities, excluding any potential acquisitions, for which we do not budget. This budget includes $570 million to $600 million for drilling costs and $80 million to $90 million for acreage and other expenditures and is expected to achieve modest growth of 2025 production relative to 2024 production volumes, while also supporting our longer-term operational plans. As has been our historical practice, we will periodically review our capital expenditures throughout the year and may adjust the budget based on commodity prices, drilling success and other factors. Throughout the year, we allocate capital on a project-by-project basis. Our expectation for 2025 is for our capital expenditure program to be funded with operating cash flows. However, in the event our 2025 capital investments exceed our internally generated cash flow, we may reduce the capital budget, draw on our bank credit facility and/or debt or equity financing may be used to fund these investments. The prices we receive for our natural gas, NGLs and oil production are largely based on current market prices, which are beyond our control. The price risk on a portion of our forecasted natural gas, NGLs and oil production for 2025 is mitigated using commodity derivative contracts and we intend to continue to enter into these transactions.
Our primary near-term focus includes the following:
•be good stewards of the environment;
•achieve competitive returns on investments;
•develop our world-class assets through disciplined capital investments;
•improve operational efficiencies and economic returns;
•return capital to stockholders while maintaining a strong balance sheet;
•continue to reduce emissions and achieve net-zero Scope 1 and Scope 2 GHG emissions;
•attract and retain quality employees; and
•align employee incentives with our stockholders’ interests and key business objectives.
Property Overview and Geographical Information
Our natural gas and oil operations are concentrated in the Appalachian region of the United States, and more specifically, in the Marcellus Shale in Pennsylvania. Our properties consist of interests in developed and undeveloped natural gas and oil leases. These interests entitle us to drill for and produce natural gas, NGLs and oil from specific areas. Our interests are mostly in the form of working interests and, to a lesser extent, royalty and overriding royalty interests.
We hold a large portfolio of drilling opportunities beyond the five-year horizon of proved reserves and therefore a significant unbooked resource potential within the Marcellus, Utica/Point Pleasant and Upper Devonian formations. We own 1,431 net producing wells in Pennsylvania, almost all of which we operate. Our average working interest in this region is 95%. As of December 31, 2024 we have approximately 871,000 gross (763,000 net) acres under lease. During 2024, we averaged approximately two horizontal drilling rigs in the field and expect to run an average of two horizontal drilling rigs throughout 2025. Substantially all of our reserves and production are located in the Marcellus Shale.
Proved Reserves
The following table sets forth our estimated proved reserves for year ended 2024 based on the average of prices on the first day of each month of the given calendar year, in accordance with SEC rules. We have no natural gas, NGLs or oil reserves from non-traditional sources. During the year ended December 31, 2024, we did not file any reports with any federal authority or agency with respect to our estimate of natural gas, NGLs and oil reserves. Additionally, we do not provide optional disclosures of probable or possible reserves.
| | | | | | | | | | | | | | | | | | | | |
| | Summary of Oil and Gas Reserves as of Year-End Based on Average Prices | |
Reserve Category | | Natural Gas
(Mmcf) | | | NGLs
(Mbbls) | | | Oil
(Mbbls) | | | Total
(Mmcfe) (a) | | | % | |
As of December 31, 2024: | | | | | | | | | | | | | | | |
Proved | | | | | | | | | | | | | | | |
Developed | | | 7,929,452 | | | | 647,430 | | | | 19,460 | | | | 11,930,793 | | | | 66 | % |
Undeveloped | | | 3,721,297 | | | | 395,903 | | | | 17,328 | | | | 6,200,682 | | | | 34 | % |
Total Proved | | | 11,650,749 | | | | 1,043,333 | | | | 36,788 | | | | 18,131,475 | | | | 100 | % |
| |
(a) | Oil and NGLs volumes are converted to mcfe at the rate of one barrel equals six mcf based upon the relative energy content of oil to natural gas, which is not indicative of the relationship between oil and natural gas prices. |
For additional information regarding estimates of our proved reserves, the qualifications of the preparers of our reserve estimates, the evaluation of such estimates by our independent petroleum engineering consultants, our processes and controls with respect to our reserves estimates and other information about our reserves, including the risks inherent in our estimates of proved reserves, refer to the Supplemental Information on Natural Gas and Oil Exploration, Development and Production Activities included in Note 16 of our consolidated financial statements for more information.
Proved Reserves (PV-10)
The following table sets forth the estimated future net cash flows, excluding open derivative contracts, from proved reserves, the present value of those net cash flows discounted at a rate of 10% (PV-10)(a), and the expected benchmark prices and average field prices used in projecting net cash flows over the past three years. The benchmark prices used are based on the average of prices on the first day of each month of the given calendar year, in accordance with SEC rules. Our reserve estimates do not include any probable or possible reserves (in millions, except prices):
| | | | | | | | | | | | |
| | 2024 | | | 2023 | | | 2022 | |
Future net cash flows | | $ | 15,261 | | | $ | 21,748 | | | $ | 78,650 | |
Present value: | | | | | | | | | |
Before income tax | | | 5,454 | | | | 7,926 | | | | 29,554 | |
After income tax (Standardized Measure) | | | 4,691 | | | | 6,838 | | | | 24,545 | |
Benchmark prices (NYMEX): | | | | | | | | | |
Gas price (per mcf) | | | 2.13 | | | | 2.62 | | | | 6.36 | |
Oil price (per bbl) | | | 74.88 | | | | 78.10 | | | | 94.13 | |
Wellhead prices: | | | | | | | | | |
Gas price (per mcf) | | | 1.74 | | | | 2.20 | | | | 6.08 | |
Oil price (per bbl) | | | 63.39 | | | | 68.32 | | | | 87.14 | |
NGLs price (per bbl) | | | 24.40 | | | | 24.91 | | | | 38.35 | |
| |
(a) | PV-10 is considered a non-GAAP financial measure as defined by the U.S. Securities and Exchange Commission (the "SEC"). We believe that the presentation of PV-10 is relevant and useful to our investors as supplemental disclosure to the standardized measure, or after-tax amount, because it presents the discounted future net cash flows attributable to our proved reserves before taking into account future corporate income taxes and our current tax structure. While the standardized measure is dependent on the unique tax situation of each company, PV-10 is based on prices and discount factors that are consistent for all companies. Because of this, PV-10 can be used within the industry and by creditors and security analysts to evaluate estimated net cash flows from proved reserves on a more comparable basis. The difference between the standardized measure and the PV-10 amount is the discounted estimated future income tax of $2.9 billion at December 31, 2024. Oil and NGLs volumes are converted at the rate of one barrel equals six mcf based on approximate relative energy content. |
Future net cash flows represent projected revenues from the sale of proved reserves, net of production and development costs (including transportation and gathering expenses, operating expenses and production taxes). Revenues are based on a twelve-month unweighted average of the first day of the month pricing, without escalation. Future cash flows are reduced by estimated production costs, administrative costs, costs to develop and produce the proved reserves and abandonment costs, all based on current economic conditions at each year-end. There can be no assurance that the proved reserves will be produced in the future or that prices, production or development costs will remain constant. There are numerous uncertainties inherent in estimating reserves and related information and different reservoir engineers often arrive at different estimates for the same properties.
Production, Sales Price and Production Costs
The following presents historical information about our total production volumes for natural gas, NGLs and oil; average sales prices and average production costs:
| | | | | | | | | | | | |
| | Year Ended December 31, | |
| | 2024 | | | 2023 | | | 2022 | |
Production Volumes: | | | | | | | | | |
Natural gas (mcf) | | | 545,415,974 | | | | 538,084,671 | | | | 539,442,624 | |
NGLs (bbls) | | | 39,622,576 | | | | 37,939,700 | | | | 36,392,033 | |
Oil (bbls) | | | 2,180,528 | | | | 2,475,306 | | | | 2,715,681 | |
Total mcfe (a) | | | 796,234,598 | | | | 780,574,707 | | | | 774,088,908 | |
Sales Prices: (b) | | | | | | | | | |
Natural gas (per mcf) | | $ | 1.93 | | | $ | 2.29 | | | $ | 6.24 | |
NGLs (per bbl) | | | 25.77 | | | | 24.61 | | | | 35.96 | |
Oil (per bbl) | | | 64.44 | | | | 67.29 | | | | 87.79 | |
Total (per mcfe) (a) | | | 2.78 | | | | 2.99 | | | | 6.34 | |
Production Costs: | | | | | | | | | |
Lease operating (per mcfe) | | $ | 0.12 | | | $ | 0.12 | | | $ | 0.11 | |
Taxes other than income (per mcfe) (c) | | | 0.03 | | | | 0.03 | | | | 0.05 | |
| |
(a) | Oil and NGLs volumes are converted at the rate of one barrel equals six mcf based on approximate relative energy content. |
(b) | Does not include derivative settlements or deductions for third-party transportation, gathering or processing costs. |
(c) | Includes Pennsylvania impact fee. |
Producing Wells
The following table sets forth information relating to productive wells at December 31, 2024. If we own both a royalty and a working interest in a well, such interest is included in the table below. Wells are classified as natural gas or oil according to their predominant production stream. We do not have any dual completions.
| | | | | | | | | | | | |
| | | | | | | | Average | |
| | Total Wells | | | Working | |
| | Gross | | | Net | | | Interest | |
Natural gas | | | 1,508 | | | | 1,431 | | | | 95 | % |
Oil | | | 1 | | | | — | | | | 3 | % |
Total | | | 1,509 | | | | 1,431 | | | | 95 | % |
Drilling Activity
The following table summarizes drilling activity for the past three years. Gross wells reflect the sum of all wells in which we own an interest. Net wells reflect the sum of our working interests in gross wells. This information should not be indicative of future performance nor should it be assumed that there was any correlation between the number of productive wells and the natural gas and oil reserves generated thereby. As of December 31, 2024, we had 32 gross (30 net) wells in the process of drilling or active completions stage. In addition, there were 26 gross (25 net) wells waiting on completion or waiting on pipelines at year-end 2024.
| | | | | | | | | | | | | | | | | | | | | | | | |
| | 2024 | | | 2023 | | | 2022 | |
| | Gross | | | Net | | | Gross | | | Net | | | Gross | | | Net | |
Development wells | | | | | | | | | | | | | | | | | | |
Productive | | | 52.0 | | | | 51.7 | | | | 50.0 | | | | 47.4 | | | | 60.0 | | | | 59.0 | |
Dry | | | — | | | | — | | | | — | | | | — | | | | — | | | | — | |
Exploratory wells | | | | | | | | | | | | | | | | | | |
Productive | | | — | | | | — | | | | — | | | | — | | | | — | | | | — | |
Dry | | | — | | | | — | | | | — | | | | — | | | | — | | | | — | |
Total wells | | | | | | | | | | | | | | | | | | |
Productive | | | 52.0 | | | | 51.7 | | | | 50.0 | | | | 47.4 | | | | 60.0 | | | | 59.0 | |
Dry | | | — | | | | — | | | | — | | | | — | | | | — | | | | — | |
Total | | | 52.0 | | | | 51.7 | | | | 50.0 | | | | 47.4 | | | | 60.0 | | | | 59.0 | |
Success ratio | | | 100 | % | | | 100 | % | | | 100 | % | | | 100 | % | | | 100 | % | | | 100 | % |
Gross and Net Acreage
We own interests in developed and undeveloped acreage. These ownership interests generally take the form of working interests in natural gas and oil leases that have varying terms. Developed acreage generally includes leased acreage that is allocated or assignable to producing wells or wells capable of production even though shallower or deeper horizons may not have been fully explored. Undeveloped acreage includes leased acres on which wells have not been drilled or completed to a point that would permit the production of commercial quantities of natural gas or oil, regardless of whether or not the acreage contains proved reserves. The following table sets forth certain information regarding the developed and undeveloped acreage in which we own a working interest as of December 31, 2024. Acreage related to option acreage, royalty, overriding royalty and other similar interests is excluded from this summary:
| | | | | | | | | | | | | | | | | | | | | | | | |
| | Developed Acres | | | Undeveloped Acres | | | Total Acres | |
| | Gross | | | Net | | | Gross | | | Net | | | Gross | | | Net | |
New York | | | — | | | | — | | | | 2,265 | | | | 567 | | | | 2,265 | | | | 567 | |
Oklahoma | | | 12,339 | | | | 5,694 | | | | 3,009 | | | | 3,636 | | | | 15,348 | | | | 9,330 | |
Pennsylvania | | | 763,681 | | | | 663,517 | | | | 99,588 | | | | 93,841 | | | | 863,269 | | | | 757,358 | |
Texas | | | 3,234 | | | | 1,974 | | | | 9,690 | | | | 2,348 | | | | 12,924 | | | | 4,322 | |
West Virginia | | | 5,876 | | | | 5,197 | | | | — | | | | — | | | | 5,876 | | | | 5,197 | |
| | | 785,130 | | | | 676,382 | | | | 114,552 | | | | 100,392 | | | | 899,682 | | | | 776,774 | |
Average working interest | | | | | | 86 | % | | | | | | 88 | % | | | | | | 86 | % |
Undeveloped Acreage Expirations
The table below summarizes by year our undeveloped acreage scheduled to expire in the next five years.
| | | | | | | | | | | | |
| | Acres | | | % of Total | |
As of December 31, | | Gross | | | Net | | | Undeveloped | |
2025 | | | 9,730 | | | | 9,003 | | | | 9 | % |
2026 | | | 17,959 | | | | 17,204 | | | | 17 | % |
2027 | | | 10,619 | | | | 10,493 | | | | 10 | % |
2028 | | | 15,759 | | | | 13,636 | | | | 14 | % |
2029 | | | 16,711 | | | | 16,220 | | | | 16 | % |
In all cases, the drilling of a commercial well will hold acreage beyond the lease expiration date. We have leased acreage that is subject to lease expiration if initial wells are not drilled within a specified period, generally between three and five years. However, we have in the past been able, and expect in the future to be able to extend the lease terms of some of these leases and sell or exchange some of these leases with other companies. The expirations included in the table above do not take into account the fact that we may be able to extend the lease terms. We do not expect to lose significant lease acreage because of failure to drill due to inadequate capital, equipment or personnel. However, based on our evaluation of prospective economics or when we do not intend to drill a property prior to lease expiration, we have allowed acreage to expire and we expect to allow additional acreage to expire in the future. We also believe acres needed in the future for our development plans can be leased again. We currently have no proved undeveloped reserve locations scheduled to be drilled after lease expiration.
Title to Properties
We believe that we have satisfactory title to all of our producing properties in accordance with generally accepted industry standards. As is customary in the industry, in the case of undeveloped properties, often minimal investigation of record title is made at the time of lease acquisition. Investigations are made before the consummation of an acquisition of producing properties and before commencement of drilling operations on undeveloped properties. Individual properties may be subject to burdens that we believe do not materially interfere with the use, or affect the value, of the properties. Burdens on properties may include:
•customary royalty or overriding royalty interests;
•liens incident to operating agreements and for current taxes;
•obligations or duties under applicable laws;
•development obligations under oil and gas leases; or
Competition
Competition exists in all sectors of the oil and gas industry and we encounter substantial competition in developing and acquiring natural gas and oil properties, securing and retaining personnel, conducting drilling and field operations and marketing production. Competitors in exploration, development, acquisitions and production include the major oil and gas companies as well as numerous independent oil and gas companies, individual proprietors and others. Although our sizable acreage position and core area concentration provide some competitive advantages, many competitors have financial and other resources substantially exceeding ours. Therefore, competitors may be able to pay more for desirable leases and evaluate, bid for and purchase a greater number of properties or prospects than our financial or personnel resources allow. We face competition for pipeline and other services to transport our product to markets, particularly in the Northeastern portion of the United States. We also face competition from companies that supply alternative sources of energy, such as wind, solar power and other renewables. Competition will increase as alternative energy technologies become more reliable and if governments throughout the world support or mandate the use of such alternative energy.
Competitive advantage is gained in the oil and gas exploration and development industry by having high-quality inventory and by employing well-trained and experienced personnel who make prudent capital investment decisions based on management direction, embrace technological innovation, focus on price and cost management and safely develop and operate our properties. We have a team of dedicated employees who represent the professional disciplines and sciences that we believe are necessary to allow us to maximize the long-term profitability and net asset value inherent in our physical assets. For more information, see Item 1A. Risk Factors.
Marketing and Customers
We market the majority of our natural gas, NGLs, and oil production from the properties we operate for our working interest, and that of the other working interest owners. We pay our royalty owners from the sales attributable to our working interest. Natural gas, NGLs and oil purchasers are selected on the basis of price, credit quality and service reliability. For information on purchasers of our natural gas, NGLs and oil production that accounted for 10% or more of consolidated revenue, see Note 2 to our consolidated financial statements. Because alternative purchasers of natural gas and oil are usually readily available, we believe that the loss of any of these purchasers would not have a material adverse effect on our operations. Production from our properties is marketed using methods that are consistent with industry practice. Natural gas is a commodity and, therefore we typically receive market-based pricing for our produced natural gas. Sales prices for natural gas, NGLs and oil production are negotiated based on factors normally considered in the industry, such as index or spot price, distance from the well to the pipeline, commodity quality and prevailing supply and demand conditions.
We contract with a third-party to process our natural gas and extract from the produced natural gas heavier hydrocarbon streams (consisting predominately of ethane, propane, isobutane, normal butane and natural gasoline). Our natural gas production is sold to utilities, marketing and midstream companies and industrial users. Our NGLs production is typically sold to petrochemical end users, marketers/traders (both domestically and internationally) and natural gas processors. Our oil production is sold to crude oil processors, transporters and refining and marketing companies.
We enter into derivative transactions with unaffiliated third parties for a varying portion of our production to achieve more predictable cash flows and to reduce our exposure to short-term fluctuations in natural gas, NGLs and oil prices. For a more detailed discussion, see Item 7. Management’s Discussion and Analysis of Financial Condition and Results of Operations and Item 7A. Quantitative and Qualitative Disclosures about Market Risk.
We incur gathering and transportation expense to move our production from the wellhead, tanks and processing plants to purchaser-specified delivery points. These expenses vary and are primarily based on volume, distance shipped and the fee charged by the third-party gatherers and transporters. We also have processing contracts based on percent of proceeds. Transportation capacity on these gathering and transportation systems and pipelines is occasionally constrained. Our Appalachian production is transported on third-party pipelines on which we hold a certain amount of long-term contractual capacity. We have entered into several ethane agreements to sell or transport ethane from our Marcellus Shale area. We attempt to balance sales, storage and transportation positions, which can include purchase of commodities from third parties for resale, to utilize contracted transportation capacity.
We have not experienced significant difficulty to date in finding a market for all of our production as it becomes available or in transporting our production to those markets; however, there is no assurance that we will always be able to transport and market all of our production or obtain favorable prices. For more information, see Item 1A. Risk Factors – Our business depends on natural gas and oil transportation and on NGLs processing facilities, which are owned by others and depends on our ability to contract with those parties.
Seasonal Nature of Business
Generally, but not always, the demand for natural gas and propane decreases during the spring and fall months and increases during the winter months and, in some areas, also increases during the summer months. Seasonal anomalies such as mild winters or summers also may impact this demand. In addition, pipelines, utilities, local distribution companies and industrial end-users utilize natural gas storage facilities and purchase some of their anticipated winter requirements during the summer. This can also impact the seasonality of demand. Exports can also impact demand based on the seasonality of global markets.
Markets
Our ability to produce and market natural gas, NGLs and oil profitably depends on numerous factors beyond our control. The effect of these factors cannot be accurately predicted or anticipated. Although we cannot predict the occurrence of events that may affect commodity prices or the degree to which commodity prices will be affected, the prices for any commodity that we produce will generally approximate current market prices in the geographic region where we deliver our production.
Human Capital Management
We believe our employees provide the foundation of our success. Successful execution of our strategy is dependent on attracting, developing and retaining our skilled employees and members of our management team. The abilities, experience and industry knowledge of our employees significantly benefit our operations and performance. In order to maximize the contributions of our employees, we regularly evaluate, modify and enhance our policies and practices, including compensation to increase employee engagement, productivity and efficiency. As of January 1, 2025, we had 565 full time employees, none of whom are currently covered by a labor union or other collective bargaining arrangement.
Compensation and Benefits. We review compensation for all employees at least annually to adjust for market conditions and to attract and retain a highly skilled workforce. We encourage our employees to take full advantage of our benefits and programs we offer. In addition to competitive base wages, other benefits include an annual bonus plan, long-term incentive plan, company-match 401(k) plan, healthcare and insurance benefits, flexible spending accounts and employee assistance programs.
Our compensation program includes eligibility for all full-time employees to receive equity awards which we believe is uncommon among our peers and encourages every employee to think like an owner of the business and be vested in its success. We believe these practices, and those further described below, are the key drivers in our very low voluntary turnover rates, which averaged less than 2% over the five-year period ended December 31, 2024. We believe our high retention rate is in part a result of our corporate culture focused on teamwork and a commitment to employee development and career advancement.
Health and Safety. We believe health and safety is a core value ingrained in all aspects of our business. This value is reflected in our strong safety culture that emphasizes personal responsibility and safety leadership both for our employees and our contractors on our worksites. Our comprehensive environmental, health and safety (EHS) management system establishes a corporate governance framework for EHS compliance and performance and covers all elements of our operating lifecycle. These practices and the commitment of our management and our employees to our culture of safety have resulted in only three OSHA recordable incidents in 3.6 million work hours over the three-year period from 2022 through 2024, for an average employee Total Recordable Incident Rate of 0.17 over that three-year period.
Recruiting, Hiring and Advancement. Due to the cyclical nature of our business and the fluctuations in activity that can occur, we take a conservative approach to our headcount, carefully evaluating whether a new hire is necessary for an open position or whether we can fill the position by expanding the role of a current employee or several employees. In this way, we provide employees with opportunities to learn new roles and develop their skills horizontally and vertically and limit or minimize layoffs and fluctuations when downturns occur. We support employees in pursuing training opportunities to expand their professional skills. We have also implemented development programs that are designed to build leadership capabilities at all levels.
We identify qualified candidates by promoting positions internally, engaging in recruiting through our website platforms, campus outreach, internships and attending job fairs. In our recruiting and hiring efforts, we seek to foster a culture of mutual respect and strictly comply with all applicable federal, state and local laws governing non-discrimination in employment. We treat all applicants with the same high level of respect regardless of their gender, ethnicity, religion, national origin, age, marital status, political affiliation, sexual orientation, gender identity, disability or protected veteran status. This philosophy extends to all employees throughout the lifecycle of employment.
Additional information about our commitment to human capital management is available on our website. Note that the information on our website is not incorporated by reference into this filing.
Executive Officers of the Registrant
Our executive officers and their ages as of February 1, 2025, are as follows:
| | | | |
| | Age | | Position |
Dennis L. Degner | | 52 | | Chief Executive Officer and President |
Mark S. Scucchi | | 47 | | Executive Vice President – Chief Financial Officer |
Erin W. McDowell | | 46 | | Senior Vice President – General Counsel and Corporate Secretary |
Ashley S. Kavanaugh | | 43 | | Vice President – Controller and Principal Accounting Officer |
Dennis L. Degner, chief executive officer and president, joined Range in 2010. Mr. Degner was named chief executive officer effective May 21, 2023. Mr. Degner previously served as chief operating officer and has more than 25 years of oil and gas experience, having worked in a variety of technical and managerial positions across the United States including Texas, Louisiana, Wyoming, Colorado and Pennsylvania. Prior to joining Range, Mr. Degner held positions with Encana, Sierra Engineering and Halliburton. Mr. Degner is a member of the Society of Petroleum Engineers and has been published for his work on active roles played in the deployment of new technologies. Mr. Degner holds a Bachelor of Science Degree in Agricultural Engineering from Texas A&M University.
Mark S. Scucchi, executive vice president – chief financial officer, joined Range in 2008. Mr. Scucchi was named senior vice president – chief financial officer in 2018 and executive vice president in 2024. Previously, Mr. Scucchi served as vice president – finance & treasurer. Prior to joining Range, Mr. Scucchi was with JPMorgan Securities providing commercial and investment banking services to small and mid-cap technology companies. Before joining JPMorgan Securities, Mr. Scucchi spent a number of years at Ernst & Young LLP in the audit practice. Mr. Scucchi earned a Bachelor of Science in Business Administration from Georgetown University and a Master of Science in Accountancy from the University of Notre Dame. Mr. Scucchi is a CFA Charterholder and a licensed certified public accountant in the state of Texas.
Erin W. McDowell, senior vice president – general counsel and corporate secretary, joined Range in January 2015 as division counsel for the Appalachia Division and was promoted to vice president, deputy general counsel & assistant corporate secretary before being appointed to general counsel and corporate secretary in March 2023. Ms. McDowell has nearly 20 years of legal experience. Prior to joining Range, Ms. McDowell spent over ten years with the law firm Eckert Seamans Cherin & Mellott in the areas of commercial litigation and environmental regulatory counseling. Ms. McDowell graduated from Bucknell University, magna cum laude, with a Bachelor of Arts in Economics and Environmental Studies and then earned a Juris Doctor from the University of Pittsburgh School of Law.
Ashley S. Kavanaugh, vice president – controller and principal accounting officer, joined Range in 2012. She has held the positions of financial reporting manager and vice president – accounting before being appointed to principal accounting officer in March 2024. Prior to joining Range, she held various positions of increasing responsibility with Ernst & Young LLP beginning in 2004. Ms. Kavanaugh earned a Bachelor of Business Administration and Master of Accountancy from Baylor University and is a licensed certified public accountant in the state of Texas.
Governmental Regulation
Enterprises that sell securities in public markets are subject to regulatory oversight by federal agencies such as the SEC. The NYSE, a private stock exchange, also requires us to comply with listing requirements for our common stock. This regulatory oversight imposes on us the responsibility for establishing and maintaining disclosure controls and procedures and internal controls over financial reporting. Additionally, we are responsible for ensuring that the financial statements and other information included in submissions to the SEC do not contain any untrue statement of a material fact or omit to state a material fact necessary to make the statements made in such submissions not misleading. Failure to comply with the NYSE listing rules and regulations of the SEC could subject us to litigation from public or private plaintiffs. Failure to comply with the rules of the NYSE could also result in the de-listing of our common stock, which could have an adverse effect on the market price of our common stock. Compliance with some of these rules and regulations is costly and regulations are subject to change or reinterpretation.
Exploration and development and the production and sale of natural gas and NGLs are subject to extensive federal, state and local regulations, mandates and trade agreements. Governmental policies affecting the energy industry, such as taxes, tariffs, duties, price controls, subsidies, incentives, foreign exchange rates and import and export restrictions, can influence the viability and volume of production of certain commodities, the volume and types of imports and exports, whether unprocessed or processed commodity products are traded, and industry profitability. For example, the United States government has in the past imposed, and may in the future impose, tariffs on certain foreign imports and any resulting retaliation by those foreign governments may disrupt aspects of the energy market. Disruption and uncertainty of this sort can affect the price of natural gas and NGLs and may cause us to change our plans for exploration and production levels. An overview of relevant federal, state and local regulations is set forth below. We believe we are in substantial compliance with currently applicable laws and regulations, and the continued substantial compliance with existing requirements will not have a material adverse effect on our financial position, cash flows or results of operations. However, current regulatory requirements may change, currently unforeseen environmental incidents may occur, or past non-compliance with environmental laws or regulations may be discovered. See Item 1A. Risk Factors – The natural gas industry is subject to extensive regulation. We do not believe we are affected differently by these regulations than others in the industry.
General Overview. Our oil and gas operations are subject to various federal, state and local laws and regulations. Generally speaking, these regulations relate to matters that include, but are not limited to:
•acquisition of seismic data;
•location of wells, pads, roads, impoundments, facilities or rights of way;
•size of drilling and spacing units or proration units;
•number of wells that may be drilled in a unit;
•unitization or pooling of oil and gas properties;
•drilling, casing and completion of wells;
•issuance of permits in connection with exploration, drilling, production, gathering, processing and transportation;
•well production, maintenance, operations and security;
•spill prevention and containment plans;
•emissions permitting or limitations;
•protection of endangered species;
•use, transportation, storage and disposal of hazardous waste, fluids and materials incidental to natural gas and NGLs operations;
•surface usage and the restoration of properties upon which wells have been drilled;
•calculation and disbursement of royalty payments and production taxes;
•plugging and abandoning of wells;
•water withdrawal and water transfer;
•operation of underground injection wells to dispose of produced water and other liquids;
•marketing of production;
•transportation of production; and
•health and safety of employees and contract service providers.
In August 2005, the United States Congress ("Congress") enacted the Energy Policy Act of 2005 ("EPAct 2005"). Among other matters, EPAct 2005 amends the Natural Gas Act ("NGA") to make it unlawful for "any entity," including otherwise non-jurisdictional producers such as Range, to use any deceptive or manipulative device or contrivance in connection with the purchase or sale of natural gas or the purchase or sale of transportation services subject to regulation by the Federal Energy Regulatory Commission (the "FERC"), in contravention of rules prescribed by the FERC. In January 2006, the FERC issued rules implementing this provision. The rules make it unlawful in connection with the purchase or sale of natural gas subject to the jurisdiction of the FERC, or the purchase or sale of transportation services subject to the jurisdiction of the FERC, for any entity, directly or indirectly, to use or employ any device, scheme or artifice to defraud; to make any untrue statement of material fact or omit any such statement necessary to make the statements not misleading; or to engage in any act or practice that operates as a fraud or deceit upon any person. EPAct 2005 also gives the FERC authority to impose civil penalties for violations of the NGA. On January 14, 2025, FERC's final rule became effective increasing the maximum civil penalty for violations of the NGA from $1,544,521 per day per violation to $1,584,648 per day per violation to account for inflation pursuant to the Federal Civil Penalties Inflation Adjustment Improvement Act of 2015. The anti-manipulation rule does not apply to activities that relate only to intrastate or other non-jurisdictional sales or gathering, but does apply to activities or otherwise non-jurisdictional entities to the extent the activities are conducted in connection with gas sales, purchases or transportation subject to the FERC’s jurisdiction which includes the reporting requirements under Order 704 (as defined and described below). Therefore, EPAct 2005 was a significant expansion of the FERC’s enforcement authority. Range has not been affected differently than any other producer of natural gas by this act. Failure to comply with applicable laws and regulations with respect to EPAct 2005 could result in substantial penalties and the regulatory burden on the industry increases the cost of doing business and affects profitability. Although we believe we are in substantial compliance with all applicable laws and regulations with respect to EPAct 2005, such laws and regulations are frequently amended or reinterpreted. Therefore, we are unable to predict the future costs or impact of compliance. Additional proposals and proceedings that affect the oil and natural gas industry are regularly considered by Congress, the states, the FERC, other federal regulatory entities and the courts. We cannot predict when or whether any such proposals may become effective.
In December 2007, the FERC issued a final rule on the annual natural gas transaction reporting requirements, as amended by subsequent orders on rehearing ("Order 704"). Under Order 704, wholesale buyers and sellers of more than 2.2 million Mmbtus of physical natural gas in the previous calendar year, including natural gas gatherers and marketers, are required to report to the FERC, on May 1st of each year, aggregate volumes of natural gas purchased or sold at wholesale in the prior calendar year to the extent such transactions utilize, contribute to, or may contribute to the formation of price indices. It is the responsibility of the reporting entity to determine which individual transactions should be reported based on the guidance of Order 704. Order 704 also requires market participants to indicate whether they report prices to any index publishers and, if so, whether their reporting complies with the FERC’s policy statement on price reporting.
Intrastate gas pipeline transportation rates are subject to regulation by state regulatory commissions. The basis for intrastate gas pipeline regulation, and the degree of regulatory oversight and scrutiny given to intrastate gas pipeline rates, varies from state to state. Additional proposals and proceedings that might affect the gas industry are considered from time to time by Congress, the FERC, state regulatory bodies and the courts. We cannot predict when or if any such proposals might become effective or their impact, if any, on our operations. We believe that the regulation of intrastate gas pipeline transportation rates will not affect our operations in any way that is materially different from its effects on similarly situated competitors.
Natural gas processing. We depend on gas processing operations owned and operated by third parties. There can be no assurance that these processing operations will continue to be unregulated in the future. However, although the processing facilities may not be directly related, other laws and regulations may affect the availability of gas for processing, such as state regulation of production rates and maximum daily production allowable from gas wells, which could impact our processing.
Gas gathering. Section 1(b) of the NGA exempts gas gathering facilities from FERC jurisdiction. We believe that our gathering facilities meet the tests the FERC has traditionally used to establish a pipeline system’s status as a non-jurisdictional gatherer. There is, however, no bright-line test for determining the jurisdictional status of pipeline facilities. Moreover, the distinction between FERC-regulated transmission services and federally unregulated gathering services is the subject of litigation from time to time, so the classification and regulation of some of our gathering facilities may be subject to change based on future determinations by the FERC and the courts. Thus, we cannot guarantee that the jurisdictional status of our gas gathering facilities will remain unchanged.
We depend on gathering facilities owned and operated by third parties to gather production from our properties, and therefore we are affected by the rates charged by these third parties for gathering services. To the extent that changes in federal or state regulations affect the rates charged for gathering services at any of these third-party facilities, we may also be affected by these changes. We do not anticipate that we would be affected differently than similarly situated gas producers.
Regulation of transportation and sale of oil and natural gas liquids. Intrastate liquids pipeline transportation rates, terms and conditions are subject to regulation by numerous federal, state and local authorities and, in a number of instances, the ability to transport and sell such products on interstate pipelines is dependent on pipelines that are also subject to FERC jurisdiction under the Interstate Commerce Act (the "ICA"). We do not believe these regulations affect us differently than other producers.
The ICA requires that pipelines maintain a tariff on file with the FERC. The tariff sets forth the established rates as well as the rules and regulations governing the service. The ICA requires, among other things, that rates and terms and conditions of service on interstate common carrier pipelines be just and reasonable. Such pipelines must also provide jurisdictional service in a manner that is not unduly discriminatory or unduly preferential. Shippers have the power to challenge new and existing rates and terms and conditions of service before the FERC.
The FERC's regulations include a methodology for oil pipelines to change their rates through the use of an index system that establishes ceiling levels for such rates. Under the FERC’s regulations, a liquids pipeline can request a rate increase that exceeds the rate obtained through application of the indexing methodology by using a cost-of-service approach, but only after the pipeline establishes that a substantial divergence exists between the actual costs experienced by the pipeline and the rates resulting from application of the indexing methodology. In December 2020, the FERC initially set the index ceiling level at Producer Price Index for Finished Goods (“PPI-FG”) plus 0.78%. Then, in January 2022, the FERC acted on rehearing of its rulemaking docket and lowered the index ceiling for this period to PPI-FG minus 0.21% for the five-year period from July 1, 2021 to June 30, 2026. On July 1, 2023, oil pipelines regulated by FERC and utilizing this index system were able to increase their rates by over 13%, which amounted to the largest index rate increase since FERC initiated this methodology. However, in July 2024 and as a result of the outcome in Liquid Energy Pipeline Association v. FERC, the original index ceiling level based on PPI-FG plus 0.78% was reinstated. Subsequently, in October 2024, the FERC issued a supplemental notice of proposed rulemaking that proposed a reduction to the reinstated index by one percent. Initial comments to such proposed rulemaking were due November 26, 2024, and reply comments were due December 20, 2024. Increases in liquids transportation rates may result in lower revenue and cash flow. Range will continue to monitor this proposed rulemaking and assess its effects on our operations.
In addition, due to common carrier regulatory obligations of liquids pipelines, capacity must be prorated among shippers in an equitable manner in the event there are nominations in excess of capacity by current shippers or capacity requests are received from a new shipper. Therefore, new shippers or increased volume by existing shippers may reduce the capacity available to us. Any prolonged interruption in the operation or curtailment of available capacity of the pipelines that we rely upon for liquids transportation could have a material adverse effect on our business, financial condition, results of operations and cash flows.
Environmental and Occupational Health and Safety Matters
Our operations are subject to numerous federal, state and local laws and regulations governing occupational health and safety, the discharge of materials into the environment or otherwise relating to environmental protection, some of which carry substantial administrative, civil and criminal penalties for failure to comply. These laws and regulations may include, but are not limited to:
•the acquisition of a permit before construction commences;
•restriction of the types, quantities and concentrations of various substances that can be released into the environment in connection with drilling, production and transporting through pipelines;
•governing the sourcing and disposal of water used in the drilling and completion process;
•limiting or prohibiting drilling activities on certain lands lying within wilderness, wetlands, frontier and other protected areas;
•requiring some form of remedial action to prevent or mitigate pollution from existing and former operations such as plugging abandoned wells or closing earthen impoundments; and
•imposing substantial liabilities for pollution resulting from operations or failure to comply with regulatory filings.
These laws and regulations also may restrict the rate of production. Moreover, changes in environmental laws and regulations often occur, and any changes that result in more stringent and costly well construction, drilling, water management or completion activities or more restrictive waste handling, storage, transport, disposal or cleanup requirements for any substances used or produced in our operations could materially adversely affect our operations and financial position, as well as those of the oil and natural gas industry in general.
Oil and gas activities have increasingly faced opposition from certain organizations and, in certain areas, have been restricted or banned by governmental authorities in response to concerns regarding the prevention of pollution or the protection of the environment. Moreover, some environmental laws and regulations may impose strict liability regardless of fault or knowledge, which could subject us to liability for conduct that was lawful at the time it occurred or conduct or conditions caused by prior operators or third parties at sites we currently own or where we have sent wastes for disposal. To the extent future laws or regulations are implemented or other governmental action is taken that prohibits, restricts or materially increases the costs of drilling, or imposes environmental protection requirements that result in increased costs to the oil and gas industry in general, our business and financial results could be adversely affected. The following is a summary of some of the environmental laws to which our operations are subject.
Comprehensive Environmental Response, Compensation and Liability Act. The Comprehensive Environmental Response, Compensation and Liability Act, as amended (“CERCLA”), also known as the Superfund law and comparable state laws impose liability, without regard to fault or the legality of the original conduct, on certain classes of persons who are considered to be responsible for the release or threatened release of a hazardous substance into the environment. These persons may include owners or operators of the disposal site or sites where the hazardous substance release occurred and companies that disposed of or arranged for the disposal of the hazardous substances at the site where the release occurred. Under CERCLA, all of these persons may be subject to joint and several liability for the costs of cleaning up the hazardous substances that have been released into the environment, for damages to natural resources and for the costs of certain health studies. In addition, it is not uncommon for neighboring landowners and other third parties, pursuant to environmental statutes, common law or both, to file claims for personal injury and property damages allegedly caused by the release of hazardous substances or other pollutants into the environment. Although petroleum, including crude oil and natural gas, is not a hazardous substance under CERCLA, at least two courts have ruled that certain wastes associated with the production of crude oil may be classified as hazardous substances under CERCLA and that releases of such wastes may therefore give rise to liability under CERCLA. While we generate materials in the course of our operations that may be regulated as hazardous substances, we have not received notification that we may be potentially responsible for cleanup costs under CERCLA. In addition, certain state laws also regulate the disposal of oil and natural gas wastes. New state and federal regulatory initiatives that could have a significant adverse impact on us may periodically be proposed and enacted.
Waste handling. We also may incur liability under the Resource Conservation and Recovery Act, as amended (“RCRA”) and comparable state laws, which impose requirements related to the handling and disposal of non-hazardous solid wastes and hazardous wastes. Drilling fluids, produced waters, and other wastes associated with the exploration, development or production of crude oil, natural gas or geothermal energy are currently regulated by the United States Environmental Protection Agency (“EPA”) and state agencies under RCRA’s less stringent non-hazardous solid waste provisions. It is possible that these solid wastes could in the future be reclassified as hazardous wastes, whether by amendment of RCRA or adoption of new laws, which could significantly increase our costs to manage and dispose of such wastes. Moreover, ordinary industrial wastes, such as paint wastes, waste solvents, laboratory wastes and waste compressor oils, may be regulated as hazardous wastes. Although the costs of managing wastes classified as hazardous waste may be significant, we do not expect to experience more burdensome costs than similarly situated companies in our industry. In December 2016, the EPA agreed in a consent decree to review its regulation of oil and gas waste. As a result, on April 23, 2019, the EPA decided to retain its current position on the regulation of oil and gas waste pursuant to RCRA. Nevertheless, any future changes in the laws and regulations could have a material adverse effect on our capital expenditures and operating expenses.
We currently own or lease, and have in the past owned or leased, properties that have been used for many years for the exploration and production of crude oil and natural gas. Petroleum hydrocarbons or wastes may have been disposed of or released on or under the properties owned or leased by us, or on or under other locations where such materials have been taken for disposal. In addition, some of these properties have been operated by third parties whose treatment and disposal or release of petroleum hydrocarbons and wastes was not under our control. These properties and the materials disposed or released on them may be subject to CERCLA, RCRA and comparable state laws and regulations. Under such laws and regulations, we could be required to remove or remediate previously disposed wastes or property contamination or to perform remedial activities to prevent future contamination.
Water discharges and use. The Federal Water Pollution Control Act, as amended (the “CWA”), and comparable state laws impose restrictions and strict controls regarding the discharge of pollutants, including produced waters and other oil and natural gas wastes, into federal and state waters. The discharge of pollutants into regulated waters is prohibited, except in accordance with the terms of a permit issued by the EPA or the state. These laws also prohibit the discharge of dredge and fill material in regulated waters, including wetlands, unless authorized by permit. These laws and any implementing regulations provide for administrative, civil and criminal penalties for any unauthorized discharges of oil and other substances in reportable quantities and may impose substantial potential liability for the costs of removal, remediation and damages. Pursuant to these laws and regulations, we may be required to obtain and maintain approvals or permits for the discharge of wastewater or storm water and are required to develop and implement
spill prevention, control and countermeasure plans, also referred to as SPCC plans, in connection with on-site storage of greater than threshold quantities of oil. We regularly review our natural gas, NGLs and oil properties to determine the need for new or updated SPCC plans and, where necessary, we will be developing or upgrading such plans, the costs of which are not expected to be substantial.
The Oil Pollution Act of 1990, as amended ("OPA"), contains numerous requirements relating to the prevention of and response to oil spills into waters of the United States. The OPA subjects owners of facilities to strict, joint and several liability for all containment and cleanup costs and certain other damages arising from an oil spill, including, but not limited to, the costs of responding to a release of oil to surface waters. While we believe we have been in substantial compliance with OPA, noncompliance could result in varying civil and criminal penalties and liabilities.
The Underground Injection Control Program authorized by the Safe Drinking Water Act prohibits any underground injection unless authorized by a permit. In connection with our operations, Range may dispose of produced water in underground wells, which are designed and permitted to place the water into deep geologic formations, isolated from fresh water sources. However, because some states have become concerned that the disposal of produced water could, under certain circumstances, contribute to seismicity, they have adopted or are considering adopting additional regulations governing such disposal. We currently do not utilize underground injection in our operations.
Hydraulic fracturing. Hydraulic fracturing, which has been used by the industry for over 60 years, is an important and common practice to stimulate production of natural gas and/or oil from dense subsurface rock formations. The hydraulic fracturing process involves the injection of water, sand and chemicals under pressure into targeted subsurface formations to fracture the surrounding rock and stimulate production. We routinely apply hydraulic fracturing techniques as part of our operations. This process is typically regulated by state environmental agencies and oil and natural gas commissions; however, several federal agencies have asserted regulatory authority over certain aspects of the process. For example, the EPA has issued final regulations under the Clean Air Act (as defined below) governing performance standards, including standards for the capture of air emissions released during hydraulic fracturing; proposed effluent limit guidelines that wastewater from shale gas extraction operations must meet before discharging to a treatment plant; and issued in May 2014 a prepublication of its Advance Notice of Proposed Rulemaking regarding Toxic Substances Control Act reporting of the chemical substances and mixtures used in hydraulic fracturing. Additionally, while the Federal Bureau of Land Management released a final rule setting forth disclosure requirements and other regulatory mandates for hydraulic fracturing on federal lands in March 2015, on December 29, 2017, the United States Department of the Interior - Bureau of Land Management rescinded the 2015 rule that would have set new environmental limitations on hydraulic fracturing, or fracking, on public lands because it believed the 2015 rule imposed administrative burdens and compliance costs that were not justified. Moreover, from time to time, Congress has considered adopting legislation intended to provide for federal regulation of hydraulic fracturing and to require disclosure of the chemicals used in the hydraulic fracturing process. In addition to any actions by Congress, certain states in which we operate, including Pennsylvania, have adopted, and other states are considering adopting, regulations imposing or that could impose new or more stringent permitting, public disclosure or well construction requirements on hydraulic fracturing operations. For example, in November 2023, Pennsylvania Governor Josh Shapiro instructed the Pennsylvania Department of Environmental Protection ("DEP") to take immediate action to pursue formal rulemaking and policy changes, including new requirements for the disclosure of chemicals used in drilling, improved control of methane emissions aligned with federal policy, stronger drilling waste protections (including inspection of secondary containment) and corrosion protections for gathering lines that transport natural gas. As a result, in January 2024, the DEP announced that it would implement a policy requiring natural gas well operators to disclose chemicals they use in drilling and hydraulic fracturing operations before the chemicals are used on-site. Certain states and political subdivisions have prohibited hydraulic fracturing. Range currently does not have operations in any of those states or political subdivisions. If new or more stringent federal, state or local legal restrictions relating to the hydraulic fracturing process are adopted in areas where we currently or in the future plan to operate, we may incur additional, more significant, costs to comply with such requirements. As a result, we could also become subject to additional permitting requirements, new setback distances (see below Land Use and Setbacks section) or experience added delays or curtailment in the pursuit of exploration, development, or production activities.
We believe that our hydraulic fracturing activities follow applicable industry practices and legal requirements for groundwater protection and that our hydraulic fracturing operations have not resulted in material environmental liabilities. We do not maintain insurance policies intended to provide coverage for losses solely related to hydraulic fracturing operations; however, we believe our existing insurance policies would cover any alleged third-party bodily injury and property damage caused by hydraulic fracturing including sudden and accidental pollution coverage.
Air emissions. The Clean Air Act of 1963, as amended (the “Clean Air Act”) and comparable state laws restrict the emission of air pollutants from many sources. These laws and any implementing regulations may require us to obtain pre-approval for the construction or modification of certain projects or facilities expected to produce air emissions, impose stringent air permit requirements, or use specific equipment or technologies to control emissions. We may be required to incur certain capital expenditures in the next few years for air pollution control equipment in connection with maintaining or obtaining operating permits and approvals for emissions of pollutants. For example, on December 2, 2023, the EPA released a final rule on the New Source Performance Standards (“NSPS”) to sharply reduce emissions of methane and other air pollution from oil and natural gas operations. The final rule,
as released will, among other things (i) require states to reduce methane emissions from hundreds of thousands of existing sources nationwide for the first time, (ii) phase out routine flaring from natural gas wells, (iii) require the deployment of innovative and advanced monitoring technologies by establishing performance requirements that can be met by a broader array of technologies, (iv) leverage data collected by certified third parties to identify and address “super emitting” sources and eliminate or minimize emissions from common pieces of equipment used in oil and gas operations such as process controllers, pumps and storage tanks and (v) require proper documentation that wells are properly closed and plugged before monitoring is allowed to end. In response to feedback received during the rule's comment period, the EPA adjusted several provisions of the proposed rule to allow extended time for compliance including a two-year phase-in period for eliminating routine flaring of natural gas that is emitted from new oil wells. Further, in May 2024, the EPA finalized amendments to the rules in the Petroleum and Natural Gas Systems source category (subpart W) of the Greenhouse Gas Reporting Program. The final amendments consist of four parts with the stated purpose to: address potential gaps in reporting of emissions data for specific sectors to ensure the reporting under subpart W reflects total methane emissions from the applicable facilities; add new emissions calculation methodologies to ensure the reporting under subpart W is based on empirical data; improve transparency of the data collected; and address technical clarifications and corrections. These final amendments to the rule had a phased-in implementation schedule with certain of the amendments becoming effective in July 2024 and the remainder of the amendments becoming effective on January 1, 2025. Such amendments will impact Range’s future greenhouse gas emissions reported to the EPA. In a related development, as part of the Inflation Reduction Act of 2022, Congress amended the Clean Air Act to create the Methane Emissions Reduction Program. As part of that program, Congress directed the EPA to collect a waste emissions charge on waste emissions of methane from certain oil and gas facilities. In November 2024, the EPA finalized a rule to facilitate implementation of calculation procedures, flexibilities, and exemptions related to the waste emissions charge, which applies to petroleum and natural gas facilities that emit more than 25,000 metric tons of carbon dioxide equivalent per year as reported under the amended subpart W of the Greenhouse Gas Reporting Program and that are not otherwise exempt from the charge. The DEP has also adopted heightened permitting conditions for all newly permitted or modified natural gas compressor stations, processing plants and transmission stations constructed, modified, or operated in Pennsylvania in an effort to regulate emissions of the greenhouse gas at such sites which became effective on December 10, 2022. Additionally, under the EPA’s 2023 NSPS rules each state is required to adopt emissions guidelines, or their equivalent, for existing oil and gas facilities. Compliance with these or any similar subsequently enacted regulatory initiatives could directly impact us by requiring installation of new emission controls on some of our equipment, resulting in the need for additional permitting and introducing potential permitting delays and increasing our capital expenditures and operating costs, which could adversely impact our business.
Climate change. In 2009, the EPA published its findings that emissions of carbon dioxide, methane and other greenhouse gases (“GHGs”) present a danger to public health and the environment because emissions of such gases are, according to the EPA, contributing to warming of the Earth’s atmosphere and other climatic conditions. Based on these findings, the EPA adopted regulations under the existing Clean Air Act establishing Title V and Prevention of Significant Deterioration (“PSD”) permitting reviews for GHG emissions from certain large stationary sources that already are potential major sources of certain principal, or criteria, pollutant emissions. We could become subject to these Title V and PSD permitting reviews and be required to install the best available control technology to limit emissions of GHGs from any new or significantly modified facilities that we may seek to construct in the future if such facilities emitted volumes of GHGs in excess of threshold permitting levels. The EPA has also adopted rules requiring the reporting of GHG emissions from specified emission sources in the United States on an annual basis, including certain oil and natural gas production facilities, which include several of our facilities. We believe that our monitoring activities and reporting are in substantial compliance with applicable obligations.
Congress has from time to time considered legislation to reduce emissions of GHGs and there have been a number of federal regulatory initiatives to address GHG emissions in recent years, such as the establishing of Title V and PSD permitting reviews for GHG emissions, as described in more detail above. For example, Congress enacted the Inflation Reduction Act of 2022 which, among other things, adopted a methane emissions fee to be assessed against oil and gas operators. Thereafter in 2024, the EPA released its finalized amendments to the rules in the Petroleum and Natural Gas Systems source category (subpart W) of the Greenhouse Gas Reporting Program and a final rule related to the Methane Emissions Reduction Program which, among other things, imposed such methane emissions fees and provided information about the calculation of those fees. While Range's methane emissions intensity remains low and below the stated threshold as amended, changes to the calculation of that fee could result in Range’s payment of such fees in the future. Additionally, a number of state and regional efforts have emerged that are aimed at tracking and/or reducing GHG emissions by means of cap and trade programs that typically require major sources of GHG emissions, such as electric power plants, to acquire and surrender emission allowances in return for emitting those GHGs.
Although it is not possible at this time to predict how legislation or new regulations that may be adopted to address GHG emissions would impact our business, any such future federal or state laws and regulations or international compacts could require us to incur increased operating costs, such as costs to purchase and operate emissions control systems, to acquire emission allowances or comply with new regulatory or reporting requirements. On an international level, the United States was one of almost 200 nations that, in December 2015, agreed to an international climate change agreement in Paris, France (“Paris Agreement”) that calls for countries to set their own GHG emissions targets and be transparent about the measures each country will use to achieve its GHG emissions targets, which agreement formally entered into force on November 4, 2016. The United States formally accepted that agreement in September 2016. In January 2025, President Trump signed an executive order directing the United States to withdraw from the Paris
Agreement. Under the terms of the Paris Agreement, the earliest possible effective date for withdrawal by the United States is one year after proper notice is given. It is not yet clear how withdrawal from the Paris Agreement or any separately negotiated agreement could impact us.
President Biden issued numerous executive orders during his administration directing the administration’s approach to addressing climate change, including executive orders related to rulemakings, prioritizing climate change, revoking prior executive orders, and addressing leasing for oil and gas production on federal lands. Upon taking office in January 2025, President Trump issued a series of executive orders not only revoking the previously referenced executive orders issued by President Biden, but also setting the policy direction for energy development for President Trump’s administration – including pausing disbursement of funds under the Inflation Reduction Act and the Infrastructure Investment and Jobs Act, directing heads of executive departments and agencies to identify and exercise emergency authority to advance domestic energy resources, restarting reviews and approvals of liquified natural gas export projects, pausing still ongoing Executive Branch rulemakings, and to begin to streamline energy permitting processes. Range will continue to monitor the effects, if any, of President Trump's executive orders, as well as any related congressional actions, on Range's operations.
Finally, it should be noted that some scientists have concluded that increasing concentrations of GHGs in the Earth’s atmosphere may produce climate changes that have significant physical effects, such as increased frequency and severity of storms, droughts, floods and other climatic events. If any such effects were to occur, they could have an adverse effect on our financial condition and results of operations.
We believe we are in substantial compliance with currently applicable environmental laws and regulations. Although we have not experienced any material adverse effect from compliance with environmental requirements, there is no assurance that this will continue. We did not have any material capital or other non-recurring expenditures in connection with complying with environmental laws or environmental remediation matters in 2024, nor do we anticipate that such expenditures will be material in 2025. However, we regularly incur expenditures and undertake projects to comply with environmental laws and to optimize our emissions performance. We anticipate those costs will continue to be incurred in the future.
Occupational health and safety. We are also subject to the requirements of the federal Occupational Safety and Health Act, as amended ("OSHA"), and comparable state laws that regulate the protection of the health and safety of employees. In addition, OSHA’s hazard communication standard requires that information be maintained about hazardous materials used or produced in our operations and that this information be provided to employees, state and local government authorities and citizens. We believe that our operations are in substantial compliance with the OSHA requirements.
Endangered Species Act. The Endangered Species Act of 1973 (“ESA”) and related state laws and regulations protect plant and animal species that are threatened or endangered. Some of our operations are located in areas that are or may be designated as protected habitats for endangered or threatened species, including the Northern Long-Eared and Indiana bats, which have a seasonal impact on our construction activities and operations. The designation of previously unprotected species as threatened or endangered, or redesignation of a threatened species as endangered, in areas where our operations are conducted could cause us to incur increased costs arising from species protection measures or could result in limitation of our exploration and production activities that could have an adverse impact on our ability to develop and produce reserves. If we were to have a portion of our leases designated as critical or suitable habitat, it could adversely impact the value of our leases.
Land Use and Setbacks. Local governments or political subdivisions may seek to adopt ordinances within their jurisdiction regulating the location of drilling and/or hydraulic fracturing activities. Certain states and political subdivisions have imposed setbacks that may limit where drilling and hydraulic fracturing can take place. For instance, in November 2024, Cecil Township, located in Washington County, Pennsylvania increased the setback distance for oil and gas operations from 500 feet to 2,500 feet from protected structures like residences and businesses and 5,000 feet from schools and hospitals, which eliminates future oil and gas operations on new well pads in the Township.
ITEM 1A. RISK FACTORS
While we utilize robust processes and resources to identify and manage risks, we are subject to various risks and uncertainties in the course of our business, some of which are comparable to the risks any business is exposed to and some that are unique to our operations. The following summarizes the known material risks and uncertainties that may adversely affect our business, financial condition or results of operations. When considering making or maintaining an investment in our securities, you should carefully consider the risk factors included below as well as those matters referenced in the section entitled Disclosures Regarding Forward-Looking Statements and other information included and incorporated by reference into this Annual Report on Form 10-K. These risks are not the only risks we face. Our business could also be impacted by additional risks and uncertainties not currently known to us or that we believe not to be material based on the information we have at this time. If any of the events described below as risks actually occur, it could materially harm our business, financial condition or results of operations or impair our ability to implement our business plans or complete development activities as expected. In that case, the market price of our common stock could decline or, if severe enough, the entire value of an investment in our securities could become worthless.
Economic risks related to our business
Volatility of natural gas, NGLs and oil prices significantly affects our cash flow and capital resources and could hamper our ability to operate economically. Natural gas, NGLs and oil prices are volatile, and a decline in prices adversely affects our profitability and financial condition. As a commodity business, the oil and gas industry is typically cyclical and we expect the volatility to continue. Natural gas prices are likely to affect us the most because approximately 64% of our proved reserves were natural gas as of December 31, 2024 and, at times in the past, natural gas prices have been low compared to our costs to produce. Natural gas, NGLs and oil prices fluctuate in response to changes in supply and demand, market uncertainty and other factors that are beyond our control. These factors include:
•events that impact domestic and foreign supply of, and demand for, natural gas, NGLs and oil;
•the continued operation of export facilities to supply foreign markets with natural gas and natural gas liquids and the ability to transport the product to markets due to shipping restrictions, armed conflict or terrorist threats and attacks;
•changes in weather patterns and events, including natural disasters such as hurricanes, floods, wildfires and tornadoes;
•technological advances affecting energy consumption, storage and energy supply;
•the production levels of non-OPEC countries, including production levels in the United States’ shale plays;
•general economic conditions worldwide;
•the price and availability of, and demand for, alternative and competing forms of energy, such as nuclear, geothermal, hydroelectric, wind and solar;
•the level of drilling, completion and production activities by other companies, and variability therein, in response to market conditions;
•the effect of worldwide energy conservation efforts;
•the ability of the members of OPEC and other exporting nations to agree to and comply with production controls;
•military, economic and political conditions in natural gas and oil producing regions;
•the cost of exploring for, developing, producing, transporting and marketing natural gas, NGLs and oil; and
•domestic (federal, state and local) and foreign governmental regulations, tariffs and taxation, including further legislation requiring, subsidizing or providing tax benefits for the use of alternative energy sources and fuels.
The long-term effects of these and other factors on the prices of natural gas, NGLs and oil prices are uncertain. Historical declines in natural gas, NGLs and oil commodity prices have adversely affected our business by:
•reducing the amount of natural gas, NGLs and oil that we can economically produce;
•reducing our revenues, operating income and cash flows;
•reducing the amount of cash flows available for capital expenditures;
•increasing the cost of obtaining capital, such as equity and debt financings; and
•reducing the standardized measure of discounted future net cash flows relating to natural gas, NGLs and oil.
If demand for natural gas, NGLs and oil is reduced, the prices we receive for and our ability to market and produce our natural gas, NGLs and oil may be negatively affected. Volatility in natural gas, NGLs and oil markets and the price we receive for our production is largely determined by various factors beyond our control. Production from natural gas and oil wells in some geographic areas of the United States has been or could be curtailed for considerable periods of time due to lack of local market demand and transportation and storage capacity. In the recent past, we have temporarily shut-in wells due to low commodity prices and it is possible that some of our wells may be shut-in in the future or sales terms may be less favorable than might otherwise be obtained should demand for our products decrease and/or prices decrease. Competition for markets has been vigorous and there remains uncertainty about prices purchasers will pay or the availability of sufficient storage, all of which could have a material adverse effect on our cash flows, results of operations and financial position.
We could experience periods of higher costs. These cost increases could reduce our profitability, cash flow and ability to conduct development activities as planned. We rely on third-party contractors to provide key services and equipment for our operations. Historically, our capital and operating costs have risen during periods of increasing oil, NGLs and gas prices. These cost increases result from a variety of factors beyond our control, such as increases in the cost of electricity, steel and other raw materials that we and our vendors rely upon; increased demand for labor, services and materials as drilling and completions activity increases; and increased taxes. Increased levels of drilling activity in the natural gas and oil industry could lead to increased costs of some drilling equipment, materials and supplies. Such costs may rise faster than increases in our revenue, thereby negatively impacting our profitability, cash flow and ability to conduct development activities as planned and on budget.
Based on the cost inflation pressure experienced over the last few years, we continue to undertake actions and implement plans to strengthen our supply chain. Nevertheless, we expect to experience some supply chain constraints and inflationary pressure on our cost structure including steel, fuel and labor, among other items, for the foreseeable future. By continuing to focus on cost control initiatives and actions, which increase our drilling, completion and operating efficiencies, we may be able to mitigate some inflationary pressures in the future.
Our debt obligations may limit our liquidity and financial flexibility. We are a borrower under fixed rate senior notes and maintain a bank credit facility which had no debt borrowings as of December 31, 2024. Our exploration and development program requires substantial capital resources depending on the level of drilling and the expected cost of services. Existing operations also require ongoing capital expenditures. Increases in our level of debt may:
•require us to dedicate a substantial portion of our cash flows from operations to the payment of our indebtedness, reducing the funds available for our operations or return of capital to stockholders;
•make us vulnerable to increases in interest rates;
•increase our vulnerability to a downturn in commodity prices or the general economy;
•place us at a competitive disadvantage compared to our competitors with lower debt service obligations;
•limit our operating flexibility due to financial and other restrictive covenants;
•limit our flexibility to maintain or grow our business and plan for, or react to, changes in our business and the industry in which we operate; and
•limit or prevent our ability to pay dividends and other restricted payments (as defined in our bank credit facility).
Historically, we have funded our capital expenditures through a combination of cash flow from operations and our bank credit facility and, in limited circumstances, debt and equity issuances. We have also engaged in asset monetization transactions. Future cash flows are subject to a number of variables, such as the level of production from existing wells, prices of natural gas, NGLs and oil and our success in developing and producing our reserves. If our access to capital were limited as a result of various factors, which could include a decrease in revenues due to lower natural gas, NGLs and oil prices or decreased production or deterioration of the credit and capital markets, we would have a reduced ability to fund our operations and replace our reserves resulting in reduced financial flexibility.
The amount available for borrowing under our bank credit facility is subject to a borrowing base, which is determined by our lenders, taking into account our estimated proved reserves and is subject to periodic re-determinations based on pricing models determined by the lenders at such time. Declines in natural gas, NGLs and oil prices adversely impact the value of our estimated proved reserves and, in turn, the market values used by our lenders to determine our borrowing base and could result in a determination to lower our borrowing base, reducing our financial flexibility.
Disruptions or volatility in the global finance markets may lead to a contraction in credit availability impacting our ability to finance our operations. We benefit from continued access to capital. A significant reduction in cash flows from operations or the availability of credit could materially and adversely affect our ability to conduct our planned operations, our ability to manage our debt maturities and our flexibility to react to changing economic and business conditions. We are also exposed to some credit risk
related to our bank credit facility to the extent that one or more of our lenders experiences liquidity problems and is unable to provide necessary funding to us under our existing revolving line of credit.
Any failure to meet our debt obligations could harm our business, financial condition and results of operations. Our earnings and cash flow will fluctuate from year to year due to the variable nature of commodity prices. If our cash flow and capital resources are insufficient to fund our debt obligations, we may be forced to sell assets, seek equity sales or restructure our debt. Our ability to restructure our debt will depend on the condition of the capital markets and our financial condition at such time. Any restructuring of debt could be at higher interest rates and may require us to comply with more onerous covenants, which could further restrict our operations and our financial flexibility. The terms of existing or future debt instruments may restrict us from adopting some of these alternatives.
We receive debt ratings from the major credit rating agencies in the United States. Factors that may impact our credit ratings include debt levels, planned asset purchases or sales and near-term and long-term cash flow relative to debt balances. Liquidity, asset quality, cost structure, product mix (natural gas, NGLs and oil) and projected commodity pricing levels are also considered by the rating agencies. A ratings downgrade could adversely impact our ability to access debt markets in the future, increase the cost of future debt and could require us to post letters of credit or other forms of collateral for certain obligations. We cannot provide assurance that our current ratings will remain in effect for any given period of time or that a rating will not be downgraded in the future.
As a result of cross-default provisions in our borrowing arrangements, we may be unable to satisfy all of our outstanding obligations in the event of a default on our part. The terms of our senior indebtedness, including our revolving credit facility, contain cross-default provisions which provide that we will be in default under such agreements in the event of certain defaults under our indentures or other loan agreements. Accordingly, should an event of default above certain thresholds occur under any of those agreements, we face the prospect of being in default under all of our debt agreements, obligated in such instance to satisfy all of our outstanding indebtedness but in all probability unable to satisfy all of our outstanding obligations simultaneously. In such an event, we might not be able to obtain alternative financing or, if we are able to obtain such financing, we might not be able to obtain it on terms acceptable to us, which would negatively affect our ability to continue our business plan, make capital expenditures and finance our operations.
Derivative transactions may limit our potential gains and involve other risks. To manage our exposure to commodity price volatility, we currently, and likely will in the future, enter into derivative arrangements, utilizing commodity derivatives ("hedges") with respect to a portion of our future production. Hedges are generally designed to lock in future prices for commodities to limit volatility and increase the predictability of cash flow. These hedging transactions can limit our potential gains if natural gas, NGLs and oil prices rise above the price established by the hedge. In addition, derivative transactions may expose us to the risk of financial loss in certain circumstances, including instances in which:
•our production is less than expected;
•the counterparties to our futures contracts fail to perform on their contract obligations; or
•an event materially impacts natural gas, NGLs or oil prices or the relationship between the hedged price index and the natural gas, NGLs or oil sales prices we receive.
We cannot be certain that any derivative transaction we may enter into will adequately protect us from declines in the prices of natural gas, NGLs or oil. Furthermore, if we choose not to engage in derivative transactions in the future, we may be more adversely affected by decreases in natural gas, NGLs or oil prices than our competitors who utilize derivative transactions. Lower natural gas, NGLs and oil prices over a longer term will also negatively impact our ability to enter into derivative contracts at prices that exceed our costs of production.
We are exposed to a risk of financial loss if a counterparty fails to perform under a derivative contract. We are unable to predict sudden changes in a counterparty’s creditworthiness or ability to perform. Even if we do accurately predict such changes, our ability to mitigate the risk may be limited depending upon market conditions. Furthermore, the bankruptcy of one or more of our hedge counterparties, or some other similar proceeding or liquidity constraint, would make it unlikely we would be able to collect all or a significant portion of amounts owed to us by the distressed entity or entities. During periods of falling commodity prices, our derivative receivable positions increase, which increases our exposure to the counterparties. If the creditworthiness of our counterparties deteriorates and results in their nonperformance, we could incur a significant loss.
Risks related to our operations
Drilling is an uncertain and costly activity. The cost of drilling, completing, and operating a well is often uncertain, and many factors can adversely affect the economics of a well. Our efforts will be uneconomical if we drill dry holes or wells that are productive but do not produce enough natural gas, NGLs and oil to be commercially viable after drilling, operating and other costs. There is no way to conclusively know in advance of drilling and testing whether any particular prospect will yield natural gas, NGLs or oil in
commercially viable quantities. Furthermore, our drilling and producing operations may be curtailed, delayed, or canceled as a result of a variety of factors, including, but not limited to:
•increases in the costs, shortages or delivery delays of drilling rigs, equipment, water for hydraulic fracturing services, labor, or other services;
•unexpected operational events and drilling conditions;
•reductions in natural gas, NGLs or oil prices;
•limitations in the market for natural gas, NGLs or oil;
•facility or equipment malfunctions or operator error;
•equipment failures or accidents;
•loss of title and other title-related issues;
•pipe or cement failures and casing collapses;
•compliance with, or changes in, permitting, environmental, tax and other governmental requirements;
•environmental hazards, such as natural gas leaks, oil spills, pipeline and tank ruptures, and unauthorized discharges of hazardous materials;
•lost or damaged oilfield drilling and service tools;
•unusual or unexpected geological formations;
•loss of drilling fluid circulation;
•pressure or irregularities in geological formations;
•fires, surface craterings, blowouts or explosions;
•uncontrollable flows of oil, natural gas or well fluids;
•availability and timely issuance of required governmental permits and licenses; and
•civil unrest or protest activities.
If any of these factors were to occur, we could lose all or a part of our investment or we could fail to realize the expected benefits, either of which could materially and adversely affect our revenue and profitability. Our operations involve utilizing drilling and completion techniques as developed by us and our service providers. Risks that we face while drilling horizontal wells include, but are not limited to, the following:
•landing the wellbore in the desired drilling zone;
•drilling the wellbore to the full planned length;
•staying in the desired drilling zone while drilling horizontally through the formation;
•running casing the entire length of the wellbore; and
•being able to run tools and other equipment consistently through the horizontal wellbore.
Risks that we face while completing horizontal wells include, but are not limited to, the following:
•the ability to fracture and stimulate the planned number of stages;
•the ability to run tools the entire length of the wellbore during completion operations; and
•the ability to successfully clean out the wellbore after completion of the final fracture stimulation stage.
Our identified drilling locations are scheduled out over multiple years, making them susceptible to uncertainties that could materially alter the occurrence or timing of their drilling. Unless we successfully replace the reserves that we produce, our reserves will decline as reserves are depleted, eventually resulting in a decrease in production and lower revenues and cash flow from operations. Our management team has specifically identified and scheduled certain drilling locations for future multi-year drilling activities on our existing acreage. Our ability to drill and develop these locations depends on a number of uncertainties, including natural gas, NGLs and oil prices, the availability and cost of capital, drilling and production costs, the availability of drilling services and equipment, drilling results, obtaining lease agreements and managing lease expirations, transportation constraints, permits,
regulatory and zoning approvals and other factors. Unless production is established within the spacing units covering acreage subject to an expiration, the leases for such acreage will expire. Because of these uncertain factors, our actual drilling activities may materially differ from those presently identified. In addition, we will require significant capital over a prolonged period in order to pursue the development of these locations, and we may not be able to raise or generate the capital required to do so. Any drilling activities we are able to conduct on these locations may not be successful or result in our ability to add proved reserves to our overall proved reserves or may result in a downward revision of our estimated proved reserves, which could have a material adverse effect on our business and results of operations and financial condition.
Our business is subject to operating hazards that could result in substantial losses or liabilities that may not be fully covered under our insurance policies. While we have processes and procedures that we utilize to mitigate operational risks, natural gas, NGLs and oil operations are subject to many risks, including well blowouts, craterings, explosions, uncontrollable flows of oil, natural gas or well fluids (especially those that reach surface water or groundwater), fires, pipe or cement failures, pipeline ruptures or spills, vandalism, pollution, releases of toxic gases, geological formations with abnormal or unexpected pressures, adverse weather conditions or natural disasters and other environmental hazards and risks. In addition, our operations are sometimes near populated commercial or residential areas. If any of these hazards occur, we could sustain substantial losses as a result of:
•personal injury or loss of life;
•damage to or destruction of property, natural resources and equipment;
•pollution or other environmental damage;
•investigatory and cleanup responsibilities;
•regulatory investigations and penalties or lawsuits;
•suspension of operations by regulatory authorities; and
•repairs and remediation to resume operations.
We maintain insurance against many, but not all, potential losses or liabilities arising from our operations in accordance with what we believe are customary industry practices and in amounts and at costs that we believe to be prudent and commercially practicable. Our insurance includes deductibles that must be met prior to recovery, as well as sub-limits and/or self-insurance. Additionally, our insurance is subject to exclusions and limitations. Our insurance does not cover every potential risk associated with our operations, including the potential loss of significant revenues. We can provide no assurance that our insurance coverage will adequately protect us against liability from all potential consequences, damages and losses.
We may elect not to purchase insurance in instances where we determine that the cost of available insurance is excessive relative to the risks we believe are presented. However, such determinations may prove to be incorrect. Further, some forms of insurance may become unavailable in the future. If we incur liability from a significant event and the damages are not covered by insurance or are in excess of policy limits, then we would have lower revenues and funds available to us for our operations, that could, in turn, have a material adverse effect on our business, financial condition and results of operations.
Additionally, we rely to a large extent on facilities owned and operated by third parties, in particular gas transportation and processing facilities, and damage to, or destruction of, those third-party facilities could affect our ability to process, transport and sell our production. To a limited extent, we maintain business interruption insurance related to three third-party processing plants and connecting lines for our wells in Pennsylvania where we are insured for potential catastrophic losses from the interruption of production caused by a covered loss of or damage to the processing plants; however, such insurance is limited and may not adequately protect us from all potential consequences, damages and losses.
Our producing properties are concentrated in Pennsylvania, making us vulnerable to risks associated with operating in one geographic and political region. Essentially 100% of our total estimated proved reserves are located in Pennsylvania. We are additionally vulnerable to processing and transportation constraints for our products in this area. We are more heavily exposed to the extensive and evolving regulatory environment in Pennsylvania which may lead to additional costs, delays or interruptions of construction, development and production from our wells. See also, below, The natural gas industry is subject to extensive regulation.
Additionally, local governments in Pennsylvania are authorized to adopt and implement ordinances and impose certain restrictions regarding siting of well sites, tank pads and other related facilities. Approval from one or more local governmental bodies, some following a public hearing, may be required before commencing construction of facilities which can result in delay, increased expense or, in some cases, prevention of development. Moreover, new initiatives or regulations could propose new setback distances or further restrictions on our ability to conduct certain operations such as hydraulic fracturing or disposal of substances generated by our operations, including, but not limited to, produced water, drilling fluids and other wastes associated with our operations. For example, in January 2024, the DEP announced that it would implement a policy requiring natural gas well operators to disclose chemicals they use in drilling and hydraulic fracturing operations before the chemicals are used on-site. Further, in November 2024,
Cecil Township, located in Washington County, Pennsylvania, increased the setback distance for oil and gas operations from 500 feet to 2,500 feet from protected structures like residences and businesses and 5,000 feet from schools and hospitals, and separately, the DEP received a citizen petition for rulemaking to expand setback distances from natural gas operations across Pennsylvania. Currently there are a few states that have elected to ban or severely limit hydraulic fracturing. Should Pennsylvania or the federal government ban hydraulic fracturing, it would preclude economic development of our Marcellus Shale reserves resulting in severe financial consequences to us.
We use a significant amount of water in our hydraulic fracturing operations. Our inability to locate sufficient amounts of water or dispose of or recycle water used in our operations may have a material adverse effect on our financial condition, results of operations and cash flows. Water is an essential component of our drilling and hydraulic fracturing processes. Limitation or restrictions on our ability to secure sufficient amounts of water (including limitations from natural causes such as drought) and transport it could impact our operations. If we are unable to obtain water to use in our operations from local sources, we may need to obtain it from new sources and transport the water to drilling sites, resulting in increased costs. We must either dispose of or recycle water used in our operations. Compliance with environmental and permit requirements governing the withdrawal, storage and use of recycled water, surface water or groundwater may increase costs and cause delays, interruptions or termination of our operations.
Our business depends on natural gas and oil transportation and NGLs processing facilities which are owned by others and on our ability to contract with those parties. Our ability to sell our natural gas, NGLs and oil production depends in part on the availability, proximity and capacity of gathering and transportation pipeline systems, processing facilities, rail cars, trucks or vessels owned by third parties and our ability to contract with those third parties. The lack of available capacity on these systems and facilities could result in the shut-in of producing wells or the delay or discontinuance of development plans for properties. See also above Our producing properties are concentrated in Pennsylvania, making us vulnerable to risks associated with operating in one geographic and political region.
Although we have some contractual control over the transportation of our products, material changes in these business relationships, including the financial condition of the contractual counterparties, could materially affect our operations. In some cases, we do not purchase firm transportation on third-party facilities and as a result, our production transportation can be interrupted by those having firm arrangements. In other cases, we have entered into firm transportation arrangements where we are obligated to pay fees on minimum volumes regardless of actual volume throughput. If production decreases due to reduced or delayed developmental activities, the current commodity price environment, production related difficulties or otherwise, we may be unable to utilize all of our rights under existing firm transportation contracts, resulting in obligations to pay fees without receiving revenue from sales. Such fees may be significant and may have a material adverse effect on our operations. We have also entered into long-term agreements with third parties to provide natural gas gathering and processing services. In some cases, the capacity of gathering systems and transportation pipelines may be insufficient to accommodate production from existing and new wells. Federal and state regulation of natural gas and oil production and transportation, tax and energy policies, changes in supply and demand, pipeline pressures, damage to or destruction of pipelines and general economic conditions could adversely affect our ability to produce, gather and transport natural gas, NGLs and oil. If any of these third-party pipelines or other facilities become partially or fully unavailable to transport or process our product, or if the natural gas quality specifications for a natural gas pipeline or facility change so as to restrict our ability to transport natural gas on those pipelines or facilities, our revenues could be adversely affected.
The disruption of third-party facilities due to maintenance, mechanical failures, accidents, weather and/or other reasons could negatively impact our ability to market and deliver our products. In particular, the disruption of certain third-party natural gas processing facilities that support our core operating area in southwest Pennsylvania could materially affect our ability to market and deliver natural gas production in that area especially if such disruption were to last for more than a short duration which could result in the necessity to curtail a significant amount of our production. We have no control over when or if such facilities are restored and generally have no control over what prices will be charged. A total shut-in of production could severely affect us due to a lack of cash flow, and if a substantial portion of the production volume is hedged at lower than market prices, our obligation to the counterparty under those financial hedges might have to be paid from borrowings thus further adversely affecting our financial condition.
Risks related to the industry in which we operate
The natural gas industry is subject to extensive regulation. Natural gas, NGLs, oil and other hydrocarbons, as well as our operations to produce these products, are subject to extensive laws, regulations, and ordinances at the federal, state and local level. Further, new legislation, proposed rulemaking and ordinance amendments affecting the industry are under constant review for more expansive requirements and rules on our products and operations. Compliance with new and expanding laws from numerous governmental departments and agencies often increases our cost of doing business, delays our operations and decreases our profitability. Certain potential legislation, such as a ban on hydraulic fracturing, could even preclude our ability to economically develop our reserves.
Matters subject to laws and regulations affecting our business include, but are not limited to: the amount and types of substances and material that may be released into the environment, including GHGs; responding to unexpected releases of regulated substances or materials to the environment; the sourcing, transport and disposal of water used in the drilling and completions process; permits,
performance rules and reporting obligations concerning drilling, completion and production operations; threatened or endangered species and waterway protection efforts; and climate related initiatives.
Environmental regulations and pollution liability could expose us to significant costs and penalties. We may incur significant costs and liabilities in complying with existing or future environmental laws, regulations and enforcement policies or initiatives. Some of these environmental laws and regulations may impose strict, joint and several liability regardless of fault or knowledge, which could subject us to liability for conduct that was lawful at the time it occurred, or conditions caused by prior owners or operators or which relate to third party sites where we have taken materials for recycling or disposal. Pennsylvania law also imposes criminal liability for certain releases of substances, regardless of fault or intent. Failure to comply with these laws and regulations may result in the occurrence of delays, cancellations or restrictions in permitting or performance of our projects or other operations and subject us to administrative, civil and/or criminal penalties, corrective actions and orders enjoining some or all of our operations. Our operations may be impacted by new and amended laws and regulations and reinterpretations of existing laws and regulations or increased government enforcement relating to environmental laws. For example, properly handled drilling fluids and produced water are currently exempt from regulation as hazardous waste under RCRA, and instead are regulated under RCRA’s non-hazardous waste provisions. It is possible that the EPA may in the future propose rulemaking that designates such wastes as hazardous rather than non-hazardous, and a similar designation may be made at the state level. Should this occur at the federal and/or state level it could result in significant costs to attain and maintain compliance.
We may also be exposed to liability and costs for handling of hydrocarbons, air emissions and wastewater or other fluid discharges related to our operations and waste disposal practices. Spills or other unauthorized releases of hazardous or regulated substances by us, our contractors or resulting from our operations could expose us to material losses, expenditures and liabilities, civil and criminal liabilities, under environmental laws and regulation and we are currently and have in the past been involved in such investigations, remediation and monitoring activities. The Pennsylvania Office of the Attorney General has publicly announced investigations and charges generally related to our industry in Pennsylvania. Additionally, neighboring landowners and other third parties may assert claims or file lawsuits against us for personal injury and/or property damage allegedly caused by the release of substances into the environment, with or without evidence of an impact from our operations, all of which could also result in significant litigation or settlement costs as well as reputational harm.
Laws and regulations pertaining to threatened and endangered species and protection of waterways could delay or restrict our operations and cause us to incur substantial costs. Various federal and state statutes prohibit actions or operations that adversely affect endangered or threatened species and their habitats. These statutes include the federal ESA, the Migratory Bird Treaty Act, the CWA, CERCLA and similar state programs including under the Pennsylvania Oil and Gas Act and the Clean Streams Law and related regulations. For example, the United States Fish and Wildlife Service as well as state agencies may designate critical habitat and suitable habitat areas that it believes are necessary for survival of threatened or endangered species. A critical habitat or suitable habitat designation could result in material restrictions to land use and delay, restrict or even prevent our operations. For additional details, please refer to Governmental Regulation in Item 1, Environmental and Occupational Health and Safety Matters, specifically the Endangered Species Act section above. Similarly, operations may be impacted, delayed or even prevented by the existence of wetlands or other environmentally sensitive areas based upon the scope of the CWA and its protection of waters of the United States as well as state laws such as the Pennsylvania Clean Streams Law and related regulations and permitting requirements.
Climate related regulations and initiatives could expose us to significant costs and restrictions on operations. There is an ongoing public debate as to the extent to which our climate is changing, the potential causes of climate change and its potential impacts. As part of that debate, there is general belief that increased levels of GHGs, including carbon dioxide and methane, have contributed to and continue to contribute to climate change which has led to numerous regulatory, political, litigation and financial risks associated with the production of fossil fuels and emissions of GHGs. Our operations result in GHGs.
Federal and state governments have from time to time considered legislation and regulations to reduce GHG emissions, including, but not limited to the implementation of GHG monitoring and reporting for the natural gas industry which includes certain of our operations. For additional details please refer to Government Regulation in Item 1, Environmental and Occupational Health and Safety Matters, specifically the Air emissions and Climate change sections above. There have also been a number of state and regional efforts that have emerged that seek to track and reduce GHG emissions by means of cap and trade programs where emitters would be required to acquire and surrender emission allowances in return for emitting GHGs. In September 2020, the PEQB approved a draft resolution to enter the Regional Greenhouse Gas Initiative ("RGGI"), a cooperative effort among the states of Connecticut, Delaware, Maine, Maryland, Massachusetts, New Hampshire, New Jersey, New York, Rhode Island and Vermont to cap and reduce power sector CO2 emissions from fossil-fuel-fired electric power plants. However, in response to the PEQB's resolution to join the RGGI, the Pennsylvania General Assembly adopted a resolution on December 15, 2021, expressing its disapproval of the state's efforts to enroll in RGGI, stating that the RGGI would drive up energy costs and result in thousands of lost jobs. On January 10, 2022, former Governor Wolf vetoed the disapproval resolution. In April 2022, the Pennsylvania senate failed to override former Governor Wolf's veto and as a result, Pennsylvania officially joined the RGGI. However, in July 2022, the Commonwealth Court of Pennsylvania issued an order blocking the state from participating in the RGGI until the court ruled on its constitutionality. On November 1, 2023, the Pennsylvania Commonwealth Court ruled that funds generated through the RGGI are an unconstitutional tax,
effectively preventing the state from participating in RGGI. Pennsylvania Governor Josh Shapiro appealed that decision to the state's Supreme Court and that appeal remains pending. Moreover, in 2023, Pennsylvania Governor Josh Shapiro created the "RGGI Working Group" and tasked them with measuring RGGI or an alternative against a three-part test: protect and create energy jobs, take real action to address climate change, and ensure reliable, affordable power for consumers in the long-term. While the RGGI Working Group agreed that a cap-and-trade regulation would meet these goals, they did not conclude that RGGI is the correct program for Pennsylvania, citing wider concerns regarding increased energy costs and job loss. The RGGI Working Group gave Governor Shapiro a list of recommendations in a four-page memo, suggesting, among other things, Governor Shapiro explore a cap-and-trade program that includes Washington, D.C. and 13 states whose electric grids are run by PJM Interconnection, while encouraging the PJM-run states to reach consensus on carbon trading. As a result on March 13, 2024, Governor Shapiro announced a proposal to adopt a carbon-pricing program in the state similar to RGGI. As part of that announcement, Governor Shapiro said he would support legislation to make Pennsylvania’s power plant owners pay for their greenhouse gas emissions and require utilities to buy more electricity from renewable sources. More recently, in September 2024, the Pennsylvania Senate voted in favor of a bill repealing the carbon tax portion of RGGI, but the bill was not considered in the Pennsylvania House of Representatives prior to the conclusion of the legislative session. The same legislation was reintroduced in 2025 and passed the Pennsylvania Senate in 2025. The reintroduced legislation awaits consideration in the Pennsylvania House of Representatives. In the absence of participation in the RGGI, the DEP is evaluating other regulations to achieve the emissions reductions. We have initiated our own internal goals to reduce GHG emissions from our operations, such as us setting a goal of net zero Scope 1 and 2 GHG emissions by 2025, which we expect to achieve. However, there are a variety of factors that may prevent us from meeting that goal, including but not limited to operational malfunctions, availability of equipment and services, engineering results, capital constraints and availability and success of carbon offsetting initiatives. We continue to evaluate a range of technology and other measures, such as carbon offsets, that could assist with meeting this goal. Failure or a perception (whether or not valid) of failure to meet our GHG emissions goals could damage our reputation and negatively impact our stock price.
The outcome of federal, state and regional actions to address global climate change could result in a variety of new laws and regulations to control or restrict emissions including taxes or other charges to deter or restrict emissions of GHGs. This may also depend upon political outcomes as there have been certain candidates seeking election to various state and federal offices or their appointees, who have made pledges to restrict GHG emissions, ban hydraulic fracturing of oil and natural gas wells and ban new leases for production of natural gas, NGLs and oil on federal lands. Our reserves development is critically dependent upon the use of hydraulic fracturing and we cannot economically develop any of our reserves without using such technology (which we believe has been safely conducted for many decades) and a ban of such technology could result in severe economic harm to us.
There are also increasing litigation risks associated with climate change concerns as a number of cities and local governments have initiated lawsuits against fossil fuel producers in state and federal court asserting claims for public nuisance and seeking damages for climate change impacts to roadways and infrastructure. Such lawsuits have also alleged that fossil fuel producers have been aware of the adverse effects of climate change and defrauded their investors by failing to adequately disclose those impacts.
Financial risks exist for fossil fuel energy companies, including natural gas producers, as in recent years, stockholders and bondholders are concerned about the potential effects of fossil fuels on climate change and may elect to shift some or all of their investments away from fossil fuel based energy. Institutional lenders who provide financing to fossil fuel energy companies are at times under pressure from activists and are the subject of lobbying to not provide funding for fossil fuel production, although this trend has recently decreased. Also, in November 2021, the Federal Reserve issued a statement in support of the efforts of the Network of Greening the Financial System, of which the Federal Reserve is a member, to identify key issues and potential solutions for the climate-related challenges most relevant to central banks and supervisory authorities. In January 2025, the Federal Reserve issued a statement announcing it has withdrawn from the Network of Central Banks and Supervisors for the Greening of the Financial System. Some of these institutional lenders may elect not to provide funding for us which could result in restriction, delay or cancellation of drilling programs, development or production activities or impair our ability to operate economically.
On March 6, 2024, the SEC adopted rules that would require public companies to disclose extensive climate change-related information in certain of their SEC filings. However, on March 15, 2024, a federal appellate court imposed a temporary stay pending judicial review of such new rules, and in response, on April 4, 2024, the SEC issued an order staying any amendments to such rules pending the completion of judicial review of the federal appellate court petitions. On February 11, 2025, the acting chairman of the SEC released a statement that he has directed the SEC staff to request that the court not schedule the case for argument to provide time for the SEC to deliberate the appropriate next steps in litigation related to The Enhancement and Standardization of Climate-Related Disclosures for Investors rule. While the final form and substance of these rules are not yet known and the ultimate scope and impact on our business is uncertain, compliance with the rules may result in increased legal, accounting, operational, technology and financial compliance costs.
Certain organizations that provide corporate governance and other corporate risk information to investors and stockholders have developed scores and ratings to evaluate companies and investment funds based on sustainability or environmental, social and governance ("ESG") metrics. Currently, there are no universal standards for such scores or ratings, but the importance of sustainability evaluations is becoming more broadly accepted by investors and stockholders. A number of advocacy groups, both domestically and
internationally, have campaigned for governmental and private action to promote change at public companies related to ESG matters, including through investment and voting practices of investment advisors, public pension funds, universities and other members of the investing community. As a result, many investment funds focus on positive ESG business practices and sustainability scores when making investments. Companies which do not adapt to or comply with investor or stockholder ESG expectations and standards or which are perceived to have not responded appropriately to the growing concern for ESG issues, regardless of whether there is a legal requirement to do so, may suffer from reputational damage and the financial condition, results of operations or cash flows of such a company could be materially and adversely affected.
Moreover, we may from time-to-time create and publish voluntary disclosures regarding ESG matters. Many of the statements in those voluntary disclosures are based on hypothetical expectations and assumptions that may or may not be representative of current or actual risks or events or forecasts of expected risks or events, including the costs associated therewith. Such expectations and assumptions are necessarily uncertain and may be prone to error or subject to misinterpretation given the long timelines involved and the lack of an established single approach to identifying, measuring and reporting on many ESG matters.
At this time, we cannot predict the potential impact of such laws, regulations, regional or international initiatives or compacts, litigation, ESG ratings or financing restrictions due to climate concerns on our future consolidated financial condition, results of operations or cash flows; however, such impacts could be material and have material negative consequences to our business.
Information concerning our reserves and future net cash flow are estimates and may not match our results. There are numerous uncertainties inherent in estimating quantities of proved natural gas and oil reserves and their values, including many factors beyond our control. Estimates of proved reserves depend on many assumptions relating to current and future economic conditions and commodity prices as well as the projected productivity of our wells and infrastructure to gather, process, store and/or transport our products to market. To the extent we experience a sustained period of reduced commodity prices, there is a risk that a portion of our proved reserves could be deemed uneconomic and no longer be classified as proved. Although we utilize robust processes and procedures to evaluate and estimate our reserves, they are estimates and the actual production, revenues and costs to develop our estimated reserves will vary from estimates and these variances could be material and/or negative.
Reserve estimation is a subjective process that involves estimating volumes to be recovered from underground accumulations of natural gas, NGLs and oil that cannot be directly measured. As a result, different petroleum engineers, each using industry-accepted geologic and engineering practices and scientific methods, may calculate different estimates of reserves and future net cash flows based on the same available data. Because of the subjective application of engineering principles to natural gas, NGLs and oil reserve estimates, each of the following items may differ materially from the amounts or other factors estimated:
•the amount and timing of natural gas, NGLs and oil production;
•the revenues and costs associated with that production;
•the amount and timing of future development expenditures; and
•future commodity prices.
The discounted future net cash flows from our proved reserves included in this report are not the same as the market value of the reserves attributable to our properties. As required by United States generally accepted accounting principles ("U.S. GAAP"), the estimated discounted future net revenues from our proved reserves are based on a twelve month average price (first day of the month) while cost estimates are based on current year-end economic conditions. Actual future prices and costs may be materially higher or lower. In addition, the ten percent discount factor that is required to be used to calculate discounted future net cash flows for reporting purposes under U.S. GAAP is not necessarily the most appropriate discount factor based on the cost of capital, which varies from time to time, and risks associated with our business and the oil and gas industry in general.
We may face various risks associated with the long-term trend toward increased activism against oil and gas exploration and development activities. Opposition toward oil and gas drilling and development activity has been growing over time. Companies in the oil and gas industry are often the target of activist efforts to delay or prevent oil and gas development from both individuals and non-governmental organizations who use safety, environmental compliance and business practices to support their opposition to oil and gas drilling. Anti-development activists are working to, among other things, reduce access to federal and state government lands, delay or cancel certain projects such as the development of oil and gas drilling or export facilities, as well as the pipeline infrastructure needed to transport and process oil and gas production. For example, environmental activists continue to advocate for increased regulations or bans on shale drilling and hydraulic fracturing in the United States, even in jurisdictions like Pennsylvania that are among the most stringent in their regulation of the industry. Such activist efforts could result in the following:
•delay or denial of drilling permits or leases;
•restrictions on or prevention of installation or operation of production, gathering or processing facilities;
•restrictions on or prevention of the use of certain operating practices, such as hydraulic fracturing, or the disposal of related materials, such as hydraulic fracturing fluids and produced water;
•additional regulatory burdens;
•increased severance and/or other taxes;
•legal challenges or lawsuits;
•negative publicity about our business or the oil and gas industry in general;
•increased costs of doing business;
•reduction in demand for our products; and
•other adverse effects on our ability to develop our properties and expand production.
We may incur significant costs associated with responding to these initiatives and such actions may materially adversely affect our financial results. Complying with any resulting additional legal or regulatory requirements that are substantial or prevent our activity could have a material adverse effect on our business, financial condition, cash flows and results of operations.
Conservation measures and technological advances could reduce demand for oil and natural gas. Fuel conservation measures, alternative fuel requirements, governmental requirements for renewable energy resources, increasing consumer demand for alternatives to oil and natural gas, technological advances in fuel economy and energy generation or storage devices (such as battery technology) may in the future reduce the demand for, and in turn the prices of, the natural gas, NGLs and oil that we sell. In addition, these measures may reduce the availability to us of necessary third-party services and facilities that we rely on which could increase our operational costs and adversely impact our ability to produce, transport and process natural gas, NGLs and oil. The impact of changing demand for natural gas, NGLs and oil services and products may have a material adverse effect on our business, financial condition, results of operations and cash flows.
Legal, tax and regulatory risks
U.S. or state tax legislation may adversely affect our business, results of operations, financial condition and cash flow . Legislation is periodically proposed that could make significant changes to United States federal income tax laws and could include the elimination of certain United States federal income tax benefits currently available to oil and gas exploration and production companies including, but not limited to, (i) the repeal of percentage depletion allowances for oil and natural gas properties; (ii) the elimination of current deductions for intangible drilling and development costs and; (iii) an extension of the amortization period for certain geological and geophysical expenditures. Additionally, legislation could be enacted that imposes new fees or increases the taxes on oil and natural gas extraction, which could result in increased operating costs and/or reduced consumer demand for our products. The passage of any such legislation or any other similar change in United States federal income tax law could increase costs or eliminate or postpone certain tax deductions that are currently available with respect to natural gas and oil exploration and development and any such changes could have an adverse effect on our financial condition, results of operations and cash flows.
In 2022, legislation commonly known as the Inflation Reduction Act was signed into law, which includes, among other things, a corporate alternative minimum tax (the "CAMT") and a one percent excise tax on corporate stock repurchases. The CAMT generally treats a corporation as an applicable corporation in any taxable year in which the average annual adjusted financial statement income for a three taxable-year period ending prior to such taxable year exceeds $1.0 billion. If we become subject to CAMT, our cash obligations for U.S. federal income taxes could be significantly accelerated. To the extent the 1% excise tax applies to repurchases of shares under our common stock repurchases program, the number of shares we repurchase and our cash flow may be affected.
In 2012, Pennsylvania enacted legislation creating a tax referred to as the natural gas impact fee applicable to production in Pennsylvania, where essentially all of our acreage is located. The legislation imposes an annual fee on natural gas and oil operators for each well drilled for a period of fifteen years. Much like a severance tax, the fee is on a sliding scale set by the Pennsylvania Public Utility Commission and is based on two factors: changes in the Consumer Price Index and the average NYMEX natural gas prices on the last day of each month. The impact fee increases the financial burden on our operations in the Marcellus Shale. There can be no assurance that the impact fee will remain as currently structured or that additional taxes will not be imposed. From time to time, the Pennsylvania Governor and various Pennsylvania state lawmakers have proposed legislation to enact a severance tax in substitution for, or as an addition to, the impact fee already in place. The structure of and ultimate effect of any additional tax burden cannot be estimated at this time but could be material.
Legal proceedings brought against us could result in substantial liabilities and materially and adversely impact our financial condition. Like many oil and gas companies, we are involved in various legal proceedings, including threatened claims, such as title, royalty, and contractual disputes. The cost to settle legal proceedings (asserted or unasserted) or satisfy any resulting judgment against
us in such proceedings could result in a substantial liability or the loss of interests, which could materially and adversely impact our cash flows, operating results and financial condition. Judgments and estimates to determine accruals or range of losses related to legal proceedings could change from one period to the next, and such changes could be material. Current accruals may be insufficient to satisfy any such judgments. Legal proceedings could also result in negative publicity about Range. In addition, legal proceedings distract management and other personnel from their primary responsibilities. At this time, based on the information available to management, there are no pending claims or litigation which appear likely to result in a material financial impact. However, management’s assessment of pending claims and litigation could be inaccurate and subsequent events could result in material liabilities from such claims or litigation.
Our success depends on key members of our management and our ability to attract and retain experienced technical and other professional personnel. None of our senior management team nor any of our other officers are subject to an employment agreement and therefore retaining them as employees is less certain than if they were parties to an employment agreement. The unanticipated loss of one or more of these individuals could have a material adverse effect on our business. Further, the loss of key technical professionals with extensive experience in our core operating area could be difficult to replace if they were to leave and the loss of such employees could adversely affect the costs of drilling, completing and operating our wells.
Risks related to our common stock
Common stockholders may be diluted if additional shares are issued. In order to align interests and encourage ownership, we issue restricted stock, restricted stock units and performance share units to our employees and directors as part of their compensation. In addition, we may issue additional shares of common stock, additional senior notes or other securities or debt convertible into common stock to extend maturities or fund capital expenditures, including acquisitions. The issuance of additional shares of common stock results in dilution of the interests of existing stockholders. One way to reverse the effects of dilution is by the acquisition of our stock. On December 31, 2024, our share repurchase program had $1.0 billion remaining. However, this program may be suspended, modified or discontinued by the board of directors at any time.
Our stock price may be volatile and stockholders may not be able to resell shares of our common stock at or above the price they paid. The price of our common stock fluctuates significantly, which may result in losses for investors. The market price of our common stock has been volatile. From January 1, 2022 to December 31, 2024, the price of our common stock reported by the New York Stock Exchange ranged from a low of $16.71 per share to a high of $39.33 per share. We expect our stock price to continue to be subject to volatility as a result of a variety of factors, including factors beyond our control. These factors include:
•most significantly, changes in natural gas, NGLs and oil prices;
•global economic conditions;
•fluctuations in the broader equity market;
•variations in drilling, recompletions, acquisitions and operating results;
•changes in governmental regulation and/or taxation;
•changes in financial estimates by securities analysts;
•changes in market valuations of comparable companies;
•expectations regarding our capital program, including any determination by our board of directors regarding repurchasing stock or paying dividends;
•changes in key personnel; or
•future sales of additional stock and changes in our capital structure.
We may fail to meet expectations of our stockholders or of securities analysts at some time in the future and our stock price could decline as a result. Payment of dividends may be limited or prevented due to the restrictions that are defined within our bank credit facility.
General risk factors
Our business could be negatively affected by security threats, including cybersecurity threats and other disruptions. The United States government has issued public warnings that indicate that energy assets might be specific targets of cybersecurity threats. As a natural gas, NGLs and oil producer, we face various security threats, including:
•cybersecurity threats to gain unauthorized access to sensitive information or to render data or computer systems unusable;
•threats to the security or operations at our physical facilities and infrastructure or third-party facilities and infrastructure, such as processing plants and pipelines; or
•threats from terrorist acts or other geopolitical events.
Digital technologies are an integral part of our business and are used to support our exploration, development and production activities and our key accounting and financial reporting functions. We use these systems to analyze and store financial and operating data and to communicate internally and with outside business counterparties. Cyberattacks could compromise our core infrastructure and digital technologies and result in disruptions to our business operations or the loss of our data and proprietary information. In addition, digital technologies control oil and gas production, processing equipment, and distribution systems globally and are necessary to deliver our production to market. A cyberattack against these operating systems, or the networks and infrastructure on which they rely, could damage critical production, distribution and/or storage assets, delay or prevent delivery to markets, cause accidental discharge and/or make it difficult or impossible to accurately account for production and settle transactions. A cyberattack on a vendor or a service provider could result in supply chain disruptions, which could delay or halt development projects. A cyberattack on our accounting or human resources systems could expose us to liability if confidential and/or personal information is obtained. Furthermore, the shift to a hybrid systems model including on-premises and cloud environments has transformed how systems interconnect, how data is stored, how users interact with applications and what end user devices are utilized. This shift has resulted in additional cybersecurity risk.
Security threats have subjected our operations to increased risks that could have a material adverse effect on our business. In particular, our implementation of various procedures and controls to monitor and mitigate security threats and to increase security for our personnel, information, facilities and infrastructure may result in increased capital and operating costs. Moreover, there can be no assurance that such procedures and controls will be sufficient to prevent security breaches from occurring. If any of these security breaches were to occur, they could lead to harm to our employees or losses of sensitive information, losses of critical infrastructure or capabilities essential to our operations and could have a material adverse effect on our reputation, financial position, results of operations or cash flows. Attackers are becoming more sophisticated and both the frequency and magnitude of cyberattacks in particular are expected to increase and include, but are not limited to, malicious software, phishing, ransomware, attempts to gain unauthorized access to data, and other electronic security breaches that could lead to disruptions in critical systems, unauthorized release of confidential or otherwise protected information, and corruption of data. These events could damage our reputation and lead to financial losses from unauthorized disbursement of funds, remedial actions, loss of business and/or potential liability. We may be unable to anticipate, detect or prevent future attacks, particularly as methodologies utilized by attackers change frequently and are not recognized until launched. Additionally, the continuing and evolving threat of cybersecurity attacks has resulted in evolving legal and compliance matters, including increased regulatory focus on prevention, which could require us to expend significant additional resources to meet such requirements. While we utilize extensive processes and procedures that we deem appropriate to counter cybersecurity risks and to date have not suffered any material losses relating to such attacks, there can be no assurance that we will not suffer such losses in the future. Any losses, costs or liabilities directly or indirectly related to cyberattacks or similar incidents may not be covered by, or may exceed the coverage limits of, any of our insurance policies.
Terrorist attacks and the threat of terrorist attacks, whether domestic or foreign attacks, as well as military or other actions taken in response to these acts, could cause instability in the global financial and energy markets. Continued hostilities in areas around the world and the occurrence or threat of terrorist attacks in the United States, other countries or international waters could adversely affect the global economy in unpredictable ways, including the disruption of energy supplies and markets, increased volatility in commodity prices or the possibility that the infrastructure on which we rely could be a direct target or an indirect casualty of an act of terrorism and, in turn, could materially and adversely affect our business and results of operations.
None.
ITEM 1C. CYBERSECURITY
We have a comprehensive approach to mitigate cybersecurity risk which primarily focuses on three key elements:
•people – security awareness education and readiness-testing throughout the year for employees;
•process – incorporating "cyber awareness" in our day-to-day processes which includes constant review of alerting and detection to mitigate constant cybersecurity threats, regular review of security posture and security roadmap to ensure alignment throughout the organization, physical and digital asset protection and security vulnerability remediation via preventable and detective measures; and
•technology – investing in industry aligned security technology and threat intelligence capabilities.
Cybersecurity governance is supported by our information technology department which includes certified security professionals and seasoned security analysts. This department conducts extensive ongoing reviews of our security initiatives to assess the current state of our program (using a cybersecurity framework) and potential evolution based on current business risks along with detection and communication of cybersecurity threats and actions to mitigate those threats. Our Director of IT Security is responsible for assessing, monitoring and managing risks from cybersecurity threats, overseeing our overall cybersecurity risk management program which includes prevention, mitigation, detection and remediation of cybersecurity incidents and supervises a team of cybersecurity personnel. Our Director of IT Security reports to our VP – Information Technology and is responsible for reporting material incidents to our Cybersecurity Risk Management Committee (“CRMC”) that includes officers charged with reporting responsibilities. Cybersecurity incidents that meet a pre-determined minimum threshold are communicated upward to executive officers to determine overall materiality and disclosure obligations. Our Director of IT Security keeps the CRMC apprised of our processes to prevent, detect, mitigate and remediate cybersecurity incidents at least annually. Our internal cybersecurity team led by our Director of IT Security has over 75 years of combined experience in information security and maintains several cybersecurity certificates.
We conduct security assessments, manage user access, perform vulnerability scanning and patching, oversee monitoring and carry out annual penetration testing, in addition to other critical security functions. In conjunction with our internal team, we utilize an independent third-party operations center that is focused on, but not limited to, monitoring alerts, logs, behavior analytics, vulnerability notifications and remediation guidance. Critical infrastructure is continuously monitored to ensure accessibility and appropriate security posture. We also perform reviews and risk analysis for third-party software and platforms which sets a standardized security baseline. We monitor known third-party breaches, known software vulnerabilities that may affect third-party vendors and communicate as necessary with those vendors, allowing us to increase security of our technology assets and our data. In addition, we perform an annual cybersecurity risk assessment of critical third-party systems.
Our board of directors oversees our cybersecurity risk and receives, at a minimum, a quarterly cybersecurity report and a bi-annual update from IT leadership, which includes additional discussions of any relevant issues related to the understanding of technology and cybersecurity risk that may be relevant at any given time. This report includes, among other things, information regarding our current security posture and ongoing cybersecurity events. Cybersecurity incidents meeting a pre-determined minimum threshold are communicated to our Board.
To date, there have been no risks from cybersecurity threats because of any previous cybersecurity incidents, which have materially affected, or have been reasonably likely to materially affect us, including our business strategy, results of operations or financial condition. Notwithstanding the extensive approach we take to cybersecurity, we may not be successful in preventing or mitigating a cybersecurity incident that could have a material adverse effect on us. For more information on our cybersecurity related risks, see Item 1A. Risk Factors of this Annual Report on Form 10-K.
ITEM 3. LEGAL PROCEEDINGS
We are the subject of, or party to, a number of pending or threatened legal actions, administrative proceedings or investigations arising in the ordinary course of our business including, but not limited to royalty claims, contract claims and environmental claims. While many of these matters involve inherent uncertainty, we believe that the amount of the liability, if any, ultimately incurred with respect to these actions, proceedings or investigations will not have a material adverse effect on our consolidated financial position as a whole or on our liquidity, capital resources or future annual results of operations. We will continue to evaluate our litigation quarterly and will establish and adjust any litigation reserves as appropriate to reflect our assessment of the then-current status of litigation.
Environmental Proceedings
From time to time, we receive notices of violation from governmental and regulatory authorities in areas in which we operate relating to alleged violations of environmental statutes or the rules and regulations promulgated thereunder. While we cannot predict with certainty whether these notices of violation will result in fines and/or penalties, if fines and/or penalties are imposed, they may result in monetary sanctions, individually or in the aggregate, in excess of $250,000.
ITEM 4. MINE SAFETY DISCLOSURES
Not applicable.
PART II
ITEM 5. MARKET FOR REGISTRANT’S COMMON EQUITY, RELATED STOCKHOLDER MATTERS AND ISSUER PURCHASES OF EQUITY SECURITIES
Market for Common Stock
Our common stock is listed on the NYSE under the symbol "RRC." During 2024, trading volume averaged approximately 2.3 million shares per day.
Holders of Record
Pursuant to the records of our transfer agent, as of February 21, 2025, there were approximately 820 holders of record of our common stock.
Dividends
The payment of dividends is subject to the formal declaration by the board of directors. The determination of the amount of future dividends, if any, to be declared and paid is at the sole discretion of our board of directors and will depend upon, among other things, our earnings, financial condition, capital requirements, levels of indebtedness and other considerations our board of directors deems relevant. For more information, see Item 7. Management’s Discussion and Analysis of Financial Condition and Results of Operations.
Equity Compensation Plan Information
The information required by this item is incorporated herein by reference to our 2025 Proxy Statement, which will be filed with the SEC not later than 120 days after December 31, 2024.
Purchases of Equity Securities by the Issuer and Affiliated Purchasers
In 2019, our board of directors authorized a common stock repurchase program. In 2022, our board of directors increased the authorization under the program. Shares repurchased as of December 31, 2024, were held as treasury stock and we have approximately $1.0 billion of remaining authorization under the program. These repurchases are based on trade date, although certain repurchases may not have settled until the following month. Purchases of our common stock in fourth quarter 2024 were as follows:
| | | | | | | | | | | | | | | | |
Period | | Total Number
of Shares
Purchased | | | Average Price
Paid Per Share (a) | | | Total Number
of Shares Purchased as Part of Publicly
Announced Plans
or Programs | | | Approximate
Dollar Amount
of Shares that
May Yet Be
Purchased Under
Plans or Programs | |
October 2024 | | | 100,000 | | | $ | 30.40 | | | | 100,000 | | | $ | 1,034,183,625 | |
November 2024 | | | 100,000 | | | $ | 29.74 | | | | 100,000 | | | $ | 1,031,209,315 | |
December 2024 | | | 450,000 | | | $ | 33.58 | | | | 450,000 | | | $ | 1,016,098,568 | |
| | | 650,000 | | | | | | | 650,000 | | | | |
| |
(a) | Includes any fees, commissions, or other expenses associated with the share repurchases. |
Stockholder Return Performance Presentation
The following graph is included in accordance with the SEC’s executive compensation disclosure rules. This historic stock price performance is not necessarily indicative of future stock performance. The graph compares the change in the cumulative total return of Range’s common stock, the S&P Oil and Gas Exploration and Production Index, the S&P Small Cap 600 Index and a customized peer group which matches the peer group selected by our compensation committee of the board of directors which is used in our performance unit program. The graph assumes that $100 was invested in the Company’s common stock and each index on December 31, 2019 and that dividends were reinvested.
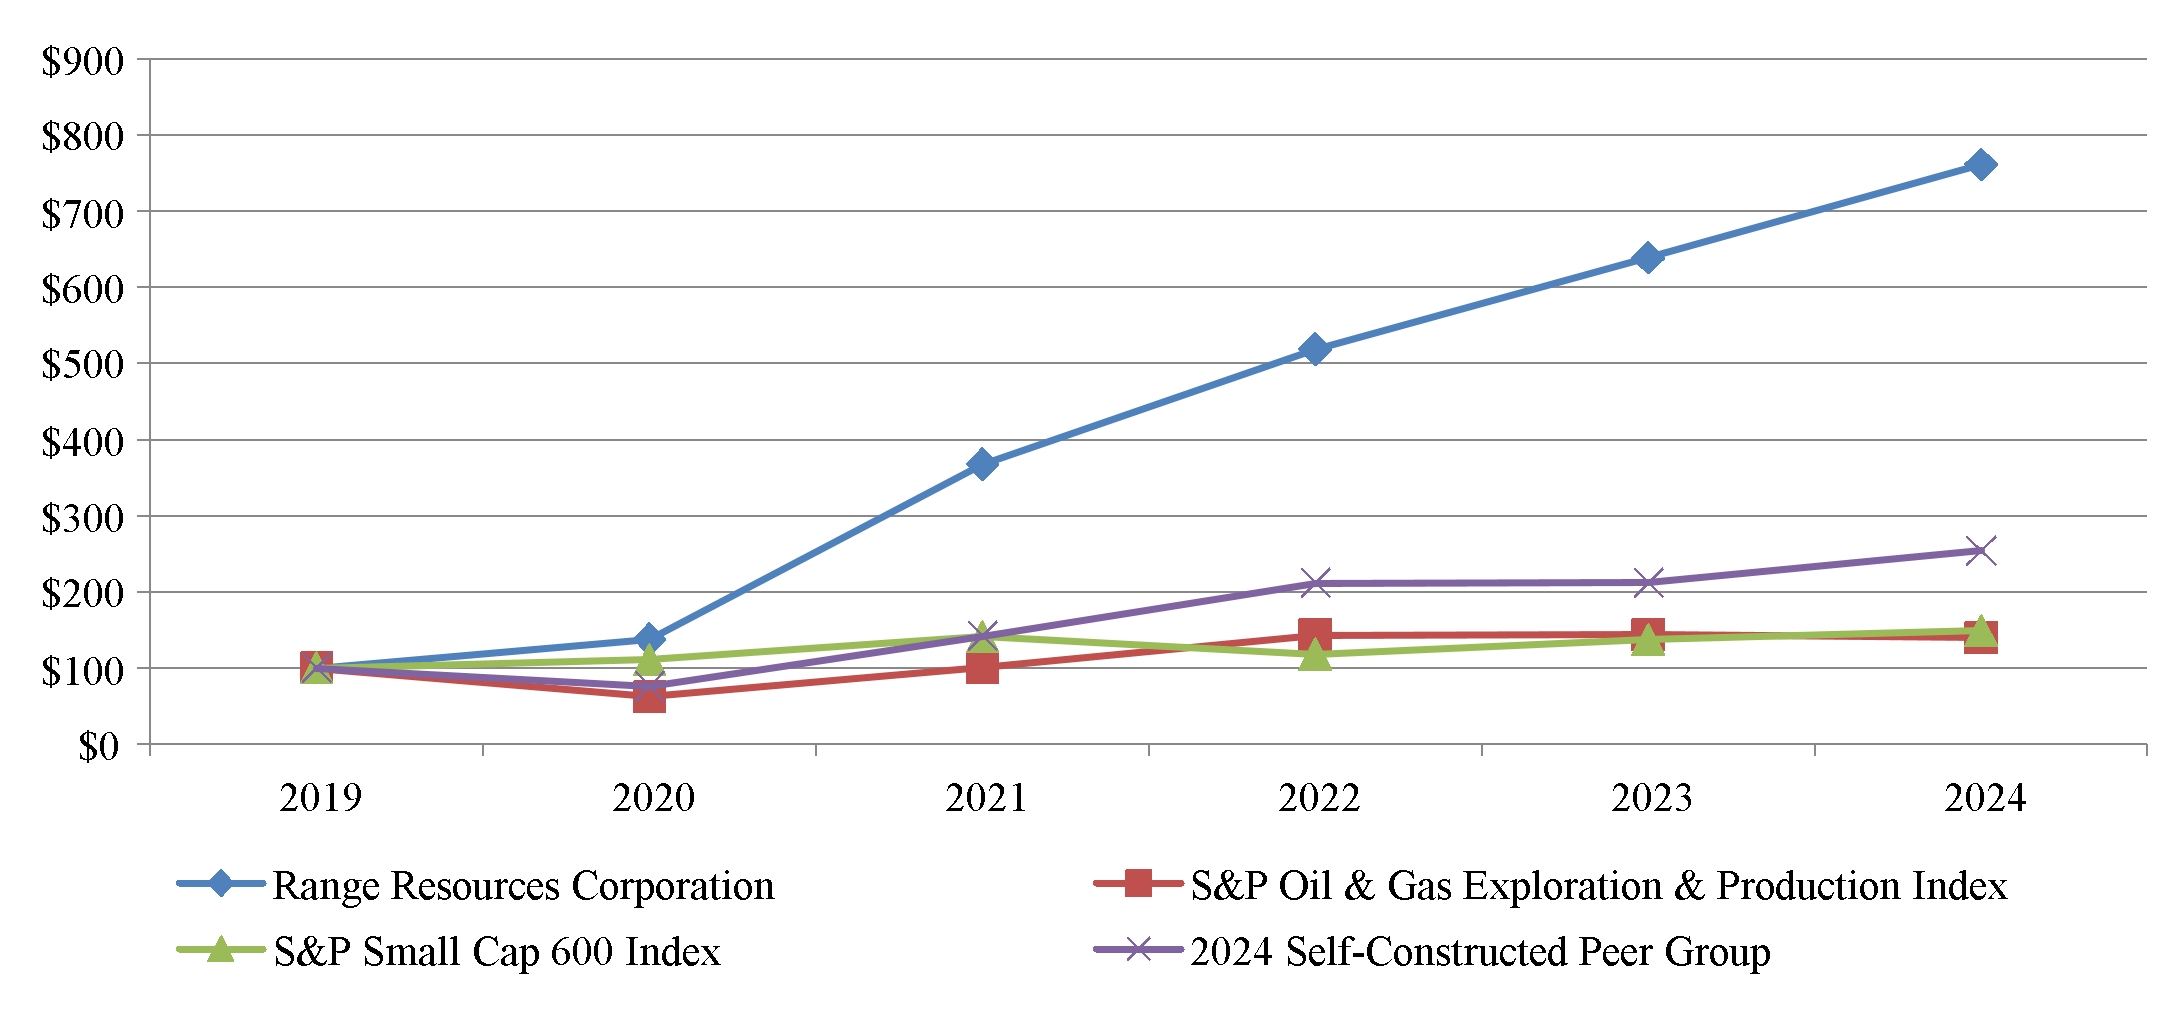
| | | | | | | | | | | | | | | | | | | | | | | |
| 2019 | | | 2020 | | | 2021 | | | 2022 | | | 2023 | | | 2024 | |
Range Resources Corporation | $ | 100 | | | $ | 138 | | | $ | 368 | | | $ | 519 | | | $ | 639 | | | $ | 762 | |
S&P Oil & Gas Exploration & Production Index | | 100 | | | | 62 | | | | 101 | | | | 143 | | | | 144 | | | | 140 | |
S&P Small Cap 600 Index | | 100 | | | | 111 | | | | 141 | | | | 118 | | | | 137 | | | | 149 | |
2024 Self-Constructed Peer Group (a) | | 100 | | | | 76 | | | | 142 | | | | 212 | | | | 212 | | | | 255 | |
| |
(a) | The 2024 Self-Constructed Peer Group includes the following fifteen companies: Antero Resources Corporation, Callon Petroleum Company (included through February 2024 when it was acquired by Apache Corporation), Chesapeake Energy Corporation (Expand Energy Corporation from October 2024 through December 2024), Civitas Resources, Inc., Chord Energy Corporation, CNX Resources Corporation, Comstock Resources, Inc., Coterra Energy, Inc., EQT Corporation, Magnolia Oil & Gas Corporation, Matador Resources Company, Marathon Oil Corporation (included through November 2024 when it was acquired by Conoco Phillips), Murphy Oil, SM Energy Company, Southwestern Energy Company (included through September 2024 when it was acquired by Chesapeake Energy Corporation to form Expand Energy Corporation) and the S&P 400. The 2024 Self-Constructed Peer Group is a market capitalization-weighted index in which each of the seven Compensation Peer Group companies with the highest percentage of dry gas reserves are included twice. The seven companies included twice are Antero Resources Corporation, Chesapeake Energy Corporation (Expand Energy Corporation from October 2024 through December 2024), CNX Resources Corporation, Comstock Resources, Inc., Coterra Energy Inc., EQT Corporation and Southwestern Energy Company (included through September 2024 when it was acquired by Chesapeake Energy Corporation to form Expand Energy Corporation). |
The above performance graph shall not be deemed "filed" for purposes of Section 18 Exchange Act, or otherwise subject to the liabilities under that section and shall not be deemed to be incorporated by reference into any filing under the Securities Act of 1933, as amended, or the Exchange Act, except as shall be expressly set forth by specific reference in such filing.
ITEM 6. RESERVED
ITEM 7. MANAGEMENT’S DISCUSSION AND ANALYSIS OF FINANCIAL CONDITION AND RESULTS OF OPERATIONS
The following discussion is intended to assist you in understanding our business and results of operations together with our present financial condition and should be read in conjunction with the information under Item 8. Financial Statements and Supplementary Data and other financial information found elsewhere in this Form 10-K. See also matters referenced in the foregoing pages under "Disclosures Regarding Forward-Looking Statements."
The following tables and discussions set forth key operating and financial data for the years ended December 31, 2024 and 2023. For similar discussions of the year ended December 31, 2023 compared to December 31, 2022 results, refer to Item 7. Managements’ Discussion and Analysis of Financial Condition and Results of Operations under Part II of our annual report on Form 10-K for the year ended December 31, 2023, which was filed with the SEC on February 21, 2024.
Overview of Our Business
We are an independent natural gas, NGLs and oil company engaged in the exploration, development and acquisition of natural gas and oil properties located in the Appalachian region of the United States. We operate in one segment and have a single company-wide management team that administers all properties as a whole rather than by discrete operating segments. We measure financial performance as a single enterprise and not on an area-by-area basis.
Our overarching business objective is to build stockholder value through returns-focused development of natural gas, NGLs and oil properties. Our strategy to achieve our business objective is to generate consistent cash flows from reserves and production through internally generated drilling projects occasionally coupled with complementary acquisitions and divestitures of non-core or, at times, core assets. Currently, our investment portfolio is focused on high quality natural gas assets in the state of Pennsylvania. Our revenues, profitability and future growth depend substantially on prevailing prices for natural gas, NGLs and oil and on our ability to economically find, develop, acquire and produce natural gas, NGLs and oil reserves.
Commodity prices have been and are expected to remain volatile. We believe we are well-positioned to manage any challenges during a low commodity price environment and that we can endure the continued volatility in current and future commodity prices by:
•exercising discipline in our capital investments;
•optimizing drilling, completion and operational efficiencies;
•maintaining a competitive cost structure;
•managing price risk through the hedging of our production; and
•managing our balance sheet.
Prices for natural gas, NGLs, and oil fluctuate widely and affect:
•our revenues, profitability and cash flow;
•the quantity of natural gas, NGLs and oil that we can economically produce;
•the quantity of natural gas, NGLs and oil shown as proved reserves;
•the amount of cash flow available to us for reinvestment or return to our stockholders; and
•our ability to borrow and raise additional capital.
We prepare our financial statements in conformity with U.S. GAAP, which require us to make estimates and assumptions that affect our reported results of operations and the amount of our reported assets, liabilities and proved natural gas, NGLs and oil reserves. We use the successful efforts method of accounting for our natural gas, NGLs and oil activities.
Management’s Discussion and Analysis of Results of Operations
Commodity prices have remained volatile. Benchmarks for natural gas and oil decreased in 2024 compared to 2023 while NGLs benchmarks remained comparable. As a result, we experienced decreases in our price realizations when compared to the same period of 2023. Despite lower prices, we continued to focus on creating long-term value for our stockholders along with positioning ourselves to be a responsible and reliable supplier of natural gas, NGLs and oil.
Overview of 2024 Results
During 2024, we recognized net income of $266.3 million, or $1.09 per diluted common share compared to $871.1 million, or $3.57 per diluted common share during 2023. The decrease in net income for the year ended December 31, 2024 when compared to 2023 is primarily due to lower realized prices and lower derivative fair value income which are partially offset by higher production.
For the year ended December 31, 2024, we experienced a decrease in revenue from the sale of natural gas, NGLs and oil due to a 2% decrease in net realized prices (average prices including all derivative settlements and third-party transportation costs paid by us) when compared to 2023. Daily production in 2024 averaged 2.18 Bcfe compared to 2.14 Bcfe in 2023.
During 2024, our financial and operating performance included the following results:
•revenue from the sale of natural gas, NGLs and oil decreased 5% from the same period of 2023 with a 7% decrease in average realized prices (before cash settlements on our derivatives) partially offset by slightly higher production volumes;
•revenue from the sale of natural gas, NGLs and oil (including cash settlements on our derivatives) increased 3% from the same period of 2023;
•transportation, gathering, processing and compression expense per mcfe was $1.48 in 2024 compared to $1.43 in the same period of 2023 primarily due to the increase of NGLs volumes and prices;
•direct operating expense per mcfe was $0.12 in 2024 compared to $0.12 in the same period of 2023;
•general and administrative expense per mcfe for 2024 increased 5% from the same period of 2023 primarily due to higher employee costs;
•interest expense per mcfe for 2024 decreased 6% from the same period of 2023 due to lower debt balances;
•our DD&A rate per mcfe for 2024 remained the same when compared to the same period of 2023;
•drilled 52 net wells with a 100% success rate; and
•our capital investment for 2024 was $654.0 million, which was within our initially announced range of $620.0 million to $670.0 million.
The year ended December 31, 2024 also included the following highlights to enhance our balance sheet, return capital to investors and preserve liquidity:
•paid $77.5 million in dividends or $0.32 per common share compared to $0.32 per common share in 2023;
•repurchased $65.3 million of our common stock compared to $19.0 million in 2023;
•repurchased in the open market $79.7 million face value of our 4.875% senior notes due 2025 at a discount; and
•enhanced liquidity with the accumulation of cash on hand of $304.5 million along with $1.3 billion available under our credit facility.
We generated $944.5 million of cash from operating activities in 2024, which is $33.4 million lower when compared to 2023 and reflects lower realized prices combined with higher comparative working capital outflows.
The year ended December 31, 2024 also included the following highlights that emphasized our corporate sustainability and initiatives:
•completed the MiQ certification for our Southwest Pennsylvania assets and re-certified an "A" grade;
•continued to recycle approximately 100% of our produced water; and
•expanded the installation and use of compressed air pneumatic controllers.
Acquisitions
During 2024, we invested $57.9 million to acquire unproved acreage compared to $40.1 million in 2023. We continue selective acreage leasing and lease renewals to consolidate our acreage positions in the Marcellus Shale play in Pennsylvania.
Outlook for 2025
As we enter 2025, we believe we are positioned for sustainable long-term success. For 2025, we expect our capital budget to be in the range of $650 million to $690 million for natural gas, NGLs and oil related activities, excluding any potential acquisitions, for
which we do not budget. As has been our historical practice, we will periodically review our capital expenditures throughout the year and may adjust the budget based on commodity prices, drilling success and other factors. We expect our 2025 capital budget to achieve modest growth in production relative to 2024 production, while also supporting our longer-term operational plans. Our 2025 capital budget is focused on generating free cash flow while efficiently developing our resource base to achieve competitive full cycle returns for our stockholders. The prices we receive for our natural gas, NGLs and oil production are largely based on current market prices, which are beyond our control. The price risk on a portion of our forecasted natural gas, NGLs and oil production for 2025 is partially mitigated by entering into commodity derivative contracts, and we intend to continue to enter into these types of contracts. We believe it is likely that commodity prices will continue to be volatile during 2025.
Market Conditions
We believe we are positioned for sustainable long-term success. We continue to monitor the impact of the actions of OPEC and other large producing nations, the Russia-Ukraine conflict, hostilities in the Middle East, global inventories of gas, NGLs and oil, future monetary and fiscal policy and governmental policies aimed at transitioning towards lower carbon energy, and we expect prices for commodities we produce to remain volatile given the complex dynamics of supply and demand that exist in the global energy markets. In fourth quarter 2024, natural gas prices declined based on the relatively mild early days of winter in the United States. Longer term natural gas futures prices remain stronger based on market expectations that associated gas-related activity in oil basins and dry gas basin activity will show modest rates of growth due to infrastructure constraints, moderated reinvestment rates and core inventory exhaustion. In addition, the global energy crisis experienced in recent years further highlighted the low cost and low emissions shale gas resource base in North America, supporting continued strong structural demand growth for United States liquefied natural gas exports, domestic industrial gas demand and power generation. Other factors such as geopolitical disruptions, supply chain disruptions, cost inflation, concerns over a potential economic recession and the pace and changes in global monetary policy may impact the demand for natural gas, NGLs and oil. We continue to assess and monitor the impact and consequences of these factors on our operations.
Prices for various quantities of natural gas, NGLs and oil that we produce significantly impact our revenues and cash flows. Prices for commodities, such as hydrocarbons, are inherently volatile. Recently, natural gas prices have increased when compared to the fourth quarter 2024, with the average NYMEX monthly settlement price for natural gas increasing to $3.51 per mcf for January and $3.54 per mcf for February 2025 following cold winter weather. Oil prices slightly increased from December 2024, to $75.10 per barrel in January 2025. The following table lists related benchmarks for natural gas, oil and NGLs composite prices for the years ended December 31, 2024 and 2023.
| | | | | | | |
| Year Ended
December 31, | |
| 2024 | | | 2023 | |
Benchmarks: | | | | | |
Average NYMEX prices (a) | | | | | |
Natural gas (per mcf) | $ | 2.27 | | | $ | 2.75 | |
Oil (per bbl) | | 76.17 | | | | 77.54 | |
Mont Belvieu NGLs composite (per gallon) (b) | | 0.56 | | | | 0.56 | |
(a)Based on average of monthly last day settlement prices on the New York Mercantile Exchange ("NYMEX").
(b)Based on our estimated NGLs product composition per barrel.
Our price realizations (not including the impact of our derivatives) may differ from the benchmarks for many reasons, including quality, location, or production being sold at different prices.
Natural Gas, NGLs and Oil Sales, Production and Realized Price Calculations
Our revenues vary from year to year as a result of changes in realized commodity prices and production volumes. In 2024, natural gas, NGLs and oil sales decreased 5% from 2023 with a 7% decrease in realized prices (excluding cash settlements on our derivatives) partially offset by slightly higher production volumes. The following table illustrates the primary components of natural gas, NGLs and oil sales for the last two years (in thousands):
| | | | | | | | | | | | | | | |
| Year Ended December 31, | |
| 2024 | | | 2023 | | | Change | | | % | |
Natural gas, NGLs and oil sales | | | | | | | | | | | |
Natural gas | $ | 1,052,442 | | | $ | 1,234,308 | | | $ | (181,866 | ) | | | (15 | )% |
NGLs | | 1,020,903 | | | | 933,791 | | | | 87,112 | | | | 9 | % |
Oil | | 140,505 | | | | 166,562 | | | | (26,057 | ) | | | (16 | )% |
Total natural gas, NGLs and oil sales | $ | 2,213,850 | | | $ | 2,334,661 | | | $ | (120,811 | ) | | | (5 | )% |
Production is maintained through drilling success as we place new wells on production, which is partially offset by the natural decline of our natural gas, NGLs and oil reserves through production. Our production for the last two years is set forth in the following table:
| | | | | | | | | | | | | | | |
| Year Ended December 31, | |
| 2024 | | | 2023 | | | Change | | | % | |
Production (a) | | | | | | | | | | | |
Natural gas (mcf) | | 545,415,974 | | | | 538,084,671 | | | | 7,331,303 | | | | 1 | % |
NGLs (bbls) | | 39,622,576 | | | | 37,939,700 | | | | 1,682,876 | | | | 4 | % |
Oil (bbls) | | 2,180,528 | | | | 2,475,306 | | | | (294,778 | ) | | | (12 | )% |
Total (mcfe) (b) | | 796,234,598 | | | | 780,574,707 | | | | 15,659,891 | | | | 2 | % |
| | | | | | | | | | | |
Average daily production (a) | | | | | | | | | | | |
Natural gas (mcf) | | 1,490,208 | | | | 1,474,205 | | | | 16,003 | | | | 1 | % |
NGLs (bbls) | | 108,258 | | | | 103,944 | | | | 4,314 | | | | 4 | % |
Oil (bbls) | | 5,958 | | | | 6,782 | | | | (824 | ) | | | (12 | )% |
Total (mcfe) (b) | | 2,175,504 | | | | 2,138,561 | | | | 36,943 | | | | 2 | % |
(a)Represents volumes sold regardless of when produced.
(b)Oil and NGLs volumes are converted to mcfe at the rate of one barrel equals six mcf based upon the approximate relative energy content of oil and natural gas, which is not indicative of the relationship between oil and natural gas prices.
Our average realized price (including all derivative settlements and third-party transportation costs paid by Range) received during 2024 was $1.84 per mcfe compared to $1.88 per mcfe in 2023. The majority of our production is sold at market-sensitive prices. We believe computed final realized prices should include the impact of transportation, gathering, processing and compression expense. Average sales prices (excluding derivative settlements) do not include any derivative settlements or third-party transportation costs which are reported in transportation, gathering and compression expense on the accompanying consolidated statements of income. Average sales prices (excluding derivative settlements) do include transportation costs where we receive net proceeds from the purchaser. Our average realized price (including all derivative settlements and third-party transportation costs paid by Range) calculation includes all cash settlements for derivatives. Average realized price calculations for the last two years are shown below:
| | | | | | | | | | | | | | | |
| Year Ended December 31, | |
| 2024 | | | 2023 | | | Change | | | % | |
Average Prices | | | | | | | | | | | |
Average realized prices (excluding derivative settlements): | | | | | | | | | | | |
Natural gas (per mcf) | $ | 1.93 | | | $ | 2.29 | | | $ | (0.36 | ) | | | (16 | )% |
NGLs (per bbl) | | 25.77 | | | | 24.61 | | | | 1.16 | | | | 5 | % |
Oil (per bbl) | | 64.44 | | | | 67.29 | | | | (2.85 | ) | | | (4 | )% |
Total (per mcfe) (a) | | 2.78 | | | | 2.99 | | | | (0.21 | ) | | | (7 | )% |
Average realized prices (including all derivative settlements): | | | | | | | | | | | |
Natural gas (per mcf) | $ | 2.70 | | | $ | 2.77 | | | $ | (0.07 | ) | | | (3 | )% |
NGLs (per bbl) | | 25.86 | | | | 24.61 | | | | 1.25 | | | | 5 | % |
Oil (per bbl) | | 68.77 | | | | 62.77 | | | | 6.00 | | | | 10 | % |
Total (per mcfe) (a) | | 3.32 | | | | 3.31 | | | | 0.01 | | | | 0 | % |
Average realized prices (including all derivative settlements
and third-party transportation costs paid by Range): | | | | | | | | | | | |
Natural gas (per mcf) | $ | 1.58 | | | $ | 1.68 | | | $ | (0.10 | ) | | | (6 | )% |
NGLs (per bbl) | | 11.62 | | | | 10.80 | | | | 0.82 | | | | 8 | % |
Oil (per bbl) | | 67.87 | | | | 62.43 | | | | 5.44 | | | | 9 | % |
Total (per mcfe) (a) | | 1.84 | | | | 1.88 | | | | (0.04 | ) | | | (2 | )% |
(a)Oil and NGLs volumes are converted at the rate of one barrel equals six mcf based upon the approximate relative energy content of oil to natural gas, which is not indicative of the relationship between oil and natural gas prices.
Realized prices include the impact of basis differentials and gains or losses realized from our basis hedging. The prices we receive for our natural gas can be more or less than the NYMEX price because of adjustments for delivery location, relative quality and other factors. The following table provides this impact on a per mcf basis:
| | | | | | | |
| Year Ended
December 31, | |
| 2024 | | | 2023 | |
Average natural gas differentials below NYMEX | $ | (0.34 | ) | | $ | (0.46 | ) |
Realized (losses) gains on basis hedging | $ | (0.02 | ) | | $ | 0.05 | |
The following tables reflect our production and average realized commodity prices (excluding derivative settlements and third-party transportation costs paid by Range) (in thousands, except prices):
| | | | | | | | | | | | | | | |
| Year Ended December 31, | |
| 2023 | | | Price
Variance | | | Volume
Variance | | | 2024 | |
Natural gas | | | | | | | | | | | |
Price (per mcf) | $ | 2.29 | | | $ | (0.36 | ) | | $ | — | | | $ | 1.93 | |
Production (Mmcf) | | 538,085 | | | | — | | | | 7,331 | | | | 545,416 | |
Natural gas sales | $ | 1,234,308 | | | $ | (198,683 | ) | | $ | 16,817 | | | $ | 1,052,442 | |
| | | | | | | | | | | | | | | |
| Year Ended December 31, | |
| 2023 | | | Price
Variance | | | Volume
Variance | | | 2024 | |
NGLs | | | | | | | | | | | |
Price (per bbl) | $ | 24.61 | | | $ | 1.16 | | | $ | — | | | $ | 25.77 | |
Production (Mbbls) | | 37,940 | | | | — | | | | 1,683 | | | | 39,623 | |
NGLs sales | $ | 933,791 | | | $ | 45,692 | | | $ | 41,420 | | | $ | 1,020,903 | |
| | | | | | | | | | | | | | | |
| Year Ended December 31, | |
| 2023 | | | Price
Variance | | | Volume
Variance | | | 2024 | |
Oil | | | | | | | | | | | |
Price (per bbl) | $ | 67.29 | | | $ | (2.85 | ) | | $ | — | | | $ | 64.44 | |
Production (Mbbls) | | 2,475 | | | | — | | | | (294 | ) | | | 2,181 | |
Oil sales | $ | 166,562 | | | $ | (6,222 | ) | | $ | (19,835 | ) | | $ | 140,505 | |
| | | | | | | | | | | | | | | |
| Year Ended December 31, | |
| 2023 | | | Price
Variance | | | Volume
Variance | | | 2024 | |
Consolidated | | | | | | | | | | | |
Price (per mcfe) | $ | 2.99 | | | $ | (0.21 | ) | | $ | — | | | $ | 2.78 | |
Production (Mmcfe) | | 780,575 | | | | — | | | | 15,660 | | | | 796,235 | |
Total natural gas, NGLs and oil sales | $ | 2,334,661 | | | $ | (167,649 | ) | | $ | 46,838 | | | $ | 2,213,850 | |
Transportation, gathering, processing and compression expense was $1.2 billion in 2024 and $1.1 billion in 2023. These third-party costs are higher than the prior year due to an increase in NGLs volumes and higher prices throughout the year which increases processing cost. Gas transportation and gathering also increased with the use of new facilities in the current year. We have included these costs in the calculation of average realized prices (including all derivative settlements and third-party transportation expenses paid by Range). The following table summarizes transportation, gathering, processing and compression expense for the last two years (in thousands) and on a per mcf and per barrel basis:
| | | | | | | | | | | | | | | |
| Year Ended December 31, | |
| 2024 | | | 2023 | | | Change | | | % | |
Transportation, gathering
processing and compression | | | | | | | | | | | |
Natural gas | $ | 611,698 | | | $ | 588,970 | | | $ | 22,728 | | | | 4 | % |
NGLs | | 564,269 | | | | 524,114 | | | | 40,155 | | | | 8 | % |
Oil | | 1,958 | | | | 857 | | | | 1,101 | | | | 128 | % |
Total | $ | 1,177,925 | | | $ | 1,113,941 | | | $ | 63,984 | | | | 6 | % |
| | | | | | | | | | | |
Natural gas (per mcf) | $ | 1.12 | | | $ | 1.09 | | | $ | 0.03 | | | | 3 | % |
NGLs (per bbl) | | 14.24 | | | | 13.81 | | | | 0.43 | | | | 3 | % |
Oil (per bbl) | | 0.90 | | | | 0.35 | | | | 0.55 | | | | 157 | % |
Total (per mcfe) | | 1.48 | | | | 1.43 | | | | 0.05 | | | | 3 | % |
Derivative fair value income was $56.7 million in 2024 compared to income of $821.2 million in 2023. All of our derivatives are accounted for using the mark-to-market accounting method. Mark-to-market accounting treatment can result in more volatility in our revenues as the change in fair value of our commodity derivative positions is included in total revenue. As commodity prices increase or decrease, such changes will have an opposite effect on the mark-to-market value of our derivatives. Gains on our derivatives generally indicate lower wellhead revenues in the future while losses indicate higher future wellhead revenues. The following table summarizes the impact of our commodity derivatives for the last two years (in thousands):
| | | | | | | |
| Year Ended
December 31, | |
| 2024 | | | 2023 | |
Derivative fair value income per consolidated statements of income | $ | 56,726 | | | $ | 821,154 | |
| | | | | |
Non-cash fair value (loss) income: ⁽ᵃ⁾ | | | | | |
Natural gas derivatives | $ | (364,467 | ) | | $ | 557,419 | |
NGLs derivatives | | — | | | | — | |
Oil derivatives | | (11,199 | ) | | | 23,301 | |
Divestiture contingent consideration | | — | | | | (13,080 | ) |
Total non-cash fair value (loss) income ⁽ᵃ⁾ | $ | (375,666 | ) | | $ | 567,640 | |
| | | | | |
Net cash receipt (payment) on derivative settlements: | | | | | |
Natural gas derivatives | $ | 419,199 | | | $ | 256,693 | |
NGLs derivatives | | 3,743 | | | | — | |
Oil derivatives | | 9,450 | | | | (11,179 | ) |
Divestiture contingent consideration | | — | | | | 8,000 | |
Total net cash receipt | $ | 432,392 | | | $ | 253,514 | |
(a)Non-cash fair value adjustments on commodity derivatives is a non-GAAP measure. Non-cash fair value adjustments on commodity derivatives only represent the net change between periods of the fair market values of commodity derivative positions and exclude the impact of settlements on commodity derivatives during the period. We believe that non-cash fair value adjustments on commodity derivatives is a useful supplemental disclosure to differentiate non-cash fair market value adjustments from settlements on commodity derivatives during the period. Non-cash fair value adjustments on commodity derivatives is not a measure of financial or operating performance under GAAP, nor should it be considered a substitute for derivative fair value income or loss as reported in our consolidated statements of income.
Brokered natural gas and marketing revenue was $133.0 million in 2024 compared to $206.6 million in 2023. We enter into purchase transactions with third parties and separate sale transactions with third parties at different times to utilize available pipeline capacity and to fulfill sales commitments in the event of operational upsets. These brokered revenues decreased compared to 2023 due to lower brokered volumes and sales prices. See also Brokered natural gas and marketing expense below for more information on our net brokered margin.
Other income was $13.5 million in 2024 compared to $12.5 million in 2023. This includes $12.7 million of interest income and $311,000 of gain on sale of assets in 2024 compared to $5.9 million of interest income and $455,000 gain on sale of assets in 2023. The 2023 period also includes the receipt of $5.1 million in make-whole payments. In 2023 and prior, interest income was included within brokered natural gas and marketing revenue and other and gain on sale of assets was its own discrete line item within our annual report on Form 10-K for the year ended December 31, 2023. In 2024, and for the prior years presented in the accompanying consolidated statements of income, we reclassified both of these items into other income on the accompanying consolidated statements of income.
Costs and Expenses per mcfe
We believe some of our expense fluctuations are best analyzed on a unit-of-production, or per mcfe, basis. The following presents information about certain of our expenses on a per mcfe basis for the last two years:
| | | | | | | | | | | | | | | |
| Year Ended December 31, | |
| 2024 | | | 2023 | | | Change | | | % | |
Direct operating expense | $ | 0.12 | | | $ | 0.12 | | | $ | — | | | | — | % |
Taxes other than income | | 0.03 | | | | 0.03 | | | | — | | | | — | % |
General and administrative expense | | 0.22 | | | | 0.21 | | | | 0.01 | | | | 5 | % |
Interest expense | | 0.15 | | | | 0.16 | | | | (0.01 | ) | | | (6 | )% |
Depletion, depreciation and amortization expense | | 0.45 | | | | 0.45 | | | | — | | | | — | % |
Direct operating expense was $95.3 million in 2024 compared to $96.1 million in 2023. Direct operating expenses include normally recurring expenses to operate and produce our wells, non-recurring workover and repair-related expenses. Our direct operating expenses for 2024 decreased from the prior year primarily due to lower water hauling/handling costs and lower workover costs, partially offset by higher labor expense. We incurred $3.3 million of workover costs in 2024 compared to $4.5 million of workover costs in 2023. Stock-based compensation expense represents the amortization of equity grants as part of the compensation of field employees. The following table summarizes direct operating expenses per mcfe for the last two years:
| | | | | | | | | | | | | | | |
| Year Ended December 31, | |
| 2024 | | | 2023 | | | Change | | | % | |
Direct operating | | | | | | | | | | | |
Lease operating expense | $ | 0.12 | | | $ | 0.11 | | | $ | 0.01 | | | | 9 | % |
Workovers | | — | | | | 0.01 | | | | (0.01 | ) | | | (100 | )% |
Stock-based compensation | | — | | | | — | | | | — | | | | — | % |
Total direct operating expense | $ | 0.12 | | | $ | 0.12 | | | $ | (0.00 | ) | | | (0 | )% |
Taxes other than income expense was $21.6 million in 2024 compared to $23.7 million in 2023. This expense category is primarily the Pennsylvania impact fee. In 2012, Pennsylvania enacted an "impact fee" on unconventional natural gas and oil production which includes the Marcellus Shale. The impact fee is based upon the year wells are drilled and the fee varies, like a severance tax, based upon natural gas prices. The year ended December 31, 2024 includes a $21.2 million impact fee compared to $21.8 million in the year ended December 31, 2023, with the decrease primarily due to a decrease in the average fee per well. This category also includes other taxes such as franchise, real estate and commercial activity taxes. The following table summarizes taxes other than income per mcfe for the last two years:
| | | | | | | | | | | | | | | |
| Year Ended December 31, | |
| 2024 | | | 2023 | | | Change | | | % | |
Taxes other than income | | | | | | | | | | | |
Impact fee | $ | 0.03 | | | $ | 0.03 | | | $ | — | | | | — | % |
Other | | — | | | | — | | | | — | | | | — | % |
Total taxes other than income | $ | 0.03 | | | $ | 0.03 | | | $ | — | | | | — | % |
General and administrative expense was $172.1 million for 2024 compared to $164.7 million for 2023. The increase in 2024, when compared to 2023, is primarily due to higher salary and benefit related costs and higher stock-based compensation. As of December 31, 2024, the number of general and administrative employees increased by 1% when compared to December 31, 2023. Stock-based compensation expense represents the amortization of stock-based compensation awards granted to our employees and our non-employee directors as part of their compensation. The following table summarizes general and administrative expenses per mcfe for the last two years:
| | | | | | | | | | | | | | | |
| Year Ended December 31, | |
| 2024 | | | 2023 | | | Change | | | % | |
General and administrative | | | | | | | | | | | |
General and administrative | $ | 0.17 | | | $ | 0.16 | | | $ | 0.01 | | | | 6 | % |
Stock-based compensation | | 0.05 | | | | 0.05 | | | | — | | | | — | % |
Total general and administrative expense | $ | 0.22 | | | $ | 0.21 | | | $ | 0.01 | | | | 5 | % |
Interest expense was $118.8 million for 2024 compared to $124.0 million for 2023. The following table summarizes interest expense per mcfe for the last two years:
| | | | | | | | | | | | | | | |
| Year Ended December 31, | |
| 2024 | | | 2023 | | | Change | | | % | |
Bank credit facility (a) | $ | 0.01 | | | $ | 0.01 | | | $ | — | | | | — | % |
Senior notes | | 0.13 | | | | 0.14 | | | | (0.01 | ) | | | (7 | )% |
Amortization of deferred financing
costs and other | | 0.01 | | | | 0.01 | | | | — | | | | — | % |
Total interest expense | $ | 0.15 | | | $ | 0.16 | | | $ | (0.01 | ) | | | (6 | )% |
Average debt outstanding ($000s) | $ | 1,741,648 | | | $ | 1,821,940 | | | $ | (80,292 | ) | | | (4 | )% |
Average interest rate (b) | | 6.5 | % | | | 6.5 | % | | | — | % | | | — | % |
(a)Includes commitment fees.
(b)Excludes deferred financing costs.
The decrease in interest expense from 2023 to 2024 was primarily due to lower overall outstanding average debt balances. See Note 6 to our consolidated financial statements for additional information. We had no debt outstanding on the bank credit facility during 2024. Average debt outstanding on the bank credit facility for 2023 was $8.0 million and the weighted average interest rate on the bank credit facility was 8.4% in 2023.
Depletion, depreciation and amortization ("DD&A") was $358.4 million in 2024 compared to $350.2 million in 2023. The increase in 2024 when compared to 2023 is due to higher production volumes. Depletion expense, the largest component of DD&A, was $0.44 per mcfe in 2024 compared to $0.44 per mcfe in 2023. We have historically adjusted our depletion rates in the fourth quarter of each year based on our year-end reserve report and at other times during the year when circumstances indicate there has been a significant change in reserves or costs. The following table summarizes DD&A expenses per mcfe for the last two years:
| | | | | | | | | | | | | | | |
| Year Ended December 31, | |
| 2024 | | | 2023 | | | Change | | | % | |
DD&A | | | | | | | | | | | |
Depletion and amortization | $ | 0.44 | | | $ | 0.44 | | | $ | — | | | | — | % |
Depreciation | | — | | | | — | | | | — | | | | — | % |
Accretion and other | | 0.01 | | | | 0.01 | | | | — | | | | — | % |
Total DD&A expense | $ | 0.45 | | | $ | 0.45 | | | $ | — | | | | — | % |
Other Operating Expenses
Our total operating expenses also include other expenses that generally do not trend with production. These expenses include stock-based compensation (including the amortization of restricted stock and performance-based grants), brokered natural gas and marketing, exploration expense, abandonment and impairment of unproved properties, exit costs, deferred compensation plan and gain or loss on early extinguishment of debt. See Note 10 to our consolidated financial statements for more information on allocation of stock-based compensation to functional expense categories.
Brokered natural gas and marketing expense was $140.5 million in 2024 compared to $202.9 million in 2023. We enter into purchase transactions with third parties and separate sale transactions with third parties at different times to utilize available pipeline capacity and fulfill sales commitments in the event of operational upsets. The decrease in these costs reflects lower purchase prices and lower purchased volumes. The following table details our brokered natural gas and marketing net margin which includes the net effect of these third-party transactions for the last two years (in thousands):
| | | | | | | | | |
| | Year Ended
December 31, | | |
| | 2024 | | | 2023 | | |
Brokered natural gas and marketing | | | | | | | |
Brokered natural gas sales | | $ | 119,767 | | | $ | 195,656 | | |
Brokered NGLs sales | | | 5,370 | | | | 1,834 | | |
Other marketing revenue | | | 7,911 | | | | 9,062 | | |
Brokered natural gas purchases and transportation | | | (123,851 | ) | | | (191,659 | ) | |
Brokered NGLs purchases | | | (4,947 | ) | | | (1,632 | ) | |
Other marketing expense | | | (11,747 | ) | | | (9,593 | ) | |
Net brokered natural gas and marketing net margin | | $ | (7,497 | ) | | $ | 3,668 | | |
Exploration expense was $26.8 million in 2024 compared to $26.5 million in 2023. Exploration expense in 2024 was higher when compared to the prior year due to higher delay rentals partially offset by lower seismic costs. Stock-based compensation represents the amortization of equity stock grants as part of the compensation of our exploration staff. The following table details our exploration related expenses for the last two years (in thousands):
| | | | | | | | | | | | | | | |
| Year Ended December 31, | |
| 2024 | | | 2023 | | | Change | | | % | |
Exploration | | | | | | | | | | | |
Seismic | $ | 229 | | | $ | 1,687 | | | $ | (1,458 | ) | | | (86 | )% |
Delay rentals and other | | 19,256 | | | | 17,644 | | | | 1,612 | | | | 9 | % |
Personnel expense | | 6,004 | | | | 5,949 | | | | 55 | | | | — | % |
Stock-based compensation expense | | 1,354 | | | | 1,250 | | | | 104 | | | | 8 | % |
Total exploration expense | $ | 26,843 | | | $ | 26,530 | | | $ | 313 | | | | 1 | % |
Abandonment and impairment of unproved properties was $8.4 million in 2024 compared to $46.4 million in 2023. These costs decreased when compared to 2023 due to lower estimated lease expirations in Pennsylvania. Impairment of individually insignificant unproved properties is assessed and amortized on an aggregate basis based on our average holding period, expected forfeiture rate and anticipated drilling success. We assess individually significant unproved properties for impairment on a quarterly basis and recognize a loss where circumstances indicate impairment in value. In determining whether a significant unproved property is impaired we consider numerous factors including, but not limited to, current exploration plans, favorable or unfavorable activity on the property being evaluated and/or adjacent properties, our geologists’ evaluation of the property and the remaining months in the lease term for the property.
Exit costs were $37.2 million in 2024 compared to $99.9 million in 2023. In August 2020, we completed the sale of our North Louisiana operations in a transaction that included the retention of certain related gathering, transportation and processing obligations extending until 2030. The present value of these estimated future obligations totaled $479.8 million which was recorded in third quarter 2020. In the year ended December 31, 2024, we recorded $39.2 million of accretion expense related to these retained liabilities, and during 2024, we recorded an adjustment of $2.1 million to decrease this obligation mainly due to a decrease in forecasted electricity costs. In the year ended December 31, 2023, we recorded $41.9 million of accretion expense related to these retained liabilities, and we recorded adjustments of $57.7 million to increase this obligation for a change in forecasted drilling plans of the buyer and an increase in forecasted rates due to inflation. See Note 14 to our consolidated financial statements for further detail.
Deferred compensation plan expense was $9.6 million in 2024 compared to $26.6 million in 2023. Our stock price increased to $35.98 at December 31, 2024 from $30.44 at December 31, 2023. This non-cash item relates to the increase or decrease in value of the liability associated with our common stock that is vested and held in our deferred compensation plan. The deferred compensation liability is adjusted to fair value by a charge or a credit to deferred compensation plan expense. Although the stock price increased, the amount of vested shares decreased as we are no longer contributing annual employee stock awards into the deferred compensation plan. The deferred compensation plan held 724,000 vested shares at December 31, 2024 compared to 1.5 million shares at December 31, 2023. See Note 10 to our consolidated financial statements for further detail.
Gain (loss) on early extinguishment of debt was a gain of $257,000 in 2024 compared to a gain of $438,000 in 2023. During 2024, we purchased on the open market $79.7 million principal amount of 4.875% senior notes due 2025 at a discount and recorded a gain of $257,000, net of transaction costs and the expensing of deferred financing costs on the repurchased debt. During 2023, we purchased on the open market $61.6 million principal amount of 4.875% senior notes due in May of 2025. We recognized a gain on early extinguishment of debt of $438,000 net of transaction costs and the expensing of deferred financing costs on the repurchased debt.
Income tax benefit was $15.7 million in 2024 compared to an expense of $229.2 million in 2023. Income tax expense was lower than prior year due to lower operating income combined with the impact of changes in our valuation allowances and generation of tax credits in 2024. See Note 4 to our consolidated financial statements for further detail. The following is a summary of income tax expense (in thousands):
| | | | | | | |
| Year Ended December 31, | |
| 2024 | | | 2023 | |
Income tax (benefit) expense | | | | | |
Current tax expense | $ | 8,165 | | | $ | 1,547 | |
Deferred income tax (benefit) expense | | (23,900 | ) | | | 227,654 | |
Total income tax (benefit) expense | $ | (15,735 | ) | | $ | 229,201 | |
Combined federal and state effective income tax rate | | (6.3 | )% | | | 20.8 | % |
Management’s Discussion and Analysis of Financial Condition, Cash Flows, Capital Resources and Liquidity
Commodity prices are the most significant factor impacting our revenues, net income, operating cash flows, the amount of capital we invest in our business, payment of dividends and funding of share or debt repurchases. Commodity prices have been and are expected to remain volatile. Our top priorities for using cash provided by operations are to fund our capital budget program, repay debt and return capital to stockholders. We currently believe we have sufficient liquidity and capital resources to execute our business plan for the foreseeable future and across a wide range of commodity price environments.
Cash Flows
The following table presents sources and uses of cash and cash equivalents for the last two years (in thousands):
| | | | | | | |
| Year Ended
December 31, | |
| 2024 | | | 2023 | |
Sources of cash and cash equivalents | | | | | |
Operating activities | $ | 944,514 | | | $ | 977,892 | |
Disposal of assets | | 313 | | | | 872 | |
Borrowing on credit facility | | — | | | | 185,000 | |
Other | | 66,363 | | | | 124,722 | |
Total sources of cash and cash equivalents | $ | 1,011,190 | | | $ | 1,288,486 | |
| | | | | |
Uses of cash and cash equivalent | | | | | |
Additions to natural gas properties | $ | (570,426 | ) | | $ | (571,819 | ) |
Repayments on credit facility | | — | | | | (204,000 | ) |
Acreage purchases | | (56,085 | ) | | | (34,410 | ) |
Additions to field service assets | | (2,069 | ) | | | (701 | ) |
Repayment of senior notes | | (79,272 | ) | | | (60,934 | ) |
Treasury stock purchases | | (65,260 | ) | | | (19,042 | ) |
Dividends paid | | (77,463 | ) | | | (77,241 | ) |
Other | | (68,099 | ) | | | (108,572 | ) |
Total uses of cash and cash equivalents | $ | (918,674 | ) | | $ | (1,076,719 | ) |
Sources of Cash and Cash Equivalents
Cash flow from operating activities in 2024 was $944.5 million compared to $977.9 million in 2023. Cash provided from operating activities is largely dependent upon commodity prices and production volumes, net of the effects of settlement of our derivative contracts. The decrease in cash provided from operating activities in 2024 from 2023 reflects lower realized prices combined with higher working capital outflow (the timing of cash receipts and disbursements). Changes in working capital (as reflected in our consolidated statements of cash flows) for 2024 was an outflow of $135.3 million compared to an outflow of $121.1 million for 2023.
Uses of Cash and Cash Equivalents
Additions to natural gas and oil properties are our most significant use of cash and cash equivalents. These cash outlays are associated with our drilling and completion capital investment program. The following table shows capital investments and reconciles to additions to natural gas and oil properties as presented on our consolidated statements of cash flows for the last two years (in thousands):
| | | | | | | | |
| | 2024 | | | 2023 | |
Additions due to natural gas and oil properties | | $ | 593,998 | | | $ | 571,607 | |
Change in capital expenditure accrual for proved properties | | | (23,318 | ) | | | 1,204 | |
Change in other non-cash capital expenditures | | | (254 | ) | | | (992 | ) |
Additions to natural gas and oil properties | | $ | 570,426 | | | $ | 571,819 | |
Repayment of senior notes for 2024 includes the repurchase of $79.7 million principal of our 4.875% senior notes due 2025, at a discount.
Purchases of treasury stock for 2024 include the repurchase of 2.1 million shares of common stock for a total of $65.3 million as part of our previously announced stock repurchase program.
Liquidity and Capital Resources
Our main sources of liquidity are cash on hand, internally generated cash flow from operations, capital market transactions and our bank credit facility. At December 31, 2024, we had approximately $1.6 billion of liquidity consisting of cash on hand and availability under our bank credit facility.
Our liquidity requirements are supported by our cash on hand and our bank credit facility. We may draw on our bank credit facility to meet short-term cash requirements or issue debt or equity securities through the shelf registration discussed below as part of our longer-term liquidity and capital management. We believe our short-term and long-term liquidity is adequate to fund our current
operations and our near-term and long-term funding requirements including our capital spending programs, repayment of debt maturities and dividends. Although we expect cash flows to be sufficient to fund our expected 2025 capital program, we may elect to use the bank credit facility or raise funds through new debt or equity offerings or from other sources of financing.
Bank Credit Facility
Our bank credit facility is secured by substantially all of our assets. In April 2022, we entered into an amended bank credit facility with a maturity date of April 14, 2027. As of December 31, 2024, we had no outstanding borrowings under our bank credit facility, and we maintain a borrowing base of $3.0 billion and aggregate lender commitments of $1.5 billion. We also have undrawn letters of credit of $165.3 million as of December 31, 2024 which reduce the borrowing capacity under our bank credit facility.
The borrowing base is subject to regular, semi-annual re-determinations and is dependent on a number of factors but primarily the lenders' assessment of our future cash flows. The next scheduled borrowing base re-determination is during the spring of 2025. We currently must comply with certain financial and non-financial covenants, including limiting dividend payments, debt incurrence and requirements that we maintain certain financial ratios (as defined in our bank credit agreement). We were in compliance with all such covenants at December 31, 2024. See Note 6 to our consolidated financial statements for more information.
Capital Requirements
Our material cash requirements include the following contractual and other potential or expected obligations:
Capital Budget
Our approved capital budget for 2025 is $650 million to $690 million. The amount of our future capital investment will depend upon a number of factors including our cash flows from operations, investing and financing activities, infrastructure availability, supply and demand fundamentals and our ability to execute our development program. We periodically review our budget to assess changes in these and other factors.
Long-Term Debt
As of December 31, 2024, we had $1.7 billion of total debt outstanding. Our next significant long-term debt maturity is in the amount of $608.7 million due in May 2025, which is currently classified as a short term liability on the consolidated balance sheet. Anticipated cash annual interest payments related to our fixed-rate debt, based on the amount outstanding at December 31, 2024, is $23.8 million on our 4.75% senior notes and $49.5 million on our 8.25% senior notes, while anticipated cash annual interest for the our 4.875% senior notes is $12.4 million as these notes are due in May 2025.
Stock Repurchase Program
Our total remaining share repurchase authorization was approximately $1.0 billion at December 31, 2024.
Other Sources of Liquidity
We have a universal shelf registration statement filed with the SEC under which we, as a "well-known seasoned issuer" for purposes of SEC rules, have the ability to sell an indeterminate amount of various types of debt and equity securities.
Cash Contractual Obligations
Our contractual obligations include long-term debt, operating leases, derivative obligations, asset retirement obligations and transportation, gathering and processing commitments. As of December 31, 2024, we do not have any capital leases or any significant off-balance sheet debt or other such unrecorded obligations and we have not guaranteed any debt of any unrelated party. The table below provides estimates of the timing of future payments that we are obligated to make based on agreements in place at December 31, 2024. In addition to the contractual obligations listed in the table below, our consolidated balance sheet at December 31, 2024 reflects accrued interest payable associated with commitment fees on our bank debt of $1.3 million, which is payable in first quarter 2025.
The following summarizes our contractual financial obligations at December 31, 2024 and their future maturities. We expect to fund these contractual obligations with cash generated from operating activities, and, if necessary, borrowings under our bank credit facility or other sources (in thousands):
| | | | | | | | | | | | | | | | | | | | | | | |
| Payment due by period | |
| 2025 | | | 2026 | | | 2027 | | | 2028 and 2029 | | | Thereafter | | | Total | |
Debt: | | | | | | | | | | | | | | | | | |
Bank debt due 2027 (a) | $ | — | | | $ | — | | | $ | — | | | $ | — | | | $ | — | | | $ | — | |
4.875% senior notes due 2025 | | 608,702 | | | | — | | | | — | | | | — | | | | — | | | | 608,702 | |
8.25% senior notes due 2029 | | — | | | | — | | | | — | | | | 600,000 | | | | — | | | | 600,000 | |
4.75% senior notes due 2030 | | — | | | | — | | | | — | | | | — | | | | 500,000 | | | | 500,000 | |
Other obligations: | | | | | | | | | | | | | | | | | — | |
Operating leases, net (b) | | 91,422 | | | | 7,186 | | | | 5,816 | | | | 6,532 | | | | 25,121 | | | | 136,077 | |
Software licenses and other | | 2,596 | | | | 1,988 | | | | 37 | | | | — | | | | — | | | | 4,621 | |
Derivative obligations (c) | | 9,634 | | | | 8,433 | | | | (313 | ) | | | 2,368 | | | | — | | | | 20,122 | |
Transportation and gathering commitments (d) | | 835,018 | | | | 815,463 | | | | 794,968 | | | | 1,445,969 | | | | 2,691,096 | | | | 6,582,514 | |
Asset retirement obligation liability (e) | | 1,189 | | | | 535 | | | | — | | | | — | | | | 132,043 | | | | 133,767 | |
Total contractual obligations (f) | $ | 1,548,561 | | | $ | 833,605 | | | $ | 800,508 | | | $ | 2,054,869 | | | $ | 3,348,260 | | | $ | 8,585,803 | |
(a)We had no outstanding balance as of the end of the year.
(b)Includes amounts expected to be received as sublease income.
(c)Derivative obligations represent net liabilities determined in accordance with master netting arrangements for commodity derivatives that were valued as of December 31, 2024. Our derivatives are measured and recorded at fair value and are subject to market and credit risk. The ultimate liquidation value will be dependent upon actual future commodity prices which may differ materially from the inputs used to determine fair value as of December 31, 2024. See Note 8 to our consolidated financial statements. (d)The obligations above represent our minimum financial commitments pursuant to the terms of these contracts. Our actual expenditures may exceed these minimum commitments.
(e)The amount above represents the discounted values. There are inherent uncertainties surrounding the obligations and the actual amount and timing may differ from our estimates. See Note 7 to our consolidated financial statements. (f)This table excludes the liability for the deferred compensation plans since these obligations will be funded with existing plan assets and does not include obligations to taxing authorities.
Not included in the above table are agreements that are contingent on future construction. See Note 13 to our consolidated financial statements for more information regarding these contracts. Also not included in the table above is our estimate of accrued contractual obligations related to certain obligations retained by us after our divestiture of our North Louisiana assets. See additional information for these obligations in Note 14 to our consolidated financial statements.
Delivery Commitments
We have various volume delivery commitments that we expect to be able to fulfill from our own production; however, we may purchase third-party volumes to satisfy our commitments or pay demand fees for commitment shortfalls, should they occur. As of December 31, 2024, our delivery commitments through 2037 are included in Note 13 to our consolidated financial statements.
Income Taxes
We are subject to income and non-income-based taxes under federal, state and local jurisdictions in which we operate. Historically, we have generated and carried forward net operating losses ("NOL") in amounts sufficient to offset the majority of our taxable income at the federal level. To the extent we utilize all or substantially all of our federal NOL carryovers, we expect to make federal income tax payments. In addition, the Inflation Reduction Act of 2022 could trigger minimum income taxes if we become subject to the corporate alternative minimum tax where we may have to make estimated federal income tax payments. We currently pay federal income taxes and state income taxes in the Commonwealth of Pennsylvania. See Note 4 to our consolidated financial statements for more information.
Proved Reserves
To maintain and grow production and cash flow, we must continue to develop existing proved reserves and locate or acquire new natural gas, NGLs and oil reserves. The following is a discussion of proved reserves, reserve additions and revisions and future net cash flows from proved reserves.
| | | | | | | |
| Year End December 31, | |
| 2024 | | | 2023 | |
| (Mmcfe) | |
Proved Reserves: | | | | | |
Beginning of year | | 18,113,125 | | | | 18,077,656 | |
Reserve revisions | | 75,765 | | | | 608,784 | |
Reserve extensions, discoveries and additions | | 749,362 | | | | 207,260 | |
Sales | | (10,542 | ) | | | — | |
Production | | (796,235 | ) | | | (780,575 | ) |
End of year | | 18,131,475 | | | | 18,113,125 | |
Proved Developed Reserves: | | | | | |
Beginning of year | | 11,535,852 | | | | 10,933,180 | |
End of year | | 11,930,793 | | | | 11,535,852 | |
Reserve Revisions and Additions. See additional information and a summary of these revisions and additions in Note 16 to our consolidated financial statements.
Future Net Cash Flows. At December 31, 2024, the present value (discounted at 10%) of estimated future net cash flows from our proved reserves was $5.5 billion. The present value of our estimated future net cash flows at December 31, 2023 was $7.9 billion. This present value was calculated based on the unweighted average first-day-of-the-month oil and gas prices for the prior twelve months held flat for the life of the reserves, in accordance with SEC rules. At December 31, 2024, the after-tax present value of estimated future net cash flows from our proved reserves was $4.7 billion compared to $6.8 billion at December 31, 2023.
The present value of future net cash flows does not purport to be an estimate of the fair market value of our proved reserves. An estimate of fair value would also take into account, among other things, anticipated changes in future prices and costs, the expected recovery of reserves in excess of proved reserves and a discount factor more representative of the time value of money to the evaluating party and the perceived risks inherent in producing natural gas, NGLs and oil.
Other
We lease acreage that is generally subject to expiration if initial wells are not drilled within a specified period, generally between three and five years. We do not expect to lose significant lease acreage because of failure to drill due to inadequate capital, equipment or personnel. However, based on our evaluation of prospective economics, including the cost of infrastructure to connect production, we have allowed acreage to expire and will allow additional acreage to expire in the future. To date, our expenditures to comply with environmental or safety regulations have not been a significant component of our cost structure and are not expected to be significant in the future. However, new regulations, enforcement policies, claims for damages, or other events could result in significant future costs. We also regularly provide letters of credit in the normal course of business under certain contracts that may be drawn if we fail to perform under those contracts.
Off-Balance Sheet Arrangements
We do not currently utilize any off-balance sheet arrangements with unconsolidated entities to enhance our liquidity or capital resources position. However, as is customary in the natural gas and oil industry, we have various contractual work commitments which are described above under cash contractual obligations.
Management’s Discussion of Critical Accounting Estimates
Our discussion and analysis of our financial condition and results of operations are based upon our consolidated financial statements, which have been prepared in accordance with accounting principles generally accepted in the United States. The preparation of our financial statements requires us to make estimates and assumptions that affect the reported amounts of assets and liabilities, the disclosure of contingent assets and liabilities at year-end and the reported amounts of revenues and expenses during the year. Accounting estimates are considered to be critical if (1) the nature of the estimates and assumptions is material due to the levels of subjectivity and judgment necessary to account for highly uncertain matters or the susceptibility of such matters to changes; and (2) the impact of the estimates and assumptions on financial condition or operating performance is material. Actual results could differ from the estimates and assumptions used.
Estimated Quantities of Net Reserves
We use the successful efforts method of accounting for natural gas, NGLs and oil producing activities as opposed to the alternate acceptable full cost method. We believe that net assets and net income are more conservatively measured under the successful efforts method of accounting than under the full cost method, particularly during periods of active exploration. One difference between the successful efforts method of accounting and the full cost method is that under the successful efforts method, all exploratory dry holes and geological and geophysical costs are charged against earnings during the periods they occur; whereas, under the full cost method of accounting, such costs are capitalized as assets, pooled with the costs of successful wells and charged against earnings of future periods as a component of depletion expense. Under the successful efforts method of accounting, successful exploration drilling costs and all development costs are capitalized and these costs are systematically charged to expense using the units of production method based on proved developed natural gas and oil reserves as estimated by our engineers and audited by independent engineers. Costs incurred for exploratory wells that find reserves that cannot yet be classified as proved are capitalized on our balance sheet if (1) the well has found a sufficient quantity of reserves to justify its completion as a producing well and (2) we are making sufficient progress assessing the reserves and the economic and operating viability of the project. Proven property leasehold costs are amortized to expense using the units of production method based on total proved reserves. Properties are assessed for impairment as circumstances warrant (at least annually) and impairments to value are charged to expense. The successful efforts method inherently relies upon the estimation of proved reserves, which includes proved developed and proved undeveloped volumes.
Proved reserves are defined by the SEC as those volumes of natural gas, NGLs and oil that geological and engineering data demonstrate with reasonable certainty are recoverable in future years from known reservoirs under existing economic and operating conditions. Proved developed reserves are volumes expected to be recovered through existing wells with existing equipment and operating methods. Proved undeveloped reserves include reserves for which a development plan has been adopted indicating each location is scheduled to be drilled within five years from the date it was booked as proved reserves, unless specific circumstances justify a longer time. Although our engineers are knowledgeable of and follow the guidelines for reserves established by the SEC, the estimation of reserves requires engineers to make a significant number of assumptions based on professional judgment. Reserve estimates are updated at least annually and consider recent production levels and other technical information. Estimated reserves are often subject to future revisions, which could be substantial, based on the availability of additional information, including reservoir performance, new geological and geophysical data, additional drilling, technological advancements, price and cost changes and other economic factors. Changes in natural gas, NGLs and oil prices can lead to a decision to start up or shut in production, which can lead to revisions to reserve quantities. Reserve revisions in turn cause adjustments in our depletion rates. We cannot predict what reserve revisions may be required in future periods. Reserve estimates are reviewed and approved by our Senior Vice President of Reservoir Engineering and Economics, who reports directly to our President and Chief Executive Officer. To further ensure the reliability of our reserve estimates, we engage independent petroleum consultants to audit our estimates of proved reserves. Estimates prepared by third parties may be higher or lower than those included herein. Independent petroleum consultants audited approximately 96% of our reserves in both 2024 and 2023. Historical variances between our reserve estimates and the aggregate estimates of our consultants have been approximately 5%. The reserves included in this report are those reserves estimated by our petroleum engineering staff. For additional discussion, see Items 1 & 2. Business and Properties – Proved Reserves and Note 16 to our consolidated financial statements.
Reserves are based on the weighted average of commodity prices during the 12-month period, using the closing prices on the first day of each month, as defined by the SEC. When determining the December 31, 2024 proved reserves for each property, benchmark prices are adjusted using price differentials that account for property-specific quality and location differences. If prices in the future average below prices used to determine reserves at December 31, 2024, it could have an adverse effect on our estimates of proved reserves. It is difficult to estimate the magnitude of any potential price change and the effect on proved reserves due to numerous factors (including commodity prices and performance revisions).
Depletion rates are determined based on reserve quantity estimates and the capitalized costs of producing properties. As the estimated reserves are adjusted, the depletion expense for a property will change, assuming no change in production volumes or the capitalized costs. While total depletion expense for the life of a property is limited to the property’s total cost, proved reserve revisions result in a change in the timing of when depletion expense is recognized. Downward revisions of proved reserves may result in an acceleration of depletion expense, while upward revisions tend to lower the rate of depletion expense recognition. Based on proved reserves at December 31, 2024, we estimate that a 1% change in proved reserves would increase or decrease 2025 depletion expense by approximately $3.0 million (based on current production estimates). We currently expect our DD&A rate to be approximately $0.45 per mcfe in 2025. Estimated reserves are used as the basis for calculating the expected future cash flows from property asset groups, which are used to determine whether that property may be impaired. Reserves are also used to estimate the supplemental disclosure of the standardized measure of discounted future net cash flows relating to natural gas and oil producing activities and reserve quantities in Note 16 to our consolidated financial statements. Changes in the estimated reserves are considered a change in estimate for accounting purposes and are reflected on a prospective basis. It should not be assumed that the standardized measure is the current market value of our estimated proved reserves.
Accounting Standards Not Yet Adopted
Refer to Note 2 to our consolidated financial statements for a discussion of new accounting pronouncements that may affect us in the future.
ITEM 7A. QUANTITATIVE AND QUALITATIVE DISCLOSURES ABOUT MARKET RISK
The primary objective of the following information is to provide forward-looking quantitative and qualitative information about our potential exposure to market risks. The term "market risk" refers to the risk of loss arising from adverse changes in natural gas, NGLs and oil prices and interest rates. The disclosures are not meant to be precise indicators of expected future losses, but rather indicators of reasonably possible losses. This forward-looking information provides indicators of how we view and manage our ongoing market-risk exposure. All of our market-risk sensitive instruments were entered into for purposes other than trading. All accounts are U.S. dollar denominated. None of the risks discussed below changed materially from December 31, 2023 to December 31, 2024.
Commodity Price Risk
We are exposed to market risks related to the volatility of natural gas, NGLs and oil prices as the volatility of these prices continues to impact our industry. We expect commodity prices to remain volatile and unpredictable in the future. We employ various strategies, including diverse sales locations and the use of commodity derivative instruments, to manage the risks related to these price fluctuations. Realized prices are primarily driven by worldwide prices for oil and spot market prices for North American natural gas production. Natural gas prices affect us more than oil prices because approximately 64% of our December 31, 2024 proved reserves were natural gas compared to 1% of proved reserves were oil. In addition, a portion of our NGLs, which are 35% of our year-end proved reserves, are also impacted by changes in oil prices.
We believe NGLs prices are somewhat seasonal, particularly for propane. Therefore, the relationship of NGLs prices to NYMEX WTI (or West Texas Intermediate) will vary due to product components, seasonality and geographic supply and demand. We sell NGLs in several regional and international markets. If we are not able to sell or store NGLs, we may be required to curtail production or shift our drilling activities to dry gas areas.
The Appalachian region has finite local demand and infrastructure to accommodate ethane. We have agreements wherein we have contracted to either sell or transport ethane from our Marcellus Shale area. We cannot ensure that these facilities will remain available. If we are not able to sell ethane under at least one of our agreements, we may be required to curtail production or, as we have done in the past, purchase or divert natural gas to blend with our rich residue gas.
Derivative Instruments
We use commodity-based derivative contracts to manage exposures to commodity price fluctuations. We do not enter into these arrangements for speculative or trading purposes. These derivative instruments apply to a varying portion of our production and provide only partial price protection. While there is risk that the financial benefit of rising natural gas, NGLs and oil prices may not be captured, we believe the benefits of more predictable cash flow are important in the event of price declines. Among these benefits are more consistent returns on invested capital, better access to bank and other capital markets, more efficient utilization of existing personnel, the flexibility to enter into long-term projects requiring substantial committed capital, smoother and more efficient execution of our ongoing development drilling and production enhancement programs. If our counterparties defaulted, this protection might be limited as we might not receive the benefits of the derivatives. We are at risk for changes in the fair value of all of our derivative instruments; however, such risk should be mitigated by price changes related to the underlying commodity transaction. While the use of derivative instruments could materially affect our results of operations in a particular quarter or annual period, we believe that the use of these instruments will not have a material adverse effect on our financial position or liquidity.
All derivative instruments, other than those that meet the normal purchase and normal sale scope exception or other derivative scope exceptions, are recorded at fair market value in accordance with GAAP and are included in our consolidated balance sheets as assets or liabilities. At December 31, 2024, our derivatives program includes swaps, collars, three-way-collars and swaptions. These contracts expire monthly through December 2027. Their fair value, represented by the estimated amount that would be realized upon immediate liquidation as of December 31, 2024, approximated a net derivative asset of $96.1 million compared to a net derivative asset of $424.4 million at December 31, 2023. As of December 31, 2024 we have hedged over 30% of our projected total production for 2025 with more than 35% of our projected natural gas production hedged. For additional discussion and information over our derivative contracts, see Note 8 to our consolidated financial statements.
Other Commodity Risk
We are impacted by basis risk as natural gas transaction prices are frequently based on industry reference prices that may vary from prices experienced in local markets. If commodity price changes in one region are not reflected in other regions, derivative commodity instruments may no longer provide the expected hedge, resulting in increased basis risk. In addition to the derivative
contracts above, we have entered into natural gas basis swap agreements. The price we receive for our natural gas production can be more or less than the NYMEX price because of adjustments for delivery location ("basis"), relative quality and other factors; therefore, we have entered into basis swap agreements that effectively lock in the basis adjustments. The fair value of the natural gas basis swaps, which expire monthly through December 2028, was a net derivative liability of $29.2 million at December 31, 2024 and the volumes are for 266,640,000 Mmbtu.
Commodity Sensitivity Analysis
The following table shows the fair value of our derivative contracts and the hypothetical change in fair value that would result from a 10% and a 25% change in commodity prices at December 31, 2024. We remain at risk for possible changes in the market value of commodity derivative instruments; however, such risks should be mitigated by price changes in the underlying physical commodity (in thousands):
| | | | | | | | | | | | | | | | | | | |
| | | | Hypothetical Change in Fair Value | |
| | | | Increase in Commodity
Price of | | | Decrease in Commodity
Price of | |
| Fair Value | | | 10% | | | 25% | | | 10% | | | 25% | |
Swaps | $ | 97,474 | | | $ | (80,658 | ) | | $ | (201,645 | ) | | $ | 80,658 | | | $ | 201,645 | |
Three-way collars | | 11,894 | | | | (9,333 | ) | | | (22,883 | ) | | | 9,216 | | | | 20,985 | |
Basis swaps | | (29,152 | ) | | | 15,972 | | | | 39,929 | | | | (15,971 | ) | | | (39,929 | ) |
Swaptions | | (13,240 | ) | | | (12,238 | ) | | | (37,407 | ) | | | 7,726 | | | | 12,398 | |
Counterparty Risk
Our commodity-based contracts expose us to the credit risk of non-performance by the counterparty to the contracts. Our exposure is diversified among major investment grade financial institutions and commodity traders, and we have master netting agreements with the majority of our counterparties that provide for offsetting payables against receivables from separate derivative contracts. Our derivative contracts are with multiple counterparties to minimize our exposure to any individual counterparty. At December 31, 2024, our derivative counterparties include fifteen financial institutions, of which all but five are secured lenders in our bank credit facility. Counterparty credit risk is considered when determining the fair value of our derivative contracts. While counterparties are major investment grade financial institutions and large commodity traders, the fair value of our derivative contracts have been adjusted to account for the risk of non-performance by certain of our counterparties, which was immaterial.
Interest Rate Risk
At times, we are also exposed to market risks related to changes in interest rates. At December 31, 2024, we had total debt of $1.7 billion. All of our outstanding debt is based on fixed interest rates and, as a result, we do not have significant exposure to movements in market interest rates at this time. Our credit facility provides for variable interest rate borrowings; however, we did not have any borrowings outstanding as of December 31, 2024. See Note 6 to our consolidated financial statements for more information about our senior notes.
Item 8. financial statements and supplementary data
RANGE RESOURCES CORPORATION
INDEX TO CONSOLIDATED FINANCIAL STATEMENTS
Management’s Report on Internal Control over Financial Reporting
To the Stockholders of Range Resources Corporation
Management is responsible for establishing and maintaining an adequate system of internal control over financial reporting (as defined in Rule 13(a)-15(f) under the Securities Exchange Act of 1934, as amended). Our internal control over financial reporting is designed to provide reasonable assurance regarding the reliability of financial reporting and presentation of consolidated financial statements.
Because of its inherent limitations, internal control over financial reporting may not prevent or detect misstatements and even when determined to be effective, can only provide reasonable assurance with respect to financial statement preparation and presentation. Also, projections of any evaluation of effectiveness to future periods are subject to the risk that the internal controls may become inadequate because of changes in conditions or because the degree of compliance with the policies or procedures may deteriorate.
Management assessed the effectiveness of our internal control over financial reporting as of December 31, 2024. In making this assessment, which was conducted under the supervision and with the participation of management, including our Chief Executive Officer and Chief Financial Officer, management used the criteria set forth by the Committee of Sponsoring Organizations of the Treadway Commission (COSO) in Internal Control – Integrated Framework (2013). Based on our assessment, we believe that, as of December 31, 2024, our internal control over financial reporting was effective based on those criteria.
Ernst and Young LLP, our independent registered public accounting firm, audited our financial statements included in this annual report and has issued an attestation report on our internal control over financial reporting as of December 31, 2024. Their report appears on the following page.
| | | | | | |
By: |
| /s/ DENNIS L. DEGNER | | By: | | /s/ Mark S. scucchi |
|
| Dennis L. Degner |
|
|
| Mark S. Scucchi |
|
| Chief Executive Officer and President |
|
|
| Executive Vice President and Chief Financial Officer |
Fort Worth, Texas
February 25, 2025
Report of Independent Registered Public Accounting Firm
To the Stockholders and the Board of Directors of Range Resources Corporation
Opinion on Internal Control Over Financial Reporting
We have audited Range Resources Corporation’s internal control over financial reporting as of December 31, 2024, based on criteria established in Internal Control—Integrated Framework issued by the Committee of Sponsoring Organizations of the Treadway Commission (2013 framework) (the COSO criteria). In our opinion, Range Resources Corporation (the Company) maintained, in all material respects, effective internal control over financial reporting as of December 31, 2024, based on the COSO criteria.
We also have audited, in accordance with the standards of the Public Company Accounting Oversight Board (United States) (PCAOB), the consolidated balance sheets of the Company as of December 31, 2024 and 2023, and the related consolidated statements of income, comprehensive income, stockholders' equity and cash flows for each of the three years in the period ended December 31, 2024, and the related notes and our report dated February 25, 2025 expressed an unqualified opinion thereon.
Basis for Opinion
The Company’s management is responsible for maintaining effective internal control over financial reporting and for its assessment of the effectiveness of internal control over financial reporting included in the accompanying Management’s Report on Internal Control over Financial Reporting. Our responsibility is to express an opinion on the Company’s internal control over financial reporting based on our audit. We are a public accounting firm registered with the PCAOB and are required to be independent with respect to the Company in accordance with the U.S. federal securities laws and the applicable rules and regulations of the Securities and Exchange Commission and the PCAOB.
We conducted our audit in accordance with the standards of the PCAOB. Those standards require that we plan and perform the audit to obtain reasonable assurance about whether effective internal control over financial reporting was maintained in all material respects.
Our audit included obtaining an understanding of internal control over financial reporting, assessing the risk that a material weakness exists, testing and evaluating the design and operating effectiveness of internal control based on the assessed risk, and performing such other procedures as we considered necessary in the circumstances. We believe that our audit provides a reasonable basis for our opinion.
Definition and Limitations of Internal Control Over Financial Reporting
A company’s internal control over financial reporting is a process designed to provide reasonable assurance regarding the reliability of financial reporting and the preparation of financial statements for external purposes in accordance with generally accepted accounting principles. A company’s internal control over financial reporting includes those policies and procedures that (1) pertain to the maintenance of records that, in reasonable detail, accurately and fairly reflect the transactions and dispositions of the assets of the company; (2) provide reasonable assurance that transactions are recorded as necessary to permit preparation of financial statements in accordance with generally accepted accounting principles, and that receipts and expenditures of the company are being made only in accordance with authorizations of management and directors of the company; and (3) provide reasonable assurance regarding prevention or timely detection of unauthorized acquisition, use, or disposition of the company’s assets that could have a material effect on the financial statements.
Because of its inherent limitations, internal control over financial reporting may not prevent or detect misstatements. Also, projections of any evaluation of effectiveness to future periods are subject to the risk that controls may become inadequate because of changes in conditions, or that the degree of compliance with the policies or procedures may deteriorate.
/s/ Ernst & Young LLP
Fort Worth, Texas
February 25, 2025
Report of Independent Registered Public Accounting Firm
To the Stockholders and the Board of Directors of Range Resources Corporation
Opinion on the Financial Statements
We have audited the accompanying consolidated balance sheets of Range Resources Corporation (the Company) as of December 31, 2024 and 2023, the related consolidated statements of income, comprehensive income, stockholders' equity and cash flows for each of the three years in the period ended December 31, 2024, and the related notes (collectively referred to as the “consolidated financial statements”). In our opinion, the consolidated financial statements present fairly, in all material respects, the financial position of the Company at December 31, 2024 and 2023, and the results of its operations and its cash flows for each of the three years in the period ended December 31, 2024, in conformity with U.S. generally accepted accounting principles.
We also have audited, in accordance with the standards of the Public Company Accounting Oversight Board (United States) (PCAOB), the Company's internal control over financial reporting as of December 31, 2024, based on criteria established in Internal Control—Integrated Framework issued by the Committee of Sponsoring Organizations of the Treadway Commission (2013 framework), and our report dated February 25, 2025 expressed an unqualified opinion thereon.
Basis for Opinion
These financial statements are the responsibility of the Company's management. Our responsibility is to express an opinion on the Company’s financial statements based on our audits. We are a public accounting firm registered with the PCAOB and are required to be independent with respect to the Company in accordance with the U.S. federal securities laws and the applicable rules and regulations of the Securities and Exchange Commission and the PCAOB.
We conducted our audits in accordance with the standards of the PCAOB. Those standards require that we plan and perform the audit to obtain reasonable assurance about whether the financial statements are free of material misstatement, whether due to error or fraud. Our audits included performing procedures to assess the risks of material misstatement of the financial statements, whether due to error or fraud, and performing procedures that respond to those risks. Such procedures included examining, on a test basis, evidence regarding the amounts and disclosures in the financial statements. Our audits also included evaluating the accounting principles used and significant estimates made by management, as well as evaluating the overall presentation of the financial statements. We believe that our audits provide a reasonable basis for our opinion.
Critical Audit Matter
The critical audit matter communicated below is a matter arising from the current period audit of the financial statements that was communicated or required to be communicated to the audit committee and that: (1) relates to accounts or disclosures that are material to the financial statements and (2) involved our especially challenging, subjective or complex judgments. The communication of the critical audit matter does not alter in any way our opinion on the consolidated financial statements, taken as a whole, and we are not, by communicating the critical audit matter below, providing a separate opinion on the critical audit matter or on the accounts or disclosures to which it relates.
| |
Description of the Matter | Depletion, depreciation, and amortization of proved natural gas and oil properties At December 31, 2024, the net book value of the Company’s proved natural gas and oil properties totaled $5.6 billion and depletion, depreciation and amortization expense (“DD&A”) was $358.4 million for the year then ended. As described in Note 2 to the consolidated financial statements, the Company follows the successful efforts method of accounting for its natural gas and oil producing activities. Under this method, DD&A for proved properties, including other property and equipment such as gathering lines related to natural gas and oil producing activities, is provided using the units of production method based on proved natural gas and oil reserves, as estimated by the Company’s petroleum engineering staff. Proved oil and gas reserves are prepared using standard geological and engineering methods generally recognized in the petroleum industry based on evaluations of estimated in-place hydrocarbon volumes using financial and non-financial inputs. Judgment is required by the Company’s petroleum engineering staff in interpreting the data used to estimate reserves. Estimating proved natural gas and oil reserves requires the selection and evaluation of inputs, including historical production, natural gas and oil price assumptions, and future operating and capital cost assumptions, among others. Because of the complexity involved in estimating natural gas and oil reserves, management used independent petroleum consultants to audit the proved reserve estimates prepared by the Company’s petroleum engineering staff as of December 31, 2024. |
| |
How We Addressed the Matter in Our Audit | Auditing the Company’s DD&A calculation is especially complex because of the use of the work of the Company’s petroleum engineering staff and the independent petroleum consultants and the evaluation of management’s determination of the inputs described above used by these engineers in estimating proved natural gas and oil reserves. We obtained an understanding, evaluated the design and tested the operating effectiveness of internal controls that address the risks of material misstatement relating to the DD&A calculation, including controls over the completeness and accuracy of the financial and historical production data used in estimating proved natural gas and oil reserves. Our testing of the Company’s DD&A calculation included, among other procedures, evaluating the professional qualifications and objectivity of both the individual primarily responsible for overseeing the preparation of the reserve estimates by the petroleum engineering staff and the independent petroleum consultants used to audit the estimates. In assessing whether we can use the work of the Company’s petroleum engineering staff, we evaluated the completeness and accuracy of the financial data, historical production and inputs described above used by the Company’s petroleum engineering staff in estimating proved oil and gas reserves by agreeing them to source documentation. In addition, we assessed the inputs for reasonableness based on our review of corroborative evidence and consideration of any contrary evidence. Finally, we tested that the DD&A calculation is based on the appropriate proved natural gas and oil reserve amounts from the Company’s reserve report. |
/s/ Ernst & Young LLP
We have served as the Company’s auditor since 2003.
Fort Worth, Texas
February 25, 2025
RANGE RESOURCES CORPORATION
CONSOLIDATED BALANCE SHEETS
(In thousands, except share data)
| | | | | | | |
| December 31, | | | December 31, | |
| 2024 | | | 2023 | |
Assets | | | | | |
Current assets: | | | | | |
Cash and cash equivalents | $ | 304,490 | | | $ | 211,974 | |
Accounts receivable, less allowance for doubtful accounts of $255 and $308 | | 302,212 | | | | 274,669 | |
Contingent consideration receivable | | — | | | | 8,000 | |
Derivative assets | | 84,479 | | | | 341,330 | |
Prepaid assets | | 12,722 | | | | 18,159 | |
Other current assets | | 17,558 | | | | 15,992 | |
Total current assets | | 721,461 | | | | 870,124 | |
Derivative assets | | 2,619 | | | | 101,641 | |
Natural gas and oil properties, successful efforts method | | 11,878,427 | | | | 11,225,482 | |
Accumulated depletion and depreciation | | (5,456,727 | ) | | | (5,107,801 | ) |
| | 6,421,700 | | | | 6,117,681 | |
Other property and equipment | | 72,771 | | | | 72,639 | |
Accumulated depreciation and amortization | | (70,306 | ) | | | (70,943 | ) |
| | 2,465 | | | | 1,696 | |
Operating lease right-of-use assets | | 119,838 | | | | 23,821 | |
Other assets | | 79,592 | | | | 88,922 | |
Total assets | $ | 7,347,675 | | | $ | 7,203,885 | |
| | | | | |
Liabilities | | | | | |
Current liabilities: | | | | | |
Accounts payable | $ | 133,132 | | | $ | 110,134 | |
Asset retirement obligations | | 1,189 | | | | 2,395 | |
Accrued liabilities | | 289,148 | | | | 290,579 | |
Deferred compensation liabilities | | 21,649 | | | | 44,149 | |
Accrued interest | | 36,920 | | | | 37,261 | |
Derivative liabilities | | 9,634 | | | | 222 | |
Operating lease liabilities | | 87,138 | | | | 11,584 | |
Divestiture contract obligation | | 86,991 | | | | 86,762 | |
Current maturities of long-term debt | | 608,269 | | | | — | |
Total current liabilities | | 1,274,070 | | | | 583,086 | |
Senior notes | | 1,089,614 | | | | 1,774,229 | |
Deferred tax liabilities | | 541,378 | | | | 561,288 | |
Derivative liabilities | | 10,488 | | | | 107 | |
Deferred compensation liabilities | | 65,233 | | | | 72,976 | |
Operating lease liabilities | | 35,737 | | | | 16,064 | |
Asset retirement obligations and other liabilities | | 137,181 | | | | 119,896 | |
Divestiture contract obligation | | 257,317 | | | | 310,688 | |
Total liabilities | | 3,411,018 | | | | 3,438,334 | |
Commitments and contingencies | | | | | |
| | | | | |
Stockholders’ Equity | | | | | |
Preferred stock, $1 par, 10,000,000 shares authorized, none issued and outstanding | | — | | | | — | |
Common stock, $0.01 par, 475,000,000 shares authorized, 267,435,419 issued at
December 31, 2024 and 265,756,369 shares at December 31, 2023 | | 2,674 | | | | 2,658 | |
Common stock held in treasury, at cost, 26,766,065 shares at December 31, 2024 and
24,716,065 shares at December 31, 2023 | | (513,941 | ) | | | (448,681 | ) |
Additional paid-in capital | | 5,927,893 | | | | 5,879,705 | |
Accumulated other comprehensive income | | 611 | | | | 647 | |
Retained deficit | | (1,480,580 | ) | | | (1,668,778 | ) |
Total stockholders' equity | | 3,936,657 | | | | 3,765,551 | |
Total liabilities and stockholders’ equity | $ | 7,347,675 | | | $ | 7,203,885 | |
The accompanying notes are an integral part of these consolidated financial statements.
RANGE RESOURCES CORPORATION
CONSOLIDATED STATEMENTS OF income
(In thousands, except per share data)
| | | | | | | | | | | |
| For the Year Ended December 31, | |
| 2024 | | | 2023 | | | 2022 | |
| | | | | | | | |
Revenues and other income: | | | | | | | | |
Natural gas, NGLs and oil sales | $ | 2,213,850 | | | $ | 2,334,661 | | | $ | 4,911,092 | |
Derivative fair value income (loss) | | 56,726 | | | | 821,154 | | | | (1,188,506 | ) |
Brokered natural gas and marketing | | 133,048 | | | | 206,552 | | | | 419,776 | |
Other income | | 13,460 | | | | 12,505 | | | | 4,850 | |
Total revenues and other income | | 2,417,084 | | | | 3,374,872 | | | | 4,147,212 | |
Costs and expenses: | | | | | | | | |
Direct operating | | 95,321 | | | | 96,085 | | | | 84,286 | |
Transportation, gathering, processing and compression | | 1,177,925 | | | | 1,113,941 | | | | 1,242,941 | |
Taxes other than income | | 21,625 | | | | 23,726 | | | | 35,367 | |
Brokered natural gas and marketing | | 140,545 | | | | 202,884 | | | | 427,048 | |
Exploration | | 26,843 | | | | 26,530 | | | | 26,772 | |
Abandonment and impairment of unproved properties | | 8,417 | | | | 46,359 | | | | 28,608 | |
General and administrative | | 172,139 | | | | 164,740 | | | | 168,085 | |
Exit costs | | 37,214 | | | | 99,940 | | | | 70,337 | |
Deferred compensation plan | | 9,593 | | | | 26,593 | | | | 61,880 | |
Interest | | 118,758 | | | | 124,004 | | | | 165,145 | |
(Gain) loss on early extinguishment of debt | | (257 | ) | | | (438 | ) | | | 69,493 | |
Depletion, depreciation and amortization | | 358,356 | | | | 350,165 | | | | 353,420 | |
Total costs and expenses | | 2,166,479 | | | | 2,274,529 | | | | 2,733,382 | |
| | | | | | | | |
Income before income taxes | | 250,605 | | | | 1,100,343 | | | | 1,413,830 | |
Income tax (benefit) expense: | | | | | | | | |
Current | | 8,165 | | | | 1,547 | | | | 14,688 | |
Deferred | | (23,900 | ) | | | 227,654 | | | | 215,772 | |
| | (15,735 | ) | | | 229,201 | | | | 230,460 | |
Net income | $ | 266,340 | | | $ | 871,142 | | | $ | 1,183,370 | |
| | | | | | | | |
Net income per common share: | | | | | | | | |
Basic | $ | 1.10 | | | $ | 3.61 | | | $ | 4.79 | |
Diluted | $ | 1.09 | | | $ | 3.57 | | | $ | 4.69 | |
| | | | | | | | |
Weighted average common shares outstanding: | | | | | | | | |
Basic | | 240,689 | | | | 236,986 | | | | 240,858 | |
Diluted | | 242,745 | | | | 239,837 | | | | 246,379 | |
The accompanying notes are an integral part of these consolidated financial statements.
RANGE RESOURCES CORPORATION
CONSOLIDATED STATEMENTS OF COMPREHENSIVE income
(In thousands)
| | | | | | | | | | | |
| Year Ended December 31, | |
| 2024 | | | 2023 | | | 2022 | |
| | | | | | | | |
Net income | $ | 266,340 | | | $ | 871,142 | | | $ | 1,183,370 | |
Other comprehensive income: | | | | | | | | |
Postretirement benefits: | | | | | | | | |
Actuarial gain (loss) | | 28 | | | | (12 | ) | | | 482 | |
Prior service costs | | — | | | | 296 | | | | — | |
Amortization of prior service costs/actuarial gain | | (74 | ) | | | (41 | ) | | | 292 | |
Income tax expense (benefit) | | 10 | | | | (63 | ) | | | (157 | ) |
Total comprehensive income | $ | 266,304 | | | $ | 871,322 | | | $ | 1,183,987 | |
The accompanying notes are an integral part of these consolidated financial statements.
RANGE RESOURCES CORPORATION
CONSOLIDATED STATEMENTS OF CASH FLOWS
(In thousands)
| | | | | | | | | | | |
| Year Ended December 31, | |
| 2024 | | | 2023 | | | 2022 | |
| | | | | | | | |
Operating activities: | | | | | | | | |
Net income | $ | 266,340 | | | $ | 871,142 | | | $ | 1,183,370 | |
Adjustments to reconcile net income to net cash provided from
operating activities: | | | | | | | | |
Deferred income tax (benefit) expense | | (23,900 | ) | | | 227,654 | | | | 215,772 | |
Depletion, depreciation and amortization | | 358,356 | | | | 350,165 | | | | 353,420 | |
Abandonment and impairment of unproved properties | | 8,417 | | | | 46,359 | | | | 28,608 | |
Derivative fair value (income) loss | | (56,726 | ) | | | (821,154 | ) | | | 1,188,506 | |
Cash settlements on derivative financial instruments | | 432,392 | | | | 253,514 | | | | (1,190,154 | ) |
Divestiture contract obligation, including accretion | | 37,088 | | | | 99,595 | | | | 69,766 | |
Allowance for bad debt | | 50 | | | | — | | | | (250 | ) |
Amortization of deferred financing costs and other | | 4,526 | | | | 4,735 | | | | 7,959 | |
Deferred and stock-based compensation | | 53,864 | | | | 67,849 | | | | 107,959 | |
Gain on the sale of assets | | (311 | ) | | | (454 | ) | | | (409 | ) |
(Gain) loss on early extinguishment of debt | | (257 | ) | | | (438 | ) | | | 69,493 | |
Changes in working capital: | | | | | | | | |
Accounts receivable | | (19,586 | ) | | | 223,081 | | | | (3,286 | ) |
Other current assets | | 3,676 | | | | (1,285 | ) | | | (18,438 | ) |
Accounts payable | | (443 | ) | | | (77,057 | ) | | | 17,077 | |
Accrued liabilities and other | | (118,972 | ) | | | (265,814 | ) | | | (164,649 | ) |
Net cash provided from operating activities | | 944,514 | | | | 977,892 | | | | 1,864,744 | |
Investing activities: | | | | | | | | |
Additions to natural gas properties | | (570,426 | ) | | | (571,819 | ) | | | (456,505 | ) |
Additions to field service assets | | (2,069 | ) | | | (701 | ) | | | (682 | ) |
Acreage purchases | | (56,085 | ) | | | (34,410 | ) | | | (30,885 | ) |
Proceeds from disposal of assets | | 313 | | | | 872 | | | | 518 | |
Purchases of marketable securities held by the deferred compensation plan | | (41,798 | ) | | | (45,168 | ) | | | (43,691 | ) |
Proceeds from the sales of marketable securities held by the deferred
compensation plan | | 46,232 | | | | 49,521 | | | | 41,413 | |
Net cash used in investing activities | | (623,833 | ) | | | (601,705 | ) | | | (489,832 | ) |
Financing activities: | | | | | | | | |
Borrowings on credit facility | | — | | | | 185,000 | | | | 972,000 | |
Repayments on credit facility | | — | | | | (204,000 | ) | | | (953,000 | ) |
Issuance of senior notes | | — | | | | — | | | | 500,000 | |
Repayment of senior notes | | (79,272 | ) | | | (60,934 | ) | | | (1,659,422 | ) |
Dividends paid | | (77,463 | ) | | | (77,241 | ) | | | (38,638 | ) |
Treasury stock purchases | | (65,260 | ) | | | (19,042 | ) | | | (399,699 | ) |
Debt issuance costs | | — | | | | — | | | | (16,176 | ) |
Taxes paid for shares withheld | | (25,217 | ) | | | (39,481 | ) | | | (25,492 | ) |
Change in cash overdrafts | | (1,084 | ) | | | (23,923 | ) | | | 9,071 | |
Proceeds from the sales of common stock held by the deferred
compensation plan | | 20,131 | | | | 75,201 | | | | 22,229 | |
Net cash used in financing activities | | (228,165 | ) | | | (164,420 | ) | | | (1,589,127 | ) |
Increase (decrease) in cash and cash equivalents | | 92,516 | | | | 211,767 | | | | (214,215 | ) |
Cash and cash equivalents at beginning of period | | 211,974 | | | | 207 | | | | 214,422 | |
Cash and cash equivalents at end of period | $ | 304,490 | | | $ | 211,974 | | | $ | 207 | |
The accompanying notes are an integral part of these consolidated financial statements.
RANGE RESOURCES CORPORATION
CONSOLIDATED STATEMENTS OF STOCKHOLDERS’ EQUITY
(In thousands, except per share data)
| | | | | | | | | | | | | | | | | | | | | | | | | | | | | | | |
| | | | | | | | | | Common | | | | | | Accumulated | | | | | | | |
| | | | | | | | | | stock | | | Additional | | | other | | | | | | | |
| Common stock | | | Treasury | | | held in | | | paid-in | | | comprehensive | | | Retained | | | | |
| Shares | | | Par value | | | shares | | | treasury | | | capital | | | (loss) income | | | deficit | | | Total | |
Balance as of December 31, 2021 | | 259,796 | | | $ | 2,598 | | | | 10,003 | |
| $ | (30,007 | ) | | $ | 5,720,277 | | | $ | (150 | ) | | $ | (3,607,055 | ) | | $ | 2,085,663 | |
Issuance of common stock | | 3,089 | | | | 31 | | | | — | | | | — | | | | 13,529 | | | | — | | | | — | | | | 13,560 | |
Issuance of common stock upon
vesting of PSUs | | 2 | | | | — | | | | — | | | | — | | | | 78 | | | | — | | | | (78 | ) | | | — | |
Stock-based compensation expense | | — | | | | — | | | | — | | | | — | | | | 31,133 | | | | — | | | | — | | | | 31,133 | |
Dividends ($0.16 per share) | | — | | | | — | | | | — | | | | — | | | | — | | | | — | | | | (38,638 | ) | | | (38,638 | ) |
Treasury stock issuance | | — | | | | — | | | | (1 | ) | | | 47 | | | | (47 | ) | | | — | | | | — | | | | — | |
Treasury stock repurchased | | — | | | | — | | | | 14,000 | | | | (399,699 | ) | | | — | | | | — | | | | — | | | | (399,699 | ) |
Other comprehensive income | | — | | | | — | | | | — | | | | — | | | | — | | | | 617 | | | | — | | | | 617 | |
Net income | | — | |
| | — | | | | — | |
| | — | | | | — | | | | — | | | | 1,183,370 | | | | 1,183,370 | |
Balance as of December 31, 2022 | | 262,887 | | | | 2,629 | | | | 24,002 | |
| | (429,659 | ) | | | 5,764,970 | | | | 467 | | | $ | (2,462,401 | ) | | $ | 2,876,006 | |
Issuance of common stock | | 2,863 | | | | 29 | | | | — | | | | — | | | | 78,050 | | | | — | | | | — | | | | 78,079 | |
Issuance of common stock upon
vesting of PSUs | | 6 | | | | — | | | | — | | | | — | | | | 278 | | | | — | | | | (278 | ) | | | — | |
Stock-based compensation expense | | — | | | | — | | | | — | | | | — | | | | 36,427 | | | | — | | | | — | | | | 36,427 | |
Dividends ($0.32 per share) | | — | | | | — | | | | — | | | | — | | | | — | | | | — | | | | (77,241 | ) | | | (77,241 | ) |
Treasury stock issuance | | — | | | | — | | | | (1 | ) | | | 20 | | | | (20 | ) | | | — | | | | | | | — | |
Treasury stock repurchased | | — | | | | — | | | | 715 | | | | (19,042 | ) | | | — | | | | — | | | | — | | | | (19,042 | ) |
Other comprehensive income | | — | | | | — | | | | — | | | | — | | | | — | | | | 180 | | | | — | | | | 180 | |
Net income | | — | |
| | — | | | | — | |
| | — | | | | — | | | | — | | | | 871,142 | | | | 871,142 | |
Balance as of December 31, 2023 | | 265,756 | | | | 2,658 | | | | 24,716 | |
| | (448,681 | ) | | | 5,879,705 | | | | 647 | | | $ | (1,668,778 | ) | | $ | 3,765,551 | |
Issuance of common stock | | 1,672 | | | | 16 | | | | — | | | | — | | | | 5,755 | | | | — | | | | — | | | | 5,771 | |
Issuance of common stock upon
vesting of PSUs | | 7 | | | | — | | | | — | | | | — | | | | 361 | | | | — | | | | (361 | ) | | | — | |
Stock-based compensation expense | | — | | | | — | | | | — | | | | — | | | | 42,072 | | | | — | | | | — | | | | 42,072 | |
Dividends ($0.32 per share) | | — | | | | — | | | | — | | | | — | | | | — | | | | — | | | | (77,781 | ) | | | (77,781 | ) |
Treasury stock repurchased | | — | | | | — | | | | 2,050 | | | | (65,260 | ) | | | — | | | | — | | | | — | | | | (65,260 | ) |
Other comprehensive loss | | — | | | | — | | | | — | | | | — | | | | — | | | | (36 | ) | | | — | | | | (36 | ) |
Net income | | — | |
| | — | | | | — | |
| | — | | | | — | | | | — | | | | 266,340 | | | | 266,340 | |
Balance as of December 31, 2024 | | 267,435 | | | $ | 2,674 | | | | 26,766 | |
| $ | (513,941 | ) | | $ | 5,927,893 | | | $ | 611 | | | $ | (1,480,580 | ) | | $ | 3,936,657 | |
The accompanying notes are an integral part of these consolidated financial statements.
RANGE RESOURCES CORPORATION
NOTES TO CONSOLIDATED FINANCIAL STATEMENTS
(1)Summary of Organization and Nature of Business
Range Resources Corporation ("Range," "we," "us," or "our") is a Fort Worth, Texas-based independent natural gas, natural gas liquids ("NGLs") and oil company engaged in the exploration, development and acquisition of natural gas and oil properties in the Appalachian region of the United States. Our objective is to build stockholder value through returns-focused development of natural gas properties. Range is a Delaware corporation with our common stock listed and traded on the New York Stock Exchange under the symbol "RRC".
(2)Summary of Significant Accounting Policies
Basis of Presentation and Principles of Consolidation
The accompanying consolidated financial statements, including the notes, have been prepared in accordance with generally accepted accounting principles ("U.S. GAAP") and include the accounts of all of our subsidiaries. All material intercompany balances and transactions have been eliminated. Certain reclassifications have been made to prior period amounts to conform to the current period's presentation. These reclassifications have no impact on previously reported stockholders' equity, net income or cash flows.
Use of Estimates
The preparation of financial statements in accordance with U.S. GAAP requires us to make estimates and assumptions that affect the reported amounts of assets and liabilities, the disclosure of contingent assets and liabilities as of the date of the consolidated financial statements and the reported amounts of revenues and expenses during the reporting periods.
Estimated quantities of natural gas, NGLs and oil reserves is a significant estimate that requires judgment. All of the reserve data included in this Form 10-K are estimates. Reservoir engineering is a subjective process of estimating underground accumulations of natural gas, NGLs and oil. There are numerous uncertainties inherent in estimating quantities of proved natural gas, NGLs and oil reserves. The accuracy of any reserves estimate is a function of the quality of available data and of engineering and geological interpretation and judgment. As a result, reserves estimates may be different from the quantities of natural gas, NGLs and oil that are ultimately recovered. See Note 16 for further detail.
Other items subject to estimates and assumptions include the carrying amounts of property, plant and equipment, valuation of certain derivative instruments, exit cost liabilities and valuation allowances for deferred income tax assets, among others. Although we believe these estimates are reasonable, actual results could differ from these estimates.
Business Segment Information
We have evaluated how we are organized and managed and have identified only one operating segment. We consider our gathering, processing and marketing functions as integral to our natural gas, NGLs and oil producing activities. We have a single company-wide management team that administers all properties as a whole rather than by discrete operating segments. Our Chief Executive Officer is the Chief Operating Decision Maker ("CODM"). We measure financial performance as a single enterprise and not on an area-by-area basis. Our exploration and production operations are limited to onshore United States and all of our sales transfer title and control in the onshore United States. Income before income taxes as presented in the consolidated statements of income is the primary measure of segment profit and loss used by the CODM in assessing business performance and making capital allocation decisions by comparing actual amounts to historical results and previously forecasted financial information.
Revenue Recognition and Accounts Receivable
Natural gas, NGLs and oil sales revenues are recognized when control of the product is transferred to the customer and collectability is reasonably assured. See below for a more detailed summary of our product types.
Natural Gas and NGLs Sales. Under some of our gas processing contracts, we deliver natural gas to a midstream processing entity for processing. The midstream processing entity processes the natural gas and remits proceeds to us for the resulting sales of NGLs and residue gas. In these scenarios, we evaluate whether we are the principal or the agent in the transaction. For those contracts that we have concluded that we are the principal, the ultimate third party is our customer, and we recognize revenue on a gross basis, with gathering, compression, processing and transportation fees presented as an expense. Alternatively, for those contracts that we have concluded that we are the agent, the midstream processing entity is our customer, and we recognize revenue based on the net amount of the proceeds received from the midstream processing entity.
In other natural gas processing agreements, we may elect to take our residue gas and/or NGLs in kind at the tailgate of the midstream entity’s processing plant and subsequently market the product on our own. Through the marketing process, we deliver product to the ultimate third-party purchaser at a contractually agreed-upon delivery point and receive a specified index-driven price from the purchaser. In this scenario, we recognize revenue when control transfers to the purchaser at the delivery point based on the index-driven price received from the purchaser. The gathering, processing and compression fees attributable to the gas processing contract, as well as any transportation fees incurred to deliver the product to the purchaser, are presented as transportation, gathering, processing and compression expense.
Oil Sales. Our oil sales contracts are generally structured in one of the following ways:
•We sell oil production at the wellhead and collect an agreed-upon index-driven price, net of transportation incurred by the purchaser (that is, a netback arrangement). In this scenario, we recognize revenue when control transfers to the purchaser at the wellhead at the net price received.
•We deliver oil to the purchaser at a contractually agreed-upon delivery point at which the purchaser takes custody, title, and risk of loss of the product. Under this arrangement, we pay a third party to transport the product and receive a specified index-driven price from the purchaser with no deduction. In this scenario, we recognize revenue when control transfers to the purchaser at the delivery point based on the price received from the purchaser. The third-party costs are recorded as transportation, gathering, processing and compression expense.
Brokered Natural Gas and Marketing. We realize brokered margins as a result of buying natural gas or NGLs utilizing separate purchase transactions, generally with separate counterparties, and subsequently selling that natural gas or NGLs under our existing contracts to fill our contract commitments or use existing infrastructure contracts to economically utilize available capacity. In these arrangements, we take control of the natural gas or NGLs purchased prior to delivery of that gas under our existing gas contracts with a separate counterparty. Revenues and expenses related to brokering natural gas or NGLs are reported gross as part of revenues and expenses in accordance with applicable accounting standards. Proceeds generated from the sale of excess firm transportation to third parties is also included here when we are determined to no longer be the primary obligor of such arrangement. Our net brokered margin was a loss of $7.5 million in 2024 compared to income of $3.7 million in 2023 and loss of $7.3 million in 2022.
The recognition of gains or losses on derivative instruments is not considered revenue from contracts with customers. We may use financial or physical contracts accounted for as derivatives as economic hedges to manage price risk associated with normal sales or in limited cases may use them for contracts we intend to physically settle but that do not meet all of the criteria to be treated as normal sales.
Accounts Receivable. Our accounts receivable consist mainly of receivables from oil and gas purchasers and joint interest owners on properties we operate. Although receivables are concentrated in the oil and gas industry, we do not view this as an unusual credit risk. However, this concentration has the potential to impact our overall exposure to credit risk in that our customers may be similarly affected by changes in economic and financial conditions, commodity prices or other conditions. Each reporting period, we assess the recoverability of material receivables using historical data and current market conditions. The loss given default method is used when, based on management’s judgment, an allowance for expected credit losses is accrued on material receivables to reflect the net amount to be collected. In certain instances, we require purchasers to post stand-by letters of credit. For receivables from joint interest owners, we may have the ability to withhold future revenue disbursements to recover any non-payment of joint interest billings. We regularly review collectability and establish or adjust our allowance as necessary. We have allowances for doubtful accounts relating to exploration and production receivables of $255,000 at December 31, 2024 compared to $308,000 at December 31, 2023. We recorded bad debt expense of $50,000 in the year ended December 31, 2024, no bad debt expense in the year ended December 31, 2023 and a reduction of $250,000 in the year ended December 31, 2022.
Cash and Cash Equivalents
Cash and cash equivalents include cash on hand and on deposit and investments in highly liquid debt instruments with maturities of three months or less. Outstanding checks in excess of funds on deposit are included in accounts payable on the consolidated balance sheets and the change in such overdrafts is classified as a financing activity on the consolidated statements of cash flows. Interest earned on cash equivalents is included in other income.
Natural Gas and Oil Properties
Property Acquisition Costs. We use the successful efforts method of accounting for natural gas and oil producing activities. Costs to acquire mineral interests in natural gas and oil properties, to drill exploratory wells that find proved reserves and to drill development wells are capitalized. Costs to drill exploratory wells that do not find proved reserves, geological and geophysical costs, delay rentals and costs of carrying and retaining unproved properties are expensed. Costs incurred for exploratory wells that find reserves that cannot yet be classified as proved are capitalized if (a) the well has found a sufficient quantity of reserves to justify its completion as a producing well and (b) we are making sufficient progress assessing the reserves and the economic and operating
viability of the project.
Depreciation, Depletion and Amortization. Depreciation, depletion and amortization of proved properties, including other property and equipment such as gathering lines related to natural gas, NGLs and oil producing activities, is provided on the units of production method. Historically, we have adjusted our depletion rates in the fourth quarter of each year based on the year-end reserve report and at other times during the year when circumstances indicate there has been a significant change in reserves or costs.
Impairments. Our proved natural gas and oil properties are reviewed for impairment of value whenever events or changes in circumstances indicate the carrying value of an asset may not be recoverable. If the sum of the expected undiscounted future cash flows from the use of the asset and its eventual disposition is less than the carrying value of the asset, an impairment loss is recognized based on the fair value of the asset. These assets are reviewed for potential impairment at the lowest level for which there are identifiable cash flows that are largely independent of other groups of assets which is the level at which depletion is calculated. Natural gas and oil properties deemed to be impaired are written down to their fair value, as determined by discounted future net cash flows or, if available, comparable market value. There were no proved property impairment charges for the three-year period ended December 31, 2024.
We evaluate our unproved property investment periodically for impairment. The majority of these costs generally relate to the acquisition of leasehold costs. The costs are capitalized and evaluated (at least quarterly) as to recoverability based on changes brought about by economic factors and potential shifts in business strategy employed by management which could impact the number of locations we intend to drill. Impairment of a significant portion of our unproved properties is assessed and amortized on an aggregate basis based on our average holding period, expected forfeiture rate and anticipated drilling success. Information such as reservoir performance or future plans to develop acreage is also considered. Impairment of individually significant unproved property is assessed on a property-by-property basis considering a combination of time, geologic and engineering factors. Unproved properties had a net book value of $819.7 million as of December 31, 2024 compared to $789.9 million in 2023. We have recorded abandonment and impairment expense related to unproved properties of $8.4 million in the year ended December 31, 2024 compared to $46.4 million in 2023 and $28.6 million in 2022.
Dispositions. Proceeds from the disposal of natural gas and oil producing properties that are part of an amortization base are credited to the net book value of the amortization group with no immediate effect on income. However, gain or loss is recognized if the disposition is significant enough to materially impact the depletion rate of the remaining properties in the amortization base. Dispositions are accounted for as a sale of assets. Gain or loss recognized on dispositions is included in other income.
Other Property and Equipment
Other property and equipment includes assets such as buildings, furniture and fixtures, field equipment, internal-use software, leasehold improvements and data processing and communication equipment. These items are generally depreciated by individual components on a straight-line basis over their economic useful life, which is generally from three to ten years. Leasehold improvements are amortized over the lesser of their economic useful lives or the underlying terms of the associated leases. Depreciation expense was $1.4 million in the year ended December 31, 2024 compared to $1.5 million in the year ended December 31, 2023 and $2.2 million in the year ended December 31, 2022.
Leases
We determine if an arrangement is a lease at the inception of the arrangement. We lease certain drilling or completion equipment, office space, field equipment, vehicles and other equipment under cancelable and non-cancelable leases to support our operations. Certain of our lease agreements include lease and non-lease components. We account for these components as a single lease. Lease costs associated with drilling and completion equipment are capitalized as part of well costs.
Lease right-of-use ("ROU") assets and liabilities are initially recorded on the lease commencement date based on the present value of lease payments over the lease term. As most of our lease contracts do not provide an implicit discount rate, we use our incremental borrowing rate which is determined based on information available at the commencement date of a lease. Leases may include renewal, purchase or termination options that can extend or shorten the term of the lease. The exercise of those options is at our discretion and is evaluated at inception and throughout the contract to determine if a modification of the lease term is required. Leases with a term of 12 months or less are not recorded as a right-of-use asset and liability. The majority of our leases are classified as either short-term or long-term operating leases.
Our leased assets may be used in joint oil and gas operations with other working interest owners. We recognize lease liabilities and ROU assets only when we are the signatory to a contract as an operator of joint properties. Such lease liabilities and ROU assets are determined and disclosed based on gross contractual obligations. Our lease costs are also presented on a gross contractual basis. For additional information regarding our leases, see Note 13.
Other Assets
Investments in unaffiliated equity securities held in our deferred compensation plans qualify as trading securities and are recorded at fair value. Investments held in the deferred compensation plans consist of various publicly-traded mutual funds. These funds include equity securities and money market instruments and are reported in other assets in the accompanying consolidated balance sheets.
Other assets at December 31, 2024 include $61.0 million of marketable securities held in our deferred compensation plan, $5.0 million of deferred financing costs related to our bank credit facility, $7.6 million of investments in surface acreage, $4.0 million of deferred tax assets and $2.0 million of other. Other assets at December 31, 2023 include $72.0 million of marketable securities held in our deferred compensation plan, $7.3 million of deferred financing costs related to our bank credit facility and $7.7 million of investments in surface acreage and $1.9 million of other.
Stock-based Compensation Arrangements
We account for stock-based compensation under the fair value method of accounting. We grant various types of stock-based awards including restricted stock and performance-based awards. The fair value of our restricted stock awards and our performance-based awards (where the performance condition is based on internal performance metrics) is based on the market value of our common stock on the date of grant. The fair value of our performance-based awards where the performance condition is based on market conditions is estimated using a Monte Carlo simulation method.
We recognize stock-based compensation expense on a straight-line basis over the requisite service period for the entire award. The expense we recognize is net of estimated forfeitures. We estimate our forfeiture rate based on prior experience and adjust it as circumstances warrant. If actual forfeitures are different than expected, adjustments to recognize expense may be required in future periods. To the extent possible, we limit the amount of shares to be issued for these awards by satisfying tax withholding requirements with cash. All awards have been issued at prevailing market prices at the time of grant and the vesting of these awards is based on an employee’s continued employment with us, with the exception of employment termination due to death, disability or retirement. For additional information regarding stock-based compensation, see Note 10.
Derivative Financial Instruments
We enter into financial commodity derivative contracts to manage exposure to price fluctuations on a portion of anticipated production volumes. We do not enter into these arrangements for speculative or trading purposes. All unsettled commodity derivative instruments are recorded in the accompanying consolidated balance sheets as either an asset or a liability measured at their fair value. In most cases, our derivatives are reflected on our consolidated balance sheets on a net basis by brokerage firm when they are governed by master netting agreements which, in an event of default, allows us to offset payables to and receivables from the defaulting counterparty. Changes in a derivative’s fair value are recognized in earnings. Cash flows from derivative contract settlements are reflected in operating activities in the accompanying consolidated statements of cash flows.
All realized and unrealized gains and losses on derivative instruments are accounted for using the mark-to-market accounting method. We recognize all unrealized and realized gains and losses related to these contracts in each period in derivative fair value income (loss) in the accompanying consolidated statements of income. Certain of our commodity derivatives are swaps where we receive a fixed price for our production and pay market prices to the counterparty. We have collars which establish a minimum floor price and a predetermined ceiling price. Our program may also include three-way collars which are a combination of three options: a sold call, a purchased put and a sold put. The sold call establishes the ceiling price while the purchased put establishes the floor price until the market price for the commodity falls below the sold put price at which time the value of the purchased put is effectively capped. We have also entered into natural gas derivative instruments containing a fixed price swap and a sold option (which we refer to as a swaption). The price we receive for our natural gas production can be more or less than the NYMEX price because of adjustments for delivery location ("basis"), relative quality and other factors; therefore, we have entered into natural gas basis swap agreements that effectively fix our basis adjustments. For additional information regarding our derivative instruments, see Note 8.
Fair Value
Fair value is the price that would be received to sell an asset or paid to transfer a liability in an orderly transaction between market participants at the measurement date (exit price). To estimate fair value, we utilize market data or assumptions that market participants would use in pricing the asset or liability, including assumptions about risk and risks inherent in the inputs to the valuation technique. These inputs can be readily observable, market corroborated or generally unobservable. The fair value standards establish a fair value hierarchy that prioritizes the inputs used in applying the various valuation techniques. The hierarchy gives the highest priority to the unadjusted quoted prices in the active markets ("Level 1" measurements) and the lowest priority to unobservable inputs ("Level 3" measurements). The three levels of the fair value hierarchy are as follows:
• Level 1 – Observable inputs that reflect unadjusted quoted prices for identical assets or liabilities in active markets as of the reporting date. Active markets are those in which transactions for the asset or liability occur in sufficient frequency and volume to provide pricing information on an ongoing basis.
• Level 2 – Observable market-based inputs or unobservable inputs that are corroborated by market data. These are inputs other than quoted prices in active markets included in Level 1, which are either directly or indirectly observable as of the reporting date.
• Level 3 – Unobservable inputs for which there is little, if any, market activity for the asset or liability being measured. These inputs reflect management’s best estimates of the assumptions market participants would use in determining fair value. Our Level 3 measurements consist of instruments using standard pricing models and other valuation methods that utilize unobservable pricing inputs that are significant to the overall value.
Valuation techniques that maximize the use of observable inputs are favored. Assets and liabilities are classified in their entirety based on the lowest priority level of input that is significant to the fair value measurement. The assessment of the significance of a particular input to the fair value measurement requires judgment and may affect the placement of assets and liabilities within the levels of the fair value hierarchy. When transfers between levels occur, it is our policy to assume the transfer occurred at the date of the event or change in circumstances that caused the transfer. We value trading securities in the deferred compensation plan and derivative assets and liabilities at fair value on a recurring basis. Certain assets are measured at fair value on a non-recurring basis. For example, our proved natural gas properties and other property and equipment are assessed for impairment periodically as events or changes in circumstances indicate the carrying amount may not be recoverable. There were no property impairment charges for the three-year period ended December 31, 2024. For additional information regarding the use of fair value, see Note 8 and Note 9.
Concentrations of Credit Risk
As of December 31, 2024, our primary concentrations of credit risk are the risks of collecting accounts receivable and the risk of counterparties’ failure to perform under derivative contracts. Most of our receivables are from a diverse group of companies, including major energy companies, pipeline companies, local distribution companies, financial institutions, commodity traders and end-users in various industries and such receivables are generally unsecured. The nature of our customers’ businesses may impact our overall credit risk, either positively or negatively, in that these entities may be similarly affected by changes in economic or other conditions. To manage risks of collecting accounts receivable, we monitor our counterparties’ financial strength and/or credit ratings and where we deem necessary, we obtain parent company guarantees, prepayments, letters of credit or other credit enhancements to reduce risk of loss. We may also limit the level of exposure with any single counterparty. We do not anticipate a material impact on our financial results due to non-performance by third parties.
For the year ended December 31, 2024, we had two customers that accounted for 10% or more of natural gas, NGLs and oil sales compared to one such customer for the year ended December 31, 2023 and no such customers for the year ended December 31, 2022. Customer A represented 15% of sales in 2024 and 13% in 2023. Customer B represented 10% of sales in 2024. We believe that the loss of any one customer would not have an adverse effect on our ability to sell our natural gas, NGLs and oil production.
We have executed International Swap Dealers Association Master Agreements ("ISDA Agreements") with counterparties for the purpose of entering into derivative contracts. To manage counterparty risk associated with our derivatives, we select and monitor counterparties based on assessment of their financial strength and/or credit ratings. Additionally, the terms of our ISDA Agreements provide us and our counterparties with netting rights such that we may offset payables against receivables with a counterparty under separate derivative contracts. Our ISDA Agreements also generally contain set-off rights such that, upon the occurrence of defined acts of default by either us or a counterparty to a derivative contract, the non-defaulting party may set-off receivables owed under all derivative contracts against payables from other agreements with that counterparty. None of our derivative contracts have a margin requirement or collateral provision that would require us to fund or post additional collateral prior to the scheduled cash settlement date.
At December 31, 2024, our derivative counterparties included fifteen financial institutions and commodity traders, of which all but five are secured lenders in our bank credit facility. At December 31, 2024, our net derivative asset includes a payable to the five
counterparties not included in our bank credit facility totaling $11.5 million. In determining fair value of derivative assets, we evaluate the risk of non-performance and incorporate factors such as amounts owed under other agreements permitting set-off, as well as pricing of credit default swaps for the counterparty. Historically, we have not experienced any issues of non-performance by derivative counterparties. Net derivative liabilities are determined in part by using our market-based credit spread to incorporate our theoretical risk of non-performance.
Asset Retirement Obligations
The fair value of asset retirement obligations ("ARO") is recognized in the period they are incurred, if a reasonable estimate of fair value can be made. Asset retirement obligations primarily relate to the abandonment of natural gas and oil producing properties and include costs to dismantle and relocate or dispose of production platforms, wells and related structures. Estimates are based on historical experience of plugging and abandoning wells, estimated remaining lives of those wells based on reserve estimates, external estimates of the cost to plug and abandon the wells in the future, federal and state regulatory requirements, inflation rates and credit-adjusted-risk-free interest rates. Depreciation of capitalized asset retirement costs will generally be determined on a units-of-production basis while accretion to be recognized will escalate over the life of the producing assets. See Note 7 for additional information.
Exit Costs
We recognize the fair value of a liability for an exit cost in the period in which a liability is incurred. The recognition and fair value estimation of an exit cost liability requires that management take into account certain estimates and assumptions. Fair value estimates are based on future discounted cash outflows required to satisfy the obligation. In periods subsequent to initial measurement, changes to an exit cost liability, including changes resulting from revisions to either the timing or the amount of estimated cash flows over the future contract period, are recognized as an adjustment to the liability in the period of the change utilizing the initial discount rate. These costs, including associated accretion expense, are included in exit costs in the accompanying consolidated statements of income. See Note 14 for additional information.
Contingencies
We are subject to legal proceedings, claims, and liabilities and environmental matters that arise in the ordinary course of business. We accrue for losses when such losses are considered probable and the amounts can be reasonably estimated. See Note 13 for a more detailed discussion regarding our contingencies.
Environmental expenditures are capitalized if the costs mitigate or prevent future contamination or if the costs improve environmental safety or efficiency of the existing assets. Expenditures that relate to an existing condition caused by past operations that have no future economic benefits are expensed.
Deferred Taxes
Deferred tax assets and liabilities, measured by the enacted tax rates, are recognized for the estimated future tax consequences attributable to the differences between the financial statement carrying amounts of assets and liabilities and their tax bases as reported in our filings with the respective taxing authorities. Deferred tax assets are recorded when it is more likely than not that they will be realized. The realization of deferred tax assets is assessed periodically based on several interrelated factors. These factors may include whether we are in a cumulative loss position in recent years, our reversal of temporary differences and our expectation to generate sufficient taxable income in the periods before tax credits and operating loss carryforwards expire. All deferred taxes are classified as long-term in the accompanying consolidated balance sheets. See Note 4 for a more detailed discussion regarding our income taxes.
Treasury Stock
Treasury stock purchases are recorded at cost. Upon re-issuance, the cost of treasury shares held is reduced by the average purchase price per share of the aggregate treasury shares held. See Note 11 for a more detailed discussion regarding our treasury stock.
Recently Adopted Accounting Standards
In November 2023, the Financial Accounting Standards Board ("FASB") issued accounting standards update ("ASU") No. 2023-07, Segment Reporting (Topic 280): Improvements to Reportable Segment Disclosures. ASU 2023-07 was issued to improve the disclosures about a public entity’s reportable segments and to provide additional, more detailed information about a reportable segment’s expenses. This update is effective for fiscal years beginning after December 15, 2023, and interim periods within fiscal years beginning after December 15, 2024, with early adoption permitted. The guidance is to be applied on a retrospective basis to all prior periods presented in the financial statements. The Company has adopted ASU 2023-07 and updated our consolidated financial statement disclosures accordingly.
Accounting Standards Not Yet Adopted
In December 2023, the FASB issued ASU 2023-09, Income Taxes: Improvements to Income Tax Disclosures to improve its income tax disclosure requirements. Under this ASU, public business entities must annually (1) disclose specific categories in the rate reconciliation and (2) provide additional information for reconciling items that meet a quantitative threshold. This ASU is effective for fiscal years beginning after December 15, 2024, and early adoption is permitted. The Company does not expect adoption of ASU 2023-09 to have a material impact on its financial statements and related disclosures.
In November 2024, the FASB issued ASU 2024-03, Income Statement—Reporting Comprehensive Income—Expense Disaggregation Disclosures (Subtopic 220-40) to improve its expense disclosure requirements. Under this ASU, public business entities at interim and annual reporting periods must (1) disclose the amounts for specific categories of expenses within relevant expense captions, (2) include certain amounts that are already required to be disclosed under current GAAP in the same disclosure as the other disaggregation requirements, (3) disclose a qualitative description of the amounts remaining in relevant expense captions that are not separately disaggregated quantitatively and (4) disclose the total amount of selling expenses and, in annual reporting periods, an entity’s definition of selling expenses. This ASU is effective for annual reporting periods beginning after December 15, 2026, and for interim reporting periods beginning after December 15, 2027. Early adoption is permitted. The Company is evaluating the impact that ASU 2024-03 will have on the consolidated financial statements and its plans for adoption, including the adoption date.
There are no other accounting standards applicable to us that would have a material effect on our consolidated financial statements and disclosures that have been issued but not yet adopted by us as of December 31, 2024, and through the filing date of this report.
(3) Revenues from Contracts with Customers
Disaggregation of Revenue
We have identified three material revenue streams in our business: natural gas sales, NGLs sales and oil sales. Brokered revenue attributable to each product sales type is included here because the volume of product that we purchase is subsequently sold to separate counterparties in accordance with existing sales contracts under which we also sell our production. Revenue attributable to each of our identified revenue streams is disaggregated below (in thousands):
| | | | | | | | | | | |
| Year Ended December 31, | |
| 2024 | | | 2023 | | | 2022 | |
Natural gas sales | $ | 1,052,442 | | | $ | 1,234,308 | | | $ | 3,364,111 | |
NGLs sales | | 1,020,903 | | | | 933,791 | | | | 1,308,574 | |
Oil sales | | 140,505 | | | | 166,562 | | | | 238,407 | |
Total natural gas, NGLs and oil sales | | 2,213,850 | | | | 2,334,661 | | | | 4,911,092 | |
Sales of purchased natural gas | | 119,767 | | | | 195,656 | | | | 408,584 | |
Sales of purchased NGLs | | 5,370 | | | | 1,834 | | | | 2,783 | |
Other marketing revenue | | 7,911 | | | | 9,062 | | | | 8,409 | |
Total | $ | 2,346,898 | | | $ | 2,541,213 | | | $ | 5,330,868 | |
Performance Obligations and Contract Balance
A significant number of our product sales are short-term in nature with a contract term of one year or less. We typically satisfy our performance obligation upon transfer of control and record revenue in the month production is delivered to the purchaser. Settlement statements for certain gas and NGLs sales may be received 30 to 90 days after the date production is delivered, and as a result, we are required to estimate the amount of production that was delivered to the purchaser and the price that will be received for the sale of the product. We record the differences between our estimates and the actual amounts for product sales in the month that payment is received from the purchaser. We have internal controls in place for our estimation process and any identified differences between our revenue estimates and actual revenue received historically have not been significant. For the three years ended December 31, 2024, 2023 and 2022, revenue recognized in the reporting period related to performance obligations satisfied in prior reporting periods was not material. Under our sales contracts, we invoice customers once our performance obligations have been satisfied, at which point payment is unconditional. Accordingly, our product sales contracts do not give rise to contract assets or liabilities. Accounts receivable attributable to our revenue contracts with customers was $291.5 million at December 31, 2024 compared to $263.9 million at December 31, 2023.
(4) Income Taxes
Our income tax benefit was $15.7 million for the year ended December 31, 2024 compared to an expense of $229.2 million in 2023 and an expense of $230.5 million in 2022. The effective income tax rate is influenced by a variety of factors including geographic sources and relative magnitude of these sources of income as well as a reduction in our valuation allowances related to a change in the realizability of our federal and Pennsylvania deferred tax assets. Additionally, in the current year we recorded a tax benefit related to credits generated in the current year and as part of a look-back study. The state tax reconciling item includes tax expense related to a tax rate change in Louisiana which is equally offset by a change in the Louisiana valuation allowance included on the valuation allowance line. Reconciliation between the statutory federal income tax rate and our effective income tax rate is as follows:
| | | | | | | | | | | | |
| Year Ended December 31, | | |
| 2024 | | | 2023 | | | 2022 | | |
Federal statutory tax rate | | 21.0 | | % | | 21.0 | | % | | 21.0 | | % |
State, net of federal benefit | | 13.9 | | | | (0.1 | ) | | | 1.0 | | |
Equity compensation and executive compensation disallowance | | (0.5 | ) | | | (0.3 | ) | | | 0.2 | | |
Valuation allowances | | (28.1 | ) | | | 0.2 | | | | (5.5 | ) | |
Tax credits | | (12.7 | ) | | | — | | | | (0.4 | ) | |
Permanent differences and other | | 0.1 | | | | — | | | | — | | |
Effective tax rate | | (6.3 | ) | % | | 20.8 | | % | | 16.3 | | % |
Income tax (benefit) expense attributable to income before income taxes consists of the following (in thousands):
| | | | | | | | | | | |
| Year Ended December 31, | |
| 2024 | | | 2023 | | | 2022 | |
Current | | | | | | | | |
Federal | $ | 3,329 | | | $ | — | | | $ | — | |
State | | 4,836 | | | | 1,547 | | | | 14,688 | |
| $ | 8,165 | | | $ | 1,547 | | | $ | 14,688 | |
| | | | | | | | |
Deferred | | | | | | | | |
Federal | $ | (7,310 | ) | | $ | 230,563 | | | $ | 245,839 | |
State | | (16,590 | ) | | | (2,909 | ) | | | (30,067 | ) |
| | (23,900 | ) | | | 227,654 | | | | 215,772 | |
Income tax (benefit) expense | $ | (15,735 | ) | | $ | 229,201 | | | $ | 230,460 | |
At December 31, 2024, deferred tax liabilities exceeded deferred tax assets by $537.4 million. We continue to evaluate the realizability of our federal and state deferred tax assets. As of December 31, 2024, we have a state valuation allowance of $125.0 million related to state tax attributes in Louisiana, Oklahoma, Texas and West Virginia. As of December 31, 2024, we have no remaining federal or Pennsylvania valuation allowances. The net change in our deferred tax asset valuation allowances was a decrease of $70.4 million for the year ended December 31, 2024 compared to an increase of $2.7 million in 2023 and a decrease of $78.3 million in 2022. The current year decrease in the valuation allowance was a result of our ability to demonstrate strong pre-tax earnings in recent history which resulted in a release of all federal and Pennsylvania valuation allowances.
At December 31, 2024, we have federal NOL carryforwards of $1.4 billion, all of which were generated after 2017 that do not expire. We have state NOL carryforwards in Pennsylvania of $773.2 million that expire between 2031 and 2042 and in Louisiana, we have state NOL carryforwards of $1.7 billion that do not expire. We file a consolidated tax return in the United States federal jurisdiction. We file separate company state income tax returns in Louisiana and Pennsylvania and file consolidated or unitary state income tax returns in Oklahoma, Texas and West Virginia. We are subject to U.S. federal income tax examinations for the years 2021 and after, and we are subject to various state tax examinations for years 2019 and after. We have not extended the statute of limitation period in any income tax jurisdiction. Our policy is to recognize interest related to income tax expense in interest expense and penalties in general and administrative expense. We do not have any material accrued interest or penalties related to tax amounts as of December 31, 2024 or December 31, 2023. Throughout 2024, 2023 and 2022, our unrecognized tax benefits were not material.
On July 12, 2022, the Commonwealth of Pennsylvania enacted legislation to reduce the corporate net income tax rate from 9.99% to 8.99% in 2023, further reducing by 0.5% per year beginning in 2024, and becoming 4.99% in 2031 and each year thereafter.
Significant components of deferred tax assets and liabilities are as follows (in thousands):
| | | | | | | |
| December 31, | |
| 2024 | | | 2023 | |
Deferred tax assets: | | | | | |
Net operating loss carryforward | $ | 424,487 | | | $ | 538,340 | |
Divestiture contract obligation | | 87,311 | | | | 107,067 | |
Deferred compensation | | 14,480 | | | | 17,342 | |
Equity compensation | | 8,155 | | | | 6,767 | |
Asset retirement obligations | | 29,096 | | | | 25,614 | |
Interest expense carryforward | | 10,830 | | | | 19,861 | |
Lease right-of-use liabilities | | 26,726 | | | | 6,023 | |
Tax credits | | 31,941 | | | | 10,104 | |
Other | | 5,878 | | | | 6,292 | |
Valuation allowances: | | | | | |
Federal | | — | | | | (23,396 | ) |
State, net of federal benefit | | (124,979 | ) | | | (172,001 | ) |
Total deferred tax assets | | 513,925 | | | | 542,013 | |
Deferred tax liabilities: | | | | | |
Depreciation and depletion | | (1,010,139 | ) | | | (998,886 | ) |
Unrealized mark-to-market gain | | (14,568 | ) | | | (96,545 | ) |
Lease right-of-use assets | | (26,065 | ) | | | (5,184 | ) |
Other | | (531 | ) | | | (2,686 | ) |
Total deferred tax liabilities | | (1,051,303 | ) | | | (1,103,301 | ) |
Net deferred tax liability | $ | (537,378 | ) | | $ | (561,288 | ) |
(5) Net Income per Common Share
Basic income or loss per share attributable to common stockholders is computed as (i) income or loss attributable to common stockholders (ii) less income allocable to participating securities (iii) divided by weighted average basic shares outstanding. Diluted income or loss per share attributable to common stockholders is computed as (i) basic income or loss attributable to common stockholders (ii) plus diluted adjustments to income allocable to participating securities (iii) divided by weighted average diluted shares outstanding. Diluted net income or loss per share is calculated under both the two class method and the treasury stock method and the more dilutive of the two calculations is presented. The following table sets forth a reconciliation of net income or loss to basic income or loss attributable to common stockholders and to diluted income or loss attributable to common stockholders (in thousands except per share amounts):
| | | | | | | | | | | |
| Year Ended December 31, | |
| 2024 | | | 2023 | | | 2022 | |
Net income as reported | $ | 266,340 | | | $ | 871,142 | | | $ | 1,183,370 | |
Participating basic earnings (a) | | (1,298 | ) | | | (14,971 | ) | | | (28,578 | ) |
Basic net income attributed to common stockholders | | 265,042 | | | | 856,171 | | | | 1,154,792 | |
Reallocation of participating earnings (a) | | 8 | | | | 159 | | | | 614 | |
Diluted net income attributed to common stockholders | $ | 265,050 | | | $ | 856,330 | | | $ | 1,155,406 | |
Net income per common share: | | | | | | | | |
Basic | $ | 1.10 | | | $ | 3.61 | | | $ | 4.79 | |
Diluted | $ | 1.09 | | | $ | 3.57 | | | $ | 4.69 | |
| |
(a) | Restricted stock Liability Awards represent participating securities because they participate in nonforfeitable dividends or distributions with common equity owners. Income allocable to participating securities represents the distributed and undistributed earnings attributable to the participating securities. Participating securities, however, do not participate in undistributed net losses. |
The following table details basic weighted average common shares outstanding and diluted weighted average common shares outstanding (in thousands):
| | | | | | | | | | | |
| Year Ended December 31, | |
| 2024 | | | 2023 | | | 2022 | |
Denominator: | | | | | | | | |
Weighted average common shares outstanding – basic | | 240,689 | | | | 236,986 | | | | 240,858 | |
Effect of dilutive securities | | 2,056 | | | | 2,851 | | | | 5,521 | |
Weighted average common shares outstanding – diluted | | 242,745 | | | | 239,837 | | | | 246,379 | |
Weighted average common shares outstanding – basic excludes 1.2 million shares of restricted stock Liability Awards held in our deferred compensation plans (although all awards are issued and outstanding upon grant) for the period ended December 31, 2024 compared to 4.1 million shares for the period ended December 31, 2023 and 6.1 million shares for the period ended December 31, 2022. Equity grants of 3,000 shares for the year ended December 31, 2023 and 5,000 shares for the year ended December 31, 2022 were outstanding but not included in the computation of diluted net income because the grant prices were greater than the average market price of the common shares and would be anti-dilutive to the computations.
(6) Indebtedness
We had the following debt outstanding as of the dates shown below. The expenses of issuing debt are generally capitalized and included as a reduction to debt in the accompanying consolidated balance sheets. For December 31, 2024, deferred financing costs for our bank credit facility are included in other assets in the accompanying consolidated balance sheet. These costs are amortized over the expected life of the related instruments. When debt is retired before maturity, or modifications significantly change the cash flows, the related unamortized costs are expensed. No interest was capitalized in the three-year period ended December 31, 2024. The components of our debt outstanding, including the effects of debt issuance costs, are as follows (in thousands):
| | | | | | | |
| December 31, | |
| 2024 | | | 2023 | |
Bank debt | $ | — | | | $ | — | |
Senior notes: | | | | | |
4.875% senior notes due 2025 | | 608,702 | | | | 688,388 | |
8.25% senior notes due 2029 | | 600,000 | | | | 600,000 | |
4.75% senior notes due 2030 | | 500,000 | | | | 500,000 | |
Total senior notes | | 1,708,702 | | | | 1,788,388 | |
Unamortized debt issuance costs | | (10,819 | ) | | | (14,159 | ) |
Total debt, net of deferred financing costs | | 1,697,883 | | | | 1,774,229 | |
Less current maturities of long-term debt (a) | | (608,269 | ) | | | — | |
Total long-term debt | $ | 1,089,614 | | | $ | 1,774,229 | |
| |
(a) | As of December 31, 2024, current maturities include $608.7 million principal amount of our 4.875% senior notes due 2025 ($608.3 million net of deferred financing costs). |
Bank Debt
In April 2022, we entered into an amended and restated revolving bank facility (which we refer to as our bank debt or our bank credit facility) which is secured by substantially all of our assets and has a maturity date of April 14, 2027. The bank credit facility provides for a maximum facility amount of $4.0 billion and an initial borrowing base of $3.0 billion. The bank credit facility provides for a borrowing base subject to re-determinations and for event-driven unscheduled re-determinations. Our current bank group is composed of seventeen financial institutions. The borrowing base may be increased or decreased based on our request and sufficient proved reserves, as determined by the bank group. The commitment amount may be increased to the borrowing base, subject to payment of a mutually acceptable commitment fee to those banks agreeing to participate in the facility increase. Borrowings under the bank facility can either be at the alternate base rate ("ABR," as defined in the bank credit agreement) plus a spread ranging from 0.75% to 1.75% or at the secured overnight financing rate ("SOFR", as defined in the bank credit agreement) plus a spread ranging from 1.75% to 2.75%. The applicable spread is dependent upon borrowings relative to the borrowing base. We may elect, from time to time, to convert all or any part of our SOFR loans to ABR loans or to convert all or any part of our ABR loans to SOFR loans. There was no debt outstanding on our bank facility for the year ended December 31, 2024. The weighted average interest rate was 8.4% for the year ended December 31, 2023 and 4.1% for the year ended December 31, 2022. A commitment fee is paid on the undrawn
balance based on an annual rate of 0.375% to 0.50%. At December 31, 2024, the commitment fee was 0.375% and the interest rate margin was 0.75% on our ABR loans and 1.75% on our SOFR loans.
On December 31, 2024, bank commitments totaled $1.5 billion and we had no outstanding borrowings under our bank credit facility. We had $165.3 million of undrawn letters of credit leaving $1.3 billion of committed borrowing capacity available under the facility. As part of our re-determination completed in October 2024, our borrowing base was reaffirmed for $3.0 billion and our bank commitments were also reaffirmed at $1.5 billion.
Senior Note Redemptions
If we experience a change of control, noteholders may require us to repurchase all or a portion of our senior notes at 101% of the principal amount plus accrued and unpaid interest, if any. We currently intend to retire our outstanding long-term debt as it matures, is callable or when market conditions are favorable to repurchase in the open market.
During 2024, we repurchased in the open market $79.7 million aggregate principal amount of our 4.875% senior notes due 2025 at a discount. We recognized a gain on early extinguishment of debt of $257,000, net of the remaining deferred financing costs on the repurchased debt.
Guarantees
Range Resources Corporation is a holding company which owns no operating assets and has no significant operations independent of its subsidiaries. The guarantees by our wholly-owned subsidiaries, which are directly or indirectly owned by Range, of our senior notes and our bank credit facility are full and unconditional and joint and several, subject to certain customary release provisions. The assets, liabilities and results of operations of Range and our guarantor subsidiaries are not materially different than our consolidated financial statements. A subsidiary guarantor may be released from its obligations under the guarantee:
•in the event of a sale or other disposition of all or substantially all of the assets of the subsidiary guarantor or a sale or other disposition of all the capital stock of the subsidiary guarantor, to any corporation or other person (including an unrestricted subsidiary of Range) by way of merger, consolidation, or otherwise; or
•if Range designates any restricted subsidiary that is a guarantor to be an unrestricted subsidiary in accordance with the terms of the indenture.
Debt Covenants and Maturity
Our bank credit facility contains negative covenants that limit our ability, among other things, to pay cash dividends, incur additional indebtedness, sell assets, enter into certain hedging contracts, change the nature of our business or operations, merge, consolidate, or make certain investments. We are required to maintain a ratio of debt-to-EBITDAX (as defined in the credit agreement) of less than 3.75x and a minimum current ratio (as defined in the credit agreement) of 1.0x. We were in compliance with applicable covenants under the bank credit facility at December 31, 2024. The following is the principal maturity schedule for our long-term debt outstanding as of December 31, 2024 (in thousands):
| | | |
| Year Ended
December 31, | |
2025 | $ | 608,702 | |
2026 | | — | |
2027 | | — | |
2028 | | — | |
2029 | | 600,000 | |
Thereafter | | 500,000 | |
| $ | 1,708,702 | |
(7) Asset Retirement Obligations
ARO primarily represents the present value of the estimated amounts we will incur to plug, abandon and remediate our producing properties at the end of their productive lives. Significant inputs used in determining such obligations include estimates of plugging and abandonment costs, estimated future inflation rates and well lives. The inputs are calculated based on historical data as well as current estimated costs. The following is a reconciliation of our liability for plugging and abandonment costs as of December 31, 2024 and 2023 (in thousands):
| | | | | | | |
| Year Ended December 31, | |
| 2024 | | | 2023 | |
Beginning of period | $ | 117,429 | | | $ | 109,851 | |
Liabilities incurred | | 3,871 | | | | 2,047 | |
Liabilities settled | | (4,655 | ) | | | (3,039 | ) |
Accretion expense | | 7,148 | | | | 6,000 | |
Change in estimate | | 9,974 | | | | 2,570 | |
End of period | | 133,767 | | | | 117,429 | |
Less current portion | | (1,189 | ) | | | (2,395 | ) |
Long-term asset retirement obligations | $ | 132,578 | | | $ | 115,034 | |
Accretion expense is recognized within depreciation, depletion and amortization expense in the accompanying consolidated statements of income.
(8) Derivative Activities
The following table sets forth the derivative volumes and fair values by expiration year as of December 31, 2024, excluding our basis swaps which are discussed separately below. All fair values presented in the table utilize Level 2 inputs, except where noted:
| | | | | | | | | | | | | | | | | | | | | | | | | | | | |
Period | | Contract Type | | Volume Hedged | | | Weighted Average Hedge Price | | | | |
| | | | | | Swap | | | Sold Put | | | Floor | | | Ceiling | | | Fair Market Value
(in thousands) | |
Natural Gas (a) | | | | | | | | | | | | | | | | | | | | | | | |
2025 | | Swaps | | 400,000 Mmbtu/day | | $ | | 4.12 | | | | | | | | | | | | | | | $ | 84,763 | |
2025 | | Three-way Collars | | 158,822 Mmbtu/day | | | | | | $ | | 2.53 | | | $ | | 3.30 | | | $ | | 4.82 | | | $ | 11,894 | |
2026 | | Swaps | | 200,000 Mmbtu/day | | $ | | 4.05 | | | | | | | | | | | | | | | $ | 10,154 | |
2027 | | Swaps | | 30,000 Mmbtu/day | | $ | | 4.10 | | | | | | | | | | | | | | | $ | 2,557 | |
| |
(a) | We also sold natural gas swaptions of 150,000 Mmbtu/day for calendar year 2026 at a weighted average price of $4.00/Mmbtu that expire between June and August 2025. The fair value of these contracts as of December 31, 2024, which utilizes Level 3 inputs, was a net derivative liability of $13.2 million. |
Derivatives in Level 2 are measured at fair value with a market approach using third-party pricing services, which have been corroborated with data from active markets or broker quotes. Derivatives in Level 3 use the same approach, but will also utilize unobservable pricing inputs that are significant to overall value.
Basis Swap Contracts
In addition to the commodity derivatives described above, at December 31, 2024, we had natural gas basis swap contracts which lock in the differential between NYMEX and certain of our physical pricing points in Appalachia. These contracts settle monthly through December 2028 and include a total volume of 266,640,000 Mmbtu. The fair value of these contracts, which utilizes Level 2 inputs, was a net derivative liability of $29.2 million as of December 31, 2024.
Derivative Assets and Liabilities
The combined fair value of derivatives included in the accompanying consolidated balance sheets as of December 31, 2024 and 2023 is summarized below (in thousands). The assets and liabilities are netted where derivatives with both gain and loss positions are held by a single counterparty and we have master netting arrangements.
| | | | | | | | |
| December 31,
2024 | | | December 31,
2023 | | |
Derivative assets: | | | | | | |
Gross amounts of recognized assets | $ | 112,359 | | | $ | 452,378 | | |
Gross amounts offset in the consolidated balance sheets | | (25,261 | ) | | | (9,407 | ) | |
Net amounts of assets presented in the consolidated balance sheets | $ | 87,098 | | | $ | 442,971 | | |
| | | | | | | |
| December 31,
2024 | | | December 31,
2023 | |
Derivative (liabilities): | | | | | |
Gross amounts of recognized (liabilities) | $ | (45,383 | ) | | $ | (9,736 | ) |
Gross amounts offset in the consolidated balance sheets | | 25,261 | | | | 9,407 | |
Net amounts of (liabilities) presented in the consolidated balance sheets | $ | (20,122 | ) | | $ | (329 | ) |
Derivative Fair Value Income
The effects of our derivatives on our consolidated statements of income for the last three years are summarized below (in thousands):
| | | | | | | | | | | |
| Year Ended
December 31, | |
| 2024 | | | 2023 | | | 2022 | |
| | | | | | | | |
Natural gas derivatives | $ | 54,732 | | | $ | 814,113 | | | $ | (1,122,332 | ) |
NGLs derivatives | | 3,744 | | | | — | | | | (9,318 | ) |
Oil derivatives | | (1,750 | ) | | | 12,121 | | | | (67,763 | ) |
Freight | | — | | | | — | | | | (33 | ) |
Divestiture contingent consideration | | — | | | | (5,080 | ) | | | 10,940 | |
Total derivative fair value income (loss) | $ | 56,726 | | | $ | 821,154 | | | $ | (1,188,506 | ) |
(9) Fair Value Measurements
We use a market approach for our recurring fair value measurements and endeavor to use the best information available. Accordingly, valuation techniques that maximize the use of observable inputs are favored. As of December 31, 2024, a portion of our natural gas instruments contain swaptions (Level 3 inputs) where the counterparty has the right, but not the obligation, to enter into a fixed price swap on a pre-determined date. If exercised, the swaption contract becomes a swap treated consistently with our fixed-price swaps. At December 31, 2024, we used a weighted average implied volatility of 24% for our swaptions. The following is a reconciliation of the beginning and ending balances for derivative instruments classified as Level 3 in the fair value hierarchy (in thousands):
| | | |
| Year Ended
December 31, 2024 | |
Balance at December 31, 2023 | $ | (1,161 | ) |
Total gains included in earnings | | — | |
Additions | | (13,240 | ) |
Settlements | | 1,161 | |
Balance at December 31, 2024 | $ | (13,240 | ) |
The following table presents the carrying amounts and the fair values of our financial instruments as of December 31, 2024 and 2023 (in thousands):
| | | | | | | | | | | | | | | |
| December 31, 2024 | | | December 31, 2023 | |
| Carrying
Value | | | Fair
Value | | | Carrying
Value | | | Fair
Value | |
Assets: | | | | | | | | | | | |
Commodity derivatives (a) | $ | 87,098 | | | $ | 87,098 | | | $ | 442,971 | | | $ | 442,971 | |
Marketable securities (b) | | 60,989 | | | | 60,989 | | | | 71,989 | | | | 71,989 | |
(Liabilities): | | | | | | | | | | | |
Commodity derivatives (a) | | (20,122 | ) | | | (20,122 | ) | | | (329 | ) | | | (329 | ) |
Bank credit facility (c) | | — | | | | — | | | | — | | | | — | |
4.875% senior notes due 2025 (c) | | (608,702 | ) | | | (607,363 | ) | | | (688,388 | ) | | | (679,363 | ) |
8.25% senior notes due 2029 (c) | | (600,000 | ) | | | (618,114 | ) | | | (600,000 | ) | | | (624,816 | ) |
4.75% senior notes due 2030 (c) | | (500,000 | ) | | | (469,285 | ) | | | (500,000 | ) | | | (463,085 | ) |
Deferred compensation plan (d) | | (86,882 | ) | | | (86,882 | ) | | | (117,125 | ) | | | (117,125 | ) |
(a) Fair values for commodity derivatives utilize Level 2 inputs with the exception of swaptions, which utilize Level 3 inputs. Fair value of swaption contracts as of December 31, 2024 was a net derivative liability of $13.2 million.
(b) Marketable securities, which are held in our deferred compensation plans, are actively traded on major exchanges, which is a Level 1 input.
(c) The book value of our bank debt approximates fair value because of its floating rate structure. The fair value of our senior notes is based on end of period market quotes. Debt is presented on the balance sheet at carrying value.
(d) The fair value of our deferred compensation plan is updated to the closing price on the balance sheet date, which is a Level 1 input.
Our current assets and liabilities contain financial instruments, the most significant of which are trade accounts receivables and payables. We believe the carrying values of our current assets and liabilities approximate fair value. Our fair value assessment incorporates a variety of considerations, including (1) the short-term duration of the instruments and (2) our historical incurrence of and expected future insignificance of bad debt expense. Non-financial liabilities initially measured at fair value include asset retirement obligations, operating lease liabilities and the divestiture contract obligation that we incurred in conjunction with the sale of our North Louisiana assets. See Note 8 for information regarding the fair value of derivative instruments and Note 10 for information regarding the fair value of stock-based compensation awards.
(10) Stock-Based Compensation Plans
Description of the Plans
We have two active equity-based stock compensation plans, our Amended and Restated 2005 Equity-Based Compensation Plan and the Amended and Restated 2019 Equity-Based Compensation Plan. Under these plans, various awards may be issued to non-employee directors and employees pursuant to decisions of the Compensation Committee, which is composed of only non-employee, independent directors. We currently award time-based and performance-based stock awards.
Time-Based Stock Awards
We grant time-based restricted stock awards to employees and non-employee directors. These awards generally vest ratably over a three-year period or at the end of the three-year period for certain employees. The vesting of these awards are typically contingent on the recipient’s continued employment with us. Awards made to non-employee directors vest at the end of a one-year period and the vesting is typically contingent on the recipient's continued service as a non-employee director.
These time-based stock awards can have two different types of accounting treatment, depending on whether they are placed into our deferred compensation plan (see further discussion below on the deferred compensation plan). Restricted stock awards that are placed into the deferred compensation plan upon grant are referred to as Liability Awards. Upon vesting, withdrawals are allowed in either cash or stock. Restricted stock awards that are accounted for using equity-classified award accounting are referred to as Equity Awards. Upon vesting, these awards will settle in stock only.
Awards granted to employees are accounted for using equity-classified award accounting, as these awards are not placed into the deferred compensation plan. Prior to 2023, employee executives (VPs and above) were awarded time-based awards that were contributed to the deferred compensation plan and were accounted for using liability-classified award accounting. Subsequent annual grants made to employee executives were not contributed to the deferred compensation plan and were accounted for using equity-classified award accounting. Directors can elect to contribute their time-based stock awards to the deferred compensation plan at the time of grant. Awards that are elected to be contributed to the deferred compensation plan are accounted for using liability-classified
award accounting.
Equity Awards. Equity Awards are expensed ratably over the service period associated with the award based on the fair value of the awards. The grant date fair value of all Equity Awards is based on prevailing market prices on the date of grant. Equity Awards made to employee executives typically earn dividends prior to vesting that are payable in cash upon vesting. These dividends are forfeited and not paid if the associated shares do not vest.
We recorded compensation expense for the restricted stock Equity Awards of $34.9 million in the year ended December 31, 2024 compared to $31.6 million in 2023 and $21.0 million in 2022. The vesting date fair value of restricted stock Equity Awards which vested during 2024, 2023 and 2022 was $35.7 million, $31.9 million and $20.3 million, respectively. As of December 31, 2024, there was $34.4 million of unrecognized compensation related to restricted stock Equity Awards expected to be recognized over a weighted average period of 1.7 years. These awards are not issued until such time as they are vested and the grantees do not have the option to receive cash.
Liability Awards. Liability Awards are recognized ratably over the service period associated with the award based on the fair value of the awards on the date of grant. The grant date fair value of Liability Awards is based on prevailing market prices at the time of the grant. Prior to vesting, restricted stock Liability Awards recipients have the right to receive dividends thereon. These restricted stock Liability Awards are classified as a liability and are re-measured at fair value each reporting period. This mark-to-market amount is reported in deferred compensation plan expense in the accompanying consolidated statements of income (see additional discussion below).
We recorded compensation expense for these outstanding restricted stock Liability Awards of $1.4 million in the year ended December 31, 2024 compared to $4.0 million in 2023 and $13.6 million in 2022. The vesting date fair value of these restricted stock Liability Awards vested during 2024, 2023 and 2022 was $2.1 million, $4.3 million and $13.2 million, respectively. As of December 31, 2024, there was $228,000 of unrecognized compensation related to restricted stock Liability Awards expected to be recognized over a weighted average period of less than one year.
Performance-Based Stock Awards
We have granted two types of performance share awards ("performance units"): one based on performance conditions measured against internal performance metrics and one based on market conditions measured related to Range’s performance relative to a predetermined peer group ("TSR Awards"). These awards typically vest at the end of the three-year performance period.
Each unit granted represents one share of our common stock. These units are settled in stock and the amount of the payout is based on the vesting percentage, which can range from zero to 200%, and (1) for our internal metric awards, the internal performance metrics achieved, which is determined by the Compensation Committee and (2) for our TSR Awards, the value of our common stock on the performance period ending date compared to our peers. Dividend equivalents accrue during the performance period and are paid in stock at the end of the performance period. The performance period is three years.
Internal Performance Metric Awards. The performance metrics are set by the Compensation Committee. If the performance metric for the applicable period is not met, that portion is considered forfeited and an adjustment to expense recorded.
Internal performance metric awards granted in 2023 and 2022 are earned based on:
•Net debt (total debt less cash on hand balance); and
•GHG emissions intensity.
Range made significant progress towards long-term net debt and GHG emissions intensity targets in 2022 and 2023, so these internal performance metric awards were not utilized in 2024. We recorded compensation expense for the prior grants of these awards of $3.3 million in the year ended December 31, 2024 compared to $2.2 million in the year ended December 31, 2023 and $6.2 million in the year ended December 31, 2022. As of December 31, 2024, there was $780,000 of unrecognized compensation related to these internal performance metric awards to be recognized over a weighted average period of 1.2 years.
TSR awards. These awards are earned, or not earned, based on the comparative performance of Range’s common stock measured against a predetermined group of companies in the peer group over a three-year performance period. The fair value of the TSR awards is estimated on the date of grant using a Monte Carlo simulation model which utilizes multiple input variables that determine the probability of satisfying the market condition stipulated in the award grant and calculates the fair value of the award. The fair value is recognized as stock-based compensation expense over the three-year performance period. Expected volatilities utilized in the model were estimated using a combination of a historical period consistent with the remaining performance period of three years and option implied volatilities. The risk-free interest rate was based on the United States Treasury note rate for a term
commensurate with the life of the grant. The following assumptions were used to estimate the fair value of the TSR awards granted during the years ended December 31, 2024, 2023 and 2022:
| | | | | | | | | | | | |
| | Year Ended December 31, | |
| | 2024 | | | 2023 | | | 2022 | |
Risk-free interest rate | | | 4.1 | % | | | 3.8 | % | | | 1.4 | % |
Expected annual volatility | | | 56 | % | | | 61 | % | | | 68 | % |
Grant date fair value per unit | | $ | 31.84 | | | $ | 30.37 | | | $ | 27.90 | |
In 2024, we granted 254,000 TSR awards as compensation to employees which vest at the end of a three-year period compared to 64,000 in 2023 and 112,000 in 2022. We recorded TSR award compensation expense of $3.9 million in the year ended December 31, 2024 compared to $1.7 million in 2023 and $3.2 million in 2022. As of December 31, 2024, there was $5.4 million of unrecognized compensation related to these TSR awards to be recognized over a weighted average period of 1.9 years.
Total Stock-Based Compensation Expense
Stock-based compensation represents amortization of restricted stock and performance units. The following details the allocation of stock-based compensation to functional expense categories for each of the years in the three-year period ended December 31, 2024 (in thousands):
| | | | | | | | | | | |
| 2024 | | | 2023 | | | 2022 | |
Direct operating expense | $ | 1,922 | | | $ | 1,723 | | | $ | 1,459 | |
Brokered natural gas and marketing expense | | 2,465 | | | | 2,095 | | | | 2,439 | |
Exploration expense | | 1,354 | | | | 1,250 | | | | 1,578 | |
General and administrative expense | | 38,004 | | | | 35,850 | | | | 42,023 | |
Total stock-based compensation expense | $ | 43,745 | | | $ | 40,918 | | | $ | 47,499 | |
The mark-to-market adjustment of the liability related to the vested restricted stock Liability Awards held in our deferred compensation plan is directly tied to the change in our stock price and is not related to functional expenses and, therefore, is not allocated to the functional categories above.
Stock Awards Summary
The following is a summary of the activity for our time-based and performance-based restricted stock awards for the two years ended December 31, 2024 and 2023:
| | | | | | | | | | | | | | | | | | | | | | | |
| Time-Based
Equity Awards | | | Time-Based
Liability Awards | | | Performance-Based
Stock Awards | |
| Shares | | | Weighted
Average Grant
Date Fair Value | | | Shares | | | Weighted
Average Grant
Date Fair Value | | | Number
of Units (a) | | | Weighted
Average Grant
Date Fair Value | |
Outstanding at December 31, 2022 | | 1,736,688 | | | $ | 14.44 | | | | 379,633 | | | $ | 14.71 | | | | 1,950,632 | | | $ | 9.02 | |
Granted | | 1,629,816 | | | | 25.11 | | | | 21,170 | | | | 25.41 | | | | 145,747 | | | | 26.86 | |
Vested | | (1,863,153 | ) | | | 17.10 | | | | (307,687 | ) | | | 14.01 | | | | (1,158,797 | ) | | | 4.80 | |
Forfeited | | (29,546 | ) | | | 17.73 | | | | — | | | | — | | | | — | | | | — | |
Outstanding at December 31, 2023 | | 1,473,805 | | | $ | 22.82 | | | | 93,116 | | | $ | 19.44 | | | | 937,582 | | | $ | 17.01 | |
Granted | | 1,275,533 | | | | 30.41 | | | | 24,186 | | | | 34.14 | | | | 254,195 | | | | 31.84 | |
Vested | | (1,455,086 | ) | | | 24.53 | | | | (98,810 | ) | | | 21.25 | | | | (526,918 | ) | | | 10.99 | |
Forfeited | | (18,290 | ) | | | 29.07 | | | | — | | | | — | | | | — | | | | — | |
Outstanding at December 31, 2024 | | 1,275,962 | | | $ | 28.37 | | | | 18,492 | | | $ | 28.98 | | | | 664,859 | | | $ | 27.45 | |
| | | | | | | | | | | | | | | | | |
| |
(a) | Amounts granted reflect performance units initially granted. The actual payout will be between zero and 200% depending on achievement of either total stockholder return ranking compared to our peers at the vesting date (TSR awards) or on the achievement of internal performance targets (internal performance metric awards). |
In 2024, we recorded an additional tax benefit of an estimated $5.2 million for the tax effect of financial accounting expense compared to the corporate income tax deduction for equity compensation that vested during the year compared to additional tax benefit of $10.6 million in 2023 and additional tax benefit of $7.2 million in 2022.
401(k) Plan
We maintain a 401(k) benefit plan that allows employees to contribute up to 75% of their salary and bonus on an annual basis (subject to Internal Revenue Service limitations) on a pretax basis. We match, dollar for dollar, in cash up to 6% of each participant's contribution and vesting of those contributions is immediate. In 2024, we contributed $5.5 million to the 401(k) Plan compared to $5.2 million in 2023 and $4.8 million in 2022. Employees have a variety of investment options in the 401(k) benefit plan including investing in Range stock.
Deferred Compensation Plan
Our deferred compensation plan gives directors, officers and key employees the ability to defer all or a portion of their salaries and bonuses and invest in Range common stock (as described above under Liability Awards) or make other investments at the individual’s discretion. Range provides a partial matching contribution which vests at the end of three years and can be made in either cash or stock. Any stock contributed through the salary or bonus deferral match are treated as Liability Awards as described above. The assets of the plans are held in trading securities or as stock in a grantor trust, which we refer to as the Rabbi Trust, and are therefore available to satisfy the claims of our creditors in the event of bankruptcy or insolvency.
Our trading securities held in the deferred compensation plan are exchange traded and are accounted for using the mark-to-market accounting method valued at fair value each reporting period utilizing Level 1 inputs. They are included in other assets in the accompanying consolidated balance sheets. We elected to adopt the fair value option to simplify our accounting for the investments in our deferred compensation plan. Interest, dividends, and mark-to-market gains or losses are included in deferred compensation plan expense in the accompanying consolidated statements of income. For the year ended December 31, 2024, interest and dividends were $1.3 million and mark-to-market was a gain of $4.5 million. For the year ended December 31, 2023, interest and dividends were $1.6 million and mark-to-market was a gain of $7.8 million. For the year ended December 31, 2022, interest and dividends were $1.1 million and mark-to-market was a loss of $14.2 million.
Our stock held in the Rabbi Trust is treated as a liability award as employees are allowed to take withdrawals from the Rabbi Trust either in cash or in Range stock. The liability for the vested portion of the stock held in the Rabbi Trust is reflected in the deferred compensation liability in the accompanying consolidated balance sheets and is adjusted to fair value each reporting period by a charge or credit to deferred compensation plan expense on our consolidated statements of income. We recorded a mark-to-market loss of $9.6 million in 2024 compared to a loss of $26.6 million in 2023 and a loss of $61.9 million in 2022. The Rabbi Trust held 742,000 shares (724,000 vested shares) of Range stock at December 31, 2024 compared to 1.6 million (1.5 million of vested shares) at December 31, 2023 and 5.6 million (5.3 million vested shares) at December 31, 2022. The proceeds received from the sale of stock held in our deferred compensation plan were $20.1 million in 2024 compared to $75.2 million in 2023 and $22.2 million in 2022.
(11) Capital Stock
We have authorized capital stock of 485.0 million shares, which includes 475.0 million shares of common stock and 10.0 million shares of preferred stock. The following is a schedule of changes in the number of common shares outstanding since the beginning of 2023:
| | | | | | | |
| Year Ended December 31, | |
| 2024 | | | 2023 | |
Beginning balance | | 241,040,304 | | | | 238,885,730 | |
Restricted stock grants | | 24,186 | | | | 50,238 | |
Restricted stock units vested | | 1,192,633 | | | | 1,755,345 | |
Performance stock units vested | | 455,317 | | | | 1,057,245 | |
Performance stock dividends | | 6,914 | | | | 6,276 | |
Treasury shares | | (2,050,000 | ) | | | (714,530 | ) |
Ending balance | | 240,669,354 | | | | 241,040,304 | |
Common Stock Dividends
The payment of dividends is subject to the formal declaration by the board of directors. The determination of the amount of future dividends, if any, to be declared and paid is at the sole discretion of the board of directors and will depend on our financial condition, earnings, capital requirements, levels of indebtedness, our future business prospects and other matters our board of directors deems relevant. Our bank credit facility allows for the payment of common dividends, with certain limitations, as described in the facility agreement.
Stock Repurchase Program
In October 2019, the board of directors approved a stock repurchase program which was increased in size in 2022. Under this program, we may repurchase shares of our common stock in open market transactions, from time to time, in accordance with applicable SEC rules and federal securities laws. In 2024, we repurchased 2,050,000 shares at an aggregate value of $65.3 million. As of December 31, 2024, we have approximately $1.0 billion of remaining authorization under this program. The following is a schedule of the change in treasury shares since the beginning of 2023:
| | | | | | | |
| Year Ended December 31, | |
| 2024 | | | 2023 | |
Beginning balance | | 24,716,065 | | | | 24,001,535 | |
Rabbi trust shares distributed/sold | | — | | | | (470 | ) |
Shares repurchased | | 2,050,000 | | | | 715,000 | |
Ending balance | | 26,766,065 | | | | 24,716,065 | |
(12) Supplemental Cash Flow Information
| | | | | | | | | | | |
| Year Ended December 31, | |
| 2024 | | | 2023 | | | 2022 | |
| (in thousands) | |
Net cash provided from operating activities included: | | | | | | | | |
Income taxes paid to taxing authorities | $ | (1,034 | ) | | $ | (2,200 | ) | | $ | (20,335 | ) |
Interest paid | | (113,679 | ) | | | (120,631 | ) | | | (193,732 | ) |
Non-cash investing activities included: | | | | | | | | |
Increase in asset retirement costs capitalized | | 13,845 | | | | 4,616 | | | | 18,096 | |
Increase in accrued capital expenditures | | 24,525 | | | | 4,403 | | | | 1,966 | |
(13) Commitments and Contingencies
Litigation
We are the subject of, or party to, a number of pending or threatened legal actions and administrative proceedings or investigations arising in the ordinary course of our business including, but not limited to, royalty claims, contract claims and environmental claims. While many of these matters involve inherent uncertainty, we believe that the amount of the liability, if any, ultimately incurred with respect to proceedings or claims will not have a material adverse effect on our consolidated financial position as a whole or on our liquidity, capital resources or future annual results of operations.
When deemed necessary, we establish reserves for certain legal proceedings. The establishment of a reserve is based on an estimation process that includes the advice of legal counsel and subjective judgment of management. While management believes these reserves to be adequate, it is reasonably possible we could incur additional losses with respect to those matters in which reserves have been established. We will continue to evaluate our litigation on a quarterly basis and will establish and adjust any litigation reserves as appropriate to reflect our assessment of the then current status of litigation.
We have incurred and will continue to incur capital, operating and remediation expenditures as a result of environmental laws and regulations. As of December 31, 2024 and 2023, liabilities for remediation were not material. We are not aware of any environmental claims existing as of December 31, 2024 that have not been provided for or would otherwise have a material impact on our financial position or results of operations. Environmental liabilities normally involve estimates that are subject to revision until final resolution, settlement or remediation occurs. We believe that substantially all of our competitors must comply with similar environmental laws and regulations.
Obligations Following Divestitures
Certain contractual obligations were retained by us after our divestiture of our North Louisiana assets in 2020. These obligations are primarily related to gathering, processing and transportation agreements including certain minimum volume commitments. For additional information see Note 14.
Lease Commitments
The components of our total lease expense for the two years ended December 31, 2024, the majority of which is included as part of natural gas and oil properties on our consolidated balance sheets, are as follows (in thousands):
| | | | | | | |
| Year Ended December 31, | |
| 2024 | | | 2023 | |
Operating lease cost | $ | 90,170 | | | $ | 70,781 | |
Variable lease expense (1) | | 8,942 | | | | 25,529 | |
Short-term lease expense (2) | | 649 | | | | 708 | |
Sublease income | | (103 | ) | | | — | |
Total lease expense | $ | 99,658 | | | $ | 97,018 | |
| | | | | |
Short-term lease costs (3) | $ | 10,478 | | | $ | 14,032 | |
| |
(1) | Variable lease payments that are not dependent on an index or rate and are not included in the lease liability or ROU assets. |
(2) | Short-term lease expense represents expense related to leases with a contract term of one year or less and are not included in our ROU assets or lease liability in our consolidated balance sheets. |
(3) | These short-term lease costs are related to leases with a contract term of one year or less, the majority of which are related to drilling rigs which are capitalized as part of natural gas and oil properties on our consolidated balance sheets and may fluctuate based on the number of drilling rigs being utilized. |
Supplemental cash flow information related to our operating leases is included in the table below (in thousands):
| | | | | | | |
| Year Ended December 31, | |
| 2024 | | | 2023 | |
Cash paid for amounts included in the measurement of lease liabilities | $ | 93,137 | | | $ | 71,669 | |
ROU assets added in exchange for lease obligations | $ | 180,342 | | | $ | 7,421 | |
Our weighted average remaining lease term and weighted average discount rate for our operating leases are as follows:
| | | |
| Year Ended December 31, |
| 2024 | | 2023 |
Weighted average remaining lease term | 3.7 years | | 2.9 years |
Weighted average discount rate | 6% | | 7% |
Our lease liabilities with enforceable contract terms that are greater than one year mature as follows (in thousands):
| | | |
| Operating
Leases | |
2025 | $ | 91,776 | |
2026 | | 7,540 | |
2027 | | 6,141 | |
2028 | | 3,241 | |
2029 | | 3,291 | |
Thereafter | | 25,122 | |
Total lease payments | | 137,111 | |
Less effects of discounting | | (14,236 | ) |
Total lease liability | $ | 122,875 | |
Transportation, Gathering and Processing Contracts
We have entered into firm transportation and gathering contracts with various pipeline carriers for the future transportation and gathering of natural gas, NGLs and oil production. Under these contracts, we are obligated to transport or gather minimum daily natural gas volumes or pay for any deficiencies at a specified reservation fee rate. Our production committed to these pipelines is currently expected to exceed the minimum daily volumes provided in the contracts. However, if in the future we fail to deliver the committed volumes, we would recognize a deficiency payment in the period in which the under-delivery takes place and the related liability has been incurred. In the information below we have not considered any potential future renewals, although at times we will renew these agreements. As of December 31, 2024, future minimum transportation and gathering fees under our commitments are as follows (in thousands):
| | | |
| Transportation
and Gathering
Contracts (a) | |
2025 | $ | 835,018 | |
2026 | | 815,463 | |
2027 | | 794,968 | |
2028 | | 777,578 | |
2029 | | 668,391 | |
Thereafter | | 2,691,096 | |
| $ | 6,582,514 | |
| |
(a) | The amounts in this table represent the gross amounts that we are committed to pay; however, we will record in our financial statements our proportionate share of costs based on our working interest which can vary based on volumes produced. |
We have also entered into amendments that are not in the above table, but modify existing contracts and are contingent on additional facility construction which is expected to be complete in 2026. The amendments will expand gathering and processing capacity by 300,000 mcf/day and transportation capacity by 250,000 Mmbtu/day. We will have a contingent related commitment for the de-ethanization capacity associated with this processing expansion. Beginning on the in-service date this capacity will total 40,000 bbl/day, increasing by 5,000 bbls/day after one year of service, and continues through the end of the agreement. We also entered into a new contract for propane export terminal capacity that is contingent on the construction of the relevant facilities and is expected to be in service in 2026. This capacity will be 10,000 bbls/day for the first year and increases to 20,000 bbls/day for the remainder of the term.
Delivery Commitments
We have various volume delivery commitments that we expect to be able to fulfill from our own production; however, we may purchase third-party volumes to satisfy our commitments or pay demand fees for commitment shortfalls, should they occur. In the information below we have not considered any potential future renewals, although at times we will renew these agreements. As of December 31, 2024, our delivery commitments through 2037 were as follows:
| | | | |
Year Ending December 31, | | Natural Gas
(Mmbtu per day) | | Ethane and Propane
(bbls per day) |
2025 | | 338,123 | | 50,000 |
2026 | | 243,739 | | 50,000 |
2027 | | 108,630 | | 46,233 |
2028 | | 100,000 | | 45,000 |
2029 | | 100,000 | | 33,444 |
2030 | | — | | 30,000 |
2031 | | — | | 16,575 |
2032 | | — | | 10,000 |
2033-2037 | | — | | 10,000 (each year) |
Other
We have lease acreage that is generally subject to expiration if initial wells are not drilled within a specified period, generally between three and five years. We do not expect to lose significant lease acreage because of failure to drill due to inadequate capital, equipment or personnel. However, based on our evaluation of prospective economics, including the cost of infrastructure to connect production, we have allowed acreage to expire and will allow additional acreage to expire in the future. To date, our expenditures to comply with environmental or safety regulations have not been a significant component of our cost structure and are not expected to
be significant in the future. However, new regulations, enforcement policies, claims for damages or other events could result in significant future costs. We also regularly provide letters of credit in the normal course of business under certain contracts that may be drawn if we fail to perform under those contracts.
(14) Exit Costs
In August 2020, we sold our North Louisiana assets and retained certain gathering, transportation and processing obligations which extend into 2030. These are contracts where we will not realize any future benefit. The estimated obligations are included in current and long-term divestiture contract obligation in our consolidated balance sheets. In the year ended December 31, 2024, we recorded accretion expense of $39.2 million compared to $41.9 million in 2023 and $43.6 million in 2022. In 2024, we recorded a net adjustment of $2.1 million to decrease the obligation mainly due to a decrease in forecasted electricity costs. In 2023, we recorded net adjustments of $57.7 million to increase this obligation primarily for higher rates due to inflation and to increase the obligation for a change to our forecasted drilling plans of the buyer. The present value of our estimated obligations related to these assets was initially recorded in 2020 as an exit cost at a total of $479.8 million. There are inherent uncertainties surrounding the retained obligation and, as a result, the determination of the accrued obligation required judgment and estimation. The actual settlement amount and timing may differ from our estimates. The estimated discounted value for this divestiture contract obligation was $344.3 million at December 31, 2024, of which $87.0 million is classified as short-term.
In second quarter 2020, we negotiated capacity releases on certain transportation pipelines in Pennsylvania effective May 31, 2020 and extending through the remainder of the contract. As a result of these releases, we recorded exit costs of $10.4 million in 2020 which represented the discounted present value of our remaining obligations to the third party. As of December 31, 2024, this obligation is complete and has no remaining carrying value.
The following summarizes our exit costs for the three years ended December 31, 2024, 2023 and 2022 (in thousands):
| | | | | | | | | | | |
| Year Ended December 31, | |
| 2024 | | | 2023 | | | 2022 | |
Transportation contract capacity releases | | 126 | | | $ | 345 | | | $ | 579 | |
Divestiture contract obligation | | 37,088 | | | | 99,595 | | | | 69,758 | |
Total exit costs | $ | 37,214 | | | $ | 99,940 | | | $ | 70,337 | |
The following details the accrued exit cost liability activity for the years ended December 31, 2024 and 2023 (in thousands):
| | | | | | | |
| Exit Costs | |
| Louisiana | | | Pennsylvania Pipeline | |
Balance at December 31, 2022 | $ | 390,620 | | | $ | 5,060 | |
Accretion of discount | | 41,860 | | | | 345 | |
Changes in estimate | | 57,735 | | | | — | |
Payments | | (92,766 | ) | | | (2,865 | ) |
Balance at December 31, 2023 | | 397,449 | | | | 2,540 | |
Accretion of discount | | 39,185 | | | | 126 | |
Changes in estimate | | (2,097 | ) | | | — | |
Payments | | (90,229 | ) | | | (2,666 | ) |
Balance at December 31, 2024 | $ | 344,308 | | | $ | — | |
As of December 31, 2024, our estimated settlement of the remaining divestiture contract obligation based on a discounted value is as follows (in thousands):
| | | |
| Divestiture
Contract
Obligation | |
2025 | $ | 86,991 | |
2026 | | 68,458 | |
2027 | | 58,781 | |
2028 | | 53,756 | |
2029 | | 48,814 | |
Thereafter | | 27,508 | |
| $ | 344,308 | |
(15) Suspended Exploratory Well Costs
We capitalize exploratory well costs until a determination is made that the well has either found proved reserves or that it is impaired. Capitalized exploratory well costs are presented in natural gas and oil properties in the accompanying consolidated balance sheets. If an exploratory well is determined to be impaired, the well costs are charged to exploration expense in the accompanying consolidated statements of income. There were no capitalized exploratory well costs in 2022 or 2023. The following table reflects the changes in capitalized exploratory well costs for the year ended December 31, 2024 (in thousands):
| | | | |
| | Year Ended
December 31, 2024 | |
| | | |
Balance at beginning of period | | $ | — | |
Additions to capitalized exploratory well costs pending the determination of proved reserves | | | 12,569 | |
Reclassifications to wells, facilities and equipment based on determination of proved reserves | | | — | |
Capitalized exploratory well costs, charged to expense | | | — | |
Balance at end of period | | $ | 12,569 | |
Less exploratory well costs that have been capitalized for a period of one year or less | | $ | 12,569 | |
Capitalized exploratory well costs that have been capitalized for a period greater than one year | | $ | — | |
(16) Supplemental Information on Natural Gas and Oil Exploration, Development and Production Activities (Unaudited)
Our natural gas and oil producing activities are conducted onshore within the continental United States and all of our proved reserves are located within the United States.
Capitalized Costs and Accumulated Depreciation, Depletion and Amortization (a)
| | | | | | | | | | | |
| December 31, | |
| 2024 | | | 2023 | | | 2022 | |
| (in thousands) | |
Natural gas and oil properties: | | | | | | | | |
Properties subject to depletion | $ | 11,058,771 | | | $ | 10,435,611 | | | $ | 9,855,287 | |
Unproved properties | | 819,656 | | | | 789,871 | | | | 800,592 | |
Total | | 11,878,427 | | | | 11,225,482 | | | | 10,655,879 | |
Accumulated depreciation, depletion and amortization | | (5,456,727 | ) | | | (5,107,801 | ) | | | (4,765,475 | ) |
Net capitalized costs | $ | 6,421,700 | | | $ | 6,117,681 | | | $ | 5,890,404 | |
| |
(a) | Includes capitalized asset retirement costs and the associated accumulated amortization. |
Costs Incurred for Property Acquisition, Exploration and Development (a)
| | | | | | | | | | | |
| December 31, | |
| 2024 | | | 2023 | | | 2022 | |
| (in thousands) | |
Acquisitions: | | | | | | | | |
Acreage purchases | $ | 57,869 | | | $ | 40,067 | | | $ | 28,735 | |
Development | | 577,093 | | | | 568,484 | | | | 460,668 | |
Exploration: | | | | | | | | |
Drilling | | 12,569 | | | | — | | | | — | |
Expense | | 25,489 | | | | 25,280 | | | | 25,194 | |
Stock-based compensation expense | | 1,354 | | | | 1,250 | | | | 1,578 | |
Gas gathering facilities: | | | | | | | | |
Development | | 4,336 | | | | 3,123 | | | | 1,466 | |
Subtotal | | 678,710 | | | | 638,204 | | | | 517,641 | |
Asset retirement obligations | | 13,845 | | | | 4,616 | | | | 18,096 | |
Total costs incurred | $ | 692,555 | | | $ | 642,820 | | | $ | 535,737 | |
| |
(a) | Includes cost incurred whether capitalized or expensed. |
Reserves Audit
All reserve information in this report is based on estimates prepared by our petroleum engineering staff. At year-end 2024, Netherland, Sewell & Associates, Inc., an independent petroleum consultant, conducted an audit of our 2024 reserves in Appalachia. These engineers were selected for their geographic expertise and their historical experience in engineering certain properties. The proved reserve audits performed for 2024, 2023 and 2022, in the aggregate, represented 96% for each of the three years. The reserve audits performed for 2024, 2023 and 2022, in the aggregate, represented 99%, 99% and 96%, respectively, of our 2024, 2023, and 2022 associated pre-tax present value of proved reserves discounted at ten percent. A copy of the reserve summary report prepared by the independent petroleum consultant is included as an exhibit to this Annual Report on Form 10-K. The technical person at our independent petroleum consulting firm responsible for reviewing the reserves estimates presented herein meets the requirements regarding qualifications, independence, objectivity and confidentiality set forth in the Standards Pertaining to the Estimating and Auditing of Oil and Gas Reserves Information promulgated by the Society of Petroleum Engineers. We maintain an internal staff of petroleum engineers and geoscience professionals who work closely with our independent petroleum consultant to ensure the integrity, accuracy and timeliness of data furnished during the reserves audit process. Throughout the year, our technical team meets periodically with representatives of our independent petroleum consultant to review properties and discuss methods and assumptions. While we have no formal committee specifically designated to review reserves reporting and the reserves estimation process, our senior management reviews and approves any significant changes to our proved reserves. Additionally, on an annual basis the board of directors approves the development plan. We provide historical information to our consultant for our largest producing properties such as ownership interest, natural gas, NGLs and oil production, well test data, commodity prices and operating and development costs. The consultants perform an independent analysis and differences are reviewed with our Senior Vice President of Reservoir Engineering and Economics. In some cases, additional meetings are held to review identified reserve differences. The reserve auditor estimates of proved reserves and the pretax present value of such reserves discounted at 10% did not differ from our estimates by more than 10% in the aggregate. However, when compared lease-by-lease, field-by-field or area-by-area, some of our estimates may be greater and some may be less than the estimates of our reserve auditor. When such differences do not exceed 10% in the aggregate, our reserve auditor is satisfied that the proved reserves and pretax present value of such reserves discounted at 10% are reasonable and will issue an unqualified opinion. Remaining differences are not resolved due to the limited cost benefit of continuing such analysis.
Historical variances between our reserve estimates and the aggregate estimates of our independent petroleum consultants have been approximately 5%. All of our reserve estimates are reviewed and approved by our Senior Vice President of Reservoir Engineering and Economics, who reports directly to our President and Chief Executive Officer. Mr. Alan Farquharson, our Senior Vice President of Reservoir Engineering and Economics, holds a Bachelor of Science degree in Electrical Engineering from the Pennsylvania State University. Before joining Range, he held various technical and managerial positions with Amoco, Hunt Oil and Union Pacific Resources and has more than forty years of engineering experience in the oil and gas industry. During the year, our reserves group may also perform separate, detailed technical reviews of reserve estimates for significant acquisitions or for properties with problematic indicators such as excessively long lives, sudden changes in performance or changes in economic or operating conditions.
Estimated Quantities of Proved Natural Gas, NGLs and Oil Reserves
Reserves of natural gas, NGLs, and oil are estimated by our petroleum engineering staff and are adjusted to reflect contractual arrangements and royalty rates in effect at the end of each year. Many assumptions and judgmental decisions are required to estimate reserves. Reported quantities are subject to future revisions, some of which may be substantial, as additional information becomes available from reservoir performance, new geological and geophysical data, additional drilling, technological advancements, price changes, production taxes and other economic factors.
The SEC defines proved reserves as those volumes of natural gas, NGLs, and oil that geological and engineering data demonstrate with reasonable certainty are recoverable in future years from known reservoirs under existing economic and operating conditions. The term "reasonable certainty" implies a high degree of confidence that the quantities of natural gas, NGLs and oil actually recovered will equal or exceed the estimate. To achieve reasonable certainty, our internal technical staff employs technologies that have been demonstrated to yield results with consistency and repeatability. The technologies and economic data used in the estimation of our proved reserves include, but are not limited to, empirical evidence through drilling results and well performance, decline curve analysis, well logs, geologic maps and available downhole and production data, seismic data, well test data, reservoir simulation modeling and implementation and application of enhanced data analytics.
Proved developed reserves are those proved reserves which can be expected to be recovered from existing wells with existing equipment and operating methods. Proved undeveloped reserves are volumes expected to be recovered from new wells on undrilled acreage or from existing wells where a relatively major expenditure is required for recompletion. Reserves on undrilled acreage shall be limited to those drilling units offsetting productive units that are reasonably certain of production when drilled. Proved reserves for other undrilled units can be claimed only where it can be demonstrated with certainty that there is continuity of production from the existing productive formation. Proved undeveloped reserves can only be assigned to acreage for which improved recovery technology is contemplated when such techniques have been proven effective by actual tests in the area and in the same reservoir. Undrilled
locations can be classified as having undeveloped reserves only if a development plan has been adopted indicating each location is scheduled to be drilled within five years from the date it was booked as proved reserves, unless specific circumstances justify a longer time.
The reported value of proved reserves is not necessarily indicative of either fair market value or present value of future net cash flows because prices, costs and governmental policies do not remain static, appropriate discount rates may vary, and extensive judgment is required to estimate the timing of production. Other logical assumptions would likely have resulted in significantly different amounts.
We produce NGLs as part of the processing of our natural gas. The extraction of NGLs in the processing of natural gas reduces the volume of natural gas available for sale. At December 31, 2024, NGLs represented approximately 35% of our total proved reserves on an mcf equivalent basis. NGLs are products priced by the gallon (and sold by the barrel) to our customers. In reporting proved reserves and production of NGLs, we have included production and reserves in barrels. Prices for a barrel of NGLs in 2024 averaged approximately 34% of the average price for equivalent volumes of oil. We report all production information related to natural gas net of the effect of any reduction in natural gas volumes resulting from the processing of NGLs. We currently include ethane in our proved reserves which match volumes to be delivered under our existing long-term, extendable ethane contracts.
The average realized prices used at December 31, 2024 to estimate reserve information were $63.39 per barrel of oil, $24.40 per barrel of NGLs and $1.74 per mcf for gas using a benchmark (NYMEX) of $74.88 per barrel and $2.13 per Mmbtu. The average realized prices used at December 31, 2023 to estimate reserve information were $68.32 per barrel of oil, $24.91 per barrel of NGLs and $2.20 per mcf for gas using a benchmark of $78.10 per barrel and $2.62 per Mmbtu. The average realized prices used at December 31, 2022 to estimate reserve information were $87.14 per barrel of oil, $38.35 per barrel of NGLs and $6.08 per mcf for gas using a benchmark of $94.13 per barrel and $6.36 per Mmbtu.
| | | | | | | | | | | | | | | |
| Natural Gas | | | NGLs | | | Oil | | | Natural
Gas
Equivalents | |
| (Mmcf) | | | (Mbbls) | | | (Mbbls) | | | (Mmcfe) (a) | |
Proved developed and undeveloped reserves: | | | | | | | | | | | |
Balance, December 31, 2021 | | 11,452,081 | | | | 1,001,305 | | | | 52,596 | | | | 17,775,484 | |
Revisions | | (393,165 | ) | | | (20,251 | ) | | | (12,885 | ) | | | (591,983 | ) |
Extensions, discoveries and additions | | 1,278,499 | | | | 59,296 | | | | 5,661 | | | | 1,668,244 | |
Production | | (539,443 | ) | | | (36,392 | ) | | | (2,716 | ) | | | (774,089 | ) |
Balance, December 31, 2022 | | 11,797,972 | | | | 1,003,958 | | | | 42,656 | | | | 18,077,656 | |
Revisions | | 326,783 | | | | 44,515 | | | | 2,485 | | | | 608,784 | |
Extensions, discoveries and additions | | 24,078 | | | | 30,234 | | | | 296 | | | | 207,260 | |
Production | | (538,085 | ) | | | (37,940 | ) | | | (2,475 | ) | | | (780,575 | ) |
Balance, December 31, 2023 | | 11,610,748 | | | | 1,040,767 | | | | 42,962 | | | | 18,113,125 | |
Revisions | | 17,299 | | | | 16,530 | | | | (6,785 | ) | | | 75,765 | |
Extensions, discoveries and additions | | 578,660 | | | | 25,659 | | | | 2,792 | | | | 749,362 | |
Property sales | | (10,542 | ) | | | — | | | | — | | | | (10,542 | ) |
Production | | (545,416 | ) | | | (39,623 | ) | | | (2,181 | ) | | | (796,235 | ) |
Balance, December 31, 2024 | | 11,650,749 | | | | 1,043,333 | | | | 36,788 | | | | 18,131,475 | |
Proved developed reserves: | | | | | | | | | | | |
December 31, 2021 | | 6,809,849 | | | | 577,507 | | | | 23,833 | | | | 10,417,887 | |
December 31, 2022 | | 7,230,313 | | | | 594,931 | | | | 22,213 | | | | 10,933,180 | |
December 31, 2023 | | 7,631,202 | | | | 629,379 | | | | 21,396 | | | | 11,535,852 | |
December 31, 2024 | | 7,929,452 | | | | 647,430 | | | | 19,460 | | | | 11,930,793 | |
Proved undeveloped reserves: | | | | | | | | | | | |
December 31, 2021 | | 4,642,232 | | | | 423,798 | | | | 28,763 | | | | 7,357,597 | |
December 31, 2022 | | 4,567,659 | | | | 409,027 | | | | 20,443 | | | | 7,144,476 | |
December 31, 2023 | | 3,979,546 | | | | 411,388 | | | | 21,566 | | | | 6,577,273 | |
December 31, 2024 | | 3,721,297 | | | | 395,903 | | | | 17,328 | | | | 6,200,682 | |
| |
(a) | Oil and NGLs volumes are converted to mcfe at the rate of one barrel equals six mcf based upon the approximate relative energy content of oil to natural gas, which is not indicative of the relationship between oil and natural gas prices. |
During 2024, revisions of previous estimates of a positive 75.8 Bcfe includes a positive revision of 457.2 Bcfe for previously undeveloped properties reclassified from non-proved properties due to their addition to our five-year development plan and positive performance revisions of 391.4 Bcfe due to improved well performance and longer lateral lengths partially offset by negative pricing revisions of 1.3 Bcfe and 771.5 Bcfe reclassified to unproved for previously planned wells not to be drilled within the original five-year development horizon. We added 749.4 Bcfe of proved reserves from drilling activities and evaluation of proved areas in Pennsylvania. Our ethane reserves are intended to match volumes delivered under our existing long-term, extendable contracts along with meeting pipeline specifications.
During 2023, revisions of previous estimates of a positive 608.8 Bcfe include a positive revision of 280.2 Bcfe for previously proved undeveloped properties reclassified from non-proved properties due to their addition to our five-year development plan and positive performance revisions of 701.4 Bcfe due to improved well performance and longer lateral lengths partially offset by negative pricing revisions of 2.2 Bcfe and 370.6 Bcfe reclassified to unproved for previously planned wells not to be drilled within the original five-year development horizon. We added approximately 207.3 Bcfe of proved reserves from drilling activities and evaluation of proved areas in the Marcellus Shale.
During 2022, we added approximately 1.7 Tcfe of proved reserves from drilling activities and evaluation of proved areas in the Marcellus Shale. Approximately 77% of the 2022 reserve additions are attributable to natural gas. Revisions of previous estimates of a negative 592.0 Bcfe included a positive revision of 716.2 Bcfe for previously proved undeveloped properties reclassified from non-proved properties due to their addition to our five-year development plan, positive performance revisions of 72.8 Bcfe and positive pricing revisions of 0.9 Bcfe more than offset by 1,381.9 Bcfe reclassified to unproved for previously planned wells not to be drilled within the original five-year development horizon. These wells were removed due to the out-performance of existing wells which resulted in a higher utilization of in-field gathering capacity and a reallocation of capital due to the drilling of longer laterals on existing locations.
The following details the changes in proved undeveloped reserves for 2024 (Mmcfe):
| | | |
Beginning proved undeveloped reserves at December 31, 2023 | | 6,577,273 | |
Undeveloped reserves transferred to developed | | (998,927 | ) |
Revisions (a) | | (116,052 | ) |
Extension and discoveries | | 738,388 | |
Ending proved undeveloped reserves at December 31, 2024 | | 6,200,682 | |
| |
(a) | Includes 457.2 Bcfe positive revision for previously proved undeveloped properties due to their addition back into our five year development plan along with 183.2 Bcfe of positive revisions due to improved recovery associated with extended lateral lengths and 15.0 Bcfe of revisions due to increased ethane recoveries. These are offset by 771.5 Bcfe of proved undeveloped reserves removed and deferred due to the five-year rule which can be included in our future proved reserves as these locations are added back to our five-year development plan. |
During 2024, we spent $512.1 million on development costs related to proved undeveloped reserves that were transferred to developed reserves. Estimated future development costs of proved undeveloped reserves are projected to be approximately $2.3 billion. As of December 31, 2024, we have no proved undeveloped reserves that have been reported for more than five years from their original date of booking. All of our recorded proved undeveloped drilling locations are scheduled to be drilled within five years of initial disclosure.
Standardized Measure of Discounted Future Net Cash Flows Relating to Proved Oil and Gas Reserves (Unaudited)
The following summarizes the policies we used in the preparation of the accompanying natural gas, NGLs and oil reserve disclosures, standardized measures of discounted future net cash flows from proved natural gas, NGLs and oil reserves and the reconciliations of standardized measures from year to year. The information disclosed is an attempt to present the information in a manner comparable with industry peers.
The information is based on estimates of proved reserves attributable to our interest in natural gas and oil properties as of December 31 of the years presented. These estimates were prepared by our petroleum engineering staff. Proved reserves are estimated quantities of natural gas, NGLs, and oil which geological and engineering data demonstrate with reasonable certainty to be recoverable in future years from known reservoirs under existing economic and operating conditions.
The standardized measure of discounted future net cash flows from production of proved reserves was developed as follows:
1.Estimates are made of quantities of proved reserves and future amounts expected to be produced based on current year-end economic conditions.
2.For the years ended 2024, 2023 and 2022, estimated future cash inflows are calculated by applying a twelve-month average price of natural gas, NGLs and oil relating to our proved reserves to the quantities of those reserves produced in each future year.
3.Future cash flows are reduced by estimated production costs, administrative costs, costs to develop and produce the proved reserves and abandonment costs, all based on current year-end economic conditions. Future income tax expenses are based on current year-end statutory tax rates giving effect to the remaining tax basis in the natural gas, NGLs and oil properties, other deductions, credits and allowances relating to our proved natural gas and oil reserves.
4.The resulting future net cash flows are discounted to present value by applying a discount rate of 10%.
The standardized measure of discounted future net cash flows does not purport, nor should it be interpreted, to present the fair value of our natural gas, NGLs and oil reserves. An estimate of fair value would also take into account, among other things, the recovery of reserves not presently classified as proved, anticipated future changes in prices and costs and a discount factor more representative of the time value of money and the risks inherent in reserve estimates.
The standardized measure of discounted future net cash flows relating to proved natural gas, NGLs, and oil reserves is as follows and excludes cash flows associated with derivatives outstanding at each of the respective reporting dates. Future cash inflows are net of third-party transportation, gathering and compression expense.
| | | | | | | |
| As of December 31, | |
| 2024 | | | 2023 | |
| (in thousands) | |
| | | | | |
Future cash inflows | $ | 48,101,796 | | | $ | 54,389,915 | |
Future costs: | | | | | |
Production | | (30,097,778 | ) | | | (29,663,691 | ) |
Development (a) | | (2,742,638 | ) | | | (2,978,183 | ) |
Future net cash flows before income taxes | | 15,261,380 | | | | 21,748,041 | |
Future income tax expense | | (2,876,562 | ) | | | (4,176,604 | ) |
Total future net cash flows before 10% discount | | 12,384,818 | | | | 17,571,437 | |
10% annual discount | | (7,693,744 | ) | | | (10,732,951 | ) |
Standardized measure of discounted future net cash flows | $ | 4,691,074 | | | $ | 6,838,486 | |
| |
(a) | 2024 includes $413.3 million of undiscounted future asset retirement costs as of December 31, 2024, using current estimates of future abandonment costs. |
The following table summarizes changes in the standardized measure of discounted future net cash flows.
| | | | | | | | | | | |
| December 31, | |
| 2024 | | | 2023 | | | 2022 | |
| (in thousands) | |
Revisions of previous estimates: | | | | | | | | |
Changes in prices and production costs | $ | (2,601,024 | ) | | $ | (23,584,574 | ) | | $ | 14,326,997 | |
Revisions in quantities | | (78,775 | ) | | | (131,078 | ) | | | 109,129 | |
Changes in future development and abandonment costs | | (167,061 | ) | | | (123,529 | ) | | | (524,847 | ) |
Net change in income taxes | | 324,863 | | | | 3,920,556 | | | | (2,625,699 | ) |
Accretion of discount | | 792,623 | | | | 2,955,359 | | | | 1,486,783 | |
Additions to proved reserves from extensions,
discoveries and improved recovery | | 265,917 | | | | 103,116 | | | | 2,842,173 | |
Natural gas, NGLs and oil sales, net of production costs | | (918,980 | ) | | | (1,100,908 | ) | | | (3,550,632 | ) |
Actual development costs incurred during the period | | 598,635 | | | | 574,646 | | | | 471,877 | |
Sales of reserves in place | | (5,265 | ) | | | — | | | | — | |
Changes in timing and other | | (358,345 | ) | | | (320,385 | ) | | | (475,724 | ) |
Net change for the year | | (2,147,412 | ) | | | (17,706,797 | ) | | | 12,060,057 | |
Beginning of year | | 6,838,486 | | | | 24,545,283 | | | | 12,485,226 | |
End of year | $ | 4,691,074 | | | $ | 6,838,486 | | | $ | 24,545,283 | |
ITEM 9. CHANGES IN AND DISAGREEMENTS WITH ACCOUNTANTS ON ACCOUNTING AND FINANCIAL DISCLOSURE
None.
ITEM 9A. CONTROLS AND PROCEDURES
Evaluation of Disclosure Controls and Procedures. As required by Rule 13a-15(b) under the Exchange Act, we have evaluated, under the supervision and with the participation of our management, including our principal executive officer and principal financial officer, the effectiveness of the design and operation of our disclosure controls and procedures (as defined in Rules 13a-15(e) and 15d-15(e) under the Exchange Act) as of the end of the period covered by this Form 10-K. Our disclosure controls and procedures are designed to provide reasonable assurance that information required to be disclosed by us in reports that we file under the Exchange Act is accumulated and communicated to our management, including our principal executive officer and principal financial officer, as appropriate, to allow timely decisions regarding required disclosure and is recorded, processed, summarized and reported within the time periods specified in the rules and forms of the SEC. Based upon the evaluation, our principal executive officer and principal financial officer concluded that our disclosure controls and procedures were effective as of December 31, 2024 at the reasonable assurance level.
Changes in Internal Controls over Financial Reporting. There have been no changes in our system of internal control over financial reporting during the three months ended December 31, 2024 that have materially affected, or are reasonably likely to materially affect, our internal control over financial reporting.
Management’s Annual Report on Internal Control over Financial Reporting. See "Management’s Report on Internal Control over Financial Reporting" and "Report of Independent Registered Public Accounting Firm on Internal Control Over Financial Reporting" which appear on pages F-2 and F-3, respectively, under Item 8. Financial Statements and Supplementary Data.
ITEM 9B. OTHER INFORMATION
During the fourth quarter, no director or officer adopted or terminated a "Rule 10b5-1 trading arrangement" (as defined in Item 408(a) of Regulation S-K) or "non-Rule 10b5-1 trading arrangement" (as defined in Item 408 (c) of Regulation S-K).
ITEM 9C. DISCLOSURE REGARDING FOREIGN JURISDICTIONS THAT PREVENT INSPECTIONS
Not applicable.
PART III
ITEM 10. DIRECTORS, EXECUTIVE OFFICERS AND CORPORATE GOVERNANCE
Information required in response to this item will be set forth in the Range Proxy Statement for the 2025 Annual Meeting of Stockholders to be held in May 2025 and is incorporated herein by reference.
See "Executive Officers of the Registrant" under Item 1 of this Form 10-K for the information about our executive officers.
Code of Ethics
We have adopted a Code of Ethics that applies to our principal executive officer, principal financial officer, principal accounting officer, or persons performing similar functions (as well as our directors and all other employees). A copy is available on our website, www.rangeresources.com, and a copy in print will be provided to any person without charge, upon request. Such requests should be directed to the Corporate Secretary, 100 Throckmorton Street, Suite 1200, Fort Worth, Texas 76102 or by calling (817) 870-2601. We intend to disclose any amendments to or waivers of the Code of Ethics on behalf of our President and Chief Executive Officer, Chief Financial Officer, Controller and persons performing similar functions on our website, under the Corporate Governance caption, or in a report on Form 8-K (Item 5.05), promptly following the date of such amendment or waiver.
Insider Trading Policy
Our Insider Trading Policy governs the purchase, sale and/or other dispositions of our securities by our directors, officers and employees. We believe this policy is reasonably designed to promote compliance with insider trading laws, rules and regulations and the NYSE listing standards applicable to us. A copy of our Insider Trading Policy is incorporated as Exhibit 19.1 to this Annual Report on Form 10-K. The Company is not subject to the Insider Trading Policy. However, the Company does not trade in its securities when it is in possession of material nonpublic information other than pursuant to a previously adopted Rule 10b5-1 trading plan.
ITEM 11. EXECUTIVE COMPENSATION
Information required by this item is incorporated herein by reference to the disclosure made in the Range Proxy Statement for the 2025 Annual Meeting of Stockholders.
ITEM 12. SECURITY OWNERSHIP OF CERTAIN BENEFICIAL OWNERS AND MANAGEMENT AND RELATED STOCKHOLDER MATTERS
Information required by this item is incorporated herein by reference to the disclosure made in the Range Proxy Statement for the 2025 Annual Meeting of Stockholders.
ITEM 13. CERTAIN RELATIONSHIPS AND RELATED TRANSACTIONS AND DIRECTOR INDEPENDENCE
Information required by this item is incorporated herein by reference to the disclosure made in the Range Proxy Statement for the 2025 Annual Meeting of Stockholders.
ITEM 14. PRINCIPAL ACCOUNTANT FEES AND SERVICES
Information required by this item is incorporated herein by reference to the disclosure made in the Range Proxy Statement for the 2025 Annual Meeting of Stockholders.
PART IV
ITEM 15. EXHIBITS AND FINANCIAL STATEMENT SCHEDULES
(a)1. and 2. Financial Statements and Financial Statement Schedules - the financial statements and financial statement schedules listed in the Index to Financial Statements in Item 8 are filed as part of this Form 10-K.
3. Exhibits - the exhibits listed in the accompanying Exhibits Index are filed as part of this Form 10-K.
| | | | | | | | | |
| | | | Incorporated by Reference (File No. 001-12209) |
Exhibit Number |
| Exhibit Description | | Form | | Exhibit | | Filing Date | |
3 | | Articles of Incorporation and Bylaws | | | | | | | |
3.1 |
| Restated Certificate of Incorporation of Range Resources Corporation | | 10-Q | | 3.1.1 | | 5/5/2004 | |
3.2 | | First Amendment to the Restated Certificate of Incorporation | | 10-Q | | 3.1 | | 7/28/2005 | |
3.3 | | Second Amendment to the Restated Certificate of Incorporation | | 10-Q | | 3.1 | | 7/24/2008 | |
3.4 |
| Amended and Restated By-laws of Range Resources Corporation, as amended as of May 15, 2016 | | 8-K | | 3.1 | | 5/19/2016 | |
4 | | Instruments Defining the Rights of Security Holders, Including Indentures, and Description of Registrant's Securities | | | | | | | |
4.1* | | Description of Registrant's Securities | | | | | | | |
4.2 | | Form of 4.875% Senior Notes due 2025 | | 8-K | | 4.1 | | 5/14/2015 | |
4.3 | | Indenture dated May 14, 2015 among Range Resources Corporation, as issuer, the Initial Guarantors (as defined therein) and U.S. Bank National Association, as trustee | | 8-K | | 4.1 | | 5/14/2015 | |
4.4 | | Second Supplemental Indenture, by and among Range Resources Corporation, the guarantors named therein and The Bank of New York Mellon Trust Company, N.A., dated as of August 23, 2016 | | 8-K | | 4.2 | | 8/25/2016 | |
4.5 | | First Supplemental Indenture, by and among Range Resources Corporation, the guarantors named therein and U.S. Bank National Association, dated as of August 23, 2016 | | 8-K | | 4.3 | | 8/25/2016 | |
4.6 | | Form of 8.25% Senior Notes due 2029 | | 8-K | | 4.1 | | 1/8/2021 | |
4.7 | | Indenture dated January 8, 2021 among Range Resources Corporation, as issuer, the Subsidiary Guarantors (as defined therein) as guarantors and U.S. Bank National Association, as trustee | | 8-K | | 4.1 | | 1/8/2021 | |
4.8 | | Form of 4.75% Senior Notes due 2030 | | 8-K | | 4.1 | | 2/1/2022 | |
4.9 | | Indenture dated February 1, 2022, among Range Resources Corporation, as issuer, the Subsidiary Guarantors (as defined therein) as guarantors and U.S. Bank Trust Company National Association, as trustee | | 8-K | | 4.1 | | 2/1/2022 | |
10 | | Material Contracts | | | | | | | |
10.01 | | Seventh Amended and Restated Credit Agreement, dated April 14, 2022, among Range Resources Corporation, as borrower, JPMorgan Chase Bank, N.A., as Administrative Agent and Letter of Credit Issuer or Lender from time-to-time party thereto | | 8-K | | 10.1 | | 4/18/2022 | |
10.02 |
| Amended and Restated Range Resources Corporation 2004 Deferred Compensation Plan for Directors and Select Employees | | 10-K | | 10.02 | | 2/27/2024 | |
10.03 |
| Range Resources Corporation Amended and Restated 2005 Equity-Based Compensation Plan | | 8-K | | 10.1 | | 6/4/2009 | |
| | | | | | | | | |
SIGNATURES
Pursuant to the requirements of Section 13 or 15(d) of the Securities Exchange Act of 1934, the registrant has duly caused this report to be signed on its behalf by the undersigned, thereunto duly authorized.
| | |
RANGE RESOURCES CORPORATION |
By: | /s/ DENNIS L. DEGNER |
|
| Dennis L. Degner |
|
| Chief Executive Officer and President (principal executive officer) |
Dated: February 25, 2025
Pursuant to the requirements of the Securities Exchange Act of 1934, this report has been signed below by the following persons on behalf of the registrant and in the capacity and on the dates indicated.
| | | | |
Signature |
| Capacity |
| Date |
/s/ DENNIS L. DEGNER |
| Chief Executive Officer and President |
| February 25, 2025 |
Dennis L. Degner |
| (principal executive officer) |
| |
/s/ mark s. scucchi |
| Executive Vice President and Chief Financial Officer |
| February 25, 2025 |
Mark S. Scucchi |
| (principal financial officer) |
| |
/s/ ASHLEY S. KAVANAUGH |
| Vice President, Controller and Principal Accounting Officer |
| February 25, 2025 |
Ashley S. Kavanaugh |
| (principal accounting officer) |
| |
/s/ Greg G. maxwell | | Chairman of the Board | | February 25, 2025 |
Greg G. Maxwell | | | | |
/s/ BRENDA A. CLINE | | Director | | February 25, 2025 |
Brenda A. Cline | | | | |
/s/ MARGARET K. DORMAN | | Director |
| February 25, 2025 |
Margaret K. Dorman | | | | |
/s/ James M. Funk |
| Director |
| February 25, 2025 |
James M. Funk |
|
|
| |
/s/ CHARLES G. GRIFFIE | | Director | | February 25, 2025 |
Charles G. Griffie | | | | |
/s/ REGINAL W. SPILLER |
| Director |
| February 25, 2025 |
Reginal W. Spiller |
|
|
|
|