UNITED STATES
SECURITIES AND EXCHANGE COMMISSION
Washington, D.C. 20549
FORM 10-K
(Mark One)
| x | ANNUAL REPORT PURSUANT TO SECTION 13 OR 15(d) OF THE SECURITIES EXCHANGE ACT OF 1934 |
For the Fiscal Year Ended December 31, 2011
OR
| ¨ | TRANSITION REPORT PURSUANT TO SECTION 13 OR 15(d) OF THE SECURITIES EXCHANGE ACT OF 1934 |
For the Transition Period from to
Commission File Number 0-9204
EXCO RESOURCES, INC.
(Exact name of Registrant as specified in its charter)
| | |
| Texas | | 74-1492779 |
(State or other jurisdiction of incorporation or organization) | | (I.R.S. Employer Identification No.) |
| |
12377 Merit Drive, Suite 1700, LB 82 Dallas, Texas | | 75251 |
| (Address of principal executive offices) | | (Zip Code) |
Registrant’s telephone number, including area code: (214) 368-2084
Securities registered pursuant to Section 12(b) of the Act:
| | |
Title of each class | | Name of each exchange on which registered |
| Common Stock, $0.001 par value | | New York Stock Exchange |
Securities registered pursuant to Section 12(g) of the Act:
None
(Title of class)
Indicate by check mark if the registrant is a well-known seasoned issuer, as defined in Rule 405 of the Securities Act. Yes x No ¨
Indicate by check mark if the registrant is not required to file reports pursuant to Section 13 or Section 15(d) of the Act. Yes ¨ No x
Indicate by check mark whether the registrant (1) has filed all reports required to be filed by Section 13 or 15(d) of the Securities Exchange Act of 1934 during the preceding 12 months (or for such shorter period that the registrant was required to file such reports), and (2) has been subject to such filing requirements for the past 90 days. Yes x No ¨
Indicate by check mark whether the registrant has submitted electronically and posted on its corporate website, if any, every Interactive Data File required to be submitted and posted pursuant to Rule 405 of Regulation S-T (§232.405 of this chapter) during the preceding 12 months (or for such shorter period that the registrant is required to submit and post such files). YES x NO ¨
Indicate by check mark if disclosure of delinquent filers pursuant to Item 405 of Regulation S-K is not contained herein, and will not be contained, to the best of registrant’s knowledge, in definitive proxy or information statements incorporated by reference in Part III of this Form 10-K or any amendment to this Form 10-K. ¨
Indicate by check mark whether the registrant is a large accelerated filer, an accelerated filer, a non-accelerated filer, or a smaller reporting company. See the definitions of “large accelerated filer,” “accelerated filer” and “smaller reporting company” in Rule 12b-2 of the Exchange Act. (Check one):
| | | | | | |
| Large accelerated filer | | x | | Accelerated filer | | ¨ |
| | | |
| Non-accelerated filer | | ¨ (Do not check if a smaller reporting company) | | Smaller reporting company | | ¨ |
Indicate by check mark whether the registrant is a shell company (as defined in Rule 12b-2 of the Exchange Act). Yes ¨ No x
As of February 22, 2012, the registrant had 216,702,880 outstanding shares of common stock, par value $.001 per share, which is its only class of common stock. As of the last business day of the registrant’s most recently completed second fiscal quarter, the aggregate market value of the registrant’s common stock held by non-affiliates was $3,474,680,000.
DOCUMENTS INCORPORATED BY REFERENCE
Portions of the registrant’s proxy statement to be furnished to shareholders in connection with its 2012 Annual Meeting of Shareholders are incorporated by reference in Part III, Items 10-14 of this Annual Report on Form 10-K.
TABLE OF CONTENTS
EXCO RESOURCES, INC.
PART I
General
Unless the context requires otherwise, references in this Annual Report on Form 10-K to “EXCO,” “EXCO Resources,” “Company,” “we,” “us,” and “our” are to EXCO Resources, Inc. and its consolidated subsidiaries.
We have provided definitions of terms commonly used in the oil and natural gas industry in the “Glossary of selected oil and natural gas terms” beginning on page 27.
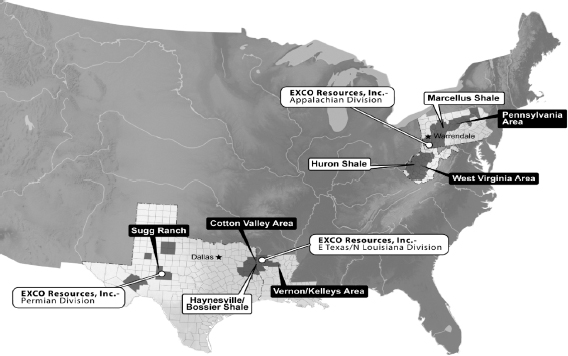
We are an independent oil and natural gas company engaged in the exploration, exploitation, development and production of onshore U.S. oil and natural gas properties with a focus on shale resource plays. Our principal operations are conducted in certain key U.S. oil and natural gas areas including East Texas, North Louisiana, Appalachia and the Permian Basin in West Texas. In addition to our oil and natural gas producing operations, we own 50% interests in two midstream joint ventures located in East Texas/North Louisiana and Appalachia. As of December 31, 2011, our Proved Reserves were approximately 1.3 Tcfe, of which 97.1% were natural gas and 73.9% were Proved Developed Reserves. As of December 31, 2011, the related PV-10 of our Proved Reserves was approximately $1.7 billion, and the Standardized Measure of our Proved Reserves was $1.4 billion (See “Summary of geographic areas of operations” for a reconciliation of PV-10 to Standardized Measure of Proved Reserves). For the year ended December 31, 2011, we produced 182.7 Bcfe of oil and natural gas resulting in a Reserve Life of approximately 7.3 years.
Our business strategy
Our primary strategy is to appraise, develop and exploit our Haynesville, Bossier and Marcellus shale resources, primarily through horizontal drilling, and to leverage our complementary midstream gathering systems and treating facilities to promptly transport our production to multiple market outlets. We continue to develop vertical drilling opportunities in our Permian Basin area as this region has high oil reserves and natural gas with a high liquid content. Our shale resource plays and midstream operations are conducted through four joint ventures with affiliates of BG Group plc, or BG Group. A brief description of each joint venture follows:
| | • | | East Texas/North Louisiana JV |
A joint venture with BG Group covering an undivided 50% interest in a substantial portion of our assets in the East Texas/North Louisiana area including the Haynesville/Bossier shale and conventional shallow producing assets, or the East Texas/North Louisiana JV. The East Texas/North Louisiana JV is governed by a joint development agreement with our subsidiary, EXCO Operating Company, LP, or EXCO Operating, serving as operator. Under the terms of the agreement, BG Group funded 75% of our share of deep drilling and completion costs within our joint venture area up to a total of $400.0 million, or the East Texas/North Louisiana Carry. During the first quarter of 2011, we utilized the balance of the East Texas/North Louisiana Carry.
A joint venture with BG Group in which we each own a 50% interest in TGGT Holdings, LLC, or TGGT, which holds most of our East Texas/North Louisiana midstream assets.
A 50/50 joint venture with BG Group covering our shallow producing assets and Marcellus shale acreage in the Appalachia region, or the Appalachia JV. EXCO and BG Group operate the Appalachia JV operations through a 50% jointly owned operating entity, or OPCO, which holds a 0.5% working interest in all of the shallow conventional assets and the deep rights in the Appalachia JV. Under the terms of the agreement, BG Group agreed to fund 75% of our share of deep drilling and completion costs within our joint venture area up to a total of $150.0 million, or the Appalachia Carry. As of December 31, 2011, the remaining balance of the Appalachia Carry was approximately $54.6 million.
1
| | • | | Appalachia Midstream JV |
A joint venture with BG Group in which we each own a 50% interest in a midstream company, or the Appalachia Midstream JV, which will develop infrastructure and provide take-away capacity in the Marcellus shale.
Our acquisition strategy for the past several years has been focused on the shale resources and consisted primarily of undeveloped acreage acquisitions. We have entered into the manufacturing phase in our core DeSoto Parish, Louisiana area of the Haynesville shale, or DeSoto Parish, and have substantially completed drilling activities to hold our acreage positions in Shelby, Nacogdoches and San Augustine Counties in East Texas, or the Shelby Area. Our Marcellus shale areas of interest have been identified and we have begun a development program in Northeast Pennsylvania. While we expect to continue to seek acquisition opportunities in our Haynesville/Bossier and Marcellus shale areas, we have deployed our business development and technical staff to evaluate opportunities in new areas.
We expect to continue to grow by leveraging our management and technical team’s experience, developing our shale resource plays, exploiting our multi-year inventory of development drilling locations and seeking opportunities outside of our existing operating areas. We employ the use of debt along with a comprehensive derivative financial instrument program to support our strategy. These approaches enhance our ability to execute our business plan over the entire commodity price cycle, protect our returns on investments and manage our capital structure.
Our business plan is summarized below:
| | • | | Manage our liquidity in a low natural gas price environment |
The price of natural gas has a history of volatility and has recently experienced significant declines. Most of our revenues are derived from the sale of natural gas and our interim liquidity is expected to be significantly impacted by these recent price declines. Although our board of directors approved a 2012 capital expenditure budget of $710.0 million in November 2011, we have revised the capital expenditure budget to $470.0 million. We expect the capital expenditure program will be funded primarily by our operating cash flow. In addition, we are evaluating potential transactions which would further enhance our liquidity, including a partial sale of our interest in TGGT, and implementing cost reduction initiatives in operating and administrative costs.
| | • | | Develop our shale resource plays |
We hold significant acreage positions in two prominent shale plays in the United States. In East Texas and North Louisiana we currently hold approximately 64,500 net acres in the Haynesville/Bossier shales and in Appalachia we currently hold approximately 140,200 net acres in the Marcellus shale. Our Haynesville operations began in 2008 when we completed our first horizontal well in the play. Since we commenced our horizontal drilling program in the Haynesville shale, we have spud 333 operated horizontal wells through December 31, 2011, entered into the East Texas/North Louisiana JV, and in 2010, identified our second Haynesville/Bossier development region in the Shelby Area. We also own working interests in 160 Haynesville horizontal wells operated by others. We continue to work closely with our midstream operations to coordinate drilling and completion timing of our wells, which allows us to flow new wells to sales promptly after completion.
We entered into the Appalachia JV in June 2010, covering our holdings in the Appalachia region, including the Marcellus shale resource play. We have used a similar process in the Marcellus region that was used in the Haynesville shale, with principal activities focused on technical evaluations of our acreage holdings, expansion of our technical staff, evaluation of test wells and a disciplined appraisal drilling program. We have identified our initial development area in Northeast Pennsylvania and most of our 2012 activities will be focused in this area.
| | • | | Enhance our midstream assets |
Our midstream companies jointly owned with BG Group in East Texas/North Louisiana and Appalachia enhance our ability to promptly hook-up our wells for delivery after completion.
TGGT’s throughput in 2011 exceeded 1.4 Bcf per day, primarily due to increased throughput volumes in DeSoto Parish and significant throughput growth from the Shelby Area. The strong development activity in the Haynesville area of East Texas/North Louisiana contributed to this increase in throughput for 2011. TGGT expects to complete its major pipeline infrastructure projects in the Shelby Area in early 2012, and its first Shelby Area treating facility is expected to be fully operational by late in the first quarter of 2012. Due to reductions in drilling programs across the
2
Haynesville area, TGGT is reducing certain capital projects and working to increase third party throughput opportunities. However, with the number of wells currently connected into the TGGT system and the projected well connections in 2012, TGGT anticipates stable throughput volumes in 2012 relative to 2011.
The Appalachia Midstream JV capital expansion is expected to be limited in 2012 as our upstream focus will be in Northeast Pennsylvania, where third party gathering infrastructure and facilities are in place.
| | • | | Exploit our multi-year development inventory |
Our prior strategy of acquiring producing properties created a portfolio with a multi-year inventory of shale and conventional drilling locations and exploitation projects. This inventory ranges from low risk infill or development drilling locations, workovers and recompletions to higher risk exploration or appraisal locations. In 2011, we drilled and completed 335 wells with a 98.8% drilling success rate. In our East Texas/North Louisiana area, we plan to selectively drill horizontal wells, implement down spacing of wells, and recomplete existing wells to enhance our production and reserve position. In Appalachia, our focus will be directed toward our development program in Northeast Pennsylvania and a limited appraisal program. We continue to exploit our Permian assets, which have resulted in higher oil production than originally expected. Presently, our natural gas vertical drilling program remains suspended primarily due to low commodity prices. In addition, a substantial portion of our undeveloped acreage in our two shale resource plays is held-by-production which gives us flexibility to delay drilling if prices remain low.
| | • | | Maintain financial flexibility |
We employ the use of debt and equity, joint ventures and a comprehensive derivative financial instrument program to support our business strategy. This approach enhances our ability to execute our business plan over the entire commodity price cycle and protects our returns on investments and capital structure. We have a credit agreement with a $1.6 billion borrowing base, or the EXCO Resources Credit Agreement, with unused borrowing capacity of $431.3 million as of February 22, 2012 (see “Item 7. Management’s Discussion and Analysis of Financial Condition and Results of Operations—Our liquidity, capital resources and capital commitments—Overview”). On September 15, 2010, we closed an underwritten offering of $750.0 million aggregate principal amount of 7.5% senior notes maturing on September 15, 2018, or the 2018 Notes.
We have derivative financial instruments covering approximately 44.6% of our projected 2012 production and plan to add to the portfolio as opportunities arise.
| | • | | Actively manage our asset portfolio and associated costs |
We periodically review our properties to identify cost savings opportunities and divestiture candidates. We actively seek to dispose of properties with higher operating costs, properties that are not within our core geographic operating areas and properties that are not strategic. We also seek to opportunistically divest properties in areas in which acquisitions and investment economics no longer meet our objectives. Our midstream equity investments also provide us with the flexibility to seek third party investors or capital market transactions.
| | • | | Evaluate acquisitions that meet our strategic and financial objectives |
Our emphasis from 2008 through 2010 on shale resource plays shifted our prior acquisition focus from producing properties to opportunistic acreage acquisitions with shale potential. Acreage acquisitions differ from our acquisitions of producing properties as the acreage does not result in immediate production and cash flows or provide an incremental borrowing base increase under our credit agreement. While we expect to continue evaluating acreage opportunities in our shale areas, we have deployed our business development and technical staff to evaluate additional opportunities, including acquisitions of producing properties.
3
Our strengths
We have a number of strengths that we believe will help us successfully execute our strategy.
| | • | | High quality asset base in attractive regions |
We own, and plan to maintain, a geographically diversified reserve base. Our principal operations are in the East Texas/North Louisiana, Appalachia and Permian areas. Our properties are generally characterized by:
| | • | | multi-year inventory of development drilling and exploitation projects; |
| | • | | high drilling success rates; |
| | • | | significant unproved reserves and resources; |
| | • | | exploration opportunities; and |
| | • | | Skilled technical personnel with supplemental support and expertise from BG Group |
We have accumulated a significant number of skilled, multi-disciplined technical and operational personnel who have successfully implemented a significant horizontal drilling program. In addition, our access to BG Group’s personnel in our shale joint ventures complements the execution of our strategies.
We operate a significant portion of our properties, coupled with significant held-by-production acreage, which permits us to manage our operating costs and better control capital expenditures as well as the timing of development and exploitation activities. As of December 31, 2011, we operated 7,872 of our 8,404 gross wells, or wells representing approximately 96.2% of our Proved Developed Reserves.
| | • | | Experienced management team |
Our management team has led both public and private oil and natural gas companies and has an average of over 31 years of industry experience in exploring, acquiring, developing and exploiting oil and natural gas properties. Since acquiring a controlling interest in us in December 1997, the management team has increased our Proved Reserves from approximately 4.7 Bcfe in the beginning of 1998 to approximately 1.3 Tcfe in December 2011.
Plans for 2012
Our initial 2012 capital budget, which was approved by our board of directors in November 2011, was constructed using an average price assumption of $4.00 per Mmbtu, adjusted for differentials. Recent prices for natural gas have fallen to less than $3.00 per Mmbtu and the 12 month NYMEX strip is significantly less than our $4.00 per Mmbtu assumption. As a result, we plan to reduce our drilling program in response to the low natural gas price environment.
Our revised 2012 capital budget is $470.0 million and includes $359.00 million for drilling and completion activities utilizing an average of nine drilling rigs in the Haynesville/Bossier shale, three drilling rigs in the Marcellus shale, primarily in our Northeast Pennsylvania development area and one drilling rig in our Permian region. Approximately 76.0% of the drilling and completion spending will be focused in the Haynesville/Bossier shale, primarily in DeSoto Parish. Our 2012 Marcellus drilling costs also benefit from $54.6 million of unused Appalachia Carry. Following utilization of the Appalachia Carry during 2012, we will be obligated to fund our 50% share of all future activities in this area. The Permian Basin region continues to provide significant rates of return due to the high liquid content of the production. We expect this capital program to be funded primarily with our operating cash flow.
Our significant held-by-production acreage provides us with the ability to dictate the pace of drilling and completing wells. During 2012, we expect to maintain our 2011 average production level and may defer the completion of a portion of our wells drilled in 2012. We continue to address reductions to the costs of drilling and completing our wells through re-negotiating supply contracts. Our management is also focused on reducing our operating and administrative costs. In addition, our derivative financial instrument program is expected to protect a significant percentage of operating cash flow during 2012 as we expect natural gas prices to remain volatile.
As with our upstream capital budget, the management of TGGT has revised their capital expenditure budget as reduced drilling activity will result in a lower level of midstream activity and allow for the deferral of certain capital projects. For 2012, TGGT’s initial capital expenditure budget was between $100.0 and $115.0 million, which has been reduced to approximately $75.0 to
4
$85.0 million. This reduced capital program focuses primarily on completing treating facilities in DeSoto Parish and the Shelby Area. The management of TGGT continues to focus on third party producer opportunities, which may result in an increase to TGGT’s capital budget. TGGT’s cash flows from operations and borrowing capacity under its credit agreement will be sufficient to fund its 2012 capital expenditure programs.
We do not expect to make significant capital contributions in 2012 to our Appalachia Midstream JV as the majority of our Northeastern Pennsylvania development drilling accesses an existing third party gathering system.
We have deployed our business development and technical staff, many of which were critical to the success we have experienced in our shale resource plays, to identify expansion opportunities outside of our existing areas.
Significant 2011 activities
Chief transaction
On January 11, 2011, we closed the acquisition of undeveloped acreage and oil and natural gas properties primarily in the Marcellus shale from Chief Oil & Gas LLC for $454.4 million, or the Chief Transaction, after post-closing title adjustments and customary post-closing purchase price adjustments. BG Group participated in its 50% share for $227.2 million.
Appalachia transaction
On March 1, 2011, we jointly closed the purchase of Marcellus undeveloped shale acreage with BG Group, which also included certain shallow production primarily in Jefferson and Clarion counties in Pennsylvania for $82.0 million ($41.0 million net to us), or the Appalachia Transaction.
Haynesville shale acquisition
On April 5, 2011, we closed on a $225.2 million acquisition of land, mineral interests and other assets in DeSoto Parish, or the Haynesville Shale Acquisition. BG Group participated for its 50% share of the transaction and funded us $112.6 million.
TGGT incident
An incident occurred at a TGGT amine treating facility in May 2011, which resulted in shutting in two treating facilities. As of December 31, 2011, we estimate approximately 124.0 Mmcf per day of production (39.0 Mmcfe per day net to us) was curtailed since the incident occurred. One of the shut-down facilities became operational in October 2011. TGGT expects the damaged facility will be re-started during the first quarter of 2012.
Former acquisition proposal
On October 29, 2010, our Chairman and Chief Executive Officer, Douglas H. Miller, presented a letter to our board of directors indicating an interest in acquiring all of the outstanding shares of our stock not already owned by Mr. Miller for a cash purchase price of $20.50 per share. This proposal did not represent a definitive offer and there was no assurance that a definitive offer would be made or accepted, that any agreement would be executed or that any transaction would be consummated.
Our board of directors established a special committee on November 4, 2010 comprised of two of our independent directors to, among other things, evaluate and determine the Company’s response to the October 29, 2010 proposal. On July 8, 2011, after consultation with its independent financial and legal advisors, the special committee released a statement that its review of strategic alternatives did not result in any firm proposal or any other proposal that was in the best interests of the Company and its shareholders and that they had terminated the review process. See “Note 19. Former acquisition proposal” of the notes to our consolidated financial statements for further information regarding the proposal.
5
Debt and cash summary
A summary of our cash, outstanding long-term debt as of December 31, 2011 and February 22, 2012 and a brief description of the EXCO Resources Credit Agreement and the 2018 Notes is presented below.
| | | | | | | | |
(in thousands) | | December 31,
2011 | | | February 22,
2012 | |
Cash and restricted cash | | $ | 187,922 | | | $ | 126,770 | |
Borrowings under the EXCO Resources Credit Agreement | | | 1,147,500 | | | | 1,159,500 | |
2018 Notes (1) | | | 750,000 | | | | 750,000 | |
| | | | | | | | |
Total debt | | | 1,897,500 | | | | 1,909,500 | |
Net debt | | $ | 1,709,578 | | | $ | 1,782,730 | |
| | | | | | | | |
EXCO Resources Credit Agreement borrowing base | | $ | 1,600,000 | | | $ | 1,600,000 | |
Unused EXCO Resources Credit Agreement borrowing base (2) | | $ | 443,273 | | | $ | 431,273 | |
Unused EXCO Resources Credit Agreement borrowing base plus cash (2) | | $ | 631,195 | | | $ | 558,043 | |
| (1) | Excludes unamortized bond discount of $9.7 million at December 31, 2011 and $9.5 million at February 22, 2012. |
| (2) | Net of letters of credit of $9.2 million at December 31, 2011 and February 22, 2012. |
EXCO Resources Credit Agreement
The EXCO Resources Credit Agreement, as amended, matures on April 1, 2016 and has a borrowing base of $1.6 billion as of December 31, 2011, subject to semi-annual borrowing base redeterminations.
2018 Notes
On September 15, 2010 we closed on the 2018 Notes. We received proceeds of approximately $724.1 million from the offering after deducting an original issue discount, commissions and offering fees and expenses. The 2018 Notes are guaranteed on a senior unsecured basis by our consolidated subsidiaries, excluding all of our jointly-held equity investments with BG Group. All of our non-guarantor subsidiaries are considered unrestricted subsidiaries under the 2018 Notes, with the exception of our equity investment in OPCO.
Summary of geographic areas of operations
The following tables set forth summary operating information attributable to our principal geographic areas of operation as of December 31, 2011:
| | | | | | | | | | | | | | | | |
Areas | | Total
Proved
Reserves
(Bcfe) (1) | | | PV-10
(in millions)
(1) (2) | | | Annual
daily net
production
(Mmcfe) | | | Reserve Life
(years) | |
East Texas/North Louisiana | | | 1,127.7 | | | $ | 1,237.9 | | | | 445.7 | | | | 6.9 | |
Appalachia | | | 114.6 | | | | 121.9 | | | | 34.0 | | | | 9.2 | |
Permian and other | | | 87.3 | | | | 313.9 | | | | 20.8 | | | | 11.5 | |
| | | | | | | | | | | | | | | | |
Total | | | 1,329.6 | | | $ | 1,673.7 | | | | 500.5 | | | | 7.3 | |
| | | | | | | | | | | | | | | | |
| | | | | | | | | | | | |
Areas | | Estimated
drilling
locations (3) | | | Total gross
acreage | | | Total net
acreage (4) | |
East Texas/North Louisiana | | | 4,340 | | | | 267,246 | | | | 132,172 | |
Appalachia | | | 4,800 | | | | 759,415 | | | | 326,075 | |
Permian and other | | | 260 | | | | 71,695 | | | | 37,616 | |
| | | | | | | | | | | | |
Total | | | 9,400 | | | | 1,098,356 | | | | 495,863 | |
| | | | | | | | | | | | |
| (1) | The total Proved Reserves and PV-10 for non-shale properties, excluding future plugging and abandonment costs, of the Proved Reserves, as used in this table, were prepared by Lee Keeling and Associates, Inc., or Lee Keeling, an independent petroleum engineering firm located in Tulsa, Oklahoma. The total Proved Reserves and PV-10 for shale |
6
| | properties, excluding future plugging and abandonment costs, as used in the table, were prepared by Haas Petroleum Engineering Services, Inc., or Haas Engineering, an independent petroleum engineering firm located in Dallas, Texas. For each area set forth in the table, the Proved Reserves were extracted from the reports from Lee Keeling and Haas Engineering by our internal engineers. The estimated future plugging and abandonment costs necessary to compute PV-10 were computed internally. |
| (2) | The PV-10 data used in this table is based on the simple average of the spot prices for the trailing twelve month period using the first day of each month beginning on January 1, 2011 and ended on December 1, 2011, of $4.12 per Mmbtu for natural gas at Henry Hub and $96.19 per Bbl for West Texas Intermediate oil at Cushing, Oklahoma, in each case adjusted for geographical and historical differentials. Market prices for oil and natural gas are volatile (see “Item 1A. Risk Factors—Risks relating to our business”). We believe that PV-10 before income taxes, while not a financial measure in accordance with generally accepted accounting principles in the United States, or GAAP, is an important financial measure used by investors and independent oil and natural gas producers for evaluating the relative significance of oil and natural gas properties and acquisitions because the tax characteristics of comparable companies can differ materially. The total Standardized Measure, a measure recognized under GAAP, for our Proved Reserves as of December 31, 2011 was $1.4 billion. The Standardized Measure represents the PV-10 after giving effect to income taxes, and is calculated in accordance with Accounting Standards Codification Topic 932, “Extractive Activities, Oil and Gas,” or ASC 932. The amount of estimated future plugging and abandonment costs, the PV-10 of these costs and the Standardized Measure were determined by us. We do not designate our derivative financial instruments as hedges and accordingly, do not include the impact of derivative financial instruments when computing the Standardized Measure. The following table provides a reconciliation of our PV-10 to our Standardized Measure. |
| | | | | | | | | | | | |
| | | As of December 31, | |
(in millions) | | 2011 | | | 2010 | | | 2009 | |
PV-10 | | $ | 1,673.7 | | | $ | 1,356.5 | | | $ | 747.7 | |
Future income taxes | | | (390.8 | ) | | | (305.1 | ) | | | — | |
Discount of future income taxes at 10% per annum | | | 143.6 | | | | 172.0 | | | | — | |
| | | | | | | | | | | | |
Standardized Measure | | $ | 1,426.5 | | | $ | 1,223.4 | | | $ | 747.7 | |
| | | | | | | | | | | | |
| (3) | Identified drilling locations represent total gross drilling locations identified and scheduled by our management as an estimation of our multi-year drilling activities on existing acreage. Of the total drilling locations shown in the table, approximately 700 are classified as proved. Our actual drilling activities may change depending on the availability of capital, regulatory approvals, seasonal restrictions, oil and natural gas prices, costs, drilling results and other factors (see “Item 1A. Risk Factors—Risks relating to our business”). |
| (4) | Includes 23,622, 34,650 and 6,550 net acres with leases expiring in 2012, 2013 and 2014, respectively. Approximately 40.0% of the scheduled expiring acreage is located with-in our shale resource plays. |
7
Our development and exploitation project areas
East Texas and North Louisiana
The East Texas/North Louisiana area is comprised of the Haynesville and Bossier shale plays and the Cotton Valley sand trend, which covers portions of the East Texas Basin and the Northern Louisiana Salt Basin. East Texas/North Louisiana is our largest division in terms of production and reserves and our primary development targets include the Haynesville and Bossier shales.
Currently, our emphasis is on development, appraisal and delineation of our acreage in the Haynesville shale play where we hold approximately 64,500 net acres. The Haynesville shale is at depths of 12,000 to 14,500 feet and is being developed with horizontal wells that typically have 4,000 to 5,500-foot laterals resulting in 16,000 to 20,000 feet of total measured depth.
In addition, we continue to produce from tight gas sand reservoirs from the Cotton Valley, Travis Peak, Pettet and Hosston formations at depths of 6,500 to 15,000 feet.
Haynesville shale
The Haynesville shale play is one of the most prolific natural gas plays in the United States. Our Haynesville shale acreage is primarily located in DeSoto and Caddo Parishes in Louisiana and in Harrison, Panola, Shelby, San Augustine and Nacogdoches counties in Texas. A substantial portion of our acreage is held by our existing Haynesville, Cotton Valley, Hosston and Travis Peak production.
Our drilling program in the Haynesville shale play is concentrated in our two core areas, DeSoto Parish and the Shelby Area. In early 2011, we operated 22 horizontal drilling rigs in the play and we ended 2011 with 18 operated horizontal drilling rigs.
Our revised plans entail reducing our operated rig count to an average of nine drilling rigs in the play. We plan to drill approximately 70 wells in 2012. We entered 2012 with 52 wells either in the drilling or completion phase, which we expect to turn to sales in 2012. We also plan to complete an additional 29 wells in 2012 for a total of 81 wells turned to sales in 2012. During 2013, we expect to complete the remaining 41 wells drilling in 2012 in addition to wells we plan to drill in 2013. Since we commenced Haynesville horizontal drilling in late 2008 through December 31, 2011, we have spud 333 operated horizontal wells and produced more than 583.4 Bcf of gross natural gas to sales. As of December 31, 2011, we averaged a gross operated daily shale gas production rate of approximately 1.2 Bcf per day. Including non-operated volumes, we exited 2011 with net Haynesville production of 406.4 Mmcf per day.
8
DeSoto Parish
We continue to develop DeSoto Parish on 80-acre spacing in a manufacturing mode utilizing multi-well pad development. Our manufacturing process typically involves four drilling rigs per 640-acre unit to simultaneously drill all wells in the unit, followed by two fracture stimulation fleets to simultaneously complete all wells in the unit. We believe this approach to development maximizes value and recovery of reserves. As of December 31, 2011, we had developed 25 units on 80-acre spacing and plan to target an additional eight units during 2012. The multi-well pad design minimizes surface impact and provides for a more capital efficient gathering and production system layout than can be achieved with single well locations.
At December 31, 2011 we had 12 drilling rigs running in the area and a total of 223 horizontal wells flowing to sales with a total gross production rate of approximately 955.4 Mmcf per day (300.6 Mmcf per day net).
Shelby Area
In 2010, we acquired a significant acreage position in the Shelby Area, our second core area of the Haynesville shale play. Since this area had few producing wells at the time of acquisition, our efforts have focused on establishing and holding acreage, delineating productivity, testing different completion designs and evaluating different flowback methodologies.
In late 2011, we began our first spacing test to fully develop the Haynesville and Bossier shales in two units. To evaluate the performance of the various spacing patterns, we drilled a vertical monitor well solely for microseismic and pressure monitoring purposes. This well was drilled and cased to a depth of 14,500 feet as a dedicated observation well. We will monitor multiple fraction stimulation stages with downhole microseismic survey tools followed by installation of permanent downhole gauges to measure and monitor the reservoir pressure in the Haynesville shale as the unit produces. We believe this is a necessary commitment to understand reservoir performance and maximize the estimated ultimate recovery, or EUR. We used a monitor well with the same design in DeSoto Parish and it provided valuable reservoir information. This original monitor well is still in use today.
Our two zone testing and evaluation program is the next phase required to properly evaluate the Haynesville/Bossier shale well spacing to assess the proper development strategy. Our plans are to evaluate the performance of this spacing pilot before proceeding with additional unit development.
At December 31, 2011, we had 6 drilling rigs running in the area. We presently expect to suspend drilling in this area while we evaluate our testing program results. We currently have a total of 55 horizontal wells flowing to sales with a total gross production rate of approximately 225.3 Mmcf per day (76.2 Mmcf per day net).
Haynesville shale operational effectiveness
Our operational focus has resulted in significant improvements in drilling and completion efficiencies. In DeSoto Parish, we continue to achieve improved drilling time performance. Three of our most recent wells in DeSoto Parish have ranked in the top ten fastest wells drilled to date. We have recently set several drilling records in the play including single bit runs from surface to intermediate hole depth and multiple single bit runs from intermediate to production hole total depth, typically 16,500 feet. In addition to our success in reducing well costs with drilling time improvements and efficiencies, we are also focused on optimizing completions. Almost 50% of our well cost is incurred during the completion phase. We plan to implement cost effective and efficient design changes as part of our manufacturing program. We are utilizing two dedicated fracture stimulation fleets and continue to see greater consistency and efficiencies in our fracturing operations. These commitments have provided consistent availability of completion equipment and personnel, and we have maintained a proper alignment with our drilling pace to keep a low inventory of wells waiting on completion. We target a minimum working inventory of completions and design our program to flow gas directly to the sales line once the well is completed. We have no wells currently waiting on pipeline. This is possible due to close coordination with our jointly-held midstream company, TGGT, which installs gathering lines in concert with our drilling operations in most of our development areas.
Cotton Valley, Hosston, Travis Peak, Pettet
The Vernon Field in Jackson Parish, Louisiana produces from the lower Cotton Valley and Bossier Sand formations at depths ranging from 12,000 to 15,000 feet. The technical expertise obtained in the development of the Vernon Field and the exploitation of these high-pressure, high-temperature reservoirs greatly assisted in the rapid development of the Haynesville and Bossier shale. With current low commodity prices, the primary focus in the Vernon Field is to minimize our operating expense while maintaining production. We have reduced our production decline rate in the field over the last two years. We have additional acreage and production in Caddo and DeSoto Parishes, Louisiana, primarily in four fields—Holly, Kingston, Caspiana and Longwood. We also have acreage and production in Harrison, Panola, and Gregg Counties in Texas, primarily across three fields—Carthage, Waskom, and
9
Danville. We are focused on producing primarily from Cotton Valley sands at depths ranging from 10,400 to 11,000 feet and the Travis Peak and Hosston Sands at 7,800 to 10,000 feet. Due to low commodity prices, we are not actively drilling in these formations. We maintain a strong emphasis on base production performance and focus on operating expense reductions. We typically run multiple service rigs replacing tubing, changing pumps, cleaning out fill and implementing general repairs to maintain optimum production levels. We currently have a total of 1,064 wells flowing to sales with a total gross operated production rate of approximately 153.1 Mmcfe per day (81.8 Mmcfe per day net).
Appalachia
The Appalachian Basin includes portions of the states of Kentucky, New York, Ohio, Pennsylvania, Virginia, West Virginia and Tennessee and covers an area of over 185,000 square miles. The Appalachian Basin is strategically located near the high energy demand markets of the northeast United States.
Most production in the Appalachian Basin has been traditionally derived from relatively shallow, low porosity and low permeability sand and shale formations at depths from approximately 1,000 to over 8,000 feet. Assets in the area are typically characterized by long reserve lives, high drilling success rates, and a large number of low productivity wells with shallow decline rates. Our operations in the area have primarily included maintaining our existing production from shallow wells and testing our Marcellus shale acreage. We currently operate a total of 6,041 vertical shallow wells flowing to sales with a total gross production rate of approximately 54.6 Mmcf per day (16.5 Mmcf per day net).
Our Pennsylvania area encompasses 22 counties. Drilling, completion and production activities target the Marcellus shale as well as the Upper Devonian, Venanago, Bradford and Elk sandstone groups at depths from 1,800 to more than 8,000 feet. We plan to drill 49 gross operated Marcellus shale wells in the Pennsylvania area during 2012.
Our West Virginia area includes 17 counties and stretches from the northern to the southern areas of the state. Drilling, completion and production activities target the Marcellus shale and multiple reservoirs of the Mississippian and Devonian formations found at depths ranging from 1,500 to 8,100 feet.
The emergence of the Marcellus shale play over the last several years resulted in a shift in our focus from the traditional shallow development to exploration and development of the Marcellus shale. We currently hold approximately 326,000 net acres in the Appalachian Basin. We are now implementing a development program in Northeast Pennsylvania, where we believe our best, most economic opportunities exist.
Marcellus shale
The 2011 program was a combination of appraisal and development wells in Northeast Pennsylvania, which includes Sullivan and Lycoming Counties and Central Areas which includes mainly Armstrong, Jefferson and Westmoreland counties.
The Northeast Pennsylvania area was acquired from Chief Oil and Gas LLC in early 2011. Our position, which totals approximately 28,000 net acres, established a core area where we quickly moved into manufacturing mode by drilling, then completing multi wells on a pad. The development wells in Northeast Pennsylvania have initial production rates ranging from 1.0 to 10.6 Mmcf per day from lateral lengths varying from 2,200 to 5,000 feet. We currently have a total of 34 horizontal wells flowing to sales with a total gross production rate of approximately 64.9 Mmcf per day (12.9 Mmcf per day net). During 2011, we drilled and completed 13 gross (3.3 net) wells.
In our Central Pennsylvania area, we have drilled mainly appraisal and spacing tests. During 2011, we added to our position by acquiring approximately 15,000 net acres. A significant amount of data has been collected and is being used to formulate a development plan based on the preliminary performance results in each area. During 2011, we drilled and completed 16 gross (8.0 net) wells.
The wells in Central Pennsylvania had initial production rates ranging from 1.5 to 6.2 Mmcf per day from lateral lengths varying from 2,200 to 5,100 feet. We currently have a total of 22 horizontal wells flowing to sales with a total gross production rate of approximately 25.8 Mmcf per day (10.7 Mmcf per day net).
10
Marcellus operational effectiveness
We continue to build our core positions in Central and Northeast Pennsylvania. Concurrently, development capital will be focused in these areas, particularly where we have realized strong results, have significant acreage, and have market access that is either existing or currently under construction. We have a significant amount of held-by-production acreage. Of the acreage that is not held-by-production, only 1,499 net acres are scheduled to expire this year.
We continue to see improvement in cost performance metrics. During 2011, we reduced total well costs by approximately 13%, with reductions in both drilling and completion costs. Improvements in drilling times, water management infrastructure, efficiencies due to multi-well pad drilling and single sourcing were among the key drivers to our cost reductions in 2011. These metrics will continue to improve as infrastructure is added, and key findings from our 2011 program are implemented.
We currently have four horizontal drilling rigs operating in the basin with plans to exit 2012 with three operated rigs. The 2012 drilling plan primarily entails development in the Northeast Pennsylvania area. We plan to drill 2 gross (0.5 net) operated appraisal wells and 47 gross (12.9 net) operated development wells while spending net drilling and completion capital totaling approximately $55.0 million. All of our planned 2012 drilling activity is located in areas that either have sufficient natural gas markets and immediate take away capacity or a defined strategy to be sales ready by year end 2012.
Permian
The Permian Basin, located in West Texas and the adjoining area of southeastern New Mexico, is best known as a mature oil-focused basin exploited with waterflood and other enhanced oil recovery techniques. Our activities are focused on conventional oil and natural gas properties. With the use of 3-D seismic, we are targeting prolific reservoirs with potential for multi-pay horizons. The properties are characterized by long reserve lives and low operating costs.
Sugg Ranch Field
The Sugg Ranch Field is located primarily in Irion County, Texas. We own a 96.6% interest in the property. As of December 31, 2011, we had Proved Reserves of 5,189 Mbbl and 54,282 Mmcf and 393 gross producing wells. Production is primarily from the Canyon Sand from depths of 6,700 to 7,900 feet. We currently plan to use one operated drilling rig to drill 37 gross (35.9 net) wells in 2012. Our Sugg Ranch properties contain significant amounts of oil and natural gas liquids. We are currently evaluating our acreage for shale potential.
Our hydraulic fracturing activities
Oil, natural gas and natural gas liquids may be recovered from our properties through the use of sophisticated drilling and hydraulic fracturing techniques. Hydraulic fracturing involves the injection of water, sand, gel and chemicals under pressure into formations to fracture the surrounding rock and stimulate production. Our hydraulic fracturing activities are primarily focused in our shale plays in East Texas, North Louisiana, Pennsylvania and West Virginia.
As of December 31, 2011, we had approximately 64,500 net acres in our East Texas/North Louisiana region for the Haynesville and Bossier shale formations and 140,200 net acres in our Appalachia region for the Marcellus shale formation, all of which are subject to possible hydraulic fracturing operations. As of December 31, 2011, a total of 1,127.7 Bcfe of our Proved Reserves were located in our East Texas/North Louisiana operating area, of which 758.4 Bcfe of Proved Reserves were associated with our Haynesville and Bossier shale properties. As of December 31, 2011, a total of 114.6 Bcfe of our Proved Reserves were located in our Appalachia operating area, of which 54.4 Bcfe of Proved Reserves were associated with our Marcellus shale properties. As of December 31, 2011, approximately 61.1% of our total proved reserves were subject to possible hydraulic fracturing activities.
Although the cost of each well will vary, on average approximately 25-30% of the total cost of drilling and completing a well in the Haynesville and Bossier shale formation and approximately 35-40% of the total cost of drilling and completing a well in the Marcellus shale formation is associated with hydraulic fracturing activities. These costs are treated in the same way that all other costs of drilling and completing our wells are treated and are built into our capital expenditure budget.
We diligently review best practices and industry standards and strive to comply with all regulatory requirements in the protection of potable water sources when drilling and completing our wells. Protective practices include, but are not limited to, setting multiple strings of protection pipe across potable water sources and cementing these pipe strings to surface, continuously monitoring the hydraulic fracturing process in real time and disposing of non-recycled produced fluids in authorized disposal wells at depths below the potable water sources. In addition, we actively seek methods to minimize the environmental impact of our hydraulic fracturing operations in all of our operating areas. For example, we use discharge water from a local paper plant as a key water source for our fracture stimulation operations in North Louisiana. In addition, we recycle flowback fluids when economically feasible.
11
For more information on the risks of hydraulic fracturing, please read “Risk Factors—Our business exposes us to liability and extensive regulation on environmental matters, which could result in substantial expenditures” and “Risk Factors—Federal and state legislation and regulatory initiatives relating to hydraulic fracturing could result in increased costs and additional operating restrictions or delays.”
Our oil and natural gas reserves
Our Proved Reserves as of December 31, 2011 were approximately 1.3 Tcfe, of which approximately 61.1% were shale. Our Haynesville/Bossier shale Proved Reserves represent 93.3% of our total shale Proved Reserves as the Marcellus shale reserves are in their early stages of development. Our non-shale Proved Reserves represent approximately 38.9% of total Proved Reserves as of December 31, 2011, over half of which were in our Vernon Field in Jackson Parish, Louisiana.
Our shale assets are in various stages of appraisal and development from full manufacturing development phase in DeSoto Parish to testing of spacing units in the Shelby Area. In the Marcellus shale, our activities range from the development/delineation phase in Northeast Pennsylvania to testing of spacing patterns in other areas of Pennsylvania. Typically, it will take years to move into manufacturing mode. Consequently, costs and Proved Reserve additions will cycle from high costs and low Proved Reserves additions to low costs and high Proved Reserves additions. Initially, higher costs are incurred because of the traditional learning curve improvements of drilling and completion, which are refined in each area. Proved Reserves can increase from improvement in the drilling and completion techniques, but more importantly, as production trends and reservoir data becomes available, “reasonable certainty” increases. This can result in anomalous annual Reserve Life and finding and development metrics. Tight gas or shale plays typically have Reserve Lives that exceed 10 years unless the play is emerging and there is not enough data to support higher Proved Reserves. Even though we have been developing DeSoto Parish for approximately three years, Reserve Lives are presently computing in the five year range. Our Marcellus shale developments and Shelby Area are less mature than DeSoto Parish. Therefore, our Reserve Lives are negatively impacted as we are in the early stages of development in these types of reservoirs.
We have two fields that exceeded 15% of our total Proved Reserves as of December 31, 2011. Our Haynesville shale fields represented approximately 57.0% and the Vernon Field represented approximately 21.4% of our total Proved Reserves. Please see “Our production, prices and expenses” for additional information regarding production from the Haynesville shale fields and the Vernon Field.
The following table summarizes Proved Reserves as of December 31, 2011, 2010, and 2009. This information was prepared in accordance with the rules and regulations of the Securities and Exchange Commission, or the SEC.
| | | | | | | | | | | | |
| | | As of December 31, | |
| | | 2011 | | | 2010 | | | 2009 | |
Oil (Mbbls) | | | | | | | | | | | | |
Developed | | | 4,565 | | | | 4,633 | | | | 3,505 | |
Undeveloped | | | 1,789 | | | | 2,725 | | | | 2,013 | |
| | | | | | | | | | | | |
Total | | | 6,354 | | | | 7,358 | | | | 5,518 | |
| | | | | | | | | | | | |
| | | |
Natural Gas (Mmcf) | | | | | | | | | | | | |
Developed | | | 955,522 | | | | 793,777 | | | | 622,160 | |
Undeveloped | | | 335,942 | | | | 661,176 | | | | 303,568 | |
| | | | | | | | | | | | |
Total | | | 1,291,464 | | | | 1,454,953 | | | | 925,728 | |
| | | | | | | | | | | | |
| | | |
Equivalent reserves (Mmcfe) | | | | | | | | | | | | |
Developed | | | 982,912 | | | | 821,575 | | | | 643,190 | |
Undeveloped | | | 346,676 | | | | 667,526 | | | | 315,646 | |
| | | | | | | | | | | | |
Total | | | 1,329,588 | | | | 1,489,101 | | | | 958,836 | |
| | | | | | | | | | | | |
| | | |
PV-10 (in millions) (1) | | | | | | | | | | | | |
Developed | | $ | 1,545.7 | | | $ | 1,187.2 | | | $ | 649.8 | |
Undeveloped | | | 128.0 | | | | 169.3 | | | | 97.9 | |
| | | | | | | | | | | | |
Total | | $ | 1,673.7 | | | $ | 1,356.5 | | | $ | 747.7 | |
| | | | | | | | | | | | |
Standardized Measure (in millions) (2) | | $ | 1,426.5 | | | $ | 1,223.4 | | | $ | 747.7 | |
| | | | | | | | | | | | |
12
| (1) | The PV-10 data does not include the effects of income taxes or derivative financial instruments and is based on the following average spot prices, in each case adjusted for historical differentials. |
| | | | | | | | |
| | | Average spot prices (a) | |
Date | | Natural gas
(per Mmbtu) | | | Oil
(per Bbl) | |
December 31, 2011 | | $ | 4.12 | | | $ | 96.19 | |
December 31, 2010 | | | 4.38 | | | | 79.43 | |
December 31, 2009 | | | 3.87 | | | | 61.18 | |
| (a) | Prices are the simple average spot price for the trailing twelve month periods per Mmbtu at Henry Hub and per Bbl at Cushing, Oklahoma, using the first day of each month beginning on January 1 and ending on December 1 of each respective year. |
| (2) | There is no difference in Standardized Measure and PV-10 as of December 31, 2009 as the impacts of lower natural gas prices, net cash flows and net operating loss carry-forwards eliminated estimated future income taxes. |
We believe that PV-10 before income taxes, while not a financial measure in accordance with GAAP, is an important financial measure used by investors and independent oil and natural gas producers for evaluating the relative significance of oil and natural gas properties and acquisitions due to tax characteristics, which can differ significantly, among comparable companies. The Standardized Measure represents the PV-10 after giving effect to income taxes, and is calculated in accordance with ASC 932. The following table provides a reconciliation of our PV-10 to our Standardized Measure as of December 31, 2011:
| | | | |
(in millions) | | | |
PV-10 | | $ | 1,673.7 | |
Future income taxes | | | (390.8 | ) |
Discount of future income taxes at 10% per annum | | | 143.6 | |
| | | | |
Standardized Measure | | $ | 1,426.5 | |
| | | | |
Changes in our Proved Reserves for the year ended December 31, 2011 were impacted by the following significant factors and events:
| | • | | Significant additions of Proved Reserves from drilling and completing horizontal wells in DeSoto Parish, where our development is conducted principally on 80-acre spacing. Our total Haynesville/Bossier Proved Developed Reserves increased by 231.2 Bcfe, or 104.0%, from December 31, 2010 to 453.5 Bcfe at December 31, 2011. |
| | • | | Weakness in natural gas prices influenced decisions to reduce or eliminate development programs in certain conventional properties, resulting in 168.3 Bcfe downward revisions to our Proved Undeveloped Reserves. |
Management has established, and is responsible for, internal controls designed to provide reasonable assurance that the estimates of Proved Reserves are computed and reported in accordance with rules and regulations promulgated by the SEC as well as established industry practices used by independent engineering firms and our peers. These internal controls include documented process workflows, qualified professional engineering and geological personnel with specific reservoir experience and investment in on-going education with emphasis on emerging technologies. These emerging technologies are of particular importance as they relate to our shale plays. Our internal audit function routinely tests our processes and controls and estimated Proved Reserve computations. We also retain outside independent engineering firms to prepare estimates of our Proved Reserves. Senior management reviews and approves our reserve estimates, whether prepared internally or by third parties. Our Vice President of Engineering oversees our outside independent engineering firms, Lee Keeling and Haas Engineering, in connection with the preparation of estimates of our Proved Reserves. Our Vice President of Engineering is a registered Professional Engineer and has served in various leadership roles with the Gas Research Institute, the Society of Petroleum Engineers and the Society of Women Engineers over her 33 years in the oil and gas industry. She is a graduate of Pennsylvania State University (1978) with a degree in Petroleum and Natural Gas Engineering. During her career, our Vice President of Engineering has been involved in oil and natural gas reserves analysis and estimation for both major oil companies and independents. Our Chief Operating Officer and our Vice President of Engineering, with input from other members of senior management, are responsible for the selection of our third-party engineering firms and receive the reports generated by such firms. The third-party engineering reports are provided to our audit committee, which meets annually with the engineering firms to review and discuss the procedures for determining the estimates of our oil and natural gas reserves.
13
The estimates of Proved Reserves and future net cash flow for our non-shale properties as of December 31, 2011, 2010 and 2009 have been prepared by Lee Keeling. Our estimated Proved Reserves and future net cash flows for our shale properties as of December 31, 2011, 2010 and 2009 were prepared by Haas Engineering. Lee Keeling and Haas Engineering are independent petroleum engineering firms that perform a variety of reserve engineering and valuation assessments for public and private companies, financial institutions and institutional investors. Lee Keeling has performed these services for over 50 years and Haas Engineering for over 30 years. Our internal technical employees responsible for reserve estimates and interaction with our independent engineers include corporate officers with petroleum and other engineering degrees, professional certifications and industry experience similar to those of our independent engineering firms. The estimates of future plugging and abandonment costs necessary to compute PV-10 and Standardized Measure were computed internally.
Estimates of oil and natural gas reserves are projections based on a process involving an independent third party engineering firm’s extensive visits, collection of any and all required geological, geophysical, engineering and economic data, and such firm’s complete external preparation of all required estimates and are forward-looking in nature. These reports rely on various assumptions, including definitions and economic assumptions required by the SEC, including the use of constant oil and natural gas pricing, use of current and constant operating costs and current capital costs. We also make assumptions relating to availability of funds and timing of capital expenditures for development of our Proved Undeveloped Reserves. These reports should not be construed as the current market value of our Proved Reserves. The process of estimating oil and natural gas reserves is also dependent on geological, engineering and economic data for each reservoir. Because of the uncertainties inherent in the interpretation of this data, we cannot ensure that the reserves will ultimately be realized. Our actual results could differ materially. See “Note 23. Supplemental information relating to oil and natural gas producing activities (unaudited)” of the notes to our consolidated financial statements for additional information regarding our oil and natural gas reserves and our Standardized Measure.
Lee Keeling and Haas Engineering also examined our estimates with respect to reserve categorization, using the definitions for Proved Reserves set forth in SEC Regulation S-X Rule 4-10(a) and SEC staff interpretations and guidance. In preparing an estimate of our Proved Reserves and future net cash flows attributable to our interests, Lee Keeling and Haas Engineering did not independently verify the accuracy and completeness of information and data furnished by us with respect to ownership interests, oil and natural gas production, well test data, historical costs of operation and development, product prices, or any agreements relating to current and future operations of the properties and sales of production. However, if in the course of the examination something came to the attention of Lee Keeling or Haas Engineering which brought into question the validity or sufficiency of any such information or data, Lee Keeling or Haas Engineering did not rely on such information or data until they had satisfactorily resolved their questions relating thereto or had independently verified such information or data. Lee Keeling and Haas Engineering determined that their estimates of Proved Reserves conform to the guidelines of the SEC, including the criteria of “reasonable certainty,” as it pertains to expectations about the recoverability of Proved Reserves in future years, under existing economic and operating conditions, consistent with the definition in Rule 4-10(a)(24) of SEC Regulation S-X.
Management’s discussion and analysis of oil and natural gas reserves
The following discussion and analysis of our proved oil and natural gas reserves and changes in our Proved Reserves is intended to provide additional guidance on the operational activities, transactions, economic and other factors which significantly impacted the determination of our estimate of Proved Reserves as of December 31, 2011 and changes in our Proved Reserves during 2011. This discussion and analysis should be read in conjunction with “Note 23. Supplemental information relating to oil and natural gas producing activities (unaudited)” and in “Risk factors” addressing the uncertainties inherent in the estimation of oil and natural gas reserves elsewhere in this Annual Report on Form 10-K. The following table summarizes the changes in our Proved Reserves from January 1, 2011 to December 31, 2011.
14
| | | | | | | | | | | | |
| | | Oil
(Mbbls) | | | Natural gas
(Mmcf) | | | Equivalent
natural gas
(Mmcfe) | |
Proved Developed Reserves | | | 4,565 | | | | 955,522 | | | | 982,912 | |
Proved Undeveloped Reserves | | | 1,789 | | | | 335,942 | | | | 346,676 | |
| | | | | | | | | | | | |
Total | | | 6,354 | | | | 1,291,464 | | | | 1,329,588 | |
| | | | | | | | | | | | |
| | | |
The changes in reserves for the year are as follows: | | | | | | | | | | | | |
January 1, 2011 | | | 7,358 | | | | 1,454,953 | | | | 1,499,101 | |
Purchase of reserves in place | | | — | | | | 62,489 | | | | 62,489 | |
Extensions and discoveries | | | 929 | | | | 195,565 | | | | 201,139 | |
Revisions of previous estimates: | | | | | | | | | | | | |
Reclassification to unproved reserves (1) | | | (182 | ) | | | (167,172 | ) | | | (168,264 | ) |
Changes in price | | | 100 | | | | (15,165 | ) | | | (14,565 | ) |
Other factors | | | (1,082 | ) | | | (55,341 | ) | | | (61,833 | ) |
Sales of reserves in place | | | (28 | ) | | | (5,599 | ) | | | (5,767 | ) |
Production | | | (741 | ) | | | (178,266 | ) | | | (182,712 | ) |
| | | | | | | | | | | | |
December 31, 2011 | | | 6,354 | | | | 1,291,464 | | | | 1,329,588 | |
| | | | | | | | | | | | |
| (1) | Represents Proved Undeveloped Reserves reclassified to unproved pursuant to the five year development rule established by the SEC. This reclassification was a result of decisions not to commit development capital in the current commodity price environment. While these locations qualify as Proved Undeveloped Reserves as they directly offset a proved location, our planned capital programs do not support development at this time. |
Current year oil and natural gas production
Total oil and natural gas production in 2011 was 182.7 Bcfe, which included approximately 23.5 Bcfe in production from 2011 extensions and discoveries that were not reflected in our beginning of the year Proved Reserves.
New discoveries and extensions
Proved Reserves additions from extensions and discoveries in 2011 were 201.1 Bcfe. Of this total, approximately 157.8 Bcfe, or 78.5%, were in Haynesville/Bossier shale plays, including 107.7 Bcfe in DeSoto Parish and 50.1 Bcfe in the Shelby Area. Throughout 2011, we continued development of DeSoto Parish on 80-acre spacing utilizing multi-pad development. At December 31, 2011, we had 195 wells on 80-acre spacing patterns and had 25 fully developed sections. EUR is based on production performance analysis and supported with reliable technologies such as seismic, microseismic, reservoir simulation, pressure transient and volumetric analysis. The DeSoto Parish proved undeveloped locations were booked using a probabilistic approach as of December 31, 2011, resulting in an average of 1.5 offsetting proved undeveloped locations, each having an average EUR of 6.6 Bcfe, for each producing well drilled. As a result, the gross EUR from these Haynesville wells on a 640-acre unit increased to 52.8 Bcfe at year end 2011 compared with 48.8 Bcfe at year end 2010. As of December 31, 2011, our Proved Undeveloped Reserves represented 26.1% of our Proved Reserves with the Haynesville shale representing approximately 87.9% of our total Proved Undeveloped Reserves at year end.
Revisions of previous estimates
In addition to 168.3 Bcfe that were reclassified to an unproved category due to scheduling, revisions due to prices were 14.6 Bcfe in 2011. Net negative revisions due to other factors were 61.8 Bcfe. Most of these downward revisions were related to conventional reserves.
15
Proved Undeveloped Reserves
The following table summarizes the changes in our Proved Undeveloped Reserves, all of which are expected to be developed within five years, for the year ended December 31, 2011:
| | | | |
| | | Mmcfe | |
Proved Undeveloped Reserves at January 1, 2011 | | | 677,526 | |
Purchases of Proved Undeveloped reserves in place | | | 26,554 | |
New discoveries and extensions (1) | | | 90,526 | |
Proved Undeveloped Reserves transferred to developed (2) | | | (268,297 | ) |
Proved Undeveloped Reserves transferred to unproved (3) | | | (168,264 | ) |
Other revisions of previous estimates of Proved Undeveloped Reserves | | | (11,369 | ) |
| | | | |
Proved Undeveloped Reserves at December 31, 2011 | | | 346,676 | |
| | | | |
| (1) | Approximately 77.5% of the discoveries and extensions of Proved Undeveloped Reserves in 2011 occurred in our East Texas/North Louisiana region in our Haynesville shale play. |
| (2) | Proved Undeveloped Reserves transferred to Proved Developed Reserves in 2011 were primarily in DeSoto Parish. Capital costs incurred to convert Proved Undeveloped Reserves to Proved Developed Reserves were $405.1 million, excluding carried in development costs incurred in 2010. |
| (3) | Represents Proved Undeveloped Reserves reclassified to unproved pursuant to the five year development rule established by the SEC. This reclassification was a result of decisions not to commit development capital in the current commodity price environment. While these locations qualify as Proved Undeveloped Reserves as they directly offset a proved location, our planned capital programs do not support development at this time. |
Impacts of changes in reserves on depletion rate and statements of operations in 2011
Our depletion rate increased to $1.89 per Mcfe in 2011 from $1.60 per Mcfe in 2010. The rate per Mcfe was impacted by utilization of the East Texas/North Louisiana Carry during the first quarter of 2011. While the Appalachia Carry provides some benefit to our depletion rate, the impact is not significant due to the Appalachia region’s early development stages which have yet to result in significant Proved Reserves.
We recorded a $233.2 million non-cash ceiling test write-down in the fourth quarter of 2011, which will lower our depletion rate in 2012. In addition, natural gas prices in January and February 2012 were lower than the previous year’s prices used to compute our ceiling test limitations. As a result, we expect to incur additional ceiling test write-downs in 2012 if prices do not increase sufficiently during the remainder of 2012.
East Texas/North Louisiana Carry and Appalachia Carry
The remaining $30.2 million of the East Texas/North Louisiana Carry was utilized in the first quarter of 2011. As of December 31, 2011, $54.6 million of the Appalachia Carry remained.
16
Our production, prices and expenses
The following table summarizes revenues, net production of oil and natural gas sold, average sales price per unit of oil and natural gas and costs and expenses associated with the production of oil and natural gas.
| | | | | | | | | | | | |
| | | Years ended December 31, | |
(in thousands, except production and per unit amounts) | | 2011 | | | 2010 | | | 2009 | |
Revenues, production and prices: | | | | | | | | | | | | |
Oil: | | | | | | | | | | | | |
Revenue (1) | | $ | 67,440 | | | $ | 52,411 | | | $ | 84,397 | |
Production sold (Mbbl) | | | 741 | | | | 688 | | | | 1,571 | |
Average sales price per Bbl (1) | | $ | 91.01 | | | $ | 76.18 | | | $ | 53.72 | |
Natural gas: | | | | | | | | | | | | |
Revenue (1) | | $ | 686,761 | | | $ | 462,815 | | | $ | 466,108 | |
Production sold (Mmcf) | | | 178,266 | | | | 107,878 | | | | 118,736 | |
Average sales price per Mcf (1) | | $ | 3.85 | | | $ | 4.29 | | | $ | 3.93 | |
Costs and expenses: | | | | | | | | | | | | |
Average production cost per Mcfe (excluding severance and ad valorem taxes) | | $ | 0.46 | | | $ | 0.75 | | | $ | 1.08 | |
General and administrative expense per Mcfe | | $ | 0.57 | | | $ | 0.94 | | | $ | 0.77 | |
Depreciation, depletion and amortization per Mcfe | | $ | 1.99 | | | $ | 1.75 | | | $ | 1.72 | |
| (1) | Excludes the effects of derivative cash settlements and derivative financial instruments. |
Additional information related to our Vernon Field and Haynesville shale, each of which exceeded 15% of our total Proved Reserves as of December 31, 2011:
| | | | | | | | | | | | |
| | | Years ended December 31, | |
| | | 2011 | | | 2010 | | | 2009 | |
Vernon Field: | | | | | | | | | | | | |
Oil production sold (Mbbls) | | | 15 | | | | 5 | | | | 4 | |
Natural gas production sold (Mmcf) | | | 22,228 | | | | 27,122 | | | | 35,146 | |
Average price per Bbl | | $ | 91.51 | | | $ | 78.68 | | | $ | 58.95 | |
Average price per Mcf | | $ | 3.90 | | | $ | 4.31 | | | $ | 3.57 | |
Average production cost per Mcfe (excluding severance and ad valorem taxes) | | $ | 1.12 | | | $ | 1.06 | | | $ | 0.83 | |
| | | |
Haynesville Shale: | | | | | | | | | | | | |
Natural gas production sold (Mmcf) | | | 130,028 | | | | 55,298 | | | | 14,917 | |
Average price per Mcf | | $ | 3.64 | | | $ | 3.96 | | | $ | 3.21 | |
Average production cost per Mcf (excluding severance and ad valorem taxes) | | $ | 0.08 | | | $ | 0.09 | | | $ | 0.10 | |
Our interest in productive wells
The following table quantifies information regarding productive wells (wells that are currently producing oil or natural gas or are capable of production), including temporarily shut-in wells. The number of total gross oil and natural gas wells excludes any multiple completions. Gross wells refer to the total number of physical wells in which we hold a working interest, regardless of our percentage interest. A net well is not a physical well, but is a concept that reflects the actual total working interests we hold in all wells. We compute the number of net wells by totaling the percentage interests we hold in all our gross wells.
| | | | | | | | | | | | | | | | | | | | | | | | |
| | | At December 31, 2011 | |
| | | Gross wells(1) | | | Net wells | |
Areas | | Oil | | | Natural gas | | | Total | | | Oil | | | Natural gas | | | Total | |
East Texas/North Louisiana | | | 52 | | | | 1,556 | | | | 1,608 | | | | 25.3 | | | | 773.1 | | | | 798.4 | |
Appalachia | | | 355 | | | | 6,010 | | | | 6,365 | | | | 173.7 | | | | 2,729.8 | | | | 2,903.5 | |
Permian and other | | | 360 | | | | 71 | | | | 431 | | | | 338.6 | | | | 50.2 | | | | 388.8 | |
| | | | | | | | | | | | | | | | | | | | | | | | |
Total | | | 767 | | | | 7,637 | | | | 8,404 | | | | 537.6 | | | | 3,553.1 | | | | 4,090.7 | |
| | | | | | | | | | | | | | | | | | | | | | | | |
| (1) | As of December 31, 2011, we held interests in 10 gross wells with multiple completions. |
As of December 31, 2011, we were the operator of 7,872 gross (4,027.6 net) wells, which represented approximately 96.2% of our proved developed producing reserves as of December 31, 2011.
17
Our drilling activities
Since 2009, we have been primarily focused on horizontal drilling in shale plays, particularly in the Haynesville/Bossier and Marcellus shales.
The following tables summarize our approximate gross and net interests in the wells we drilled during the periods indicated and refer to the number of wells completed during the period, regardless of when drilling was initiated. At December 31, 2011, we had 22 gross (8.6 net) wells being drilled and 57 gross (19.9 net) wells being completed or awaiting completion.
| | | | | | | | | | | | | | | | | | | | | | | | |
| | | Development wells | |
| | | Gross | | | Net | |
| | | Productive | | | Dry | | | Total | | | Productive | | | Dry | | | Total | |
Year ended December 31, 2011 | | | 255 | | | | 2 | | | | 257 | | | | 116.9 | | | | 1.9 | | | | 118.8 | |
Year ended December 31, 2010 | | | 171 | | | | 0 | | | | 171 | | | | 83.4 | | | | 0 | | | | 83.4 | |
Year ended December 31, 2009 | | | 82 | | | | 1 | | | | 83 | | | | 40.8 | | | | 0.9 | | | | 41.7 | |
| |
| | | Exploratory wells | |
| | | Gross | | | Net | |
| | | Productive | | | Dry | | | Total | | | Productive | | | Dry | | | Total | |
Year ended December 31, 2011 (1) | | | 80 | | | | 2 | | | | 82 | | | | 26.9 | | | | 2.0 | | | | 28.9 | |
Year ended December 31, 2010 | | | 34 | | | | 2 | | | | 36 | | | | 13.8 | | | | 2.0 | | | | 15.8 | |
Year ended December 31, 2009 | | | 19 | | | | 1 | | | | 20 | | | | 12.2 | | | | 1.0 | | | | 13.2 | |
| (1) | Our 2011 exploratory wells include Haynesville shale wells located outside of DeSoto Parish and southern Caddo Parish, Louisiana, the Shelby Area and all Marcellus shale wells. We also classify our Bossier shale test wells as exploratory projects. Haynesville shale drilling in DeSoto Parish and southern Caddo Parish, Louisiana and Northeast Pennsylvania are classified as development. |
Our developed and undeveloped acreage
Developed acreage includes those acres spaced or assignable to producing wells. Undeveloped acreage represents those acres that do not currently have completed wells capable of producing commercial quantities of oil or natural gas, regardless of whether the acreage contains Proved Reserves. The definitions of gross acres and net acres conform to how we determine gross wells and net wells. The following table sets forth our developed and undeveloped acreage:
| | | | | | | | | | | | | | | | |
| | | At December 31, 2011 | |
| | | Developed acreage | | | Undeveloped acreage | |
Areas | | Gross | | | Net | | | Gross | | | Net | |
East Texas/North Louisiana | | | 222,887 | | | | 109,766 | | | | 44,359 | | | | 22,406 | |
Appalachia | | | 398,383 | | | | 177,509 | | | | 361,032 | | | | 148,566 | |
Permian and other | | | 32,350 | | | | 30,402 | | | | 39,345 | | | | 7,214 | |
| | | | | | | | | | | | | | | | |
Total | | | 653,620 | | | | 317,677 | | | | 444,736 | | | | 178,186 | |
| | | | | | | | | | | | | | | | |
The primary terms of our oil and natural gas leases expire at various dates. Much of our undeveloped acreage is held-by-production, which means that these leases are active as long as we produce oil or natural gas from the acreage or comply with certain lease terms. Upon ceasing production, these leases will expire. We have 23,622, 34,650 and 6,550 net acres with leases expiring in 2012, 2013 and 2014, respectively. Approximately 40.0% of the scheduled expiring acreage is located within our shale resource plays.
The held-by-production acreage in many cases represents potential additional drilling opportunities through down-spacing and drilling of proved undeveloped and unproved locations in the same formation(s) already producing, as well as other non-producing formations, in a given oil or natural gas field without the necessity of purchasing additional leases or producing properties.
18
Equity investments
Midstream operations
EXCO and BG Group each own a 50% interest in TGGT and the Appalachia Midstream JV, which provide midstream services to natural gas producers. Although we use the equity method of accounting for these investments, our midstream operations are treated as a business segment for financial reporting purposes. See “Note 15. Segment information” in our notes to consolidated financial statements for additional details regarding our midstream business segments.
TGGT’s operations are principally designed to facilitate delivery of natural gas produced in the East Texas/North Louisiana region to markets. Revenues are primarily derived from sales of natural gas purchased for resale and fixed fees earned from gathering, treating and compression of natural gas. TGGT does not own natural gas processing facilities.
TGGT increased its throughput in 2011 in its core areas of operation within East Texas and North Louisiana. TGGT’s primary customers are EXCO and BG Group. TGGT owns and operates TGG Pipeline, Ltd., or TGG, and Talco Midstream Assets, Ltd., or Talco. The assets of TGG include treating facilities and gathering pipelines that connect to downstream pipelines. Talco’s assets primarily consist of gathering pipelines that provide well hookups and lateral connections. Current throughput totals approximately 1.5 Bcf per day.
TGG operates amine, glycol, and H2S treating facilities, which treat natural gas to meet pipeline specifications for downstream transportation. TGG’s system, which has access to 14 interstate and intrastate pipeline markets, has approximately 127 miles of pipeline comprised of 12, 16, and 20-inch diameter pipe in the East Texas area and 27 miles of pipeline comprised of 36-inch diameter pipe in the North Louisiana area.
Additionally, TGG initiated major midstream expansion efforts in 2011 in the Shelby Area. The Shelby Area’s system has approximately 73 miles of operational pipeline as of December 31, 2011. An additional 35 miles of pipeline and a treating facility is expected to become operational in the first half of 2012 which will provide treating capacity of approximately 250 Mmcf per day.
Through Talco, TGGT owns and operates a network of gas gathering systems comprised of over 850 miles of pipeline located in East Texas and North Louisiana as of December 31, 2011. These gathering pipelines primarily service Cotton Valley production in East Texas/North Louisiana and Haynesville/Bossier production in North Louisiana. Approximately 275 miles of Talco’s gathering lines are located in the core area of the Haynesville/Bossier shale in North Louisiana. Natural gas is gathered through fixed fee arrangements pursuant to which the fee income represents an agreed rate per unit of throughput. The revenues earned from these arrangements are directly related to the volume of natural gas that flows through the systems and are not directly dependent on commodity prices.
Our Appalachia Midstream JV’s focus is to maximize take-away from existing infrastructure as the Marcellus shale region develops. The Appalachia Midstream JV has begun installing and operating gathering systems and compression facilities to support our development drilling program in the Appalachia JV.
Appalachia JV
OPCO serves as the operator of our Appalachia producing and development operations and owns a 0.5% working interest in our Appalachia joint venture properties. EXCO and BG Group each own 50% of OPCO.
Our principal customers
In 2011, sales to BG Energy Merchants LLC accounted for approximately 36.0% of total consolidated revenues. BG Energy Merchants LLC is a subsidiary of BG Group. The loss of any significant customer may cause a temporary interruption in sales of, or lower price for, our oil and natural gas, but we believe that the loss of any one customer would not have a material adverse effect on our results of operations or financial condition.
Competition
The oil and natural gas industry is highly competitive, particularly with respect to acquiring prospective oil and natural gas properties and oil and natural gas reserves. We encounter strong competition from other independent operators and from major oil companies in acquiring properties, contracting for drilling equipment and securing trained personnel. Many of these competitors have financial and technical resources and headcount substantially larger than ours. Many of these companies not only engage in the acquisition, exploration, development, and production of oil and natural gas reserves, but also have refining operations, market refined products, own drilling rigs and generate electricity.
19
The oil and natural gas industry has periodically experienced shortages of drilling rigs, equipment, pipe and personnel, which has delayed development drilling and other exploitation activities and has caused significant price increases and operational delays. Depending on the region, we may experience difficulties in obtaining drilling rigs and other services in certain areas as well as an increase in the cost for these services and related material and equipment. We are unable to predict when, or if, supply or demand imbalances occur or how these market-driven factors impact prices, which affects our development and exploitation programs. Competition has also been intense for hiring experienced personnel, particularly in petroleum engineering, geoscience, accounting and financial reporting, tax and land professions. In addition, the market for oil and natural gas producing properties is competitive. We are often outbid by competitors in our attempts to acquire properties. The oil and natural gas industry also faces competition from alternative fuel sources, including other fossil fuels such as coal. Competitive conditions may be affected by future legislation and regulations as the U.S. develops new energy and climate-related policies. All of these challenges could make it more difficult to execute our growth strategy and increase our costs.
Applicable laws and regulations
General
The oil and natural gas industry is extensively regulated by numerous federal, state and local authorities. Legislation affecting the oil and natural gas industry is under constant review for amendment or expansion, which could increase the regulatory burden and the potential for financial sanctions for noncompliance. Although the regulatory burden on the oil and gas industry increases our cost of doing business and, consequently, affects our profitability, these burdens generally do not affect us any differently or to any greater or lesser extent than they affect others in our industry with similar types, quantities and locations of production.
The following is a summary of the more significant existing environmental, safety and other laws and regulations to which our business operations are subject and with which compliance may have a material adverse effect on our capital expenditures, earnings or competitive position.
Production regulation
Our production operations are subject to a number of regulations at the federal, state and local levels. These regulations require, among other things, permits for the drilling of wells, drilling bonds and reports concerning operations. Most states, and some counties and municipalities, in which we operate, also regulate one or more of the following:
| | • | | the method of drilling, completion and operating wells; |
| | • | | the surface use and restoration of properties upon which wells are drilled; |
| | • | | the plugging and abandoning of wells; |
| | • | | notice to surface owners and other third parties; and |
| | • | | produced water and waste disposal. |
State laws regulate the size and shape of drilling and spacing units or proration units governing the pooling of oil and natural gas properties. Some states allow forced pooling or integration of tracts to facilitate exploration while other states rely on voluntary pooling of lands and leases. In some instances, forced pooling or unitization may be implemented by third parties and may reduce our interest in the unitized properties. In addition, state conservation laws establish maximum rates of production from oil and natural gas wells and generally prohibit the venting or flaring of natural gas and impose requirements requiring that oil and gas be produced in a prorated, equitable system. These laws and regulations may limit the amount of oil and natural gas we can produce from our wells or limit the number of wells or the locations at which we can drill. Moreover, most states generally impose a production, ad valorem or severance tax with respect to the production and sale of oil and natural gas within its jurisdiction. States do not generally regulate wellhead prices or engage in other, similar direct economic regulation, but there can be no assurance they will not do so in the future.
Our operations are subject to numerous stringent federal and state statutes and regulations governing the discharge of materials into the environment or otherwise relating to environmental protection, some of which carry substantial administrative, civil and criminal penalties for failure to comply. These laws and regulations may require the acquisition of a permit before drilling commences, restrict the types, quantities and concentrations of various substances that can be released into the environment in connection with drilling, production and transporting, govern the sourcing, storage and disposal of water used in the drilling and completion process, restrict or prohibit drilling activities in certain areas and on certain lands lying within wetlands and other protected areas, require closing earthen impoundments and impose liabilities for pollution resulting from operations or failure to comply with regulatory filings.
20
Statutes, rules and regulations affecting exploration and production undergo constant review and often are amended, expanded and reinterpreted, making the prediction of future costs or the impact of regulatory compliance to new laws and statutes difficult. The regulatory burden on the oil and gas industry increases its cost of doing business and, consequently, affects its profitability.
FERC matters
The availability, terms and cost of downstream transportation significantly affect sales of natural gas, oil and NGLs. The interstate transportation and sale for resale is subject to federal regulation, including regulation of the terms, conditions and rates for interstate transportation, storage and various other matters, primarily by the Federal Energy Regulatory Commission, or FERC. Since 1985, FERC has implemented regulations intended to increase competition within the natural gas industry by making natural gas transportation more accessible to gas buyers and sellers on an open-access, non-discriminatory basis. Federal and state regulations govern the rates and terms for access to intrastate natural gas pipeline transportation, while states alone regulate natural gas gathering activities. With regard to oil and NGLs, the rates and terms and conditions of service for interstate transportation is regulated by FERC. Tariffs for such transportation must be just and reasonable and not unduly discriminatory. Oil and NGL transportation that is not federally regulated is left to state regulation.
Wholesale prices for natural gas, oil and NGLs are not currently regulated and are determined by the market. We cannot predict, however, whether new legislation to regulate the price of energy commodities might be proposed, what proposals, if any, might actually be enacted by Congress or the various state legislatures, and what effect, if any, the proposals might have on the operations of the underlying properties.
Under the Energy Policy Act of 2005, FERC possesses regulatory oversight over natural gas markets, including the purchase, sale and transportation activities of natural gas market participants other than intrastate pipelines. The Commodity Futures Trading Commission, or the CFTC, also holds authority to monitor certain segments of the physical and futures energy commodities market pursuant to the Commodity Exchange Act and the Dodd Frank Wall Street Reform and Consumer Protection Act of 2010, or the Dodd Frank Act. With regard to our physical sales of natural gas, oil and NGLs, our gathering of any of these energy commodities, and any related hedging activities that we undertake, we are required to observe these anti-market manipulation laws and related regulations enforced by FERC and/or the CFTC. These agencies hold substantial enforcement authority, including the ability to assess civil penalties of up to $1 million per day per violation, to order disgorgement of profits and to recommend criminal penalties. Should we violate the anti-market manipulation laws and regulations, we could also be subject to related third party damage claims by, among others, sellers, royalty owners and taxing authorities.
Federal, state or Indian oil and natural gas leases
In the event we conduct operations on federal, state or Indian oil and natural gas leases, these operations must comply with numerous regulatory restrictions, including various nondiscrimination statutes, royalty and related valuation requirements, and certain of these operations must be conducted pursuant to certain on-site security regulations and other appropriate permits issued by the Bureau of Land Management, Bureau of Ocean Energy Management, Bureau of Safety and Environmental Enforcement or other appropriate federal, or tribal state agencies.
Surface Damage Acts
In addition, eleven states and some tribal nations have enacted surface damage statutes, or SDAs. These laws are designed to compensate for damage caused by mineral development. Most SDAs contain entry notification and negotiation requirements to facilitate contact between operators and surface owners/users. Most also contain bonding requirements and specific expenses for exploration and activities. Costs and delays associated with SDAs could impair operational effectiveness and increase development costs.
Other regulatory matters relating to our pipeline and gathering system assets
The pipelines we use to gather and transport our oil and natural gas are subject to regulation by the U.S. Department of Transportation, or DOT, under the Hazardous Liquid Pipeline Safety Act of 1979, as amended, or the HLPSA, with respect to oil, and the Natural Gas Pipeline Safety Act of 1968, as amended, or the NGPSA, with respect to natural gas. The HLPSA and NGPSA govern the design, installation, testing, construction, operation, replacement and management of natural gas and hazardous liquids pipeline facilities, including pipelines transporting crude oil. Where applicable, the HLPSA and NGPSA also require us and other pipeline operators to comply with regulations issued pursuant to these acts that are designed to permit access to and allow copying of records and to make certain reports available and provide information as required by the Secretary of Transportation.
21
The Pipeline Safety Act of 1992, as reauthorized and amended, or the Pipeline Safety Act, mandates requirements in the way that the energy industry ensures the safety and integrity of its pipelines. The law applies to natural gas and hazardous liquids pipelines, including some natural gas gathering pipelines. Central to the law are the requirements it places on each pipeline operator to prepare and implement an “integrity management program.” The Pipeline Safety Act mandates a number of other requirements, including increased penalties for violations of safety standards and qualification programs for employees who perform sensitive tasks. The DOT has established a number of rules carrying out the provisions of this act. The DOT Pipeline and Hazardous Materials Safety Administration, or the PHMSA, has established a new risk-based approach to determine which gathering pipelines are subject to regulation, and what safety standards regulated pipelines must meet. We could incur significant expenses as a result of these laws and regulations.
The Pipeline Safety, Regulatory Certainty, and Job Creation Act of 2011 was signed into law on January 3, 2012. This bill includes a number of provisions affecting pipeline owners and operators that became effective upon approval, including increased civil penalties for violators of pipeline regulations and additional reporting requirements. Most of the changes do not impact natural gas gathering lines. The act also tasks DOT and Comptroller General with conducting several studies over the next two years, including a study and report to Congress on existing gathering line regulations. This study will be closely watched to determine what effect, if any, future changes would have on our gathering operations.
U.S. federal taxation
The federal government may propose tax initiatives that affect us. We are unable to determine what effect, if any, future proposals would have on product demand or our results of operations.
U.S. environmental regulations
The exploration, development and production of oil and natural gas, including the operation of saltwater injection and disposal wells, are subject to various federal, state and local environmental laws and regulations. These laws and regulations can increase the costs of planning, designing, installing and operating oil and natural gas wells. Federal environmental statutes to which our domestic activities are subject include, but are not limited to:
| | • | | the Oil Pollution Act of 1990, or OPA; |
| | • | | the Clean Water Act of 1972, or CWA; |
| | • | | the Rivers and Harbors Act of 1899; |
| | • | | the Comprehensive Environmental Response, Compensation and Liability Act, as amended, or CERCLA; |
| | • | | the Resource Conservation and Recovery Act, or RCRA; |
| | • | | the Clean Air Act, or CAA; and |
| | • | | the Safe Drinking Water Act, or SDWA. |
Our domestic activities are subject to regulations promulgated under these statutes and comparable state statutes. We also are subject to regulations governing the handling, transportation, storage and disposal of naturally occurring radioactive materials that are found in our oil and natural gas operations. Administrative, civil and criminal penalties, as well as injunctive relief, may be imposed for non-compliance with environmental laws and regulations. Additionally, these laws and regulations require the acquisition of permits or other governmental authorizations before we undertake certain activities, limit or prohibit other activities because of protected areas or species, impose certain substantial liabilities for the clean-up of pollution, impose certain reporting requirements, regulate remedial plugging operations to prevent future contamination, and require substantial expenditures for compliance. We cannot predict what effect future regulation or legislation, enforcement policies, and claims for damages to property, employees, other persons and the environment resulting from our operations could have on our activities.
Under the CWA, which was amended and augmented by OPA, our release or threatened release of oil or hazardous substances into or upon waters of the United States, adjoining shorelines and wetlands and offshore areas could result in our being held responsible for: (1) the costs of removing or remediating a release; (2) administrative, civil or criminal fines or penalties; or (3) specified damages, such as loss of use, property damage and natural resource damages. The scope of our liability could be extensive depending upon the circumstances of the release. Liability can be joint and several and without regard to fault. The CWA also may impose permitting requirements for certain discharges into waters of the United States, including certain wetlands, of dredged materials, which may apply to various of our construction activities, as well as requirements to develop Spill Prevention Control and Countermeasure Plans and Facility Response Plans to address potential discharges of oil into or upon waters of the United States and adjoining shorelines. State laws governing discharges to water also provide varying civil, criminal and administrative penalties and impose liabilities in the case of a discharge of petroleum or its derivatives, or other hazardous substances, into state waters.
22
CERCLA often referred to as Superfund, and comparable state statutes, impose liability that is generally joint and several and that is retroactive for costs of investigation and remediation and for natural resource damages, without regard to fault or the legality of the original conduct, on specified classes of persons for the release of a “hazardous substance” or under state law, other specified substances, into the environment. So-called potentially responsible parties, or PRPs, include the current and certain past owners and operators of a facility where there has been a release or threat of release of a hazardous substance and persons who disposed of or arranged for the disposal of hazardous substances found at a site. CERCLA also authorizes the Environmental Protection Agency, or EPA, and, in some cases, third parties to take actions in response to threats to the public health or the environment and to seek to recover from the PRPs the cost of such action. Liability can arise from conditions on properties where operations are conducted, even under circumstances where such operations were performed by third parties not under our control, and/or from conditions at third party disposal facilities where wastes from operations were sent. Although CERCLA currently exempts petroleum (including oil, natural gas and NGLs) from the definition of hazardous substance, some similar state statutes do not provide such an exemption. We cannot ensure that this exemption will be preserved in any future amendments of the act. Such amendments could have a material impact on our costs or operations. Additionally, our operations may involve the use or handling of other materials that may be classified as hazardous substances under CERCLA or regulated under similar state statutes. We may also be the owner or operator of sites on which hazardous substances have been released. To our knowledge, neither we nor our predecessors have been designated as a PRP by the EPA under CERCLA. We also do not know of any prior owners or operators of our properties that are named as PRPs related to their ownership or operation of such properties. In the event hazardous substance contamination is discovered at a site on which we are or have been an owner or operator or to which we have sent materials, we could be liable for costs of investigation and remediation and natural resource damages.
Oil and natural gas exploration and production, and possibly other activities, have been conducted at a majority of our properties by previous owners and operators. Materials from these operations remain on some of the properties and in certain instances may require remediation. In some instances, we have agreed to indemnify the sellers of producing properties from whom we have acquired reserves against certain liabilities for environmental claims associated with the properties. We do not believe the costs to be incurred by us for compliance and remediating previously or currently owned or operated properties will be material, but we cannot guarantee that result.
If in the course of our routine oil and natural gas operations, surface spills and leaks occur, including casing leaks of oil or other materials, we may incur penalties and costs for waste handling, remediation and third party actions for damages. Moreover, we are only able to directly control the operations of the wells that we operate. Notwithstanding our lack of control over wells owned by us but operated by others, the failure of the operator to comply with applicable environmental regulations may be attributable to us and may impose legal liabilities upon us.
If substantial liabilities to third parties or governmental entities are incurred, the payment of such claims may reduce or eliminate the funds available for project investment or result in loss of our properties. Although we maintain insurance coverage we consider to be customary in the industry, we are not fully insured against all of these risks, either because insurance is not available or because of high premiums. Accordingly, we may be subject to liability or may lose substantial portions of properties due to hazards that cannot be insured against or have not been insured against due to prohibitive premiums or for other reasons. The imposition of any of these liabilities or compliance obligations on us may have a material adverse effect on our financial condition and results of operations.
RCRA and comparable state and local programs impose requirements on the management, treatment, storage and disposal of both hazardous and nonhazardous solid wastes. Although we believe we utilize operating and waste disposal practices that are standard in the industry, hydrocarbons or other solid wastes may have been disposed or released on or under the properties we own or lease, in addition to the locations where such wastes have been taken for disposal. In addition, many of these properties have been owned or operated by third parties. We have not had control over such parties’ treatment of hydrocarbons or other solid wastes and the manner in which such substances may have been disposed or released. We also generate hazardous and non-hazardous solid waste in our routine operations. It is possible that certain wastes generated by our operations, which are currently exempt from “hazardous waste” regulations under RCRA, may in the future be designated as “hazardous waste” under RCRA or other applicable state statutes and become subject to more rigorous and costly management and disposal requirements.
Our operations are subject to local, state and federal regulations for the control of emissions from sources of air pollution. The CAA and analogous state laws require certain new and modified sources of air pollutants to obtain permits prior to commencing construction. Smaller sources may qualify for exemption from permit requirements, for example, through qualifications for permits by rule or general permits. Major sources of air pollutants are subject to more stringent, federally imposed requirements including additional operating permits. Federal and state laws designed to control hazardous (i.e., toxic) air pollutants might require installation of additional controls. Administrative enforcement actions for failure to comply strictly with air pollution regulations or permits are generally resolved by payment of monetary fines and correction of any identified deficiencies. Alternatively, regulatory agencies could bring lawsuits for civil penalties or require us to forgo construction, modification or operation of certain air emission sources.
23
On July 28, 2011, the EPA proposed a rule to subject oil and gas operations to regulation under the New Source Performance Standards, or NSPS, and National Emission Standards for Hazardous Air Pollutants, or NESHAPS, programs under the CAA, and to impose new and amended requirements under both programs. Under the proposal, the EPA would, among other things, amend standards applicable to natural gas processing plants and would expand the NSPS to include all oil and gas operations, imposing requirements on those operations. The EPA is also proposing NSPS standards for completions of hydraulically fracturing gas wells. The proposed standards include the reduced emission completion techniques. The NESHAPS proposal includes maximum achievable control technology, or MACT, standards for certain glycol dehydrators and storage vessels, and revises applicability provisions, alternative test protocols and the availability of the startup, shutdown and maintenance exemption. The EPA is under a court order to finalize the rules by April 3, 2012. Should these rules become final and applicable to our operations, they could result in increased operating and compliance costs, increased regulatory burdens and delays in our operations.
There are various federal and state programs that regulate the conservation and development of coastal resources. The federal Coastal Zone Management Act, or CZMA, was passed in 1972 to preserve and, where possible, restore the natural resources of the coastal zone of the United States. The CZMA provides for federal grants for state management programs that regulate land use, water use and coastal development. Many states, including, also have coastal management programs, which provide for, among other things, the coordination among local and state authorities to protect coastal resources through regulating land use, water, and coastal development. Coastal management programs also may provide for the review of state and federal agency rules and agency actions for consistency with the goals and policies of the state coastal management plan. In the event our activities trigger these programs, this review of agency rules and actions may impact other agency permitting and review activities, resulting in possible delays or restrictions of our activities and adding an additional layer of review to certain activities undertaken by us.
We are unable to assure that more stringent laws and regulations protecting the environment will not be adopted and that we will not incur material expenses in complying with them in the future. For example, although federal legislation regarding the control of emissions of greenhouse gases or GHGs, for the present, appears unlikely, the EPA has been implementing regulatory measures under existing CAA authority and some of those regulations may affect our operations. GHGs are certain gases, including carbon dioxide, a product of the combustion of natural gas, and methane, a primary component of natural gas, that may be contributing to warming of the Earth’s atmosphere resulting in climatic changes. These GHG regulations could require us to incur increased operating costs and could have an adverse effect on demand for the oil and natural gas we produce.
On June 3, 2010, the EPA published its so-called GHG tailoring rule that will phase in federal prevention of significant deterioration, or PSD, and Title V operating permit requirements for new sources and modifications with the potential to emit specific quantities of GHGs. Those permitting provisions, when they become applicable to our operations, could require controls or other measures to reduce GHG emissions from new or modified sources, and we could incur additional costs to satisfy those requirements. On November 30, 2010, the EPA published a rule establishing GHG reporting requirements for sources in the petroleum and natural gas industry, requiring those sources to monitor, maintain records on, and annually report their GHG emissions, with the first annual report for 2011 being due in September 2012. Although this rule does not limit the amount of GHGs that can be emitted, it requires us to incur costs to monitor, recordkeep and report GHG emissions associated with our operations. In addition, some states have considered, and notably California has adopted, a state specific GHG regulatory program.
Nearly all of our exploration and production operations depend on the use of hydraulic fracturing to enhance production from oil and gas wells. Hydraulic fracturing involves the injection of water, sand and chemicals under pressure into formations to fracture the surrounding rock and stimulate production. Our hydraulic fracturing activities are focused in our shale plays in East Texas, North Louisiana, Pennsylvania and West Virginia. Many of our wells would not be economical without the use of hydraulic fracturing to stimulate production from the well.
Congress has periodically considered legislation to amend the federal SDWA to remove the exemption from regulation and permitting that is applicable to hydraulic fracturing operations and to require reporting and disclosure of chemicals used by the oil and gas industry in the hydraulic fracturing process. Sponsors of bills previously introduced before the Senate and House of Representatives have asserted that chemicals used in the fracturing process could adversely affect drinking water supplies. These bills, or similar legislation, if adopted, could increase the possibility of litigation and establish an additional level of regulation at the federal level that could lead to operational delays or increased operating costs and could result in additional regulatory burdens, making it more difficult to perform hydraulic fracturing and increasing our costs of compliance.
In addition, the EPA has recently been taking action to assert federal regulatory authority over hydraulic fracturing using diesel under the SDWA’s Underground Injection Control Program. Further, in March 2010, the EPA announced that it would conduct a wide-ranging study on the effects of hydraulic fracturing on drinking water resources. Interim results of the study are expected in 2012, with final results expected in 2014. In addition, in December 2011, the EPA published an unrelated draft report concluding that hydraulic fracturing caused groundwater pollution in a natural gas field in Wyoming. This study remains subject to review and public
24
comment. The agency also announced that one of its enforcement initiatives for 2011 to 2013 would be to focus on environmental compliance by the energy extraction sector. This study and enforcement initiative could result in additional regulatory scrutiny or further legislative or regulatory action regarding hydraulic fracturing or similar production operations that could make it difficult to perform hydraulic fracturing and increase our costs of compliance or significantly impact our business, results of operations, cash flows, financial position and future growth.
In addition, state, local and river basin conservancy districts have all previously exercised their various regulatory powers to curtail and, in some cases, place moratoriums on hydraulic fracturing. State regulations include express inclusion of hydraulic fracturing into existing regulations covering other aspects of exploration and production and specifically may include, but not be limited to, the following:
| | • | | requirement that logs and pressure test results are included in disclosures to state authorities; |
| | • | | disclosure of hydraulic fracturing fluids, chemicals, proppants and the ratios of same used in operations; |
| | • | | specific disposal regimens for hydraulic fracturing fluid; |
| | • | | replacement/remediation of contaminated water assets; and |
| | • | | minimum depth of hydraulic fracturing. |
Local regulations, which may be preempted by state and federal regulations, have included the following which may extend to all operations including those beyond hydraulic fracturing:
| | • | | noise control ordinances; |
| | • | | traffic control ordinances; |
| | • | | limitations on the hours of operations; and |
| | • | | mandatory reporting of accidents, spills and pressure test failures. |
We do not anticipate that we will be required in the near future to expend amounts that are material in relation to our total capital expenditures program complying with current environmental laws and regulations. As these laws and regulations are frequently changed and are subject to interpretation, our assessment regarding the cost of compliance or the extent of liability risks may change in the future.
OSHA and other regulations
We are subject to the requirements of the federal Occupational Safety and Health Act, or OSHA, and comparable state statutes. The OSHA hazard communication standard, the EPA community right-to-know regulations under the Title III of CERCLA and similar state statutes require that we organize and/or disclose information about hazardous materials used or produced in our operations. We believe that we are in substantial compliance with these applicable requirements and with other OSHA and comparable state requirements.
Title to our properties
When we acquire developed properties, we conduct a title investigation. However, when we acquire undeveloped properties, as is common industry practice, we usually conduct little or no investigation of title other than a preliminary review of local mineral records. We do conduct title investigations and, in most cases, obtain a title opinion of local counsel before we begin drilling operations. We believe that the methods we utilize for investigating title prior to acquiring any property are consistent with practices customary in the oil and natural gas industry and that our practices are adequately designed to enable us to acquire marketable title to properties. However, some title risks cannot be avoided, despite the use of customary industry practices.
Our properties are generally burdened by:
| | • | | customary royalty and overriding royalty interests; |
| | • | | liens incident to operating agreements; and |
| | • | | liens for current taxes and other burdens and minor encumbrances, easements and restrictions. |
We believe that none of these burdens either materially detract from the value of our properties or materially interfere with property used in the operation of our business. Substantially all of our properties are pledged as collateral under our credit agreement.
25
Operational Factors
Oil and natural gas exploration and development involves a high degree of risk, which even a combination of experience, knowledge and careful evaluation may not be able to overcome. In the event of exploration failures, environmental damage, or other accidents such as well fires, blowouts, equipment failure and human error, substantial liabilities to third parties or governmental entities may be incurred, the satisfaction of which could substantially reduce available cash and possibly result in the loss of oil and natural gas properties. As is common in the oil and natural gas industry, we are not fully insured against all risks associated with our business either because such insurance is not available or because we believe the premium costs are prohibitive. A loss not fully covered by insurance could have a materially adverse effect on our operating results, financial position or cash flows. For further discussion on risks see “Item 1A. Risk Factors.”
Our employees
As of December 31, 2011, we employed 1,093 persons. None of our employees are represented by unions or covered by collective bargaining agreements. To date, we have not experienced any strikes or work stoppages due to labor problems, and we consider our relations with our employees to be satisfactory. We also utilize the services of independent consultants and contractors.
Forward-looking statements
This Annual Report on Form 10-K contains forward-looking statements, as defined in Section 27A of the Securities Act of 1933, as amended, or the Securities Act, and Section 21E of the Securities Exchange Act of 1934, or the Exchange Act. These forward-looking statements relate to, among other things, the following:
| | • | | our future financial and operating performance and results; |
| | • | | our future use of derivative financial instruments; and |
| | • | | our plans and forecasts. |
We have based these forward-looking statements on our current assumptions, expectations and projections about future events.
We use the words “may,” “expect,” “anticipate,” “estimate,” “believe,” “continue,” “intend,” “plan,” “budget,” variations of such words and other similar words to identify forward-looking statements. You should read statements that contain these words carefully because they discuss future expectations, contain projections of results of operations or of our financial condition and/or state other “forward-looking” information. We do not undertake any obligation to update or revise publicly any forward-looking statements, except as required by law. These statements also involve risks and uncertainties that could cause our actual results or financial condition to materially differ from our expectations in this Annual Report on Form 10-K, including, but not limited to:
| | • | | fluctuations in prices of oil and natural gas; |
| | • | | imports of foreign oil and natural gas, including liquefied natural gas; |
| | • | | future capital requirements and availability of financing; |
| | • | | disruption of credit and capital markets and the ability of financial institutions to honor their commitments; |
| | • | | estimates of reserves and economic assumptions; |
| | • | | geological concentration of our reserves; |
| | • | | risks associated with drilling and operating wells; |
| | • | | exploratory risks, including our Marcellus shale play in Appalachia and the Haynesville/Bossier shale play in East Texas/North Louisiana; |
| | • | | risks associated with the operation of natural gas pipelines and gathering systems; |
| | • | | discovery, acquisition, development and replacement of oil and natural gas reserves; |
| | • | | cash flow and liquidity; |
| | • | | timing and amount of future production of oil and natural gas; |
| | • | | availability of drilling and production equipment; |
| | • | | marketing of oil and natural gas; |
| | • | | developments in oil-producing and natural gas-producing countries; |
| | • | | title to our properties; |
| | • | | general economic conditions, including costs associated with drilling and operations of our properties; |
26
| | • | | environmental or other governmental regulations, including legislation to reduce emissions of greenhouse gases, legislation of derivative financial instruments, regulation of hydraulic fracture stimulation and elimination of income tax incentives available to our industry; |
| | • | | receipt and collectability of amounts owed to us by purchasers of our production and counterparties to our derivative financial instruments; |
| | • | | decisions whether or not to enter into derivative financial instruments; |
| | • | | potential acts of terrorism; |
| | • | | actions of third party co-owners of interests in properties in which we also own an interest; |
| | • | | fluctuations in interest rates; and |
| | • | | our ability to effectively integrate companies and properties that we acquire. |
We believe that it is important to communicate our expectations of future performance to our investors. However, events may occur in the future that we are unable to accurately predict, or over which we have no control. You are cautioned not to place undue reliance on a forward-looking statement. When considering our forward-looking statements, you should keep in mind the risk factors and other cautionary statements in this Annual Report on Form 10-K. The risk factors noted in this Annual Report on Form 10-K and other factors noted throughout this Annual Report on Form 10-K, provide examples of risks, uncertainties and events that may cause our actual results to differ materially from those contained in any forward-looking statement. Please see “Item 1A. Risk Factors” for a discussion of certain risks of our business and an investment in our securities.
Our revenues, operating results and financial condition depend substantially on prevailing prices for oil and natural gas and the availability of capital from our credit agreement. Declines in oil or natural gas prices may have a material adverse effect on our financial condition, liquidity, results of operations, the amount of oil or natural gas that we can produce economically and the ability fund our operations. Historically, oil and natural gas prices and markets have been volatile, with prices fluctuating widely, and they are likely to continue to be volatile.
Glossary of selected oil and natural gas terms
The following are abbreviations and definitions of terms commonly used in the oil and natural gas industry and this Annual Report on Form 10-K.
2-D seismic. Geophysical data that depicts the subsurface strata in two dimensions.
3-D seismic. Geophysical data that depicts the subsurface strata in three dimensions. 3-D seismic typically provides a more detailed and accurate interpretation of the subsurface strata than 2-D, or two-dimensional, seismic.
Appraisal wells. Wells drilled to convert an area or sub-region from the resource to the reserves category.
Bbl. One stock tank barrel, or 42 U.S. gallons liquid volume, used in reference to oil or other liquid hydrocarbons.
Bcf. One billion cubic feet of natural gas.
Bcfe. One billion cubic feet equivalent calculated by converting one Bbl of oil or NGLs to six Mcf of natural gas.
Btu. British thermal unit, which is the heat required to raise the temperature of a one pound mass of water from 58.5 to 59.5 degrees Fahrenheit.
Commercial Well; Commercially Productive Well. An oil and natural gas well which produces oil and natural gas in sufficient quantities such that proceeds from the sale of such production exceed production expenses and taxes.
Completion. The installation of permanent equipment for the production of oil or natural gas, or, in the case of a dry hole, the reporting of abandonment to the appropriate agency.
Deterministic estimate. The method of estimating reserves or resources when a single value for each parameter (from the geoscience, engineering, or economic data) in the reserves calculation is used in the reserves estimation procedure.
Developed Acreage. The number of acres which are allocated or assignable to producing wells or wells capable of production.
27
Development Well. A well drilled within the proved area of an oil or natural gas reservoir, or which extends a proved reservoir, to the depth of a stratigraphic horizon known to be productive.
Downspacing Wells. Additional wells drilled between known producing wells to better exploit the reservoir.
Dry Hole; Dry Well. A well found to be incapable of producing either oil or natural gas in sufficient quantities to justify completion as an oil or natural gas well.
Economically producible. As it relates to a resource, a resource which generates revenue that exceeds, or is reasonably expected to exceed, the costs of the operation.
Exploitation. The continuing development of a known producing formation in a previously discovered field. To maximize the ultimate recovery of oil or natural gas from the field by development wells, secondary recovery equipment or other suitable processes and technology.
Exploratory Well. A well drilled in unproven or semi-proven territory for the purpose of ascertaining the presence underground of a commercial petroleum deposit. An exploratory well may be drilled either (a) in search of a new and as yet undiscovered pool (of oil or natural gas) or (b) with the hope of greatly extending the limits of a pool that is already developed. These types of wells may also be referred to as appraisal or delineation wells.
Farmout. An assignment of an interest in a drilling location and related acreage conditional upon the drilling of a well on that location.
Formation. A succession of sedimentary beds that were deposited under the same general geologic conditions.
Fracture Stimulation. A stimulation treatment routinely performed involving the injection of water, sand and chemicals under pressure to stimulate hydrocarbon production in low-permeability reservoirs.
Full Cost Pool. The full cost pool consists of all costs associated with property acquisition, exploration, and development activities for a company using the full cost method of accounting. Additionally, any internal costs that can be directly identified with acquisition, exploration and development activities are included. Any costs related to production, general corporate overhead or similar activities are not included.
Gross Acres or Gross Wells. The total acres or wells, as the case may be, in which a working interest is owned.
Held-by-production.A provision in an oil, gas and mineral lease that perpetuates a company’s right to operate a property or concession as long as the property or concession produces a minimum paying quantity of oil or natural gas.
Horizontal Wells. Wells which are drilled at angles greater than 70 degrees from vertical.
Infill drilling. Drilling of a well between known producing wells to better exploit the reservoir.
Initial production rate. Generally, the maximum 24 hour production volume from a well.
Mbbl. One thousand stock tank barrels.
Mcf. One thousand cubic feet of natural gas.
Mcfe. One thousand cubic feet equivalent calculated by converting one Bbl of oil or NGLs to six Mcf of natural gas.
Mmbbl. One million stock tank barrels.
Mmbtu. One million British thermal units.
Mmcf. One million cubic feet of natural gas.
Mmcf/d. One million cubic feet of natural gas per day.
Mmcfe. One million cubic feet equivalent calculated by converting one Bbl of oil or NGLs to six Mcf of natural gas.
28
Mmcfe/d. One million cubic feet equivalent per day calculated by converting one Bbl of oil or NGLs to six Mcf of natural gas.
Mmmbtu. One billion British thermal units.
Net Acres or Net Wells. The sum of the fractional working interests owned in gross acres or gross wells.
NYMEX. New York Mercantile Exchange.
NGLs. The combination of ethane, propane, butane and natural gasolines that when removed from natural gas become liquid under various levels of higher pressure and lower temperature.
Overriding royalty interest. An interest in an oil and/or natural gas property entitling the owner to a share of oil and natural gas production free of the costs of production.
Pad drilling. The drilling of multiple wells from the same site.
Play. A term applied to a portion of the exploration and production cycle following the identification by geologists and geophysicists of areas with potential oil and gas reserves.
Present value of estimated future net revenues or PV-10. The present value of estimated future net revenues is an estimate of future net revenues from a property at the date indicated, without giving effect to derivative financial instrument activities, after deducting production and ad valorem taxes, future capital costs, abandonment costs and operating expenses, but before deducting future federal income taxes. The future net revenues have been discounted at an annual rate of 10% to determine their “present value.” The present value is shown to indicate the effect of time on the value of the net revenue stream and should not be construed as being the fair market value of the properties. Estimates have been made using constant oil and natural gas prices and operating and capital costs at the date indicated, at its acquisition date, or as otherwise indicated. We believe that the present value of estimated future net revenues before income taxes, while not a financial measure in accordance with GAAP, is an important financial measure used by investors and independent oil and natural gas producers for evaluating the relative significance of oil and natural gas properties and acquisitions because the tax characteristics of comparable companies can differ materially.
Probabilistic estimate. The method of estimation of reserves or resources when the full range of values that could reasonably occur for each unknown parameter (from the geoscience and engineering data) is used to generate a full range of possible outcomes and their associated probabilities of occurrence.
Productive Well. A productive well is a well that is not a dry well.
Proved Developed Reserves. Developed oil and natural gas reserves are reserves of any category that can be expected to be recovered (i) through existing wells with existing equipment and operating methods or in which the cost of the required equipment is relatively minor compared to the cost of a new well; and (ii) through installed extraction equipment and infrastructure operational at the time of the reserves estimate.
Proved Reserves. Those quantities of oil and natural gas, which, by analysis of geoscience and engineering data, can be estimated with reasonable certainty to be economically producible, from a given date forward, from known reservoirs, and under existing economic conditions, operating methods, and government regulations, prior to the time at which contracts providing the right to operate expire, unless evidence indicates that renewal is reasonably certain, regardless of whether deterministic or probabilistic methods are used for the estimation. The project to extract the hydrocarbons must have commenced or the operator must be reasonably certain that it will commence the project within a reasonable time.
The area of the reservoir considered as proved includes: (i) the area identified by drilling and limited by fluid contacts, if any, and (ii) adjacent undrilled portions of the reservoir that can, with reasonable certainty, be judged to be continuous with it and to contain economically producible oil or gas on the basis of available geoscience and engineering data.
In the absence of data on fluid contacts, proved quantities in a reservoir are limited by the lowest known hydrocarbons (LKH) as seen in a well penetration unless geoscience, engineering, or performance data and reliable technology establishes a lower contact with reasonable certainty. Where direct observation from well penetrations has defined a highest known oil (HKO) elevation and the potential exists for an associated gas cap, proved oil reserves may be assigned in the structurally higher portions of the reservoir only if geoscience, engineering, or performance data and reliable technology establish the higher contact with reasonable certainty.
29
Reserves which can be produced economically through application of improved recovery techniques (including, but not limited to, fluid injection) are included in the proved classification when: (i) successful testing by a pilot project in an area of the reservoir with properties no more favorable than in the reservoir as a whole, the operation of an installed program in the reservoir or an analogous reservoir, or other evidence using reliable technology establishes the reasonable certainty of the engineering analysis on which the project or program was based; and (ii) the project has been approved for development by all necessary parties and entities, including governmental entities.
Existing economic conditions include prices and costs at which economic producibility from a reservoir is to be determined. The price shall be the average price during the 12-month period prior to the ending date of the period covered by the report, determined as an unweighted arithmetic average of the first-day-of-the-month price for each month within such period, unless prices are defined by contractual arrangements, excluding escalations based upon future conditions.
Proved Undeveloped Reserves. Reserves of any category that are expected to be recovered from new wells on undrilled acreage, or from existing wells where a relatively major expenditure is required for recompletion.
Reserves on undrilled acreage shall be limited to those directly offsetting development spacing areas that are reasonably certain of production when drilled, unless evidence using reliable technology exists that establishes reasonable certainty of economic producibility at greater distances. Undrilled locations can be classified as having undeveloped reserves only if a development plan has been adopted indicating that they are scheduled to be drilled within five years, unless the specific circumstances justify a longer time.
Under no circumstances shall estimates for undeveloped reserves be attributable to any acreage for which an application of fluid injection or other improved recovery technique is contemplated, unless such techniques have been proved effective by actual projects in the same reservoir or an analogous reservoir or by other evidence using reliable technology establishing reasonable certainty.
Recompletion. An operation within an existing well bore to make the well produce oil and/or gas from a different, separately producible zone other than the zone from which the well had been producing.
Reasonable certainty. If deterministic methods are used to classify a reserve as proved, reasonable certainty means a high degree of confidence that the quantities will be recovered. If probabilistic methods are used, there should be at least a 90% probability that the quantities actually recovered will equal or exceed the estimate. A high degree of confidence exists if the quantity is much more likely to be achieved than not, and, as changes due to increased availability of geoscience (geological, geophysical, and geochemical), engineering, and economic data are made to EUR with time, reasonably certain EUR is much more likely to increase or remain constant than to decrease.
Reserve Life. The estimated productive life, in years, of a proved reservoir based upon the economic limit of such reservoir producing hydrocarbons in paying quantities assuming certain price and cost parameters. For purposes of this Annual Report on Form 10-K, reserve life is calculated by dividing the Proved Reserves (on an Mmcfe basis) at the end of the period by production volumes.
Reservoir. A porous and permeable underground formation containing a natural accumulation of producible oil or natural gas that is confined by impermeable rock or water barriers and is individual and separate from other reserves.
Resources. All quantities of petroleum naturally occurring on or within the earth’s crust, discovered and undiscovered (recoverable and unrecoverable), plus those quantities already produced. It also includes all types of petroleum whether currently considered “conventional” or “unconventional.”
Royalty interest. An interest in an oil and/or natural gas property entitling the owner to a share of oil and natural gas production free of the costs of production.
Shale. Fine-grained sedimentary rock composed mostly of consolidated clay or mud. Shale is the most frequently occurring sedimentary rock.
Shut-in well. A producing well that has been closed down temporarily for, among other things, economics, cleaning out, building up pressure, lack of a market or lack of equipment.
30
Spud. To start the well drilling process.
Standardized Measure of discounted future net cash flows or the Standardized Measure. Under the Standardized Measure, future cash flows are estimated by applying the simple average spot prices for the trailing twelve month period using the first day of each month beginning on January 1 and ending on December 1 of each respective year, adjusted for price differentials, to the estimated future production of year-end Proved Reserves. Future cash inflows are reduced by estimated future production and development costs based on period-end and future plugging and abandonment costs to determine pre-tax cash inflows. Future income taxes are computed by applying the statutory tax rate to the excess of pre-tax cash inflows over our tax basis in the associated properties. Future net cash inflows after income taxes are discounted using a 10% annual discount rate to arrive at the Standardized Measure.
Stock tank barrel. 42 U.S. gallons liquid volume.
Tcf. One trillion cubic feet of natural gas.
Tcfe. One trillion cubic feet equivalent calculated by converting one Bbl of oil or NGLs to six Mcf of natural gas.
Undeveloped Acreage. Lease acreage on which wells have not been drilled or completed to a point that would permit the production of commercial quantities of oil and natural gas regardless of whether such acreage contains Proved Reserves.
Working interest. The operating interest that gives the owner the right to drill, produce and conduct activities on the property and a share of production.
Workovers. Operations on a producing well to restore or increase production.
Available information
We make available, free of charge, our annual report on Form 10-K, quarterly reports on Form 10-Q, current reports on Form 8-K and amendments to these reports on our website atwww.excoresources.com as soon as reasonably practicable after those reports and other information is electronically filed with, or furnished to, the SEC.
The risk factors noted in this section and other factors noted throughout this Annual Report on Form 10-K, including those risks identified in “Item 7. Management’s Discussion and Analysis of Financial Condition and Results of Operations” describe examples of risks, uncertainties and events that may cause our actual results to differ materially from those contained in any forward-looking statement.
If one or more of these risks or uncertainties materialize, or if underlying assumptions prove incorrect, actual outcomes may vary materially from those included in this Annual Report on Form 10-K.
Risks relating to our business
Fluctuations in oil and natural gas prices, which have been volatile at times, may adversely affect our revenues as well as our ability to maintain or increase our borrowing capacity, repay current or future indebtedness and obtain additional capital on attractive terms.
Our future financial condition, access to capital, cash flow and results of operations depend upon the prices we receive for our oil and natural gas. We are particularly dependent on prices for natural gas. As of December 31, 2011, 97.1% of our Proved Reserves were natural gas. Historically, oil and natural gas prices have been volatile and are subject to fluctuations in response to changes in supply and demand, market uncertainty and a variety of additional factors that are beyond our control. Factors that affect the prices we receive for our oil and natural gas include:
| | • | | supply and demand for oil and natural gas and expectations regarding supply and demand; |
| | • | | the level of domestic production; |
| | • | | the availability of imported oil and natural gas; |
| | • | | political and economic conditions and events in foreign oil and natural gas producing nations, including embargoes, continued hostilities in the Middle East and other sustained military campaigns, and acts of terrorism or sabotage; |
31
| | • | | the ability of members of the Organization of Petroleum Exporting Countries to agree to and maintain oil price and production controls; |
| | • | | the cost and availability of transportation and pipeline systems with adequate capacity; |
| | • | | the cost and availability of other competitive fuels; |
| | • | | fluctuating and seasonal demand for oil, natural gas and refined products; |
| | • | | concerns about global warming or other conservation initiatives and the extent of governmental price controls and regulation of production; |
| | • | | regional price differentials and quality differentials of oil and natural gas; |
| | • | | the availability of refining capacity; |
| | • | | technological advances affecting oil and natural gas production and consumption; |
| | • | | weather conditions and natural disasters; |
| | • | | foreign and domestic government relations; and |
| | • | | overall economic conditions. |
In the past, prices of oil and natural gas have been extremely volatile, and we expect this volatility to continue. During 2011, the NYMEX price for natural gas has fluctuated from a high of $4.85 per Mmbtu to a low of $2.99 per Mmbtu, while the NYMEX West Texas Intermediate crude oil price ranged from a high of $113.93 per Bbl to a low of $75.67 per Bbl. For the five years ended December 31, 2011, the NYMEX Henry Hub natural gas price ranged from a high of $13.58 per Mmbtu to a low of $2.51 per Mmbtu, while the NYMEX West Texas Intermediate crude oil price ranged from a high of $145.29 per Bbl to a low of $33.87 per Bbl. On December 31, 2011, the spot market price for natural gas at Henry Hub was $3.03 per Mmbtu, a 27.2% decrease from December 31, 2010. On December 31, 2011, the spot market price for crude oil at Cushing was $98.81 per Bbl, a 10.0% increase from December 31, 2010. For 2011, our average realized prices (before the impact of derivative financial instruments) for oil and natural gas were $91.01 per Bbl and $3.85 per Mcf compared with 2010 average realized prices of $76.18 per Bbl and $4.29 per Mcf, respectively.
Our revenues, cash flow and profitability and our ability to maintain or increase our borrowing capacity, to repay current or future indebtedness and to obtain additional capital on attractive terms depend substantially upon oil and natural gas prices.
Changes in the differential between NYMEX or other benchmark prices of oil and natural gas and the reference or regional index price used to price our actual oil and natural gas sales could have a material adverse effect on our results of operations and financial condition.
The reference or regional index prices that we use to price our oil and natural gas sales sometimes reflects a discount to the relevant benchmark prices, such as NYMEX. The difference between the benchmark price and the price we reference in our sales contracts is called a differential. We cannot accurately predict oil and natural gas differentials. Changes in differentials between the benchmark price for oil and natural gas and the reference or regional index price we reference in our sales contracts could have a material adverse effect on our results of operations and financial condition.
There are risks associated with our drilling activity that could impact the results of our operations.
Our drilling involves numerous risks, including the risk that we will not encounter commercially productive oil or natural gas reservoirs. We must incur significant expenditures to identify and acquire properties and to drill and complete wells. Additionally, seismic and other technology does not allow us to know conclusively prior to drilling a well that oil or natural gas is present or economically producible. The costs of drilling and completing wells are often uncertain, and drilling operations may be curtailed, delayed or canceled as a result of a variety of factors, including unexpected drilling conditions, pressure or irregularities in formations, equipment failures or accidents, weather conditions and shortages or delays in the delivery of equipment. We have experienced some delays in contracting for drilling rigs, obtaining fracture stimulation crews and materials, which result in increasing costs to drill wells. All of these risks could adversely affect our results of operations and financial condition.
Part of our strategy involves acquiring acreage and drilling in new or emerging shale resource plays. As a result, our drilling results in these areas are subject to more uncertainties than our drilling program in the more established shallower formations and may not meet our expectations for reserves or production.
The results of our drilling in new or emerging shale resource plays, such as the Haynesville/Bossier shale and the Marcellus shale, may be more uncertain than drilling results in areas that are developed and have established production. Since new or emerging plays and new formations have limited or no production history, we are less able to use past drilling results in those areas to help predict our future drilling results. In addition, part of our drilling strategy to maximize recoveries from the shale resource plays involves the drilling of horizontal wells using completion techniques that have proven to be successful in other shale formations. Our experience with horizontal drilling of the Haynesville/Bossier shale and the Marcellus shale to date, as well as the industry’s drilling and production history in these formations, is limited. In the past, we acquired producing oil and natural gas properties with
32
established production histories which generated cash flow immediately upon closing the acquisition. Since we shifted our acquisition strategy to focus on acreage acquisitions in shale areas with Haynesville/Bossier and Marcellus potential, we now invest significant capital for acreage generally without any meaningful production or immediate cash flow. We must then incur significant additional costs to drill and properly develop the acreage we acquire in these shale areas. We may use bank debt to fund these acquisitions but we do not receive credit for borrowing base purposes until the wells we drill generate production.
Increased drilling in the shale formations may cause pipeline and gathering system capacity constraints that may limit our ability to sell natural gas and/or receive market prices for our natural gas.
The Haynesville/Bossier shale wells we have drilled to date have generally reported very high initial production rates. If drilling in the Haynesville/Bossier shale continues to be successful, the amount of natural gas being produced in the area from these new wells, as well as natural gas produced from other existing wells, may exceed the capacity of the various gathering and intrastate or interstate transportation pipelines currently available. If this occurs, it will be necessary for new interstate and intrastate pipelines and gathering systems to be built. While development in the Marcellus shale is in its early stages, the geography in the Appalachia area will present similar, if not greater, gathering system challenges.
Because of the current economic climate, certain planned pipeline projects for the Haynesville/Bossier and Marcellus shale areas may not occur because the prospective owners of these pipelines may be unable to secure the necessary financing. In addition, capital constraints could limit our ability to build intrastate gathering systems necessary to transport our natural gas to interstate pipelines. In such event, this could result in wells being shut in awaiting a pipeline connection or capacity and/or natural gas being sold at much lower prices than those quoted on NYMEX or than we currently project, which would adversely affect our results of operations.
We conduct a substantial portion of our operations through joint ventures, and our failure to continue such joint ventures or resolve any material disagreements with our partners could have a material adverse effect on the success of these operations, our financial condition and our results of operations.
We conduct a substantial portion of our operations through joint ventures with third parties, principally BG Group, and as a result, the continuation of such joint ventures is vital to our continued success. We may also enter into other joint venture arrangements in the future. In many instances we depend on these third parties for elements of these arrangements that are important to the success of the joint venture, such as agreed payments of substantial carried costs pertaining to the joint venture and their share of capital and other costs of the joint venture. The performance of these third party obligations or the ability of third parties to meet their obligations under these arrangements is outside our control. If these parties do not meet or satisfy their obligations under these arrangements, the performance and success of these arrangements, and their value to us, may be adversely affected. If our current or future joint venture partners are unable to meet their obligations, we may be forced to undertake the obligations ourselves and/or incur additional expenses in order to have some other party perform such obligations. In such cases we may also be required to enforce our rights, which may cause disputes among our joint venture partners and us. If any of these events occur, they may adversely impact us, our financial performance and results of operations, these joint ventures and/or our ability to enter into future joint ventures. In addition, BG Group has the right to elect to participate in all acreage and other acquisitions in defined areas of mutual interest. If they elect not to participate in a particular transaction or transactions, we would bear the entire cost of the acquisition and all development costs of the acquired properties.
Such joint venture arrangements may involve risks not otherwise present when exploring and developing properties directly, including, for example:
| | • | | our joint venture partners may share certain approval rights over major decisions; |
| | • | | the possibility that our joint venture partners might become insolvent or bankrupt, leaving us liable for their shares of joint venture liabilities; |
| | • | | the possibility that we may incur liabilities as a result of an action taken by our joint venture partners; |
| | • | | joint venture partners may be in a position to take action contrary to our instructions or requests or contrary to our policies or objectives; |
| | • | | disputes between us and our joint venture partners may result in litigation or arbitration that would increase our expenses, delay or terminate projects and prevent our officers and directors from focusing their time and effort on our business; |
| | • | | that under certain joint venture arrangements, neither joint venture partner may have the power to control the venture, and an impasse could be reached which might have a negative influence on our investment in the joint venture; and |
| | • | | our joint venture partners may decide to terminate their relationship with us in any joint venture company or sell their interest in any of these companies and we may be unable to replace such joint venture partner or raise the necessary financing to purchase such joint venture partner’s interest. |
33
The failure to continue some of our joint ventures or to resolve disagreements with our joint venture partners could adversely affect our ability to transact the business that is the subject of such joint venture, which would in turn negatively affect our financial condition and results of operations.
Our joint ventures with BG Group contemplate that we will make significant capital expenditures and subject us to certain legal and financial terms that could adversely affect us.
On August 14, 2009, we closed two joint venture transactions with BG Group, which involved the sale of an undivided 50% interest in an area of mutual interest in certain oil and natural gas properties in East Texas and North Louisiana and a 50% interest in certain midstream operations. The upstream transaction operates as a joint venture pursuant to a joint development agreement under which EXCO acts as the operator. The midstream transaction functions as a 50-50 joint venture between EXCO and BG Group, with neither party having control over the management of, or a controlling beneficial economic interest in, the operations.
On June 1, 2010, we closed our Appalachian joint venture with BG Group. Pursuant to the agreements governing the joint venture, EXCO and BG Group agreed to jointly explore and develop their Appalachian properties, particularly the Marcellus shale. EXCO and BG Group each own a 50% interest in OPCO which operates the properties, subject to oversight from a management board having equal representation from EXCO and BG Group. In addition, certain midstream assets owned by EXCO were transferred to a newly formed, jointly owned entity, Appalachia Midstream, LLC, through which EXCO and BG Group will pursue the construction and expansion of gathering systems, pipeline systems and treating facilities for anticipated future production from the Marcellus shale.
Each of these joint ventures may require us to make significant capital expenditures. If we do not timely meet our financial commitments under the respective joint venture agreements, our rights to participate in such joint ventures will be adversely affected and other parties to the joint ventures may have a right to acquire a share of our interest in such joint ventures proportionate to, and in satisfaction of, our unmet financial obligations.
EXCO has unconditionally guaranteed its subsidiaries’ performance of the joint venture agreements under the Appalachia joint ventures.
Our use of derivative financial instruments is subject to risks that our counterparties may default on their contractual obligations to us and may cause us to forego additional future profits or result in us making cash payments.
To reduce our exposure to changes in the prices of oil and natural gas, we have entered into, and may in the future enter into, derivative financial instrument arrangements for a portion of our oil and natural gas production. The agreements that we have entered into generally have the effect of providing us with a fixed price for a portion of our expected future oil and natural gas production over a fixed period of time. Our derivative financial instruments are subject to mark-to-market accounting treatment. The change in the fair market value of these instruments is reported as a non-cash item in our statement of operations each quarter, which typically results in significant variability in our net income. Derivative financial instruments expose us to the risk of financial loss and may limit our ability to benefit from increases in oil and natural gas prices in some circumstances, including the following:
| | • | | the counterparty to the derivative financial instrument contract may default on its contractual obligations to us; |
| | • | | there may be a change in the expected differential between the underlying price in the derivative financial instrument agreement and actual prices received; or |
| | • | | market prices may exceed the prices which we are contracted to receive, resulting in our need to make significant cash payments. |
Our use of derivative financial instruments could have the effect of reducing our revenues and the value of our securities. During the years ended December 31, 2011 and 2010, we received cash payments to settle our derivative financial instrument contracts totaling $135.4 million and $217.5 million, respectively. For the year ended December 31, 2011, a $1.00 increase in the average commodity price per Mcfe would have resulted in an increase in cash settlement payments (or a decrease in settlements received) of approximately $107.7 million. As of December 31, 2011, the net unrealized gains on our oil and natural gas derivative financial instrument contracts were $173.2 million. The ultimate settlement amount of these unrealized derivative financial instrument contracts is dependent on future commodity prices. In connection with acquisitions which included producing properties, we have, in certain instances, assumed derivative financial instruments covering a significant portion of estimated future production. We may incur significant unrealized losses in the future from our use of derivative financial instruments to the extent market prices increase and our derivatives contracts remain in place. See “Item 7. Management’s Discussion and Analysis of Financial Condition and Results of Operations—Our results of operations—Derivative financial instruments.”
34
We have incurred a substantial amount of indebtedness to fund our acquisitions, which may adversely affect our cash flow and our ability to operate our business, remain in compliance with debt covenants and make payments on our debt.
As of December 31, 2011, our consolidated indebtedness was approximately $1.9 billion, an increase of approximately $300.0 million from our consolidated debt of approximately $1.6 billion at December 31, 2010. The increase is primarily due to borrowings to fund our drilling programs and complete acquisitions (see “Item 1. Business—Significant 2011 activities”). Reimbursements from BG Group and the $125.0 million distribution from TGGT partially offset these borrowings. While we believe our consolidated debt is manageable, our reserves, borrowing base, production and cash flows can be negatively impacted by the declines in natural gas prices. At current natural gas prices, we expect that our borrowing base will likely be decreased at the next regularly scheduled re-determination date. In addition, our ratio of consolidated funded indebtedness to consolidated EBITDAX, as defined in the EXCO Resources Credit Agreement, is computed using a trailing twelve-month computation. As a result, our ability to maintain compliance with this covenant may be negatively affected when oil and/or natural gas prices decline for an extended period of time. To service our indebtedness, we will require a significant amount of cash. Our ability to generate cash depends on many factors beyond our control, and any failure to meet our debt obligations could harm our business, financial condition and results of operations. If our operating cash flow and other capital resources are insufficient to fund our debt obligations, we may be forced to sell assets, seek additional equity or debt capital or restructure our debt. These remedies may not be available on commercially reasonable terms, or at all. Our cash flow and capital resources may be insufficient for payment of interest on, and principal of, our debt under the EXCO Resources Credit Agreement and the 2018 Notes, which could cause us to default on our obligations and could impair our liquidity.
We may be unable to acquire or develop additional reserves, which would reduce our revenues and access to capital.
Our success depends upon our ability to find, develop or acquire additional oil and natural gas reserves that are profitable to produce. Factors that may hinder our ability to acquire or develop additional oil and natural gas reserves include competition, access to capital, prevailing oil and natural gas prices and the number and attractiveness of properties for sale. If we are unable to conduct successful development activities or acquire properties containing Proved Reserves, our total Proved Reserves will generally decline as a result of production. Also, our production will generally decline. In addition, if our reserves and production decline, then the amount we are able to borrow under the EXCO Resources Credit Agreement will also decline. We may be unable to locate additional reserves, drill economically productive wells or acquire properties containing Proved Reserves.
Development and exploration drilling and strategic acquisitions are the main methods of replacing reserves. However, development and exploration drilling operations may not result in any increases in reserves for various reasons. Our future oil and natural gas production depends on our success in finding or acquiring additional reserves. If we fail to replace reserves through drilling or acquisitions, our level of production and cash flows will be adversely affected.
We may not identify all risks associated with the acquisition of oil and natural gas properties, and any indemnifications we receive from sellers may be insufficient to protect us from such risks, which may result in unexpected liabilities and costs to us.
Generally, it is not feasible for us to review in detail every individual property involved in an acquisition. Our business strategy focuses on acquisitions of producing oil and natural gas properties. Any future acquisitions will require an assessment of recoverable reserves, title, future oil and natural gas prices, operating costs, potential environmental hazards and liabilities, potential tax and Employee Retirement Income Security Act, or ERISA, liabilities, and other liabilities and other similar factors. Ordinarily, our review efforts are focused on the higher-valued properties. Even a detailed review of properties and records may not reveal existing or potential problems, nor will it permit us to become sufficiently familiar with the properties to assess fully their deficiencies and capabilities. We do not inspect every well that we acquire. Potential problems, such as deficiencies in the mechanical integrity of equipment or environmental conditions that may require significant remedial expenditures, are not necessarily observable even when we inspect a well. Any unidentified problems could result in material liabilities and costs that negatively impact our financial condition and results of operations.
Even if we are able to identify problems with an acquisition, the seller may be unwilling or unable to provide effective contractual protection or indemnity against all or part of these problems. Even if a seller agrees to provide indemnity, the indemnity may not be fully enforceable and may be limited by floors and caps on such indemnity.
We may be unable to obtain additional financing to implement our growth strategy.
The growth of our business will require substantial capital on a continuing basis. Due to the amount of debt we have incurred, it may be difficult for us in the foreseeable future to obtain additional debt financing or to obtain additional secured financing other than purchase money indebtedness. If we are unable to obtain additional capital on satisfactory terms and conditions or at all, we may lose opportunities to acquire oil and natural gas properties and businesses and, therefore, be unable to implement our growth strategy.
35
We may encounter obstacles to marketing our oil and natural gas, which could adversely impact our revenues.
Our ability to market our oil and natural gas production will depend upon the availability and capacity of natural gas gathering systems, pipelines and other transportation facilities. We are primarily dependent upon third parties to transport our products. Transportation space on the gathering systems and pipelines we utilize is occasionally limited or unavailable due to repairs, outages caused by accidents or other events, or improvements to facilities or due to space being utilized by other companies that have priority transportation agreements. We experienced production curtailments in East Texas/North Louisiana resulting from capacity restraints, offsetting fracturing stimulation operations and short term shutdowns of certain pipelines for maintenance purposes. As we have increased our knowledge of the Haynesville/Bossier reservoirs, we have begun to shut in production on adjacent wells when conducting completion operations. Due to the high production capabilities of these wells, these volumes can be significant. In addition, an incident at a TGGT treating facility in May 2011 has resulted in the curtailment of volumes at that facility. We expect this facility to become operational during the first quarter of 2012. Our access to transportation options can also be affected by U.S. federal and state regulation of oil and natural gas production and transportation, general economic conditions and changes in supply and demand. These factors and the availability of markets are beyond our control. If market factors dramatically change, the impact on our revenues could be substantial and could adversely affect our ability to produce and market oil and natural gas, the value of our common stock and our ability to pay dividends on our common stock.
We may not correctly evaluate reserve data or the exploitation potential of properties as we engage in our acquisition, exploration, development and exploitation activities.
Our future success will depend on the success of our acquisition, exploration, development and exploitation activities. Our decisions to purchase, explore, develop or otherwise exploit properties or prospects will depend in part on the evaluation of data obtained from production reports and engineering studies, geophysical and geological analyses and seismic and other information, the results of which are often inconclusive and subject to various interpretations, which could significantly reduce our ability to generate cash needed to service our debt and fund our capital program and other working capital requirements.
We cannot control the development of the properties we own but do not operate, which may adversely affect our production, revenues and results of operations.
As of December 31, 2011, third parties operate wells that represent approximately 3.8% of our proved developed producing reserves. As a result, the success and timing of our drilling and development activities on those properties depend upon a number of factors outside of our control, including:
| | • | | the timing and amount of capital expenditures; |
| | • | | the operators’ expertise and financial resources; |
| | • | | the approval of other participants in drilling wells; and |
| | • | | the selection of suitable technology. |
If drilling and development activities are not conducted on these properties or are not conducted on a timely basis, we may be unable to increase our production, offset normal production declines or may lose production leases due to non-production, which may adversely affect our production, revenues and results of operations.
Our estimates of oil and natural gas reserves involve inherent uncertainty, which could materially affect the quantity and value of our reported reserves, our financial condition and the value of our common stock.
Numerous uncertainties are inherent in estimating quantities of proved oil and natural gas reserves, including many factors beyond our control. This Annual Report on Form 10-K contains estimates of our proved oil and natural gas reserves and the PV-10 and Standardized Measure of our proved oil and natural gas reserves. These estimates are based upon reports of our independent petroleum engineers. These reports rely upon various assumptions, including assumptions required by the SEC as to oil and natural gas prices, drilling and operating expenses, capital expenditures, taxes and availability of funds. These estimates should not be construed as the current market value of our estimated Proved Reserves. The process of estimating oil and natural gas reserves is complex, requiring significant decisions and assumptions in the evaluation of available geological, engineering and economic data for each reservoir. As a result, the estimates are inherently imprecise evaluations of reserve quantities and future net revenue. Our actual future production, revenues, taxes, development expenditures, operating expenses and quantities of recoverable oil and natural gas reserves may vary substantially from those we have assumed in the estimates. Any significant variance in our assumptions could materially affect the quantity and value of reserves, the amount of PV-10 and Standardized Measure described in this Annual Report on Form 10-K, and our financial condition. In addition, our reserves, the amount of PV-10 and Standardized Measure may be revised downward or upward, based upon production history, results of future exploitation and development activities, prevailing oil and
36
natural gas prices and other factors. A material decline in prices paid for our production can adversely impact the estimated volumes and values of our reserves. Similarly, a decline in market prices for oil or natural gas may adversely affect our PV-10 and Standardized Measure. Any of these negative effects on our reserves or PV-10 and Standardized Measure may decrease the value of our common stock.
We are exposed to operating hazards and uninsured risks that could adversely impact our results of operations and cash flow.
Our operations are subject to the risks inherent in the oil and natural gas industry, including the risks of:
| | • | | fires, explosions and blowouts; |
| | • | | abnormally pressured formations; and |
| | • | | environmental accidents such as oil spills, gas leaks, ruptures or discharges of toxic gases, brine or well fluids into the environment (including groundwater contamination). |
We have in the past experienced some of these events during our drilling, production and midstream operations. These events may result in substantial losses to us from:
| | • | | injury or loss of life; |
| | • | | severe damage to or destruction of property, natural resources and equipment; |
| | • | | pollution or other environmental damage; |
| | • | | environmental clean-up responsibilities; |
| | • | | regulatory investigation; |
| | • | | penalties and suspension of operations; or |
| | • | | attorneys’ fees and other expenses incurred in the prosecution or defense of litigation. |
As is customary in our industry, we maintain insurance against some, but not all, of these risks. Our insurance may not be adequate to cover these potential losses or liabilities. Furthermore, insurance coverage may not continue to be available at commercially acceptable premium levels or at all. Due to cost considerations, from time to time we have declined to obtain coverage for certain drilling activities. We do not carry business interruption insurance. Losses and liabilities arising from uninsured or under-insured events could require us to make large unbudgeted cash expenditures that could adversely impact our results of operations and cash flow.
We currently carry general liability insurance and excess liability insurance with a combined annual limit of $101 million per occurrence and in the aggregate. These insurance policies contain maximum policy limits and deductibles ranging from $1,000 to $50,000 that must be met prior to recovery, and are subject to customary exclusions and limitations. Our general liability insurance covers us and our subsidiaries for third-party claims and liabilities arising out of lease operations and related activities. The excess liability insurance is in addition to, and is triggered if, the general liability insurance per occurrence limit is reached.
We also maintain control of well insurance and pollution insurance. Our control of well insurance has per occurrence and combined single limits ranging from $3 million to $30 million and is subject to a $500,000 deductible per occurrence. Our pollution insurance has a per occurrence and aggregate annual limit of $30 million and is subject to a $25,000 deductible per occurrence.
We require our third-party contractors to sign master service agreements in which they generally agree to indemnify us for the injury and death of the service provider’s employees as well as contractors and subcontractors that are hired by the service provider. Similarly, we agree to indemnify our third-party contractors against claims made by our employees and our other contractors. Additionally, each party generally is responsible for damage to its own property.
Our third-party contractors that perform hydraulic fracturing operations for us sign master service agreements containing the indemnification provisions noted above. We do not currently have any insurance policies in effect that are intended to provide coverage for losses solely related to hydraulic fracturing operations. We believe that our general liability, excess liability and pollution insurance policies would cover third-party claims related to hydraulic fracturing operations and associated legal expenses, in accordance with, and subject to, the terms of such policies. However, these policies may not cover fines, penalties or costs and expenses related to government-mandated environmental clean-up responsibilities.
37
We are subject to complex federal, state, local and other laws and regulations that could adversely affect the cost, manner or feasibility of conducting our operations.
Our oil and natural gas development and production operations are subject to complex and stringent laws and regulations. In order to conduct our operations in compliance with these laws and regulations, we must obtain and maintain numerous permits, approvals and certificates from various federal, state and local governmental authorities. We may incur substantial costs in order to comply with these existing laws and regulations. In addition, our costs of compliance may increase if existing laws and regulations are revised or reinterpreted, or if new laws and regulations become applicable to our operations.
Our business is subject to federal, state and local laws and regulations as interpreted and enforced by governmental authorities possessing jurisdiction over various aspects of the exploration for, production and sale of, oil and natural gas. Failure to comply with such laws and regulations, as interpreted and enforced, could have a material adverse effect on our business, financial condition and results of operations. Please see “Item 1. Business, Applicable laws and regulations” for a description of the laws and regulations that affect us.
Certain U.S. federal income tax deductions currently available with respect to oil and gas exploration and development may be eliminated as a result of future legislation.
President Obama’s proposed Fiscal Year 2011, Fiscal Year 2012 and Fiscal Year 2013 Budgets included proposed legislation that would, if enacted into law, make significant changes to United States tax laws, including the elimination of certain key U.S. federal income tax incentives currently available to oil and natural gas exploration and production companies. These changes include, but are not limited to, (i) the repeal of the percentage depletion allowance for oil and natural gas properties, (ii) the elimination of current deductions for intangible drilling and development costs, (iii) the elimination of the manufacturing deduction for certain domestic production activities, and (iv) an extension of the amortization period for certain geological and geophysical expenditures. It is unclear whether any such changes will be enacted or how soon any such changes could become effective. The passage of any legislation as a result of these proposals or any other similar changes in U.S. federal income tax laws could eliminate certain tax deductions that are currently available with respect to oil and gas exploration and development, and any such change could negatively affect our financial condition and results of operations.
The EPA’s implementation of climate change regulations could result in increased operating costs and reduced demand for our oil and natural gas production.
Although federal legislation regarding the control of emissions of greenhouse gases or GHGs, for the present, appears unlikely, the EPA has been implementing regulatory measures under existing CAA authority and some of those regulations may affect our operations. GHGs are certain gases, including carbon dioxide, a product of the combustion of natural gas, and methane, a primary component of natural gas, that may be contributing to the warming of the Earth’s atmosphere, resulting in climatic changes. These GHG regulations could require us to incur increased operating costs and could have an adverse effect on demand for our oil and natural gas production.
On June 3, 2010, the EPA published its so-called GHG tailoring rule that will phase in federal prevention of significant deterioration (PSD) permit requirements for new sources and modifications, and Title V operating permits for all sources, that have the potential to emit specific quantities of GHGs. Those permitting provisions, when they become applicable to our operations, could require controls or other measures to reduce GHG emissions from new or modified sources, and we could incur additional costs to satisfy those requirements. On November 30, 2010, the EPA published a rule establishing GHG reporting requirements for sources in the petroleum and natural gas industry, requiring those sources to monitor, maintain records on, and annually report their GHG emissions, with the first annual report for 2011 being due in September 2012. Although this rule does not limit the amount of GHGs that can be emitted, it requires us to incur costs to monitor, recordkeep and report GHG emissions associated with our operations.
The adoption of derivatives legislation and regulations thereunder could have an adverse impact on our ability to hedge risks associated with our business and could affect our business, financial condition or results of operations.
On July 21, 2010, President Obama signed into law the Dodd-Frank Act. The Dodd-Frank Act establishes federal oversight and regulation of the over-the-counter derivatives market and entities that participate in the market and requires the CFTC, federal regulators of banks and other financial institutions and the SEC to implement the new law by promulgating regulations. The Dodd-Frank Act originally required most regulations to be promulgated by no later than July 16, 2011, but the CFTC and the SEC have both issued temporary relief to extend this deadline; in the CFTC’s case, such relief has been extended through July 16, 2012, although it is possible that some regulations may be postponed or delayed further.
38
Under the Dodd-Frank Act and related reforms, over-the-counter derivatives dealers and other over-the-counter major market participants could be subjected to substantial regulatory supervision. The reforms expand the power of the CFTC to regulate derivatives transactions related to energy commodities, including oil and natural gas, to mandate clearance of derivatives contracts through registered derivatives clearing organizations and to impose burdensome capital and margin requirements and business conduct standards on over-the-counter derivatives transactions.
The Dodd-Frank Act also permits the CFTC to set position limits on certain derivatives instruments. On October 18, 2011, the CFTC voted to issue final regulations that implement position and trading limits on certain commodities, but include exemptions for bona fide hedging transactions. The impact of the regulations upon our business is not yet clear. Certain of our trading activities, and those of our counterparties, may be subject to the position limits, which may reduce our ability to enter into hedging transactions.
The reforms may also require us to comply with margin and clearing and trade-execution requirements in connection with our derivatives activities, although whether these requirements will apply to our business is uncertain at this time. Further, the reforms may also require our counterparties to spin off derivatives activities to separate entities which may not be as creditworthy as the original counterparties.
The full impact of the Dodd-Frank Act and related reforms and regulatory requirements upon our business will not be known until the regulations are implemented and the market for derivatives contracts has adjusted. The new requirements could cause hedges to become significantly more expensive (including through requirements to post collateral), uneconomic or unavailable, which could lead to increased costs, commodity price volatility, reductions in commodity prices, or any combination of the foregoing. Further, they could reduce our ability to monetize or restructure our existing derivatives contracts, subject us to additional capital or margin requirements, restrict our flexibility in conducting trading activity and taking commodity positions, and increase our exposure to less creditworthy counterparties. If we reduce our use of derivatives contracts as a result of the new requirements, our results of operations may become more volatile and cash flows less predictable, which could adversely affect our ability to plan for and fund capital expenditures. In addition, the Dodd-Frank Act was intended, in part, to reduce the volatility of oil and natural gas prices, which some legislators attributed to speculative trading in derivatives and commodity instruments related to oil and natural gas. Our revenues could therefore be adversely affected if a consequence of the legislation and regulations is lower commodity prices. Individually and collectively, these factors could have a material adverse effect on our ability to hedge risks and on our business, financial condition or results of operations.
Federal and state legislation and regulatory initiatives relating to hydraulic fracturing could result in increased costs and additional operating restrictions or delays.
Hydraulic fracturing involves the injection of water, sand and chemicals under pressure into rock formations to stimulate natural gas production. Congress has considered legislation to amend the federal SDWA to remove the exemption from regulation and permitting that is applicable to hydraulic fracturing operations and require reporting and disclosure of chemicals used by the oil and gas industry in the hydraulic fracturing process. Sponsors of bills previously introduced before the Senate and House of Representatives have asserted that chemicals used in the fracturing process could adversely affect drinking water supplies. Such bills or similar legislation, if adopted, could increase the possibility of litigation and establish an additional level of regulation at the federal level that could lead to operational delays or increased operating costs and could result in additional regulatory burdens, making it more difficult to perform hydraulic fracturing and increasing our costs of compliance.
In addition, the EPA has recently been taking action to assert federal regulatory authority over hydraulic fracturing using diesel under the SWDA’s Underground Injection Control Program. Further, in March 2010, the EPA announced that it would conduct a wide-ranging study on the effects of hydraulic fracturing on drinking water resources. Interim results of the study are expected in 2012, with final results expected in 2014. In addition, in December 2011, the EPA published an unrelated draft report concluding that hydraulic fracturing caused groundwater pollution in a natural gas field in Wyoming. This study remains subject to further review and public comment. The agency also announced that one of its enforcement initiatives for 2011 to 2013 would be to focus on environmental compliance by the energy extraction sector. This study and enforcement initiative could result in additional regulatory scrutiny that could make it difficult to perform hydraulic fracturing and increase our costs of compliance and doing business. Consequently, these studies and initiatives could spur further legislative or regulatory action regarding hydraulic fracturing or similar production operations.
39
Our business exposes us to liability and extensive regulation on environmental matters, which could result in substantial expenditures.
Our operations are subject to numerous U.S. federal, state and local laws and regulations relating to the protection of the environment, including those governing the discharge of materials into the water and air, the generation, management and disposal of hazardous substances and wastes and the clean-up of contaminated sites. We could incur material costs, including clean-up costs, fines and civil and criminal sanctions and third-party claims for property damage and personal injury as a result of violations of, or liabilities under, environmental laws and regulations. Such laws and regulations not only expose us to liability for our own activities, but may also expose us to liability for the conduct of others or for actions by us that were in compliance with all applicable laws at the time those actions were taken. In addition, we could incur substantial expenditures complying with environmental laws and regulations, including future environmental laws and regulations which may be more stringent, for example, the regulation of GHG emissions under the federal CAA, or state or regional regulatory programs. Regulation of GHG emissions by the EPA, or various states in the United States in areas in which we conduct business, for example, could have an adverse effect on our operations and demand for our oil and natural gas production. Moreover, the EPA has shown a general increased scrutiny on the oil and gas industry through its GHG, CAA and SDWA regulations.
Among the foregoing CAA regulations are certain newly proposed requirements as to hazardous air pollutants. Specifically, on July 28, 2011, the EPA proposed a rule to subject oil and gas operations to regulation under the NSPS and NESHAPS, programs under the CAA, and to impose new and amended requirements under both programs. Under the proposal, the EPA would, among other things, amend standards applicable to natural gas processing plants and would expand the NSPS to include all oil and gas operations, imposing requirements on those operations. The EPA is also proposing NSPS standards for completions of hydraulically fracturing gas wells. The proposed standards include the reduced emission completion techniques. The NESHAPS proposal includes MACT standards for certain glycol dehydrators and storage vessels, and revises applicability provisions, alternative test protocols and the availability of the startup, shutdown and maintenance exemption. The EPA is under a court order to finalize the rules by April 3, 2012. Should these rules become final and applicable to our operations, they could result in increased operating and compliance costs, increased regulatory burdens and delays in our operations.
Our business substantially depends on Douglas H. Miller, our Chief Executive Officer.
We are substantially dependent upon the skills of Mr. Douglas H. Miller. Mr. Miller has extensive experience in acquiring, financing and restructuring oil and natural gas companies. We do not have an employment agreement with Mr. Miller or maintain key man insurance. The loss of the services of Mr. Miller could hinder our ability to successfully implement our business strategy.
We may have write-downs of our asset values, which could negatively affect our results of operations and net worth.
We follow the full cost method of accounting for our oil and natural gas properties. Depending upon oil and natural gas prices in the future, and at the end of each quarterly and annual period when we are required to test the carrying value of our assets using full cost accounting rules, we may be required to write-down the value of our oil and natural gas properties if the present value of the after-tax future cash flows from our oil and natural gas properties falls below the net book value of these properties. We have in the current year and the past, including 2008, 2009 and 2011 and may in the future, experience ceiling test write-downs with respect to our oil and natural gas properties. For 2011, we recorded a non-cash ceiling test write-down of approximately $233.2 million. Future ceiling test write-downs could negatively affect our results of operations and net worth.
We also test goodwill for impairment annually or when circumstances indicate that an impairment may exist. If the book value of our reporting units exceeds the estimated fair value of those reporting units, an impairment charge will occur, which would negatively impact our results of operations and net worth.
We may experience a financial loss if any of our significant customers fail to pay us for our oil or natural gas.
Our ability to collect the proceeds from the sale of oil and natural gas from our customers depends on the payment ability of our customer base, which includes several significant customers. If any one or more of our significant customers fails to pay us for any reason, we could experience a material loss. In addition, in recent years, it has become more difficult to maintain and grow a customer base of creditworthy customers because a number of energy marketing and trading companies have discontinued their marketing and trading operations, which has significantly reduced the number of potential purchasers for our oil and natural gas production. As a result, we may experience a material loss as a result of the failure of our customers to pay us for prior purchases of our oil or natural gas.
40
We may experience a decline in revenues if we lose one of our significant customers.
For 2011, sales to BG Energy Merchants LLC accounted for approximately 36.0% of total consolidated revenues. BG Energy Merchants LLC is a subsidiary of BG Group. As our volumes in the Haynesville shale grow, sales to BG Energy Merchants LLC and others are expected to become more significant. The loss of any significant customer may cause a temporary interruption in sales of, or a lower price for, our oil and natural gas.
We have entered into significant natural gas firm transportation contracts primarily in East Texas and North Louisiana that require us to pay fixed amounts of money to the shippers regardless of quantities actually shipped. If we are unable to deliver the necessary quantities of natural gas to the shippers, our results of operations and liquidity could be adversely affected.
As of December 31, 2011, we were contractually committed to spend approximately $846.0 million over the next ten years for firm transportation services. We may enter into additional firm transportation agreements as our development of our Marcellus shale plays expands. The use of firm transportation agreements allow us priority space in a shippers’ pipeline which we believe is a strategic advantage. In the event we encounter delays due to construction, interruptions of operations or delays in connecting new volumes to gathering systems or pipelines for an extended period of time, the requirements to pay for quantities not delivered could have a material impact on our results of operations and liquidity.
Competition in our industry is intense and we may be unable to compete in acquiring properties, contracting for drilling equipment and hiring experienced personnel.
The oil and natural gas industry is highly competitive. We encounter strong competition from other independent operators and from major oil companies in acquiring properties, contracting for drilling equipment and securing trained personnel. Many of these competitors have financial and technical resources and headcount substantially larger than ours. As a result, our competitors may be able to pay more for desirable leases, or to evaluate, bid for and purchase a greater number of properties or prospects than our financial or personnel resources will permit. The oil and natural gas industry has periodically experienced shortages of drilling rigs, equipment, pipe and personnel, which has delayed development drilling and other exploitation activities and has caused significant expense/cost increases. We may experience difficulties in obtaining drilling rigs and other services in certain areas as well as an increase in the cost for these services and related material and equipment. We are unable to predict when, or if, such shortages may again occur or how such shortages and price increases will affect our development and exploitation program. Competition has also been strong in hiring experienced personnel, particularly in petroleum engineering, geoscience, accounting and financial reporting, tax and land professions. In addition, competition is strong for attractive oil and natural gas producing properties, oil and natural gas companies, and undeveloped leases and drilling rights. We are often outbid by competitors in our attempts to acquire properties or companies. All of these challenges could make it more difficult to execute our growth strategy.
If TGGT or third-party pipelines or other facilities interconnected to our gathering and transportation pipelines become unavailable to transport or process natural gas, our revenues and cash flow could be adversely affected.
We depend upon TGGT and third party pipelines and other facilities to provide gathering and transportation. Much of the natural gas transported by our pipelines must be treated or processed before delivery into a pipeline for natural gas. If the processing and treating plants to which we deliver natural gas were to become temporarily or permanently unavailable for any reason, or if throughput were reduced because of testing, line repair, damage to pipelines, reduced operating pressures, lack of capacity or other causes, our customers would be unable to deliver natural gas to end markets. For example, in the second quarter of 2011, an incident occurred at a TGGT amine treating facility in northwest Red River Parish, Louisiana resulting in an immediate shut-down of the facility. As a precautionary measure, TGGT also shut down another amine treating facility located in DeSoto Parish with similar specifications, which was restarted in October 2011. If any of such events occur or continue to occur, they could materially and adversely affect our business, results of operations and financial condition.
We exist in a litigious environment.
Any constituent could bring suit regarding our existing or planned operations or allege a violation of an existing contract. Any such action could delay when planned operations can actually commence or could cause a halt to existing production until such alleged violations are resolved by the courts. Not only could we incur significant legal and support expenses in defending our rights, but halting existing production or delaying planned operations could impact our future operations and financial condition. In addition, we are defendants in numerous cases involving claims by landowners for surface or subsurface damages arising from our operations and for claims by unleased mineral owners and royalty owners for unpaid or underpaid revenues customary in our business. We incur costs in defending these claims and from time to time must pay damages or other amounts due. Such legal disputes can also distract management and other personnel from their primary responsibilities.
41
Our business could be negatively impacted by security threats, including cybersecurity threats, and other disruptions.
As an oil and natural gas producer, we face various security threats, including cybersecurity threats to gain unauthorized access to sensitive information or to render data or systems unusable; threats to the safety of our employees; threats to the security of our facilities and infrastructure or third party facilities and infrastructure, such as processing plants and pipelines; and threats from terrorist acts. Although we utilize various procedures and controls to monitor these threats and mitigate our exposure to such threats, there can be no assurance that these procedures and controls will be sufficient in preventing security threats from materializing. If any of these events were to materialize, they could lead to losses of sensitive information, critical infrastructure, personnel or capabilities, essential to our operations and could have a material adverse effect on our reputation, financial position, results of operations, or cash flows. Cybersecurity attacks in particular are evolving and include but are not limited to, malicious software, attempts to gain unauthorized access to data, and other electronic security breaches that could lead to disruptions in critical systems, unauthorized release of confidential or otherwise protected information and corruption of data. These events could damage our reputation and lead to financial losses from remedial actions, loss of business or potential liability.
While we believe we have taken the steps necessary to improve the effectiveness of our internal control over financial reporting, if we are unable to successfully address or prevent material weaknesses in our internal control over financial reporting, our ability to report our financial results on a timely and accurate basis and to comply with disclosure and other requirements may be adversely affected.
Our management identified a material weakness in internal control over financial reporting as of December 31, 2011 related to the ceiling test computation, which did not properly address income taxes (see “Item 9A. Controls and Procedures”). As a result of this material weakness, our management concluded that, as of December 31, 2011, we did not maintain effective disclosure controls and procedures or internal control over financial reporting. A material weakness is a deficiency, or a combination of deficiencies, in internal control over financial reporting such that there is a reasonable possibility that a material misstatement of our annual or interim financial statements will not be prevented or detected on a timely basis.
Although we believe we have taken the steps necessary to remediate the material weakness and improve the effectiveness of our disclosure controls and procedures and internal control over financial reporting, we can give no assurances that the measures we take will remediate the material weakness that we identified or that any additional material weaknesses will not arise in the future. We will continue to monitor the effectiveness of these and other processes, procedures and controls and will make any further changes management determines appropriate.
Any material weakness or other deficiencies in our disclosure controls and procedures and internal control over financial reporting may affect our ability to report our financial results on a timely and accurate basis and to comply with disclosure obligations or cause our financial statements to contain material misstatements, which could negatively affect the market price and trading liquidity of our common stock or cause investors to lose confidence in our reported financial information.
There are inherent limitations in all internal control systems over financial reporting, and misstatements due to error or fraud may occur and not be detected.
While we have taken actions designed to address compliance with the internal control, disclosure control and other requirements of the Sarbanes-Oxley Act of 2002 and the rules and regulations promulgated by the SEC implementing these requirements, there are inherent limitations in our ability to control all circumstances. Our management, including our Chief Executive Officer, Chief Financial Officer and Chief Accounting Officer, does not expect that our internal controls and disclosure controls will prevent all errors and all fraud. A control system, no matter how well conceived and operated, can provide only reasonable, not absolute, assurance that the objectives of the control system are met. In addition, the design of a control system must reflect the fact that there are resource constraints and the benefit of controls must be relative to their costs. Because of the inherent limitations in all control systems, no evaluation of controls can provide absolute assurance that all control issues and instances of fraud, if any, in our company have been detected. These inherent limitations include the realities that judgments in decision-making can be faulty and that breakdowns can occur because of simple errors or mistakes. Further, controls can be circumvented by individual acts of some persons, by collusion of two or more persons, or by management override of the controls. The design of any system of controls also is based in part upon certain assumptions about the likelihood of future events, and there can be no assurance that any design will succeed in achieving its stated goals under all potential future conditions. Over time, a control may be inadequate because of changes in conditions, such as growth of our company or increased transaction volume, or the degree of compliance with the policies or procedures may deteriorate. Because of inherent limitations in a cost-effective control system, misstatements due to error or fraud may occur and not be detected.
Risks relating to our indebtedness
We have a substantial amount of indebtedness, which may adversely affect our cash flow and our ability to operate our business, remain in compliance with debt covenants and make payments on our debt.
As of February 22, 2012, we had approximately $1.9 billion of indebtedness, including $1.2 billion of indebtedness subject to variable interest rates and $750.0 million of indebtedness under the 2018 Notes. Our total interest expense, excluding amortization of deferred financing costs, on an annual basis based on currently available interest rates would be approximately $82.3 million and would change by approximately $11.6 million for every 1% change in interest rates.
Our level of debt could have important consequences, including the following:
| | • | | it may be more difficult for us to satisfy our obligations with respect to our indebtedness, and any failure to comply with the obligations of any of our debt agreements, including financial and other restrictive covenants, could result in an event of default under the EXCO Resources Credit Agreement, the indenture governing the 2018 Notes, or the Indenture, and the agreements governing our other indebtedness; |
| | • | | we may have difficulty borrowing money in the future for acquisitions, capital expenditures or to meet our operating expenses or other general corporate obligations; |
| | • | | the amount of our interest expense may increase because certain of our borrowings are at variable rates of interest; |
| | • | | we will need to use a substantial portion of our cash flows to pay principal and interest on our debt, which will reduce the amount of money we have for operations, working capital, capital expenditures, expansion, acquisitions or general corporate or other business activities; |
| | • | | we may have a higher level of debt than some of our competitors, which may put us at a competitive disadvantage; |
| | • | | we may be more vulnerable to economic downturns and adverse developments in our industry or the economy in general, especially declines in oil and natural gas prices; |
| | • | | when oil and natural gas prices decline, our ability to maintain compliance with our financial covenants becomes more difficult and our borrowing base is subject to reductions, which may reduce or eliminate our ability to fund our operations; and |
| | • | | our debt level could limit our flexibility in planning for, or reacting to, changes in our business and the industry in which we operate. |
Our ability to meet our expenses and debt obligations will depend on our future performance, which will be affected by financial, business, economic, regulatory and other factors. We will be unable to control many of these factors, such as economic conditions and governmental regulation. We cannot be certain that our earnings will be sufficient to allow us to pay the principal and interest on our debt and meet our other obligations. If we do not have enough money to service our debt, we may be required but unable to refinance all or part of our existing debt, sell assets, borrow more money or raise equity on terms acceptable to us, if at all and may be required to surrender assets pursuant to the security provisions of the EXCO Resources Credit Agreement. Further, failing to comply with the financial and other restrictive covenants in the EXCO Resources Credit Agreement and the Indenture could result in an event of default, which could adversely affect our business, financial condition and results of operations.
We may incur substantially more debt, which may intensify the risks described above, including our ability to service our indebtedness.
Together with our subsidiaries, we may incur substantially more debt in the future in connection with our exploration, exploitation, development, acquisitions of undeveloped acreage and producing properties. The restrictions in our debt agreements on
42
our incurrence of additional indebtedness are subject to a number of qualifications and exceptions, and under certain circumstances, indebtedness incurred in compliance with these restrictions could be substantial. Also, these restrictions do not prevent us from incurring obligations that do not constitute indebtedness. To the extent new indebtedness is added to our current indebtedness levels, the risks described above could substantially increase. Significant additions of undeveloped acreage financed with debt may result in increased indebtedness without any corresponding increase in borrowing base, which could curtail drilling and development of this acreage or could cause us to not comply with our debt covenants.
To service our indebtedness and fund our planned capital expenditure programs, we will require a significant amount of cash. Our ability to generate cash depends on many factors beyond our control, and any failure to meet our debt obligations could harm our business, financial condition and results of operations.
Our ability to make payments on and to refinance our indebtedness, including the 2018 Notes and the EXCO Resources Credit Agreement, and to fund planned capital expenditures will depend on our ability to generate cash flow from operations and other resources in the future. This, to a certain extent, is subject to general economic, financial, competitive, legislative, regulatory and other factors that are beyond our control, including the prices that we receive for oil and natural gas.
Our business may not generate sufficient cash flow from operations and future borrowings may not be available to us in an amount sufficient to enable us to pay our indebtedness, including our 2018 Notes and the EXCO Resources Credit Agreement, to fund planned capital expenditures or to fund our other liquidity needs. If our cash flow and capital resources are insufficient to fund our debt obligations and capital expenditure programs, we may be forced to sell assets, seek additional equity or debt capital or restructure our debt. These remedies may not be available on commercially reasonable terms, or at all. In addition, any failure to make scheduled payments of interest and principal on our outstanding indebtedness would likely result in a reduction of our credit rating, which could harm our ability to incur additional indebtedness on acceptable terms. Our cash flow and capital resources may be insufficient for payment of interest on and principal of our debt in the future, which could cause us to default on our obligations and could impair our liquidity.
Our borrowing base under the EXCO Resources Credit Agreement is subject to semi-annual redeterminations. If our borrowing base were to be reduced to a level which was less than the current borrowings, we would be required to reduce our borrowings to a level sufficient to cure any deficiency. We may be required to sell assets or seek alternative debt or equity which may not be available at commercially reasonable terms, if at all.
In addition, we conduct certain of our operations through our joint ventures and subsidiaries. Accordingly, repayment of our indebtedness, including the 2018 Notes, is dependent on the generation of cash flow by our joint ventures and subsidiaries and their ability to make such cash available to us, by dividend, debt repayment or otherwise. Unless they are guarantors of the 2018 Notes or our other indebtedness, our joint ventures and subsidiaries do not have any obligation to pay amounts due on the 2018 Notes or our other indebtedness or to make funds available for that purpose. Our joint ventures and subsidiaries may not be able to, or may not be permitted to, make distributions to enable us to make payments in respect of our indebtedness. Each joint venture and subsidiary is a distinct legal entity, and, under certain circumstances, legal and contractual restrictions may limit our ability to obtain cash from our joint ventures and subsidiaries. While the Indenture and the agreements governing certain of our other existing indebtedness limit the ability of certain of our joint ventures and subsidiaries to incur consensual restrictions on their ability to pay dividends or make other intercompany payments to us, these limitations are subject to qualifications and exceptions. In the event that we do not receive distributions from our joint ventures and subsidiaries, we may be unable to make required principal and interest payments on our indebtedness.
Our inability to generate sufficient cash flows to satisfy our debt obligations, or to refinance our indebtedness on commercially reasonable terms or at all, would materially and adversely affect our financial position and results of operations.
If we cannot make scheduled payments on our debt, we will be in default and holders of the 2018 Notes could declare all outstanding principal and interest to be due and payable, the lenders under the EXCO Resources Credit Agreement could terminate their commitments to loan money, our secured lenders could foreclose against the assets securing their borrowings and we could be forced into bankruptcy or liquidation.
Restrictive debt covenants could limit our growth and our ability to finance our operations, fund our capital needs, respond to changing conditions and engage in other business activities that may be in our best interests.
The EXCO Resources Credit Agreement and the Indenture contain a number of significant covenants that, among other things, restrict our ability to:
| | • | | incur or guarantee additional indebtedness and issue certain types of preferred stock; |
43
| | • | | pay dividends on our capital stock; |
| | • | | create liens on our assets; |
| | • | | enter into sale or leaseback transactions; |
| | • | | enter into specified investments or acquisitions; |
| | • | | repurchase, redeem or retire our capital stock or subordinated debt; |
| | • | | merge or consolidate, or transfer all or substantially all of our assets and the assets of our subsidiaries; |
| | • | | engage in specified transactions with subsidiaries and affiliates; or |
| | • | | pursue other corporate activities. |
Also, the EXCO Resources Credit Agreement requires us to maintain compliance with specified financial ratios and satisfy certain financial condition tests. Our ability to comply with these ratios and financial condition tests may be affected by events beyond our control, and, as a result, we may be unable to meet these ratios and financial condition tests. These financial ratio restrictions and financial condition tests could limit our ability to obtain future financings, make needed capital expenditures, withstand a future downturn in our business or the economy in general or otherwise conduct necessary corporate activities. We may also be prevented from taking advantage of business opportunities that arise because of the limitations imposed on us by the restrictive covenants under the EXCO Resources Credit Agreement and the Indenture. A breach of any of these covenants or our inability to comply with the required financial ratios or financial condition tests could result in a default under the applicable indebtedness. The consolidated funded indebtedness to consolidated EBITDAX ratio, as defined in the EXCO Resources Credit Agreement, is computed using a trailing twelve-month computation. When oil and/or natural gas prices decline for an extended period of time, our ability to pass this covenant becomes more difficult. Such a default, if not cured or waived, may allow the creditors to accelerate the related indebtedness and could result in acceleration of any other indebtedness to which a cross-acceleration or cross-default provision applies. An event of default under the Indenture would permit the lenders under the EXCO Resources Credit Agreement to terminate all commitments to extend further credit under the agreement. Furthermore, if we were unable to repay the amounts due and payable under the EXCO Resources Credit Agreement, those lenders could proceed against the collateral granted to them to secure that indebtedness. In the event that our lenders or noteholders accelerate the repayment of our borrowings, we and our subsidiaries may not have sufficient assets to repay that indebtedness. As a result of these restrictions, we may be:
| | • | | limited in how we conduct our business; |
| | • | | unable to raise additional debt or equity financing during general economic, business or industry downturns; or |
| | • | | unable to compete effectively or to take advantage of new business opportunities. |
The credit risk of financial institutions could adversely affect us.
We have exposure to different counterparties, and we have entered into transactions with counterparties in the financial services industry, including commercial banks, investment banks, insurance companies and other institutions. These transactions expose us to credit risk in the event of default of our counterparty. Deterioration in the credit markets may impact the credit ratings of our current and potential counterparties and affect their ability to fulfill their existing obligations to us and their willingness to enter into future transactions with us. We have exposure to financial institutions in the form of derivative transactions in connection with our hedges and insurance companies in the form of claims under our policies. In addition, if any lender under the EXCO Resources Credit Agreement is unable to fund its commitment, our liquidity will be reduced by an amount up to the aggregate amount of such lender’s commitment under the credit agreement.
Risks relating to our common stock
Our stock price may fluctuate significantly.
Our common stock began trading on the NYSE on February 9, 2006. An active trading market may not be sustained. The market price of our common stock could fluctuate significantly as a result of:
| | • | | actual or anticipated quarterly variations in our operating results; |
| | • | | changes in expectations as to our future financial performance or changes in financial estimates of public market analysis; |
| | • | | announcements relating to our business or the business of our competitors; |
| | • | | conditions generally affecting the oil and natural gas industry; |
| | • | | the success of our operating strategy; and |
| | • | | the operating and stock price performance of other comparable companies. |
Many of these factors are beyond our control and we cannot predict their potential effects on the price of our common stock. In addition, the stock markets in general can experience considerable price and volume fluctuations.
44
Future sales of our common stock may cause our stock price to decline.
As of December 31, 2011, we had 216,706,283 shares of common stock outstanding, including 2,562,409 shares of restricted stock issued to certain employees. All shares, other than restricted stock and shares held by our affiliates, are freely tradable in the public market. Sales of substantial amounts of our common stock in the public market, or the perception that these sales may occur, could cause the market price of our common stock to decline. In addition, the sale of these shares could impair our ability to raise capital through the sale of additional common or preferred stock.
The equity trading markets may be volatile, which could result in losses for our shareholders.
The equity trading markets may experience periods of volatility, which could result in highly variable and unpredictable pricing of equity securities. The market price of our common stock could change in ways that may or may not be related to our business, our industry or our operating performance and financial condition.
Our articles of incorporation permit us to issue preferred stock that may restrict a takeover attempt that you may favor.
Our articles of incorporation permit our board to issue up to 10,000,000 shares of preferred stock and to establish by resolution one or more series of preferred stock and the powers, designations, preferences and participating, optional or other special rights of each series of preferred stock. The preferred stock may be issued on terms that are unfavorable to the holders of our common stock, including the grant of superior voting rights, the grant of preferences in favor of preferred shareholders in the payment of dividends and upon our liquidation and the designation of conversion rights that entitle holders of our preferred stock to convert their shares into our common stock on terms that are dilutive to holders of our common stock. The issuance of preferred stock in future offerings may make a takeover or change in control of us more difficult.
We may reduce or discontinue paying our quarterly cash dividend if our board of directors determines that paying a dividend is no longer appropriate.
In October 2009, we commenced a quarterly cash dividend program on shares of our common stock. Any future dividend payments will depend on our earnings, capital requirements, financial condition, prospects and other factors that our board of directors may deem relevant. At any time, our board of directors may decide to reduce or discontinue paying our quarterly cash dividend. If we do not pay dividends, our common stock may be less valuable because a return on your investment will only occur if our stock price appreciates. In addition, the EXCO Resources Credit Agreement and the Indenture restrict our ability to pay dividends.
| Item 1B. | Unresolved Staff Comments |
Not applicable.
Corporate offices
We lease office space in Dallas, Texas; Warrendale, Pennsylvania and Cranberry Township, Pennsylvania. We also have small offices for technical and field operations in Texas, Louisiana, Pennsylvania and West Virginia. The table below summarizes our material corporate leases.
| | | | | | | | | | |
Location | | Approximate
square
footage | | | Approximate
monthly
payment | | | Expiration |
Dallas, Texas | | | 203,000 | | | $ | 298,800 | | | December 31, 2015 |
Warrendale, Pennsylvania | | | 56,000 | | | $ | 104,300 | | | October 31, 2016 |
Cranberry Township, Pennsylvania | | | 6,900 | | | $ | 9,500 | | | February 28, 2013 |
Other
We have described our oil and natural gas properties, oil and natural gas reserves, acreage, wells, production and drilling activity in “Item 1. Business” of this Annual Report on Form 10-K.
45
In the ordinary course of business, we are periodically a party to various litigation matters. We do not believe that any resulting liability from existing legal proceedings, individually or in the aggregate, will have a material adverse effect on our results of operations or financial condition.
Environmental proceedings
Under a Consent Agreement and Final Order, or CAO, dated December 22, 2011, between OPCO and the EPA, OPCO agreed to pay a fine of $159,624 to settle allegations related to its compliance with SDWA permitting requirements at a well site in Clearfield County, Pennsylvania. EXCO and BG Group each own 50% of OPCO, which is the joint operator of our Appalachia JV. The EPA determined that OPCO failed to cease injection operations at the well site once a loss of mechanical integrity became evident, failed to give advance notice to the EPA of the reworking of the well site in July and August 2011, failed to give advance notice to the EPA of a planned mechanical integrity test. Additionally, the EPA cited OPCO for operating the well during March, April and May 2010 at a pressure of 3,250 psi, which exceeded the SDWA permit, reporting future noncompliance with permitting requirements and limitation of 3,240 psi. Under the CAO, OPCO agreed to take certain corrective measures, including but not limited to restoring the well’s mechanical integrity or plugging the well by June 1, 2012. OPCO signed the CAO on December 22, 2011 and believes the CAO will be finalized by the EPA during the first quarter of 2012.
| Item 4. | Mine Safety Disclosures |
Not applicable.
46
PART II
| Item 5. | Market for the Registrant’s Common Equity, Related Stockholder Matters and Issuer Purchases of Equity Securities |
Market information for our common stock
Our common stock trades on the NYSE under the symbol “XCO.” The following table sets forth, for the periods indicated, the high and low sales prices per share of our common stock as reported by the NYSE:
| | | | | | | | | | | | |
| | | Price per share | | | Dividends | |
| | | High | | | Low | | | declared | |
2011 | | | | | | | | | | | | |
First Quarter | | $ | 20.79 | | | $ | 18.95 | | | $ | 0.04 | |
Second Quarter | | | 21.04 | | | | 16.91 | | | | 0.04 | |
Third Quarter | | | 17.81 | | | | 10.58 | | | | 0.04 | |
Fourth Quarter | | | 13.55 | | | | 9.33 | | | | 0.04 | |
2010 | | | | | | | | | | | | |
First Quarter | | $ | 22.45 | | | $ | 16.50 | | | $ | 0.03 | |
Second Quarter | | | 21.34 | | | | 14.02 | | | | 0.03 | |
Third Quarter | | | 15.81 | | | | 13.25 | | | | 0.04 | |
Fourth Quarter | | | 20.37 | | | | 13.62 | | | | 0.04 | |
Our shareholders
According to our transfer agent, Continental Stock Transfer & Trust Company, there were 461 holders of record of our common stock on December 31, 2011 (including nominee holders such as banks and brokerage firms who hold shares for beneficial holders and the restricted stock shareholders).
Our dividend policy
In 2011, we paid quarterly dividends of $0.04 per share totaling $34.2 million. In addition, in 2011 we accrued $0.1 million of dividends payable to the holders of the restricted stock when their shares vest. In 2010, we paid dividends totaling $29.8 million. Any future declaration of dividends, as well as the establishment of record and payment dates, is subject to limitations under the EXCO Resources Credit Agreement, the Indenture governing the 2018 Notes and the approval of EXCO’s board of directors.
Issuer repurchases of common stock
The following table details our repurchase of common stock for the three months ended December 31, 2011:
| | | | | | | | | | | | | | | | |
Period | | Total Number of
Shares Purchased (1) | | | Average Price
Paid Per Share | | | Total Number of
Shares Purchased as
Part of Publicly Announced
Plans or Programs | | | Maximum Approximate
Dollar Value of Shares that
May Yet Be Purchased
Under the Plans or Programs (1) | |
October 1 - October 31, 2011 | | | 0 | | | $ | 0.00 | | | | 0 | | | $ | 192.5 million | |
November 1 - November 30, 2011 | | | 0 | | | $ | 0.00 | | | | 0 | | | $ | 192.5 million | |
December 1 - December 31, 2011 | | | 0 | | | $ | 0.00 | | | | 0 | | | $ | 192.5 million | |
| | | | | | | | | | | | | | | | |
Total | | | 0 | | | $ | 0.00 | | | | 0 | | | | | |
| (1) | On July 19, 2010, we announced a $200.0 million share repurchase program. This program was suspended as a result of the pending strategic alternatives being evaluated by a special committee of our board of directors in connection with the October 29, 2010 proposal from our Chairman and Chief Executive Officer to purchase all of our outstanding common stock. On July 8, 2011, the special committee of our board of directors terminated their strategic alternative review process and on August 5, 2011, our board of directors agreed to reinstate the repurchase program. |
47
| Item 6. | Selected Financial Data |
The following table presents our selected historical financial and operating data. You should read this financial data in conjunction with “Item 7. Management’s Discussion and Analysis of Financial Condition and Results of Operations,” our consolidated financial statements, the notes to our consolidated financial statements and the other financial information included in this Annual Report on Form 10-K. This information does not replace the consolidated financial statements.
Selected consolidated financial and operating data
| | | | | | | | | | | | | | | | | | | | |
| | | Years ended December 31, | |
(in thousands, except per share amounts) | | 2011 | | | 2010 | | | 2009 | | | 2008 | | | 2007 | |
Statement of operations data (1): | | | | | | | | | | | | | | | | | | | | |
Revenues: | | | | | | | | | | | | | | | | | | | | |
Oil and natural gas | | $ | 754,201 | | | $ | 515,226 | | | $ | 550,505 | | | $ | 1,404,826 | | | $ | 875,787 | |
Midstream (2) | | | — | | | | — | | | | 35,330 | | | | 85,432 | | | | 18,817 | |
| | | | | | | | | | | | | | | | | | | | |
Total revenues | | | 754,201 | | | | 515,226 | | | | 585,835 | | | | 1,490,258 | | | | 894,604 | |
| | | | | | | | | | | | | | | | | | | | |
| | | | | |
Costs and expenses: | | | | | | | | | | | | | | | | | | | | |
Oil and natural gas production (3) | | | 108,641 | | | | 108,184 | | | | 177,629 | | | | 238,071 | | | | 168,999 | |
Midstream operating (2) | | | — | | | | — | | | | 35,580 | | | | 82,797 | | | | 16,289 | |
Gathering and transportation | | | 86,881 | | | | 54,877 | | | | 18,960 | | | | 14,206 | | | | 10,210 | |
Depreciation, depletion and amortization | | | 362,956 | | | | 196,963 | | | | 221,438 | | | | 460,314 | | | | 375,420 | |
Write-down of oil and natural gas properties | | | 233,239 | | | | — | | | | 1,293,579 | | | | 2,815,835 | | | | — | |
Accretion of discount on asset retirement obligations | | | 3,652 | | | | 3,758 | | | | 7,132 | | | | 6,703 | | | | 4,878 | |
General and administrative (4) | | | 104,618 | | | | 105,114 | | | | 99,177 | | | | 87,568 | | | | 64,670 | |
(Gain) loss on divestitures and other operating items | | | 23,819 | | | | (509,872 | ) | | | (676,434 | ) | | | (2,692 | ) | | | (3,997 | ) |
| | | | | | | | | | | | | | | | | | | | |
Total costs and expenses | | | 923,806 | | | | (40,976 | ) | | | 1,177,061 | | | | 3,702,802 | | | | 636,469 | |
| | | | | | | | | | | | | | | | | | | | |
Operating income (loss) | | | (169,605 | ) | | | 556,202 | | | | (591,226 | ) | | | (2,212,544 | ) | | | 258,135 | |
Other income (expense): | | | | | | | | | | | | | | | | | | | | |
Interest expense | | | (61,023 | ) | | | (45,533 | ) | | | (147,161 | ) | | | (161,638 | ) | | | (181,350 | ) |
Gain on derivative financial instruments (5) | | | 219,730 | | | | 146,516 | | | | 232,025 | | | | 384,389 | | | | 26,807 | |
Other income | | | 788 | | | | 327 | | | | 126 | | | | 1,289 | | | | 6,160 | |
Equity method income (loss) (2) | | | 32,706 | | | | 16,022 | | | | (69 | ) | | | — | | | | — | |
| | | | | | | | | | | | | | | | | | | | |
Total other income (expense) | | | 192,201 | | | | 117,332 | | | | 84,921 | | | | 224,040 | | | | (148,383 | ) |
| | | | | | | | | | | | | | | | | | | | |
Income (loss) before income taxes | | | 22,596 | | | | 673,534 | | | | (506,305 | ) | | | (1,988,504 | ) | | | 109,752 | |
Income tax expense (benefit) | | | — | | | | 1,608 | | | | (9,501 | ) | | | (255,033 | ) | | | 60,096 | |
| | | | | | | | | | | | | | | | | | | | |
Net income (loss) | | | 22,596 | | | | 671,926 | | | | (496,804 | ) | | | (1,733,471 | ) | | | 49,656 | |
Preferred stock dividends | | | — | | | | — | | | | — | | | | (76,997 | ) | | | (132,968 | ) |
| | | | | | | | | | | | | | | | | | | | |
Net income (loss) available to common shareholders | | $ | 22,596 | | | $ | 671,926 | | | $ | (496,804 | ) | | $ | (1,810,468 | ) | | $ | (83,312 | ) |
| | | | | | | | | | | | | | | | | | | | |
Basic income (loss) per share available to common shareholder | | $ | 0.11 | | | $ | 3.16 | | | $ | (2.35 | ) | | $ | (11.81 | ) | | $ | (0.80 | ) |
| | | | | | | | | | | | | | | | | | | | |
Diluted income (loss) per share available to common shareholders | | $ | 0.10 | | | $ | 3.11 | | | $ | (2.35 | ) | | $ | (11.81 | ) | | $ | (0.80 | ) |
| | | | | | | | | | | | | | | | | | | | |
Cash dividends declared per share | | $ | 0.16 | | | $ | 0.14 | | | $ | 0.05 | | | $ | — | | | $ | — | |
| | | | | | | | | | | | | | | | | | | | |
Weighted average common and common equivalent shares outstanding: | | | | | | | | | | | | | | | | | | | | |
Basic | | | 213,908 | | | | 212,465 | | | | 211,266 | | | | 153,346 | | | | 104,364 | |
Diluted | | | 216,705 | | | | 215,735 | | | | 211,266 | | | | 153,346 | | | | 104,364 | |
48
Selected consolidated financial and operating data (continued)
| | | | | | | | | | | | | | | | | | | | |
| | | Years ended December 31, | |
| | | 2011 | | | 2010 | | | 2009 | | | 2008 | | | 2007 | |
| | | | | |
Statement of cash flow data: | | | | | | | | | | | | | | | | | | | | |
Net cash provided by (used in): | | | | | | | | | | | | | | | | | | | | |
Operating activities | | $ | 428,543 | | | $ | 339,921 | | | $ | 433,605 | | | $ | 974,966 | | | $ | 577,829 | |
Investing activities | | | (709,531 | ) | | | (712,854 | ) | | | 1,235,275 | | | | (1,708,579 | ) | | | (2,396,437 | ) |
Financing activities | | | 268,756 | | | | 348,755 | | | | (1,657,612 | ) | | | 735,242 | | | | 1,851,296 | |
Balance sheet data: | | | | | | | | | | | | | | | | | | | | |
Current assets | | $ | 678,008 | | | $ | 520,460 | | | $ | 402,088 | | | $ | 513,040 | | | $ | 311,300 | |
Total assets | | | 3,791,587 | | | | 3,477,420 | | | | 2,358,894 | | | | 4,822,352 | | | | 5,955,771 | |
Current liabilities | | | 287,399 | | | | 285,698 | | | | 212,914 | | | | 322,873 | | | | 278,167 | |
Long-term debt | | | 1,887,828 | | | | 1,588,269 | | | | 1,196,277 | | | | 3,019,738 | | | | 2,099,171 | |
Shareholders’ equity | | | 1,558,332 | | | | 1,540,552 | | | | 859,588 | | | | 1,332,501 | | | | 1,115,742 | |
Total liabilities and shareholders’ equity | | | 3,791,587 | | | | 3,477,420 | | | | 2,358,894 | | | | 4,822,352 | | | | 5,955,771 | |
| (1) | We have completed numerous acquisitions and dispositions which impact the comparability of the selected financial data between periods (see Note 4. “Divestitures, acquisitions and other significant events” in our notes to consolidated financial statements). |
| (2) | Prior to the closing of the formation of TGGT on August 14, 2009, we designated our midstream operations as a separate business segment. Following the formation of TGGT, our midstream operations are accounted for using the equity method. |
| (3) | Share-based compensation pursuant to Financial Accounting Standards Board, or FASB, ASC Topic 718, Compensation— Stock Compensation, included in oil and natural gas production costs was $0.1 million, $1.0 million, $2.8 million, $4.2 million and $3.6 million for the years ended December 31, 2011, 2010, 2009, 2008 and 2007, respectively. |
| (4) | Share-based compensation pursuant to FASB ASC Topic 718, Compensation—Stock Compensation, included in general and administrative expenses was $10.9 million, $15.8 million, $16.2 million, $11.8 million and $9.0 million for the years ended December 31, 2011, 2010, 2009, 2008 and 2007, respectively. |
| (5) | We do not designate our derivative financial instruments as hedges and, as a result, the changes in the fair value of our derivative financial instruments are recognized directly in our statement of operations. See “Item 7. Management’s Discussion and Analysis of Financial Condition and Results of Operations—Critical accounting policies—Accounting for derivatives” for a description of this accounting method. |
49
| Item 7. | Management’s Discussion and Analysis of Financial Condition and Results of Operations |
The following discussion and analysis of our financial condition and results of operations should be read in conjunction with our financial statements and the related notes to those statements included elsewhere in this Annual Report on Form 10-K. In addition to historical financial information, the following discussion and analysis contains forward-looking statements that involve risks, uncertainties and assumptions. Our results and the timing of selected events may differ materially from those anticipated in these forward-looking statements as a result of many factors, including those discussed under “risk factors” and elsewhere in this Annual Report on Form 10-K.
Overview and history
We are an independent oil and natural gas company engaged in the exploration, exploitation, development and production of onshore U.S. oil and natural gas properties with a focus on shale resource plays. Our principal operations are conducted in certain key U.S. oil and natural gas areas including East Texas, North Louisiana, Appalachia and the Permian Basin in West Texas. In addition to our oil and natural gas producing operations, we own 50% interests in two midstream joint ventures located in East Texas/North Louisiana and Appalachia.
Our shale resource plays and midstream operations are conducted through four joint ventures with BG Group. A brief description of each joint venture follows.
| | • | | East Texas/North Louisiana JV |
A joint venture with BG Group covering an undivided 50% interest in a substantial portion of our assets in the East Texas/North Louisiana area including the Haynesville/Bossier shale and conventional shallow producing assets. The East Texas/North Louisiana JV is governed by a joint development agreement with our subsidiary, EXCO Operating, serving as operator. Under the terms of the agreement, BG Group funded 75% of our share of deep drilling and completion costs within our joint venture area up to a total of $400.0 million. During the first quarter of 2011, we utilized the balance of the East Texas/North Louisiana Carry.
A joint venture with BG Group in which we each own a 50% interest in TGGT, which holds most of our East Texas/North Louisiana midstream assets.
A 50/50 joint venture with BG Group covering our shallow producing assets and Marcellus shale acreage in the Appalachia region. EXCO and BG Group jointly operate the Appalachia JV operations through OPCO, which holds a 0.5% working interest in all of the shallow conventional assets and the deep rights in the Appalachia JV. Under the terms of the agreement, BG Group agreed to fund 75% of our share of deep drilling and completion costs within our joint venture area up to a total of $150.0 million. As of December 31, 2011, the remaining balance of the Appalachia Carry was approximately $54.6 million.
| | • | | Appalachia Midstream JV |
A joint venture with BG Group in which we each own a 50% interest in a midstream company which will develop infrastructure and provide take-away capacity in the Marcellus shale.
Our primary strategy is to appraise, develop and exploit our Haynesville, Bossier and Marcellus shale resources, primarily through horizontal drilling, and to leverage our complementary midstream gathering facilities to promptly transport our production to multiple market outlets. Future acquisitions are primarily targeted on supplementing our shale resource holdings in the East Texas/North Louisiana and Appalachian areas. We continue to develop vertical drilling opportunities in our Permian Basin area as this region has high oil reserves and natural gas with a high liquid content.
During 2011, we completed a number of significant transactions.
| | • | | On January 11, 2011, we funded the Chief Transaction for approximately $459.4 million, after post-closing purchase price adjustments, subject to post-closing title adjustments and customary post-closing purchase price adjustments. The $459.4 |
50
| | million preliminary purchase price was funded into an escrow account pending receipt of a waiver from a third party, which was received on January 11, 2011 and all properties were released to us. During the third quarter of 2011, the post-closing adjustments were completed on the Chief Transaction resulting in a final purchase price of $454.4 million ($227.2 million net to us). BG Group participated in its 50% share of the transaction. |
| | • | | On March 1, 2011, we jointly closed the purchase of Marcellus shale properties with BG Group, which included certain shallow production primarily in Jefferson and Clarion counties in Pennsylvania for $82.0 million ($41.0 million net to us). |
| | • | | On April 5, 2011, we closed the Haynesville Shale Acquisition for $225.2 million acquisition, which included land, mineral interests and other assets in the DeSoto Parish. On May 12, 2011, BG Group elected to participate in this acquisition for its 50% share. |
As of December 31, 2011, the related PV-10 of our Proved Reserves was approximately $1.7 billion, and the Standardized Measure of our Proved Reserves was $1.4 billion (see “Item 1. Business—Summary of geographic areas of operations” for a reconciliation of PV-10 to the Standardized Measure of Proved Reserves). For the year ended December 31, 2011, we produced 182.7 Bcfe of oil and natural gas resulting in a Reserve Life of approximately 7.3 years.
Our 2011 development, exploitation and other oil and natural gas property capital expenditures totaled $855.5 million, net of $30.2 million of East Texas/North Louisiana Carry and $72.2 million of Appalachia Carry paid for our benefit by BG Group. In addition, we leased $19.0 million of undeveloped acreage in the Haynesville/Bossier shale resource play in East Texas/North Louisiana and $10.6 million of undeveloped acreage in the Marcellus shale resource play in Appalachia, net of reimbursements from BG Group. Contributions to our equity investments were $13.8 million. Corporate, gathering, and seismic capital expenditures totaled $82.4 million. We completed $396.4 million of acquisitions, net of reimbursements from BG Group. These acquisitions were mostly undeveloped acreage in the Haynesville/Bossier and Marcellus shale resource plays.
Our initial 2012 capital budget of $710.0 million was constructed using an average natural gas price assumption of $4.00 per Mmbtu, as adjusted for differentials. As of January 31, 2012, the NYMEX strip for the remainder of 2012 was $2.88 per Mmbtu. Although our board of directors approved the $710.0 million capital budget in November 2011, we have revised our spending plans to $470.0 million. Management is also addressing cost reduction initiatives in operating and administrative areas in response to the reduced drilling program. Our significant held-by-production acreage and derivative financial instruments allow us flexibility to manage the pace of drilling as we expect natural gas prices to remain volatile.
For 2012, TGGT’s initial capital budget was between $100.0 and $115.0 million, which included 2012 projects focusing primarily on completing treating facilities in DeSoto Parish and the Shelby Area. In light of the low natural gas environment and significant reductions in the East Texas/North Louisiana JV’s drilling in the Shelby Area, TGGT has reduced its capital expenditure budget to approximately $75.0 to $85.0 million. The management of TGGT continues to evaluate several expansion projects, which will be primarily driven by natural gas prices and third party producer opportunities and believes cash flows from operations and borrowing capacity under its credit agreement will be sufficient to fund its 2012 capital expenditure programs.
We do not expect to make significant capital contributions in 2012 to our Appalachia Midstream JV as the majority of our Northeastern Pennsylvania development drilling accesses an existing third party gathering system.
Like all oil and natural gas production companies, we face the challenge of natural production declines. We attempt to offset this natural decline by drilling to identify and develop additional reserves and add reserves through acquisitions. As of December 31, 2011, 97.1% of our estimated Proved Reserves were natural gas. Consequently, our results of operations are particularly impacted by the natural gas markets.
Critical accounting policies
In response to the SEC’s Release No. 33-8040, “Cautionary Advice Regarding Disclosure About Critical Accounting Policies,” we have identified the most critical accounting policies used in the preparation of our consolidated financial statements. We determined the critical policies by considering accounting policies that involve the most complex or subjective decisions or assessments. We identified our most critical accounting policies to be those related to our Proved Reserves, accounting for business combinations, accounting for derivatives, share-based payments, our choice of accounting method for oil and natural gas properties, goodwill, asset retirement obligations and income taxes.
We prepared our consolidated financial statements for inclusion in this report in accordance with GAAP. GAAP represents a comprehensive set of accounting and disclosure rules and requirements, and applying these rules and requirements requires
51
management judgments and estimates including, in certain circumstances, choices between acceptable GAAP alternatives. The following is a discussion of our most critical accounting policies, judgments and uncertainties that are inherent in our application of GAAP.
Estimates of Proved Reserves
The Proved Reserves data included in this Annual Report on Form 10-K was prepared in accordance with SEC guidelines. The accuracy of a reserve estimate is a function of:
| | • | | the quality and quantity of available data; |
| | • | | the interpretation of that data; |
| | • | | the accuracy of various mandated economic assumptions; and |
| | • | | the technical qualifications, experience and judgment of the persons preparing the estimates. |
Because these estimates depend on many assumptions, all of which may substantially differ from actual results, reserve estimates may be different from the quantities of oil and natural gas that are ultimately recovered. In addition, results of drilling, testing and production after the date of an estimate may justify material revisions to the estimate. The assumptions used for our Haynesville and Marcellus well and reservoir characteristics and performance are subject to further refinement as more production history is accumulated.
You should not assume that the present value of future net cash flows represents the current market value of our estimated Proved Reserves. In accordance with the SEC requirements, we based the estimated discounted future net cash flows from Proved Reserves according to the requirements in the SEC’s Release No. 33-8995 Modernization of Oil and Gas Reporting, or Release No. 33-8995. Actual future prices and costs may be materially higher or lower than the prices and costs used in the preparation of the estimate. Further, the mandated discount rate of 10% may not be an accurate assumption of future interest rates.
Proved Reserve quantities directly and materially impact depletion expense. If the Proved Reserves decline, then the rate at which we record depletion expense increases, reducing net income. A decline in the estimate of Proved Reserves may result from lower market prices, making it uneconomical to drill or produce from higher cost fields. In addition, a decline in Proved Reserves may impact the outcome of our assessment of our oil and natural gas properties and require an impairment of the carrying value of our oil and natural gas properties.
Proved Reserves are defined as those quantities of oil and gas, which, by analysis of geoscience and engineering data, can be estimated with reasonable certainty to be economically producible, from a given date forward, from known reservoirs, and under existing economic conditions, operating methods, and government regulations, prior to the time at which contracts providing the right to operate expire, unless evidence indicates that renewal is reasonably certain, regardless of whether the estimates are a deterministic estimate or probabilistic estimate. The project to extract the hydrocarbons must have commenced, or the operator must be reasonably certain that it will commence the project, within a reasonable time.
The area of the reservoir considered as proved includes both the area identified by drilling and limited by fluid contacts, if any, and adjacent undrilled portions of the reservoir that can, with reasonable certainty, be judged to be continuous with it and to contain economically producible oil or natural gas on the basis of available geoscience and engineering data. In the absence of data on fluid contacts, proved quantities in a reservoir are limited by the lowest known hydrocarbons as seen in a well penetration unless geoscience, engineering, or performance data and reliable technology establish a lower contact with reasonable certainty.
Where direct observation from well penetrations has defined a highest known oil elevation and the potential exists for an associated gas cap, proved oil reserves may be assigned in the structurally higher portions of the reservoir only if geoscience, engineering, or performance data and reliable technology establish the higher contact with reasonable certainty.
Reserves that can be produced economically through application of improved recovery techniques (including, but not limited to, fluid injection) are included in the proved classification when successful testing by a pilot project in an area of the reservoir with properties no more favorable than in the reservoir as a whole, the operation of an installed program in the reservoir or an analogous reservoir, or other evidence using reliable technology establishes the reasonable certainty of the engineering analysis on which the project or program was based, and the project has been approved for development by all necessary parties and entities, including governmental entities.
Undrilled locations can be classified as having undeveloped reserves only if a development plan has been adopted indicating that they are scheduled to be drilled within five years, unless the specific circumstances justify a longer time.
52
Existing economic conditions include prices and costs at which economic producibility from a reservoir is to be determined. The price shall be the average price during the 12-month period before the ending date of the period covered by the report, determined as an unweighted arithmetic average of the first-day-of-the-month price for each month within such period, unless prices are defined by contractual arrangements, excluding escalations based upon future conditions.
Business combinations
For the periods covered by this Annual Report on Form 10-K, we use the FASB ASC Subtopic 805-10, Business Combinations, or ASC 805-10, to record our acquisitions of oil and natural gas properties or entities which we acquired beginning on January 1, 2009. ASC 805-10 requires that acquired assets, identifiable intangible assets and liabilities be recorded at their fair value, with any excess purchase price being recognized as goodwill. Application of ASC 805-10 requires significant estimates to be made by management using information available at the time of acquisition. Since these estimates require the use of significant judgment, actual results could vary as the estimates are subject to changes as new information becomes available.
Accounting for derivatives
We use derivative financial instruments to manage price fluctuations, protect our investments and achieve a more predictable cash flow in connection with our acquisitions. These derivative financial instruments are not held for trading purposes. We do not designate our derivative financial instruments as hedging instruments and, as a result, we recognize the change in the derivative’s fair value as a component of current earnings.
Share-based payments
We account for share-based compensation in accordance with FASB ASC Topic 718, Compensation—Stock Compensation, or ASC 718. At December 31, 2011, our employees and directors held options under EXCO’s 2005 Long-Term Incentive Plan, or the 2005 Incentive Plan, to purchase 15,670,168 shares of EXCO’s common stock at prices ranging from $6.33 per share to $38.01 per share. The options expire five to ten years from the date of grant, depending on the terms of the grant. Pursuant to the 2005 Incentive Plan, 25% of the options vest immediately with an additional 25% of the options vesting on each of the next three anniversaries of the date of grant. We use the Black-Scholes model to calculate the fair value of issued options. The gross fair value of the 2011 granted options using the Black-Scholes model range from $5.14 per share to $11.62 per share. As December 31, 2011, our employees also held 2,562,409 restricted shares under the 2005 Incentive Plan with grant prices ranging from $10.63 to $14.83 per share. The restricted shares vest over three to five years, depending on the terms of the grant. ASC 718 requires share-based compensation be recorded with cost classifications consistent with cash compensation. EXCO uses the full cost method to account for its oil and natural gas properties. As a result, part of our share-based payments is capitalized. Total share-based compensation for the year ended December 31, 2011 was $17.4 million, of which $6.4 million was capitalized as part of our oil and natural gas properties. For the years ended December 31, 2010 and 2009, a total of $23.2 million and $24.1 million, respectively, of share-based compensation was incurred, of which $6.4 million and $5.1 million, respectively, was capitalized.
Accounting for oil and natural gas properties
The accounting for, and disclosure of, oil and natural gas producing activities require that we choose between two GAAP alternatives: the full cost method or the successful efforts method. We use the full cost method of accounting, which involves capitalizing all acquisition, exploration, exploitation and development costs of oil and natural gas properties. Once we incur costs, they are recorded in the depletable pool of proved properties or in unproved properties, collectively, the full cost pool. Our unproved property costs are not subject to depletion. We review our unproved oil and natural gas property costs on a quarterly basis to assess possible impairment or the need to transfer unproved costs to proved properties as a result of extension or discoveries from drilling operations. We expect these costs to be evaluated in one to seven years and transferred to the depletable portion of the full cost pool during that time. The full cost pool is comprised of intangible drilling costs, lease and well equipment and exploration and development costs incurred plus costs of acquired proved and unproved leaseholds.
When we acquire significant amounts of undeveloped acreage, we capitalize interest on the acquisition costs in accordance with FASB ASC Subtopic 835-20, Capitalization of Interest. We began capitalizing interest in April 2008, upon identification and development of shale resource opportunities in the Haynesville and Marcellus areas. When the unproved property costs are moved to proved developed and undeveloped oil and natural gas properties, or the properties are sold, we cease capitalizing interest.
We calculate depletion using the unit-of-production method. Under this method, the sum of the full cost pool, excluding the book value of unproved properties, and all estimated future development costs, is divided by the total estimated quantities of Proved Reserves. This rate is applied to our total production for the period, and the appropriate expense is recorded. We capitalize the portion of general and administrative costs, including share-based compensation, that is attributable to our exploration, exploitation and development activities.
53
Sales, dispositions and other oil and natural gas property retirements are accounted for as adjustments to the full cost pool, with no recognition of gain or loss, unless the disposition would significantly alter the amortization rate and/or the relationship between capitalized costs and Proved Reserves. The impacts on our depletion rate from the formation of the Appalachia JV in 2010 and the formation of the East Texas/North Louisiana JV in 2009, along with certain other divestiture transactions in 2009, as discussed in “Note 4. Divestitures, acquisitions and other significant events” of our notes to consolidated financial statements, were considered significant and we recognized gains of $528.9 million and $691.9 million in 2010 and 2009, respectively, on our divestitures. There were no sales of oil and natural gas properties in 2011 that resulted in recognition of gains or losses.
Pursuant to Rule 4-10(c)(4) of Regulation S-X, at the end of each quarterly period, companies that use the full cost method of accounting for their oil and natural gas properties must compute a limitation on capitalized costs, or ceiling test. The ceiling test involves comparing the net book value of the full cost pool, after taxes, to the full cost ceiling limitation defined below. In the event the full cost ceiling limitation is less than the full cost pool, a ceiling test write-down of oil and natural gas properties to the value of the full cost ceiling limitation is required. The full cost ceiling limitation is computed as the sum of the present value of estimated future net revenues from our Proved Reserves by applying average prices as prescribed by the SEC Release No. 33-8995, less estimated future expenditures (based on current costs) to develop and produce the Proved Reserves, discounted at 10%, plus the cost of properties not being amortized and the lower of cost or estimated fair value of unproved properties included in the costs being amortized, net of income tax effects.
The ceiling test is computed using the simple average spot price for the trailing twelve month period using the first day of each month. For the twelve months ended December 31, 2011, the trailing twelve month reference price was $96.19 per Bbl for the West Texas Intermediate oil at Cushing, Oklahoma and $4.12 per Mmbtu for natural gas at Henry Hub. Each of the aforementioned reference prices for oil and natural gas are further adjusted for quality factors and regional differentials to derive estimated future net revenues. Under full cost accounting rules, any ceiling test write-downs of oil and natural gas properties may not be reversed in subsequent periods. Since we do not designate our derivative financial instruments as hedges, we are not allowed to use the impacts of the derivative financial instruments in our ceiling test computation.
The ceiling test calculation is based upon estimates of Proved Reserves. There are numerous uncertainties inherent in estimating quantities of Proved Reserves, in projecting the future rates of production and in the timing of development activities. The accuracy of any reserve estimate is a function of the quality of available data and of engineering and geological interpretation and judgment. Results of drilling, testing and production subsequent to the date of the estimate may justify revision of such estimate. Accordingly, reserve estimates are often different from the quantities of oil and natural gas that are ultimately recovered.
Goodwill
In accordance with FASB ASC Subtopic 350-20 for Intangibles-Goodwill and Other, goodwill is not amortized, but is tested for impairment on an annual basis, or more frequently as impairment indicators arise. Impairment tests, which involve the use of estimates related to the fair market value of the business operations with which goodwill is associated, are performed as of December 31 of each year. Losses, if any, resulting from impairment tests will be reflected in operating income in the Consolidated Statement of Operations.
To determine the fair value of our exploration and production reporting unit, a two-part, equally weighted approach is applied. We perform an income approach, which uses a discounted cash flow model to value our business, and a market approach, in which our value is determined using trading metrics and transaction multiples of peer companies.
As a result of testing, the fair value of the business exceeded the carrying value of net assets and we did not record an impairment charge for the periods ending December 31, 2011, 2010 or 2009.
The Appalachia JV and the East Texas/North Louisiana JV and other 2009 divestitures discussed in “Note 4. Divestitures, acquisitions and other significant events” caused significant alterations to the depletion rate and the relationship between capitalized costs and Proved Reserves. As a result of their significance, we reduced goodwill by $51.4 million in 2010 and $177.6 million in 2009 when computing our gains on those transactions. In addition, the TGGT Transaction, as discussed in “Note 4. Divestitures, acquisitions and other significant events” in our notes to consolidated financial statements, resulted in a reduction of $11.4 million in goodwill in 2009 against the associated gain and the transfer of $11.4 million of goodwill to the equity investment in TGGT.
The balance of goodwill as of December 31, 2011 and 2010 was $218.3.
54
Revenue recognition and gas imbalances
We use the sales method of accounting for oil and natural gas revenues. Under the sales method, revenues are recognized based on actual volumes of oil and natural gas sold to purchasers. A majority of our natural gas imbalances were concentrated in our Mid-Continent properties, which we sold during 2009, as discussed in “Note 4. Divestitures, acquisitions and other significant events” in our notes to consolidated financial statements, gas imbalances at December 31, 2011, 2010 and 2009 were not significant.
Deferred abandonment on asset retirement obligations
We follow FASB ASC Subtopic 410-20, Asset Retirement Obligations to account for legal obligations associated with the retirement of long-lived assets. ASC 410-20 requires these obligations be recognized at their estimated fair value at the time that the obligations are incurred. Upon initial recognition of a liability, that cost should be capitalized as part of the related long-lived asset and allocated to expense over the useful life of the asset. The costs of plugging and abandoning oil and natural gas properties fluctuate with costs associated with the industry. We periodically assess the estimated costs of our asset retirement obligations and adjust the liability according to these estimates.
Accounting for income taxes
Income taxes are accounted for using the liability method of accounting in accordance FASB ASC Topic 740, Income Taxes. We must make certain estimates related to the reversal of temporary differences, and actual results could vary from those estimates. Deferred taxes are recorded to reflect the tax benefits and consequences of future years’ differences between the tax basis of assets and liabilities and their financial reporting basis. We record a valuation allowance to reduce deferred tax assets if it is more likely than not that some portion or all of the deferred tax assets will not be realized.
Recent accounting pronouncements
On May 12, 2011, the Financial Accounting Standards Board, or the FASB, issued Accounting Standards Update, or ASU, No. 2011-04 -Fair Value Measurement (Topic 820): Amendments to Achieve Common Fair Value Measurement and Disclosure Requirements in U.S. GAAP and IFRS, or ASU 2011-04. ASU 2011-04 clarifies the FASB’s intent about the application of existing fair value measurement requirements and changes particular principles or requirements for measuring fair value or for disclosing information about fair value measurements. We anticipate the update will impact our fair value disclosures. This update is effective during interim and annual periods beginning after December 15, 2011, at which time we will adopt the update.
On June 16, 2011 the FASB issued ASU No.��2011-05 Comprehensive Income (Topic 220): Presentation of Comprehensive Income, or ASU 2011-05. This ASU requires entities to report items of other comprehensive income on either part of a single contiguous statement of comprehensive income or in a separate statement of comprehensive income immediately following the statement of income. On December 23, 2011, the FASB issued an update to this pronouncement, ASU No. 2011-12 Comprehensive Income (Topic 220): Deferral of the Effective Date for Amendments to the Presentation of Reclassifications of Items Out of Accumulated Other Comprehensive Income in Accounting Standards Update No. 2011-05. The Update defers the specific requirement to present items that are reclassified from accumulated other comprehensive income to net income separately with their respective components of net income and other comprehensive income. While early adoption is permitted, the amendments are effective for fiscal years, and interim periods within those years, beginning after December 15, 2011 and must be applied retrospectively. Presently, we do not have any transactions which require the reporting of comprehensive income; therefore, we do not anticipate any immediate impact from this pronouncement.
On September 15, 2011 the FASB issued ASU No. 2011-08, Intangibles—Goodwill and Other (Topic 350): Testing Goodwill for Impairment, or ASU 2011-08. This ASU allows both public and nonpublic entities an option to first assess qualitative factors to determine whether it is necessary to perform the two-step quantitative goodwill impairment test. An entity no longer would be required to calculate the fair value of a reporting unit unless the entity determines, based on that qualitative assessment, that it is more likely than not that its fair value is less than its carrying amount. The ASU, which allows early adoption, will be effective for annual and interim goodwill impairment tests performed for fiscal years beginning after December 15, 2011. We are presently assessing the impacts of ASU 2011-08.
On December 16, 2011 the FASB issued ASU No. 2011-11 Balance Sheet (Topic 210), Disclosures about Offsetting Assets and Liabilities, or ASU 2011-11. ASU 2011-11 will require entities to disclose both gross information and net information about both instruments and transactions eligible for offset in the statement of financial position and instruments and transaction subject to an agreement similar to a master netting arrangements. Application of the ASU is required for annual reporting periods beginning on or after January 1, 2013 and interim periods within those annual periods. At that time we will make the necessary disclosures.
55
Our results of operations
A summary of key financial data for 2011, 2010 and 2009 related to our results of operations for each of the years then ended is presented below.
| | | | | | | | | | | | | | | | | | | | |
| | | Years ended December 31, | | | Year to year change | |
(dollars in thousands, except per unit prices) | | 2011 | | | 2010 | | | 2009 | | | 2011-2010 | | | 2010-2009 | |
Production: | | | | | | | | | | | | | | | | | | | | |
Oil (Mbbls) | | | 741 | | | | 688 | | | | 1,571 | | | | 53 | | | | (883 | ) |
Natural gas (Mmcf) | | | 178,266 | | | | 107,878 | | | | 118,736 | | | | 70,388 | | | | (10,858 | ) |
Total production (Mmcfe) (1) | | | 182,712 | | | | 112,006 | | | | 128,162 | | | | 70,706 | | | | (16,156 | ) |
Average daily production (Mmcfe) (1) | | | 501 | | | | 307 | | | | 351 | | | | 194 | | | | (44 | ) |
Oil and natural gas revenues before derivative financial instrument activities: | | | | | | | | | | | | | | | | | | | | |
Oil | | $ | 67,440 | | | $ | 52,411 | | | $ | 84,397 | | | $ | 15,029 | | | $ | (31,986 | ) |
Natural gas | | | 686,761 | | | | 462,815 | | | | 466,108 | | | | 223,946 | | | | (3,293 | ) |
| | | | | | | | | | | | | | | | | | | | |
Total oil and natural gas | | $ | 754,201 | | | $ | 515,226 | | | $ | 550,505 | | | $ | 238,975 | | | $ | (35,279 | ) |
| | | | | | | | | | | | | | | | | | | | |
Oil and natural gas derivative financial instruments: | | | | | | | | | | | | | | | | | | | | |
Cash settlements (payments) on derivative financial instruments | | $ | 135,417 | | | $ | 217,455 | | | $ | 478,463 | | | $ | (82,038 | ) | | $ | (261,008 | ) |
Non-cash change in fair value of derivative financial instruments | | | 84,313 | | | | (70,939 | ) | | | (246,438 | ) | | | 155,252 | | | | 175,499 | |
| | | | | | | | | | | | | | | | | | | | |
Total derivative financial instrument activities | | $ | 219,730 | | | $ | 146,516 | | | $ | 232,025 | | | $ | 73,214 | | | $ | (85,509 | ) |
| | | | | | | | | | | | | | | | | | | | |
Average sales price (before cash settlements of derivative financial instruments): | | | | | | | | | | | | | | | | | | | | |
Oil (per Bbl) | | $ | 91.01 | | | $ | 76.18 | | | $ | 53.72 | | | $ | 14.83 | | | $ | 22.46 | |
Natural gas (per Mcf) | | | 3.85 | | | | 4.29 | | | | 3.93 | | | | (0.44 | ) | | | 0.36 | |
Natural gas equivalent (per Mcfe) | | | 4.13 | | | | 4.60 | | | | 4.30 | | | | (0.47 | ) | | | 0.30 | |
Costs and expenses: | | | | | | | | | | | | | | | | | | | | |
Oil and natural gas operating costs (2) | | $ | 84,766 | | | $ | 84,145 | | | $ | 138,659 | | | $ | 621 | | | $ | (54,514 | ) |
Production and ad valorem taxes | | | 23,875 | | | | 24,039 | | | | 38,970 | | | | (164 | ) | | | (14,931 | ) |
Gathering and transportation | | | 86,881 | | | | 54,877 | | | | 18,960 | | | | 32,004 | | | | 35,917 | |
Depletion | | | 344,947 | | | | 179,613 | | | | 196,515 | | | | 165,334 | | | | (16,902 | ) |
Depreciation and amortization | | | 18,009 | | | | 17,350 | | | | 24,923 | | | | 659 | | | | (7,573 | ) |
General and administrative (3) | | | 104,618 | | | | 105,114 | | | | 99,177 | | | | (496 | ) | | | 5,937 | |
Interest expense | | | 61,023 | | | | 45,533 | | | | 147,161 | | | | 15,490 | | | | (101,628 | ) |
Costs and expenses (per Mcfe): | | | | | | | | | | | | | | | | | | | | |
Oil and natural gas operating costs | | $ | 0.46 | | | $ | 0.75 | | | $ | 1.08 | | | $ | (0.29 | ) | | $ | (0.33 | ) |
Production and ad valorem taxes | | | 0.13 | | | | 0.21 | | | | 0.30 | | | | (0.08 | ) | | | (0.09 | ) |
Gathering and transportation | | | 0.48 | | | | 0.49 | | | | 0.15 | | | | (0.01 | ) | | | 0.34 | |
Depletion | | | 1.89 | | | | 1.60 | | | | 1.53 | | | | 0.29 | | | | 0.07 | |
Depreciation and amortization | | | 0.10 | | | | 0.15 | | | | 0.19 | | | | (0.05 | ) | | | (0.04 | ) |
General and administrative | | | 0.57 | | | | 0.94 | | | | 0.77 | | | | (0.37 | ) | | | 0.17 | |
Net income (loss) | | $ | 22,596 | | | $ | 671,926 | | | $ | (496,804 | ) | | $ | (649,330 | ) | | $ | 1,168,730 | |
| (1) | Mmcfe is calculated by converting one barrel of oil into six Mcf of natural gas. |
| (2) | Share-based compensation, pursuant to FASB ASC 718, included in oil and natural gas operating costs, was $0.1 million, $1.0 million, and $2.8 million for the years ended December 31, 2011, 2010 and 2009, respectively. |
| (3) | Share-based compensation, pursuant to FASB ASC 718, included in general and administrative expenses was $10.9 million, $15.8 million and $16.2 million for the years ended December 31, 2011, 2010 and 2009, respectively. |
The following is a discussion of our financial condition and results of operations for the years ended December 31, 2011, 2010 and 2009.
The comparability of our results of operations for 2011, 2010 and 2009 was impacted by:
| | • | | the Chief Transaction, the Appalachia Transaction and the Haynesville Shale Acquisition in 2011; |
| | • | | costs associated with the former acquisition proposal, asset impairments and other infrequent costs; |
| | • | | the Appalachia JV in 2010; |
| | • | | the East Texas/North Louisiana JV in 2009; |
| | • | | fluctuations in oil and natural gas prices, which impact our oil and natural gas reserves, revenues, cash flows and net income or loss; |
| | • | | mark-to-market accounting used for our derivative financial instruments gains or losses; |
56
| | • | | changes in Proved Reserves and production volumes and their impact on depletion; |
| | • | | the equity method of accounting for our investments; |
| | • | | the impact of our natural gas production volumes from our horizontal drilling activities in the Haynesville/Bossier and Marcellus shales; |
| | • | | ceiling test write-downs in 2011 and 2009; |
| | • | | gains on sales of assets in 2010 and 2009; and |
| | • | | significant changes in the amount of our long-term debt. |
General
The availability of a ready market for oil and natural gas and the prices of oil and natural gas are dependent upon a number of factors that are beyond our control. These factors include, among other things:
| | • | | the level of domestic production and economic activity, particularly the ongoing worldwide economic recession which continues to affect oil and natural gas prices and demand; |
| | • | | the recent oversupply of natural gas; |
| | • | | the level of domestic and international industrial demand for manufacturing operations; |
| | • | | the availability of imported oil and natural gas; |
| | • | | actions taken by foreign oil producing nations; |
| | • | | the cost and availability of natural gas pipelines with adequate capacity and other transportation facilities; |
| | • | | the cost and availability of other competitive fuels; |
| | • | | fluctuating and seasonal demand for oil, natural gas and refined products; |
| | • | | the extent of governmental regulation and taxation (under both present and future legislation) of the production, refining, transportation, pricing, use and allocation of oil, natural gas, refined products and substitute fuels; and |
| | • | | trends in fuel use and government regulations that encourage less fuel use and encourage or mandate alternative fuel use. |
Accordingly, in light of the many uncertainties affecting the supply and demand for oil, natural gas and refined petroleum products, we cannot accurately predict the prices or marketability of oil and natural gas from any producing well in which we have or may acquire an interest.
Marketing arrangements and backlog
We produce oil and natural gas. We do not refine or process the oil or natural gas we produce. We sell the majority of the oil we produce under short-term contracts using market sensitive pricing. The majority of our contracts are based on NYMEX pricing, which is typically calculated as the average of the daily closing prices of oil to be delivered one month in the future. We also sell a portion of our oil at F.O.B. field prices posted by the principal purchaser of oil where our producing properties are located. Our sales contracts are of a type common within the industry, and we usually negotiate a separate contract for each property. Generally, we sell our oil to purchasers and refiners near the areas of our producing properties.
We sell the majority of our natural gas under individually negotiated gas purchase contracts using market sensitive pricing. Our sales contracts vary in length from spot market sales of a single day to term agreements that may extend for a year or more. Our natural gas customers include utilities, natural gas marketing companies and a variety of commercial and industrial end users. The natural gas purchase contracts define the terms and conditions unique to each of these sales. The price received for natural gas sold on the spot market varies daily, reflecting changing market conditions.
For the year ended December 31, 2011, sales to BG Energy Merchants LLC accounted for approximately 36.0% of total consolidated revenues. For the year ended December 31, 2010, sales to BG Energy Merchants LLC and Louis Dreyfus Energy Services LP accounted for approximately 21.5% and 10.1%, respectively, of total consolidated revenues. BG Energy Merchants LLC is a subsidiary of BG Group. For the year ended December 31, 2009, there were no sales to any individual customer that exceeded 10% of our consolidated revenues or were considered material to our operations. The loss of any significant customer may cause a temporary interruption in sales of, or a lower price for, our oil and natural gas, but we believe that the loss of any one customer would not have a material adverse effect on our results of operations or financial condition.
We may be unable to market all of the oil and natural gas we produce. If our oil and natural gas can be marketed, we may be unable to negotiate favorable price and contractual terms. Changes in oil or natural gas prices may significantly affect our revenues, cash flows, the value of our oil and natural gas properties and the estimates of recoverable oil and natural gas reserves. Further, significant declines in the prices of oil or natural gas may have a material adverse effect on our business and on our financial condition.
57
We engage in oil and natural gas production activities in geographic regions where, from time to time, the supply of oil or natural gas available for delivery exceeds the demand. In this situation, companies purchasing oil or natural gas in these areas reduce the amount of oil or natural gas that they purchase from us. If we cannot locate other buyers for our production or for any of our newly discovered oil or natural gas reserves, we may shut in our oil or natural gas wells for periods of time. If this occurs, we may incur additional payment obligations under our oil and natural gas leases and, under certain circumstances, the oil and natural gas leases might be terminated. Economic conditions, particularly low natural gas prices, may negatively impact the liquidity and creditworthiness of our purchasers and may expose us to risk with respect to the ability to collect payments for the oil and natural gas we deliver.
Summary
For the years ended December 31, 2011, 2010 and 2009, we had net income of $22.6 million, $671.9 million and net loss of $496.8 million, respectively.
The results of operations for 2011, as compared to 2010, were significantly impacted by higher production volumes, predominantly in the Haynesville/Bossier shale. In addition, our shale operations have lower operating expenses compared to our lower-volume conventional vertical wells, resulting in lower per unit operating expense. The higher production and resulting revenues were offset by lower natural gas prices, increased gathering rates and an increase in depletion. The 2011 and 2010 operating results were also impacted by a ceiling test write-down of $233.2 million in the fourth quarter 2011 as a result of the continual decline in natural gas prices and a non-cash pretax gain of $528.9 million arising from the formation of the Appalachia JV in 2010.
During 2009, we completed a divestiture program, or the 2009 Divestitures, entered into the East Texas/North Louisiana JV, formed TGGT and recorded a first quarter $1.3 billion non-cash ceiling test write-down. Proceeds from the 2009 Divestitures and joint venture transactions were approximately $2.1 billion excluding the $400.0 million East Texas/North Louisiana Carry. These transactions resulted in significant decreases in our full cost pool, gathering assets, goodwill, operating assets and liabilities and resulted in gains totaling approximately $691.9 million. As a result of these transactions, comparability of the 2010 operating results to 2009 reflects significant declines in production revenues and operating costs. Accordingly, we are presenting certain pro forma comparisons to facilitate comparison of operating data between 2010 and 2009.
The impact of fluctuations in oil and natural gas prices are significant to our results of operations. There were large fluctuations in oil and natural gas prices during 2011, 2010 and 2009. In 2011, we received average oil prices of $91.01 per Bbl compared to $76.18 per Bbl in 2010 and $53.72 per Bbl in 2009. Natural gas prices for 2011 averaged $3.85 per Mcf compared to $4.29 per Mcf in 2010 and $3.93 per Mcf in 2009. We do not designate our derivative financial instruments as hedges. Therefore, we mark the non-cash changes in the fair value of our unsettled derivative financial instruments to market at the end of each reporting period. Due to the significant fluctuations in oil and natural gas prices, the impacts of derivative financial instruments, including cash settlements or receipts with our counterparties and the non-cash mark-to-market impacts, resulted in net gains of $219.7 million, $146.5 million and $232.0 million for 2011, 2010 and 2009, respectively.
Oil and natural gas revenues, production and prices
The following table and discussion presents our production, revenue and average sales prices by our geographic producing areas for the years ended December 31, 2011 and 2010:
| | | | | | | | | | | | | | | | | | | | | | | | | | | | | | | | | | | | |
| | | Years ended December 31, | | | | |
| | | 2011 | | | 2010 | | | Year to year change | |
(dollars in thousands, except per unit
rate) | | Revenue | | | Production
(Mmcfe) | | | $/Mcfe | | | Revenue | | | Production
(Mmcfe) | | | $/Mcfe | | | Revenue | | | Production
(Mmcfe) | | | $/Mcfe | |
Producing region: | | | | | | | | | | | | | | | | | | | | | | | | | | | | | | | | | | | | |
East Texas/North Louisiana | | $ | 608,218 | | | | 162,693 | | | $ | 3.74 | | | $ | 397,680 | | | | 95,423 | | | $ | 4.17 | | | $ | 210,538 | | | | 67,270 | | | | (0.43 | ) |
Appalachia | | | 52,319 | | | | 12,408 | | | | 4.22 | | | | 45,962 | | | | 9,427 | | | | 4.88 | | | | 6,357 | | | | 2,981 | | | | (0.66 | ) |
Permian and other | | | 93,664 | | | | 7,611 | | | | 12.31 | | | | 71,584 | | | | 7,156 | | | | 10.00 | | | | 22,080 | | | | 455 | | | | 2.31 | |
| | | | | | | | | | | | | | | | | | | | | | | | | | | | | | | | | | | | |
Total | | | 754,201 | | | | 182,712 | | | | 4.13 | | | | 515,226 | | | | 112,006 | | | | 4.60 | | | $ | 238,975 | | | | 70,706 | | | | (0.47 | ) |
| | | | | | | | | | | | | | | | | | | | | | | | | | | | | | | | | | | | |
Production in our East Texas/North Louisiana region in 2011 increased by 67.3 Bcfe from 2010. This increase is the result of the development of our Haynesville shale, which resulted in production increases of 74.7 Bcfe from 2010. The increase in Haynesville production was partially offset by production declines of 4.8 Bcfe in our Vernon Field and 2.6 Bcfe in shallow Cotton Valley wells. The declines in Vernon and Cotton Valley are the result of the suspension of vertical drilling operations and normal production declines. Recent development drilling in our Appalachia region has resulted in production increases in the Marcellus shale. Our Permian Basin also experienced production increases as we continue our development of our Sugg Ranch field.
58
Total oil and natural gas revenues in 2011 were $754.2 million compared with $515.2 million in 2010. For 2011, natural gas represented 91.1% of our oil and natural gas revenues, compared to 2010, where natural gas represented 89.8% of our oil and natural gas revenues. The 46.4% increase in revenues is primarily a result of increased production and oil prices which were partially offset by lower natural gas prices. The average sales price of oil per Bbl, excluding the impact of derivative financial instruments, increased from $76.18 per Bbl in 2010 to $91.01 per Bbl in 2011, or 19.5%. The average natural gas sales price, excluding the impact of derivative financial instruments, was $3.85 per Mcf for 2011, a decrease of 10.3% compared with $4.29 per Mcf for 2010.
In addition, our production volumes are impacted by curtailed volumes of natural gas due to operational requirements associated with fracture stimulation and other operations on near-by horizontal wells, seasonal supply and demand conditions from end users and general maintenance and repairs to our wells. While these curtailed volumes are typically for short periods of time, they may have impacts to our revenues, cash flows and results of operations. We currently expect that approximately 7.5% to 10.0% of our Haynesville/Bossier shale production will be curtailed due to these operations. As discussed below inMidstream operations, an incident occurred at a TGGT amine treating facility in May 2011, which resulted in shutting in two treating facilities. As of December 31, 2011, we estimate approximately 124.0 Mmcf per day of production (39.0 Mmcfe per day net to us) was curtailed since the incident occurred. One of the shut-down facilities became operational in October 2011. TGGT expects restoration of treating capacity at the damaged facility during the first quarter of 2012.
The analysis of 2010 compared to 2009 is being presented on a pro forma basis to eliminate the impact of the 2009 Divestitures, the East Texas/North Louisiana JV in 2009 and the Appalachia JV in 2010. We believe pro forma information, particularly in 2009, provides a more meaningful analysis due to the significance of the 2009 Divestitures and joint ventures. The pro forma adjustments below reduce our actual production as if the transactions had occurred on January 1 of each respective year.
| | | | | | | | | | | | | | | | | | | | | | | | | | | | | | | | |
| | | Years ended December 31, | | | | | | | |
| | | 2010 | | | 2009 | | | Year to year change | |
(in Mmcfe) | | Actual
production | | | Pro forma
adjustment
(1) | | | Pro forma
production | | | Actual
production | | | Pro forma
adjustment
(2) | | | Pro forma
production | | | Actual
production | | | Pro forma
production | |
Producing region: | | | | | | | | | | | | | | | | | | | | | | | | | | | | | | | | |
East Texas/North Louisiana | | | 95,423 | | | | — | | | | 95,423 | | | | 82,138 | | | | (18,866 | ) | | | 63,272 | | | | 13,285 | | | | 32,151 | |
Appalachia | | | 9,427 | | | | (2,707 | ) | | | 6,720 | | | | 19,184 | | | | (12,256 | ) | | | 6,928 | | | | (9,757 | ) | | | (208 | ) |
Permian and other | | | 7,156 | | | | — | | | | 7,156 | | | | 8,827 | | | | (974 | ) | | | 7,853 | | | | (1,671 | ) | | | (697 | ) |
Mid-Continent | | | — | | | | — | | | | — | | | | 18,013 | | | | (18,013 | ) | | | — | | | | (18,013 | ) | | | — | |
| | | | | | | | | | | | | | | | | | | | | | | | | | | | | | | | |
Total | | | 112,006 | | | | (2,707 | ) | | | 109,299 | | | | 128,162 | | | | (50,109 | ) | | | 78,053 | | | | (16,156 | ) | | | 31,246 | |
| | | | | | | | | | | | | | | | | | | | | | | | | | | | | | | | |
| (1) | The pro forma adjustments reduce production volumes attributable to the properties affected by the Appalachia JV as if the sale had occurred on January 1, 2010. |
| (2) | The pro forma adjustments reduce production volumes attributable to properties sold in 2009 and properties affected by both the East Texas/North Louisiana JV and the Appalachia JV as if these sales had occurred on January 1, 2009. |
On a pro forma basis, production in our East Texas/North Louisiana region for the year 2010 increased by 32.2 Bcfe from 2009. This increase was a result of the development of our Haynesville shale, which resulted in a production increase of 44.5 Bcfe for 2010 compared to 2009. These increases were partially offset by production declines of 3.8 Bcfe in our Cotton Valley area and 8.5 Bcfe in our Vernon Field in 2010 when compared to 2009. These declines are primarily the result of the suspension of vertical drilling operations in 2009 and normal production declines. The Appalachia and Permian divisions also experienced production declines arising from the suspension of conventional, vertical drilling programs in both areas during 2009.
59
The following table and discussion presents our production, revenue and average sales prices by our geographic producing areas for the years ended December 31, 2010 and 2009:
| | | | | | | | | | | | | | | | | | | | | | | | | | | | | | | | | | | | |
| | | Years ended December 31, | | | | | | | | | | |
| | | 2010 | | | 2009 | | | Year to year change | |
(dollars in thousands, except per unit rate) | | Revenue | | | Production
(Mmcfe) | | | $/Mcfe | | | Revenue | | | Production
(Mmcfe) | | | $/Mcfe | | | Revenue | | | Production
(Mmcfe) | | | $/Mcfe | |
Producing region: | | | | | | | | | | | | | | | | | | | | | | | | | | | | | | | | | | | | |
East Texas/North Louisiana | | $ | 397,680 | | | | 95,423 | | | $ | 4.17 | | | $ | 315,710 | | | | 82,138 | | | $ | 3.84 | | | $ | 81,970 | | | | 13,285 | | | $ | 0.33 | |
Appalachia | | | 45,962 | | | | 9,427 | | | | 4.88 | | | | 91,832 | | | | 19,184 | | | | 4.79 | | | $ | (45,870 | ) | | | (9,757 | ) | | $ | 0.09 | |
Permian and other | | | 71,584 | | | | 7,156 | | | | 10.00 | | | | 58,784 | | | | 8,827 | | | | 6.66 | | | $ | 12,800 | | | | (1,671 | ) | | $ | 3.34 | |
Mid-Continent | | | — | | | | — | | | | — | | | | 84,179 | | | | 18,013 | | | | 4.67 | | | $ | (84,179 | ) | | | (18,013 | ) | | $ | (4.67 | ) |
| | | | | | | | | | | | | | | | | | | | | | | | | | | | | | | | | | | | |
Total | | $ | 515,226 | | | | 112,006 | | | | 4.60 | | | $ | 550,505 | | | | 128,162 | | | | 4.30 | | | $ | (35,279 | ) | | | (16,156 | ) | | $ | 0.30 | |
| | | | | | | | | | | | | | | | | | | | | | | | | | | | | | | | | | | | |
Total oil and natural gas revenues for 2010 were $515.2 million compared to $550.5 million for 2009. For 2010, natural gas represented 89.8% of our oil and natural gas revenues, compared to 2009, where natural gas represented 84.7% of our oil and natural gas revenues.
The 6.4% decrease in oil and gas revenues in 2010 from 2009 is primarily a result of the reduced volumes attributable to the Appalachia JV and a full year impact of the 2009 Divestitures and the East Texas/North Louisiana JV. The decreases are partially offset by increases in prices. The average sales price of oil, excluding the impact of derivative financial instruments, increased from $53.72 per Bbl in 2009 to $76.18 per Bbl in 2010, or 41.8%. The average natural gas sales price, excluding the impact of derivative financial instruments, was $4.29 per Mcf for 2010, an increase of 9.2% for 2010 compared with $3.93 per Mcf for 2009.
The price we receive for the oil and natural gas we produce is largely a function of market supply and demand. Demand is impacted by general economic conditions, estimates of oil and natural gas in storage, weather and other seasonal conditions, including hurricanes and tropical storms. Market conditions involving over or under supply of natural gas can result in substantial price volatility. Historically, commodity prices have been volatile and we expect the volatility to continue in the future. Changes in oil and natural gas prices have a significant impact on our oil and natural gas revenues, cash flows, quantities of estimated Proved Reserves and related liquidity. Assuming our 2011 production levels, a change of $0.10 per Mcf of natural gas sold would result in an annual increase or decrease in revenues of approximately $17.8 million and a change of $1.00 per Bbl of oil sold would result in an annual increase or decrease in revenues and cash flow of approximately $0.7 million without considering the effects of derivative financial instruments. In addition, our production volumes are impacted by shut in volumes of natural gas due to operational requirements associated with fracture stimulation on near-by horizontal wells, seasonal supply and demand conditions from end users and general maintenance and repairs to our wells. While these shut in volumes are typically for short periods of time, they may impact our revenues, cash flows and results of operations.
Oil and natural gas operating costs
Our oil and natural gas operating costs for 2011, 2010, and 2009 were $84.8 million, $84.1 million and $138.7 million, respectively. Total oil and natural gas operating expenses in 2011 compared to 2010 did not increase significantly, despite an increase of over 60% in production volumes. This is due to horizontal wells having operating costs that are similar to shallow conventional vertical wells, but produce significantly higher volumes. The decrease in total oil and natural gas operating costs from 2009 to 2010 was primarily due to the 2009 divestitures and joint venture transactions.
Management believes that analyses on a per Mcfe basis provide a more meaningful measure than the Company’s total costs between periods. As shown in the table below, oil and natural gas operating expenses for 2011 decreased $0.29 per Mcfe from 2010. In East Texas/North Louisiana, the $0.26 per Mcfe decrease is the result of the Haynesville horizontal wells, where we have continued to develop cost efficiencies as we have increased production. Our conventional Vernon Field and Cotton Valley properties have experienced offsetting increases in operating expenses on a per Mcfe basis due to decreases in production resulting from suspension of drilling activities, reduced workover activity and resulting production declines, which tends to increase operating expenses on a per Mcfe basis. Decreases in Appalachia are primarily a result of increased production in the Marcellus shale, which also has a lower lease operating expense rate per Mcfe than the shallow wells. The Permian region operating expenses per Mcfe increased due to higher costs associated with liquids production.
60
| | | | | | | | | | | | | | | | | | | | | | | | | | | | | | | | | | | | |
| | | Years ended December 31, | | | | | | | | | | |
| | | 2011 | | | 2010 | | | Year to year change | |
(in thousands) | | Lease
operating
expenses | | | Workovers
and other | | | Total | | | Lease
operating
expenses | | | Workovers
and other | | | Total | | | Lease
operating
expenses | | | Workovers
and other | | | Total | |
Producing region: | | | | | | | | | | | | | | | | | | | | | | | | | | | | | | | | | | | | |
East Texas/North Louisiana | | $ | 46,915 | | | $ | 10,282 | | | $ | 57,197 | | | $ | 48,255 | | | $ | 10,735 | | | $ | 58,990 | | | $ | (1,340 | ) | | $ | (453 | ) | | $ | (1,793 | ) |
Appalachia | | | 15,733 | | | | — | | | | 15,733 | | | | 14,929 | | | | 216 | | | | 15,145 | | | | 804 | | | | (216 | ) | | | 588 | |
Permian and other | | | 11,491 | | | | 345 | | | | 11,836 | | | | 9,127 | | | | 883 | | | | 10,010 | | | | 2,364 | | | | (538 | ) | | | 1,826 | |
| | | | | | | | | | | | | | | | | | | | | | | | | | | | | | | | | | | | |
Total | | $ | 74,139 | | | $ | 10,627 | | | $ | 84,766 | | | $ | 72,311 | | | $ | 11,834 | | | $ | 84,145 | | | $ | 1,828 | | | $ | (1,207 | ) | | $ | 621 | |
| | | | | | | | | | | | | | | | | | | | | | | | | | | | | | | | | | | | |
| | | | | | | | | | | | | | | | | | | | | | | | | | | | | | | | | | | | |
| | | Years ended December 31, | | | | | | | | | | |
| | | 2011 | | | 2010 | | | Year to year change | |
(per Mcfe) | | Lease
operating
expenses | | | Workovers
and other | | | Total | | | Lease
operating
expenses | | | Workovers
and other | | | Total | | | Lease
operating
expenses | | | Workovers
and other | | | Total | |
Producing region: | | | | | | | | | | | | | | | | | | | | | | | | | | | | | | | | | | | | |
East Texas/North Louisiana | | $ | 0.29 | | | $ | 0.06 | | | $ | 0.35 | | | $ | 0.50 | | | $ | 0.11 | | | $ | 0.61 | | | $ | (0.21 | ) | | $ | (0.05 | ) | | $ | (0.26 | ) |
Appalachia | | | 1.27 | | | | — | | | | 1.27 | | | | 1.58 | | | | 0.02 | | | | 1.60 | | | | (0.31 | ) | | | (0.02 | ) | | | (0.33 | ) |
Permian and other | | | 1.51 | | | | 0.05 | | | | 1.56 | | | | 1.28 | | | | 0.12 | | | | 1.40 | | | | 0.23 | | | | (0.07 | ) | | | 0.16 | |
Operating costs per Mcfe | | | 0.40 | | | | 0.06 | | | | 0.46 | | | | 0.64 | | | | 0.11 | | | | 0.75 | | | | (0.24 | ) | | | (0.05 | ) | | | (0.29 | ) |
As shown in the table below, oil and natural gas operating expenses for 2010 decreased by $0.33 per Mcfe from 2009. The $0.31 per Mcfe decrease in East Texas/North Louisiana was the result of the Haynesville horizontal wells, which have low lease operating rates per Mcfe compared with conventional vertical wells. The increases in Appalachia and Permian are primarily the result of production declines associated with suspended drilling operations without a corresponding decrease in costs to offset the decline in production.
| | | | | | | | | | | | | | | | | | | | | | | | | | | | | | | | | | | | |
| | | Years ended December 31, | | | | | | | | | | |
| | | 2010 | | | 2009 | | | Year to year change | |
(in thousands) | | Lease
operating
expenses | | | Workovers
and other | | | Total | | | Lease
operating
expenses | | | Workovers
and other | | | Total | | | Lease
operating
expenses | | | Workovers
and other | | | Total | |
Producing region: | | | | | | | | | | | | | | | | | | | | | | | | | | | | | | | | | | | | |
East Texas/North Louisiana | | $ | 48,255 | | | $ | 10,735 | | | $ | 58,990 | | | $ | 65,827 | | | $ | 10,220 | | | $ | 76,047 | | | $ | (17,572 | ) | | $ | 515 | | | $ | (17,057 | ) |
Appalachia | | | 14,929 | | | | 216 | | | | 15,145 | | | | 29,244 | | | | 1,455 | | | | 30,699 | | | | (14,315 | ) | | | (1,239 | ) | | | (15,554 | ) |
Permian and other | | | 9,127 | | | | 883 | | | | 10,010 | | | | 10,091 | | | | 1,521 | | | | 11,612 | | | | (964 | ) | | | (638 | ) | | | (1,602 | ) |
Mid-Continent | | | — | | | | — | | | | — | | | | 19,541 | | | | 760 | | | | 20,301 | | | | (19,541 | ) | | | (760 | ) | | | (20,301 | ) |
| | | | | | | | | | | | | | | | | | | | | | | | | | | | | | | | | | | | |
Total | | $ | 72,311 | | | $ | 11,834 | | | $ | 84,145 | | | $ | 124,703 | | | $ | 13,956 | | | $ | 138,659 | | | $ | (52,392 | ) | | $ | (2,122 | ) | | $ | (54,514 | ) |
| | | | | | | | | | | | | | | | | | | | | | | | | | | | | | | | | | | | |
| | | | | | | | | | | | | | | | | | | | | | | | | | | | | | | | | | | | |
| | | Years ended December 31, | | | | | | | | | | |
| | | 2010 | | | 2009 | | | Year to year change | |
(per Mcfe) | | Lease
operating
expenses | | | Workovers
and other | | | Total | | | Lease
operating
expenses | | | Workovers
and other | | | Total | | | Lease
operating
expenses | | | Workovers
and other | | | Total | |
Producing region: | | | | | | | | | | | | | | | | | | | | | | | | | | | | | | | | | | | | |
East Texas/North Louisiana | | $ | 0.50 | | | $ | 0.11 | | | $ | 0.61 | | | $ | 0.80 | | | $ | 0.12 | | | $ | 0.92 | | | $ | (0.30 | ) | | $ | (0.01 | ) | | $ | (0.31 | ) |
Appalachia | | | 1.58 | | | | 0.02 | | | | 1.60 | | | | 1.52 | | | | 0.08 | | | | 1.60 | | | | 0.06 | | | | (0.06 | ) | | | — | |
Permian and other | | | 1.28 | | | | 0.12 | | | | 1.40 | | | | 1.14 | | | | 0.17 | | | | 1.31 | | | | 0.14 | | | | (0.05 | ) | | | 0.09 | |
Mid-Continent | | | — | | | | — | | | | — | | | | 1.08 | | | | 0.04 | | | | 1.12 | | | | (1.08 | ) | | | (0.04 | ) | | | (1.12 | ) |
Operating costs per Mcfe | | | 0.64 | | | | 0.11 | | | | 0.75 | | | | 0.97 | | | | 0.11 | | | | 1.08 | | | | (0.33 | ) | | | — | | | | (0.33 | ) |
Midstream operations
We own a 50% equity interest in TGGT and the Appalachia Midstream JV. Our midstream operations earn fees from the gathering, treating and compression of natural gas. Additional operating margins are derived from purchases and resale of natural gas from third parties. Our midstream joint ventures do not own any natural gas processing facilities. We use the equity method of accounting for both of our midstream joint ventures.
TGGT holds our East Texas/North Louisiana midstream assets. TGGT’s primary customers are EXCO and BG Group. TGGT also owns and operates TGG Pipeline, Ltd., or TGG, and Talco Midstream Assets, Ltd., or Talco. The assets of TGG include treating facilities and gathering pipelines that connect to downstream pipelines. Talco’s assets primarily consist of gathering pipelines that provide well hookups and lateral connections.
TGG operates amine, glycol, and H2S treating facilities, which treat natural gas to meet pipeline specifications for downstream transportation. TGG’s system, which has access to 14 interstate and intrastate pipeline markets, has approximately 127 miles of pipeline comprised of 12, 16, and 20-inch diameter pipe in the East Texas area and 27 miles of pipeline comprised of 36-inch
61
diameter pipe in the North Louisiana area. Additionally, TGG initiated major midstream expansion efforts in 2011 in the Shelby Area. The Shelby Area’s system has approximately 73 miles of operational pipeline as of December 31, 2011. An additional 35 miles of pipeline and treating facility is expected to become operational in the first half of 2012, which will provide treating capacity of approximately 250 Mmcf per day.
In the second quarter 2011 an incident occurred at a TGGT amine treating facility in northwest Red River Parish, Louisiana resulting in an immediate shut-down of the facility. As a precautionary measure, TGGT also shut down another amine treating facility located in DeSoto Parish with similar specifications, which was restarted in October 2011. TGGT has installed temporary treating units at the damaged facility and expects to begin treating volumes during the first quarter of 2012 once these temporary treating units are operational. The estimated 2011 impact to TGGT resulting from this incident was a $20.3 million net decrease to their operating income, which was due to an estimated $15.4 million reduction in revenue and a $4.9 million increase in operating expenses. TGGT recorded an impairment of $12.0 million and received an insurance reimbursement associated with the incident of approximately $6.2 million. As a result of the treating facility incident, our equity method income for 2011 was negatively impacted by approximately $13.1 million.
The Appalachia Midstream JV has begun installing and operating gathering systems and compression facilities to support our development drilling program in the Appalachia JV.
Gathering and transportation
We report gathering and transportation costs in accordance with FASB Section 605-45-05, Subtopic 605-45, Revenue Recognition. We generally sell oil and natural gas under two types of agreements which are common in our industry. Both types of agreements include a transportation charge. One is a netback arrangement, under which we sell oil or natural gas at the wellhead and collect a price, net of the transportation incurred by the purchaser. In this case, we record sales at the price received from the purchaser, net of the transportation costs. Under the other arrangement, we sell oil or natural gas at a specific delivery point, pay transportation to a third party and receive proceeds from the purchaser with no transportation deduction. In this case, we record the transportation cost as gathering and transportation expense. Due to these two distinct selling arrangements, our computed realized prices, before the impact of derivative financial instruments, contain revenues which are reported under two separate bases. Gathering and transportation expenses totaled $86.9 million for year ended December 31, 2011, compared to $54.9 million for the year ended December 31, 2010 and $19.0 million for the year ended December 31, 2009. The overall increase in gathering and transportation expenses is a result of increased production in Haynesville, along with firm transportation agreements in the Haynesville area that commenced in February 2010 and fees from TGGT. As a result of the aforementioned TGGT incident discussed inMidstream operations, we anticipate a slight increase in our per unit gathering rates for 2012.
We have entered into firm transportation agreements with pipeline companies to facilitate sales as we expand our Haynesville volumes and report these firm transportation costs as a component of gathering and transportation expenses. As of December 31, 2011, our firm transportation agreements covered an average of 830 Mmcf per day with average annual minimum gathering and transportation expenses of approximately $92.0 million through 2021.
Production and ad valorem taxes
Production and ad valorem taxes were $23.9 million, $24.0 million and $39.0 million for 2011, 2010, and 2009, respectively. On a percentage of revenue basis, before the impact of derivative financial instruments, production and ad valorem taxes were 3.2% of oil and natural gas revenues for 2011, compared with 4.7% and 7.1% for 2010 and 2009, respectively. In our East Texas/North Louisiana area, we are presently receiving severance tax holidays on certain Haynesville shale wells which reduce the effective rate of these taxes. The decrease in the percentage of revenue basis for the years ended December 31, 2011 and 2010 compared to 2009 is primarily the result of these severance tax holidays on our Haynesville and Bossier shale wells due to the development program.
Production taxes are set by state and local governments and vary as to the tax rate and the value to which that rate is applied. Ad valorem tax rates also vary widely. In Louisiana, where a substantial percentage of our production is derived, severance taxes are levied on a per Mcf basis. Therefore, the resulting dollar value of production is not sensitive to changes in prices for natural gas, except for holiday exemptions, if any. In our other operating areas, particularly Texas, production taxes are based on a fixed percentage of gross value of products sold. While severance tax holidays are available in Texas, as our production increases, our realized severance and ad valorem tax rates may become more sensitive to prices.
We may be subject to new taxes or changes to existing rates in the future. The state of Louisiana, which has a history of adjusting its severance tax rate each July, increased its severance tax rate from $0.29 per Mcf to $0.33 per Mcf effective July 1, 2009 and then decreased the rate to $0.164 per Mcf effective July 1, 2010. In July 2011, the state of Louisiana elected not to change the rate from the 2010 rate. In addition, in February 2012, the Commonwealth of Pennsylvania enacted HB 1950, a comprehensive reform to
62
Pennsylvania’s Oil and Gas Act, which results in a $315,000 fee for unconventional wells that are drilled, with $50,000 due for the initial fee. The initial fee, which is payable September 1, 2012, will be assessed on all our unconventional wells spud through December 31, 2011. The fee is computed using the prior year’s trailing 12 month NYMEX natural gas price and is based on a tiered pricing system and will be paid annually over a 15 year period. The lowest price tier will result in impact fees of $190,000 per well while the highest price tier is in the aggregate $355,000 per well. The initial fee will be based on a $3.00 to $4.99 tier. We estimate the initial fee will be approximately $1.6 million.
Overall, our production and ad valorem tax rates per Mcfe were $0.13 per Mcfe for 2011, $0.21 per Mcfe for 2010 and $0.30 per Mcfe for 2009. The following table presents our severance and ad valorem taxes on a per Mcfe basis and percentage of revenue basis for our significant producing regions.
| | | | | | | | | | | | | | | | | | | | | | | | | | | | | | | | | | | | | | | | | | | | | | | | | | | | | | | | | | | | |
| | | Years ended December 31, | |
| | | 2011 | | | 2010 | | | 2009 | |
(in thousands,
except per unit
rate) | | Revenue | | | Production
(Mmcfe) | | | Severance
and ad
valorem
taxes | | | Taxes
% of
revenue | | | Taxes
$/Mcfe | | | Revenue | | | Production
(Mmcfe) | | | Severance
and ad
valorem
taxes | | | Taxes
% of
revenue | | | Taxes
$/Mcfe | | | Revenue | | | Production
(Mmcfe) | | | Severance
and ad
valorem
taxes | | | Taxes
% of
revenue | | | Taxes
$/Mcfe | |
Producing region: | | | | | | | | | | | | | | | | | | | | | | | | | | | | | | | | | | | | | | | | | | | | | | | | | | | | | | | | | | | | |
East Texas/North Louisiana | | $ | 608,218 | | | | 162,693 | | | $ | 14,851 | | | | 2.4 | % | | $ | 0.09 | | | $ | 397,680 | | | | 95,423 | | | $ | 16,914 | | | | 4.3 | % | | $ | 0.18 | | | $ | 315,710 | | | | 82,138 | | | $ | 24,162 | | | | 7.7 | % | | $ | 0.29 | |
Appalachia | | | 52,319 | | | | 12,408 | | | | 1,694 | | | | 3.2 | % | | | 0.14 | | | | 45,962 | | | | 9,427 | | | | 1,740 | | | | 3.8 | % | | | 0.18 | | | | 91,832 | | | | 19,184 | | | | 2,562 | | | | 2.8 | % | | | 0.13 | |
Permian and other | | | 93,664 | | | | 7,611 | | | | 7,330 | | | | 7.8 | % | | | 0.96 | | | | 71,584 | | | | 7,156 | | | | 5,385 | | | | 7.5 | % | | | 0.75 | | | | 58,784 | | | | 8,827 | | | | 5,658 | | | | 9.6 | % | | | 0.64 | |
Mid-Continent | | | — | | | | — | | | | — | | | | | | | | | | | | | | | | | | | | | | | | | | | | | | | | 84,179 | | | | 18,013 | | | | 6,588 | | | | 7.8 | % | | | 0.37 | |
| | | | | | | | | | | | | | | | | | | | | | | | | | | | | | | | | | | | | | | | | | | | | | | | | | | | | | | | | | | | |
Total | | $ | 754,201 | | | | 182,712 | | | $ | 23,875 | | | | 3.2 | % | | $ | 0.13 | | | $ | 515,226 | | | | 112,006 | | | $ | 24,039 | | | | 4.7 | % | | $ | 0.21 | | | $ | 550,505 | | | | 128,162 | | | $ | 38,970 | | | | 7.1 | % | | $ | 0.30 | |
| | | | | | | | | | | | | | | | | | | | | | | | | | | | | | | | | | | | | | | | | | | | | | | | | | | | | | | | | | | | |
Depreciation, depletion and amortization
The following table presents our depreciation, depletion and amortization expenses for the years ended December 31, 2011, 2010 and 2009. The depreciation, depletion and amortization rate per Mcfe produced varies significantly for each of the periods presented due to the various divestitures, acquisitions and ceiling test write-downs. The depreciation, depletion and amortization rate for the year ended December 31, 2011 was $1.99, a $0.24 increase from the year ended December 31, 2010. The increase is primarily the result of higher production volumes and increased capital expenditures as a result of the utilization of the East Texas/North Louisiana Carry. We expect the depletion rate in 2012 to be impacted by utilization of the Appalachia Carry and the depletion rate may also be impacted by additional ceiling test write-downs. The depreciation, depletion and amortization rate for 2010 was $1.75, a $0.03 increase from 2009. The increase was a result of increased drilling on proved undeveloped locations in the Haynesville area, offset by a decrease in depreciation related to the mid-year 2009 sale of our East Texas/North Louisiana gathering assets to TGGT.
| | | | | | | | | | | | | | | | | | | | |
| | | | | | | | | | | | Year to
year
change
2011-2010 | | | Year to
year
change
2010-2009 | |
| | | Years ended December 31, | | | |
(in thousands) | | 2011 | | | 2010 | | | 2009 | | | |
Depreciation, depletion and amortization costs: | | | | | | | | | | | | | | | | | | | | |
Depletion expense | | $ | 344,947 | | | $ | 179,613 | | | $ | 196,515 | | | $ | 165,334 | | | $ | (16,902 | ) |
Depreciation and amortization expense | | $ | 18,009 | | | $ | 17,350 | | | $ | 24,923 | | | $ | 659 | | | $ | (7,573 | ) |
Depletion calculated rate per Mmcfe | | $ | 1.89 | | | $ | 1.60 | | | $ | 1.53 | | | $ | 0.29 | | | $ | 0.07 | |
Depreciation and amortization calculated rate per Mmcfe | | $ | 0.10 | | | $ | 0.15 | | | $ | 0.19 | | | $ | (0.05 | ) | | $ | (0.04 | ) |
Consolidated depreciation, depletion and amortization rate per Mcfe | | $ | 1.99 | | | $ | 1.75 | | | $ | 1.72 | | | $ | 0.24 | | | $ | 0.03 | |
Accretion of discount on asset retirement obligations was $3.7 million in 2011, $3.8 million in 2010 and $7.1 million in 2009.
Write-down of oil and natural gas properties non-cash
In 2011 and 2009, we recognized ceiling test write-downs of $233.2 million and $1.3 billion, respectively, due primarily to low natural gas prices. There were no ceiling test write-downs in 2010.
The ceiling test computation is based on the arithmetic average of reference prices on the first day of the month for the preceding twelve months at each balance sheet date. Natural gas prices on January 1, 2012 and February 1, 2012 were lower than January 1, 2011 and February 1, 2011, which lower this trailing twelve month average in 2012. As a result, we expect to incur additional ceiling test write-downs in 2012 if prices do not increase.
63
General and administrative expenses
The following table presents our general and administrative expenses and changes for each of the years then ended.
| | | | | | | | | | | | | | | | | | | | |
| | | Years ended December 31, | | | Year to
year change | | | Year to
year change | |
(in thousands) | | 2011 | | | 2010 | | | 2009 | | | 2011-2010 | | | 2010-2009 | |
General and administrative costs: | | | | | | | | | | | | | | | | | | | | |
Gross general and administrative expense | | $ | 175,030 | | | $ | 164,603 | | | $ | 147,017 | | | $ | 10,427 | | | $ | 17,586 | |
Technical services and service agreement charges | | | (29,061 | ) | | | (23,519 | ) | | | (4,913 | ) | | | (5,542 | ) | | | (18,606 | ) |
Operator overhead reimbursements | | | (18,407 | ) | | | (16,176 | ) | | | (24,600 | ) | | | (2,231 | ) | | | 8,424 | |
Capitalized salaries and share-based compensation | | | (22,944 | ) | | | (19,794 | ) | | | (18,327 | ) | | | (3,150 | ) | | | (1,467 | ) |
| | | | | | | | | | | | | | | | | | | | |
Net general and administrative expense | | $ | 104,618 | | | $ | 105,114 | | | $ | 99,177 | | | $ | (496 | ) | | $ | 5,937 | |
| | | | | | | | | | | | | | | | | | | | |
| | | | | |
General and administrative expense per Mcfe | | $ | 0.57 | | | $ | 0.94 | | | $ | 0.77 | | | $ | (0.37 | ) | | $ | 0.17 | |
Our general and administrative costs for 2011 were $104.6 million, or $0.57 per Mcfe, compared to $105.1 million, or $0.94 per Mcfe, for 2010, a decrease of $0.5 million, or 0.5%.
Net general and administrative expenses for 2010 were $105.1 million, or $0.94 per Mcfe, compared with $99.2 million, or $0.77 per Mcfe, in 2009, an increase of $5.9 million, or 6.0%.
Significant increases between 2011 and 2010 included the following items:
| | • | | increased personnel costs of $11.9 million, including additional technical resources in our Appalachia area and approximately $6.6 million attributable to an employee retention plan; and |
| | • | | increased expenditures associated with environmental training and safety programs of $2.4 million. |
The above increases were offset by:
| | • | | lower share-based compensation of $4.9 million; |
| | • | | lower legal costs of $1.7 million; |
| | • | | lower travel and relocation related costs of $2.0 million; |
| | • | | reductions in office related expenses of $1.6 million attributable to office lease terminations in 2010; and |
| | • | | increased technical service recoveries, operator overhead reimbursements and capitalized costs of $10.9 million. |
Significant variances between 2010 and 2009 included the following items:
| | • | | increased salaries and benefit costs of $7.8 million due primarily to technical employees hired to exploit our shale resource asset base; |
| | • | | increased legal costs of $5.3 million due to various claims and settlements; |
| | • | | increased building rent and fees of $2.7 million due to expansion of our Dallas office; |
| | • | | increased travel costs of $1.9 million primarily related to joint venture activities; and |
| | • | | decreases in operator overhead recoveries of $8.4 million due to the 2009 Divestitures. |
These increases were partially offset by recoveries of technical and administrative service costs of $18.6 million from our service agreement with BG Group, a $0.4 million decrease in share-based compensation due to a reduction in options granted in 2010 compared to prior years and a $1.0 million reduction in bad debt expense.
Gain (loss) on divestitures and other operating items
Other operating expenses of $23.8 million for 2011 include expenses related to various lawsuits, the impairment of treating facilities in our Vernon Field, write-downs of inventory items and costs associated with the former acquisition proposal terminated in July 2011. In 2010, we recognized a gain on the Appalachia JV of $528.9 million. This gain was partially offset by expense items which are not considered attributable to our ongoing producing operations. Examples of these costs in 2010 include professional fees incurred by a special committee of our board of directors to evaluate strategic opportunities, valuation allowances to the carrying costs from sales of our field inventories, conventional rig contract terminations and certain legal costs. In 2009, we recognized gains of $691.9 million, which were also reduced by similar operating expense items described above.
64
Interest expense
Interest expense for 2011 was $61.0 million compared to $45.5 million for 2010. The $15.5 million increase in 2011 is due primarily to a net increase of interest expense of $19.1 million related to our 2018 and 2011 Notes and a net increase of interest expense of $4.9 million related to our credit agreements. These increases were partially offset by a $9.3 million increase in capitalized interest.
Interest expense for 2010 was $45.5 million compared with $147.2 million for 2009, a decrease of $101.7 million. Significant components of the decrease include $56.6 million of interest and financing costs related to a $300.0 million senior unsecured term credit agreement, or the Term Credit Agreement, that was repaid in August 2009, decreased interest associated with lower average balances on the EXCO Resources Credit Agreement of $30.6 million and net reductions of $19.3 million from interest rate swaps and capitalized interest. These decreases were partially offset by $9.6 million of net interest increases arising from the issuance of the 2018 Notes and redemption of the 2011 Notes.
| | | | | | | | | | | | | | | | | | | | |
| | | Years ended December 31, | | | Year to year change | |
(in thousands) | | 2011 | | | 2010 | | | 2009 | | | 2011-2010 | | | 2010-2009 | |
Interest expense: | | | | | | | | | | | | | | | | | | | | |
2018 Notes | | $ | 57,309 | | | $ | 16,700 | | | $ | — | | | $ | 40,609 | | | $ | 16,700 | |
2011 Notes (1) | | | — | | | | 21,532 | | | | 28,653 | | | | (21,532 | ) | | | (7,121 | ) |
EXCO Resources Credit Agreement | | | 23,517 | | | | 12,609 | | | | 22,778 | | | | 10,908 | | | | (10,169 | ) |
EXCO Operating Credit Agreement (2) | | | — | | | | 6,008 | | | | 26,456 | | | | (6,008 | ) | | | (20,448 | ) |
Term Credit Agreement | | | — | | | | — | | | | 18,833 | | | | — | | | | (18,833 | ) |
Amortization and write-off of deferred financing costs on EXCO Resources Credit Agreement | | | 6,833 | | | | 3,740 | | | | 8,632 | | | | 3,093 | | | | (4,892 | ) |
Amortization of deferred financing costs on EXCO Operating Credit Agreement (2) | | | — | | | | 4,436 | | | | 5,362 | | | | (4,436 | ) | | | (926 | ) |
Amortization of deferred financing costs on Term Credit Agreement | | | — | | | | — | | | | 37,754 | | | | — | | | | (37,754 | ) |
Amortization of deferred financing costs on 2018 Notes | | | 1,867 | | | | 537 | | | | — | | | | 1,330 | | | | 537 | |
Interest rate swaps settlements | | | — | | | | 2,063 | | | | 12,180 | | | | (2,063 | ) | | | (10,117 | ) |
Fair market value adjustment on interest rate swaps | | | — | | | | (2,018 | ) | | | (7,861 | ) | | | 2,018 | | | | 5,843 | |
Capitalized interest | | | (30,083 | ) | | | (20,829 | ) | | | (5,840 | ) | | | (9,254 | ) | | | (14,989 | ) |
Other | | | 1,580 | | | | 755 | | | | 214 | | | | 825 | | | | 541 | |
| | | | | | | | | | | | | | | | | | | | |
Total interest expense | | $ | 61,023 | | | $ | 45,533 | | | $ | 147,161 | | | $ | 15,490 | | | $ | (101,628 | ) |
| | | | | | | | | | | | | | | | | | | | |
| (1) | The 2011 Notes were redeemed in October 2010. |
| (2) | The EXCO Operating Credit Agreement was consolidated with the EXCO Resources Credit Agreement on April 30, 2010. |
Derivative financial instruments
Our objective in entering into derivative financial instruments is to manage our exposure to commodity price and interest rate fluctuations, protect our returns on investments, and achieve a more predictable cash flow from operations. These transactions limit exposure to declines in commodity prices, but also limit the benefits we would realize if commodity prices increase. When prices for oil and natural gas are volatile, a significant portion of the effect of our derivative financial instrument management activities consists of non-cash income or expenses due to changes in the fair value of our derivative financial instrument contracts. Cash charges or gains only arise from payments made or received on monthly settlements of contracts or if we terminate a contract prior to its expiration. We expect that our revenues will continue to be significantly impacted in future periods by changes in the value of our derivative financial instruments as a result of volatility in oil and natural gas prices and the amount of future production volumes subject to derivative financial instruments.
The following table presents our realized and unrealized gains and losses from our oil and natural gas derivative financial instruments. Our derivative activity is reported as a component of other income or expenses in our Consolidated Statements of Operations.
65
| | | | | | | | | | | | | | | | | | | | |
| | | Years ended December 31, | | | Year to year change | |
(in thousands) | | 2011 | | | 2010 | | | 2009 | | | 2011-2010 | | | 2010-2009 | |
Derivative financial instrument activities: | | | | | | | | | | | | | | | | | | | | |
Cash settlements on derivative financial instruments, excluding early terminations | | $ | 135,417 | | | $ | 179,519 | | | $ | 478,463 | | | $ | (44,102 | ) | | $ | (298,944 | ) |
Cash settlements on early terminations of derivative financial instruments | | | — | | | | 37,936 | | | | — | | | | (37,936 | ) | | | 37,936 | |
Non-cash change in fair value of derivative financial instruments | | | 84,313 | | | | (70,939 | ) | | | (246,438 | ) | | | 155,252 | | | | 175,499 | |
| | | | | | | | | | | | | | | | | | | | |
Total derivative financial instrument activities | | $ | 219,730 | | | $ | 146,516 | | | $ | 232,025 | | | $ | 73,214 | | | $ | (85,509 | ) |
| | | | | | | | | | | | | | | | | | | | |
The following table presents our oil and natural gas prices, before the impact of derivative financial instruments.
| | | | | | | | | | | | | | | | | | | | |
| | | Years ended December 31, | | | Year to year change | |
Realized pricing: | | 2011 | | | 2010 | | | 2009 | | | 2011-2010 | | | 2010-2009 | |
Oil per Bbl | | $ | 91.01 | | | $ | 76.18 | | | $ | 53.72 | | | $ | 14.83 | | | $ | 22.46 | |
Natural gas per Mcf | | | 3.85 | | | | 4.29 | | | | 3.93 | | | | (0.44 | ) | | | 0.36 | |
Natural gas equivalent per Mcfe | | $ | 4.13 | | | $ | 4.60 | | | $ | 4.30 | | | $ | (0.47 | ) | | $ | 0.30 | |
Cash settlements on derivatives, excluding early terminations, per Mcfe | | | 0.74 | | | | 1.60 | | | | 3.73 | | | | (0.86 | ) | | | (2.13 | ) |
| | | | | | | | | | | | | | | | | | | | |
Net price per Mcfe, including derivative financial instruments before early terminations | | $ | 4.87 | | | $ | 6.20 | | | $ | 8.03 | | | $ | (1.33 | ) | | $ | (1.83 | ) |
Cash settlements on early terminations of derivative financial instruments, per Mcfe | | | — | | | | 0.34 | | | | — | | | | (0.34 | ) | | | 0.34 | |
| | | | | | | | | | | | | | | | | | | | |
Net price per Mcfe, derivative financial instruments | | $ | 4.87 | | | $ | 6.54 | | | $ | 8.03 | | | $ | (1.67 | ) | | $ | (1.49 | ) |
| | | | | | | | | | | | | | | | | | | | |
Our total cash settlements for 2011 increased our other income by $135.4 million, or $0.74 per Mcfe compared to cash settlements increasing our other income by $217.5 million, or $1.94 per Mcfe, in 2010. Our cash settlements increased our other income by $478.5 million, or $3.73 per Mcfe, in 2009. As noted above, the significant fluctuations between settlements of receipts on our derivative financial instruments demonstrate the volatility in prices.
Our non-cash mark-to-market changes in the fair value of our oil and natural gas derivative financial instruments for 2011 resulted in a gain of $84.3 million compared to losses of $70.9 million and $246.4 million for 2010 and 2009, respectively. The significant fluctuations were attributable to high volatility in the prices for oil and natural gas between each of the years. The ultimate settlement amount of the unrealized portion of the derivative financial instruments is dependent on future commodity prices.
We expect to continue our comprehensive derivative financial instrument program as part of our overall business strategy to enhance our ability to execute our business plan over the entire commodity price cycle, protect our returns on investment, and manage our capital structure.
In January 2008, we entered into interest rate swaps to mitigate our exposure to fluctuations in interest rates on $700.0 million in principal through February 14, 2010 at LIBOR ranging from 2.45% to 2.8%. For 2010, we realized losses from settlements of $2.1 million. These swaps expired on February 14, 2010 and we have not entered into any new interest rate swaps. For 2009, we had realized losses from settlements of $12.2 million and $2.0 million of non-cash unrealized losses attributable to the interest rate swaps.
66
Income taxes
The following table presents a reconciliation of our income tax provision (benefit) for the years ended December 31, 2011, 2010 and 2009.
| | | | | | | | | | | | |
| | | Years ended December 31, | |
(in thousands) | | 2011 | | | 2010 | | | 2009 | |
| | | |
United States federal income taxes (benefit) at statutory rate of 35% | | $ | 7,909 | | | $ | 235,737 | | | $ | (177,207 | ) |
Increases (reductions) resulting from: | | | | | | | | | | | | |
Goodwill | | | — | | | | 11,556 | | | | 43,455 | |
Adjustments to the valuation allowance | | | (11,665 | ) | | | (277,182 | ) | | | 141,975 | |
Non-deductible compensation | | | 1,760 | | | | 2,098 | | | | 2,808 | |
State taxes net of federal benefit | | | 1,554 | | | | 29,050 | | | | (20,606 | ) |
Other | | | 442 | | | | 349 | | | | 74 | |
| | | | | | | | | | | | |
Total income tax provision | | $ | — | | | $ | 1,608 | | | $ | (9,501 | ) |
| | | | | | | | | | | | |
During 2011, our taxable income was offset by the utilization of net operating losses and a corresponding decrease to previously recognized valuation allowances against deferred tax assets. The net result is no income tax provision for 2011.
During 2010, our taxable income was impacted by gains attributable to the formation of the Appalachia JV, offset by the utilization of net operating losses and a corresponding decrease to previously recognized valuation allowances against deferred tax assets. The 2010 income tax provision represents an alternative minimum tax and state income tax liability.
During 2009, our taxable income was impacted by the recognition of valuation allowances against deferred tax assets, which were due primarily to ceiling test write-downs that caused previous book basis and tax basis differences to change from deferred tax liabilities to deferred tax assets.
We adopted the provisions of FASB ASC Subtopic 740-10, Income Taxes on January 1, 2007, or ASC 740-10. As a result of the implementation of ASC Subtopic 740-10, we recognized zero liabilities for unrecognized tax benefits. As of December 31, 2011, 2010 and 2009, our policy is to recognize interest related to unrecognized tax benefits, including penalties, in operating expenses. We have not accrued any interest or penalties relating to unrecognized tax benefits in the current financial statements.
We file income tax returns in the U.S. federal jurisdiction and various state jurisdictions. With few exceptions, we are no longer subject to U.S. federal, state and local examinations by tax authorities for years before 2004. We are not currently under examination by the Internal Revenue Service.
Our liquidity, capital resources and capital commitments
Overview
Our primary sources of capital resources and liquidity are internally generated cash flows from operations, borrowing capacity under the EXCO Resources Credit Agreement, dispositions of non-strategic assets, joint ventures and capital markets, when market conditions are favorable. We have invested approximately $1.3 billion acquiring undeveloped acreage in our shale resource plays since 2008. In addition to the costs incurred to acquire this acreage, the capital expenditure requirements to develop the Haynesville/Bossier shale, Marcellus shale and related midstream infrastructures have been significant and have exceeded our cash flows from operations during 2010 and 2011. As a result of the current low natural gas price environment, we have revised our 2012 capital budget to approximate our expected cash flows from operations. In addition, we are evaluating potential transactions which would further enhance our liquidity, including a partial sale of our interest in TGGT. Other factors which could impact our liquidity, capital resources and capital commitments in 2012 and future years include the following:
| | • | | the results of our ongoing drilling programs; |
| | • | | our ability to effectively reduce our capital expenditure programs in response to low natural gas prices; |
| | • | | reduced oil and natural gas revenues resulting from reductions to our drilling and development activities; |
67
| | • | | decreases in the percentage of our production covered by derivative financial instruments, coupled with expiration of higher priced derivative financial instruments; |
| | • | | potential acquisitions of oil and natural gas properties; |
| | • | | potential reductions to our borrowing base and our ability maintain compliance with debt covenants as a result of low natural gas prices; |
| | • | | availability of services related to horizontal drilling and completions; and |
| | • | | our management of operating and general and administrative costs. |
While we believe our existing capital resources, including our cash flow from operations and borrowing capacity under our EXCO Resources Credit Agreement is sufficient to conduct our operations through 2012 and into 2013, there are certain risks arising from recent declines in natural gas prices that could impact our ability to meet debt covenants in future periods. In particular, our consolidated funded indebtedness to consolidated EBITDAX, as defined in the EXCO Resources Credit Agreement, is computed using a trailing twelve month computation. As a result, our ability to maintain compliance with this covenant may be negatively impacted when oil and or natural gas prices decline for an extended period of time. In addition, as a result of the decline in natural gas prices, we expect a reduction to our available borrowing base under the EXCO Resources Credit Agreement at the next regularly scheduled redetermination in April 2012 and the possibility of further reductions in future periods if natural gas prices do not recover.
In response to the recent declines in natural gas prices, management has reduced our drilling plans, which will likely reduce our production volumes late in 2012 and into 2013, and has taken measures to reduce operating and administrative expenses. In addition, the volumes of natural gas currently covered by derivative financial instruments declines significantly in 2013. Depending on market conditions, we may enter into additional hedging transactions in 2012. The combination of a potential reduction in our borrowing base, lower production volumes and reduced percentages of volumes covered by derivative financial instruments may require us to seek alternative financing arrangements, further reduce costs or sell assets.
Our revised capital budget for 2012 totals $470.0 million and reflects our continued focus on the development of the Marcellus shale in Appalachia and the Haynesville and Bossier shale plays in East Texas/North Louisiana and reflects a favorable impact from the Appalachia Carry of $54.6 million. We expect the remainder of the Appalachia Carry will be fully utilized during 2012.
We believe this revised budget will met our strategic objectivity while maintaining sufficient liquidity. However, we expect reductions in our borrowing base in 2012 which may result in additional drilling reductions or may negatively affect 2013.
The following table presents our liquidity and financial position as of December 31, 2011 and February 22, 2012:
| | | | | | | | |
(in thousands) | | December 31,
2011 | | | February 22,
2012 | |
Cash | | $ | 187,922 | | | | 126,770 | |
Borrowings under the EXCO Resources Credit Agreement | | | 1,147,500 | | | | 1,159,500 | |
2018 Notes (1) | | | 750,000 | | | | 750,000 | |
| | | | | | | | |
Total debt | | | 1,897,500 | | | | 1,909,500 | |
Net debt | | $ | 1,709,578 | | | $ | 1,782,730 | |
| | | | | | | | |
EXCO Resources Credit Agreement borrowing base | | $ | 1,600,000 | | | $ | 1,600,000 | |
Unused EXCO Resources Credit Agreement borrowing base (2) | | $ | 443,273 | | | | 431,273 | |
Unused EXCO Resources Credit Agreement borrowing base plus cash (2) | | $ | 631,195 | | | | 558,043 | |
| (1) | Excludes unamortized bond discount of $9.7 million at December 31, 2011 and $9.5 million at February 22, 2012. |
| (2) | Net of letters of credit of $9.2 million at December 31, 2011 and February 22, 2012. |
Events affecting liquidity
On January 11, 2011, we closed the Chief Transaction, which included undeveloped acreage and oil and natural gas properties in the Marcellus shale for approximately $454.4 million ($227.2 million net to us) after post-closing adjustments. BG Group participated in its 50% share of the transaction and funded its $227.2 million to us.
68
On January 31, 2011, TGGT entered into the TGGT Credit Agreement and a portion of the proceeds were used pay a distribution to us and BG Group of $125.0 million each. We used this distribution to reduce the borrowings under the EXCO Resources Credit Agreement.
On March 1, 2011, we jointly closed the purchase of Marcellus shale acreage with BG Group, which also included certain shallow production primarily in Jefferson and Clarion counties in Pennsylvania for $82.0 million ($41.0 million net to us).
On April 5, 2011, we closed the Haynesville Shale Acquisition for $225.2 million which included land, mineral interests and other assets in DeSoto Parish. BG Group elected to participate in this acquisition for its 50% share and funded us $112.6 million on May 12, 2011.
An incident occurred at a TGGT amine treating facility in May 2011 in northwest Red River Parish, Louisiana resulting in an immediate shut-down of the facility. As a precautionary measure, TGGT shut down another amine treating facility located in DeSoto Parish with similar specifications, which was restarted in October 2011. TGGT has installed temporary treating units at the damaged facility and expects to be capable of treating volumes in the first quarter of 2012 once these temporary treating units are operational. The incident impacted our production volumes from wells in the East Texas/North Louisiana JV. As of December 31, 2011, we estimated approximately 124.0 Mmcf per day of gross EXCO operated production (39.0 Mmcfe per day net to us) was curtailed since the incident occurred. Using average realized prices for June 2011 through December 2011, the shut-in volumes decreased our operating revenues by approximately $29.1 million. These volumes are expected to be curtailed until the end of the first quarter of 2012.
On January 25, 2012, TGGT entered into the First Amendment to the TGGT Credit Agreement. This amendment, among other things, increased the borrowing base from $500.0 million to $600.0 million, allows for the issuance of unsecured senior note indebtedness under certain conditions and modified certain debt covenants.
During 2011, we entered into three amendments to the EXCO Resources Credit Agreement. As of February 22, 2012, we have a borrowing base of $1.6 billion with $431.3 million of unused borrowing capacity. The EXCO Resources Credit Agreement also contains provisions which allow us to incur up to an additional $750.0 million of unsecured senior note indebtedness on or before November 1, 2012. The next scheduled borrowing base redetermination is in April 2012 and we expect the borrowing base will be reduced at that time.
Although weaknesses in natural gas prices continue, we believe that our capital resources from existing cash balances, anticipated cash flow from operating activities and available borrowing capacity under the EXCO Resources Credit Agreement will be adequate to execute our corporate strategies and to meet debt service obligations.
Historical sources and uses of funds
Net increases (decreases) in cash are summarized as follows:
| | | | | | | | | | | | |
| | | Years ended December 31, | |
(in thousands) | | 2011 | | | 2010 | | | 2009 | |
Cash flows provided by operating activities | | $ | 428,543 | | | $ | 339,921 | | | $ | 433,605 | |
Cash flows provided by (used in) investing activities | | | (709,531 | ) | | | (712,854 | ) | | | 1,235,275 | |
Cash flows provided by (used in) financing activities | | | 268,756 | | | | 348,755 | | | | (1,657,612 | ) |
| | | | | | | | | | | | |
Net increase (decrease) in cash | | $ | (12,232 | ) | | $ | (24,178 | ) | | $ | 11,268 | |
| | | | | | | | | | | | |
Our primary sources of cash in 2011 were cash flows from operating activities, borrowings under our credit facilities, reimbursements from BG Group for acquisitions and a $125.0 million capital distribution from TGGT. As of December 31, 2011, our total unrestricted and restricted cash was $187.9 million compared with $205.9 million as of December 31, 2010. Our consolidated debt was $1.9 billion as of December 31, 2011 compared with $1.6 billion as of December 31, 2010. The December 31, 2010 debt balance includes $459.4 million of borrowings to fund the Chief Transaction. On February 7, 2011, we received $229.7 million from BG Group for its share of this acquisition. Our primary sources of cash in 2010 were proceeds from our Appalachia JV and other asset sales, proceeds from the issuance of the 2018 Notes and cash flows from operating activities. We utilized these cash inflows to redeem our 2011 Notes, fund our drilling and development activities and fund acquisitions.
69
Cash flows from operations
The primary factors impacting our cash flows from operations generally include: (i) levels of production from our oil and natural gas properties, (ii) prices we receive from sales of oil and natural gas production, including settlement proceeds or payments related to our oil and natural gas derivatives, (iii) operating costs of our oil and natural gas properties, (iv) costs of our general and administrative activities and (v) interest expense and other financing related costs. Our cash flows from operations have been significantly impacted by fluctuations in oil and natural gas prices and our production volumes.
Net cash provided by operating activities was $428.5 million for the year ended December 31, 2011 compared with $339.9 million for the year ended December 31, 2010. The 26.1% increase is primarily attributable to higher production volumes in 2011 from our Haynesville and Appalachia shale activities, offset by lower average natural gas prices in 2011, compared to average natural gas prices in 2010 and lower cash settlements of our oil and natural gas derivatives in 2010.
Investing activities
Our investing activities consist primarily of drilling and development expenditures, capital contributions to our joint ventures, and acquisitions. Our recent acquisitions have been focused primarily on undeveloped shale acreage in our core areas and have been funded primarily with borrowings under the EXCO Resources Credit Agreement. In January 2011, we received a capital distribution from TGGT of $125.0 million which was used to reduce borrowings under the EXCO Resources Credit Agreement. We also receive reimbursements from BG Group on the acquisitions for which they elect to participate. Future acquisitions are dependent on oil and natural gas prices, availability of attractive acreage and availability of borrowing capacity under the EXCO Resources Credit Agreement or from other capital sources.
Capital expenditures
The following table presents our capital expenditures for the years ended December 31, 2011, 2010 and 2009. The 2011 oil and natural gas acquisitions include the $459.4 million we funded for the Chief Transaction in 2010 as the necessary consents to acquire those assets were not received from third parties until January 11, 2011. Our acquisitions in 2011, 2010 and 2009 emphasized undeveloped acreage in the Haynesville and Bossier shales in East Texas/North Louisiana and the Marcellus shale in Appalachia.
| | | | | | | | | | | | |
| | | Years ended December 31, | |
(in thousands) | | 2011 | | | 2010 | | | 2009 | |
Capital expenditures: | | | | | | | | | | | | |
Oil and natural gas property acquisitions (1) | | $ | 755,520 | | | $ | 533,941 | | | $ | 233,634 | |
Lease purchases (2) | | | 63,367 | | | | 95,843 | | | | 106,040 | |
Development capital expenditures | | | 855,451 | | | | 346,582 | | | | 299,837 | |
Midstream capital additions | | | — | | | | — | | | | 53,122 | |
Seismic | | | 10,146 | | | | 21,335 | | | | 12,400 | |
Gas gathering and water pipelines | | | 6,495 | | | | 23,607 | | | | 1,176 | |
Corporate and other | | | 65,747 | | | | 74,427 | | | | 38,957 | |
| | | | | | | | | | | | |
Total capital expenditures | | $ | 1,756,726 | | | $ | 1,095,735 | | | $ | 745,166 | |
| | | | | | | | | | | | |
| (1) | Excludes reimbursements from BG Group of $359.1 million in 2011 and $123.5 million in 2010. |
There were no reimbursements in 2009.
| (2) | Excludes reimbursements from BG Group of $31.9 million in 2011 and $58.3 million in 2010. |
There were no reimbursements in 2009.
2012 capital budget
Future capital expenditures are subject to a number of variables including our oil and natural gas production volumes, fluctuations in oil and natural gas prices, availability of borrowings under the EXCO Resources Credit Agreement and ability to service our debt. Continued weaknesses in natural gas prices, coupled with the expiration of our higher priced derivative financial instruments will have a negative impact on our cash flows, which may result in increased borrowing to fulfill our drilling commitments in 2012. Anticipated continued low natural gas prices will be a significant factor in our 2012 capital budget and we expect to reduce our development activities.
Our initial 2012 capital budget, which was approved by our board of directors in November 2011, was constructed using an average price assumption of $4.00 per Mmbtu, adjusted for differentials. Recent prices for natural gas have fallen to less than $3.00 per Mmbtu and the 12 month NYMEX strip is significantly less than our $4.00 per Mmbtu assumption. As a result, management has undertaken a detailed analysis of the existing capital budget and expects to significantly reduce our drilling program in response to the low natural gas price environment.
70
Our revised 2012 capital budget is $470.0 million and includes $359.0 million for drilling and completion activities utilizing an average of nine drilling rigs in the Haynesville/Bossier shale, three drilling rigs in the Marcellus shale, primarily in our Northeast Pennsylvania development area and one drilling rigs in our Permian region. Approximately 76.0% of the drilling and completion spending will be focused in the Haynesville/Bossier shale primarily in DeSoto Parish. Our 2012 Marcellus drilling costs also benefit from $54.6 million of unused Appalachia Carry. Following utilization of the Appalachia Carry during 2012, we will be obligated to fund our 50% share of all future activities in this area. The Permian Basin region continues to provide significant rates of return due to the high liquid content of the production. We expect this capital program to be funded primarily with our operating cash flow.
Our capital budget for 2012 currently emphasizes development of our shale resource plays.
The following table presents a comparison of our 2012 capital expenditure budget to our actual 2011 capital expenditures. The 2012 capital expenditures budget does not reflect any equity contributions to TGGT as we expect the capital programs to be funded from cash flows and available borrowing capacity under the TGGT Credit Agreement. In addition, we are presently evaluating a number of alternatives to reduce our capital expenditures, operating and administrative costs in response to low natural gas prices.
| | | | | | | | | | | | | | | | | | | | |
(in millions, except wells) | | 2012
planned
gross
wells
drilled | | | 2012
planned
gross
wells
completed | | | 2012
revised
capital
budget | | | 2011
actual
spending(1) | | | Year to
year
change | |
East Texas/North Louisiana | | | 70 | | | | 81 | | | $ | 296.0 | | | $ | 787.8 | | | $ | (491.8 | ) |
Appalachia | | | 49 | | | | 58 | | | | 86.0 | | | | 64.9 | | | | 21.1 | |
Permian | | | 37 | | | | 37 | | | | 38.0 | | | | 50.9 | | | | (12.9 | ) |
Corporate and other (2) | | | — | | | | — | | | | 50.0 | | | | 65.7 | | | | (15.7 | ) |
| | | | | | | | | | | | | | | | | | | | |
Total | | | 156 | | | | 176 | | | $ | 470.0 | | | $ | 969.3 | | | $ | (499.3 | ) |
| | | | | | | | | | | | | | | | | | | | |
| (1) | Includes reimbursements from BG Group of $31.9 million. |
| (2) | Includes $25.0 million of capitalized interest for 2012 and $30.1 million for 2011. |
Credit agreement and long-term debt
As of February 22, 2012, we had total debt outstanding of approximately $1.9 billion consisting of borrowings under the EXCO Resources Credit Agreement of $1.2 billion and $750.0 million under the 2018 Notes. Terms and conditions of each of the debt obligations are discussed below. Our ability to borrow from sources other than the EXCO Resources Credit Agreement is subject to certain restrictions imposed by our lenders and the Indenture. These agreements contain limitations and restrictions on incurring additional indebtedness and pledging our assets.
EXCO Resources Credit Agreement
The EXCO Resources Credit Agreement has a current borrowing base of $1.6 billion. On February 22, 2012, we had $1.2 billion of outstanding indebtedness and $431.3 million of available borrowing capacity under the EXCO Resources Credit Agreement. The majority of EXCO’s subsidiaries are guarantors under the EXCO Resources Credit Agreement, except those subsidiaries which are jointly held with BG Group. The EXCO Resources Credit Agreement permits certain investments, loans and advances to the unrestricted subsidiaries that are jointly held with BG Group. The EXCO Resources Credit Agreement matures on April 1, 2016 and has regularly scheduled semi-annual borrowing base redeterminations each April and October, with EXCO and the lenders having the right to request interim unscheduled redeterminations in certain circumstances.
Borrowings under the EXCO Resources Credit Agreement are collateralized by first lien mortgages providing a security interest of not less than 80% of the Engineered Value, as defined in the EXCO Resources Credit Agreement, of our oil and natural gas properties evaluated by the lenders for purposes of establishing our borrowing base. We are permitted to have derivative financial instruments covering no more than 100% of the forecasted production from total Proved Reserves (as defined in the agreement) during the first two years of the forthcoming five year period, 90% of the forecasted production from total Proved Reserves for any month during the third year of the forthcoming five year period and 85% of the forecasted production from total Proved Reserves during the fourth and fifth year of the forthcoming five year period.
On November 8, 2011, we entered into the fourth amendment and fifth amendments to the EXCO Resources Credit Agreement. The fourth amendment increased the borrowing base from $1.5 billion to $1.6 billion and increased the maximum facility amount from $1.5 billion to $2.0 billion. The fifth amendment permits us to incur up to an additional $750.0 million of unsecured senior note indebtedness on or before November 1, 2012.
71
The EXCO Resources Credit Agreement sets forth the terms and conditions under which we are permitted to pay a cash dividend on our common stock. Pursuant to the amendment, we may declare and pay cash dividends on our common stock in an amount not to exceed $50.0 million in any four consecutive fiscal quarters, provided that as of each payment date and after giving effect to the dividend payment date, (i) no default has occurred and is continuing, (ii) we have at least 10% of our borrowing base available under the EXCO Resources Credit Agreement, and (iii) payment of such dividend is permitted under our 2018 Notes.
The interest rate ranges from LIBOR plus 200 basis points, or bps, to LIBOR plus 300 bps depending upon borrowing base usage. The facility also includes an Alternate Base Rate, or ABR, pricing alternative ranging from ABR plus 100 bps to ABR plus 200 bps depending upon borrowing base usage. Based on a one month LIBOR of 0.24% on February 22, 2012, we would incur an interest rate of 2.24% on any new indebtedness we may incur under the EXCO Resources Credit Agreement.
As of December 31, 2011, we were in compliance with the financial covenants contained in the EXCO Resources Credit Agreement, which require that we:
| | • | | maintain a consolidated current ratio (as defined in the agreement) of at least 1.0 to 1.0 as of the end of any fiscal quarter; and |
| | • | | not permit our ratio of consolidated funded indebtedness (as defined in the agreement) to consolidated EBITDAX (as defined in the agreement) to be greater than 4.0 to 1.0 at the end of any fiscal quarter ending on or after December 31, 2010. |
The foregoing description is not complete and is qualified in its entirety by the EXCO Resources Credit Agreement.
2018 Notes
On September 15, 2010 we closed an underwritten offering of $750.0 million aggregate principal amount of 7.5% senior unsecured notes maturing on September 15, 2018. We received proceeds of approximately $724.1 million from the offering after deducting an original issue discount of $11.0 million and commissions, estimated offering fees and expenses of $14.9 million. The remaining net proceeds from the offering were used to redeem the 2011 Notes with the balance of approximately $271.3 million being used to pay a portion of the outstanding balance under the EXCO Resources Credit Agreement. The notes are guaranteed on a senior unsecured basis by EXCO’s consolidated subsidiaries, other than EXCO Water Resources, LLC and all of our jointly-held equity investments with BG Group. Our midstream equity investments with BG Group are designated as unrestricted subsidiaries under the Indenture governing the 2018 Notes.
As of December 31, 2011, $750.0 million in principal was outstanding on our 2018 Notes. The unamortized discount on the 2018 Notes at December 31, 2011 was $9.7 million. The estimated fair value of the 2018 Notes, based on quoted market prices, was $705.0 million on December 31, 2011.
Interest is payable on the on the 2018 Notes semi-annually in arrears on March 15 and September 15 of each year, beginning on March 15, 2011.
The Indenture governing the 2018 Notes contains covenants which may limit our ability and the ability of our restricted subsidiaries to:
| | • | | incur or guarantee additional indebtedness; |
| | • | | pay dividends on our capital stock (over $50.0 million per annum) or make other distributions or repurchase or redeem our capital stock; |
| | • | | prepay, redeem or repurchase certain debt; |
| | • | | make certain investments and loans; |
| | • | | incur liens on our assets; |
| | • | | enter into transactions with affiliates; |
| | • | | alter the businesses we conduct; |
| | • | | enter into agreements restricting our subsidiaries’ ability to pay dividends; and |
| | • | | consolidate, merge or sell all or substantially all of our assets. |
Other activities
On July 19, 2010, we announced a share repurchase program which authorizes us to purchase up to $200.0 million of our common shares. Repurchases are made in the open market, in privately negotiated transactions or in structured share repurchase
72
programs, and may be made from time to time and in one or more large repurchases. The program will be conducted in compliance with the SEC’s Rule 10b-18 and applicable legal requirements and shall be subject to market conditions and other factors. We are not obligated to repurchase any common shares, or any particular amount of common stock, and the repurchase program may be modified or suspended at any time at our discretion. The repurchases may be funded from available cash or borrowings under the EXCO Resources Credit Agreement.
As of December 31, 2011, we have repurchased a total of 539,221 shares for $7.5 million at an average price of $13.87 per share. The program was suspended as a result of the pending strategic alternatives being evaluated by a special committee of our board of directors in connection with the October 29, 2010 proposal from our Chairman and Chief Executive Officer to purchase all of our outstanding common stock. On July 8, 2011, the special committee of our board of directors terminated their strategic alternatives review process and on August 5, 2011, our board of directors agreed to reinstate the repurchase program.
Derivative financial instruments
We use oil and natural gas derivatives and financial risk management instruments to manage our exposure to commodity prices. We do not designate these instruments as hedging instruments for financial accounting purposes and, as a result, we recognize the change in the respective instruments’ fair value currently in earnings, as a gain or loss on oil and natural gas derivatives.
Recent financial reform legislation has addressed derivative financial instruments, including the possibility of requiring the posting of cash collateral for certain derivative parties. The definitions and specific requirements of this legislation are yet to be defined and we cannot presently quantify the impact to us, if any.
Oil and natural gas derivatives
Our production is generally sold at prevailing market prices. However, we periodically enter into oil and natural gas contracts for a portion of our production when market conditions are deemed favorable and oil and natural gas prices exceed our minimum internal price targets.
Our objective in entering into oil and natural gas derivative contracts is to mitigate the impact of price fluctuations and achieve a more predictable cash flow from our operations and related borrowings under the EXCO Resources Credit Agreement. These transactions limit our exposure to declines in prices, but also limit the benefits we would realize if oil and natural gas prices increase. As of December 31, 2011, we had derivative financial instrument contracts in place for the volumes and prices shown below:
| | | | | | | | | | | | | | | | |
(in thousands, except prices) | | NYMEX gas
volume - Mmbtu | | | Weighted
average contract
price per Mmbtu | | | NYMEX oil
volume - Bbls | | | Weighted
average contract
price per Bbl | |
Swaps: | | | | | | | | | | | | | | | | |
Q1 2012 | | | 20,020 | | | $ | 5.27 | | | | 68,250 | | | $ | 95.70 | |
Q2 2012 | | | 20,020 | | | $ | 5.27 | | | | 68,250 | | | $ | 95.70 | |
Q3 2012 | | | 20,240 | | | $ | 5.27 | | | | 69,000 | | | $ | 95.70 | |
Q4 2012 | | | 20,240 | | | $ | 5.27 | | | | 69,000 | | | $ | 95.70 | |
2013 | | | 5,475 | | | $ | 5.99 | | | | — | | | $ | — | |
Off-balance sheet arrangements
As of December 31, 2011, we had no arrangements or any guarantees of off-balance sheet debt to third parties.
73
Contractual obligations and commercial commitments
| | | | | | | | | | | | | | | | | | | | |
| | | Payments due by period | |
(in thousands) | | Less than
one year | | | One to three
years | | | Three to five
years | | | More than
five years | | | Total | |
Long-term debt - 2018 Notes (1) | | $ | — | | | $ | — | | | $ | — | | | $ | 750,000 | | | $ | 750,000 | |
Long-term debt - EXCO Resources Credit Agreement (2) | | | — | | | | — | | | | 1,147,500 | | | | — | | | | 1,147,500 | |
Firm transportation services (3) | | | 93,789 | | | | 185,448 | | | | 181,544 | | | | 394,804 | | | | 855,585 | |
Other fixed commitments (4) | | | 46,047 | | | | 18,922 | | | | 12,580 | | | | 1,529 | | | | 79,078 | |
Drilling contracts | | | 76,805 | | | | 22,163 | | | | — | | | | — | | | | 98,968 | |
Operating leases and other | | | 14,806 | | | | 21,383 | | | | 5,627 | | | | — | | | | 41,816 | |
| | | | | | | | | | | | | | | | | | | | |
Total contractual obligations (5) | | $ | 231,447 | | | $ | 247,916 | | | $ | 1,347,251 | | | $ | 1,146,333 | | | $ | 2,972,947 | |
| | | | | | | | | | | | | | | | | | | | |
| (1) | The 2018 Notes are due on September 15, 2018. The annual interest obligations are $56.3 million. |
| (2) | The EXCO Resources Credit Agreement, as amended, matures on April 1, 2016. The interest is payable at LIBOR plus 150 bps to LIBOR plus 250 bps, or from ABR plus 50 bps to ABR plus 150 bps, depending on borrowing base usage. |
| (3) | Firm transportation services reflect contracts whereby EXCO commits to transport a minimum quantity of natural gas on a shippers’ pipeline. Whether or not EXCO delivers the minimum quantity, we pay the fees as if the quantities were delivered. |
| (4) | Primarily contracts related to completion operations. |
| (5) | Excludes commitments of our equity method investees, TGGT and OPCO. TGGT’s commitments, which consist primarily of compression equipment and office leases, total $9.7 million ($4.8 million net to us). OPCO’s commitments, which consist primarily of firm transportation contracts, drilling contracts and completion services, total $85.3 million ($42.7 million net to us). OPCO’s commitments in 2012 through 2014 total approximately $53.9 million ($26.9 million net to us), or 61.7% of their total commitments. |
74
| Item 7A. | Quantitative and Qualitative Disclosures About Market Risk |
Some of the information below contains forward-looking statements. The primary objective of the following information is to provide forward-looking quantitative and qualitative information about our potential exposure to market risks. The term “market risk” refers to the risk of loss arising from adverse changes in oil and natural gas prices, interest rates charged on borrowings and earned on cash equivalent investments, and adverse changes in the market value of marketable securities. The disclosure is not meant to be a precise indicator of expected future losses, but rather an indicator of reasonably possible losses. This forward-looking information provides an indicator of how we view and manage our ongoing market risk exposures. Our market risk sensitive instruments were entered into for hedging and investment purposes, not for trading purposes.
Commodity price risk
Our objective in entering into derivative financial instruments is to manage our exposure to commodity price, protect our returns on investments, and achieve a more predictable cash flow in connection with our operations. These transactions limit exposure to declines in prices, but also limit the benefits we would realize if prices increase. When prices for oil and natural gas are volatile, a significant portion of the effect of our derivative financial instrument management activities consists of non-cash income or expense due to changes in the fair value of our derivative financial instrument contracts. Cash charges or gains only arise from payments made or received on monthly settlements of contracts or if we terminate a contract prior to its expiration.
Pricing for oil and natural gas is volatile. We do not designate our derivative financial instruments as hedging instruments for financial accounting purposes and, as a result, we recognize the change in the respective instrument’s fair value currently in earnings, with respect to commodity derivatives, gains or losses on derivative financial instruments and with respect to interest rate swaps, as interest expense on financial risk management instruments.
Our major market risk exposure is in the pricing applicable to our oil and natural gas production. Realized pricing is primarily driven by the prevailing worldwide price for crude oil and spot market prices for natural gas. Pricing for oil and natural gas production is volatile. The following table sets forth our oil and natural gas derivatives:
| | | | | | | | | | | | |
(in thousands, except prices) | | Volume
Mmbtus/Bbls | | | Weighted average
strike price per
Mmbtu/Bbl | | | Fair value at
December 31,
2011 | |
Natural gas: | | | | | | | | | | | | |
Swaps: | | | | | | | | | | | | |
2012 | | | 80,520 | | | $ | 5.27 | | | $ | 163,049 | |
2013 | | | 5,475 | | | | 5.99 | | | | 11,034 | |
| | | | | | | | | | | | |
Total natural gas | | | 85,995 | | | | | | | | 174,083 | |
| | | | | | | | | | | | |
| | | |
Oil: | | | | | | | | | | | | |
Swaps: | | | | | | | | | | | | |
2012 | | | 275 | | | | 95.70 | | | | (847 | ) |
| | | | | | | | | | | | |
Total oil | | | 275 | | | | | | | | (847 | ) |
| | | | | | | | | | | | |
Total oil and natural gas and derivatives | | | | | | | | | | $ | 173,236 | |
| | | | | | | | | | | | |
At December 31, 2011, the average forward NYMEX oil prices per Bbl for calendar year 2012 and 2013 were $98.81 and $95.78, respectively, and the average forward NYMEX natural gas prices per Mmbtu for calendar 2012 and 2013 were $3.24 and $3.94, respectively. Our reported earnings and assets or liabilities for derivative financial instruments will continue to be subject to significant fluctuations in value due to price volatility.
Realized gains or losses from the settlement of our oil and natural gas derivatives are recorded in our financial statements as increases or decreases in other income or loss. For example, using the oil swaps in place as of December 31, 2011 for 2012, if the settlement price exceeds the actual weighted average strike price of $95.70 per Bbl, then a reduction in other income (expense) would be recorded for the difference between the settlement price and $95.70 per Bbl, multiplied by the hedged volume of 275 Mbbls. Conversely, if the settlement price is less than $95.70 per Bbl, then an increase in other income (expense) would be recorded for the difference between the settlement price and $95.70 per Bbl, multiplied by the hedged volume of 275 Mbbls. For example, for a hedged volume of 275 Mbbls, if the settlement price is $96.70 per Bbl then other income (expense) would decrease by $0.3 million. Conversely, if the settlement price is $94.70 per Bbl, oil and natural gas revenue would increase by $0.3 million.
75
Interest rate risk
At December 31, 2011, our exposure to interest rate changes related primarily to borrowings under the EXCO Resources Credit Agreement and interest earned on our short-term investments. The interest rate is fixed at 7.5% on the $750.0 million outstanding under the 2018 Notes. Interest is payable on borrowings under the EXCO Resources Credit Agreement based on a floating rate as more fully described in “Management’s Discussion and Analysis of Financial Condition and Results of Operations—Our liquidity, capital resources and capital commitments.” At December 31, 2011, we had $1.1 billion in outstanding borrowings under the EXCO Resources Credit Agreement. A 1% change in interest rates based on the variable borrowings as of December 31, 2011 would result in an increase or decrease in our interest costs of $11.5 million per year. The interest we pay on these borrowings is set periodically based upon market rates.
76
| Item 8. | Financial Statements and Supplementary Data |
EXCO Resources, Inc.
Index to Consolidated Financial Statements
Contents
77
MANAGEMENT’S REPORT ON INTERNAL CONTROL OVER FINANCIAL REPORTING
To the Board of Directors and Shareholders of
EXCO Resources, Inc.:
Management is responsible for establishing and maintaining adequate internal control over financial reporting (as defined in Rule 13a-15(f) under the Securities Exchange Act of 1934, as amended). Our internal control over financial reporting is designed to provide reasonable assurance to management and our board of directors regarding the preparation and fair presentation of published financial statements. Because of its inherent limitations, internal control over financial reporting may not prevent or detect misstatements. Therefore, even those systems determined to be effective can provide only reasonable assurance with respect to financial statement preparation and presentation. Management assessed the effectiveness of our internal control over financial reporting as of December 31, 2011. In making this assessment, management used the criteria set forth by the Committee of Sponsoring Organizations of the Treadway Commission (COSO) inInternal Control—Integrated Framework. Based on management’s assessment, management believes that, as of December 31, 2011, our internal control over financial reporting was not effective based on those criteria due to the effect of a material weakness in internal control over financial reporting that is described in “Item 9A. Controls and Procedures—Disclosure Control and Procedures” and is incorporated by reference herein.
The effectiveness of EXCO Resources, Inc.’s internal control over financial reporting as of December 31, 2011 has been audited by KPMG LLP, an independent registered public accounting firm, as stated in their report which appears herein.
| | | | | | | | |
| By: | | /s/ DOUGLAS H. MILLER | | | | By: | | /s/ STEPHEN F. SMITH |
| Title: | | Chief Executive Officer | | | | Title: | | President and Chief Financial Officer |
Dallas, Texas
February 27, 2012
78
Report of Independent Registered Public Accounting Firm
The Board of Directors and Stockholders
EXCO Resources, Inc.:
We have audited EXCO Resources, Inc.’s (the Company) internal control over financial reporting as of December 31, 2011, based on criteria established inInternal Control – Integrated Frameworkissued by the Committee of Sponsoring Organizations of the Treadway Commission (COSO). EXCO Resources, Inc.’s management is responsible for maintaining effective internal control over financial reporting and for its assessment of the effectiveness of internal control over financial reporting, included in the accompanyingManagement’s Report on Internal Control over Financial Reporting. Our responsibility is to express an opinion on the Company’s internal control over financial reporting based on our audit.
We conducted our audit in accordance with the standards of the Public Company Accounting Oversight Board (United States). Those standards require that we plan and perform the audit to obtain reasonable assurance about whether effective internal control over financial reporting was maintained in all material respects. Our audit included obtaining an understanding of internal control over financial reporting, assessing the risk that a material weakness exists, and testing and evaluating the design and operating effectiveness of internal control based on the assessed risk. Our audit also included performing such other procedures as we considered necessary in the circumstances. We believe that our audit provides a reasonable basis for our opinion.
A company’s internal control over financial reporting is a process designed to provide reasonable assurance regarding the reliability of financial reporting and the preparation of financial statements for external purposes in accordance with generally accepted accounting principles. A company’s internal control over financial reporting includes those policies and procedures that (1) pertain to the maintenance of records that, in reasonable detail, accurately and fairly reflect the transactions and dispositions of the assets of the company; (2) provide reasonable assurance that transactions are recorded as necessary to permit preparation of financial statements in accordance with generally accepted accounting principles, and that receipts and expenditures of the company are being made only in accordance with authorizations of management and directors of the company; and (3) provide reasonable assurance regarding prevention or timely detection of unauthorized acquisition, use, or disposition of the company’s assets that could have a material effect on the financial statements.
Because of its inherent limitations, internal control over financial reporting may not prevent or detect misstatements. Also, projections of any evaluation of effectiveness to future periods are subject to the risk that controls may become inadequate because of changes in conditions, or that the degree of compliance with the policies or procedures may deteriorate.
A material weakness is a deficiency, or a combination of deficiencies, in internal control over financial reporting, such that there is a reasonable possibility that a material misstatement of the company’s annual or interim financial statements will not be prevented or detected on a timely basis. A material weakness related to the Company’s computation of the limitation on capitalized costs has been identified and included in management’s assessment.
We also have audited, in accordance with the standards of the Public Company Accounting Oversight Board (United States), the consolidated balance sheets of EXCO Resources, Inc. and subsidiaries as of December 31, 2011 and 2010, and the related consolidated statements of operations, shareholders’ equity, and cash flows for each of the years in the three-year period ended December 31, 2011. This material weakness was considered in determining the nature, timing, and extent of audit tests applied in our audit of the 2011 consolidated financial statements, and this report does not affect our report dated February 27, 2012, which expressed an unqualified opinion on those consolidated financial statements.
In our opinion, because of the effect of the aforementioned material weakness on the achievement of the objectives of the control criteria, EXCO Resources, Inc. has not maintained effective internal control over financial reporting as of December 31, 2011, based on criteria established inInternal Control – Integrated Frameworkissued by the Committee of Sponsoring Organizations of the Treadway Commission.
/s/ KPMG LLP
Dallas, Texas
February 27, 2012
79
Report of Independent Registered Public Accounting Firm
The Board of Directors and Shareholders
EXCO Resources, Inc.:
We have audited the accompanying consolidated balance sheets of EXCO Resources, Inc. and subsidiaries (the Company) as of December 31, 2011 and 2010, and the related consolidated statements of operations, shareholders’ equity, and cash flows for each of the years in the three-year period ended December 31, 2011. These consolidated financial statements are the responsibility of the Company’s management. Our responsibility is to express an opinion on these consolidated financial statements based on our audits.
We conducted our audits in accordance with the standards of the Public Company Accounting Oversight Board (United States). Those standards require that we plan and perform the audit to obtain reasonable assurance about whether the financial statements are free of material misstatement. An audit includes examining, on a test basis, evidence supporting the amounts and disclosures in the financial statements. An audit also includes assessing the accounting principles used and significant estimates made by management, as well as evaluating the overall financial statement presentation. We believe that our audits provide a reasonable basis for our opinion.
In our opinion, the consolidated financial statements referred to above present fairly, in all material respects, the financial position of EXCO Resources, Inc. and subsidiaries as of December 31, 2011 and 2010, and the results of their operations and their cash flows for each of the years in the three-year period ended December 31, 2011, in conformity with U.S. generally accepted accounting principles.
We also have audited, in accordance with the standards of the Public Company Accounting Oversight Board (United States), EXCO Resources, Inc.’s internal control over financial reporting as of December 31, 2011, based on criteria established inInternal Control—Integrated Framework, issued by the Committee of Sponsoring Organizations of the Treadway Commission (COSO), and our report dated February 27, 2012 expressed an adverse opinion on the effectiveness of the Company’s internal control over financial reporting.
/s/ KPMG LLP
Dallas, Texas
February 27, 2012
80
EXCO Resources, Inc.
Consolidated Balance Sheets
| | | | | | | | |
(in thousands) | | December 31,
2011 | | | December 31,
2010 | |
| | |
Assets | | | | | | | | |
Current assets: | | | | | | | | |
Cash and cash equivalents | | $ | 31,997 | | | $ | 44,229 | |
Restricted cash | | | 155,925 | | | | 161,717 | |
Accounts receivable, net: | | | | | | | | |
Oil and natural gas | | | 88,518 | | | | 80,740 | |
Joint interest | | | 170,918 | | | | 104,358 | |
Interest and other | | | 28,488 | | | | 35,594 | |
Inventory | | | 8,345 | | | | 7,876 | |
Derivative financial instruments | | | 164,002 | | | | 73,176 | |
Other | | | 29,815 | | | | 12,770 | |
| | | | | | | | |
Total current assets | | | 678,008 | | | | 520,460 | |
| | | | | | | | |
Equity investments | | | 302,833 | | | | 379,001 | |
Oil and natural gas properties (full cost accounting method): | | | | | | | | |
Unproved oil and natural gas properties and development costs not being amortized | | | 667,342 | | | | 599,409 | |
Proved developed and undeveloped oil and natural gas properties | | | 3,392,146 | | | | 2,370,962 | |
Accumulated depletion | | | (1,657,165 | ) | | | (1,312,216 | ) |
| | | | | | | | |
Oil and natural gas properties, net | | | 2,402,323 | | | | 1,658,155 | |
| | | | | | | | |
Gas gathering assets | | | 136,203 | | | | 157,929 | |
Accumulated depreciation and amortization | | | (29,104 | ) | | | (24,772 | ) |
| | | | | | | | |
Gas gathering assets, net | | | 107,099 | | | | 133,157 | |
| | | | | | | | |
Office, field, and other equipment, net | | | 42,384 | | | | 43,149 | |
Deferred financing costs, net | | | 29,622 | | | | 30,704 | |
Derivative financial instruments | | | 11,034 | | | | 23,722 | |
Goodwill | | | 218,256 | | | | 218,256 | |
Deposits on acquisitions | | | 0 | | | | 464,151 | |
Other assets | | | 28 | | | | 6,665 | |
| | | | | | | | |
Total assets | | $ | 3,791,587 | | | $ | 3,477,420 | |
| | | | | | | | |
See accompanying notes.
81
EXCO Resources, Inc.
Consolidated Balance Sheets
| | | | | | | | |
(in thousands, except per share and share data) | | December 31,
2011 | | | December 31,
2010 | |
| | |
Liabilities and shareholders’ equity | | | | | | | | |
Current liabilities: | | | | | | | | |
Accounts payable and accrued liabilities | | $ | 117,968 | | | $ | 152,999 | |
Revenues and royalties payable | | | 148,926 | | | | 108,830 | |
Accrued interest payable | | | 17,973 | | | | 18,983 | |
Current portion of asset retirement obligations | | | 732 | | | | 900 | |
Income taxes payable | | | 0 | | | | 211 | |
Derivative financial instruments | | | 1,800 | | | | 3,775 | |
| | | | | | | | |
Total current liabilities | | | 287,399 | | | | 285,698 | |
| | | | | | | | |
Long-term debt | | | 1,887,828 | | | | 1,588,269 | |
Deferred income taxes | | | 0 | | | | 0 | |
Derivative financial instruments | | | 0 | | | | 4,200 | |
Asset retirement obligations and other long-term liabilities | | | 58,028 | | | | 58,701 | |
Commitments and contingencies | | | — | | | | — | |
Shareholders’ equity: | | | | | | | | |
Preferred stock, $0.001 par value; authorized shares - 10,000,000; none issued and outstanding | | | 0 | | | | 0 | |
Common stock, $0.001 par value; 350,000,000 authorized shares; | | | | | | | | |
217,245,504 shares issued and 216,706,283 shares outstanding at December 31, 2011; 213,736,266 shares issued and 213,197,045 shares outstanding at December 31, 2010 | | | 215 | | | | 214 | |
Additional paid-in capital | | | 3,181,063 | | | | 3,151,513 | |
Accumulated deficit | | | (1,615,467 | ) | | | (1,603,696 | ) |
Treasury stock, at cost; 539,221 shares at December 31, 2011 and December 31, 2010 | | | (7,479 | ) | | | (7,479 | ) |
| | | | | | | | |
Total shareholders’ equity | | | 1,558,332 | | | | 1,540,552 | |
| | | | | | | | |
Total liabilities and shareholders’ equity | | $ | 3,791,587 | | | $ | 3,477,420 | |
| | | | | | | | |
See accompanying notes.
82
EXCO Resources, Inc.
Consolidated Statements of Operations
| | | | | | | | | | | | |
| | | Years ended December 31, | |
(in thousands, except per share data) | | 2011 | | | 2010 | | | 2009 | |
Revenues: | | | | | | | | | | | | |
Oil and natural gas | | $ | 754,201 | | | $ | 515,226 | | | $ | 550,505 | |
Midstream | | | — | | | | — | | | | 35,330 | |
| | | | | | | | | | | | |
Total revenues | | | 754,201 | | | | 515,226 | | | | 585,835 | |
| | | | | | | | | | | | |
Costs and expenses: | | | | | | | | | | | | |
Oil and natural gas operating costs | | | 84,766 | | | | 84,145 | | | | 138,659 | |
Midstream operating | | | — | | | | — | | | | 35,580 | |
Production and ad valorem taxes | | | 23,875 | | | | 24,039 | | | | 38,970 | |
Gathering and transportation | | | 86,881 | | | | 54,877 | | | | 18,960 | |
Depreciation, depletion and amortization | | | 362,956 | | | | 196,963 | | | | 221,438 | |
Write-down of oil and natural gas properties | | | 233,239 | | | | 0 | | | | 1,293,579 | |
Accretion of discount on asset retirement obligations | | | 3,652 | | | | 3,758 | | | | 7,132 | |
General and administrative | | | 104,618 | | | | 105,114 | | | | 99,177 | |
(Gain) loss on divestitures and other operating items | | | 23,819 | | | | (509,872 | ) | | | (676,434 | ) |
| | | | | | | | | | | | |
Total costs and expenses | | | 923,806 | | | | (40,976 | ) | | | 1,177,061 | |
| | | | | | | | | | | | |
Operating income (loss) | | | (169,605 | ) | | | 556,202 | | | | (591,226 | ) |
Other income (expense): | | | | | | | | | | | | |
Interest expense | | | (61,023 | ) | | | (45,533 | ) | | | (147,161 | ) |
Gain on derivative financial instruments | | | 219,730 | | | | 146,516 | | | | 232,025 | |
Other income | | | 788 | | | | 327 | | | | 126 | |
Equity income (loss) | | | 32,706 | | | | 16,022 | | | | (69 | ) |
| | | | | | | | | | | | |
Total other income (expense) | | | 192,201 | | | | 117,332 | | | | 84,921 | |
| | | | | | | | | | | | |
Income (loss) before income taxes | | | 22,596 | | | | 673,534 | | | | (506,305 | ) |
Income tax expense (benefit) | | | 0 | | | | 1,608 | | | | (9,501 | ) |
| | | | | | | | | | | | |
Net income (loss) | | $ | 22,596 | | | $ | 671,926 | | | $ | (496,804 | ) |
| | | | | | | | | | | | |
Earnings per common share: | | | | | | | | | | | | |
Basic | | | | | | | | | | | | |
Net income (loss) | | $ | 0.11 | | | $ | 3.16 | | | $ | (2.35 | ) |
| | | | | | | | | | | | |
Weighted average common shares outstanding | | | 213,908 | | | | 212,465 | | | | 211,266 | |
| | | | | | | | | | | | |
| | | |
Diluted | | | | | | | | | | | | |
Net income (loss) | | $ | 0.10 | | | $ | 3.11 | | | $ | (2.35 | ) |
| | | | | | | | | | | | |
Weighted average common and common equivalent shares outstanding | | | 216,705 | | | | 215,735 | | | | 211,266 | |
| | | | | | | | | | | | |
See accompanying notes.
83
EXCO Resources, Inc.
Consolidated Statements of Cash Flows
| | | | | | | | | | | | |
| | | Years Ended December 31, | |
(in thousands) | | 2011 | | | 2010 | | | 2009 | |
Operating Activities: | | | | | | | | | | | | |
Net income (loss) | | $ | 22,596 | | | $ | 671,926 | | | $ | (496,804 | ) |
Adjustments to reconcile net income (loss) to net cash provided by operating activities: | | | | | | | | | | | | |
Depreciation, depletion and amortization | | | 362,956 | | | | 196,963 | | | | 221,438 | |
Share-based compensation | | | 11,012 | | | | 16,841 | | | | 18,987 | |
Accretion of discount on asset retirement obligations | | | 3,652 | | | | 3,758 | | | | 7,132 | |
Gain on divestitures | | | (479 | ) | | | (528,888 | ) | | | (691,932 | ) |
Write-down of oil and natural gas properties and other impairment losses on long-lived assets | | | 240,039 | | | | 0 | | | | 1,293,579 | |
Income from equity investments | | | (32,706 | ) | | | (16,022 | ) | | | 69 | |
Non-cash change in fair value of derivatives | | | (84,313 | ) | | | 68,921 | | | | 238,577 | |
Cash settlements of assumed derivatives | | | 0 | | | | 907 | | | | (182,952 | ) |
Deferred income taxes | | | 0 | | | | 0 | | | | (9,371 | ) |
Amortization of deferred financing costs; discount on the 2018 Notes and premium on the 2011 Notes | | | 9,759 | | | | 5,014 | | | | 48,159 | |
Effect of changes in: | | | | | | | | | | | | |
Accounts receivable | | | (79,359 | ) | | | (136,417 | ) | | | 34,998 | |
Other current assets | | | (5,961 | ) | | | 1,188 | | | | (2,325 | ) |
Accounts payable and other current liabilities | | | (18,653 | ) | | | 55,730 | | | | (45,950 | ) |
| | | | | | | | | | | | |
Net cash provided by operating activities | | | 428,543 | | | | 339,921 | | | | 433,605 | |
| | | | | | | | | | | | |
Investing Activities: | | | | | | | | | | | | |
Additions to oil and natural gas properties, gathering systems and equipment | | | (984,085 | ) | | | (519,206 | ) | | | (664,292 | ) |
Property acquisitions | | | (753,286 | ) | | | (522,765 | ) | | | (68,404 | ) |
Restricted cash | | | 5,792 | | | | (102,808 | ) | | | (58,909 | ) |
Deposit on acquisitions | | | 464,151 | | | | (464,151 | ) | | | 0 | |
Equity investments | | | (13,829 | ) | | | (143,740 | ) | | | (47,500 | ) |
Return of investment in equity investments | | | 125,000 | | | | 0 | | | | 0 | |
Proceeds from disposition of property and equipment | | | 449,683 | | | | 1,044,833 | | | | 2,074,380 | |
Advances to Appalachia JV | | | (1,707 | ) | | | (5,017 | ) | | | 0 | |
Other | | | (1,250 | ) | | | 0 | | | | 0 | |
| | | | | | | | | | | | |
Net cash provided by (used in) investing activities | | | (709,531 | ) | | | (712,854 | ) | | | 1,235,275 | |
| | | | | | | | | | | | |
Financing Activities: | | | | | | | | | | | | |
Borrowings under credit agreements | | | 706,000 | | | | 2,072,399 | | | | 247,799 | |
Repayments under credit agreements | | | (407,500 | ) | | | (1,970,963 | ) | | | (2,067,671 | ) |
Proceeds from issuance of 2018 Notes | | | 0 | | | | 738,975 | | | | 0 | |
Repayment of 2011 Notes | | | 0 | | | | (444,720 | ) | | | 0 | |
Proceeds from issuance of common stock | | | 12,063 | | | | 23,024 | | | | 10,361 | |
Payment of common stock dividends | | | (34,238 | ) | | | (29,760 | ) | | | (10,582 | ) |
Payments for common shares repurchased | | | 0 | | | | (7,479 | ) | | | 0 | |
Settlements of derivative financial instruments with a financing element | | | 0 | | | | (907 | ) | | | 182,952 | |
Deferred financing costs and other | | | (7,569 | ) | | | (31,814 | ) | | | (20,471 | ) |
| | | | | | | | | | | | |
Net cash provided by (used in) financing activities | | | 268,756 | | | | 348,755 | | | | (1,657,612 | ) |
| | | | | | | | | | | | |
Net increase (decrease) in cash | | | (12,232 | ) | | | (24,178 | ) | | | 11,268 | |
Cash at beginning of period | | | 44,229 | | | | 68,407 | | | | 57,139 | |
| | | | | | | | | | | | |
Cash at end of period | | $ | 31,997 | | | $ | 44,229 | | | $ | 68,407 | |
| | | | | | | | | | | | |
| | | |
Supplemental Cash Flow Information: | | | | | | | | | | | | |
Cash interest payments | | $ | 78,125 | | | $ | 54,523 | | | $ | 112,560 | |
| | | | | | | | | | | | |
Income tax payments | | $ | 1,458 | | | $ | 5,460 | | | $ | 0 | |
| | | | | | | | | | | | |
Supplemental non-cash investing and financing activities: | | | | | | | | | | | | |
Capitalized stock option compensation | | $ | 6,406 | | | $ | 6,351 | | | $ | 5,066 | |
| | | | | | | | | | | | |
Capitalized interest | | $ | 30,083 | | | $ | 20,829 | | | $ | 5,840 | |
| | | | | | | | | | | | |
Issuance of common stock for director services | | $ | 70 | | | $ | 61 | | | $ | 59 | |
| | | | | | | | | | | | |
See accompanying notes.
84
EXCO Resources, Inc.
Consolidated Statements of Changes in Shareholders’ Equity
| | | | | | | | | | | | | | | | | | | | | | | | | | | | |
| | | Common Stock | | | Treasury Stock | | | Additional
paid-in
capital | | | Retained
earnings
(deficit) | | | Total
shareholders’
equity | |
(in thousands ) | | Shares | | | Amount | | | Shares | | | Amount | | | | |
Balance at December 31, 2008 | | | 210,969 | | | $ | 211 | | | | — | | | $ | — | | | $ | 3,070,766 | | | $ | (1,738,476 | ) | | $ | 1,332,501 | |
Issuance of common stock | | | 936 | | | | 1 | | | | | | | | | | | | 10,419 | | | | | | | | 10,420 | |
Share-based compensation | | | | | | | | | | | | | | | | | | | 24,053 | | | | | | | | 24,053 | |
Common stock dividends | | | | | | | | | | | | | | | | | | | | | | | (10,582 | ) | | | (10,582 | ) |
Net income (loss) | | | | | | | | | | | | | | | | | | | | | | | (496,804 | ) | | | (496,804 | ) |
| | | | | | | | | | | | | | | | | | | | | | | | | | | | |
Balance at December 31, 2009 | | | 211,905 | | | $ | 212 | | | | — | | | $ | — | | | $ | 3,105,238 | | | $ | (2,245,862 | ) | | $ | 859,588 | |
| | | | | | | | | | | | | | | | | | | | | | | | | | | | |
Issuance of common stock | | | 1,831 | | | | 2 | | | | | | | | | | | | 23,083 | | | | | | | | 23,085 | |
Share-based compensation | | | | | | | | | | | | | | | | | | | 23,192 | | | | | | | | 23,192 | |
Common stock dividends | | | | | | | | | | | | | | | | | | | | | | | (29,760 | ) | | | (29,760 | ) |
Treasury stock | | | | | | | | | | | (539 | ) | | | (7,479 | ) | | | | | | | | | | | (7,479 | ) |
Net income | | | | | | | | | | | | | | | | | | | | | | | 671,926 | | | | 671,926 | |
| | | | | | | | | | | | | | | | | | | | | | | | | | | | |
Balance at December 31, 2010 | | | 213,736 | | | $ | 214 | | | | (539 | ) | | $ | (7,479 | ) | | $ | 3,151,513 | | | $ | (1,603,696 | ) | | $ | 1,540,552 | |
| | | | | | | | | | | | | | | | | | | | | | | | | | | | |
Issuance of common stock | | | 946 | | | | 1 | | | | | | | | | | | | 12,132 | | | | | | | | 12,133 | |
Share-based compensation | | | | | | | | | | | | | | | | | | | 17,418 | | | | | | | | 17,418 | |
Restricted stock issued, net of cancellations | | | 2,563 | | | | 0 | | | | | | | | | | | | 0 | | | | | | | | 0 | |
Common stock dividends | | | | | | | | | | | | | | | | | | | | | | | (34,367 | ) | | | (34,367 | ) |
Net income | | | | | | | | | | | | | | | | | | | | | | | 22,596 | | | | 22,596 | |
| | | | | | | | | | | | | | | | | | | | | | | | | | | | |
Balance at December 31, 2011 | | | 217,245 | | | $ | 215 | | | | (539 | ) | | $ | (7,479 | ) | | $ | 3,181,063 | | | $ | (1,615,467 | ) | | $ | 1,558,332 | |
| | | | | | | | | | | | | | | | | | | | | | | | | | | | |
See accompanying notes.
85
EXCO Resources, Inc.
Notes to consolidated financial statements
Unless the context requires otherwise, references in this Annual Report on Form 10-K to “EXCO,” “EXCO Resources,” “Company,” “we,” “us,” and “our” are to EXCO Resources, Inc., and its consolidated subsidiaries.
We are an independent oil and natural gas company engaged in the exploration, exploitation, development and production of onshore U.S. oil and natural gas properties. Our principal operations are conducted in key U.S. oil and natural gas areas including East Texas, North Louisiana, Appalachia and the Permian Basin in West Texas. In addition to our oil and natural gas producing operations, we own 50% interests in two midstream joint ventures located in East Texas/North Louisiana and Appalachia, respectively. Our midstream joint ventures are treated as a separate business segment.
Our primary strategy is to appraise, develop and exploit our Haynesville, Bossier and Marcellus shale resources, primarily through horizontal drilling, and to leverage our complementary midstream gathering facilities to promptly transport our production to multiple market outlets. We continue to develop vertical drilling opportunities in our Permian Basin area as this region has high oil reserves and natural gas with a high liquid content. Our shale resource plays and midstream operations are conducted through four joint ventures with affiliates of BG Group, plc, or BG Group. A brief description of each joint venture follows:
| | • | | East Texas/North Louisiana JV |
A joint venture with BG Group covering an undivided 50% interest in a substantial portion of our assets in the East Texas/North Louisiana area including the Haynesville/Bossier shale and conventional shallow producing assets, or the East Texas/North Louisiana JV. The East Texas/North Louisiana JV is governed by a joint development agreement with our subsidiary, EXCO Operating Company, LP, or EXCO Operating, serving as operator. Under the terms of the agreement, BG Group funded 75% of our share of deep drilling and completion costs within our joint venture area up to a total of $400.0 million, or the East Texas/North Louisiana Carry. During the first quarter of 2011, we utilized the balance of the East Texas/North Louisiana Carry. We report the operating results and financial position of the East Texas/North Louisiana JV using proportional consolidation.
A joint venture with BG Group in which we each own a 50% interest in TGGT Holdings, LLC, or TGGT, which holds most of our East Texas/North Louisiana midstream assets. We use the equity method to account for our 50% investment in TGGT.
A 50/50 joint venture with BG Group covering our shallow producing assets and Marcellus shale acreage in the Appalachia region, or the Appalachia JV. EXCO and BG Group jointly operate the Appalachia JV operations through a 50% jointly owned operating entity, or OPCO, which holds a 0.5% working interest in all of the shallow conventional assets and the deep rights in the Appalachia JV. Under the terms of the agreement, BG Group agreed to fund 75% of our share of deep drilling and completion costs within our joint venture area up to a total of $150.0 million, or the Appalachia Carry. As of December 31, 2011, the remaining balance of the Appalachia Carry was approximately $54.6 million. We use the equity method to account for our investment in OPCO and proportionally consolidate our 49.75% interest in the Appalachia area oil and natural gas exploration, development and production.
| | • | | Appalachia Midstream JV |
A joint venture with BG Group in which we each own a 50% interest in a midstream company, or the Appalachia Midstream JV, which will develop infrastructure and provide take-away capacity in the Marcellus shale. We use the equity method to account for our 50% investment in the Appalachia Midstream JV.
86
Our acquisition strategy for the past several years has been focused on the shale resources and consisted primarily of undeveloped acreage acquisitions. We have entered into the manufacturing phase in DeSoto Parish area of the Haynesville shale, or DeSoto Parish, and have substantially completed our drilling activities to hold our acreage positions in our Shelby, Nacogdoches and San Augustine Counties in East Texas, or the Shelby Area. Our Marcellus shale areas of interest have been identified and we have begun a development program in Northeast Pennsylvania. While we expect to continue to seek acquisition opportunities in our Haynesville/Bossier and Marcellus shale areas, we have deployed our business development and technical staff to evaluate opportunities in new areas.
The accompanying Consolidated Balance Sheets as of December 31, 2011 and 2010, Consolidated Statements of Operations, Consolidated Cash Flows and Consolidated Changes in Shareholders’ Equity for the years ended December 31, 2011, 2010 and 2009 are for EXCO and its subsidiaries. The consolidated financial statements and related footnotes are presented in accordance with generally accepted accounting principles in the United States, or GAAP.
| 2. | Summary of significant accounting policies |
Principles of consolidation
We consolidate all of our subsidiaries in the accompanying Consolidated Balance Sheets as of December 31, 2011 and 2010 and the Consolidated Statements of Operations and Consolidated Statements of Cash Flows and Changes in Shareholders’ Equity for the years ended December 31, 2011, 2010 and 2009. Investments in unconsolidated affiliates in which we are able to exercise significant influence are accounted for using the equity method. All intercompany transactions and accounts have been eliminated.
Management estimates
In preparing financial statements in conformity with GAAP, we are required to make estimates and assumptions that affect the reported amounts of assets, liabilities, revenues and expenses during the reporting periods. The more significant estimates pertain to proved oil and natural gas reserve volumes, future development costs, dismantlement and abandonment costs, share-based compensation expenses, estimates relating to oil and natural gas revenues and expenses, the fair market value of assets and liabilities acquired in business combinations, derivatives, goodwill and equity securities. Actual results may differ from management’s estimates.
Cash equivalents
We consider all highly liquid investments with maturities of three months or less when purchased, to be cash equivalents.
Restricted cash
The restricted cash on our balance sheet is principally comprised of our share of an evergreen escrow account with BG Group that is used to fund our share of development operations in the East Texas/North Louisiana JV. Funds held in this escrow account are restricted and can be used solely for drilling and operations for the East Texas/North Louisiana JV.
Concentration of credit risk and accounts receivable
Financial instruments that potentially subject us to a concentration of credit risk consist principally of cash, trade receivables and our derivative financial instruments. We place our cash with financial institutions which we believe have sufficient credit quality to minimize risk of loss. We sell oil and natural gas to various customers. In addition, we participate with other parties in the drilling, completion and operation of oil and natural gas wells. The majority of our accounts receivable are due from either purchasers of oil or natural gas or participants in oil and natural gas wells for which we serve as the operator. We have the right to offset future revenues against unpaid charges related to wells which we operate. Oil and natural gas receivables are generally uncollateralized. The allowance for doubtful accounts receivable aggregated $0.7 million and $0.5 million at December 31, 2011 and 2010, respectively. We place our derivative financial instruments with financial institutions and other firms that we believe have high credit ratings. To mitigate our risk of loss due to default, we have entered into master netting agreements with our counterparties on our derivative financial instruments that allow us to offset our asset position with our liability position in the event of a default by the counterparty.
For the year ended December 31, 2011, sales to BG Energy Merchants LLC accounted for approximately 36.0% of total consolidated revenues. For the year ended December 31, 2010, sales to BG Energy Merchants LLC and Louis Dreyfus Energy Services LP accounted for approximately 21.5% and 10.1%, respectively, of total consolidated revenues. BG Energy Merchants LLC is a subsidiary of BG Group. For the year ended December 31, 2009 there were no sales to any individual customer that exceeded 10% of our consolidated revenues.
87
Derivative financial instruments
In connection with the incurrence of debt related to our exploration, exploitation, development, acquisition and producing activities, our management has adopted a policy of entering into oil and natural gas derivative financial instruments to mitigate the impacts of commodity price fluctuations and to achieve a more predictable cash flow. Financial Accounting Standards Board, or FASB, Accounting Standards Codification, or ASC, Topic 815, Divestitures and Hedging, or ASC 815, requires that every derivative instrument (including certain derivative instruments embedded in other contracts) be recorded on the balance sheet as either an asset or liability measured at its estimated fair value. ASC 815 requires that changes in the derivative’s estimated fair value be recognized currently in earnings unless specific hedge accounting criteria are met, or exemptions for normal purchases and normal sales as permitted by ASC 815 exist. We do not designate our derivative financial instruments as hedging instruments and, as a result, recognize the change in a derivative’s estimated fair value currently in earnings as a component of other income or expense.
Oil and natural gas properties
The accounting for, and disclosure of, oil and natural gas producing activities require that we choose between two GAAP alternatives; the full cost method or the successful efforts method. We use the full cost method of accounting, which involves capitalizing all exploration, exploitation, development and acquisition costs. Once we incur costs, they are recorded in the depletable pool of proved properties or in unproved properties, collectively, the full cost pool. Our unproved property costs, which include unproved oil and gas properties, properties under development, and major development projects, collectively totaled $667.3 million and $599.4 million as of December 31, 2011 and 2010, respectively, and are not subject to depletion. We review our unproved oil and natural gas property costs on a quarterly basis to assess for impairment and transfer unproved costs to proved properties as a result of extension or discoveries from drilling operations or determination that no Proved Reserves are attributable to such costs. We expect these costs to be evaluated in one to seven years and transferred to the depletable portion of the full cost pool during that time. The full cost pool is comprised of intangible drilling costs, lease and well equipment and exploration and development costs incurred plus acquired proved and unproved leaseholds.
When we acquire significant amounts of undeveloped acreage, we capitalize interest on the acquisition costs in accordance with FASB ASC Subtopic 835-20, Capitalization of Interest. We began capitalizing interest in April 2008, upon identification and development of shale resource opportunities in the Haynesville and Marcellus areas. When the unproved property costs are moved to proved developed and undeveloped oil and natural gas properties, or the properties are sold, we cease capitalizing interest.
We calculate depletion using the unit-of-production method. Under this method, the sum of the full cost pool, excluding the book value of unproved properties, and all estimated future development costs, are divided by the total estimated quantities of Proved Reserves. This rate is applied to our total production for the period, and the appropriate expense is recorded. We capitalize the portion of general and administrative costs, including share-based compensation, that is attributable to our exploration, exploitation and development activities.
Sales, dispositions and other oil and natural gas property retirements are accounted for as adjustments to the full cost pool, with no recognition of gain or loss, unless the disposition would significantly alter the amortization rate and/or the relationship between capitalized costs and Proved Reserves. The impacts on our depletion rate from the formation of the Appalachia JV in 2010 and the formation of the East Texas/North Louisiana JV in 2009, along with certain other divestiture transactions in 2009, as discussed in “Note 4. Divestitures, acquisitions and other significant events,” were considered significant and we recognized gains of $528.9 million and $691.9 million in 2010 and 2009, respectively, on our divestitures. There were no sales of oil and natural gas properties in 2011 that resulted in recognition of gains or losses.
Pursuant to Rule 4-10(c)(4) of Regulation S-X, at the end of each quarterly period, companies that use the full cost method of accounting for their oil and natural gas properties must compute a limitation on capitalized costs, or ceiling test. The ceiling test involves comparing the net book value of the full cost pool, after taxes, to the full cost ceiling limitation defined below. In the event the full cost ceiling limitation is less than the full cost pool, a ceiling test write-down of oil and natural gas properties to the value of the full cost ceiling limitation is required. The full cost ceiling limitation is computed as the sum of the present value of estimated future net revenues from our Proved Reserves by applying average prices as prescribed by the Securities and Exchange Commission, or SEC, Release No. 33-8995, less estimated future expenditures (based on current costs) to develop and produce the Proved Reserves, discounted at 10%, plus the cost of properties not being amortized and the lower of cost or estimated fair value of unproved properties included in the costs being amortized, net of income tax effects.
The ceiling test is computed using the simple average spot price for the trailing twelve month period using the first day of each month. For the twelve months ended December 31, 2011, the trailing twelve month reference price was $96.19 per Bbl for the West Texas Intermediate oil at Cushing, Oklahoma and $4.12 per Mmbtu for natural gas at Henry Hub. Each of the reference prices
88
for oil and natural gas are further adjusted for quality factors and regional differentials to derive estimated future net revenues. Under full cost accounting rules, any ceiling test write-downs of oil and natural gas properties may not be reversed in subsequent periods. Since we do not designate our derivative financial instruments as hedges, we are not allowed to use the impacts of the derivative financial instruments in our ceiling test computation.
The ceiling test calculation is based upon estimates of Proved Reserves. There are numerous uncertainties inherent in estimating quantities of Proved Reserves, in projecting the future rates of production and in the timing of development activities. The accuracy of any reserve estimate is a function of the quality of available data and of engineering and geological interpretation and judgment. Results of drilling, testing and production subsequent to the date of the estimate may justify revision of such estimate. Accordingly, reserve estimates are often different from the quantities of oil and natural gas that are ultimately recovered.
Write-down of oil and natural gas properties
For the year ended December 31, 2011, we recognized a ceiling test write-down in the fourth quarter of 2011 of $233.2 million to our proved oil and natural gas properties. There were no ceiling test write-downs during the year ended December 31, 2010. For the year ended December 31, 2009, we recognized a ceiling test write-down of $1.3 billion to our proved oil and natural gas properties.
Gas gathering assets
Gas gathering assets are capitalized at cost and depreciated on a straight line basis over their estimated useful lives of 25 to 40 years.
During 2011, we sold certain treating facilities in our Vernon Field and recognized a $6.8 million impairment to write the book values down to the selling price.
Inventory
Inventory includes tubular goods and other lease and well equipment which we plan to utilize in our ongoing exploration and development activities and is carried at the lower of cost or market. The inventory is capitalized to our full cost pool or gathering system assets once it has been placed into service.
Office, field and other equipment
Office, field and other equipment are capitalized at cost and depreciated on a straight line basis over their estimated useful lives. Office, field, and other equipment useful lives range from 3 to 15 years.
Goodwill
In accordance with FASB ASC Subtopic 350-20, Intangibles-Goodwill and Other, goodwill is not amortized, but is tested for impairment on an annual basis, or more frequently as impairment indicators arise. Impairment tests, which involve the use of estimates related to the fair market value of the business operations with which goodwill is associated, are performed as of December 31 of each year. Losses, if any, resulting from impairment tests will be reflected in operating income in the Consolidated Statement of Operations.
To determine the fair value of our exploration and production reporting unit, a two-part, equally weighted approach is applied. We perform an income approach, which uses a discounted cash flow model to value our business, and a market approach, in which our value is determined using trading metrics and transaction multiples of peer companies.
As a result of testing, the fair value of the business exceeded the carrying value of net assets and we did not record an impairment charge for the periods ending December 31, 2011, 2010 or 2009.
The Appalachia JV and the East Texas/North Louisiana JV and other 2009 divestitures discussed in “Note 4. Divestitures, acquisitions and other significant events” caused significant alterations to the depletion rate and the relationship between capitalized costs and Proved Reserves. As a result of their significance, we reduced goodwill by $51.4 million in 2010 and $177.6 million in 2009 when computing our gains on those transactions. In addition, the TGGT Transaction, as discussed in “Note 4. Divestitures, acquisitions and other significant events,” resulted in a reduction of $11.4 million in goodwill against the associated gain and the transfer of $11.4 million of goodwill to the equity investment in TGGT.
89
The balance of goodwill as of December 31, 2011 and 2010 was $218.3 million.
Deferred abandonment and asset retirement obligations
We apply FASB ASC Subtopic 410-20, Asset Retirement and Environmental Obligations, or ASC 410-20, to account for estimated future plugging and abandonment costs. ASC 410-20 requires legal obligations associated with the retirement of long-lived assets to be recognized at their estimated fair value at the time that the obligations are incurred. Upon initial recognition of a liability, that cost is capitalized as part of the related long-lived asset and allocated to expense over the useful life of the asset. Our asset retirement obligations primarily represents the present value of the estimated amount we will incur to plug, abandon and remediate our proved producing properties at the end of their productive lives, in accordance with applicable state laws.
The following is a reconciliation of our asset retirement obligations for the periods indicated:
| | | | | | | | | | | | |
| | | December 31, | |
(in thousands) | | 2011 | | | 2010 | | | 2009 | |
Asset retirement obligations at beginning of period | | $ | 50,292 | | | $ | 65,115 | | | $ | 120,671 | |
Activity during the period: | | | | | | | | | | | | |
Adjustment to liability due to acquisitions | | | 1,684 | | | | 11 | | | | 389 | |
Liabilities incurred during period | | | 3,765 | | | | 1,936 | | | | 879 | |
Liabilities settled during period | | | (291 | ) | | | (503 | ) | | | (5,455 | ) |
Reduction to retirement obligations due to divestitures | | | (1,014 | ) | | | (20,025 | ) | | | (58,501 | ) |
Accretion of discount | | | 3,652 | | | | 3,758 | | | | 7,132 | |
| | | | | | | | | | | | |
Asset retirement obligations at end of period | | | 58,088 | | | | 50,292 | | | | 65,115 | |
Less current portion | | | 732 | | | | 900 | | | | 900 | |
| | | | | | | | | | | | |
Long-term portion | | $ | 57,356 | | | $ | 49,392 | | | $ | 64,215 | |
| | | | | | | | | | | | |
We have no assets that are legally restricted for purposes of settling asset retirement obligations.
Revenue recognition and gas imbalances
We use the sales method of accounting for oil and natural gas revenues. Under the sales method, revenues are recognized based on actual volumes of oil and natural gas sold to purchasers. A majority of our natural gas imbalances were concentrated in our Mid-Continent properties, which we sold during 2009, as discussed in “Note 4. Divestitures, acquisitions and other significant events—Gas imbalances” at December 31, 2011, 2010 and 2009 and were not significant.
Gathering and transportation
We generally sell oil and natural gas under two types of agreements which are common in our industry. Both types of agreements include a transportation charge. One is a netback arrangement, under which we sell oil or natural gas at the wellhead and collect a price, net of the transportation incurred by the purchaser. In this case, we record sales at the price received from the purchaser, net of the transportation costs. Under the other arrangement, we sell oil or natural gas at a specific delivery point, pay transportation to a third party and receive proceeds from the purchaser with no transportation deduction. In this case, we record the transportation cost as gathering and transportation expense. Due to these two distinct selling arrangements, our computed realized prices, before the impact of derivative financial instruments, include revenues which are reported under two separate bases.
As a result of the formation of TGGT in 2009, the net operating results from our gathering system in North Louisiana that supports our Vernon Field operations, which was previously reported within our midstream segment, is now reported as a component of “Gathering and transportation” in the Consolidated Statements of Operations.
Gathering and transportation expenses totaled $86.9 million, $54.9 million and $19.0 million for the years ended December 31, 2011, 2010 and 2009, respectively. The overall increase in gathering and transportation expenses from 2010 to 2011 is a result of increased volumes, while the increase from 2009 to 2010 is a result of increased volumes, new firm transportation agreements in the Haynesville area and fees charged by TGGT.
We have entered into firm transportation agreements with pipeline companies to facilitate sales as we expand our Haynesville volumes and report these firm transportation costs as a component of gathering and transportation expenses. At the end of 2011, our firm transportation agreements covered an average of 830 Mmcf per day of with average annual minimum gathering and transportation expenses of approximately $91.0 million. We have similar commitments through 2021.
90
Capitalization of internal costs
We capitalize as part of our proved developed oil and natural gas properties a portion of salaries and related share-based compensation for employees who are directly involved in the acquisition and development of oil and natural gas properties. During the years ended December 31, 2011, 2010 and 2009, we capitalized $22.9 million, $19.8 million and $18.3 million, respectively. The capitalized amounts include $6.4 million, $6.4 million and $5.1 million of share-based compensation for the years ended December 31, 2011, 2010 and 2009, respectively.
Overhead reimbursement fees
We have classified fees from overhead charges billed to working interest owners, including ourselves, of $18.4 million, $16.2 million and $24.6 million, for the years ended December 31, 2011, 2010 and 2009, respectively, as a reduction of general and administrative expenses in the accompanying Consolidated Statements of Operations. Our share of these charges was $9.6 million, $8.8 million and $16.6 million for the years ended December 31, 2011, 2010 and 2009, respectively, and are classified as oil and natural gas production costs.
In addition, we have agreements with BG Group that allow us to bill each other certain personnel costs and related fees incurred on behalf of the East Texas/North Louisiana JV and the Appalachia JV. For the years ended 2011, 2010 and 2009, general and administrative expenses were reduced by $29.1 million, $23.5 million and $4.9 million, respectively, for recoveries of fees for our personnel and services provided to our joint ventures. These recoveries are net of fees charged to us by BG Group for their personnel and services.
Environmental costs
Environmental costs that relate to current operations are expensed as incurred. Remediation costs that relate to an existing condition caused by past operations are accrued when it is probable that those costs will be incurred and can be reasonably estimated based upon evaluations of currently available facts related to each site.
Income taxes
Income taxes are accounted for using the liability method of accounting in accordance with FASB ASC Topic 740, Income Taxes, under which deferred income taxes are recognized for the future tax effects of temporary differences between the financial statement carrying amounts and the tax basis of existing assets and liabilities using the enacted statutory tax rates in effect at year-end. The effect on deferred taxes for a change in tax rates is recognized in income in the period that includes the enactment date. A valuation allowance for deferred tax assets is recorded when it is more likely than not that the benefit from the deferred tax asset will not be realized.
Earnings per share
We account for earnings per share in accordance with FASB ASC Subtopic 260-10, Earnings Per Share, or ASC 260-10. ASC 260-10 requires companies to present two calculations of earnings per share, or EPS; basic and diluted. Basic earnings per common share is based on the weighted average number of common shares outstanding during the period. Diluted earnings per common share is computed in the same manner as basic earnings per share after assuming issuance of common stock for all potentially dilutive equivalent shares, whether vested, exercisable or not.
Share-based compensation
We account for our share-based compensation in accordance with FASB ASC Topic 718, Compensation—Stock Compensation. ASC 718 requires all share-based payments to employees, including grants of employee stock options and restricted stock, to be recognized in our Consolidated Statements of Operations based on their estimated fair values. We recognize expense on a straight-line basis over the vesting period of the option.
Our 2005 Long-Term Incentive Plan, as amended, or the 2005 Incentive Plan, provides for the granting of options and other equity incentive awards up to 28,500,000 shares of our common stock in accordance with terms within the agreements. New shares will be issued for any options exercised or awards granted. Under the 2005 Incentive Plan, we have only issued stock options and restricted stock, although the plan allows for other share-based awards.
91
| 3. | Recent accounting pronouncements |
On May 12, 2011, the Financial Accounting Standards Board, or the FASB, issued Accounting Standards Update, or ASU, No. 2011-04, Fair Value Measurement (Topic 820): Amendments to Achieve Common Fair Value Measurement and Disclosure Requirements in U.S. GAAP and IFRS, or ASU 2011-04. ASU 2011-04 clarifies the FASB’s intent about the application of existing fair value measurement requirements and changes particular principles or requirements for measuring fair value or for disclosing information about fair value measurements. We anticipate the update will impact our fair value disclosures. This update is effective during interim and annual periods beginning after December 15, 2011, at which time we will adopt the update.
On June 16, 2011, the FASB issued ASU No. 2011-05, Comprehensive Income (Topic 220): Presentation of Comprehensive Income, or ASU 2011-05. ASU 2011-05 requires entities to report items of other comprehensive income on either part of a single contiguous statement of comprehensive income or in a separate statement of comprehensive income immediately following the statement of income. On December 23, 2011, the FASB issued an update to this pronouncement, ASU No. 2011-12, Comprehensive Income (Topic 220): Deferral of the Effective Date for Amendments to the Presentation of Reclassifications of Items Out of Accumulated Other Comprehensive Income in Accounting Standards Update No. 2011-05, or ASU 2011-12. ASU 2011-12 defers the specific requirement to present items that are reclassified from accumulated other comprehensive income to net income separately with their respective components of net income and other comprehensive income. While early adoption is permitted, the amendments are effective for fiscal years, and interim periods within those years, beginning after December 15, 2011 and must be applied retrospectively. Presently, we do not have any transactions which require the reporting of comprehensive income; therefore, we do not anticipate any immediate impact from this pronouncement.
On September 15, 2011, the FASB issued ASU No. 2011-08, Intangibles—Goodwill and Other (Topic 350): Testing Goodwill for Impairment, or ASU 2011-08. ASU 2011-08 allows both public and nonpublic entities an option to first assess qualitative factors to determine whether it is necessary to perform the two-step quantitative goodwill impairment test. An entity would no longer be required to calculate the fair value of a reporting unit unless the entity determines, based on that qualitative assessment, that it is more likely than not that its fair value is less than its carrying amount. ASU 2011-08 allows early adoption and will be effective for annual and interim goodwill impairment tests performed for fiscal years beginning after December 15, 2011. We are presently assessing the impacts of ASU 2011-08.
On December 16, 2011, the FASB issued ASU No. 2011-11, Balance Sheet (Topic 210), Disclosures about Offsetting Assets and Liabilities, or ASU 2011-11. ASU 2011-11 will require entities to disclose both gross information and net information about both instruments and transactions eligible for offset in the statement of financial position and instruments and transactions subject to an agreement similar to a master netting arrangement. Application of ASU 2011-1 is required for annual reporting periods beginning on or after January 1, 2013 and interim periods within those annual periods. At that time we will make the necessary disclosures.
| 4. | Divestitures, acquisitions and other significant events |
2011 Acquisitions and other significant events
Chief transaction
On December 21, 2010, we funded the acquisition of undeveloped acreage and oil and natural gas properties in the Marcellus shale from Chief Oil & Gas LLC and related parties for approximately $459.4 million, subject to post-closing title adjustments and customary post-closing purchase price adjustments, or the Chief Transaction. The $459.4 million preliminary purchase price was initially funded into an escrow account pending receipt of a waiver from a third party, which was received on January 11, 2011. Upon receipt of that waiver, the properties were released to us. On February 7, 2011, BG Group elected to participate in the Chief Transaction and funded $229.7 million for their 50% share of the preliminary purchase price. During the third quarter of 2011 we completed post-closing adjustments on the Chief Transaction resulting in a final purchase price of $454.4 million ($227.2 million net to us).
Appalachia transaction
On March 1, 2011, we jointly closed the purchase of Marcellus shale acreage with BG Group, which also included certain shallow production primarily in Jefferson and Clarion counties in Pennsylvania for $82.0 million ($41.0 million net to us), or the Appalachia Transaction.
92
Haynesville shale acquisition
On April 5, 2011, we purchased land, mineral interests and other assets in DeSoto Parish for $225.2 million, or the Haynesville Shale Acquisition. On May 12, 2011, BG Group elected to participate for its 50% share of the transaction and funded us $112.6 million.
TGGT incident
Late in May 2011 an incident occurred at a TGGT amine treating facility in northwest Red River Parish, Louisiana resulting in an immediate shut-down of the facility. As a precautionary measure, TGGT also shut down another amine treating facility located in DeSoto Parish with similar specifications, which was restarted in October 2011. TGGT has installed temporary treating units and expects to begin treating volumes at the damaged facility during the first quarter of 2012.
Former acquisition proposal
On October 29, 2010, our Chairman and Chief Executive Officer, Douglas H. Miller, presented a letter to our board of directors indicating an interest in acquiring all of the outstanding shares of our stock not already owned by Mr. Miller for a cash purchase price of $20.50 per share. This proposal did not represent a definitive offer and there was no assurance that a definitive offer would be made or accepted, that any agreement would be executed or that any transaction would be consummated.
Our board of directors established a special committee on November 4, 2010 comprised of two of our independent directors to, among other things, evaluate and determine the Company’s response to the October 29, 2010 proposal. On July 8, 2011, after consultation with its independent financial and legal advisors, the special committee released a statement that its review of strategic alternatives did not result in any firm proposal or any other proposal that was in the best interests of the Company and its shareholders and that they had terminated the review process. See “Note 19. Former acquisition proposal” for further information regarding the proposal.
2010 Divestitures and acquisitions
Appalachia JV
On June 1, 2010, we closed a transaction which resulted in the sale of a 50% undivided interest in substantially all of our Appalachian oil and natural gas proved and unproved properties and related assets to BG Group for cash consideration of approximately $835.2 million. Subsequent to closing, we reduced the purchase price by approximately $45.0 million for post-closing adjustments, lowering the sales proceeds to approximately $790.2 million. In addition to the cash consideration received at closing, BG Group agreed to fund 75% of our share of deep drilling and completion costs within our joint venture area until the carry amount is satisfied up to a total of $150.0 million. In conjunction with the Appalachia JV, we entered into a Joint Development Agreement, or the Appalachia JDA, with BG Group. The effective date of the transaction was January 1, 2010.
EXCO and BG Group each own a 50% interest in OPCO, which operates the properties located within the Appalachia JV, subject to oversight from a management board having equal representation from EXCO and BG Group. We make advances to OPCO to provide working capital for our share of properties. These advances are recorded as a prepaid asset and included in “Other” current assets on our Consolidated Balance Sheets and are offset by any payments made by OPCO for our interest in the properties. We use the equity method to account for our 50% interest in OPCO.
In addition to the upstream Appalachia properties, certain midstream assets were transferred to a newly formed, jointly owned entity, Appalachia Midstream, LLC, or Appalachia Midstream, which will pursue construction of gathering systems, pipeline systems and treating facilities for anticipated future production from the Marcellus shale. We use the equity method to account for our 50% interest in Appalachia Midstream.
The sale of oil and natural gas properties in the Appalachia JV resulted in a significant alteration in our depletion rate. Accordingly, in accordance with full cost accounting rules, we recorded a gain, net of a proportionate net reduction in goodwill, of approximately $528.9 million during the year ended December 31, 2010.
93
Common Transaction
On May 14, 2010, along with BG Group, we closed the joint purchase of Common Resources, L.L.C., or the Common Transaction, which owned properties in Shelby, San Augustine and Nacogdoches Counties, Texas in the Haynesville and Bossier shales. The purchase price was approximately $442.1 million ($221.0 million net to EXCO), after final purchase price adjustments. Our share of the acquisition price was financed with borrowings under our credit agreement, or the EXCO Resources Credit Agreement. The development of these assets is governed by the East Texas/North Louisiana JV.
Southwestern Transaction
On June 30, 2010, along with BG Group, we closed the joint purchase of undeveloped acreage and oil and natural gas properties in Shelby, San Augustine and Nacogdoches Counties, Texas in the Haynesville and Bossier shales from Southwestern Energy Company, or the Southwestern Transaction. The purchase price was $357.8 million ($178.9 million net to EXCO), after final purchase price adjustments. Our share of the acquisition price was financed with borrowings under the EXCO Resources Credit Agreement. The development of these assets is governed by the East Texas/North Louisiana JV. The majority of the assets acquired in the Southwestern Transaction represented incremental working interests in properties acquired in the Common Transaction.
2009 Divestitures and acquisitions
During 2009, we completed a $2.1 billion divesture program that allowed us to reduce our outstanding debt and exit our Mid-Continent division.
East Texas Transaction
On August 11, 2009, we closed a sale of properties located in East Texas, or the East Texas Transaction, with Encore Operating, LP, or Encore. Pursuant to the East Texas Transaction, we sold all of our interests in certain oil and natural gas properties located in our Overton Field and Gladewater area of East Texas. We received $154.3 million in cash, after final closing adjustments.
Mid-Continent Transaction
On August 11, 2009, we closed a sale of properties located in Texas and Oklahoma, or the Mid-Continent Transaction, with Encore. Pursuant to the Mid-Continent Transaction, we sold all of our interests in certain oil and natural gas properties located in our Mid-Continent operating area. We received $197.7 million in cash, after final closing adjustments.
East Texas/North Louisiana JV
On August 14, 2009, we closed the East Texas/North Louisiana JV, which included most of our oil and natural gas assets in East Texas/North Louisiana. The East Texas/North Louisiana JV includes agreements governing the joint development and operation of our Haynesville and Bossier shales and shallow oil and natural gas assets located in the area of mutual interest with BG Group, or the BG AMI. We received $713.8 million in cash, after final closing adjustments. Pursuant to this transaction, BG Group also committed to fund the East Texas/North Louisiana Carry of $400.0 million.
TGGT Transaction
On August 14, 2009 we closed the sale to an affiliate of BG Group of a 50% interest in TGGT, a newly formed entity which holds most of our East Texas/North Louisiana midstream assets, or the TGGT Transaction. Our Vernon Field midstream assets were excluded from the TGGT Transaction. TGGT’s subsidiaries include TGG Pipeline, Ltd., or TGG, which owns an intrastate pipeline in East Texas and a gathering system in North Louisiana, and Talco Midstream Assets, Ltd., or Talco, which owns gathering assets in East Texas/North Louisiana. BG Group contributed $269.2 million in cash to TGGT and we received those funds from TGGT via a special distribution at closing. EXCO and an affiliate of BG Group each own 50% of TGGT. We use the equity method of accounting for our interest in TGGT. The TGGT Transaction resulted in recognition of a gain of $98.3 million, net of an allocated reduction of goodwill previously ascribed to our midstream business segment.
The total cash proceeds of $983.0 million from the East Texas/North Louisiana JV and the TGGT Transaction were used to repay a $300.0 million senior unsecured term credit agreement, or the Term Credit Agreement, create an evergreen escrow funding account to develop the Haynesville operations, and fund a working capital contribution to TGGT. The remaining proceeds were used to reduce outstanding balances under our credit agreements.
94
The East Texas/North Louisiana JV, the TGGT Transaction and the Mid-Continent Transaction resulted in recognition of aggregate gains of $460.4 million, net of proportionate reductions to goodwill, during the year ended December 31, 2009.
Sheridan Transaction
On November 10, 2009, we closed the sale of our remaining assets in our Mid-Continent operating area to Sheridan Holding Company I, LLC, or the Sheridan Transaction, for $531.2 million, after final closing adjustments. The sale was effective on October 1, 2009.
Proceeds from the Sheridan Transaction caused a significant alteration to our full cost pool and depletion rate. Accordingly, we recognized a gain, net of proportionate reduction in goodwill, on the Sheridan Transaction of $231.5 million.
EnerVest Transaction
On November 24, 2009, we closed the sale of our Ohio and certain Northwestern Pennsylvania producing assets to EV Energy Partners, L.P., or the EnerVest Transaction, along with certain institutional partnerships managed by EnerVest, Ltd., for $141.6 million, after final closing adjustments. The sale was effective on September 1, 2009. This transaction did not have a significant impact on our depletion rate. Therefore, the proceeds reduced our full cost pool.
Other transactions
During 2009, we also closed sales of certain non-strategic assets, resulting in net cash proceeds of approximately $67.9 million after post-closing adjustments. The proceeds reduced our full cost pool.
During the fourth quarter of 2009, we completed acquisitions totaling $251.5 million. While the acquisitions contained a minor amount of proved oil and natural gas properties, the strategic objective of the acquisitions was for the expansion of acreage in our shale resource plays. During 2010, BG Group elected to participate in 50% of these acquisitions.
| 5. | Derivative financial instruments |
Our primary objective in entering into derivative financial instruments is to manage our exposure to commodity price fluctuations, protect our returns on investments and achieve a more predictable cash flow in connection with our operations. These transactions limit exposure to declines in commodity prices, but also limit the benefits we would realize if commodity prices increase. When prices for oil and natural gas are volatile, a significant portion of the effect of our derivative financial instrument management activities consists of non-cash income or expense due to changes in the fair value of our derivative financial instrument contracts. Cash charges or gains only arise from payments made or received on monthly settlements of contracts or if we terminate a contract prior to its expiration.
We account for our derivative financial instruments in accordance with ASC 815, which requires that every derivative instrument (including certain derivative instruments embedded in other contracts) be recorded on the balance sheet as either an asset or liability measured at its fair value. ASC 815 requires that changes in the derivative’s fair value be recognized currently in earnings unless specific hedge accounting criteria are met, or exemptions for normal purchases and normal sales as permitted by ASC 815 exist. We do not designate our derivative financial instruments as hedging instruments for financial accounting purposes and, as a result, we recognize the change in the respective instruments’ fair value currently in earnings. The table below outlines the classification of our derivative financial instruments on our Consolidated Balance Sheets and their financial impact in our Consolidated Statements of Operations.
95
Fair Value of Derivative Financial Instruments
| | | | | | | | | | |
(in thousands) | | Balance Sheet location | | December 31,
2011 | | | December 31,
2010 | |
Commodity contracts | | Derivative financial instruments - Current assets | | $ | 164,002 | | | $ | 73,176 | |
Commodity contracts | | Derivative financial instruments - Long-term assets | | | 11,034 | | | | 23,722 | |
Commodity contracts | | Derivative financial instruments - Current liabilities | | | (1,800 | ) | | | (3,775 | ) |
Commodity contracts | | Derivative financial instruments - Long-term liabilities | | | 0 | | | | (4,200 | ) |
| | | | | | | | | | |
Net derivative financial instruments | | $ | 173,236 | | | $ | 88,923 | |
| | | | | | | | | | |
The Effect of Derivative Financial Instruments
| | | | | | | | | | | | | | |
| | | | | Years ended December 31, | |
(in thousands) | | Statements of Operations location | | 2011 | | | 2010 | | | 2009 | |
Commodity contracts (1) | | Gain on derivative financial instruments | | $ | 219,730 | | | $ | 146,516 | | | $ | 232,025 | |
Interest rate contracts (2) | | Interest expense | | | 0 | | | | (45 | ) | | | (4,319 | ) |
| | | | | | | | | | | | | | |
Net gain | | $ | 219,730 | | | $ | 146,471 | | | $ | 227,706 | |
| | | | | | | | | | | | | | |
| (1) | Included in these amounts are net cash receipts of $135.4 million, $217.4 million and $478.5 million for the years ended December 31, 2011, 2010 and 2009, respectively |
| (2) | Included in these amounts are net cash payments of $2.1 million and $12.2 million for the years ended December 31, 2010 and 2009, respectively. Our interest rate swaps expired on February 14, 2010. |
Settlements in the normal course of maturities of our derivative financial instrument contracts result in cash receipts from or cash disbursements to our derivative contract counterparties. Changes in the fair value of our derivative financial instrument contracts are included in income currently with a corresponding increase or decrease in the Consolidated Balance Sheet fair value amounts. Unrealized fair value adjustments included in “Gain (loss) on derivative financial instruments” on the Consolidated Statements of Operations do not impact cash flows. Unrealized fair value adjustments were gains of $84.3 million for the year ended December 31, 2011 and losses of $70.9 million and $246.5 million for the years ended December 31, 2010 and 2009, respectively.
Unrealized fair value adjustments included in “Interest expense” on the Consolidated Statements of Operations, which do not impact cash flows, were gains of $2.0 million and $7.9 million for the years ended December 31, 2010 and 2009, respectively. There were no interest rate derivative financial instruments in 2011.
We place our derivative financial instruments with financial institutions and other firms that we believe have high credit ratings. To mitigate our risk of loss due to default, we have entered into master netting agreements with our counterparties on our derivative financial instruments that allow us to offset our asset position with our liability position in the event of a default by the counterparty.
96
The following table presents the volume and fair value of our oil and natural gas derivative financial instruments as of December 31, 2011:
| | | | | | | | | | | | |
(in thousands, except prices) | | Volume
Mmbtus/Bbls | | | Weighted average
strike price per
Mmbtu/Bbl | | | Fair value at
December 31,
2011 | |
Natural gas: | | | | | | | | | | | | |
Swaps: | | | | | | | | | | | | |
2012 | | | 80,520 | | | $ | 5.27 | | | $ | 163,049 | |
2013 | | | 5,475 | | | | 5.99 | | | | 11,034 | |
| | | | | | | | | | | | |
Total natural gas | | | 85,995 | | | | | | | | 174,083 | |
| | | | | | | | | | | | |
| | | |
Oil: | | | | | | | | | | | | |
Swaps: | | | | | | | | | | | | |
2012 | | | 275 | | | | 95.70 | | | | (847 | ) |
| | | | | | | | | | | | |
Total oil | | | 275 | | | | | | | | (847 | ) |
| | | | | | | | | | | | |
Total oil and natural gas and derivatives | | | | | | | | | | $ | 173,236 | |
At December 31, 2010, we had outstanding derivative contracts to mitigate price volatility covering 89,500 Mmcf of natural gas and 822 Mbbls of oil. At December 31, 2011, the average forward NYMEX natural gas price per Mmbtu for calendar 2012 and 2013 was $3.24 and $3.94, respectively, and the average forward NYMEX oil prices per Bbl for calendar 2012 and 2013 was $98.81 and $95.78, respectively.
Our derivative financial instruments covered approximately 58.9% and 53.1% of our total equivalent Mcfe production for the years ended December 31, 2011 and December 31, 2010, respectively.
| 6. | Fair value measurements |
We value our derivatives according to FASB ASC Topic 820, Fair Value Measurements and Disclosures, which defines fair value as the exchange price that would be received for an asset or paid to transfer a liability (exit price) in the principal or most advantageous market for the asset or liability in an orderly transaction between market participants on the measurement date. This fair value may be different from the settlement value based on company-specific inputs, such as credit rating, futures markets and forward curves, and readily available buyers or sellers for such assets or liabilities.
We categorize the inputs used in measuring fair value into a three-tier fair value hierarchy. These tiers include:
Level 1 – Observable inputs, such as quoted market prices in active markets, for substantially identical assets and liabilities.
Level 2 – Observable inputs other than quoted prices withinLevel 1 for similar assets and liabilities. These include quoted prices in markets that are not active or other inputs that are observable or can be corroborated by observable market data. If the asset or liability has a specified or contractual term, the input must be observable for substantially the full term of the asset or liability.
Level 3 – Unobservable inputs that are supported by little or no market activity, generally requiring development of fair value assumptions by management.
Fair value of derivative financial instruments
The following table presents a summary of the estimated fair value of our derivative financial instruments as of December 31, 2011 and 2010. During 2011 and 2010, there were no changes in the fair value level classifications.
| | | | | | | | | | | | | | | | |
| | | December 31, 2011 | |
(in thousands) | | Level 1 | | | Level 2 | | | Level 3 | | | Total | |
Oil and natural gas derivative financial instruments | | $ | — | | | $ | 173,236 | | | $ | — | | | $ | 173,236 | |
| | | | | | | | | | | | | | | | |
| |
| | | December 31, 2010 | |
(in thousands) | | Level 1 | | | Level 2 | | | Level 3 | | | Total | |
Oil and natural gas derivative financial instruments | | $ | — | | | $ | 88,923 | | | $ | — | | | $ | 88,923 | |
| | | | | | | | | | | | | | | | |
97
We evaluate derivative assets and liabilities in accordance with master netting agreements with the derivative counterparties, but report them gross on the Consolidated Balance Sheets. Net derivative asset values are determined primarily by quoted futures prices and utilization of the counterparties’ credit-adjusted risk-free rate curves and net derivative liabilities are determined by utilization of our credit-adjusted risk-free rate curve. The credit-adjusted risk-free rates of our counterparties are based on an independent market-quoted credit default swap rate curve for the counterparties’ debt plus the LIBOR curve as of the end of the reporting period. Our credit-adjusted risk-free rate is based on the blended rate of independent market-quoted credit default swap rate curves for companies that have the same credit rating as us plus the LIBOR curve as of the end of the reporting period.
The valuation of our commodity price derivatives, represented by oil and natural gas swaps, is discussed below.
Oil derivatives. Our oil derivatives are swap contracts for notional Bbls of oil at fixed NYMEX West Texas Intermediate (WTI) oil prices. The asset and liability values attributable to our oil derivatives as of the end of the reporting period are based on (i) the contracted notional volumes, (ii) independent active NYMEX futures price quotes for WTI oil, and (iii) the applicable estimated credit-adjusted risk-free rate curve, as described above.
Natural gas derivatives. Our natural gas derivatives are swap contracts for notional Mmbtus of gas at posted price indexes, including NYMEX Henry Hub (HH) swap contracts. The asset and liability values attributable to our natural gas derivatives as of the end of the reporting period are based on (i) the contracted notional volumes, (ii) independent active NYMEX futures price quotes for HH for natural gas swaps, and (iii) the applicable credit-adjusted risk-free rate curve, as described above.
For further details on the fair value of our derivative financial instruments in “Note 5. Derivative financial instruments.”
Interest rate swaps
In January 2008, we entered into interest rate swaps to mitigate our exposure to fluctuations in interest rates on $700.0 million in principal of our credit agreements through February 14, 2010 at LIBOR ranging from 2.45% to 2.8%. The net derivative liability value attributable to our interest rate derivative contracts as of the end of the reporting period are based on (i) the contracted notional amounts, (ii) forward active market-quoted LIBOR yield curves and (iii) the applicable credit-adjusted risk-free rate yield curve. We had our interest rate swaps and their related fair value tier as Level 2.
Our interest rate swaps expired on February 14, 2010 and we have not entered into any new interest rate swap agreements as of December 31, 2011. During the twelve months ended December 31, 2010, our interest rate swaps had a net $0.1 million impact to interest expense. During the twelve months ended December 31, 2009, we recognized $4.3 million of interest expense related to the interest rate swaps.
Fair value of other financial instruments
Our financial instruments include cash and cash equivalents, accounts receivable and payable and accrued liabilities. The carrying amount of these instruments approximates fair value because of their short-term nature. The carrying value of the EXCO Resources Credit Agreement approximates its fair value.
The estimated fair value of our $750.0 million 7.5% senior unsecured notes maturing on September 15, 2018, or the 2018 Notes, was $705.0 million with a carrying amount of $740.3 million as of December 31, 2011. The estimated fair value of the 2018 Notes was $736.1 million with a carrying amount of $739.3 million as of December 31, 2010.
98
| | | | | | | | |
| | | December 31, | |
(in thousands) | | 2011 | | | 2010 | |
EXCO Resources Credit Agreement | | $ | 1,147,500 | | | $ | 849,000 | |
2018 Notes | | | 750,000 | | | | 750,000 | |
Unamortized discount on 2018 Notes | | | (9,672 | ) | | | (10,731 | ) |
| | | | | | | | |
Total debt | | $ | 1,887,828 | | | $ | 1,588,269 | |
| | | | | | | | |
Terms and conditions of each of the debt obligations are discussed below.
EXCO Resources Credit Agreement
As of December 31, 2011, the EXCO Resources Credit Agreement had a borrowing base of $1.6 billion, with $1.1 billion of outstanding indebtedness and $443.3 million of available borrowing capacity. On December 31, 2011, the one month LIBOR was 0.3% which would result in an interest rate of approximately 2.3%. The borrowing base is redetermined semi-annually, with us and the lenders having the right to request interim unscheduled redeterminations in certain circumstances. On April 1, 2011, we entered into the third amendment to the EXCO Resources Credit Agreement in conjunction with the regular semi-annual redetermination of the borrowing base and increased the borrowing base from $1.0 billion to $1.5 billion. In addition, the interest rate was reduced by 50 bps and now ranges from LIBOR plus 150 bps to LIBOR plus 250 bps, or from ABR plus 50 bps to ABR plus 150 bps, depending upon borrowing base usage. Our consolidated ratio of funded indebtedness to consolidated EBITDAX (as defined in the EXCO Resources Credit Agreement), was increased by 0.5 and can be no greater than 4.0 to 1.0. The maturity date was also extended from April 30, 2014 to April 1, 2016. On November 8, 2011, the lenders completed their regular semi-annual redetermination of the borrowing base and entered into the fourth amendment and the fifth amendment to the EXCO Resources Credit Agreement. The fourth amendment resulted in an increase in the borrowing base from $1.5 billion to $1.6 billion. The fifth amendment allows us to incur up to an additional $750.0 million of unsecured senior note indebtedness on or before November 1, 2012.
The majority of our subsidiaries are guarantors under the EXCO Resources Credit Agreement. The EXCO Resources Credit Agreement permits investments, loans and advances to the unrestricted subsidiaries related to our joint ventures with certain limitations, and allows us to repurchase up to $200.0 million of our common stock, of which $7.5 million has been utilized as of December 31, 2011.
Borrowings under the EXCO Resources Credit Agreement are collateralized by first lien mortgages providing a security interest of not less than 80% of the Engineered Value (as defined in the EXCO Resources Credit Agreement) of our oil and natural gas properties covered by the borrowing base. We are permitted to have derivative financial instruments covering no more than 100% of forecasted production from total Proved Reserves (as defined in the EXCO Resources Credit Agreement) during the first two years of the forthcoming five-year period, 90% of the forecasted production for any month during the third year of the forthcoming five-year period and 85% of the forecasted production from total Proved Reserves during the fourth and fifth year of the forthcoming five-year period.
The EXCO Resources Credit Agreement sets forth the terms and conditions under which we are permitted to pay a cash dividend on our common stock and provides that we may declare and pay cash dividends on our common stock in an amount not to exceed $50.0 million in any four consecutive fiscal quarters, provided that, as of each payment date and after giving effect to the dividend payment date, (i) no default has occurred and is continuing, (ii) we have at least 10% of our borrowing base available under the EXCO Resources Credit Agreement, and (iii) payment of such dividend is permitted under the indenture governing the 2018 Notes.
On December 31, 2011, the one month LIBOR was 0.3%, which would result in an interest rate of approximately 2.3% on any new indebtedness we may incur under the EXCO Resources Credit Agreement.
As of December 31, 2011, we were in compliance with the financial covenants contained in the EXCO Resources Credit Agreement, which require that we:
| | • | | maintain a consolidated current ratio (as defined in the EXCO Resources Credit Agreement) of at least 1.0 to 1.0 as of the end of any fiscal quarter; and |
| | • | | not permit our ratio of consolidated funded indebtedness to consolidated EBITDAX (as defined in the EXCO Resources Credit Agreement) to be greater than 4.0 to 1.0 at the end of any fiscal quarter ending on or after December 31, 2010. |
99
The foregoing descriptions are not complete and are qualified in their entirety by the EXCO Resources Credit Agreement.
While we believe our existing capital resources, including our cash flow from operations and borrowing capacity under the EXCO Resources Credit Agreement is sufficient to conduct our operations into 2013, there are certain risks arising from recent declines in natural gas prices that could impact our ability to meet debt covenants in future periods. In particular, our consolidated funded indebtedness to consolidated EBITDAX, as defined in the EXCO Resources Credit Agreement, is computed using a trailing twelve month computation. As a result, our ability to maintain compliance with this covenant may be negatively impacted when oil and or natural gas prices decline for an extended period of time. In addition, as a result of the decline in natural gas prices, we expect a reduction to our available borrowing base under the EXCO Resources Credit Agreement at the next regularly scheduled redetermination in April 2012 and the possibility of further reductions in future periods if natural gas prices do not recover.
In response to the recent declines in natural gas prices, management has reduced our drilling plans, which will likely reduce our production volumes late in 2012 and into 2013, and has taken measures to reduce operating and administrative expenses. In addition, the volumes of natural gas currently covered by derivative financial instruments declines significantly in 2013. Depending on market conditions, we may enter into additional derivative financial instrument transactions in 2012. The combination of a reduction in our borrowing base, lower production volumes and reduced percentages of volumes covered by derivative financial instruments may result in our seeking alternative financing arrangements, further reducing costs or selling assets.
EXCO Operating credit agreement
On April 30, 2010, the EXCO Operating credit agreement, a separate credit agreement used by our wholly-owned subsidiary, EXCO Operating, was consolidated into the EXCO Resources Credit Agreement. Terms of the amended and restated agreement include, among other things, EXCO Operating and certain of its subsidiaries becoming guarantor subsidiaries under the EXCO Resources Credit Agreement.
Term Credit Agreement.
In connection with the closings of the East Texas/North Louisiana JV, TGGT Transaction and the East Texas Transaction in August 2009, EXCO Operating repaid the a $300.0 million term credit agreement.
2011 Notes
On September 15, 2010 we provided notice to the trustee of our 7 1/4% Senior Notes due January 15, 2011, or the 2011 Notes, in accordance with the indenture, to fully redeem all of the $444.7 million outstanding notes. We used a portion of the proceeds from the issuance of the 2018 Notes to redeem the 2011 Notes, including accrued interest of $8.1 million from July 15, 2010 to the redemption date of October 15, 2010.
2018 Notes
On September 15, 2010 we closed on an underwritten offering of our 7.5% 2018 Notes. We received proceeds of approximately $724.1 million from the offering after deducting discounts to the underwriters and estimated offering fees and expenses. Proceeds from the offering were used to redeem the 2011 Notes and reduce the balance under the EXCO Resources Credit Agreement. The 2018 Notes are guaranteed on a senior unsecured basis by our consolidated subsidiaries, except for our jointly-held equity investments with BG Group. Our equity investments with BG Group, other than OPCO, have been designated as unrestricted subsidiaries under the indenture governing the 2018 Notes.
As of December 31, 2011, $750.0 million in principal was outstanding on our 2018 Notes. The unamortized discount on the 2018 Notes at December 31, 2011 was $9.7 million. The estimated fair value of the 2018 Notes, based on quoted market prices, was $705.0 million on December 31, 2011. The estimated fair value of the 2018 Notes was $736.1 million with a carrying amount of $739.3 million as of December 31, 2010.
Interest accrues at 7.5% and is payable on the 2018 Notes semi-annually in arrears on March 15 and September 15 of each year, beginning on March 15, 2011.
The Indenture governing the 2018 Notes contains covenants, which may limit our ability and the ability of our restricted subsidiaries to:
100
| | • | | incur or guarantee additional indebtedness; |
| | • | | pay dividends on our capital stock (over $50.0 million per annum) or make other distributions or repurchase or redeem our capital stock; |
| | • | | prepay, redeem or repurchase certain debt; |
| | • | | make certain investments and loans; |
| | • | | incur liens on our assets; |
| | • | | enter into transactions with affiliates; |
| | • | | alter the businesses we conduct; |
| | • | | enter into agreements restricting our subsidiaries’ ability to pay dividends; and |
| | • | | consolidate, merge or sell all or substantially all of our assets. |
| 8. | Environmental regulation |
Various federal, state and local laws and regulations covering discharge of materials into the environment, or otherwise relating to the protection of the environment, may affect our operations and the costs of our oil and natural gas exploitation, development and production operations. We do not anticipate that we will be required in the foreseeable future to expend amounts material in relation to the financial statements taken as a whole by reason of environmental laws and regulations. Because these laws and regulations are constantly being changed, we are unable to predict the conditions and other factors over which we do not exercise control that may give rise to environmental liabilities affecting us.
| 9. | Commitments and contingencies |
We lease our offices and certain equipment. Our rental expenses were approximately $8.2 million, $8.2 million and $28.1 million for the years ended December 31, 2011, 2010, and 2009, respectively. Our future minimum rental payments under operating leases with remaining noncancellable lease terms at December 31, 2011, are presented on the following table. The commitments do not include those of our equity method investments.
| | | | | | | | | | | | | | | | | | | | |
(in thousands) | | Firm
transportation
services | | | Other
fixed
commitments | | | Drilling
contracts | | | Operating
leases
and other | | | Total | |
2012 | | $ | 93,789 | | | $ | 46,047 | | | $ | 76,805 | | | $ | 14,806 | | | $ | 231,447 | |
2013 | | | 92,872 | | | | 12,235 | | | | 20,552 | | | | 14,052 | | | | 139,711 | |
2014 | | | 92,576 | | | | 6,687 | | | | 1,611 | | | | 7,331 | | | | 108,205 | |
2015 | | | 92,240 | | | | 6,538 | | | | 0 | | | | 4,507 | | | | 103,285 | |
2016 | | | 89,304 | | | | 6,042 | | | | 0 | | | | 1,120 | | | | 96,466 | |
Thereafter | | | 394,804 | | | | 1,529 | | | | 0 | | | | 0 | | | | 396,333 | |
| | | | | | | | | | | | | | | | | | | | |
Total | | $ | 855,585 | | | $ | 79,078 | | | $ | 98,968 | | | $ | 41,816 | | | $ | 1,075,447 | |
| | | | | | | | | | | | | | | | | | | | |
We have entered into firm transportation agreements with independent pipeline companies which commit us to ship an average of 830 Mmcf per day in the East Texas/North Louisiana area through 2021.
In the ordinary course of business, we are periodically a party to lawsuits. From time to time, natural gas producers, including EXCO, have been named in various lawsuits alleging underpayment of royalties in connection with natural gas and NGLs produced and sold. We have reserved our estimated exposure and do not believe it was material to our current, or future, financial position or results of operations.
We do not believe that any resulting liability from any additional existing legal proceedings, individually or in the aggregate, will have a material adverse effect on our results of operations or financial condition and have properly reflected any potential exposure in our financial position when determined to be both probable and can be reasonably estimated.
| 10. | Employee benefit plans |
At December 31, 2011, we sponsored a 401(k) plan for our employees and matched 100% of employee contributions. Our matching contributions were $9.4 million, $7.8 million and $7.0 million for the years ended December 31, 2011, 2010 and 2009, respectively.
101
We account for earnings per share in accordance with FASB ASC Subtopic 260-10, Earnings Per Share, or ASC 260-10. ASC 260-10 requires companies to present two calculations of earnings per share; basic and diluted. Basic earnings (loss) per share for the years ended December 31, 2011, 2010 and 2009 equals the net income (loss) divided by the weighted average common shares outstanding during the period. Diluted earnings (loss) per common share for the year ended December 31, 2011, 2010 and 2009 is computed in the same manner as basic earnings per share after assuming issuance of common stock for all potentially dilutive common stock equivalents, whether vested, exercisable or not. We excluded 7,251,289 and 4,099,255 antidilutive common stock equivalents from the years ended December 31, 2011 and 2010, respectively, from the computation of diluted earnings per share. Since we incurred net losses for the year ended December 31, 2009, we excluded 14,729,424 of potential common stock equivalents from the diluted earnings per share calculation.
The following table presents basic and diluted earnings (loss) per share for the years ended December 31, 2011, 2010 and 2009:
| | | | | | | | | | | | |
| | | Year ended December 31, | |
(in thousands, except per share amount) | | 2011 | | | 2010 | | | 2009 | |
Basic income (loss) per common share: | | | | | | | | | | | | |
Net income (loss) | | $ | 22,596 | | | $ | 671,926 | | | $ | (496,804 | ) |
| | | | | | | | | | | | |
| | | |
Shares: | | | | | | | | | | | | |
Weighted average number of common shares outstanding | | | 213,908 | | | | 212,465 | | | | 211,266 | |
| | | | | | | | | | | | |
| | | |
Basic income (loss) per common share: | | | | | | | | | | | | |
Net income (loss) per common share | | $ | 0.11 | | | $ | 3.16 | | | $ | (2.35 | ) |
| | | | | | | | | | | | |
| | | |
Diluted income (loss) per share: | | | | | | | | | | | | |
Net income (loss) | | $ | 22,596 | | | $ | 671,926 | | | $ | (496,804 | ) |
| | | | | | | | | | | | |
| | | |
Shares: | | | | | | | | | | | | |
Weighted average number of common shares outstanding | | | 213,908 | | | | 212,465 | | | | 211,266 | |
Dilutive effect of | | | | | | | | | | | | |
stock options | | | 2,797 | | | | 3,270 | | | | 0 | |
restricted shares | | | 0 | | | | — | | | | — | |
| | | | | | | | | | | | |
Weighted average number of common shares and common stock equivalent shares outstanding | | | 216,705 | | | | 215,735 | | | | 211,266 | |
| | | | | | | | | | | | |
| | | |
Diluted income (loss) per share: | | | | | | | | | | | | |
Net income (loss) per common share | | $ | 0.10 | | | $ | 3.11 | | | $ | (2.35 | ) |
| | | | | | | | | | | | |
| 12. | Stock options and awards |
Description of plan
As of December 31, 2011 and 2010, there were 2,670,634 and 2,068,375 shares, respectively, available for grant under the 2005 Incentive Plan. Effective October 6, 2011, our shareholders voted to increase the total shares authorized for issuance under the 2005 Incentive Plan from 23,000,000 to 28,500,000 shares, increasing the number of shares available for grant by 5,500,000, and also voted to increase the amount that each restricted share counts against the total number of shares we have available for grant from 1.17 shares to 2.1 shares.
We have historically granted only options under the 2005 Incentive Plan. However, in 2011 we granted shares of restricted stock to certain employees. The holders of these shares have voting rights and upon vesting the right to receive all accrued and unpaid dividends.
Compensation costs
We account for our stock-based options and awards in accordance with ASC 718. As required by ASC 718, the granting of options and awards to our employees under the 2005 Incentive Plan are share-based payment transactions and are to be treated as compensation expense by us with a corresponding increase to additional paid-in capital.
102
Total share-based compensation to be recognized on unvested options and restricted stock awards as of December 31, 2011 is $39.3 million. Of this amount, $16.3 million is related to unvested options and will be recognized over a weighted average period of 1.7 years and $23.0 million is related to unvested restricted stock awards and will be recognized over a weighted average period of 3.8 years.
The following is a reconciliation of our share-based compensation expense for the years ended December 31, 2011, 2010 and 2009:
| | | | | | | | | | | | |
| | | Years ended December 31, | |
(in thousands) | | 2011 | | | 2010 | | | 2009 | |
General and administrative expense | | $ | 10,872 | | | $ | 15,800 | | | $ | 16,156 | |
Lease operating expense | | | 140 | | | | 1,041 | | | | 2,831 | |
| | | | | | | | | | | | |
Total share-based compensation expense | | | 11,012 | | | | 16,841 | | | | 18,987 | |
Share-based compensation capitalized | | | 6,406 | | | | 6,351 | | | | 5,066 | |
| | | | | | | | | | | | |
Total share-based compensation | | $ | 17,418 | | | $ | 23,192 | | | $ | 24,053 | |
| | | | | | | | | | | | |
The total tax benefit attributable to our share-based compensation for the years ended December 31, 2011, 2010 and 2009 was $1.2 million, $1.3 million and $1.1 million, respectively.
Stock options
Our outstanding stock option expiration dates range from 5 to 10 years following the date of grant and have a weighted average remaining life of 6.1 years. Pursuant to the 2005 Incentive Plan, 25% of the options vest immediately with an additional 25% to vest on each of the next three anniversaries of the date of the grant.
The following table summarizes stock option activity related to our employees under the 2005 Incentive Plan:
| | | | | | | | | | | | | | | | |
| | | Stock
options | | | Weighted average
exercise price
per share | | | Weighted average
remaining terms
(in years) | | | Aggregate
intrinsic
value | |
| | | | |
Options outstanding at December 31, 2008 | | | 14,963,315 | | | $ | 12.20 | | | | | | | | | |
Granted | | | 3,072,650 | | | | 17.05 | | | | | | | | | |
Forfeitures | | | 650,300 | | | | 15.32 | | | | | | | | | |
Exercised | | | 931,371 | | | | 11.12 | | | | | | | | | |
| | | | | | | | | | | | | | | | |
Options outstanding at December 31, 2009 | | | 16,454,294 | | | | 13.04 | | | | | | | | | |
| | | | | | | | | | | | | | | | |
Granted | | | 2,292,900 | | | | 18.31 | | | | | | | | | |
Forfeitures | | | 441,175 | | | | 18.65 | | | | | | | | | |
Exercised | | | 1,827,093 | | | | 12.60 | | | | | | | | | |
| | | | | | | | | | | | | | | | |
Options outstanding at December 31, 2010 | | | 16,478,926 | | | | 13.68 | | | | | | | | | |
| | | | | | | | | | | | | | | | |
Granted | | | 831,600 | | | | 11.79 | | | | | | | | | |
Forfeitures | | | 698,700 | | | | 17.88 | | | | | | | | | |
Exercised | | | 941,658 | | | | 12.81 | | | | | | | | | |
| | | | | | | | | | | | | | | | |
Options outstanding at December 31, 2011 | | | 15,670,168 | | | | 13.44 | | | | 6.05 | | | $ | 14,397,059 | |
| | | | | | | | | | | | | | | | |
Options exercisable at December 31, 2011 | | | 13,369,135 | | | $ | 12.97 | | | | 5.77 | | | $ | 14,371,455 | |
| | | | | | | | | | | | | | | | |
The weighted average fair value of stock options on the date of the grant during the years 2011, 2010 and 2009 were $5.92, $10.19 and $9.67, respectively. The total intrinsic value of stock options exercised for the years ended December 31, 2011, 2010 and 2009 was $6.0 million, $11.3 million and $5.3 million, respectively.
103
The fair value of each option grant is estimated on the date of grant using the Black-Scholes option pricing model. Options are granted at the fair market value of the common stock on the date of grant. The following assumptions were used for the options included in the table below:
| | | | | | |
| | | 2011 | | 2010 | | 2009 |
Expected life | | 3.8 to 7.5 years | | 7.5 years | | 7.5-8.5 years |
Risk-free rate of return | | 0.67 - 3.09% | | 2.04-3.52% | | 2.33-3.57% |
Volatility | | 55.77 - 72.83% | | 54.37-56.80% | | 53.87-55.61% |
Dividend yield | | 0.77 - 1.51% | | 0.45-1.15% | | 0.568-0.652% |
Expected life was determined based on EXCO’s exercise history, as well as comparable public companies. Risk-free rate of return is a rate of a similar term U.S. Treasury zero coupon bond. Volatility was determined based on the weighted average of historical volatility of our common stock and the daily closing prices from comparable public companies.
In connection with certain divestitures, we accelerated the vesting of a number of employee stock options on the date of the employee’s termination and extended their exercise terms to one year from date of termination. For the year ended December 31, 2010, we recognized $0.9 million of additional compensation expense related to the modification of option terms which would have been recognized over the remaining life of the options had they not been accelerated. The underlying stock price on the dates of modification ranged from $14.70 to $21.23 and the exercise prices of the options accelerated ranged from $7.50 to $24.66.
Restricted stock
During the year ended December 31, 2011, 2,589,709 restricted shares of common stock were granted under the 2005 Incentive Plan. The shares were valued at the closing price of our stock on the date of grant. The shares vest over a range of three to five years.
A summary of our restricted stock activity for the period ended December 31, 2011 is as follows:
| | | | | | | | |
| | | Shares | | | Weighted average
grant date fair value
per share | |
Non-vested shares outstanding at December 31, 2010 | | | — | | | | — | |
Granted | | | 2,589,709 | | | | 11.75 | |
Vested | | | 0 | | | | 0 | |
Forfeited | | | (27,300 | ) | | | 14.71 | |
| | | | | | | | |
Non-vested shares outstanding at December 31, 2011 | | | 2,562,409 | | | $ | 11.72 | |
| | | | | | | | |
104
The income tax provision attributable to our income (loss) before income taxes consists of the following:
| | | | | | | | | | | | |
| | | Years ended December 31, | |
(in thousands) | | 2011 | | | 2010 | | | 2009 | |
| | | |
Current: | | | | | | | | | | | | |
U.S. | | | | | | | | | | | | |
Federal | | $ | 0 | | | $ | 1,348 | | | $ | 0 | |
State | | | 0 | | | | 260 | | | | (130 | ) |
| | | | | | | | | | | | |
Total current income tax (benefit) | | | 0 | | | | 1,608 | | | | (130 | ) |
| | | | | | | | | | | | |
| | | |
Deferred: | | | | | | | | | | | | |
U.S. | | | | | | | | | | | | |
Federal | | | 10,111 | | | | 248,132 | | | | (130,740 | ) |
State | | | 1,554 | | | | 29,050 | | | | (20,606 | ) |
Valuation allowance | | | (11,665 | ) | | | (277,182 | ) | | | 141,975 | |
| | | | | | | | | | | | |
Total deferred income tax (benefit) | | | 0 | | | | 0 | | | | (9,371 | ) |
| | | | | | | | | | | | |
Total income tax (benefit) | | $ | 0 | | | $ | 1,608 | | | $ | (9,501 | ) |
| | | | | | | | | | | | |
We have net operating loss carryforwards, or NOLs, for United States income tax purposes that have been generated from our operations. Our NOLs are scheduled to expire if not utilized between 2026 and 2029. Our ability to use the NOLs has been restricted by Section 382 of the Internal Revenue Code due to ownership changes which occurred on August 30, 2007 based upon the transformation of the Hybrid Preferred Stock to the same terms as the 7.0% Preferred Stock. The result of the change in control was no current limitation on our 2007 NOL. Our total NOL and alternative minimum tax credits available for utilization at December 31, 2011 was approximately $1.7 billion and of $1.5 million, respectively.
Deferred income taxes reflect the net tax effects of temporary differences between the carrying amounts of assets and liabilities for financial reporting purposes and the amounts used for income tax purposes. Significant components of our deferred tax liabilities and assets are as follows:
| | | | | | | | |
| | | December 31, | |
(in thousands) | | 2011 | | | 2010 | |
Current deferred tax assets (liabilities): | | | | | | | | |
Derivative financial instruments | | $ | 0 | | | $ | 0 | |
Other | | | 242 | | | | 6,330 | |
| | | | | | | | |
Valuation allowance | | | (242 | ) | | | (6,330 | ) |
| | | | | | | | |
Total current deferred tax assets (liabilities) | | | 0 | | | | 0 | |
| | | | | | | | |
Non-current deferred tax assets: | | | | | | | | |
Net operating loss and AMT credits carryforwards - U.S | | | 657,922 | | | | 297,661 | |
Share-based compensation | | | 9,003 | | | | 7,391 | |
Depreciation, depletion and amortization | | | 0 | | | | 117,261 | |
Goodwill | | | 10,524 | | | | 14,756 | |
Other | | | 85 | | | | 83 | |
| | | | | | | | |
Total long-term deferred tax assets | | | 677,534 | | | | 437,152 | |
| | | | | | | | |
Valuation allowance | | | (375,281 | ) | | | (381,206 | ) |
| | | | | | | | |
Net total non-current deferred tax assets | | | 302,853 | | | | 55,946 | |
| | | | | | | | |
Non-current deferred tax liabilities: | | | | | | | | |
Depreciation, depletion and amortization | | | (185,551 | ) | | | 0 | |
Investment in partnerships | | | (59,336 | ) | | | (31,749 | ) |
Derivative financial instruments | | | (57,366 | ) | | | (24,197 | ) |
| | | | | | | | |
Total non-current deferred liabilities | | | (302,253 | ) | | | (55,946 | ) |
| | | | | | | | |
Net total non-current deferred tax assets (liabilities) | | $ | 0 | | | $ | 0 | |
| | | | | | | | |
105
A reconciliation of our income tax provision (benefit) computed by applying the statutory United States federal income tax rate to our income (loss) before income taxes for the years ended December 31, 2011, 2010 and 2009 is presented in the following table:
| | | | | | | | | | | | |
| | | Years ended December 31, | |
(in thousands) | | 2011 | | | 2010 | | | 2009 | |
| | | |
United States federal income taxes (benefit) at statutory rate of 35% | | $ | 7,909 | | | $ | 235,737 | | | $ | (177,207 | ) |
Increases (reductions) resulting from: | | | | | | | | | | | | |
Goodwill | | | 0 | | | | 11,556 | | | | 43,455 | |
Adjustments to the valuation allowance | | | (11,665 | ) | | | (277,182 | ) | | | 141,975 | |
Non-deductible compensation | | | 1,760 | | | | 2,098 | | | | 2,808 | |
State taxes net of federal benefit | | | 1,554 | | | | 29,050 | | | | (20,606 | ) |
Other | | | 442 | | | | 349 | | | | 74 | |
| | | | | | | | | | | | |
Total income tax provision | | $ | 0 | | | $ | 1,608 | | | $ | (9,501 | ) |
| | | | | | | | | | | | |
During 2011, our taxable income was offset by utilization of net operating losses and a corresponding decrease to previously recognized valuation allowances against deferred tax assets. The net result is a zero income tax liability provision for 2011.
During 2010, our taxable income was impacted by gains attributable to the formation of the Appalachia JV, offset by utilization of net operating losses and a corresponding decrease to previously recognized valuation allowances against deferred tax assets. The 2010 income tax provision represents an alternative minimum tax and state income tax liability.
During 2009, our taxable income was impacted by the recognition of valuation allowances against deferred tax assets, which were due primarily to ceiling test write-downs that caused previous book basis and tax basis differences to change from deferred tax liabilities to deferred tax assets.
We adopted the provisions of FASB ASC Subtopic 740-10, Income Taxes on January 1, 2007. As a result of the implementation of ASC Subtopic 740-10, the Company recognized zero liabilities for unrecognized tax benefits. As of December 31, 2010, 2009 and 2008, the Company’s policy is to recognize interest related to unrecognized tax benefits of interest expense and penalties in operating expenses. The Company has not accrued any interest or penalties relating to unrecognized tax benefits in the current financials.
We file income tax returns in the U.S. federal jurisdictions and various state jurisdictions. With few exceptions, we are no longer subject to U.S. federal and state and local examinations by tax authorities for years before 2004. We are not currently under examination by the Internal Revenue Service.
| 14. | Related party transactions |
Corporate use of personal aircraft
We have periodically chartered, for company business, two jet aircraft from DHM Aviation, LLC, a company owned by Douglas H. Miller, our Chairman and Chief Executive Officer. The board of directors has adopted a written policy covering the use of these aircraft. The Company believes that prudent use of a chartered private airplane by our senior management while on company business can promote efficient use of management time. Such usage can allow for unfettered, confidential communications among management during the course of the flight and minimize airport commuting and waiting time, thereby promoting maximum use of management time for company business. However, we restrict the use of the aircraft to priority company business being conducted by senior management in a manner that is cost effective for us and our shareholders. As a result, EXCO’s reimbursed use of the aircraft is restricted to travel that is integrally and directly related to the performance of senior management’s jobs. Such use must be approved in advance by our Chief Executive Officer, President and Chief Financial Officer, Chief Operating Officer or General Counsel. We maintain a detailed written log of such usage specifying the company personnel (and others, if any) that fly on the aircraft, the travel dates and destination(s), and the company business being conducted. In addition, the log contains a detail of all charges paid or reimbursed by us with supporting written documentation.
In the event the aircraft is chartered for a mixture of company business and personal use, all charges will be reasonably allocated between company-reimbursed charges and charges to the person using the aircraft for personal use.
At least annually, and more frequently if requested by the Audit Committee, our Director of Internal Audit surveys fixed base operators and other charter operators located in the Dallas, Texas area and other parts of the country to ascertain hourly flight and hourly fuel surcharge rates for aircraft of comparable size and equipment in relation to the aircraft. A summary of the survey results is
106
supplied to the Audit Committee in order for the Audit Committee to establish an hourly rate and other charges EXCO shall pay for the upcoming calendar year for the use of the aircraft. In addition, DHM Aviation, LLC is reimbursed by us for customary out-of-pocket catering expenses invoiced for a flight and any out-of-pocket expenses incurred by the pilots.
For the years ended December 31, 2011, 2010 and 2009, expenses incurred by EXCO payable directly to DHM Aviation, LLC or indirectly through an invoicing agent for use of these aircraft aggregated $0.3 million, $1.1 million and $1.1 million, respectively.
TGGT and OPCO
TGGT provides us with gathering, treating and well connect services in the ordinary course of business. In addition, TGGT also purchases natural gas from us in certain areas. OPCO serves as the operator of our wells in the Appalachia JV. There are service agreements between us and TGGT and OPCO whereby we provide administrative and technical services for which we are reimbursed. During 2011, 2010, and 2009, these transactions included the following:
| | | | | | | | | | | | | | | | | | | | | | | | |
| | | Years ended December 31, | |
| | | 2011 | | | 2010 (2) | | | 2009 (3) | |
(in millions) | | TGGT | | | OPCO | | | TGGT | | | OPCO | | | TGGT | | | OPCO | |
Amounts paid | | | | | | | | | | | | | | | | | | | | | | | | |
Gathering, treating, and well connect fees (1) | | $ | 199.5 | | | | | | | $ | 90.1 | | | | | | | $ | 8.3 | | | | | |
Advances to operator | | | | | | $ | 69.1 | | | | | | | $ | 47.8 | | | | | | | $ | — | |
| | | | | | |
Amounts received | | | | | | | | | | | | | | | | | | | | | | | | |
Natural gas purchases | | $ | 27.9 | | | | | | | $ | 33.2 | | | | | | | $ | 1.7 | | | | | |
General and administrative services | | | 15.7 | | | $ | 47.3 | | | | 11.3 | | | $ | 22.6 | | | | 2.7 | | | $ | — | |
Purchase of gathering and other assets | | | 2.2 | | | | | | | | 5.0 | | | | | | | | 0.0 | | | | | |
Other | | | 3.4 | | | | | | | | 0.0 | | | | | | | | 0.0 | | | | | |
| | | | | | | | | | | | | | | | | | | | | | | | |
Total | | $ | 49.2 | | | $ | 47.3 | | | $ | 49.5 | | | $ | 22.6 | | | $ | 4.4 | | | $ | — | |
| (1) | Represents the gross billings from TGGT. |
| (2) | OPCO began providing services to us in June 2010. |
| (3) | TGGT began providing services to us in August 2009. |
In addition, we had the following amounts due to us and from us as of December 31, 2011 and 2010.
| | | | | | | | | | | | | | | | |
| | | December 31, 2011 | | | December 31, 2010 | |
(in millions) | | TGGT | | | OPCO | | | TGGT | | | OPCO | |
| | | | |
Amounts due to EXCO | | $ | 8.2 | | | $ | 8.2 | | | $ | 9.7 | | | $ | 4.1 | |
Amounts due from EXCO (1) | | | 39.4 | | | | 0.0 | | | | 33.7 | | | | 0.0 | |
| (1) | Due to the relationship of OPCO being the operator of our wells, we advance them funds on an as needed basis, which we include in other current assets on our Balance Sheet. Any amounts we owe them are netted against this account. |
Other
Until January 1, 2012, Jeff Smith, the son of Stephen F. Smith, our President, Chief Financial Officer and one of our directors, owned a 50% interest in S&S Directional Drilling, LLC, or S&S. Several of TGGT’s vendors or their affiliates subcontracted with S&S in 2011 to provide equipment for shallow pipe-line construction directional drilling services. From January 1, 2011 through December 31, 2011, S&S was paid approximately $3.8 million by these vendors and/or their affiliates for the use of equipment in connection with services provided to TGGT. On January 1, 2012, EXCO’s preferred service provider in East Texas and Louisiana purchased 100% of the membership interests of S&S, including the 50% interest owned by Mr. Smith’s son, or the S&S Transaction. As a result of the S&S Transaction, S&S became a direct vendor of TGGT and EXCO and their preferred service provider for pipe-line construction directional drilling in East Texas and Louisiana. During 2010 and 2009, S&S was paid approximately $6.9 million and $0.8 million, respectively, by one of EXCO’s vendors or its affiliates for the usage of equipment in connection with services provided to EXCO.
Penny Wilson, the spouse of Mark E. Wilson, our Vice President, Chief Accounting Officer and Controller, was retained by us during 2011 and 2010 as a consultant to support certain marketing and operational functions. Fees paid to Ms. Wilson totaled approximately $0.1 million during 2010 and were not material during 2011.
Kyle Hickey, the son of Harold L. Hickey, our Vice President and Chief Operating Officer, was retained by us as a consultant during 2010 and 2011 primarily to support land functions and became one of our employees in May 2011. During 2011, fees paid to Mr. Kyle Hickey totaled approximately $0.1 million and were immaterial in 2010.
107
We follow FASB ASC Topic 280, Segment Reporting, or ASC 280, when reporting operating segments. Pursuant to ASC 280, our reportable segments consist of exploration and production and midstream. The exploration and production segment is responsible for acquisition, development and production of oil and natural gas. The midstream segment, which consists of TGGT and Appalachia Midstream, is accounted for using the equity method and is responsible for purchasing, gathering, transporting and treating natural gas.
For the period of January 1, 2009 through August 13, 2009, prior to formation of TGGT, our reportable segments consisted of exploration and production and wholly-owned midstream subsidiaries that were consolidated in our financial statements. We evaluated the performance of our operating segments based on segment profits, which include segment revenues, excluding the gain (loss) on derivative financial instruments, from external and internal customers and direct segment costs and expenses. Segment profit excludes items such as income taxes, interest income, interest expense, corporate expenses, depreciation and depletion and other items.
At the formation of TGGT on August 14, 2009, we determined that our midstream segment was no longer required due to the 50% reduction in the midstream segment’s profits and the application of equity method accounting. Due to the significant capital investments and growth within TGGT from its inception through 2011 and the expected growth of Appalachia Midstream, we now consider our midstream equity investments as a reportable segment. As a result of the designation of the midstream segment, we have restated the periods of August 14, 2009 through December 31, 2010 and the year ended December 31, 2011 to reflect midstream as a segment. Our management evaluates TGGT’s and the Appalachia Midstream JV’s performance on a standalone basis. The revenues and expenses used to compute the midstream’s segment profit represent TGGT’s and the Appalachia Midstream JV’s results of operations without regard to our 50% ownership. Since we use the equity method of accounting for TGGT, we eliminate these revenues and expenses when reconciling to our consolidated results of operations and report our net share of midstream’s operations as equity income (loss). See Note. 16 “Equity investments” for additional details related to our equity investments, including our midstream segment.
108
Summarized financial information concerning our reportable segments is shown in the following table:
| | | | | | | | | | | | | | | | |
| | | | | | | | | Equity investee and | | | | |
| | | Exploration and | | | | | | intercompany | | | Consolidated | |
(in thousands) | | production | | | Midstream | | | eliminations | | | total | |
For the year ended December 31, 2011 | | | | | | | | | | | | | | | | |
Third party revenues | | $ | 754,201 | | | $ | 242,366 | | | $ | (242,366 | ) | | $ | 754,201 | |
Intersegment revenues | | | 0 | | | | 0 | | | | 0 | | | | 0 | |
| | | | | | | | | | | | | | | | |
Total revenues | | $ | 754,201 | | | $ | 242,366 | | | $ | (242,366 | ) | | $ | 754,201 | |
| | | | | | | | | | | | | | | | |
| | | | |
Segment profit | | $ | 558,679 | | | $ | 134,250 | | | $ | (134,250 | ) | | $ | 558,679 | |
| | | | | | | | | | | | | | | | |
Equity income (loss) | | $ | (494 | ) | | $ | 33,200 | | | $ | 0 | | | $ | 32,706 | |
| | | | | | | | | | | | | | | | |
| | | | |
For the year ended December 31, 2010: | | | | | | | | | | | | | | | | |
Third party revenues | | $ | 515,226 | | | $ | 160,039 | | | $ | (160,039 | ) | | $ | 515,226 | |
Intersegment revenues | | | 0 | | | | 0 | | | | 0 | | | | 0 | |
| | | | | | | | | | | | | | | | |
Total revenues | | $ | 515,226 | | | $ | 160,039 | | | $ | (160,039 | ) | | $ | 515,226 | |
| | | | | | | | | | | | | | | | |
| | | | |
Segment profit | | $ | 352,165 | | | $ | 63,524 | | | $ | (63,524 | ) | | $ | 352,165 | |
| | | | | | | | | | | | | | | | |
Equity income (loss) | | $ | (860 | ) | | $ | 16,882 | | | $ | 0 | | | $ | 16,022 | |
| | | | | | | | | | | | | | | | |
| | | | |
For the year ended December 31, 2009: | | | | | | | | | | | | | | | | |
Third party revenues | | $ | 550,505 | | | $ | 73,234 | | | $ | (37,904 | ) | | $ | 585,835 | |
Intersegment revenues | | | (20,356 | ) | | | 41,148 | | | | (20,792 | ) | | | 0 | |
| | | | | | | | | | | | | | | | |
Total revenues | | $ | 530,149 | | | $ | 114,382 | | | $ | (58,696 | ) | | $ | 585,835 | |
| | | | | | | | | | | | | | | | |
| | | | |
Segment profit | | $ | 333,560 | | | $ | 26,948 | | | $ | (6,842 | ) | | $ | 353,666 | |
| | | | | | | | | | | | | | | | |
Equity income (loss) | | $ | 0 | | | $ | (69 | ) | | $ | 0 | | | $ | (69 | ) |
| | | | | | | | | | | | | | | | |
| | | | |
As of December 31, 2011: | | | | | | | | | | | | | | | | |
Capital expenditures | | $ | 1,001,206 | | | $ | 284,288 | | | $ | (284,288 | ) | | $ | 1,001,206 | |
| | | | | | | | | | | | | | | | |
Goodwill | | $ | 218,256 | | | $ | 0 | | | $ | 0 | | | $ | 218,256 | |
| | | | | | | | | | | | | | | | |
Total assets | | $ | 3,791,587 | | | $ | 1,255,977 | | | $ | (1,255,977 | ) | | $ | 3,791,587 | |
| | | | | | | | | | | | | | | | |
| | | | |
As of December 31, 2010: | | | | | | | | | | | | | | | | |
Capital expenditures | | $ | 561,794 | | | $ | 353,522 | | | $ | (353,522 | ) | | $ | 561,794 | |
| | | | | | | | | | | | | | | | |
Goodwill | | $ | 218,256 | | | $ | 0 | | | $ | 0 | | | $ | 218,256 | |
| | | | | | | | | | | | | | | | |
Total assets | | $ | 3,477,420 | | | $ | 942,784 | | | $ | (942,784 | ) | | $ | 3,477,420 | |
| | | | | | | | | | | | | | | | |
The following table reconciles the segment profits reported above to income (loss) before income taxes:
| | | | | | | | | | | | |
| | | Years ended December 31, | |
(in thousands) | | 2011 | | | 2010 | | | 2009 | |
Segment profits | | $ | 558,679 | | | $ | 352,165 | | | $ | 353,666 | |
Depreciation, depletion and amortization | | | (362,956 | ) | | | (196,963 | ) | | | (221,438 | ) |
Write-down of oil and natural gas properties | | | (233,239 | ) | | | 0 | | | | (1,293,579 | ) |
Accretion of discount on asset retirement obligations | | | (3,652 | ) | | | (3,758 | ) | | | (7,132 | ) |
General and administrative | | | (104,618 | ) | | | (105,114 | ) | | | (99,177 | ) |
Gain on divestitures and other operating items | | | (23,819 | ) | | | 509,872 | | | | 676,434 | |
Interest expense | | | (61,023 | ) | | | (45,533 | ) | | | (147,161 | ) |
Gain on derivative financial instruments | | | 219,730 | | | | 146,516 | | | | 232,025 | |
Other income | | | 788 | | | | 327 | | | | 126 | |
Equity income (loss) | | | 32,706 | | | | 16,022 | | | | (69 | ) |
| | | | | | | | | | | | |
Income (loss) before income taxes | | $ | 22,596 | | | $ | 673,534 | | | $ | (506,305 | ) |
| | | | | | | | | | | | |
109
We hold equity investments in four entities with BG Group, which are described below. We use the equity method of accounting for each investment.
| | • | | We have a 50% ownership in TGGT, which holds interests in midstream assets in East Texas and North Louisiana. During the first quarter of 2011, TGGT closed on its credit facility and used a majority of the proceeds from the initial draw to make a return of capital distribution to both us and BG Group of $250.0 million, $125.0 million net to each partner. On May 28, 2011, an incident occurred at a TGGT amine treating facility which resulted in the immediate shut-down of two treating facilities and the recognition of a $12.0 million impairment in the second quarter of 2011. During the third quarter of 2011, TGGT collected an insurance reimbursement of approximately $6.2 million related to the damaged facility. |
| | • | | We own a 50% interest in OPCO, which operates the Appalachia JV properties, subject to oversight from a management board having equal representation from EXCO and BG Group. During 2011, EXCO and BG Group each contributed $3.1 million to OPCO, which is equal to OPCO’s 0.5% interest in the 2011 property acquisitions, plus all related working capital items and other fixed assets that will be used to service the properties acquired, and capital contributions for OPCO’s drilling and operating budget needs. |
| | • | | We own a 50% interest in the Appalachia Midstream JV, through which we and BG Group will pursue the construction and expansion of gathering systems for anticipated future production from the Marcellus shale. During 2011, EXCO and BG Group each contributed $8.0 million to the Appalachia Midstream JV to fund their capital budget and operation needs. |
| | • | | We own a 50% interest in an entity that manages certain surface acreage. |
The following tables present summarized consolidated financial information of our equity investments and a reconciliation of our investment to our proportionate 50% interest.
| | | | | | | | |
| | | December 31, | |
(in thousands) | | 2011 | | | 2010 | |
Assets | | | | | | | | |
Total current assets | | $ | 230,722 | | | $ | 120,475 | |
Property and equipment, net | | | 1,173,642 | | | | 873,228 | |
Other assets | | | 3,759 | | | | 6,143 | |
| | | | | | | | |
Total assets | | $ | 1,408,123 | | | $ | 999,846 | |
| | | | | | | | |
Liabilities and members’ equity | | | | | | | | |
Total current liabilities | | $ | 253,646 | | | $ | 145,006 | |
Total long-term liabilities | | | 465,817 | | | | 10,092 | |
Members’ equity: | | | | | | | | |
Total members’ equity | | | 688,660 | | | | 844,748 | |
| | | | | | | | |
Total liabilities and members’ equity | | $ | 1,408,123 | | | $ | 999,846 | |
| | | | | | | | |
| | | | | | | | | | | | |
| | | For the year ended | |
| | | December 31, 2011 | | | December 31, 2010 | | | December 31, 2009 | |
Revenues | | | | | | | | | | | | |
Oil and natural gas | | $ | 524 | | | $ | 168 | | | $ | 0 | |
Midstream | | | 242,366 | | | | 160,039 | | | | 37,904 | |
| | | | | | | | | | | | |
Total revenues | | | 242,890 | | | | 160,207 | | | | 37,904 | |
| | | | | | | | | | | | |
Costs and expenses: | | | | | | | | | | | | |
Oil and natural gas production | | | 55 | | | | 268 | | | | 0 | |
Midstream operating | | | 108,116 | | | | 96,515 | | | | 31,062 | |
Depreciation, depletion and amortization | | | 28,482 | | | | 18,226 | | | | 5,350 | |
Write-down of oil and natural gas properties | | | 1,445 | | | | 0 | | | | 0 | |
Other expenses | | | 42,496 | | | | 16,396 | | | | 2,753 | |
| | | | | | | | | | | | |
Total costs and expenses | | | 180,594 | | | | 131,405 | | | | 39,165 | |
| | | | | | | | | | | | |
Income before income taxes | | | 62,296 | | | | 28,802 | | | | (1,261 | ) |
Income tax expense | | | 636 | | | | 288 | | | | 110 | |
| | | | | | | | | | | | |
Net income (loss) | | $ | 61,660 | | | $ | 28,514 | | | $ | (1,371 | ) |
| | | | | | | | | | | | |
EXCO’s share of equity income (loss) before amortization | | $ | 30,830 | | | $ | 14,257 | | | $ | (686 | ) |
Amortization of the difference in the historical basis of our contribution | | | 1,876 | | | | 1,765 | | | | 617 | |
| | | | | | | | | | | | |
EXCO’s share of equity income (loss) after amortization | | $ | 32,706 | | | $ | 16,022 | | | $ | (69 | ) |
| | | | | | | | | | | | |
110
| | | | | | | | |
| | | December 31, | |
(in thousands) | | 2011 | | | 2010 | |
Equity investments | | $ | 302,833 | | | $ | 379,001 | |
Basis adjustment (1) | | | 45,755 | | | | 45,755 | |
Cumulative amortization of basis adjustment (2) | | | (4,258 | ) | | | (2,382 | ) |
| | | | | | | | |
EXCO’s 50% interest in equity investments | | $ | 344,330 | | | $ | 422,374 | |
| | | | | | | | |
| (1) | Our equity in TGGT and OPCO, at inception, exceeded the book value of our investments by an aggregate of $45.8 million, comprised of an aggregate $57.2 million difference in the historical basis of our contribution and the fair value of BG Group’s contribution offset by $11.4 million of goodwill included in our investment in TGGT. |
| (2) | The $57.2 million basis difference is being amortized over the estimated life of the associated assets. |
On November 17, 2011, our board of directors approved a fourth quarter 2011 cash dividend of $0.04 per share. The total cash dividend was $8.6 million, of which $8.5 million was paid on December 15, 2011 to holders of record on November 30, 2011 and $0.1 million was accrued to be paid to restricted shareholders when their shares vest. Total dividends paid to our shareholders in 2011 were $34.2 million and $0.1 million will be paid when restricted shares vest. Any future declaration of dividends, as well as the establishment of record and payment dates, is subject to limitations under the EXCO Resources Credit Agreement, the Indenture governing the 2018 Notes and the approval of our board of directors.
On July 19, 2010, we announced a share repurchase program which authorizes us to purchase up to $200.0 million of our common stock. Any repurchases will be made in the open market, in privately negotiated transactions or in structured share repurchase programs, and may be made from time to time and in one or more large repurchases. The program will be conducted in compliance with the Securities and Exchange Commission’s Rule 10b-18 and applicable legal requirements and shall be subject to market conditions and other factors. EXCO is not obligated to repurchase any common stock, or any particular amount of common stock, and the repurchase program may be modified or suspended at any time at EXCO’s discretion. The repurchases may be funded from available cash or borrowings under the EXCO Resources Credit Agreement.
As of December 31, 2011, we have repurchased a total of 539,221 shares for $7.5 million at an average price of $13.87 per share. The program was suspended as a result of the pending strategic alternatives being evaluated by a special committee of our board of directors in connection with the October 29, 2010 proposal from our Chairman and Chief Executive Officer to purchase all of our outstanding common stock. On July 8, 2011, the special committee of our board of directors terminated their strategic alternatives review process and on August 5, 2011, our board of directors agreed to reinstate the repurchase program.
| 19. | Former acquisition proposal |
On October 29, 2010, our Chairman and Chief Executive Officer, Douglas H. Miller, presented a letter to our board of directors indicating an interest in acquiring all of the outstanding shares of our stock not already owned by Mr. Miller for a cash purchase price of $20.50 per share. The proposal did not represent a definitive offer and there was no assurance that a definitive offer would be made or accepted, that any agreement would be executed or that any transaction would be consummated. Our board of directors established a special committee on November 4, 2010 comprised of two independent directors to, among other things, evaluate and determine the Company’s response to the October 29, 2010 proposal.
On January 13, 2011, the special committee of the board of directors announced it would explore strategic alternatives to maximize shareholder value, including a potential sale of the Company. As part of a comprehensive process, the special committee stated that it would consider Mr. Miller’s proposal as well as acquisition proposals the special committee may receive from other interested parties and other strategic alternatives potentially available to the Company. At the direction of the special committee, the Company adopted a shareholder rights plan, or the Rights Plan, with a one year term. On August 19, 2011, the Board determined to amend the Rights Plan to accelerate the expiration date from the close of business on January 24, 2012 to the close of business on September 30, 2011.
On July 8, 2011, after consultation with its independent financial and legal advisors, the special committee released a statement that its review of strategic alternatives did not result in any firm proposal or any other proposal that was in the best interests of the Company and its shareholders and that they had terminated the review process. On August 12, 2011, our board of directors, following the report of the special committee that it had fulfilled its responsibilities, determined that it was appropriate to disband the special committee. In addition, certain shareholder derivative lawsuits and shareholder class action suits that were filed in connection with the acquisition proposal were either voluntarily non-suited or dismissed in the third quarter of 2011.
111
On February 3, 2012, we entered into an agreement granting a forty-five day exclusivity period to an unaffiliated private infrastructure fund to negotiate the sale of a one-third equity interest in TGGT for a purchase price in excess of $400.0 million. We expect that BG Group will participate in this possible transaction. There can be no assurance this transaction will be completed.
| 21. | Consolidating financial statements |
Effective April 30, 2010, the EXCO Operating credit agreement was consolidated into the EXCO Resources Credit Agreement, with certain non-guarantor subsidiaries, including EXCO Operating, which owns all of our East Texas/North Louisiana assets, becoming restricted subsidiaries and guarantor subsidiaries under our 2011 Notes. The accompanying condensed consolidating financial statements are presented as if the previous non-guarantor subsidiaries were guarantor subsidiaries for each of the periods presented.
As of December 31, 2011, the majority of EXCO’s subsidiaries are guarantors under the EXCO Resources Credit Agreement and the indenture governing the 2018 Notes. All of our non-guarantor subsidiaries are considered unrestricted subsidiaries under the Indenture governing the 2018 Notes, with the exception of our equity investment in OPCO. As of and for the twelve months ended December 31, 2011:
| | • | | Our equity method investment in OPCO represented $2.4 million of equity method investments and contributed $1.1 million of equity method losses; and |
| | • | | Our interests in jointly held entities with BG Group, with the exception of OPCO, represented $300.4 million of equity method investments, or 7.9% of our total assets and contributed $33.8 million of equity method income. |
Set forth below are condensed consolidating financial statements of EXCO, the guarantor subsidiaries and the non-guarantor subsidiaries. The 2018 Notes, which were issued by EXCO Resources, Inc., are jointly and severally guaranteed by some of our subsidiaries (referred to as Guarantor Subsidiaries). Each of the Guarantor Subsidiaries are wholly-owned subsidiaries of Resources (defined below), and the guarantees are unconditional as it relates to the assets of the Guarantor Subsidiaries. For purposes of this footnote, EXCO Resources, Inc. is referred to as Resources to distinguish it from the Guarantor Subsidiaries.
The following financial information presents consolidating financial statements, which include:
| | • | | the Guarantor Subsidiaries on a combined basis; |
| | • | | the Non-Guarantor Subsidiaries; |
| | • | | elimination entries necessary to consolidate Resources, the Guarantor Subsidiaries and the Non-Guarantor Subsidiaries; and |
| | • | | EXCO on a consolidated basis. |
Investments in subsidiaries are accounted for using the equity method of accounting. The financial information for the Guarantor Subsidiaries and the Non-Guarantor Subsidiaries is presented on a combined basis. The elimination entries primarily eliminate investments in subsidiaries and intercompany balances and transactions.
112
EXCO Resources, Inc.
Consolidating Balance Sheet
December 31, 2011
| | | | | | | | | | | | | | | | | | | | |
(in thousands) | | Resources | | | Guarantor
subsidiaries | | | Non-guarantor
subsidiaries | | | Eliminations | | | Consolidated | |
Assets | | | | | | | | | | | | | | | | | | | | |
Current assets: | | | | | | | | | | | | | | | | | | | | |
Cash and cash equivalents | | $ | 78,664 | | | $ | (46,667 | ) | | $ | 0 | | | $ | 0 | | | | 31,997 | |
Restricted cash | | | 0 | | | | 155,925 | | | | 0 | | | | 0 | | | | 155,925 | |
Other current assets | | | 177,709 | | | | 312,377 | | | | 0 | | | | 0 | | | | 490,086 | |
| | | | | | | | | | | | | | | | | | | | |
Total current assets | | | 256,373 | | | | 421,635 | | | | 0 | | | | 0 | | | | 678,008 | |
| | | | | | | | | | | | | | | | | | | | |
Equity investments | | | 0 | | | | 0 | | | | 302,833 | | | | 0 | | | | 302,833 | |
Oil and natural gas properties (full cost accounting method): | | | | | | | | | | | | | | | | | | | | |
Unproved oil and natural gas properties | | | 15,942 | | | | 651,400 | | | | 0 | | | | 0 | | | | 667,342 | |
Proved developed and undeveloped oil and natural gas properties | | | 464,898 | | | | 2,927,248 | | | | 0 | | | | 0 | | | | 3,392,146 | |
Accumulated depletion | | | (327,218 | ) | | | (1,329,947 | ) | | | 0 | | | | 0 | | | | (1,657,165 | ) |
| | | | | | | | | | | | | | | | | | | | |
Oil and natural gas properties, net | | | 153,622 | | | | 2,248,701 | | | | 0 | | | | 0 | | | | 2,402,323 | |
| | | | | | | | | | | | | | | | | | | | |
Gas gathering, office and field equipment, net | | | 27,815 | | | | 121,668 | | | | 0 | | | | 0 | | | | 149,483 | |
Investments in and advances to affiliates | | | 869,387 | | | | 0 | | | | 0 | | | | (869,387 | ) | | | 0 | |
Deferred financing costs, net | | | 29,622 | | | | 0 | | | | 0 | | | | 0 | | | | 29,622 | |
Derivative financial instruments | | | 5,998 | | | | 5,036 | | | | 0 | | | | 0 | | | | 11,034 | |
Goodwill | | | 38,100 | | | | 180,156 | | | | 0 | | | | 0 | | | | 218,256 | |
Other assets | | | 3 | | | | 25 | | | | 0 | | | | 0 | | | | 28 | |
| | | | | | | | | | | | | | | | | | | | |
Total assets | | $ | 1,380,920 | | | $ | 2,977,221 | | | $ | 302,833 | | | $ | (869,387 | ) | | $ | 3,791,587 | |
| | | | | | | | | | | | | | | | | | | | |
| | | | | |
Liabilities and shareholders’ equity | | | | | | | | | | | | | | | | | | | | |
Current liabilities | | $ | 39,395 | | | $ | 248,004 | | | $ | 0 | | | $ | 0 | | | | 287,399 | |
Long-term debt | | | 1,887,828 | | | | 0 | | | | 0 | | | | 0 | | | | 1,887,828 | |
Deferred income taxes | | | 0 | | | | 0 | | | | 0 | | | | 0 | | | | 0 | |
Other liabilities | | | 7,740 | | | | 50,288 | | | | 0 | | | | 0 | | | | 58,028 | |
Payable to parent | | | (2,112,375 | ) | | | 2,118,531 | | | | (6,156 | ) | | | 0 | | | | 0 | |
Total shareholders’ equity | | | 1,558,332 | | | | 560,398 | | | | 308,989 | | | | (869,387 | ) | | | 1,558,332 | |
| | | | | | | | | | | | | | | | | | | | |
Total liabilities and shareholders’ equity | | $ | 1,380,920 | | | $ | 2,977,221 | | | $ | 302,833 | | | $ | (869,387 | ) | | $ | 3,791,587 | |
| | | | | | | | | | | | | | | | | | | | |
113
EXCO Resources, Inc.
Consolidating Balance Sheet
December 31, 2010
| | | | | | | | | | | | | | | | | | | | |
| | | | | | Guarantor | | | Non-guarantor | | | | | | | |
(in thousands) | | Resources | | | subsidiaries | | | subsidiaries | | | Eliminations | | | Consolidated | |
Assets | | | | | | | | | | | | | | | | | | | | |
Current assets: | | | | | | | | | | | | | | | | | | | | |
Cash and cash equivalents | | $ | 76,763 | | | $ | (32,534 | ) | | $ | 0 | | | $ | 0 | | | $ | 44,229 | |
Restricted cash | | | 0 | | | | 161,717 | | | | 0 | | | | 0 | | | | 161,717 | |
Other current assets | | | 83,913 | | | | 230,590 | | | | 11 | | | | 0 | | | | 314,514 | |
| | | | | | | | | | | | | | | | | | | | |
Total current assets | | | 160,676 | | | | 359,773 | | | | 11 | | | | 0 | | | | 520,460 | |
| | | | | | | | | | | | | | | | | | | | |
Equity Investment | | | 0 | | | | 0 | | | | 379,001 | | | | 0 | | | | 379,001 | |
Oil and natural gas properties (full cost accounting method): | | | | | | | | | | | | | | | | | | | | |
Unproved oil and natural gas properties and development costs not being amortized | | | 37,818 | | | | 561,591 | | | | 0 | | | | 0 | | | | 599,409 | |
Proved developed and undeveloped oil and natural gas properties | | | 385,357 | | | | 1,985,605 | | | | 0 | | | | 0 | | | | 2,370,962 | |
Accumulated depletion | | | (295,453 | ) | | | (1,016,763 | ) | | | 0 | | | | 0 | | | | (1,312,216 | ) |
| | | | | | | | | | | | | | | | | | | | |
Oil and natural gas properties, net | | | 127,722 | | | | 1,530,433 | | | | 0 | | | | 0 | | | | 1,658,155 | |
| | | | | | | | | | | | | | | | | | | | |
Gas gathering, office and field equipment, net | | | 28,837 | | | | 131,276 | | | | 16,193 | | | | 0 | | | | 176,306 | |
Investments in and advances to affiliates | | | 964,806 | | | | 92,973 | | | | 0 | | | | (1,057,779 | ) | | | 0 | |
Deferred financing costs, net | | | 30,704 | | | | 0 | | | | 0 | | | | 0 | | | | 30,704 | |
Derivative financial instruments | | | 13,665 | | | | 10,057 | | | | 0 | | | | 0 | | | | 23,722 | |
Goodwill | | | 38,100 | | | | 180,156 | | | | 0 | | | | 0 | | | | 218,256 | |
Other assets | | | 3 | | | | 470,813 | | | | 0 | | | | 0 | | | | 470,816 | |
| | | | | | | | | | | | | | | | | | | | |
Total assets | | $ | 1,364,513 | | | $ | 2,775,481 | | | $ | 395,205 | | | $ | (1,057,779 | ) | | $ | 3,477,420 | |
| | | | | | | | | | | | | | | | | | | | |
| | | | | |
Liabilities and shareholders’ equity | | | | | | | | | | | | | | | | | | | | |
Current liabilities | | $ | 50,654 | | | $ | 228,332 | | | $ | 6,712 | | | $ | 0 | | | | 285,698 | |
Long-term debt | | | 1,588,269 | | | | 0 | | | | 0 | | | | 0 | | | | 1,588,269 | |
Deferred income taxes | | | 0 | | | | 0 | | | | 0 | | | | 0 | | | | 0 | |
Other liabilities | | | 10,234 | | | | 52,667 | | | | 0 | | | | 0 | | | | 62,901 | |
Payable to parent | | | (1,825,196 | ) | | | 1,821,530 | | | | 3,666 | | | | 0 | | | | 0 | |
Total shareholders’ equity | | | 1,540,552 | | | | 672,952 | | | | 384,827 | | | | (1,057,779 | ) | | | 1,540,552 | |
| | | | | | | | | | | | | | | | | | | | |
Total liabilities and shareholders’ equity | | $ | 1,364,513 | | | $ | 2,775,481 | | | $ | 395,205 | | | $ | (1,057,779 | ) | | $ | 3,477,420 | |
| | | | | | | | | | | | | | | | | | | | |
114
EXCO Resources, Inc.
Consolidating Statement of Operations
For the year ended December 31, 2011
| | | | | | | | | | | | | | | | | | | | |
(in thousands) | | Resources | | | Guarantor
subsidiaries | | | Non-
guarantor
subsidiaries | | | Eliminations | | | Consolidated | |
Revenues: | | | | | | | | | | | | | | | | | | | | |
Oil and natural gas | | $ | 93,663 | | | $ | 660,538 | | | $ | 0 | | | $ | 0 | | | $ | 754,201 | |
| | | | | | | | | | | | | | | | | | | | |
Costs and expenses: | | | | | | | | | | | | | | | | | | | | |
Oil and natural gas production | | | 19,166 | | | | 89,475 | | | | 0 | | | | 0 | | | | 108,641 | |
Gathering and transportation | | | 0 | | | | 86,881 | | | | 0 | | | | 0 | | | | 86,881 | |
Depreciation, depletion and amortization | | | 39,954 | | | | 322,853 | | | | 149 | | | | 0 | | | | 362,956 | |
Write-down of oil and natural gas properties | | | 0 | | | | 233,239 | | | | 0 | | | | 0 | | | | 233,239 | |
Accretion of discount on asset retirement obligations | | | 442 | | | | 3,210 | | | | 0 | | | | 0 | | | | 3,652 | |
General and administrative | | | 27,559 | | | | 77,059 | | | | 0 | | | | 0 | | | | 104,618 | |
Other operating items | | | 19,122 | | | | 4,973 | | | | (276 | ) | | | 0 | | | | 23,819 | |
| | | | | | | | | | | | | | | | | | | | |
Total costs and expenses | | | 106,243 | | | | 817,690 | | | | (127 | ) | | | 0 | | | | 923,806 | |
| | | | | | | | | | | | | | | | | | | | |
Operating income (loss) | | | (12,580 | ) | | | (157,152 | ) | | | 127 | | | | 0 | | | | (169,605 | ) |
Other income (expense): | | | | | | | | | | | | | | | | | | | | |
Interest expense | | | (59,764 | ) | | | (1,259 | ) | | | 0 | | | | 0 | | | | (61,023 | ) |
Gain on derivative financial instruments | | | 190,043 | | | | 29,687 | | | | 0 | | | | 0 | | | | 219,730 | |
Other income | | | 316 | | | | 472 | | | | 0 | | | | 0 | | | | 788 | |
Equity method income | | | 0 | | | | 0 | | | | 32,706 | | | | 0 | | | | 32,706 | |
Equity in earnings of subsidiaries | | | (95,419 | ) | | | 0 | | | | 0 | | | | 95,419 | | | | 0 | |
| | | | | | | | | | | | | | | | | | | | |
Total other income (expense) | | | 35,176 | | | | 28,900 | | | | 32,706 | | | | 95,419 | | | | 192,201 | |
| | | | | | | | | | | | | | | | | | | | |
Income (loss) before income taxes | | | 22,596 | | | | (128,252 | ) | | | 32,833 | | | | 95,419 | | | | 22,596 | |
Income tax expense | | | 0 | | | | 0 | | | | 0 | | | | 0 | | | | 0 | |
| | | | | | | | | | | | | | | | | | | | |
Net income (loss) | | | 22,596 | | | | (128,252 | ) | | | 32,833 | | | | 95,419 | | | | 22,596 | |
| | | | | | | | | | | | | | | | | | | | |
115
EXCO Resources, Inc.
Consolidating Statement of Operations
For the year ended December 31, 2010
| | | | | | | | | | | | | | | | | | | | |
(in thousands) | | Resources | | | Guarantor
subsidiaries | | | Non-
guarantor
subsidiaries | | | Eliminations | | | Consolidated | |
Revenues: | | | | | | | | | | | | | | | | | | | | |
Oil and natural gas | | $ | 71,584 | | | $ | 430,097 | | | $ | 13,545 | | | $ | 0 | | | $ | 515,226 | |
| | | | | | | | | | | | | | | | | | | | |
Costs and expenses: | | | | | | | | | | | | | | | | | | | | |
Oil and natural gas production | | | 15,396 | | | | 91,423 | | | | 1,365 | | | | 0 | | | | 108,184 | |
Gathering and transportation | | | 0 | | | | 53,577 | | | | 1,300 | | | | 0 | | | | 54,877 | |
Depreciation, depletion and amortization | | | 26,479 | | | | 165,041 | | | | 5,443 | | | | 0 | | | | 196,963 | |
Accretion of discount on asset retirement obligations | | | 346 | | | | 3,408 | | | | 4 | | | | 0 | | | | 3,758 | |
General and administrative | | | 29,571 | | | | 75,543 | | | | 0 | | | | 0 | | | | 105,114 | |
Gain on divestitures and other operating items | | | 17,286 | | | | (526,585 | ) | | | (573 | ) | | | 0 | | | | (509,872 | ) |
| | | | | | | | | | | | | | | | | | | | |
Total costs and expenses | | | 89,078 | | | | (137,593 | ) | | | 7,539 | | | | 0 | | | | (40,976 | ) |
| | | | | | | | | | | | | | | | | | | | |
Operating income (loss) | | | (17,494 | ) | | | 567,690 | | | | 6,006 | | | | 0 | | | | 556,202 | |
Other income (expense): | | | | | | | | | | | | | | | | | | | | |
Interest expense | | | (38,780 | ) | | | (6,753 | ) | | | 0 | | | | 0 | | | | (45,533 | ) |
Gain on derivative financial instruments | | | 54,631 | | | | 91,885 | | | | 0 | | | | 0 | | | | 146,516 | |
Equity income | | | 0 | | | | 0 | | | | 16,022 | | | | 0 | | | | 16,022 | |
Other income (expense) | | | 10,423 | | | | (10,096 | ) | | | 0 | | | | 0 | | | | 327 | |
Equity in earnings of subsidiaries | | | 664,754 | | | | 0 | | | | 0 | | | | (664,754 | ) | | | 0 | |
| | | | | | | | | | | | | | | | | | | | |
Total other income (expense) | | | 691,028 | | | | 75,036 | | | | 16,022 | | | | (664,754 | ) | | | 117,332 | |
| | | | | | | | | | | | | | | | | | | | |
Income (loss) before income taxes | | | 673,534 | | | | 642,726 | | | | 22,028 | | | | (664,754 | ) | | | 673,534 | |
Income tax expense | | | 1,608 | | | | 0 | | | | 0 | | | | 0 | | | | 1,608 | |
| | | | | | | | | | | | | | | | | | | | |
Net income (loss) | | $ | 671,926 | | | $ | 642,726 | | | $ | 22,028 | | | $ | (664,754 | ) | | | 671,926 | |
| | | | | | | | | | | | | | | | | | | | |
116
EXCO Resources, Inc.
Consolidating Statement of Operations
For the year ended December 31, 2009
| | | | | | | | | | | | | | | | | | | | |
(in thousands) | | Resources | | | Guarantor
subsidiaries | | | Non-
guarantor
subsidiaries | | | Eliminations | | | Consolidated | |
Revenues: | | | | | | | | | | | | | | | | | | | | |
Oil and natural gas | | $ | 142,963 | | | $ | 407,542 | | | $ | 0 | | | $ | 0 | | | $ | 550,505 | |
Midstream | | | 0 | | | | 35,330 | | | | 0 | | | | 0 | | | | 35,330 | |
| | | | | | | | | | | | | | | | | | | | |
Total revenues | | | 142,963 | | | | 442,872 | | | | 0 | | | | 0 | | | | 585,835 | |
| | | | | | | | | | | | | | | | | | | | |
Costs and expenses: | | | | | | | | | | | | | | | | | | | | |
Oil and natural gas production | | | 44,158 | | | | 133,471 | | | | 0 | | | | 0 | | | | 177,629 | |
Midstream operating expenses | | | 0 | | | | 35,580 | | | | 0 | | | | 0 | | | | 35,580 | |
Gathering and transportation | | | 86 | | | | 18,874 | | | | 0 | | | | 0 | | | | 18,960 | |
Depreciation, depletion and amortization | | | 45,555 | | | | 175,883 | | | | 0 | | | | 0 | | | | 221,438 | |
Write-down of oil and natural gas properties | | | 279,632 | | | | 1,013,947 | | | | 0 | | | | 0 | | | | 1,293,579 | |
Accretion of discount on asset retirement obligations | | | 1,628 | | | | 5,504 | | | | 0 | | | | 0 | | | | 7,132 | |
General and administrative | | | 26,319 | | | | 72,858 | | | | 0 | | | | 0 | | | | 99,177 | |
Gain on divestitures and other operating items | | | (332,327 | ) | | | (344,107 | ) | | | 0 | | | | 0 | | | | (676,434 | ) |
| | | | | | | | | | | | | | | | | | | | |
Total costs and expenses | | | 65,051 | | | | 1,112,010 | | | | 0 | | | | 0 | | | | 1,177,061 | |
| | | | | | | | | | | | | | | | | | | | |
Operating income (loss) | | | 77,912 | | | | (669,138 | ) | | | 0 | | | | 0 | | | | (591,226 | ) |
Other income (expense): | | | | | | | | | | | | | | | | | | | | |
Interest expense | | | (58,927 | ) | | | (88,234 | ) | | | 0 | | | | 0 | | | | (147,161 | ) |
Gain on derivative financial instruments | | | 54,286 | | | | 177,739 | | | | 0 | | | | 0 | | | | 232,025 | |
Equity loss | | | 0 | | | | 0 | | | | (69 | ) | | | 0 | | | | (69 | ) |
Other income (expense) | | | 24,845 | | | | (24,719 | ) | | | 0 | | | | 0 | | | | 126 | |
Equity in earnings of subsidiaries | | | (604,241 | ) | | | 0 | | | | 0 | | | | 604,241 | | | | 0 | |
| | | | | | | | | | | | | | | | | | | | |
Total other income (expense) | | | (584,037 | ) | | | 64,786 | | | | (69 | ) | | | 604,241 | | | | 84,921 | |
| | | | | | | | | | | | | | | | | | | | |
Income (loss) before income taxes | | | (506,125 | ) | | | (604,352 | ) | | | (69 | ) | | | 604,241 | | | | (506,305 | ) |
Income tax expense | | | (9,321 | ) | | | (180 | ) | | | 0 | | | | 0 | | | | (9,501 | ) |
| | | | | | | | | | | | | | | | | | | | |
Net income (loss) available to common shareholders | | $ | (496,804 | ) | | $ | (604,172 | ) | | $ | (69 | ) | | $ | 604,241 | | | $ | (496,804 | ) |
| | | | | | | | | | | | | | | | | | | | |
117
EXCO Resources, Inc.
Consolidating Statement of Cash Flow
For the year ended December 31, 2011
| | | | | | | | | | | | | | | | | | | | |
(in thousands) | | Resources | | | Guarantor
subsidiaries | | | Non-
guarantor
subsidiaries | | | Eliminations | | | Consolidated | |
Operating Activities: | | | | | | | | | | | | | | | | | | | | |
Net cash provided by operating activities | | $ | 71,636 | | | $ | 355,736 | | | $ | 1,171 | | | $ | 0 | | | $ | 428,543 | |
| | | | | | | | | | | | | | | | | | | | |
Investing Activities: | | | | | | | | | | | | | | | | | | | | |
Property acquisitions and additions to oil and natural gas properties, gathering systems and equipment | | | (63,089 | ) | | | (1,670,029 | ) | | | (4,253 | ) | | | 0 | | | | (1,737,371 | ) |
Restricted cash | | | 0 | | | | 5,792 | | | | 0 | | | | 0 | | | | 5,792 | |
Deposit on pending acquisitions | | | 0 | | | | 464,151 | | | | 0 | | | | 0 | | | | 464,151 | |
Investment in equity investments | | | 0 | | | | (13,829 | ) | | | 0 | | | | 0 | | | | (13,829 | ) |
Return of investment in equity investments | | | 0 | | | | 125,000 | | | | 0 | | | | 0 | | | | 125,000 | |
Proceeds from dispositions of property and equipment | | | 3,129 | | | | 446,554 | | | | 0 | | | | 0 | | | | 449,683 | |
Advances to Appalachia JV | | | 0 | | | | (1,707 | ) | | | 0 | | | | 0 | | | | (1,707 | ) |
Other | | | 0 | | | | (1,250 | ) | | | 0 | | | | 0 | | | | (1,250 | ) |
Advances/investments with affiliates | | | (278,531 | ) | | | 275,449 | | | | 3,082 | | | | 0 | | | | 0 | |
| | | | | | | | | | | | | | | | | | | | |
Net cash used in investing activities | | | (338,491 | ) | | | (369,869 | ) | | | (1,171 | ) | | | 0 | | | | (709,531 | ) |
| | | | | | | | | | | | | | | | | | | | |
Financing Activities: | | | | | | | | | | | | | | | | | | | | |
Borrowings under credit agreements | | | 706,000 | | | | 0 | | | | 0 | | | | 0 | | | | 706,000 | |
Repayments under credit agreements | | | (407,500 | ) | | | 0 | | | | 0 | | | | 0 | | | | (407,500 | ) |
Proceeds from issuance of common stock | | | 12,063 | | | | 0 | | | | 0 | | | | 0 | | | | 12,063 | |
Payment of common stock dividends | | | (34,238 | ) | | | 0 | | | | 0 | | | | 0 | | | | (34,238 | ) |
Deferred financing costs and other | | | (7,569 | ) | | | 0 | | | | 0 | | | | 0 | | | | (7,569 | ) |
| | | | | | | | | | | | | | | | | | | | |
Net cash provided by financing activities | | | 268,756 | | | | 0 | | | | 0 | | | | 0 | | | | 268,756 | |
| | | | | | | | | | | | | | | | | | | | |
Net increase (decrease) in cash | | | 1,901 | | | | (14,133 | ) | | | 0 | | | | 0 | | | | (12,232 | ) |
Cash at beginning of period | | | 76,763 | | | | (32,534 | ) | | | 0 | | | | 0 | | | | 44,229 | |
| | | | | | | | | | | | | | | | | | | | |
Cash at end of period | | $ | 78,664 | | | $ | (46,667 | ) | | $ | 0 | | | $ | 0 | | | $ | 31,997 | |
| | | | | | | | | | | | | | | | | | | | |
118
EXCO Resources, Inc.
Consolidating Statement of Cash Flow
For the year ended December 31, 2010
| | | | | | | | | | | | | | | | | | | | |
(in thousands) | | Resources | | | Guarantor
subsidiaries | | | Non-
guarantor
subsidiaries | | | Eliminations | | | Consolidated | |
Operating Activities: | | | | | | | | | | | | | | | | | | | | |
Net cash provided by (used in) operating activities | | $ | 70,757 | | | $ | 275,768 | | | $ | (6,604 | ) | | $ | 0 | | | $ | 339,921 | |
| | | | | | | | | | | | | | | | | | | | |
Investing Activities: | | | | | | | | | | | | | | | | | | | | |
Additions to oil and natural gas properties, gathering systems and equipment | | | (68,478 | ) | | | (728,018 | ) | | | (245,475 | ) | | | 0 | | | | (1,041,971 | ) |
Restricted cash | | | 0 | | | | (102,808 | ) | | | 0 | | | | 0 | | | | (102,808 | ) |
Deposit on pending acquisitions | | | 0 | | | | (464,151 | ) | | | 0 | | | | 0 | | | | (464,151 | ) |
Investment in equity investments | | | 0 | | | | (143,740 | ) | | | 0 | | | | 0 | | | | (143,740 | ) |
Proceeds from dispositions of property and equipment | | | 8,624 | | | | 1,036,209 | | | | 0 | | | | 0 | | | | 1,044,833 | |
Advances to Appalachia JV | | | 0 | | | | (5,017 | ) | | | 0 | | | | 0 | | | | (5,017 | ) |
Advances/investments with affiliates | | | (305,326 | ) | | | 53,247 | | | | 252,079 | | | | 0 | | | | 0 | |
| | | | | | | | | | | | | | | | | | | | |
Net cash provided by (used in) investing activities | | | (365,180 | ) | | | (354,278 | ) | | | 6,604 | | | | 0 | | | | (712,854 | ) |
| | | | | | | | | | | | | | | | | | | | |
Financing Activities: | | | | | | | | | | | | | | | | | | | | |
Borrowings under credit agreements | | | 2,022,437 | | | | 49,962 | | | | 0 | | | | 0 | | | | 2,072,399 | |
Repayments under credit agreements | | | (1,945,982 | ) | | | (24,981 | ) | | | 0 | | | | 0 | | | | (1,970,963 | ) |
Proceeds from issuance of 2018 Notes | | | 738,975 | | | | 0 | | | | 0 | | | | 0 | | | | 738,975 | |
Repayment of 2011 Notes | | | (444,720 | ) | | | 0 | | | | 0 | | | | 0 | | | | (444,720 | ) |
Proceeds from issuance of common stock | | | 23,024 | | | | 0 | | | | 0 | | | | 0 | | | | 23,024 | |
Payment of common stock dividends | | | (29,760 | ) | | | 0 | | | | 0 | | | | 0 | | | | (29,760 | ) |
Payment for common shares repurchased | | | (7,479 | ) | | | 0 | | | | 0 | | | | 0 | | | | (7,479 | ) |
Settlements of derivative financial instruments with a financing element | | | (907 | ) | | | 0 | | | | 0 | | | | 0 | | | | (907 | ) |
Deferred financing costs and other | | | (31,814 | ) | | | 0 | | | | 0 | | | | 0 | | | | (31,814 | ) |
| | | | | | | | | | | | | | | | | | | | |
Net cash provided by financing activities | | | 323,774 | | | | 24,981 | | | | 0 | | | | 0 | | | | 348,755 | |
| | | | | | | | | | | | | | | | | | | | |
Net increase (decrease) in cash | | | 29,351 | | | | (53,529 | ) | | | 0 | | | | 0 | | | | (24,178 | ) |
Cash at beginning of period | | | 47,412 | | | | 20,995 | | | | 0 | | | | 0 | | | | 68,407 | |
| | | | | | | | | | | | | | | | | | | | |
Cash at end of period | | $ | 76,763 | | | $ | (32,534 | ) | | $ | 0 | | | $ | 0 | | | $ | 44,229 | |
| | | | | | | | | | | | | | | | | | | | |
119
EXCO Resources, Inc.
Consolidating Statement of Cash Flow
For the year ended December 31, 2009
| | | | | | | | | | | | | | | | | | | | |
(in thousands) | | Resources | | | Guarantor
subsidiaries | | | Non-
guarantor
subsidiaries | | | Eliminations | | | Consolidated | |
Operating Activities: | | | | | | | | | | | | | | | | | | | | |
Net cash provided by operating activities | | $ | 226,012 | | | $ | 207,593 | | | $ | 0 | | | $ | 0 | | | $ | 433,605 | |
| | | | | | | | | | | | | | | | | | | | |
Investing Activities: | | | | | | | | | | | | | | | | | | | | |
Additions to oil and natural gas properties, gathering systems and equipment | | | (44,434 | ) | | | (635,660 | ) | | | (52,602 | ) | | | 0 | | | | (732,696 | ) |
Restricted cash | | | 0 | | | | (58,909 | ) | | | 0 | | | | 0 | | | | (58,909 | ) |
Investment in equity investments | | | 0 | | | | (47,500 | ) | | | 0 | | | | 0 | | | | (47,500 | ) |
Proceeds from dispositions of property and equipment | | | 910,891 | | | | 1,163,489 | | | | 0 | | | | 0 | | | | 2,074,380 | |
Advances/investments with affiliates | | | (137,305 | ) | | | 84,703 | | | | 52,602 | | | | 0 | | | | 0 | |
| | | | | | | | | | | | | | | | | | | | |
Net cash provided by investing activities | | | 729,152 | | | | 506,123 | | | | 0 | | | | 0 | | | | 1,235,275 | |
| | | | | | | | | | | | | | | | | | | | |
Financing Activities: | | | | | | | | | | | | | | | | | | | | |
Borrowings under credit agreements | | | 14,979 | | | | 232,820 | | | | 0 | | | | 0 | | | | 247,799 | |
Repayments under credit agreements | | | (982,444 | ) | | | (1,085,227 | ) | | | 0 | | | | 0 | | | | (2,067,671 | ) |
Proceeds from issuance of common stock, net | | | 10,361 | | | | 0 | | | | 0 | | | | 0 | | | | 10,361 | |
Payment of common stock dividends | | | (10,582 | ) | | | 0 | | | | 0 | | | | 0 | | | | (10,582 | ) |
Settlement of derivative financial instruments with a financing element | | | 56,701 | | | | 126,251 | | | | 0 | | | | 0 | | | | 182,952 | |
Deferred financing costs and other | | | (5,385 | ) | | | (15,086 | ) | | | 0 | | | | 0 | | | | (20,471 | ) |
| | | | | | | | | | | | | | | | | | | | |
Net cash used in financing activities | | | (916,370 | ) | | | (741,242 | ) | | | 0 | | | | 0 | | | | (1,657,612 | ) |
| | | | | | | | | | | | | | | | | | | | |
Net increase (decrease) in cash | | | 38,794 | | | | (27,526 | ) | | | 0 | | | | 0 | | | | 11,268 | |
Cash at the beginning of the period | | | 8,618 | | | | 48,521 | | | | 0 | | | | 0 | | | | 57,139 | |
| | | | | | | | | | | | | | | | | | | | |
Cash at end of period | | $ | 47,412 | | | $ | 20,995 | | | $ | 0 | | | $ | 0 | | | $ | 68,407 | |
| | | | | | | | | | | | | | | | | | | | |
120
| 22. | Quarterly financial data (unaudited) |
The following are summarized quarterly financial data for the years ended December 31, 2011 and 2010:
| | | | | | | | | | | | | | | | |
| | | Quarter | |
(in thousands) | | 1st | | | 2nd | | | 3rd | | | 4th | |
2011 | | | | | | | | | | | | | | | | |
Oil and natural gas revenues | | $ | 161,228 | | | $ | 206,828 | | | $ | 207,274 | | | $ | 178,871 | |
Operating income (loss) | | | 24,631 | | | | 49,028 | | | | 4,892 | | | | (248,156 | ) |
Net income (loss) | | $ | 21,941 | | | $ | 82,362 | | | $ | 84,945 | | | $ | (166,652 | ) |
Basic earnings (loss) per share: | | | | | | | | | | | | | | | | |
Net income (loss) | | $ | 0.10 | | | $ | 0.39 | | | $ | 0.40 | | | $ | (0.78 | ) |
Weighted average shares | | | 213,531 | | | | 213,888 | | | | 214,068 | | | | 214,137 | |
Diluted earnings (loss) per share: | | | | | | | | | | | | | | | | |
Net income (loss) | | $ | 0.10 | | | $ | 0.38 | | | $ | 0.39 | | | $ | (0.78 | ) |
Weighted average shares | | $ | 217,110 | | | | 217,513 | | | | 216,314 | | | | 214,137 | |
| | | | |
2010 | | | | | | | | | | | | | | | | |
Oil and natural gas revenues | | $ | 130,994 | | | $ | 118,344 | | | $ | 130,990 | | | $ | 134,898 | |
Operating income (loss) (a) | | | 26,904 | | | | 577,187 | | | | 9,481 | | | | (57,370 | ) |
Net income (loss) (a) | | $ | 115,568 | | | $ | 564,313 | | | $ | 64,896 | | | $ | (72,851 | ) |
Basic earnings (loss) per share: | | | | | | | | | | | | | | | | |
Net income (loss) | | $ | 0.54 | | | $ | 2.66 | | | $ | 0.31 | | | $ | (0.34 | ) |
Weighted average shares | | | 212,086 | | | | 212,497 | | | | 212,480 | | | | 212,791 | |
Diluted earnings (loss) per share: | | | | | | | | | | | | | | | | |
Net income (loss) | | $ | 0.54 | | | $ | 2.62 | | | $ | 0.30 | | | $ | (0.34 | ) |
Weighted average shares | | | 215,666 | | | | 215,498 | | | | 214,922 | | | | 212,791 | |
| (a) | During the fourth quarter of 2010, we incurred losses, including $45.0 million related to estimated post-closing adjustments for our Appalachia JV, $4.8 million fees incurred in connection with our acquisition proposal, and inventory value reductions and certain legal costs. |
121
| 23. | Supplemental information relating to oil and natural gas producing activities (unaudited) |
The following supplemental information relating to our oil and natural gas producing activities for the years ended December 31, 2011, 2010 and 2009 are presented in accordance with ASC Topic 932, “Extractive Activities, Oil and Gas.”
Presented below are costs incurred in oil and natural gas property acquisition, exploration and development activities:
| | | | |
(in thousands, except per unit amounts) | | Amount | |
2011: | | | | |
Proved property acquisition costs | | $ | 136,295 | |
Unproved property acquisition costs | | | 260,076 | |
| | | | |
Total property acquisition costs (1) | | | 396,371 | |
Development | | | 593,331 | |
Exploration costs (2) | | | 262,120 | |
Lease acquisitions and other (3) | | | 31,466 | |
Capitalized asset retirement costs | | | 3,765 | |
Depreciation, depletion and amortization per Boe | | $ | 11.92 | |
Depreciation, depletion and amortization per Mcfe | | $ | 1.99 | |
2010: | | | | |
Proved property acquisition costs | | $ | 34,042 | |
Unproved property acquisition costs (4) | | | 493,797 | |
| | | | |
Total property acquisition costs | | | 527,839 | |
Development | | | 232,978 | |
Exploration costs (5) | | | 113,617 | |
Lease acquisitions and other (6) | | | 37,518 | |
Capitalized asset retirement costs | | | 1,936 | |
Depreciation, depletion and amortization per Boe | | $ | 10.55 | |
Depreciation, depletion and amortization per Mcfe | | $ | 1.75 | |
2009: | | | | |
Proved property acquisition costs | | $ | 6,473 | |
Unproved property acquisition costs (7) | | | 227,161 | |
| | | | |
Total property acquisition costs | | | 233,634 | |
Development | | | 262,786 | |
Exploration costs (8) | | | 37,051 | |
Lease acquisitions and other (9) | | | 106,040 | |
Capitalized asset retirement costs | | | 879 | |
Depreciation, depletion and amortization per Boe | | $ | 10.37 | |
Depreciation, depletion and amortization per Mcfe | | $ | 1.75 | |
| (1) | Acquisition costs in 2011, net of BG Group reimbursements of $359.1 million, include the Chief Transaction, Appalachia Transaction and the Haynesville Shale Acquisition. |
| (2) | Exploration costs in 2011 include approximately $33.9 million incurred in the Marcellus shale play in Appalachia and approximately $228.2 million in the Shelby Area. |
| (3) | Lease acquisition costs in 2011 are net of acreage reimbursements from BG Group totaling $31.9 million. |
| (4) | Reflects acreage acquisitions of Shelby Area, DeSoto Parish and acreage acquisitions in Appalachia. |
| (5) | Exploration costs in 2010 included approximately $49.8 million incurred in the Marcellus shale play in Appalachia, approximately $40.3 million in non-shale activities in the Kelley’s area of East Texas/North Louisiana and $18.5 million in the Shelby Area. |
| (6) | Lease acquisition costs in 2010 are net of acreage reimbursements from BG Group totaling $58.3 million. |
| (7) | Reflects fourth quarter acquisitions, consisting primarily of undeveloped acreage in the Haynesville shale play in DeSoto Parish and Caddo Parish, Louisiana. |
| (8) | Exploration costs incurred in 2009 included approximately $27.5 million incurred in the Haynesville shale play in Caddo Parish, Louisiana and Gregg County, Texas, approximately $5.5 million in Appalachia and approximately $1.7 million in Permian. |
| (9) | Lease acquisitions in 2009 include approximately $98.7 million and $6.6 million in the Haynesville/Bossier and Marcellus shale plays, respectively. |
122
We retain independent engineering firms to provide annual year-end estimates of our future net recoverable oil and natural gas reserves. The estimated proved net recoverable reserves we show below include only those quantities that we expect to be commercially recoverable at prices and costs in effect at the balance sheet dates under existing regulatory practices and with conventional equipment and operating methods. Proved Developed Reserves represent only those reserves that we may recover through existing wells. Proved Undeveloped Reserves include those reserves that we may recover from new wells on undrilled acreage or from existing wells on which we must make a relatively major expenditure for recompletion or secondary recovery operations. All of our reserves are located onshore in the continental United States of America.
Discounted future cash flow estimates like those shown below are not intended to represent estimates of the fair value of our oil and natural gas properties. Estimates of fair value should also consider unproved reserves, anticipated future oil and natural gas prices, interest rates, changes in development and production costs and risks associated with future production. Because of these and other considerations, any estimate of fair value is subjective and imprecise.
| | | | | | | | | | | | |
| | | Oil
(Mbbls) | | | Natural
Gas
(Mmcf) | | | Mmcfe (1) | |
December 31, 2008 | | | 20,801 | | | | 1,815,138 | | | | 1,939,944 | |
Purchase of reserves in place | | | 0 | | | | 8,065 | | | | 8,065 | |
Discoveries and extensions (2) | | | 202 | | | | 240,844 | | | | 242,056 | |
Revisions of previous estimates (3): | | | | | | | | | | | | |
Changes in price | | | (1,482 | ) | | | (249,948 | ) | | | (258,840 | ) |
Other factors | | | 124 | | | | (54,613 | ) | | | (53,869 | ) |
Sales of reserves in place(4) | | | (12,556 | ) | | | (715,023 | ) | | | (790,359 | ) |
Production | | | (1,571 | ) | | | (118,735 | ) | | | (128,161 | ) |
| | | | | | | | | | | | |
December 31, 2009 | | | 5,518 | | | | 925,728 | | | | 958,836 | |
Purchase of reserves in place | | | 0 | | | | 30,047 | | | | 30,047 | |
Discoveries and extensions (5) | | | 1,631 | | | | 635,841 | | | | 645,627 | |
Revisions of previous estimates (6): | | | | | | | | | | | | |
Changes in price | | | 751 | | | | 48,630 | | | | 53,136 | |
Other factors | | | 549 | | | | 63,089 | | | | 66,383 | |
Sales of reserves in place (7) | | | (403 | ) | | | (140,504 | ) | | | (142,922 | ) |
Production | | | (688 | ) | | | (107,878 | ) | | | (112,006 | ) |
| | | | | | | | | | | | |
December 31, 2010 (8) | | | 7,358 | | | | 1,454,953 | | | | 1,499,101 | |
Purchase of reserves in place | | | 0 | | | | 62,489 | | | | 62,489 | |
Discoveries and extensions (9) | | | 929 | | | | 195,565 | | | | 201,139 | |
Revisions of previous estimates: | | | | | | | | | | | | |
Changes in price | | | 100 | | | | (15,165 | ) | | | (14,565 | ) |
Other factors (10) | | | (1,264 | ) | | | (222,513 | ) | | | (230,097 | ) |
Sales of reserves in place | | | (28 | ) | | | (5,599 | ) | | | (5,767 | ) |
Production | | | (741 | ) | | | (178,266 | ) | | | (182,712 | ) |
| | | | | | | | | | | | |
December 31, 2011 (11) | | | 6,354 | | | | 1,291,464 | | | | 1,329,588 | |
| | | | | | | | | | | | |
Estimated Quantities of Proved Developed Reserves
| | | | | | | | | | | | |
| | | Oil
(Mbbls) | | | Natural
Gas
(Mmcf) | | | Mmcfe (1) | |
Proved developed: | | | | | | | | | | | | |
December 31, 2011 | | | 4,565 | | | | 955,522 | | | | 982,912 | |
December 31, 2010 | | | 4,633 | | | | 793,777 | | | | 821,575 | |
December 31, 2009 | | | 3,505 | | | | 622,160 | | | | 643,190 | |
| | | |
Proved undeveloped: | | | | | | | | | | | | |
December 31, 2011 | | | 1,789 | | | | 335,942 | | | | 346,676 | |
December 31, 2010 | | | 2,725 | | | | 661,176 | | | | 677,526 | |
December 31, 2009 | | | 2,013 | | | | 303,568 | | | | 315,646 | |
123
| (1) | Mcfe—one thousand cubic feet equivalent calculated by converting one Bbl of oil to six Mcf of natural gas. |
| (2) | New discoveries and extensions between December 31, 2008 and December 31, 2009 include 238,475 Mmcfe in East Texas/North Louisiana (primarily in the Haynesville shale play), 2,303 Mmcfe in Appalachia and 1,279 Mmcfe in Permian. |
| (3) | Total revisions of 312,709 Mmcfe reflect negative revisions attributable to price of 258,840 Mmcfe and 65,008 Mmcfe of downward performance revisions, which occurred primarily in our Appalachia region. The other than price downward revisions were offset by positive performance revisions of 11,139 Mmcfe, which occurred primarily in our East Texas/North Louisiana region. |
| (4) | Sales of reserves in place in 2009 reflect 346,283 Mmcfe in East Texas/North Louisiana (including the BG Upstream Transaction), 292,158 Mmcfe in the Mid-Continent area, 121,578 Mmcfe in Appalachia and 30,340 Mmcfe in Permian. |
| (5) | New discoveries and extensions in 2010 include 614,508 Mmcfe in East Texas/North Louisiana, primarily in the Haynesville shale play; 14,699 Mmcfe in Appalachia, of which 10,285 Mmcfe was in the Marcellus shale play; and 16,420 in Permian. |
| (6) | Total net positive revisions of 119,519 Mmcfe reflect upward revisions attributable to price of 53,136 Mmcfe and positive performance revisions of 75,205 Mmcfe and 13,711 Mmcfe in East Texas/North Louisiana and Permian, respectively. These were offset by downward performance revisions of 22,533 Mmcfe in Appalachia related to shallow reserves. |
| (7) | Sales of reserve in place in 2010 are primarily attributable to the Appalachia JV transaction with BG Group which resulted in the sale of 133,123 Mmcfe. |
| (8) | The above reserves do not include our equity interest in OPCO, which represents 0.04% (575 Mmcfe) of our consolidated Proved Reserves at December 31, 2010 and a Standardized Measure of $405,000, or 0.03%, of our consolidated Standard Measure. |
| (9) | New discoveries and extensions in 2011 include 158,649 Mmcfe in East Texas/North Louisiana, primarily in the Haynesville shale, 30,206 Mmcfe in Appalachia, all in the Marcellus shale and 12,284 Mmcfe in Permian. |
| (10) | Total revisions due to Other factors in 2011 include approximately 168,264 Mmcfe of Proved Undeveloped Reserves that were reclassified to unproved reserves as a result of a slower development schedule due to continued low natural gas prices, which extended their scheduling beyond a five-year development horizon. The reclassified Proved Developed Reserves represent all non-shale Proved Undeveloped Reserves in Appalachia and East Texas/North Louisiana. |
| (11) | The above reserves do not include our equity interest in OPCO, which represents 0.04% (576 Mmcfe) of our consolidated Proved Reserves at December 31, 2011 and a Standardized Measure of $576,000, or 0.04%, of our consolidated Standard Measure. |
Standardized measure of discounted future net cash flows
We have summarized the Standardized Measure related to our proved oil, natural gas, and NGL reserves. We have based the following summary on a valuation of Proved Reserves using discounted cash flows based on prices as prescribed by the SEC, costs and economic conditions and a 10% discount rate. The additions to Proved Reserves from the purchase of reserves in place, and new discoveries and extensions could vary significantly from year to year; additionally, the impact of changes to reflect current prices and costs of reserves proved in prior years could also be significant. Accordingly, you should not view the information presented below as an estimate of the fair value of our oil and natural gas properties, nor should you consider the information indicative of any trends.
124
| | | | |
(in thousands) | | Amount | |
Year ended December 31, 2011: | | | | |
Future cash inflows | | $ | 5,950,080 | |
Future production costs | | | 2,231,693 | |
Future development costs | | | 915,399 | |
Future income taxes | | | 390,786 | |
| | | | |
Future net cash flows | | | 2,412,202 | |
Discount of future net cash flows at 10% per annum | | | 985,740 | |
| | | | |
Standardized measure of discounted future net cash flows | | $ | 1,426,462 | |
| | | | |
Year ended December 31, 2010: | | | | |
Future cash inflows | | $ | 6,909,755 | |
Future production costs | | | 2,513,808 | |
Future development costs | | | 1,630,946 | |
Future income taxes | | | 305,115 | |
| | | | |
Future net cash flows | | | 2,459,886 | |
Discount of future net cash flows at 10% per annum | | | 1,236,448 | |
| | | | |
Standardized measure of discounted future net cash flows | | $ | 1,223,438 | |
| | | | |
Year ended December 31, 2009: | | | | |
Future cash inflows | | $ | 3,509,227 | |
Future production costs | | | 1,337,898 | |
Future development costs | | | 695,174 | |
Future income taxes (1) | | | 0 | |
| | | | |
Future net cash flows | | | 1,476,155 | |
Discount of future net cash flows at 10% per annum | | | 728,452 | |
| | | | |
Standardized measure of discounted future net cash flows | | $ | 747,703 | |
| | | | |
| (1) | Due to a 32.2% reduction in price for natural gas in 2009 from 2008, estimated future net cash flows, combined with available net operating loss carry-forwards resulted in no estimated future taxable income as of December 31, 2009. |
During recent years, prices paid for oil and natural gas have fluctuated significantly. The reference prices at December 31, 2011, 2010 and 2009 used in the above table, were $96.19, $79.43 and $61.18 per Bbl of oil, respectively, and $4.12, $4.38 and $3.87 per Mmbtu of natural gas, respectively, in each case adjusted for historical differentials. The prices for oil and natural gas reflect the SEC rules requiring the use of simple average of the first day of the month price for the previous twelve month period.
125
The following are the principal sources of change in the Standardized Measure:
| | | | |
(in thousands) | | Amount | |
Year ended December 31, 2011: | | | | |
Sales and transfers of oil and natural gas produced | | $ | (558,794 | ) |
Net changes in prices and production costs | | | (182,750 | ) |
Extensions and discoveries, net of future development and production costs | | | 293,377 | |
Development costs during the period | | | 405,125 | |
Changes in estimated future development costs | | | 265,864 | |
Revisions of previous quantity estimates (includes revisions—transfer of Proved Undeveloped Reserves to probable reserves) | | | (334,181 | ) |
Sales of reserves in place | | | (6,067 | ) |
Purchase of reserves in place | | | 156,731 | |
Accretion of discount before income taxes | | | 137,519 | |
Changes in timing and other | | | 140,304 | |
Net change in income taxes | | | (114,105 | ) |
| | | | |
Net change | | $ | 203,023 | |
| | | | |
Year ended December 31, 2010: | | | | |
Sales and transfers of oil and natural gas produced | | $ | (353,206 | ) |
Net changes in prices and production costs | | | 231,551 | |
Extensions and discoveries, net of future development and production costs | | | 512,470 | |
Development costs during the period | | | 44,537 | |
Changes in estimated future development costs | | | (50,151 | ) |
Revisions of previous quantity estimates | | | 207,657 | |
Sales of reserves in place | | | (82,445 | ) |
Purchase of reserves in place | | | 51,942 | |
Accretion of discount before income taxes | | | 74,770 | |
Changes in timing and other | | | (28,307 | ) |
Net change in income taxes | | | (133,083 | ) |
| | | | |
Net change | | $ | 475,735 | |
| | | | |
Year ended December 31, 2009: | | | | |
Sales and transfers of oil and natural gas produced | | $ | (356,746 | ) |
Net changes in prices and production costs | | | (915,030 | ) |
Extensions and discoveries, net of future development and production costs | | | 275,622 | |
Development costs during the period | | | 80,218 | |
Changes in estimated future development costs | | | 373,336 | |
Revisions of previous quantity estimates | | | (329,573 | ) |
Sales of reserves in place | | | (1,028,622 | ) |
Purchase of reserves in place | | | 472 | |
Accretion of discount before income taxes | | | 240,507 | |
Changes in timing and other | | | (66,011 | ) |
Net change in income taxes | | | 237,236 | |
| | | | |
Net change | | $ | (1,488,591 | ) |
| | | | |
Costs not subject to amortization
The following table summarizes the categories of costs comprising the amount of unproved properties not subject to amortization by the year in which such costs were incurred. There are no individually significant properties or significant development projects included in costs not being amortized. The majority of the evaluation activities are expected to be completed within one to seven years.
| | | | | | | | | | | | | | | | | | | | |
(in thousands) | | Total | | | 2011 | | | 2010 | | | 2009 | | | 2008 and
prior | |
| | | | | |
Property acquisition costs | | $ | 578,382 | | | $ | 245,993 | | | $ | 218,923 | | | $ | 101,726 | | | $ | 11,740 | |
Exploration and development | | | 50,869 | | | | 50,457 | | | | 412 | | | | 0 | | | | 0 | |
Capitalized interest | | | 38,091 | | | | 26,177 | | | | 11,570 | | | | 344 | | | | 0 | |
| | | | | | | | | | | | | | | | | | | | |
Total | | $ | 667,342 | | | $ | 322,627 | | | $ | 230,905 | | | $ | 102,070 | | | $ | 11,740 | |
| | | | | | | | | | | | | | | | | | | | |
126
| Item 9. | Changes in and Disagreements with Accountants on Accounting and Financial Disclosure |
None.
| Item 9A. | Controls and Procedures |
Disclosure controls and procedures. Pursuant to Rule 13a-15(b) under the Exchange Act, EXCO’s management has evaluated, under the supervision and with the participation of our principal executive officer and principal financial officer, the effectiveness of the design and operation of our disclosure controls and procedures (as defined in Rules 13a-15(e) and 15d-15(e) of the Exchange Act), as of the end of the period covered by this report. This evaluation included consideration of various processes and procedures to ensure that information that is required to be disclosed by EXCO in the reports it files or submits under the Exchange Act is (i) recorded, processed, summarized and reported, within the time periods specified in the SEC’s rules and forms and (ii) accumulated and communicated to EXCO’s management, including our principal executive officer and principal financial officer, as appropriate to allow timely decisions regarding required disclosure.
Based upon this evaluation, our principal executive officer and principal financial officer concluded that, as of December 31, 2011, as a result of the material weakness described below, our disclosure controls and procedures were not effective. Due to this material weakness in preparing our consolidated financial statements for the year ended December 31, 2011, we performed additional procedures to ensure that our consolidated financial statements were fairly presented in all material respects in accordance with U.S. generally accepted accounting principles.
Management’s report on internal control over financial reporting. EXCO’s management is responsible for establishing and maintaining adequate internal control over financial reporting (as defined in Rule 13a-15(f) or 15d-15(f) of the Exchange Act). Management assessed the effectiveness of our internal control over financial reporting as of December 31, 2011, using criteria established inInternal Control-Integrated Framework issued by the Committee of Sponsoring Organizations of the Treadway Commission (COSO). Even an effective internal control system, no matter how well designed, has inherent limitations, including the possibility of human error and circumvention or overriding of controls and therefore can provide only reasonable assurance with respect to reliable financial reporting. Furthermore, the effectiveness of an internal control system in future periods can change with conditions.
A material weakness is a deficiency, or combination of deficiencies, in internal control over financial reporting such that there is a reasonable possibility that a material misstatement of EXCO’s annual or interim financial statements will not be prevented or detected on a timely basis. During the preparation and audit of our consolidated financial statements for the year ended December 31, 2011, we identified that our processes and procedures over the computation of the limitation on capitalized costs, including our review controls, failed to identify that the computation did not appropriately consider income tax effects. This control deficiency resulted in a material error in our 2011 consolidated financial statements that increased the amount of our full cost ceiling test write down for the fourth quarter. Accordingly, management has concluded this deficiency in internal control over financial reporting constituted a material weakness. The error did not affect the reported results of operations or disclosures in any prior interim or annual period.
Our independent registered public accounting firm, KPMG LLP, has issued reports on its assessment of our internal control over financial reporting and our consolidated financial statements that are included in Item 8 of this Annual Report on Form 10-K.
Management’s remediation initiatives. As a result of the error, we have implemented a more comprehensive review of the ceiling test computation, effective in the first quarter 2012. Specific remedial actions include additional reviews, methodologies, procedures and approvals of the ceiling test computation and enhanced coordination between our accounting and income tax staff. We believe these remediation measures will be adequate to resolve the material weakness in internal control over financial reporting that existed as of December 31, 2011.
Changes in control over financial reporting. There were no changes in EXCO’s internal control over financial reporting that occurred during the fiscal quarter ended December 31, 2011 that have materially affected, or are reasonably likely to materially affect, EXCO’s internal control over financial reporting.
| Item 9B. | Other Information |
None.
PART III
| Item 10. | Directors, Executive Officers and Corporate Governance |
The information required in response to this Item 10 is incorporated herein by reference to our definitive proxy statement to be filed with the Securities and Exchange Commission pursuant to Regulation 14A of the Securities Exchange Act of 1934 not later than 120 days after the end of the fiscal year covered by this Annual Report on Form 10-K.
| Item 11. | Executive Compensation |
The information required in response to this Item 11 is incorporated herein by reference to our definitive proxy statement to be filed with the Securities and Exchange Commission pursuant to Regulation 14A of the Securities Exchange Act of 1934 not later than 120 days after the end of the fiscal year covered by this Annual Report on Form 10-K.
| Item 12. | Security Ownership of Certain Beneficial Owners and Management and Related Stockholder Matters |
The information required in response to this Item 12 is incorporated herein by reference to our definitive proxy statement to be filed with the Securities and Exchange Commission pursuant to Regulation 14A of the Securities Exchange Act of 1934 not later than 120 days after the end of the fiscal year covered by this Annual Report on Form 10-K.
| Item 13. | Certain Relationships and Related Transactions and Director Independence |
The information required in response to this Item 13 is incorporated herein by reference to our definitive proxy statement to be filed with the Securities and Exchange Commission pursuant to Regulation 14A of the Securities Exchange Act of 1934 not later than 120 days after the end of the fiscal year covered by this Annual Report on Form 10-K.
127
| Item 14. | Principal Accountant Fees and Services |
The information required in response to this Item 14 is incorporated herein by reference to our definitive proxy statement to be filed with the Securities and Exchange Commission pursuant to Regulation 14A of the Securities Exchange Act of 1934 not later than 120 days after the end of the fiscal year covered by this Annual Report on Form 10-K.
PART IV
| Item 15. | Exhibits and Financial Statement Schedules |
| | |
| (a)(1) | | See Part II—Item 8. Financial Statements and Supplementary Data in this Annual Report on Form 10-K. |
| |
| (a)(2) | | None. |
| |
| (a)(3) | | See “Index to Exhibits” for a description of our exhibits. |
| |
| (b) | | See “Index to Exhibits” for a description of our exhibits. |
| |
| (c) | | None. |
128
SIGNATURE PAGE
Pursuant to the requirements of Section 13 or 15(d) of the Securities Exchange Act of 1934, the registrant has duly caused this report to be signed on its behalf by the undersigned, thereunto duly authorized.
| | | | | | |
| Date: February 27, 2012 | | EXCO RESOURCES, INC. (Registrant) |
| | | |
| | | | By: | | /s/ DOUGLAS H. MILLER |
| | | | | | Douglas H. Miller |
| | | | | | Chairman and Chief Executive Officer |
Pursuant to the requirements of the Securities Exchange Act of 1934, this report has been signed below by the following persons on behalf of the registrant and in the capacities and on the date indicated.
| | | | | | |
| Date: February 27, 2012 | | /s/ DOUGLAS H. MILLER |
| | Douglas H. Miller Director, Chairman and Chief Executive Officer |
| |
| | /s/ STEPHEN F. SMITH |
| | Stephen F. Smith Director, Vice Chairman, President and Chief Financial Officer |
| |
| | /s/ MARK E. WILSON |
| | Mark E. Wilson Vice President, Chief Accounting Officer and Controller |
| |
| | /s/ JEFFREY D. BENJAMIN |
| | Jeffrey D. Benjamin Director |
| |
| | /s/ EARL E. ELLIS |
| | Earl E. Ellis Director |
| |
| | /s/ B. JAMES FORD |
| | B. James Ford Director |
| |
| | /s/ MARK F. MULHERN |
| | Mark F. Mulhern Director |
| |
| | /s/ BOONE PICKENS |
| | Boone Pickens Director |
| |
| | /s/ JEFFREY S. SEROTA |
| | Jeffrey S. Serota Director |
| |
| | /s/ ROBERT L. STILLWELL |
| | Robert L. Stillwell Director |
INDEX TO EXHIBITS
| | |
Exhibit
Number | | Description of Exhibits |
| |
| 2.1 | | Membership Interest Transfer Agreement, dated as of May 9, 2010, between EXCO Holding (PA), Inc. and BG US Production Company, LLC, filed as an Exhibit to EXCO’s Current Report on Form 8-K, dated June 1, 2010 and filed on June 7, 2010 and incorporated by reference herein. |
| |
| 2.2 | | First Amendment to Membership Interest Transfer Agreement, dated as of June 1, 2010, between EXCO Holding (PA), Inc. and BG US Production Company, LLC, filed as an Exhibit to EXCO’s Annual Report on Form 10-K for 2010 filed February 24, 2011 and incorporated by reference herein. |
| |
| 2.3 | | Second Amendment to Membership Interest Transfer Agreement, dated as of June 30, 2010, between EXCO Holding (PA), Inc. and BG US Production Company, LLC, filed as an Exhibit to EXCO’s Annual Report on Form 10-K for 2010 filed February 24, 2011 and incorporated by reference herein. |
| |
| 2.4 | | Amendment to Membership Interest Transfer Agreement, dated as of November 24, 2010, between EXCO Holding (PA), Inc. and BG US Production Company, LLC, filed as an Exhibit to EXCO’s Annual Report on Form 10-K for 2010 filed February 24, 2011 and incorporated by reference herein. |
| |
| 2.5 | | Fourth Amendment to Membership Interest Transfer Agreement, dated as of January 6, 2011, between EXCO Holding (PA), Inc. and BG US Production Company, LLC, filed as an Exhibit to EXCO’s Annual Report on Form 10-K for 2010 filed February 24, 2011 and incorporated by reference herein. |
| |
| 2.6 | | Fifth Amendment to Membership Interest Transfer Agreement, dated as of January 13, 2011, between EXCO Holding (PA), Inc. and BG US Production Company, LLC, filed as an Exhibit to EXCO’s Annual Report on Form 10-K for 2010 filed February 24, 2011 and incorporated by reference herein. |
| |
| 2.7 | | Sixth Amendment to Membership Interest Transfer Agreement, dated as of March 24, 2011, between EXCO Holding (PA), Inc., BG US Production Company, LLC and EXCO Resources (PA), LLC, filed as an Exhibit to EXCO’s Quarterly Report on Form 10-Q, filed on May 4, 2011 and incorporated by reference herein. |
| |
| 2.8 | | Seventh Amendment to Membership Interest Transfer Agreement, dated as of June 16, 2011, between EXCO Holding (PA), Inc., BG US Production Company, LLC and EXCO Resources (PA), LLC, filed as an exhibit to EXCO’s Quarterly Report on Form 10-Q filed on August 3, 2011 and incorporated by reference herein. |
| |
| 2.9 | | Asset Purchase Agreement, dated December 15, 2010, among EXCO Holding (PA), Inc., Chief Oil & Gas LLC, Chief Exploration & Development LLC and Radler 2000 Limited Partnership, filed as an Exhibit to EXCO’s Annual Report on Form 10-K for 2010 filed February 24, 2011 and incorporated by reference herein. |
| |
| 3.1 | | Third Amended and Restated Articles of Incorporation of EXCO Resources, Inc., filed as an Exhibit to EXCO’s Current Report on Form 8-K (File No. 001-32743), dated February 8, 2006 and filed on February 14, 2006 and incorporated by reference herein. |
| |
| 3.2 | | Articles of Amendment to the Third Amended and Restated Articles of Incorporation of EXCO Resources, Inc., filed as an Exhibit to EXCO’s Current Report on Form 8-K (File No. 001-32743), dated August 30, 2007 and filed on September 5, 2007 and incorporated by reference herein. |
| |
| 3.3 | | Second Amended and Restated Bylaws of EXCO Resources, Inc., filed as an Exhibit to EXCO’s Current Report on Form 8-K, dated March 4, 2009 and filed on March 6, 2009 and incorporated by reference herein. |
| |
| 3.4 | | Statement of Designation of Series A-l 7.0% Cumulative Convertible Perpetual Preferred Stock of EXCO Resources, Inc., filed as an Exhibit to EXCO’s Current Report on Form 8-K (File No. 001-32743), dated March 28, 2007 and filed on April 2, 2007 and incorporated by reference herein. |
| |
| 3.5 | | Statement of Designation of Series A-2 7.0% Cumulative Convertible Perpetual Preferred Stock of EXCO Resources, Inc., filed as an Exhibit to EXCO’s Current Report on Form 8-K (File No. 001-32743), dated March 28, 2007 and filed on April 2, 2007 and incorporated by reference herein. |
| |
| 3.6 | | Statement of Designation of Series B 7.0% Cumulative Convertible Perpetual Preferred Stock of EXCO Resources, Inc., filed as an Exhibit to EXCO’s Current Report on Form 8-K (File No. 001-32743), dated March 28, 2007 and filed on April 2, 2007 and incorporated by reference herein. |
1
| | |
| |
| 3.7 | | Statement of Designation of Series C 7.0% Cumulative Convertible Perpetual Preferred Stock of EXCO Resources, Inc., filed as an Exhibit to EXCO’s Current Report on Form 8-K (File No. 001-32743), dated March 28, 2007 and filed on April 2, 2007 and incorporated by reference herein. |
| |
| 3.8 | | Statement of Designation of Series A-l Hybrid Preferred Stock of EXCO Resources, Inc., filed as an Exhibit to EXCO’s Current Report on Form 8-K (File No. 001-32743), dated March 28, 2007 and filed on April 2, 2007 and incorporated by reference herein. |
| |
| 3.9 | | Statement of Designation of Series A-2 Hybrid Preferred Stock of EXCO Resources, Inc., filed as an Exhibit to EXCO’s Current Report on Form 8-K (File No. 001-32743), dated March 28, 2007 and filed on April 2, 2007 and incorporated by reference herein. |
| |
| 3.10 | | Statement of Designation of Series A Junior Participating Preferred Stock of EXCO Resources, Inc., filed as an Exhibit to EXCO’s Current Report on Form 8-K, dated January 12, 2011 and filed on January 13, 2011 and incorporated by reference herein. |
| |
| 4.1 | | Indenture, dated September 15, 2010, by and between EXCO Resources, Inc. and Wilmington Trust Company, as trustee, filed as an Exhibit to EXCO’s Current Report on Form 8-K, dated September 10, 2010 and filed on September 15, 2010 and incorporated by reference herein. |
| |
| 4.2 | | First Supplemental Indenture, dated September 15, 2010, by and among EXCO Resources, Inc., certain of its subsidiaries and Wilmington Trust Company, as trustee, including the form of 7.500% Senior Notes due 2018, filed as an Exhibit to EXCO’s Current Report on Form 8-K, dated September 10, 2010 and filed on September 15, 2010 and incorporated by reference herein. |
| |
| 4.3 | | Specimen Stock Certificate for EXCO’s common stock, filed as an Exhibit to EXCO’s Amendment No. 2 to the Form S-l (File No. 333-129935), filed on January 27, 2006 and incorporated by reference herein. |
| |
| 4.4 | | First Amended and Restated Registration Rights Agreement, by and among EXCO Holdings Inc. and the Initial Holders (as defined therein), effective January 5, 2006, filed as an Exhibit to EXCO’s Amendment No. 1 to its Registration Statement on Form S-l (File No. 333-129935), filed on January 6, 2006 and incorporated by reference herein. |
| |
| 4.5 | | Rights Agreement, dated as of January 12, 2011, by and between EXCO Resources, Inc. and Continental Stock Transfer & Trust Company, as Rights Agent, filed as an Exhibit to EXCO’s Current Report on Form 8-K, dated January 12, 2011 and filed on January 13, 2011 and incorporated by reference herein. |
| |
| 4.6 | | Amendment No. 1 to Rights Agreement, dated as of August 19, 2011, by and between EXCO Resources, Inc. and Continental Stock Transfer & Trust Company, as Rights Agent, filed as an Exhibit to EXCO’s Form 8-A/A, filed on August 22, 2011 and incorporated by reference herein. |
| |
| 10.1 | | Amended and Restated 2005 Long-Term Incentive Plan, filed as an Exhibit to EXCO’s Current Report on Form 8-K, dated November 14, 2007 and filed on November 16, 2007 and incorporated by reference herein.* |
| |
| 10.2 | | Form of Incentive Stock Option Agreement for the EXCO Resources, Inc. 2005 Long-Term Incentive Plan, filed as an Exhibit to EXCO’s Current Report on Form 8-K, dated November 14, 2007 and filed on November 16, 2007 and incorporated by reference herein.* |
| |
| 10.3 | | Form of Nonqualified Stock Option Agreement for the EXCO Resources, Inc. 2005 Long-Term Incentive Plan, filed as an Exhibit to EXCO’s Current Report on Form 8-K, dated November 14, 2007 and filed on November 16, 2007 and incorporated by reference herein.* |
| |
| 10.4 | | Form of Restricted Stock Award Agreement for the EXCO Resources, Inc. 2005 Long-Term Incentive Plan, filed as an Exhibit to EXCO’s Current Report on Form 8-K, dated August 4, 2011 and filed on August 10, 2011 and incorporated by reference herein.* |
| |
| 10.5 | | Fourth Amended and Restated EXCO Resources, Inc. Severance Plan, filed as an Exhibit to EXCO’s Current Report on Form 8-K, dated March 16, 2011 and filed on March 22, 2011 and incorporated by reference herein.* |
| |
| 10.6 | | Amended and Restated 2007 Director Plan of EXCO Resources, Inc., filed as an Exhibit to EXCO’s Current Report on Form 8-K, dated November 14, 2007 and filed on November 16, 2007 and incorporated by reference herein.* |
| |
| 10.7 | | Amendment Number One to the Amended and Restated 2007 Director Plan of EXCO Resources, Inc., filed as an Exhibit to EXCO’s Annual Report on Form 10-K for 2009 filed February 24, 2010 and incorporated by reference herein.* |
2
| | |
| |
| 10.8 | | Letter Agreement, dated March 28, 2007, with OCM Principal Opportunities Fund IV, L.P. and OCM EXCO Holdings, LLC, filed as an Exhibit to EXCO’s Form 8-K (File No. 001-32743), dated March 28, 2007 and filed on April 2, 2007 and incorporated by reference herein. |
| |
| 10.9 | | Letter Agreement, dated March 28, 2007, with Ares Corporate Opportunities Fund, ACOF EXCO, L.P., ACOF EXCO 892 Investors, L.P., Ares Corporate Opportunities Fund II, L.P., Ares EXCO, L.P. and Ares EXCO 892 Investors, L.P, filed as an Exhibit to EXCO’s Form 8-K (File No. 001-32743), dated March 28, 2007 and filed on April 2, 2007 and incorporated by reference herein. |
| |
| 10.10 | | Amendment Number One to the EXCO Resources, Inc. Amended and Restated 2005 Long-Term Incentive Plan, filed as an exhibit to EXCO’s Current Report on Form 8-K, dated June 4, 2009 and filed on June 10, 2009 and incorporated by reference herein.* |
| |
| 10.11 | | Amendment Number Two to the EXCO Resources, Inc. Amended and Restated 2005 Long-Term Incentive Plan, dated as of October 6, 2011, filed as an Exhibit to EXCO’s Current Report on Form 8-K, dated October 6, 2011 and filed on October 7, 2011 and incorporated by reference herein.* |
| |
| 10.12 | | Joint Development Agreement, dated August 14, 2009, by and among BG US Production Company, LLC, EXCO Operating Company, LP and EXCO Production Company, LP, filed as an Exhibit to EXCO’s Current Report on Form 8-K, dated August 11, 2009 and filed on August 17, 2009 and incorporated by reference herein. |
| |
| 10.13 | | Amendment to Joint Development Agreement, dated February 1, 2011, by and among BG US Production Company, LLC and EXCO Operating Company, LP, filed as an Exhibit to EXCO’s Annual Report on Form 10-K for 2010 filed February 24, 2011 and incorporated by reference herein. |
| |
| 10.14 | | Amended and Restated Limited Liability Company Agreement of TGGT Holdings, LLC, dated August 14, 2009, filed as an Exhibit to EXCO’s Current Report on Form 8-K, dated August 11, 2009 and filed on August 17, 2009 and incorporated by reference herein. |
| |
| 10.15 | | First Amendment to Amended and Restated Limited Liability Company Agreement of TGGT Holdings, LLC, dated January 31, 2011, filed as an Exhibit to EXCO’s Annual Report on Form 10-K for 2010 filed February 24, 2011 and incorporated by reference herein. |
| |
| 10.16 | | Joint Development Agreement, dated as of June 1, 2010, by and among EXCO Production Company (PA), LLC, EXCO Production Company (WV), LLC, BG Production Company, (PA), LLC, BG Production Company, (WV), LLC and EXCO Resources (PA), LLC, filed as an Exhibit to EXCO’s Current Report on Form 8-K, dated June 1, 2010 and filed on June 7, 2010 and incorporated by reference herein. |
| |
| 10.17 | | Amendment to Joint Development Agreement, dated February 4, 2011, by and among EXCO Production Company (PA), LLC, EXCO Production Company (WV), LLC, BG Production Company, (PA), LLC, BG Production Company, (WV), LLC and EXCO Resources (PA), LLC, filed as an Exhibit to EXCO’s Annual Report on Form 10-K for 2010 filed February 24, 2011 and incorporated by reference herein. |
| |
| 10.18 | | Second Amended and Restated Limited Liability Company Agreement of EXCO Resources (PA), LLC, dated June 1, 2010, by and among EXCO Holding (PA), Inc., BG US Production Company, LLC and EXCO Resources (PA), LLC, filed as an Exhibit to EXCO’s Current Report on Form 8-K, dated June 1, 2010 and filed on June 7, 2010 and incorporated by reference herein. |
| |
| 10.19 | | Second Amended and Restated Limited Liability Company Agreement of Appalachia Midstream, LLC, dated June 1, 2010, by and among EXCO Holding (PA), Inc., BG US Production Company, LLC and Appalachia Midstream, LLC, filed as an Exhibit to EXCO’s Current Report on Form 8-K, dated June 1, 2010 and filed on June 7, 2010 and incorporated by reference herein. |
| |
| 10.20 | | Letter Agreement, dated June 1, 2010 and effective as of May 9, 2010, by and between EXCO Holding (PA), Inc. and BG US Production Company, LLC, filed as an Exhibit to EXCO’s Current Report on Form 8-K, dated June 1, 2010 and filed on June 7, 2010 and incorporated by reference herein. |
3
| | |
| |
| 10.21 | | Membership Interest Transfer Agreement, dated as of May 9, 2010, between EXCO Holding (PA), Inc. and BG US Production Company, LLC, filed as an Exhibit to EXCO’s Current Report on Form 8-K, dated June 1, 2010 and filed on June 7, 2010 and incorporated by reference herein. |
| |
| 10.22 | | First Amendment to Membership Interest Transfer Agreement, dated as of June 1, 2010, between EXCO Holding (PA), Inc. and BG US Production Company, LLC, filed as an Exhibit to EXCO’s Annual Report on Form 10-K for 2010 filed February 24, 2011 and incorporated by reference herein. |
| |
| 10.23 | | Second Amendment to Membership Interest Transfer Agreement, dated as of June 30, 2010, between EXCO Holding (PA), Inc. and BG US Production Company, LLC, filed as an Exhibit to EXCO’s Annual Report on Form 10-K for 2010 filed February 24, 2011 and incorporated by reference herein. |
| |
| 10.24 | | Amendment to Membership Interest Transfer Agreement, dated as of November 24, 2010, between EXCO Holding (PA), Inc. and BG US Production Company, LLC, filed as an Exhibit to EXCO’s Annual Report on Form 10-K for 2010 filed February 24, 2011 and incorporated by reference herein. |
| |
| 10.25 | | Fourth Amendment to Membership Interest Transfer Agreement, dated as of January 6, 2011, between EXCO Holding (PA), Inc. and BG US Production Company, LLC, filed as an Exhibit to EXCO’s Annual Report on Form 10-K for 2010 filed February 24, 2011 and incorporated by reference herein. |
| |
| 10.26 | | Fifth Amendment to Membership Interest Transfer Agreement, dated as of January 13, 2011, between EXCO Holding (PA), Inc. and BG US Production Company, LLC, filed as an Exhibit to EXCO’s Annual Report on Form 10-K for 2010 filed February 24, 2011 and incorporated by reference herein. |
| |
| 10.27 | | Sixth Amendment to Membership Interest Transfer Agreement, dated as of March 24, 2011, between EXCO Holding (PA), Inc., BG US Production Company, LLC and EXCO Resources (PA), LLC, filed as an Exhibit to EXCO’s Quarterly Report on Form 10-Q, filed on May 4, 2011 and incorporated by reference herein. |
| |
| 10.28 | | Seventh Amendment to Membership Interest Transfer Agreement, dated as of June 16, 2011, between EXCO Holding (PA), Inc., BG US Production Company, LLC and EXCO Resources (PA), LLC, filed as an Exhibit to EXCO’s Quarterly Report on Form 10-Q, filed on August 3, 2011 and incorporated by reference herein. |
| |
| 10.29 | | Guaranty, dated May 9, 2010, by BG Energy Holdings Limited in favor of EXCO Holding (PA), Inc., EXCO Production Company (PA), LLC and EXCO Production Company (WV), LLC, filed as an Exhibit to EXCO’s Current Report on Form 8-K, dated June 1, 2010 and filed on June 7, 2010 and incorporated by reference herein. |
| |
| 10.30 | | Guaranty, dated May 9, 2010, by EXCO Resources, Inc. in favor of BG US Production Company, LLC, filed as an Exhibit to EXCO’s Current Report on Form 8-K, dated June 1, 2010 and filed on June 7, 2010 and incorporated by reference herein. |
| |
| 10.31 | | Guaranty, dated June 1, 2010, by BG North America, LLC in favor of (i) EXCO Production Company (PA), LLC, EXCO Production Company (WV), LLC and EXCO Resources (PA), LLC; and (ii) EXCO Resources (PA), LLC and EXCO Holding (PA), Inc, filed as an Exhibit to EXCO’s Current Report on Form 8-K, dated June 1, 2010 and filed on June 7, 2010 and incorporated by reference herein. |
| |
| 10.32 | | Guaranty, dated June 1, 2010, by EXCO Resources, Inc., in favor of: (i) BG Production Company (PA), LLC, BG Production Company (WV), LLC and EXCO Resources (PA), LLC; and (ii) EXCO Resources (PA), LLC and BG US Production Company, LLC, filed as an Exhibit to EXCO’s Current Report on Form 8-K, dated June 1, 2010 and filed on June 7, 2010 and incorporated by reference herein. |
| |
| 10.33 | | Credit Agreement, dated as of April 30, 2010, among EXCO Resources, Inc., as Borrower, certain subsidiaries of Borrower, as Guarantors, the lenders party thereto, JPMorgan Chase Bank, N.A., as Administrative Agent, and J.P. Morgan Securities Inc., as Sole Book runner and Lead Arranger, Wells Fargo Securities, LLC, as Co-Lead Arranger, Bank of America, N.A. and BNP Paribas, as Co-Lead Arrangers and Co-Syndication Agents, Royal Bank of Canada, as Co-Lead Arranger and Co-Documentation Agent, Wells Fargo Bank, National Association, as Co-Documentation Agent, filed as an Exhibit to EXCO’s Current Report on Form 8-K, dated July 16, 2010 and filed on July 22, 2010 and incorporated by reference herein. |
4
| | |
| |
| 10.34 | | First Amendment to Credit Agreement, dated as of July 16, 2010, among EXCO Resources, Inc., as Borrower, certain subsidiaries of Borrower, as Guarantors, the lenders party thereto, JPMorgan Chase Bank, N.A., as Administrative Agent, and Bank of America, N.A. and BNP Paribas, as Co-Lead Arrangers and Co-Syndication Agents, Royal Bank of Canada, as Co-Lead Arranger and Co-Documentation Agent, Wells Fargo Bank, National Association, as Co-Documentation Agent, filed as an Exhibit to EXCO’s Current Report on Form 8-K, dated July 16, 2010 and filed on July 22, 2010 and incorporated by reference herein. |
| |
| 10.35 | | Second Amendment to Credit Agreement, dated as of September 15, 2010, among EXCO Resources, Inc., as Borrower, certain subsidiaries of Borrower, as Guarantors, the lenders party thereto, JPMorgan Chase Bank, N.A., as Administrative Agent, and Bank of America, N.A. and BNP Paribas, as Co-Lead Arrangers and Co-Syndication Agents, Royal Bank of Canada, as Co-Lead Arranger and Co-Documentation Agent, and Wells Fargo Bank, National Association, as Co-Documentation Agent, filed as an Exhibit to EXCO’s Current Report on Form 8-K, dated September 10, 2010 and filed on September 15, 2010 and incorporated by reference herein. |
| |
| 10.36 | | Third Amendment to Credit Agreement, dated as of April 1, 2011, among EXCO Resources, Inc., as Borrower, certain subsidiaries of Borrower, as Guarantors, the lenders party thereto, JPMorgan Chase Bank, N.A., as Administrative Agent, filed as an Exhibit to EXCO’s Current Report on Form 8-K, dated April 1, 2011 and filed on April 4, 2011 and incorporated by reference herein. |
| |
| 10.37 | | Fourth Amendment to Credit Agreement, dated as of November 8, 2011, among EXCO Resources, Inc., as Borrower, certain subsidiaries of Borrower, as Guarantors, the lenders party thereto, and JPMorgan Chase Bank, N.A., as Administrative Agent, filed as an Exhibit to EXCO’s Current Report on Form 8-K, dated November 8, 2011 and filed on November 9, 2011 and incorporated by reference herein. |
| |
| 10.38 | | Fifth Amendment to Credit Agreement, dated as of November 8, 2011, among EXCO Resources, Inc., as Borrower, certain subsidiaries of Borrower, as Guarantors, the lenders party thereto, and JPMorgan Chase Bank, N.A., as Administrative Agent, filed as an Exhibit to EXCO’s Current Report on Form 8-K, dated November 8, 2011 and filed on November 9, 2011 and incorporated by reference herein. |
| |
| 10.39 | | Form of Director Indemnification Agreement, filed as an Exhibit to EXCO’s Current Report on Form 8-K, dated November 10, 2010 and filed on November 12, 2010 and incorporated by reference herein. |
| |
| 10.40 | | Credit Agreement, dated January 31, 2011, by and among TGGT Holdings, LLC, its subsidiaries, as borrowers (or guarantor as to one TGGT subsidiary), JPMorgan Chase Bank, N.A., as administrative agent, J.P. Morgan Securities Inc., as sole bookrunner and co-lead arranger, BNP Paribas, Citibank, N.A., The Royal Bank of Scotland PLC and Wells Fargo Securities, LLC, as co-lead arrangers, and the lenders named therein, filed as an Exhibit to EXCO’s Annual Report on Form 10-K for 2010 filed February 24, 2011 and incorporated by reference herein. |
| |
| 10.41 | | First Amendment to Credit Agreement, dated January 25, 2012, by and among TGGT Holdings, LLC, TGG Pipeline, Ltd. And Talco Midstream Assets, Ltd., as Borrowers, TGGT GP Holdings, LLC and certain subsidiaries of Borrowers, as Guarantors, JPMorgan Chase Bank, N.A., as Administrative Agent, J.P. Morgan Securities LLC, as Sole Bookrunner and Co-Lead Arranger, Wells Fargo Securities, LLC, Bank of America, N.A., BMO Harris Financing, Inc., Royal Bank of Canada, Morgan Stanley Senior Funding, Inc., UBS Loan Finance LLC and The Royal Bank of Scotland plc, as Co-Lead Arrangers, and the lenders party thereto, filed as an Exhibit to EXCO’s Current Report on Form 8-K, dated January 25, 2012 and filed on January 31, 2012 and incorporated by reference herein. |
| |
| 10.42 | | EXCO Resources, Inc. Retention Bonus Plan, dated August 4, 2011, filed as an Exhibit to EXCO’s Current Report on Form 8-K, dated August 4, 2011 and filed on August 10, 2011 and incorporated by reference herein.* |
| |
| 14.1 | | Code of Ethics for the Chief Executive Officer and Senior Financial Officers, filed as an Exhibit to EXCO’s Amendment No. 1 to its Registration Statement on Form S-1 (File No. 333-129935) filed January 6, 2006 and incorporated by reference herein. |
| |
| 14.2 | | Code of Business Conduct and Ethics for Directors, Officers and Employees, filed as an Exhibit to EXCO’s Amendment No. 1 to its Registration Statement on Form S-1 (File No. 333-129935) filed January 6, 2006 and incorporated by reference herein. |
| |
| 14.3 | | Amendment No. 1 to EXCO Resources, Inc. Code of Business Conduct and Ethics for Directors, Officers and Employees, filed as an Exhibit to EXCO’s Current Report on Form 8-K, dated November 8, 2006 and filed on November 9, 2006 and incorporated by reference herein. |
5
| | |
| |
| 21.1 | | Subsidiaries of the registrant, filed herewith. |
| |
| 23.1 | | Consent of KPMG LLP, filed herewith. |
| |
| 23.2 | | Consent of Lee Keeling and Associates, Inc., filed herewith. |
| |
| 23.3 | | Consent of Haas Petroleum Engineering Services, Inc., filed herewith. |
| |
| 31.1 | | Certification pursuant to Section 302 of the Sarbanes-Oxley Act of 2002 of Chief Executive Officer of EXCO Resources, Inc., filed herewith. |
| |
| 31.2 | | Certification pursuant to Section 302 of the Sarbanes-Oxley Act of 2002 of Chief Financial Officer of EXCO Resources, Inc., filed herewith. |
| |
| 32.1 | | Certification pursuant to Section 906 of the Sarbanes-Oxley Act of 2002 of Chief Executive Officer and Chief Financial Officer of EXCO Resources, Inc., furnished herewith. |
| |
| 99.1 | | 2011 Reports of Lee Keeling and Associates, Inc., filed herewith. |
| |
| 99.2 | | 2011 Report of Haas Petroleum Engineering Services, Inc., filed herewith. |
| |
| 101.INS** | | XBRL Instance Document. |
| |
| 101.SCH** | | XBRL Taxonomy Extension Schema Document. |
| |
| 101.CAL** | | XBRL Taxonomy Calculation Linkbase Document. |
| |
| 101.DEF** | | XBRL Taxonomy Definition Linkbase Document. |
| |
| 101.LAB** | | XBRL Taxonomy Label Linkbase Document. |
| |
| 101.PRE** | | XBRL Taxonomy Presentation Linkbase Document. |
| * | These exhibits are management contracts. |
| ** | Furnished with this report. In accordance with Rule 406T of Regulation S-T, the information in these exhibits shall not be deemed to be “filed” for purposes of Section 18 of the Securities Exchange Act of 1934, as amended, or otherwise subject to liability under that section, and shall not be incorporated by reference into any registration statement or other document filed under the Securities Act of 1933, as amended, except as expressly set forth by specific reference in such filing. |
6