UNITED STATES
SECURITIES AND EXCHANGE COMMISSION
Washington, D.C. 20549
FORM N-CSR
CERTIFIED SHAREHOLDER REPORT OF REGISTERED
MANAGEMENT INVESTMENT COMPANIES
Investment Company Act file number 811-3114
Fidelity Select Portfolios
(Exact name of registrant as specified in charter)
82 Devonshire St., Boston, Massachusetts 02109
(Address of principal executive offices) (Zip code)
Eric D. Roiter, Secretary
82 Devonshire St.
Boston, Massachusetts 02109
(Name and address of agent for service)
Registrant's telephone number, including area code: 617-563-7000
Date of fiscal year end: | February 28 |
Date of reporting period: | February 28, 2007 |
Item 1. Reports to Stockholders
Fidelity®
Select Portfolios®
Energy Sector
Select Energy Portfolio
Select Energy Service Portfolio
Select Natural Gas Portfolio
Select Natural Resources Portfolio
Annual Report
February 28, 2007
(2_fidelity_logos) (Registered_Trademark)
Contents
Chairman's Message | ||
Notes to Shareholders | ||
Shareholder Expense Example | ||
Fund Updates* | ||
Energy Sector | ||
Energy | ||
Energy Service | ||
Natural Gas | ||
Natural Resources | ||
Notes to Financial Statements | ||
Report of Independent Registered Public Accounting Firm | ||
Trustees and Officers | ||
Distributions | ||
Proxy Voting Results |
* Fund updates for each Select Portfolio include: Performance, Management's Discussion of Fund Performance, Investment Changes, Investments, and Financial Statements.
To view a fund's proxy voting guidelines and proxy voting record for the 12-month period ended June 30, visit www.fidelity.com/proxyvotingresults or visit the Securities and Exchange Commission's (SEC) web site at www.sec.gov. You may also call 1-800-544-8544 to request a free copy of the proxy voting guidelines.
Standard & Poor's, S&P and S&P 500 are registered service marks of The McGraw-Hill Companies, Inc. and have been licensed for use by Fidelity Distributors Corporation.
Other third party marks appearing herein are the property of their respective owners.
All other marks appearing herein are registered or unregistered trademarks or service marks of FMR Corp. or an affiliated company.
This report and the financial statements contained herein are submitted for the general information of the shareholders of the funds. This report is not authorized for distribution to prospective investors in the funds unless preceded or accompanied by an effective prospectus.
A fund files its complete schedule of portfolio holdings with the SEC for the first and third quarters of each fiscal year on Form N-Q. Forms N-Q are available on the SEC's web site at http://www.sec.gov. A fund's Forms N-Q may be reviewed and copied at the SEC's Public Reference Room in Washington, DC. Information regarding the operation of the SEC's Public Reference Room may be obtained by calling 1-800-SEC-0330. For a complete list of a fund's portfolio holdings, view the most recent quarterly holdings report, semiannual report, or annual report on Fidelity's web site at http://www.fidelity.com/holdings.
NOT FDIC INSURED · MAY LOSE VALUE · NO BANK GUARANTEE
Neither the funds nor Fidelity Distributors Corporation is a bank.
Annual Report
Chairman's Message
(Photograph of Edward C. Johnson 3d.)
Dear Shareholder:
Substantial single-day losses are not uncommon in the equity markets, and when they occur - as in late February - investors can be better served in the long term by buying good stocks at lower prices than by moving their money to the sidelines. While financial markets are always unpredictable, there are a number of time-tested principles that can put the historical odds in your favor.
One of the basic tenets is to invest for the long term. Over time, riding out the markets' inevitable ups and downs has proven much more effective than selling into panic or chasing the hottest trend. Even missing only a few of the markets' best days can significantly diminish investor returns. Patience also affords the benefits of compounding - of earning interest on additional income or reinvested dividends and capital gains. There are tax advantages and cost benefits to consider as well. The more you sell, the more taxes you pay, and the more you trade, the higher the costs. While staying the course doesn't eliminate risk, it can considerably lessen the effect of short-term declines.
You can further manage your investing risk through diversification. And today, more than ever, geographic diversification should be taken into account. Studies
indicate that asset allocation is the single most important determinant of a portfolio's long-term success. The right mix of stocks, bonds and cash - aligned to your particular risk tolerance and investment objective - is very important. Age-appropriate rebalancing is also an essential aspect of asset allocation. For younger investors, an emphasis on equities - which historically have been the best performing asset class over time - is encouraged. As investors near their specific goal, such as retirement or sending a child to college, consideration may be given to replacing volatile assets (e.g. common stocks) with more-stable fixed investments (bonds or savings plans).
A third investment principle - investing regularly - can help lower the average cost of your purchases. Investing a certain amount of money each month or quarter helps ensure you won't pay for all your shares at market highs. This strategy - known as dollar cost averaging - also reduces unconstructive "emotion" from investing, helping shareholders avoid selling weak performers just prior to an upswing, or chasing a hot performer just before a correction.
We invite you to contact us via the Internet, through our Investor Centers or over the phone. It is our privilege to provide you the information you need to make the investments that are right for you.
Sincerely,
/s/Edward C. Johnson 3d
Edward C. Johnson 3d
Annual Report
Notes to Shareholders:
Effective October 1, 2006, Fidelity restructured the Fidelity® Select Portfolios® equity product line. The restructuring aligned the equity funds' investment goals more closely with standard industry classifications and facilitated adoption of more-specific benchmark indexes to evaluate fund performance. As restructured, the equity funds generally align under the 10 sectors in the widely recognized Global Industry Classification Standard (GICS), developed by Standard & Poor's® (S&P®) and Morgan Stanley Capital InternationalSM (MSCI®): Consumer Discretionary, Consumer Staples, Energy, Financials, Health Care, Industrials, Information Technology, Materials, Telecommunications Services and Utilities. Changes to the funds ranged from simply adopting a new supplemental benchmark to, in some cases, changing investment policies and fund names.
For Banking, Communications Equipment (formerly Developing Communications), Construction and Housing, Consumer Discretionary (formerly Consumer Industries), Consumer Staples (formerly Food and Agriculture), Home Finance, Industrials (formerly Cyclical Industries), IT Services (formerly Business Services and Outsourcing) and Materials (formerly Industrial Materials), shareholders approved certain fundamental investment policy changes related to the restructuring at a special meeting of shareholders held September 20, 2006. All the equity funds adopted new benchmark indexes from MSCI, except for Gold (which adopted an S&P/Citigroup index), Natural Gas (which adopted an S&P index) and Natural Resources (which retained its current Goldman Sachs® index). Taken together, the name, policy and benchmark changes will make it easier for investors to distinguish funds in the product line and to evaluate Fidelity Management & Research Company's skill in managing the funds.
The Select equity portfolios also eliminated hourly pricing. The funds now price each business day as of the close of the New York Stock Exchange, normally 4:00 pm Eastern time. The funds also adopted Fidelity's standard fund market timing policy, as described in the funds' current prospectus, and removed the $7.50 fee formerly charged on exchanges made through non-automated channels.
Changes for each fund in the GICS Energy Sector are described in detail below.
The fund is now benchmarked to the MSCI US Investable Market Energy Index.
Energy Service
The fund is now benchmarked to the MSCI US Investable Market Energy Equipment & Services Index.
Natural Gas
The fund is now benchmarked to the S&P Custom Natural Gas Index.
Natural Resources
The fund continues to be benchmarked to the Goldman Sachs Natural Resources Index.
Annual Report
Shareholder Expense Example
As a shareholder of a Fund, you incur two types of costs: (1) transaction costs, including redemption fees, exchange fees, and (2) ongoing costs, including management fees and other Fund expenses. This Example is intended to help you understand your ongoing costs (in dollars) of investing in the Funds and to compare these costs with the ongoing costs of investing in other mutual funds.
The Example is based on an investment of $1,000 invested at the beginning of the period and held for the entire period (September 1, 2006 to February 28, 2007).
Actual Expenses
The first line of the accompanying table for each fund provides information about actual account values and actual expenses. You may use the information in this line, together with the amount you invested, to estimate the expenses that you paid over the period. Simply divide your account value by $1,000.00 (for example, an $8,600 account value divided by $1,000.00 = 8.6), then multiply the result by the number in the first line for a fund under the heading entitled "Expenses Paid During Period" to estimate the expenses you paid on your account during this period. A small balance maintenance fee of $12.00 that is charged once a year may apply for certain accounts with a value of less than $2,000. This fee is not included in the table below. If it was, the estimate of expenses you paid during the period would be higher, and your ending account value lower, by this amount.
Hypothetical Example for Comparison Purposes
The second line of the accompanying table for each fund provides information about hypothetical account values and hypothetical expenses based on a fund's actual expense ratio and an assumed rate of return of 5% per year before expenses, which is not the Fund's actual return. The hypothetical account values and expenses may not be used to estimate the actual ending account balance or expenses you paid for the period. You may use this information to compare the ongoing costs of investing in the Fund and other funds. To do so, compare this 5% hypothetical example with the 5% hypothetical examples that appear in the shareholder reports of the other funds. A small balance maintenance fee of $12.00 that is charged once a year may apply for certain accounts with a value of less than $2,000. This fee is not included in the table below. If it was, the estimate of expenses you paid during the period would be higher, and your ending account value lower, by this amount.
Please note that the expenses shown in the table are meant to highlight your ongoing costs only and do not reflect any transaction costs. Therefore, the second line of the table is useful in comparing ongoing costs only, and will not help you determine the relative total costs of owning different funds. In addition, if these transactional costs were included, your costs would have been higher.
Beginning | Ending | Expenses Paid | |
Energy Portfolio | |||
Actual | $ 1,000.00 | $ 1,029.90 | $ 4.48 |
HypotheticalA | $ 1,000.00 | $ 1,020.38 | $ 4.46 |
Energy Service Portfolio | |||
Actual | $ 1,000.00 | $ 1,020.30 | $ 4.36 |
HypotheticalA | $ 1,000.00 | $ 1,020.48 | $ 4.36 |
Natural Gas Portfolio | |||
Actual | $ 1,000.00 | $ 1,047.40 | $ 4.57 |
HypotheticalA | $ 1,000.00 | $ 1,020.33 | $ 4.51 |
Natural Resources Portfolio | |||
Actual | $ 1,000.00 | $ 1,094.40 | $ 4.78 |
HypotheticalA | $ 1,000.00 | $ 1,020.23 | $ 4.61 |
A 5% return per year before expenses
* Expenses are equal to each Fund's annualized expense ratio (shown in the table below); multiplied by the average account value over the period, multiplied by 181/365 (to reflect the one-half year period).
Annualized | |
Energy Portfolio | .89% |
Energy Service Portfolio | .87% |
Natural Gas Portfolio | .90% |
Natural Resources Portfolio | .92% |
Annual Report
Performance
Average annual total return reflects the change in the value of an investment, assuming reinvestment of the fund's dividend income and capital gains (the profits earned upon the sale of securities that have grown in value) and assuming a constant rate of performance each year. The $10,000 table and the fund's returns do not reflect the deduction of taxes that a shareholder would pay on fund distributions or the redemption of fund shares. During periods of reimbursement by Fidelity, a fund's total returns will be greater than it would be had the reimbursement not occurred. How a fund did yesterday is no guarantee of how it will do tomorrow.
Average Annual Total Returns
Periods ended February 28, 2007 | Past 1 | Past 5 | Past 10 |
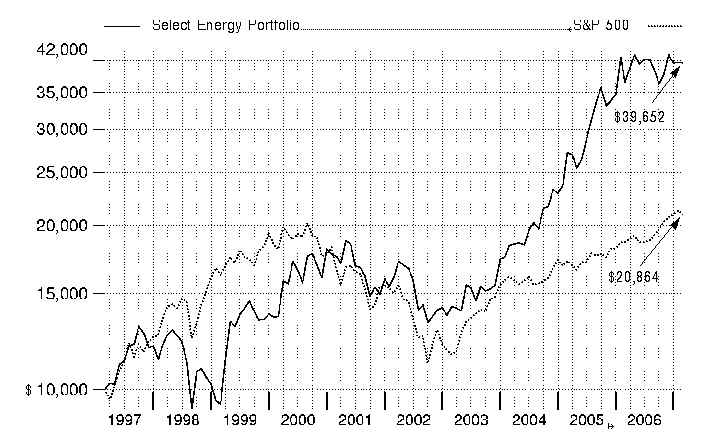
Select Energy Portfolio | 8.57% | 19.86% | 14.77% |
$10,000 Over 10 Years
Let's say hypothetically that $10,000 was invested in Select Energy Portfolio on February 28, 1997. The chart shows how the value of your investment would have changed, and also shows how the S&P 500® Index performed over the same period.
Annual Report
Management's Discussion of Fund Performance
Comments from John Dowd, Portfolio Manager of Fidelity® Select Energy Portfolio
A rosy year for stocks wilted just prior to the end of the 12-month period ending February 28, 2007. On the day prior to the period's close, the Dow Jones Industrial AverageSM plunged 416 points and the Standard & Poor's 500SM Index lost roughly 3.5% of its value, plummeting nearly 50 points and marking the benchmark's worst single-day performance since the day the market reopened after the 9/11 terrorist attacks. Though investors were obviously rattled by the development, it was only the 22nd-biggest decline for the S&P 500® in 20 years, and it could not overshadow how well stocks performed for the 12 months overall. For much of the past year, investors grew confident that the economy would not fall into a recession, and they bid up most broad-based stock indexes for six consecutive months from August through January. Overall for the year ending February 28, 2007, the S&P 500 was up 11.97%, the Dow advanced 14.24%, the small-cap Russell 2000® Index gained 9.87% and the NASDAQ Composite® Index rose 6.66%.
For the 12 months that ended February 28, 2007, the fund returned 8.57%, underperforming the 12.77% gain of the Morgan Stanley Capital InternationalSM (MSCI®) US Investable Market Energy Index and the 10.48% advance of a blended index specific to this fund. This blended index is a combination of the Goldman Sachs® Natural Resources Index, which the fund was compared with through September, and the new MSCI benchmark mentioned above, which the fund was compared with during the period's final five months1. For the same 12-month period, the fund underperformed the S&P 500 as well. During the first seven months of the review period, the fund underperformed the Goldman Sachs benchmark partly due to a lack of exposure to strong performing metals and mining index components Falconbridge and Inco - two Canadian nickel producers - and copper miners Phelps Dodge and Southern Copper. Underweighting integrated oil company Chevron also hurt. Elsewhere, energy services giant Halliburton along with Ultra Petroleum, Canadian Natural Resources and UTS Energy in the exploration and production (E&P) space detracted as well. On the flip side, non-index components OMI, Dominion Resources and Danish wind turbine manufacturer Vestas Wind Systems boosted performance. Underweighting or not owning the integrated oil companies more sensitive to energy prices, such as Petro-Canada, Hess and BP, also contributed. Within E&P, overweighting Kerr-McGee and not owning index constituent Anadarko Petroleum paid off, as did avoiding gold producer Newmont Mining, another index component. During the final five months of the period, the fund modestly outperformed the MSCI index partly due to good stock selection in the E&P area, including Range Resources, Cabot Oil & Gas and XTO Energy. Drillers GlobalSantaFe and Diamond Offshore Drilling also performed well, as did National Oilwell Varco and refiner Valero Energy. Several out-of-index stocks boosted returns, including Vestas Wind Systems and mining equipment manufacturer Joy Global. On the other hand, underweighting or not owning integrated oil companies Exxon Mobil, Chevron and Marathon Oil detracted, along with some weak investments in energy services, including Baker Hughes, and poor performance by E&P companies Houston Exploration, Ultra Petroleum and EOG Resources. A number of stocks mentioned in this discussion were no longer held at period end.
1 The fund's blended index is a customized index developed by Fidelity for the limited purpose of discussing the fund's performance for the 12-month period ending February 28, 2007. From March 1, 2006, through September 30, 2006, the fund compared its performance to the Goldman Sachs Natural Resources Index, which returned 2.61% during that period. On October 1, 2006, the fund began comparing its performance to a different index, the MSCI US Investable Market Energy Index, which returned 7.67% from October 1, 2006, through February 28, 2007. For the 12-month period ending February 28, 2007, the blended index (Goldman Sachs and MSCI) returned 10.48%.
The views expressed above reflect those of the portfolio manager(s) only through the end of the period as stated on the cover of this report and do not necessarily represent the views of Fidelity or any other person in the Fidelity organization. Any such views are subject to change at any time based upon market or other conditions and Fidelity disclaims any responsibility to update such views. These views may not be relied on as investment advice and, because investment decisions for a Fidelity fund are based on numerous factors, may not be relied on as an indication of trading intent on behalf of any Fidelity fund.
Annual Report
Select Energy Portfolio
Investment Changes
Top Ten Stocks as of February 28, 2007 | ||
% of fund's | % of fund's net assets | |
Exxon Mobil Corp. | 8.9 | 5.4 |
Valero Energy Corp. | 8.0 | 4.3 |
ConocoPhillips | 6.6 | 5.7 |
Schlumberger Ltd. (NY Shares) | 5.6 | 5.3 |
Chevron Corp. | 5.1 | 2.6 |
Range Resources Corp. | 4.0 | 2.3 |
Noble Corp. | 3.8 | 2.7 |
National Oilwell Varco, Inc. | 3.7 | 4.1 |
Ultra Petroleum Corp. | 3.6 | 2.4 |
GlobalSantaFe Corp. | 3.6 | 3.9 |
52.9 | ||
Top Industries (% of fund's net assets) | |||
As of February 28, 2007 | |||
 | Oil, Gas & Consumable Fuels | 64.6% | |
 | Energy Equipment & Services | 31.8% | |
 | Electrical Equipment | 1.8% | |
 | Construction & Engineering | 0.9% | |
 | Machinery | 0.4% | |
 | All Others* | 0.5% | |

As of August 31, 2006 | |||
| Oil, Gas & Consumable Fuels | 49.7% | |
| Energy Equipment & Services | 38.1% | |
| Independent Power Producers & Energy Traders | 2.8% | |
| Machinery | 1.9% | |
| Construction & Engineering | 1.7% | |
| All Others* | 5.8% | |
* Includes short-term investments and net other assets. |
Annual Report
Select Energy Portfolio
Investments February 28, 2007
Showing Percentage of Net Assets
Common Stocks - 99.5% | |||
Shares | Value | ||
CONSTRUCTION & ENGINEERING - 0.9% | |||
Construction & Engineering - 0.9% | |||
Chicago Bridge & Iron Co. NV (NY Shares) | 61,000 | $ 1,813,530 | |
Fluor Corp. | 47,500 | 4,012,325 | |
Jacobs Engineering Group, Inc. (a) | 155,300 | 14,029,802 | |
19,855,657 | |||
ELECTRICAL EQUIPMENT - 1.8% | |||
Electrical Components & Equipment - 0.0% | |||
Suntech Power Holdings Co. Ltd. sponsored ADR (a) | 28,100 | 1,018,625 | |
Heavy Electrical Equipment - 1.8% | |||
Suzlon Energy Ltd. | 122,327 | 2,891,845 | |
Vestas Wind Systems AS (a) | 758,400 | 35,423,518 | |
38,315,363 | |||
TOTAL ELECTRICAL EQUIPMENT | 39,333,988 | ||
ENERGY EQUIPMENT & SERVICES - 31.8% | |||
Oil & Gas Drilling - 14.1% | |||
Diamond Offshore Drilling, Inc. | 611,300 | 47,571,366 | |
GlobalSantaFe Corp. | 1,321,900 | 76,181,097 | |
Noble Corp. | 1,150,400 | 80,781,088 | |
Pride International, Inc. (a) | 1,657,816 | 47,745,101 | |
Transocean, Inc. (a) | 641,100 | 49,159,548 | |
301,438,200 | |||
Oil & Gas Equipment & Services - 17.7% | |||
Baker Hughes, Inc. | 914,350 | 59,533,329 | |
Halliburton Co. | 1,180,064 | 36,440,376 | |
Hanover Compressor Co. (a) | 282,000 | 6,189,900 | |
National Oilwell Varco, Inc. (a) | 1,149,750 | 80,068,590 | |
Oceaneering International, Inc. (a) | 139,900 | 5,517,656 | |
Schlumberger Ltd. (NY Shares) (d) | 1,930,360 | 121,226,608 | |
Smith International, Inc. | 682,897 | 27,998,777 | |
Superior Energy Services, Inc. (a) | 607,900 | 18,632,135 | |
Universal Compression Holdings, Inc. (a) | 93,000 | 6,226,350 | |
W-H Energy Services, Inc. (a) | 215,600 | 9,055,200 | |
Weatherford International Ltd. (a) | 227,500 | 9,134,125 | |
380,023,046 | |||
TOTAL ENERGY EQUIPMENT & SERVICES | 681,461,246 | ||
MACHINERY - 0.4% | |||
Construction & Farm Machinery & Heavy Trucks - 0.4% | |||
Joy Global, Inc. | 207,300 | 9,191,682 | |
Shares | Value | ||
OIL, GAS & CONSUMABLE FUELS - 64.6% | |||
Coal & Consumable Fuels - 4.0% | |||
Arch Coal, Inc. | 646,800 | $ 20,141,352 | |
CONSOL Energy, Inc. | 885,200 | 31,575,084 | |
Foundation Coal Holdings, Inc. | 139,800 | 4,602,216 | |
Peabody Energy Corp. | 727,700 | 29,399,080 | |
85,717,732 | |||
Integrated Oil & Gas - 23.8% | |||
Chevron Corp. | 1,595,232 | 109,448,868 | |
ConocoPhillips | 2,144,026 | 140,262,181 | |
Exxon Mobil Corp. | 2,673,410 | 191,630,027 | |
Hess Corp. | 416,000 | 22,068,800 | |
Occidental Petroleum Corp. | 690,900 | 31,905,762 | |
Petroleo Brasileiro SA Petrobras sponsored ADR | 106,000 | 9,582,400 | |
Suncor Energy, Inc. | 71,200 | 5,049,231 | |
509,947,269 | |||
Oil & Gas Exploration & Production - 25.9% | |||
Aurora Oil & Gas Corp. (a) | 952,983 | 2,344,338 | |
Cabot Oil & Gas Corp. | 985,541 | 66,583,150 | |
Canadian Natural Resources Ltd. | 102,300 | 5,137,086 | |
Chesapeake Energy Corp. (d) | 1,801,900 | 54,939,931 | |
Energy Partners Ltd. (a) | 213,813 | 4,639,742 | |
EOG Resources, Inc. | 989,200 | 67,008,408 | |
Forest Oil Corp. (a) | 72,300 | 2,306,370 | |
Mariner Energy, Inc. (a) | 133,218 | 2,464,533 | |
Newfield Exploration Co. (a) | 149,100 | 6,444,102 | |
Noble Energy, Inc. | 240,100 | 13,822,557 | |
Petrohawk Energy Corp. (a) | 903,800 | 10,818,486 | |
Plains Exploration & Production Co. (a) | 1,043,205 | 47,601,444 | |
Quicksilver Resources, Inc. (a) | 724,300 | 27,936,251 | |
Range Resources Corp. | 2,669,400 | 85,233,942 | |
Talisman Energy, Inc. | 301,000 | 5,191,031 | |
Ultra Petroleum Corp. (a) | 1,534,700 | 77,978,107 | |
W&T Offshore, Inc. | 347,100 | 10,419,942 | |
XTO Energy, Inc. | 1,271,800 | 65,701,188 | |
556,570,608 | |||
Oil & Gas Refining & Marketing - 8.8% | |||
Petroplus Holdings AG | 30,070 | 2,097,190 | |
Sunoco, Inc. | 186,800 | 12,052,336 | |
Tesoro Corp. | 22,500 | 2,050,650 | |
Valero Energy Corp. | 2,999,732 | 172,934,550 | |
189,134,726 | |||
Oil & Gas Storage & Transport - 2.1% | |||
Williams Companies, Inc. | 1,637,500 | 44,163,375 | |
TOTAL OIL, GAS & CONSUMABLE FUELS | 1,385,533,710 | ||
TOTAL COMMON STOCKS (Cost $1,685,693,207) | 2,135,376,283 | ||
Money Market Funds - 0.3% | |||
Shares | Value | ||
Fidelity Cash Central Fund, 5.35% (b) | 730,318 | $ 730,318 | |
Fidelity Securities Lending Cash Central Fund, 5.34% (b)(c) | 4,782,600 | 4,782,600 | |
TOTAL MONEY MARKET FUNDS (Cost $5,512,918) | 5,512,918 | ||
TOTAL INVESTMENT PORTFOLIO - 99.8% (Cost $1,691,206,125) | 2,140,889,201 |
NET OTHER ASSETS - 0.2% | 4,508,139 | ||
NET ASSETS - 100% | $ 2,145,397,340 | ||
Legend |
(a) Non-income producing |
(b) Affiliated fund that is available only to investment companies and other accounts managed by Fidelity Investments. The rate quoted is the annualized seven-day yield of the fund at period end. A complete unaudited listing of the fund's holdings as of its most recent quarter end is available upon request. |
(c) Investment made with cash collateral received from securities on loan. |
(d) Security or a portion of the security is on loan at period end. |
Affiliated Central Funds |
Information regarding fiscal year to date income earned by the Fund from investments in Fidelity Central Funds is as follows: |
Fund | Income earned |
Fidelity Cash Central Fund | $ 1,388,471 |
Fidelity Securities Lending Cash Central Fund | 211,925 |
Total | $ 1,600,396 |
Other Information |
Distribution of investments by country of issue, as a percentage of total net assets, is as follows: |
United States of America | 80.3% |
Cayman Islands | 7.4% |
Netherlands Antilles | 5.6% |
Canada | 4.2% |
Denmark | 1.7% |
Others (individually less than 1%) | 0.8% |
100.0% |
See accompanying notes which are an integral part of the financial statements.
Annual Report
Financial Statements
Statement of Assets and Liabilities
February 28, 2007 | ||
Assets | ||
Investment in securities, at value (including securities loaned of $4,680,348) - See accompanying schedule: Unaffiliated issuers (cost $1,685,693,207) | $ 2,135,376,283 | |
Fidelity Central Funds (cost $5,512,918) | 5,512,918 | |
Total Investments (cost $1,691,206,125) | $ 2,140,889,201 | |
Receivable for investments sold | 21,958,409 | |
Receivable for fund shares sold | 5,148,923 | |
Dividends receivable | 6,361,511 | |
Distributions receivable from Fidelity Central Funds | 27,263 | |
Prepaid expenses | 11,614 | |
Other receivables | 10,805 | |
Total assets | 2,174,407,726 | |
Liabilities | ||
Payable for investments purchased | $ 14,706,187 | |
Payable for fund shares redeemed | 7,792,445 | |
Accrued management fee | 1,040,802 | |
Other affiliated payables | 539,648 | |
Other payables and accrued expenses | 148,704 | |
Collateral on securities loaned, at value | 4,782,600 | |
Total liabilities | 29,010,386 | |
Net Assets | $ 2,145,397,340 | |
Net Assets consist of: | ||
Paid in capital | $ 1,612,033,714 | |
Undistributed net investment income | 4,942,151 | |
Accumulated undistributed net realized gain (loss) on investments and foreign currency transactions | 78,738,399 | |
Net unrealized appreciation (depreciation) on investments | 449,683,076 | |
Net Assets, for 43,962,536 shares outstanding | $ 2,145,397,340 | |
Net Asset Value, offering price and redemption price per share ($2,145,397,340 ÷ 43,962,536 shares) | $ 48.80 | |
Statement of Operations
Year ended February 28, 2007 | ||
Investment Income | ||
Dividends | $ 30,078,951 | |
Interest | 41,093 | |
Income from Fidelity Central Funds (including $211,925 from security lending) | 1,600,396 | |
Total income | 31,720,440 | |
Expenses | ||
Management fee | $ 14,317,493 | |
Transfer agent fees | 6,865,166 | |
Accounting and security lending fees | 886,905 | |
Custodian fees and expenses | 112,775 | |
Independent trustees' compensation | 9,422 | |
Registration fees | 160,053 | |
Audit | 46,312 | |
Legal | 45,250 | |
Interest | 64,063 | |
Miscellaneous | 131,816 | |
Total expenses before reductions | 22,639,255 | |
Expense reductions | (116,623) | 22,522,632 |
Net investment income (loss) | 9,197,808 | |
Realized and Unrealized Gain (Loss) Net realized gain (loss) on: | ||
Investment securities: | ||
Unaffiliated issuers | 190,130,776 | |
Foreign currency transactions | 24,604 | |
Total net realized gain (loss) | 190,155,380 | |
Change in net unrealized appreciation (depreciation) on: Investment securities | (47,748,519) | |
Assets and liabilities in foreign currencies | (2,064) | |
Total change in net unrealized appreciation (depreciation) | (47,750,583) | |
Net gain (loss) | 142,404,797 | |
Net increase (decrease) in net assets resulting from operations | $ 151,602,605 | |
See accompanying notes which are an integral part of the financial statements.
Annual Report
Select Energy Portfolio
Financial Statements - continued
Statement of Changes in Net Assets
Year ended | Year ended | |
Increase (Decrease) in Net Assets | ||
Operations | ||
Net investment income (loss) | $ 9,197,808 | $ 5,195,545 |
Net realized gain (loss) | 190,155,380 | 241,102,758 |
Change in net unrealized appreciation (depreciation) | (47,750,583) | 263,292,874 |
Net increase (decrease) in net assets resulting from operations | 151,602,605 | 509,591,177 |
Distributions to shareholders from net investment income | (4,748,680) | (4,035,148) |
Distributions to shareholders from net realized gain | (226,752,869) | (107,681,031) |
Total distributions | (231,501,549) | (111,716,179) |
Share transactions Proceeds from sales of shares | 1,231,553,047 | 2,697,973,308 |
Reinvestment of distributions | 222,569,462 | 107,368,613 |
Cost of shares redeemed | (1,777,274,000) | (1,805,743,615) |
Net increase (decrease) in net assets resulting from share transactions | (323,151,491) | 999,598,306 |
Redemption fees | 648,583 | 1,466,118 |
Total increase (decrease) in net assets | (402,401,852) | 1,398,939,422 |
Net Assets | ||
Beginning of period | 2,547,799,192 | 1,148,859,770 |
End of period (including undistributed net investment income of $4,942,151 and undistributed net investment income of $1,501,978, respectively) | $ 2,145,397,340 | $ 2,547,799,192 |
Other Information Shares | ||
Sold | 24,389,971 | 61,223,035 |
Issued in reinvestment of distributions | 4,357,368 | 2,375,548 |
Redeemed | (36,564,806) | (41,499,308) |
Net increase (decrease) | (7,817,467) | 22,099,275 |
Financial Highlights
Years ended February 28, | 2007 | 2006 | 2005 | 2004 G | 2003 |
Selected Per-Share Data | |||||
Net asset value, beginning of period | $ 49.20 | $ 38.71 | $ 26.52 | $ 20.63 | $ 23.45 |
Income from Investment Operations | |||||
Net investment income (loss) C | .18 | .12 | .19 | .13 | .12 |
Net realized and unrealized gain (loss) | 4.13 | 12.87 | 12.43 | 5.89 | (2.81) |
Total from investment operations | 4.31 | 12.99 | 12.62 | 6.02 | (2.69) |
Distributions from net investment income | (.10) | (.09) | (.17) | (.14) | (.14) |
Distributions from net realized gain | (4.62) | (2.44) | (.28) | - | - |
Total distributions | (4.72) | (2.53) | (.45) | (.14) | (.14) |
Redemption fees added to paid in capital C | .01 | .03 | .02 | .01 | .01 |
Net asset value, end of period | $ 48.80 | $ 49.20 | $ 38.71 | $ 26.52 | $ 20.63 |
Total Return A,B | 8.57% | 34.39% | 48.07% | 29.34% | (11.46)% |
Ratios to Average Net Assets D,F | |||||
Expenses before reductions | .89% | .94% | .97% | 1.18% | 1.22% |
Expenses net of fee waivers, if any | .89% | .94% | .97% | 1.18% | 1.22% |
Expenses net of all reductions | .89% | .89% | .93% | 1.17% | 1.21% |
Net investment income (loss) | .36% | .27% | .62% | .59% | .54% |
Supplemental Data | |||||
Net assets, end of period (000 omitted) | $ 2,145,397 | $ 2,547,799 | $ 1,148,860 | $ 286,847 | $ 194,294 |
Portfolio turnover rate E | 102% | 128% | 91% | 33% | 73% |
A Total returns would have been lower had certain expenses not been reduced during the periods shown.
B Total returns do not include the effect of the former sales charges.
C Calculated based on average shares outstanding during the period.
D Fees and expenses of the underlying Fidelity Central Funds are not included in the Fund's expense ratio. The Fund indirectly bears its proportionate share of the expenses of any underlying Fidelity Central Funds.
E Amount does not include the portfolio activity of any underlying Fidelity Central Funds.
F Expense ratios reflect operating expenses of the Fund. Expenses before reductions do not reflect amounts reimbursed by the investment adviser or reductions from brokerage service arrangements or other expense offset arrangements and do not represent the amount paid by the Fund during periods when reimbursements or reductions occur. Expenses net of fee waivers reflect expenses after reimbursement by the investment adviser but prior to reductions from brokerage service arrangements or other expense offset arrangements. Expenses net of all reductions represent the net expenses paid by the Fund.
G For the year ended February 29.
See accompanying notes which are an integral part of the financial statements.
Annual Report
Select Energy Service Portfolio
Performance
Average annual total return reflects the change in the value of an investment, assuming reinvestment of the fund's dividend income and capital gains (the profits earned upon the sale of securities that have grown in value) and assuming a constant rate of performance each year. The $10,000 table and the fund's returns do not reflect the deduction of taxes that a shareholder would pay on fund distributions or the redemption of fund shares. During periods of reimbursement by Fidelity, a fund's total returns will be greater than it would be had the reimbursement not occurred. How a fund did yesterday is no guarantee of how it will do tomorrow.
Average Annual Total Returns
Periods ended February 28, 2007 | Past 1 | Past 5 | Past 10 |
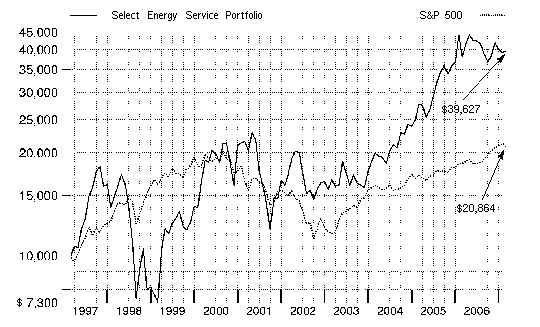
Select Energy Service Portfolio | 3.92% | 18.12% | 14.76% |
$10,000 Over 10 Years
Let's say hypothetically that $10,000 was invested in Select Energy Service Portfolio on February 28, 1997. The chart shows how the value of your investment would have changed, and also shows how the S&P 500 Index performed over the same period.
Annual Report
Select Energy Service Portfolio
Management's Discussion of Fund Performance
Comments from John Dowd, Portfolio Manager of Fidelity® Select Energy Service Portfolio
A rosy year for stocks wilted just prior to the end of the 12-month period ending February 28, 2007. On the day prior to the period's close, the Dow Jones Industrial AverageSM plunged 416 points and the Standard & Poor's 500SM Index lost roughly 3.5% of its value, plummeting nearly 50 points and marking the benchmark's worst single-day performance since the day the market reopened after the 9/11 terrorist attacks. Though investors were obviously rattled by the development, it was only the 22nd-biggest decline for the S&P 500® in 20 years, and it could not overshadow how well stocks performed for the 12 months overall. For much of the past year, investors grew confident that the economy would not fall into a recession, and they bid up most broad-based stock indexes for six consecutive months from August through January. Overall for the year ending February 28, 2007, the S&P 500 was up 11.97%, the Dow advanced 14.24%, the small-cap Russell 2000® Index gained 9.87% and the NASDAQ Composite® Index rose 6.66%.
For the 12 months that ended February 28, 2007, the fund returned 3.92%, underperforming the 4.12% gain of the Morgan Stanley Capital InternationalSM (MSCI®) US Investable Market Energy Equipment & Services Index and the 8.60% advance of a blended index specific to this fund. This blended index is a combination of the Goldman Sachs® Natural Resources Index, which the fund was compared with through September, and the new MSCI benchmark mentioned above, which the fund was compared with during the period's final five months1. During the same 12-month period, the fund also underperformed the S&P 500. During the first seven months of the review period, the fund lagged the Goldman Sachs benchmark partly because of a lack of exposure to strong performing metals and mining index components Falconbridge and Inco - two Canadian nickel producers - and copper miner Phelps Dodge. Overweighting drillers Noble, GlobalSantaFe, Diamond Offshore Drilling and Pride International, as well as energy services giant Halliburton, also detracted, as did not owning Chevron and Exxon Mobil. On the flip side, overweighted positions in services companies Veritas DGC, Cameron International and McDermott International boosted performance, as did avoiding index components ConocoPhillips and Petro-Canada. The fund also benefited from not owning Canadian Natural Resources, Anadarko Petroleum and Newmont Mining. During the final five months of the period, the fund outperformed the MSCI index, partly due to a rally in selected drilling stocks, including Noble and Diamond Offshore Drilling. At the same time, underweighting or not owning natural gas drillers paid off when Patterson UTI, Rowan and Nabors Industries remained weak. Other contributors included subsea robotics manufacturer Oceaneering International and drilling equipment manufacturer National Oilwell Varco, as well as out-of-index Danish wind turbine manufacturer Vestas Wind Systems and solar panel manufacturer Sunpower. In energy services, not owning index component BJ Services helped when its pressure pumping business softened. Conversely, the fund suffered from underweighting or not owning some strong performing energy equipment and services companies, including Schlumberger, Veritas DGC, Halliburton, Tidewater and Core Laboratories. On the other hand, overweighting services companies with natural gas exposure, such as Weatherford International and W-H Energy, detracted. Lastly, underweighting driller Helmerich & Payne proved costly when the stock performed very well.
1 The fund's blended index is a customized index developed by Fidelity for the limited purpose of discussing the fund's performance for the 12-month period ending February 28, 2007. From March 1, 2006, through September 30, 2006, the fund compared its performance to the Goldman Sachs Natural Resources Index, which returned 2.61% during that period. On October 1, 2006, the fund began comparing its performance to a different index, the MSCI US Investable Market Energy Equipment & Services Index, which returned 5.84% from October 1, 2006, through February 28, 2007. For the 12-month period ending February 28, 2007, the blended index (Goldman Sachs and MSCI) returned 8.60%.
The views expressed above reflect those of the portfolio manager(s) only through the end of the period as stated on the cover of this report and do not necessarily represent the views of Fidelity or any other person in the Fidelity organization. Any such views are subject to change at any time based upon market or other conditions and Fidelity disclaims any responsibility to update such views. These views may not be relied on as investment advice and, because investment decisions for a Fidelity fund are based on numerous factors, may not be relied on as an indication of trading intent on behalf of any Fidelity fund.
Annual Report
Select Energy Service Portfolio
Investment Changes
Top Ten Stocks as of February 28, 2007 | ||
% of fund's | % of fund's net assets | |
Schlumberger Ltd. (NY Shares) | 23.8 | 5.8 |
Halliburton Co. | 8.1 | 5.6 |
National Oilwell Varco, Inc. | 7.5 | 8.4 |
Transocean, Inc. | 5.8 | 3.8 |
Weatherford International Ltd. | 4.8 | 5.5 |
Baker Hughes, Inc. | 4.7 | 4.4 |
GlobalSantaFe Corp. | 4.7 | 6.2 |
Smith International, Inc. | 4.5 | 2.5 |
Cameron International Corp. | 4.2 | 3.2 |
Noble Corp. | 3.2 | 6.5 |
71.3 | ||
Top Industries (% of fund's net assets) | |||
As of February 28, 2007 | |||
| Energy Equipment & Services | 95.7% | |
| Electrical Equipment | 1.4% | |
| Electronic Equipment & Instruments | 0.8% | |
| Oil, Gas & Consumable Fuels | 0.6% | |
| Industrial Conglomerates | 0.6% | |
| All Others* | 0.9% | |

As of August 31, 2006 | |||
| Energy Equipment & Services | 91.8% | |
| Industrial Conglomerates | 3.5% | |
| Oil, Gas & Consumable Fuels | 3.2% | |
| Electrical Equipment | 0.8% | |
| Electronic Equipment & Instruments | 0.6% | |
| All Others* | 0.1% | |
* Includes short-term investments and net other assets. |
Annual Report
Select Energy Service Portfolio
Investments February 28, 2007
Showing Percentage of Net Assets
Common Stocks - 99.1% | |||
Shares | Value | ||
ELECTRICAL EQUIPMENT - 1.4% | |||
Electrical Components & Equipment - 0.1% | |||
Suntech Power Holdings Co. Ltd. sponsored ADR (a) | 17,300 | $ 627,125 | |
Heavy Electrical Equipment - 1.3% | |||
Suzlon Energy Ltd. | 132,000 | 3,120,517 | |
Vestas Wind Systems AS (a) | 280,800 | 13,115,669 | |
16,236,186 | |||
TOTAL ELECTRICAL EQUIPMENT | 16,863,311 | ||
ELECTRONIC EQUIPMENT & INSTRUMENTS - 0.8% | |||
Electronic Equipment & Instruments - 0.8% | |||
Sunpower Corp. Class A (a)(d) | 221,100 | 9,573,630 | |
ENERGY EQUIPMENT & SERVICES - 95.7% | |||
Oil & Gas Drilling - 21.0% | |||
Atwood Oceanics, Inc. (a) | 112,500 | 5,692,500 | |
Diamond Offshore Drilling, Inc. | 344,700 | 26,824,554 | |
GlobalSantaFe Corp. | 994,710 | 57,325,137 | |
Grey Wolf, Inc. (a) | 1,200 | 8,028 | |
Helmerich & Payne, Inc. | 7,100 | 193,120 | |
Hercules Offshore, Inc. (a) | 250,400 | 6,668,152 | |
Nabors Industries Ltd. (a) | 991,200 | 29,696,352 | |
Noble Corp. | 559,850 | 39,312,667 | |
Patterson-UTI Energy, Inc. | 1,300 | 28,977 | |
Pride International, Inc. (a)(d) | 677,086 | 19,500,077 | |
Rowan Companies, Inc. | 4,300 | 131,709 | |
TODCO Class A (a) | 3,200 | 109,056 | |
Transocean, Inc. (a) | 919,427 | 70,501,662 | |
255,991,991 | |||
Oil & Gas Equipment & Services - 74.7% | |||
Acergy SA (a) | 204,900 | 3,878,757 | |
Baker Hughes, Inc. | 887,136 | 57,761,425 | |
Basic Energy Services, Inc. (a) | 281,200 | 6,402,924 | |
Cameron International Corp. (a) | 904,800 | 51,293,112 | |
Dresser-Rand Group, Inc. (a)(d) | 288,600 | 7,494,942 | |
Dril-Quip, Inc. (a) | 454,600 | 17,538,468 | |
FMC Technologies, Inc. (a) | 308,000 | 20,260,240 | |
Global Industries Ltd. (a) | 13,200 | 194,832 | |
Grant Prideco, Inc. (a) | 591,805 | 25,690,255 | |
Halliburton Co. (d) | 3,210,934 | 99,153,642 | |
Hanover Compressor Co. (a) | 716,400 | 15,724,980 | |
Hornbeck Offshore Services, Inc. (a) | 90,800 | 2,430,716 | |
National Oilwell Varco, Inc. (a) | 1,311,331 | 91,321,091 | |
Oceaneering International, Inc. (a) | 874,800 | 34,502,112 | |
Oil States International, Inc. (a) | 586,100 | 17,202,035 | |
ProSafe ASA | 95,000 | 1,347,474 | |
Schlumberger Ltd. (NY Shares) (d) | 4,619,746 | 290,120,049 | |
Shares | Value | ||
Smith International, Inc. | 1,332,056 | $ 54,614,296 | |
Superior Energy Services, Inc. (a) | 348,300 | 10,675,395 | |
Tidewater, Inc. | 5,700 | 296,229 | |
Universal Compression Holdings, Inc. (a) | 259,800 | 17,393,610 | |
W-H Energy Services, Inc. (a) | 698,300 | 29,328,600 | |
Weatherford International Ltd. (a) | 1,446,010 | 58,057,302 | |
912,682,486 | |||
TOTAL ENERGY EQUIPMENT & SERVICES | 1,168,674,477 | ||
INDUSTRIAL CONGLOMERATES - 0.6% | |||
Industrial Conglomerates - 0.6% | |||
McDermott International, Inc. (a) | 153,150 | 7,381,830 | |
OIL, GAS & CONSUMABLE FUELS - 0.6% | |||
Oil & Gas Exploration & Production - 0.6% | |||
Plains Exploration & Production Co. (a) | 103,800 | 4,736,394 | |
Quicksilver Resources, Inc. (a) | 80,062 | 3,087,991 | |
7,824,385 | |||
TOTAL COMMON STOCKS (Cost $830,829,289) | 1,210,317,633 | ||
Money Market Funds - 6.8% | |||
Fidelity Securities Lending Cash Central Fund, 5.34% (b)(c) | 83,497,675 | 83,497,675 | |
TOTAL INVESTMENT PORTFOLIO - 105.9% (Cost $914,326,964) | 1,293,815,308 |
NET OTHER ASSETS - (5.9)% | (72,411,363) | ||
NET ASSETS - 100% | $ 1,221,403,945 | ||
Legend |
(a) Non-income producing |
(b) Affiliated fund that is available only to investment companies and other accounts managed by Fidelity Investments. The rate quoted is the annualized seven-day yield of the fund at period end. A complete unaudited listing of the fund's holdings as of its most recent quarter end is available upon request. |
(c) Investment made with cash collateral received from securities on loan. |
(d) Security or a portion of the security is on loan at period end. |
Affiliated Central Funds |
Information regarding fiscal year to date income earned by the Fund from investments in Fidelity Central Funds is as follows: |
Fund | Income earned |
Fidelity Cash Central Fund | $ 669,189 |
Fidelity Securities Lending Cash Central Fund | 340,817 |
Total | $ 1,010,006 |
Other Information |
Distribution of investments by country of issue, as a percentage of total net assets, is as follows: |
United States of America | 65.9% |
Netherlands Antilles | 23.8% |
Cayman Islands | 8.0% |
Denmark | 1.1% |
Others (individually less than 1%) | 1.2% |
100.0% |
See accompanying notes which are an integral part of the financial statements.
Annual Report
Select Energy Service Portfolio
Financial Statements
Statement of Assets and Liabilities
February 28, 2007 | ||
Assets | ||
Investment in securities, at value (including securities loaned of $81,797,600) - See accompanying schedule: Unaffiliated issuers (cost $830,829,289) | $ 1,210,317,633 | |
Fidelity Central Funds (cost $83,497,675) | 83,497,675 | |
Total Investments (cost $914,326,964) | $ 1,293,815,308 | |
Receivable for investments sold | 16,769,741 | |
Receivable for fund shares sold | 3,730,659 | |
Dividends receivable | 2,546,354 | |
Distributions receivable from Fidelity Central Funds | 6,838 | |
Prepaid expenses | 7,761 | |
Other receivables | 82,844 | |
Total assets | 1,316,959,505 | |
Liabilities | ||
Payable to custodian bank | $ 3,059,738 | |
Payable for investments purchased | 3,189,925 | |
Payable for fund shares redeemed | 4,817,553 | |
Accrued management fee | 593,476 | |
Other affiliated payables | 297,660 | |
Other payables and accrued expenses | 99,533 | |
Collateral on securities loaned, at value | 83,497,675 | |
Total liabilities | 95,555,560 | |
Net Assets | $ 1,221,403,945 | |
Net Assets consist of: | ||
Paid in capital | $ 772,816,631 | |
Accumulated net investment loss | (826) | |
Accumulated undistributed net realized gain (loss) on investments and foreign currency transactions | 69,099,810 | |
Net unrealized appreciation (depreciation) on investments and assets and liabilities in foreign currencies | 379,488,330 | |
Net Assets, for 18,279,805 shares outstanding | $ 1,221,403,945 | |
Net Asset Value, offering price and redemption price per share ($1,221,403,945 ÷ 18,279,805 shares) | $ 66.82 | |
Statement of Operations
Year ended February 28, 2007 | ||
Investment Income | ||
Dividends | $ 7,026,853 | |
Special dividends | 1,407,600 | |
Interest | 2,906 | |
Income from Fidelity Central Funds (including $340,817 from security lending ) | 1,010,006 | |
Total income | 9,447,365 | |
Expenses | ||
Management fee | $ 9,235,810 | |
Transfer agent fees | 4,136,278 | |
Accounting and security lending fees | 601,416 | |
Custodian fees and expenses | 63,097 | |
Independent trustees' compensation | 6,218 | |
Registration fees | 168,802 | |
Audit | 42,439 | |
Legal | 30,278 | |
Interest | 94,738 | |
Miscellaneous | 80,281 | |
Total expenses before reductions | 14,459,357 | |
Expense reductions | (57,757) | 14,401,600 |
Net investment income (loss) | (4,954,235) | |
Realized and Unrealized Gain (Loss) Net realized gain (loss) on: | ||
Investment securities: | ||
Unaffiliated issuers | 133,790,934 | |
Foreign currency transactions | 18,835 | |
Total net realized gain (loss) | 133,809,769 | |
Change in net unrealized appreciation (depreciation) on: Investment securities | (128,698,875) | |
Assets and liabilities in foreign currencies | (159) | |
Total change in net unrealized appreciation (depreciation) | (128,699,034) | |
Net gain (loss) | 5,110,735 | |
Net increase (decrease) in net assets resulting from operations | $ 156,500 | |
See accompanying notes which are an integral part of the financial statements.
Annual Report
Select Energy Services Portfolio
Financial Statements - continued
Statement of Changes in Net Assets
Year ended | Year ended | |
Increase (Decrease) in Net Assets | ||
Operations | ||
Net investment income (loss) | $ (4,954,235) | $ (2,557,504) |
Net realized gain (loss) | 133,809,769 | 59,949,764 |
Change in net unrealized appreciation (depreciation) | (128,699,034) | 254,167,467 |
Net increase (decrease) in net assets resulting from operations | 156,500 | 311,559,727 |
Distributions to shareholders from net realized gain | (92,210,989) | - |
Share transactions | 1,150,774,571 | 1,674,189,408 |
Reinvestment of distributions | 88,457,527 | - |
Cost of shares redeemed | (1,661,826,381) | (1,149,311,141) |
Net increase (decrease) in net assets resulting from share transactions | (422,594,283) | 524,878,267 |
Redemption fees | 1,976,642 | 1,385,968 |
Total increase (decrease) in net assets | (512,672,130) | 837,823,962 |
Net Assets | ||
Beginning of period | 1,734,076,075 | 896,252,113 |
End of period (including accumulated net investment loss of $826 and accumulated net investment loss of $957, respectively) | $ 1,221,403,945 | $ 1,734,076,075 |
Other Information Shares | ||
Sold | 15,753,549 | 27,015,130 |
Issued in reinvestment of distributions | 1,218,147 | - |
Redeemed | (24,182,884) | (19,650,559) |
Net increase (decrease) | (7,211,188) | 7,364,571 |
Financial Highlights
Years ended February 28, | 2007 | 2006 | 2005 | 2004 I | 2003 |
Selected Per-Share Data | |||||
Net asset value, beginning of period | $ 68.03 | $ 49.44 | $ 35.65 | $ 29.73 | $ 30.75 |
Income from Investment Operations | |||||
Net investment income (loss) C | (.21) J | (.12) G | (.20) | (.24) | (.21) F |
Net realized and unrealized gain (loss) | 3.07 | 18.64 | 13.95 | 6.14 | (.85) |
Total from investment operations | 2.86 | 18.52 | 13.75 | 5.90 | (1.06) |
Distributions from net realized gain | (4.15) | - | - | - | - |
Redemption fees added to paid in capital C | .08 | .07 | .04 | .02 | .04 |
Net asset value, end of period | $ 66.82 | $ 68.03 | $ 49.44 | $ 35.65 | $ 29.73 |
Total Return A,B | 3.92% | 37.60% | 38.68% | 19.91% | (3.32)% |
Ratios to Average Net Assets D,H | |||||
Expenses before reductions | .88% | .94% | .98% | 1.14% | 1.15% |
Expenses net of fee waivers, if any | .88% | .94% | .98% | 1.14% | 1.15% |
Expenses net of all reductions | .88% | .91% | .96% | 1.13% | 1.12% |
Net investment income (loss) | (.30)% J | (.21)% G | (.53)% | (.79)% | (.68)% |
Supplemental Data | |||||
Net assets, end of period (000 omitted) | $ 1,221,404 | $ 1,734,076 | $ 896,252 | $ 463,384 | $ 455,122 |
Portfolio turnover rate E | 92% | 58% | 34% | 23% | 64% |
A Total returns would have been lower had certain expenses not been reduced during the periods shown.
B Total returns do not include the effect of the former sales charges.
C Calculated based on average shares outstanding during the period.
D Fees and expenses of the underlying Fidelity Central Funds are not included in the Fund's expense ratio. The Fund indirectly bears its proportionate share of the expenses of any underlying Fidelity Central Funds.
E Amount does not include the portfolio activity of any underlying Fidelity Central Funds.
F Investment income per share reflects a special dividend which amounted to $.01 per share.
G Investment income per share reflects a special dividend which amounted to $.08 per share. Excluding the special dividend, the ratio of net investment income (loss) to average net assets would have been (.34)%.
H Expense ratios reflect operating expenses of the Fund. Expenses before reductions do not reflect amounts reimbursed by the investment adviser or reductions from brokerage service arrangements or other expense offset arrangements and do not represent the amount paid by the Fund during periods when reimbursements or reductions occur. Expenses net of fee waivers reflect expenses after reimbursement by the investment adviser but prior to reductions from brokerage service arrangements or other expense offset arrangements. Expenses net of all reductions represent the net expenses paid by the Fund.
I For the year ended February 29.
J Investment income reflects a special dividend which amounted to $.06 per share. Excluding the special dividend, the ratio of net investment income (loss) to average net assets would have been (.39%).
See accompanying notes which are an integral part of the financial statements.
Annual Report
Performance
Average annual total return reflects the change in the value of an investment, assuming reinvestment of the fund's dividend income and capital gains (the profits earned upon the sale of securities that have grown in value) and assuming a constant rate of performance each year. The $10,000 table and the fund's returns do not reflect the deduction of taxes that a shareholder would pay on fund distributions or the redemption of fund shares. During periods of reimbursement by Fidelity, a fund's total returns will be greater than it would be had the reimbursement not occurred. How a fund did yesterday is no guarantee of how it will do tomorrow.
Average Annual Total Returns
Periods ended February 28, 2007 | Past 1 | Past 5 | Past 10 |
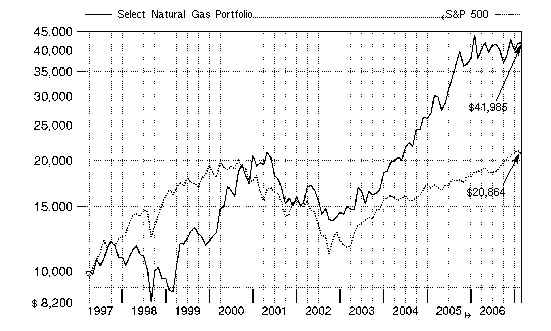
Select Natural Gas Portfolio | 10.43% | 22.32% | 15.43% |
$10,000 Over 10 Years
Let's say hypothetically that $10,000 was invested in Select Natural Gas Portfolio on February 28, 1997. The chart shows how the value of your investment would have changed, and also shows how the S&P 500 Index performed over the same period.
Annual Report
Select Natural Gas Portfolio
Management's Discussion of Fund Performance
Comments from James McElligott, Portfolio Manager of Fidelity® Select Natural Gas Portfolio
A rosy year for stocks wilted just prior to the end of the 12-month period ending February 28, 2007. On the day prior to the period's close, the Dow Jones Industrial AverageSM plunged 416 points and the Standard & Poor's 500SM Index lost roughly 3.5% of its value, plummeting nearly 50 points and marking the benchmark's worst single-day performance since the day the market reopened after the 9/11 terrorist attacks. Though investors were obviously rattled by the development, it was only the 22nd-biggest decline for the S&P 500® in 20 years, and it could not overshadow how well stocks performed for the 12 months overall. For much of the past year, investors grew confident that the economy would not fall into a recession, and they bid up most broad-based stock indexes for six consecutive months from August through January. Overall for the year ending February 28, 2007, the S&P 500 was up 11.97%, the Dow advanced 14.24%, the small-cap Russell 2000® Index gained 9.87% and the NASDAQ Composite® Index rose 6.66%.
For the year, the fund was up 10.43%, compared with a gain of 12.10% for its new benchmark, the Standard & Poor's® Custom Natural Gas Index, and an advance of 12.22% for a blended index specific to this fund. This blended index is a combination of the Goldman Sachs® Natural Resources Index, which the fund was compared with through September, and the S&P® Custom index mentioned above, which the fund was compared with during the period's final five months1. During the same 12-month period, the fund lagged the S&P 500. For the first seven months of the period, a time when the spot price for natural gas was falling due to overabundant supply and slack demand, the fund lagged the Goldman Sachs benchmark. The shortfall was mainly the result of unfavorable market selection. An overweighting in the oil and gas exploration and production (E&P) segment had a negative impact on relative performance, as did a lack of exposure to strong performing groups outside the fund's focus, such as integrated oil/gas and diversified metals/mining. Solid stock selection in the steel industry offset some of these negatives, however. Among individual holdings that detracted, large stakes in E&P firms Quicksilver Resources, Canadian Natural Resources and Ultra Petroleum hurt, along with a big position in refiner Valero Energy. Having only a small position in integrated energy giant Chevron also detracted. Conversely, big stakes in Plains Exploration & Production, Kerr-McGee and Range Resources, strong performers in the E&P space, helped offset some of the negative performance during the period's first seven months. For the year's final five months, natural gas prices began to rebound, driven by increasing winter fuel demand and a drawdown of excess inventories. As prices regained ground, much of what didn't work during the earlier part of the year began to perform far better. The fund easily outdistanced the S&P Custom index during this five-month period, with stocks that had lagged earlier in the year - such as Quicksilver Resources and Valero Energy - registering as strong contributors. Many of the stocks that had done well in the earlier period - such as Range Resources and Oregon Steel - also contributed to the fund's relative performance in the latter part of the 12-month period. Having virtually no representation in various large index-component utilities - such as Duke Energy, Sempra Energy and Dominion Resources - detracted. Several stocks mentioned in this discussion were no longer held at period end.
1 The fund's blended index is a customized index developed by Fidelity for the limited purpose of discussing the fund's performance for the 12-month period ending February 28, 2007. From March 1, 2006, through September 30, 2006, the fund compared its performance to the Goldman Sachs Natural Resources Index, which returned 2.61% during that period. On October 1, 2006, the fund began comparing its performance to a different index, the Standard & Poor's Custom Natural Gas Index, which returned 9.37% from October 1, 2006, through February 28, 2007. For the 12-month period ending February 28, 2007, the blended index (Goldman Sachs and Standard & Poor's) returned 12.22%.
The views expressed above reflect those of the portfolio manager(s) only through the end of the period as stated on the cover of this report and do not necessarily represent the views of Fidelity or any other person in the Fidelity organization. Any such views are subject to change at any time based upon market or other conditions and Fidelity disclaims any responsibility to update such views. These views may not be relied on as investment advice and, because investment decisions for a Fidelity fund are based on numerous factors, may not be relied on as an indication of trading intent on behalf of any Fidelity fund.
Annual Report
Select Natural Gas Portfolio
Investment Changes
Top Ten Stocks as of February 28, 2007 | ||
% of fund's | % of fund's net assets | |
Quicksilver Resources, Inc. | 11.7 | 7.1 |
Range Resources Corp. | 10.8 | 8.8 |
Valero Energy Corp. | 9.7 | 7.7 |
Ultra Petroleum Corp. | 5.7 | 3.8 |
Plains Exploration & Production Co. | 4.4 | 8.3 |
EOG Resources, Inc. | 4.0 | 2.6 |
GlobalSantaFe Corp. | 4.0 | 2.6 |
Noble Energy, Inc. | 3.5 | 2.5 |
XTO Energy, Inc. | 3.4 | 2.5 |
Transocean, Inc. | 2.4 | 0.0 |
59.6 | ||
Top Industries (% of fund's net assets) | |||
As of February 28, 2007 | |||
| Oil, Gas & Consumable Fuels | 77.4% | |
| Energy Equipment & Services | 19.1% | |
| Gas Utilities | 0.9% | |
| Electrical Equipment | 0.5% | |
| Metals & Mining | 0.4% | |
| All Others* | 1.7% | |

As of August 31, 2006 | |||
| Oil, Gas & Consumable Fuels | 73.0% | |
| Energy Equipment & Services | 21.6% | |
| Metals & Mining | 1.5% | |
| Independent Power Producers & Energy Traders | 0.9% | |
| Machinery | 0.8% | |
| All Others* | 2.2% | |

* Includes short-term investments and net other assets. |
Annual Report
Select Natural Gas Portfolio
Investments February 28, 2007
Showing Percentage of Net Assets
Common Stocks - 99.1% | |||
Shares | Value | ||
ELECTRICAL EQUIPMENT - 0.5% | |||
Heavy Electrical Equipment - 0.5% | |||
Suzlon Energy Ltd. | 10,000 | $ 236,403 | |
Vestas Wind Systems AS (a) | 96,300 | 4,498,002 | |
4,734,405 | |||
ENERGY EQUIPMENT & SERVICES - 19.1% | |||
Oil & Gas Drilling - 14.0% | |||
Diamond Offshore Drilling, Inc. | 244,700 | 19,042,554 | |
ENSCO International, Inc. | 380,100 | 19,046,811 | |
GlobalSantaFe Corp. | 703,400 | 40,536,942 | |
Helmerich & Payne, Inc. | 277,600 | 7,550,720 | |
Nabors Industries Ltd. (a) | 50,000 | 1,498,000 | |
Pride International, Inc. (a) | 680,200 | 19,589,760 | |
Rowan Companies, Inc. | 378,500 | 11,593,455 | |
Transocean, Inc. (a) | 326,300 | 25,020,684 | |
143,878,926 | |||
Oil & Gas Equipment & Services - 5.1% | |||
Baker Hughes, Inc. | 17,500 | 1,139,425 | |
Cameron International Corp. (a) | 249,600 | 14,149,824 | |
Complete Production Services, Inc. | 28,100 | 539,801 | |
Grant Prideco, Inc. (a) | 63,700 | 2,765,217 | |
National Oilwell Varco, Inc. (a) | 111,928 | 7,794,666 | |
Schlumberger Ltd. (NY Shares) | 8,700 | 546,360 | |
Smith International, Inc. | 295,290 | 12,106,890 | |
W-H Energy Services, Inc. (a) | 122,100 | 5,128,200 | |
Weatherford International Ltd. (a) | 191,800 | 7,700,770 | |
51,871,153 | |||
TOTAL ENERGY EQUIPMENT & SERVICES | 195,750,079 | ||
GAS UTILITIES - 0.9% | |||
Gas Utilities - 0.9% | |||
AGL Resources, Inc. | 50,000 | 2,036,500 | |
Energen Corp. | 84,500 | 4,096,560 | |
Equitable Resources, Inc. | 72,200 | 3,080,774 | |
9,213,834 | |||
INDEPENDENT POWER PRODUCERS & ENERGY TRADERS - 0.4% | |||
Independent Power Producers & Energy Traders - 0.4% | |||
Canadian Hydro Developers, Inc. (a) | 272,800 | 1,471,821 | |
Dynegy, Inc. Class A (a) | 320,200 | 2,628,842 | |
4,100,663 | |||
INDUSTRIAL CONGLOMERATES - 0.4% | |||
Industrial Conglomerates - 0.4% | |||
McDermott International, Inc. (a) | 77,900 | 3,754,780 | |
METALS & MINING - 0.4% | |||
Diversified Metals & Mining - 0.4% | |||
Ivanhoe Mines Ltd. (a) | 50,000 | 506,605 | |
Titanium Metals Corp. | 120,600 | 4,208,940 | |
4,715,545 | |||
Shares | Value | ||
OIL, GAS & CONSUMABLE FUELS - 77.4% | |||
Coal & Consumable Fuels - 3.4% | |||
Alpha Natural Resources, Inc. (a) | 213,400 | $ 3,079,362 | |
Arch Coal, Inc. | 68,700 | 2,139,318 | |
Cameco Corp. | 51,300 | 1,897,076 | |
CONSOL Energy, Inc. | 132,600 | 4,729,842 | |
Evergreen Energy, Inc. (a)(d) | 1,165,400 | 9,148,390 | |
International Coal Group, Inc. (a)(d) | 1,485,800 | 7,592,438 | |
Peabody Energy Corp. | 157,500 | 6,363,000 | |
34,949,426 | |||
Integrated Oil & Gas - 0.8% | |||
OAO Gazprom sponsored ADR | 150,000 | 6,075,000 | |
Petroleo Brasileiro SA Petrobras sponsored ADR | 26,200 | 2,368,480 | |
8,443,480 | |||
Oil & Gas Exploration & Production - 58.2% | |||
Apache Corp. | 205,400 | 14,076,062 | |
Aurora Oil & Gas Corp. (a) | 3,847,053 | 9,463,750 | |
Cabot Oil & Gas Corp. | 310,300 | 20,963,868 | |
Canadian Natural Resources Ltd. | 152,800 | 7,672,989 | |
Chesapeake Energy Corp. (d) | 797,200 | 24,306,628 | |
Denbury Resources, Inc. (a) | 8,100 | 233,604 | |
EOG Resources, Inc. | 602,600 | 40,820,124 | |
Forest Oil Corp. (a) | 291,300 | 9,292,470 | |
GMX Resources, Inc. (a) | 27,700 | 898,865 | |
Goodrich Petroleum Corp. | 132,800 | 4,543,088 | |
Mariner Energy, Inc. (a) | 280,689 | 5,192,747 | |
Newfield Exploration Co. (a) | 498,400 | 21,540,848 | |
Noble Energy, Inc. (d) | 631,200 | 36,338,184 | |
Petrohawk Energy Corp. (a) | 349,100 | 4,178,727 | |
Plains Exploration & Production Co. (a) | 999,100 | 45,588,933 | |
Quicksilver Resources, Inc. (a)(d) | 3,104,566 | 119,743,110 | |
Range Resources Corp. | 3,467,100 | 110,704,503 | |
Southwestern Energy Co. (a) | 616,100 | 24,027,900 | |
Talisman Energy, Inc. | 296,700 | 5,116,873 | |
Ultra Petroleum Corp. (a) | 1,143,100 | 58,080,911 | |
XTO Energy, Inc. | 667,200 | 34,467,552 | |
597,251,736 | |||
Oil & Gas Refining & Marketing - 13.3% | |||
Petroplus Holdings AG | 25,390 | 1,770,790 | |
Tesoro Corp. | 242,600 | 22,110,564 | |
Valero Energy Corp. | 1,726,000 | 99,503,900 | |
Western Refining, Inc. | 434,600 | 12,564,286 | |
135,949,540 | |||
Oil & Gas Storage & Transport - 1.7% | |||
Boardwalk Pipeline Partners, LP | 146,000 | 5,358,200 | |
Common Stocks - continued | |||
Shares | Value | ||
OIL, GAS & CONSUMABLE FUELS - CONTINUED | |||
Oil & Gas Storage & Transport - continued | |||
Targa Resources Partners LP | 133,800 | $ 3,224,580 | |
Williams Partners LP | 192,400 | 8,311,680 | |
16,894,460 | |||
TOTAL OIL, GAS & CONSUMABLE FUELS | 793,488,642 | ||
TOTAL COMMON STOCKS (Cost $811,948,061) | 1,015,757,948 | ||
Money Market Funds - 6.8% | |||
Fidelity Securities Lending Cash Central Fund, 5.34% (b)(c) | 69,842,700 | 69,842,700 | |
TOTAL INVESTMENT PORTFOLIO - 105.9% (Cost $881,790,761) | 1,085,600,648 |
NET OTHER ASSETS - (5.9)% | (60,011,407) | ||
NET ASSETS - 100% | $ 1,025,589,241 | ||
Legend |
(a) Non-income producing |
(b) Affiliated fund that is available only to investment companies and other accounts managed by Fidelity Investments. The rate quoted is the annualized seven-day yield of the fund at period end. A complete unaudited listing of the fund's holdings as of its most recent quarter end is available upon request. |
(c) Investment made with cash collateral received from securities on loan. |
(d) Security or a portion of the security is on loan at period end. |
Affiliated Central Funds |
Information regarding fiscal year to date income earned by the Fund from investments in Fidelity Central Funds is as follows: |
Fund | Income earned |
Fidelity Cash Central Fund | $ 579,847 |
Fidelity Securities Lending Cash Central Fund | 556,329 |
Total | $ 1,136,176 |
Other Information |
Distribution of investments by country of issue, as a percentage of total net assets, is as follows: |
United States of America | 86.7% |
Canada | 7.3% |
Cayman Islands | 4.0% |
Others (individually less than 1%) | 2.0% |
100.0% |
See accompanying notes which are an integral part of the financial statements.
Annual Report
Select Natural Gas Portfolio
Financial Statements
Statement of Assets and Liabilities
February 28, 2007 | ||
Assets | ||
Investment in securities, at value (including securities loaned of $68,288,581) - See accompanying schedule: Unaffiliated issuers (cost $811,948,061) | $ 1,015,757,948 | |
Fidelity Central Funds (cost $69,842,700) | 69,842,700 | |
Total Investments (cost $881,790,761) | $ 1,085,600,648 | |
Receivable for investments sold | 17,295,682 | |
Receivable for fund shares sold | 3,055,987 | |
Dividends receivable | 1,375,770 | |
Distributions receivable from Fidelity Central Funds | 44,274 | |
Prepaid expenses | 5,771 | |
Other receivables | 53,775 | |
Total assets | 1,107,431,907 | |
Liabilities | ||
Payable to custodian bank | $ 3,534,743 | |
Payable for investments purchased | 2,850,600 | |
Payable for fund shares redeemed | 4,755,970 | |
Accrued management fee | 499,163 | |
Other affiliated payables | 263,838 | |
Other payables and accrued expenses | 95,652 | |
Collateral on securities loaned, at value | 69,842,700 | |
Total liabilities | 81,842,666 | |
Net Assets | $ 1,025,589,241 | |
Net Assets consist of: | ||
Paid in capital | $ 746,046,544 | |
Undistributed net investment income | 88,807 | |
Accumulated undistributed net realized gain (loss) on investments and foreign currency transactions | 75,644,003 | |
Net unrealized appreciation (depreciation) on investments | 203,809,887 | |
Net Assets, for 25,894,788 shares outstanding | $ 1,025,589,241 | |
Net Asset Value, offering price and redemption price per share ($1,025,589,241 ÷ 25,894,788 shares) | $ 39.61 | |
Statement of Operations
Year ended February 28, 2007 | ||
Investment Income | ||
Dividends | $ 6,269,658 | |
Special dividends | 3,035,499 | |
Interest | 910 | |
Income from Fidelity Central Funds (including $556,329 from security lending) | 1,136,176 | |
Total income | 10,442,243 | |
Expenses | ||
Management fee | $ 7,280,517 | |
Transfer agent fees | 3,497,688 | |
Accounting and security lending fees | 497,697 | |
Custodian fees and expenses | 61,565 | |
Independent trustees' compensation | 4,920 | |
Registration fees | 74,274 | |
Audit | 40,753 | |
Legal | 26,508 | |
Interest | 63,073 | |
Miscellaneous | 74,255 | |
Total expenses before reductions | 11,621,250 | |
Expense reductions | (72,510) | 11,548,740 |
Net investment income (loss) | (1,106,497) | |
Realized and Unrealized Gain (Loss) Net realized gain (loss) on: | ||
Investment securities: | ||
Unaffiliated issuers | 143,278,991 | |
Foreign currency transactions | (42,488) | |
Total net realized gain (loss) | 143,236,503 | |
Change in net unrealized appreciation (depreciation) on: Investment securities | (35,830,246) | |
Assets and liabilities in foreign currencies | 1,700 | |
Total change in net unrealized appreciation (depreciation) | (35,828,546) | |
Net gain (loss) | 107,407,957 | |
Net increase (decrease) in net assets resulting from operations | $ 106,301,460 | |
See accompanying notes which are an integral part of the financial statements.
Annual Report
Select Natural Gas Portfolio
Financial Statements - continued
Statement of Changes in Net Assets
Year ended | Year ended | |
Increase (Decrease) in Net Assets | ||
Operations | ||
Net investment income (loss) | $ (1,106,497) | $ (3,363,919) |
Net realized gain (loss) | 143,236,503 | 165,345,128 |
Change in net unrealized appreciation (depreciation) | (35,828,546) | 100,302,804 |
Net increase (decrease) in net assets resulting from operations | 106,301,460 | 262,284,013 |
Distributions to shareholders from net realized gain | (105,118,798) | (152,139,802) |
Share transactions | 573,033,635 | 1,819,254,857 |
Reinvestment of distributions | 100,548,446 | 145,498,281 |
Cost of shares redeemed | (1,205,228,167) | (1,468,412,444) |
Net increase (decrease) in net assets resulting from share transactions | (531,646,086) | 496,340,694 |
Redemption fees | 473,958 | 1,555,343 |
Total increase (decrease) in net assets | (529,989,466) | 608,040,248 |
Net Assets | ||
Beginning of period | 1,555,578,707 | 947,538,459 |
End of period (including undistributed net investment income of $88,807 and distributions in excess of net investment income of $79, respectively) | $ 1,025,589,241 | $ 1,555,578,707 |
Other Information Shares | ||
Sold | 14,468,811 | 48,076,717 |
Issued in reinvestment of distributions | 2,485,813 | 4,018,204 |
Redeemed | (31,092,157) | (39,599,586) |
Net increase (decrease) | (14,137,533) | 12,495,335 |
Financial Highlights
Years ended February 28, | 2007 | 2006 | 2005 | 2004 G | 2003 |
Selected Per-Share Data | |||||
Net asset value, beginning of period | $ 38.86 | $ 34.41 | $ 23.00 | $ 17.42 | $ 17.91 |
Income from Investment Operations | |||||
Net investment income (loss) C | (.03) H | (.09) | .01 | (.09) | .05 |
Net realized and unrealized gain (loss) | 4.08 | 8.58 | 11.83 | 5.65 | (.45) |
Total from investment operations | 4.05 | 8.49 | 11.84 | 5.56 | (.40) |
Distributions from net investment income | - | - | (.02) | - | (.10) |
Distributions from net realized gain | (3.31) | (4.08) | (.44) | - | - |
Total distributions | (3.31) | (4.08) | (.46) | - | (.10) |
Redemption fees added to paid in capital C | .01 | .04 | .03 | .02 | .01 |
Net asset value, end of period | $ 39.61 | $ 38.86 | $ 34.41 | $ 23.00 | $ 17.42 |
Total Return A,B | 10.43% | 26.28% | 52.01% | 32.03% | (2.17)% |
Ratios to Average Net Assets D,F | |||||
Expenses before reductions | .90% | .95% | .98% | 1.21% | 1.30% |
Expenses net of fee waivers, if any | .90% | .95% | .98% | 1.21% | 1.30% |
Expenses net of all reductions | .89% | .88% | .94% | 1.14% | 1.24% |
Net investment income (loss) | (.09)% H | (.24)% | .02% | (.46)% | .27% |
Supplemental Data | |||||
Net assets, end of period (000 omitted) | $ 1,025,589 | $ 1,555,579 | $ 947,538 | $ 224,475 | $ 163,005 |
Portfolio turnover rate E | 59% | 148% | 190% | 171% | 108% |
A Total returns would have been lower had certain expenses not been reduced during the periods shown.
B Total returns do not include the effect of the former sales charges.
C Calculated based on average shares outstanding during the period.
D Fees and expenses of the underlying Fidelity Central Funds are not included in the Fund's expense ratio. The Fund indirectly bears its proportionate share of the expenses of any underlying Fidelity Central Funds.
E Amount does not include the portfolio activity of any underlying Fidelity Central Funds.
F Expense ratios reflect operating expenses of the Fund. Expenses before reductions do not reflect amounts reimbursed by the investment adviser or reductions from brokerage service arrangements or other expense offset arrangements and do not represent the amount paid by the Fund during periods when reimbursements or reductions occur. Expenses net of fee waivers reflect expenses after reimbursement by the investment adviser but prior to reductions from brokerage service arrangements or other expense offset arrangements. Expenses net of all reductions represent the net expenses paid by the Fund.
G For the year ended February 29.
H Investment income per share reflects special dividends which amounted to $.09 per share. Excluding these special dividends, the ratio of net investment income (loss) to average net assets would have been (.32%).
See accompanying notes which are an integral part of the financial statements.
Annual Report
Select Natural Resources Portfolio
Performance
Average annual total return reflects the change in the value of an investment, assuming reinvestment of the fund's dividend income and capital gains (the profits earned upon the sale of securities that have grown in value) and assuming a constant rate of performance each year. The $10,000 table and the fund's returns do not reflect the deduction of taxes that a shareholder would pay on fund distributions or the redemption of fund shares. During periods of reimbursement by Fidelity, a fund's total returns will be greater than it would be had the reimbursement not occurred. How a fund did yesterday is no guarantee of how it will do tomorrow.
Average Annual Total Returns
Periods ended February 28, 2007 | Past 1 | Past 5 | Life of |
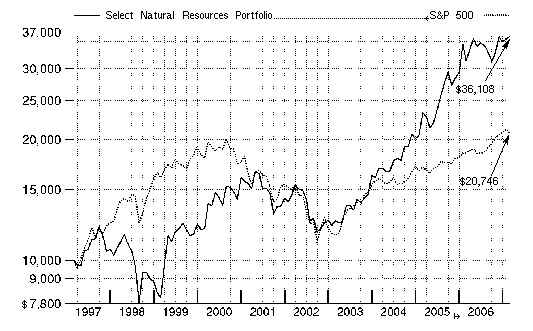
Select Natural Resources Portfolio | 15.18% | 19.99% | 13.70% |
A From March 3, 1997
$10,000 Over Life of Fund
Let's say hypothetically that $10,000 was invested in Select Natural Resources Portfolio on March 3, 1997, when the fund started. The chart shows how the value of your investment would have changed, and also shows how the S&P 500 Index performed over the same period.
Annual Report
Select Natural Resources Portfolio
Management's Discussion of Fund Performance
Comments from John Dowd, Portfolio Manager of Fidelity® Select Natural Resources Portfolio
A rosy year for stocks wilted just prior to the end of the 12-month period ending February 28, 2007. On the day prior to the period's close, the Dow Jones Industrial AverageSM plunged 416 points and the Standard & Poor's 500SM Index lost roughly 3.5% of its value, plummeting nearly 50 points and marking the benchmark's worst single-day performance since the day the market reopened after the 9/11 terrorist attacks. Though investors were obviously rattled by the development, it was only the 22nd-biggest decline for the S&P 500® in 20 years, and it could not overshadow how well stocks performed for the 12 months overall. For much of the past year, investors grew confident that the economy would not fall into a recession, and they bid up most broad-based stock indexes for six consecutive months from August through January. Overall for the year ending February 28, 2007, the S&P 500 was up 11.97%, the Dow advanced 14.24%, the small-cap Russell 2000® Index gained 9.87% and the NASDAQ Composite® Index rose 6.66%.
For the 12 months that ended February 28, 2007, the fund returned 15.18%, outperforming both the Goldman Sachs® Natural Resources Index, which returned 11.29%, and the S&P 500. A number of non-index investments were key to the fund's strong showing, including several positions in fertilizer manufacturers - Mosaic, Terra Nitrogen and CF Industries - that benefited from higher corn production and, consequently, higher fertilizer demand to treat additional corn acreage. Steel producers also performed well, with Oregon Steel Mills moving up in response to increased demand for pipe used in energy infrastructure as well as favorable reaction to a buyout announcement. Elsewhere, alternative energy plays contributed to performance relative to the index. For instance, titanium manufacturers Titanium Metals, Allegheny Technologies and RTI International Metals supply the aircraft industry with a lighter, stronger alternative to steel, which reduces aircraft weight and improves fuel efficiency. Danish wind turbine manufacturer Vestas Wind Systems, an out-of-index position, benefited from investors' increased interest in alternative energy as well. In other areas, underweighting or not owning commodity-price-sensitive integrated oil companies BP and Petro-Canada helped, while several undervalued investments in the exploration and production (E&P) space, such as Range Resources and Cabot Oil & Gas, also contributed. On the other hand, the fund suffered some disappointments, including its underexposure to some index-component metals and mining stocks that performed very well, including copper producers Phelps Dodge and Southern Copper, as well as Canadian nickel miner Inco. Overweighting gold producer Newmont Mining, which struggled, also hurt. Among the large, more-defensive integrated oil companies, underweighting or not owning Exxon Mobil, Chevron and Marathon Oil detracted. Energy services giant Halliburton hurt performance on weakness in several business lines, while driller Pride International stumbled when capacity growth in its key Gulf of Mexico market weakened. Several stocks mentioned in this discussion were no longer held at period end.
The views expressed above reflect those of the portfolio manager(s) only through the end of the period as stated on the cover of this report and do not necessarily represent the views of Fidelity or any other person in the Fidelity organization. Any such views are subject to change at any time based upon market or other conditions and Fidelity disclaims any responsibility to update such views. These views may not be relied on as investment advice and, because investment decisions for a Fidelity fund are based on numerous factors, may not be relied on as an indication of trading intent on behalf of any Fidelity fund.
Annual Report
Select Natural Resources Portfolio
Investment Changes
Top Ten Stocks as of February 28, 2007 | ||
% of fund's | % of fund's net assets | |
ConocoPhillips | 6.1 | 3.9 |
Valero Energy Corp. | 5.8 | 3.6 |
GlobalSantaFe Corp. | 4.7 | 4.0 |
Schlumberger Ltd. (NY Shares) | 4.2 | 4.5 |
National Oilwell Varco, Inc. | 3.3 | 3.5 |
Alcoa, Inc. | 3.2 | 3.3 |
Range Resources Corp. | 3.1 | 2.3 |
Cabot Oil & Gas Corp. | 2.7 | 0.8 |
Chesapeake Energy Corp. | 2.7 | 3.0 |
Smith International, Inc. | 2.7 | 3.3 |
38.5 | ||
Top Industries (% of fund's net assets) | |||
As of February 28, 2007 | |||
| Oil, Gas & Consumable Fuels | 48.1% | |
| Energy Equipment & Services | 27.6% | |
| Metals & Mining | 12.0% | |
| Chemicals | 2.6% | |
| Paper & Forest Products | 2.1% | |
| All Others* | 7.6% | |
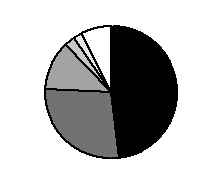
As of August 31, 2006 | |||
| Oil, Gas & Consumable Fuels | 41.5% | |
| Energy Equipment & Services | 30.6% | |
| Metals & Mining | 14.9% | |
| Machinery | 2.4% | |
| Chemicals | 1.9% | |
| All Others* | 8.7% | |
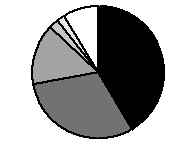
* Includes short-term investments and net other assets. |
Annual Report
Select Natural Resources Portfolio
Investments February 28, 2007
Showing Percentage of Net Assets
Common Stocks - 99.8% | |||
Shares | Value | ||
CHEMICALS - 2.6% | |||
Commodity Chemicals - 0.4% | |||
Celanese Corp. Class A | 35,600 | $ 1,017,448 | |
Formosa Chemicals & Fibre Corp. | 1,255,830 | 2,424,060 | |
Georgia Gulf Corp. | 20,650 | 396,067 | |
Tokai Carbon Co. Ltd. | 22,000 | 180,288 | |
4,017,863 | |||
Diversified Chemicals - 0.3% | |||
Ashland, Inc. | 44,400 | 2,911,752 | |
Fertilizers & Agricultural Chemicals - 1.7% | |||
Agrium, Inc. | 61,600 | 2,364,349 | |
Terra Nitrogen Co. LP | 81,101 | 3,645,490 | |
The Mosaic Co. | 385,600 | 9,809,664 | |
15,819,503 | |||
Specialty Chemicals - 0.2% | |||
Tokuyama Corp. | 120,000 | 2,070,186 | |
TOTAL CHEMICALS | 24,819,304 | ||
COMMERCIAL SERVICES & SUPPLIES - 0.0% | |||
Environmental & Facility Services - 0.0% | |||
Clean Harbors, Inc. (a) | 7,200 | 363,672 | |
CONSTRUCTION & ENGINEERING - 1.6% | |||
Construction & Engineering - 1.6% | |||
Chicago Bridge & Iron Co. NV (NY Shares) | 330,800 | 9,834,684 | |
Fluor Corp. | 29,600 | 2,500,312 | |
Infrasource Services, Inc. (a) | 58,700 | 1,439,324 | |
Jacobs Engineering Group, Inc. (a) | 12,600 | 1,138,284 | |
14,912,604 | |||
CONTAINERS & PACKAGING - 0.7% | |||
Metal & Glass Containers - 0.0% | |||
Owens-Illinois, Inc. | 8,900 | 211,464 | |
Paper Packaging - 0.7% | |||
Smurfit-Stone Container Corp. | 252,300 | 3,113,382 | |
Temple-Inland, Inc. | 59,900 | 3,582,020 | |
6,695,402 | |||
TOTAL CONTAINERS & PACKAGING | 6,906,866 | ||
ELECTRICAL EQUIPMENT - 1.9% | |||
Electrical Components & Equipment - 0.5% | |||
Q-Cells AG (d) | 48,300 | 2,880,136 | |
Suntech Power Holdings Co. Ltd. sponsored ADR (a) | 48,100 | 1,743,625 | |
4,623,761 | |||
Heavy Electrical Equipment - 1.4% | |||
Areva (investment certificates)(non-vtg.) | 100 | 89,591 | |
Shares | Value | ||
Suzlon Energy Ltd. | 60,000 | $ 1,418,417 | |
Vestas Wind Systems AS (a) | 263,200 | 12,293,605 | |
13,801,613 | |||
TOTAL ELECTRICAL EQUIPMENT | 18,425,374 | ||
ELECTRONIC EQUIPMENT & INSTRUMENTS - 0.2% | |||
Electronic Equipment & Instruments - 0.2% | |||
Itron, Inc. (a)(d) | 34,700 | 2,242,314 | |
ENERGY EQUIPMENT & SERVICES - 27.6% | |||
Oil & Gas Drilling - 11.2% | |||
Diamond Offshore Drilling, Inc. | 144,700 | 11,260,554 | |
GlobalSantaFe Corp. | 783,200 | 45,135,816 | |
Nabors Industries Ltd. (a) | 2,600 | 77,896 | |
Noble Corp. | 239,200 | 16,796,624 | |
Patterson-UTI Energy, Inc. | 50,000 | 1,114,500 | |
Pride International, Inc. (a) | 500,900 | 14,425,920 | |
Rowan Companies, Inc. | 1,000 | 30,630 | |
TODCO Class A (a) | 1,400 | 47,712 | |
Transocean, Inc. (a) | 243,300 | 18,656,244 | |
107,545,896 | |||
Oil & Gas Equipment & Services - 16.4% | |||
Baker Hughes, Inc. | 178,290 | 11,608,462 | |
Cameron International Corp. (a) | 107,600 | 6,099,844 | |
FMC Technologies, Inc. (a) | 2,300 | 151,294 | |
Global Industries Ltd. (a) | 4,900 | 72,324 | |
Grant Prideco, Inc. (a) | 13,700 | 594,717 | |
Halliburton Co. | 724,500 | 22,372,560 | |
Hanover Compressor Co. (a) | 126,000 | 2,765,700 | |
Hydril Co. (a) | 1,200 | 114,180 | |
Key Energy Services, Inc. (a) | 183,500 | 3,027,750 | |
National Oilwell Varco, Inc. (a) | 445,611 | 31,032,350 | |
Oceaneering International, Inc. (a) | 14,300 | 563,992 | |
Oil States International, Inc. (a) | 4,400 | 129,140 | |
Saipem Spa | 4,500 | 121,841 | |
Schlumberger Ltd. (NY Shares) | 636,152 | 39,950,346 | |
Smith International, Inc. | 625,500 | 25,645,500 | |
W-H Energy Services, Inc. (a) | 52,800 | 2,217,600 | |
Weatherford International Ltd. (a) | 259,390 | 10,414,509 | |
156,882,109 | |||
TOTAL ENERGY EQUIPMENT & SERVICES | 264,428,005 | ||
FOOD PRODUCTS - 0.6% | |||
Agricultural Products - 0.6% | |||
Archer-Daniels-Midland Co. | 3,100 | 106,578 | |
Corn Products International, Inc. | 158,611 | 5,070,794 | |
Global Bio-Chem Technology Group Co. Ltd. | 78,700 | 21,657 | |
5,199,029 | |||
Common Stocks - continued | |||
Shares | Value | ||
GAS UTILITIES - 0.1% | |||
Gas Utilities - 0.1% | |||
Questar Corp. | 14,700 | $ 1,236,858 | |
INDEPENDENT POWER PRODUCERS & ENERGY TRADERS - 1.4% | |||
Independent Power Producers & Energy Traders - 1.4% | |||
Dynegy, Inc. Class A (a) | 284 | 2,332 | |
Mirant Corp. (a) | 222,800 | 8,301,528 | |
NRG Energy, Inc. | 16,100 | 1,066,464 | |
TXU Corp. | 57,100 | 3,777,165 | |
13,147,489 | |||
INDUSTRIAL CONGLOMERATES - 0.2% | |||
Industrial Conglomerates - 0.2% | |||
McDermott International, Inc. (a) | 40,700 | 1,961,740 | |
MACHINERY - 0.5% | |||
Construction & Farm Machinery & Heavy Trucks - 0.5% | |||
Joy Global, Inc. | 90,550 | 4,014,987 | |
Trinity Industries, Inc. | 28,200 | 1,180,170 | |
5,195,157 | |||
METALS & MINING - 12.0% | |||
Aluminum - 3.2% | |||
Alcan, Inc. | 900 | 46,803 | |
Alcoa, Inc. | 908,700 | 30,359,667 | |
Century Aluminum Co. (a) | 1,900 | 86,507 | |
30,492,977 | |||
Diversified Metals & Mining - 4.1% | |||
Freeport-McMoRan Copper & Gold, Inc. Class B | 1,363 | 78,250 | |
Phelps Dodge Corp. | 1,200 | 149,892 | |
RTI International Metals, Inc. (a) | 116,638 | 10,063,527 | |
Teck Cominco Ltd. Class B (sub. vtg.) | 92,600 | 6,530,416 | |
Titanium Metals Corp. | 645,676 | 22,534,092 | |
39,356,177 | |||
Gold - 4.1% | |||
Eldorado Gold Corp. (a) | 535,300 | 3,194,728 | |
Kinross Gold Corp. (a) | 97,967 | 1,377,092 | |
Meridian Gold, Inc. (a) | 697,500 | 19,131,974 | |
Newmont Mining Corp. | 342,200 | 15,422,954 | |
39,126,748 | |||
Precious Metals & Minerals - 0.6% | |||
Aquarius Platinum Ltd. (United Kingdom) | 140,000 | 3,883,226 | |
Shore Gold, Inc. (a) | 221,300 | 1,447,518 | |
5,330,744 | |||
Steel - 0.0% | |||
Allegheny Technologies, Inc. | 900 | 92,205 | |
Shares | Value | ||
Arcelor Mittal | 3,700 | $ 188,182 | |
Hitachi Metals Ltd. | 10,000 | 117,613 | |
398,000 | |||
TOTAL METALS & MINING | 114,704,646 | ||
OIL, GAS & CONSUMABLE FUELS - 48.1% | |||
Coal & Consumable Fuels - 4.2% | |||
Arch Coal, Inc. | 129,200 | 4,023,288 | |
Cameco Corp. | 235,900 | 8,723,590 | |
CONSOL Energy, Inc. | 224,400 | 8,004,348 | |
Foundation Coal Holdings, Inc. (d) | 178,800 | 5,886,096 | |
Peabody Energy Corp. | 326,800 | 13,202,720 | |
USEC, Inc. (a) | 1,600 | 22,688 | |
39,862,730 | |||
Integrated Oil & Gas - 14.2% | |||
BP PLC sponsored ADR | 74,564 | 4,596,125 | |
Chevron Corp. | 57,132 | 3,919,827 | |
ConocoPhillips | 896,430 | 58,644,447 | |
ENI Spa sponsored ADR (d) | 126,100 | 7,721,103 | |
Exxon Mobil Corp. | 36,715 | 2,631,731 | |
Hess Corp. | 184,600 | 9,793,030 | |
Husky Energy, Inc. | 43,800 | 2,842,478 | |
MOL Hungarian Oil and Gas PLC Series A (For. Reg.) | 600 | 64,545 | |
OAO Gazprom sponsored ADR | 150,257 | 6,085,409 | |
Occidental Petroleum Corp. | 207,300 | 9,573,114 | |
OMV AG | 61,435 | 3,430,047 | |
Petroleo Brasileiro SA Petrobras sponsored ADR | 97,600 | 8,823,040 | |
Suncor Energy, Inc. | 256,700 | 18,204,179 | |
136,329,075 | |||
Oil & Gas Exploration & Production - 21.5% | |||
Anadarko Petroleum Corp. | 1,800 | 72,414 | |
Apache Corp. | 800 | 54,824 | |
Aurora Oil & Gas Corp. (a) | 35,400 | 87,084 | |
Cabot Oil & Gas Corp. | 388,800 | 26,267,328 | |
Canadian Natural Resources Ltd. | 227,300 | 11,414,073 | |
Chesapeake Energy Corp. (d) | 842,500 | 25,687,825 | |
Comstock Resources, Inc. (a) | 1,300 | 34,905 | |
Denbury Resources, Inc. (a) | 2,300 | 66,332 | |
Devon Energy Corp. | 800 | 52,568 | |
EnCana Corp. | 123,784 | 6,016,947 | |
EOG Resources, Inc. | 267,200 | 18,100,128 | |
EXCO Resources, Inc. | 3,600 | 62,712 | |
Forest Oil Corp. (a) | 39,300 | 1,253,670 | |
Goodrich Petroleum Corp. | 4,300 | 147,103 | |
Houston Exploration Co. (a) | 7,100 | 372,182 | |
Hugoton Royalty Trust | 19,957 | 485,953 | |
Mariner Energy, Inc. (a) | 49,324 | 912,494 | |
Newfield Exploration Co. (a) | 56,800 | 2,454,896 | |
Nexen, Inc. | 103,900 | 5,956,560 | |
Noble Energy, Inc. | 117,800 | 6,781,746 | |
Common Stocks - continued | |||
Shares | Value | ||
OIL, GAS & CONSUMABLE FUELS - CONTINUED | |||
Oil & Gas Exploration & Production - continued | |||
Penn West Energy Trust | 62,800 | $ 1,886,336 | |
Plains Exploration & Production Co. (a) | 139,400 | 6,360,822 | |
Pogo Producing Co. | 1,300 | 62,127 | |
Quicksilver Resources, Inc. (a) | 191,950 | 7,403,512 | |
Range Resources Corp. | 934,673 | 29,844,109 | |
Southwestern Energy Co. (a) | 1,800 | 70,200 | |
Talisman Energy, Inc. | 690,300 | 11,904,879 | |
Ultra Petroleum Corp. (a) | 391,300 | 19,881,953 | |
W&T Offshore, Inc. | 41,700 | 1,251,834 | |
XTO Energy, Inc. | 410,900 | 21,227,094 | |
206,174,610 | |||
Oil & Gas Refining & Marketing - 5.9% | |||
ERG Spa | 3,400 | 84,314 | |
Frontier Oil Corp. | 6,000 | 177,300 | |
Neste Oil Oyj | 2,600 | 83,540 | |
Petroplus Holdings AG | 13,390 | 933,867 | |
Valero Energy Corp. | 956,088 | 55,118,473 | |
Western Refining, Inc. | 5,800 | 167,678 | |
56,565,172 | |||
Oil & Gas Storage & Transport - 2.3% | |||
OMI Corp. | 4,400 | 97,988 | |
TransCanada Corp. | 90,600 | 2,889,470 | |
Williams Companies, Inc. | 693,400 | 18,700,998 | |
21,688,456 | |||
TOTAL OIL, GAS & CONSUMABLE FUELS | 460,620,043 | ||
PAPER & FOREST PRODUCTS - 2.1% | |||
Forest Products - 1.8% | |||
Sino-Forest Corp. (a) | 823,900 | 6,734,628 | |
Weyerhaeuser Co. (d) | 129,200 | 11,094,404 | |
17,829,032 | |||
Paper Products - 0.3% | |||
Aracruz Celulose SA (PN-B) sponsored ADR (non-vtg.) | 48,700 | 2,613,242 | |
TOTAL PAPER & FOREST PRODUCTS | 20,442,274 | ||
Shares | Value | ||
REAL ESTATE INVESTMENT TRUSTS - 0.2% | |||
Specialized REITs - 0.2% | |||
Plum Creek Timber Co., Inc. | 40,100 | $ 1,590,366 | |
SEMICONDUCTORS & SEMICONDUCTOR EQUIPMENT - 0.0% | |||
Semiconductors - 0.0% | |||
Renewable Energy Corp. AS | 2,400 | 49,497 | |
TOTAL COMMON STOCKS (Cost $777,249,147) | 956,245,238 | ||
Money Market Funds - 4.7% | |||
Fidelity Securities Lending Cash Central Fund, 5.34% (b)(c) | 45,354,998 | 45,354,998 | |
TOTAL INVESTMENT PORTFOLIO - 104.5% (Cost $822,604,145) | 1,001,600,236 |
NET OTHER ASSETS - (4.5)% | (43,157,551) | ||
NET ASSETS - 100% | $ 958,442,685 | ||
Legend |
(a) Non-income producing |
(b) Affiliated fund that is available only to investment companies and other accounts managed by Fidelity Investments. The rate quoted is the annualized seven-day yield of the fund at period end. A complete unaudited listing of the fund's holdings as of its most recent quarter end is available upon request. |
(c) Investment made with cash collateral received from securities on loan. |
(d) Security or a portion of the security is on loan at period end. |
Affiliated Central Funds |
Information regarding fiscal year to date income earned by the Fund from investments in Fidelity Central Funds is as follows: |
Fund | Income earned |
Fidelity Cash Central Fund | $ 684,934 |
Fidelity Securities Lending Cash Central Fund | 150,840 |
Total | $ 835,774 |
Other Information |
Distribution of investments by country of issue, as a percentage of total net assets, is as follows: |
United States of America | 67.9% |
Canada | 13.8% |
Cayman Islands | 6.7% |
Netherlands Antilles | 4.2% |
Denmark | 1.3% |
Brazil | 1.2% |
Netherlands | 1.0% |
Others (individually less than 1%) | 3.9% |
100.0% |
See accompanying notes which are an integral part of the financial statements.
Annual Report
Select Natural Resources Portfolio
Financial Statements
Statement of Assets and Liabilities
February 28, 2007 | ||
Assets | ||
Investment in securities, at value (including securities loaned of $44,550,283) - See accompanying schedule: Unaffiliated issuers (cost $777,249,147) | $ 956,245,238 | |
Fidelity Central Funds (cost $45,354,998) | 45,354,998 | |
Total Investments (cost $822,604,145) | $ 1,001,600,236 | |
Receivable for investments sold | 2,470,172 | |
Receivable for fund shares sold | 5,841,270 | |
Dividends receivable | 1,526,819 | |
Distributions receivable from Fidelity Central Funds | 31,001 | |
Prepaid expenses | 4,992 | |
Other receivables | 11,500 | |
Total assets | 1,011,485,990 | |
Liabilities | ||
Payable to custodian bank | $ 1,571,335 | |
Payable for investments purchased | 1,166,637 | |
Payable for fund shares redeemed | 4,157,843 | |
Accrued management fee | 456,365 | |
Other affiliated payables | 248,284 | |
Other payables and accrued expenses | 87,843 | |
Collateral on securities loaned, at value | 45,354,998 | |
Total liabilities | 53,043,305 | |
Net Assets | $ 958,442,685 | |
Net Assets consist of: | ||
Paid in capital | $ 748,588,450 | |
Undistributed net investment income | 907,896 | |
Accumulated undistributed net realized gain (loss) on investments and foreign currency transactions | 29,950,461 | |
Net unrealized appreciation (depreciation) on investments and assets and liabilities in foreign currencies | 178,995,878 | |
Net Assets, for 33,335,756 shares outstanding | $ 958,442,685 | |
Net Asset Value, offering price and redemption price per share ($958,442,685 ÷ 33,335,756 shares) | $ 28.75 | |
Statement of Operations
Year ended February 28, 2007 | ||
Investment Income | ||
Dividends | $ 12,458,072 | |
Interest | 10,528 | |
Income from Fidelity Central Funds (including $150,840 from security lending) | 835,774 | |
Total income | 13,304,374 | |
Expenses | ||
Management fee | $ 6,120,653 | |
Transfer agent fees | 3,073,463 | |
Accounting and security lending fees | 416,923 | |
Custodian fees and expenses | 102,870 | |
Independent trustees' compensation | 3,861 | |
Registration fees | 166,694 | |
Audit | 39,365 | |
Legal | 18,277 | |
Interest | 80,574 | |
Miscellaneous | 56,975 | |
Total expenses before reductions | 10,079,655 | |
Expense reductions | (102,495) | 9,977,160 |
Net investment income (loss) | 3,327,214 | |
Realized and Unrealized Gain (Loss) Net realized gain (loss) on: | ||
Investment securities: | ||
Unaffiliated issuers | 45,338,102 | |
Foreign currency transactions | (11,891) | |
Total net realized gain (loss) | 45,326,211 | |
Change in net unrealized appreciation (depreciation) on: Investment securities | 27,993,797 | |
Assets and liabilities in foreign currencies | (5,290) | |
Total change in net unrealized appreciation (depreciation) | 27,988,507 | |
Net gain (loss) | 73,314,718 | |
Net increase (decrease) in net assets resulting from operations | $ 76,641,932 | |
See accompanying notes which are an integral part of the financial statements.
Annual Report
Select Natural Resources Portfolio
Financial Statements - continued
Statement of Changes in Net Assets
Year ended | Year ended | |
Increase (Decrease) in Net Assets | ||
Operations | ||
Net investment income (loss) | $ 3,327,214 | $ 1,106,763 |
Net realized gain (loss) | 45,326,211 | 43,520,153 |
Change in net unrealized appreciation (depreciation) | 27,988,507 | 95,731,911 |
Net increase (decrease) in net assets resulting from operations | 76,641,932 | 140,358,827 |
Distributions to shareholders from net investment income | (2,640,805) | (980,210) |
Distributions to shareholders from net realized gain | (34,829,928) | (22,978,849) |
Total distributions | (37,470,733) | (23,959,059) |
Share transactions | 1,116,394,207 | 885,245,672 |
Reinvestment of distributions | 36,219,564 | 23,245,108 |
Cost of shares redeemed | (1,114,690,019) | (453,189,533) |
Net increase (decrease) in net assets resulting from share transactions | 37,923,752 | 455,301,247 |
Redemption fees | 508,195 | 443,375 |
Total increase (decrease) in net assets | 77,603,146 | 572,144,390 |
Net Assets | ||
Beginning of period | 880,839,539 | 308,695,149 |
End of period (including undistributed net investment income of $907,896 and undistributed net investment income of $367,985, respectively) | $ 958,442,685 | $ 880,839,539 |
Other Information Shares | ||
Sold | 40,071,811 | 37,984,838 |
Issued in reinvestment of distributions | 1,283,333 | 995,604 |
Redeemed | (42,071,305) | (20,310,503) |
Net increase (decrease) | (716,161) | 18,669,939 |
Financial Highlights
Years ended February 28, | 2007 | 2006 | 2005 | 2004 G | 2003 |
Selected Per-Share Data | |||||
Net asset value, beginning of period | $ 25.87 | $ 20.07 | $ 14.90 | $ 11.04 | $ 12.78 |
Income from Investment Operations | |||||
Net investment income (loss) C | .08 | .05 | .09 | .03 | - H |
Net realized and unrealized gain (loss) | 3.81 | 6.72 | 5.42 | 3.82 | (1.73) |
Total from investment operations | 3.89 | 6.77 | 5.51 | 3.85 | (1.73) |
Distributions from net investment income | (.07) | (.04) | (.07) | - | (.02) |
Distributions from net realized gain | (.95) | (.95) | (.28) | - | - |
Total distributions | (1.02) | (.99) | (.35) | - | (.02) |
Redemption fees added to paid in capital C | .01 | .02 | .01 | .01 | .01 |
Net asset value, end of period | $ 28.75 | $ 25.87 | $ 20.07 | $ 14.90 | $ 11.04 |
Total Return A,B | 15.18% | 34.50% | 37.51% | 34.96% | (13.48)% |
Ratios to Average Net Assets D,F | |||||
Expenses before reductions | .93% | .99% | 1.04% | 1.59% | 1.75% |
Expenses net of fee waivers, if any | .93% | .99% | 1.04% | 1.59% | 1.75% |
Expenses net of all reductions | .92% | .93% | 1.00% | 1.59% | 1.72% |
Net investment income (loss) | .31% | .21% | .55% | .24% | .01% |
Supplemental Data | |||||
Net assets, end of period (000 omitted) | $ 958,443 | $ 880,840 | $ 308,695 | $ 76,778 | $ 27,198 |
Portfolio turnover rate E | 116% | 119% | 101% | 32% | 70% |
A Total returns would have been lower had certain expenses not been reduced during the periods shown.
B Total returns do not include the effect of the former sales charges.
C Calculated based on average shares outstanding during the period.
D Fees and expenses of the underlying Fidelity Central Funds are not included in the Fund's expense ratio. The Fund indirectly bears its proportionate share of the expenses of any underlying Fidelity Central Funds.
E Amount does not include the portfolio activity of any underlying Fidelity Central Funds.
F Expense ratios reflect operating expenses of the Fund. Expenses before reductions do not reflect amounts reimbursed by the investment adviser or reductions from brokerage service arrangements or other expense offset arrangements and do not represent the amount paid by the Fund during periods when reimbursements or reductions occur. Expenses net of fee waivers reflect expenses after reimbursement by the investment adviser but prior to reductions from brokerage service arrangements or other expense offset arrangements. Expenses net of all reductions represent the net expenses paid by the Fund.
G For the year ended February 29.
H Amount represents less than $.01 per share.
See accompanying notes which are an integral part of the financial statements.
Annual Report
Notes to Financial Statements
For the period ended February 28, 2007
1. Organization.
Energy Portfolio, Energy Service Portfolio, Natural Gas Portfolio, and Natural Resources Portfolio, (the Funds) are non-diversified funds of Fidelity Select Portfolios (the trust). The trust is registered under the Investment Company Act of 1940, as amended (the 1940 Act), as an open-end management investment company organized as a Massachusetts business trust. The Funds invest primarily in securities of companies whose principal business activities fall within specific industries. Each Fund is authorized to issue an unlimited number of shares. The Natural Resources Portfolio may also invest in certain precious metals. The financial statements have been prepared in conformity with accounting principles generally accepted in the United States of America, which require management to make certain estimates and assumptions at the date of the financial statements.
2. Investments in Fidelity Central Funds.
The Funds may invest in Fidelity Central Funds which are open-end investment companies available only to other investment companies and accounts managed by Fidelity Management & Research Company (FMR) and its affiliates. The Funds' Schedule of Investments lists each of the Fidelity Central Funds as an investment of each Fund but does not include the underlying holdings of each Fidelity Central Fund. As an Investing Fund, the Funds indirectly bear their proportionate share of the expenses of the underlying Fidelity Central Funds. A complete unaudited list of holdings for each Fidelity Central Fund is available upon request. In addition, the financial statements of the Fidelity Central Funds, which are not covered by the Funds' Report of Independent Registered Public Accounting Firm, are available on the EDGAR Database on the SEC's web site, www.sec.gov, or upon request.
The Money Market Central Funds seek preservation of capital and current income and are managed by Fidelity Investments Money Management, Inc. (FIMM) an affiliate of FMR.
3. Significant Accounting Policies.
The following summarizes the significant accounting policies of the Funds:
Security Valuation. Investments are valued and net asset value (NAV) per share is calculated (NAV calculation) as of the close of business of the New York Stock Exchange (NYSE), normally 4:00 p.m. Eastern time. During the period each Fund also calculated a NAV each hour on the hour (commencing at 10:00 a.m. Eastern time until one hour prior to the close of business on the NYSE). Effective October 1, 2006 each Fund eliminated hourly NAV calculation.
Wherever possible, each Fund uses independent pricing services approved by the Board of Trustees to value their investments. Equity securities, including restricted securities, for which market quotations are readily available, are valued at the last reported sale price or official closing price as reported by an independent pricing service on the primary market or exchange on which they are traded. In the event there were no sales during the day or closing prices are not available, securities are valued at the last quoted bid price. Investments in open-end mutual funds, including the Fidelity Central Funds, are valued at their closing net asset value each business day. Short-term securities with remaining maturities of sixty days or less for which quotations are not readily available are valued at amortized cost, which approximates value.
When current market prices or quotations are not readily available or do not accurately reflect fair value, valuations may be determined in accordance with procedures adopted by the Board of Trustees. For example, when developments occur between the close of a market and the close of the NYSE that may materially affect the value of some or all of the securities, or when trading in a security is halted, those securities may be fair valued. Factors used in the determination of fair value may include monitoring news to identify significant market or security specific events such as changes in the value of U.S. securities markets, reviewing developments in foreign markets and evaluating the performance of ADRs, futures contracts and exchange-traded funds. Because each Fund's utilization of fair value pricing depends on market activity, the frequency with which fair value pricing is used cannot be predicted and may be utilized to a significant extent. The value of securities used for NAV calculation under fair value pricing may differ from published prices for the same securities.
Foreign Currency. Funds may use foreign currency contracts to facilitate transactions in foreign-denominated securities. Losses from these transactions may arise from changes in the value of the foreign currency or if the counterparties do not perform under the contracts' terms.
Foreign-denominated assets, including investment securities, and liabilities are translated into U.S. dollars at the exchange rate at period end. Purchases and sales of investment securities, income and dividends received and expenses denominated in foreign currencies are translated into U.S. dollars at the exchange rate in effect on the transaction date.
The effects of exchange rate fluctuations on investments are included with the net realized and unrealized gain (loss) on investment securities. Other foreign currency transactions resulting in realized and unrealized gain (loss) are disclosed separately.
Annual Report
Notes to Financial Statements - continued
3. Significant Accounting Policies - continued
Investment Transactions and Income. For financial reporting purposes, the Funds' investment holdings and NAV include trades executed through the end of the last business day of the period. The NAV for processing shareholder transactions includes trades executed through the end of the prior business day. Gains and losses on securities sold are determined on the basis of identified cost and may include proceeds received from litigation. Dividend income is recorded on the ex-dividend date, except for certain dividends from foreign securities where the ex-dividend date may have passed, which are recorded as soon as the Fund is informed of the ex-dividend date. Non-cash dividends included in dividend income, if any, are recorded at the fair market value of the securities received. Distributions received on securities that represent a return of capital or capital gain are recorded as a reduction of cost of investments and/or as a realized gain. The Funds estimate the components of distributions received that may be considered return of capital distributions or capital gain distributions. Large, non-recurring dividends recognized by the Fund are presented separately on the Statement of Operations as "Special Dividends" and the impact of these dividends is presented in the Financial Highlights. Interest income and distributions from the Fidelity Central Funds are accrued as earned, with any distributions receivable as of period end included in Distributions receivable from Fidelity Central Funds on the Statement of Assets and Liabilities. Interest income includes coupon interest and amortization of premium and accretion of discount on debt securities. Investment income is recorded net of foreign taxes withheld where recovery of such taxes is uncertain.
Expenses. Most expenses of each trust can be directly attributed to a fund. Expenses which cannot be directly attributed are apportioned among each Fund in the trust. Expense estimates are accrued in the period to which they relate and adjustments are made when actual amounts are known.
Income Tax Information and Distributions to Shareholders. Each year, each Fund intends to qualify as a regulated investment company by distributing all of its taxable income and realized gains under Subchapter M of the Internal Revenue Code. As a result, no provision for income taxes is required in the accompanying financial statements. Foreign taxes are provided for based on each Fund's understanding of the tax rules and rates that exist in the foreign markets in which it invests.
Distributions are recorded on the ex-dividend date. Income and capital gain distributions are determined in accordance with income tax regulations, which may differ from generally accepted accounting principles. In addition, certain Funds will claim a portion of the payment made to redeeming shareholders as a distribution for income tax purposes.
Capital accounts within the financial statements are adjusted for permanent book-tax differences. These adjustments have no impact on net assets or the results of operations. Temporary book-tax differences will reverse in a subsequent period.
Book-tax differences are primarily due to short-term capital gains, foreign currency transactions, passive foreign investment companies (PFIC), partnerships, deferred trustees compensation, net operating losses, capital loss carryforwards and losses deferred due to wash sales.
The tax-basis components of distributable earnings and the federal tax cost as of period end were as follows for each Fund:
Cost for | Unrealized | Unrealized | Net Unrealized | |
Energy Portfolio | $ 1,699,304,467 | $ 465,455,373 | $ (23,870,639) | $ 441,584,734 |
Energy Service Portfolio | 918,355,835 | 383,824,522 | (8,365,049) | 375,459,473 |
Natural Gas Portfolio | 885,900,160 | 222,980,345 | (23,279,857) | 199,700,488 |
Natural Resources Portfolio | 824,295,488 | 192,881,852 | (15,577,104) | 177,304,748 |
Undistributed | Undistributed Long-term Capital Gain | |
Energy Portfolio | $ 1,923,334 | $ 33,788,457 |
Energy Service Portfolio | - | 34,784,878 |
Natural Gas Portfolio | - | 44,793,880 |
Natural Resources Portfolio | 465,264 | 21,732,833 |
The tax character of distributions paid was as follows:
February 28, 2007 | |||
Ordinary Income | Long-term | Total | |
Energy Portfolio | $ 78,563,119 | $ 152,938,430 | $ 231,501,549 |
Energy Service Portfolio | 2,760,766 | 89,450,223 | 92,210,989 |
Natural Gas Portfolio | 25,399,488 | 79,719,310 | 105,118,798 |
Natural Resources Portfolio | 13,833,491 | 23,637,242 | 37,470,733 |
February 28, 2006 | |||
Ordinary Income | Long-term | Total | |
Energy Portfolio | $ 43,006,359 | $ 68,709,820 | $ 111,716,179 |
Natural Gas Portfolio | 57,454,659 | 94,685,143 | 152,139,802 |
Natural Resources Portfolio | 10,307,159 | 13,651,900 | 23,959,059 |
Annual Report
3. Significant Accounting Policies - continued
Trading (Redemption) Fees. Shares in the Funds held less than 30 days are subject to a redemption fee equal to .75% of the net asset value of shares redeemed. All redemption fees, including any estimated redemption fees paid by FMR, are retained by the Funds and accounted for as an addition to paid in capital. Shareholders were also subject to an additional $7.50 fee for shares exchanged into another Fidelity fund (see Note 6).
New Accounting Pronouncements. In July 2006, Financial Accounting Standards Board Interpretation No. 48, Accounting for Uncertainty in Income Taxes - an interpretation of FASB Statement 109 (FIN 48), was issued and is effective on the last business day of the semiannual reporting period for fiscal years beginning after December 15, 2006. FIN 48 sets forth a threshold for financial statement recognition, measurement and disclosure of a tax position taken or expected to be taken on a tax return. Management is currently evaluating the impact, if any, the adoption of FIN 48 will have on the Funds' net assets, results of operations and financial statement disclosures.
In addition, in September 2006, Statement of Financial Accounting Standards No. 157, Fair Value Measurements (SFAS 157), was issued and is effective for fiscal years beginning after November 15, 2007. SFAS 157 defines fair value, establishes a framework for measuring fair value and expands disclosures about fair value measurements. Management is currently evaluating the impact the adoption of SFAS 157 will have on the Funds' financial statement disclosures.
4. Operating Policies.
Repurchase Agreements. FMR has received an Exemptive Order from the Securities and Exchange Commission (the SEC) which permits certain Funds and other affiliated entities of FMR to transfer uninvested cash balances into joint trading accounts which are then invested in repurchase agreements. Certain Funds may also invest directly with institutions in repurchase agreements. Repurchase agreements are collateralized by government or non-government securities. Upon settlement date, collateral is held in segregated accounts with custodian banks and may be obtained in the event of a default of the counterparty. Each applicable Fund monitors, on a daily basis, the value of the collateral to ensure it is at least equal to the principal amount of the repurchase agreement (including accrued interest). In the event of a default by the counterparty, realization of the collateral proceeds could be delayed, during which time the value of the collateral may decline.
5. Purchases and Sales of Investments.
Purchases and sales of securities, other than short-term securities, are noted in the table below.
Purchases ($) | Sales ($) | |
Energy Portfolio | 2,572,388,862 | 3,106,648,536 |
Energy Service Portfolio | 1,496,634,645 | 2,020,348,758 |
Natural Gas Portfolio | 769,367,907 | 1,403,755,318 |
Natural Resources Portfolio | 1,247,988,772 | 1,243,492,738 |
6. Fees and Other Transactions with Affiliates.
Management Fee. FMR and its affiliates provide the Funds with investment management related services for which the Funds pay a monthly management fee. The management fee is the sum of an individual fund fee rate and a group fee rate. The individual fund fee rate is applied to each Fund's average net assets. The group fee rate is based upon the average net assets of all the mutual funds advised by FMR. The group fee rate decreases as assets under management increase and increases as assets under management decrease. For the period, each Fund's annual management fee rate expressed as a percentage of each Fund's average net assets was as follows:
Individual Rate | Group Rate | Total | |
Energy Portfolio | .30% | .26% | .56% |
Energy Service Portfolio | .30% | .26% | .56% |
Natural Gas Portfolio | .30% | .26% | .56% |
Natural Resources Portfolio | .30% | .26% | .56% |
Transfer Agent Fees. Fidelity Service Company, Inc. (FSC), an affiliate of FMR, is the Funds' transfer, dividend disbursing and shareholder servicing agent. FSC receives account fees and asset-based fees that vary according to account size and type of account. FSC pays for typesetting, printing and mailing of shareholder reports, except proxy statements. For the period, the transfer agent fees were equivalent to the following annual rates expressed as a percentage of average net assets:
Energy Portfolio | .27% |
Energy Service Portfolio | .25% |
Natural Gas Portfolio | .27% |
Natural Resources Portfolio | .28% |
Annual Report
Notes to Financial Statements - continued
6. Fees and Other Transactions with Affiliates - continued
Accounting and Security Lending Fees. FSC maintains each Fund's accounting records. The accounting fee is based on the level of average net assets for the month. Under a separate contract, FSC administers the security lending program. The security lending fee is based on the number and duration of lending transactions.
Exchange Fees. During the period, FSC received the proceeds of a $7.50 fee to cover administrative costs associated with exchanges out of the Funds to any other Fidelity Select fund or to any other Fidelity fund made through non-automated channels. Effective October 1, 2006, the exchange fees were eliminated. For the period, exchange fees retained by FSC were as follows:
Retained | |
Energy Portfolio | $ 22,125 |
Energy Service Portfolio | 19,365 |
Natural Gas Portfolio | 21,690 |
Natural Resources Portfolio | 10,515 |
Brokerage Commissions. Certain Funds placed a portion of their portfolio transactions with brokerage firms which are affiliates of the investment adviser. The commissions paid to these affiliated firms were as follows:
Amount | |
Energy Portfolio | $ 7,298 |
Energy Service Portfolio | 764 |
Natural Gas Portfolio | 3,933 |
Natural Resources Portfolio | 4,591 |
Interfund Lending Program. Pursuant to an Exemptive Order issued by the SEC, the Funds, along with other registered investment companies having management contracts with FMR, may participate in an interfund lending program. This program provides an alternative credit facility allowing the funds to borrow from, or lend money to, other participating affiliated funds. At period end, there were no interfund loans outstanding. Each applicable fund's activity in this program during the period for which loans were outstanding was as follows:
Borrower | Average Daily Loan Balance | Weighted Average Interest Rate | Interest Expense | |
Energy Portfolio | Borrower | $ 11,154,579 | 5.29% | $ 62,322 |
Energy Service Portfolio | Borrower | $ 13,354,959 | 5.21% | $ 94,738 |
Natural Gas Portfolio | Borrower | $ 6,394,364 | 5.26% | $ 61,656 |
Natural Resources Portfolio | Borrower | $ 14,412,919 | 5.32% | $ 78,860 |
7. Committed Line of Credit.
Certain Funds participate with other funds managed by FMR in a $4.2 billion credit facility (the "line of credit") to be utilized for temporary or emergency purposes to fund shareholder redemptions or for other short-term liquidity purposes. The participating funds have agreed to pay commitment fees on their pro rata portion of the line of credit, which is reflected in Miscellaneous Expense on the Statement of Operations, and is as follows:
Energy Portfolio | $ 6,904 |
Energy Service Portfolio | 4,601 |
Natural Gas Portfolio | 3,827 |
Natural Resources Portfolio | 2,782 |
During the period, there were no borrowings on this line of credit.
8. Security Lending.
Certain Funds lend portfolio securities from time to time in order to earn additional income. On the settlement date of the loan, each applicable Fund receives collateral (in the form of U.S. Treasury obligations, letters of credit and/or cash) against the loaned securities and maintains collateral in an amount not less than 100% of the market value of the loaned securities during the period of the loan. The market value of the loaned securities is determined at the close of business of the Funds and any additional required collateral is delivered to the Funds on the next business day. If the borrower defaults on its obligation to return the securities loaned because of insolvency or other reasons, a fund could experience delays and costs in recovering the securities loaned or in gaining access to the collateral. Any cash collateral received is invested in the Fidelity Securities Lending Cash Central Fund. The value of loaned securities and cash collateral at period end are disclosed on each applicable Fund's Statement of Assets and Liabilities.
Annual Report
8. Security Lending - continued
Security lending income represents the income earned on investing cash collateral, less fees and expenses associated with the loan, plus any premium payments that may be received on the loan of certain types of securities. Security lending income is presented on each applicable Fund's Statement of Operations as a component of income from Fidelity Central Funds.
9. Bank Borrowings.
Each Fund is permitted to have bank borrowings for temporary or emergency purposes to fund shareholder redemptions. Each Fund has established borrowing arrangements with certain banks. The interest rate on the borrowings is the bank's base rate, as revised from time to time. At period end, there were no bank borrowings outstanding. Each applicable Fund's activity in this program during the period for which loans were outstanding was as follows:
Average Daily | Weighted Average | |
Energy Portfolio | $ 11,451,000 | 5.50% |
Natural Gas Portfolio | $ 3,091,667 | 5.51% |
Natural Resources Portfolio | $ 5,546,000 | 5.56% |
10. Expense Reductions.
Many of the brokers with whom FMR places trades on behalf of certain Funds provided services to these Funds in addition to trade execution. These services included payments of expenses on behalf of each applicable Fund. In addition, through arrangements with each applicable fund's custodian and transfer agent, credits realized as a result of uninvested cash balances were used to reduce each applicable fund's expenses. All of the applicable expense reductions are noted in the table below.
Brokerage Service Arrangements | Custody | Transfer | |
Energy Portfolio | $ 42,967 | $ - | $ 34,473 |
Energy Service Portfolio | 14,173 | - | 17,927 |
Natural Gas Portfolio | 26,835 | 1,645 | 21,231 |
Natural Resources Portfolio | 54,835 | - | 32,876 |
11. Other.
The Funds' organizational documents provide former and current trustees and officers with a limited indemnification against liabilities arising in connection with the performance of their duties to the Funds. In the normal course of business, the Funds may also enter into contracts that provide general indemnifications. The Funds' maximum exposure under these arrangements is unknown as this would be dependent on future claims that may be made against the Funds. The risk of material loss from such claims is considered remote.
The United States Securities and Exchange Commission ("SEC") is conducting an investigation of FMR (covering the years 2002 to 2004) arising from gifts, gratuities and business entertainment provided by certain brokers to certain individuals who were employed on FMR's domestic equity trading desk during that period. FMR is in discussions with the SEC staff regarding the possible resolution of the matter, but as of period-end no final resolution has been reached.
In December 2006, the Independent Trustees completed their own investigation of the matter with the assistance of independent counsel. The Independent Trustees and FMR agree that, despite the absence of proof that the Fidelity mutual funds experienced diminished execution quality as a result of the improper receipt of gifts and business entertainment, the conduct at issue was serious and is worthy of redress. Accordingly, the Independent Trustees have requested and FMR has agreed to pay $42 million to Fidelity mutual funds, plus interest to be determined at the time that payment is made. A method of allocating this payment among the funds has not yet been determined. The total payment to each of the Funds is not anticipated to have a material impact on such Fund's net assets. In addition, FMR reimbursed related legal expenses which are recorded in the accompanying Statement of Operations as an expense reduction.
Annual Report
Report of Independent Registered Public Accounting Firm
To the Trustees of Fidelity Select Portfolios and the Shareholders of Energy Portfolio, Energy Service Portfolio, Natural Gas Portfolio, and Natural Resources Portfolio:
In our opinion, the accompanying statements of assets and liabilities, including the schedules of investments, and the related statements of operations and of changes in net assets and the financial highlights present fairly, in all material respects, the financial position of Energy Portfolio, Energy Service Portfolio, Natural Gas Portfolio, and Natural Resources Portfolio(funds of Fidelity Select Portfolios) at February 28, 2007, the results of each of their operations for the year then ended, the changes in each of their net assets for each of the two years in the period then ended and the financial highlights for each of the five years in the period then ended, in conformity with accounting principles generally accepted in the United States of America. These financial statements and financial highlights (hereafter referred to as "financial statements") are the responsibility of the Fidelity Select Portfolios' management. Our responsibility is to express an opinion on these financial statements based on our audits. We conducted our audits of these financial statements in accordance with the standards of the Public Company Accounting Oversight Board (United States). Those standards require that we plan and perform the audit to obtain reasonable assurance about whether the financial statements are free of material misstatement. An audit includes examining, on a test basis, evidence supporting the amounts and disclosures in the financial statements, assessing the accounting principles used and significant estimates made by management, and evaluating the overall financial statement presentation. We believe that our audits, which included confirmation of securities at February 28, 2007 by correspondence with the custodian and brokers, provide a reasonable basis for our opinion.
/s/PricewaterhouseCoopers LLP
PricewaterhouseCoopers LLP
Boston, Massachusetts
April 20, 2007
Annual Report
Trustees and Officers
The Trustees, Member of the Advisory Board, and executive officers of the trust and funds, as applicable, are listed below. The Board of Trustees governs each fund and is responsible for protecting the interests of shareholders. The Trustees are experienced executives who meet periodically throughout the year to oversee each fund's activities, review contractual arrangements with companies that provide services to each fund, and review each fund's performance. Each of the Trustees oversees 349 funds advised by FMR or an affiliate.
The Trustees hold office without limit in time except that (a) any Trustee may resign; (b) any Trustee may be removed by written instrument, signed by at least two-thirds of the number of Trustees prior to such removal; (c) any Trustee who requests to be retired or who has become incapacitated by illness or injury may be retired by written instrument signed by a majority of the other Trustees; and (d) any Trustee may be removed at any special meeting of shareholders by a two-thirds vote of the outstanding voting securities of the trust. Each Trustee who is not an interested person (as defined in the 1940 Act) (Independent Trustee), shall retire not later than the last day of the calendar year in which his or her 72nd birthday occurs. The Independent Trustees may waive this mandatory retirement age policy with respect to individual Trustees. The executive officers and Advisory Board Member hold office without limit in time, except that any officer and Advisory Board Member may resign or may be removed by a vote of a majority of the Trustees at any regular meeting or any special meeting of the Trustees. Except as indicated, each individual has held the office shown or other offices in the same company for the past five years.
The funds' Statement of Additional Information (SAI) includes more information about the Trustees. To request a free copy, call Fidelity at 1-800-544-8544.
Interested Trustees*:
Correspondence intended for each Trustee who is an interested person may be sent to Fidelity Investments, 82 Devonshire Street, Boston, Massachusetts 02109.
Name, Age; Principal Occupation | |
Edward C. Johnson 3d (76) | |
Year of Election or Appointment: 1980 Mr. Johnson is Chairman of the Board of Trustees. Mr. Johnson serves as President (2006-present), Chief Executive Officer, Chairman, and a Director of FMR Corp.; Chairman and a Director of FMR; Chairman and a Director of Fidelity Research & Analysis Company (FRAC); Chairman and a Director of Fidelity Investments Money Management, Inc.; and Chairman (2001- present) and a Director of FMR Co., Inc. In addition, Mr. Johnson serves as Chairman and Director of Fidelity International Limited (FIL). | |
Robert L. Reynolds (54) | |
Year of Election or Appointment: 2003 Mr. Reynolds is President and a Director of FMR (2005-present), Fidelity Investments Money Management, Inc. (2005-present), and FMR Co., Inc. (2005-present). Mr. Reynolds also serves as Vice Chairman (2006-present), a Director (2003-present), and Chief Operating Officer of FMR Corp. and a Director of Strategic Advisers, Inc. (2005-present). He also serves on the Board at Fidelity Investments Canada, Ltd. | |
* Trustees have been determined to be "Interested Trustees" by virtue of, among other things, their affiliation with the trust or various entities under common control with FMR.
Independent Trustees:
Correspondence intended for each Independent Trustee (that is, the Trustees other than the Interested Trustees) may be sent to Fidelity Investments, P.O. Box 55235, Boston, Massachusetts 02205-5235.
Name, Age; Principal Occupation | |
Dennis J. Dirks (58) | |
Year of Election or Appointment: 2005 Prior to his retirement in May 2003, Mr. Dirks was Chief Operating Officer and a member of the Board of The Depository Trust & Clearing Corporation (DTCC) (1999-2003). He also served as President, Chief Operating Officer, and Board member of The Depository Trust Company (DTC) (1999-2003) and President and Board member of the National Securities Clearing Corporation (NSCC) (1999-2003). In addition, Mr. Dirks served as Chief Executive Officer and Board member of the Government Securities Clearing Corporation (2001-2003) and Chief Executive Officer and Board member of the Mortgage-Backed Securities Clearing Corporation (2001-2003). Mr. Dirks also serves as a Trustee and a member of the Finance Committee of Manhattan College (2005-present) and a Trustee and a member of the Finance Committee of AHRC of Nassau County (2006-present). | |
Albert R. Gamper, Jr. (64) | |
Year of Election or Appointment: 2006 Prior to his retirement in December 2004, Mr. Gamper served as Chairman of the Board of CIT Group Inc. (commercial finance). During his tenure with CIT Group Inc. Mr. Gamper served in numerous senior management positions, including Chairman (1987-1989; 1999-2001; 2002-2004), Chief Executive Officer (1987-2004), and President (1989-2002). He currently serves as a member of the Board of Directors of Public Service Enterprise Group (utilities, 2001-present), Chairman of the Board of Governors, Rutgers University (2004-present), and Chairman of the Board of Saint Barnabas Health Care System. | |
George H. Heilmeier (70) | |
Year of Election or Appointment: 2004 Dr. Heilmeier is Chairman Emeritus of Telcordia Technologies (communication software and systems), where prior to his retirement, he served as company Chairman and Chief Executive Officer. He currently serves on the Boards of Directors of The Mitre Corporation (systems engineering and information technology support for the government), and HRL Laboratories (private research and development, 2004-present). He is Chairman of the General Motors Science & Technology Advisory Board and a Life Fellow of the Institute of Electrical and Electronics Engineers (IEEE). Dr. Heilmeier is a member of the Defense Science Board and the National Security Agency Advisory Board. He is also a member of the National Academy of Engineering, the American Academy of Arts and Sciences, and the Board of Overseers of the School of Engineering and Applied Science of the University of Pennsylvania. Previously, Dr. Heilmeier served as a Director of TRW Inc. (automotive, space, defense, and information technology, 1992-2002), Compaq (1994-2002), Automatic Data Processing, Inc. (ADP) (technology-based business outsourcing, 1995-2002), INET Technologies Inc. (telecommunications network surveillance, 2001-2004), and Teletech Holdings (customer management services). He is the recipient of the 2005 Kyoto Prize in Advanced Technology for his invention of the liquid crystal display, and a member of the Consumer Electronics Hall of Fame. | |
James H. Keyes (66) | |
Year of Election or Appointment: 2007 Prior to his retirement in 2003, Mr. Keyes was Chairman, President, and Chief Executive Officer of Johnson Controls, Inc. (automotive supplier, 1993-2003). He currently serves as a member of the boards of LSI Logic Corporation (semiconductor technologies), Navistar International Corporation (manufacture and sale of trucks, buses, and diesel engines, 2002-present), and Pitney Bowes, Inc. (integrated mail, messaging, and document management solutions). | |
Marie L. Knowles (60) | |
Year of Election or Appointment: 2001 Prior to Ms. Knowles' retirement in June 2000, she served as Executive Vice President and Chief Financial Officer of Atlantic Richfield Company (ARCO) (diversified energy, 1996-2000). From 1993 to 1996, she was a Senior Vice President of ARCO and President of ARCO Transportation Company. She served as a Director of ARCO from 1996 to 1998. She currently serves as a Director of Phelps Dodge Corporation (copper mining and manufacturing) and McKesson Corporation (healthcare service, 2002-present). Ms. Knowles is a Trustee of the Brookings Institution and the Catalina Island Conservancy and also serves as a member of the Advisory Board for the School of Engineering of the University of Southern California. | |
Ned C. Lautenbach (63) | |
Year of Election or Appointment: 2000 Mr. Lautenbach is Chairman of the Independent Trustees (2006-present). Mr. Lautenbach has been a partner of Clayton, Dubilier & Rice, Inc. (private equity investment firm) since September 1998. Previously, Mr. Lautenbach was with the International Business Machines Corporation (IBM) from 1968 until his retirement in 1998. Mr. Lautenbach serves as a Director of Sony Corporation (2006-present) and Eaton Corporation (diversified industrial) as well as the Philharmonic Center for the Arts in Naples, Florida. He also is a member of the Board of Trustees of Fairfield University (2005-present), as well as a member of the Council on Foreign Relations. | |
Cornelia M. Small (62) | |
Year of Election or Appointment: 2005 Ms. Small is a member (2000-present) and Chairperson (2002-present) of the Investment Committee, and a member (2002- present) of the Board of Trustees of Smith College. Previously, she served as Chief Investment Officer (1999-2000), Director of Global Equity Investments (1996-1999), and a member of the Board of Directors of Scudder, Stevens & Clark (1990-1997) and Scudder Kemper Investments (1997-1999). In addition, Ms. Small served as Co-Chair (2000-2003) of the Annual Fund for the Fletcher School of Law and Diplomacy. | |
William S. Stavropoulos (67) | |
Year of Election or Appointment: 2001 Mr. Stavropoulos is Chairman Emeritus of the Board of Directors of The Dow Chemical Company. Since joining The Dow Chemical Company in 1967, Mr. Stavropoulos served in numerous senior management positions, including President (1993-2000; 2002-2003), CEO (1995-2000; 2002-2004), and Chairman of the Executive Committee (2000-2004). Currently, he is a Director of NCR Corporation (data warehousing and technology solutions), Chemical Financial Corporation, Maersk Inc. (industrial conglomerate, 2002-present), Tyco International, Inc. (multinational manufacturing and services, 2007-present), and a member of the Advisory Board for Metalmark Capital (private equity investment firm, 2005-present). He is a special advisor to Clayton, Dubilier & Rice, Inc., a private equity investment firm. He also serves as a member of the Board of Trustees of the American Enterprise Institute for Public Policy Research. In addition, Mr. Stavropoulos is a member of The Business Council, J.P. Morgan International Council and the University of Notre Dame Advisory Council for the College of Science. | |
Kenneth L. Wolfe (68) | |
Year of Election or Appointment: 2005 Prior to his retirement in 2001, Mr. Wolfe was Chairman and Chief Executive Officer of Hershey Foods Corporation (1993-2001). He currently serves as a member of the boards of Adelphia Communications Corporation (2003-present), Bausch & Lomb, Inc., and Revlon Inc. (2004-present). | |
Advisory Board Member and Executive Officers:
Correspondence intended for each executive officer and Mr. Lynch may be sent to Fidelity Investments, 82 Devonshire Street, Boston, Massachusetts 02109.
Name, Age; Principal Occupation | |
Peter S. Lynch (63) | |
Year of Election or Appointment: 2003 Member of the Advisory Board of Fidelity Select Portfolios. Mr. Lynch is Vice Chairman and a Director of FMR, and Vice Chairman (2001-present) and a Director of FMR Co., Inc. Previously, Mr. Lynch served as a Trustee of the Fidelity funds (1990-2003). In addition, he serves as a Trustee of Boston College and as the Chairman of the Inner-City Scholarship Fund. | |
Kimberley H. Monasterio (43) | |
Year of Election or Appointment: 2007 President and Treasurer of Select Energy Portfolio, Select Energy Service Portfolio, Select Natural Gas Portfolio, and Select Natural Resources Portfolio. Ms. Monasterio also serves as President and Treasurer of other Fidelity funds (2007-present) and is an employee of FMR (2004-present). Previously, Ms. Monasterio served as Deputy Treasurer of the Fidelity funds (2004-2006). Before joining Fidelity Investments, Ms. Monasterio served as Treasurer (2000-2004) and Chief Financial Officer (2002-2004) of the Franklin Templeton Funds and Senior Vice President of Franklin Templeton Services, LLC (2000-2004). | |
Boyce I. Greer (51) | |
Year of Election or Appointment: 2005 Vice President of Select Energy Portfolio, Select Energy Service Portfolio, Select Natural Gas Portfolio, and Select Natural Resources Portfolio. Mr. Greer also serves as Vice President of certain Equity Funds (2005-present), certain Asset Allocation Funds (2005-present), Fixed-Income Funds (2006-present), and Money Market Funds (2006-present). Mr. Greer is also a Trustee of other investment companies advised by FMR (2003-present). He is an Executive Vice President of FMR (2005-present) and FMR Co., Inc. (2005-present), and Senior Vice President of Fidelity Investments Money Management, Inc. (2006-present). Previously, Mr. Greer served as a Director and Managing Director of Strategic Advisers, Inc. (2002-2005), and Executive Vice President (2000-2002) and Money Market Group Leader (1997-2002) of the Fidelity Investments Fixed Income Division. He also served as Vice President of Fidelity's Money Market Funds (1997-2002), Senior Vice President of FMR (1997-2002), and Vice President of FIMM (1998-2002). | |
Eric D. Roiter (58) | |
Year of Election or Appointment: 1998 Secretary of Select Energy Portfolio, Select Energy Service Portfolio, Select Natural Gas Portfolio, and Select Natural Resources Portfolio. He also serves as Secretary of other Fidelity funds; Vice President, General Counsel, and Secretary of FMR Co., Inc. (2001-present) and FMR; Assistant Secretary of Fidelity Management & Research (U.K.) Inc. (2001-present), Fidelity Research & Analysis Company (2001-present), and Fidelity Investments Money Management, Inc. (2001-present). Mr. Roiter is an Adjunct Member, Faculty of Law, at Boston College Law School (2003-present). Previously, Mr. Roiter served as Vice President and Secretary of Fidelity Distributors Corporation (FDC) (1998-2005). | |
Scott C. Goebel (39) | |
Year of Election or Appointment: 2007 | |
R. Stephen Ganis (40) | |
Year of Election or Appointment: 2006 Anti-Money Laundering (AML) officer of Select Energy Portfolio, Select Energy Service Portfolio, Select Natural Gas Portfolio, and Select Natural Resources Portfolio. Mr. Ganis also serves as AML officer of other Fidelity funds (2006-present) and FMR Corp. (2003-present). Before joining Fidelity Investments, Mr. Ganis practiced law at Goodwin Procter, LLP (2000-2002). | |
Joseph B. Hollis (58) | |
Year of Election or Appointment: 2006 Chief Financial Officer of Select Energy Portfolio, Select Energy Service Portfolio, Select Natural Gas Portfolio, and Select Natural Resources Portfolio. Mr. Hollis also serves as Chief Financial Officer of other Fidelity funds. Mr. Hollis is President of Fidelity Pricing and Cash Management Services (FPCMS) (2005-present). Mr. Hollis also serves as President and Director of Fidelity Service Company, Inc. (2006-present). Previously, Mr. Hollis served as Senior Vice President of Cash Management Services (1999-2002) and Investment Management Operations (2002-2005). | |
Kenneth A. Rathgeber (59) | |
Year of Election or Appointment: 2004 Chief Compliance Officer of Select Energy Portfolio, Select Energy Service Portfolio, Select Natural Gas Portfolio, and Select Natural Resources Portfolio. Mr. Rathgeber also serves as Chief Compliance Officer of other Fidelity funds (2004-present) and Executive Vice President of Risk Oversight for Fidelity Investments (2002-present). He is Chief Compliance Officer of FMR (2005-present), FMR Co., Inc. (2005-present), Fidelity Management & Research (U.K.) Inc. (2005-present), Fidelity Research & Analysis Company (2005-present), Fidelity Investments Money Management, Inc. (2005-present), and Strategic Advisers, Inc. (2005-present). Previously, Mr. Rathgeber served as Executive Vice President and Chief Operating Officer for Fidelity Investments Institutional Services Company, Inc. (1998-2002). | |
Bryan A. Mehrmann (45) | |
Year of Election or Appointment: 2005 Deputy Treasurer of Select Energy Portfolio, Select Energy Service Portfolio, Select Natural Gas Portfolio, and Select Natural Resources Portfolio. Mr. Mehrmann also serves as Deputy Treasurer of other Fidelity funds (2005-present) and is an employee of FMR. Previously, Mr. Mehrmann served as Vice President of Fidelity Investments Institutional Services Group (FIIS)/Fidelity Investments Institutional Operations Corporation, Inc. (FIIOC) Client Services (1998-2004). | |
Kenneth B. Robins (37) | |
Year of Election or Appointment: 2005 Deputy Treasurer of Select Energy Portfolio, Select Energy Service Portfolio, Select Natural Gas Portfolio, and Select Natural Resources Portfolio. Mr. Robins also serves as Deputy Treasurer of other Fidelity funds (2005-present) and is an employee of FMR (2004-present). Before joining Fidelity Investments, Mr. Robins worked at KPMG LLP, where he was a partner in KPMG's department of professional practice (2002-2004) and a Senior Manager (1999-2000). In addition, Mr. Robins served as Assistant Chief Accountant, United States Securities and Exchange Commission (2000-2002). | |
Robert G. Byrnes (40) | |
Year of Election or Appointment: 2005 Assistant Treasurer of Select Energy Portfolio, Select Energy Service Portfolio, Select Natural Gas Portfolio, and Select Natural Resources Portfolio. Mr. Byrnes also serves as Assistant Treasurer of other Fidelity funds (2005-present) and is an employee of FMR (2005-present). Previously, Mr. Byrnes served as Vice President of FPCMS (2003-2005). Before joining Fidelity Investments, Mr. Byrnes worked at Deutsche Asset Management where he served as Vice President of the Investment Operations Group (2000-2003). | |
Peter L. Lydecker (53) | |
Year of Election or Appointment: 2004 Assistant Treasurer of Select Energy Portfolio, Select Energy Service Portfolio, Select Natural Gas Portfolio, and Select Natural Resources Portfolio. Mr. Lydecker also serves as Assistant Treasurer of other Fidelity funds (2004) and is an employee of FMR. | |
Gary W. Ryan (48) | |
Year of Election or Appointment: 2005 Assistant Treasurer of Select Energy Portfolio, Select Energy Service Portfolio, Select Natural Gas Portfolio, and Select Natural Resources Portfolio. Mr. Ryan also serves as Assistant Treasurer of other Fidelity funds (2005-present) and is an employee of FMR (2005-present). Previously, Mr. Ryan served as Vice President of Fund Reporting in FPCMS (1999-2005). | |
Salvatore Schiavone (41) | |
Year of Election or Appointment: 2005 Assistant Treasurer of Select Energy Portfolio, Select Energy Service Portfolio, Select Natural Gas Portfolio, and Select Natural Resources Portfolio. Mr. Schiavone also serves as Assistant Treasurer of other Fidelity funds (2005-present) and is an employee of FMR (2005-present). Before joining Fidelity Investments, Mr. Schiavone worked at Deutsche Asset Management, where he most recently served as Assistant Treasurer (2003-2005) of the Scudder Funds and Vice President and Head of Fund Reporting (1996-2003). | |
Annual Report
Distributions
The Board of Trustees of each fund voted to pay to shareholders of record at the opening of business on record date, the following distributions per share derived from capital gains realized from sales of portfolio securities, and dividends derived from net investment income:
Fund | Pay Date | Record Date | Dividends | Capital Gains |
Energy Portfolio | 04/16/07 | 04/13/07 | $0.05 | $0.80 |
Energy Service Portfolio | 04/16/07 | 04/13/07 | $1.90 | |
Natural Gas Portfolio | 04/16/07 | 04/13/07 | $1.74 | |
Natural Resources Portfolio | 04/16/07 | 04/13/07 | $0.02 | $0.62 |
The funds hereby designate as capital gain dividend the amounts noted below for the taxable year ended February 28, 2007, or, if subsequently determined to be different, the net capital gain of such year.
Fund | |
Energy Portfolio | $168,444,694 |
Energy Service Portfolio | $125,380,486 |
Natural Gas Portfolio | $103,501,020 |
Natural Resources Portfolio | $ 38,232,628 |
A percentage of the dividends distributed during the fiscal year for the following funds qualifies for the dividends-received deduction for corporate shareholders:
Energy Portfolio | |
April 2006 | 3% |
December 2006 | 100% |
Energy Services Portfolio | |
April 2006 | 100% |
Natural Gas Portfolio | |
April 2006 | 5% |
December 2006 | 26% |
Natural Resources Portfolio | |
April 2006 | 7% |
December 2006 | 100% |
A percentage of the dividends distributed during the fiscal year for the following funds may be taken into account as a dividend for purposes of the maximum rate under section 1(h)(11) of the Internal Revenue Code.
Energy Portfolio | |
April 2006 | 4% |
December 2006 | 100% |
Energy Services Portfolio | |
April 2006 | 100% |
Natural Gas Portfolio | |
April 2006 | 5% |
December 2006 | 34% |
Natural Resources Portfolio | |
April 2006 | 9% |
December 2006 | 100% |
The fund will notify shareholders in January 2008 of amounts for use in preparing 2007 income tax returns.
Annual Report
Proxy Voting Results
A special meeting of Fidelity Select Portfolios' shareholders was held on September 20, 2006. The results of votes taken among shareholders on the proposal before them are reported below. Each vote reported represents one dollar of net asset value held on the record date for the meeting.
PROPOSAL 1 | ||
To elect a Board of Trustees. A | ||
# of | % of | |
Dennis J. Dirks | ||
Affirmative | 13,182,341,755.09 | 94.980 |
Withheld | 696,736,162.41 | 5.020 |
TOTAL | 13,879,077,917.50 | 100.000 |
Albert R. Gamper, Jr. | ||
Affirmative | 13,177,593,614.43 | 94.946 |
Withheld | 701,484,303.07 | 5.054 |
TOTAL | 13,879,077,917.50 | 100.000 |
Robert M. Gates | ||
Affirmative | 13,141,235,622.81 | 94.684 |
Withheld | 737,842,294.69 | 5.316 |
TOTAL | 13,879,077,917.50 | 100.000 |
George H. Heilmeier | ||
Affirmative | 13,140,073,210.00 | 94.675 |
Withheld | 739,004,707.50 | 5.325 |
TOTAL | 13,879,077,917.50 | 100.000 |
Edward C. Johnson 3d | ||
Affirmative | 13,106,284,587.54 | 94.432 |
Withheld | 772,793,329.96 | 5.568 |
TOTAL | 13,879,077,917.50 | 100.000 |
Stephen P. Jonas | ||
Affirmative | 13,168,282,872.88 | 94.879 |
Withheld | 710,795,044.62 | 5.121 |
TOTAL | 13,879,077,917.50 | 100.000 |
James H. KeyesB | ||
Affirmative | 13,164,603,089.66 | 94.852 |
Withheld | 714,474,827.84 | 5.148 |
TOTAL | 13,879,077,917.50 | 100.000 |
Marie L. Knowles | ||
Affirmative | 13,169,356,779.66 | 94.886 |
Withheld | 709,721,137.84 | 5.114 |
TOTAL | 13,879,077,917.50 | 100.000 |
Ned C. Lautenbach | ||
Affirmative | 13,166,485,155.52 | 94.866 |
Withheld | 712,592,761.98 | 5.134 |
TOTAL | 13,879,077,917.50 | 100.000 |
William O. McCoy | ||
Affirmative | 13,129,548,996.59 | 94.600 |
Withheld | 749,528,920.91 | 5.400 |
TOTAL | 13,879,077,917.50 | 100.000 |
Robert L. Reynolds | ||
Affirmative | 13,180,813,649.06 | 94.969 |
Withheld | 698,264,268.44 | 5.031 |
TOTAL | 13,879,077,917.50 | 100.000 |
# of | % of | |
Cornelia M. Small | ||
Affirmative | 13,170,500,616.42 | 94.895 |
Withheld | 708,577,301.08 | 5.105 |
TOTAL | 13,879,077,917.50 | 100.000 |
William S. Stavropoulos | ||
Affirmative | 13,143,284,328.22 | 94.699 |
Withheld | 735,793,589.28 | 5.301 |
TOTAL | 13,879,077,917.50 | 100.000 |
Kenneth L. Wolfe | ||
Affirmative | 13,162,946,758.47 | 94.840 |
Withheld | 716,131,159.03 | 5.160 |
TOTAL | 13,879,077,917.50 | 100.000 |
A Denotes trust-wide proposal and voting results. B Effective on or about January 1, 2007. | ||
Annual Report
Managing Your Investments
Fidelity offers several ways to conveniently manage your personal investments via your telephone or PC. You can access your account information, conduct trades and research your investments 24 hours a day.
By Phone
Fidelity Automated Service Telephone provides a single toll-free number to access account balances, positions, quotes and trading. It's easy to navigate the service, and on your first call, the system will help you create a personal identification number (PIN) for security.
(phone_graphic)Fidelity Automated Service Telephone (FAST®)
1-800-544-5555
Press
1 For mutual fund and brokerage trading.
2 For quotes.*
3 For account balances and holdings.
4 To review orders and mutual fund activity.
5 To change your PIN.
*0 To speak to a Fidelity representative.
By PC
Fidelity's web site on the Internet provides a wide range of information, including daily financial news, fund performance, interactive planning tools and news about Fidelity products and services.
(computer_graphic)Fidelity's Web Site
www.fidelity.com
* When you call the quotes line, please remember that a fund's yield and return will vary and, except for money market funds, share price will also vary. This means that you may have a gain or loss when you sell your shares. There is no assurance that money market funds will be able to maintain a stable $1 share price; an investment in a money market fund is not insured or guaranteed by the U.S. government. Total returns are historical and include changes in share price, reinvestment of dividends and capital gains, and the effects of any sales charges.
Annual Report
Investment Adviser
Fidelity Management & Research Company
Boston, MA
Investment Sub-Advisers
FMR Co., Inc.
Fidelity Management & Research
(U.K.) Inc.
Fidelity Research & Analysis Company (formerly Fidelity
Management & Research (Far East) Inc.)
Fidelity Investments Japan Limited
Fidelity International Investment Advisors
Fidelity International Investment Advisors
(U.K. Limited)
General Distributor
Fidelity Distributors Corporation
Boston, MA
Transfer and Service Agent
Fidelity Service Company, Inc.
Boston, MA
Custodian
Brown Brothers Harriman & Co.
Boston, MA
Corporate Headquarters
82 Devonshire Street
Boston, MA 02109
1-800-544-8888
The Fidelity Telephone Connection
Mutual Fund 24-Hour Service
Exchanges/Redemptions
and Account Assistance 1-800-544-6666
Product Information 1-800-544-8888
Retirement Accounts 1-800-544-4774
(8 a.m. - 9 p.m.)
TDD Service 1-800-544-0118
for the deaf and hearing impaired
(9 a.m. - 9 p.m. Eastern time)
Fidelity Automated Service
Telephone (FAST®) (automated graphic) 1-800-544-5555
(automated graphic) Automated line for quickest service
(Fidelity Investment logo)(registered trademark)
Corporate Headquarters
82 Devonshire St., Boston, MA 02109
www.fidelity.com
SELNR-UANN-0407
1.813647.102
Fidelity®
Select Portfolios®
Utilities Sector
Select Utilities Growth Portfolio
Annual Report
February 28, 2007
(2_fidelity_logos) (Registered_Trademark)
Contents
Chairman's Message | ||
Note to Shareholders | ||
Performance | ||
Management's Discussion | ||
Shareholder Expense Example | ||
Investment Changes | ||
Investments | ||
Financial Statements | ||
Notes to Financial Statements | ||
Report of Independent Registered Public Accounting Firm | ||
Trustees and Officers | ||
Distributions | ||
Proxy Voting Results | ||
To view a fund's proxy voting guidelines and proxy voting record for the 12-month period ended June 30, visit www.fidelity.com/proxyvotingresults or visit the Securities and Exchange Commission's (SEC) web site at www.sec.gov. You may also call 1-800-544-8544 to request a free copy of the proxy voting guidelines.
Standard & Poor's, S&P and S&P 500 are registered service marks of The McGraw-Hill Companies, Inc. and have been licensed for use by Fidelity Distributors Corporation.
Other third party marks appearing herein are the property of their respective owners.
All other marks appearing herein are registered or unregistered trademarks or service marks of FMR Corp. or an affiliated company.
This report and the financial statements contained herein are submitted for the general information of the shareholders of the funds. This report is not authorized for distribution to prospective investors in the funds unless preceded or accompanied by an effective prospectus.
A fund files its complete schedule of portfolio holdings with the SEC for the first and third quarters of each fiscal year on Form N-Q. Forms N-Q are available on the SEC's web site at http://www.sec.gov. A fund's Forms N-Q may be reviewed and copied at the SEC's Public Reference Room in Washington, DC. Information regarding the operation of the SEC's Public Reference Room may be obtained by calling 1-800-SEC-0330. For a complete list of a fund's portfolio holdings, view the most recent quarterly holdings report, semiannual report, or annual report on Fidelity's web site at http://www.fidelity.com/holdings.
NOT FDIC INSURED · MAY LOSE VALUE · NO BANK GUARANTEE
Neither the funds nor Fidelity Distributors Corporation is a bank.
Annual Report
Chairman's Message
(Photograph of Edward C. Johnson 3d.)
Dear Shareholder:
Substantial single-day losses are not uncommon in the equity markets, and when they occur - as in late February - investors can be better served in the long term by buying good stocks at lower prices than by moving their money to the sidelines. While financial markets are always unpredictable, there are a number of time-tested principles that can put the historical odds in your favor.
One of the basic tenets is to invest for the long term. Over time, riding out the markets' inevitable ups and downs has proven much more effective than selling into panic or chasing the hottest trend. Even missing only a few of the markets' best days can significantly diminish investor returns. Patience also affords the benefits of compounding - of earning interest on additional income or reinvested dividends and capital gains. There are tax advantages and cost benefits to consider as well. The more you sell, the more taxes you pay, and the more you trade, the higher the costs. While staying the course doesn't eliminate risk, it can considerably lessen the effect of short-term declines.
You can further manage your investing risk through diversification. And today, more than ever, geographic diversification should be taken into account. Studies
indicate that asset allocation is the single most important determinant of a portfolio's long-term success. The right mix of stocks, bonds and cash - aligned to your particular risk tolerance and investment objective - is very important. Age-appropriate rebalancing is also an essential aspect of asset allocation. For younger investors, an emphasis on equities - which historically have been the best performing asset class over time - is encouraged. As investors near their specific goal, such as retirement or sending a child to college, consideration may be given to replacing volatile assets (e.g. common stocks) with more-stable fixed investments (bonds or savings plans).
A third investment principle - investing regularly - can help lower the average cost of your purchases. Investing a certain amount of money each month or quarter helps ensure you won't pay for all your shares at market highs. This strategy - known as dollar cost averaging - also reduces unconstructive "emotion" from investing, helping shareholders avoid selling weak performers just prior to an upswing, or chasing a hot performer just before a correction.
We invite you to contact us via the Internet, through our Investor Centers or over the phone. It is our privilege to provide you the information you need to make the investments that are right for you.
Sincerely,
/s/Edward C. Johnson 3d
Edward C. Johnson 3d
Annual Report
Note to Shareholders:
Effective October 1, 2006, Fidelity restructured the Fidelity® Select Portfolios® equity product line. The restructuring aligned the equity funds' investment goals more closely with standard industry classifications and facilitated adoption of more-specific benchmark indexes to evaluate fund performance. As restructured, the equity funds generally align under the 10 sectors in the widely recognized Global Industry Classification Standard (GICS), developed by Standard & Poor's® (S&P®) and Morgan Stanley Capital InternationalSM (MSCI®): Consumer Discretionary, Consumer Staples, Energy, Financials, Health Care, Industrials, Information Technology, Materials, Telecommunications Services and Utilities. Changes to the funds ranged from simply adopting a new supplemental benchmark to, in some cases, changing investment policies and fund names.
For Banking, Communications Equipment (formerly Developing Communications), Construction and Housing, Consumer Discretionary (formerly Consumer Industries), Consumer Staples (formerly Food and Agriculture), Home Finance, Industrials (formerly Cyclical Industries), IT Services (formerly Business Services and Outsourcing) and Materials (formerly Industrial Materials), shareholders approved certain fundamental investment policy changes related to the restructuring at a special meeting of shareholders held September 20, 2006. All the equity funds adopted new benchmark indexes from MSCI, except for Gold (which adopted an S&P/Citigroup index), Natural Gas (which adopted an S&P index) and Natural Resources (which retained its current Goldman Sachs® index). Taken together, the name, policy and benchmark changes will make it easier for investors to distinguish funds in the product line and to evaluate Fidelity Management & Research Company's skill in managing the funds.
Utilities Growth aligns with the GICS Utilities Sector and is now benchmarked to the MSCI US Investable Market Utilities Index, generally emphasizing power and gas utilities and not telephone companies and telecommunications utilities.
The Select equity portfolios also eliminated hourly pricing. The funds now price each business day as of the close of the New York Stock Exchange, normally 4:00 pm Eastern time. The funds also adopted Fidelity's standard fund market timing policy, as described in the funds' current prospectus, and removed the $7.50 fee formerly charged on exchanges made through non-automated channels.
Annual Report
Select Utilities Growth Portfolio
Performance
Average annual total return reflects the change in the value of an investment, assuming reinvestment of the fund's dividend income and capital gains (the profits earned upon the sale of securities that have grown in value) and assuming a constant rate of performance each year. The $10,000 table and the fund's returns do not reflect the deduction of taxes that a shareholder would pay on fund distributions or the redemption of fund shares. During periods of reimbursement by Fidelity, a fund's total returns will be greater than it would be had the reimbursement not occurred. How a fund did yesterday is no guarantee of how it will do tomorrow.
Average Annual Total Returns
Periods ended February 28, 2007 | Past 1 | Past 5 | Past 10 |
Select Utilities Growth Portfolio | 26.95% | 12.95% | 9.50% |
Prior to October 1, 2006, Select Utilities Growth Portfolio operated under certain different investment policies. The fund's historical performance may not represent its current investment policies.
$10,000 Over 10 Years
Let's say hypothetically that $10,000 was invested in Select Utilities Growth Portfolio on February 28, 1997. The chart shows how the value of your investment would have changed, and also shows how the S&P 500 Index performed over the same period.
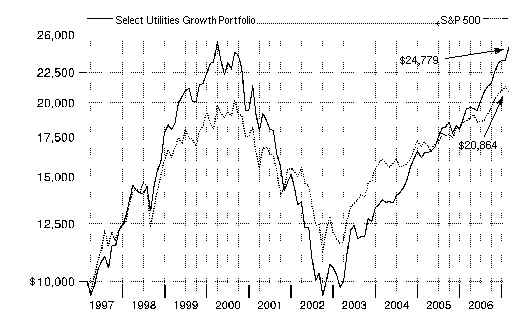
Annual Report
Select Utilities Growth Portfolio
Management's Discussion of Fund Performance
Comments from Douglas Simmons, who became Portfolio Manager of Fidelity® Select Utilities Growth Fund on October 2, 2006
A rosy year for stocks wilted just prior to the end of the 12-month period ending February 28, 2007. On the day prior to the period's close, the Dow Jones Industrial AverageSM plunged 416 points and the Standard & Poor's 500SM Index lost roughly 3.5% of its value, plummeting nearly 50 points and marking the benchmark's worst single-day performance since the day the market reopened after the 9/11 terrorist attacks. Though investors were obviously rattled by the development, it was only the 22nd-biggest decline for the S&P 500® in 20 years, and it could not overshadow how well stocks performed for the 12 months overall. For much of the past year, investors grew confident that the economy would not fall into a recession, and they bid up most broad-based stock indexes for six consecutive months from August through January. Overall for the year ending February 28, 2007, the S&P 500 was up 11.97%, the Dow advanced 14.24%, the small-cap Russell 2000® Index gained 9.87% and the NASDAQ Composite® Index rose 6.66%.
For the 12 months ending February 28, 2007, the fund returned 26.95%, outperforming the 22.80% gain of the Morgan Stanley Capital InternationalSM (MSCI®) US Investable Market Utilities Index and the 24.17% advance of a blended index specific to this fund. This blended index is a combination of the Goldman Sachs® Utilities Index, which the fund was compared with through September, and the new MSCI benchmark mentioned above, which the fund was compared with during the period's final five months1. During the same 12-month period, the fund also outpaced the S&P 500. The main contributor to the fund's outperformance of the Goldman Sachs index during the first seven months was positive security selection in and an overweighting of the integrated telecommunication services industry. An underweighting of and good stock picks in broadcasting and cable TV also helped. The principal detractor during that period was poor security selection in wireless telecom services and multi-utilities. Top performers included not owning broadcasting/cable TV provider and index component NTL, as well as investments in BellSouth, Qwest Communications and Level 3 Communications. Sprint Nextel, New Jersey-based electric utility Public Service Enterprise Group and Internet telecommunication services provider Vonage were detractors. During the last five months of the period, the fund slightly outperformed its new MSCI Utilities index due to strong security selection in electric utilities as well as positive stock selection in and an underweighting of multi-utilities stocks. Performance was held back by the fund's average cash position - which hurt returns in an up market - and declines among residual holdings in the telecommunications area that were acquired prior to the fund's restructuring on October 1, 2006, and which were not part of the new benchmark. Contributors during this time frame included independent power producer Constellation Energy Group, not owning electric utility and major index component Southern Company, and holdings in electric utilities FPL Group and Entergy. Oil and gas storage and transport company Spectra Energy detracted, as did a residual holding in Level 3 Communications and not owning independent power producer and index component Mirant. The telecom stocks mentioned here are no longer in the fund.
1 The fund's blended index is a customized index developed by Fidelity for the limited purpose of discussing the fund's performance for the 12-month period ending February 28, 2007. From March 1, 2006, through September 30, 2006, the fund compared its performance to the Goldman Sachs Utilities Index, which returned 8.34% during that period. On October 1, 2006, the fund began comparing its performance to a different index, the MSCI US Investable Market Utilities Index, which returned 14.61% from October 1, 2006, through February 28, 2007. For the 12-month period ending February 28, 2007, the blended index (Goldman Sachs and MSCI) returned 24.17%.
The views expressed above reflect those of the portfolio manager(s) only through the end of the period as stated on the cover of this report and do not necessarily represent the views of Fidelity or any other person in the Fidelity organization. Any such views are subject to change at any time based upon market or other conditions and Fidelity disclaims any responsibility to update such views. These views may not be relied on as investment advice and, because investment decisions for a Fidelity fund are based on numerous factors, may not be relied on as an indication of trading intent on behalf of any Fidelity fund.
Annual Report
Select Utilities Growth Portfolio
Shareholder Expense Example
As a shareholder of the Fund, you incur two types of costs: (1) transaction costs, including redemption fees, exchange fees, and (2) ongoing costs, including management fees and other Fund expenses. This Example is intended to help you understand your ongoing costs (in dollars) of investing in the Fund and to compare these costs with the ongoing costs of investing in other mutual funds.
The Example is based on an investment of $1,000 invested at the beginning of the period and held for the entire period (September 1, 2006 to February 28, 2007).
Actual Expenses
The first line of the accompanying table provides information about actual account values and actual expenses. You may use the information in this line, together with the amount you invested, to estimate the expenses that you paid over the period. Simply divide your account value by $1,000.00 (for example, an $8,600 account value divided by $1,000.00 = 8.6), then multiply the result by the number in the first line under the heading entitled "Expenses Paid During Period" to estimate the expenses you paid on your account during this period. A small balance maintenance fee of $12.00 that is charged once a year may apply for certain accounts with a value of less than $2,000. This fee is not included in the table below. If it was, the estimate of expenses you paid during the period would be higher, and your ending account value lower, by this amount.
Hypothetical Example for Comparison Purposes
The second line of the accompanying table provides information about hypothetical account values and hypothetical expenses based on the Fund's actual expense ratio and an assumed rate of return of 5% per year before expenses, which is not the Fund's actual return. The hypothetical account values and expenses may not be used to estimate the actual ending account balance or expenses you paid for the period. You may use this information to compare the ongoing costs of investing in the Fund and other funds. To do so, compare this 5% hypothetical example with the 5% hypothetical examples that appear in the shareholder reports of the other funds. A small balance maintenance fee of $12.00 that is charged once a year may apply for certain accounts with a value of less than $2,000. This fee is not included in the table below. If it was, the estimate of expenses you paid during the period would be higher, and your ending account value lower, by this amount.
Please note that the expenses shown in the table are meant to highlight your ongoing costs only and do not reflect any transaction costs. Therefore, the second line of the table is useful in comparing ongoing costs only, and will not help you determine the relative total costs of owning different funds. In addition, if these transactional costs were included, your costs would have been higher.
Beginning | Ending | Expenses Paid | |
Actual | $ 1,000.00 | $ 1,162.30 | $ 4.83 |
Hypothetical (5% return per year before expenses) | $ 1,000.00 | $ 1,020.33 | $ 4.51 |
* Expenses are equal to the Fund's annualized expense ratio of .90%; multiplied by the average account value over the period, multiplied by 181/365 (to reflect the one-half year period).
Annual Report
Select Utilities Growth Portfolio
Investment Changes
Top Ten Stocks as of February 28, 2007 | ||
% of fund's | % of fund's net assets | |
Exelon Corp. | 7.2 | 5.3 |
Constellation Energy Group, Inc. | 6.1 | 0.0 |
Entergy Corp. | 5.8 | 4.4 |
Sempra Energy | 4.8 | 2.1 |
AES Corp. | 4.6 | 3.7 |
TXU Corp. | 4.6 | 4.8 |
Public Service Enterprise Group, Inc. | 4.3 | 3.3 |
FPL Group, Inc. | 4.3 | 4.6 |
Duke Energy Corp. | 4.0 | 2.4 |
FirstEnergy Corp. | 3.8 | 0.3 |
49.5 | ||
Top Industries (% of fund's net assets) | |||
As of February 28, 2007 | |||
 | Electric Utilities | 45.7% | |
 | Multi-Utilities | 23.0% | |
 | Independent Power Producers & Energy Traders | 17.8% | |
 | Oil, Gas & Consumable Fuels | 3.7% | |
 | Gas Utilities | 3.1% | |
 | All Others* | 6.7% | |
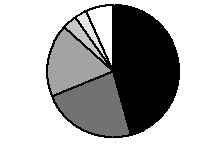
As of August 31, 2006 | |||
| Diversified Telecommunication Services | 40.2% | |
| Electric Utilities | 22.7% | |
| Wireless Telecommunication Services | 12.2% | |
| Multi-Utilities | 10.9% | |
| Independent Power Producers & Energy Traders | 10.3% | |
| All Others* | 3.7% | |
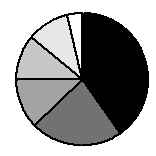
* Includes short-term investments and net other assets. |
Annual Report
Select Utilities Growth Portfolio
Investments February 28, 2007
Showing Percentage of Net Assets
Common Stocks - 93.6% | |||
Shares | Value | ||
ELECTRIC UTILITIES - 45.7% | |||
Electric Utilities - 45.7% | |||
Allegheny Energy, Inc. (a) | 261,000 | $ 12,329,640 | |
American Electric Power Co., Inc. | 677,000 | 30,370,220 | |
DPL, Inc. | 590,900 | 17,827,453 | |
Duke Energy Corp. | 1,607,000 | 31,641,830 | |
Edison International | 306,900 | 14,399,748 | |
Entergy Corp. | 466,700 | 46,063,290 | |
Exelon Corp. | 866,900 | 57,154,717 | |
FirstEnergy Corp. | 489,100 | 30,602,987 | |
FPL Group, Inc. | 579,700 | 34,242,879 | |
Great Plains Energy, Inc. | 80,500 | 2,502,745 | |
ITC Holdings Corp. | 51,400 | 2,256,974 | |
Northeast Utilities | 622,000 | 18,075,320 | |
Pepco Holdings, Inc. | 365,900 | 9,740,258 | |
Pinnacle West Capital Corp. | 85,200 | 4,040,184 | |
PPL Corp. | 457,400 | 17,390,348 | |
Progress Energy, Inc. | 257,300 | 12,571,678 | |
Reliant Energy, Inc. (a) | 435,400 | 7,362,614 | |
Sierra Pacific Resources (a) | 871,900 | 15,136,184 | |
363,709,069 | |||
ELECTRONIC EQUIPMENT & INSTRUMENTS - 0.3% | |||
Electronic Equipment & Instruments - 0.3% | |||
Itron, Inc. (a) | 33,700 | 2,177,694 | |
GAS UTILITIES - 3.1% | |||
Gas Utilities - 3.1% | |||
Equitable Resources, Inc. | 167,600 | 7,151,492 | |
ONEOK, Inc. | 101,500 | 4,228,490 | |
Questar Corp. | 95,900 | 8,069,026 | |
Southern Union Co. (d) | 181,600 | 5,320,880 | |
24,769,888 | |||
INDEPENDENT POWER PRODUCERS & ENERGY TRADERS - 17.8% | |||
Independent Power Producers & Energy Traders - 17.8% | |||
AES Corp. (a) | 1,735,598 | 37,002,949 | |
Constellation Energy Group, Inc. | 612,300 | 48,169,641 | |
Dynegy, Inc. Class A (a) | 193,300 | 1,586,993 | |
International Power PLC | 525,700 | 3,769,301 | |
NRG Energy, Inc. (d) | 222,300 | 14,725,152 | |
TXU Corp. | 551,100 | 36,455,265 | |
141,709,301 | |||
MULTI-UTILITIES - 23.0% | |||
Multi-Utilities - 23.0% | |||
Alliant Energy Corp. | 152,100 | 6,360,822 | |
Ameren Corp. | 181,700 | 9,490,191 | |
CenterPoint Energy, Inc. (d) | 570,100 | 10,170,584 | |
CMS Energy Corp. | 667,116 | 11,641,174 | |
Shares | Value | ||
DTE Energy Co. (d) | 199,200 | $ 9,222,960 | |
Integrys Energy Group, Inc. | 55,700 | 3,104,718 | |
MDU Resources Group, Inc. | 284,500 | 7,519,335 | |
PG&E Corp. (d) | 456,800 | 21,204,656 | |
Public Service Enterprise Group, Inc. | 462,400 | 34,633,760 | |
Puget Energy, Inc. | 211,000 | 5,205,370 | |
SCANA Corp. | 95,300 | 3,976,869 | |
Sempra Energy | 633,300 | 38,029,665 | |
Wisconsin Energy Corp. | 457,600 | 21,941,920 | |
182,502,024 | |||
OIL, GAS & CONSUMABLE FUELS - 3.7% | |||
Coal & Consumable Fuels - 0.6% | |||
Cameco Corp. | 140,900 | 5,210,487 | |
Oil & Gas Storage & Transport - 3.1% | |||
Spectra Energy Corp. | 952,700 | 24,512,971 | |
TOTAL OIL, GAS & CONSUMABLE FUELS | 29,723,458 | ||
TOTAL COMMON STOCKS (Cost $661,289,928) | 744,591,434 | ||
Money Market Funds - 11.3% | |||
Fidelity Cash Central Fund, 5.35% (b) | 45,773,016 | 45,773,016 | |
Fidelity Securities Lending Cash Central Fund, 5.34% (b)(c) | 44,103,350 | 44,103,350 | |
TOTAL MONEY MARKET FUNDS (Cost $89,876,366) | 89,876,366 | ||
TOTAL INVESTMENT PORTFOLIO - 104.9% (Cost $751,166,294) | 834,467,800 | ||
NET OTHER ASSETS - (4.9)% | (38,784,970) | ||
NET ASSETS - 100% | $ 795,682,830 | ||
Legend |
(a) Non-income producing |
(b) Affiliated fund that is available only to investment companies and other accounts managed by Fidelity Investments. The rate quoted is the annualized seven-day yield of the fund at period end. A complete unaudited listing of the fund's holdings as of its most recent quarter end is available upon request. |
(c) Investment made with cash collateral received from securities on loan. |
(d) Security or a portion of the security is on loan at period end. |
Affiliated Central Funds |
Information regarding fiscal year to date income earned by the Fund from investments in Fidelity Central Funds is as follows: |
Fund | Income earned |
Fidelity Cash Central Fund | $ 1,341,587 |
Fidelity Securities Lending Cash Central Fund | 54,465 |
Total | $ 1,396,052 |
Income Tax Information |
At February 28, 2007, the fund had a capital loss carryforward of approximately $54,429,916 all of which will expire on February 28, 2011. |
See accompanying notes which are an integral part of the financial statements.
Annual Report
Select Utilities Growth Portfolio
Financial Statements
Statement of Assets and Liabilities
February 28, 2007 | ||
Assets | ||
Investment in securities, at value (including securities loaned of $43,140,637) - See accompanying schedule: Unaffiliated issuers (cost $661,289,928) | $ 744,591,434 | |
Fidelity Central Funds (cost $89,876,366) | 89,876,366 | |
Total Investments (cost $751,166,294) | $ 834,467,800 | |
Receivable for fund shares sold | 6,342,882 | |
Dividends receivable | 2,731,065 | |
Distributions receivable from Fidelity Central Funds | 234,004 | |
Prepaid expenses | 1,464 | |
Other receivables | 11,214 | |
Total assets | 843,788,429 | |
Liabilities | ||
Payable for fund shares redeemed | 3,418,260 | |
Accrued management fee | 362,067 | |
Other affiliated payables | 175,765 | |
Other payables and accrued expenses | 46,157 | |
Collateral on securities loaned, at value | 44,103,350 | |
Total liabilities | 48,105,599 | |
Net Assets | $ 795,682,830 | |
Net Assets consist of: | ||
Paid in capital | $ 764,578,817 | |
Undistributed net investment income | 2,448,226 | |
Accumulated undistributed net realized gain (loss) on investments and foreign currency transactions | (54,645,719) | |
Net unrealized appreciation (depreciation) on investments | 83,301,506 | |
Net Assets, for 13,655,572 shares outstanding | $ 795,682,830 | |
Net Asset Value, offering price and redemption price per share ($795,682,830 ÷ 13,655,572 shares) | $ 58.27 | |
Statement of Operations
Year ended February 28, 2007 | ||
Investment Income | ||
Dividends | $ 12,086,935 | |
Interest | 248 | |
Income from Fidelity Central Funds | 1,396,052 | |
Total income | 13,483,235 | |
Expenses | ||
Management fee | $ 2,689,027 | |
Transfer agent fees | 1,336,717 | |
Accounting and security lending fees | 201,747 | |
Custodian fees and expenses | 18,950 | |
Independent trustees' compensation | 1,817 | |
Registration fees | 88,241 | |
Audit | 36,400 | |
Legal | 6,979 | |
Miscellaneous | 20,910 | |
Total expenses before reductions | 4,400,788 | |
Expense reductions | (15,555) | 4,385,233 |
Net investment income (loss) | 9,098,002 | |
Realized and Unrealized Gain (Loss) Net realized gain (loss) on: | ||
Investment securities: | ||
Unaffiliated issuers | 46,406,556 | |
Foreign currency transactions | (960) | |
Total net realized gain (loss) | 46,405,596 | |
Change in net unrealized appreciation (depreciation) on investment securities | 69,980,819 | |
Net gain (loss) | 116,386,415 | |
Net increase (decrease) in net assets resulting from operations | $ 125,484,417 | |
See accompanying notes which are an integral part of the financial statements.
Annual Report
Select Utilities Growth Portfolio
Financial Statements - continued
Statement of Changes in Net Assets
Year ended | Year ended | |
Increase (Decrease) in Net Assets | ||
Operations | ||
Net investment income (loss) | $ 9,098,002 | $ 5,521,599 |
Net realized gain (loss) | 46,405,596 | 62,384,092 |
Change in net unrealized appreciation (depreciation) | 69,980,819 | (16,994,242) |
Net increase (decrease) in net assets resulting from operations | 125,484,417 | 50,911,449 |
Distributions to shareholders from net investment income | (7,028,986) | (6,178,163) |
Share transactions Proceeds from sales of shares | 682,796,377 | 150,205,440 |
Reinvestment of distributions | 6,723,035 | 5,869,756 |
Cost of shares redeemed | (310,802,961) | (227,229,266) |
Net increase (decrease) in net assets resulting from share transactions | 378,716,451 | (71,154,070) |
Redemption fees | 140,020 | 60,121 |
Total increase (decrease) in net assets | 497,311,902 | (26,360,663) |
Net Assets | ||
Beginning of period | 298,370,928 | 324,731,591 |
End of period (including undistributed net investment income of $2,448,226 and undistributed net investment income of $315,700, respectively) | $ 795,682,830 | $ 298,370,928 |
Other Information Shares | ||
Sold | 13,101,641 | 3,527,344 |
Issued in reinvestment of distributions | 122,956 | 135,825 |
Redeemed | (5,993,779) | (5,348,558) |
Net increase (decrease) | 7,230,818 | (1,685,389) |
Financial Highlights
Years ended February 28, | 2007 | 2006 | 2005 | 2004 I | 2003 |
Selected Per-Share Data | |||||
Net asset value, beginning of period | $ 46.44 | $ 40.04 | $ 33.94 | $ 24.44 | $ 34.32 |
Income from Investment Operations | |||||
Net investment income (loss) C | 1.00 | .73 | .76 F, G | .43 | .44 |
Net realized and unrealized gain (loss) | 11.45 | 6.59 | 5.95 | 9.46 | (9.85) |
Total from investment operations | 12.45 | 7.32 | 6.71 | 9.89 | (9.41) |
Distributions from net investment income | (.64) | (.93) | (.62) | (.40) | (.48) |
Redemption fees added to paid in capital C | .02 | .01 | .01 | .01 | .01 |
Net asset value, end of period | $ 58.27 | $ 46.44 | $ 40.04 | $ 33.94 | $ 24.44 |
Total Return A, B | 26.95% | 18.48% | 19.90% | 40.71% | (27.55)% |
Ratios to Average Net Assets D, H | |||||
Expenses before reductions | .93% | .97% | 1.02% | 1.23% | 1.30% |
Expenses net of fee waivers, if any | .93% | .97% | 1.02% | 1.23% | 1.30% |
Expenses net of all reductions | .93% | .92% | .99% | 1.19% | 1.17% |
Net investment income (loss) | 1.93% | 1.71% | 2.06% F, G | 1.44% | 1.56% |
Supplemental Data | |||||
Net assets, end of period (000 omitted) | $ 795,683 | $ 298,371 | $ 324,732 | $ 207,044 | $ 161,359 |
Portfolio turnover rate E | 107% | 101% | 51% | 76% | 139% |
A Total returns would have been lower had certain expenses not been reduced during the periods shown. BTotal returns do not include the effect of the former sales charges. C Calculated based on average shares outstanding during the period. D Fees and expenses of the underlying Fidelity Central Funds are not included in the Fund's expense ratio. The Fund indirectly bears its proportionate share of the expenses of any underlying Fidelity Central Funds. E Amount does not include the portfolio activity of any underlying Fidelity Central Funds. F Investment income per share reflects a special dividend which amounted to $.22 per share. Excluding the special dividend, the ratio of net investment income (loss) to average net assets would have been 1.47%. GAs a result in the change in the estimate of the return of capital components of dividend income realized in the year ended February 29, 2004, net investment income per share and the ratio of net investment income to average net assets for the year ended February 28, 2005 have been reduced by $0.02 per share and .06%, respectively. The change in estimate has no impact on total net assets or total return of the fund. H Expense ratios reflect operating expenses of the Fund. Expenses before reductions do not reflect amounts reimbursed by the investment adviser or reductions from brokerage service arrangements or other expense offset arrangements and do not represent the amount paid by the Fund during periods when reimbursements or reductions occur. Expenses net of fee waivers reflect expenses after reimbursement by the investment adviser but prior to reductions from brokerage service arrangements or other expense offset arrangements. Expenses net of all reductions represent the net expenses paid by the Fund. I For the year ended February 29. |
See accompanying notes which are an integral part of the financial statements.
Annual Report
Notes to Financial Statements
For the period ended February 28, 2007
1. Organization.
Utilities Growth Portfolio (the Fund) is a non-diversified fund of Fidelity Select Portfolios (the trust) and is authorized to issue an unlimited number of shares. The trust is registered under the Investment Company Act of 1940, as amended (the 1940 Act), as an open-end management investment company organized as a Massachusetts business trust. The Fund invests primarily in securities of companies whose principal business activities fall within specific industries. The financial statements have been prepared in conformity with accounting principles generally accepted in the United States of America, which require management to make certain estimates and assumptions at the date of the financial statements.
2. Investments in Fidelity Central Funds.
The Fund may invest in Fidelity Central Funds which are open-end investment companies available only to other investment companies and accounts managed by FMR and its affiliates. The Fund's Schedule of Investments lists each of the Fidelity Central Funds as an investment of the Fund but does not include the underlying holdings of each Fidelity Central Fund. As an Investing Fund, the Fund indirectly bears its proportionate share of the expenses of the underlying Fidelity Central Funds. A complete unaudited list of holdings for each Fidelity Central Fund is available upon request. In addition, the financial statements of the Fidelity Central Funds, which are not covered by the Fund's Report of Independent Registered Public Accounting Firm, are available on the EDGAR Database on the SEC's web site, www.sec.gov, or upon request.
The Money Market Central Funds seek preservation of capital and current income and are managed by Fidelity Investments Money Management, Inc. (FIMM) an affiliate of Fidelity Management & Research Company (FMR).
3. Significant Accounting Policies.
The following summarizes the significant accounting policies of the Fund:
Security Valuation. Investments are valued and net asset value (NAV) per share is calculated (NAV calculation) as of the close of business of the New York Stock Exchange (NYSE), normally 4:00 p.m. Eastern time. During the period the Fund also calculated a NAV each hour on the hour (commencing at 10:00 a.m. Eastern time until one hour prior to the close of business on the NYSE). Effective October 1, 2006 the Fund eliminated hourly NAV calculation.
Wherever possible, the Fund uses independent pricing services approved by the Board of Trustees to value its investments. Equity securities, including restricted securities, for which market quotations are readily available, are valued at the last reported sale price or official closing price as reported by an independent pricing service on the primary market or exchange on which they are traded. In the event there were no sales during the day or closing prices are not available, securities are valued at the last quoted bid price. Investments in open-end mutual funds, including the Fidelity Central Funds, are valued at their closing net asset value each business day. Short-term securities with remaining maturities of sixty days or less for which quotations are not readily available are valued at amortized cost, which approximates value.
When current market prices or quotations are not readily available or do not accurately reflect fair value, valuations may be determined in accordance with procedures adopted by the Board of Trustees. For example, when developments occur between the close of a market and the close of the NYSE that may materially affect the value of some or all of the securities, or when trading in a security is halted, those securities may be fair valued. Factors used in the determination of fair value may include monitoring news to identify significant market or security specific events such as changes in the value of U.S. securities markets, reviewing developments in foreign markets and evaluating the performance of ADRs, futures contracts and exchange-traded funds. Because the Fund's utilization of fair value pricing depends on market activity, the frequency with which fair value pricing is used cannot be predicted and may be utilized to a significant extent. The value of securities used for NAV calculation under fair value pricing may differ from published prices for the same securities.
Foreign Currency. The Fund uses foreign currency contracts to facilitate transactions in foreign-denominated securities. Losses from these transactions may arise from changes in the value of the foreign currency or if the counterparties do not perform under the contracts' terms.
Foreign-denominated assets, including investment securities, and liabilities are translated into U.S. dollars at the exchange rate at period end. Purchases and sales of investment securities, income and dividends received and expenses denominated in foreign currencies are translated into U.S. dollars at the exchange rate in effect on the transaction date.
The effects of exchange rate fluctuations on investments are included with the net realized and unrealized gain (loss) on investment securities. Other foreign currency transactions resulting in realized and unrealized gain (loss) are disclosed separately.
Investment Transactions and Income. For financial reporting purposes, the Fund's investment holdings and NAV include trades executed through the end of the last business day of the period. The NAV for processing shareholder transactions includes trades executed through the end of the prior business day. Gains and losses on securities sold are determined on the basis of identified cost and may include proceeds received from litigation. Dividend income is recorded on the ex-dividend date, except for certain dividends from foreign securities where the ex-dividend date may have passed,
Annual Report
Notes to Financial Statements - continued
3. Significant Accounting Policies - continued
Investment Transactions and Income - continued
which are recorded as soon as the Fund is informed of the ex-dividend date. Non-cash dividends included in dividend income, if any, are recorded at the fair market value of the securities received. Distributions received on securities that represent a return of capital or capital gain are recorded as a reduction of cost of investments and/or as a realized gain. The Fund estimates the components of distributions received that may be considered return of capital distributions or capital gain distributions. Interest income and distributions from the Fidelity Central Funds are accrued as earned, with any distributions receivable as of period end included in Distributions receivable from Fidelity Central Funds on the Statement of Assets and Liabilities. Interest income includes coupon interest and amortization of premium and accretion of discount on debt securities. Investment income is recorded net of foreign taxes withheld where recovery of such taxes is uncertain.
Expenses. Most expenses of the trust can be directly attributed to a fund. Expenses which cannot be directly attributed are apportioned among each Fund in the trust. Expense estimates are accrued in the period to which they relate and adjustments are made when actual amounts are known.
Income Tax Information and Distributions to Shareholders. Each year, the Fund intends to qualify as a regulated investment company by distributing all of its taxable income and realized gains under Subchapter M of the Internal Revenue Code. As a result, no provision for income taxes is required in the accompanying financial statements. Foreign taxes are provided for based on the Fund's understanding of the tax rules and rates that exist in the foreign markets in which it invests.
Distributions are recorded on the ex-dividend date. Income and capital gain distributions are determined in accordance with income tax regulations, which may differ from generally accepted accounting principles.
Capital accounts within the financial statements are adjusted for permanent book-tax differences. These adjustments have no impact on net assets or the results of operations. Temporary book-tax differences will reverse in a subsequent period.
Book-tax differences are primarily due to foreign currency transactions, deferred trustees compensation, capital loss carryforwards and losses deferred due to wash sales.
The tax-basis components of distributable earnings and the federal tax cost as of period end were as follows:
Unrealized appreciation | $ 84,309,862 |
Unrealized depreciation | (1,224,159) |
Net unrealized appreciation (depreciation) | 83,085,703 |
Undistributed ordinary income | 2,449,536 |
Capital loss carryforward | (54,429,916) |
Cost for federal income tax purposes | $ 751,382,097 |
The tax character of distributions paid was as follows:
February 28, 2007 | February 28, 2006 | |
Ordinary Income | $ 7,028,986 | $ 6,178,163 |
Trading (Redemption) Fees. Shares in the Fund held less than 30 days are subject to a redemption fee equal to .75% of the net asset value of shares redeemed. All redemption fees, including any estimated redemption fees paid by FMR, are retained by the Fund and accounted for as an addition to paid in capital. Shareholders were also subject to an additional $7.50 fee for shares exchanged into another Fidelity fund (see Note 6).
New Accounting Pronouncements. In July 2006, Financial Accounting Standards Board Interpretation No. 48, Accounting for Uncertainty in Income Taxes - an interpretation of FASB Statement 109 (FIN 48), was issued and is effective on the last business day of the semiannual reporting period for fiscal years beginning after December 15, 2006. FIN 48 sets forth a threshold for financial statement recognition, measurement and disclosure of a tax position taken or expected to be taken on a tax return. Management is currently evaluating the impact, if any, the adoption of FIN 48 will have on the Fund's net assets, results of operations and financial statement disclosures.
In addition, in September 2006, Statement of Financial Accounting Standards No. 157, Fair Value Measurements (SFAS 157), was issued and is effective for fiscal years beginning after November 15, 2007. SFAS 157 defines fair value, establishes a framework for measuring fair value and expands disclosures about fair value measurements. Management is currently evaluating the impact the adoption of SFAS 157 will have on the Fund's financial statement disclosures.
Annual Report
4. Operating Policies.
Repurchase Agreements. FMR has received an Exemptive Order from the Securities and Exchange Commission (the SEC) which permits the Fund and other affiliated entities of FMR to transfer uninvested cash balances into joint trading accounts which are then invested in repurchase agreements. The Fund may also invest directly with institutions in repurchase agreements. Repurchase agreements are collateralized by government or non-government securities. Upon settlement date, collateral is held in segregated accounts with custodian banks and may be obtained in the event of a default of the counterparty. The Fund monitors, on a daily basis, the value of the collateral to ensure it is at least equal to the principal amount of the repurchase agreement (including accrued interest). In the event of a default by the counterparty, realization of the collateral proceeds could be delayed, during which time the value of the collateral may decline.
5. Purchases and Sales of Investments.
Purchases and sales of securities, other than short-term securities, aggregated $831,729,600 and $493,005,521, respectively.
6. Fees and Other Transactions with Affiliates.
Management Fee. FMR and its affiliates provide the Fund with investment management related services for which the Fund pays a monthly management fee. The management fee is the sum of an individual fund fee rate that is based on an annual rate of .30% of the Fund's average net assets and a group fee rate that averaged .26% during the period. The group fee rate is based upon the average net assets of all the mutual funds advised by FMR. The group fee rate decreases as assets under management increase and increases as assets under management decrease. For the period, the total annual management fee rate was .57% of the Fund's average net assets.
Transfer Agent Fees. Fidelity Service Company, Inc. (FSC), an affiliate of FMR, is the Fund's transfer, dividend disbursing and shareholder servicing agent. FSC receives account fees and asset-based fees that vary according to account size and type of account. FSC pays for typesetting, printing and mailing of shareholder reports, except proxy statements. For the period the transfer agent fees were equivalent to an annual rate of ..28% of average net assets.
Accounting and Security Lending Fees. FSC maintains the Fund's accounting records. The accounting fee is based on the level of average net assets for the month. Under a separate contract, FSC administers the security lending program. The security lending fee is based on the number and duration of lending transactions.
Exchange Fees. During the period, FSC received the proceeds of a $7.50 fee to cover administrative costs associated with exchanges out of the Fund to any other Fidelity Select fund or to any other Fidelity fund made through non-automated channels. Effective October 1, 2006, the exchange fees were eliminated. For the period, exchange fees retained by FSC were as follows:
Retained | |
Utilities Growth Portfolio | $ 1,650 |
Brokerage Commissions. The Fund placed a portion of its portfolio transactions with brokerage firms which are affiliates of the investment adviser. The commissions paid to these affiliated firms were $3,439 for the period.
7. Committed Line of Credit.
The Fund participates with other funds managed by FMR in a $4.2 billion credit facility (the "line of credit") to be utilized for temporary or emergency purposes to fund shareholder redemptions or for other short-term liquidity purposes. The Fund has agreed to pay commitment fees on its pro rata portion of the line of credit, which amounted to $1,039 and is reflected in Miscellaneous Expense on the Statement of Operations. During the period, there were no borrowings on this line of credit.
8. Security Lending.
The Fund lends portfolio securities from time to time in order to earn additional income. On the settlement date of the loan, the Fund receives collateral (in the form of U.S. Treasury obligations, letters of credit and/or cash) against the loaned securities and maintains collateral in an amount not less than 100% of the market value of the loaned securities during the period of the loan. The market value of the loaned securities is determined at the close of business of the Fund and any additional required collateral is delivered to the Fund on the next business day. If the borrower defaults on its obligation to return the securities loaned because of insolvency or other reasons, a fund could experience delays and costs in recovering the securities loaned or in gaining access to the collateral. Any cash collateral received is invested in the Fidelity Securities Lending Cash Central Fund. The value of loaned securities and cash collateral at period end are disclosed on the Fund's Statement of Assets and Liabilities. Security lending income represents the income earned on investing cash collateral, less fees and expenses associated with the loan, plus any premium payments that may be received on
Annual Report
Notes to Financial Statements - continued
8. Security Lending - continued
the loan of certain types of securities. Security lending income is presented in the Statement of Operations as a component of income from Fidelity Central Funds. Net income from lending portfolio securities during the period amounted to $54,465.
9. Expense Reductions.
Through arrangements with the Fund's custodian and transfer agent, credits realized as a result of uninvested cash balances were used to reduce the Fund's expenses. During the period, these credits reduced the Fund's custody and transfer agent expenses by $797 and $9,216, respectively.
10. Other.
The Fund's organizational documents provide former and current trustees and officers with a limited indemnification against liabilities arising in connection with the performance of their duties to the Fund. In the normal course of business, the Fund may also enter into contracts that provide general indemnifications. The Fund's maximum exposure under these arrangements is unknown as this would be dependent on future claims that may be made against the Fund. The risk of material loss from such claims is considered remote.
The United States Securities and Exchange Commission ("SEC") is conducting an investigation of FMR (covering the years 2002 to 2004) arising from gifts, gratuities and business entertainment provided by certain brokers to certain individuals who were employed on FMR's domestic equity trading desk during that period. FMR is in discussions with the SEC staff regarding the possible resolution of the matter, but as of period-end no final resolution has been reached.
In December 2006, the Independent Trustees completed their own investigation of the matter with the assistance of independent counsel. The Independent Trustees and FMR agree that, despite the absence of proof that the Fidelity mutual funds experienced diminished execution quality as a result of the improper receipt of gifts and business entertainment, the conduct at issue was serious and is worthy of redress. Accordingly, the Independent Trustees have requested and FMR has agreed to pay $42 million to Fidelity mutual funds, plus interest to be determined at the time that payment is made. A method of allocating this payment among the funds has not yet been determined. The total payment to the Fund is not anticipated to have a material impact on the Fund's net assets. In addition, FMR reimbursed related legal expenses which are recorded in the accompanying Statement of Operations as an expense reduction.
Annual Report
Report of Independent Registered Public Accounting Firm
To the Trustees of Fidelity Select Portfolios and the Shareholders of Utilities Growth Portfolio:
In our opinion, the accompanying statement of assets and liabilities, including the schedule of investments, and the related statements of operations and of changes in net assets and the financial highlights present fairly, in all material respects, the financial position of Utilities Growth Portfolio (a fund of Fidelity Select Portfolios) at February 28, 2007, the results of its operations for the year then ended, the changes in its net assets for each of the two years in the period then ended and the financial highlights for each of the five years in the period then ended, in conformity with accounting principles generally accepted in the United States of America. These financial statements and financial highlights (hereafter referred to as "financial statements") are the responsibility of the Utilities Growth Portfolio's management. Our responsibility is to express an opinion on these financial statements based on our audits. We conducted our audits of these financial statements in accordance with the standards of the Public Company Accounting Oversight Board (United States). Those standards require that we plan and perform the audit to obtain reasonable assurance about whether the financial statements are free of material misstatement. An audit includes examining, on a test basis, evidence supporting the amounts and disclosures in the financial statements, assessing the accounting principles used and significant estimates made by management, and evaluating the overall financial statement presentation. We believe that our audits, which included confirmation of securities at February 28, 2007 by correspondence with the custodian and brokers, provide a reasonable basis for our opinion.
/s/PricewaterhouseCoopers LLP
PricewaterhouseCoopers LLP
Boston, Massachusetts
April 20, 2007
Annual Report
Trustees and Officers
The Trustees, Member of the Advisory Board, and executive officers of the trust and fund, as applicable, are listed below. The Board of Trustees governs the fund and is responsible for protecting the interests of shareholders. The Trustees are experienced executives who meet periodically throughout the year to oversee the fund's activities, review contractual arrangements with companies that provide services to the fund, and review the fund's performance. Each of the Trustees oversees 349 funds advised by FMR or an affiliate.
The Trustees hold office without limit in time except that (a) any Trustee may resign; (b) any Trustee may be removed by written instrument, signed by at least two-thirds of the number of Trustees prior to such removal; (c) any Trustee who requests to be retired or who has become incapacitated by illness or injury may be retired by written instrument signed by a majority of the other Trustees; and (d) any Trustee may be removed at any special meeting of shareholders by a two-thirds vote of the outstanding voting securities of the trust. Each Trustee who is not an interested person (as defined in the 1940 Act) (Independent Trustee), shall retire not later than the last day of the calendar year in which his or her 72nd birthday occurs. The Independent Trustees may waive this mandatory retirement age policy with respect to individual Trustees. The executive officers and Advisory Board Member hold office without limit in time, except that any officer and Advisory Board Member may resign or may be removed by a vote of a majority of the Trustees at any regular meeting or any special meeting of the Trustees. Except as indicated, each individual has held the office shown or other offices in the same company for the past five years.
The fund's Statement of Additional Information (SAI) includes more information about the Trustees. To request a free copy, call Fidelity at 1-800-544-8544.
Interested Trustees*:
Correspondence intended for each Trustee who is an interested person may be sent to Fidelity Investments, 82 Devonshire Street, Boston, Massachusetts 02109.
Name, Age; Principal Occupation | |
Edward C. Johnson 3d (76) | |
Year of Election or Appointment: 1980 Mr. Johnson is Chairman of the Board of Trustees. Mr. Johnson serves as President (2006-present), Chief Executive Officer, Chairman, and a Director of FMR Corp.; Chairman and a Director of FMR; Chairman and a Director of Fidelity Research & Analysis Company (FRAC); Chairman and a Director of Fidelity Investments Money Management, Inc.; and Chairman (2001- present) and a Director of FMR Co., Inc. In addition, Mr. Johnson serves as Chairman and Director of Fidelity International Limited (FIL). | |
Robert L. Reynolds (54) | |
Year of Election or Appointment: 2003 Mr. Reynolds is President and a Director of FMR (2005-present), Fidelity Investments Money Management, Inc. (2005-present), and FMR Co., Inc. (2005-present). Mr. Reynolds also serves as Vice Chairman (2006-present), a Director (2003-present), and Chief Operating Officer of FMR Corp. and a Director of Strategic Advisers, Inc. (2005-present). He also serves on the Board at Fidelity Investments Canada, Ltd. | |
* Trustees have been determined to be "Interested Trustees" by virtue of, among other things, their affiliation with the trust or various entities under common control with FMR.
Independent Trustees:
Correspondence intended for each Independent Trustee (that is, the Trustees other than the Interested Trustees) may be sent to Fidelity Investments, P.O. Box 55235, Boston, Massachusetts 02205-5235.
Name, Age; Principal Occupation | |
Dennis J. Dirks (58) | |
Year of Election or Appointment: 2005 Prior to his retirement in May 2003, Mr. Dirks was Chief Operating Officer and a member of the Board of The Depository Trust & Clearing Corporation (DTCC) (1999-2003). He also served as President, Chief Operating Officer, and Board member of The Depository Trust Company (DTC) (1999-2003) and President and Board member of the National Securities Clearing Corporation (NSCC) (1999-2003). In addition, Mr. Dirks served as Chief Executive Officer and Board member of the Government Securities Clearing Corporation (2001-2003) and Chief Executive Officer and Board member of the Mortgage-Backed Securities Clearing Corporation (2001-2003). Mr. Dirks also serves as a Trustee and a member of the Finance Committee of Manhattan College (2005-present) and a Trustee and a member of the Finance Committee of AHRC of Nassau County (2006-present). | |
Albert R. Gamper, Jr. (64) | |
Year of Election or Appointment: 2006 Prior to his retirement in December 2004, Mr. Gamper served as Chairman of the Board of CIT Group Inc. (commercial finance). During his tenure with CIT Group Inc. Mr. Gamper served in numerous senior management positions, including Chairman (1987-1989; 1999-2001; 2002-2004), Chief Executive Officer (1987-2004), and President (1989-2002). He currently serves as a member of the Board of Directors of Public Service Enterprise Group (utilities, 2001-present), Chairman of the Board of Governors, Rutgers University (2004-present), and Chairman of the Board of Saint Barnabas Health Care System. | |
George H. Heilmeier (70) | |
Year of Election or Appointment: 2004 Dr. Heilmeier is Chairman Emeritus of Telcordia Technologies (communication software and systems), where prior to his retirement, he served as company Chairman and Chief Executive Officer. He currently serves on the Boards of Directors of The Mitre Corporation (systems engineering and information technology support for the government), and HRL Laboratories (private research and development, 2004-present). He is Chairman of the General Motors Science & Technology Advisory Board and a Life Fellow of the Institute of Electrical and Electronics Engineers (IEEE). Dr. Heilmeier is a member of the Defense Science Board and the National Security Agency Advisory Board. He is also a member of the National Academy of Engineering, the American Academy of Arts and Sciences, and the Board of Overseers of the School of Engineering and Applied Science of the University of Pennsylvania. Previously, Dr. Heilmeier served as a Director of TRW Inc. (automotive, space, defense, and information technology, 1992-2002), Compaq (1994-2002), Automatic Data Processing, Inc. (ADP) (technology-based business outsourcing, 1995-2002), INET Technologies Inc. (telecommunications network surveillance, 2001-2004), and Teletech Holdings (customer management services). He is the recipient of the 2005 Kyoto Prize in Advanced Technology for his invention of the liquid crystal display, and a member of the Consumer Electronics Hall of Fame. | |
James H. Keyes (66) | |
Year of Election or Appointment: 2007 Prior to his retirement in 2003, Mr. Keyes was Chairman, President, and Chief Executive Officer of Johnson Controls, Inc. (automotive supplier, 1993-2003). He currently serves as a member of the boards of LSI Logic Corporation (semiconductor technologies), Navistar International Corporation (manufacture and sale of trucks, buses, and diesel engines, 2002-present), and Pitney Bowes, Inc. (integrated mail, messaging, and document management solutions). | |
Marie L. Knowles (60) | |
Year of Election or Appointment: 2001 Prior to Ms. Knowles' retirement in June 2000, she served as Executive Vice President and Chief Financial Officer of Atlantic Richfield Company (ARCO) (diversified energy, 1996-2000). From 1993 to 1996, she was a Senior Vice President of ARCO and President of ARCO Transportation Company. She served as a Director of ARCO from 1996 to 1998. She currently serves as a Director of Phelps Dodge Corporation (copper mining and manufacturing) and McKesson Corporation (healthcare service, 2002-present). Ms. Knowles is a Trustee of the Brookings Institution and the Catalina Island Conservancy and also serves as a member of the Advisory Board for the School of Engineering of the University of Southern California. | |
Ned C. Lautenbach (63) | |
Year of Election or Appointment: 2000 Mr. Lautenbach is Chairman of the Independent Trustees (2006-present). Mr. Lautenbach has been a partner of Clayton, Dubilier & Rice, Inc. (private equity investment firm) since September 1998. Previously, Mr. Lautenbach was with the International Business Machines Corporation (IBM) from 1968 until his retirement in 1998. Mr. Lautenbach serves as a Director of Sony Corporation (2006-present) and Eaton Corporation (diversified industrial) as well as the Philharmonic Center for the Arts in Naples, Florida. He also is a member of the Board of Trustees of Fairfield University (2005-present), as well as a member of the Council on Foreign Relations. | |
Cornelia M. Small (62) | |
Year of Election or Appointment: 2005 Ms. Small is a member (2000-present) and Chairperson (2002-present) of the Investment Committee, and a member (2002- present) of the Board of Trustees of Smith College. Previously, she served as Chief Investment Officer (1999-2000), Director of Global Equity Investments (1996-1999), and a member of the Board of Directors of Scudder, Stevens & Clark (1990-1997) and Scudder Kemper Investments (1997-1999). In addition, Ms. Small served as Co-Chair (2000-2003) of the Annual Fund for the Fletcher School of Law and Diplomacy. | |
William S. Stavropoulos (67) | |
Year of Election or Appointment: 2001 Mr. Stavropoulos is Chairman Emeritus of the Board of Directors of The Dow Chemical Company. Since joining The Dow Chemical Company in 1967, Mr. Stavropoulos served in numerous senior management positions, including President (1993-2000; 2002-2003), CEO (1995-2000; 2002-2004), and Chairman of the Executive Committee (2000-2004). Currently, he is a Director of NCR Corporation (data warehousing and technology solutions), Chemical Financial Corporation, Maersk Inc. (industrial conglomerate, 2002-present), Tyco International, Inc. (multinational manufacturing and services, 2007-present), and a member of the Advisory Board for Metalmark Capital (private equity investment firm, 2005-present). He is a special advisor to Clayton, Dubilier & Rice, Inc., a private equity investment firm. He also serves as a member of the Board of Trustees of the American Enterprise Institute for Public Policy Research. In addition, Mr. Stavropoulos is a member of The Business Council, J.P. Morgan International Council and the University of Notre Dame Advisory Council for the College of Science. | |
Kenneth L. Wolfe (68) | |
Year of Election or Appointment: 2005 Prior to his retirement in 2001, Mr. Wolfe was Chairman and Chief Executive Officer of Hershey Foods Corporation (1993-2001). He currently serves as a member of the boards of Adelphia Communications Corporation (2003-present), Bausch & Lomb, Inc., and Revlon Inc. (2004-present). | |
Advisory Board Member and Executive Officers:
Correspondence intended for each executive officer and Mr. Lynch may be sent to Fidelity Investments, 82 Devonshire Street, Boston, Massachusetts 02109.
Name, Age; Principal Occupation | |
Peter S. Lynch (63) | |
Year of Election or Appointment: 2003 Member of the Advisory Board of Fidelity Select Portfolios. Mr. Lynch is Vice Chairman and a Director of FMR, and Vice Chairman (2001-present) and a Director of FMR Co., Inc. Previously, Mr. Lynch served as a Trustee of the Fidelity funds (1990-2003). In addition, he serves as a Trustee of Boston College and as the Chairman of the Inner-City Scholarship Fund. | |
Kimberley H. Monasterio (43) | |
Year of Election or Appointment: 2007 President and Treasurer of Select Utilities Growth Portfolio. Ms. Monasterio also serves as President and Treasurer of other Fidelity funds (2007-present) and is an employee of FMR (2004-present). Previously, Ms. Monasterio served as Deputy Treasurer of the Fidelity funds (2004-2006). Before joining Fidelity Investments, Ms. Monasterio served as Treasurer (2000-2004) and Chief Financial Officer (2002-2004) of the Franklin Templeton Funds and Senior Vice President of Franklin Templeton Services, LLC (2000-2004). | |
Boyce I. Greer (51) | |
Year of Election or Appointment: 2005 Vice President of Select Utilities Growth Portfolio. Mr. Greer also serves as Vice President of certain Equity Funds (2005-present), certain Asset Allocation Funds (2005-present), Fixed-Income Funds (2006-present), and Money Market Funds (2006-present). Mr. Greer is also a Trustee of other investment companies advised by FMR (2003-present). He is an Executive Vice President of FMR (2005-present) and FMR Co., Inc. (2005-present), and Senior Vice President of Fidelity Investments Money Management, Inc. (2006-present). Previously, Mr. Greer served as a Director and Managing Director of Strategic Advisers, Inc. (2002-2005), and Executive Vice President (2000-2002) and Money Market Group Leader (1997-2002) of the Fidelity Investments Fixed Income Division. He also served as Vice President of Fidelity's Money Market Funds (1997-2002), Senior Vice President of FMR (1997-2002), and Vice President of FIMM (1998-2002). | |
Eric D. Roiter (58) | |
Year of Election or Appointment: 1998 Secretary of Select Utilities Growth Portfolio. He also serves as Secretary of other Fidelity funds; Vice President, General Counsel, and Secretary of FMR Co., Inc. (2001-present) and FMR; Assistant Secretary of Fidelity Management & Research (U.K.) Inc. (2001-present), Fidelity Research & Analysis Company (2001-present), and Fidelity Investments Money Management, Inc. (2001-present). Mr. Roiter is an Adjunct Member, Faculty of Law, at Boston College Law School (2003-present). Previously, Mr. Roiter served as Vice President and Secretary of Fidelity Distributors Corporation (FDC) (1998-2005). | |
Scott C. Goebel (39) | |
Year of Election or Appointment: 2007 Assistant Secretary of Select Utilities Growth Portfolio. Mr. Goebel also serves as Assistant Secretary of other Fidelity funds (2007-present), Vice President and Secretary of FDC (2006-present), and is an employee of FMR. | |
R. Stephen Ganis (40) | |
Year of Election or Appointment: 2006 Anti-Money Laundering (AML) officer of Select Utilities Growth Portfolio. Mr. Ganis also serves as AML officer of other Fidelity funds (2006-present) and FMR Corp. (2003-present). Before joining Fidelity Investments, Mr. Ganis practiced law at Goodwin Procter, LLP (2000-2002). | |
Joseph B. Hollis (58) | |
Year of Election or Appointment: 2006 Chief Financial Officer of Select Utilities Growth Portfolio. Mr. Hollis also serves as Chief Financial Officer of other Fidelity funds. Mr. Hollis is President of Fidelity Pricing and Cash Management Services (FPCMS) (2005-present). Mr. Hollis also serves as President and Director of Fidelity Service Company, Inc. (2006-present). Previously, Mr. Hollis served as Senior Vice President of Cash Management Services (1999-2002) and Investment Management Operations (2002-2005). | |
Kenneth A. Rathgeber (59) | |
Year of Election or Appointment: 2004 Chief Compliance Officer of Select Utilities Growth Portfolio. Mr. Rathgeber also serves as Chief Compliance Officer of other Fidelity funds (2004-present) and Executive Vice President of Risk Oversight for Fidelity Investments (2002-present). He is Chief Compliance Officer of FMR (2005-present), FMR Co., Inc. (2005-present), Fidelity Management & Research (U.K.) Inc. (2005-present), Fidelity Research & Analysis Company (2005-present), Fidelity Investments Money Management, Inc. (2005- present), and Strategic Advisers, Inc. (2005-present). Previously, Mr. Rathgeber served as Executive Vice President and Chief Operating Officer for Fidelity Investments Institutional Services Company, Inc. (1998-2002). | |
Bryan A. Mehrmann (45) | |
Year of Election or Appointment: 2005 Deputy Treasurer of Select Utilities Growth Portfolio. Mr. Mehrmann also serves as Deputy Treasurer of other Fidelity funds (2005-present) and is an employee of FMR. Previously, Mr. Mehrmann served as Vice President of Fidelity Investments Institutional Services Group (FIIS)/Fidelity Investments Institutional Operations Corporation, Inc. (FIIOC) Client Services (1998-2004). | |
Kenneth B. Robins (37) | |
Year of Election or Appointment: 2005 Deputy Treasurer of Select Utilities Growth Portfolio. Mr. Robins also serves as Deputy Treasurer of other Fidelity funds (2005- present) and is an employee of FMR (2004-present). Before joining Fidelity Investments, Mr. Robins worked at KPMG LLP, where he was a partner in KPMG's department of professional practice (2002-2004) and a Senior Manager (1999-2000). In addition, Mr. Robins served as Assistant Chief Accountant, United States Securities and Exchange Commission (2000-2002). | |
Robert G. Byrnes (40) | |
Year of Election or Appointment: 2005 Assistant Treasurer of Select Utilities Growth Portfolio. Mr. Byrnes also serves as Assistant Treasurer of other Fidelity funds (2005-present) and is an employee of FMR (2005-present). Previously, Mr. Byrnes served as Vice President of FPCMS (2003-2005). Before joining Fidelity Investments, Mr. Byrnes worked at Deutsche Asset Management where he served as Vice President of the Investment Operations Group (2000-2003). | |
Peter L. Lydecker (53) | |
Year of Election or Appointment: 2004 Assistant Treasurer of Select Utilities Growth Portfolio. Mr. Lydecker also serves as Assistant Treasurer of other Fidelity funds (2004) and is an employee of FMR. | |
Gary W. Ryan (48) | |
Year of Election or Appointment: 2005 Assistant Treasurer of Select Utilities Growth Portfolio. Mr. Ryan also serves as Assistant Treasurer of other Fidelity funds (2005-present) and is an employee of FMR (2005-present). Previously, Mr. Ryan served as Vice President of Fund Reporting in FPCMS (1999-2005). | |
Salvatore Schiavone (41) | |
Year of Election or Appointment: 2005 Assistant Treasurer of Select Utilities Growth Portfolio. Mr. Schiavone also serves as Assistant Treasurer of other Fidelity funds (2005-present) and is an employee of FMR (2005-present). Before joining Fidelity Investments, Mr. Schiavone worked at Deutsche Asset Management, where he most recently served as Assistant Treasurer (2003-2005) of the Scudder Funds and Vice President and Head of Fund Reporting (1996-2003). | |
Annual Report
Distributions
Select Utilities Growth designates 100% of the dividends distributed in April 2006 and December 2006, respectively, as qualifying for the dividends-received deduction for corporate shareholders.
The fund designates 100% of the dividends distributed in April 2006 and December 2006, respectively, as amounts which may be taken into account as a dividend for the purposes of the maximum rate under section 1(h)(11) of the Internal Revenue Code.
The fund will notify shareholders in January 2008 of amounts for use in preparing 2007 income tax returns.
Annual Report
Proxy Voting Results
A special meeting of Fidelity Select Portfolios' shareholders was held on September 20, 2006. The results of votes taken among shareholders on the proposal before them are reported below. Each vote reported represents one dollar of net asset value held on the record date for the meeting.
PROPOSAL 1 | ||
To elect a Board of Trustees. A | ||
# of | % of | |
Dennis J. Dirks | ||
Affirmative | 13,182,341,755.09 | 94.980 |
Withheld | 696,736,162.41 | 5.020 |
TOTAL | 13,879,077,917.50 | 100.000 |
Albert R. Gamper, Jr. | ||
Affirmative | 13,177,593,614.43 | 94.946 |
Withheld | 701,484,303.07 | 5.054 |
TOTAL | 13,879,077,917.50 | 100.000 |
Robert M. Gates | ||
Affirmative | 13,141,235,622.81 | 94.684 |
Withheld | 737,842,294.69 | 5.316 |
TOTAL | 13,879,077,917.50 | 100.000 |
George H. Heilmeier | ||
Affirmative | 13,140,073,210.00 | 94.675 |
Withheld | 739,004,707.50 | 5.325 |
TOTAL | 13,879,077,917.50 | 100.000 |
Edward C. Johnson 3d | ||
Affirmative | 13,106,284,587.54 | 94.432 |
Withheld | 772,793,329.96 | 5.568 |
TOTAL | 13,879,077,917.50 | 100.000 |
Stephen P. Jonas | ||
Affirmative | 13,168,282,872.88 | 94.879 |
Withheld | 710,795,044.62 | 5.121 |
TOTAL | 13,879,077,917.50 | 100.000 |
James H. KeyesB | ||
Affirmative | 13,164,603,089.66 | 94.852 |
Withheld | 714,474,827.84 | 5.148 |
TOTAL | 13,879,077,917.50 | 100.000 |
Marie L. Knowles | ||
Affirmative | 13,169,356,779.66 | 94.886 |
Withheld | 709,721,137.84 | 5.114 |
TOTAL | 13,879,077,917.50 | 100.000 |
Ned C. Lautenbach | ||
Affirmative | 13,166,485,155.52 | 94.866 |
Withheld | 712,592,761.98 | 5.134 |
TOTAL | 13,879,077,917.50 | 100.000 |
William O. McCoy | ||
Affirmative | 13,129,548,996.59 | 94.600 |
Withheld | 749,528,920.91 | 5.400 |
TOTAL | 13,879,077,917.50 | 100.000 |
Robert L. Reynolds | ||
Affirmative | 13,180,813,649.06 | 94.969 |
Withheld | 698,264,268.44 | 5.031 |
TOTAL | 13,879,077,917.50 | 100.000 |
# of | % of | |
Cornelia M. Small | ||
Affirmative | 13,170,500,616.42 | 94.895 |
Withheld | 708,577,301.08 | 5.105 |
TOTAL | 13,879,077,917.50 | 100.000 |
William S. Stavropoulos | ||
Affirmative | 13,143,284,328.22 | 94.699 |
Withheld | 735,793,589.28 | 5.301 |
TOTAL | 13,879,077,917.50 | 100.000 |
Kenneth L. Wolfe | ||
Affirmative | 13,162,946,758.47 | 94.840 |
Withheld | 716,131,159.03 | 5.160 |
TOTAL | 13,879,077,917.50 | 100.000 |
A Denotes trust-wide proposal and voting results. B Effective on or about January 1, 2007. | ||
Annual Report
Managing Your Investments
Fidelity offers several ways to conveniently manage your personal investments via your telephone or PC. You can access your account information, conduct trades and research your investments 24 hours a day.
By Phone
Fidelity Automated Service Telephone provides a single toll-free number to access account balances, positions, quotes and trading. It's easy to navigate the service, and on your first call, the system will help you create a personal identification number (PIN) for security.
(phone_graphic)Fidelity Automated Service Telephone (FAST®)
1-800-544-5555
Press
1 For mutual fund and brokerage trading.
2 For quotes.*
3 For account balances and holdings.
4 To review orders and mutual fund activity.
5 To change your PIN.
*0 To speak to a Fidelity representative.
By PC
Fidelity's web site on the Internet provides a wide range of information, including daily financial news, fund performance, interactive planning tools and news about Fidelity products and services.
(computer_graphic)Fidelity's Web Site
www.fidelity.com
* When you call the quotes line, please remember that a fund's yield and return will vary and, except for money market funds, share price will also vary. This means that you may have a gain or loss when you sell your shares. There is no assurance that money market funds will be able to maintain a stable $1 share price; an investment in a money market fund is not insured or guaranteed by the U.S. government. Total returns are historical and include changes in share price, reinvestment of dividends and capital gains, and the effects of any sales charges.
Annual Report
Investment Adviser
Fidelity Management & Research Company
Boston, MA
Investment Sub-Advisers
FMR Co., Inc.
Fidelity Management & Research
(U.K.) Inc.
Fidelity Research & Analysis Company (formerly Fidelity
Management & Research (Far East) Inc.)
Fidelity Investments Japan Limited
Fidelity International Investment Advisors
Fidelity International Investment Advisors
(U.K. Limited)
General Distributor
Fidelity Distributors Corporation
Boston, MA
Transfer and Service Agent
Fidelity Service Company, Inc.
Boston, MA
Custodian
Brown Brothers Harriman & Co.
Boston, MA
Corporate Headquarters
82 Devonshire Street
Boston, MA 02109
1-800-544-8888
The Fidelity Telephone Connection
Mutual Fund 24-Hour Service
Exchanges/Redemptions
and Account Assistance 1-800-544-6666
Product Information 1-800-544-8888
Retirement Accounts 1-800-544-4774
(8 a.m. - 9 p.m.)
TDD Service 1-800-544-0118
for the deaf and hearing impaired
(9 a.m. - 9 p.m. Eastern time)
Fidelity Automated Service
Telephone (FAST®) (automated graphic) 1-800-544-5555
(automated graphic) Automated line for quickest service
(Fidelity Investment logo)(registered trademark)
Corporate Headquarters
82 Devonshire St., Boston, MA 02109
www.fidelity.com
SELUTL-UANN-0407
1.813624.102
Fidelity®
Select Portfolios®
Industrials Sector
Select Air Transportation Portfolio
Select Defense and Aerospace Portfolio
Select Environmental Portfolio
Select Industrial Equipment Portfolio
Select Industrials Portfolio (formerly Select Cyclical Industries Portfolio)
Select Transportation Portfolio
Annual Report
February 28, 2007
(2_fidelity_logos) (Registered_Trademark)
Contents
Chairman's Message | ||
Notes to Shareholders | ||
Shareholder Expense Example | ||
Fund Updates* | ||
Industrials Sector | ||
Air Transportation | ||
Defense and Aerospace | ||
Environmental | ||
Industrial Equipment | ||
Industrials | ||
Transportation | ||
Notes to Financial Statements | ||
Report of Independent Registered Public Accounting Firm | ||
Trustees and Officers | ||
Distributions | ||
Proxy Voting Results |
* Fund updates for each Select Portfolio include: Performance, Management's Discussion of Fund Performance, Investment Changes, Investments, and Financial Statements.
To view a fund's proxy voting guidelines and proxy voting record for the 12-month period ended June 30, visit www.fidelity.com/proxyvotingresults or visit the Securities and Exchange Commission's (SEC) web site at www.sec.gov. You may also call 1-800-544-8544 to request a free copy of the proxy voting guidelines.
Standard & Poor's, S&P and S&P 500 are registered service marks of The McGraw-Hill Companies, Inc. and have been licensed for use by
Fidelity Distributors Corporation.
Other third party marks appearing herein are the property of their respective owners.
All other marks appearing herein are registered or unregistered trademarks or service marks of FMR Corp. or an affiliated company.
This report and the financial statements contained herein are submitted for the general information of the shareholders of the funds. This report is not authorized for distribution to prospective investors in the funds unless preceded or accompanied by an effective prospectus.
A fund files its complete schedule of portfolio holdings with the SEC for the first and third quarters of each fiscal year on Form N-Q. Forms N-Q are available on the SEC's web site at http://www.sec.gov. A fund's Forms N-Q may be reviewed and copied at the SEC's Public Reference Room in Washington, DC. Information regarding the operation of the SEC's Public Reference Room may be obtained by calling 1-800-SEC-0330. For a complete list of a fund's portfolio holdings, view the most recent quarterly holdings report, semiannual report, or annual report on Fidelity's web site at http://www.fidelity.com/holdings.
NOT FDIC INSURED · MAY LOSE VALUE · NO BANK GUARANTEE
Neither the funds nor Fidelity Distributors Corporation is a bank.
Annual Report
Chairman's Message
(Photograph of Edward C. Johnson 3d.)
Dear Shareholder:
Substantial single-day losses are not uncommon in the equity markets, and when they occur - as in late February - investors can be better served in the long term by buying good stocks at lower prices than by moving their money to the sidelines. While financial markets are always unpredictable, there are a number of time-tested principles that can put the historical odds in your favor.
One of the basic tenets is to invest for the long term. Over time, riding out the markets' inevitable ups and downs has proven much more effective than selling into panic or chasing the hottest trend. Even missing only a few of the markets' best days can significantly diminish investor returns. Patience also affords the benefits of compounding - of earning interest on additional income or reinvested dividends and capital gains. There are tax advantages and cost benefits to consider as well. The more you sell, the more taxes you pay, and the more you trade, the higher the costs. While staying the course doesn't eliminate risk, it can considerably lessen the effect of short-term declines.
You can further manage your investing risk through diversification. And today, more than ever, geographic diversification should be taken into account. Studies
indicate that asset allocation is the single most important determinant of a portfolio's long-term success. The right mix of stocks, bonds and cash - aligned to your particular risk tolerance and investment objective - is very important. Age-appropriate rebalancing is also an essential aspect of asset allocation. For younger investors, an emphasis on equities - which historically have been the best performing asset class over time - is encouraged. As investors near their specific goal, such as retirement or sending a child to college, consideration may be given to replacing volatile assets (e.g. common stocks) with more-stable fixed investments (bonds or savings plans).
A third investment principle - investing regularly - can help lower the average cost of your purchases. Investing a certain amount of money each month or quarter helps ensure you won't pay for all your shares at market highs. This strategy - known as dollar cost averaging - also reduces unconstructive "emotion" from investing, helping shareholders avoid selling weak performers just prior to an upswing, or chasing a hot performer just before a correction.
We invite you to contact us via the Internet, through our Investor Centers or over the phone. It is our privilege to provide you the information you need to make the investments that are right for you.
Sincerely,
/s/Edward C. Johnson 3d
Edward C. Johnson 3d
Annual Report
Notes to Shareholders:
Effective October 1, 2006, Fidelity restructured the Fidelity® Select Portfolios® equity product line. The restructuring aligned the equity funds' investment goals more closely with standard industry classifications and facilitated adoption of more-specific benchmark indexes to evaluate fund performance. As restructured, the equity funds generally align under the 10 sectors in the widely recognized Global Industry Classification Standard (GICS), developed by Standard & Poor's® (S&P®) and Morgan Stanley Capital InternationalSM (MSCI®): Consumer Discretionary, Consumer Staples, Energy, Financials, Health Care, Industrials, Information Technology, Materials, Telecommunications Services and Utilities. Changes to the funds ranged from simply adopting a new supplemental benchmark to, in some cases, changing investment policies and fund names.
For Banking, Communications Equipment (formerly Developing Communications), Construction and Housing, Consumer Discretionary (formerly Consumer Industries), Consumer Staples (formerly Food and Agriculture), Home Finance, Industrials (formerly Cyclical Industries), IT Services (formerly Business Services and Outsourcing) and Materials (formerly Industrial Materials), shareholders approved certain fundamental investment policy changes related to the restructuring at a special meeting of shareholders held September 20, 2006. All the equity funds adopted new benchmark indexes from MSCI, except for Gold (which adopted an S&P/Citigroup index), Natural Gas (which adopted an S&P index) and Natural Resources (which retained its current Goldman Sachs® index). Taken together, the name, policy and benchmark changes will make it easier for investors to distinguish funds in the product line and to evaluate Fidelity Management & Research Company's skill in managing the funds.
The Select equity portfolios also eliminated hourly pricing. The funds now price each business day as of the close of the New York Stock Exchange, normally 4:00 pm Eastern time. The funds also adopted Fidelity's standard fund market timing policy, as described in the funds' current prospectus, and removed the $7.50 fee formerly charged on exchanges made through non-automated channels.
Changes for each fund in the GICS Industrials Sector are described in detail below.
Air Transportation
The fund is now benchmarked to the MSCI US Investable Market Transportation Index.
Defense and Aerospace
The fund is now benchmarked to the MSCI US Investable Market Aerospace & Defense Index.
Environmental
The fund is now benchmarked to the MSCI US Investable Market Industrials Index.
Industrial Equipment
The fund is now benchmarked to the MSCI US Investable Market Capital Goods Index.
Industrials (formerly Cyclical Industries)
Shareholders approved narrowing the fund's policies to invest primarily in companies engaged in the research, development, manufacture, distribution, supply or sale of industrial products, services or equipment. The industrials and materials industries are considered subsets of the cyclical industries sector. The fund is now benchmarked to the MSCI US Investable Market Industrials Index.
Transportation
The fund is now benchmarked to the MSCI US Investable Market Transportation Index.
Annual Report
Shareholder Expense Example
As a shareholder of a Fund, you incur two types of costs: (1) transaction costs, including redemption fees, exchange fees, and (2) ongoing costs, including management fees and other Fund expenses. This Example is intended to help you understand your ongoing costs (in dollars) of investing in the Funds and to compare these costs with the ongoing costs of investing in other mutual funds.
The Example is based on an investment of $1,000 invested at the beginning of the period and held for the entire period (September 1, 2006 to February 28, 2007).
Actual Expenses
The first line of the accompanying table for each fund provides information about actual account values and actual expenses. You may use the information in this line, together with the amount you invested, to estimate the expenses that you paid over the period. Simply divide your account value by $1,000.00 (for example, an $8,600 account value divided by $1,000.00 = 8.6), then multiply the result by the number in the first line for a fund under the heading entitled "Expenses Paid During Period" to estimate the expenses you paid on your account during this period. A small balance maintenance fee of $12.00 that is charged once a year may apply for certain accounts with a value of less than $2,000. This fee is not included in the table below. If it was, the estimate of expenses you paid during the period would be higher, and your ending account value lower, by this amount.
Hypothetical Example for Comparison Purposes
The second line of the accompanying table for each fund provides information about hypothetical account values and hypothetical expenses based on a fund's actual expense ratio and an assumed rate of return of 5% per year before expenses, which is not the Fund's actual return. The hypothetical account values and expenses may not be used to estimate the actual ending account balance or expenses you paid for the period. You may use this information to compare the ongoing costs of investing in the Fund and other funds. To do so, compare this 5% hypothetical example with the 5% hypothetical examples that appear in the shareholder reports of the other funds. A small balance maintenance fee of $12.00 that is charged once a year may apply for certain accounts with a value of less than $2,000. This fee is not included in the table below. If it was, the estimate of expenses you paid during the period would be higher, and your ending account value lower, by this amount.
Please note that the expenses shown in the table are meant to highlight your ongoing costs only and do not reflect any transaction costs. Therefore, the second line of the table is useful in comparing ongoing costs only, and will not help you determine the relative total costs of owning different funds. In addition, if these transactional costs were included, your costs would have been higher.
Beginning | Ending | Expenses Paid | |
Air Transportation Portfolio | |||
Actual | $ 1,000.00 | $ 1,214.50 | $ 5.27 |
HypotheticalA | $ 1,000.00 | $ 1,020.03 | $ 4.81 |
Defense and Aerospace Portfolio | |||
Actual | $ 1,000.00 | $ 1,171.80 | $ 4.85 |
HypotheticalA | $ 1,000.00 | $ 1,020.33 | $ 4.51 |
Environmental Portfolio | |||
Actual | $ 1,000.00 | $ 1,050.70 | $ 5.39 |
HypotheticalA | $ 1,000.00 | $ 1,019.54 | $ 5.31 |
Industrial Equipment Portfolio | |||
Actual | $ 1,000.00 | $ 1,110.80 | $ 4.92 |
HypotheticalA | $ 1,000.00 | $ 1,020.13 | $ 4.71 |
Industrials Portfolio | |||
Actual | $ 1,000.00 | $ 1,100.20 | $ 5.57 ** |
HypotheticalA | $ 1,000.00 | $ 1,019.49 | $ 5.36 ** |
Transportation Portfolio | |||
Actual | $ 1,000.00 | $ 1,156.20 | $ 5.29 |
HypotheticalA | $ 1,000.00 | $ 1,019.89 | $ 4.96 |
A 5% return per year before expenses
* Expenses are equal to each Fund's annualized expense ratio (shown in the table below); multiplied by the average account value over the period, multiplied by 181/365 (to reflect the one-half year period).
Annual Report
Annualized | |
Air Transportation Portfolio | .96% |
Defense and Aerospace Portfolio | .90% |
Environmental Portfolio | 1.06% |
Industrial Equipment Portfolio | .94% |
Industrials Portfolio | 1.07% ** |
Transportation Portfolio | .99% |
** If fees effective January 1, 2007 had been in effect during the entire period, the annualized expense ratios and the expenses paid in the actual and hypothetical examples above would have been as follows:
Annualized | Expense Paid | |
Industrials Portfolio | 1.00% | |
Actual | $ 5.21 | |
HypotheticalA | $ 5.01 |
Annual Report
Select Air Transportation Portfolio
Performance
Average annual total return reflects the change in the value of an investment, assuming reinvestment of the fund's dividend income and capital gains (the profits earned upon the sale of securities that have grown in value) and assuming a constant rate of performance each year. The $10,000 table and the fund's returns do not reflect the deduction of taxes that a shareholder would pay on fund distributions or the redemption of fund shares. During periods of reimbursement by Fidelity a fund's total returns will be greater than it would be had the reimbursement not occurred. How a fund did yesterday is no guarantee of how it will do tomorrow.
Average Annual Total Returns
Periods ended February 28, 2007 | Past 1 | Past 5 | Past 10 |
Select Air Transportation Portfolio | 19.81% | 10.29% | 15.86% |
$10,000 Over 10 Years
Let's say hypothetically that $10,000 was invested in Select Air Transportation Portfolio on February 28, 1997. The chart shows how the value of your investment would have changed, and also shows how the S&P 500® Index performed over the same period.
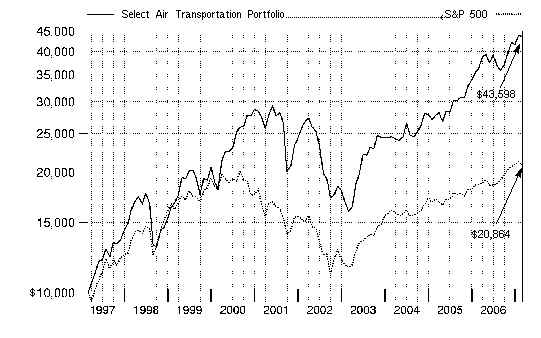
Annual Report
Select Air Transportation Portfolio
Management's Discussion of Fund Performance
Comments from Andrew Hatem, Portfolio Manager of Fidelity® Select Air Transportation Portfolio
A rosy year for stocks wilted just prior to the end of the 12-month period ending February 28, 2007. On the day prior to the period's close, the Dow Jones Industrial AverageSM plunged 416 points and the Standard & Poor's 500SM Index lost roughly 3.5% of its value, plummeting nearly 50 points and marking the benchmark's worst single-day performance since the day the market reopened after the 9/11 terrorist attacks. Though investors were obviously rattled by the development, it was only the 22nd-biggest decline for the S&P 500® in 20 years, and it could not overshadow how well stocks performed for the 12 months overall. For much of the past year, investors grew confident that the economy would not fall into a recession, and they bid up most broad-based stock indexes for six consecutive months from August through January. Overall for the year ending February 28, 2007, the S&P 500 was up 11.97%, the Dow advanced 14.24%, the small-cap Russell 2000® Index gained 9.87% and the NASDAQ Composite® Index rose 6.66%.
For the year, the fund was up 19.81%, compared with a gain of 6.64% for its new benchmark, the Morgan Stanley Capital InternationalSM (MSCI®) US Investable Market Transportation Index, and an advance of 10.29% for a blended index specific to this fund. This blended index is a combination of the Goldman Sachs® Cyclical Industries Index, which the fund was compared with through September, and the new MSCI index mentioned above, which the fund was compared with during the period's final five months1. During the same 12-month period, the fund beat the S&P® benchmark. For the first seven months of the review period, the fund outpaced the Goldman Sachs benchmark because of its narrow focus on air transportation-related stocks, which meant that it avoided some of the weaker cyclical industries, such as those involved with the slowing housing market. Although some unfavorable stock selection in the aerospace/defense segment modestly tempered results, good stock picking in the air freight/logistics group more than offset that relative shortfall. Among the notable contributors were Precision Castparts, a maker of complex metal parts for jet engines; defense contractor General Dynamics; and airline US Airways. In the air freight/logistics space, results were helped by a position in Expeditors International of Washington, as well as by timely trading in EGL and C.H. Robinson Worldwide, two other transport companies. Conversely, a handful of poor performers in the airline industry - among them, discount carrier AirTran Holdings; AMR, parent of American Airlines; and UAL, parent of United Airlines - held back performance, as did Hexcel, a supplier of carbon-fiber composites, which struggled when aircraft manufacturer Airbus announced further delays to its next-generation passenger plane, the A380. During the period's final five months, the fund handily beat its new MSCI benchmark, mainly as a result of strong stock selection. Performance was further aided by an overweighting in the resurgent airline sector, where stocks such as UAL and AMR were among the top contributors. Out-of-benchmark holdings in Precision Castparts and Rockwell Collins, two strong performing aerospace and defense companies, also helped, as did our investment in non-index component Titanium Metals, which supplies this strong, lightweight metal to aircraft manufacturers. On the flip side, the fund's lack of any exposure to the robust railroads, trucking and marine transportation groups held back the return modestly. The single biggest drag on relative performance came from the fund's slight underweighting in Continental Airlines, another productive airline stock, while having no stake in railroad companies such as CSX and Union Pacific also detracted.
1 The fund's blended index is a customized index developed by Fidelity for the limited purpose of discussing the fund's performance for the 12-month period ending February 28, 2007. From March 1, 2006, through September 30, 2006, the fund compared its performance to the Goldman Sachs Cyclical Industries Index, which returned 1.77% during that period. On October 1, 2006, the fund began comparing its performance to a different index, the MSCI US Investable Market Transportation Index, which returned 8.37% from October 1, 2006, through February 28, 2007. For the 12-month period ending February 28, 2007, the blended index (Goldman Sachs and MSCI) returned 10.29%.
The views expressed above reflect those of the portfolio manager(s) only through the end of the period as stated on the cover of this report and do not necessarily represent the views of Fidelity or any other person in the Fidelity organization. Any such views are subject to change at any time based upon market or other conditions and Fidelity disclaims any responsibility to update such views. These views may not be relied on as investment advice and, because investment decisions for a Fidelity fund are based on numerous factors, may not be relied on as an indication of trading intent on behalf of any Fidelity fund.
Annual Report
Select Air Transportation Portfolio
Investment Changes
Top Ten Stocks as of February 28, 2007 | ||
% of fund's | % of fund's net assets | |
FedEx Corp. | 8.8 | 0.8 |
United Parcel Service, Inc. Class B | 7.1 | 0.0 |
Rockwell Collins, Inc. | 6.8 | 7.9 |
Precision Castparts Corp. | 6.1 | 7.6 |
C.H. Robinson Worldwide, Inc. | 6.1 | 6.0 |
Expeditors International of Washington, Inc. | 5.3 | 8.9 |
The Boeing Co. | 4.5 | 5.6 |
AMR Corp. | 4.4 | 4.9 |
US Airways Group, Inc. | 3.9 | 3.3 |
UAL Corp. | 3.8 | 3.8 |
56.8 | ||
Top Industries (% of fund's net assets) | |||
As of February 28, 2007 | |||
 | Aerospace & Defense | 32.5% | |
 | Air Freight & Logistics | 30.9% | |
 | Airlines | 24.7% | |
 | Industrial Conglomerates | 3.6% | |
 | Metals & Mining | 3.5% | |
 | All Others* | 4.8% | |

As of August 31, 2006 | |||
| Aerospace & Defense | 42.8% | |
| Airlines | 21.8% | |
| Air Freight & Logistics | 21.4% | |
| Metals & Mining | 5.0% | |
| Commercial Services | 3.2% | |
| All Others * | 5.8% | |
* Includes short-term investments and net other assets. |
Annual Report
Select Air Transportation Portfolio
Investments February 28, 2007
Showing Percentage of Net Assets
Common Stocks - 99.6% | |||
Shares | Value | ||
AEROSPACE & DEFENSE - 32.5% | |||
Aerospace & Defense - 32.5% | |||
Alliant Techsystems, Inc. (a) | 11,300 | $ 978,015 | |
BE Aerospace, Inc. (a) | 23,400 | 706,446 | |
Bombardier, Inc. Class B (sub. vtg.) | 733,800 | 2,861,039 | |
General Dynamics Corp. | 48,000 | 3,670,080 | |
Goodrich Corp. | 53,000 | 2,599,650 | |
Hexcel Corp. (a)(d) | 123,700 | 2,234,022 | |
Orbital Sciences Corp. (a) | 40,400 | 799,516 | |
Precision Castparts Corp. | 99,500 | 9,051,515 | |
Raytheon Co. | 65,800 | 3,523,590 | |
Rockwell Collins, Inc. | 153,300 | 10,038,084 | |
Rolls-Royce Group PLC | 2,317 | 22,359 | |
Spirit AeroSystems Holdings, Inc. Class A | 132,400 | 3,907,124 | |
The Boeing Co. | 75,900 | 6,623,793 | |
Triumph Group, Inc. | 16,100 | 863,121 | |
47,878,354 | |||
AIR FREIGHT & LOGISTICS - 30.9% | |||
Air Freight & Logistics - 30.9% | |||
C.H. Robinson Worldwide, Inc. (d) | 176,800 | 9,009,728 | |
EGL, Inc. (a) | 40,609 | 1,429,843 | |
Expeditors International of Washington, Inc. | 173,900 | 7,799,415 | |
FedEx Corp. | 113,850 | 12,999,393 | |
Forward Air Corp. | 42,400 | 1,383,088 | |
Hub Group, Inc. Class A | 47,300 | 1,497,991 | |
United Parcel Service, Inc. Class B | 148,400 | 10,416,196 | |
UTI Worldwide, Inc. | 34,600 | 1,042,844 | |
45,578,498 | |||
AIRLINES - 24.7% | |||
Airlines - 24.7% | |||
AirTran Holdings, Inc. (a)(d) | 159,300 | 1,659,906 | |
Alaska Air Group, Inc. (a) | 100 | 4,100 | |
AMR Corp. (a)(d) | 188,000 | 6,408,920 | |
British Airways PLC ADR (a)(d) | 10,600 | 1,121,480 | |
Continental Airlines, Inc. Class B (a) | 107,700 | 4,264,920 | |
ExpressJet Holdings, Inc. Class A (a) | 200 | 1,446 | |
Frontier Airlines Holdings, Inc. (a) | 5 | 34 | |
JetBlue Airways Corp. (a)(d) | 212,942 | 2,621,316 | |
Pinnacle Airlines Corp. (a) | 600 | 10,770 | |
Republic Airways Holdings, Inc. (a) | 67,300 | 1,333,886 | |
Ryanair Holdings PLC sponsored ADR (a)(d) | 27,900 | 1,251,315 | |
SkyWest, Inc. | 16,700 | 426,685 | |
Southwest Airlines Co. | 371,925 | 5,627,225 | |
UAL Corp. (a)(d) | 140,800 | 5,630,592 | |
US Airways Group, Inc. (a) | 109,466 | 5,723,977 | |
WestJet Airlines Ltd. (a) | 21,350 | 265,609 | |
36,352,181 | |||
Shares | Value | ||
COMMUNICATIONS EQUIPMENT - 1.8% | |||
Communications Equipment - 1.8% | |||
Harris Corp. | 54,600 | $ 2,679,768 | |
ENERGY EQUIPMENT & SERVICES - 0.8% | |||
Oil & Gas Drilling - 0.4% | |||
Nabors Industries Ltd. (a) | 20,100 | 602,196 | |
Oil & Gas Equipment & Services - 0.4% | |||
BJ Services Co. | 21,300 | 570,627 | |
TOTAL ENERGY EQUIPMENT & SERVICES | 1,172,823 | ||
INDUSTRIAL CONGLOMERATES - 3.6% | |||
Industrial Conglomerates - 3.6% | |||
Textron, Inc. | 58,000 | 5,352,820 | |
METALS & MINING - 3.5% | |||
Diversified Metals & Mining - 2.9% | |||
Titanium Metals Corp. (d) | 121,300 | 4,233,370 | |
Steel - 0.6% | |||
Carpenter Technology Corp. | 7,300 | 865,415 | |
TOTAL METALS & MINING | 5,098,785 | ||
OIL, GAS & CONSUMABLE FUELS - 1.8% | |||
Integrated Oil & Gas - 0.3% | |||
ConocoPhillips | 6,500 | 425,230 | |
Oil & Gas Exploration & Production - 1.0% | |||
Noble Energy, Inc. | 13,700 | 788,709 | |
Ultra Petroleum Corp. (a) | 12,700 | 645,287 | |
1,433,996 | |||
Oil & Gas Refining & Marketing - 0.5% | |||
Valero Energy Corp. | 12,300 | 709,095 | |
Oil & Gas Storage & Transport - 0.0% | |||
Ship Finance International Ltd. (NY Shares) | 18 | 468 | |
TOTAL OIL, GAS & CONSUMABLE FUELS | 2,568,789 | ||
TOTAL COMMON STOCKS (Cost $121,923,233) | 146,682,018 | ||
Money Market Funds - 12.7% | |||
Shares | Value | ||
Fidelity Cash Central Fund, 5.35% (b) | 3,381,067 | $ 3,381,067 | |
Fidelity Securities Lending Cash Central Fund, 5.34% (b)(c) | 15,396,125 | 15,396,125 | |
TOTAL MONEY MARKET FUNDS (Cost $18,777,192) | 18,777,192 | ||
TOTAL INVESTMENT PORTFOLIO - 112.3% (Cost $140,700,425) | 165,459,210 | ||
NET OTHER ASSETS - (12.3)% | (18,157,449) | ||
NET ASSETS - 100% | $ 147,301,761 | ||
Legend |
(a) Non-income producing |
(b) Affiliated fund that is available only to investment companies and other accounts managed by Fidelity Investments. The rate quoted is the annualized seven-day yield of the fund at period end. A complete unaudited listing of the fund's holdings as of its most recent quarter end is available upon request. |
(c) Investment made with cash collateral received from securities on loan. |
(d) Security or a portion of the security is on loan at period end. |
Affiliated Central Funds |
Information regarding fiscal year to date income earned by the Fund from investments in Fidelity Central Funds is as follows: |
Fund | Income earned |
Fidelity Cash Central Fund | $ 221,076 |
Fidelity Securities Lending Cash Central Fund | 88,200 |
Total | $ 309,276 |
See accompanying notes which are an integral part of the financial statements.
Annual Report
Select Air Transportation Portfolio
Financial Statements
Statement of Assets and Liabilities
February 28, 2007 | ||
Assets | ||
Investment in securities, at value (including securities loaned of $15,037,877) - See accompanying schedule: Unaffiliated issuers (cost $121,923,233) | $ 146,682,018 | |
Fidelity Central Funds (cost $18,777,192) | 18,777,192 | |
Total Investments (cost $140,700,425) | $ 165,459,210 | |
Receivable for investments sold | 2,135,653 | |
Receivable for fund shares sold | 1,020,223 | |
Dividends receivable | 125,849 | |
Distributions receivable from Fidelity Central Funds | 21,789 | |
Prepaid expenses | 448 | |
Other receivables | 4,910 | |
Total assets | 168,768,082 | |
Liabilities | ||
Payable for fund shares redeemed | 5,931,891 | |
Accrued management fee | 70,568 | |
Other affiliated payables | 35,270 | |
Other payables and accrued expenses | 32,467 | |
Collateral on securities loaned, at value | 15,396,125 | |
Total liabilities | 21,466,321 | |
Net Assets | $ 147,301,761 | |
Net Assets consist of: | ||
Paid in capital | $ 118,384,981 | |
Accumulated net investment loss | (12) | |
Accumulated undistributed net realized gain (loss) on investments and foreign currency transactions | 4,158,007 | |
Net unrealized appreciation (depreciation) on investments | 24,758,785 | |
Net Assets, for 2,903,200 shares outstanding | $ 147,301,761 | |
Net Asset Value, offering price and redemption price per share ($147,301,761 ÷ 2,903,200 shares) | $ 50.74 | |
Statement of Operations
Year ended February 28, 2007 | ||
Investment Income | ||
Dividends | $ 691,678 | |
Interest | 11 | |
Income from Fidelity Central Funds (including $88,200 from security lending) | 309,276 | |
Total income | 1,000,965 | |
Expenses | ||
Management fee | $ 655,425 | |
Transfer agent fees | 322,598 | |
Accounting and security lending fees | 54,989 | |
Custodian fees and expenses | 16,948 | |
Independent trustees' compensation | 394 | |
Registration fees | 56,020 | |
Audit | 35,058 | |
Legal | 1,998 | |
Interest | 3,749 | |
Miscellaneous | 5,286 | |
Total expenses before reductions | 1,152,465 | |
Expense reductions | (9,372) | 1,143,093 |
Net investment income (loss) | (142,128) | |
Realized and Unrealized Gain (Loss) Net realized gain (loss) on: | ||
Investment securities: | ||
Unaffiliated issuers | 5,028,197 | |
Investment not meeting investment restrictions | (1,108) | |
Foreign currency transactions | 13,594 | |
Payment from investment advisor for loss on investment not meeting investment restrictions | 1,108 | |
Total net realized gain (loss) | 5,041,791 | |
Change in net unrealized appreciation (depreciation) on investment securities | 9,206,214 | |
Net gain (loss) | 14,248,005 | |
Net increase (decrease) in net assets resulting from operations | $ 14,105,877 | |
See accompanying notes which are an integral part of the financial statements.
Annual Report
Select Air Transportation Portfolio
Financial Statements - continued
Statement of Changes in Net Assets
Year ended | Year ended | |
Increase (Decrease) in Net Assets | ||
Operations | ||
Net investment income (loss) | $ (142,128) | $ (53,317) |
Net realized gain (loss) | 5,041,791 | 4,743,341 |
Change in net unrealized appreciation (depreciation) | 9,206,214 | 9,148,901 |
Net increase (decrease) in net assets resulting from operations | 14,105,877 | 13,838,925 |
Distributions to shareholders from net investment income | - | (11,065) |
Distributions to shareholders from net realized gain | (2,737,561) | (1,175,691) |
Total distributions | (2,737,561) | (1,186,756) |
Share transactions | 235,838,995 | 140,976,982 |
Reinvestment of distributions | 2,563,316 | 1,075,872 |
Cost of shares redeemed | (220,199,811) | (72,407,983) |
Net increase (decrease) in net assets resulting from share transactions | 18,202,500 | 69,644,871 |
Redemption fees | 89,643 | 52,151 |
Total increase (decrease) in net assets | 29,660,459 | 82,349,191 |
Net Assets | ||
Beginning of period | 117,641,302 | 35,292,111 |
End of period (including accumulated net investment loss of $12 and accumulated net investment loss of $20, respectively) | $ 147,301,761 | $ 117,641,302 |
Other Information Shares | ||
Sold | 4,974,556 | 3,522,772 |
Issued in reinvestment of distributions | 55,583 | 26,955 |
Redeemed | (4,854,045) | (1,877,480) |
Net increase (decrease) | 176,094 | 1,672,247 |
Financial Highlights
Years ended February 28, | 2007 | 2006 | 2005 | 2004 G | 2003 |
Selected Per-Share Data | |||||
Net asset value, beginning of period | $ 43.14 | $ 33.46 | $ 30.04 | $ 19.58 | $ 32.96 |
Income from Investment Operations | |||||
Net investment income (loss) C | (.06) | (.04) | .07 | (.13) | (.19) |
Net realized and unrealized gain (loss) | 8.48 | 10.44 | 3.73 | 10.55 | (12.99) |
Total from investment operations | 8.42 | 10.40 | 3.80 | 10.42 | (13.18) |
Distributions from net investment income | - | (.01) | (.06) | - | - |
Distributions from net realized gain | (.86) | (.75) | (.36) | - | (.24) |
Total distributions | (.86) | (.76) | (.42) | - | (.24) |
Redemption fees added to paid in capital C | .04 | .04 | .04 | .04 | .04 |
Net asset value, end of period | $ 50.74 | $ 43.14 | $ 33.46 | $ 30.04 | $ 19.58 |
Total Return A, B | 19.81% | 31.40% | 12.92% | 53.42% | (40.16)% |
Ratios to Average Net Assets D, F | |||||
Expenses before reductions | 1.00% | 1.16% | 1.23% | 1.49% | 1.63% |
Expenses net of fee waivers, if any | 1.00% | 1.16% | 1.23% | 1.49% | 1.63% |
Expenses net of all reductions | .99% | 1.11% | 1.21% | 1.42% | 1.58% |
Net investment income (loss) | (.12)% | (.11)% | .22% | (.47)% | (.73)% |
Supplemental Data | |||||
Net assets, end of period (000 omitted) | $ 147,302 | $ 117,641 | $ 35,292 | $ 34,724 | $ 23,440 |
Portfolio turnover rate E | 165% | 93% | 71% | 140% | 56% |
A Total returns would have been lower had certain expenses not been reduced during the periods shown.
B Total returns do not include the effect of the former sales charges.
C Calculated based on average shares outstanding during the period.
D Fees and expenses of the underlying Fidelity Central Funds are not included in the Fund's expense ratio. The Fund indirectly bears its proportionate share of the expenses of any underlying Fidelity Central Funds.
E Amount does not include the portfolio activity of any underlying Fidelity Central Funds.
F Expense ratios reflect operating expenses of the Fund. Expenses before reductions do not reflect amounts reimbursed by the investment adviser or reductions from brokerage service arrangements or other expense offset arrangements and do not represent the amount paid by the Fund during periods when reimbursements or reductions occur. Expenses net of fee waivers reflect expenses after reimbursement by the investment adviser but prior to reductions from brokerage service arrangements or other expense offset arrangements. Expenses net of all reductions represent the net expenses paid by the Fund.
G For the year ended February 29.
See accompanying notes which are an integral part of the financial statements.
Annual Report
Select Defense and Aerospace Portfolio
Performance
Average annual total return reflects the change in the value of an investment, assuming reinvestment of the fund's dividend income and capital gains (the profits earned upon the sale of securities that have grown in value) and assuming a constant rate of performance each year. The $10,000 table and the fund's returns do not reflect the deduction of taxes that a shareholder would pay on fund distributions or the redemption of fund shares. During periods of reimbursement by Fidelity a fund's total returns will be greater than it would be had the reimbursement not occurred. How a fund did yesterday is no guarantee of how it will do tomorrow.
Average Annual Total Returns
Periods ended February 28, 2007 | Past 1 | Past 5 | Past 10 |
Select Defense and Aerospace Portfolio | 15.90% | 15.93% | 14.74% |
$10,000 Over 10 Years
Let's say hypothetically that $10,000 was invested in Select Defense and Aerospace Portfolio on February 28, 1997. The chart shows how the value of your investment would have changed, and also shows how the S&P 500 Index performed over the same period.
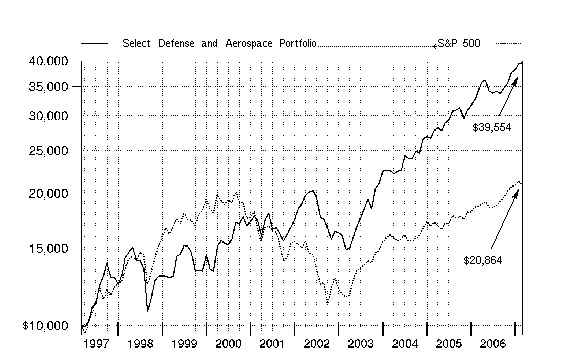
Annual Report
Select Defense and Aerospace Portfolio
Management's Discussion of Fund Performance
Comments from Andrew Hatem, Portfolio Manager of Fidelity® Select Defense and Aerospace Portfolio
A rosy year for stocks wilted just prior to the end of the 12-month period ending February 28, 2007. On the day prior to the period's close, the Dow Jones Industrial AverageSM plunged 416 points and the Standard & Poor's 500SM Index lost roughly 3.5% of its value, plummeting nearly 50 points and marking the benchmark's worst single-day performance since the day the market reopened after the 9/11 terrorist attacks. Though investors were obviously rattled by the development, it was only the 22nd-biggest decline for the S&P 500® in 20 years, and it could not overshadow how well stocks performed for the 12 months overall. For much of the past year, investors grew confident that the economy would not fall into a recession, and they bid up most broad-based stock indexes for six consecutive months from August through January. Overall for the year ending February 28, 2007, the S&P 500 was up 11.97%, the Dow advanced 14.24%, the small-cap Russell 2000® Index gained 9.87% and the NASDAQ Composite® Index rose 6.66%.
For the year, the fund was up 15.90%, compared with a gain of 20.33% for its new benchmark, the Morgan Stanley Capital InternationalSM (MSCI®) US Investable Market Aerospace & Defense Index, and an advance of 13.63% for a blended index specific to this fund. This blended index is a combination of the Goldman Sachs® Cyclical Industries Index, which the fund was compared with through September, and the new MSCI index mentioned above, which the fund was compared with during the period's final five months1. During the same 12-month period, the fund beat the S&P® benchmark. For the first seven months of the review period, the fund slightly outpaced the benchmark mainly because its narrower focus helped it avoid some of the weaker areas of the index, such as those related to a slowing housing market. Among the notable contributors during this period were Precision Castparts, a maker of complex metal parts for jet engines; defense contractors General Dynamics and Raytheon; and Orbital Sciences, which makes commercial satellites and missile-defense launch systems. An out-of-benchmark position in EchoStar Communications, which delivers satellite television products worldwide, also benefited performance. Despite being overweighted in defense/aerospace stocks - which helped - poor stock selection in that area offset those gains. Among the biggest individual detractors were DRS Technologies, a supplier of defense electronics systems; Hexcel, which produces carbon-fiber composites for the commercial airline industry; and BE Aerospace, which makes products for airline interiors. Also detracting was poor stock selection in the diversified metals and mining group, where untimely ownership of Titanium Metals, a supplier of this lightweight metal to airline manufacturers, held back the return. Underweighting industrial conglomerates, which did reasonably well as a group, hurt as well. Some of the stocks just mentioned were no longer held at period end. During the period's final five months, the fund beat the new MSCI index mainly as a result of favorable security selection in the aerospace/defense group. Productive picks in such out-of-benchmark areas as steel and diversified metals/mining also provided nice gains. Results were held back somewhat by inopportune security selection in information technology (IT) consulting/other services, broadcasting and cable television, and communications equipment. The single biggest contribution came from a significant underweighting in industrial conglomerate United Technologies, a major index component that struggled due to its exposure to residential real estate. Underweighting Boeing and not owning Northrop Grumman, two major aircraft manufacturers, also helped. BE Aerospace recovered nicely during the period and added to performance. Titanium Metals and Allegheny Technologies, both of which supply specialty metals to aircraft makers, also were strong performers, and I sold the position in Allegheny to lock in its profits. On the flip side, technology services providers SRA International and CACI International both were laggards, as spending on government IT projects was diverted to fund more pressing military needs overseas. Having virtually no exposure to industrial conglomerate and benchmark heavyweight Honeywell International, which performed respectably during the period, also hurt.
1 The fund's blended index is a customized index developed by Fidelity for the limited purpose of discussing the fund's performance for the 12-month period ending February 28, 2007. From March 1, 2006, through September 30, 2006, the fund compared its performance to the Goldman Sachs Cyclical Industries Index, which returned 1.77% during that period. On October 1, 2006, the fund began comparing its performance to a different index, the MSCI US Investable Market Aerospace & Defense Index, which returned 11.65% from October 1, 2006, through February 28, 2007. For the 12-month period ending February 28, 2007, the blended index (Goldman Sachs and MSCI) returned 13.63%.
The views expressed above reflect those of the portfolio manager(s) only through the end of the period as stated on the cover of this report and do not necessarily represent the views of Fidelity or any other person in the Fidelity organization. Any such views are subject to change at any time based upon market or other conditions and Fidelity disclaims any responsibility to update such views. These views may not be relied on as investment advice and, because investment decisions for a Fidelity fund are based on numerous factors, may not be relied on as an indication of trading intent on behalf of any Fidelity fund.
Annual Report
Select Defense and Aerospace Portfolio
Investment Changes
Top Ten Stocks as of February 28, 2007 | ||
% of fund's | % of fund's net assets | |
General Dynamics Corp. | 12.9 | 7.3 |
Lockheed Martin Corp. | 11.9 | 0.3 |
Raytheon Co. | 11.2 | 7.2 |
Rockwell Collins, Inc. | 7.0 | 6.9 |
Precision Castparts Corp. | 4.8 | 6.7 |
Alliant Techsystems, Inc. | 4.1 | 5.2 |
The Boeing Co. | 3.9 | 4.7 |
DRS Technologies, Inc. | 3.8 | 3.6 |
United Technologies Corp. | 3.7 | 1.4 |
Harris Corp. | 3.6 | 7.5 |
66.9 | ||
Top Industries (% of fund's net assets) | |||
As of February 28, 2007 | |||
| Aerospace & Defense | 83.6% | |
| Communications Equipment | 4.6% | |
| Metals & Mining | 3.7% | |
| IT Services | 3.5% | |
| Machinery | 0.6% | |
| All Others* | 4.0% | |
As of August 31, 2006 | |||
| Aerospace & Defense | 70.2% | |
| Communications Equipment | 8.5% | |
| Media | 6.5% | |
| Metals & Mining | 4.7% | |
| IT Services | 4.3% | |
| All Others* | 5.8% | |
* Includes short-term investments and net other assets. |
Annual Report
Select Defense and Aerospace Portfolio
Investments February 28, 2007
Showing Percentage of Net Assets
Common Stocks - 96.2% | |||
Shares | Value | ||
AEROSPACE & DEFENSE - 83.6% | |||
Aerospace & Defense - 83.6% | |||
AAR Corp. (a) | 983,700 | $ 28,635,507 | |
AeroVironment, Inc. | 10,000 | 212,700 | |
Alliant Techsystems, Inc. (a)(d) | 573,355 | 49,623,875 | |
BE Aerospace, Inc. (a) | 1,013,050 | 30,583,980 | |
Ceradyne, Inc. (a) | 95,900 | 4,948,440 | |
DRS Technologies, Inc. | 863,100 | 45,735,669 | |
DynCorp International, Inc. Class A | 255,000 | 4,233,000 | |
EDO Corp. (d) | 270,300 | 6,498,012 | |
GenCorp, Inc. (non-vtg.) (a)(d) | 181,300 | 2,518,257 | |
General Dynamics Corp. | 2,027,200 | 154,999,710 | |
Goodrich Corp. | 693,650 | 34,023,533 | |
Hexcel Corp. (a)(d) | 1,180,000 | 21,310,800 | |
Honeywell International, Inc. | 259,500 | 12,051,180 | |
L-3 Communications Holdings, Inc. | 431,100 | 37,548,810 | |
Ladish Co., Inc. (a) | 133,400 | 5,576,120 | |
Lockheed Martin Corp. | 1,476,500 | 143,633,920 | |
MTC Technologies, Inc. (a) | 223,000 | 4,707,530 | |
Orbital Sciences Corp. (a) | 1,470,292 | 29,097,079 | |
Precision Castparts Corp. | 627,900 | 57,120,063 | |
Raytheon Co. | 2,509,352 | 134,375,800 | |
Rockwell Collins, Inc. | 1,278,000 | 83,683,440 | |
Spirit AeroSystems Holdings, Inc. Class A | 14,000 | 413,140 | |
Stanley, Inc. | 666,200 | 10,046,296 | |
The Boeing Co. | 535,900 | 46,767,993 | |
Triumph Group, Inc. | 230,400 | 12,351,744 | |
United Technologies Corp. | 682,400 | 44,785,912 | |
1,005,482,510 | |||
COMMUNICATIONS EQUIPMENT - 4.6% | |||
Communications Equipment - 4.6% | |||
Ciena Corp. (a) | 180,600 | 5,683,482 | |
Finisar Corp. (a) | 970,200 | 3,094,938 | |
Harris Corp. | 887,800 | 43,573,224 | |
Optium Corp. | 130,600 | 3,005,106 | |
55,356,750 | |||
ELECTRONIC EQUIPMENT & INSTRUMENTS - 0.2% | |||
Electronic Equipment & Instruments - 0.2% | |||
CPI International, Inc. | 4,700 | 82,391 | |
L-1 Identity Solutions, Inc. (d) | 165,900 | 2,636,151 | |
2,718,542 | |||
IT SERVICES - 3.5% | |||
IT Consulting & Other Services - 3.5% | |||
CACI International, Inc. Class A (a) | 255,800 | 11,894,700 | |
ManTech International Corp. Class A (a) | 159,500 | 5,494,775 | |
NCI, Inc. Class A (a)(e) | 537,862 | 9,041,460 | |
Shares | Value | ||
SI International, Inc. (a) | 6,300 | $ 176,526 | |
SRA International, Inc. Class A (a) | 631,400 | 14,964,180 | |
41,571,641 | |||
MACHINERY - 0.6% | |||
Construction & Farm Machinery & Heavy Trucks - 0.6% | |||
Force Protection, Inc. (a)(d) | 472,800 | 7,706,640 | |
METALS & MINING - 3.7% | |||
Diversified Metals & Mining - 3.2% | |||
Titanium Metals Corp. | 927,100 | 32,355,790 | |
Toho Titanium Co. Ltd. (d) | 122,500 | 6,612,465 | |
38,968,255 | |||
Steel - 0.5% | |||
Carpenter Technology Corp. | 46,600 | 5,524,430 | |
TOTAL METALS & MINING | 44,492,685 | ||
TOTAL COMMON STOCKS (Cost $926,500,364) | 1,157,328,768 | ||
Money Market Funds - 6.6% | |||
Fidelity Cash Central Fund, 5.35% (b) | 45,337,549 | 45,337,549 | |
Fidelity Securities Lending Cash Central Fund, 5.34% (b)(c) | 34,536,965 | 34,536,965 | |
TOTAL MONEY MARKET FUNDS (Cost $79,874,514) | 79,874,514 | ||
TOTAL INVESTMENT PORTFOLIO - 102.8% (Cost $1,006,374,878) | 1,237,203,282 | ||
NET OTHER ASSETS - (2.8)% | (33,909,272) | ||
NET ASSETS - 100% | $ 1,203,294,010 | ||
Legend |
(a) Non-income producing |
(b) Affiliated fund that is available only to investment companies and other accounts managed by Fidelity Investments. The rate quoted is the annualized seven-day yield of the fund at period end. A complete unaudited listing of the fund's holdings as of its most recent quarter end is available upon request. |
(c) Investment made with cash collateral received from securities on loan. |
(d) Security or a portion of the security is on loan at period end. |
(e) Affiliated company |
Affiliated Central Funds |
Information regarding fiscal year to date income earned by the Fund from investments in Fidelity Central Funds is as follows: |
Fund | Income earned |
Fidelity Cash Central Fund | $ 1,538,316 |
Fidelity Securities Lending Cash Central Fund | 232,023 |
Total | $ 1,770,339 |
Other Affiliated Issuers |
An affiliated company is a company in which the fund has ownership of at least 5% of the voting securities. Fiscal year to date transactions with companies which are or were affiliates are as follows: |
Affiliate | Value, | Purchases | Sales | Dividend | Value, |
NCI, Inc. Class A | $ 2,213,442 | $ 5,020,857 | $ 450,544 | $ - | $ 9,041,460 |
See accompanying notes which are an integral part of the financial statements.
Annual Report
Select Defense and Aerospace Portfolio
Financial Statements
Statement of Assets and Liabilities
February 28, 2007 | ||
Assets | ||
Investment in securities, at value (including securities loaned of $33,338,906) - See accompanying schedule: Unaffiliated issuers (cost $920,273,382) | $ 1,148,287,308 | |
Fidelity Central Funds (cost $79,874,514) | 79,874,514 | |
Other affiliated issuers (cost $6,226,982) | 9,041,460 | |
Total Investments (cost $1,006,374,878) | $ 1,237,203,282 | |
Receivable for investments sold | 14,077,773 | |
Receivable for fund shares sold | 6,076,544 | |
Dividends receivable | 1,233,161 | |
Distributions receivable from Fidelity Central Funds | 191,409 | |
Prepaid expenses | 3,790 | |
Other receivables | 28,758 | |
Total assets | 1,258,814,717 | |
Liabilities | ||
Payable for investments purchased | $ 15,684,828 | |
Payable for fund shares redeemed | 4,373,750 | |
Accrued management fee | 561,800 | |
Other affiliated payables | 282,282 | |
Other payables and accrued expenses | 81,082 | |
Collateral on securities loaned, at value | 34,536,965 | |
Total liabilities | 55,520,707 | |
Net Assets | $ 1,203,294,010 | |
Net Assets consist of: | ||
Paid in capital | $ 904,876,520 | |
Undistributed net investment income | 542,092 | |
Accumulated undistributed net realized gain (loss) on investments and foreign currency transactions | 67,046,994 | |
Net unrealized appreciation (depreciation) on investments | 230,828,404 | |
Net Assets, for 14,246,728 shares outstanding | $ 1,203,294,010 | |
Net Asset Value, offering price and redemption price per share ($1,203,294,010 ÷ 14,246,728 shares) | $ 84.46 | |
Statement of Operations
Year ended February 28, 2007 | ||
Investment Income | ||
Dividends | $ 8,361,006 | |
Interest | 1,077 | |
Income from Fidelity Central Funds (including $232,023 from security lending) | 1,770,339 | |
Total income | 10,132,422 | |
Expenses | ||
Management fee | $ 5,664,491 | |
Transfer agent fees | 2,944,636 | |
Accounting and security lending fees | 388,660 | |
Custodian fees and expenses | 30,137 | |
Independent trustees' compensation | 3,484 | |
Registration fees | 87,580 | |
Audit | 38,867 | |
Legal | 16,795 | |
Miscellaneous | 58,480 | |
Total expenses before reductions | 9,233,130 | |
Expense reductions | (53,098) | 9,180,032 |
Net investment income (loss) | 952,390 | |
Realized and Unrealized Gain (Loss) Net realized gain (loss) on: | ||
Investment securities: | ||
Unaffiliated issuers | 125,690,089 | |
Other affiliated issuers | (96,443) | |
Foreign currency transactions | 46,400 | |
Total net realized gain (loss) | 125,640,046 | |
Change in net unrealized appreciation (depreciation) on investment securities | 15,144,274 | |
Net gain (loss) | 140,784,320 | |
Net increase (decrease) in net assets resulting from operations | $ 141,736,710 | |
See accompanying notes which are an integral part of the financial statements.
Annual Report
Select Defense and Aerospace Portfolio
Financial Statements - continued
Statement of Changes in Net Assets
Year ended | Year ended | |
Increase (Decrease) in Net Assets | ||
Operations | ||
Net investment income (loss) | $ 952,390 | $ 1,419,609 |
Net realized gain (loss) | 125,640,046 | 67,339,025 |
Change in net unrealized appreciation (depreciation) | 15,144,274 | 88,845,184 |
Net increase (decrease) in net assets resulting from operations | 141,736,710 | 157,603,818 |
Distributions to shareholders from net investment income | (612,095) | (1,154,317) |
Distributions to shareholders from net realized gain | (80,003,674) | (34,919,985) |
Total distributions | (80,615,769) | (36,074,302) |
Share transactions | 585,618,510 | 520,738,976 |
Reinvestment of distributions | 77,580,350 | 34,754,666 |
Cost of shares redeemed | (423,187,600) | (358,203,751) |
Net increase (decrease) in net assets resulting from share transactions | 240,011,260 | 197,289,891 |
Redemption fees | 113,031 | 112,951 |
Total increase (decrease) in net assets | 301,245,232 | 318,932,358 |
Net Assets | ||
Beginning of period | 902,048,778 | 583,116,420 |
End of period (including undistributed net investment income of $542,092 and undistributed net investment income of $237,024, respectively) | $ 1,203,294,010 | $ 902,048,778 |
Other Information Shares | ||
Sold | 7,180,965 | 7,213,251 |
Issued in reinvestment of distributions | 956,556 | 475,557 |
Redeemed | (5,322,738) | (4,936,594) |
Net increase (decrease) | 2,814,783 | 2,752,214 |
Financial Highlights
Years ended February 28, | 2007 | 2006 | 2005 | 2004 G | 2003 |
Selected Per-Share Data | |||||
Net asset value, beginning of period | $ 78.91 | $ 67.18 | $ 55.07 | $ 36.30 | $ 46.08 |
Income from Investment Operations | |||||
Net investment income (loss) C | .08 | .13 | .25 | (.09) | - H |
Net realized and unrealized gain (loss) | 12.07 | 15.04 | 12.28 | 18.85 | (9.77) |
Total from investment operations | 12.15 | 15.17 | 12.53 | 18.76 | (9.77) |
Distributions from net investment income | (.05) | (.11) | (.19) | - | (.04) |
Distributions from net realized gain | (6.56) | (3.34) | (.25) | - | - |
Total distributions | (6.61) | (3.45) | (.44) | - | (.04) |
Redemption fees added to paid in capital C | .01 | .01 | .02 | .01 | .03 |
Net asset value, end of period | $ 84.46 | $ 78.91 | $ 67.18 | $ 55.07 | $ 36.30 |
Total Return A, B | 15.90% | 23.02% | 22.82% | 51.71% | (21.16)% |
Ratios to Average Net Assets D, F | |||||
Expenses before reductions | .92% | .97% | 1.02% | 1.28% | 1.25% |
Expenses net of fee waivers, if any | .92% | .97% | 1.02% | 1.28% | 1.25% |
Expenses net of all reductions | .92% | .95% | 1.00% | 1.24% | 1.21% |
Net investment income (loss) | .10% | .19% | .41% | (.19)% | -% |
Supplemental Data | |||||
Net assets, end of period (000 omitted) | $ 1,203,294 | $ 902,049 | $ 583,116 | $ 321,915 | $ 264,301 |
Portfolio turnover rate E | 82% | 50% | 38% | 47% | 79% |
A Total returns would have been lower had certain expenses not been reduced during the periods shown.
B Total returns do not include the effect of the former sales charges.
C Calculated based on average shares outstanding during the period.
D Fees and expenses of the underlying Fidelity Central Funds are not included in the Fund's expense ratio. The Fund indirectly bears its proportionate share of the expenses of any underlying Fidelity Central Funds.
E Amount does not include the portfolio activity of any underlying Fidelity Central Funds.
F Expense ratios reflect operating expenses of the Fund. Expenses before reductions do not reflect amounts reimbursed by the investment adviser or reductions from brokerage service arrangements or other expense offset arrangements and do not represent the amount paid by the Fund during periods when reimbursements or reductions occur. Expenses net of fee waivers reflect expenses after reimbursement by the investment adviser but prior to reductions from brokerage service arrangements or other expense offset arrangements. Expenses net of all reductions represent the net expenses paid by the Fund.
G For the year ended February 29.
H Amount represents less than $.01 per share.
See accompanying notes which are an integral part of the financial statements.
Annual Report
Select Environmental Portfolio
Performance
Average annual total return reflects the change in the value of an investment, assuming reinvestment of the fund's dividend income and capital gains (the profits earned upon the sale of securities that have grown in value) and assuming a constant rate of performance each year. The $10,000 table and the fund's returns do not reflect the deduction of taxes that a shareholder would pay on fund distributions or the redemption of fund shares. During periods of reimbursement by Fidelity a fund's total returns will be greater than it would be had the reimbursement not occurred. How a fund did yesterday is no guarantee of how it will do tomorrow.
Average Annual Total Returns
Periods ended February 28, 2007 | Past 1 | Past 5 | Past 10 |
Select Environmental Portfolio | -0.81% | 8.25% | 1.76% |
$10,000 Over 10 Years
Let's say hypothetically that $10,000 was invested in Select Environmental Portfolio on February 28, 1997. The chart shows how the value of your investment would have changed, and also shows how the S&P 500 Index performed over the same period.
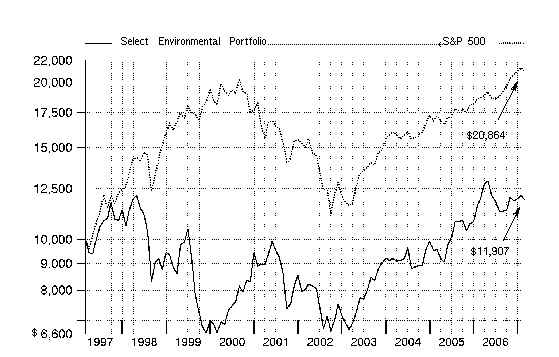
Annual Report
Select Environmental Portfolio
Management's Discussion of Fund Performance
Comments from Douglas Simmons, who managed Fidelity® Select Environmental Portfolio during the period covered by this report
A rosy year for stocks wilted just prior to the end of the 12-month period ending February 28, 2007. On the day prior to the period's close, the Dow Jones Industrial AverageSM plunged 416 points and the Standard & Poor's 500SM Index lost roughly 3.5% of its value, plummeting nearly 50 points and marking the benchmark's worst single-day performance since the day the market reopened after the 9/11 terrorist attacks. Though investors were obviously rattled by the development, it was only the 22nd-biggest decline for the S&P 500® in 20 years, and it could not overshadow how well stocks performed for the 12 months overall. For much of the past year, investors grew confident that the economy would not fall into a recession, and they bid up most broad-based stock indexes for six consecutive months from August through January. Overall for the year ending February 28, 2007, the S&P 500 was up 11.97%, the Dow advanced 14.24%, the small-cap Russell 2000® Index gained 9.87% and the NASDAQ Composite® Index rose 6.66%.
For the 12 months ending February 28, 2007, the fund returned -0.81%, underperforming the 11.51% gain of the Morgan Stanley Capital InternationalSM (MSCI®) US Investable Market Industrials Index and the 10.33% advance of a blended index specific to this fund. This blended index is a combination of the Goldman Sachs® Cyclical Industries Index, which the fund was compared with through September, and the new MSCI benchmark mentioned above, which the fund was compared with during the period's final five months1. During the same 12-month period, the fund lagged the S&P 500. The main factors behind the fund's underperformance of the Goldman Sachs index during the first seven months were unsuccessful security selection in the industrial machinery and electrical components/equipment groups, as well as not owning index-component aerospace and defense stocks. Overweighting the environmental and facility services area and positive stock selection in multi-utilities helped. Individual detractors included water infrastructure company Pentair, industrial filtration firms Donaldson and Pall, and an out-of-benchmark position in life sciences filtration firm Millipore. European water utility conglomerate Veolia Environnement - not part of the index - medical waste disposal company Stericycle, and an out-of-benchmark position in environmental clean-up and remediation firm Clean Harbors helped performance. During the last five months of the period, the fund underperformed its new MSCI Industrials index due to unsuccessful security selection within two out-of-benchmark groups - food retailing and specialty chemicals. Not investing in industrial conglomerates helped, as they underperformed the broader MSCI index. Major detractors included environmental facility and services company Waste Management and filtration provider Donaldson, as well as out-of-benchmark positions in food retailer Whole Foods Market and specialty chemicals firm Ecolab. Contributions came from not owning major index component General Electric as well as from holdings in Pentair and environmental and facility services company Waste Connections. Some of the stocks mentioned here were not in the fund at period end.
1 The fund's blended index is a customized index developed by Fidelity for the limited purpose of discussing the fund's performance for the 12-month period ending February 28, 2007. From March 1, 2006, through September 30, 2006, the fund compared its performance to the Goldman Sachs Cyclical Industries Index, which returned 1.77% during that period. On October 1, 2006, the fund began comparing its performance to a different index, the MSCI US Investable Market Industrials Index, which returned 8.41% from October 1, 2006, through February 28, 2007. For the 12-month period ending February 28, 2007, the blended index (Goldman Sachs and MSCI) returned 10.33%.
Note to shareholders: Stavros Koutsantonis will become manager of the fund on March 1, 2007.
The views expressed above reflect those of the portfolio manager(s) only through the end of the period as stated on the cover of this report and do not necessarily represent the views of Fidelity or any other person in the Fidelity organization. Any such views are subject to change at any time based upon market or other conditions and Fidelity disclaims any responsibility to update such views. These views may not be relied on as investment advice and, because investment decisions for a Fidelity fund are based on numerous factors, may not be relied on as an indication of trading intent on behalf of any Fidelity fund.
Annual Report
Select Environmental Portfolio
Investment Changes
Top Ten Stocks as of February 28, 2007 | ||
% of fund's | % of fund's net assets | |
Veolia Environnement sponsored ADR | 10.9 | 6.0 |
Ecolab, Inc. | 8.6 | 6.8 |
Republic Services, Inc. | 7.4 | 4.5 |
Donaldson Co., Inc. | 6.1 | 0.0 |
Allied Waste Industries, Inc. | 6.0 | 4.6 |
Whole Foods Market, Inc. | 5.5 | 3.7 |
Waste Management, Inc. | 4.8 | 11.5 |
Covanta Holding Corp. | 4.8 | 0.0 |
Waste Connections, Inc. | 4.7 | 4.5 |
Stericycle, Inc. | 4.6 | 4.5 |
63.4 | ||
Top Industries (% of fund's net assets) | |||
As of February 28, 2007 | |||
| Commercial Services & Supplies | 38.9% | |
| Machinery | 15.1% | |
| Multi-utilities | 10.9% | |
| Chemicals | 9.4% | |
| Food & Staples Retailing | 8.1% | |
| All Others* | 17.6% | |
As of August 31, 2006 | |||
| Commercial Services & Supplies | 35.5% | |
| Food & Staples Retailing | 8.6% | |
| Chemicals | 7.4% | |
| Life Sciences Tools & Services | 7.2% | |
| Independent Power Producers & Energy Traders | 6.7% | |
| All Others* | 34.6% | |
* Includes short-term investments and net other assets. |
Annual Report
Select Environmental Portfolio
Investments February 28, 2007
Showing Percentage of Net Assets
Common Stocks - 95.7% | |||
Shares | Value | ||
AUTO COMPONENTS - 1.0% | |||
Auto Parts & Equipment - 1.0% | |||
Ballard Power Systems, Inc. (a)(d) | 77,200 | $ 467,060 | |
CHEMICALS - 9.4% | |||
Commodity Chemicals - 0.8% | |||
Calgon Carbon Corp. (a)(d) | 51,400 | 349,520 | |
Specialty Chemicals - 8.6% | |||
Ecolab, Inc. | 94,700 | 4,005,810 | |
TOTAL CHEMICALS | 4,355,330 | ||
COMMERCIAL SERVICES & SUPPLIES - 38.9% | |||
Diversified Commercial & Professional Services - 1.5% | |||
Tetra Tech, Inc. (a) | 39,000 | 695,370 | |
Environmental & Facility Services - 37.4% | |||
Allied Waste Industries, Inc. | 218,200 | 2,797,324 | |
Bennett Environmental, Inc. (a) | 45,900 | 30,612 | |
Casella Waste Systems, Inc. Class A (a) | 19,600 | 231,476 | |
Clean Harbors, Inc. (a) | 41,300 | 2,086,063 | |
Covanta Holding Corp. (a) | 97,700 | 2,221,698 | |
Republic Services, Inc. | 81,400 | 3,424,498 | |
Stericycle, Inc. (a)(d) | 27,600 | 2,147,556 | |
Waste Connections, Inc. | 49,100 | 2,171,202 | |
Waste Management, Inc. | 66,193 | 2,253,872 | |
17,364,301 | |||
TOTAL COMMERCIAL SERVICES & SUPPLIES | 18,059,671 | ||
CONSTRUCTION & ENGINEERING - 0.9% | |||
Construction & Engineering - 0.9% | |||
Insituform Technologies, Inc. Class A (a) | 17,000 | 430,780 | |
ELECTRICAL EQUIPMENT - 2.8% | |||
Electrical Components & Equipment - 2.1% | |||
FuelCell Energy, Inc. (d) | 40,400 | 278,760 | |
Hydrogenics Corp. (a) | 64,100 | 74,997 | |
Suntech Power Holdings Co. Ltd. sponsored ADR (a)(d) | 16,500 | 598,125 | |
951,882 | |||
Heavy Electrical Equipment - 0.7% | |||
Capstone Turbine Corp. (a)(d) | 99,600 | 87,648 | |
Plug Power, Inc. (a)(d) | 67,900 | 236,292 | |
323,940 | |||
TOTAL ELECTRICAL EQUIPMENT | 1,275,822 | ||
Shares | Value | ||
ENERGY EQUIPMENT & SERVICES - 0.9% | |||
Oil & Gas Equipment & Services - 0.9% | |||
Newpark Resources, Inc. (a) | 66,400 | $ 405,040 | |
FOOD & STAPLES RETAILING - 8.1% | |||
Food Distributors - 1.8% | |||
United Natural Foods, Inc. (a) | 28,400 | 845,752 | |
Food Retail - 6.3% | |||
Whole Foods Market, Inc. | 53,500 | 2,555,695 | |
Wild Oats Markets, Inc. (a) | 18,900 | 347,571 | |
2,903,266 | |||
TOTAL FOOD & STAPLES RETAILING | 3,749,018 | ||
FOOD PRODUCTS - 2.7% | |||
Packaged Foods & Meats - 2.7% | |||
Hain Celestial Group, Inc. (a) | 28,600 | 829,686 | |
SunOpta, Inc. (a) | 40,000 | 428,000 | |
1,257,686 | |||
INDEPENDENT POWER PRODUCERS & ENERGY TRADERS - 4.0% | |||
Independent Power Producers & Energy Traders - 4.0% | |||
Nevada Geothermal Power, Inc. (a)(e) | 1,300,000 | 867,000 | |
Nevada Geothermal Power, Inc. warrants 4/4/08 (a) | 1,300,000 | 50,078 | |
Ormat Technologies, Inc. (d) | 24,000 | 932,400 | |
1,849,478 | |||
MACHINERY - 15.1% | |||
Construction & Farm Machinery & Heavy Trucks - 1.3% | |||
Lindsay Corp. | 17,400 | 597,516 | |
Industrial Machinery - 13.8% | |||
CLARCOR, Inc. | 39,100 | 1,211,709 | |
Donaldson Co., Inc. | 78,900 | 2,829,354 | |
ESCO Technologies, Inc. (a) | 21,800 | 950,262 | |
Kadant, Inc. (a) | 24,200 | 567,248 | |
Pentair, Inc. | 26,900 | 839,818 | |
6,398,391 | |||
TOTAL MACHINERY | 6,995,907 | ||
MULTI-UTILITIES - 10.9% | |||
Multi-Utilities - 10.9% | |||
Veolia Environnement sponsored ADR (d) | 71,500 | 5,040,751 | |
OIL, GAS & CONSUMABLE FUELS - 1.0% | |||
Coal & Consumable Fuels - 1.0% | |||
Cameco Corp. | 12,600 | 465,948 | |
Common Stocks - continued | |||
Shares | Value | ||
SEMICONDUCTORS & SEMICONDUCTOR EQUIPMENT - 0.0% | |||
Semiconductors - 0.0% | |||
JA Solar Holdings Co. Ltd. ADR | 200 | $ 3,850 | |
Trina Solar Ltd. ADR | 200 | 9,020 | |
12,870 | |||
TOTAL COMMON STOCKS (Cost $42,523,845) | 44,365,361 | ||
Money Market Funds - 15.6% | |||
Fidelity Cash Central Fund, 5.35% (b) | 2,054,624 | 2,054,624 | |
Fidelity Securities Lending Cash Central Fund, 5.34% (b)(c) | 5,197,425 | 5,197,425 | |
TOTAL MONEY MARKET FUNDS (Cost $7,252,049) | 7,252,049 | ||
TOTAL INVESTMENT PORTFOLIO - 111.3% (Cost $49,775,894) | 51,617,410 | ||
NET OTHER ASSETS - (11.3)% | (5,240,846) | ||
NET ASSETS - 100% | $ 46,376,564 | ||
Legend |
(a) Non-income producing |
(b) Affiliated fund that is available only to investment companies and other accounts managed by Fidelity Investments. The rate quoted is the annualized seven-day yield of the fund at period end. A complete unaudited listing of the fund's holdings as of its most recent quarter end is available upon request. |
(c) Investment made with cash collateral received from securities on loan. |
(d) Security or a portion of the security is on loan at period end. |
(e) Security exempt from registration under Rule 144A of the Securities Act of 1933. These securities may be resold in transactions exempt from registration, normally to qualified institutional buyers. At the end of the period, the value of these securities amounted to $867,000 or 1.9% of net assets. |
Affiliated Central Funds |
Information regarding fiscal year to date income earned by the Fund from investments in Fidelity Central Funds is as follows: |
Fund | Income earned |
Fidelity Cash Central Fund | $ 150,608 |
Fidelity Securities Lending Cash Central Fund | 121,074 |
Total | $ 271,682 |
Other Information |
Distribution of investments by country of issue, as a percentage of total net assets, is as follows: |
United States of America | 82.6% |
France | 10.9% |
Canada | 5.2% |
Cayman Islands | 1.3% |
100.0% |
Income Tax Information |
At February 28, 2007, the fund had a capital loss carryforward of approximately $4,005,657 of which $10,408 and $3,995,249 will expire on February 29, 2012 and February 28, 2015, respectively. |
See accompanying notes which are an integral part of the financial statements.
Annual Report
Select Environmental Portfolio
Financial Statements
Statement of Assets and Liabilities
February 28, 2007 | ||
Assets | ||
Investment in securities, at value (including securities loaned of $5,028,672) - See accompanying schedule: Unaffiliated issuers (cost $42,523,845) | $ 44,365,361 | |
Fidelity Central Funds (cost $7,252,049) | 7,252,049 | |
Total Investments (cost $49,775,894) | $ 51,617,410 | |
Receivable for fund shares sold | 159,728 | |
Dividends receivable | 29,153 | |
Distributions receivable from Fidelity Central Funds | 5,645 | |
Prepaid expenses | 308 | |
Other receivables | 3,090 | |
Total assets | 51,815,334 | |
Liabilities | ||
Payable for fund shares redeemed | 173,023 | |
Accrued management fee | 22,202 | |
Other affiliated payables | 13,351 | |
Other payables and accrued expenses | 32,769 | |
Collateral on securities loaned, at value | 5,197,425 | |
Total liabilities | 5,438,770 | |
Net Assets | $ 46,376,564 | |
Net Assets consist of: | ||
Paid in capital | $ 48,796,945 | |
Accumulated net investment loss | (205) | |
Accumulated undistributed net realized gain (loss) on investments and foreign currency transactions | (4,261,692) | |
Net unrealized appreciation (depreciation) on investments | 1,841,516 | |
Net Assets, for 2,694,857 shares outstanding | $ 46,376,564 | |
Net Asset Value, offering price and redemption price per share ($46,376,564 ÷ 2,694,857 shares) | $ 17.21 | |
Statement of Operations
Year ended February 28, 2007 | ||
Investment Income | ||
Dividends | $ 474,143 | |
Interest | 4,534 | |
Income from Fidelity Central Funds (including $121,074 from security lending) | 271,682 | |
Total income | 750,359 | |
Expenses | ||
Management fee | $ 432,797 | |
Transfer agent fees | 253,716 | |
Accounting and security lending fees | 37,715 | |
Custodian fees and expenses | 16,306 | |
Independent trustees' compensation | 302 | |
Registration fees | 48,816 | |
Audit | 34,705 | |
Legal | 1,481 | |
Interest | 18,680 | |
Miscellaneous | 6,204 | |
Total expenses before reductions | 850,722 | |
Expense reductions | (11,477) | 839,245 |
Net investment income (loss) | (88,886) | |
Realized and Unrealized Gain (Loss) Net realized gain (loss) on: | ||
Investment securities: | ||
Unaffiliated issuers | (3,718,673) | |
Foreign currency transactions | (7,634) | |
Total net realized gain (loss) | (3,726,307) | |
Change in net unrealized appreciation (depreciation) on investment securities | (2,113,664) | |
Net gain (loss) | (5,839,971) | |
Net increase (decrease) in net assets resulting from operations | $ (5,928,857) | |
See accompanying notes which are an integral part of the financial statements.
Annual Report
Select Environmental Portfolio
Financial Statements - continued
Statement of Changes in Net Assets
Year ended | Year ended | |
Increase (Decrease) in Net Assets | ||
Operations | ||
Net investment income (loss) | $ (88,886) | $ (29,976) |
Net realized gain (loss) | (3,726,307) | 1,298,153 |
Change in net unrealized appreciation (depreciation) | (2,113,664) | 3,984,704 |
Net increase (decrease) in net assets resulting from operations | (5,928,857) | 5,252,881 |
Share transactions | 175,272,057 | 75,524,136 |
Cost of shares redeemed | (178,453,053) | (37,407,839) |
Net increase (decrease) in net assets resulting from share transactions | (3,180,996) | 38,116,297 |
Redemption fees | 88,998 | 23,557 |
Total increase (decrease) in net assets | (9,020,855) | 43,392,735 |
Net Assets | ||
Beginning of period | 55,397,419 | 12,004,684 |
End of period (including accumulated net investment loss of $205 and accumulated net investment loss of $223, respectively) | $ 46,376,564 | $ 55,397,419 |
Other Information Shares | ||
Sold | 9,773,005 | 4,815,847 |
Redeemed | (10,271,871) | (2,492,334) |
Net increase (decrease) | (498,866) | 2,323,513 |
Financial Highlights
Years ended February 28, | 2007 | 2006 | 2005 | 2004 G | 2003 |
Selected Per-Share Data | |||||
Net asset value, beginning of period | $ 17.35 | $ 13.80 | $ 13.29 | $ 9.71 | $ 11.58 |
Income from Investment Operations | |||||
Net investment income (loss) C | (.02) | (.02) | (.14) | (.25) | (.20) |
Net realized and unrealized gain (loss) | (.14) | 3.55 | .64 | 3.83 | (1.68) |
Total from investment operations | (.16) | 3.53 | .50 | 3.58 | (1.88) |
Redemption fees added to paid in capital C | .02 | .02 | .01 | - H | .01 |
Net asset value, end of period | $ 17.21 | $ 17.35 | $ 13.80 | $ 13.29 | $ 9.71 |
Total Return A, B | (.81)% | 25.72% | 3.84% | 36.87% | (16.15)% |
Ratios to Average Net Assets D, F | |||||
Expenses before reductions | 1.11% | 1.40% | 1.87% | 2.57% | 2.64% |
Expenses net of fee waivers, if any | 1.11% | 1.25% | 1.83% | 2.50% | 2.50% |
Expenses net of all reductions | 1.09% | 1.16% | 1.74% | 2.50% | 2.45% |
Net investment income (loss) | (.12)% | (.14)% | (1.06)% | (2.12)% | (1.92)% |
Supplemental Data | |||||
Net assets, end of period (000 omitted) | $ 46,377 | $ 55,397 | $ 12,005 | $ 12,269 | $ 9,987 |
Portfolio turnover rate E | 224% | 166% | 220% | 90% | 67% |
A Total returns would have been lower had certain expenses not been reduced during the periods shown.
B Total returns do not include the effect of the former sales charges.
C Calculated based on average shares outstanding during the period.
D Fees and expenses of the underlying Fidelity Central Funds are not included in the Fund's expense ratio. The Fund indirectly bears its proportionate share of the expenses of any underlying Fidelity Central Funds.
E Amount does not include the portfolio activity of any underlying Fidelity Central Funds.
F Expense ratios reflect operating expenses of the Fund. Expenses before reductions do not reflect amounts reimbursed by the investment adviser or reductions from brokerage service arrangements or other expense offset arrangements and do not represent the amount paid by the Fund during periods when reimbursements or reductions occur. Expenses net of fee waivers reflect expenses after reimbursement by the investment adviser but prior to reductions from brokerage service arrangements or other expense offset arrangements. Expenses net of all reductions represent the net expenses paid by the Fund.
G For the year ended February 29.
H Amount represents less than $.01 per share.
See accompanying notes which are an integral part of the financial statements.
Annual Report
Select Industrial Equipment Portfolio
Performance
Average annual total return reflects the change in the value of an investment, assuming reinvestment of the fund's dividend income and capital gains (the profits earned upon the sale of securities that have grown in value) and assuming a constant rate of performance each year. The $10,000 table and the fund's returns do not reflect the deduction of taxes that a shareholder would pay on fund distributions or the redemption of fund shares. During periods of reimbursement by Fidelity a fund's total returns will be greater than it would be had the reimbursement not occurred. How a fund did yesterday is no guarantee of how it will do tomorrow.
Average Annual Total Returns
Periods ended February 28, 2007 | Past 1 | Past 5 | Past 10 |
Select Industrial Equipment Portfolio | 9.59% | 9.51% | 8.62% |
$10,000 Over 10 Years
Let's say hypothetically that $10,000 was invested in Select Industrial Equipment Portfolio on February 28, 1997. The chart shows how the value of your investment would have changed, and also shows how the S&P 500 Index performed over the same period.
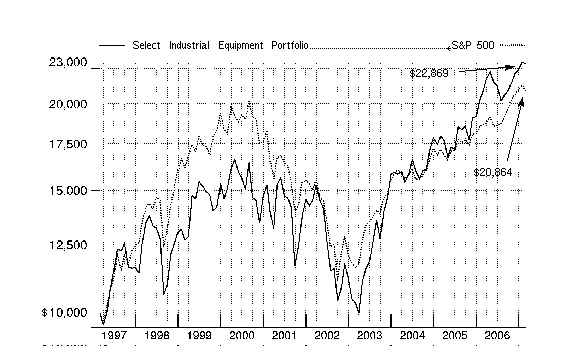
Annual Report
Select Industrial Equipment Portfolio
Management's Discussion of Fund Performance
Comments from Christopher Bartel, who managed Fidelity® Select Industrial Equipment Portfolio during the period covered by this report
A rosy year for stocks wilted just prior to the end of the 12-month period ending February 28, 2007. On the day prior to the period's close, the Dow Jones Industrial AverageSM plunged 416 points and the Standard & Poor's 500SM Index lost roughly 3.5% of its value, plummeting nearly 50 points and marking the benchmark's worst single-day performance since the day the market reopened after the 9/11 terrorist attacks. Though investors were obviously rattled by the development, it was only the 22nd-biggest decline for the S&P 500® in 20 years, and it could not overshadow how well stocks performed for the 12 months overall. For much of the past year, investors grew confident that the economy would not fall into a recession, and they bid up most broad-based stock indexes for six consecutive months from August through January. Overall for the year ending February 28, 2007, the S&P 500 was up 11.97%, the Dow advanced 14.24%, the small-cap Russell 2000® Index gained 9.87% and the NASDAQ Composite® Index rose 6.66%.
During the past year, the fund returned 9.59%, trailing the 12.58% return of the Morgan Stanley Capital InternationalSM (MSCI®) US Investable Market Capital Goods Index and also falling a little short of the 10.09% gain of a blended index specific to this fund. This blended index is a combination of the Goldman Sachs® Cyclical Industries Index, which the fund was compared with through September, and the new MSCI benchmark mentioned above, which the fund was compared with during the period's final five months1. During the same 12-month period, the fund trailed the S&P 500 as well. For the first seven months of the review period, the fund underperformed the Goldman Sachs index. Unrewarding stock selection in the oil and gas equipment/services group hurt the most. An underweighting and unfavorable stock picks in aerospace and defense also held back our results, as did an overweighting in semiconductor equipment. Conversely, having no exposure to homebuilders or railroads - groups outside of the fund's focus - was beneficial, along with favorable stock selection in building products and in industrial machinery. Among individual holdings, a large out-of-index position in energy services provider Halliburton detracted from performance, as falling energy prices led to fears that exploration activity might be curtailed. Not owning a stake in index component General Motors also was counterproductive. On the positive side, timely ownership of WESCO International, an electrical products distributor serving the nonresidential construction markets, made it the fund's top contributor. During the final five months of the period, the fund outperformed the MSCI index, as stock selection was a positive factor in industrial machinery, construction and farm machinery/heavy trucks, and industrial conglomerates. These favorable factors were partially offset by a sizable underweighting in the aerospace and defense group, which performed well. At the company level, an out-of-index position in Finland-based KCI Konecranes, a maker of mobile lift equipment, helped the most versus the MSCI index, as the stock benefited from a continued recovery in European industrial activity. Meanwhile, farm equipment provider Deere saw its stock post a strong advance in response to a rebound in corn prices driven by demand for ethanol fuels. Underweighting General Electric, representing nearly 30% of the MSCI index, also aided performance. Looking at detractors, not having positions in heavy-duty truck maker Paccar or construction equipment manufacturer Terex was detrimental, as both index components recorded double-digit gains. Overall, the fund became more concentrated in its primary areas of focus to be more in line with the new MSCI benchmark.
1 The fund's blended index is a customized index developed by Fidelity for the limited purpose of discussing the fund's performance for the 12-month period ending February 28, 2007. From March 1, 2006, through September 30, 2006, the fund compared its performance to the Goldman Sachs Cyclical Industries Index, which returned 1.77% during that period. On October 1, 2006, the fund began comparing its performance to a different index, the MSCI US Investable Market Capital Goods Index, which returned 8.18% from October 1, 2006, through February 28, 2007. For the 12-month period ending February 28, 2007, the blended index (Goldman Sachs and MSCI) returned 10.09%.
Note to shareholders: Vincent Montemaggiore will become manager of the fund on March 1, 2007.
The views expressed above reflect those of the portfolio manager(s) only through the end of the period as stated on the cover of this report and do not necessarily represent the views of Fidelity or any other person in the Fidelity organization. Any such views are subject to change at any time based upon market or other conditions and Fidelity disclaims any responsibility to update such views. These views may not be relied on as investment advice and, because investment decisions for a Fidelity fund are based on numerous factors, may not be relied on as an indication of trading intent on behalf of any Fidelity fund.
Annual Report
Select Industrial Equipment Portfolio
Investment Changes
Top Ten Stocks as of February 28, 2007 | ||
% of fund's | % of fund's net assets | |
General Electric Co. | 22.0 | 5.5 |
Tyco International Ltd. | 7.6 | 6.5 |
United Technologies Corp. | 5.6 | 0.0 |
Deere & Co. | 4.6 | 3.9 |
Honeywell International, Inc. | 4.0 | 6.2 |
3M Co. | 4.0 | 0.0 |
American Standard Companies, Inc. | 2.9 | 2.1 |
Danaher Corp. | 2.8 | 3.4 |
Illinois Tool Works, Inc. | 2.8 | 2.5 |
Emerson Electric Co. | 2.8 | 5.3 |
59.1 | ||
Top Industries (% of fund's net assets) | |||
As of February 28, 2007 | |||
| Industrial Conglomerates | 34.6% | |
| Machinery | 26.0% | |
| Aerospace & Defense | 21.3% | |
| Electrical Equipment | 7.3% | |
| Building Products | 3.9% | |
| All Others* | 6.9% | |
As of August 31, 2006 | |||
| Machinery | 35.5% | |
| Industrial Conglomerates | 13.3% | |
| Electrical Equipment | 11.0% | |
| Semiconductors | 9.0% | |
| Aerospace & Defense | 8.3% | |
| All Others* | 22.9% | |
* Includes short-term investments and net other assets. |
Annual Report
Select Industrial Equipment Portfolio
Investments February 28, 2007
Showing Percentage of Net Assets
Common Stocks - 99.2% | |||
Shares | Value | ||
AEROSPACE & DEFENSE - 21.3% | |||
Aerospace & Defense - 21.3% | |||
AeroVironment, Inc. | 700 | $ 14,889 | |
DRS Technologies, Inc. | 4,500 | 238,455 | |
General Dynamics Corp. | 21,200 | 1,620,952 | |
Goodrich Corp. | 9,900 | 485,595 | |
Honeywell International, Inc. | 72,000 | 3,343,680 | |
L-3 Communications Holdings, Inc. | 2,500 | 217,750 | |
Lockheed Martin Corp. | 9,100 | 885,248 | |
Precision Castparts Corp. | 12,400 | 1,128,028 | |
Raytheon Co. | 42,600 | 2,281,230 | |
Rockwell Collins, Inc. | 10,700 | 700,636 | |
The Boeing Co. | 23,700 | 2,068,299 | |
United Technologies Corp. | 70,300 | 4,613,789 | |
17,598,551 | |||
BUILDING PRODUCTS - 3.9% | |||
Building Products - 3.9% | |||
American Standard Companies, Inc. | 45,400 | 2,405,746 | |
Masco Corp. | 28,100 | 838,785 | |
3,244,531 | |||
COMPUTERS & PERIPHERALS - 0.6% | |||
Computer Hardware - 0.6% | |||
NCR Corp. (a) | 10,400 | 480,480 | |
CONSTRUCTION & ENGINEERING - 1.9% | |||
Construction & Engineering - 1.9% | |||
EMCOR Group, Inc. (a) | 13,900 | 834,834 | |
KBR, Inc. | 500 | 11,365 | |
SNC-Lavalin Group, Inc. | 15,900 | 488,603 | |
URS Corp. (a) | 5,100 | 212,007 | |
1,546,809 | |||
ELECTRICAL EQUIPMENT - 7.3% | |||
Electrical Components & Equipment - 7.3% | |||
AMETEK, Inc. | 26,850 | 918,270 | |
Cooper Industries Ltd. Class A | 18,000 | 1,651,320 | |
Emerson Electric Co. | 53,300 | 2,296,697 | |
Hubbell, Inc. Class B | 4,200 | 202,860 | |
Rockwell Automation, Inc. | 10,100 | 627,109 | |
Roper Industries, Inc. | 5,900 | 313,408 | |
6,009,664 | |||
ENERGY EQUIPMENT & SERVICES - 1.0% | |||
Oil & Gas Equipment & Services - 1.0% | |||
Halliburton Co. | 26,100 | 805,968 | |
Shares | Value | ||
INDUSTRIAL CONGLOMERATES - 34.6% | |||
Industrial Conglomerates - 34.6% | |||
3M Co. | 45,000 | $ 3,333,600 | |
General Electric Co. | 519,550 | 18,142,686 | |
Textron, Inc. | 9,000 | 830,610 | |
Tyco International Ltd. | 203,900 | 6,286,237 | |
28,593,133 | |||
MACHINERY - 26.0% | |||
Construction & Farm Machinery & Heavy Trucks - 10.7% | |||
AGCO Corp. (a) | 15,400 | 558,250 | |
Astec Industries, Inc. (a) | 8,200 | 315,372 | |
Bucyrus International, Inc. Class A | 4,550 | 231,823 | |
Caterpillar, Inc. | 29,000 | 1,868,180 | |
Deere & Co. | 35,125 | 3,808,253 | |
Joy Global, Inc. | 8,100 | 359,154 | |
Manitowoc Co., Inc. | 9,000 | 528,300 | |
Oshkosh Truck Co. | 8,100 | 434,565 | |
Toro Co. | 4,700 | 246,985 | |
Toromont Industries Ltd. | 19,300 | 429,714 | |
8,780,596 | |||
Industrial Machinery - 15.3% | |||
Actuant Corp. Class A | 8,000 | 417,600 | |
Atlas Copco AB (B Shares) | 15,800 | 472,181 | |
Danaher Corp. | 32,600 | 2,335,464 | |
Donaldson Co., Inc. | 5,300 | 190,058 | |
Dover Corp. | 32,200 | 1,538,838 | |
Harsco Corp. | 5,000 | 429,000 | |
IDEX Corp. | 4,600 | 239,246 | |
Illinois Tool Works, Inc. | 45,100 | 2,331,670 | |
ITT Corp. | 29,600 | 1,752,912 | |
KCI Konecranes Oyj | 42,250 | 1,318,953 | |
Pentair, Inc. | 6,000 | 187,320 | |
Schindler Holding AG (participation certificate) | 15,073 | 952,304 | |
SPX Corp. | 7,000 | 489,300 | |
12,654,846 | |||
TOTAL MACHINERY | 21,435,442 | ||
MARINE - 0.5% | |||
Marine - 0.5% | |||
Kirby Corp. (a) | 12,500 | 456,750 | |
TRADING COMPANIES & DISTRIBUTORS - 2.1% | |||
Trading Companies & Distributors - 2.1% | |||
Fastenal Co. | 10,100 | 356,227 | |
Finning International, Inc. | 11,900 | 530,619 | |
W.W. Grainger, Inc. | 5,000 | 385,750 | |
WESCO International, Inc. (a) | 6,900 | 460,437 | |
1,733,033 | |||
TOTAL COMMON STOCKS (Cost $65,604,172) | 81,904,361 | ||
Money Market Funds - 0.1% | |||
Shares | Value | ||
Fidelity Cash Central Fund, 5.35% (b) | 71,159 | $ 71,159 | |
TOTAL INVESTMENT PORTFOLIO - 99.3% (Cost $65,675,331) | 81,975,520 | ||
NET OTHER ASSETS - 0.7% | 552,228 | ||
NET ASSETS - 100% | $ 82,527,748 | ||
Legend |
(a) Non-income producing |
(b) Affiliated fund that is available only to investment companies and other accounts managed by Fidelity Investments. The rate quoted is the annualized seven-day yield of the fund at period end. A complete unaudited listing of the fund's holdings as of its most recent quarter end is available upon request. |
Affiliated Central Funds |
Information regarding fiscal year to date income earned by the Fund from investments in Fidelity Central Funds is as follows: |
Fund | Income earned |
Fidelity Cash Central Fund | $ 97,911 |
Fidelity Securities Lending Cash Central Fund | 7,194 |
Total | $ 105,105 |
See accompanying notes which are an integral part of the financial statements.
Annual Report
Select Industrial Equipment Portfolio
Financial Statements
Statement of Assets and Liabilities
February 28, 2007 | ||
Assets | ||
Investment in securities, at value - See accompanying schedule: Unaffiliated issuers (cost $65,604,172) | $ 81,904,361 | |
Fidelity Central Funds (cost $71,159) | 71,159 | |
Total Investments (cost $65,675,331) | $ 81,975,520 | |
Receivable for investments sold | 509,291 | |
Receivable for fund shares sold | 86,407 | |
Dividends receivable | 264,726 | |
Distributions receivable from Fidelity Central Funds | 4,955 | |
Prepaid expenses | 344 | |
Other receivables | 137 | |
Total assets | 82,841,380 | |
Liabilities | ||
Payable for fund shares redeemed | 225,631 | |
Accrued management fee | 38,371 | |
Other affiliated payables | 17,538 | |
Other payables and accrued expenses | 32,092 | |
Total liabilities | 313,632 | |
Net Assets | $ 82,527,748 | |
Net Assets consist of: | ||
Paid in capital | $ 64,893,310 | |
Undistributed net investment income | 293,326 | |
Accumulated undistributed net realized gain (loss) on investments and foreign currency transactions | 1,040,724 | |
Net unrealized appreciation (depreciation) on investments and assets and liabilities in foreign currencies | 16,300,388 | |
Net Assets, for 2,620,136 shares outstanding | $ 82,527,748 | |
Net Asset Value, offering price and redemption price per share ($82,527,748 ÷ 2,620,136 shares) | $ 31.50 | |
Statement of Operations
Year ended February 28, 2007 | ||
Investment Income | ||
Dividends | $ 1,250,691 | |
Interest | 15 | |
Income from Fidelity Central Funds (including $7,194 from security lending) | 105,105 | |
Total income | 1,355,811 | |
Expenses | ||
Management fee | $ 484,354 | |
Transfer agent fees | 223,108 | |
Accounting and security lending fees | 39,307 | |
Custodian fees and expenses | 35,416 | |
Independent trustees' compensation | 303 | |
Registration fees | 24,645 | |
Audit | 34,931 | |
Legal | 1,636 | |
Miscellaneous | 3,971 | |
Total expenses before reductions | 847,671 | |
Expense reductions | (3,282) | 844,389 |
Net investment income (loss) | 511,422 | |
Realized and Unrealized Gain (Loss) Net realized gain (loss) on: | ||
Investment securities: | ||
Unaffiliated issuers | 1,629,106 | |
Foreign currency transactions | (895) | |
Total net realized gain (loss) | 1,628,211 | |
Change in net unrealized appreciation (depreciation) on: Investment securities | 2,987,086 | |
Assets and liabilities in foreign currencies | 207 | |
Total change in net unrealized appreciation (depreciation) | 2,987,293 | |
Net gain (loss) | 4,615,504 | |
Net increase (decrease) in net assets resulting from operations | $ 5,126,926 | |
See accompanying notes which are an integral part of the financial statements.
Annual Report
Select Industrial Equipment Portfolio
Financial Statements - continued
Statement of Changes in Net Assets
Year ended | Year ended | |
Increase (Decrease) in Net Assets | ||
Operations | ||
Net investment income (loss) | $ 511,422 | $ 125,878 |
Net realized gain (loss) | 1,628,211 | 3,137,422 |
Change in net unrealized appreciation (depreciation) | 2,987,293 | 3,947,920 |
Net increase (decrease) in net assets resulting from operations | 5,126,926 | 7,211,220 |
Distributions to shareholders from net investment income | (265,173) | (36,844) |
Distributions to shareholders from net realized gain | (918,016) | (3,199,441) |
Total distributions | (1,183,189) | (3,236,285) |
Share transactions | 96,154,133 | 46,137,172 |
Reinvestment of distributions | 1,138,035 | 3,125,450 |
Cost of shares redeemed | (93,519,662) | (24,786,422) |
Net increase (decrease) in net assets resulting from share transactions | 3,772,506 | 24,476,200 |
Redemption fees | 41,433 | 13,961 |
Total increase (decrease) in net assets | 7,757,676 | 28,465,096 |
Net Assets | ||
Beginning of period | 74,770,072 | 46,304,976 |
End of period (including undistributed net investment income of $293,326 and undistributed net investment income of $88,453, respectively) | $ 82,527,748 | $ 74,770,072 |
Other Information Shares | ||
Sold | 3,169,330 | 1,655,158 |
Issued in reinvestment of distributions | 37,422 | 119,637 |
Redeemed | (3,151,568) | (934,451) |
Net increase (decrease) | 55,184 | 840,344 |
Financial Highlights
Years ended February 28, | 2007 | 2006 | 2005 | 2004 G | 2003 |
Selected Per-Share Data | |||||
Net asset value, beginning of period | $ 29.15 | $ 26.85 | $ 24.60 | $ 16.00 | $ 22.54 |
Income from Investment Operations | |||||
Net investment income (loss) C | .18 | .07 | (.04) | (.02) | (.12) |
Net realized and unrealized gain (loss) | 2.59 | 4.02 | 3.26 | 8.59 | (6.43) |
Total from investment operations | 2.77 | 4.09 | 3.22 | 8.57 | (6.55) |
Distributions from net investment income | (.10) | (.02) | - | - | - |
Distributions from net realized gain | (.33) | (1.78) | (.98) | - | - |
Total distributions | (.43) | (1.80) | (.98) | - | - |
Redemption fees added to paid in capital C | .01 | .01 | .01 | .03 | .01 |
Net asset value, end of period | $ 31.50 | $ 29.15 | $ 26.85 | $ 24.60 | $ 16.00 |
Total Return A, B | 9.59% | 16.17% | 13.37% | 53.75% | (29.02)% |
Ratios to Average Net Assets D, F | |||||
Expenses before reductions | .99% | 1.03% | 1.07% | 1.37% | 1.77% |
Expenses net of fee waivers, if any | .99% | 1.03% | 1.07% | 1.37% | 1.77% |
Expenses net of all reductions | .98% | 1.02% | 1.06% | 1.33% | 1.76% |
Net investment income (loss) | .60% | .27% | (.17)% | (.08)% | (.62)% |
Supplemental Data | |||||
Net assets, end of period (000 omitted) | $ 82,528 | $ 74,770 | $ 46,305 | $ 66,383 | $ 17,459 |
Portfolio turnover rate E | 104% | 40% | 51% | 95% | 123% |
A Total returns would have been lower had certain expenses not been reduced during the periods shown.
B Total returns do not include the effect of the former sales charges.
C Calculated based on average shares outstanding during the period.
D Fees and expenses of the underlying Fidelity Central Funds are not included in the Fund's expense ratio. The Fund indirectly bears its proportionate share of the expenses of any underlying Fidelity Central Funds.
E Amount does not include the portfolio activity of any underlying Fidelity Central Funds.
F Expense ratios reflect operating expenses of the Fund. Expenses before reductions do not reflect amounts reimbursed by the investment adviser or reductions from brokerage service arrangements or other expense offset arrangements and do not represent the amount paid by the Fund during periods when reimbursements or reductions occur. Expenses net of fee waivers reflect expenses after reimbursement by the investment adviser but prior to reductions from brokerage service arrangements or other expense offset arrangements. Expenses net of all reductions represent the net expenses paid by the Fund.
G For the year ended February 29.
See accompanying notes which are an integral part of the financial statements.
Annual Report
Performance
Average annual total return reflects the change in the value of an investment, assuming reinvestment of the fund's dividend income and capital gains (the profits earned upon the sale of securities that have grown in value) and assuming a constant rate of performance each year. The $10,000 table and the fund's returns do not reflect the deduction of taxes that a shareholder would pay on fund distributions or the redemption of fund shares. During periods of reimbursement by Fidelity a fund's total returns will be greater than it would be had the reimbursement not occurred. How a fund did yesterday is no guarantee of how it will do tomorrow.
Average Annual Total Returns
Periods ended February 28, 2007 | Past 1 | Past 5 | Life of |
Select Industrials Portfolio | 8.34% | 12.44% | 10.88% |
A From March 3, 1997
Prior to October 1, 2006, Select Industrials Portfolio was named Select Cyclical Industries Portfolio and operated under certain different investment policies. The fund's historical performance may not represent its current investment policies.
$10,000 Over Life of Fund
Let's say hypothetically that $10,000 was invested in Select Industrials Portfolio on March 3, 1997, when the fund started. The chart shows how the value of your investment would have changed, and also shows how the S&P 500 Index performed over the same period.
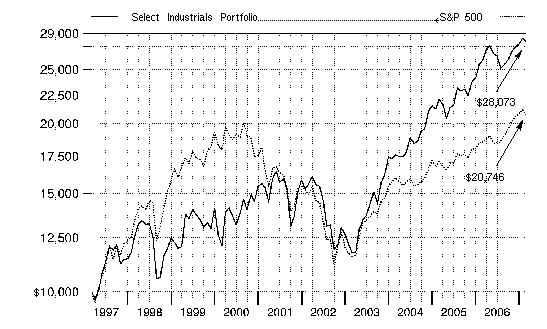
Annual Report
Select Industrials Portfolio
Management's Discussion of Fund Performance
Comments from Christopher Bartel, who managed Fidelity® Select Industrials Portfolio for most of the period covered by this report
A rosy year for stocks wilted just prior to the end of the 12-month period ending February 28, 2007. On the day prior to the period's close, the Dow Jones Industrial AverageSM plunged 416 points and the Standard & Poor's 500SM Index lost roughly 3.5% of its value, plummeting nearly 50 points and marking the benchmark's worst single-day performance since the day the market reopened after the 9/11 terrorist attacks. Though investors were obviously rattled by the development, it was only the 22nd-biggest decline for the S&P 500® in 20 years, and it could not overshadow how well stocks performed for the 12 months overall. For much of the past year, investors grew confident that the economy would not fall into a recession, and they bid up most broad-based stock indexes for six consecutive months from August through January. Overall for the year ending February 28, 2007, the S&P 500 was up 11.97%, the Dow advanced 14.24%, the small-cap Russell 2000® Index gained 9.87% and the NASDAQ Composite® Index rose 6.66%.
During the past year, the fund returned 8.34%, trailing the 11.51% return of the Morgan Stanley Capital InternationalSM (MSCI®) US Investable Market Industrials Index and also falling short of the 10.33% gain of a blended index specific to this fund. This blended index is a combination of the Goldman Sachs® Cyclical Industries Index, which the fund was compared with through September, and the new MSCI benchmark mentioned above, which the fund was compared with during the period's final five months1. During the same 12-month period, the fund trailed the S&P 500 as well. For the first seven months of the review period, the fund modestly underperformed the Goldman Sachs index. An overweighted exposure to construction and engineering had a negative impact on the fund's results, along with unrewarding stock selection in the group. Lackluster picks in aerospace and defense worked against us as well. Counterbalancing these negative factors to some extent were effective choices in steel and in automobile manufacturers, as well as an overweighting in the steel group. Among individual holdings, the biggest detractor was Hexcel, a supplier of composite materials to EADS, the parent company of European commercial aircraft manufacturer Airbus. Both stocks were hurt when EADS - which the fund also owned - announced a delayed rollout of the company's new A380 aircraft and the replacement of the company's co-chief executive officers. Discount airline AirTran Holdings stumbled when the company became involved in a fare war with a rival, depressing profit margins. On the positive side, not owning weak performing auto manufacturer DaimlerChrysler, a major index component, aided our results. Steel producer Allegheny Technologies also had a positive impact. Some of these stocks were sold by period end. During the final five months of the period, the fund slightly trailed the MSCI index, as an underweighted exposure to the construction and farm machinery/heavy trucks segment curbed our return. An overweighting in heavy electrical equipment also hurt but was more than offset by favorable stock selection in that group. Other positive factors included rewarding stock picking in construction and engineering and in air freight and logistics. At the company level, overweighting aerospace and defense conglomerate United Technologies, the fund's second-largest holding at period end, undermined performance, mainly due to weak results at the company's Sikorsky helicopter division and its Carrier heating and air conditioning group. Selling commercial aircraft manufacturer and index component Boeing also hurt. Conversely, the fund's results were aided by its holdings in Switzerland-based ABB, a provider of power transmission and automation equipment for utility and industrial customers. The company benefited from the robust global growth in manufacturing and infrastructure projects. Overall, the fund's focus narrowed during the 12-month period, reflecting the new MSCI benchmark.
1 The fund's blended index is a customized index developed by Fidelity for the limited purpose of discussing the fund's performance for the 12-month period ending February 28, 2007. From March 1, 2006, through September 30, 2006, the fund compared its performance to the Goldman Sachs Cyclical Industries Index, which returned 1.77% during that period. On October 1, 2006, the fund began comparing its performance to a different index, the MSCI US Investable Market Industrials Index, which returned 8.41% from October 1, 2006, through February 28, 2007. For the 12-month period ending February 28, 2007, the blended index (Goldman Sachs and MSCI) returned 10.33%.
Note to shareholders: Tobias Welo became manager of the fund on January 4, 2007.
The views expressed above reflect those of the portfolio manager(s) only through the end of the period as stated on the cover of this report and do not necessarily represent the views of Fidelity or any other person in the Fidelity organization. Any such views are subject to change at any time based upon market or other conditions and Fidelity disclaims any responsibility to update such views. These views may not be relied on as investment advice and, because investment decisions for a Fidelity fund are based on numerous factors, may not be relied on as an indication of trading intent on behalf of any Fidelity fund.
Annual Report
Select Industrials Portfolio
Investment Changes
Top Ten Stocks as of February 28, 2007 | ||
% of fund's | % of fund's net assets | |
General Electric Co. | 17.2 | 8.0 |
United Technologies Corp. | 7.6 | 4.1 |
Honeywell International, Inc. | 5.7 | 3.0 |
Tyco International Ltd. | 4.9 | 2.9 |
Danaher Corp. | 3.4 | 0.9 |
Emerson Electric Co. | 3.2 | 1.7 |
United Parcel Service, Inc. Class B | 3.1 | 1.4 |
Burlington Northern Santa Fe Corp. | 2.8 | 1.0 |
Illinois Tool Works, Inc. | 2.5 | 2.2 |
Raytheon Co. | 2.4 | 1.3 |
52.8 | ||
Top Industries (% of fund's net assets) | |||
As of February 28, 2007 | |||
| Industrial Conglomerates | 23.7% | |
| Aerospace & Defense | 18.8% | |
| Machinery | 13.6% | |
| Road & Rail | 7.6% | |
| Electrical Equipment | 7.1% | |
| All Others* | 29.2% | |
As of August 31, 2006 | |||
| Aerospace & Defense | 16.4% | |
| Industrial Conglomerates | 15.1% | |
| Chemicals | 14.7% | |
| Machinery | 10.9% | |
| Construction & Engineering | 8.0% | |
| All Others* | 34.9% | |
* Includes short-term investments and net other assets. |
Annual Report
Select Industrials Portfolio
Investments February 28, 2007
Showing Percentage of Net Assets
Common Stocks - 98.1% | |||
Shares | Value | ||
AEROSPACE & DEFENSE - 18.8% | |||
Aerospace & Defense - 18.8% | |||
DRS Technologies, Inc. | 7,000 | $ 370,930 | |
General Dynamics Corp. | 20,100 | 1,536,846 | |
Goodrich Corp. | 9,500 | 465,975 | |
Honeywell International, Inc. | 93,100 | 4,323,564 | |
Raytheon Co. | 33,900 | 1,815,345 | |
United Technologies Corp. | 88,000 | 5,775,440 | |
14,288,100 | |||
AIR FREIGHT & LOGISTICS - 5.3% | |||
Air Freight & Logistics - 5.3% | |||
C.H. Robinson Worldwide, Inc. | 16,200 | 825,552 | |
Hub Group, Inc. Class A | 12,722 | 402,906 | |
United Parcel Service, Inc. Class B | 33,800 | 2,372,422 | |
UTI Worldwide, Inc. | 14,088 | 424,612 | |
4,025,492 | |||
AIRLINES - 1.8% | |||
Airlines - 1.8% | |||
AirTran Holdings, Inc. (a) | 24,400 | 254,248 | |
UAL Corp. (a) | 13,300 | 531,867 | |
US Airways Group, Inc. (a) | 10,800 | 564,732 | |
1,350,847 | |||
AUTO COMPONENTS - 0.7% | |||
Auto Parts & Equipment - 0.7% | |||
Johnson Controls, Inc. | 6,100 | 572,180 | |
AUTOMOBILES - 0.7% | |||
Automobile Manufacturers - 0.7% | |||
Renault SA | 4,600 | 547,197 | |
BUILDING PRODUCTS - 1.7% | |||
Building Products - 1.7% | |||
Armstrong World Industries, Inc. (a) | 8,300 | 416,079 | |
Masco Corp. | 30,710 | 916,694 | |
1,332,773 | |||
CHEMICALS - 0.7% | |||
Industrial Gases - 0.6% | |||
Airgas, Inc. | 10,900 | 449,843 | |
Specialty Chemicals - 0.1% | |||
Minerals Technologies, Inc. | 1,600 | 99,024 | |
TOTAL CHEMICALS | 548,867 | ||
COMMERCIAL SERVICES & SUPPLIES - 3.7% | |||
Diversified Commercial & Professional Services - 1.6% | |||
Cintas Corp. | 15,700 | 633,966 | |
The Brink's Co. | 10,100 | 598,223 | |
1,232,189 | |||
Shares | Value | ||
Environmental & Facility Services - 2.1% | |||
Allied Waste Industries, Inc. | 48,700 | $ 624,334 | |
Waste Management, Inc. | 28,600 | 973,830 | |
1,598,164 | |||
TOTAL COMMERCIAL SERVICES & SUPPLIES | 2,830,353 | ||
COMMUNICATIONS EQUIPMENT - 0.5% | |||
Communications Equipment - 0.5% | |||
Harris Corp. | 7,500 | 368,100 | |
CONSTRUCTION & ENGINEERING - 5.1% | |||
Construction & Engineering - 5.1% | |||
Chicago Bridge & Iron Co. NV (NY Shares) | 12,300 | 365,679 | |
Fluor Corp. | 11,300 | 954,511 | |
Foster Wheeler Ltd. (a) | 17,500 | 967,400 | |
Jacobs Engineering Group, Inc. (a) | 7,600 | 686,584 | |
Shaw Group, Inc. (a) | 28,700 | 883,386 | |
3,857,560 | |||
ELECTRICAL EQUIPMENT - 7.1% | |||
Electrical Components & Equipment - 5.7% | |||
AMETEK, Inc. | 16,250 | 555,750 | |
Cooper Industries Ltd. Class A | 14,600 | 1,339,404 | |
Emerson Electric Co. | 56,200 | 2,421,658 | |
4,316,812 | |||
Heavy Electrical Equipment - 1.4% | |||
ABB Ltd. sponsored ADR | 64,700 | 1,083,078 | |
TOTAL ELECTRICAL EQUIPMENT | 5,399,890 | ||
HOUSEHOLD DURABLES - 0.5% | |||
Household Appliances - 0.5% | |||
Black & Decker Corp. | 4,400 | 370,788 | |
INDUSTRIAL CONGLOMERATES - 23.7% | |||
Industrial Conglomerates - 23.7% | |||
General Electric Co. | 374,501 | 13,077,576 | |
Textron, Inc. | 12,700 | 1,172,083 | |
Tyco International Ltd. | 121,545 | 3,747,232 | |
17,996,891 | |||
MACHINERY - 13.6% | |||
Construction & Farm Machinery & Heavy Trucks - 2.6% | |||
Deere & Co. | 12,900 | 1,398,618 | |
Oshkosh Truck Co. | 10,900 | 584,785 | |
1,983,403 | |||
Industrial Machinery - 11.0% | |||
Danaher Corp. | 36,400 | 2,607,696 | |
Dover Corp. | 26,000 | 1,242,540 | |
Flowserve Corp. (a) | 8,600 | 446,512 | |
IDEX Corp. | 7,500 | 390,075 | |
Illinois Tool Works, Inc. | 36,200 | 1,871,540 | |
Common Stocks - continued | |||
Shares | Value | ||
MACHINERY - CONTINUED | |||
Industrial Machinery - continued | |||
ITT Corp. | 20,400 | $ 1,208,088 | |
SPX Corp. | 8,700 | 608,130 | |
8,374,581 | |||
TOTAL MACHINERY | 10,357,984 | ||
MARINE - 0.6% | |||
Marine - 0.6% | |||
Kirby Corp. (a) | 13,300 | 485,982 | |
METALS & MINING - 3.6% | |||
Aluminum - 0.6% | |||
Alcoa, Inc. | 14,500 | 484,445 | |
Steel - 3.0% | |||
Arcelor Mittal | 12,100 | 615,406 | |
Carpenter Technology Corp. | 5,000 | 592,750 | |
Reliance Steel & Aluminum Co. | 22,800 | 1,041,048 | |
2,249,204 | |||
TOTAL METALS & MINING | 2,733,649 | ||
OIL, GAS & CONSUMABLE FUELS - 1.2% | |||
Coal & Consumable Fuels - 1.2% | |||
Massey Energy Co. | 15,800 | 383,308 | |
Peabody Energy Corp. | 12,700 | 513,080 | |
896,388 | |||
ROAD & RAIL - 7.6% | |||
Railroads - 4.9% | |||
Burlington Northern Santa Fe Corp. | 26,600 | 2,106,454 | |
CSX Corp. | 3,800 | 143,146 | |
Union Pacific Corp. | 14,900 | 1,469,587 | |
3,719,187 | |||
Trucking - 2.7% | |||
Con-way, Inc. | 9,600 | 471,360 | |
Shares | Value | ||
Knight Transportation, Inc. | 14,600 | $ 272,728 | |
Landstar System, Inc. | 20,618 | 921,418 | |
Old Dominion Freight Lines, Inc. (a) | 11,625 | 361,654 | |
2,027,160 | |||
TOTAL ROAD & RAIL | 5,746,347 | ||
TRADING COMPANIES & DISTRIBUTORS - 1.2% | |||
Trading Companies & Distributors - 1.2% | |||
UAP Holding Corp. | 14,559 | 369,362 | |
WESCO International, Inc. (a) | 7,800 | 520,494 | |
889,856 | |||
TOTAL COMMON STOCKS (Cost $67,768,371) | 74,599,244 | ||
Money Market Funds - 1.3% | |||
Fidelity Cash Central Fund, 5.35% (b) | 960,383 | 960,383 | |
TOTAL INVESTMENT PORTFOLIO - 99.4% (Cost $68,728,754) | 75,559,627 | ||
NET OTHER ASSETS - 0.6% | 451,555 | ||
NET ASSETS - 100% | $ 76,011,182 | ||
Legend |
(a) Non-income producing |
(b) Affiliated fund that is available only to investment companies and other accounts managed by Fidelity Investments. The rate quoted is the annualized seven-day yield of the fund at period end. A complete unaudited listing of the fund's holdings as of its most recent quarter end is available upon request. |
Affiliated Central Funds |
Information regarding fiscal year to date income earned by the Fund from investments in Fidelity Central Funds is as follows: |
Fund | Income earned |
Fidelity Cash Central Fund | $ 89,011 |
Fidelity Securities Lending Cash Central Fund | 26,794 |
Total | $ 115,805 |
See accompanying notes which are an integral part of the financial statements.
Annual Report
Select Industrials Portfolio
Financial Statements
Statement of Assets and Liabilities
February 28, 2007 | ||
Assets | ||
Investment in securities, at value - See accompanying schedule: Unaffiliated issuers (cost $67,768,371) | $ 74,599,244 | |
Fidelity Central Funds (cost $960,383) | 960,383 | |
Total Investments (cost $68,728,754) | $ 75,559,627 | |
Receivable for investments sold | 946,648 | |
Receivable for fund shares sold | 338,200 | |
Dividends receivable | 214,880 | |
Distributions receivable from Fidelity Central Funds | 4,892 | |
Prepaid expenses | 338 | |
Other receivables | 513 | |
Total assets | 77,065,098 | |
Liabilities | ||
Payable for investments purchased | $ 603,532 | |
Payable for fund shares redeemed | 360,879 | |
Accrued management fee | 35,867 | |
Other affiliated payables | 20,322 | |
Other payables and accrued expenses | 33,316 | |
Total liabilities | 1,053,916 | |
Net Assets | $ 76,011,182 | |
Net Assets consist of: | ||
Paid in capital | $ 63,989,806 | |
Undistributed net investment income | 328,857 | |
Accumulated undistributed net realized gain (loss) on investments and foreign currency transactions | 4,861,736 | |
Net unrealized appreciation (depreciation) on investments and assets and liabilities in foreign currencies | 6,830,783 | |
Net Assets, for 3,671,791 shares outstanding | $ 76,011,182 | |
Net Asset Value, offering price and redemption price per share ($76,011,182 ÷ 3,671,791 shares) | $ 20.70 | |
Statement of Operations
Year ended February 28, 2007 | ||
Investment Income | ||
Dividends | $ 1,320,286 | |
Interest | 44 | |
Income from Fidelity Central Funds (including $26,794 from security lending) | 115,805 | |
Total income | 1,436,135 | |
Expenses | ||
Management fee | $ 460,879 | |
Transfer agent fees | 277,595 | |
Accounting and security lending fees | 37,794 | |
Custodian fees and expenses | 35,695 | |
Independent trustees' compensation | 296 | |
Registration fees | 29,593 | |
Audit | 35,872 | |
Legal | 1,604 | |
Interest | 16,942 | |
Miscellaneous | 6,541 | |
Total expenses before reductions | 902,811 | |
Expense reductions | (8,692) | 894,119 |
Net investment income (loss) | 542,016 | |
Realized and Unrealized Gain (Loss) Net realized gain (loss) on: | ||
Investment securities: | ||
Unaffiliated issuers | 9,419,016 | |
Foreign currency transactions | (6,803) | |
Total net realized gain (loss) | 9,412,213 | |
Change in net unrealized appreciation (depreciation) on: Investment securities | (6,919,005) | |
Assets and liabilities in foreign currencies | 583 | |
Total change in net unrealized appreciation (depreciation) | (6,918,422) | |
Net gain (loss) | 2,493,791 | |
Net increase (decrease) in net assets resulting from operations | $ 3,035,807 | |
See accompanying notes which are an integral part of the financial statements.
Annual Report
Select Industrials Portfolio
Financial Statements - continued
Statement of Changes in Net Assets
Year ended | Year ended | |
Increase (Decrease) in Net Assets | ||
Operations | ||
Net investment income (loss) | $ 542,016 | $ 216,156 |
Net realized gain (loss) | 9,412,213 | 6,498,549 |
Change in net unrealized appreciation (depreciation) | (6,918,422) | 2,768,625 |
Net increase (decrease) in net assets resulting from operations | 3,035,807 | 9,483,330 |
Distributions to shareholders from net investment income | (285,699) | (167,989) |
Distributions to shareholders from net realized gain | (6,810,352) | (4,339,314) |
Total distributions | (7,096,051) | (4,507,303) |
Share transactions | 96,555,061 | 57,428,807 |
Reinvestment of distributions | 6,780,780 | 4,328,731 |
Cost of shares redeemed | (106,990,221) | (48,044,834) |
Net increase (decrease) in net assets resulting from share transactions | (3,654,380) | 13,712,704 |
Redemption fees | 45,420 | 22,519 |
Total increase (decrease) in net assets | (7,669,204) | 18,711,250 |
Net Assets | ||
Beginning of period | 83,680,386 | 64,969,136 |
End of period (including undistributed net investment income of $328,857 and undistributed net investment income of $108,975, respectively) | $ 76,011,182 | $ 83,680,386 |
Other Information Shares | ||
Sold | 4,527,115 | 2,929,253 |
Issued in reinvestment of distributions | 328,326 | 230,791 |
Redeemed | (5,174,527) | (2,550,620) |
Net increase (decrease) | (319,086) | 609,424 |
Financial Highlights
Years ended February 28, | 2007 | 2006 | 2005 | 2004 G | 2003 |
Selected Per-Share Data | |||||
Net asset value, beginning of period | $ 20.97 | $ 19.21 | $ 16.22 | $ 11.04 | $ 14.69 |
Income from Investment Operations | |||||
Net investment income (loss) C | .14 | .06 | .05 | .02 | (.05) |
Net realized and unrealized gain (loss) | 1.55 | 3.06 | 3.99 | 5.46 | (3.61) |
Total from investment operations | 1.69 | 3.12 | 4.04 | 5.48 | (3.66) |
Distributions from net investment income | (.08) | (.05) | (.02) | (.01) | - |
Distributions from net realized gain | (1.89) | (1.32) | (1.04) | (.30) | - |
Total distributions | (1.97) | (1.37) | (1.06) | (.31) | - |
Redemption fees added to paid in capital C | .01 | .01 | .01 | .01 | .01 |
Net asset value, end of period | $ 20.70 | $ 20.97 | $ 19.21 | $ 16.22 | $ 11.04 |
Total Return A, B | 8.34% | 17.23% | 25.60% | 49.87% | (24.85)% |
Ratios to Average Net Assets D, F | |||||
Expenses before reductions | 1.10% | 1.12% | 1.19% | 1.60% | 1.94% |
Expenses net of fee waivers, if any | 1.10% | 1.12% | 1.19% | 1.60% | 1.94% |
Expenses net of all reductions | 1.09% | 1.07% | 1.15% | 1.57% | 1.91% |
Net investment income (loss) | .66% | .34% | .27% | .14% | (.40)% |
Supplemental Data | |||||
Net assets, end of period (000 omitted) | $ 76,011 | $ 83,680 | $ 64,969 | $ 36,797 | $ 15,132 |
Portfolio turnover rate E | 185% | 168% | 151% | 166% | 162% |
A Total returns would have been lower had certain expenses not been reduced during the periods shown.
B Total returns do not include the effect of the former sales charges.
C Calculated based on average shares outstanding during the period.
D Fees and expenses of the underlying Fidelity Central Funds are not included in the Fund's expense ratio. The Fund indirectly bears its proportionate share of the expenses of any underlying Fidelity Central Funds.
E Amount does not include the portfolio activity of any underlying Fidelity Central Funds.
F Expense ratios reflect operating expenses of the Fund. Expenses before reductions do not reflect amounts reimbursed by the investment adviser or reductions from brokerage service arrangements or other expense offset arrangements and do not represent the amount paid by the Fund during periods when reimbursements or reductions occur. Expenses net of fee waivers reflect expenses after reimbursement by the investment adviser but prior to reductions from brokerage service arrangements or other expense offset arrangements. Expenses net of all reductions represent the net expenses paid by the Fund.
G For the year ended February 29.
See accompanying notes which are an integral part of the financial statements.
Annual Report
Select Transportation Portfolio
Performance
Average annual total return reflects the change in the value of an investment, assuming reinvestment of the fund's dividend income and capital gains (the profits earned upon the sale of securities that have grown in value) and assuming a constant rate of performance each year. The $10,000 table and the fund's returns do not reflect the deduction of taxes that a shareholder would pay on fund distributions or the redemption of fund shares. During periods of reimbursement by Fidelity a fund's total returns will be greater than it would be had the reimbursement not occurred. How a fund did yesterday is no guarantee of how it will do tomorrow.
Average Annual Total Returns
Periods ended February 28, 2007 | Past 1 | Past 5 | Past 10 |
Select Transportation Portfolio | 7.65% | 12.47% | 14.41% |
$10,000 Over 10 Years
Let's say hypothetically that $10,000 was invested in Select Transportation Portfolio on February 28, 1997. The chart shows how the value of your investment would have changed, and also shows how the S&P 500 Index performed over the same period.
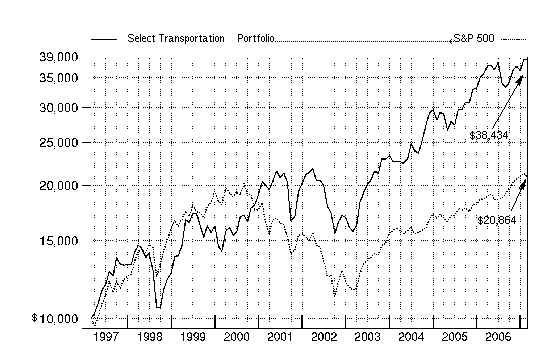
Annual Report
Select Transportation Portfolio
Management's Discussion of Fund Performance
Comments from Lindsay Connor, who became sole Portfolio Manager of Fidelity® Select Transportation Portfolio on January 4, 2007
A rosy year for stocks wilted just prior to the end of the 12-month period ending February 28, 2007. On the day prior to the period's close, the Dow Jones Industrial AverageSM plunged 416 points and the Standard & Poor's 500SM Index lost roughly 3.5% of its value, plummeting nearly 50 points and marking the benchmark's worst single-day performance since the day the market reopened after the 9/11 terrorist attacks. Though investors were obviously rattled by the development, it was only the 22nd-biggest decline for the S&P 500® in 20 years, and it could not overshadow how well stocks performed for the 12 months overall. For much of the past year, investors grew confident that the economy would not fall into a recession, and they bid up most broad-based stock indexes for six consecutive months from August through January. Overall for the year ending February 28, 2007, the S&P 500 was up 11.97%, the Dow advanced 14.24%, the small-cap Russell 2000® Index gained 9.87% and the NASDAQ Composite® Index rose 6.66%.
During the past year, the fund returned 7.65%, beating the 6.64% return of the Morgan Stanley Capital InternationalSM (MSCI®) US Investable Market Transportation Index but trailing the 10.29% gain of a blended index specific to this fund. This blended index is a combination of the Goldman Sachs® Cyclical Industries Index, which the fund was compared with through September, and the new MSCI benchmark mentioned above, which the fund was compared with during the period's final five months1. During the same 12-month period, the fund trailed the S&P 500. For the first seven months of the review period, the fund significantly trailed the Goldman Sachs index due in part to stock selection in airlines, along with a large overweighting in the group. My picks in application software and in construction and farm machinery/heavy trucks also detracted from our results. Overweighting railroads, underweighting aerospace and defense, and underweighting industrial conglomerates further hampered fund performance. On the positive side, not having a stake in homebuilders was beneficial, as demand for new homes continued to sputter. My choices in the marine group helped as well, as did our modest cash position. Among individual holdings, discount airline AirTran Holdings was a significant detractor. A fare war with rival Delta Air Lines undermined AirTran's pricing power and clouded its earnings outlook. Also hurting our results was an out-of-index position in NAVTEQ, a provider of digital map information. Air freight and logistics provider UTi Worldwide further detracted. Conversely, Expeditors International of Washington aided performance, as did American Commercial Lines, an operator of barges and towboats on North American inland waterways. Some stocks I've mentioned were sold by period end. Versus the MSCI index during the final five months, the fund handily outperformed, aided by an underweighting in the weak performing air freight and logistics segment, along with favorable stock selection in the group. Stock picking also added value in airlines, diversified metals and mining, and aerospace and defense. That said, my picks in oil and gas storage/transportation modestly detracted from performance. Individual contributors included an underweighting in poorly performing United Parcel Service, the largest benchmark component. A lighter-than-benchmark exposure to Southwest Airlines also was timely given the stock's negative return. An out-of-benchmark position in Titanium Metals further boosted our results. Conversely, not owning index component Continental Airlines hurt, as takeover speculation and lower fuel costs drove the stock's gains. The fund's positioning in US Airways Group detracted as well. Overall, the fund became more concentrated in its primary areas of focus to be more in line with the new MSCI benchmark.
1 The fund's blended index is a customized index developed by Fidelity for the limited purpose of discussing the fund's performance for the 12-month period ending February 28, 2007. From March 1, 2006, through September 30, 2006, the fund compared its performance to the Goldman Sachs Cyclical Industries Index, which returned 1.77% during that period. On October 1, 2006, the fund began comparing its performance to a different index, the MSCI US Investable Market Transportation Index, which returned 8.37% from October 1, 2006, through February 28, 2007. For the 12-month period ending February 28, 2007, the blended index (Goldman Sachs and MSCI) returned 10.29%.
The views expressed above reflect those of the portfolio manager(s) only through the end of the period as stated on the cover of this report and do not necessarily represent the views of Fidelity or any other person in the Fidelity organization. Any such views are subject to change at any time based upon market or other conditions and Fidelity disclaims any responsibility to update such views. These views may not be relied on as investment advice and, because investment decisions for a Fidelity fund are based on numerous factors, may not be relied on as an indication of trading intent on behalf of any Fidelity fund.
Annual Report
Select Transportation Portfolio
Investment Changes
Top Ten Stocks as of February 28, 2007 | ||
% of fund's | % of fund's net assets | |
Burlington Northern Santa Fe Corp. | 10.8 | 6.2 |
Union Pacific Corp. | 9.7 | 5.0 |
United Parcel Service, Inc. Class B | 8.0 | 3.7 |
CSX Corp. | 6.4 | 6.7 |
Norfolk Southern Corp. | 5.3 | 5.4 |
FedEx Corp. | 4.9 | 3.3 |
Expeditors International of Washington, Inc. | 4.6 | 4.7 |
C.H. Robinson Worldwide, Inc. | 3.7 | 3.9 |
AMR Corp. | 3.0 | 2.3 |
Titanium Metals Corp. | 2.5 | 1.8 |
58.9 | ||
Top Industries (% of fund's net assets) | |||
As of February 28, 2007 | |||
| Road & Rail | 43.7% | |
| Air Freight & Logistics | 25.4% | |
| Airlines | 15.1% | |
| Marine | 3.8% | |
| Aerospace & Defense | 3.3% | |
| All Others* | 8.7% | |
As of August 31, 2006 | |||
| Road & Rail | 38.8% | |
| Air Freight & Logistics | 20.9% | |
| Airlines | 13.2% | |
| Machinery | 7.9% | |
| Oil, Gas & Consumable Fuels | 5.6% | |
| All Others* | 13.6% | |
* Includes short-term investments and net other assets. |
Annual Report
Select Transportation Portfolio
Investments February 28, 2007
Showing Percentage of Net Assets
Common Stocks - 97.6% | |||
Shares | Value | ||
AEROSPACE & DEFENSE - 3.3% | |||
Aerospace & Defense - 3.3% | |||
AAR Corp. (a) | 15,200 | $ 442,472 | |
Bombardier, Inc. Class B (sub. vtg.) | 165,100 | 643,714 | |
General Dynamics Corp. | 2,700 | 206,442 | |
Hexcel Corp. (a) | 29,200 | 527,352 | |
Ladish Co., Inc. (a) | 5,000 | 209,000 | |
Precision Castparts Corp. | 5,600 | 509,432 | |
Rockwell Collins, Inc. | 7,300 | 478,004 | |
Rolls-Royce Group PLC | 20,800 | 200,722 | |
Spirit AeroSystems Holdings, Inc. Class A | 7,100 | 209,521 | |
3,426,659 | |||
AIR FREIGHT & LOGISTICS - 25.4% | |||
Air Freight & Logistics - 25.4% | |||
C.H. Robinson Worldwide, Inc. (d) | 75,600 | 3,852,576 | |
Expeditors International of Washington, Inc. | 107,420 | 4,817,787 | |
FedEx Corp. | 45,000 | 5,138,100 | |
Forward Air Corp. | 25,550 | 833,441 | |
Hub Group, Inc. Class A | 20,560 | 651,135 | |
Pacer International, Inc. | 18,300 | 494,649 | |
Panalpina Welttransport Holding AG | 640 | 99,722 | |
United Parcel Service, Inc. Class B | 119,900 | 8,415,781 | |
UTI Worldwide, Inc. | 77,900 | 2,347,906 | |
26,651,097 | |||
AIRLINES - 15.1% | |||
Airlines - 15.1% | |||
Air France KLM (Reg.) | 6,000 | 260,435 | |
AirTran Holdings, Inc. (a)(d) | 205,800 | 2,144,436 | |
AMR Corp. (d) | 93,200 | 3,177,188 | |
Copa Holdings SA Class A | 5,500 | 308,000 | |
easyJet PLC (a) | 29,700 | 386,229 | |
Gol Linhas Aereas Inteligentes SA sponsored ADR | 7,100 | 201,853 | |
JetBlue Airways Corp. (a)(d) | 188,514 | 2,320,607 | |
Republic Airways Holdings, Inc. (a) | 25,700 | 509,374 | |
Ryanair Holdings PLC sponsored ADR (a)(d) | 34,076 | 1,528,309 | |
Southwest Airlines Co. | 161,187 | 2,438,759 | |
TAM SA (PN) sponsored ADR (ltd. vtg.) | 7,400 | 216,524 | |
UAL Corp. (a) | 25,800 | 1,031,742 | |
US Airways Group, Inc. (a) | 25,500 | 1,333,395 | |
15,856,851 | |||
COMMUNICATIONS EQUIPMENT - 0.3% | |||
Communications Equipment - 0.3% | |||
Harris Corp. | 7,100 | 348,468 | |
INDUSTRIAL CONGLOMERATES - 0.3% | |||
Industrial Conglomerates - 0.3% | |||
Textron, Inc. | 2,900 | 267,641 | |
Shares | Value | ||
MACHINERY - 1.2% | |||
Construction & Farm Machinery & Heavy Trucks - 1.2% | |||
Bucyrus International, Inc. Class A | 6,200 | $ 315,890 | |
Joy Global, Inc. | 8,100 | 359,154 | |
Manitowoc Co., Inc. | 3,200 | 187,840 | |
Oshkosh Truck Co. | 4,000 | 214,600 | |
Terex Corp. | 3,100 | 204,104 | |
1,281,588 | |||
MARINE - 3.8% | |||
Marine - 3.8% | |||
American Commercial Lines, Inc. (a) | 59,982 | 2,167,150 | |
Kirby Corp. (a) | 43,900 | 1,604,106 | |
Kuehne & Nagel International AG | 1,230 | 93,858 | |
Ultrapetrol Ltd. | 5,600 | 100,912 | |
3,966,026 | |||
METALS & MINING - 3.2% | |||
Diversified Metals & Mining - 2.8% | |||
RTI International Metals, Inc. (a) | 3,000 | 258,840 | |
Titanium Metals Corp. | 75,600 | 2,638,440 | |
2,897,280 | |||
Steel - 0.4% | |||
Allegheny Technologies, Inc. | 2,400 | 245,880 | |
Carpenter Technology Corp. | 1,800 | 213,390 | |
459,270 | |||
TOTAL METALS & MINING | 3,356,550 | ||
OIL, GAS & CONSUMABLE FUELS - 1.0% | |||
Coal & Consumable Fuels - 0.5% | |||
China Shenhua Energy Co. Ltd. (H Shares) | 60,500 | 153,630 | |
Massey Energy Co. | 8,400 | 203,784 | |
Peabody Energy Corp. | 5,000 | 202,000 | |
559,414 | |||
Oil & Gas Refining & Marketing - 0.5% | |||
Valero Energy Corp. | 8,500 | 490,025 | |
TOTAL OIL, GAS & CONSUMABLE FUELS | 1,049,439 | ||
ROAD & RAIL - 43.7% | |||
Railroads - 33.6% | |||
Burlington Northern Santa Fe Corp. | 143,000 | 11,324,172 | |
Canadian National Railway Co. | 2,200 | 96,122 | |
Canadian Pacific Railway Ltd. | 4,000 | 213,586 | |
CSX Corp. | 178,100 | 6,709,027 | |
Florida East Coast Industries, Inc. Class A | 9,000 | 547,650 | |
Guangshen Railway Co. Ltd. sponsored ADR | 8,400 | 258,132 | |
Kansas City Southern (d) | 13,950 | 446,958 | |
Common Stocks - continued | |||
Shares | Value | ||
ROAD & RAIL - CONTINUED | |||
Railroads - continued | |||
Norfolk Southern Corp. | 116,700 | $ 5,531,580 | |
Union Pacific Corp. | 103,000 | 10,158,890 | |
35,286,117 | |||
Trucking - 10.1% | |||
Arkansas Best Corp. | 4,600 | 181,562 | |
Avis Budget Group, Inc. | 9,300 | 247,287 | |
Celadon Group, Inc. (a) | 29,500 | 528,345 | |
Con-way, Inc. | 32,900 | 1,615,390 | |
Dollar Thrifty Automotive Group, Inc. (a) | 6,200 | 321,966 | |
Frozen Food Express Industries, Inc. | 25,800 | 216,204 | |
Hertz Global Holdings, Inc. | 22,000 | 467,720 | |
J.B. Hunt Transport Services, Inc. | 50,500 | 1,341,280 | |
Knight Transportation, Inc. | 28,800 | 537,984 | |
Laidlaw International, Inc. | 31,500 | 1,076,670 | |
Landstar System, Inc. | 36,270 | 1,620,906 | |
Old Dominion Freight Lines, Inc. (a) | 32,500 | 1,011,075 | |
Trailer Bridge, Inc. (a) | 12,504 | 105,659 | |
Vitran Corp., Inc. (a) | 11,200 | 212,016 | |
YRC Worldwide, Inc. (a) | 27,000 | 1,173,960 | |
10,658,024 | |||
TOTAL ROAD & RAIL | 45,944,141 | ||
TRADING COMPANIES & DISTRIBUTORS - 0.3% | |||
Trading Companies & Distributors - 0.3% | |||
Rush Enterprises, Inc. Class A (a) | 16,700 | 310,119 | |
TOTAL COMMON STOCKS (Cost $78,354,533) | 102,458,579 | ||
Money Market Funds - 15.3% | |||
Shares | Value | ||
Fidelity Cash Central Fund, 5.35% (b) | 4,216,138 | $ 4,216,138 | |
Fidelity Securities Lending Cash Central Fund, 5.34% (b)(c) | 11,851,204 | 11,851,204 | |
TOTAL MONEY MARKET FUNDS (Cost $16,067,342) | 16,067,342 | ||
TOTAL INVESTMENT PORTFOLIO - 112.9% (Cost $94,421,875) | 118,525,921 | ||
NET OTHER ASSETS - (12.9)% | (13,498,780) | ||
NET ASSETS - 100% | $ 105,027,141 | ||
Legend |
(a) Non-income producing |
(b) Affiliated fund that is available only to investment companies and other accounts managed by Fidelity Investments. The rate quoted is the annualized seven-day yield of the fund at period end. A complete unaudited listing of the fund's holdings as of its most recent quarter end is available upon request. |
(c) Investment made with cash collateral received from securities on loan. |
(d) Security or a portion of the security is on loan at period end. |
Affiliated Central Funds |
Information regarding fiscal year to date income earned by the Fund from investments in Fidelity Central Funds is as follows: |
Fund | Income earned |
Fidelity Cash Central Fund | $ 161,106 |
Fidelity Securities Lending Cash Central Fund | 72,242 |
Total | $ 233,348 |
See accompanying notes which are an integral part of the financial statements.
Annual Report
Select Transportation Portfolio
Financial Statements
Statement of Assets and Liabilities
February 28, 2007 | ||
Assets | ||
Investment in securities, at value (including securities loaned of $11,506,525) - See accompanying schedule: Unaffiliated issuers (cost $78,354,533) | $ 102,458,579 | |
Fidelity Central Funds (cost $16,067,342) | 16,067,342 | |
Total Investments (cost $94,421,875) | $ 118,525,921 | |
Receivable for investments sold | 1,655,584 | |
Receivable for fund shares sold | 1,171,110 | |
Dividends receivable | 133,311 | |
Distributions receivable from Fidelity Central Funds | 15,138 | |
Prepaid expenses | 629 | |
Other receivables | 4,579 | |
Total assets | 121,506,272 | |
Liabilities | ||
Payable for investments purchased | $ 3,939,620 | |
Payable for fund shares redeemed | 577,731 | |
Accrued management fee | 48,556 | |
Other affiliated payables | 26,782 | |
Other payables and accrued expenses | 35,238 | |
Collateral on securities loaned, at value | 11,851,204 | |
Total liabilities | 16,479,131 | |
Net Assets | $ 105,027,141 | |
Net Assets consist of: | ||
Paid in capital | $ 80,330,168 | |
Undistributed net investment income | 90,218 | |
Accumulated undistributed net realized gain (loss) on investments and foreign currency transactions | 502,631 | |
Net unrealized appreciation (depreciation) on investments and assets and liabilities in foreign currencies | 24,104,124 | |
Net Assets, for 1,981,697 shares outstanding | $ 105,027,141 | |
Net Asset Value, offering price and redemption price per share ($105,027,141 ÷ 1,981,697 shares) | $ 53.00 | |
Statement of Operations
Year ended February 28, 2007 | ||
Investment Income | ||
Dividends | $ 1,028,879 | |
Interest | 6 | |
Income from Fidelity Central Funds (including $72,242 from security lending) | 233,348 | |
Total income | 1,262,233 | |
Expenses | ||
Management fee | $ 641,690 | |
Transfer agent fees | 356,537 | |
Accounting and security lending fees | 53,066 | |
Custodian fees and expenses | 24,553 | |
Independent trustees' compensation | 404 | |
Registration fees | 47,570 | |
Audit | 35,055 | |
Legal | 2,147 | |
Miscellaneous | 7,644 | |
Total expenses before reductions | 1,168,666 | |
Expense reductions | (5,888) | 1,162,778 |
Net investment income (loss) | 99,455 | |
Realized and Unrealized Gain (Loss) Net realized gain (loss) on: | ||
Investment securities: | ||
Unaffiliated issuers | 719,610 | |
Foreign currency transactions | (1,693) | |
Total net realized gain (loss) | 717,917 | |
Change in net unrealized appreciation (depreciation) on: Investment securities | (1,783,757) | |
Assets and liabilities in foreign currencies | 78 | |
Total change in net unrealized appreciation (depreciation) | (1,783,679) | |
Net gain (loss) | (1,065,762) | |
Net increase (decrease) in net assets resulting from operations | $ (966,307) | |
See accompanying notes which are an integral part of the financial statements.
Annual Report
Select Transportation Portfolio
Financial Statements - continued
Statement of Changes in Net Assets
Year ended | Year ended | |
Increase (Decrease) in Net Assets | ||
Operations | ||
Net investment income (loss) | $ 99,455 | $ 309,175 |
Net realized gain (loss) | 717,917 | 5,340,781 |
Change in net unrealized appreciation (depreciation) | (1,783,679) | 8,140,215 |
Net increase (decrease) in net assets resulting from operations | (966,307) | 13,790,171 |
Distributions to shareholders from net investment income | (46,855) | (250,837) |
Distributions to shareholders from net realized gain | (2,366,175) | (2,277,096) |
Total distributions | (2,413,030) | (2,527,933) |
Share transactions Proceeds from sales of shares | 188,256,102 | 147,323,750 |
Reinvestment of distributions | 2,323,914 | 2,429,834 |
Cost of shares redeemed | (186,218,427) | (139,120,153) |
Net increase (decrease) in net assets resulting from share transactions | 4,361,589 | 10,633,431 |
Redemption fees | 118,088 | 72,847 |
Total increase (decrease) in net assets | 1,100,340 | 21,968,516 |
Net Assets | ||
Beginning of period | 103,926,801 | 81,958,285 |
End of period (including undistributed net investment income of $90,218 and undistributed net investment income of $58,316, respectively) | $ 105,027,141 | $ 103,926,801 |
Other Information Shares | ||
Sold | 3,661,348 | 3,256,955 |
Issued in reinvestment of distributions | 45,239 | 54,997 |
Redeemed | (3,794,241) | (3,190,130) |
Net increase (decrease) | (87,654) | 121,822 |
Financial Highlights
Years ended February 28, | 2007 | 2006 | 2005 | 2004 H | 2003 |
Selected Per-Share Data | |||||
Net asset value, beginning of period | $ 50.22 | $ 42.08 | $ 32.84 | $ 22.80 | $ 30.95 |
Income from Investment Operations | |||||
Net investment income (loss) C | .04 | .17 | .20 F | (.12) | (.18) |
Net realized and unrealized gain (loss) | 3.72 I | 8.99 | 9.24 | 10.13 | (8.02) |
Total from investment operations | 3.76 | 9.16 | 9.44 | 10.01 | (8.20) |
Distributions from net investment income | (.02) | (.10) | (.11) | - | - |
Distributions from net realized gain | (1.01) | (.96) | (.13) | - | - |
Total distributions | (1.03) | (1.06) | (.24) | - | - |
Redemption fees added to paid in capital C | .05 | .04 | .04 | .03 | .05 |
Net asset value, end of period | $ 53.00 | $ 50.22 | $ 42.08 | $ 32.84 | $ 22.80 |
Total Return A, B | 7.65% | 22.24% | 28.86% | 44.04% | (26.33)% |
Ratios to Average Net Assets D, G | |||||
Expenses before reductions | 1.03% | 1.13% | 1.17% | 1.57% | 1.77% |
Expenses net of fee waivers, if any | 1.03% | 1.13% | 1.17% | 1.57% | 1.77% |
Expenses net of all reductions | 1.02% | 1.11% | 1.14% | 1.53% | 1.75% |
Net investment income (loss) | .09% | .40% | .53% F | (.40)% | (.67)% |
Supplemental Data | |||||
Net assets, end of period (000 omitted) | $ 105,027 | $ 103,927 | $ 81,958 | $ 37,583 | $ 21,820 |
Portfolio turnover rate E | 133% | 142% | 148% | 86% | 47% |
A Total returns would have been lower had certain expenses not been reduced during the periods shown.
B Total returns do not include the effect of the former sales charges.
C Calculated based on average shares outstanding during the period.
D Fees and expenses of the underlying Fidelity Central Funds are not included in the Fund's expense ratio. The Fund indirectly bears its proportionate share of the expenses of any underlying Fidelity Central Funds.
E Amount does not include the portfolio activity of any underlying Fidelity Central Funds.
F Investment income per share reflects a special dividend which amounted to $.09 per share and an in-kind dividend received in a corporate reorganization which amounted to $.08 per share. Excluding these dividends, the ratio of net investment income (loss) to average net assets would have been .06%.
G Expense ratios reflect operating expenses of the Fund. Expenses before reductions do not reflect amounts reimbursed by the investment adviser or reductions from brokerage service arrangements or other expense offset arrangements and do not represent the amount paid by the Fund during periods when reimbursements or reductions occur. Expenses net of fee waivers reflect expenses after reimbursement by the investment adviser but prior to reductions from brokerage service arrangements or other expense offset arrangements. Expenses net of all reductions represent the net expenses paid by the Fund.
H For the year ended February 29.
I The amount shown for a share outstanding does not correspond with the aggregate net gain (loss) on investments for the period due to the timing of sales and repurchases of shares in relation to fluctuating market values of the investments of the Fund.
See accompanying notes which are an integral part of the financial statements.
Annual Report
Notes to Financial Statements
For the period ended February 28, 2007
1. Organization.
Air Transportation Portfolio, Defense and Aerospace Portfolio, Environmental Portfolio, Industrial Equipment Portfolio, Industrials Portfolio (formerly Cyclical Industries Portfolio), and Transportation Portfolio (the Funds) are non-diversified funds of Fidelity Select Portfolios (the trust). The trust is registered under the Investment Company Act of 1940, as amended (the 1940 Act), as an open-end management investment company organized as a Massachusetts business trust. The Funds invest primarily in securities of companies whose principal business activities fall within specific industries. Each Fund is authorized to issue an unlimited number of shares. The financial statements have been prepared in conformity with accounting principles generally accepted in the United States of America, which require management to make certain estimates and assumptions at the date of the financial statements.
2. Investments in Fidelity Central Funds.
The Funds may invest in Fidelity Central Funds which are open-end investment companies available only to other investment companies and accounts managed by FMR and its affiliates. The Funds' Schedule of Investments lists each of the Fidelity Central Funds as an investment of each Fund but does not include the underlying holdings of each Fidelity Central Fund. As an Investing Fund, the Funds indirectly bear their proportionate share of the expenses of the underlying Fidelity Central Funds. A complete unaudited list of holdings for each Fidelity Central Fund is available upon request. In addition, the financial statements of the Fidelity Central Funds, which are not covered by the Funds' Report of Independent Registered Public Accounting Firm, are available on the EDGAR Database on the SEC's web site, www.sec.gov, or upon request.
The Money Market Central Funds seek preservation of capital and current income and are managed by Fidelity Investments Money Management, Inc. (FIMM) an affiliate of Fidelity Management & Research Company (FMR).
3. Significant Accounting Policies.
The following summarizes the significant accounting policies of the Funds:
Security Valuation. Investments are valued and net asset value (NAV) per share is calculated (NAV calculation) as of the close of business of the New York Stock Exchange (NYSE), normally 4:00 p.m. Eastern time. During the period each Fund also calculated a NAV each hour on the hour (commencing at 10:00 a.m. Eastern time until one hour prior to the close of business on the NYSE). Effective October 1, 2006, each Fund eliminated hourly NAV calculation. Wherever possible, each Fund uses independent pricing services approved by the Board of Trustees to value their investments.
Equity securities, including restricted securities, for which market quotations are readily available, are valued at the last reported sale price or official closing price as reported by an independent pricing service on the primary market or exchange on which they are traded. In the event there were no sales during the day or closing prices are not available, securities are valued at the last quoted bid price. Investments in open-end mutual funds, including the Fidelity Central Funds, are valued at their closing net asset value each business day. Short-term securities with remaining maturities of sixty days or less for which quotations are not readily available are valued at amortized cost, which approximates value.
When current market prices or quotations are not readily available or do not accurately reflect fair value, valuations may be determined in accordance with procedures adopted by the Board of Trustees. For example, when developments occur between the close of a market and the close of the NYSE that may materially affect the value of some or all of the securities, or when trading in a security is halted, those securities may be fair valued. Factors used in the determination of fair value may include monitoring news to identify significant market or security specific events such as changes in the value of U.S. securities markets, reviewing developments in foreign markets and evaluating the performance of ADRs, futures contracts and exchange-traded funds. Because each Fund's utilization of fair value pricing depends on market activity, the frequency with which fair value pricing is used cannot be predicted and may be utilized to a significant extent. The value of securities used for NAV calculation under fair value pricing may differ from published prices for the same securities.
Foreign Currency. Certain Funds may use foreign currency contracts to facilitate transactions in foreign-denominated securities. Losses from these transactions may arise from changes in the value of the foreign currency or if the counterparties do not perform under the contracts' terms.
Foreign-denominated assets, including investment securities, and liabilities are translated into U.S. dollars at the exchange rate at period end. Purchases and sales of investment securities, income and dividends received and expenses denominated in foreign currencies are translated into U.S. dollars at the exchange rate in effect on the transaction date.
The effects of exchange rate fluctuations on investments are included with the net realized and unrealized gain (loss) on investment securities. Other foreign currency transactions resulting in realized and unrealized gain (loss) are disclosed separately.
Annual Report
Notes to Financial Statements - continued
3. Significant Accounting Policies - continued
Investment Transactions and Income. For financial reporting purposes, the Funds' investment holdings and NAV include trades executed through the end of the last business day of the period. The NAV for processing shareholder transactions includes trades executed through the end of the prior business day. Gains and losses on securities sold are determined on the basis of identified cost and may include proceeds received from litigation. Dividend income is recorded on the ex-dividend date, except for certain dividends from foreign securities where the ex-dividend date may have passed, which are recorded as soon as the Fund is informed of the ex-dividend date. Non-cash dividends included in dividend income, if any, are recorded at the fair market value of the securities received. Distributions received on securities that represent a return of capital or capital gain are recorded as a reduction of cost of investments and/or as a realized gain. The Funds estimate the components of distributions received that may be considered return of capital distributions or capital gain distributions. Interest income and distributions from the Fidelity Central Funds are accrued as earned, with any distributions receivable as of period end included in Distributions receivable from Fidelity Central Funds on the Statement of Assets and Liabilities. Interest income includes coupon interest and amortization of premium and accretion of discount on debt securities. Investment income is recorded net of foreign taxes withheld where recovery of such taxes is uncertain.
Expenses. Most expenses of each trust can be directly attributed to a fund. Expenses which cannot be directly attributed are apportioned among each Fund in the trust. Expense estimates are accrued in the period to which they relate and adjustments are made when actual amounts are known.
Income Tax Information and Distributions to Shareholders. Each year, each Fund intends to qualify as a regulated investment company by distributing all of its taxable income and realized gains under Subchapter M of the Internal Revenue Code. As a result, no provision for income taxes is required in the accompanying financial statements. Foreign taxes are provided for based on each Fund's understanding of the tax rules and rates that exist in the foreign markets in which it invests.
Distributions are recorded on the ex-dividend date. Income and capital gain distributions are determined in accordance with income tax regulations, which may differ from generally accepted accounting principles. In addition, certain funds will claim a portion of the payment made to redeeming shareholders as a distribution for income tax purposes.
Capital accounts within the financial statements are adjusted for permanent book-tax differences. These adjustments have no impact on net assets or the results of operations. Temporary book-tax differences will reverse in a subsequent period.
Book-tax differences are primarily due to short-term capital gains, foreign currency transactions, certain foreign taxes, passive foreign investment companies (PFIC), deferred trustees compensation, net operating losses, capital loss carryforwards, losses deferred due to wash sales and excise tax regulations.
The tax-basis components of distributable earnings and the federal tax cost as of period end were as follows for each Fund:
Cost for | Unrealized | Unrealized | Net Unrealized | |
Air Transportation Portfolio | $ 141,602,383 | $ 27,610,076 | $ (3,753,249) | $ 23,856,827 |
Defense and Aerospace Portfolio | 1,007,261,608 | 247,417,533 | (17,475,859) | 229,941,674 |
Environmental Portfolio | 50,031,928 | 4,204,121 | (2,618,639) | 1,585,482 |
Industrial Equipment Portfolio | 65,733,833 | 16,732,794 | (491,107) | 16,241,687 |
Industrials Portfolio | 68,793,349 | 7,612,348 | (846,070) | 6,766,278 |
Transportation Portfolio | 94,652,159 | 25,729,062 | (1,855,300) | 23,873,762 |
Undistributed | Undistributed | Capital Loss | |
Air Transportation Portfolio | $ - | $ 2,686,658 | $ - |
Defense and Aerospace Portfolio | 15,870,250 | 40,222,574 | - |
Environmental Portfolio | - | - | (4,005,657) |
Industrial Equipment Portfolio | 453,833 | 700,086 | - |
Industrials Portfolio | 167,578 | 2,510,293 | - |
Transportation Portfolio | 57,304 | 465,528 | - |
Annual Report
3. Significant Accounting Policies - continued
Income Tax Information and Distributions to Shareholders - continued
The tax character of distributions paid was as follows:
February 28, 2007 | |||
Ordinary | Long-term | Total | |
Air Transportation Portfolio | $ 34,281 | $ 2,703,280 | $ 2,737,561 |
Defense and Aerospace Portfolio | 8,083,424 | 72,532,345 | 80,615,769 |
Industrial Equipment Portfolio | 473,930 | 709,259 | 1,183,189 |
Industrials Portfolio | 1,434,237 | 5,661,814 | 7,096,051 |
Transportation Portfolio | 46,855 | 2,366,175 | 2,413,030 |
February 28, 2006 | |||
Ordinary | Long-term | Total | |
Air Transportation Portfolio | $ 106,269 | $ 1,080,487 | $ 1,186,756 |
Defense and Aerospace Portfolio | 5,246,497 | 30,827,805 | 36,074,302 |
Industrial Equipment Portfolio | 36,844 | 3,199,441 | 3,236,285 |
Industrials Portfolio | 940,945 | 3,566,358 | 4,507,303 |
Transportation Portfolio | 250,837 | 2,277,096 | 2,527,933 |
Trading (Redemption) Fees. Shares in the Funds held less than 30 days are subject to a redemption fee equal to .75% of the net asset value of shares redeemed. All redemption fees, including any estimated redemption fees paid by FMR, are retained by the Funds and accounted for as an addition to paid in capital. Shareholders were also subject to an additional $7.50 fee for shares exchanged into another Fidelity fund (see Note 6).
New Accounting Pronouncements. In July 2006, Financial Accounting Standards Board Interpretation No. 48, Accounting for Uncertainty in Income Taxes - an interpretation of FASB Statement 109 (FIN 48), was issued and is effective on the last business day of the semiannual reporting period for fiscal years beginning after December 15, 2006. FIN 48 sets forth a threshold for financial statement recognition, measurement and disclosure of a tax position taken or expected to be taken on a tax return. Management is currently evaluating the impact, if any, the adoption of FIN 48 will have on the Funds' net assets, results of operations and financial statement disclosures.
In addition, in September 2006, Statement of Financial Accounting Standards No. 157, Fair Value Measurements (SFAS 157), was issued and is effective for fiscal years beginning after November 15, 2007. SFAS 157 defines fair value, establishes a framework for measuring fair value and expands disclosures about fair value measurements. Management is currently evaluating the impact the adoption of SFAS 157 will have on the Funds' financial statement disclosures.
4. Operating Policies.
Repurchase Agreements. FMR has received an Exemptive Order from the Securities and Exchange Commission (the SEC) which permits certain Funds and other affiliated entities of FMR to transfer uninvested cash balances into joint trading accounts which are then invested in repurchase agreements. Certain Funds may also invest directly with institutions in repurchase agreements. Repurchase agreements are collateralized by government or non-government securities. Upon settlement date, collateral is held in segregated accounts with custodian banks and may be obtained in the event of a default of the counterparty. Each applicable Fund monitors, on a daily basis, the value of the collateral to ensure it is at least equal to the principal amount of the repurchase agreement (including accrued interest). In the event of a default by the counterparty, realization of the collateral proceeds could be delayed, during which time the value of the collateral may decline.
Restricted Securities. Certain Funds may invest in securities that are subject to legal or contractual restrictions on resale. These securities generally may be resold in transactions exempt from registration or to the public if the securities are registered. Disposal of these securities may involve time-consuming negotiations and expense, and prompt sale at an acceptable price may be difficult. Information regarding restricted securities is included at the end of each applicable Fund's Schedule of Investments.
Annual Report
Notes to Financial Statements - continued
5. Purchases and Sales of Investments.
Purchases and sales of securities, other than short-term securities, are noted in the table below.
Purchases ($) | Sales ($) | |
Air Transportation Portfolio | 208,247,832 | 186,197,552 |
Defense and Aerospace Portfolio | 965,266,331 | 799,619,085 |
Environmental Portfolio | 161,510,212 | 158,732,689 |
Industrial Equipment Portfolio | 95,137,485 | 87,263,703 |
Industrials Portfolio | 147,970,293 | 157,556,511 |
Transportation Portfolio | 145,969,016 | 143,094,918 |
6. Fees and Other Transactions with Affiliates.
Management Fee. FMR and its affiliates provide the Funds with investment management related services for which the Funds pay a monthly management fee. The management fee is the sum of an individual fund fee rate and a group fee rate. The individual fund fee rate is applied to each Fund's average net assets. The group fee rate is based upon the average net assets of all the mutual funds advised by FMR. The group fee rate decreases as assets under management increase and increases as assets under management decrease. For the period, each Fund's annual management fee rate expressed as a percentage of each Fund's average net assets was as follows:
Individual Rate | Group Rate | Total | |
Air Transportation Portfolio | .30% | .26% | .56% |
Defense and Aerospace Portfolio | .30% | .26% | .56% |
Environmental Portfolio | .30% | .26% | .56% |
Industrial Equipment Portfolio | .30% | .26% | .56% |
Industrials Portfolio | .30% | .26% | .56% |
Transportation Portfolio | .30% | .26% | .56% |
Transfer Agent Fees. Fidelity Service Company, Inc. (FSC), an affiliate of FMR, is the Funds' transfer, dividend disbursing and shareholder servicing agent. FSC receives account fees and asset-based fees that vary according to account size and type of account. FSC pays for typesetting, printing and mailing of shareholder reports, except proxy statements. For the period, the transfer agent fees were equivalent to the following annual rates expressed as a percentage of average net assets:
Air Transportation Portfolio | .28% |
Defense and Aerospace Portfolio | .29% |
Environmental Portfolio | .33% |
Industrial Equipment Portfolio | .26% |
Industrials Portfolio | .34% |
Transportation Portfolio | .31% |
Accounting and Security Lending Fees. FSC maintains each Fund's accounting records. The accounting fee is based on the level of average net assets for the month. Under a separate contract, FSC administers the security lending program. The security lending fee is based on the number and duration of lending transactions.
Exchange Fees. During the period, FSC received the proceeds of a $7.50 fee to cover administrative costs associated with exchanges out of the Funds to any other Fidelity Select fund or to any other Fidelity fund made through non-automated channels. Effective October 1, 2006, the exchange fees were eliminated. For the period, exchange fees retained by FSC were as follows:
Retained | |
Air Transportation Portfolio | $ 2,580 |
Defense and Aerospace Portfolio | 3,810 |
Environmental Portfolio | 1,575 |
Industrial Equipment Portfolio | 510 |
Industrials Portfolio | 518 |
Transportation Portfolio | 1,740 |
Annual Report
6. Fees and Other Transactions with Affiliates - continued
Brokerage Commissions. Certain Funds placed a portion of their portfolio transactions with brokerage firms which are affiliates of the investment adviser. The commissions paid to these affiliated firms were as follows:
Amount | |
Air Transportation Portfolio | $ 3,892 |
Defense and Aerospace Portfolio | 11,316 |
Environmental Portfolio | 2,170 |
Industrial Equipment Portfolio | 1,862 |
Industrials Portfolio | 1,072 |
Transportation Portfolio | 2,516 |
Interfund Lending Program. Pursuant to an Exemptive Order issued by the SEC, the Funds, along with other registered investment companies having management contracts with FMR, may participate in an interfund lending program. This program provides an alternative credit facility allowing the funds to borrow from, or lend money to, other participating affiliated funds. At period end, there were no interfund loans outstanding. Each applicable fund's activity in this program during the period for which loans were outstanding was as follows:
Borrower | Average Daily | Weighted Average | Interest | |
Air Transportation Portfolio | Borrower | $ 4,368,333 | 5.15% | $ 3,749 |
Environmental Portfolio | Borrower | 12,292,000 | 5.12% | 3,499 |
Industrials Portfolio | Borrower | 5,517,500 | 5.16% | 1,581 |
7. Committed Line of Credit.
Certain Funds participate with other funds managed by FMR in a $4.2 billion credit facility (the "line of credit") to be utilized for temporary or emergency purposes to fund shareholder redemptions or for other short-term liquidity purposes. The participating funds have agreed to pay commitment fees on their pro rata portion of the line of credit, which is reflected in Miscellaneous Expense on the Statement of Operations, and is as follows:
Air Transportation Portfolio | $ 274 |
Defense and Aerospace Portfolio | 2,497 |
Environmental Portfolio | 187 |
Industrial Equipment Portfolio | 215 |
Industrials Portfolio | 214 |
Transportation Portfolio | 291 |
During the period, there were no borrowings on this line of credit.
8. Security Lending.
Certain Funds lend portfolio securities from time to time in order to earn additional income. On the settlement date of the loan, each applicable Fund receives collateral (in the form of U.S. Treasury obligations, letters of credit and/or cash) against the loaned securities and maintains collateral in an amount not less than 100% of the market value of the loaned securities during the period of the loan. The market value of the loaned securities is determined at the close of business of the Funds and any additional required collateral is delivered to the Funds on the next business day. If the borrower defaults on its obligation to return the securities loaned because of insolvency or other reasons, a fund could experience delays and costs in recovering the securities loaned or in gaining access to the collateral. Any cash collateral received is invested in the Fidelity Securities Lending Cash Central Fund. The value of loaned securities and cash collateral at period end are disclosed on each applicable Fund's Statement of Assets and Liabilities. Security lending income represents the income earned on investing cash collateral, less fees and expenses associated with the loan, plus any premium payments that may be received on the loan of certain types of securities. Security lending income is presented on each applicable Fund's Statement of Operations as a component of income from Fidelity Central Funds.
Annual Report
Notes to Financial Statements - continued
9. Bank Borrowings.
Each Fund is permitted to have bank borrowings for temporary or emergency purposes to fund shareholder redemptions. Each Fund has established borrowing arrangements with certain banks. The interest rate on the borrowings is the bank's base rate, as revised from time to time. At period end, there were no bank borrowings outstanding. Each applicable Fund's activity in this program during the period for which loans were outstanding was as follows:
Average Daily | Weighted Average | |
Environmental Portfolio | $ 8,662,667 | 5.26% |
Industrials Portfolio | 19,882,800 | 5.56% |
10. Expense Reductions.
Many of the brokers with whom FMR places trades on behalf of certain Funds provided services to these Funds in addition to trade execution. These services included payments of expenses on behalf of each applicable Fund. In addition, through arrangements with each applicable fund's custodian and transfer agent, credits realized as a result of uninvested cash balances were used to reduce each applicable fund's expenses. All of the applicable expense reductions are noted in the table below.
Brokerage | Custody | Transfer | |
Air Transportation Portfolio | $ 7,371 | $ - | $ 590 |
Defense and Aerospace Portfolio | 24,237 | 718 | 14,093 |
Environmental Portfolio | 10,128 | - | 366 |
Industrial Equipment Portfolio | 1,948 | - | 181 |
Industrials Portfolio | 4,428 | - | 3,072 |
Transportation Portfolio | 3,492 | - | 799 |
11. Other.
The Funds' organizational documents provide former and current trustees and officers with a limited indemnification against liabilities arising in connection with the performance of their duties to the Funds. In the normal course of business, the Funds may also enter into contracts that provide general indemnifications. The Funds' maximum exposure under these arrangements is unknown as this would be dependent on future claims that may be made against the Funds. The risk of material loss from such claims is considered remote.
The United States Securities and Exchange Commission ("SEC") is conducting an investigation of FMR (covering the years 2002 to 2004) arising from gifts, gratuities and business entertainment provided by certain brokers to certain individuals who were employed on FMR's domestic equity trading desk during that period. FMR is in discussions with the SEC staff regarding the possible resolution of the matter, but as of period-end no final resolution has been reached.
In December 2006, the Independent Trustees completed their own investigation of the matter with the assistance of independent counsel. The Independent Trustees and FMR agree that, despite the absence of proof that the Fidelity mutual funds experienced diminished execution quality as a result of the improper receipt of gifts and business entertainment, the conduct at issue was serious and is worthy of redress. Accordingly, the Independent Trustees have requested and FMR has agreed to pay $42 million to Fidelity mutual funds, plus interest to be determined at the time that payment is made. A method of allocating this payment among the funds has not yet been determined. The total payment to each of the Funds is not anticipated to have a material impact on such Fund's net assets. In addition, FMR reimbursed related legal expenses which are recorded in the accompanying Statement of Operations as an expense reduction.
Annual Report
Report of Independent Registered Public Accounting Firm
To the Trustees of Fidelity Select Portfolios and the Shareholders of Air Transportation Portfolio, Defense and Aerospace Portfolio, Environmental Portfolio, Industrial Equipment Portfolio, Industrials Portfolio (formerly Cyclical Industries Portfolio), and Transportation Portfolio:
In our opinion, the accompanying statements of assets and liabilities, including the schedules of investments, and the related statements of operations and of changes in net assets and the financial highlights present fairly, in all material respects, the financial position of Air Transportation Portfolio, Defense and Aerospace Portfolio, Environmental Portfolio, Industrial Equipment Portfolio, Industrials Portfolio (formerly Cyclical Industries Portfolio), and Transportation Portfolio (funds of Fidelity Select Portfolios) at February 28, 2007, the results of each of their operations for the year then ended, the changes in each of their net assets for each of the two years in the period then ended and the financial highlights for each of the five years in the period then ended, in conformity with accounting principles generally accepted in the United States of America. These financial statements and financial highlights (hereafter referred to as "financial statements") are the responsibility of the Fidelity Select Portfolios' management. Our responsibility is to express an opinion on these financial statements based on our audits. We conducted our audits of these financial statements in accordance with the standards of the Public Company Accounting Oversight Board (United States). Those standards require that we plan and perform the audit to obtain reasonable assurance about whether the financial statements are free of material misstatement. An audit includes examining, on a test basis, evidence supporting the amounts and disclosures in the financial statements, assessing the accounting principles used and significant estimates made by management, and evaluating the overall financial statement presentation. We believe that our audits, which included confirmation of securities at February 28, 2007 by correspondence with the custodian and brokers, provide a reasonable basis for our opinion.
/s/PricewaterhouseCoopers LLP
PricewaterhouseCoopers LLP
Boston, Massachusetts
April 20, 2007
Annual Report
Trustees and Officers
The Trustees, Member of the Advisory Board, and executive officers of the trust and funds, as applicable, are listed below. The Board of Trustees governs each fund and is responsible for protecting the interests of shareholders. The Trustees are experienced executives who meet periodically throughout the year to oversee each fund's activities, review contractual arrangements with companies that provide services to each fund, and review each fund's performance. Each of the Trustees oversees 349 funds advised by FMR or an affiliate.
The Trustees hold office without limit in time except that (a) any Trustee may resign; (b) any Trustee may be removed by written instrument, signed by at least two-thirds of the number of Trustees prior to such removal; (c) any Trustee who requests to be retired or who has become incapacitated by illness or injury may be retired by written instrument signed by a majority of the other Trustees; and (d) any Trustee may be removed at any special meeting of shareholders by a two-thirds vote of the outstanding voting securities of the trust. Each Trustee who is not an interested person (as defined in the 1940 Act) (Independent Trustee), shall retire not later than the last day of the calendar year in which his or her 72nd birthday occurs. The Independent Trustees may waive this mandatory retirement age policy with respect to individual Trustees. The executive officers and Advisory Board Member hold office without limit in time, except that any officer and Advisory Board Member may resign or may be removed by a vote of a majority of the Trustees at any regular meeting or any special meeting of the Trustees. Except as indicated, each individual has held the office shown or other offices in the same company for the past five years.
The funds' Statement of Additional Information (SAI) includes more information about the Trustees. To request a free copy, call Fidelity at 1-800-544-8544.
Interested Trustees*:
Correspondence intended for each Trustee who is an interested person may be sent to Fidelity Investments, 82 Devonshire Street, Boston, Massachusetts 02109.
Name, Age; Principal Occupation | |
Edward C. Johnson 3d (76) | |
Year of Election or Appointment: 1980 Mr. Johnson is Chairman of the Board of Trustees. Mr. Johnson serves as President (2006-present), Chief Executive Officer, Chairman, and a Director of FMR Corp.; Chairman and a Director of FMR; Chairman and a Director of Fidelity Research & Analysis Company (FRAC); Chairman and a Director of Fidelity Investments Money Management, Inc.; and Chairman (2001-present) and a Director of FMR Co., Inc. In addition, Mr. Johnson serves as Chairman and Director of Fidelity International Limited (FIL). | |
Robert L. Reynolds (54) | |
Year of Election or Appointment: 2003 Mr. Reynolds is President and a Director of FMR (2005-present), Fidelity Investments Money Management, Inc. (2005-present), and FMR Co., Inc. (2005-present). Mr. Reynolds also serves as Vice Chairman (2006-present), a Director (2003-present), and Chief Operating Officer of FMR Corp. and a Director of Strategic Advisers, Inc. (2005-present). He also serves on the Board at Fidelity Investments Canada, Ltd. | |
* Trustees have been determined to be "Interested Trustees" by virtue of, among other things, their affiliation with the trust or various entities under common control with FMR.
Independent Trustees:
Correspondence intended for each Independent Trustee (that is, the Trustees other than the Interested Trustees) may be sent to Fidelity Investments, P.O. Box 55235, Boston, Massachusetts 02205-5235.
Name, Age; Principal Occupation | |
Dennis J. Dirks (58) | |
Year of Election or Appointment: 2005 Prior to his retirement in May 2003, Mr. Dirks was Chief Operating Officer and a member of the Board of The Depository Trust & Clearing Corporation (DTCC) (1999-2003). He also served as President, Chief Operating Officer, and Board member of The Depository Trust Company (DTC) (1999-2003) and President and Board member of the National Securities Clearing Corporation (NSCC) (1999-2003). In addition, Mr. Dirks served as Chief Executive Officer and Board member of the Government Securities Clearing Corporation (2001-2003) and Chief Executive Officer and Board member of the Mortgage-Backed Securities Clearing Corporation (2001-2003). Mr. Dirks also serves as a Trustee and a member of the Finance Committee of Manhattan College (2005-present) and a Trustee and a member of the Finance Committee of AHRC of Nassau County (2006-present). | |
Albert R. Gamper, Jr. (64) | |
Year of Election or Appointment: 2006 Prior to his retirement in December 2004, Mr. Gamper served as Chairman of the Board of CIT Group Inc. (commercial finance). During his tenure with CIT Group Inc. Mr. Gamper served in numerous senior management positions, including Chairman (1987-1989; 1999-2001; 2002-2004), Chief Executive Officer (1987-2004), and President (1989-2002). He currently serves as a member of the Board of Directors of Public Service Enterprise Group (utilities, 2001-present), Chairman of the Board of Governors, Rutgers University (2004-present), and Chairman of the Board of Saint Barnabas Health Care System. | |
George H. Heilmeier (70) | |
Year of Election or Appointment: 2004 Dr. Heilmeier is Chairman Emeritus of Telcordia Technologies (communication software and systems), where prior to his retirement, he served as company Chairman and Chief Executive Officer. He currently serves on the Boards of Directors of The Mitre Corporation (systems engineering and information technology support for the government), and HRL Laboratories (private research and development, 2004-present). He is Chairman of the General Motors Science & Technology Advisory Board and a Life Fellow of the Institute of Electrical and Electronics Engineers (IEEE). Dr. Heilmeier is a member of the Defense Science Board and the National Security Agency Advisory Board. He is also a member of the National Academy of Engineering, the American Academy of Arts and Sciences, and the Board of Overseers of the School of Engineering and Applied Science of the University of Pennsylvania. Previously, Dr. Heilmeier served as a Director of TRW Inc. (automotive, space, defense, and information technology, 1992-2002), Compaq (1994-2002), Automatic Data Processing, Inc. (ADP) (technology-based business outsourcing, 1995-2002), INET Technologies Inc. (telecommunications network surveillance, 2001-2004), and Teletech Holdings (customer management services). He is the recipient of the 2005 Kyoto Prize in Advanced Technology for his invention of the liquid crystal display, and a member of the Consumer Electronics Hall of Fame. | |
James H. Keyes (66) | |
Year of Election or Appointment: 2007 Prior to his retirement in 2003, Mr. Keyes was Chairman, President, and Chief Executive Officer of Johnson Controls, Inc. (automotive supplier, 1993-2003). He currently serves as a member of the boards of LSI Logic Corporation (semiconductor technologies), Navistar International Corporation (manufacture and sale of trucks, buses, and diesel engines, 2002-present), and Pitney Bowes, Inc. (integrated mail, messaging, and document management solutions). | |
Marie L. Knowles (60) | |
Year of Election or Appointment: 2001 Prior to Ms. Knowles' retirement in June 2000, she served as Executive Vice President and Chief Financial Officer of Atlantic Richfield Company (ARCO) (diversified energy, 1996-2000). From 1993 to 1996, she was a Senior Vice President of ARCO and President of ARCO Transportation Company. She served as a Director of ARCO from 1996 to 1998. She currently serves as a Director of Phelps Dodge Corporation (copper mining and manufacturing) and McKesson Corporation (healthcare service, 2002-present). Ms. Knowles is a Trustee of the Brookings Institution and the Catalina Island Conservancy and also serves as a member of the Advisory Board for the School of Engineering of the University of Southern California. | |
Ned C. Lautenbach (63) | |
Year of Election or Appointment: 2000 Mr. Lautenbach is Chairman of the Independent Trustees (2006-present). Mr. Lautenbach has been a partner of Clayton, Dubilier & Rice, Inc. (private equity investment firm) since September 1998. Previously, Mr. Lautenbach was with the International Business Machines Corporation (IBM) from 1968 until his retirement in 1998. Mr. Lautenbach serves as a Director of Sony Corporation (2006-present) and Eaton Corporation (diversified industrial) as well as the Philharmonic Center for the Arts in Naples, Florida. He also is a member of the Board of Trustees of Fairfield University (2005-present), as well as a member of the Council on Foreign Relations. | |
Cornelia M. Small (62) | |
Year of Election or Appointment: 2005 Ms. Small is a member (2000-present) and Chairperson (2002-present) of the Investment Committee, and a member (2002- present) of the Board of Trustees of Smith College. Previously, she served as Chief Investment Officer (1999-2000), Director of Global Equity Investments (1996-1999), and a member of the Board of Directors of Scudder, Stevens & Clark (1990-1997) and Scudder Kemper Investments (1997-1999). In addition, Ms. Small served as Co-Chair (2000-2003) of the Annual Fund for the Fletcher School of Law and Diplomacy. | |
William S. Stavropoulos (67) | |
Year of Election or Appointment: 2001 Mr. Stavropoulos is Chairman Emeritus of the Board of Directors of The Dow Chemical Company. Since joining The Dow Chemical Company in 1967, Mr. Stavropoulos served in numerous senior management positions, including President (1993-2000; 2002-2003), CEO (1995-2000; 2002-2004), and Chairman of the Executive Committee (2000-2004). Currently, he is a Director of NCR Corporation (data warehousing and technology solutions), Chemical Financial Corporation, Maersk Inc. (industrial conglomerate, 2002-present) Tyco International, Inc. (multinational manufacturing and services, 2007-present), and a member of the Advisory Board for Metalmark Capital (private equity investment firm, 2005-present). He is a special advisor to Clayton Dubilier & Rice, Inc., a private equity investment firm. He also serves as a member of the Board of Trustees of the American Enterprise Institute for Public Policy Research. In addition, Mr. Stavropoulos is a member of The Business Council, J.P. Morgan International Council and the University of Notre Dame Advisory Council for the College of Science. | |
Kenneth L. Wolfe (68) | |
Year of Election or Appointment: 2005 Prior to his retirement in 2001, Mr. Wolfe was Chairman and Chief Executive Officer of Hershey Foods Corporation (1993-2001). He currently serves as a member of the boards of Adelphia Communications Corporation (2003-present), Bausch & Lomb, Inc., and Revlon Inc. (2004-present). | |
Advisory Board Member and Executive Officers:
Correspondence intended for each executive officer and Mr. Lynch may be sent to Fidelity Investments, 82 Devonshire Street, Boston, Massachusetts 02109.
Name, Age; Principal Occupation | |
Peter S. Lynch (63) | |
Year of Election or Appointment: 2003 Member of the Advisory Board of Fidelity Select Portfolios. Mr. Lynch is Vice Chairman and a Director of FMR, and Vice Chairman (2001-present) and a Director of FMR Co., Inc. Previously, Mr. Lynch served as a Trustee of the Fidelity funds (1990-2003). In addition, he serves as a Trustee of Boston College and as the Chairman of the Inner-City Scholarship Fund. | |
Kimberley H. Monasterio (43) | |
Year of Election or Appointment: 2007 President and Treasurer of Select Air Transportation Portfolio, Select Defense and Aerospace Portfolio, Select Environmental Portfolio, Select Industrials Portfolio, Select Industrial Equipment Portfolio, and Select Transportation Portfolio. Ms. Monasterio also serves as President and Treasurer of other Fidelity funds (2007-present) and is an employee of FMR (2004-present). Previously, Ms. Monasterio served as Deputy Treasurer of the Fidelity funds (2004-2006). Before joining Fidelity Investments, Ms. Monasterio served as Treasurer (2000-2004) and Chief Financial Officer (2002-2004) of the Franklin Templeton Funds and Senior Vice President of Franklin Templeton Services, LLC (2000-2004). | |
Boyce I. Greer (51) | |
Year of Election or Appointment: 2005 Vice President of Select Air Transportation Portfolio, Select Defense and Aerospace Portfolio, Select Environmental Portfolio, Select Industrials Portfolio, Select Industrial Equipment Portfolio, and Select Transportation Portfolio. Mr. Greer also serves as Vice President of certain Equity Funds (2005-present), certain Asset Allocation Funds (2005-present), Fixed-Income Funds (2006- present), and Money Market Funds (2006-present). Mr. Greer is also a Trustee of other investment companies advised by FMR (2003-present). He is an Executive Vice President of FMR (2005-present) and FMR Co., Inc. (2005-present), and Senior Vice President of Fidelity Investments Money Management, Inc. (2006-present). Previously, Mr. Greer served as a Director and Managing Director of Strategic Advisers, Inc. (2002-2005), and Executive Vice President (2000-2002) and Money Market Group Leader (1997-2002) of the Fidelity Investments Fixed Income Division. He also served as Vice President of Fidelity's Money Market Funds (1997-2002), Senior Vice President of FMR (1997-2002), and Vice President of FIMM (1998-2002). | |
Eric D. Roiter (58) | |
Year of Election or Appointment: 1998 Secretary of Select Air Transportation Portfolio, Select Defense and Aerospace Portfolio, Select Environmental Portfolio, Select Industrials Portfolio, Select Industrial Equipment Portfolio, and Select Transportation Portfolio. He also serves as Secretary of other Fidelity funds; Vice President, General Counsel, and Secretary of FMR Co., Inc. (2001-present) and FMR; Assistant Secretary of Fidelity Management & Research (U.K.) Inc. (2001-present), Fidelity Research & Analysis Company (2001-present), and Fidelity Investments Money Management, Inc. (2001-present). Mr. Roiter is an Adjunct Member, Faculty of Law, at Boston College Law School (2003-present). Previously, Mr. Roiter served as Vice President and Secretary of Fidelity Distributors Corporation (FDC) (1998-2005). | |
Scott C. Goebel (39) | |
Year of Election or Appointment: 2007 Assistant Secretary of Select Air Transportation Portfolio, Select Defense and Aerospace Portfolio, Select Environmental Portfolio, Select Industrials Portfolio, Select Industrial Equipment Portfolio, and Select Transportation Portfolio. Mr. Goebel also serves as Assistant Secretary of other Fidelity funds (2007-present), Vice President and Secretary of FDC (2006-present), and is an employee of FMR. | |
R. Stephen Ganis (40) | |
Year of Election or Appointment: 2006 Anti-Money Laundering (AML) officer of Select Air Transportation Portfolio, Select Defense and Aerospace Portfolio, Select Environmental Portfolio, Select Industrials Portfolio, Select Industrial Equipment Portfolio, and Select Transportation Portfolio. Mr. Ganis also serves as AML officer of other Fidelity funds (2006-present) and FMR Corp. (2003-present). Before joining Fidelity Investments, Mr. Ganis practiced law at Goodwin Procter, LLP (2000-2002). | |
Joseph B. Hollis (58) | |
Year of Election or Appointment: 2006 Chief Financial Officer of Select Air Transportation Portfolio, Select Defense and Aerospace Portfolio, Select Environmental Portfolio, Select Industrials Portfolio, Select Industrial Equipment Portfolio, and Select Transportation Portfolio. Mr. Hollis also serves as Chief Financial Officer of other Fidelity funds. Mr. Hollis is President of Fidelity Pricing and Cash Management Services (FPCMS) (2005-present). Mr. Hollis also serves as President and Director of Fidelity Service Company, Inc. (2006-present). Previously, Mr. Hollis served as Senior Vice President of Cash Management Services (1999-2002) and Investment Management Operations (2002-2005). | |
Kenneth A. Rathgeber (59) | |
Year of Election or Appointment: 2004 Chief Compliance Officer of Select Air Transportation Portfolio, Select Defense and Aerospace Portfolio, Select Environmental Portfolio, Select Industrials Portfolio, Select Industrial Equipment Portfolio, and Select Transportation Portfolio. Mr. Rathgeber also serves as Chief Compliance Officer of other Fidelity funds (2004-present) and Executive Vice President of Risk Oversight for Fidelity Investments (2002-present). He is Chief Compliance Officer of FMR (2005-present), FMR Co., Inc. (2005-present), Fidelity Management & Research (U.K.) Inc. (2005-present), Fidelity Research & Analysis Company (2005-present), Fidelity Investments Money Management, Inc. (2005-present), and Strategic Advisers, Inc. (2005-present). Previously, Mr. Rathgeber served as Executive Vice President and Chief Operating Officer for Fidelity Investments Institutional Services Company, Inc. (1998-2002). | |
Bryan A. Mehrmann (45) | |
Year of Election or Appointment: 2005 Deputy Treasurer of Select Air Transportation Portfolio, Select Defense and Aerospace Portfolio, Select Environmental Portfolio, Select Industrials Portfolio, Select Industrial Equipment Portfolio, and Select Transportation Portfolio. Mr. Mehrmann also serves as Deputy Treasurer of other Fidelity funds (2005-present) and is an employee of FMR. Previously, Mr. Mehrmann served as Vice President of Fidelity Investments Institutional Services Group (FIIS)/Fidelity Investments Institutional Operations Corporation, Inc. (FIIOC) Client Services (1998-2004). | |
Kenneth B. Robins (37) | |
Year of Election or Appointment: 2005 Deputy Treasurer of Select Air Transportation Portfolio, Select Defense and Aerospace Portfolio, Select Environmental Portfolio, Select Industrials Portfolio, Select Industrial Equipment Portfolio, and Select Transportation Portfolio. Mr. Robins also serves as Deputy Treasurer of other Fidelity funds (2005-present) and is an employee of FMR (2004-present). Before joining Fidelity Investments, Mr. Robins worked at KPMG LLP, where he was a partner in KPMG's department of professional practice (2002-2004) and a Senior Manager (1999-2000). In addition, Mr. Robins served as Assistant Chief Accountant, United States Securities and Exchange Commission (2000-2002). | |
Robert G. Byrnes (40) | |
Year of Election or Appointment: 2005 Assistant Treasurer of Select Air Transportation Portfolio, Select Defense and Aerospace Portfolio, Select Environmental Portfolio, Select Industrials Portfolio, Select Industrial Equipment Portfolio, and Select Transportation Portfolio. Mr. Byrnes also serves as Assistant Treasurer of other Fidelity funds (2005-present) and is an employee of FMR (2005-present). Previously, Mr. Byrnes served as Vice President of FPCMS (2003-2005). Before joining Fidelity Investments, Mr. Byrnes worked at Deutsche Asset Management where he served as Vice President of the Investment Operations Group (2000-2003). | |
Peter L. Lydecker (53) | |
Year of Election or Appointment: 2004 Assistant Treasurer of Select Air Transportation Portfolio, Select Defense and Aerospace Portfolio, Select Environmental Portfolio, Select Industrials Portfolio, Select Industrial Equipment Portfolio, and Select Transportation Portfolio. Mr. Lydecker also serves as Assistant Treasurer of other Fidelity funds (2004) and is an employee of FMR. | |
Gary W. Ryan (48) | |
Year of Election or Appointment: 2005 Assistant Treasurer of Select Air Transportation Portfolio, Select Defense and Aerospace Portfolio, Select Environmental Portfolio, Select Industrials Portfolio, Select Industrial Equipment Portfolio, and Select Transportation Portfolio. Mr. Ryan also serves as Assistant Treasurer of other Fidelity funds (2005-present) and is an employee of FMR (2005-present). Previously, Mr. Ryan served as Vice President of Fund Reporting in FPCMS (1999-2005). | |
Salvatore Schiavone (41) | |
Year of Election or Appointment: 2005 Assistant Treasurer of Select Air Transportation Portfolio, Select Defense and Aerospace Portfolio, Select Environmental Portfolio, Select Industrials Portfolio, Select Industrial Equipment Portfolio, and Select Transportation Portfolio. Mr. Schiavone also serves as Assistant Treasurer of other Fidelity funds (2005-present) and is an employee of FMR (2005-present). Before joining Fidelity Investments, Mr. Schiavone worked at Deutsche Asset Management, where he most recently served as Assistant Treasurer (2003-2005) of the Scudder Funds and Vice President and Head of Fund Reporting (1996-2003). | |
Annual Report
Distributions
The Board of Trustees of each fund voted to pay to shareholders of record at the opening of business on record date, the following distributions per share derived from capital gains realized from sales of portfolio securities, and dividends derived from net investment income:
Fund | Pay Date | Record Date | Dividends | Capital Gains |
Air Transportation | 04/16/07 | 04/13/07 | $0.00 | $1.22 |
Industrials | 04/16/07 | 04/13/07 | $0.05 | $0.70 |
Defense and Aerospace | 04/16/07 | 04/13/07 | $0.03 | $3.86 |
Industrial Equipment | 04/16/07 | 04/13/07 | $0.11 | $0.39 |
Transportation | 04/16/07 | 04/13/07 | $0.03 | $0.25 |
The funds hereby designate as capital gain dividend the amounts noted below for the taxable year ended February 28, 2007, or, if subsequently determined to be different, the net capital gain of such year.
Fund | |
Air Transportation | $ 3,545,605 |
Industrials | $ 8,185,514 |
Defense and Aerospace | $ 98,310,351 |
Industrial Equipment | $ 1,111,120 |
Transportation | $ 732,993 |
A percentage of the dividends distributed during the fiscal year for the following funds qualifies for the dividends-received deduction for corporate shareholders:
Air Transportation | |
April, 2006 | 100% |
Industrials | |
April 2006 | 48% |
December 2006 | 100% |
Defense and Aerospace | |
April 2006 | 44% |
December 2006 | 100% |
Industrial Equipment | |
April, 2006 | 100% |
December, 2006 | 100% |
Transportation | |
April, 2006 | 100% |
A percentage of the dividends distributed during the fiscal year for the following funds may be taken into account as a dividend for purposes of the maximum rate under section 1(h)(11) of the Internal Revenue Code.
Air Transportation | |
April 2006 | 100% |
Industrials | |
April 2006 | 58% |
December 2006 | 100% |
Defense and Aerospace | |
April 2006 | 49% |
December 2006 | 100% |
Industrial Equipment | |
April, 2006 | 100% |
December, 2006 | 100% |
Transportation | |
April, 2006 | 100% |
The fund will notify shareholders in January 2008 of amounts for use in preparing 2007 income tax returns.
Annual Report
Proxy Voting Results
A special meeting of Fidelity Select Portfolios' shareholders was held on September 20, 2006. The results of votes taken among shareholders on the proposals before them are reported below. Each vote reported represents one dollar of net asset value held on the record date for the meeting.
PROPOSAL 1 | ||
To elect a Board of Trustees. A | ||
# of | % of | |
Dennis J. Dirks | ||
Affirmative | 13,182,341,755.09 | 94.980 |
Withheld | 696,736,162.41 | 5.020 |
TOTAL | 13,879,077,917.50 | 100.000 |
Albert R. Gamper, Jr. | ||
Affirmative | 13,177,593,614.43 | 94.946 |
Withheld | 701,484,303.07 | 5.054 |
TOTAL | 13,879,077,917.50 | 100.000 |
Robert M. Gates | ||
Affirmative | 13,141,235,622.81 | 94.684 |
Withheld | 737,842,294.69 | 5.316 |
TOTAL | 13,879,077,917.50 | 100.000 |
George H. Heilmeier | ||
Affirmative | 13,140,073,210.00 | 94.675 |
Withheld | 739,004,707.50 | 5.325 |
TOTAL | 13,879,077,917.50 | 100.000 |
Edward C. Johnson 3d | ||
Affirmative | 13,106,284,587.54 | 94.432 |
Withheld | 772,793,329.96 | 5.568 |
TOTAL | 13,879,077,917.50 | 100.000 |
Stephen P. Jonas | ||
Affirmative | 13,168,282,872.88 | 94.879 |
Withheld | 710,795,044.62 | 5.121 |
TOTAL | 13,879,077,917.50 | 100.000 |
James H. KeyesB | ||
Affirmative | 13,164,603,089.66 | 94.852 |
Withheld | 714,474,827.84 | 5.148 |
TOTAL | 13,879,077,917.50 | 100.000 |
Marie L. Knowles | ||
Affirmative | 13,169,356,779.66 | 94.886 |
Withheld | 709,721,137.84 | 5.114 |
TOTAL | 13,879,077,917.50 | 100.000 |
Ned C. Lautenbach | ||
Affirmative | 13,166,485,155.52 | 94.866 |
Withheld | 712,592,761.98 | 5.134 |
TOTAL | 13,879,077,917.50 | 100.000 |
William O. McCoy | ||
Affirmative | 13,129,548,996.59 | 94.600 |
Withheld | 749,528,920.91 | 5.400 |
TOTAL | 13,879,077,917.50 | 100.000 |
Robert L. Reynolds | ||
Affirmative | 13,180,813,649.06 | 94.969 |
Withheld | 698,264,268.44 | 5.031 |
TOTAL | 13,879,077,917.50 | 100.000 |
# of | % of | |
Cornelia M. Small | ||
Affirmative | 13,170,500,616.42 | 94.895 |
Withheld | 708,577,301.08 | 5.105 |
TOTAL | 13,879,077,917.50 | 100.000 |
William S. Stavropoulos | ||
Affirmative | 13,143,284,328.22 | 94.699 |
Withheld | 735,793,589.28 | 5.301 |
TOTAL | 13,879,077,917.50 | 100.000 |
Kenneth L. Wolfe | ||
Affirmative | 13,162,946,758.47 | 94.840 |
Withheld | 716,131,159.03 | 5.160 |
TOTAL | 13,879,077,917.50 | 100.000 |
PROPOSAL 3A | ||
To modify the fund's fundamental "invests primarily" policy (the investment policy concerning the fund's primary investments). | ||
Industrials Portfolio | ||
# of | % of | |
Affirmative | 30,619,544.53 | 88.165 |
Against | 2,307,189.64 | 6.643 |
Abstain | 814,036.55 | 2.344 |
Broker Non-Votes | 989,077.44 | 2.848 |
TOTAL | 34,729,848.16 | 100.000 |
PROPOSAL 3B | ||
To modify the fund's investment concentration policy. | ||
Industrials Portfolio | ||
# of | % of | |
Affirmative | 30,585,896.92 | 88.068 |
Against | 2,358,363.88 | 6.791 |
Abstain | 796,509.92 | 2.293 |
Broker Non-Votes | 989,077.44 | 2.848 |
TOTAL | 34,729,848.16 | 100.000 |
A Denotes trust-wide proposal and voting results. B Effective on or about January 1, 2007. | ||
Annual Report
Managing Your Investments
Fidelity offers several ways to conveniently manage your personal investments via your telephone or PC. You can access your account information, conduct trades and research your investments 24 hours a day.
By Phone
Fidelity Automated Service Telephone provides a single toll-free number to access account balances, positions, quotes and trading. It's easy to navigate the service, and on your first call, the system will help you create a personal identification number (PIN) for security.
(phone_graphic)Fidelity Automated Service Telephone (FAST®)
1-800-544-5555
Press
1 For mutual fund and brokerage trading.
2 For quotes.*
3 For account balances and holdings.
4 To review orders and mutual fund activity.
5 To change your PIN.
*0 To speak to a Fidelity representative.
By PC
Fidelity's web site on the Internet provides a wide range of information, including daily financial news, fund performance, interactive planning tools and news about Fidelity products and services.
(computer_graphic)Fidelity's Web Site
www.fidelity.com
* When you call the quotes line, please remember that a fund's yield and return will vary and, except for money market funds, share price will also vary. This means that you may have a gain or loss when you sell your shares. There is no assurance that money market funds will be able to maintain a stable $1 share price; an investment in a money market fund is not insured or guaranteed by the U.S. government. Total returns are historical and include changes in share price, reinvestment of dividends and capital gains, and the effects of any sales charges.
Annual Report
Investment Adviser
Fidelity Management & Research Company
Boston, MA
Investment Sub-Advisers
FMR Co., Inc.
Fidelity Management & Research
(U.K.) Inc.
Fidelity Research & Analysis Company
Fidelity Investments Japan Limited
Fidelity International Investment Advisors
Fidelity International Investment Advisors
(U.K. Limited)
General Distributor
Fidelity Distributors Corporation
Boston, MA
Transfer and Service Agent
Fidelity Service Company, Inc.
Boston, MA
Custodian
Brown Brothers Harriman & Co.
Boston, MA
Corporate Headquarters
82 Devonshire Street
Boston, MA 02109
1-800-544-8888
The Fidelity Telephone Connection
Mutual Fund 24-Hour Service
Exchanges/Redemptions
and Account Assistance 1-800-544-6666
Product Information 1-800-544-8888
Retirement Accounts 1-800-544-4774
(8 a.m. - 9 p.m.)
TDD Service 1-800-544-0118
for the deaf and hearing impaired
(9 a.m. - 9 p.m. Eastern time)
Fidelity Automated Service
Telephone (FAST®) (automated graphic) 1-800-544-5555
(automated graphic) Automated line for quickest service
(Fidelity Investment logo)(registered trademark)
Corporate Headquarters
82 Devonshire St., Boston, MA 02109
www.fidelity.com
SELCI-UANN-0407
1.813656.102
Fidelity®
Select Portfolios®
Consumer Discretionary Sector
Select Automotive Portfolio
Select Construction and Housing Portfolio
Select Consumer Discretionary Portfolio (formerly Select Consumer Industries Portfolio)
Select Leisure Portfolio
Select Multimedia Portfolio
Select Retailing Portfolio
Annual Report
February 28, 2007
(2_fidelity_logos) (Registered_Trademark)
Contents
Chairman's Message | ||
Notes to Shareholders | ||
Shareholder Expense Example | ||
Fund Updates* | ||
Consumer Discretionary Sector | ||
Automotive | ||
Construction and Housing | ||
Consumer Discretionary | ||
Leisure | ||
Multimedia | ||
Retailing | ||
Notes to Financial Statements | ||
Report of Independent Registered Public Accounting Firm | ||
Trustees and Officers | ||
Distributions | ||
Proxy Voting Results |
* Fund updates for each Select Portfolio include: Performance, Management's Discussion of Fund Performance, Investment Changes, Investments, and Financial Statements.
To view a fund's proxy voting guidelines and proxy voting record for the 12-month period ended June 30, visit www.fidelity.com/proxyvotingresults or visit the Securities and Exchange Commission's (SEC) web site at www.sec.gov. You may also call 1-800-544-8544 to request a free copy of the proxy voting guidelines.
Standard & Poor's, S&P and S&P 500 are registered service marks of The McGraw-Hill Companies, Inc. and have been licensed for use by Fidelity Distributors Corporation.
Other third party marks appearing herein are the property of their respective owners.
All other marks appearing herein are registered or unregistered trademarks or service marks of FMR Corp. or an affiliated company.
This report and the financial statements contained herein are submitted for the general information of the shareholders of the funds. This report is not authorized for distribution to prospective investors in the funds unless preceded or accompanied by an effective prospectus.
A fund files its complete schedule of portfolio holdings with the SEC for the first and third quarters of each fiscal year on Form N-Q. Forms N-Q are available on the SEC's web site at http://www.sec.gov. A fund's Forms N-Q may be reviewed and copied at the SEC's Public Reference Room in Washington, DC. Information regarding the operation of the SEC's Public Reference Room may be obtained by calling 1-800-SEC-0330. For a complete list of a fund's portfolio holdings, view the most recent quarterly holdings report, semiannual report, or annual report on Fidelity's web site at http://www.fidelity.com/holdings.
NOT FDIC INSURED · MAY LOSE VALUE · NO BANK GUARANTEE
Neither the funds nor Fidelity Distributors Corporation is a bank.
Annual Report
Chairman's Message
(Photograph of Edward C. Johnson 3d.)
Dear Shareholder:
Substantial single-day losses are not uncommon in the equity markets, and when they occur - as in late February - investors can be better served in the long term by buying good stocks at lower prices than by moving their money to the sidelines. While financial markets are always unpredictable, there are a number of time-tested principles that can put the historical odds in your favor.
One of the basic tenets is to invest for the long term. Over time, riding out the markets' inevitable ups and downs has proven much more effective than selling into panic or chasing the hottest trend. Even missing only a few of the markets' best days can significantly diminish investor returns. Patience also affords the benefits of compounding - of earning interest on additional income or reinvested dividends and capital gains. There are tax advantages and cost benefits to consider as well. The more you sell, the more taxes you pay, and the more you trade, the higher the costs. While staying the course doesn't eliminate risk, it can considerably lessen the effect of short-term declines.
You can further manage your investing risk through diversification. And today, more than ever, geographic diversification should be taken into account. Studies
indicate that asset allocation is the single most important determinant of a portfolio's long-term success. The right mix of stocks, bonds and cash - aligned to your particular risk tolerance and investment objective - is very important. Age-appropriate rebalancing is also an essential aspect of asset allocation. For younger investors, an emphasis on equities - which historically have been the best performing asset class over time - is encouraged. As investors near their specific goal, such as retirement or sending a child to college, consideration may be given to replacing volatile assets (e.g. common stocks) with more-stable fixed investments (bonds or savings plans).
A third investment principle - investing regularly - can help lower the average cost of your purchases. Investing a certain amount of money each month or quarter helps ensure you won't pay for all your shares at market highs. This strategy - known as dollar cost averaging - also reduces unconstructive "emotion" from investing, helping shareholders avoid selling weak performers just prior to an upswing, or chasing a hot performer just before a correction.
We invite you to contact us via the Internet, through our Investor Centers or over the phone. It is our privilege to provide you the information you need to make the investments that are right for you.
Sincerely,
/s/Edward C. Johnson 3d
Edward C. Johnson 3d
Annual Report
Notes to Shareholders:
Effective October 1, 2006, Fidelity restructured the Fidelity® Select Portfolios® equity product line. The restructuring aligned the equity funds' investment goals more closely with standard industry classifications and facilitated adoption of more-specific benchmark indexes to evaluate fund performance. As restructured, the equity funds generally align under the 10 sectors in the widely recognized Global Industry Classification Standard (GICS), developed by Standard & Poor's® (S&P®) and Morgan Stanley Capital InternationalSM (MSCI®): Consumer Discretionary, Consumer Staples, Energy, Financials, Health Care, Industrials, Information Technology, Materials, Telecommunications Services and Utilities. Changes to the funds ranged from simply adopting a new supplemental benchmark to, in some cases, changing investment policies and fund names.
For Banking, Communications Equipment (formerly Developing Communications), Construction and Housing, Consumer Discretionary (formerly Consumer Industries), Consumer Staples (formerly Food and Agriculture), Home Finance, Industrials (formerly Cyclical Industries), IT Services (formerly Business Services and Outsourcing) and Materials (formerly Industrial Materials), shareholders approved certain fundamental investment policy changes related to the restructuring at a special meeting of shareholders held September 20, 2006. All the equity funds adopted new benchmark indexes from MSCI, except for Gold (which adopted an S&P/Citigroup index), Natural Gas (which adopted an S&P index) and Natural Resources (which retained its current Goldman Sachs® index). Taken together, the name, policy and benchmark changes will make it easier for investors to distinguish funds in the product line and to evaluate Fidelity Management & Research Company's skill in managing the funds.
The Select equity portfolios also eliminated hourly pricing. The funds now price each business day as of the close of the New York Stock Exchange, normally 4:00 pm Eastern time. The funds also adopted Fidelity's standard fund market timing policy, as described in the funds' current prospectus, and removed the $7.50 fee formerly charged on exchanges made through non-automated channels.
Changes for each fund in the GICS Consumer Discretionary Sector are described in detail below.
The fund is now benchmarked to the MSCI US Investable Market Automobiles & Components Index.
Construction and Housing
Shareholders approved modifying the fund's investment policies to better reflect its focus on housing, including retail homebuilders, as well as construction companies. The fund is now benchmarked to the MSCI US Investable Market Construction & Housing Custom Index.
Consumer Discretionary (formerly Consumer Industries)
Shareholders approved narrowing the fund's policies to focus on companies engaged in the manufacture and distribution of consumer discretionary products and services. Consumer discretionary companies are a subset of the broader consumer industries sector, which is generally made up of consumer discretionary and consumer staples companies. The fund is now benchmarked to the MSCI US Investable Market Consumer Discretionary Index.
Leisure
The fund is now benchmarked to the MSCI US Investable Market Consumer Services Index.
Multimedia
The fund is now benchmarked to the MSCI US Investable Market Media Index.
Retailing
The fund is now benchmarked to the MSCI US Investable Market Retailing Index.
Annual Report
Shareholder Expense Example
As a shareholder of a Fund, you incur two types of costs: (1) transaction costs, including redemption fees, exchange fees, and (2) ongoing costs, including management fees and other Fund expenses. This Example is intended to help you understand your ongoing costs (in dollars) of investing in the Funds and to compare these costs with the ongoing costs of investing in other mutual funds.
The example is based on an investment of $1,000 invested at the beginning of the period and held for the entire period (September 1, 2006 to February 28, 2007).
Actual Expenses
The first line of the accompanying table for each fund provides information about actual account values and actual expenses. You may use the information in this line, together with the amount you invested, to estimate the expenses that you paid over the period. Simply divide your account value by $1,000.00 (for example, an $8,600 account value divided by $1,000.00 = 8.6), then multiply the result by the number in the first line for a fund under the heading entitled "Expenses Paid During Period" to estimate the expenses you paid on your account during this period. A small balance maintenance fee of $12.00 that is charged once a year may apply for certain accounts with a value of less than $2,000. This fee is not included in the table below. If it was, the estimate of expenses you paid during the period would be higher, and your ending account value lower, by this amount.
Hypothetical Example for Comparison Purposes
The second line of the accompanying table for each fund provides information about hypothetical account values and hypothetical expenses based on a fund's actual expense ratio and an assumed rate of return of 5% per year before expenses, which is not the Fund's actual return. The hypothetical account values and expenses may not be used to estimate the actual ending account balance or expenses you paid for the period. You may use this information to compare the ongoing costs of investing in the Fund and other funds. To do so, compare this 5% hypothetical example with the 5% hypothetical examples that appear in the shareholder reports of the other funds. A small balance maintenance fee of $12.00 that is charged once a year may apply for certain accounts with a value of less than $2,000. This fee is not included in the table below. If it was, the estimate of expenses you paid during the period would be higher, and your ending account value lower, by this amount.
Please note that the expenses shown in the table are meant to highlight your ongoing costs only and do not reflect any transaction costs. Therefore, the second line of the table is useful in comparing ongoing costs only, and will not help you determine the relative total costs of owning different funds. In addition, if these transactional costs were included, your costs would have been higher.
Beginning | Ending | Expenses Paid | |
Automotive Portfolio | |||
Actual | $ 1,000.00 | $ 1,187.50 | $ 6.45** |
HypotheticalA | $ 1,000.00 | $ 1,018.89 | $ 5.96** |
Construction and Housing Portfolio | |||
Actual | $ 1,000.00 | $ 1,180.90 | $ 5.41 |
HypotheticalA | $ 1,000.00 | $ 1,019.84 | $ 5.01 |
Consumer Discretionary Portfolio | |||
Actual | $ 1,000.00 | $ 1,118.70 | $ 6.15** |
HypotheticalA | $ 1,000.00 | $ 1,018.99 | $ 5.86** |
Leisure Portfolio | |||
Actual | $ 1,000.00 | $ 1,157.60 | $ 5.03 |
HypotheticalA | $ 1,000.00 | $ 1,020.13 | $ 4.71 |
Multimedia Portfolio | |||
Actual | $ 1,000.00 | $ 1,139.70 | $ 5.41 |
HypotheticalA | $ 1,000.00 | $ 1,019.74 | $ 5.11 |
Retailing Portfolio | |||
Actual | $ 1,000.00 | $ 1,177.20 | $ 5.56 |
HypotheticalA | $ 1,000.00 | $ 1,019.69 | $ 5.16 |
A 5% return per year before expenses
* Expenses are equal to each Fund's annualized expense ratio (shown in the table below); multiplied by the average account value over the period, multiplied by 181/365 (to reflect the one-half year period).
Annual Report
Annualized | |
Automotive Portfolio | 1.19%** |
Construction and Housing Portfolio | 1.00% |
Consumer Discretionary Portfolio | 1.17%** |
Leisure Portfolio | .94% |
Multimedia Portfolio | 1.02% |
Retailing Portfolio | 1.03% |
**If fees effective January 1, 2007 had been in effect during the entire period, the annualized expense ratios and the expenses paid in the actual and hypothetical examples above would have been as follows:
Annualized | Expenses | |
Automotive Portfolio | 1.15% | |
Actual | $ 6.24 | |
HypotheticalA | $ 5.76 | |
Consumer Discretionary Portfolio | ||
Actual | 1.15% | $ 6.04 |
HypotheticalA | $ 5.76 |
Annual Report
Performance
Average annual total return reflects the change in the value of an investment, assuming reinvestment of the fund's dividend income and capital gains (the profits earned upon the sale of securities that have grown in value) and assuming a constant rate of performance each year. The $10,000 table and the fund's returns do not reflect the deduction of taxes that a shareholder would pay on fund distributions or the redemption of fund shares. During periods of reimbursement by Fidelity a fund's total returns will be greater than it would be had the reimbursement not occurred. How a fund did yesterday is no guarantee of how it will do tomorrow.
Average Annual Total Returns
Periods ended February 28, 2007 | Past 1 | Past 5 | Past 10 |
Select Automotive Portfolio | 17.33% | 9.27% | 6.90% |
$10,000 Over 10 Years
Let's say hypothetically that $10,000 was invested in Select Automotive Portfolio on February 28, 1997. The chart shows how the value of your investment would have changed, and also shows how the S&P 500 Index performed over the same period.
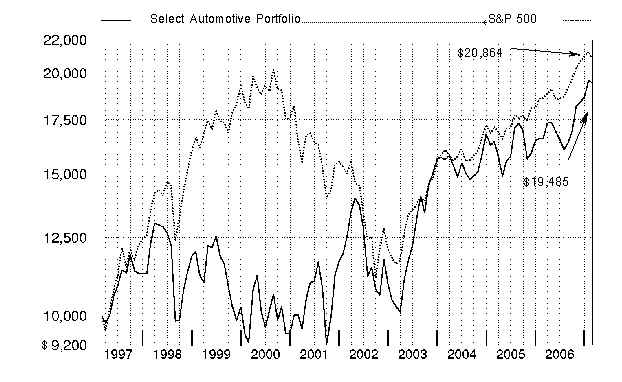
Annual Report
Management's Discussion of Fund Performance
Comments from Lee Miles, Portfolio Manager of Fidelity® Select Automotive Portfolio
A rosy year for stocks wilted just prior to the end of the 12-month period ending February 28, 2007. On the day prior to the period's close, the Dow Jones Industrial AverageSM plunged 416 points and the Standard & Poor's 500SM Index lost roughly 3.5% of its value, plummeting nearly 50 points and marking the benchmark's worst single-day performance since the day the market reopened after the 9/11 terrorist attacks. Though investors were obviously rattled by the development, it was only the 22nd-biggest decline for the S&P 500® in 20 years, and it could not overshadow how well stocks performed for the 12 months overall. For much of the past year, investors grew confident that the economy would not fall into a recession, and they bid up most broad-based stock indexes for six consecutive months from August through January. Overall for the year ending February 28, 2007, the S&P 500 was up 11.97%, the Dow advanced 14.24%, the small-cap Russell 2000® Index gained 9.87% and the NASDAQ Composite® Index rose 6.66%.
During the past year, the fund returned 17.33%, trailing the 26.42% gain of the Morgan Stanley Capital InternationalSM (MSCI®) US Investable Market Automobiles & Components Index, but surpassing the S&P 500 and the 15.41% return of a blended index specific to this fund. This blended index is a combination of the Goldman Sachs® Cyclical Industries Index, which the fund was compared with through September, and the new MSCI benchmark mentioned above, which the fund was compared with during the period's final five months.1 During the first seven months of the fiscal period, the fund edged the Goldman Sachs index. Performance benefited from some good picks in auto parts and equipment, led by Visteon - a major parts supplier to Ford - which was the top overall contributor to relative results. An out-of-benchmark position in Amerigon, a manufacturer of climate-controlled seat systems and radar-operated lane-departure warning systems, also added to the fund's return. The fund was helped further by overweighted positions in several automakers that performed well, including General Motors (GM), Honda and Toyota. Our out-of-index position in Harman International, a supplier of car stereos and navigation systems, was the principal detractor from results during this period. Other notable detractors included NAVTEQ - not in the index - which makes database software for navigation systems, and Gentex, a maker of auto-dimming mirrors. The fund beat its new MSCI index during the final five months, bolstered by strong stock selection among the automakers, both foreign and domestic. Specifically, the fund benefited from underweighted positions in GM and Ford, as both of these stocks underperformed. Out-of-benchmark holdings in Japanese manufacturers Toyota and Isuzu, and a significantly underweighted position in lagging Harley Davidson also helped boost the fund's relative return. We took profits on Isuzu and sold the position before the period ended. Conversely, subpar security selection in auto parts and equipment dampened results. Notable detractors in this category included South Korea's Hyundai Mobis, which is not in the index, and an underweighting in Johnson Controls. An out-of-benchmark position in French automaker Renault was the biggest individual disappointment, as the stock lagged due to weaker-than-expected sales in Western Europe.
1 The fund's blended index is a customized index developed by Fidelity for the limited purpose of discussing the fund's performance for the 12-month period ending February 28, 2007. From March 1, 2006, through September 30, 2006, the fund compared its performance to the Goldman Sachs Cyclical Industries Index, which returned 1.77% during that period. On October 1, 2006, the fund began comparing its performance to a different index, the MSCI US Investable Market Automobiles & Components Index, which returned 13.40% from October 1, 2006, through February 28, 2007. For the 12-month period ending February 28, 2007, the blended index (Goldman Sachs and MSCI) returned 15.41%.
The views expressed above reflect those of the portfolio manager(s) only through the end of the period as stated on the cover of this report and do not necessarily represent the views of Fidelity or any other person in the Fidelity organization. Any such views are subject to change at any time based upon market or other conditions and Fidelity disclaims any responsibility to update such views. These views may not be relied on as investment advice and, because investment decisions for a Fidelity fund are based on numerous factors, may not be relied on as an indication of trading intent on behalf of any Fidelity fund.
Annual Report
Select Automotive Portfolio
Investment Changes
Top Ten Stocks as of February 28, 2007 | ||
% of fund's | % of fund's net assets | |
Johnson Controls, Inc. | 17.7 | 5.7 |
Harley-Davidson, Inc. | 15.0 | 0.0 |
Ford Motor Co. | 9.0 | 2.0 |
General Motors Corp. | 6.7 | 1.8 |
Renault SA | 4.9 | 4.0 |
The Goodyear Tire & Rubber Co. | 4.9 | 0.6 |
BorgWarner, Inc. | 4.9 | 2.9 |
Gentex Corp. | 3.5 | 2.5 |
Toyota Motor Corp. | 3.1 | 7.5 |
Bayerische Motoren Werke AG (BMW) | 2.5 | 2.0 |
72.2 | ||
Top Industries (% of fund's net assets) | |||
As of February 28, 2007 | |||
 | Automobiles | 50.5% | |
 | Auto Components | 45.9% | |
 | Household Durables | 0.8% | |
 | Electrical Equipment | 0.5% | |
 | Software | 0.3% | |
 | All Others* | 2.0% | |

As of August 31, 2006 | |||
| Automobiles | 37.6% | |
| Auto Components | 23.6% | |
| Specialty Retail | 16.1% | |
| Machinery | 12.0% | |
| Distributors | 3.6% | |
| All Others* | 7.1% | |
* Includes short-term investments and net other assets. |
Annual Report
Select Automotive Portfolio
Investments February 28, 2007
Showing Percentage of Net Assets
Common Stocks - 98.3% | |||
Shares | Value | ||
AUTO COMPONENTS - 45.9% | |||
Auto Parts & Equipment - 39.4% | |||
Aftermarket Technology Corp. (a) | 7,600 | $ 170,088 | |
Aisin Seiki Co. Ltd. | 2,500 | 85,838 | |
Akebono Brake Industry Co. Ltd. (d) | 15,000 | 130,961 | |
American Axle & Manufacturing Holdings, Inc. | 20,796 | 510,126 | |
Amerigon, Inc. (a) | 21,200 | 235,744 | |
ArvinMeritor, Inc. | 18,700 | 341,462 | |
Bharat Forge Ltd. | 158 | 1,179 | |
BorgWarner, Inc. | 31,500 | 2,319,660 | |
Drew Industries, Inc. (a) | 7,400 | 213,120 | |
Exedy Corp. | 2,900 | 88,617 | |
Gentex Corp. (d) | 99,500 | 1,662,645 | |
Hyundai Mobis | 3,150 | 260,897 | |
Johnson Controls, Inc. | 90,190 | 8,459,821 | |
Kongsberg Automotive AS | 22,800 | 200,727 | |
Lear Corp. | 27,600 | 1,018,992 | |
LKQ Corp. (a) | 22,200 | 482,184 | |
Modine Manufacturing Co. | 11,700 | 288,639 | |
Nippon Seiki Co. Ltd. | 5,000 | 120,257 | |
Nissin Kogyo Co. Ltd. | 5,000 | 131,380 | |
Sauer-Danfoss, Inc. | 5,300 | 195,782 | |
SORL Auto Parts, Inc. (a) | 12,800 | 99,840 | |
Superior Industries International, Inc. | 5,300 | 113,685 | |
Tenneco, Inc. (a) | 29,100 | 707,130 | |
TRW Automotive Holdings Corp. (a) | 16,500 | 502,590 | |
Visteon Corp. (a) | 56,300 | 480,239 | |
18,821,603 | |||
Tires & Rubber - 6.5% | |||
Bandag, Inc. | 1,900 | 96,102 | |
Continental AG | 2,500 | 312,013 | |
Cooper Tire & Rubber Co. | 23,800 | 350,812 | |
The Goodyear Tire & Rubber Co. (a)(d) | 94,800 | 2,333,976 | |
3,092,903 | |||
TOTAL AUTO COMPONENTS | 21,914,506 | ||
AUTOMOBILES - 50.5% | |||
Automobile Manufacturers - 35.1% | |||
Bayerische Motoren Werke AG (BMW) | 20,600 | 1,197,031 | |
DaimlerChrysler AG | 5,400 | 367,578 | |
Fleetwood Enterprises, Inc. (a) | 29,700 | 275,319 | |
Ford Motor Co. (d) | 538,700 | 4,266,504 | |
Ford Otomotiv Sanayi AS | 46,000 | 393,914 | |
General Motors Corp. (d) | 100,300 | 3,201,576 | |
Honda Motor Co. Ltd. sponsored ADR | 27,300 | 1,013,649 | |
Hyundai Motor Co. | 2,160 | 158,259 | |
Maruti Udyog Ltd. | 76 | 1,451 | |
Monaco Coach Corp. | 17,000 | 273,870 | |
Nissan Motor Co. Ltd. sponsored ADR (d) | 26,100 | 600,039 | |
Renault SA | 19,700 | 2,343,432 | |
Thor Industries, Inc. | 17,400 | 728,016 | |
Shares | Value | ||
Tofas Turk Otomobil Fabrikasi AS | 30,000 | $ 111,465 | |
Toyota Motor Corp. | 400 | 26,700 | |
Toyota Motor Corp. sponsored ADR | 10,700 | 1,428,450 | |
Winnebago Industries, Inc. | 10,900 | 354,468 | |
16,741,721 | |||
Motorcycle Manufacturers - 15.4% | |||
Bajaj Auto Ltd. | 3,847 | 228,477 | |
Harley-Davidson, Inc. | 108,500 | 7,150,150 | |
7,378,627 | |||
TOTAL AUTOMOBILES | 24,120,348 | ||
ELECTRICAL EQUIPMENT - 0.5% | |||
Electrical Components & Equipment - 0.5% | |||
Ener1, Inc. (a) | 800,000 | 224,000 | |
ELECTRONIC EQUIPMENT & INSTRUMENTS - 0.0% | |||
Electronic Equipment & Instruments - 0.0% | |||
Iteris, Inc. (a) | 1,400 | 3,668 | |
HOUSEHOLD DURABLES - 0.8% | |||
Consumer Electronics - 0.8% | |||
Harman International Industries, Inc. | 3,700 | 366,892 | |
MACHINERY - 0.1% | |||
Construction & Farm Machinery & Heavy Trucks - 0.1% | |||
Tata Motors Ltd. sponsored ADR | 2,800 | 51,828 | |
METALS & MINING - 0.2% | |||
Diversified Metals & Mining - 0.2% | |||
Titanium Metals Corp. | 2,300 | 80,270 | |
SOFTWARE - 0.3% | |||
Application Software - 0.3% | |||
NAVTEQ Corp. (a) | 4,000 | 127,840 | |
TOTAL COMMON STOCKS (Cost $47,353,683) | 46,889,352 | ||
Money Market Funds - 17.7% | |||
Shares | Value | ||
Fidelity Cash Central Fund, 5.35% (b) | 603,450 | $ 603,450 | |
Fidelity Securities Lending Cash Central Fund, 5.34% (b)(c) | 7,851,814 | 7,851,814 | |
TOTAL MONEY MARKET FUNDS (Cost $8,455,264) | 8,455,264 | ||
TOTAL INVESTMENT PORTFOLIO - 116.0% (Cost $55,808,947) | 55,344,616 | ||
NET OTHER ASSETS - (16.0)% | (7,637,073) | ||
NET ASSETS - 100% | $ 47,707,543 | ||
Legend |
(a) Non-income producing |
(b) Affiliated fund that is available only to investment companies and other accounts managed by Fidelity Investments. The rate quoted is the annualized seven-day yield of the fund at period end. A complete unaudited listing of the fund's holdings as of its most recent quarter end is available upon request. |
(c) Investment made with cash collateral received from securities on loan. |
(d) Security or a portion of the security is on loan at period end. |
Affiliated Central Funds |
Information regarding fiscal year to date income earned by the Fund from investments in Fidelity Central Funds is as follows: |
Fund | Income earned |
Fidelity Cash Central Fund | $ 39,528 |
Fidelity Securities Lending Cash Central Fund | 17,222 |
Total | $ 56,750 |
Distribution of investments by country of issue, as a percentage of total net assets, is as follows: |
United States of America | 80.7% |
Japan | 7.7% |
France | 4.9% |
Germany | 4.0% |
Turkey | 1.0% |
Others (individually less than 1%) | 1.7% |
100.0% |
Income Tax Information |
At February 28, 2007, the fund had a capital loss carryforward of approximately $2,058,115 of which $878,623 and $1,179,492 will expire on February 29, 2010 and 2011, respectively. |
See accompanying notes which are an integral part of the financial statements.
Annual Report
Financial Statements
Statement of Assets and Liabilities
February 28, 2007 | ||
Assets | ||
Investment in securities, at value (including securities loaned of $7,686,808) - See accompanying schedule: Unaffiliated issuers (cost $47,353,683) | $ 46,889,352 | |
Fidelity Central Funds (cost $8,455,264) | 8,455,264 | |
Total Investments (cost $55,808,947) | $ 55,344,616 | |
Foreign currency held at value (cost $4) | 4 | |
Receivable for investments sold | 2,839,904 | |
Receivable for fund shares sold | 363,602 | |
Dividends receivable | 39,846 | |
Distributions receivable from Fidelity Central Funds | 6,506 | |
Prepaid expenses | 55 | |
Receivable from investment adviser for expense reductions | 6,530 | |
Other receivables | 5,650 | |
Total assets | 58,606,713 | |
Liabilities | ||
Payable for investments purchased | $ 36,439 | |
Payable for fund shares redeemed | 2,930,869 | |
Accrued management fee | 23,356 | |
Other affiliated payables | 10,317 | |
Other payables and accrued expenses | 46,375 | |
Collateral on securities loaned, at value | 7,851,814 | |
Total liabilities | 10,899,170 | |
Net Assets | $ 47,707,543 | |
Net Assets consist of: | ||
Paid in capital | $ 50,848,804 | |
Accumulated net investment loss | (240) | |
Accumulated undistributed net realized gain (loss) on investments and foreign currency transactions | (2,680,356) | |
Net unrealized appreciation (depreciation) on investments and assets and liabilities in foreign currencies | (460,665) | |
Net Assets, for 1,185,587 shares outstanding | $ 47,707,543 | |
Net Asset Value, offering price and redemption price per share ($47,707,543 ÷ 1,185,587 shares) | $ 40.24 | |
Statement of Operations
Year ended February 28, 2007 | ||
Investment Income | ||
Dividends | $ 296,855 | |
Interest | 1,305 | |
Income from Fidelity Central Funds (including $17,222 from security lending) | 56,750 | |
Total income | 354,910 | |
Expenses | ||
Management fee | $ 148,688 | |
Transfer agent fees | 85,962 | |
Accounting and security lending fees | 11,782 | |
Custodian fees and expenses | 68,695 | |
Independent trustees' compensation | 111 | |
Registration fees | 36,283 | |
Audit | 42,133 | |
Legal | 11,099 | |
Interest | 2,508 | |
Miscellaneous | 1,727 | |
Total expenses before reductions | 408,988 | |
Expense reductions | (95,816) | 313,172 |
Net investment income (loss) | 41,738 | |
Realized and Unrealized Gain (Loss) Net realized gain (loss) on: | ||
Investment securities: | ||
Unaffiliated issuers (net of foreign taxes of $5,285) | 1,911,251 | |
Foreign currency transactions | (7,334) | |
Total net realized gain (loss) | 1,903,917 | |
Change in net unrealized appreciation (depreciation) on: Investment securities (net of decrease in deferred foreign taxes of $15,459) | (392,542) | |
Assets and liabilities in foreign currencies | (381) | |
Total change in net unrealized appreciation (depreciation) | (392,923) | |
Net gain (loss) | 1,510,994 | |
Net increase (decrease) in net assets resulting from operations | $ 1,552,732 | |
See accompanying notes which are an integral part of the financial statements.
Annual Report
Statement of Changes in Net Assets
Year ended | Year ended | |
Increase (Decrease) in Net Assets | ||
Operations | ||
Net investment income (loss) | $ 41,738 | $ 30,429 |
Net realized gain (loss) | 1,903,917 | 272,925 |
Change in net unrealized appreciation (depreciation) | (392,923) | (886,750) |
Net increase (decrease) in net assets resulting from operations | 1,552,732 | (583,396) |
Distributions to shareholders from net investment income | (88,153) | (29,914) |
Share transactions Proceeds from sales of shares | 93,868,957 | 32,879,236 |
Reinvestment of distributions | 84,064 | 27,917 |
Cost of shares redeemed | (63,095,640) | (33,914,891) |
Net increase (decrease) in net assets resulting from share transactions | 30,857,381 | (1,007,738) |
Redemption fees | 24,628 | 27,708 |
Total increase (decrease) in net assets | 32,346,588 | (1,593,340) |
Net Assets | ||
Beginning of period | 15,360,955 | 16,954,295 |
End of period (including accumulated net investment loss of $240 and accumulated net investment loss of $256, respectively) | $ 47,707,543 | $ 15,360,955 |
Other Information Shares | ||
Sold | 2,423,941 | 942,833 |
Issued in reinvestment of distributions | 2,232 | 823 |
Redeemed | (1,687,796) | (993,625) |
Net increase (decrease) | 738,377 | (49,969) |
Financial Highlights
Years ended February 28, | 2007 | 2006 | 2005 | 2004 H | 2003 |
Selected Per-Share Data | |||||
Net asset value, beginning of period | $ 34.35 | $ 34.10 | $ 32.36 | $ 21.27 | $ 25.93 |
Income from Investment Operations | |||||
Net investment income (loss) C | .06 | .06 | (.11) | (.22) | (.13) |
Net realized and unrealized gain (loss) | 5.85 | .21 F | 1.81 | 11.29 | (4.59) |
Total from investment operations | 5.91 | .27 | 1.70 | 11.07 | (4.72) |
Distributions from net investment income | (.06) | (.07) | - | - | - |
Redemption fees added to paid in capital C | .04 | .05 | .04 | .02 | .06 |
Net asset value, end of period | $ 40.24 | $ 34.35 | $ 34.10 | $ 32.36 | $ 21.27 |
Total Return A, B | 17.33% | .94% | 5.38% | 52.14% | (17.97)% |
Ratios to Average Net Assets D, G | |||||
Expenses before reductions | 1.58% | 1.59% | 1.64% | 1.78% | 1.71% |
Expenses net of fee waivers, if any | 1.22% | 1.25% | 1.58% | 1.78% | 1.71% |
Expenses net of all reductions | 1.21% | 1.19% | 1.56% | 1.77% | 1.68% |
Net investment income (loss) | .16% | .17% | (.34)% | (.77)% | (.52)% |
Supplemental Data | |||||
Net assets, end of period (000 omitted) | $ 47,708 | $ 15,361 | $ 16,954 | $ 21,438 | $ 15,241 |
Portfolio turnover rate E | 256% | 206% | 188% | 125% | 217% |
A Total returns would have been lower had certain expenses not been reduced during the periods shown. B Total returns do not include the effect of the former sales charges. C Calculated based on average shares outstanding during the period. D Fees and expenses of the underlying Fidelity Central Funds are not included in the Fund's expense ratio. The Fund indirectly bears its proportionate share of the expenses of any underlying Fidelity Central Funds. E Amount does not include the portfolio activity of any underlying Fidelity Central Funds. F The amount shown for a share outstanding does not correspond with the aggregate net gain (loss) on investments for the period due to the timing of sales and repurchases of shares in relation to fluctuating market values of the investments of the Fund. G Expense ratios reflect operating expenses of the Fund. Expenses before reductions do not reflect amounts reimbursed by the investment adviser or reductions from brokerage service arrangements or other expense offset arrangements and do not represent the amount paid by the Fund during periods when reimbursements or reductions occur. Expenses net of fee waivers reflect expenses after reimbursement by the investment adviser but prior to reductions from brokerage service arrangements or other expense offset arrangements. Expenses net of all reductions represent the net expenses paid by the Fund. H For the year ended February 29. |
See accompanying notes which are an integral part of the financial statements.
Annual Report
Select Construction and Housing Portfolio
Performance
Average annual total return reflects the change in the value of an investment, assuming reinvestment of the fund's dividend income and capital gains (the profits earned upon the sale of securities that have grown in value) and assuming a constant rate of performance each year. The $10,000 table and the fund's returns do not reflect the deduction of taxes that a shareholder would pay on fund distributions or the redemption of fund shares. During periods of reimbursement by Fidelity a fund's total returns will be greater than it would be had the reimbursement not occurred. How a fund did yesterday is no guarantee of how it will do tomorrow.
Average Annual Total Returns
Periods ended February 28, 2007 | Past 1 | Past 5 | Past 10 |
Select Construction and Housing Portfolio | 5.41% | 13.68% | 13.60% |
$10,000 Over 10 Years
Let's say hypothetically that $10,000 was invested in Select Construction and Housing Portfolio on February 28, 1997. The chart shows how the value of your investment would have changed, and also shows how the S&P 500 Index performed over the same period.
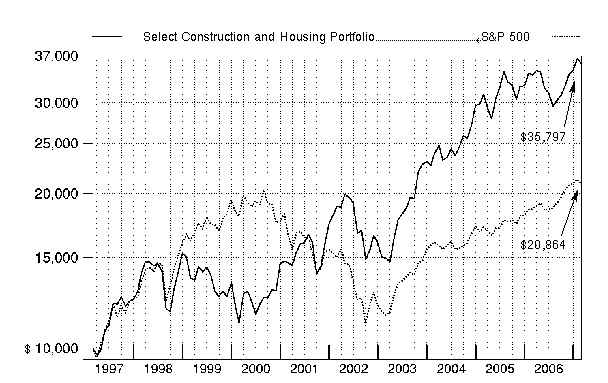
Annual Report
Select Construction and Housing Portfolio
Management's Discussion of Fund Performance
Comments from Nora Creedon, Portfolio Manager of Fidelity® Select Construction and Housing Portfolio
A rosy year for stocks wilted just prior to the end of the 12-month period ending February 28, 2007. On the day prior to the period's close, the Dow Jones Industrial AverageSM plunged 416 points and the Standard & Poor's 500SM Index lost roughly 3.5% of its value, plummeting nearly 50 points and marking the benchmark's worst single-day performance since the day the market reopened after the 9/11 terrorist attacks. Though investors were obviously rattled by the development, it was only the 22nd-biggest decline for the S&P 500® in 20 years, and it could not overshadow how well stocks performed for the 12 months overall. For much of the past year, investors grew confident that the economy would not fall into a recession, and they bid up most broad-based stock indexes for six consecutive months from August through January. Overall for the year ending February 28, 2007, the S&P 500 was up 11.97%, the Dow advanced 14.24%, the small-cap Russell 2000® Index gained 9.87% and the NASDAQ Composite® Index rose 6.66%.
For the year, the fund was up 5.41%, compared with a decline of 1.08% for its new benchmark, the Morgan Stanley Capital InternationalSM (MSCI®) US Investable Market Construction & Housing Custom Index, and an advance of 17.74% for a blended index specific to this fund. This blended index is a combination of the Goldman Sachs® Cyclical Industries Index, which the fund was compared with through September, and the new MSCI index mentioned above, which the fund was compared with during the period's final five months1. For the same 12-month period, the fund underperformed the S&P 500. During the review period's first seven months, the fund fell short of the Goldman Sachs index, mostly because of its sizable overexposure to homebuilding stocks, which were especially weak. Among the most notable detractors in this space were D.R. Horton, KB Home and Lennar. Out-of-index home improvement retailers Home Depot and Lowe's, also with significant leverage to the slowing housing market, were major drags on performance as well. Positive results came from good stock selection in the industrial machinery, real estate management/development and trading/distributors groups, with Danaher, China Overseas Land & Investment and WESCO International, respectively, leading the way. A stake in high-end paint maker Sherwin-Williams also helped. Danaher was no longer held in the portfolio at the end of the 12-month review period. During the early part of the final five months of the period, as homebuilder stocks fell to book-value levels, some of these stocks rallied on renewed interest from value investors. Later, however, grave concerns about the credit quality of subprime mortgages stalled the rally. Overall during this period, the fund performed roughly in line with its new MSCI benchmark. An underweighting and favorable stock selection in the homebuilding space helped, as did favorable picks among home improvement retailers and mall-related real estate investment trusts (REITs). Not owning homebuilder and index component Centex provided the biggest relative contribution, while strong performance by holdings in such commercially oriented businesses as mall REIT General Growth Properties, an out-of-index holding, and global real estate services leader CB Richard Ellis Group also were notable. A small out-of-benchmark stake in Norwegian construction and property development firm Veidekke helped as well. Holding back our results were underweightings in construction materials and building products, with underrepresented holdings in Vulcan Materials and American Standard, respectively, both hurting. Having no stake in Realogy - a leading provider of real estate and relocation services that rose on a takeover bid - also detracted, as did an overweighting in non-index stock Caterpillar, which makes heavy construction equipment.
1 The fund's blended index is a customized index developed by Fidelity for the limited purpose of discussing the fund's performance for the 12-month period ending February 28, 2007. From March 1, 2006, through September 30, 2006, the fund compared its performance to the Goldman Sachs Cyclical Industries Index, which returned 1.77% during that period. On October 1, 2006, the fund began comparing its performance to a different index, the MSCI US Investable Market Construction & Housing Custom Index, which returned 15.69% from October 1, 2006, through February 28, 2007. For the 12-month period ending February 28, 2007, the blended index (Goldman Sachs and MSCI) returned 17.74%.
The views expressed above reflect those of the portfolio manager(s) only through the end of the period as stated on the cover of this report and do not necessarily represent the views of Fidelity or any other person in the Fidelity organization. Any such views are subject to change at any time based upon market or other conditions and Fidelity disclaims any responsibility to update such views. These views may not be relied on as investment advice and, because investment decisions for a Fidelity fund are based on numerous factors, may not be relied on as an indication of trading intent on behalf of any Fidelity fund.
Annual Report
Select Construction and Housing Portfolio
Investment Changes
Top Ten Stocks as of February 28, 2007 | ||
% of fund's | % of fund's net assets | |
Home Depot, Inc. | 22.9 | 5.9 |
Lowe's Companies, Inc. | 15.1 | 3.7 |
Fluor Corp. | 4.4 | 5.6 |
CB Richard Ellis Group, Inc. Class A | 3.3 | 0.0 |
D.R. Horton, Inc. | 3.2 | 3.9 |
Pulte Homes, Inc. | 2.5 | 3.5 |
Vulcan Materials Co. | 2.5 | 3.4 |
Forest City Enterprises, Inc. Class A | 2.3 | 0.0 |
Martin Marietta Materials, Inc. | 2.0 | 1.8 |
General Growth Properties, Inc. | 2.0 | 2.0 |
60.2 | ||
Top Industries (% of fund's net assets) | |||
As of February 28, 2007 | |||
| Specialty Retail | 39.8% | |
| Construction & Engineering | 13.0% | |
| Household Durables | 12.3% | |
| Real Estate Management & Development | 8.6% | |
| Construction Materials | 6.9% | |
| All Others* | 19.4% | |
As of August 31, 2006 | |||
| Household Durables | 15.9% | |
| Machinery | 15.0% | |
| Specialty Retail | 12.2% | |
| Construction & Engineering | 11.8% | |
| Thrifts & Mortgage Finance | 10.7% | |
| All Others* | 34.4% | |
* Includes short-term investments and net other assets. |
Annual Report
Select Construction and Housing Portfolio
Investments February 28, 2007
Showing Percentage of Net Assets
Common Stocks - 91.8% | |||
Shares | Value | ||
BUILDING PRODUCTS - 3.5% | |||
Building Products - 3.5% | |||
American Standard Companies, Inc. | 39,300 | $ 2,082,507 | |
Masco Corp. | 94,700 | 2,826,795 | |
NCI Building Systems, Inc. (a) | 13,900 | 776,176 | |
5,685,478 | |||
COMMUNICATIONS EQUIPMENT - 1.0% | |||
Communications Equipment - 1.0% | |||
Dycom Industries, Inc. (a) | 34,000 | 850,000 | |
MasTec, Inc. (a) | 71,800 | 822,828 | |
1,672,828 | |||
CONSTRUCTION & ENGINEERING - 13.0% | |||
Construction & Engineering - 13.0% | |||
Chicago Bridge & Iron Co. NV (NY Shares) | 45,800 | 1,361,634 | |
EMCOR Group, Inc. (a) | 17,700 | 1,063,062 | |
Fluor Corp. | 85,600 | 7,230,632 | |
Foster Wheeler Ltd. (a) | 47,600 | 2,631,328 | |
Infrasource Services, Inc. (a) | 49,700 | 1,218,644 | |
Jacobs Engineering Group, Inc. (a) | 30,800 | 2,782,472 | |
Shaw Group, Inc. (a) | 45,400 | 1,397,412 | |
URS Corp. (a) | 28,000 | 1,163,960 | |
Veidekke ASA | 16,400 | 850,254 | |
Washington Group International, Inc. (a) | 15,700 | 920,334 | |
YIT-Yhtyma OY | 20,550 | 670,353 | |
21,290,085 | |||
CONSTRUCTION MATERIALS - 6.9% | |||
Construction Materials - 6.9% | |||
Eagle Materials, Inc. (d) | 25,200 | 1,167,264 | |
Florida Rock Industries, Inc. | 26,475 | 1,783,886 | |
Martin Marietta Materials, Inc. | 26,700 | 3,346,044 | |
Texas Industries, Inc. (d) | 11,500 | 910,915 | |
Vulcan Materials Co. | 34,600 | 4,030,554 | |
11,238,663 | |||
HEALTH CARE PROVIDERS & SERVICES - 0.2% | |||
Health Care Facilities - 0.2% | |||
Brookdale Senior Living, Inc. | 8,000 | 377,680 | |
HOUSEHOLD DURABLES - 12.3% | |||
Homebuilding - 12.3% | |||
D.R. Horton, Inc. | 208,466 | 5,288,782 | |
KB Home | 58,800 | 2,916,480 | |
Lennar Corp. Class A | 63,100 | 3,107,044 | |
Pulte Homes, Inc. | 140,900 | 4,165,004 | |
Shares | Value | ||
Ryland Group, Inc. | 7,000 | $ 337,190 | |
Standard Pacific Corp. (d) | 53,000 | 1,353,090 | |
Toll Brothers, Inc. (a) | 101,600 | 3,033,776 | |
20,201,366 | |||
MACHINERY - 1.7% | |||
Construction & Farm Machinery & Heavy Trucks - 1.7% | |||
Bucyrus International, Inc. Class A | 13,100 | 667,445 | |
Caterpillar, Inc. | 22,000 | 1,417,240 | |
Joy Global, Inc. | 16,800 | 744,912 | |
2,829,597 | |||
REAL ESTATE INVESTMENT TRUSTS - 3.6% | |||
Residential REITs - 1.4% | |||
Equity Residential (SBI) | 26,100 | 1,325,619 | |
United Dominion Realty Trust, Inc. (SBI) | 26,596 | 868,359 | |
2,193,978 | |||
Retail REITs - 2.0% | |||
General Growth Properties, Inc. | 52,500 | 3,330,075 | |
Specialized REITs - 0.2% | |||
Health Care Property Investors, Inc. | 9,600 | 352,992 | |
TOTAL REAL ESTATE INVESTMENT TRUSTS | 5,877,045 | ||
REAL ESTATE MANAGEMENT & DEVELOPMENT - 8.6% | |||
Real Estate Management & Development - 8.6% | |||
AV Jennings Homes Ltd. | 768,664 | 835,823 | |
CB Richard Ellis Group, Inc. Class A (a)(d) | 160,900 | 5,361,188 | |
China Overseas Land & Investment Ltd. | 1,069,000 | 1,078,160 | |
Forest City Enterprises, Inc. Class A | 60,200 | 3,719,156 | |
The St. Joe Co. (d) | 56,500 | 3,143,660 | |
14,137,987 | |||
SPECIALTY RETAIL - 39.8% | |||
Home Improvement Retail - 39.4% | |||
Home Depot, Inc. (d) | 949,250 | 37,590,300 | |
Lowe's Companies, Inc. (d) | 760,000 | 24,745,600 | |
Sherwin-Williams Co. | 35,600 | 2,369,180 | |
64,705,080 | |||
Homefurnishing Retail - 0.4% | |||
Pier 1 Imports, Inc. | 87,900 | 596,841 | |
TOTAL SPECIALTY RETAIL | 65,301,921 | ||
TRADING COMPANIES & DISTRIBUTORS - 1.2% | |||
Trading Companies & Distributors - 1.2% | |||
WESCO International, Inc. (a) | 28,500 | 1,901,805 | |
TOTAL COMMON STOCKS (Cost $120,934,645) | 150,514,455 | ||
Money Market Funds - 25.1% | |||
Shares | Value | ||
Fidelity Cash Central Fund, 5.35% (b) | 13,915,979 | $ 13,915,979 | |
Fidelity Securities Lending Cash Central Fund, 5.34% (b)(c) | 27,186,675 | 27,186,675 | |
TOTAL MONEY MARKET FUNDS (Cost $41,102,654) | 41,102,654 | ||
TOTAL INVESTMENT PORTFOLIO - 116.9% (Cost $162,037,299) | 191,617,109 | ||
NET OTHER ASSETS - (16.9)% | (27,636,447) | ||
NET ASSETS - 100% | $ 163,980,662 | ||
Legend |
(a) Non-income producing |
(b) Affiliated fund that is available only to investment companies and other accounts managed by Fidelity Investments. The rate quoted is the annualized seven-day yield of the fund at period end. A complete unaudited listing of the fund's holdings as of its most recent quarter end is available upon request. |
(c) Investment made with cash collateral received from securities on loan. |
(d) Security or a portion of the security is on loan at period end. |
Affiliated Central Funds |
Information regarding fiscal year to date income earned by the Fund from investments in Fidelity Central Funds is as follows: |
Fund | Income earned |
Fidelity Cash Central Fund | $ 147,851 |
Fidelity Securities Lending Cash Central Fund | 176,554 |
Total | $ 324,405 |
See accompanying notes which are an integral part of the financial statements.
Annual Report
Select Construction and Housing Portfolio
Financial Statements
Statement of Assets and Liabilities
February 28, 2007 | ||
Assets | ||
Investment in securities, at value (including securities loaned of $26,240,245) - See accompanying schedule: Unaffiliated issuers (cost $120,934,645) | $ 150,514,455 | |
Fidelity Central Funds (cost $41,102,654) | 41,102,654 | |
Total Investments (cost $162,037,299) | $ 191,617,109 | |
Receivable for fund shares sold | 361,085 | |
Dividends receivable | 46,553 | |
Distributions receivable from Fidelity Central Funds | 40,326 | |
Prepaid expenses | 871 | |
Other receivables | 15,219 | |
Total assets | 192,081,163 | |
Liabilities | ||
Payable for fund shares redeemed | 749,715 | |
Accrued management fee | 77,977 | |
Other affiliated payables | 43,777 | |
Other payables and accrued expenses | 42,357 | |
Collateral on securities loaned, at value | 27,186,675 | |
Total liabilities | 28,100,501 | |
Net Assets | $ 163,980,662 | |
Net Assets consist of: | ||
Paid in capital | $ 127,540,534 | |
Undistributed net investment income | 566,263 | |
Accumulated undistributed net realized gain (loss) on investments and foreign currency transactions | 6,294,055 | |
Net unrealized appreciation (depreciation) on investments | 29,579,810 | |
Net Assets, for 3,566,126 shares outstanding | $ 163,980,662 | |
Net Asset Value, offering price and redemption price per share ($163,980,662 ÷ 3,566,126 shares) | $ 45.98 | |
Statement of Operations
Year ended February 28, 2007 | ||
Investment Income | ||
Dividends | $ 2,216,818 | |
Income from Fidelity Central Funds (including $176,554 from security lending) | 324,405 | |
Total income | 2,541,223 | |
Expenses | ||
Management fee | $ 1,002,483 | |
Transfer agent fees | 621,162 | |
Accounting and security lending fees | 86,055 | |
Custodian fees and expenses | 23,551 | |
Independent trustees' compensation | 677 | |
Registration fees | 29,127 | |
Audit | 36,440 | |
Legal | 3,906 | |
Miscellaneous | 16,633 | |
Total expenses before reductions | 1,820,034 | |
Expense reductions | (12,752) | 1,807,282 |
Net investment income (loss) | 733,941 | |
Realized and Unrealized Gain (Loss) Net realized gain (loss) on: | ||
Investment securities: | ||
Unaffiliated issuers | 21,755,965 | |
Foreign currency transactions | 3,876 | |
Total net realized gain (loss) | 21,759,841 | |
Change in net unrealized appreciation (depreciation) on investment securities | (21,412,222) | |
Net gain (loss) | 347,619 | |
Net increase (decrease) in net assets resulting from operations | $ 1,081,560 | |
See accompanying notes which are an integral part of the financial statements.
Annual Report
Select Construction and Housing Portfolio
Financial Statements - continued
Statement of Changes in Net Assets
Year ended | Year ended | |
Increase (Decrease) in Net Assets | ||
Operations | ||
Net investment income (loss) | $ 733,941 | $ 9,821 |
Net realized gain (loss) | 21,759,841 | 6,319,571 |
Change in net unrealized appreciation (depreciation) | (21,412,222) | 8,021,493 |
Net increase (decrease) in net assets resulting from operations | 1,081,560 | 14,350,885 |
Distributions to shareholders from net investment income | (164,323) | (48,224) |
Distributions to shareholders from net realized gain | (21,267,651) | (2,067,434) |
Total distributions | (21,431,974) | (2,115,658) |
Share transactions Proceeds from sales of shares | 79,173,304 | 370,971,483 |
Reinvestment of distributions | 20,689,569 | 2,048,294 |
Cost of shares redeemed | (159,966,113) | (380,317,030) |
Net increase (decrease) in net assets resulting from share transactions | (60,103,240) | (7,297,253) |
Redemption fees | 31,212 | 260,223 |
Total increase (decrease) in net assets | (80,422,442) | 5,198,197 |
Net Assets | ||
Beginning of period | 244,403,104 | 239,204,907 |
End of period (including undistributed net investment income of $566,263 and distributions in excess of net investment income of $32, respectively) | $ 163,980,662 | $ 244,403,104 |
Other Information Shares | ||
Sold | 1,680,588 | 7,902,684 |
Issued in reinvestment of distributions | 451,499 | 49,218 |
Redeemed | (3,511,759) | (8,226,702) |
Net increase (decrease) | (1,379,672) | (274,800) |
Financial Highlights
Years ended February 28, | 2007 | 2006 | 2005 | 2004 H | 2003 |
Selected Per-Share Data | |||||
Net asset value, beginning of period | $ 49.42 | $ 45.82 | $ 36.04 | $ 22.55 | $ 28.41 |
Income from Investment Operations | |||||
Net investment income (loss) C | .19 | - I | .02 | (.05) F | (.10) |
Net realized and unrealized gain (loss) | 2.28 | 3.99 | 10.78 | 13.52 | (5.81) |
Total from investment operations | 2.47 | 3.99 | 10.80 | 13.47 | (5.91) |
Distributions from net investment income | (.05) | (.01) | - | - | - |
Distributions from net realized gain | (5.87) | (.42) | (1.06) | - | - |
Total distributions | (5.92) | (.43) | (1.06) | - | - |
Redemption fees added to paid in capital C | .01 | .04 | .04 | .02 | .05 |
Net asset value, end of period | $ 45.98 | $ 49.42 | $ 45.82 | $ 36.04 | $ 22.55 |
Total Return A, B | 5.41% | 8.98% | 30.28% | 59.82% | (20.63)% |
Ratios to Average Net Assets D, G | |||||
Expenses before reductions | 1.02% | 1.05% | 1.09% | 1.37% | 1.44% |
Expenses net of fee waivers, if any | 1.02% | 1.05% | 1.09% | 1.37% | 1.44% |
Expenses net of all reductions | 1.02% | 1.01% | 1.08% | 1.35% | 1.41% |
Net investment income (loss) | .41% | -% | .04% | (.15)% | (.37)% |
Supplemental Data | |||||
Net assets, end of period (000 omitted) | $ 163,981 | $ 244,403 | $ 239,205 | $ 97,338 | $ 47,083 |
Portfolio turnover rate E | 54% | 154% | 119% | 71% | 133% |
A Total returns would have been lower had certain expenses not been reduced during the periods shown. B Total returns do not include the effect of the former sales charges. CCalculated based on average shares outstanding during the period. D Fees and expenses of the underlying Fidelity Central Funds are not included in the Fund's expense ratio. The Fund indirectly bears its proportionate share of the expenses of any underlying Fidelity Central Funds. E Amount does not include the portfolio activity of any underlying Fidelity Central Funds. F Investment income per share reflects a special dividend which amounted to $.05 per share. GExpense ratios reflect operating expenses of the Fund. Expenses before reductions do not reflect amounts reimbursed by the investment adviser or reductions from brokerage service arrangements or other expense offset arrangements and do not represent the amount paid by the Fund during periods when reimbursements or reductions occur. Expenses net of fee waivers reflect expenses after reimbursement by the investment adviser but prior to reductions from brokerage service arrangements or other expense offset arrangements. Expenses net of all reductions represent the net expenses paid by the Fund. H For the year ended February 29. I Amount represents less than $.01 per share. |
See accompanying notes which are an integral part of the financial statements.
Annual Report
Select Consumer Discretionary Portfolio
Performance
Average annual total return reflects the change in the value of an investment, assuming reinvestment of the fund's dividend income and capital gains (the profits earned upon the sale of securities that have grown in value) and assuming a constant rate of performance each year. The $10,000 table and the fund's returns do not reflect the deduction of taxes that a shareholder would pay on fund distributions or the redemption of fund shares. During periods of reimbursement by Fidelity a fund's total returns will be greater than it would be had the reimbursement not occurred. How a fund did yesterday is no guarantee of how it will do tomorrow.
Average Annual Total Returns
Periods ended February 28, 2007 | Past 1 | Past 5 | Past 10 |
Select Consumer Discretionary Portfolio | 12.99% | 5.68% | 8.01% |
Prior to October 1, 2006, Select Consumer Discretionary Portfolio was named Select Consumer Industries Portfolio, operated under certain different investment policies. The historical performance for the fund may not represent its current investment policies.
$10,000 Over 10 Years
Let's say hypothetically that $10,000 was invested in Select Consumer Discretionary Portfolio on February 28, 1997. The chart shows how the value of your investment would have changed, and also shows how the S&P 500® Index performed over the same period.
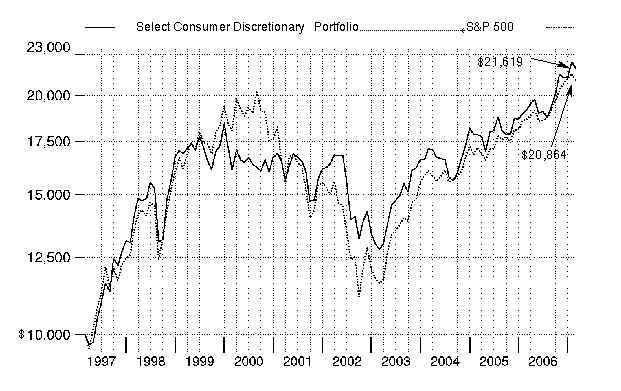
Annual Report
Select Consumer Discretionary Portfolio
Management's Discussion of Fund Performance
Comments from John Harris, who became Portfolio Manager of Fidelity® Select Consumer Discretionary Portfolio on
April 11, 2007, after the period covered by this report
A rosy year for stocks wilted just prior to the end of the 12-month period ending February 28, 2007. On the day prior to the period's close, the Dow Jones Industrial AverageSM plunged 416 points and the Standard & Poor's 500SM Index lost roughly 3.5% of its value, plummeting nearly 50 points and marking the benchmark's worst single-day performance since the day the market reopened after the 9/11 terrorist attacks. Though investors were obviously rattled by the development, it was only the 22nd-biggest decline for the S&P 500® in 20 years, and it could not overshadow how well stocks performed for the 12 months overall. For much of the past year, investors grew confident that the economy would not fall into a recession, and they bid up most broad-based stock indexes for six consecutive months from August through January. Overall for the year ending February 28, 2007, the S&P 500 was up 11.97%, the Dow advanced 14.24%, the small-cap Russell 2000® Index gained 9.87% and the NASDAQ Composite® Index rose 6.66%.
For the 12 months ending February 28, 2007, the fund was up 12.99%, while the Morgan Stanley Capital InternationalSM (MSCI®) US Investable Market Consumer Discretionary Index returned 14.93% and a blended index specific to this fund advanced 18.42%. This blended index is a combination of the Goldman Sachs® Consumer Industries Index, which the fund was compared with through September, and the new MSCI benchmark mentioned above, which the fund was compared with during the period's final five months 1. The new supplemental benchmark and simultaneous name change reflected a narrowing of the fund's focus, from both consumer discretionary and consumer staples stocks to just consumer discretionary issues. The portfolio outperformed the S&P 500 during the 12-month time frame. For the first seven months of the review period, the fund lagged behind the Goldman Sachs index, hurt by an underweighting in broadcast and cable stocks, which generally did well, and overweighted holdings in Internet software and services firms that underperformed. Internet auctioneer eBay lost value on investor concerns about the firm's growth trends and high stock valuation, and we sold the position. Not owning index component Comcast during this time - although we added it later - also hurt results as the stock soared. On the positive side, underweighting home improvement retailers helped results when their stocks declined on investor fears that a housing market slowdown would hurt sales. An overweighting in department stores and stock selection in packaged foods aided relative performance as well. Top contributors included an out-of-index position in Google and an overweighting in Federated Department Stores, the nation's largest department store chain. The firm had acquired its chief competitor, May Department Stores, in late 2005, and investors applauded Federated's turnaround plan for the merged companies. The fund underperformed the MSCI index during the final five months of the period, held back by retail holdings that had helped results earlier in the year but declined in the fourth quarter. Apparel retail was a particular area of weakness. Retailers in general were buffeted by investor fears that holiday sales would come in below projections. Those fears in the end turned out to be largely unfounded, and many of the same stocks began to recover in 2007. Key detractors during the final five months included a quartet of retailers: Federated Department Stores, women's clothing chain Coldwater Creek, and electronics retailers Best Buy and Circuit City. By period end, the fund's Circuit City and Coldwater Creek positions had been sold. On the positive side, Saks, Polo Ralph Lauren and Coach, three high-end fashion retailers, were among the fund's best relative performers.
1 The fund's blended index is a customized index developed by Fidelity for the limited purpose of discussing the fund's performance for the 12-month period ending February 28, 2007. From March 1, 2006, through September 30, 2006, the fund compared its performance to the Goldman Sachs Consumer Industries Index, which returned 6.22% during that period. On October 1, 2006, the fund began comparing its performance to a different index, the MSCI US Investable Market Consumer Discretionary Index, which returned 11.49% from October 1, 2006, through February 28, 2007. For the 12-month period ending February 28, 2007, the blended index (Goldman Sachs and MSCI) returned 18.42%.
The views expressed above reflect those of the portfolio manager(s) only through the end of the period as stated on the cover of this report and do not necessarily represent the views of Fidelity or any other person in the Fidelity organization. Any such views are subject to change at any time based upon market or other conditions and Fidelity disclaims any responsibility to update such views. These views may not be relied on as investment advice and, because investment decisions for a Fidelity fund are based on numerous factors, may not be relied on as an indication of trading intent on behalf of any Fidelity fund.
Annual Report
Select Consumer Discretionary Portfolio
Investment Changes
Top Ten Stocks as of February 28, 2007 | ||
% of fund's | % of fund's net assets | |
Federated Department Stores, Inc. | 6.7 | 5.3 |
News Corp. Class A | 6.1 | 2.0 |
Time Warner, Inc. | 5.4 | 0.0 |
Comcast Corp. Class A | 5.0 | 0.0 |
Target Corp. | 3.2 | 1.8 |
McDonald's Corp. | 3.0 | 0.0 |
JCPenney Co., Inc. | 2.9 | 1.7 |
Saks, Inc. | 2.7 | 0.9 |
McGraw-Hill Companies, Inc. | 2.7 | 1.1 |
Polo Ralph Lauren Corp. Class A | 2.6 | 0.8 |
40.3 | ||
Top Industries (% of fund's net assets) | |||
As of February 28, 2007 | |||
| Media | 24.0% | |
| Multiline Retail | 19.8% | |
| Specialty Retail | 18.4% | |
| Hotels, Restaurants & Leisure | 14.5% | |
| Textiles, Apparel & Luxury Goods | 11.1% | |
| All Others* | 12.2% | |
As of August 31, 2006 | |||
| Food Products | 13.6% | |
| Food & Staples Retailing | 12.8% | |
| Beverages | 12.4% | |
| Specialty Retail | 12.3% | |
| Multiline Retail | 9.7% | |
| All Others* | 39.2% | |
* Includes short-term investments and net other assets. |
Annual Report
Select Consumer Discretionary Portfolio
Investments February 28, 2007
Showing Percentage of Net Assets
Common Stocks - 99.4% | |||
Shares | Value | ||
AUTOMOBILES - 1.2% | |||
Automobile Manufacturers - 1.2% | |||
Renault SA | 1,700 | $ 202,225 | |
Toyota Motor Corp. sponsored ADR | 2,200 | 293,700 | |
495,925 | |||
COMPUTERS & PERIPHERALS - 1.5% | |||
Computer Hardware - 1.5% | |||
Apple, Inc. (a) | 1,100 | 93,071 | |
Hewlett-Packard Co. | 12,800 | 504,064 | |
597,135 | |||
DIVERSIFIED CONSUMER SERVICES - 1.5% | |||
Specialized Consumer Services - 1.5% | |||
Sotheby's Class A (ltd. vtg.) | 16,800 | 610,848 | |
DIVERSIFIED FINANCIAL SERVICES - 1.4% | |||
Specialized Finance - 1.4% | |||
Moody's Corp. | 9,000 | 582,480 | |
FOOD & STAPLES RETAILING - 1.1% | |||
Food Retail - 1.0% | |||
Tesco PLC | 2,275 | 19,306 | |
Tesco PLC Sponsored ADR | 15,400 | 393,470 | |
412,776 | |||
Hypermarkets & Super Centers - 0.1% | |||
Wal-Mart de Mexico SA de CV Series V | 9,000 | 34,787 | |
TOTAL FOOD & STAPLES RETAILING | 447,563 | ||
HOTELS, RESTAURANTS & LEISURE - 14.5% | |||
Casinos & Gaming - 6.2% | |||
Ameristar Casinos, Inc. | 7,900 | 256,118 | |
Aristocrat Leisure Ltd. | 7,900 | 104,577 | |
Bally Technologies, Inc. (a) | 15,700 | 343,045 | |
Boyd Gaming Corp. | 7,900 | 370,273 | |
International Game Technology | 12,400 | 511,500 | |
Las Vegas Sands Corp. (a) | 3,200 | 276,096 | |
Penn National Gaming, Inc. (a) | 8,300 | 387,029 | |
Wynn Resorts Ltd. (d) | 2,400 | 235,248 | |
2,483,886 | |||
Hotels, Resorts & Cruise Lines - 3.2% | |||
Accor SA | 6,800 | 600,489 | |
Marriott International, Inc. Class A | 11,900 | 570,129 | |
Starwood Hotels & Resorts Worldwide, Inc. | 1,700 | 111,860 | |
1,282,478 | |||
Restaurants - 5.1% | |||
McDonald's Corp. | 27,400 | 1,197,928 | |
Starbucks Corp. (a) | 5,400 | 166,860 | |
Shares | Value | ||
Tim Hortons, Inc. | 3,977 | $ 119,588 | |
Wendy's International, Inc. | 18,200 | 584,038 | |
2,068,414 | |||
TOTAL HOTELS, RESTAURANTS & LEISURE | 5,834,778 | ||
HOUSEHOLD DURABLES - 1.4% | |||
Homebuilding - 0.9% | |||
D.R. Horton, Inc. | 5,000 | 126,850 | |
Ryland Group, Inc. | 1,500 | 72,255 | |
Toll Brothers, Inc. (a) | 5,700 | 170,202 | |
369,307 | |||
Household Appliances - 0.5% | |||
Whirlpool Corp. | 2,400 | 211,704 | |
TOTAL HOUSEHOLD DURABLES | 581,011 | ||
INTERNET & CATALOG RETAIL - 0.5% | |||
Internet Retail - 0.5% | |||
Blue Nile, Inc. (a)(d) | 4,900 | 191,100 | |
INTERNET SOFTWARE & SERVICES - 1.1% | |||
Internet Software & Services - 1.1% | |||
Google, Inc. Class A (sub. vtg.) (a) | 954 | 428,775 | |
LEISURE EQUIPMENT & PRODUCTS - 0.1% | |||
Leisure Products - 0.1% | |||
Sports Direct International PLC | 7,600 | 42,549 | |
MEDIA - 24.0% | |||
Advertising - 0.3% | |||
National CineMedia, Inc. | 3,600 | 94,392 | |
Broadcasting & Cable TV - 6.4% | |||
Comcast Corp. Class A | 78,550 | 2,020,306 | |
Grupo Televisa SA de CV (CPO) sponsored ADR | 16,500 | 450,285 | |
Liberty Media Holding Corp. - Capital Series A (a) | 900 | 97,092 | |
2,567,683 | |||
Movies & Entertainment - 12.8% | |||
News Corp | |||
Class A | 108,800 | 2,451,264 | |
Class B | 3,900 | 92,976 | |
Regal Entertainment Group Class A | 2,700 | 57,699 | |
The Walt Disney Co. | 7,100 | 243,246 | |
Time Warner, Inc. | 107,200 | 2,181,520 | |
Viacom, Inc. Class B (non-vtg.) (a) | 3,300 | 128,832 | |
5,155,537 | |||
Publishing - 4.5% | |||
McGraw-Hill Companies, Inc. | 16,800 | 1,085,448 | |
R.H. Donnelley Corp. | 10,300 | 736,965 | |
1,822,413 | |||
TOTAL MEDIA | 9,640,025 | ||
Common Stocks - continued | |||
Shares | Value | ||
MULTILINE RETAIL - 19.8% | |||
Department Stores - 15.8% | |||
Federated Department Stores, Inc. | 60,800 | $ 2,715,327 | |
JCPenney Co., Inc. | 14,200 | 1,151,762 | |
Nordstrom, Inc. | 17,200 | 913,148 | |
Saks, Inc. | 56,900 | 1,099,308 | |
Sears Holdings Corp. (a) | 2,700 | 486,675 | |
6,366,220 | |||
General Merchandise Stores - 4.0% | |||
Family Dollar Stores, Inc. | 10,300 | 298,391 | |
Target Corp. | 21,200 | 1,304,436 | |
1,602,827 | |||
TOTAL MULTILINE RETAIL | 7,969,047 | ||
PERSONAL PRODUCTS - 1.1% | |||
Personal Products - 1.1% | |||
Bare Escentuals, Inc. | 12,200 | 424,438 | |
REAL ESTATE INVESTMENT TRUSTS - 0.7% | |||
Specialized REITs - 0.7% | |||
Host Hotels & Resorts, Inc. | 11,200 | 294,336 | |
SPECIALTY RETAIL - 18.4% | |||
Apparel Retail - 9.9% | |||
Abercrombie & Fitch Co. Class A | 4,700 | 367,399 | |
Aeropostale, Inc. (a) | 5,800 | 212,512 | |
American Eagle Outfitters, Inc. | 13,650 | 423,833 | |
Casual Male Retail Group, Inc. (a) | 13,200 | 165,000 | |
Gap, Inc. | 4,600 | 88,274 | |
Gymboree Corp. (a) | 8,300 | 312,827 | |
Limited Brands, Inc. | 22,300 | 617,264 | |
Ross Stores, Inc. | 13,600 | 445,672 | |
TJX Companies, Inc. | 23,500 | 646,250 | |
Urban Outfitters, Inc. (a) | 15,800 | 392,156 | |
Zumiez, Inc. (d) | 9,700 | 329,897 | |
4,001,084 | |||
Computer & Electronics Retail - 2.2% | |||
Best Buy Co., Inc. (d) | 4,150 | 192,851 | |
RadioShack Corp. (d) | 28,302 | 706,701 | |
899,552 | |||
Home Improvement Retail - 1.8% | |||
Home Depot, Inc. | 11,800 | 467,280 | |
Lowe's Companies, Inc. | 8,000 | 260,480 | |
727,760 | |||
Specialty Stores - 4.5% | |||
OfficeMax, Inc. | 5,900 | 306,210 | |
PETsMART, Inc. | 3,600 | 109,116 | |
Shares | Value | ||
Staples, Inc. | 37,250 | $ 969,245 | |
Tiffany & Co., Inc. | 9,300 | 404,922 | |
1,789,493 | |||
TOTAL SPECIALTY RETAIL | 7,417,889 | ||
TEXTILES, APPAREL & LUXURY GOODS - 11.1% | |||
Apparel, Accessories & Luxury Goods - 6.5% | |||
Coach, Inc. (a) | 19,800 | 934,560 | |
Luxottica Group Spa | 6,800 | 213,656 | |
Phillips-Van Heusen Corp. | 8,300 | 455,172 | |
Polo Ralph Lauren Corp. Class A | 11,800 | 1,026,364 | |
2,629,752 | |||
Footwear - 4.6% | |||
Crocs, Inc. | 7,800 | 380,016 | |
Deckers Outdoor Corp. (a) | 11,034 | 719,417 | |
Iconix Brand Group, Inc. (a) | 14,900 | 326,757 | |
Skechers U.S.A., Inc. Class A (sub. vtg.) (a) | 11,500 | 401,580 | |
1,827,770 | |||
TOTAL TEXTILES, APPAREL & LUXURY GOODS | 4,457,522 | ||
TOTAL COMMON STOCKS (Cost $34,178,349) | 40,015,421 | ||
Money Market Funds - 3.4% | |||
Fidelity Securities Lending Cash Central Fund, 5.34% (b)(c) | 1,353,500 | 1,353,500 | |
TOTAL INVESTMENT PORTFOLIO - 102.8% (Cost $35,531,849) | 41,368,921 | ||
NET OTHER ASSETS - (2.8)% | (1,119,616) | ||
NET ASSETS - 100% | $ 40,249,305 | ||
Legend |
(a) Non-income producing |
(b) Affiliated fund that is available only to investment companies and other accounts managed by Fidelity Investments. The rate quoted is the annualized seven-day yield of the fund at period end. A complete unaudited listing of the fund's holdings as of its most recent quarter end is available upon request. |
(c) Investment made with cash collateral received from securities on loan. |
(d) Security or a portion of the security is on loan at period end. |
Affiliated Central Funds |
Information regarding fiscal year to date income earned by the Fund from investments in Fidelity Central Funds is as follows: |
Fund | Income earned |
Fidelity Cash Central Fund | $ 61,598 |
Fidelity Securities Lending Cash Central Fund | 13,644 |
Total | $ 75,242 |
See accompanying notes which are an integral part of the financial statements.
Annual Report
Select Consumer Discretionary Portfolio
Financial Statements
Statement of Assets and Liabilities
February 28, 2007 | ||
Assets | ||
Investment in securities, at value (including securities loaned of $1,321,860) - See accompanying schedule: Unaffiliated issuers (cost $34,178,349) | $ 40,015,421 | |
Fidelity Central Funds (cost $1,353,500) | 1,353,500 | |
Total Investments (cost $35,531,849) | $ 41,368,921 | |
Receivable for investments sold | 1,409,022 | |
Receivable for fund shares sold | 161,329 | |
Dividends receivable | 26,952 | |
Distributions receivable from Fidelity Central Funds | 1,360 | |
Prepaid expenses | 218 | |
Receivable from investment adviser for expense reductions | 876 | |
Other receivables | 1,418 | |
Total assets | 42,970,096 | |
Liabilities | ||
Payable to custodian bank | $ 242,721 | |
Payable for investments purchased | 672,116 | |
Payable for fund shares redeemed | 385,220 | |
Accrued management fee | 19,426 | |
Other affiliated payables | 11,145 | |
Other payables and accrued expenses | 36,663 | |
Collateral on securities loaned, at value | 1,353,500 | |
Total liabilities | 2,720,791 | |
Net Assets | $ 40,249,305 | |
Net Assets consist of: | ||
Paid in capital | $ 29,634,098 | |
Undistributed net investment income | 221,170 | |
Accumulated undistributed net realized gain (loss) on investments and foreign currency transactions | 4,556,996 | |
Net unrealized appreciation (depreciation) on investments and assets and liabilities in foreign currencies | 5,837,041 | |
Net Assets, for 1,499,197 shares outstanding | $ 40,249,305 | |
Net Asset Value, offering price and redemption price per share ($40,249,305 ÷ 1,499,197 shares) | $ 26.85 | |
Statement of Operations
Year ended February 28, 2007 | ||
Investment Income | ||
Dividends | $ 499,040 | |
Special dividends | 237,300 | |
Interest | 43 | |
Income from Fidelity Central Funds (including $13,644 from security lending) | 75,242 | |
Total income | 811,625 | |
Expenses | ||
Management fee | $ 292,855 | |
Transfer agent fees | 168,266 | |
Accounting and security lending fees | 23,829 | |
Custodian fees and expenses | 32,073 | |
Independent trustees' compensation | 190 | |
Registration fees | 22,882 | |
Audit | 34,666 | |
Legal | 1,191 | |
Interest | 15,394 | |
Miscellaneous | 3,809 | |
Total expenses before reductions | 595,155 | |
Expense reductions | (5,382) | 589,773 |
Net investment income (loss) | 221,852 | |
Realized and Unrealized Gain (Loss) Net realized gain (loss) on: | ||
Investment securities: | ||
Unaffiliated issuers | 7,177,059 | |
Foreign currency transactions | (1,052) | |
Total net realized gain (loss) | 7,176,007 | |
Change in net unrealized appreciation (depreciation) on: Investment securities | (599,644) | |
Assets and liabilities in foreign currencies | (31) | |
Total change in net unrealized appreciation (depreciation) | (599,675) | |
Net gain (loss) | 6,576,332 | |
Net increase (decrease) in net assets resulting from operations | $ 6,798,184 | |
See accompanying notes which are an integral part of the financial statements.
Annual Report
Select Consumer Discretionary Portfolio
Financial Statements - continued
Statement of Changes in Net Assets
Year ended | Year ended | |
Increase (Decrease) in Net Assets | ||
Operations | ||
Net investment income (loss) | $ 221,852 | $ (45,197) |
Net realized gain (loss) | 7,176,007 | 1,980,108 |
Change in net unrealized appreciation (depreciation) | (599,675) | 1,133,559 |
Net increase (decrease) in net assets resulting from operations | 6,798,184 | 3,068,470 |
Distributions to shareholders from net realized gain | (3,663,932) | (484,881) |
Share transactions Proceeds from sales of shares | 51,885,622 | 26,870,735 |
Reinvestment of distributions | 3,436,406 | 473,921 |
Cost of shares redeemed | (67,905,287) | (20,002,209) |
Net increase (decrease) in net assets resulting from share transactions | (12,583,259) | 7,342,447 |
Redemption fees | 16,285 | 8,138 |
Total increase (decrease) in net assets | (9,432,722) | 9,934,174 |
Net Assets | ||
Beginning of period | 49,682,027 | 39,747,853 |
End of period (including undistributed net investment income of $221,170 and accumulated net investment loss of $14, respectively) | $ 40,249,305 | $ 49,682,027 |
Other Information Shares | ||
Sold | 1,940,857 | 1,077,885 |
Issued in reinvestment of distributions | 130,336 | 18,542 |
Redeemed | (2,502,120) | (806,579) |
Net increase (decrease) | (430,927) | 289,848 |
Financial Highlights
Years ended February 28, | 2007 | 2006 | 2005 | 2004 H | 2003 |
Selected Per-Share Data | |||||
Net asset value, beginning of period | $ 25.74 | $ 24.23 | $ 24.21 | $ 18.39 | $ 23.58 |
Income from Investment Operations | |||||
Net investment income (loss) C | .11 F | (.03) | (.07) | (.09) | (.18) |
Net realized and unrealized gain (loss) | 3.15 | 1.80 | 1.05 | 6.28 | (5.02) |
Total from investment operations | 3.26 | 1.77 | .98 | 6.19 | (5.20) |
Distributions from net realized gain | (2.16) | (.26) | (.97) | (.38) | - |
Redemption fees added to paid in capital C | .01 | - I | .01 | .01 | .01 |
Net asset value, end of period | $ 26.85 | $ 25.74 | $ 24.23 | $ 24.21 | $ 18.39 |
Total Return A, B | 12.99% | 7.31% | 4.18% | 33.82% | (22.01)% |
Ratios to Average Net Assets D, G | |||||
Expenses before reductions | 1.14% | 1.15% | 1.23% | 1.59% | 1.86% |
Expenses net of fee waivers, if any | 1.14% | 1.15% | 1.22% | 1.59% | 1.86% |
Expenses net of all reductions | 1.13% | 1.13% | 1.19% | 1.54% | 1.83% |
Net investment income (loss) | .43% F | (.11)% | (.31)% | (.39)% | (.84)% |
Supplemental Data | |||||
Net assets, end of period (000 omitted) | $ 40,249 | $ 49,682 | $ 39,748 | $ 35,573 | $ 20,693 |
Portfolio turnover rate E | 244% | 71% | 112% | 138% | 116% |
A Total returns would have been lower had certain expenses not been reduced during the periods shown. B Total returns do not include the effect of the former sales charges. C Calculated based on average shares outstanding during the period. D Fees and expenses of the underlying Fidelity Central Funds are not included in the Fund's expense ratio. The Fund indirectly bears its proportionate share of the expenses of any underlying Fidelity Central Funds. E Amount does not include the portfolio activity of any underlying Fidelity Central Funds. FInvestment income per share reflects a special dividend which amounted to $.12 per share. Excluding the special dividend, the ratio of net investment income (loss) to average net assets would have been (.03)%. G Expense ratios reflect operating expenses of the Fund. Expenses before reductions do not reflect amounts reimbursed by the investment adviser or reductions from brokerage service arrangements or other expense offset arrangements and do not represent the amount paid by the Fund during periods when reimbursements or reductions occur. Expenses net of fee waivers reflect expenses after reimbursement by the investment adviser but prior to reductions from brokerage service arrangements or other expense offset arrangements. Expenses net of all reductions represent the net expenses paid by the Fund. H For the year ended February 29. I Amount represents less than $.01 per share. |
See accompanying notes which are an integral part of the financial statements.
Annual Report
Performance
Average annual total return reflects the change in the value of an investment, assuming reinvestment of the fund's dividend income and capital gains (the profits earned upon the sale of securities that have grown in value) and assuming a constant rate of performance each year. The $10,000 table and the fund's returns do not reflect the deduction of taxes that a shareholder would pay on fund distributions or the redemption of fund shares. During periods of reimbursement by Fidelity a fund's total returns will be greater than it would be had the reimbursement not occurred. How a fund did yesterday is no guarantee of how it will do tomorrow.
Average Annual Total Returns
Periods ended February 28, 2007 | Past 1 | Past 5 | Past 10 |
Select Leisure Portfolio | 13.61% | 10.49% | 12.01% |
$10,000 Over 10 Years
Let's say hypothetically that $10,000 was invested in Select Leisure Portfolio on February 28, 1997. The chart shows how the value of your investment would have changed, and also shows how the S&P 500 Index performed over the same period.
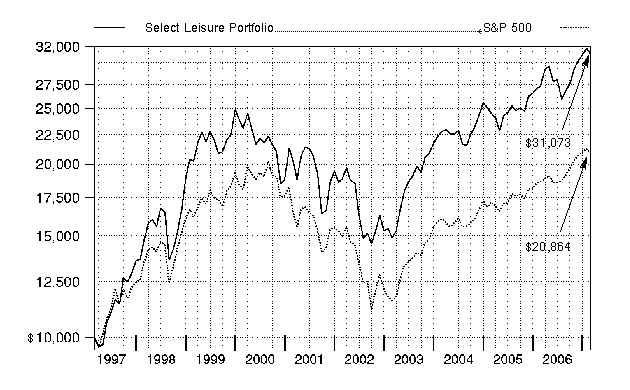
Annual Report
Select Leisure Portfolio
Management's Discussion of Fund Performance
Comments from Geoffrey Kuli, Portfolio Manager of Fidelity® Select Leisure Portfolio
A rosy year for stocks wilted just prior to the end of the 12-month period ending February 28, 2007. On the day prior to the period's close, the Dow Jones Industrial AverageSM plunged 416 points and the Standard & Poor's 500SM Index lost roughly 3.5% of its value, plummeting nearly 50 points and marking the benchmark's worst single-day performance since the day the market reopened after the 9/11 terrorist attacks. Though investors were obviously rattled by the development, it was only the 22nd-biggest decline for the S&P 500® in 20 years, and it could not overshadow how well stocks performed for the 12 months overall. For much of the past year, investors grew confident that the economy would not fall into a recession, and they bid up most broad-based stock indexes for six consecutive months from August through January. Overall for the year ending February 28, 2007, the S&P 500 was up 11.97%, the Dow advanced 14.24%, the small-cap Russell 2000® Index gained 9.87% and the NASDAQ Composite® Index rose 6.66%.
The fund gained 13.61% during the 12-month period, outperforming the S&P 500, but underperforming the 16.57% gain of the Morgan Stanley Capital InternationalSM (MSCI®) US Investable Market Consumer Services Index and the 20.68% return of a blended index specific to this fund. This blended index is a combination of the Goldman Sachs® Consumer Industries Index, which the fund was compared with through September, and the new MSCI benchmark mentioned above, which the fund was compared with during the final five months of the period1. The fund significantly underperformed the Goldman Sachs index during the first seven months of the review period, mainly due to stock selection in Internet software and services, along with overweightings in the poor performing casinos/gaming, and hotels, resorts and cruise lines segments. Specifically, Internet portal Yahoo and cruise line operators Carnival and Royal Caribbean disappointed. However, the fund had gains in home entertainment software and industrial conglomerates and also benefited from avoiding the weak home improvement retail space. Melco International Development - which operates a casino in Macau, a Chinese gambling haven - did very well, as did Google, the leading Internet search engine. For the final five months, the fund modestly trailed its new MSCI index. Stock selection in leisure products - a group not included in the index - and in hotels, resorts and cruise lines was positive, but poor stock picking in restaurants, casinos and gaming, and movies and entertainment hurt. A modest stake in cash also detracted. Good stock picks included Aruze, a Japanese gaming equipment maker, and toy makers Jakks Pacific and RC2, which had positive product cycles. Results were hurt by not owning index component Station Casinos, being underweighted in Harrah's Entertainment, poor timing on the purchase of shares of casino operator Las Vegas Sands and by disappointing performance from Starbucks. Several stocks mentioned in this report were no longer held at period end.
1 The fund's blended index is a customized index developed by Fidelity for the limited purpose of discussing the fund's performance for the 12-month period ending February 28, 2007. From March 1, 2006, through September 30, 2006, the fund compared its performance to the Goldman Sachs Consumer Industries Index, which returned 6.22% during that period. On October 1, 2006, the fund began comparing its performance to a different index, the MSCI US Investable Market Consumer Services Index, which returned 13.61% from October 1, 2006, through February 28, 2007. For the 12-month period ending February 28, 2007, the blended index (Goldman Sachs and MSCI) returned 20.68%.
The views expressed above reflect those of the portfolio manager(s) only through the end of the period as stated on the cover of this report and do not necessarily represent the views of Fidelity or any other person in the Fidelity organization. Any such views are subject to change at any time based upon market or other conditions and Fidelity disclaims any responsibility to update such views. These views may not be relied on as investment advice and, because investment decisions for a Fidelity fund are based on numerous factors, may not be relied on as an indication of trading intent on behalf of any Fidelity fund.
Annual Report
Select Leisure Portfolio
Investment Changes
Top Ten Stocks as of February 28, 2007 | ||
% of fund's | % of fund's net assets | |
McDonald's Corp. | 14.9 | 4.6 |
Starbucks Corp. | 9.2 | 1.0 |
Marriott International, Inc. Class A | 5.9 | 1.4 |
International Game Technology | 5.3 | 4.8 |
Yum! Brands, Inc. | 5.2 | 0.0 |
Starwood Hotels & Resorts Worldwide, Inc. | 5.1 | 3.0 |
Carnival Corp. unit | 4.7 | 2.5 |
Hilton Hotels Corp. | 3.9 | 0.8 |
Las Vegas Sands Corp. | 3.9 | 2.9 |
Harrah's Entertainment, Inc. | 3.3 | 1.3 |
61.4 | ||
Top Industries (% of fund's net assets) | |||
As of February 28, 2007 | |||
| Hotels, Restaurants & Leisure | 81.5% | |
| Diversified Consumer Services | 12.2% | |
| Leisure Equipment & Products | 3.4% | |
| Textiles, Apparel & Luxury Goods | 0.6% | |
| Airlines | 0.4% | |
| All Others* | 1.9% | |

As of August 31, 2006 | |||
| Hotels, Restaurants & Leisure | 47.9% | |
| Media | 22.6% | |
| Internet Software & Services | 13.4% | |
| Software | 3.5% | |
| Leisure Equipment & Products | 2.8% | |
| All Others* | 9.8% | |
* Includes short-term investments and net other assets. |
Annual Report
Select Leisure Portfolio
Investments February 28, 2007
Showing Percentage of Net Assets
Common Stocks - 98.1% | |||
Shares | Value | ||
AIRLINES - 0.4% | |||
Airlines - 0.4% | |||
Gol Linhas Aereas Inteligentes SA sponsored ADR | 40,200 | $ 1,142,886 | |
DIVERSIFIED CONSUMER SERVICES - 12.2% | |||
Education Services - 8.2% | |||
Apollo Group, Inc. Class A (non-vtg.) (a)(d) | 131,100 | 6,199,719 | |
Bright Horizons Family Solutions, Inc. (a) | 22,400 | 897,792 | |
Career Education Corp. (a) | 94,500 | 2,795,310 | |
Corinthian Colleges, Inc. (a) | 64,700 | 902,565 | |
ITT Educational Services, Inc. (a) | 31,500 | 2,519,370 | |
Laureate Education, Inc. (a) | 70,000 | 4,177,600 | |
Strayer Education, Inc. | 30,800 | 3,631,012 | |
21,123,368 | |||
Specialized Consumer Services - 4.0% | |||
Jackson Hewitt Tax Service, Inc. | 26,700 | 861,075 | |
Regis Corp. | 80,300 | 3,379,024 | |
Sotheby's Class A (ltd. vtg.) | 42,200 | 1,534,392 | |
Steiner Leisure Ltd. (a) | 52,200 | 2,359,962 | |
Weight Watchers International, Inc. | 50,200 | 2,371,950 | |
10,506,403 | |||
TOTAL DIVERSIFIED CONSUMER SERVICES | 31,629,771 | ||
HOTELS, RESTAURANTS & LEISURE - 81.5% | |||
Casinos & Gaming - 19.8% | |||
Aristocrat Leisure Ltd. | 215,000 | 2,846,075 | |
Boyd Gaming Corp. | 72,500 | 3,398,075 | |
Harrah's Entertainment, Inc. | 99,100 | 8,372,959 | |
International Game Technology | 333,300 | 13,748,625 | |
Las Vegas Sands Corp. (a) | 116,800 | 10,077,504 | |
MGM Mirage, Inc. (a)(d) | 106,100 | 7,535,222 | |
Multimedia Games, Inc. (a) | 600 | 6,336 | |
Penn National Gaming, Inc. (a) | 110,100 | 5,133,963 | |
51,118,759 | |||
Hotels, Resorts & Cruise Lines - 23.7% | |||
Accor SA | 15,900 | 1,404,084 | |
Carnival Corp. unit | 260,300 | 12,083,126 | |
Hilton Hotels Corp. | 286,700 | 10,120,510 | |
Home Inns & Hotels Management, Inc. ADR | 100 | 4,225 | |
Marriott International, Inc. Class A | 316,400 | 15,158,724 | |
Orient Express Hotels Ltd. Class A | 89,300 | 4,610,559 | |
Starwood Hotels & Resorts Worldwide, Inc. | 198,300 | 13,048,140 | |
Wyndham Worldwide Corp. (a) | 134,700 | 4,741,440 | |
61,170,808 | |||
Leisure Facilities - 3.2% | |||
International Speedway Corp. Class A | 41,000 | 2,181,200 | |
Life Time Fitness, Inc. (a) | 37,900 | 1,811,620 | |
Shares | Value | ||
Speedway Motorsports, Inc. | 30,300 | $ 1,132,311 | |
Vail Resorts, Inc. (a)(d) | 59,900 | 3,112,404 | |
8,237,535 | |||
Restaurants - 34.8% | |||
Burger King Holdings, Inc. | 90,100 | 1,919,130 | |
Carrols Restaurant Group, Inc. | 115,900 | 1,541,470 | |
Darden Restaurants, Inc. | 35,100 | 1,437,696 | |
McCormick & Schmick's Seafood Restaurants (a) | 7,788 | 196,024 | |
McDonald's Corp. | 879,100 | 38,434,252 | |
Ruth's Chris Steak House, Inc. (a) | 117,900 | 2,544,282 | |
Sonic Corp. | 88,500 | 1,917,795 | |
Starbucks Corp. (a)(d) | 771,600 | 23,842,440 | |
Texas Roadhouse, Inc. Class A (a) | 104,500 | 1,530,925 | |
Tim Hortons, Inc. | 35,586 | 1,070,071 | |
Wendy's International, Inc. | 66,700 | 2,140,403 | |
Yum! Brands, Inc. | 231,200 | 13,395,728 | |
89,970,216 | |||
TOTAL HOTELS, RESTAURANTS & LEISURE | 210,497,318 | ||
LEISURE EQUIPMENT & PRODUCTS - 3.4% | |||
Leisure Products - 3.4% | |||
Aruze Corp. | 37,600 | 1,082,675 | |
Brunswick Corp. | 81,700 | 2,667,505 | |
MarineMax, Inc. (a)(d) | 110,800 | 2,526,240 | |
RC2 Corp. (a) | 60,761 | 2,401,275 | |
8,677,695 | |||
TEXTILES, APPAREL & LUXURY GOODS - 0.6% | |||
Apparel, Accessories & Luxury Goods - 0.6% | |||
Coach, Inc. (a) | 30,100 | 1,420,720 | |
TOTAL COMMON STOCKS (Cost $223,162,104) | 253,368,390 | ||
Money Market Funds - 8.7% | |||
Shares | Value | ||
Fidelity Cash Central Fund, 5.35% (b) | 1,795,847 | $ 1,795,847 | |
Fidelity Securities Lending Cash Central Fund, 5.34% (b)(c) | 20,701,300 | 20,701,300 | |
TOTAL MONEY MARKET FUNDS (Cost $22,497,147) | 22,497,147 | ||
TOTAL INVESTMENT PORTFOLIO - 106.8% (Cost $245,659,251) | 275,865,537 | ||
NET OTHER ASSETS - (6.8)% | (17,525,234) | ||
NET ASSETS - 100% | $ 258,340,303 | ||
Legend |
(a) Non-income producing |
(b) Affiliated fund that is available only to investment companies and other accounts managed by Fidelity Investments. The rate quoted is the annualized seven-day yield of the fund at period end. A complete unaudited listing of the fund's holdings as of its most recent quarter end is available upon request. |
(c) Investment made with cash collateral received from securities on loan. |
(d) Security or a portion of the security is on loan at period end. |
Affiliated Central Funds |
Information regarding fiscal year to date income earned by the Fund from investments in Fidelity Central Funds is as follows: |
Fund | Income earned |
Fidelity Cash Central Fund | $ 467,691 |
Fidelity Securities Lending Cash Central Fund | 106,453 |
Total | $ 574,144 |
See accompanying notes which are an integral part of the financial statements.
Annual Report
Select Leisure Portfolio
Financial Statements
Statement of Assets and Liabilities
February 28, 2007 | ||
Assets | ||
Investment in securities, at value (including securities loaned of $20,410,699) - See accompanying schedule: Unaffiliated issuers (cost $223,162,104) | $ 253,368,390 | |
Fidelity Central Funds (cost $22,497,147) | 22,497,147 | |
Total Investments (cost $245,659,251) | $ 275,865,537 | |
Receivable for investments sold | 6,726,209 | |
Receivable for fund shares sold | 848,698 | |
Dividends receivable | 114,689 | |
Distributions receivable from Fidelity Central Funds | 27,335 | |
Prepaid expenses | 861 | |
Other receivables | 7,534 | |
Total assets | 283,590,863 | |
Liabilities | ||
Payable for investments purchased | $ 2,653,984 | |
Payable for fund shares redeemed | 1,653,733 | |
Accrued management fee | 130,301 | |
Other affiliated payables | 72,088 | |
Other payables and accrued expenses | 39,154 | |
Collateral on securities loaned, at value | 20,701,300 | |
Total liabilities | 25,250,560 | |
Net Assets | $ 258,340,303 | |
Net Assets consist of: | ||
Paid in capital | $ 216,690,716 | |
Undistributed net investment income | 379,397 | |
Accumulated undistributed net realized gain (loss) on investments and foreign currency transactions | 11,063,904 | |
Net unrealized appreciation (depreciation) on investments | 30,206,286 | |
Net Assets, for 3,245,110 shares outstanding | $ 258,340,303 | |
Net Asset Value, offering price and redemption price per share ($258,340,303 ÷ 3,245,110 shares) | $ 79.61 | |
Statement of Operations
Year ended February 28, 2007 | ||
Investment Income | ||
Dividends | $ 2,068,475 | |
Special dividends | 246,000 | |
Interest | 2,267 | |
Income from Fidelity Central Funds (including $106,453 from security lending) | 574,144 | |
Total income | 2,890,886 | |
Expenses | ||
Management fee | $ 1,307,080 | |
Transfer agent fees | 686,068 | |
Accounting and security lending fees | 107,112 | |
Custodian fees and expenses | 23,345 | |
Independent trustees' compensation | 873 | |
Registration fees | 37,793 | |
Audit | 35,902 | |
Legal | 4,134 | |
Miscellaneous | 14,536 | |
Total expenses before reductions | 2,216,843 | |
Expense reductions | (40,773) | 2,176,070 |
Net investment income (loss) | 714,816 | |
Realized and Unrealized Gain (Loss) Net realized gain (loss) on: | ||
Investment securities: | ||
Unaffiliated issuers | 36,734,581 | |
Foreign currency transactions | 6,781 | |
Total net realized gain (loss) | 36,741,362 | |
Change in net unrealized appreciation (depreciation) on: Investment securities | (8,521,356) | |
Assets and liabilities in foreign currencies | (6) | |
Total change in net unrealized appreciation (depreciation) | (8,521,362) | |
Net gain (loss) | 28,220,000 | |
Net increase (decrease) in net assets resulting from operations | $ 28,934,816 | |
See accompanying notes which are an integral part of the financial statements.
Annual Report
Statement of Changes in Net Assets
Year ended | Year ended | |
Increase (Decrease) in Net Assets | ||
Operations | ||
Net investment income (loss) | $ 714,816 | $ (736,502) |
Net realized gain (loss) | 36,741,362 | 14,588,568 |
Change in net unrealized appreciation (depreciation) | (8,521,362) | 8,408,643 |
Net increase (decrease) in net assets resulting from operations | 28,934,816 | 22,260,709 |
Distributions to shareholders from net investment income | (339,735) | - |
Distributions to shareholders from net realized gain | (33,272,820) | (7,936,173) |
Total distributions | (33,612,555) | (7,936,173) |
Share transactions | 150,928,886 | 52,967,028 |
Reinvestment of distributions | 31,437,000 | 7,524,369 |
Cost of shares redeemed | (124,672,281) | (75,943,707) |
Net increase (decrease) in net assets resulting from share transactions | 57,693,605 | (15,452,310) |
Redemption fees | 34,238 | 12,071 |
Total increase (decrease) in net assets | 53,050,104 | (1,115,703) |
Net Assets | ||
Beginning of period | 205,290,199 | 206,405,902 |
End of period (including undistributed net investment income of $379,397 and accumulated net investment loss of $521, respectively) | $ 258,340,303 | $ 205,290,199 |
Other Information Shares | ||
Sold | 1,841,696 | 699,664 |
Issued in reinvestment of distributions | 391,327 | 98,957 |
Redeemed | (1,533,791) | (1,002,364) |
Net increase (decrease) | 699,232 | (203,743) |
Financial Highlights
Years ended February 28, | 2007 | 2006 | 2005 | 2004 H | 2003 |
Selected Per-Share Data | |||||
Net asset value, beginning of period | $ 80.64 | $ 75.07 | $ 74.40 | $ 48.60 | $ 61.57 |
Income from Investment Operations | |||||
Net investment income (loss) C | .25 F | (.28) | (.20) | (.24) | (.33) |
Net realized and unrealized gain (loss) | 10.52 | 8.83 | 5.55 | 26.03 | (12.66) |
Total from investment operations | 10.77 | 8.55 | 5.35 | 25.79 | (12.99) |
Distributions from net investment income | (.12) | - | - | - | - |
Distributions from net realized gain | (11.69) | (2.98) | (4.70) | - | - |
Total distributions | (11.81) | (2.98) | (4.70) | - | - |
Redemption fees added to paid in capital C | .01 | - I | .02 | .01 | .02 |
Net asset value, end of period | $ 79.61 | $ 80.64 | $ 75.07 | $ 74.40 | $ 48.60 |
Total Return A, B | 13.61% | 11.67% | 7.43% | 53.09% | (21.07)% |
Ratios to Average Net Assets D, G | |||||
Expenses before reductions | .96% | .99% | 1.01% | 1.15% | 1.27% |
Expenses net of fee waivers, if any | .96% | .99% | 1.01% | 1.15% | 1.27% |
Expenses net of all reductions | .94% | .94% | .96% | 1.09% | 1.19% |
Net investment income (loss) | .31% | (.37)% | (.28)% | (.38)% | (.62)% |
Supplemental Data | |||||
Net assets, end of period (000 omitted) | $ 258,340 | $ 205,290 | $ 206,406 | $ 204,354 | $ 112,147 |
Portfolio turnover rate E | 179% | 107% | 117% | 156% | 124% |
A Total returns would have been lower had certain expenses not been reduced during the periods shown. B Total returns do not include the effect of the former sales charges. C Calculated based on average shares outstanding during the period. DFees and expenses of the underlying Fidelity Central Funds are not included in the Fund's expense ratio. The Fund indirectly bears its proportionate share of the expenses of any underlying Fidelity Central Funds. E Amount does not include the portfolio activity of any underlying Fidelity Central Funds. F Investment income per share reflects a special dividend which amounted to $.09 per share. Excluding the special dividend, the ratio of net investment income (loss) to average net assets would have been .20%. G Expense ratios reflect operating expenses of the Fund. Expenses before reductions do not reflect amounts reimbursed by the investment adviser or reductions from brokerage service arrangements or other expense offset arrangements and do not represent the amount paid by the Fund during periods when reimbursements or reductions occur. Expenses net of fee waivers reflect expenses after reimbursement by the investment adviser but prior to reductions from brokerage service arrangements or other expense offset arrangements. Expenses net of all reductions represent the net expenses paid by the Fund. H For the year ended February 29. I Amount represents less than $.01 per share.
See accompanying notes which are an integral part of the financial statements.
Annual Report
Performance
Average annual total return reflects the change in the value of an investment, assuming reinvestment of the fund's dividend income and capital gains (the profits earned upon the sale of securities that have grown in value) and assuming a constant rate of performance each year. The $10,000 table and the fund's returns do not reflect the deduction of taxes that a shareholder would pay on fund distributions or the redemption of fund shares. During periods of reimbursement by Fidelity a fund's total returns will be greater than it would be had the reimbursement not occurred. How a fund did yesterday is no guarantee of how it will do tomorrow.
Average Annual Total Returns
Periods ended February 28, 2007 | Past 1 | Past 5 | Past 10 |
Select Multimedia Portfolio | 13.73% | 10.26% | 12.00% |
$10,000 Over 10 Years
Let's say hypothetically that $10,000 was invested in Select Multimedia Portfolio on February 28, 1997. The chart shows how the value of your investment would have changed, and also shows how the S&P 500 Index performed over the same period.
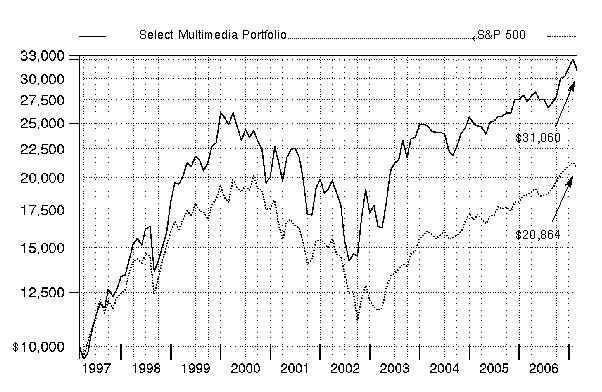
Annual Report
Select Multimedia Portfolio
Management's Discussion of Fund Performance
Comments from Kristina Salen, Portfolio Manager of Fidelity® Select Multimedia Portfolio
A rosy year for stocks wilted just prior to the end of the 12-month period ending February 28, 2007. On the day prior to the period's close, the Dow Jones Industrial AverageSM plunged 416 points and the Standard & Poor's 500SM Index lost roughly 3.5% of its value, plummeting nearly 50 points and marking the benchmark's worst single-day performance since the day the market reopened after the 9/11 terrorist attacks. Though investors were obviously rattled by the development, it was only the 22nd-biggest decline for the S&P 500® in 20 years, and it could not overshadow how well stocks performed for the 12 months overall. For much of the past year, investors grew confident that the economy would not fall into a recession, and they bid up most broad-based stock indexes for six consecutive months from August through January. Overall for the year ending February 28, 2007, the S&P 500 was up 11.97%, the Dow advanced 14.24%, the small-cap Russell 2000® Index gained 9.87% and the NASDAQ Composite® Index rose 6.66%.
For the 12 months ending February 28, 2007, the fund was up 13.73%, while the Morgan Stanley Capital InternationalSM (MSCI®) US Investable Market Media Index returned 21.54% and a blended index specific to this fund advanced 18.23%. This blended index is a combination of the Goldman Sachs® Consumer Industries Index, which the fund was compared with through September, and the new MSCI benchmark mentioned above, which the fund was compared with during the period's final five months1. The portfolio outperformed the S&P 500 for the 12-month period. For the first seven months of the review period, the fund lagged behind the Goldman Sachs index. Stock selection in broadcasting and cable TV and an overweighting in publishing stocks hurt relative performance. We had particularly weak results in Internet software and services, where a large out-of-index position in Internet portal Yahoo was the largest detractor. Yahoo's stock sank as a result of its pre-announcement of weak banner ad revenue and its delay in releasing a technology upgrade to improve the monetization of Web searches - the way it makes money from searches. Elsewhere, Viacom was another key detractor, as management difficulties caused its stock to retreat. Intense price competition in the cable industry led us to underweight Comcast, but the fund's relative performance suffered as the stock surged on good near-term profits. On the positive side, performance was helped by stock selection in hotels, resorts and cruise lines. Having no exposure to the lagging home improvement retail industry also contributed. Top individual contributors included strong performing media conglomerate News Corp. and advertising giant Omnicom, whose good stock performance was in part driven by its advertising work for Web-based companies. During the final five months of the period, fund performance was in line with that of the new MSCI index. Performance was boosted by holdings in the consumer electronics and the Internet software and services areas, which are not in the new index. Stock selection in the publishing area, a detractor in the previous seven months, provided the biggest boost to relative results, and R.H. Donnelley, a publisher of telephone directories, was the top individual contributor. Donnelley's stock rose sharply on the belief that it would raise its dividend. Other key contributors included out-of-index holdings in Sony, whose stock was boosted by the release of its PlayStation 3 video game console, and Iliad, a broadband provider in France, where the cable market is relatively new and still has huge growth potential. To align the fund more closely with its new benchmark, I increased exposure to movies and entertainment as well as broadcasting and cable TV, but stock selection in those areas dragged on results. We largely avoided media holding company Liberty Global and missed its strong stock performance, and we sold our NTL position before the British cable and phone provider's stock rallied sharply. The fund's cash position also detracted.
1 The fund's blended index is a customized index developed by Fidelity for the limited purpose of discussing the fund's performance for the 12-month period ending February 28, 2007. From March 1, 2006, through September 30, 2006, the fund compared its performance to the Goldman Sachs Consumer Industries Index, which returned 6.22% during that period. On October 1, 2006, the fund began comparing its performance to a different index, the MSCI US Investable Market Media Index, which returned 11.31% from October 1, 2006, through February 28, 2007. For the 12-month period ending February 28, 2007, the blended index (Goldman Sachs and MSCI) returned 18.23%.
The views expressed above reflect those of the portfolio manager(s) only through the end of the period as stated on the cover of this report and do not necessarily represent the views of Fidelity or any other person in the Fidelity organization. Any such views are subject to change at any time based upon market or other conditions and Fidelity disclaims any responsibility to update such views. These views may not be relied on as investment advice and, because investment decisions for a Fidelity fund are based on numerous factors, may not be relied on as an indication of trading intent on behalf of any Fidelity fund.
Annual Report
Select Multimedia Portfolio
Investment Changes
Top Ten Stocks as of February 28, 2007 | ||
% of fund's | % of fund's net assets | |
Time Warner, Inc. | 16.2 | 5.0 |
Comcast Corp. Class A | 13.8 | 3.9 |
News Corp. Class A | 10.4 | 5.8 |
The Walt Disney Co. | 7.6 | 4.8 |
McGraw-Hill Companies, Inc. | 4.5 | 7.5 |
Viacom, Inc. Class B (non-vtg.) | 4.2 | 6.9 |
R.H. Donnelley Corp. | 3.8 | 2.0 |
CBS Corp. Class B | 3.7 | 0.0 |
Google, Inc. Class A (sub. vtg.) | 3.4 | 8.9 |
Omnicom Group, Inc. | 3.0 | 5.8 |
70.6 | ||
Top Industries (% of fund's net assets) | |||
As of February 28, 2007 | |||
| Media | 82.7% | |
| Internet Software & Services | 9.5% | |
| Diversified Telecommunication Services | 1.6% | |
| Household Durables | 1.3% | |
| Computers & Peripherals | 1.0% | |
| All Others* | 3.9% | |
As of August 31, 2006 | |||
| Media | 74.0% | |
| Internet Software & Services | 18.2% | |
| Hotels, Restaurants & Leisure | 2.1% | |
| Software | 2.0% | |
| Real Estate Management & Development | 0.6% | |
| All Others* | 3.1% | |
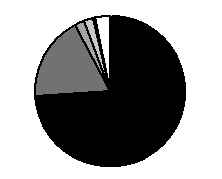
* Includes short-term investments and net other assets. |
Annual Report
Select Multimedia Portfolio
Investments February 28, 2007
Showing Percentage of Net Assets
Common Stocks - 97.1% | |||
Shares | Value | ||
COMPUTERS & PERIPHERALS - 1.0% | |||
Computer Hardware - 1.0% | |||
Apple, Inc. (a) | 10,700 | $ 905,327 | |
DIVERSIFIED TELECOMMUNICATION SERVICES - 1.6% | |||
Alternative Carriers - 1.6% | |||
Iliad Group SA | 11,200 | 1,177,125 | |
Level 3 Communications, Inc. (a) | 43,700 | 287,109 | |
1,464,234 | |||
HOUSEHOLD DURABLES - 1.3% | |||
Consumer Electronics - 1.3% | |||
Sony Corp. (d) | 22,500 | 1,165,050 | |
INTERNET SOFTWARE & SERVICES - 9.5% | |||
Internet Software & Services - 9.5% | |||
Akamai Technologies, Inc. (a) | 10,600 | 546,642 | |
aQuantive, Inc. (a) | 33,100 | 838,754 | |
Equinix, Inc. (a)(d) | 6,500 | 537,355 | |
Google, Inc. Class A (sub. vtg.) (a) | 6,900 | 3,101,205 | |
LoopNet, Inc. | 75,300 | 1,262,781 | |
ValueClick, Inc. (a) | 51,700 | 1,370,050 | |
Yahoo!, Inc. (a) | 31,000 | 956,660 | |
8,613,447 | |||
MEDIA - 82.7% | |||
Advertising - 4.5% | |||
Focus Media Holding Ltd. ADR (a) | 13,600 | 1,089,360 | |
National CineMedia, Inc. | 9,400 | 246,468 | |
Omnicom Group, Inc. | 26,300 | 2,724,943 | |
4,060,771 | |||
Broadcasting & Cable TV - 26.7% | |||
CBS Corp. Class B | 111,100 | 3,371,885 | |
Central European Media Enterprises Ltd. Class A (a) | 5,600 | 454,552 | |
Clear Channel Communications, Inc. | 70,000 | 2,532,600 | |
Comcast Corp. Class A | 488,850 | 12,573,222 | |
EchoStar Communications Corp. Class A (a) | 33,600 | 1,364,160 | |
Grupo Televisa SA de CV (CPO) sponsored ADR | 51,500 | 1,405,435 | |
Liberty Global, Inc. Class A (a) | 68,975 | 1,985,790 | |
RRSat Global Communications Network Ltd. | 40,800 | 548,760 | |
24,236,404 | |||
Movies & Entertainment - 42.1% | |||
CKX, Inc. (a)(d) | 80,200 | 1,055,432 | |
DreamWorks Animation SKG, Inc. Class A (a) | 48,100 | 1,289,561 | |
News Corp. Class A | 419,782 | 9,457,688 | |
Playboy Enterprises, Inc. Class B (non-vtg.) (a) | 37,160 | 384,234 | |
Shares | Value | ||
Regal Entertainment Group Class A | 31,200 | $ 666,744 | |
The Walt Disney Co. (d) | 202,500 | 6,937,650 | |
Time Warner, Inc. | 720,600 | 14,664,211 | |
Viacom, Inc. Class B (non-vtg.) (a) | 97,000 | 3,786,880 | |
38,242,400 | |||
Publishing - 9.4% | |||
Gemstar-TV Guide International, Inc. (a) | 558 | 2,260 | |
Getty Images, Inc. (a) | 19,600 | 1,028,020 | |
McGraw-Hill Companies, Inc. | 62,900 | 4,063,969 | |
R.H. Donnelley Corp. | 48,600 | 3,477,330 | |
8,571,579 | |||
TOTAL MEDIA | 75,111,154 | ||
SOFTWARE - 1.0% | |||
Home Entertainment Software - 0.6% | |||
Nintendo Co. Ltd. | 2,200 | 581,768 | |
Systems Software - 0.4% | |||
Macrovision Corp. (a) | 14,300 | 352,781 | |
TOTAL SOFTWARE | 934,549 | ||
TOTAL COMMON STOCKS (Cost $69,395,622) | 88,193,761 | ||
Money Market Funds - 9.7% | |||
Fidelity Securities Lending Cash Central Fund, 5.34% (b)(c) | 8,830,385 | 8,830,385 | |
TOTAL INVESTMENT PORTFOLIO - 106.8% (Cost $78,226,007) | 97,024,146 | ||
NET OTHER ASSETS - (6.8)% | (6,217,787) | ||
NET ASSETS - 100% | $ 90,806,359 | ||
Legend |
(a) Non-income producing |
(b) Affiliated fund that is available only to investment companies and other accounts managed by Fidelity Investments. The rate quoted is the annualized seven-day yield of the fund at period end. A complete unaudited listing of the fund's holdings as of its most recent quarter end is available upon request. |
(c) Investment made with cash collateral received from securities on loan. |
(d) Security or a portion of the security is on loan at period end. |
Affiliated Central Funds |
Information regarding fiscal year to date income earned by the Fund from investments in Fidelity Central Funds is as follows: |
Fund | Income earned |
Fidelity Cash Central Fund | $ 276,403 |
Fidelity Securities Lending Cash Central Fund | 40,043 |
Total | $ 316,446 |
See accompanying notes which are an integral part of the financial statements.
Annual Report
Select Multimedia Portfolio
Financial Statements
Statement of Assets and Liabilities
February 28, 2007 | ||
Assets | ||
Investment in securities, at value (including securities loaned of $8,791,514) - See accompanying schedule: Unaffiliated issuers (cost $69,395,622) | $ 88,193,761 | |
Fidelity Central Funds (cost $8,830,385) | 8,830,385 | |
Total Investments (cost $78,226,007) | $ 97,024,146 | |
Receivable for investments sold | 6,792,539 | |
Receivable for fund shares sold | 61,584 | |
Dividends receivable | 57,505 | |
Distributions receivable from Fidelity Central Funds | 14,040 | |
Prepaid expenses | 325 | |
Other receivables | 1,774 | |
Total assets | 103,951,913 | |
Liabilities | ||
Payable to custodian bank | $ 546,610 | |
Payable for investments purchased | 140,727 | |
Payable for fund shares redeemed | 3,497,024 | |
Accrued management fee | 58,220 | |
Other affiliated payables | 38,483 | |
Other payables and accrued expenses | 34,105 | |
Collateral on securities loaned, at value | 8,830,385 | |
Total liabilities | 13,145,554 | |
Net Assets | $ 90,806,359 | |
Net Assets consist of: | ||
Paid in capital | $ 63,788,633 | |
Accumulated net investment loss | (49) | |
Accumulated undistributed net realized gain (loss) on investments and foreign currency transactions | 8,220,260 | |
Net unrealized appreciation (depreciation) on investments and assets and liabilities in foreign currencies | 18,797,515 | |
Net Assets, for 1,919,428 shares outstanding | $ 90,806,359 | |
Net Asset Value, offering price and redemption price per share ($90,806,359 ÷ 1,919,428 shares) | $ 47.31 | |
Statement of Operations
Year ended February 28, 2007 | ||
Investment Income | ||
Dividends | $ 577,936 | |
Interest | 2,405 | |
Income from Fidelity Central Funds (including $40,043 from security lending) | 316,446 | |
Total income | 896,787 | |
Expenses | ||
Management fee | $ 577,805 | |
Transfer agent fees | 331,862 | |
Accounting and security lending fees | 46,891 | |
Custodian fees and expenses | 17,131 | |
Independent trustees' compensation | 348 | |
Registration fees | 34,730 | |
Audit | 35,928 | |
Legal | 1,884 | |
Interest | 7,239 | |
Miscellaneous | 6,676 | |
Total expenses before reductions | 1,060,494 | |
Expense reductions | (3,879) | 1,056,615 |
Net investment income (loss) | (159,828) | |
Realized and Unrealized Gain (Loss) Net realized gain (loss) on: | ||
Investment securities: | ||
Unaffiliated issuers | 16,995,606 | |
Foreign currency transactions | (10,511) | |
Total net realized gain (loss) | 16,985,095 | |
Change in net unrealized appreciation (depreciation) on: Investment securities | (1,151,947) | |
Assets and liabilities in foreign currencies | (800) | |
Total change in net unrealized appreciation (depreciation) | (1,152,747) | |
Net gain (loss) | 15,832,348 | |
Net increase (decrease) in net assets resulting from operations | $ 15,672,520 | |
See accompanying notes which are an integral part of the financial statements.
Annual Report
Select Multimedia Portfolio
Financial Statements - continued
Statement of Changes in Net Assets
Year ended | Year ended | |
Increase (Decrease) in Net Assets | ||
Operations | ||
Net investment income (loss) | $ (159,828) | $ (243,191) |
Net realized gain (loss) | 16,985,095 | 8,623,430 |
Change in net unrealized appreciation (depreciation) | (1,152,747) | (81,731) |
Net increase (decrease) in net assets resulting from operations | 15,672,520 | 8,298,508 |
Distributions to shareholders from net realized gain | (13,553,788) | (1,681,202) |
Share transactions | 153,985,180 | 36,474,405 |
Reinvestment of distributions | 12,972,279 | 1,612,799 |
Cost of shares redeemed | (158,997,983) | (89,613,233) |
Net increase (decrease) in net assets resulting from share transactions | 7,959,476 | (51,526,029) |
Redemption fees | 12,848 | 8,889 |
Total increase (decrease) in net assets | 10,091,056 | (44,899,834) |
Net Assets | ||
Beginning of period | 80,715,303 | 125,615,137 |
End of period (including accumulated net investment loss of $49 and accumulated net investment loss | $ 90,806,359 | $ 80,715,303 |
Other Information Shares | ||
Sold | 3,267,373 | 781,583 |
Issued in reinvestment of distributions | 276,911 | 33,434 |
Redeemed | (3,330,188) | (1,993,938) |
Net increase (decrease) | 214,096 | (1,178,921) |
Financial Highlights
Years ended February 28, | 2007 | 2006 | 2005 | 2004 G | 2003 |
Selected Per-Share Data | |||||
Net asset value, beginning of period | $ 47.33 | $ 43.55 | $ 44.83 | $ 32.10 | $ 37.38 |
Income from Investment Operations | |||||
Net investment income (loss) C | (.07) | (.12) | (.18) | (.31) | (.20) |
Net realized and unrealized gain (loss) | 6.27 | 4.70 | .19 | 16.49 | (5.14) |
Total from investment operations | 6.20 | 4.58 | .01 | 16.18 | (5.34) |
Distributions from net realized gain | (6.23) | (.80) | (1.30) | (3.47) | - |
Redemption fees added to paid in capital C | .01 | -H | .01 | .02 | .06 |
Net asset value, end of period | $ 47.31 | $ 47.33 | $ 43.55 | $ 44.83 | $ 32.10 |
Total Return A, B | 13.73% | 10.48% | .01% | 50.99% | (14.13)% |
Ratios to Average Net Assets D, F | |||||
Expenses before reductions | 1.04% | 1.07% | 1.07% | 1.17% | 1.29% |
Expenses net of fee waivers, if any | 1.04% | 1.07% | 1.07% | 1.17% | 1.29% |
Expenses net of all reductions | 1.04% | 1.04% | 1.03% | 1.09% | 1.13% |
Net investment income (loss) | (.16)% | (.27)% | (.42)% | (.75)% | (.59)% |
Supplemental Data | |||||
Net assets, end of period (000 omitted) | $ 90,806 | $ 80,715 | $ 125,615 | $ 163,826 | $ 100,111 |
Portfolio turnover rate E | 179% | 48% | 88% | 208% | 272% |
A Total returns would have been lower had certain expenses not been reduced during the periods shown. B Total returns do not include the effect of the former sales charges. C Calculated based on average shares outstanding during the period. D Fees and expenses of the underlying Fidelity Central Funds are not included in the Fund's expense ratio. The Fund indirectly bears its proportionate share of the expenses of any underlying Fidelity Central Funds. E Amount does not include the portfolio activity of any underlying Fidelity Central Funds. F Expense ratios reflect operating expenses of the Fund. Expenses before reductions do not reflect amounts reimbursed by the investment adviser or reductions from brokerage service arrangements or other expense offset arrangements and do not represent the amount paid by the Fund during periods when reimbursements or reductions occur. Expenses net of fee waivers reflect expenses after reimbursement by the investment adviser but prior to reductions from brokerage service arrangements or other expense offset arrangements. Expenses net of all reductions represent the net expenses paid by the Fund. G For the year ended February 29. H Amount represents less than $.01 per share. |
See accompanying notes which are an integral part of the financial statements.
Annual Report
Performance
Average annual total return reflects the change in the value of an investment, assuming reinvestment of the fund's dividend income and capital gains (the profits earned upon the sale of securities that have grown in value) and assuming a constant rate of performance each year. The $10,000 table and the fund's returns do not reflect the deduction of taxes that a shareholder would pay on fund distributions or the redemption of fund shares. During periods of reimbursement by Fidelity a fund's total returns will be greater than it would be had the reimbursement not occurred. How a fund did yesterday is no guarantee of how it will do tomorrow.
Average Annual Total Returns
Periods ended February 28, 2007 | Past 1 | Past 5 | Past 10 |
Select Retailing Portfolio | 15.79% | 10.00% | 11.26% |
$10,000 Over 10 Years
Let's say hypothetically that $10,000 was invested in Select Retailing Portfolio on February 28, 1997. The chart shows how the value of your investment would have changed, and also shows how the S&P 500 Index performed over the same period.

Annual Report
Select Retailing Portfolio
Management's Discussion of Fund Performance
Comments from Evan Hornbuckle, who became Portfolio Manager of Fidelity® Select Retailing Portfolio on April 11, 2007, after the period covered by this report
A rosy year for stocks wilted just prior to the end of the 12-month period ending February 28, 2007. On the day prior to the period's close, the Dow Jones Industrial AverageSM plunged 416 points and the Standard & Poor's 500SM Index lost roughly 3.5% of its value, plummeting nearly 50 points and marking the benchmark's worst single-day performance since the day the market reopened after the 9/11 terrorist attacks. Though investors were obviously rattled by the development, it was only the 22nd-biggest decline for the S&P 500® in 20 years, and it could not overshadow how well stocks performed for the 12 months overall. For much of the past year, investors grew confident that the economy would not fall into a recession, and they bid up most broad-based stock indexes for six consecutive months from August through January. Overall for the year ending February 28, 2007, the S&P 500 was up 11.97%, the Dow advanced 14.24%, the small-cap Russell 2000® Index gained 9.87% and the NASDAQ Composite® Index rose 6.66%.
For the 12 months ending February 28, 2007, the fund was up 15.79%, while the Morgan Stanley Capital InternationalSM (MSCI®) US Investable Market Retailing Index returned 10.32% and a blended index specific to this fund advanced 16.27%. This blended index is a combination of the Goldman Sachs® Consumer Industries Index, which the fund was compared with through September, and the new MSCI benchmark mentioned above, which the fund was compared with during the period's final five months 1. The portfolio outperformed the S&P 500 for the 12-month period. For the first seven months of the review period, the fund modestly underperformed the Goldman Sachs index. The fund had no holdings in the tobacco and broadcast/cable TV industries, which typically are not within the universe of a retailing fund; however, those areas of the index performed well, and not owning stocks such as cable operator Comcast detracted from relative results. Performance also was hurt by an out-of-index position in Internet auctioneer eBay. The fund's holdings in women's apparel chain Chico's FAS lost ground as well. On the positive side, the fund overweighted stocks in several areas related to fashion retailing that delivered strong results. Top contributors included: Federated Department Stores, the nation's largest department store chain; Deckers Outdoor, marketer of footwear under the Teva, Simple and UGG (Uggs) brands; and children's apparel retailer Gymboree. Deckers and Gymboree were not in the index. Fund performance slightly outpaced that of the MSCI index during the final five months of the period. Footwear firms such as Deckers Outdoor remained strong drivers of results. Retailers catering to the high-end consumer, including Coach, Polo Ralph Lauren and department store chain Saks, also were key contributors. While department stores in general helped performance, Federated's stock detracted as it became apparent that its turnaround of May Department Stores, which it had acquired in 2005, would take longer than investors had expected. Several apparel retailers, including women's retailer Coldwater Creek, became leading detractors as women's apparel sales weakened. Shying away from Internet retailers also hampered results. Underweighting home improvement retailers such as Lowe's, a major index component, hurt results as well, as the group outperformed. Some stocks mentioned in this discussion were not held at period end.
1 The fund's blended index is a customized index developed by Fidelity for the limited purpose of discussing the fund's performance for the 12-month period ending February 28, 2007. From March 1, 2006, through September 30, 2006, the fund compared its performance to the Goldman Sachs Consumer Industries Index, which returned 6.22% during that period. On October 1, 2006, the fund began comparing its performance to a different index, the MSCI US Investable Market Retailing Index, which returned 9.46% from October 1, 2006, through February 28, 2007. For the 12-month period ending February 28, 2007, the blended index (Goldman Sachs and MSCI) returned 16.27%.
The views expressed above reflect those of the portfolio manager(s) only through the end of the period as stated on the cover of this report and do not necessarily represent the views of Fidelity or any other person in the Fidelity organization. Any such views are subject to change at any time based upon market or other conditions and Fidelity disclaims any responsibility to update such views. These views may not be relied on as investment advice and, because investment decisions for a Fidelity fund are based on numerous factors, may not be relied on as an indication of trading intent on behalf of any Fidelity fund.
Annual Report
Select Retailing Portfolio
Investment Changes
Top Ten Stocks as of February 28, 2007 | ||
% of fund's | % of fund's net assets | |
Target Corp. | 9.1 | 5.2 |
Federated Department Stores, Inc. | 6.6 | 6.8 |
Deckers Outdoor Corp. | 5.6 | 3.9 |
Home Depot, Inc. | 4.5 | 1.8 |
JCPenney Co., Inc. | 4.4 | 2.9 |
Nordstrom, Inc. | 3.5 | 0.5 |
Staples, Inc. | 3.3 | 1.7 |
Sears Holdings Corp. | 2.8 | 2.4 |
TJX Companies, Inc. | 2.8 | 2.5 |
Liberty Media Holding Corp. - Interactive Series A | 2.6 | 0.0 |
45.2 | ||
Top Industries (% of fund's net assets) | |||
As of February 28, 2007 | |||
| Specialty Retail | 38.2% | |
| Multiline Retail | 32.3% | |
| Textiles, Apparel & Luxury Goods | 13.9% | |
| Internet & Catalog Retail | 5.2% | |
| Food & Staples Retailing | 2.2% | |
| All Others* | 8.2% | |
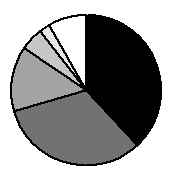
As of August 31, 2006 | |||
| Specialty Retail | 33.0% | |
| Multiline Retail | 21.2% | |
| Food & Staples Retailing | 20.4% | |
| Textiles, Apparel & Luxury Goods | 8.0% | |
| Hotels, Restaurants & Leisure | 6.6% | |
| All Others* | 10.8% | |
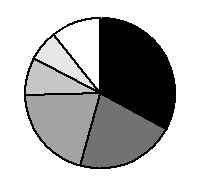
* Includes short-term investments and net other assets. |
Annual Report
Select Retailing Portfolio
Investments February 28, 2007
Showing Percentage of Net Assets
Common Stocks - 99.8% | |||
Shares | Value | ||
DISTRIBUTORS - 0.9% | |||
Distributors - 0.9% | |||
Li & Fung Ltd. | 236,000 | $ 749,106 | |
DIVERSIFIED CONSUMER SERVICES - 0.6% | |||
Specialized Consumer Services - 0.6% | |||
Sotheby's Class A (ltd. vtg.) | 14,200 | 516,312 | |
DIVERSIFIED FINANCIAL SERVICES - 1.3% | |||
Other Diversifed Financial Services - 1.3% | |||
Endeavor Acquisition Corp. (a)(d) | 95,000 | 1,064,950 | |
FOOD & STAPLES RETAILING - 2.2% | |||
Drug Retail - 0.9% | |||
Rite Aid Corp. (d) | 124,000 | 740,280 | |
Hypermarkets & Super Centers - 1.3% | |||
Wal-Mart de Mexico SA de CV Series V | 167,811 | 648,623 | |
Wal-Mart Stores, Inc. | 9,000 | 434,700 | |
1,083,323 | |||
TOTAL FOOD & STAPLES RETAILING | 1,823,603 | ||
HOTELS, RESTAURANTS & LEISURE - 1.9% | |||
Restaurants - 1.9% | |||
McDonald's Corp. | 13,300 | 581,476 | |
Tim Hortons, Inc. | 15,565 | 468,040 | |
Wendy's International, Inc. | 17,500 | 561,575 | |
1,611,091 | |||
HOUSEHOLD DURABLES - 1.0% | |||
Household Appliances - 1.0% | |||
Snap-On, Inc. | 8,000 | 400,800 | |
Whirlpool Corp. | 5,000 | 441,050 | |
841,850 | |||
INTERNET & CATALOG RETAIL - 5.2% | |||
Catalog Retail - 2.7% | |||
Coldwater Creek, Inc. (a) | 5,000 | 92,000 | |
Liberty Media Holding Corp. - Interactive Series A (a) | 91,500 | 2,156,655 | |
2,248,655 | |||
Internet Retail - 2.5% | |||
Amazon.com, Inc. (a) | 5,000 | 195,700 | |
Blue Nile, Inc. (a)(d) | 10,000 | 390,000 | |
IAC/InterActiveCorp (a) | 25,000 | 980,000 | |
Priceline.com, Inc. (a) | 10,000 | 524,100 | |
2,089,800 | |||
TOTAL INTERNET & CATALOG RETAIL | 4,338,455 | ||
LEISURE EQUIPMENT & PRODUCTS - 0.5% | |||
Leisure Products - 0.5% | |||
Leapfrog Enterprises, Inc. Class A (a)(d) | 40,000 | 413,600 | |
Shares | Value | ||
MULTILINE RETAIL - 32.3% | |||
Department Stores - 21.8% | |||
Federated Department Stores, Inc. | 124,600 | $ 5,564,636 | |
JCPenney Co., Inc. | 45,000 | 3,649,950 | |
KarstadtQuelle AG (a) | 13,600 | 472,616 | |
Kohl's Corp. (a) | 10,100 | 696,799 | |
Nordstrom, Inc. | 55,400 | 2,941,186 | |
Saks, Inc. | 108,000 | 2,086,560 | |
Sears Holdings Corp. (a) | 13,164 | 2,372,811 | |
The Bon-Ton Stores, Inc. | 9,800 | 480,396 | |
18,264,954 | |||
General Merchandise Stores - 10.5% | |||
Family Dollar Stores, Inc. | 26,000 | 753,220 | |
Target Corp. (d) | 124,000 | 7,629,720 | |
Tuesday Morning Corp. (d) | 27,800 | 437,572 | |
8,820,512 | |||
TOTAL MULTILINE RETAIL | 27,085,466 | ||
PERSONAL PRODUCTS - 1.2% | |||
Personal Products - 1.2% | |||
Bare Escentuals, Inc. | 28,700 | 998,473 | |
SPECIALTY RETAIL - 38.2% | |||
Apparel Retail - 16.5% | |||
Abercrombie & Fitch Co. Class A | 17,000 | 1,328,890 | |
Aeropostale, Inc. (a) | 29,000 | 1,062,560 | |
American Eagle Outfitters, Inc. | 37,000 | 1,148,850 | |
Casual Male Retail Group, Inc. (a) | 36,400 | 455,000 | |
Dress Barn, Inc. (a) | 20,000 | 420,400 | |
Esprit Holdings Ltd. | 38,000 | 395,902 | |
Gap, Inc. | 35,000 | 671,650 | |
Guess?, Inc. | 11,500 | 937,020 | |
Gymboree Corp. (a) | 5,500 | 207,295 | |
Limited Brands, Inc. | 62,000 | 1,716,160 | |
Ross Stores, Inc. | 25,600 | 838,912 | |
The Children's Place Retail Stores, Inc. (a) | 7,500 | 408,450 | |
TJX Companies, Inc. | 85,000 | 2,337,500 | |
Urban Outfitters, Inc. (a) | 49,300 | 1,223,626 | |
Zumiez, Inc. (a)(d) | 19,400 | 659,794 | |
13,812,009 | |||
Automotive Retail - 1.9% | |||
CarMax, Inc. (a) | 19,800 | 1,043,460 | |
CSK Auto Corp. (a) | 32,500 | 561,925 | |
1,605,385 | |||
Computer & Electronics Retail - 3.8% | |||
Best Buy Co., Inc. (d) | 15,000 | 697,050 | |
Gamestop Corp. Class A (a) | 16,563 | 868,232 | |
RadioShack Corp. (d) | 65,400 | 1,633,038 | |
3,198,320 | |||
Home Improvement Retail - 6.9% | |||
Home Depot, Inc. | 96,200 | 3,809,520 | |
Common Stocks - continued | |||
Shares | Value | ||
SPECIALTY RETAIL - CONTINUED | |||
Home Improvement Retail - continued | |||
Lowe's Companies, Inc. (d) | 51,100 | $ 1,663,816 | |
Sherwin-Williams Co. | 5,000 | 332,750 | |
5,806,086 | |||
Homefurnishing Retail - 0.5% | |||
Select Comfort Corp. (d) | 22,000 | 407,660 | |
Specialty Stores - 8.6% | |||
Borders Group, Inc. | 20,400 | 436,152 | |
Build-A-Bear Workshop, Inc. (a)(d) | 23,000 | 609,500 | |
Guitar Center, Inc. (a) | 5,600 | 245,336 | |
Hibbett Sports, Inc. (a) | 12,100 | 377,278 | |
Office Depot, Inc. (a) | 10,000 | 333,600 | |
OfficeMax, Inc. | 9,700 | 503,430 | |
PETsMART, Inc. | 26,300 | 797,153 | |
Staples, Inc. | 107,200 | 2,789,344 | |
Tiffany & Co., Inc. | 25,300 | 1,101,562 | |
7,193,355 | |||
TOTAL SPECIALTY RETAIL | 32,022,815 | ||
TEXTILES, APPAREL & LUXURY GOODS - 13.9% | |||
Apparel, Accessories & Luxury Goods - 4.6% | |||
Coach, Inc. (a) | 25,400 | 1,198,880 | |
Phillips-Van Heusen Corp. | 15,900 | 871,956 | |
Polo Ralph Lauren Corp. Class A | 12,000 | 1,043,760 | |
Under Armour, Inc. Class A (sub. vtg.) (a) | 5,700 | 261,915 | |
Volcom, Inc. (a) | 12,700 | 463,296 | |
3,839,807 | |||
Footwear - 9.3% | |||
Crocs, Inc. (d) | 17,000 | 828,240 | |
Deckers Outdoor Corp. (a)(d) | 72,000 | 4,694,400 | |
Heelys, Inc. | 100 | 3,338 | |
Iconix Brand Group, Inc. (a) | 44,700 | 980,271 | |
Shares | Value | ||
Skechers U.S.A., Inc. Class A (sub. vtg.) (a) | 29,400 | $ 1,026,648 | |
Wolverine World Wide, Inc. | 11,000 | 305,250 | |
7,838,147 | |||
TOTAL TEXTILES, APPAREL & LUXURY GOODS | 11,677,954 | ||
THRIFTS & MORTGAGE FINANCE - 0.6% | |||
Thrifts & Mortgage Finance - 0.6% | |||
NexCen Brands, Inc. (a) | 50,000 | 522,000 | |
TOTAL COMMON STOCKS (Cost $66,654,471) | 83,665,675 | ||
Money Market Funds - 20.0% | |||
Fidelity Securities Lending Cash Central Fund, 5.34% (b)(c) | 16,780,175 | 16,780,175 | |
TOTAL INVESTMENT PORTFOLIO - 119.8% (Cost $83,434,646) | 100,445,850 | ||
NET OTHER ASSETS - (19.8)% | (16,603,097) | ||
NET ASSETS - 100% | $ 83,842,753 | ||
Legend |
(a) Non-income producing |
(b) Affiliated fund that is available only to investment companies and other accounts managed by Fidelity Investments. The rate quoted is the annualized seven-day yield of the fund at period end. A complete unaudited listing of the fund's holdings as of its most recent quarter end is available upon request. |
(c) Investment made with cash collateral received from securities on loan. |
(d) Security or a portion of the security is on loan at period end. |
Affiliated Central Funds |
Information regarding fiscal year to date income earned by the Fund from investments in Fidelity Central Funds is as follows: |
Fund | Income earned |
Fidelity Cash Central Fund | $ 104,728 |
Fidelity Securities Lending Cash Central Fund | 69,352 |
Total | $ 174,080 |
See accompanying notes which are an integral part of the financial statements.
Annual Report
Select Retailing Portfolio
Financial Statements
Statement of Assets and Liabilities
February 28, 2007 | ||
Assets | ||
Investment in securities, at value (including securities loaned of $16,649,816) - See accompanying schedule: Unaffiliated issuers (cost $66,654,471) | $ 83,665,675 | |
Fidelity Central Funds (cost $16,780,175) | 16,780,175 | |
Total Investments (cost $83,434,646) | $ 100,445,850 | |
Receivable for investments sold | 2,123,629 | |
Receivable for fund shares sold | 140,800 | |
Dividends receivable | 46,953 | |
Distributions receivable from Fidelity Central Funds | 3,335 | |
Prepaid expenses | 251 | |
Other receivables | 12,109 | |
Total assets | 102,772,927 | |
Liabilities | ||
Payable to custodian bank | $ 505,086 | |
Payable for investments purchased | 1,005,056 | |
Payable for fund shares redeemed | 539,008 | |
Accrued management fee | 39,972 | |
Other affiliated payables | 23,894 | |
Other payables and accrued expenses | 36,983 | |
Collateral on securities loaned, at value | 16,780,175 | |
Total liabilities | 18,930,174 | |
Net Assets | $ 83,842,753 | |
Net Assets consist of: | ||
Paid in capital | $ 62,312,662 | |
Undistributed net investment income | 470,109 | |
Accumulated undistributed net realized gain (loss) on investments and foreign currency transactions | 4,048,778 | |
Net unrealized appreciation (depreciation) on investments | 17,011,204 | |
Net Assets, for 1,525,097 shares outstanding | $ 83,842,753 | |
Net Asset Value, offering price and redemption price per share ($83,842,753 ÷ 1,525,097 shares) | $ 54.98 | |
Statement of Operations
Year ended February 28, 2007 | ||
Investment Income | ||
Dividends | $ 582,591 | |
Special dividends | 578,900 | |
Interest | 20 | |
Income from Fidelity Central Funds (including $69,352 from security lending) | 174,080 | |
Total income | 1,335,591 | |
Expenses | ||
Management fee | $ 461,653 | |
Transfer agent fees | 253,602 | |
Accounting and security lending fees | 37,241 | |
Custodian fees and expenses | 36,421 | |
Independent trustees' compensation | 330 | |
Registration fees | 38,681 | |
Audit | 34,897 | |
Legal | 1,539 | |
Miscellaneous | 4,901 | |
Total expenses before reductions | 869,265 | |
Expense reductions | (4,219) | 865,046 |
Net investment income (loss) | 470,545 | |
Realized and Unrealized Gain (Loss) Net realized gain (loss) on: | ||
Investment securities: | ||
Unaffiliated issuers | 7,938,965 | |
Foreign currency transactions | (66) | |
Total net realized gain (loss) | 7,938,899 | |
Change in net unrealized appreciation (depreciation) on investment securities | 3,818,862 | |
Net gain (loss) | 11,757,761 | |
Net increase (decrease) in net assets resulting from operations | $ 12,228,306 | |
See accompanying notes which are an integral part of the financial statements.
Annual Report
Select Retailing Portfolio
Financial Statements - continued
Statement of Changes in Net Assets
Year ended | Year ended | |
Increase (Decrease) in Net Assets | ||
Operations | ||
Net investment income (loss) | $ 470,545 | $ (167,502) |
Net realized gain (loss) | 7,938,899 | 13,946,935 |
Change in net unrealized appreciation (depreciation) | 3,818,862 | (4,974,621) |
Net increase (decrease) in net assets resulting from operations | 12,228,306 | 8,804,812 |
Distributions to shareholders from net realized gain | (5,786,015) | (10,046,481) |
Share transactions | 125,590,066 | 80,507,255 |
Reinvestment of distributions | 5,539,472 | 9,613,165 |
Cost of shares redeemed | (120,775,927) | (127,275,863) |
Net increase (decrease) in net assets resulting from share transactions | 10,353,611 | (37,155,443) |
Redemption fees | 37,760 | 59,867 |
Total increase (decrease) in net assets | 16,833,662 | (38,337,245) |
Net Assets | ||
Beginning of period | 67,009,091 | 105,346,336 |
End of period (including undistributed net investment income of $470,109 and accumulated net investment loss of $367, respectively) | $ 83,842,753 | $ 67,009,091 |
Other Information Shares | ||
Sold | 2,368,259 | 1,540,646 |
Issued in reinvestment of distributions | 105,399 | 193,514 |
Redeemed | (2,268,109) | (2,484,756) |
Net increase (decrease) | 205,549 | (750,596) |
Financial Highlights
Years ended February 28, | 2007 | 2006 | 2005 | 2004 H | 2003 |
Selected Per-Share Data | |||||
Net asset value, beginning of period | $ 50.78 | $ 50.89 | $ 47.39 | $ 30.72 | $ 41.67 |
Income from Investment Operations | |||||
Net investment income (loss) C | .30 F | (.10) | (.01) | (.19) | (.28) |
Net realized and unrealized gain (loss) | 7.46 | 6.24 | 4.00 | 16.83 | (10.70) |
Total from investment operations | 7.76 | 6.14 | 3.99 | 16.64 | (10.98) |
Distributions from net investment income | - | - | (.01) | - | - |
Distributions from net realized gain | (3.58) | (6.29) | (.50) | - | - |
Total distributions | (3.58) | (6.29) | (.51) | - | - |
Redemption fees added to paid in capital C | .02 | .04 | .02 | .03 | .03 |
Net asset value, end of period | $ 54.98 | $ 50.78 | $ 50.89 | $ 47.39 | $ 30.72 |
Total Return A, B | 15.79% | 12.77% | 8.47% | 54.26% | (26.28)% |
Ratios to Average Net Assets D, G | |||||
Expenses before reductions | 1.06% | 1.06% | 1.08% | 1.31% | 1.32% |
Expenses net of fee waivers, if any | 1.06% | 1.06% | 1.08% | 1.31% | 1.32% |
Expenses net of all reductions | 1.06% | 1.04% | 1.03% | 1.28% | 1.25% |
Net investment income (loss) | .58% F | (.20)% | (.02)% | (.46)% | (.74)% |
Supplemental Data | |||||
Net assets, end of period (000 omitted) | $ 83,843 | $ 67,009 | $ 105,346 | $ 87,086 | $ 63,627 |
Portfolio turnover rate E | 202% | 114% | 94% | 85% | 149% |
A Total returns would have been lower had certain expenses not been reduced during the periods shown. B Total returns do not include the effect of the former sales charges. C Calculated based on average shares outstanding during the period. D Fees and expenses of the underlying Fidelity Central Funds are not included in the Fund's expense ratio. The Fund indirectly bears its proportionate share of the expenses of any underlying Fidelity Central Funds. E Amount does not include the portfolio activity of any underlying Fidelity Central Funds. F Investment income per share reflects special dividends which amounted to $.37 per share. Excluding these special dividends, the ratio of net investment income (loss) to average net assets would have been (.13)%. G Expense ratios reflect operating expenses of the Fund. Expenses before reductions do not reflect amounts reimbursed by the investment adviser or reductions from brokerage service arrangements or other expense offset arrangements and do not represent the amount paid by the Fund during periods when reimbursements or reductions occur. Expenses net of fee waivers reflect expenses after reimbursement by the investment adviser but prior to reductions from brokerage service arrangements or other expense offset arrangements. Expenses net of all reductions represent the net expenses paid by the Fund. H For the year ended February 29. |
See accompanying notes which are an integral part of the financial statements.
Annual Report
Notes to Financial Statements
For the period ended February 28, 2007
1. Organization.
Automotive Portfolio, Construction and Housing Portfolio, Consumer Discretionary Portfolio(formerly Consumer Industries Portfolio), Leisure Portfolio, Multimedia Portfolio, and Retailing Portfolio (the Funds) are non-diversified funds of Fidelity Select Portfolios (the trust). The trust is registered under the Investment Company Act of 1940, as amended (the 1940 Act), as an open-end management investment company organized as a Massachusetts business trust. The Funds invest primarily in securities of companies whose principal business activities fall within specific industries. Each Fund is authorized to issue an unlimited number of shares. The financial statements have been prepared in conformity with accounting principles generally accepted in the United States of America, which require management to make certain estimates and assumptions at the date of the financial statements.
2. Investments in Fidelity Central Funds.
The Funds may invest in Fidelity Central Funds which are open-end investment companies available only to other investment companies and accounts managed by Fidelity Management & Research Company (FMR) and its affiliates. The Funds' Schedule of Investments lists each of the Fidelity Central Funds as an investment of each Fund but does not include the underlying holdings of each Fidelity Central Fund. As an Investing Fund, the Funds indirectly bear their proportionate share of the expenses of the underlying Fidelity Central Funds. A complete unaudited list of holdings for each Fidelity Central Fund is available upon request. In addition, the financial statements of the Fidelity Central Funds, which are not covered by the Funds' Report of Independent Registered Public Accounting Firm, are available on the EDGAR Database on the SEC's web site, www.sec.gov, or upon request.
The Money Market Central Funds seek preservation of capital and current income and are managed by Fidelity Investments Money Management, Inc. (FIMM) an affiliate of FMR.
3. Significant Accounting Policies.
The following summarizes the significant accounting policies of the Funds:
Security Valuation. Investments are valued and net asset value (NAV) per share is calculated (NAV calculation) as of the close of business of the New York Stock Exchange (NYSE), normally 4:00 p.m. Eastern time. During the period each Fund also calculated a NAV each hour on the hour (commencing at 10:00 a.m. Eastern time until one hour prior to the close of business on the NYSE). Effective October 1, 2006 each Fund eliminated hourly NAV calculation. Wherever possible, each Fund uses independent pricing services approved by the Board of Trustees to value their investments.
Equity securities, including restricted securities, for which market quotations are readily available, are valued at the last reported sale price or official closing price as reported by an independent pricing service on the primary market or exchange on which they are traded. In the event there were no sales during the day or closing prices are not available, securities are valued at the last quoted bid price. Investments in open-end mutual funds, including the Fidelity Central Funds, are valued at their closing net asset value each business day. Short-term securities with remaining maturities of sixty days or less for which quotations are not readily available are valued at amortized cost, which approximates value.
When current market prices or quotations are not readily available or do not accurately reflect fair value, valuations may be determined in accordance with procedures adopted by the Board of Trustees. For example, when developments occur between the close of a market and the close of the NYSE that may materially affect the value of some or all of the securities, or when trading in a security is halted, those securities may be fair valued. Factors used in the determination of fair value may include monitoring news to identify significant market or security specific events such as changes in the value of U.S. securities markets, reviewing developments in foreign markets and evaluating the performance of ADRs, futures contracts and exchange-traded funds. Because each Fund's utilization of fair value pricing depends on market activity, the frequency with which fair value pricing is used cannot be predicted and may be utilized to a significant extent. The value of securities used for NAV calculation under fair value pricing may differ from published prices for the same securities.
Foreign Currency. Certain Funds may use foreign currency contracts to facilitate transactions in foreign-denominated securities. Losses from these transactions may arise from changes in the value of the foreign currency or if the counterparties do not perform under the contracts' terms.
Foreign-denominated assets, including investment securities, and liabilities are translated into U.S. dollars at the exchange rate at period end. Purchases and sales of investment securities, income and dividends received and expenses denominated in foreign currencies are translated into U.S. dollars at the exchange rate in effect on the transaction date.
The effects of exchange rate fluctuations on investments are included with the net realized and unrealized gain (loss) on investment securities. Other foreign currency transactions resulting in realized and unrealized gain (loss) are disclosed separately.
Annual Report
Notes to Financial Statements - continued
3. Significant Accounting Policies - continued
Investment Transactions and Income. For financial reporting purposes, the Funds' investment holdings and NAV include trades executed through the end of the last business day of the period. The NAV for processing shareholder transactions includes trades executed through the end of the prior business day. Gains and losses on securities sold are determined on the basis of identified cost and may include proceeds received from litigation. Dividend income is recorded on the ex-dividend date, except for certain dividends from foreign securities where the ex-dividend date may have passed, which are recorded as soon as the Fund is informed of the ex-dividend date. Non-cash dividends included in dividend income, if any, are recorded at the fair market value of the securities received. Distributions received on securities that represent a return of capital or capital gain are recorded as a reduction of cost of investments and/or as a realized gain. The Funds estimate the components of distributions received that may be considered return of capital distributions or capital gain distributions. Large, non-recurring dividends recognized by the Funds are presented separately on the Statement of Operations as "Special Dividends" and the impact of these dividends is presented in the Financial Highlights. Interest income and distributions from the Fidelity Central Funds are accrued as earned, with any distributions receivable as of period end included in Distributions receivable from Fidelity Central Funds on the Statement of Assets and Liabilities. Interest income includes coupon interest and amortization of premium and accretion of discount on debt securities. Investment income is recorded net of foreign taxes withheld where recovery of such taxes is uncertain.
Expenses. Most expenses of each trust can be directly attributed to a fund. Expenses which cannot be directly attributed are apportioned among each Fund in the trust. Expense estimates are accrued in the period to which they relate and adjustments are made when actual amounts are known.
Income Tax Information and Distributions to Shareholders. Each year, each Fund intends to qualify as a regulated investment company by distributing all of its taxable income and realized gains under Subchapter M of the Internal Revenue Code. As a result, no provision for income taxes is required in the accompanying financial statements. Foreign taxes are provided for based on each Fund's understanding of the tax rules and rates that exist in the foreign markets in which it invests.
Distributions are recorded on the ex-dividend date. Income and capital gain distributions are determined in accordance with income tax regulations, which may differ from generally accepted accounting principles. In addition, Certain Funds will claim a portion of the payment made to redeeming shareholders as a distribution for income tax purposes.
Capital accounts within the financial statements are adjusted for permanent book-tax differences. These adjustments have no impact on net assets or the results of operations. Temporary book-tax differences will reverse in a subsequent period.
Book-tax differences are primarily due to short-term capital gains, foreign currency transactions, certain foreign taxes, non-taxable dividends, deferred trustees compensation, capital loss carryforwards and losses deferred due to wash sales and excise tax regulations.
The tax-basis components of distributable earnings and the federal tax cost as of period end were as follows for each Fund:
Cost for | Unrealized | Unrealized | Net Unrealized | |
Automotive Portfolio | $ 56,427,522 | $ 1,613,559 | $ (2,696,465) | $ (1,082,906) |
Construction and Housing Portfolio | 162,168,751 | 31,237,941 | (1,789,583) | 29,448,358 |
Consumer Discretionary Portfolio | 35,627,099 | 6,271,379 | (529,557) | 5,741,822 |
Leisure Portfolio | 245,812,349 | 35,093,472 | (5,040,284) | 30,053,188 |
Multimedia Portfolio | 78,263,684 | 19,151,355 | (390,893) | 18,760,462 |
Retailing Portfolio | 83,541,506 | 17,399,306 | (494,962) | 16,904,344 |
Undistributed | Undistributed | Capital Loss | |
Automotive Portfolio | $ - | $ - | $ (2,058,115) |
Construction and Housing Portfolio | 110,252 | 1,251,018 | - |
Consumer Discretionary Portfolio | 90,304 | 1,899,445 | - |
Leisure Portfolio | 5,091,420 | 1,577,635 | - |
Multimedia Portfolio | - | 5,941,268 | - |
Retailing Portfolio | 607,589 | 2,811,098 | - |
Annual Report
3. Significant Accounting Policies - continued
Income Tax Information and Distributions to Shareholders - continued
The tax character of distributions paid was as follows:
February 28, 2007 | |||
Ordinary | Long-term | Total | |
Automotive Portfolio | $ 88,153 | $ - | $ 88,153 |
Construction and Housing Portfolio | 164,323 | 21,267,651 | 21,431,974 |
Consumer Discretionary Portfolio | 338,288 | 3,325,645 | 3,663,933 |
Leisure Portfolio | 1,925,823 | 31,686,731 | 33,612,554 |
Multimedia Portfolio | 934,772 | 12,619,015 | 13,553,787 |
Retailing Portfolio | - | 5,786,015 | 5,786,015 |
February 28, 2006 | |||
Ordinary | Long-term | Total | |
Automotive Portfolio | $ 29,914 | $ - | $ 29,914 |
Construction and Housing Portfolio | 578,638 | 1,537,020 | 2,115,658 |
Consumer Discretionary Portfolio | - | 484,881 | 484,881 |
Leisure Portfolio | - | 7,936,173 | 7,936,173 |
Multimedia Portfolio | - | 1,681,202 | 1,681,202 |
Retailing Portfolio | 956,672 | 9,089,809 | 10,046,481 |
Trading (Redemption) Fees. Shares in the Funds held less than 30 days are subject to a redemption fee equal to .75% of the net asset value of shares redeemed. All redemption fees, including any estimated redemption fees paid by FMR, are retained by the Funds and accounted for as an addition to paid in capital. Shareholders were also subject to an additional $7.50 fee for shares exchanged into another Fidelity fund (see Note 5).
New Accounting Pronouncements. In July 2006, Financial Accounting Standards Board Interpretation No. 48, Accounting for Uncertainty in Income Taxes - an interpretation of FASB Statement 109 (FIN 48), was issued and is effective on the last business day of the semiannual reporting period for fiscal years beginning after December 15, 2006. FIN 48 sets forth a threshold for financial statement recognition, measurement and disclosure of a tax position taken or expected to be taken on a tax return. Management is currently evaluating the impact, if any, the adoption of FIN 48 will have on the Funds' net assets, results of operations and financial statement disclosures.
In addition, in September 2006, Statement of Financial Accounting Standards No. 157, Fair Value Measurements (SFAS 157), was issued and is effective for fiscal years beginning after November 15, 2007. SFAS 157 defines fair value, establishes a framework for measuring fair value and expands disclosures about fair value measurements. Management is currently evaluating the impact the adoption of SFAS 157 will have on the Funds' financial statement disclosures.
4. Operating Policies.
Repurchase Agreements. FMR has received an Exemptive Order from the Securities and Exchange Commission (the SEC) which permits certain Funds and other affiliated entities of FMR to transfer uninvested cash balances into joint trading accounts which are then invested in repurchase agreements. Certain Funds may also invest directly with institutions in repurchase agreements. Repurchase agreements are collateralized by government or non-government securities. Upon settlement date, collateral is held in segregated accounts with custodian banks and may be obtained in the event of a default of the counterparty. Each applicable Fund monitors, on a daily basis, the value of the collateral to ensure it is at least equal to the principal amount of the repurchase agreement (including accrued interest). In the event of a default by the counterparty, realization of the collateral proceeds could be delayed, during which time the value of the collateral may decline.
5. Purchases and Sales of Investments.
Purchases and sales of securities, other than short-term securities, are noted in the table below.
Purchases ($) | Sales ($) | |
Automotive Portfolio | 97,405,444 | 67,230,172 |
Construction and Housing Portfolio | 94,168,581 | 173,854,283 |
Consumer Discretionary Portfolio | 123,859,694 | 138,956,795 |
Leisure Portfolio | 427,324,148 | 399,339,484 |
Multimedia Portfolio | 173,523,024 | 181,407,174 |
Retailing Portfolio | 168,108,040 | 161,434,643 |
Annual Report
Notes to Financial Statements - continued
6. Fees and Other Transactions with Affiliates.
Management Fee. FMR and its affiliates provide the Funds with investment management related services for which the Funds pay a monthly management fee. The management fee is the sum of an individual fund fee rate and a group fee rate. The individual fund fee rate is applied to each Fund's average net assets. The group fee rate is based upon the average net assets of all the mutual funds advised by FMR. The group fee rate decreases as assets under management increase and increases as assets under management decrease. For the period, each Fund's annual management fee rate expressed as a percentage of each Fund's average net assets was as follows:
Individual Rate | Group Rate | Total | |
Automotive Portfolio | .30% | .26% | .57% |
Construction and Housing Portfolio | .30% | .26% | .56% |
Consumer Discretionary Portfolio | .30% | .26% | .56% |
Leisure Portfolio | .30% | .26% | .57% |
Multimedia Portfolio | .30% | .26% | .57% |
Retailing Portfolio | .30% | .26% | .57% |
Transfer Agent Fees. Fidelity Service Company, Inc. (FSC), an affiliate of FMR, is the Funds' transfer, dividend disbursing and shareholder servicing agent. FSC receives account fees and asset-based fees that vary according to account size and type of account. FSC pays for typesetting, printing and mailing of shareholder reports, except proxy statements. For the period, the transfer agent fees were equivalent to the following annual rates expressed as a percentage of average net assets:
Automotive Portfolio | .33% |
Construction and Housing Portfolio | .35% |
Consumer Discretionary Portfolio | .32% |
Leisure Portfolio | .30% |
Multimedia Portfolio | .33% |
Retailing Portfolio | .31% |
Accounting and Security Lending Fees. FSC maintains each Fund's accounting records. The accounting fee is based on the level of average net assets for the month. Under a separate contract, FSC administers the security lending program. The security lending fee is based on the number and duration of lending transactions.
Exchange Fees. During the period, FSC received the proceeds of a $7.50 fee to cover administrative costs associated with exchanges out of the Funds to any other Fidelity Select fund or to any other Fidelity fund made through non-automated channels. Effective October 1, 2006, the exchange fees were eliminated. For the period, exchange fees retained by FSC were as follows:
Retained | |
Automotive Portfolio | $ 143 |
Construction and Housing Portfolio | 3,578 |
Consumer Discretionary Portfolio | 195 |
Leisure Portfolio | 893 |
Multimedia Portfolio | 690 |
Retailing Portfolio | 398 |
Brokerage Commissions. Certain Funds placed a portion of their portfolio transactions with brokerage firms which are affiliates of the investment adviser. The commissions paid to these affiliated firms were as follows:
Amount | |
Automotive Portfolio | $ 5,416 |
Construction and Housing Portfolio | 267 |
Consumer Discretionary Portfolio | 411 |
Leisure Portfolio | 1,768 |
Multimedia Portfolio | 1,687 |
Retailing Portfolio | 695 |
Annual Report
6. Fees and Other Transactions with Affiliates - continued
Interfund Lending Program. Pursuant to an Exemptive Order issued by the SEC, the Funds, along with other registered investment companies having management contracts with FMR, may participate in an interfund lending program. This program provides an alternative credit facility allowing the funds to borrow from, or lend money to, other participating affiliated funds. Each applicable fund's activity in this program during the period for which loans were outstanding was as follows:
Borrower | Average Daily Loan Balance | Weighted Average | Interest | |
Multimedia Portfolio | Borrower | $ 14,151,000 | 5.39% | $ 2,121 |
7. Committed Line of Credit.
Certain Funds participate with other funds managed by FMR in a $4.2 billion credit facility (the "line of credit") to be utilized for temporary or emergency purposes to fund shareholder redemptions or for other short-term liquidity purposes. The participating funds have agreed to pay commitment fees on their pro rata portion of the line of credit, which is reflected in Miscellaneous Expense on the Statement of Operations, and is as follows:
Automotive Portfolio | 58 |
Construction and Housing Portfolio | 525 |
Consumer Discretionary Portfolio | 141 |
Leisure Portfolio | 581 |
Multimedia Portfolio | 250 |
Retailing Portfolio | 206 |
During the period, there were no borrowings on this line of credit.
8. Security Lending.
Certain Funds lend portfolio securities from time to time in order to earn additional income. On the settlement date of the loan, each applicable Fund receives collateral (in the form of U.S. Treasury obligations, letters of credit and/or cash) against the loaned securities and maintains collateral in an amount not less than 100% of the market value of the loaned securities during the period of the loan. The market value of the loaned securities is determined at the close of business of the Funds and any additional required collateral is delivered to the Funds on the next business day. If the borrower defaults on its obligation to return the securities loaned because of insolvency or other reasons, a fund could experience delays and costs in recovering the securities loaned or in gaining access to the collateral. Any cash collateral received is invested in the Fidelity Securities Lending Cash Central Fund. The value of loaned securities and cash collateral at period end are disclosed on each applicable Fund's Statement of Assets and Liabilities. Security lending income represents the income earned on investing cash collateral, less fees and expenses associated with the loan, plus any premium payments that may be received on the loan of certain types of securities. Security lending income is presented on each applicable Fund's Statement of Operations as a component of income from Fidelity Central Funds.
9. Bank Borrowings.
Each Fund is permitted to have bank borrowings for temporary or emergency purposes to fund shareholder redemptions. Each Fund has established borrowing arrangements with certain banks. The interest rate on the borrowings is the bank's base rate, as revised from time to time. Each applicable Fund's activity in this program during the period for which loans were outstanding was as follows:
Average Daily | Weighted Average | |
Automotive Portfolio | $ 2,345,143 | 5.50% |
Consumer Discretionary Portfolio | $ 14,394,429 | 5.50% |
Multimedia Portfolio | $ 16,494,000 | 5.59% |
Annual Report
Notes to Financial Statements - continued
10. Expense Reductions.
Effective January 1, 2007, FMR voluntarily agreed to reimburse funds to the extent annual operating expenses exceeded certain levels of average net assets as noted in the table below. Some expenses, for example interest expense, including commitment fees, are excluded from this reimbursement.
The following funds were in reimbursement during the period:
Expense | Reimbursement | |
Automotive Portfolio | 1.25%-1.15%* | $ 91,220 |
Consumer Discretionary Portfolio | 1.25%-1.15%* | 1,211 |
* Expense limitation in effect at period end.
Many of the brokers with whom FMR places trades on behalf of certain Funds provided services to these Funds in addition to trade execution. These services included payments of expenses on behalf of each applicable Fund. In addition, through arrangements with each applicable fund's custodian and transfer agent, credits realized as a result of uninvested cash balances were used to reduce each applicable fund's expenses. All of the applicable expense reductions are noted in the table below.
Brokerage Service Arrangements | Custody | Transfer | |
Automotive Portfolio | $ 4,325 | $ - | $ - |
Construction and Housing Portfolio | 6,069 | - | 3,361 |
Consumer Discretionary Portfolio | 2,410 | - | 948 |
Leisure Portfolio | 33,422 | 1,977 | 2,107 |
Multimedia Portfolio | 1,679 | - | 822 |
Retailing Portfolio | 2,936 | - | 133 |
11. Other.
The Funds' organizational documents provide former and current trustees and officers with a limited indemnification against liabilities arising in connection with the performance of their duties to the Funds. In the normal course of business, the Funds may also enter into contracts that provide general indemnifications. The Funds' maximum exposure under these arrangements is unknown as this would be dependent on future claims that may be made against the Funds. The risk of material loss from such claims is considered remote.
The United States Securities and Exchange Commission ("SEC") is conducting an investigation of FMR (covering the years 2002 to 2004) arising from gifts, gratuities and business entertainment provided by certain brokers to certain individuals who were employed on FMR's domestic equity trading desk during that period. FMR is in discussions with the SEC staff regarding the possible resolution of the matter, but as of period-end no final resolution has been reached.
In December 2006, the Independent Trustees completed their own investigation of the matter with the assistance of independent counsel. The Independent Trustees and FMR agree that, despite the absence of proof that the Fidelity mutual funds experienced diminished execution quality as a result of the improper receipt of gifts and business entertainment, the conduct at issue was serious and is worthy of redress. Accordingly, the Independent Trustees have requested and FMR has agreed to pay $42 million to Fidelity mutual funds, plus interest to be determined at the time that payment is made. A method of allocating this payment among the funds has not yet been determined. The total payment to each of the Funds is not anticipated to have a material impact on such Fund's net assets. In addition, FMR reimbursed related legal expenses which are recorded in the accompanying Statement of Operations as an expense reduction.
12. Litigation
In October 2002, a lawsuit was commenced against Construction and Housing Portfolio and numerous other defendants as a defendants' class action suit by the Chapter 11 estate of Owens Corning. The Owens Corning estate alleged that 16 dividend payments made by Owens Corning between 1996 and the filing of Owens Corning's petition for Chapter 11 relief in October 2000 were fraudulent conveyences and, thus, the Owens Corning estate sought to recover those dividends. During this period Construction and Housing Portfolio received dividends in the amount of $42,780. This lawsuit was dismissed on November 7, 2006.
Annual Report
Report of Independent Registered Public Accounting Firm
To the Trustees of Fidelity Select Portfolios and the Shareholders of Automotive Portfolio, Construction and Housing Portfolio, Consumer Discretionary Portfolio, Leisure Portfolio, Multimedia Portfolio, and Retailing Portfolio:
In our opinion, the accompanying statements of assets and liabilities, including the schedules of investments, and the related statements of operations and of changes in net assets and the financial highlights present fairly, in all material respects, the financial position of Automotive Portfolio, Construction and Housing Portfolio, Consumer Discretionary Portfolio, Leisure Portfolio, Multimedia Portfolio, and Retailing Portfolio (funds of Fidelity Select Portfolios) at February 28, 2007, the results of each of their operations for the year then ended, the changes in each of their net assets for each of the two years in the period then ended and the financial highlights for each of the five years in the period then ended, in conformity with accounting principles generally accepted in the United States of America. These financial statements and financial highlights (hereafter referred to as "financial statements") are the responsibility of the Fidelity Select Portfolios' management. Our responsibility is to express an opinion on these financial statements based on our audits. We conducted our audits of these financial statements in accordance with the standards of the Public Company Accounting Oversight Board (United States). Those standards require that we plan and perform the audit to obtain reasonable assurance about whether the financial statements are free of material misstatement. An audit includes examining, on a test basis, evidence supporting the amounts and disclosures in the financial statements, assessing the accounting principles used and significant estimates made by management, and evaluating the overall financial statement presentation. We believe that our audits, which included confirmation of securities at February 28, 2007 by correspondence with the custodian and brokers, provide a reasonable basis for our opinion.
/s/PricewaterhouseCoopers LLP
PricewaterhouseCoopers LLP
Boston, Massachusetts
April 20, 2007
Annual Report
Trustees and Officers
The Trustees, Member of the Advisory Board, and executive officers of the trust and funds, as applicable, are listed below. The Board of Trustees governs each fund and is responsible for protecting the interests of shareholders. The Trustees are experienced executives who meet periodically throughout the year to oversee each fund's activities, review contractual arrangements with companies that provide services to each fund, and review each fund's performance. Each of the Trustees oversees 349 funds advised by FMR or an affiliate.
The Trustees hold office without limit in time except that (a) any Trustee may resign; (b) any Trustee may be removed by written instrument, signed by at least two-thirds of the number of Trustees prior to such removal; (c) any Trustee who requests to be retired or who has become incapacitated by illness or injury may be retired by written instrument signed by a majority of the other Trustees; and (d) any Trustee may be removed at any special meeting of shareholders by a two-thirds vote of the outstanding voting securities of the trust. Each Trustee who is not an interested person (as defined in the 1940 Act) (Independent Trustee), shall retire not later than the last day of the calendar year in which his or her 72nd birthday occurs. The Independent Trustees may waive this mandatory retirement age policy with respect to individual Trustees. The executive officers and Advisory Board Member hold office without limit in time, except that any officer and Advisory Board Member may resign or may be removed by a vote of a majority of the Trustees at any regular meeting or any special meeting of the Trustees. Except as indicated, each individual has held the office shown or other offices in the same company for the past five years.
The funds' Statement of Additional Information (SAI) includes more information about the Trustees. To request a free copy, call Fidelity at 1-800-544-8544.
Interested Trustees*:
Correspondence intended for each Trustee who is an interested person may be sent to Fidelity Investments, 82 Devonshire Street, Boston, Massachusetts 02109.
Name, Age; Principal Occupation | |
Edward C. Johnson 3d (76) | |
Year of Election or Appointment: 1980 Mr. Johnson is Chairman of the Board of Trustees. Mr. Johnson serves as President (2006-present), Chief Executive Officer, Chairman, and a Director of FMR Corp.; Chairman and a Director of FMR; Chairman and a Director of Fidelity Research & Analysis Company (FRAC); Chairman and a Director of Fidelity Investments Money Management, Inc.; and Chairman (2001- present) and a Director of FMR Co., Inc. In addition, Mr. Johnson serves as Chairman and Director of Fidelity International Limited (FIL). | |
Robert L. Reynolds (54) | |
Year of Election or Appointment: 2003 Mr. Reynolds is President and a Director of FMR (2005-present), Fidelity Investments Money Management, Inc. (2005-present), and FMR Co., Inc. (2005-present). Mr. Reynolds also serves as Vice Chairman (2006-present), a Director (2003-present), and Chief Operating Officer of FMR Corp. and a Director of Strategic Advisers, Inc. (2005-present). He also serves on the Board at Fidelity Investments Canada, Ltd. | |
* Trustees have been determined to be "Interested Trustees" by virtue of, among other things, their affiliation with the trust or various entities under common control with FMR.
Independent Trustees:
Correspondence intended for each Independent Trustee (that is, the Trustees other than the Interested Trustees) may be sent to Fidelity Investments, P.O. Box 55235, Boston, Massachusetts 02205-5235.
Name, Age; Principal Occupation | |
Dennis J. Dirks (58) | |
Year of Election or Appointment: 2005 Prior to his retirement in May 2003, Mr. Dirks was Chief Operating Officer and a member of the Board of The Depository Trust & Clearing Corporation (DTCC) (1999-2003). He also served as President, Chief Operating Officer, and Board member of The Depository Trust Company (DTC) (1999-2003) and President and Board member of the National Securities Clearing Corporation (NSCC) (1999-2003). In addition, Mr. Dirks served as Chief Executive Officer and Board member of the Government Securities Clearing Corporation (2001-2003) and Chief Executive Officer and Board member of the Mortgage-Backed Securities Clearing Corporation (2001-2003). Mr. Dirks also serves as a Trustee and a member of the Finance Committee of Manhattan College (2005-present) and a Trustee and a member of the Finance Committee of AHRC of Nassau County (2006-present). | |
Albert R. Gamper, Jr. (64) | |
Year of Election or Appointment: 2006 Prior to his retirement in December 2004, Mr. Gamper served as Chairman of the Board of CIT Group Inc. (commercial finance). During his tenure with CIT Group Inc. Mr. Gamper served in numerous senior management positions, including Chairman (1987-1989; 1999-2001; 2002-2004), Chief Executive Officer (1987-2004), and President (1989-2002). He currently serves as a member of the Board of Directors of Public Service Enterprise Group (utilities, 2001-present), Chairman of the Board of Governors, Rutgers University (2004-present), and Chairman of the Board of Saint Barnabas Health Care System. | |
George H. Heilmeier (70) | |
Year of Election or Appointment: 2004 Dr. Heilmeier is Chairman Emeritus of Telcordia Technologies (communication software and systems), where prior to his retirement, he served as company Chairman and Chief Executive Officer. He currently serves on the Boards of Directors of The Mitre Corporation (systems engineering and information technology support for the government), and HRL Laboratories (private research and development, 2004-present). He is Chairman of the General Motors Science & Technology Advisory Board and a Life Fellow of the Institute of Electrical and Electronics Engineers (IEEE). Dr. Heilmeier is a member of the Defense Science Board and the National Security Agency Advisory Board. He is also a member of the National Academy of Engineering, the American Academy of Arts and Sciences, and the Board of Overseers of the School of Engineering and Applied Science of the University of Pennsylvania. Previously, Dr. Heilmeier served as a Director of TRW Inc. (automotive, space, defense, and information technology, 1992-2002), Compaq (1994-2002), Automatic Data Processing, Inc. (ADP) (technology-based business outsourcing, 1995-2002), INET Technologies Inc. (telecommunications network surveillance, 2001-2004), and Teletech Holdings (customer management services). He is the recipient of the 2005 Kyoto Prize in Advanced Technology for his invention of the liquid crystal display, and a member of the Consumer Electronics Hall of Fame. | |
James H. Keyes (66) | |
Year of Election or Appointment: 2007 Prior to his retirement in 2003, Mr. Keyes was Chairman, President, and Chief Executive Officer of Johnson Controls, Inc. (automotive supplier, 1993-2003). He currently serves as a member of the boards of LSI Logic Corporation (semiconductor technologies), Navistar International Corporation (manufacture and sale of trucks, buses, and diesel engines, 2002-present), and Pitney Bowes, Inc. (integrated mail, messaging, and document management solutions). | |
Marie L. Knowles (60) | |
Year of Election or Appointment: 2001 Prior to Ms. Knowles' retirement in June 2000, she served as Executive Vice President and Chief Financial Officer of Atlantic Richfield Company (ARCO) (diversified energy, 1996-2000). From 1993 to 1996, she was a Senior Vice President of ARCO and President of ARCO Transportation Company. She served as a Director of ARCO from 1996 to 1998. She currently serves as a Director of Phelps Dodge Corporation (copper mining and manufacturing) and McKesson Corporation (healthcare service, 2002-present). Ms. Knowles is a Trustee of the Brookings Institution and the Catalina Island Conservancy and also serves as a member of the Advisory Board for the School of Engineering of the University of Southern California. | |
Ned C. Lautenbach (63) | |
Year of Election or Appointment: 2000 Mr. Lautenbach is Chairman of the Independent Trustees (2006-present). Mr. Lautenbach has been a partner of Clayton, Dubilier & Rice, Inc. (private equity investment firm) since September 1998. Previously, Mr. Lautenbach was with the International Business Machines Corporation (IBM) from 1968 until his retirement in 1998. Mr. Lautenbach serves as a Director of Sony Corporation (2006-present) and Eaton Corporation (diversified industrial) as well as the Philharmonic Center for the Arts in Naples, Florida. He also is a member of the Board of Trustees of Fairfield University (2005-present), as well as a member of the Council on Foreign Relations. | |
Cornelia M. Small (62) | |
Year of Election or Appointment: 2005 Ms. Small is a member (2000-present) and Chairperson (2002-present) of the Investment Committee, and a member (2002- present) of the Board of Trustees of Smith College. Previously, she served as Chief Investment Officer (1999-2000), Director of Global Equity Investments (1996-1999), and a member of the Board of Directors of Scudder, Stevens & Clark (1990-1997) and Scudder Kemper Investments (1997-1999). In addition, Ms. Small served as Co-Chair (2000-2003) of the Annual Fund for the Fletcher School of Law and Diplomacy. | |
William S. Stavropoulos (67) | |
Year of Election or Appointment: 2001 Mr. Stavropoulos is Chairman Emeritus of the Board of Directors of The Dow Chemical Company. Since joining The Dow Chemical Company in 1967, Mr. Stavropoulos served in numerous senior management positions, including President (1993-2000; 2002-2003), CEO (1995-2000; 2002-2004), and Chairman of the Executive Committee (2000-2004). Currently, he is a Director of NCR Corporation (data warehousing and technology solutions), Chemical Financial Corporation, Maersk Inc. (industrial conglomerate, 2002-present), Tyco International, Inc. (multinational manufacturing and services, 2007-present), and a member of the Advisory Board for Metalmark Capital (private equity investment firm, 2005-present). He is a special advisor to Clayton, Dubilier & Rice, Inc., a private equity investment firm. He also serves as a member of the Board of Trustees of the American Enterprise Institute for Public Policy Research. In addition, Mr. Stavropoulos is a member of The Business Council, J.P. Morgan International Council and the University of Notre Dame Advisory Council for the College of Science. | |
Kenneth L. Wolfe (68) | |
Year of Election or Appointment: 2005 Prior to his retirement in 2001, Mr. Wolfe was Chairman and Chief Executive Officer of Hershey Foods Corporation (1993-2001). He currently serves as a member of the boards of Adelphia Communications Corporation (2003-present), Bausch & Lomb, Inc., and Revlon Inc. (2004-present). | |
Advisory Board Member and Executive Officers:
Correspondence intended for each executive officer and Mr. Lynch may be sent to Fidelity Investments, 82 Devonshire Street, Boston, Massachusetts 02109.
Name, Age; Principal Occupation | |
Peter S. Lynch (63) | |
Year of Election or Appointment: 2003 Member of the Advisory Board of Fidelity Select Portfolios. Mr. Lynch is Vice Chairman and a Director of FMR, and Vice Chairman (2001-present) and a Director of FMR Co., Inc. Previously, Mr. Lynch served as a Trustee of the Fidelity funds (1990-2003). In addition, he serves as a Trustee of Boston College and as the Chairman of the Inner-City Scholarship Fund. | |
Kimberley H. Monasterio (43) | |
Year of Election or Appointment: 2007 President and Treasurer of Select Automotive Portfolio, Select Construction & Housing Portfolio, Select Consumer Discretionary Portfolio, Select Leisure Portfolio, Select Multimedia Portfolio, and Select Retailing Portfolio. Ms. Monasterio also serves as President and Treasurer of other Fidelity funds (2007-present) and is an employee of FMR (2004-present). Previously, Ms. Monasterio served as Deputy Treasurer of the Fidelity funds (2004-2006). Before joining Fidelity Investments, Ms. Monasterio served as Treasurer (2000-2004) and Chief Financial Officer (2002-2004) of the Franklin Templeton Funds and Senior Vice President of Franklin Templeton Services, LLC (2000-2004). | |
Boyce I. Greer (51) | |
Year of Election or Appointment: 2005 Vice President of Select Automotive Portfolio, Select Construction & Housing Portfolio, Select Consumer Discretionary Portfolio, Select Leisure Portfolio, Select Multimedia Portfolio, and Select Retailing Portfolio. Mr. Greer also serves as Vice President of certain Equity Funds (2005-present), certain Asset Allocation Funds (2005-present), Fixed-Income Funds (2006-present), and Money Market Funds (2006-present). Mr. Greer is also a Trustee of other investment companies advised by FMR (2003-present). He is an Executive Vice President of FMR (2005-present) and FMR Co., Inc. (2005-present), and Senior Vice President of Fidelity Investments Money Management, Inc. (2006-present). Previously, Mr. Greer served as a Director and Managing Director of Strategic Advisers, Inc. (2002-2005), and Executive Vice President (2000-2002) and Money Market Group Leader (1997-2002) of the Fidelity Investments Fixed Income Division. He also served as Vice President of Fidelity's Money Market Funds (1997-2002), Senior Vice President of FMR (1997-2002), and Vice President of FIMM (1998-2002). | |
Eric D. Roiter (58) | |
Year of Election or Appointment: 1998 Secretary of Select Automotive Portfolio, Select Construction & Housing Portfolio, Select Consumer Discretionary Portfolio, Select Leisure Portfolio, Select Multimedia Portfolio, and Select Retailing Portfolio. He also serves as Secretary of other Fidelity funds; Vice President, General Counsel, and Secretary of FMR Co., Inc. (2001-present) and FMR; Assistant Secretary of Fidelity Management & Research (U.K.) Inc. (2001-present), Fidelity Research & Analysis Company (2001-present), and Fidelity Investments Money Management, Inc. (2001-present). Mr. Roiter is an Adjunct Member, Faculty of Law, at Boston College Law School (2003-present). Previously, Mr. Roiter served as Vice President and Secretary of Fidelity Distributors Corporation (FDC) (1998-2005). | |
Scott C. Goebel (39) | |
Year of Election or Appointment: 2007 Assistant Secretary of Select Automotive Portfolio, Select Construction & Housing Portfolio, Select Consumer Discretionary Portfolio, Select Leisure Portfolio, Select Multimedia Portfolio, and Select Retailing Portfolio. Mr. Goebel also serves as Assistant Secretary of other Fidelity funds (2007-present), Vice President and Secretary of FDC (2006-present), and is an employee of FMR. | |
R. Stephen Ganis (40) | |
Year of Election or Appointment: 2006 Anti-Money Laundering (AML) officer of Select Automotive Portfolio, Select Construction & Housing Portfolio, Select Consumer Discretionary Portfolio, Select Leisure Portfolio, Select Multimedia Portfolio, and Select Retailing Portfolio. Mr. Ganis also serves as AML officer of other Fidelity funds (2006-present) and FMR Corp. (2003-present). Before joining Fidelity Investments, Mr. Ganis practiced law at Goodwin Procter, LLP (2000-2002). | |
Joseph B. Hollis (58) | |
Year of Election or Appointment: 2006 Chief Financial Officer of Select Automotive Portfolio, Select Construction & Housing Portfolio, Select Consumer Discretionary Portfolio, Select Leisure Portfolio, Select Multimedia Portfolio, and Select Retailing Portfolio. Mr. Hollis also serves as Chief Financial Officer of other Fidelity funds. Mr. Hollis is President of Fidelity Pricing and Cash Management Services (FPCMS) (2005-present). Mr. Hollis also serves as President and Director of Fidelity Service Company, Inc. (2006-present). Previously, Mr. Hollis served as Senior Vice President of Cash Management Services (1999-2002) and Investment Management Operations (2002-2005). | |
Kenneth A. Rathgeber (59) | |
Year of Election or Appointment: 2004 Chief Compliance Officer of Select Automotive Portfolio, Select Construction & Housing Portfolio, Select Consumer Discretionary Portfolio, Select Leisure Portfolio, Select Multimedia Portfolio, and Select Retailing Portfolio. Mr. Rathgeber also serves as Chief Compliance Officer of other Fidelity funds (2004-present) and Executive Vice President of Risk Oversight for Fidelity Investments (2002-present). He is Chief Compliance Officer of FMR (2005-present), FMR Co., Inc. (2005-present), Fidelity Management & Research (U.K.) Inc. (2005-present), Fidelity Research & Analysis Company (2005-present), Fidelity Investments Money Management, Inc. (2005-present), and Strategic Advisers, Inc. (2005-present). Previously, Mr. Rathgeber served as Executive Vice President and Chief Operating Officer for Fidelity Investments Institutional Services Company, Inc. (1998-2002). | |
Bryan A. Mehrmann (45) | |
Year of Election or Appointment: 2005 Deputy Treasurer of Select Automotive Portfolio, Select Construction & Housing Portfolio, Select Consumer Discretionary Portfolio, Select Leisure Portfolio, Select Multimedia Portfolio, and Select Retailing Portfolio. Mr. Mehrmann also serves as Deputy Treasurer of other Fidelity funds (2005-present) and is an employee of FMR. Previously, Mr. Mehrmann served as Vice President of Fidelity Investments Institutional Services Group (FIIS)/Fidelity Investments Institutional Operations Corporation, Inc. (FIIOC) Client Services (1998-2004). | |
Kenneth B. Robins (37) | |
Year of Election or Appointment: 2005 Deputy Treasurer of Select Automotive Portfolio, Select Construction & Housing Portfolio, Select Consumer Discretionary Portfolio, Select Leisure Portfolio, Select Multimedia Portfolio, and Select Retailing Portfolio. Mr. Robins also serves as Deputy Treasurer of other Fidelity funds (2005-present) and is an employee of FMR (2004-present). Before joining Fidelity Investments, Mr. Robins worked at KPMG LLP, where he was a partner in KPMG's department of professional practice (2002-2004) and a Senior Manager (1999-2000). In addition, Mr. Robins served as Assistant Chief Accountant, United States Securities and Exchange Commission (2000-2002). | |
Robert G. Byrnes (40) | |
Year of Election or Appointment: 2005 Assistant Treasurer of Select Automotive Portfolio, Select Construction & Housing Portfolio, Select Consumer Discretionary Portfolio, Select Leisure Portfolio, Select Multimedia Portfolio, and Select Retailing Portfolio. Mr. Byrnes also serves as Assistant Treasurer of other Fidelity funds (2005-present) and is an employee of FMR (2005-present). Previously, Mr. Byrnes served as Vice President of FPCMS (2003-2005). Before joining Fidelity Investments, Mr. Byrnes worked at Deutsche Asset Management where he served as Vice President of the Investment Operations Group (2000-2003). | |
Peter L. Lydecker (53) | |
Year of Election or Appointment: 2004 Assistant Treasurer of Select Automotive Portfolio, Select Construction & Housing Portfolio, Select Consumer Discretionary Portfolio, Select Leisure Portfolio, Select Multimedia Portfolio, and Select Retailing Portfolio. Mr. Lydecker also serves as Assistant Treasurer of other Fidelity funds (2004) and is an employee of FMR. | |
Gary W. Ryan (48) | |
Year of Election or Appointment: 2005 Assistant Treasurer of Select Automotive Portfolio, Select Construction & Housing Portfolio, Select Consumer Discretionary Portfolio, Select Leisure Portfolio, Select Multimedia Portfolio, and Select Retailing Portfolio. Mr. Ryan also serves as Assistant Treasurer of other Fidelity funds (2005-present) and is an employee of FMR (2005-present). Previously, Mr. Ryan served as Vice President of Fund Reporting in FPCMS (1999-2005). | |
Salvatore Schiavone (41) | |
Year of Election or Appointment: 2005 Assistant Treasurer of Select Automotive Portfolio, Select Construction & Housing Portfolio, Select Consumer Discretionary Portfolio, Select Leisure Portfolio, Select Multimedia Portfolio, and Select Retailing Portfolio. Mr. Schiavone also serves as Assistant Treasurer of other Fidelity funds (2005-present) and is an employee of FMR (2005-present). Before joining Fidelity Investments, Mr. Schiavone worked at Deutsche Asset Management, where he most recently served as Assistant Treasurer (2003-2005) of the Scudder Funds and Vice President and Head of Fund Reporting (1996-2003). | |
Annual Report
Distributions
The Board of Trustees of each fund voted to pay to shareholders of record at the opening of business on record date, the following distributions per share derived from capital gains realized from sales of portfolio securities, and dividends derived from net investment income:
Fund | Pay Date | Record Date | Dividends | Capital Gains | ||
Construction and Housing Portfolio | 04/16/07 | 04/13/07 | $0.04 | $0.43 | ||
Consumer Discretionary Portfolio | 04/16/07 | 04/13/07 | $0.06 | $1.23 | ||
Leisure Portfolio | 04/16/07 | 04/13/07 | $0.07 | $2.05 | ||
Multimedia Portfolio | 04/16/07 | 04/13/07 | $0.00 | $3.53 | ||
Retailing Portfolio | 04/16/07 | 04/13/07 | $0.22 | $1.93 | ||
The funds hereby designate as capital gain dividend the amounts noted below for the taxable year ended February 28, 2007, or, if subsequently determined to be different, the net capital gain of such year.
Fund | |
Construction and Housing Portfolio | $ 20,673,594 |
Consumer Discretionary Portfolio | $ 4,409,620 |
Leisure Portfolio | $ 25,444,104 |
Multimedia Portfolio | $ 14,625,636 |
Retailing Portfolio | $ 6,410,379 |
A percentage of the dividends distributed during the fiscal year for the following funds qualifies for the dividends-received deduction for corporate shareholders:
Automotive Portfolio | |
December, 2006 | 100% |
Construction and Housing Portfolio | |
December, 2006 | 100% |
Consumer Discretionary Portfolio | |
April, 2006 | 98% |
Leisure Portfolio | |
April, 2006 | 87% |
December, 2006 | 75% |
Multimedia Portfolio | |
April, 2006 | 48% |
A percentage of the dividends distributed during the fiscal year for the following funds may be taken into account as a dividend for purposes of the maximum rate under section 1(h)(11) of the Internal Revenue Code.
Automotive Portfolio | |
December, 2006 | 100% |
Construction and Housing Portfolio | |
December, 2006 | 100% |
Consumer Discretionary Portfolio | |
April, 2006 | 100% |
Leisure Portfolio | |
April, 2006 | 93% |
December, 2006 | 86% |
Multimedia Portfolio | |
April, 2006 | 59% |
The fund will notify shareholders in January 2008 of amounts for use in preparing 2007 income tax returns.
Annual Report
Proxy Voting Results
A special meeting of Fidelity Select Portfolios' shareholders was held on September 20, 2006. The results of votes taken among shareholders on the proposals before them are reported below. Each vote reported represents one dollar of net asset value held on the record date for the meeting.
PROPOSAL 1 | ||
To elect a Board of Trustees. A | ||
# of | % of | |
Dennis J. Dirks | ||
Affirmative | 13,182,341,755.09 | 94.980 |
Withheld | 696,736,162.41 | 5.020 |
TOTAL | 13,879,077,917.50 | 100.000 |
Albert R. Gamper, Jr. | ||
Affirmative | 13,177,593,614.43 | 94.946 |
Withheld | 701,484,303.07 | 5.054 |
TOTAL | 13,879,077,917.50 | 100.000 |
Robert M. Gates | ||
Affirmative | 13,141,235,622.81 | 94.684 |
Withheld | 737,842,294.69 | 5.316 |
TOTAL | 13,879,077,917.50 | 100.000 |
George H. Heilmeier | ||
Affirmative | 13,140,073,210.00 | 94.675 |
Withheld | 739,004,707.50 | 5.325 |
TOTAL | 13,879,077,917.50 | 100.000 |
Edward C. Johnson 3d | ||
Affirmative | 13,106,284,587.54 | 94.432 |
Withheld | 772,793,329.96 | 5.568 |
TOTAL | 13,879,077,917.50 | 100.000 |
Stephen P. Jonas | ||
Affirmative | 13,168,282,872.88 | 94.879 |
Withheld | 710,795,044.62 | 5.121 |
TOTAL | 13,879,077,917.50 | 100.000 |
James H. KeyesB | ||
Affirmative | 13,164,603,089.66 | 94.852 |
Withheld | 714,474,827.84 | 5.148 |
TOTAL | 13,879,077,917.50 | 100.000 |
Marie L. Knowles | ||
Affirmative | 13,169,356,779.66 | 94.886 |
Withheld | 709,721,137.84 | 5.114 |
TOTAL | 13,879,077,917.50 | 100.000 |
Ned C. Lautenbach | ||
Affirmative | 13,166,485,155.52 | 94.866 |
Withheld | 712,592,761.98 | 5.134 |
TOTAL | 13,879,077,917.50 | 100.000 |
William O. McCoy | ||
Affirmative | 13,129,548,996.59 | 94.600 |
Withheld | 749,528,920.91 | 5.400 |
TOTAL | 13,879,077,917.50 | 100.000 |
Robert L. Reynolds | ||
Affirmative | 13,180,813,649.06 | 94.969 |
Withheld | 698,264,268.44 | 5.031 |
TOTAL | 13,879,077,917.50 | 100.000 |
# of | % of | |
Cornelia M. Small | ||
Affirmative | 13,170,500,616.42 | 94.895 |
Withheld | 708,577,301.08 | 5.105 |
TOTAL | 13,879,077,917.50 | 100.000 |
William S. Stavropoulos | ||
Affirmative | 13,143,284,328.22 | 94.699 |
Withheld | 735,793,589.28 | 5.301 |
TOTAL | 13,879,077,917.50 | 100.000 |
Kenneth L. Wolfe | ||
Affirmative | 13,162,946,758.47 | 94.840 |
Withheld | 716,131,159.03 | 5.160 |
TOTAL | 13,879,077,917.50 | 100.000 |
PROPOSAL 2A & 8A | ||
To modify the fund's fundamental "invests primarily" policy (the investment policy concerning the fund's primary investments). | ||
Consumer Discretionary Portfolio | ||
# of | % of | |
Affirmative | 31,466,469.89 | 84.262 |
Against | 777,329.52 | 2.082 |
Abstain | 574,751.87 | 1.539 |
Broker Non-Votes | 4,524,985.68 | 12.117 |
TOTAL | 37,343,536.96 | 100.000 |
Construction and Housing Portfolio | ||
# of | % of | |
Affirmative | 73,567,140.71 | 82.331 |
Against | 6,217,844.92 | 6.959 |
Abstain | 3,955,488.54 | 4.426 |
Broker Non-Votes | 5,614,725.82 | 6.284 |
TOTAL | 89,355,199.99 | 100.000 |
PROPOSAL 2B & 8B | ||
To modify the fund's investment concentration policy. | ||
Consumer Discretionary Portfolio | ||
# of | % of | |
Affirmative | 31,287,196.22 | 83.782 |
Against | 958,558.54 | 2.567 |
Abstain | 572,796.52 | 1.534 |
Broker Non-Votes | 4,524,985.68 | 12.117 |
TOTAL | 37,343,536.96 | 100.000 |
Construction and Housing Portfolio | ||
# of | % of | |
Affirmative | 72,316,588.92 | 80.932 |
Against | 6,462,062.23 | 7.231 |
Abstain | 4,961,822.98 | 5.554 |
Broker Non-Votes | 5,614,725.86 | 6.284 |
TOTAL | 89,355,199.99 | 100.000 |
A Denotes trust-wide proposal and voting results. B Effective on or about January 1, 2007. | ||
Annual Report
Investment Adviser
Fidelity Management & Research Company
Boston, MA
Investment Sub-Advisers
FMR Co., Inc.
Fidelity Management & Research
(U.K.) Inc.
Fidelity Research & Analysis Company
Fidelity Investments Japan Limited
Fidelity International Investment Advisors
Fidelity International Investment Advisors
(U.K. Limited)
General Distributor
Fidelity Distributors Corporation
Boston, MA
Transfer and Service Agent
Fidelity Service Company, Inc.
Boston, MA
Custodian
Brown Brothers Harriman & Co.
Boston, MA
Corporate Headquarters
82 Devonshire Street
Boston, MA 02109
1-800-544-8888
The Fidelity Telephone Connection
Mutual Fund 24-Hour Service
Exchanges/Redemptions
and Account Assistance 1-800-544-6666
Product Information 1-800-544-8888
Retirement Accounts 1-800-544-4774
(8 a.m. - 9 p.m.)
TDD Service 1-800-544-0118
for the deaf and hearing impaired
(9 a.m. - 9 p.m. Eastern time)
Fidelity Automated Service
Telephone (FAST®) (automated graphic) 1-800-544-5555
(automated graphic) Automated line for quickest service
(Fidelity Investment logo)(registered trademark)
Corporate Headquarters
82 Devonshire St., Boston, MA 02109
www.fidelity.com
SELCON-UANN-0407
1.813632.102
Fidelity®
Select Portfolios®
Health Care Sector
Select Biotechnology Portfolio
Select Health Care Portfolio
Select Medical Delivery Portfolio
Select Medical Equipment and Systems Portfolio
Select Pharmaceuticals Portfolio
Annual Report
February 28, 2007
(2_fidelity_logos) (Registered_Trademark)
Contents
Chairman's Message | ||
Notes To Shareholders | ||
Shareholder Expense Example | ||
Fund Updates* | ||
Health Care Sector | ||
Biotechnology | ||
Health Care | ||
Medical Delivery | ||
Medical Equipment and Systems | ||
Pharmaceuticals | ||
Notes to Financial Statements | ||
Report of Independent Registered Public Accounting Firm | ||
Trustees and Officers | ||
Distributions | ||
Proxy Voting Results |
* Fund updates for each Select Portfolio include: Performance, Management's Discussion of Fund Performance, Investment Changes, Investments, and Financial Statements.
To view a fund's proxy voting guidelines and proxy voting record for the 12-month period ended June 30, visit www.fidelity.com/proxyvotingresults or visit the Securities and Exchange Commission's (SEC) web site at www.sec.gov. You may also call 1-800-544-8544 to request a free copy of the proxy voting guidelines.
Standard & Poor's, S&P and S&P 500 are registered service marks of The McGraw-Hill Companies, Inc. and have been licensed for use by Fidelity Distributors Corporation.
Other third party marks appearing herein are the property of their respective owners.
All other marks appearing herein are registered or unregistered trademarks or service marks of FMR Corp. or an affiliated company.
This report and the financial statements contained herein are submitted for the general information of the shareholders of the funds. This report is not authorized for distribution to prospective investors in the funds unless preceded or accompanied by an effective prospectus.
A fund files its complete schedule of portfolio holdings with the SEC for the first and third quarters of each fiscal year on Form N-Q. Forms N-Q are available on the SEC's web site at http://www.sec.gov. A fund's Forms N-Q may be reviewed and copied at the SEC's Public Reference Room in Washington, DC. Information regarding the operation of the SEC's Public Reference Room may be obtained by calling 1-800-SEC-0330. For a complete list of a fund's portfolio holdings, view the most recent quarterly holdings report, semiannual report, or annual report on Fidelity's web site at http://www.fidelity.com/holdings.
NOT FDIC INSURED · MAY LOSE VALUE · NO BANK GUARANTEE
Neither the funds nor Fidelity Distributors Corporation is a bank.
Annual Report
Chairman's Message
(Photograph of Edward C. Johnson 3d.)
Dear Shareholder:
Substantial single-day losses are not uncommon in the equity markets, and when they occur - as in late February - investors can be better served in the long term by buying good stocks at lower prices than by moving their money to the sidelines. While financial markets are always unpredictable, there are a number of time-tested principles that can put the historical odds in your favor.
One of the basic tenets is to invest for the long term. Over time, riding out the markets' inevitable ups and downs has proven much more effective than selling into panic or chasing the hottest trend. Even missing only a few of the markets' best days can significantly diminish investor returns. Patience also affords the benefits of compounding - of earning interest on additional income or reinvested dividends and capital gains. There are tax advantages and cost benefits to consider as well. The more you sell, the more taxes you pay, and the more you trade, the higher the costs. While staying the course doesn't eliminate risk, it can considerably lessen the effect of short-term declines.
You can further manage your investing risk through diversification. And today, more than ever, geographic diversification should be taken into account. Studies
indicate that asset allocation is the single most important determinant of a portfolio's long-term success. The right mix of stocks, bonds and cash - aligned to your particular risk tolerance and investment objective - is very important. Age-appropriate rebalancing is also an essential aspect of asset allocation. For younger investors, an emphasis on equities - which historically have been the best performing asset class over time - is encouraged. As investors near their specific goal, such as retirement or sending a child to college, consideration may be given to replacing volatile assets (e.g. common stocks) with more-stable fixed investments (bonds or savings plans).
A third investment principle - investing regularly - can help lower the average cost of your purchases. Investing a certain amount of money each month or quarter helps ensure you won't pay for all your shares at market highs. This strategy - known as dollar cost averaging - also reduces unconstructive "emotion" from investing, helping shareholders avoid selling weak performers just prior to an upswing, or chasing a hot performer just before a correction.
We invite you to contact us via the Internet, through our Investor Centers or over the phone. It is our privilege to provide you the information you need to make the investments that are right for you.
Sincerely,
/s/Edward C. Johnson 3d
Edward C. Johnson 3d
Annual Report
Notes to Shareholders:
Effective October 1, 2006, Fidelity restructured the Fidelity® Select Portfolios® equity product line. The restructuring aligned the equity funds' investment goals more closely with standard industry classifications and facilitated adoption of more-specific benchmark indexes to evaluate fund performance. As restructured, the equity funds generally align under the 10 sectors in the widely recognized Global Industry Classification Standard (GICS), developed by Standard & Poor's® (S&P®) and Morgan Stanley Capital InternationalSM (MSCI®): Consumer Discretionary, Consumer Staples, Energy, Financials, Health Care, Industrials, Information Technology, Materials, Telecommunications Services and Utilities. Changes to the funds ranged from simply adopting a new supplemental benchmark to, in some cases, changing investment policies and fund names.
For Banking, Communications Equipment (formerly Developing Communications), Construction and Housing, Consumer Discretionary (formerly Consumer Industries), Consumer Staples (formerly Food and Agriculture), Home Finance, Industrials (formerly Cyclical Industries), IT Services (formerly Business Services and Outsourcing) and Materials (formerly Industrial Materials), shareholders approved certain fundamental investment policy changes related to the restructuring at a special meeting of shareholders held September 20, 2006. All the equity funds adopted new benchmark indexes from MSCI, except for Gold (which adopted an S&P/Citigroup index), Natural Gas (which adopted an S&P index) and Natural Resources (which retained its current Goldman Sachs® index). Taken together, the name, policy and benchmark changes will make it easier for investors to distinguish funds in the product line and to evaluate Fidelity Management & Research Company's skill in managing the funds.
The Select equity portfolios also eliminated hourly pricing. The funds now price each business day as of the close of the New York Stock Exchange, normally 4:00 pm Eastern time. The funds also adopted Fidelity's standard fund market timing policy, as described in the funds' current prospectus, and removed the $7.50 fee formerly charged on exchanges made through non-automated channels.
Changes for each fund in the GICS Health Care Sector are described in detail below.
The fund is now benchmarked to the MSCI US Investable Market Biotechnology Index.
Health Care
The fund is now benchmarked to the MSCI US Investable Market Health Care Index.
Medical Delivery
The fund is now benchmarked to the MSCI US Investable Market Health Care Providers & Services Index.
Medical Equipment and Systems
The fund is now benchmarked to the MSCI US Investable Market Health Care Equipment & Supplies Index.
Pharmaceuticals
The fund is now benchmarked to the MSCI US Investable Market Pharmaceuticals Index.
Annual Report
Shareholder Expense Example
As a shareholder of a Fund, you incur two types of costs: (1) transaction costs, including redemption fees, exchange fees, and (2) ongoing costs, including management fees and other Fund expenses. This Example is intended to help you understand your ongoing costs (in dollars) of investing in the Funds and to compare these costs with the ongoing costs of investing in other mutual funds.
The Example is based on an investment of $1,000 invested at the beginning of the period and held for the entire period (September 1, 2006 to February 28, 2007).
Actual Expenses
The first line of the accompanying table for each fund provides information about actual account values and actual expenses. You may use the information in this line, together with the amount you invested, to estimate the expenses that you paid over the period. Simply divide your account value by $1,000.00 (for example, an $8,600 account value divided by $1,000.00 = 8.6), then multiply the result by the number in the first line for a fund under the heading entitled "Expenses Paid During Period" to estimate the expenses you paid on your account during this period. A small balance maintenance fee of $12.00 that is charged once a year may apply for certain accounts with a value of less than $2,000. This fee is not included in the table below. If it was, the estimate of expenses you paid during the period would be higher, and your ending account value lower, by this amount.
Hypothetical Example for Comparison Purposes
The second line of the accompanying table for each fund provides information about hypothetical account values and hypothetical expenses based on a fund's actual expense ratio and an assumed rate of return of 5% per year before expenses, which is not the Fund's actual return. The hypothetical account values and expenses may not be used to estimate the actual ending account balance or expenses you paid for the period. You may use this information to compare the ongoing costs of investing in the Fund and other funds. To do so, compare this 5% hypothetical example with the 5% hypothetical examples that appear in the shareholder reports of the other funds. A small balance maintenance fee of $12.00 that is charged once a year may apply for certain accounts with a value of less than $2,000. This fee is not included in the table below. If it was, the estimate of expenses you paid during the period would be higher, and your ending account value lower, by this amount.
Please note that the expenses shown in the table are meant to highlight your ongoing costs only and do not reflect any transaction costs. Therefore, the second line of the table is useful in comparing ongoing costs only, and will not help you determine the relative total costs of owning different funds. In addition, if these transactional costs were included, your costs would have been higher.
Beginning | Ending | Expenses Paid | |
Biotechnology Portfolio | |||
Actual | $ 1,000.00 | $ 1,058.00 | $ 4.64 |
Hypothetical A | $ 1,000.00 | $ 1,020.28 | $ 4.56 |
Health Care Portfolio | |||
Actual | $ 1,000.00 | $ 1,040.40 | $ 4.40 |
Hypothetical A | $ 1,000.00 | $ 1,020.48 | $ 4.36 |
Medical Delivery Portfolio | |||
Actual | $ 1,000.00 | $ 1,075.90 | $ 4.89 |
Hypothetical A | $ 1,000.00 | $ 1,020.08 | $ 4.76 |
Medical Equipment and Systems Portfolio | |||
Actual | $ 1,000.00 | $ 1,056.80 | $ 4.69 |
Hypothetical A | $ 1,000.00 | $ 1,020.23 | $ 4.61 |
Pharmaceuticals Portfolio | |||
Actual | $ 1,000.00 | $ 1,024.40 | $ 4.92 |
Hypothetical A | $ 1,000.00 | $ 1,019.93 | $ 4.91 |
A 5% return per year before expenses
* Expenses are equal to each Fund's annualized expense ratio (shown in the table below); multiplied by the average account value over the period, multiplied by 181/365 (to reflect the one-half year period).
Annualized | |
Biotechnology Portfolio | .91% |
Health Care Portfolio | .87% |
Medical Delivery Portfolio | .95% |
Medical Equipment and Systems Portfolio | .92% |
Pharmaceuticals Portfolio | .98% |
Annual Report
Select Biotechnology Portfolio
Performance
Average annual total return reflects the change in the value of an investment, assuming reinvestment of the fund's dividend income and capital gains (the profits earned upon the sale of securities that have grown in value) and assuming a constant rate of performance each year. The $10,000 table and the fund's returns do not reflect the deduction of taxes that a shareholder would pay on fund distributions or the redemption of fund shares. During periods of reimbursement by Fidelity a fund's total returns will be greater than it would be had the reimbursement not occurred. How a fund did yesterday is no guarantee of how it will do tomorrow.
Average Annual Total Returns
Periods ended February 28, 2007 | Past 1 | Past 5 | Past 10 |
Select Biotechnology Portfolio | -6.13% | 3.62% | 9.45% |
$10,000 Over 10 Years
Let's say hypothetically that $10,000 was invested in Select Biotechnology Portfolio on February 28, 1997. The chart shows how the value of your investment would have changed, and also shows how the Standard & Poor's 500SM Index (S&P 500®) performed over the same period.
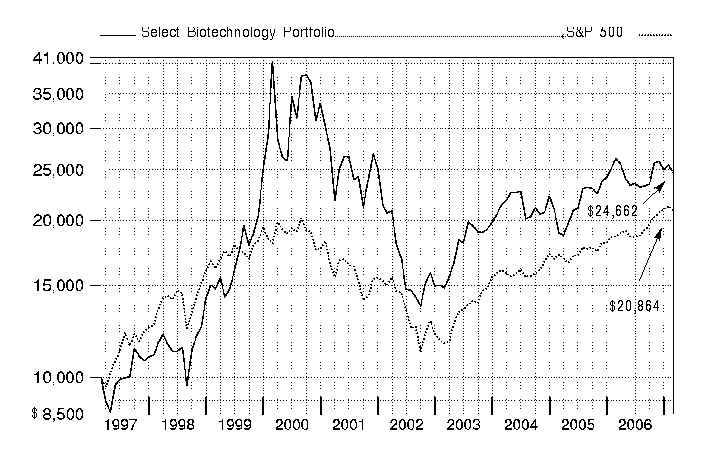
Annual Report
Select Biotechnology Portfolio
Management's Discussion of Fund Performance
Comments from Rajiv Kaul, Portfolio Manager of Fidelity® Select Biotechnology Portfolio
A rosy year for stocks wilted just prior to the end of the 12-month period ending February 28, 2007. On the day prior to the period's close, the Dow Jones Industrial AverageSM plunged 416 points and the Standard & Poor's 500SM Index lost roughly 3.5% of its value, plummeting nearly 50 points and marking the benchmark's worst single-day performance since the day the market reopened after the 9/11 terrorist attacks. Though investors were obviously rattled by the development, it was only the 22nd-biggest decline for the S&P 500® in 20 years, and it could not overshadow how well stocks performed for the 12 months overall. For much of the past year, investors grew confident that the economy would not fall into a recession, and they bid up most broad-based stock indexes for six consecutive months from August through January. Overall for the year ending February 28, 2007, the S&P 500 was up 11.97%, the Dow advanced 14.24%, the small-cap Russell 2000® Index gained 9.87% and the NASDAQ Composite® Index rose 6.66%.
During the past year, the fund returned -6.13%, slightly trailing the -5.82% return of the Morgan Stanley Capital InternationalSM (MSCI®) US Investable Market Biotechnology Index and also finishing behind the 1.12% gain of a blended index specific to this fund. This blended index is a combination of the Goldman Sachs® Health Care Index, which the fund was compared with through September, and the new MSCI benchmark mentioned above, which the fund was compared with during the period's final five months1. During the same 12-month period, the fund underperformed the S&P 500. For the first seven months of the review period, the fund significantly trailed the Goldman Sachs index primarily due to its huge overweighting in biotechnology and a sizable underweighting in pharmaceuticals. Stock selection in both groups had a negative impact as well. Offsetting these negatives to some extent were having no exposure to the weak performing managed health care group and a sizable underweighting in health care equipment, which also fared poorly. Cephalon was the fund's biggest detractor versus the Goldman Sachs index. News that U.S. regulators had decided not to approve Sparlon, the company's medication for attention deficit hyperactivity disorder, caused the stock to drop sharply in August. Other biotech holdings that hurt performance were MedImmune and PDL BioPharma. Conversely, biotech stock Celgene was a major contributor. The shares were boosted by Food and Drug Administration approval of Revlimid to treat multiple myeloma, a common type of blood cancer. Not owning health care equipment maker Boston Scientific also helped performance. During the final five months of the period, the fund handily outperformed the MSCI index. Strong stock picking in biotechnology and, secondarily, in pharmaceuticals was the deciding factor. Underweighting biotech bellwether Amgen - which accounted for roughly 31% of the MSCI index - had the most positive impact on our results. Also providing a performance boost was an out-of-index position in New River Pharmaceuticals. Myogen, a biotech company that was purchased at a premium price by Gilead Sciences, further boosted our results. New River Pharmaceuticals and Myogen were no longer held at period end. On the negative side, Irish pharmaceutical company Elan - an out-of-index holding - suffered from concerns about a slower-than-expected rebound in the sales of Tysabri, its multiple sclerosis drug. An underweighting in biotech giant Genentech also detracted.
1 The fund's blended index is a customized index developed by Fidelity for the limited purpose of discussing the fund's performance for the 12-month period ending February 28, 2007. From March 1, 2006, through September 30, 2006, the fund compared its performance to the Goldman Sachs Health Care Index, which returned 1.62% during that period. On October 1, 2006, the fund began comparing its performance to a different index, the MSCI US Investable Market Biotechnology Index, which returned -0.49% from October 1, 2006, through February 28, 2007. For the 12-month period ending February 28, 2007, the blended index (Goldman Sachs and MSCI) returned 1.12%.
The views expressed above reflect those of the portfolio manager(s) only through the end of the period as stated on the cover of this report and do not necessarily represent the views of Fidelity or any other person in the Fidelity organization. Any such views are subject to change at any time based upon market or other conditions and Fidelity disclaims any responsibility to update such views. These views may not be relied on as investment advice and, because investment decisions for a Fidelity fund are based on numerous factors, may not be relied on as an indication of trading intent on behalf of any Fidelity fund.
Annual Report
Select Biotechnology Portfolio
Investment Changes
Top Ten Stocks as of February 28, 2007 | ||
% of fund's | % of fund's net assets | |
Gilead Sciences, Inc. | 13.7 | 5.8 |
Amgen, Inc. | 13.1 | 5.1 |
Genentech, Inc. | 11.1 | 5.9 |
Biogen Idec, Inc. | 7.8 | 6.8 |
Cephalon, Inc. | 4.3 | 3.3 |
Celgene Corp. | 4.2 | 6.8 |
Genzyme Corp. | 3.5 | 5.3 |
Vertex Pharmaceuticals, Inc. | 3.1 | 3.3 |
Alexion Pharmaceuticals, Inc. | 2.8 | 2.7 |
OSI Pharmaceuticals, Inc. | 2.6 | 2.8 |
66.2 | ||
Top Industries (% of fund's net assets) | |||
As of February 28, 2007 | |||
 | Biotechnology | 89.9% | |
 | Pharmaceuticals | 5.3% | |
 | Life Sciences Tools & Services | 3.0% | |
 | Health Care Equipment & Supplies | 1.4% | |
 | Health Care Providers & Services | 0.2% | |
 | All Others* | 0.2% | |
As of August 31, 2006 | |||
| Biotechnology | 76.7% | |
| Life Sciences Tools & Services | 10.7% | |
| Pharmaceuticals | 10.1% | |
| Health Care Equipment & Supplies | 2.1% | |
 | Health Care Providers & Services | 0.2% | |
| All Others* | 0.2% | |
* Includes short-term investments and net other assets. |
Annual Report
Select Biotechnology Portfolio
Investments February 28, 2007
Showing Percentage of Net Assets
Common Stocks - 99.7% | |||
Shares | Value | ||
BIOTECHNOLOGY - 89.7% | |||
Biotechnology - 89.7% | |||
3SBio, Inc. ADR | 297,500 | $ 4,212,600 | |
Acadia Pharmaceuticals, Inc. (a)(d) | 728,896 | 5,073,116 | |
Acorda Therapeutics, Inc. | 142,000 | 3,082,820 | |
Affymax, Inc. | 38,500 | 1,370,985 | |
Alexion Pharmaceuticals, Inc. (a)(d) | 1,021,200 | 37,661,856 | |
Alkermes, Inc. (a) | 1,071,757 | 17,576,815 | |
Alnylam Pharmaceuticals, Inc. (a) | 279,100 | 5,247,080 | |
Altus Pharmaceuticals, Inc. | 157,988 | 2,579,944 | |
Amgen, Inc. (a)(d) | 2,800,000 | 179,928,000 | |
Amylin Pharmaceuticals, Inc. (a)(d) | 807,498 | 31,419,747 | |
Arena Pharmaceuticals, Inc. (a)(d) | 302,900 | 3,831,685 | |
ARIAD Pharmaceuticals, Inc. (a) | 666,500 | 3,219,195 | |
Biogen Idec, Inc. (a) | 2,369,006 | 107,055,381 | |
Celgene Corp. (a) | 1,066,434 | 56,840,932 | |
Cephalon, Inc. (a)(d) | 823,840 | 58,558,547 | |
Combinatorx, Inc. (a) | 353,100 | 2,881,296 | |
Cubist Pharmaceuticals, Inc. (a) | 306,700 | 6,143,201 | |
CV Therapeutics, Inc. (a)(d) | 329,300 | 4,205,161 | |
Cytokinetics, Inc. (a) | 184,900 | 1,436,673 | |
Cytos Biotechnology AG (a) | 15,423 | 1,708,394 | |
Emergent BioSolutions, Inc. | 379,810 | 4,774,212 | |
Encysive Pharmaceuticals, Inc. (a)(d) | 337,700 | 1,171,819 | |
Enzon Pharmaceuticals, Inc. (a) | 164,900 | 1,365,372 | |
Genentech, Inc. (a)(d) | 1,803,600 | 152,169,732 | |
Genzyme Corp. (a)(d) | 779,300 | 48,160,740 | |
Gilead Sciences, Inc. (a)(d) | 2,630,200 | 188,217,113 | |
GTx, Inc. (a)(d) | 233,373 | 5,094,533 | |
Halozyme Therapeutics, Inc. (a)(d) | 160,290 | 1,328,804 | |
Human Genome Sciences, Inc. (a)(d) | 2,275,300 | 25,028,300 | |
Infinity Pharmaceuticals, Inc. (a) | 46,601 | 612,337 | |
Isis Pharmaceuticals, Inc. (a)(d) | 771,600 | 7,036,992 | |
Ligand Pharmaceuticals, Inc. Class B (a) | 261,300 | 2,937,012 | |
MannKind Corp. (a)(d) | 614,600 | 9,778,286 | |
Martek Biosciences (a)(d) | 193,400 | 4,374,708 | |
Medarex, Inc. (a)(d) | 1,619,005 | 22,147,988 | |
MedImmune, Inc. (a)(d) | 384,020 | 12,254,078 | |
Momenta Pharmaceuticals, Inc. (a)(d) | 309,592 | 3,795,598 | |
Myriad Genetics, Inc. (a)(d) | 480,493 | 16,077,296 | |
Neurocrine Biosciences, Inc. (a) | 421,000 | 5,308,810 | |
Novacea, Inc. | 120,500 | 783,250 | |
ONYX Pharmaceuticals, Inc. (a)(d) | 313,400 | 8,226,750 | |
OSI Pharmaceuticals, Inc. (a)(d) | 1,042,100 | 36,056,660 | |
PDL BioPharma, Inc. (a) | 1,316,900 | 25,139,621 | |
Pharmion Corp. (a) | 172,534 | 4,516,940 | |
Regeneron Pharmaceuticals, Inc. (a) | 575,200 | 11,411,968 | |
Rosetta Genomics Ltd. | 263,900 | 1,992,445 | |
Savient Pharmaceuticals, Inc. (a) | 100,587 | 1,361,948 | |
Theravance, Inc. (a) | 414,300 | 13,361,175 | |
Shares | Value | ||
Trubion Pharmaceuticals, Inc. (d) | 118,500 | $ 2,142,480 | |
United Therapeutics Corp. (a)(d) | 379,297 | 21,316,491 | |
Vanda Pharmaceuticals, Inc. (d) | 384,769 | 9,257,542 | |
Vertex Pharmaceuticals, Inc. (a) | 1,380,200 | 42,358,338 | |
ViaCell, Inc. (a) | 17,500 | 92,050 | |
Zymogenetics, Inc. (a)(d) | 326,000 | 4,890,000 | |
1,228,574,816 | |||
DIVERSIFIED FINANCIAL SERVICES - 0.1% | |||
Other Diversifed Financial Services - 0.1% | |||
Ithaka Acquisition Corp. (a) | 107,500 | 581,575 | |
HEALTH CARE EQUIPMENT & SUPPLIES - 1.4% | |||
Health Care Equipment - 1.0% | |||
Clinical Data, Inc. (a) | 129,102 | 2,655,628 | |
Quidel Corp. (a) | 996,450 | 10,731,767 | |
13,387,395 | |||
Health Care Supplies - 0.4% | |||
Gen-Probe, Inc. (a) | 117,900 | 5,661,558 | |
TOTAL HEALTH CARE EQUIPMENT & SUPPLIES | 19,048,953 | ||
HEALTH CARE PROVIDERS & SERVICES - 0.2% | |||
Health Care Services - 0.2% | |||
Oracle Healthcare Acquisition Corp. unit | 267,600 | 2,306,712 | |
LIFE SCIENCES TOOLS & SERVICES - 3.0% | |||
Life Sciences Tools & Services - 3.0% | |||
Advanced Magnetics, Inc. (a) | 103,900 | 6,126,983 | |
Applera Corp. - Celera Genomics Group (a) | 877,600 | 12,207,416 | |
Exelixis, Inc. (a) | 998,700 | 10,056,909 | |
QIAGEN NV (a) | 793,800 | 13,010,382 | |
41,401,690 | |||
PHARMACEUTICALS - 5.3% | |||
Pharmaceuticals - 5.3% | |||
Akorn, Inc. (a) | 784,500 | 4,636,395 | |
Cardiome Pharma Corp. (a) | 66,800 | 736,137 | |
Catalyst Pharmaceutical Partners, Inc. | 259,800 | 1,257,432 | |
Cypress Bioscience, Inc. (a) | 505,500 | 3,922,680 | |
Elan Corp. PLC sponsored ADR (a) | 1,616,400 | 20,916,216 | |
Sepracor, Inc. (a)(d) | 635,100 | 33,380,856 | |
Somaxon Pharmaceuticals, Inc. (a) | 56,100 | 636,735 | |
Xenoport, Inc. (a) | 286,339 | 7,381,819 | |
72,868,270 | |||
TOTAL COMMON STOCKS (Cost $1,313,593,514) | 1,364,782,016 | ||
Preferred Stocks - 0.2% | |||
Shares | Value | ||
Convertible Preferred Stocks - 0.2% | |||
BIOTECHNOLOGY - 0.2% | |||
Biotechnology - 0.2% | |||
Xenon Pharmaceuticals, Inc. Series E (e) | 981,626 | $ 3,416,058 | |
Nonconvertible Preferred Stocks - 0.0% | |||
LIFE SCIENCES TOOLS & SERVICES - 0.0% | |||
Life Sciences Tools & Services - 0.0% | |||
GeneProt, Inc. Series A (a)(e) | 180,000 | 2 | |
TOTAL PREFERRED STOCKS (Cost $7,698,817) | 3,416,060 | ||
Money Market Funds - 23.3% | |||
Fidelity Cash Central Fund, 5.35% (b) | 2,162,861 | 2,162,861 | |
Fidelity Securities Lending Cash Central Fund, 5.34% (b)(c) | 316,948,825 | 316,948,825 | |
TOTAL MONEY MARKET FUNDS (Cost $319,111,686) | 319,111,686 | ||
TOTAL INVESTMENT PORTFOLIO - 123.2% (Cost $1,640,404,017) | 1,687,309,762 |
NET OTHER ASSETS - (23.2)% | (318,000,331) | ||
NET ASSETS - 100% | $ 1,369,309,431 | ||
Legend |
(a) Non-income producing |
(b) Affiliated fund that is available only to investment companies and other accounts managed by Fidelity Investments. The rate quoted is the annualized seven-day yield of the fund at period end. A complete unaudited listing of the fund's holdings as of its most recent quarter end is available upon request. |
(c) Investment made with cash collateral received from securities on loan. |
(d) Security or a portion of the security is on loan at period end. |
(e) Restricted securities - Investment in securities not registered under the Securities Act of 1933 (excluding 144A issues). At the end of the period, the value of restricted securities (excluding 144A issues) amounted to $3,416,060 or 0.2% of net assets. |
Additional information on each holding is as follows: |
Security | Acquisition Date | Acquisition Cost |
GeneProt, Inc. Series A | 7/7/00 | $ 974,679 |
Xenon Pharmaceuticals, Inc. Series E | 3/23/01 | $ 6,724,138 |
Affiliated Central Funds |
Information regarding fiscal year to date income earned by the Fund from investments in Fidelity Central Funds is as follows: |
Fund | Income earned |
Fidelity Cash Central Fund | $ 301,751 |
Fidelity Securities Lending Cash Central Fund | 2,288,231 |
Total | $ 2,589,982 |
Income Tax Information |
At February 28, 2007, the fund had a capital loss carryforward of approximately $382,410,343 all of which will expire on February 28, 2011. |
See accompanying notes which are an integral part of the financial statements.
Annual Report
Select Biotechnology Portfolio
Financial Statements
Statement of Assets and Liabilities
February 28, 2007 | ||
Assets | ||
Investment in securities, at value (including securities loaned of $309,178,823) - See accompanying schedule: Unaffiliated issuers (cost $1,321,292,331) | $ 1,368,198,076 | |
Fidelity Central Funds (cost $319,111,686) | 319,111,686 | |
Total Investments (cost $1,640,404,017) | $ 1,687,309,762 | |
Cash | 769,041 | |
Receivable for investments sold | 9,488,060 | |
Receivable for fund shares sold | 870,228 | |
Distributions receivable from Fidelity Central Funds | 14,075 | |
Prepaid expenses | 6,253 | |
Other receivables | 171,860 | |
Total assets | 1,698,629,279 | |
Liabilities | ||
Payable for investments purchased | $ 3,720,743 | |
Payable for fund shares redeemed | 7,453,599 | |
Accrued management fee | 679,760 | |
Other affiliated payables | 390,953 | |
Other payables and accrued expenses | 125,968 | |
Collateral on securities loaned, at value | 316,948,825 | |
Total liabilities | 329,319,848 | |
Net Assets | $ 1,369,309,431 | |
Net Assets consist of: | ||
Paid in capital | $ 1,715,524,470 | |
Accumulated net investment loss | (3,129) | |
Accumulated undistributed net realized gain (loss) on investments and foreign currency transactions | (393,117,655) | |
Net unrealized appreciation (depreciation) on investments | 46,905,745 | |
Net Assets, for 21,433,694 shares outstanding | $ 1,369,309,431 | |
Net Asset Value, offering price and redemption price per share ($1,369,309,431 ÷ 21,433,694 shares) | $ 63.89 | |
Statement of Operations
Year ended February 28, 2007 | ||
Investment Income | ||
Dividends | $ 109,407 | |
Interest | 6,819 | |
Income from Fidelity Central Funds (including $2,288,231 from security lending) | 2,589,982 | |
Total income | 2,706,208 | |
Expenses | ||
Management fee | $ 8,731,488 | |
Transfer agent fees | 4,695,005 | |
Accounting and security lending fees | 614,169 | |
Custodian fees and expenses | 68,539 | |
Independent trustees' compensation | 5,506 | |
Registration fees | 67,688 | |
Audit | 41,599 | |
Legal | 28,861 | |
Interest | 16,656 | |
Miscellaneous | 108,173 | |
Total expenses before reductions | 14,377,684 | |
Expense reductions | (70,790) | 14,306,894 |
Net investment income (loss) | (11,600,686) | |
Realized and Unrealized Gain (Loss) Net realized gain (loss) on: | ||
Investment securities: | ||
Unaffiliated issuers | 271,577,157 | |
Foreign currency transactions | (6,552) | |
Total net realized gain (loss) | 271,570,605 | |
Change in net unrealized appreciation (depreciation) on: Investment securities | (381,729,985) | |
Assets and liabilities in foreign currencies | 4,275 | |
Total change in net unrealized appreciation (depreciation) | (381,725,710) | |
Net gain (loss) | (110,155,105) | |
Net increase (decrease) in net assets resulting from operations | $ (121,755,791) | |
See accompanying notes which are an integral part of the financial statements.
Annual Report
Select Biotechnology Portfolio
Financial Statements - continued
Statement of Changes in Net Assets
Year ended | Year ended | |
Increase (Decrease) in Net Assets | ||
Operations | ||
Net investment income (loss) | $ (11,600,686) | $ (13,520,627) |
Net realized gain (loss) | 271,570,605 | 158,681,966 |
Change in net unrealized appreciation (depreciation) | (381,725,710) | 384,296,736 |
Net increase (decrease) in net assets resulting from operations | (121,755,791) | 529,458,075 |
Share transactions | 337,912,705 | 414,412,377 |
Cost of shares redeemed | (658,547,986) | (619,998,822) |
Net increase (decrease) in net assets resulting from share transactions | (320,635,281) | (205,586,445) |
Redemption fees | 208,171 | 220,761 |
Total increase (decrease) in net assets | (442,182,901) | 324,092,391 |
Net Assets | ||
Beginning of period | 1,811,492,332 | 1,487,399,941 |
End of period (including accumulated net investment loss of $3,129 and accumulated net investment loss of $3,835, respectively) | $ 1,369,309,431 | $ 1,811,492,332 |
Other Information Shares | ||
Sold | 5,248,435 | 7,153,448 |
Redeemed | (10,431,851) | (10,864,160) |
Net increase (decrease) | (5,183,416) | (3,710,712) |
Financial Highlights
Years ended February 28, | 2007 | 2006 | 2005 | 2004 G | 2003 |
Selected Per-Share Data | |||||
Net asset value, beginning of period | $ 68.06 | $ 49.04 | $ 55.39 | $ 38.42 | $ 53.48 |
Income from Investment Operations | |||||
Net investment income (loss) C | (.47) | (.48) | (.52) | (.43) | (.36) |
Net realized and unrealized gain (loss) | (3.71) | 19.49 | (5.84) | 17.39 | (14.71) |
Total from investment operations | (4.18) | 19.01 | (6.36) | 16.96 | (15.07) |
Redemption fees added to paid in capital C | .01 | .01 | .01 | .01 | .01 |
Net asset value, end of period | $ 63.89 | $ 68.06 | $ 49.04 | $ 55.39 | $ 38.42 |
Total Return A, B | (6.13)% | 38.78% | (11.46)% | 44.17% | (28.16)% |
Ratios to Average Net Assets D, F | |||||
Expenses before reductions | .93% | .97% | .99% | 1.17% | 1.29% |
Expenses net of fee waivers, if any | .93% | .97% | .99% | 1.17% | 1.29% |
Expenses net of all reductions | .92% | .93% | .98% | 1.15% | 1.24% |
Net investment income (loss) | (.75) % | (.83)% | (.94)% | (.88)% | (.87)% |
Supplemental Data | |||||
Net assets, end of period (000 omitted) | $ 1,369,309 | $ 1,811,492 | $ 1,487,400 | $ 1,948,574 | $ 1,484,303 |
Portfolio turnover rate E | 70% | 63% | 19% | 50% | 73% |
A Total returns would have been lower had certain expenses not been reduced during the periods shown. B Total returns do not include the effect of the former sales charges. C Calculated based on average shares outstanding during the period. D Fees and expenses of the underlying Fidelity Central Funds are not included in the Fund's expense ratio. The Fund indirectly bears its proportionate share of the expenses of any underlying Fidelity Central Funds. E Amount does not include the portfolio activity of any underlying Fidelity Central Funds. F Expense ratios reflect operating expenses of the Fund. Expenses before reductions do not reflect amounts reimbursed by the investment adviser or reductions from brokerage service arrangements or other expense offset arrangements and do not represent the amount paid by the Fund during periods when reimbursements or reductions occur. Expenses net of fee waivers reflect expenses after reimbursement by the investment adviser but prior to reductions from brokerage service arrangements or other expense offset arrangements. Expenses net of all reductions represent the net expenses paid by the Fund. G For the year ended February 29. |
See accompanying notes which are an integral part of the financial statements.
Annual Report
Performance
Average annual total return reflects the change in the value of an investment, assuming reinvestment of the fund's dividend income and capital gains (the profits earned upon the sale of securities that have grown in value) and assuming a constant rate of performance each year. The $10,000 table and the fund's returns do not reflect the deduction of taxes that a shareholder would pay on fund distributions or the redemption of fund shares. During periods of reimbursement by Fidelity a fund's total returns will be greater than it would be had the reimbursement not occurred. How a fund did yesterday is no guarantee of how it will do tomorrow.
Average Annual Total Returns
Periods ended February 28, 2007 | Past 1 | Past 5 | Past 10 |
Select Health Care Portfolio | 4.13% | 6.12% | 9.59% |
$10,000 Over 10 Years
Let's say hypothetically that $10,000 was invested in Select Health Care Portfolio on February 28, 1997. The chart shows how the value of your investment would have changed, and also shows how the S&P 500 Index performed over the same period.
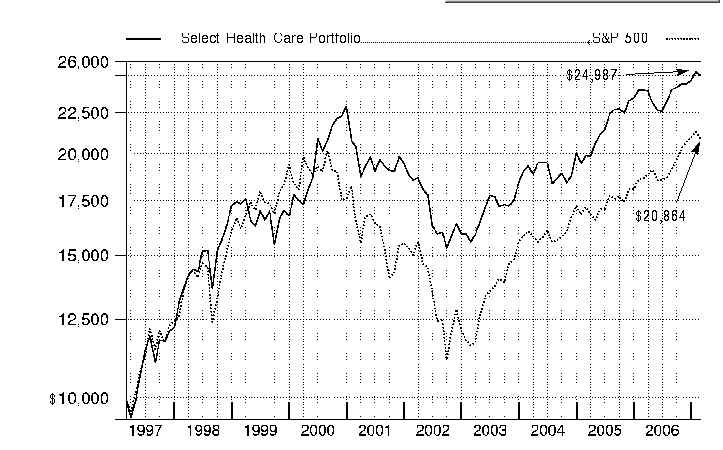
Annual Report
Select Health Care Portfolio
Management's Discussion of Fund Performance
Comments from Matthew Sabel, Portfolio Manager of Fidelity® Select Health Care Portfolio
A rosy year for stocks wilted just prior to the end of the 12-month period ending February 28, 2007. On the day prior to the period's close, the Dow Jones Industrial AverageSM plunged 416 points and the Standard & Poor's 500SM Index lost roughly 3.5% of its value, plummeting nearly 50 points and marking the benchmark's worst single-day performance since the day the market reopened after the 9/11 terrorist attacks. Though investors were obviously rattled by the development, it was only the 22nd-biggest decline for the S&P 500® in 20 years, and it could not overshadow how well stocks performed for the 12 months overall. For much of the past year, investors grew confident that the economy would not fall into a recession, and they bid up most broad-based stock indexes for six consecutive months from August through January. Overall for the year ending February 28, 2007, the S&P 500 was up 11.97%, the Dow advanced 14.24%, the small-cap Russell 2000® Index gained 9.87% and the NASDAQ Composite® Index rose 6.66%.
For the 12 months ending February 28, 2007, the fund returned 4.13%, underperforming the 5.03% gain of the Morgan Stanley Capital InternationalSM (MSCI®) US Investable Market Health Care Index and the 4.67% advance of a blended index specific to this fund. This blended index is a combination of the Goldman Sachs® Health Care Index, which the fund was compared with through September, and the new MSCI benchmark mentioned above, which the fund was compared with during the period's final five months1. During the same 12-month period, the fund lagged the S&P 500. The fund modestly underperformed the Goldman Sachs index during the first seven months due to unfavorable security selection in and an underweighting of pharmaceutical stocks, as well as less-successful stock selection in biotechnology. Stronger security selection in and an overweighting of health care facilities helped, as did overweighting personal products. Detractors included biotech firm Neurocrine Biosciences, as well as underweighting pharmaceutical companies Johnson & Johnson, Bristol-Myers Squibb and Abbott Laboratories. Contributors included an overweighting in assisted living company Brookdale Senior Living and out-of-benchmark positions in nutritional products supplier Herbalife and soft-drink manufacturer Hansen Natural. During the last five months of the period, the fund slightly outperformed its new MSCI Health Care index due to solid security selection in and an overweighting of health care services, as well as some good picks in fertilizers and agricultural chemicals, an area not represented in the benchmark. Performance was held back by less-favorable stock selection in and an underweighting of health care equipment, as well as less-successful security selection in pharmaceuticals. Contributors during this time frame included an underweighting in pharmaceutical firm Eli Lilly, New River Pharmaceuticals, timely ownership of health care services provider Express Scripts and an underweighting in biotech firm Amgen. Underweighting Abbott Laboratories, an out-of-benchmark holding in Herbalife, and not owning index component and health care equipment manufacturer Zimmer Holdings detracted from relative performance. Some of the stocks mentioned here were not held at period end.
1 The fund's blended index is a customized index developed by Fidelity for the limited purpose of discussing the fund's performance for the 12-month period ending February 28, 2007. From March 1, 2006, through September 30, 2006, the fund compared its performance to the Goldman Sachs Health Care Index, which returned 1.62% during that period. On October 1, 2006, the fund began comparing its performance to a different index, the MSCI US Investable Market Health Care Index, which returned 3.00% from October 1, 2006, through February 28, 2007. For the 12-month period ending February 28, 2007, the blended index (Goldman Sachs and MSCI) returned 4.67%.
The views expressed above reflect those of the portfolio manager(s) only through the end of the period as stated on the cover of this report and do not necessarily represent the views of Fidelity or any other person in the Fidelity organization. Any such views are subject to change at any time based upon market or other conditions and Fidelity disclaims any responsibility to update such views. These views may not be relied on as investment advice and, because investment decisions for a Fidelity fund are based on numerous factors, may not be relied on as an indication of trading intent on behalf of any Fidelity fund.
Annual Report
Select Health Care Portfolio
Investment Changes
Top Ten Stocks as of February 28, 2007 | ||
% of fund's | % of fund's net assets | |
Johnson & Johnson | 9.1 | 7.8 |
Pfizer, Inc. | 7.8 | 9.2 |
Merck & Co., Inc. | 6.5 | 5.1 |
UnitedHealth Group, Inc. | 5.6 | 4.9 |
Allergan, Inc. | 3.2 | 2.8 |
Amgen, Inc. | 3.2 | 4.6 |
Wyeth | 3.0 | 3.9 |
Brookdale Senior Living, Inc. | 2.2 | 1.7 |
McKesson Corp. | 2.2 | 1.0 |
Gilead Sciences, Inc. | 2.1 | 1.0 |
44.9 | ||
Top Industries (% of fund's net assets) | |||
As of February 28, 2007 | |||
| Pharmaceuticals | 36.0% | |
| Health Care Providers & Services | 26.4% | |
| Biotechnology | 12.7% | |
| Health Care Equipment & Supplies | 11.0% | |
| Life Sciences Tools & Services | 3.0% | |
| All Others* | 10.9% | |
As of August 31, 2006 | |||
| Pharmaceuticals | 39.4% | |
| Health Care Providers & Services | 23.1% | |
| Biotechnology | 15.1% | |
| Health Care Equipment & Supplies | 14.2% | |
| Life Sciences Tools & Services | 2.1% | |
| All Others* | 6.1% | |
* Includes short-term investments and net other assets. |
Annual Report
Select Health Care Portfolio
Investments February 28, 2007
Showing Percentage of Net Assets
Common Stocks - 99.1% | |||
Shares | Value | ||
BIOTECHNOLOGY - 12.7% | |||
Biotechnology - 12.7% | |||
3SBio, Inc. ADR | 422,900 | $ 5,988,264 | |
Acadia Pharmaceuticals, Inc. (a) | 100,000 | 696,000 | |
Alexion Pharmaceuticals, Inc. (a) | 9,064 | 334,280 | |
Alnylam Pharmaceuticals, Inc. (a) | 289,500 | 5,442,600 | |
Altus Pharmaceuticals, Inc. | 78,500 | 1,281,905 | |
Amgen, Inc. (a) | 1,022,004 | 65,673,977 | |
Amylin Pharmaceuticals, Inc. (a) | 187,900 | 7,311,189 | |
Arena Pharmaceuticals, Inc. (a) | 77,600 | 981,640 | |
BioCryst Pharmaceuticals, Inc. (a)(d) | 170,000 | 1,718,700 | |
Biogen Idec, Inc. (a) | 159,500 | 7,207,805 | |
BioMarin Pharmaceutical, Inc. (a) | 88,200 | 1,502,046 | |
Celgene Corp. (a) | 430,900 | 22,966,970 | |
Cephalon, Inc. (a) | 30,000 | 2,132,400 | |
Cleveland Biolabs, Inc. (d) | 36,000 | 393,480 | |
CSL Ltd. | 91,800 | 5,616,720 | |
CV Therapeutics, Inc. (a) | 82,500 | 1,053,525 | |
CytRx Corp. (a) | 289,300 | 1,212,167 | |
deCODE genetics, Inc. (a)(d) | 520,000 | 2,028,000 | |
Dyadic International, Inc. (a)(d) | 175,000 | 1,071,000 | |
Genentech, Inc. (a) | 141,300 | 11,921,481 | |
Genmab AS (a) | 17,200 | 1,020,264 | |
Genomic Health, Inc. (a) | 21,100 | 396,469 | |
Gilead Sciences, Inc. (a) | 609,300 | 43,601,508 | |
GTx, Inc. (a) | 123,400 | 2,693,822 | |
Human Genome Sciences, Inc. (a) | 162,000 | 1,782,000 | |
Isis Pharmaceuticals, Inc. (a) | 347,700 | 3,171,024 | |
MannKind Corp. (a) | 43,000 | 684,130 | |
Martek Biosciences (a) | 2,229 | 50,420 | |
Medarex, Inc. (a) | 321,000 | 4,391,280 | |
Memory Pharmaceuticals Corp. (a) | 472,000 | 1,373,520 | |
Molecular Insight Pharmaceuticals, Inc. | 175,700 | 2,315,726 | |
Omrix Biopharmaceuticals, Inc. | 77,695 | 2,781,481 | |
ONYX Pharmaceuticals, Inc. (a) | 41,600 | 1,092,000 | |
Orchid Cellmark, Inc. (a) | 2,500 | 10,250 | |
OSI Pharmaceuticals, Inc. (a)(d) | 930,264 | 32,187,134 | |
PDL BioPharma, Inc. (a) | 120,900 | 2,307,981 | |
Regeneron Pharmaceuticals, Inc. (a) | 12,800 | 253,952 | |
Tercica, Inc. (a)(d) | 238,000 | 1,237,600 | |
Theravance, Inc. (a) | 123,400 | 3,979,650 | |
Transition Therapeutics, Inc. (a) | 785,500 | 1,437,279 | |
Vanda Pharmaceuticals, Inc. | 205,009 | 4,932,517 | |
Vertex Pharmaceuticals, Inc. (a) | 144,900 | 4,446,981 | |
262,681,137 | |||
CHEMICALS - 2.8% | |||
Diversified Chemicals - 0.6% | |||
Bayer AG sponsored ADR | 228,400 | 13,130,716 | |
Fertilizers & Agricultural Chemicals - 2.0% | |||
Agrium, Inc. | 55,200 | 2,118,702 | |
Fertilizantes Fosfatados SA (PN) | 100,200 | 1,857,043 | |
Monsanto Co. | 479,100 | 25,243,779 | |
Shares | Value | ||
Potash Corp. of Saskatchewan, Inc. | 51,600 | $ 8,142,996 | |
Syngenta AG sponsored ADR | 114,800 | 4,040,960 | |
41,403,480 | |||
Specialty Chemicals - 0.2% | |||
Ecolab, Inc. | 47,500 | 2,009,250 | |
Novozymes AS Series B | 12,000 | 1,035,750 | |
Sigma Aldrich Corp. | 30,000 | 1,230,000 | |
4,275,000 | |||
TOTAL CHEMICALS | 58,809,196 | ||
COMMERCIAL SERVICES & SUPPLIES - 0.3% | |||
Diversified Commercial & Professional Services - 0.3% | |||
FTI Consulting, Inc. (a) | 155,000 | 5,203,350 | |
Environmental & Facility Services - 0.0% | |||
Clean Harbors, Inc. (a) | 4,670 | 235,882 | |
TOTAL COMMERCIAL SERVICES & SUPPLIES | 5,439,232 | ||
DIVERSIFIED CONSUMER SERVICES - 0.1% | |||
Specialized Consumer Services - 0.1% | |||
Service Corp. International | 178,700 | 2,096,151 | |
DIVERSIFIED FINANCIAL SERVICES - 1.0% | |||
Specialized Finance - 1.0% | |||
Fortress Investment Group LLC | 710,700 | 21,463,140 | |
FOOD PRODUCTS - 2.2% | |||
Agricultural Products - 0.4% | |||
BioMar Holding AS | 37,960 | 1,752,819 | |
Nutreco Holding NV | 94,200 | 6,544,627 | |
8,297,446 | |||
Packaged Foods & Meats - 1.8% | |||
Cermaq ASA | 360,000 | 6,749,597 | |
China Huiyuan Juice Group Ltd. | 1,188,000 | 1,547,903 | |
China Mengniu Dairy Co. Ltd. | 722,000 | 1,982,184 | |
Green Mountain Coffee Roasters, Inc. (a) | 1,100 | 61,699 | |
Groupe Danone | 50,900 | 8,064,835 | |
Groupe Danone sponsored ADR (d) | 40,000 | 1,360,400 | |
Koninklijke Numico NV | 123,000 | 6,341,599 | |
Marine Harvest ASA (a) | 5,920,000 | 7,238,698 | |
Synear Food Holdings Ltd. | 1,650,000 | 2,266,113 | |
Want Want Holdings Ltd. | 507,000 | 780,780 | |
36,393,808 | |||
TOTAL FOOD PRODUCTS | 44,691,254 | ||
HEALTH CARE EQUIPMENT & SUPPLIES - 11.0% | |||
Health Care Equipment - 9.2% | |||
Accuray, Inc. | 3,400 | 86,632 | |
Advanced Medical Optics, Inc. (a) | 103,800 | 4,000,452 | |
American Medical Systems Holdings, Inc. (a) | 112,400 | 2,286,216 | |
ArthroCare Corp. (a) | 161,800 | 5,881,430 | |
Common Stocks - continued | |||
Shares | Value | ||
HEALTH CARE EQUIPMENT & SUPPLIES - CONTINUED | |||
Health Care Equipment - continued | |||
Aspect Medical Systems, Inc. (a) | 286,800 | $ 4,631,820 | |
Baxter International, Inc. | 782,900 | 39,152,829 | |
Becton, Dickinson & Co. | 417,500 | 31,725,825 | |
BioLase Technology, Inc. (a) | 107,900 | 910,676 | |
C.R. Bard, Inc. | 482,400 | 38,495,520 | |
China Medical Technologies, Inc. sponsored ADR (a)(d) | 128,400 | 3,212,568 | |
Cytyc Corp. (a) | 70,000 | 2,121,000 | |
Electro-Optical Sciences, Inc. (a) | 37,500 | 210,000 | |
Foxhollow Technologies, Inc. (a)(d) | 21,092 | 471,617 | |
I-Flow Corp. (a) | 41,000 | 590,810 | |
Intuitive Surgical, Inc. (a) | 37,300 | 4,144,030 | |
Invacare Corp. | 131,600 | 2,445,128 | |
IRIS International, Inc. (a) | 87,200 | 988,848 | |
Kyphon, Inc. (a) | 202,000 | 9,112,220 | |
Mindray Medical International Ltd. sponsored ADR | 386,300 | 9,943,362 | |
Respironics, Inc. (a) | 207,500 | 8,501,275 | |
Sirona Dental Systems, Inc. | 101,300 | 3,770,386 | |
St. Jude Medical, Inc. (a) | 237,700 | 9,424,805 | |
The Spectranetics Corp. (a) | 195,000 | 2,049,450 | |
Thermogenesis Corp. (a) | 240,000 | 736,800 | |
Varian Medical Systems, Inc. (a) | 141,100 | 6,483,545 | |
191,377,244 | |||
Health Care Supplies - 1.8% | |||
Align Technology, Inc. (a) | 152,900 | 2,510,618 | |
Cooper Companies, Inc. | 57,800 | 2,652,442 | |
DJO, Inc. (a) | 134,019 | 5,250,864 | |
Gen-Probe, Inc. (a) | 59,400 | 2,852,388 | |
Haemonetics Corp. (a) | 22,400 | 1,008,000 | |
Immucor, Inc. (a) | 73,492 | 2,185,652 | |
Inverness Medical Innovations, Inc. (a) | 285,565 | 12,050,843 | |
Inverness Medical Innovations, Inc. (a)(e) | 42,205 | 1,781,051 | |
LifeCell Corp. (a)(d) | 88,500 | 2,112,495 | |
Merit Medical Systems, Inc. (a) | 194,873 | 2,741,863 | |
Shandong Weigao Group Medical Polymer Co. Ltd. | 788,000 | 1,149,769 | |
36,295,985 | |||
TOTAL HEALTH CARE EQUIPMENT & SUPPLIES | 227,673,229 | ||
HEALTH CARE PROVIDERS & SERVICES - 26.4% | |||
Health Care Distributors & Services - 4.4% | |||
Cardinal Health, Inc. | 348,800 | 24,447,392 | |
Henry Schein, Inc. (a) | 71,100 | 3,709,287 | |
McKesson Corp. | 812,600 | 45,310,576 | |
Shares | Value | ||
MWI Veterinary Supply, Inc. (a) | 183,450 | $ 5,692,454 | |
Profarma Distribuidora de Produtos Farmaceuticos SA | 800,000 | 12,804,527 | |
91,964,236 | |||
Health Care Facilities - 5.4% | |||
Acibadem Saglik Hizmetleri AS | 533,340 | 5,246,586 | |
Apollo Hospitals Enterprise Ltd. | 334,171 | 3,768,803 | |
Brookdale Senior Living, Inc. | 966,100 | 45,609,581 | |
Bumrungrad Hospital PCL (For. Reg.) | 5,478,400 | 5,957,408 | |
Capital Senior Living Corp. (a) | 493,100 | 5,315,618 | |
Community Health Systems, Inc. (a) | 445,100 | 16,579,975 | |
Emeritus Corp. (a) | 108,000 | 3,018,600 | |
Five Star Quality Care, Inc. (a)(d) | 195,000 | 2,228,850 | |
Genesis HealthCare Corp. (a) | 34,100 | 2,150,005 | |
Manor Care, Inc. | 62,900 | 3,370,182 | |
Sun Healthcare Group, Inc. (a) | 542,100 | 7,128,615 | |
U.S. Physical Therapy, Inc. (a) | 63,404 | 856,588 | |
United Surgical Partners International, Inc. (a) | 129,900 | 3,967,146 | |
VCA Antech, Inc. (a) | 185,900 | 6,824,389 | |
112,022,346 | |||
Health Care Services - 7.7% | |||
Caremark Rx, Inc. | 421,800 | 25,978,662 | |
Cross Country Healthcare, Inc. (a) | 31,600 | 601,980 | |
Diagnosticos da America SA (a) | 1,530,800 | 33,279,830 | |
Emergency Medical Services Corp. Class A (a) | 100 | 2,643 | |
Express Scripts, Inc. (a) | 510,648 | 38,507,966 | |
HAPC, Inc. unit | 627,500 | 3,846,575 | |
Health Grades, Inc. (a) | 1,121,906 | 6,237,797 | |
HMS Holdings Corp. (a) | 206,900 | 4,096,620 | |
Medco Health Solutions, Inc. (a) | 411,500 | 27,821,515 | |
Nighthawk Radiology Holdings, Inc. | 355,548 | 7,388,287 | |
Omnicare, Inc. | 227,800 | 9,462,812 | |
Rural/Metro Corp. (a) | 394,049 | 2,982,951 | |
160,207,638 | |||
Managed Health Care - 8.9% | |||
Health Net, Inc. (a) | 247,800 | 13,249,866 | |
Healthspring, Inc. | 58,600 | 1,238,218 | |
Humana, Inc. (a) | 373,700 | 22,362,208 | |
Sierra Health Services, Inc. (a) | 187,900 | 6,982,364 | |
UnitedHealth Group, Inc. | 2,209,820 | 115,352,604 | |
WellPoint, Inc. (a) | 307,400 | 24,404,486 | |
183,589,746 | |||
TOTAL HEALTH CARE PROVIDERS & SERVICES | 547,783,966 | ||
HEALTH CARE TECHNOLOGY - 1.2% | |||
Health Care Technology - 1.2% | |||
Cerner Corp. (a) | 236,700 | 12,334,437 | |
Eclipsys Corp. (a) | 252,800 | 5,288,576 | |
Systems Xcellence, Inc. (a) | 17,875 | 349,690 | |
Common Stocks - continued | |||
Shares | Value | ||
HEALTH CARE TECHNOLOGY - CONTINUED | |||
Health Care Technology - continued | |||
Vital Images, Inc. (a) | 12,390 | $ 425,844 | |
WebMD Health Corp. Class A (a) | 121,289 | 6,524,135 | |
24,922,682 | |||
HOTELS, RESTAURANTS & LEISURE - 0.3% | |||
Leisure Facilities - 0.3% | |||
Life Time Fitness, Inc. (a) | 128,800 | 6,156,640 | |
INDUSTRIAL CONGLOMERATES - 0.0% | |||
Industrial Conglomerates - 0.0% | |||
Tyco International Ltd. | 26,200 | 807,746 | |
INSURANCE - 0.8% | |||
Insurance Brokers - 0.0% | |||
eHealth, Inc. | 1,900 | 47,538 | |
Life & Health Insurance - 0.8% | |||
China Life Insurance Co. Ltd. ADR (d) | 82,900 | 3,283,669 | |
Prudential Financial, Inc. | 65,100 | 5,920,194 | |
Universal American Financial Corp. (a) | 410,967 | 7,886,457 | |
17,090,320 | |||
TOTAL INSURANCE | 17,137,858 | ||
LIFE SCIENCES TOOLS & SERVICES - 3.0% | |||
Life Sciences Tools & Services - 3.0% | |||
Advanced Magnetics, Inc. (a) | 104,200 | 6,144,674 | |
Applera Corp.: | |||
- Applied Biosystems Group | 94,300 | 2,911,984 | |
- Celera Genomics Group (a) | 71,500 | 994,565 | |
Bio-Rad Laboratories, Inc. Class A (a) | 20,900 | 1,482,228 | |
Charles River Laboratories International, Inc. (a) | 65,400 | 2,998,590 | |
Covance, Inc. (a) | 71,900 | 4,433,354 | |
Exelixis, Inc. (a) | 357,400 | 3,599,018 | |
Illumina, Inc. (a) | 113,655 | 3,817,671 | |
Millipore Corp. (a) | 158,330 | 11,323,762 | |
Pharmaceutical Product Development, Inc. | 119,500 | 3,798,905 | |
PRA International (a) | 72,600 | 1,456,356 | |
QIAGEN NV (a) | 228,900 | 3,751,671 | |
Sequenom, Inc. (a) | 125,000 | 523,750 | |
Techne Corp. (a) | 10,800 | 608,256 | |
Thermo Fisher Scientific, Inc. (a) | 237,500 | 10,751,625 | |
Ventana Medical Systems, Inc. (a) | 103,900 | 4,181,975 | |
62,778,384 | |||
MACHINERY - 0.1% | |||
Industrial Machinery - 0.1% | |||
Watts Water Technologies, Inc. Class A | 60,200 | 2,267,132 | |
Shares | Value | ||
MULTI-UTILITIES - 0.2% | |||
Multi-Utilities - 0.2% | |||
Veolia Environnement sponsored ADR | 59,800 | $ 4,215,900 | |
PERSONAL PRODUCTS - 0.6% | |||
Personal Products - 0.6% | |||
Hengan International Group Co. Ltd. | 4,398,000 | 12,158,734 | |
PHARMACEUTICALS - 36.0% | |||
Pharmaceuticals - 36.0% | |||
Abbott Laboratories | 195,600 | 10,683,672 | |
Adams Respiratory Therapeutics, Inc. (a)(d) | 484,805 | 17,608,118 | |
Adolor Corp. (a)(d) | 611,000 | 4,081,480 | |
Allergan, Inc. | 588,300 | 65,718,993 | |
Atherogenics, Inc. (a)(d) | 98,981 | 1,081,862 | |
Barr Pharmaceuticals, Inc. (a) | 259,800 | 13,769,400 | |
BioMimetic Therapeutics, Inc. | 115,800 | 1,911,858 | |
Cadence Pharmaceuticals, Inc. | 14,000 | 199,640 | |
Collagenex Pharmaceuticals, Inc. (a) | 143,000 | 1,933,360 | |
Eczacibasi ILAC Sanayi TAS (a) | 250,000 | 1,017,339 | |
Elan Corp. PLC sponsored ADR (a) | 4,400 | 56,936 | |
Endo Pharmaceuticals Holdings, Inc. (a) | 159,200 | 4,968,632 | |
Inspire Pharmaceuticals, Inc. (a) | 567,000 | 3,912,300 | |
Javelin Pharmaceuticals, Inc. (a) | 146,586 | 835,540 | |
Johnson & Johnson | 2,992,184 | 188,657,203 | |
Merck & Co., Inc. | 3,046,800 | 134,546,688 | |
Nastech Pharmaceutical Co., Inc. (a) | 249,500 | 2,884,220 | |
Nexmed, Inc. (a) | 971,000 | 1,262,300 | |
Pfizer, Inc. | 6,487,310 | 161,923,258 | |
Roche Holding AG (participation certificate) | 115,191 | 20,547,712 | |
Schering-Plough Corp. | 1,013,900 | 23,806,372 | |
Shire PLC | 48,900 | 1,037,439 | |
Shire PLC sponsored ADR | 272,100 | 17,542,287 | |
Valeant Pharmaceuticals International | 118,200 | 2,119,326 | |
Wuyi International Pharmaceutical Co. Ltd. | 2,587,000 | 642,359 | |
Wyeth | 1,263,470 | 61,808,952 | |
Xenoport, Inc. (a) | 86,500 | 2,229,970 | |
746,787,216 | |||
SEMICONDUCTORS & SEMICONDUCTOR EQUIPMENT - 0.0% | |||
Semiconductor Equipment - 0.0% | |||
Verigy Ltd. | 7,958 | 186,933 | |
SOFTWARE - 0.4% | |||
Systems Software - 0.4% | |||
Quality Systems, Inc. | 186,500 | 7,633,445 | |
TOTAL COMMON STOCKS (Cost $1,661,940,841) | 2,055,689,975 | ||
Nonconvertible Preferred Stocks - 0.0% | |||
Shares | Value | ||
LIFE SCIENCES TOOLS & SERVICES - 0.0% | |||
Life Sciences Tools & Services - 0.0% | |||
GeneProt, Inc. Series A (a)(e) | 111,000 | $ 1 | |
Money Market Funds - 1.3% | |||
Fidelity Securities Lending Cash Central Fund, 5.34% (b)(c) | 27,189,896 | 27,189,896 | |
TOTAL INVESTMENT PORTFOLIO - 100.4% (Cost $1,689,731,789) | 2,082,879,872 | ||
NET OTHER ASSETS - (0.4)% | (9,096,853) | ||
NET ASSETS - 100% | $ 2,073,783,019 | ||
Legend |
(a) Non-income producing |
(b) Affiliated fund that is available only to investment companies and other accounts managed by Fidelity Investments. The rate quoted is the annualized seven-day yield of the fund at period end. A complete unaudited listing of the fund's holdings as of its most recent quarter end is available upon request. |
(c) Investment made with cash collateral received from securities on loan. |
(d) Security or a portion of the security is on loan at period end. |
(e) Restricted securities - Investment in securities not registered under the Securities Act of 1933 (excluding 144A issues). At the end of the period, the value of restricted securities (excluding 144A issues) amounted to $1,781,052 or 0.1% of net assets. |
Additional information on each holding is as follows: |
Security | Acquisition Date | Acquisition Cost |
GeneProt, Inc. Series A | 7/7/00 | $ 601,052 |
Inverness Medical Innovations, Inc. | 2/8/06 | $ 1,030,224 |
Affiliated Central Funds |
Information regarding fiscal year to date income earned by the Fund from investments in Fidelity Central Funds is as follows: |
Fund | Income earned |
Fidelity Cash Central Fund | $ 1,179,414 |
Fidelity Securities Lending Cash Central Fund | 561,845 |
Total | $ 1,741,259 |
Other information |
Distribution of investments by country of issue, as a percentage of total net assets, is as follows: |
United States of America | 88.9% |
Brazil | 2.3% |
Switzerland | 1.2% |
Cayman Islands | 1.2% |
Others (individually less than 1%) | 6.4% |
100.0% |
See accompanying notes which are an integral part of the financial statements.
Annual Report
Select Health Care Portfolio
Financial Statements
Statement of Assets and Liabilities
February 28, 2007 | ||
Assets | ||
Investment in securities, at value (including securities loaned of $26,248,230) - See accompanying schedule: Unaffiliated issuers (cost $1,662,541,893) | $ 2,055,689,976 | |
Fidelity Central Funds (cost $27,189,896) | 27,189,896 | |
Total Investments (cost $1,689,731,789) | $ 2,082,879,872 | |
Receivable for investments sold | 41,683,431 | |
Receivable for fund shares sold | 1,284,158 | |
Dividends receivable | 3,530,120 | |
Distributions receivable from Fidelity Central Funds | 105,876 | |
Prepaid expenses | 8,695 | |
Other receivables | 84,496 | |
Total assets | 2,129,576,648 | |
Liabilities | ||
Payable to custodian bank | $ 897,696 | |
Payable for investments purchased | 22,221,846 | |
Payable for fund shares redeemed | 3,746,843 | |
Accrued management fee | 1,000,168 | |
Other affiliated payables | 545,532 | |
Other payables and accrued expenses | 191,648 | |
Collateral on securities loaned, at value | 27,189,896 | |
Total liabilities | 55,793,629 | |
Net Assets | $ 2,073,783,019 | |
Net Assets consist of: | ||
Paid in capital | $ 1,600,081,425 | |
Undistributed net investment income | 3,189,023 | |
Accumulated undistributed net realized gain (loss) on investments and foreign currency transactions | 77,426,552 | |
Net unrealized appreciation (depreciation) on investments and assets and liabilities in foreign currencies | 393,086,019 | |
Net Assets, for 16,357,792 shares outstanding | $ 2,073,783,019 | |
Net Asset Value, offering price and redemption price per share ($2,073,783,019 ÷ 16,357,792 shares) | $ 126.78 | |
Statement of Operations
Year ended February 28, 2007 | ||
Investment Income | ||
Dividends | $ 23,859,814 | |
Interest | 26,412 | |
Income from Fidelity Central Funds (including $561,845 from security lending) | 1,741,259 | |
Total income | 25,627,485 | |
Expenses | ||
Management fee | $ 12,199,482 | |
Transfer agent fees | 5,696,777 | |
Accounting and security lending fees | 759,280 | |
Custodian fees and expenses | 136,620 | |
Independent trustees' compensation | 7,874 | |
Depreciation in deferred trustee compensation account | (710) | |
Registration fees | 47,233 | |
Audit | 44,285 | |
Legal | 38,306 | |
Interest | 14,030 | |
Miscellaneous | 113,138 | |
Total expenses before reductions | 19,056,315 | |
Expense reductions | (151,445) | 18,904,870 |
Net investment income (loss) | 6,722,615 | |
Realized and Unrealized Gain (Loss) Net realized gain (loss) on: | ||
Investment securities: | ||
Unaffiliated issuers | 156,959,101 | |
Foreign currency transactions | (193,802) | |
Total net realized gain (loss) | 156,765,299 | |
Change in net unrealized appreciation (depreciation) on: Investment securities (net of increase in deferred foreign taxes of $39,717) | (83,804,632) | |
Assets and liabilities in foreign currencies | (13,137) | |
Total change in net unrealized appreciation (depreciation) | (83,817,769) | |
Net gain (loss) | 72,947,530 | |
Net increase (decrease) in net assets resulting from operations | $ 79,670,145 | |
See accompanying notes which are an integral part of the financial statements.
Annual Report
Statement of Changes in Net Assets
Year ended | Year ended | |
Increase (Decrease) in Net Assets | ||
Operations | ||
Net investment income (loss) | $ 6,722,615 | $ (2,671,642) |
Net realized gain (loss) | 156,765,299 | 467,925,520 |
Change in net unrealized appreciation (depreciation) | (83,817,769) | (62,069,040) |
Net increase (decrease) in net assets resulting from operations | 79,670,145 | 403,184,838 |
Distributions to shareholders from net investment income | (3,281,740) | (592,623) |
Distributions to shareholders from net realized gain | (284,464,403) | (214,985,606) |
Total distributions | (287,746,143) | (215,578,229) |
Share transactions | 284,188,477 | 714,309,159 |
Reinvestment of distributions | 271,255,684 | 202,655,649 |
Cost of shares redeemed | (653,962,965) | (630,625,737) |
Net increase (decrease) in net assets resulting from share transactions | (98,518,804) | 286,339,071 |
Redemption fees | 54,584 | 126,010 |
Total increase (decrease) in net assets | (306,540,218) | 474,071,690 |
Net Assets | ||
Beginning of period | 2,380,323,237 | 1,906,251,547 |
End of period (including undistributed net investment income of $3,189,023 and accumulated net investment loss of $58,050, respectively) | $ 2,073,783,019 | $ 2,380,323,237 |
Other Information Shares | ||
Sold | 2,259,157 | 5,197,779 |
Issued in reinvestment of distributions | 2,185,999 | 1,471,110 |
Redeemed | (5,200,459) | (4,557,268) |
Net increase (decrease) | (755,303) | 2,111,621 |
Financial Highlights
Years ended February 28, | 2007 | 2006 | 2005 | 2004 G | 2003 |
Selected Per-Share Data | |||||
Net asset value, beginning of period | $ 139.09 | $ 127.07 | $ 123.36 | $ 99.56 | $ 121.42 |
Income from Investment Operations | |||||
Net investment income (loss) C | .39 | (.17) | .14 | .13 | .23 |
Net realized and unrealized gain (loss) | 4.49 | 25.97 | 3.69 | 23.84 | (19.48) |
Total from investment operations | 4.88 | 25.80 | 3.83 | 23.97 | (19.25) |
Distributions from net investment income | (.20) | (.04) | (.13) | (.18) | (.20) |
Distributions from net realized gain | (16.99) | (13.75) | - | - | (2.42) |
Total distributions | (17.19) | (13.79) | (.13) | (.18) | (2.62) |
Redemption fees added to paid in capital C | - H | .01 | .01 | .01 | .01 |
Net asset value, end of period | $ 126.78 | $ 139.09 | $ 127.07 | $ 123.36 | $ 99.56 |
Total Return A, B | 4.13% | 20.42% | 3.12% | 24.11% | (16.14)% |
Ratios to Average Net Assets D, F | |||||
Expenses before reductions | .88% | .91% | .93% | 1.02% | 1.05% |
Expenses net of fee waivers, if any | .88% | .91% | .93% | 1.02% | 1.05% |
Expenses net of all reductions | .87% | .87% | .92% | .99% | .99% |
Net investment income (loss) | .31% | (.12)% | .11% | .12% | .22% |
Supplemental Data | |||||
Net assets, end of period (000 omitted) | $ 2,073,783 | $ 2,380,323 | $ 1,906,252 | $ 2,035,782 | $ 1,748,459 |
Portfolio turnover rate E | 91% | 120% | 32% | 104% | 139% |
A Total returns would have been lower had certain expenses not been reduced during the periods shown. B Total returns do not include the effect of the former sales charges. C Calculated based on average shares outstanding during the period. D Fees and expenses of the underlying Fidelity Central Funds are not included in the Fund's expense ratio. The Fund indirectly bears its proportionate share of the expenses of any underlying Fidelity Central Funds. E Amount does not include the portfolio activity of any underlying Fidelity Central Funds. F Expense ratios reflect operating expenses of the Fund. Expenses before reductions do not reflect amounts reimbursed by the investment adviser or reductions from brokerage service arrangements or other expense offset arrangements and do not represent the amount paid by the Fund during periods when reimbursements or reductions occur. Expenses net of fee waivers reflect expenses after reimbursement by the investment adviser but prior to reductions from brokerage service arrangements or other expense offset arrangements. Expenses net of all reductions represent the net expenses paid by the Fund. G For the year ended February 29. H Amount represents less than $.01 per share. |
See accompanying notes which are an integral part of the financial statements.
Annual Report
Select Medical Delivery Portfolio
Performance
Average annual total return reflects the change in the value of an investment, assuming reinvestment of the fund's dividend income and capital gains (the profits earned upon the sale of securities that have grown in value) and assuming a constant rate of performance each year. The $10,000 table and the fund's returns do not reflect the deduction of taxes that a shareholder would pay on fund distributions or the redemption of fund shares. During periods of reimbursement by Fidelity a fund's total returns will be greater than it would be had the reimbursement not occurred. How a fund did yesterday is no guarantee of how it will do tomorrow.
Average Annual Total Returns
Periods ended February 28, 2007 | Past 1 | Past 5 | Past 10 |
Select Medical Delivery Portfolio | 2.23% | 17.60% | 10.39% |
$10,000 Over 10 Years
Let's say hypothetically that $10,000 was invested in Select Medical Delivery Portfolio on February 28, 1997. The chart shows how the value of your investment would have changed, and also shows how the S&P 500 Index performed over the same period.
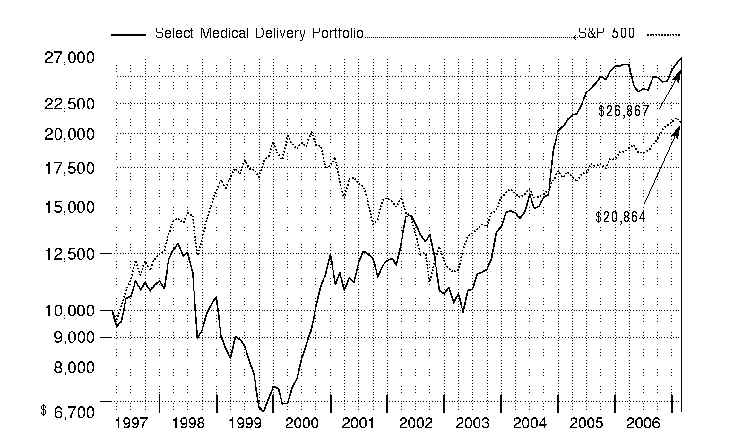
Annual Report
Select Medical Delivery Portfolio
Management's Discussion of Fund Performance
Comments from Matthew Sabel, Portfolio Manager of Fidelity® Select Medical Delivery Portfolio
A rosy year for stocks wilted just prior to the end of the 12-month period ending February 28, 2007. On the day prior to the period's close, the Dow Jones Industrial AverageSM plunged 416 points and the Standard & Poor's 500SM Index lost roughly 3.5% of its value, plummeting nearly 50 points and marking the benchmark's worst single-day performance since the day the market reopened after the 9/11 terrorist attacks. Though investors were obviously rattled by the development, it was only the 22nd-biggest decline for the S&P 500® in 20 years, and it could not overshadow how well stocks performed for the 12 months overall. For much of the past year, investors grew confident that the economy would not fall into a recession, and they bid up most broad-based stock indexes for six consecutive months from August through January. Overall for the year ending February 28, 2007, the S&P 500 was up 11.97%, the Dow advanced 14.24%, the small-cap Russell 2000® Index gained 9.87% and the NASDAQ Composite® Index rose 6.66%.
For the 12 months ending February 28, 2007, the fund returned 2.23%, underperforming the 3.29% gain of the Morgan Stanley Capital InternationalSM (MSCI®) US Investable Market Health Care Providers & Services Index and below the 8.56% advance of a blended index specific to this fund. This blended index is a combination of the Goldman Sachs® Health Care Index, which the fund was compared with through September, and the new MSCI benchmark mentioned above, which the fund was compared with during the period's final five months1. During the same 12-month period, the fund lagged the S&P 500. The main factors behind the fund's underperformance of the Goldman Sachs index during the first seven months were its focus on managed health care stocks - one of the worst performing segments of the index during this period - and, even more so, unfavorable stock selection in and a significant underweighting of the index's large stake in pharmaceuticals - one of the better performing groups during this interval. Underweighting biotechnology helped relative returns, as did strong security selection in health care supplies. Detractors included managed care providers Aetna and UnitedHealth Group, health care services company Omincare and not owning pharmaceutical firm Merck, an index component. Contributors included an overweighting in managed health care firm Humana, not owning health care equipment provider and index component Boston Scientific and underweighting health care equipment firm Medtronic. During the last five months of the period, the fund outperformed its new MSCI index due to positive security and market selection in health care services, as well as some good picks in specialized consumer services - an area not represented in the index. Detractors from relative performance included poor results from out-of-benchmark holdings in biotechnology. Contributions during this time frame came from significant underweightings in managed care company and major benchmark component WellPoint and health care services provider Quest Diagnostics, as well as an overweighting in managed care provider Health Net and timely ownership of pharmacy benefit management company Caremark Rx. Hurting performance was health care services provider Rural/Metro - a stock not included in the benchmark - along with not owning managed care company and benchmark component Cigna. An out-of-index stake in biotech firm OSI Pharmaceuticals also held back the fund's return. Some of the stocks mentioned here were not held at period end.
1 The fund's blended index is a customized index developed by Fidelity for the limited purpose of discussing the fund's performance for the 12-month period ending February 28, 2007. From March 1, 2006, through September 30, 2006, the fund compared its performance to the Goldman Sachs Health Care Index, which returned 1.62% during that period. On October 1, 2006, the fund began comparing its performance to a different index, the MSCI US Investable Market Health Care Providers & Services Index, which returned 6.83% from October 1, 2006, through February 28, 2007. For the 12-month period ending February 28, 2007, the blended index (Goldman Sachs and MSCI) returned 8.56%.
The views expressed above reflect those of the portfolio manager(s) only through the end of the period as stated on the cover of this report and do not necessarily represent the views of Fidelity or any other person in the Fidelity organization. Any such views are subject to change at any time based upon market or other conditions and Fidelity disclaims any responsibility to update such views. These views may not be relied on as investment advice and, because investment decisions for a Fidelity fund are based on numerous factors, may not be relied on as an indication of trading intent on behalf of any Fidelity fund.
Annual Report
Select Medical Delivery Portfolio
Investment Changes
Top Ten Stocks as of February 28, 2007 | ||
% of fund's | % of fund's net assets | |
UnitedHealth Group, Inc. | 22.1 | 7.8 |
McKesson Corp. | 6.6 | 5.1 |
Caremark Rx, Inc. | 6.5 | 3.6 |
Cardinal Health, Inc. | 6.1 | 1.3 |
Medco Health Solutions, Inc. | 5.8 | 5.2 |
Express Scripts, Inc. | 3.9 | 3.8 |
Health Net, Inc. | 3.6 | 4.3 |
Diagnosticos da America SA | 3.6 | 0.8 |
Brookdale Senior Living, Inc. | 3.4 | 2.6 |
Humana, Inc. | 3.1 | 4.0 |
64.7 | ||
Top Industries (% of fund's net assets) | |||
As of February 28, 2007 | |||
| Health Care Providers & Services | 83.7% | |
| Health Care Equipment & Supplies | 4.4% | |
| Biotechnology | 2.5% | |
| Health Care Technology | 1.5% | |
| Insurance | 1.5% | |
| All Others* | 6.4% | |
As of August 31, 2006 | |||
| Health Care Providers & Services | 72.5% | |
| Health Care Equipment & Supplies | 5.3% | |
| Diversified Consumer Services | 3.8% | |
| Pharmaceuticals | 3.3% | |
| Health Care Technology | 3.0% | |
| All Others* | 12.1% | |
* Includes short-term investments and net other assets. |
Annual Report
Select Medical Delivery Portfolio
Investments February 28, 2007
Showing Percentage of Net Assets
Common Stocks - 97.9% | |||
Shares | Value | ||
BIOTECHNOLOGY - 2.5% | |||
Biotechnology - 2.5% | |||
Alnylam Pharmaceuticals, Inc. (a) | 29,300 | $ 550,840 | |
Cepheid, Inc. (a) | 67,600 | 538,772 | |
CV Therapeutics, Inc. (a) | 25,000 | 319,250 | |
deCODE genetics, Inc. (a) | 96,600 | 376,740 | |
Insmed, Inc. (a) | 325,000 | 461,500 | |
MannKind Corp. (a) | 6,300 | 100,233 | |
Memory Pharmaceuticals Corp. (a) | 190,000 | 552,900 | |
OSI Pharmaceuticals, Inc. (a)(e) | 383,100 | 13,255,260 | |
16,155,495 | |||
COMMERCIAL SERVICES & SUPPLIES - 0.1% | |||
Human Resource & Employment Services - 0.1% | |||
Kforce, Inc. (a) | 67,400 | 916,640 | |
DIVERSIFIED CONSUMER SERVICES - 1.1% | |||
Specialized Consumer Services - 1.1% | |||
Carriage Services, Inc. Class A (e) | 506,549 | 3,550,908 | |
Service Corp. International | 311,430 | 3,653,074 | |
7,203,982 | |||
DIVERSIFIED FINANCIAL SERVICES - 1.1% | |||
Specialized Finance - 1.1% | |||
Fortress Investment Group LLC | 232,500 | 7,021,500 | |
HEALTH CARE EQUIPMENT & SUPPLIES - 4.4% | |||
Health Care Equipment - 1.3% | |||
Abiomed, Inc. (a) | 500 | 6,990 | |
Aspect Medical Systems, Inc. (a) | 414,300 | 6,690,945 | |
Becton, Dickinson & Co. | 8,600 | 653,514 | |
BioLase Technology, Inc. (a) | 48,300 | 407,652 | |
IDEXX Laboratories, Inc. (a) | 800 | 68,944 | |
NeuroMetrix, Inc. (a) | 57,700 | 656,626 | |
8,484,671 | |||
Health Care Supplies - 3.1% | |||
Align Technology, Inc. (a) | 4,800 | 78,816 | |
Inverness Medical Innovations, Inc. (a) | 463,800 | 19,572,360 | |
19,651,176 | |||
TOTAL HEALTH CARE EQUIPMENT & SUPPLIES | 28,135,847 | ||
HEALTH CARE PROVIDERS & SERVICES - 83.4% | |||
Health Care Distributors & Services - 13.4% | |||
Cardinal Health, Inc. | 560,000 | 39,250,400 | |
Henry Schein, Inc. (a) | 1,700 | 88,689 | |
McKesson Corp. | 766,300 | 42,728,888 | |
MWI Veterinary Supply, Inc. (a) | 76,300 | 2,367,589 | |
Profarma Distribuidora de Produtos Farmaceuticos SA | 136,000 | 2,176,770 | |
86,612,336 | |||
Health Care Facilities - 12.3% | |||
Acibadem Saglik Hizmetleri AS | 338,000 | 3,324,982 | |
Advocat, Inc. (a) | 72,000 | 1,256,400 | |
Shares | Value | ||
Apollo Hospitals Enterprise Ltd. | 832,520 | $ 9,389,217 | |
Assisted Living Concepts, Inc. Class A (a) | 119,200 | 1,364,840 | |
Bangkok Chain Hospital PCL | 4,250,000 | 1,067,965 | |
Bangkok Dusit Medical Service PCL (For. Reg.) | 2,172,600 | 2,298,710 | |
Brookdale Senior Living, Inc. | 466,000 | 21,999,860 | |
Bumrungrad Hospital PCL (For. Reg.) | 3,168,200 | 3,445,214 | |
Capital Senior Living Corp. (a) | 175,700 | 1,894,046 | |
Community Health Systems, Inc. (a) | 307,473 | 11,453,369 | |
Emeritus Corp. (a) | 152,300 | 4,256,785 | |
Five Star Quality Care, Inc. (a)(e) | 72,500 | 828,675 | |
HealthSouth Corp. (a) | 436 | 10,447 | |
Kindred Healthcare, Inc. (a) | 100 | 3,292 | |
LifePoint Hospitals, Inc. (a) | 2,100 | 76,860 | |
Manor Care, Inc. | 71,500 | 3,830,970 | |
Sun Healthcare Group, Inc. (a) | 269,931 | 3,549,593 | |
U.S. Physical Therapy, Inc. (a) | 100,752 | 1,361,160 | |
United Surgical Partners International, Inc. (a) | 37,250 | 1,137,615 | |
VCA Antech, Inc. (a) | 174,300 | 6,398,553 | |
78,948,553 | |||
Health Care Services - 27.4% | |||
AMN Healthcare Services, Inc. (a) | 55,800 | 1,551,240 | |
Caremark Rx, Inc. | 682,400 | 42,029,016 | |
Diagnosticos da America SA (a) | 1,048,500 | 22,794,553 | |
Emergency Medical Services Corp. Class A (a) | 100 | 2,643 | |
Express Scripts, Inc. (a) | 328,100 | 24,742,021 | |
Health Grades, Inc. (a)(f) | 1,833,177 | 10,192,464 | |
Healthways, Inc. (a) | 500 | 21,745 | |
HMS Holdings Corp. (a) | 165,829 | 3,283,414 | |
Lincare Holdings, Inc. (a) | 33,600 | 1,312,080 | |
Medco Health Solutions, Inc. (a) | 554,100 | 37,462,701 | |
Nighthawk Radiology Holdings, Inc. (e) | 167,700 | 3,484,806 | |
Omnicare, Inc. (e) | 352,800 | 14,655,312 | |
Rural/Metro Corp. (a)(f) | 1,957,400 | 14,817,518 | |
Visicu, Inc. | 33,292 | 234,043 | |
176,583,556 | |||
Managed Health Care - 30.3% | |||
AMERIGROUP Corp. (a) | 2,600 | 86,008 | |
Centene Corp. (a) | 1,800 | 43,416 | |
Coventry Health Care, Inc. (a) | 16,700 | 908,814 | |
Health Net, Inc. (a) | 433,500 | 23,179,245 | |
Healthspring, Inc. | 75,700 | 1,599,541 | |
Humana, Inc. (a) | 338,200 | 20,237,888 | |
Medial Saude SA | 159,000 | 1,612,120 | |
Molina Healthcare, Inc. (a) | 1,473 | 45,899 | |
Sierra Health Services, Inc. (a) | 138,400 | 5,142,944 | |
UnitedHealth Group, Inc. | 2,718,701 | 141,916,190 | |
WellPoint, Inc. (a) | 400 | 31,756 | |
194,803,821 | |||
TOTAL HEALTH CARE PROVIDERS & SERVICES | 536,948,266 | ||
Common Stocks - continued | |||
Shares | Value | ||
HEALTH CARE TECHNOLOGY - 1.5% | |||
Health Care Technology - 1.5% | |||
Cerner Corp. (a) | 59,701 | $ 3,111,019 | |
Eclipsys Corp. (a) | 60,400 | 1,263,568 | |
Emageon, Inc. (a)(e) | 87,598 | 1,022,269 | |
Vital Images, Inc. (a) | 30,097 | 1,034,434 | |
WebMD Health Corp. Class A (a) | 63,400 | 3,410,286 | |
9,841,576 | |||
HOTELS, RESTAURANTS & LEISURE - 0.5% | |||
Leisure Facilities - 0.5% | |||
Life Time Fitness, Inc. (a) | 64,300 | 3,073,540 | |
INSURANCE - 1.5% | |||
Life & Health Insurance - 1.5% | |||
China Life Insurance Co. Ltd. ADR (e) | 25,232 | 999,440 | |
MetLife, Inc. | 51,800 | 3,271,170 | |
Universal American Financial Corp. (a) | 271,073 | 5,201,891 | |
9,472,501 | |||
INTERNET & CATALOG RETAIL - 0.2% | |||
Internet Retail - 0.2% | |||
NutriSystem, Inc. (a)(e) | 26,900 | 1,214,535 | |
LIFE SCIENCES TOOLS & SERVICES - 0.1% | |||
Life Sciences Tools & Services - 0.1% | |||
Exelixis, Inc. (a) | 80,000 | 805,600 | |
PERSONAL PRODUCTS - 0.2% | |||
Personal Products - 0.2% | |||
Natura Cosmeticos SA | 86,100 | 1,093,862 | |
PHARMACEUTICALS - 0.8% | |||
Pharmaceuticals - 0.8% | |||
Adams Respiratory Therapeutics, Inc. (a) | 33,500 | 1,216,720 | |
Allergan, Inc. | 29,300 | 3,273,103 | |
Atherogenics, Inc. (a)(e) | 34,200 | 373,806 | |
4,863,629 | |||
SOFTWARE - 0.5% | |||
Systems Software - 0.5% | |||
Quality Systems, Inc. | 83,800 | 3,429,934 | |
TOTAL COMMON STOCKS (Cost $506,699,702) | 630,176,907 | ||
Nonconvertible Bonds - 0.3% | ||||
Principal Amount | Value | |||
HEALTH CARE PROVIDERS & SERVICES - 0.3% | ||||
Health Care Services - 0.3% | ||||
Rural/Metro Corp.: | ||||
0% 3/15/16 (d) | $ 2,790,000 | $ 2,155,275 | ||
9.875% 3/15/15 | 20,000 | 21,200 | ||
(Cost $1,936,015) | 2,176,475 | |||
Money Market Funds - 3.5% | |||
Shares | |||
Fidelity Cash Central Fund, 5.35% (b) | 10,629,207 | 10,629,207 | |
Fidelity Securities Lending Cash Central Fund, 5.34% (b)(c) | 11,787,216 | 11,787,216 | |
TOTAL MONEY MARKET FUNDS (Cost $22,416,423) | 22,416,423 | ||
TOTAL INVESTMENT PORTFOLIO - 101.7% (Cost $531,052,140) | 654,769,805 | ||
NET OTHER ASSETS - (1.7)% | (11,128,663) | ||
NET ASSETS - 100% | $ 643,641,142 | ||
Legend |
(a) Non-income producing |
(b) Affiliated fund that is available only to investment companies and other accounts managed by Fidelity Investments. The rate quoted is the annualized seven-day yield of the fund at period end. A complete unaudited listing of the fund's holdings as of its most recent quarter end is available upon request. |
(c) Investment made with cash collateral received from securities on loan. |
(d) Security initially issued in zero coupon form which converts to coupon form at a specified rate and date. The rate shown is the rate at period end. |
(e) Security or a portion of the security is on loan at period end. |
(f) Affiliated company |
Affiliated Central Funds |
Information regarding fiscal year to date income earned by the Fund from investments in Fidelity Central Funds is as follows: |
Fund | Income earned |
Fidelity Cash Central Fund | $ 317,858 |
Fidelity Securities Lending Cash Central Fund | 293,830 |
Total | $ 611,688 |
Other Affiliated Issuers |
An affiliated company is a company in which the fund has ownership of at least 5% of the voting securities. Fiscal year to date transactions with companies which are or were affiliates are as follows: |
Affiliate | Value, | Purchases | Sales | Dividend | Value, |
Health Grades, Inc. | $ 5,154,280 | $ 4,733,590 | $ 866,915 | $ - | $ 10,192,464 |
Rural/Metro Corp. | 16,872,788 | - | - | - | 14,817,518 |
Total | $ 22,027,068 | $ 4,733,590 | $ 866,915 | $ - | $ 25,009,982 |
See accompanying notes which are an integral part of the financial statements.
Annual Report
Select Medical Delivery Portfolio
Financial Statements
Statement of Assets and Liabilities
February 28, 2007 | ||
Assets | ||
Investment in securities, at value (including securities loaned of $11,443,677) - See accompanying schedule: Unaffiliated issuers (cost $485,048,441) | $ 607,343,400 | |
Fidelity Central Funds (cost $22,416,423) | 22,416,423 | |
Other affiliated issuers (cost $23,587,276) | 25,009,982 | |
Total Investments (cost $531,052,140) | $ 654,769,805 | |
Cash | 626,633 | |
Foreign currency held at value (cost $29,633) | 29,623 | |
Receivable for investments sold | 3,527,242 | |
Receivable for fund shares sold | 1,770,100 | |
Dividends receivable | 50,139 | |
Interest receivable | 905 | |
Distributions receivable from Fidelity Central Funds | 47,813 | |
Prepaid expenses | 3,313 | |
Other receivables | 24,046 | |
Total assets | 660,849,619 | |
Liabilities | ||
Payable for investments purchased | $ 2,178,952 | |
Payable for fund shares redeemed | 2,605,264 | |
Accrued management fee | 305,330 | |
Other affiliated payables | 182,359 | |
Other payables and accrued expenses | 149,356 | |
Collateral on securities loaned, at value | 11,787,216 | |
Total liabilities | 17,208,477 | |
Net Assets | $ 643,641,142 | |
Net Assets consist of: | ||
Paid in capital | $ 480,517,282 | |
Accumulated net investment loss | (777) | |
Accumulated undistributed net realized gain (loss) on investments and foreign currency transactions | 39,446,365 | |
Net unrealized appreciation (depreciation) on investments and assets and liabilities in foreign currencies | 123,678,272 | |
Net Assets, for 12,615,071 shares outstanding | $ 643,641,142 | |
Net Asset Value, offering price and redemption price per share ($643,641,142 ÷ 12,615,071 shares) | $ 51.02 | |
Statement of Operations
Year ended February 28, 2007 | ||
Investment Income | ||
Dividends | $ 2,144,566 | |
Interest | 296,464 | |
Income from Fidelity Central Funds (including $293,830 from security lending) | 611,688 | |
Total income | 3,052,718 | |
Expenses | ||
Management fee | $ 4,712,681 | |
Transfer agent fees | 2,520,020 | |
Accounting and security lending fees | 341,926 | |
Custodian fees and expenses | 135,444 | |
Independent trustees' compensation | 3,339 | |
Registration fees | 69,690 | |
Audit | 44,707 | |
Legal | 19,489 | |
Interest | 76,464 | |
Miscellaneous | 59,457 | |
Total expenses before reductions | 7,983,217 | |
Expense reductions | (61,751) | 7,921,466 |
Net investment income (loss) | (4,868,748) | |
Realized and Unrealized Gain (Loss) Net realized gain (loss) on: | ||
Investment securities: | ||
Unaffiliated issuers (net of foreign taxes of $63,717) | 87,980,518 | |
Other affiliated issuers | 74,747 | |
Foreign currency transactions | (121,256) | |
Total net realized gain (loss) | 87,934,009 | |
Change in net unrealized appreciation (depreciation) on: Investment securities (net of decrease in deferred foreign taxes of $189,947) | (115,774,068) | |
Assets and liabilities in foreign currencies | (15,686) | |
Total change in net unrealized appreciation (depreciation) | (115,789,754) | |
Net gain (loss) | (27,855,745) | |
Net increase (decrease) in net assets resulting from operations | $ (32,724,493) | |
See accompanying notes which are an integral part of the financial statements.
Annual Report
Statement of Changes in Net Assets
Year ended | Year ended | |
Increase (Decrease) in Net Assets | ||
Operations | ||
Net investment income (loss) | $ (4,868,748) | $ (7,632,320) |
Net realized gain (loss) | 87,934,009 | 87,118,185 |
Change in net unrealized appreciation (depreciation) | (115,789,754) | 181,514,309 |
Net increase (decrease) in net assets resulting from operations | (32,724,493) | 261,000,174 |
Distributions to shareholders from net realized gain | (79,276,226) | (63,142,749) |
Share transactions | 251,334,506 | 1,611,776,758 |
Reinvestment of distributions | 75,721,552 | 60,447,547 |
Cost of shares redeemed | (1,041,431,790) | (1,106,838,737) |
Net increase (decrease) in net assets resulting from share transactions | (714,375,732) | 565,385,568 |
Redemption fees | 156,545 | 435,074 |
Total increase (decrease) in net assets | (826,219,906) | 763,678,067 |
Net Assets | ||
Beginning of period | 1,469,861,048 | 706,182,981 |
End of period (including accumulated net investment loss of $777 and accumulated net investment loss of $953, respectively) | $ 643,641,142 | $ 1,469,861,048 |
Other Information Shares | ||
Sold | 4,957,037 | 31,776,334 |
Issued in reinvestment of distributions | 1,525,404 | 1,194,823 |
Redeemed | (20,600,304) | (21,329,025) |
Net increase (decrease) | (14,117,863) | 11,642,132 |
Financial Highlights
Years ended February 28, | 2007 | 2006 | 2005 | 2004 H | 2003 |
Selected Per-Share Data | |||||
Net asset value, beginning of period | $ 54.98 | $ 46.80 | $ 32.76 | $ 22.84 | $ 26.49 |
Income from Investment Operations | |||||
Net investment income (loss)C | (.29) | (.31) | (.28) | (.30) | (.28) |
Net realized and unrealized gain (loss) | 1.20 F | 11.41 | 14.28 | 10.20 | (3.46) |
Total from investment operations | .91 | 11.10 | 14.00 | 9.90 | (3.74) |
Distributions from net realized gain | (4.88) | (2.94) | - | - | - |
Redemption fees added to paid in capital C | .01 | .02 | .04 | .02 | .09 |
Net asset value, end of period | $ 51.02 | $ 54.98 | $ 46.80 | $ 32.76 | $ 22.84 |
Total Return A, B | 2.23% | 24.54% | 42.86% | 43.43% | (13.78)% |
Ratios to Average Net Assets D, G | |||||
Expenses before reductions | .95% | .95% | 1.03% | 1.30% | 1.25% |
Expenses net of fee waivers, if any | .95% | .95% | 1.03% | 1.30% | 1.25% |
Expenses net of all reductions | .94% | .91% | .92% | 1.24% | 1.13% |
Net investment income (loss) | (.58)% | (.60)% | (.72)% | (1.11)% | (.99)% |
Supplemental Data | |||||
Net assets, end of period (000 omitted) | $ 643,641 | $ 1,469,861 | $ 706,183 | $ 210,255 | $ 117,635 |
Portfolio turnover rate E | 92% | 106% | 244% | 196% | 269% |
A Total returns would have been lower had certain expenses not been reduced during the periods shown. B Total returns do not include the effect of the former sales charges. C Calculated based on average shares outstanding during the period. D Fees and expenses of the underlying Fidelity Central Funds are not included in the Fund's expense ratio. The Fund indirectly bears its proportionate share of the expenses of any underlying Fidelity Central Funds. E Amount does not include the portfolio activity of any underlying Fidelity Central Funds. F The amount shown for a share outstanding does not correspond with the aggregate net gain (loss) on investments for the period due to the timing of sales and repurchases of shares in relation to fluctuating market values of the investments of the Fund. G Expense ratios reflect operating expenses of the Fund. Expenses before reductions do not reflect amounts reimbursed by the investment adviser or reductions from brokerage service arrangements or other expense offset arrangements and do not represent the amount paid by the Fund during periods when reimbursements or reductions occur. Expenses net of fee waivers reflect expenses after reimbursement by the investment adviser but prior to reductions from brokerage service arrangements or other expense offset arrangements. Expenses net of all reductions represent the net expenses paid by the Fund. H For the year ended February 29. |
See accompanying notes which are an integral part of the financial statements.
Annual Report
Select Medical Equipment and Systems Portfolio
Performance
Average annual total return reflects the change in the value of an investment, assuming reinvestment of the fund's dividend income and capital gains (the profits earned upon the sale of securities that have grown in value) and assuming a constant rate of performance each year. The $10,000 table and the fund's returns do not reflect the deduction of taxes that a shareholder would pay on fund distributions or the redemption of fund shares. During periods of reimbursement by Fidelity a fund's total returns will be greater than it would be had the reimbursement not occurred. How a fund did yesterday is no guarantee of how it will do tomorrow.
Average Annual Total Returns
Periods ended February 28, 2007 | Past 1 | Past 5 | Life of |
Select Medical Equipment and Systems Portfolio | 5.66% | 11.77% | 15.04% |
A From April 28, 1998.
$10,000 Over Life of Fund
Let's say hypothetically that $10,000 was invested in Select Medical Equipment and Systems Portfolio on April 28, 1998, when the fund started. The chart shows how the value of your investment would have changed, and also shows how the S&P 500 Index performed over the same period.
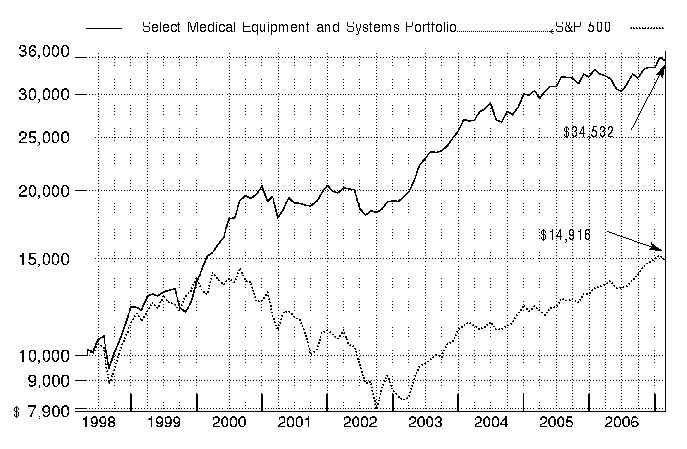
Annual Report
Select Medical Equipment and Systems Portfolio
Management's Discussion of Fund Performance
Comments from Aaron Cooper, Portfolio Manager of Fidelity® Select Medical Equipment and Systems Portfolio
A rosy year for stocks wilted just prior to the end of the 12-month period ending February 28, 2007. On the day prior to the period's close, the Dow Jones Industrial AverageSM plunged 416 points and the Standard & Poor's 500SM Index lost roughly 3.5% of its value, plummeting nearly 50 points and marking the benchmark's worst single-day performance since the day the market reopened after the 9/11 terrorist attacks. Though investors were obviously rattled by the development, it was only the 22nd-biggest decline for the S&P 500® in 20 years, and it could not overshadow how well stocks performed for the 12 months overall. For much of the past year, investors grew confident that the economy would not fall into a recession, and they bid up most broad-based stock indexes for six consecutive months from August through January. Overall for the year ending February 28, 2007, the S&P 500 was up 11.97%, the Dow advanced 14.24%, the small-cap Russell 2000® Index gained 9.87% and the NASDAQ Composite® Index rose 6.66%.
For the year ending February 28, 2007, the fund was up 5.66%, underperforming the 6.38% gain of the Morgan Stanley Capital InternationalSM (MSCI®) US Investable Market Health Care Equipment & Supplies Index and the 12.42% gain of a blended index specific to this fund. This blended index is a combination of the Goldman Sachs® Health Care Index, with which the fund was compared through September, and the new MSCI benchmark mentioned above, with which the fund was compared during the period's final five months.1 For the year ending February 28, 2007, the fund also trailed the S&P 500. For the first seven months of the review period, the fund underperformed the benchmark Goldman Sachs index largely because the health care equipment group on which we focus underperformed the health care sector as a whole. Cardiology equipment maker Boston Scientific - a position we sold - and neurological diagnostic tool maker NeuroMetrix were among the detractors. However, good stock picking in health care supplies, including Inverness Medical Innovations - a maker of pregnancy and cardiology tests - contributed to performance. In the last five months of the period, the fund underperformed its new MSCI index, as many of the small- and mid-cap stocks I favored failed to outperform the larger stocks that form the core of the index. Detractors included Cooper Companies, which makes contact lenses, and underexposure to Zimmer Holdings and Stryker, two strong performing orthopedic stocks in the index. Conversely, an overweighting in Inverness and underweightings in Varian Medical Systems and Medtronic, two stocks that struggled, contributed to the fund's relative performance.
1 The fund's blended index is a customized index developed by Fidelity for the limited purpose of discussing the fund's performance for the 12-month period ending February 28, 2007. From March 1, 2006, through September 30, 2006, the fund compared its performance to the Goldman Sachs Health Care Index, which returned 1.62% during that period. On October 1, 2006, the fund began comparing its performance to a different index, the MSCI US Investable Market Health Care Equipment & Supplies Index, which returned 10.63% from October 1, 2006, through February 28, 2007. For the 12-month period ending February 28, 2007, the blended index (Goldman Sachs and MSCI) returned 12.42%.
The views expressed above reflect those of the portfolio manager(s) only through the end of the period as stated on the cover of this report and do not necessarily represent the views of Fidelity or any other person in the Fidelity organization. Any such views are subject to change at any time based upon market or other conditions and Fidelity disclaims any responsibility to update such views. These views may not be relied on as investment advice and, because investment decisions for a Fidelity fund are based on numerous factors, may not be relied on as an indication of trading intent on behalf of any Fidelity fund.
Annual Report
Select Medical Equipment and Systems Portfolio
Investment Changes
Top Ten Stocks as of February 28, 2007 | ||
% of fund's | % of fund's net assets | |
Baxter International, Inc. | 11.5 | 6.3 |
Becton, Dickinson & Co. | 9.6 | 6.5 |
Inverness Medical Innovations, Inc. | 9.1 | 6.6 |
C.R. Bard, Inc. | 7.3 | 5.0 |
Cooper Companies, Inc. | 4.4 | 4.7 |
St. Jude Medical, Inc. | 3.1 | 3.9 |
Allergan, Inc. | 3.0 | 10.2 |
Respironics, Inc. | 2.1 | 1.0 |
Aspect Medical Systems, Inc. | 2.0 | 2.1 |
Brookdale Senior Living, Inc. | 1.9 | 2.4 |
54.0 | ||
Top Industries (% of fund's net assets) | |||
As of February 28, 2007 | |||
| Health Care Equipment & Supplies | 80.5% | |
| Pharmaceuticals | 4.5% | |
| Health Care Providers & Services | 3.6% | |
| Biotechnology | 3.5% | |
| Life Sciences Tools & Services | 3.4% | |
| All Others* | 4.5% | |
As of August 31, 2006 | |||
| Health Care Equipment & Supplies | 63.7% | |
| Pharmaceuticals | 20.2% | |
| Health Care Providers & Services | 5.0% | |
| Health Care Technology | 2.6% | |
| Biotechnology | 2.4% | |
| All Others* | 6.1% | |

* Includes short-term investments and net other assets. |
Annual Report
Select Medical Equipment and Systems Portfolio
Investments February 28, 2007
Showing Percentage of Net Assets
Common Stocks - 99.4% | |||
Shares | Value | ||
BIOTECHNOLOGY - 3.5% | |||
Biotechnology - 3.5% | |||
Alnylam Pharmaceuticals, Inc. (a)(d) | 545,800 | $ 10,261,040 | |
deCODE genetics, Inc. (a)(d) | 631,400 | 2,462,460 | |
Diagnocure, Inc. (a) | 644,700 | 2,425,446 | |
DUSA Pharmaceuticals, Inc. (a)(d) | 852,199 | 3,502,538 | |
Epigenomics AG (a) | 63,300 | 344,287 | |
MannKind Corp. (a)(d) | 107,200 | 1,705,552 | |
Omrix Biopharmaceuticals, Inc. | 198,300 | 7,099,140 | |
27,800,463 | |||
CHEMICALS - 0.2% | |||
Specialty Chemicals - 0.2% | |||
Lonza Group AG | 21,689 | 1,930,877 | |
HEALTH CARE EQUIPMENT & SUPPLIES - 80.5% | |||
Health Care Equipment - 61.1% | |||
Advanced Medical Optics, Inc. (a)(d) | 386,094 | 14,880,063 | |
American Medical Systems Holdings, Inc. (a)(d) | 394,177 | 8,017,560 | |
ArthroCare Corp. (a) | 228,200 | 8,295,070 | |
Aspect Medical Systems, Inc. (a) | 969,406 | 15,655,907 | |
Baxter International, Inc. | 1,826,920 | 91,364,266 | |
Becton, Dickinson & Co. | 1,005,500 | 76,407,945 | |
BioLase Technology, Inc. (a) | 113,200 | 955,408 | |
Biomet, Inc. | 192,100 | 8,131,593 | |
Biosite, Inc. (a) | 72,905 | 3,872,714 | |
C.R. Bard, Inc. | 730,900 | 58,325,820 | |
Cochlear Ltd. | 62,200 | 2,780,855 | |
Conceptus, Inc. (a) | 245,100 | 4,602,978 | |
Cytyc Corp. (a) | 108,300 | 3,281,490 | |
DexCom, Inc. (a)(d) | 168,385 | 1,362,235 | |
Edwards Lifesciences Corp. (a) | 139,300 | 7,030,471 | |
Electro-Optical Sciences, Inc. (a)(f) | 602,089 | 3,371,698 | |
Electro-Optical Sciences, Inc. warrants 11/2/11 (a)(f) | 90,313 | 251,079 | |
Greatbatch, Inc. (a) | 126,500 | 3,283,940 | |
Gyrus Group PLC (a) | 226,400 | 1,885,698 | |
Hologic, Inc. (a) | 160,300 | 8,824,515 | |
Hospira, Inc. (a) | 165,500 | 6,333,685 | |
Intuitive Surgical, Inc. (a)(d) | 135,900 | 15,098,490 | |
IRIS International, Inc. (a) | 182,800 | 2,072,952 | |
Kinetic Concepts, Inc. (a) | 55,600 | 2,732,740 | |
Kyphon, Inc. (a) | 252,400 | 11,385,764 | |
Medtronic, Inc. | 160,500 | 8,082,780 | |
Mentor Corp. | 63,300 | 3,039,033 | |
Meridian Bioscience, Inc. | 84,600 | 2,272,356 | |
NeuroMetrix, Inc. (a)(d)(e) | 691,900 | 7,873,822 | |
NMT Medical, Inc. (a)(d) | 136,904 | 1,904,335 | |
Nobel Biocare Holding AG (Switzerland) | 4,973 | 1,650,526 | |
Northstar Neuroscience, Inc. | 227,800 | 2,742,712 | |
NuVasive, Inc. (a) | 101,600 | 2,400,808 | |
Orthofix International NV (a) | 37,500 | 1,842,000 | |
Phonak Holding AG | 26,050 | 1,970,716 | |
Shares | Value | ||
ResMed, Inc. (a)(d) | 187,800 | $ 8,973,084 | |
Respironics, Inc. (a) | 402,700 | 16,498,619 | |
Restore Medical, Inc. (d) | 487,222 | 2,017,099 | |
Sirona Dental Systems, Inc. | 61,858 | 2,302,355 | |
St. Jude Medical, Inc. (a) | 626,300 | 24,832,795 | |
Stereotaxis, Inc. (a)(d) | 505,429 | 5,817,488 | |
Straumann Holding AG | 9,754 | 2,567,053 | |
The Spectranetics Corp. (a) | 594,700 | 6,250,297 | |
Thermogenesis Corp. (a) | 2,087,288 | 6,407,974 | |
Thoratec Corp. (a) | 231,600 | 4,550,940 | |
Varian Medical Systems, Inc. (a) | 241,300 | 11,087,735 | |
William Demant Holding AS (a) | 20,200 | 1,655,620 | |
486,945,083 | |||
Health Care Supplies - 19.4% | |||
Alcon, Inc. | 49,900 | 6,218,538 | |
Align Technology, Inc. (a) | 123,400 | 2,026,228 | |
Bausch & Lomb, Inc. | 78,100 | 4,081,506 | |
Cooper Companies, Inc. | 772,400 | 35,445,436 | |
DJO, Inc. (a) | 89,100 | 3,490,938 | |
Gen-Probe, Inc. (a) | 194,312 | 9,330,862 | |
Haemonetics Corp. (a) | 99,200 | 4,464,000 | |
Immucor, Inc. (a) | 119,900 | 3,565,826 | |
Inverness Medical Innovations, Inc. (a) | 1,709,800 | 72,153,560 | |
Inverness Medical Innovations, Inc. (a)(f) | 20,683 | 872,823 | |
Medical Action Industries, Inc. (a) | 53,595 | 1,190,881 | |
Merit Medical Systems, Inc. (a) | 365,700 | 5,145,399 | |
NUCRYST Pharmaceuticals Corp. (a) | 637,905 | 2,264,567 | |
Utah Medical Products, Inc. | 35,500 | 1,238,240 | |
West Pharmaceutical Services, Inc. | 34,800 | 1,575,048 | |
Ypsomed Holding AG (d) | 17,940 | 1,529,408 | |
154,593,260 | |||
TOTAL HEALTH CARE EQUIPMENT & SUPPLIES | 641,538,343 | ||
HEALTH CARE PROVIDERS & SERVICES - 3.6% | |||
Health Care Distributors & Services - 0.6% | |||
Henry Schein, Inc. (a) | 85,000 | 4,434,450 | |
Health Care Facilities - 1.9% | |||
Brookdale Senior Living, Inc. | 329,000 | 15,532,090 | |
Health Care Services - 0.9% | |||
Gentiva Health Services, Inc. (a) | 78,400 | 1,547,616 | |
Health Grades, Inc. (a) | 276,400 | 1,536,784 | |
Healthways, Inc. (a) | 55,700 | 2,422,393 | |
HMS Holdings Corp. (a) | 38,300 | 758,340 | |
Nighthawk Radiology Holdings, Inc. | 51,200 | 1,063,936 | |
7,329,069 | |||
Managed Health Care - 0.2% | |||
Magellan Health Services, Inc. (a) | 36,500 | 1,526,065 | |
TOTAL HEALTH CARE PROVIDERS & SERVICES | 28,821,674 | ||
Common Stocks - continued | |||
Shares | Value | ||
HEALTH CARE TECHNOLOGY - 3.0% | |||
Health Care Technology - 3.0% | |||
Allscripts Healthcare Solutions, Inc. (a) | 58,900 | $ 1,595,012 | |
Cerner Corp. (a) | 278,400 | 14,507,424 | |
Eclipsys Corp. (a) | 85,800 | 1,794,936 | |
Vital Images, Inc. (a) | 116,500 | 4,004,105 | |
WebMD Health Corp. Class A (a) | 39,630 | 2,131,698 | |
24,033,175 | |||
HOTELS, RESTAURANTS & LEISURE - 0.4% | |||
Leisure Facilities - 0.4% | |||
Town Sports International Holdings, Inc. | 143,000 | 2,808,520 | |
LIFE SCIENCES TOOLS & SERVICES - 3.4% | |||
Life Sciences Tools & Services - 3.4% | |||
Affymetrix, Inc. (a) | 145,330 | 3,739,341 | |
Exelixis, Inc. (a) | 214,800 | 2,163,036 | |
Illumina, Inc. (a)(d) | 147,988 | 4,970,917 | |
Millipore Corp. (a) | 59,700 | 4,269,744 | |
PerkinElmer, Inc. | 86,500 | 2,050,050 | |
QIAGEN NV (a) | 286,800 | 4,700,652 | |
Third Wave Technologies, Inc. (a) | 314,500 | 1,654,270 | |
Ventana Medical Systems, Inc. (a) | 85,300 | 3,433,325 | |
26,981,335 | |||
PHARMACEUTICALS - 4.5% | |||
Pharmaceuticals - 4.5% | |||
Allergan, Inc. (d) | 214,100 | 23,917,111 | |
BioMimetic Therapeutics, Inc. | 368,500 | 6,083,935 | |
Johnson & Johnson | 72,331 | 4,560,470 | |
Medicis Pharmaceutical Corp. Class A | 43,100 | 1,567,116 | |
36,128,632 | |||
SOFTWARE - 0.3% | |||
Systems Software - 0.3% | |||
Quality Systems, Inc. | 47,900 | 1,960,547 | |
TOTAL COMMON STOCKS (Cost $652,399,266) | 792,003,566 | ||
Money Market Funds - 11.9% | |||
Shares | Value | ||
Fidelity Cash Central Fund, 5.35% (b) | 20,529,525 | $ 20,529,525 | |
Fidelity Securities Lending Cash Central Fund, 5.34% (b)(c) | 74,772,185 | 74,772,185 | |
TOTAL MONEY MARKET FUNDS (Cost $95,301,710) | 95,301,710 | ||
TOTAL INVESTMENT PORTFOLIO - 111.3% (Cost $747,700,976) | 887,305,276 | ||
NET OTHER ASSETS - (11.3)% | (90,330,653) | ||
NET ASSETS - 100% | $ 796,974,623 | ||
Legend |
(a) Non-income producing |
(b) Affiliated fund that is available only to investment companies and other accounts managed by Fidelity Investments. The rate quoted is the annualized seven-day yield of the fund at period end. A complete unaudited listing of the fund's holdings as of its most recent quarter end is available upon request. |
(c) Investment made with cash collateral received from securities on loan. |
(d) Security or a portion of the security is on loan at period end. |
(e) Affiliated company |
(f) Restricted securities - Investment in securities not registered under the Securities Act of 1933 (excluding 144A issues). At the end of the period, the value of restricted securities (excluding 144A issues) amounted to $4,495,600 or 0.6% of net assets. |
Additional information on each holding is as follows: |
Security | Acquisition Date | Acquisition Cost |
Electro-Optical Sciences, Inc. | 11/1/06 | $ 3,431,907 |
Electro-Optical Sciences, Inc. warrants 11/2/11 | 11/1/06 | $ 9 |
Inverness Medical Innovations, Inc. | 2/8/06 | $ 504,872 |
Affiliated Central Funds |
Information regarding fiscal year to date income earned by the Fund from investments in Fidelity Central Funds is as follows: |
Fund | Income earned |
Fidelity Cash Central Fund | $ 530,195 |
Fidelity Securities Lending Cash Central Fund | 484,295 |
Total | $ 1,014,490 |
Other Affiliated Issuers |
An affiliated company is a company in which the fund has ownership of at least 5% of the voting securities. Fiscal year to date transactions with companies which are or were affiliates are as follows: |
Affiliate | Value, | Purchases | Sales | Dividend | Value, |
DUSA Pharmaceuticals, Inc. | $ 8,302,700 | $ 240,615 | $ 2,197,128 | $ - | $ - |
NeuroMetrix, Inc. | 20,542,648 | 3,111,947 | - | - | 7,873,822 |
Seracare Life Sciences, Inc. | 8,349,208 | - | 5,001,763 | - | - |
Total | $ 37,194,556 | $ 3,352,562 | $ 7,198,891 | $ - | $ 7,873,822 |
See accompanying notes which are an integral part of the financial statements.
Annual Report
Select Medical Equipment and Systems Portfolio
Financial Statements
Statement of Assets and Liabilities
February 28, 2007 | ||
Assets | ||
Investment in securities, at value (including securities loaned of $73,218,308) - See accompanying schedule: Unaffiliated issuers (cost $635,440,681) | $ 784,129,744 | |
Fidelity Central Funds (cost $95,301,710) | 95,301,710 | |
Other affiliated issuers (cost $16,958,585) | 7,873,822 | |
Total Investments (cost $747,700,976) | $ 887,305,276 | |
Receivable for investments sold | 250,265 | |
Receivable for fund shares sold | 1,192,879 | |
Dividends receivable | 77,324 | |
Distributions receivable from Fidelity Central Funds | 49,818 | |
Prepaid expenses | 3,407 | |
Other receivables | 57,251 | |
Total assets | 888,936,220 | |
Liabilities | ||
Payable for investments purchased | $ 14,409,902 | |
Payable for fund shares redeemed | 2,100,358 | |
Accrued management fee | 383,241 | |
Other affiliated payables | 214,139 | |
Other payables and accrued expenses | 81,772 | |
Collateral on securities loaned, at value | 74,772,185 | |
Total liabilities | 91,961,597 | |
Net Assets | $ 796,974,623 | |
Net Assets consist of: | ||
Paid in capital | $ 632,704,133 | |
Accumulated undistributed net realized gain (loss) on investments and foreign currency transactions | 24,666,295 | |
Net unrealized appreciation (depreciation) on investments and assets and liabilities in foreign currencies | 139,604,195 | |
Net Assets, for 33,672,598 shares outstanding | $ 796,974,623 | |
Net Asset Value, offering price and redemption price per share ($796,974,623 ÷ 33,672,598 shares) | $ 23.67 | |
Statement of Operations
Year ended February 28, 2007 | ||
Investment Income | ||
Dividends | $ 5,121,012 | |
Interest | 6,078 | |
Income from Fidelity Central Funds (including $484,295 from security lending) | 1,014,490 | |
Total income | 6,141,580 | |
Expenses | ||
Management fee | $ 4,911,582 | |
Transfer agent fees | 2,604,240 | |
Accounting and security lending fees | 352,844 | |
Custodian fees and expenses | 45,295 | |
Independent trustees' compensation | 3,266 | |
Registration fees | 35,170 | |
Audit | 38,615 | |
Legal | 17,477 | |
Interest | 20,091 | |
Miscellaneous | 59,115 | |
Total expenses before reductions | 8,087,695 | |
Expense reductions | (52,008) | 8,035,687 |
Net investment income (loss) | (1,894,107) | |
Realized and Unrealized Gain (Loss) Net realized gain (loss) on: | ||
Investment securities: | ||
Unaffiliated issuers | 80,699,083 | |
Other affiliated issuers | (5,244,923) | |
Investment not meeting investment restrictions | (3,690) | |
Foreign currency transactions | (4,118) | |
Payment from investment advisor for loss on investment not meeting investment restrictions | 3,690 | |
Total net realized gain (loss) | 75,450,042 | |
Change in net unrealized appreciation (depreciation) on: Investment securities | (37,056,137) | |
Assets and liabilities in foreign currencies | (436) | |
Total change in net unrealized appreciation (depreciation) | (37,056,573) | |
Net gain (loss) | 38,393,469 | |
Net increase (decrease) in net assets resulting from operations | $ 36,499,362 | |
See accompanying notes which are an integral part of the financial statements.
Annual Report
Statement of Changes in Net Assets
Year ended | Year ended | |
Increase (Decrease) in Net Assets | ||
Operations | ||
Net investment income (loss) | $ (1,894,107) | $ (2,022,638) |
Net realized gain (loss) | 75,450,042 | 89,919,444 |
Change in net unrealized appreciation (depreciation) | (37,056,573) | (6,935,199) |
Net increase (decrease) in net assets resulting from operations | 36,499,362 | 80,961,607 |
Distributions to shareholders from net realized gain | (84,052,518) | (39,838,684) |
Share transactions | 166,020,263 | 565,874,282 |
Reinvestment of distributions | 80,778,740 | 38,098,805 |
Cost of shares redeemed | (517,423,736) | (496,658,412) |
Net increase (decrease) in net assets resulting from share transactions | (270,624,733) | 107,314,675 |
Redemption fees | 35,458 | 100,516 |
Total increase (decrease) in net assets | (318,142,431) | 148,538,114 |
Net Assets | ||
Beginning of period | 1,115,117,054 | 966,578,940 |
End of period | $ 796,974,623 | $ 1,115,117,054 |
Other Information Shares | ||
Sold | 7,116,270 | 23,177,404 |
Issued in reinvestment of distributions | 3,475,653 | 1,520,304 |
Redeemed | (22,203,852) | (20,201,783) |
Net increase (decrease) | (11,611,929) | 4,495,925 |
Financial Highlights
Years ended February 28, | 2007 | 2006 | 2005 | 2004 G | 2003 |
Selected Per-Share Data | |||||
Net asset value, beginning of period | $ 24.62 | $ 23.70 | $ 20.99 | $ 15.63 | $ 16.02 |
Income from Investment Operations | |||||
Net investment income (loss) C | (.05) | (.04) | (.06) | (.09) | (.08) |
Net realized and unrealized gain (loss) | 1.35 | 1.80 | 2.88 | 5.97 | (.21) |
Total from investment operations | 1.30 | 1.76 | 2.82 | 5.88 | (.29) |
Distributions from net realized gain | (2.25) | (.84) | (.11) | (.53) | (.11) |
Redemption fees added to paid in capitalC | - H | -H | -H | .01 | .01 |
Net asset value, end of period | $ 23.67 | $ 24.62 | $ 23.70 | $ 20.99 | $ 15.63 |
Total Return A, B | 5.66% | 7.36% | 13.49% | 37.94% | (1.76)% |
Ratios to Average Net Assets D, F | |||||
Expenses before reductions | .93% | .96% | 1.00% | 1.18% | 1.33% |
Expenses net of fee waivers, if any | .93% | .96% | 1.00% | 1.18% | 1.33% |
Expenses net of all reductions | .92% | .92% | .98% | 1.15% | 1.29% |
Net investment income (loss) | (.22)% | (.18)% | (.28)% | (.46)% | (.55)% |
Supplemental Data | |||||
Net assets, end of period (000 omitted) | $ 796,975 | $ 1,115,117 | $ 966,579 | $ 571,596 | $ 155,970 |
Portfolio turnover rate E | 71% | 99% | 28% | 33% | 82% |
A Total returns would have been lower had certain expenses not been reduced during the periods shown. B Total returns do not include the effect of the former sales charges. C Calculated based on average shares outstanding during the period. D Fees and expenses of the underlying Fidelity Central Funds are not included in the Fund's expense ratio. The Fund indirectly bears its proportionate share of the expenses of any underlying Fidelity Central Funds. E Amount does not include the portfolio activity of any underlying Fidelity Central Funds. F Expense ratios reflect operating expenses of the Fund. Expenses before reductions do not reflect amounts reimbursed by the investment adviser or reductions from brokerage service arrangements or other expense offset arrangements and do not represent the amount paid by the Fund during periods when reimbursements or reductions occur. Expenses net of fee waivers reflect expenses after reimbursement by the investment adviser but prior to reductions from brokerage service arrangements or other expense offset arrangements. Expenses net of all reductions represent the net expenses paid by the Fund. G For the year ended February 29. H Amount represents less than $.01 per share. |
See accompanying notes which are an integral part of the financial statements.
Annual Report
Select Pharmaceuticals Portfolio
Performance
Average annual total return reflects the change in the value of an investment, assuming reinvestment of the fund's dividend income and capital gains (the profits earned upon the sale of securities that have grown in value) and assuming a constant rate of performance each year. The $10,000 table and the fund's returns do not reflect the deduction of taxes that a shareholder would pay on fund distributions or the redemption of fund shares. During periods of reimbursement by Fidelity a fund's total returns will be greater than it would be had the reimbursement not occurred. How a fund did yesterday is no guarantee of how it will do tomorrow.
Average Annual Total Returns
Periods ended February 28, 2007 | Past 1 | Past 5 | Life of |
Select Pharmaceuticals Portfolio | 8.05% | 4.07% | 2.11% |
A From June 18, 2001.
$10,000 Over Life of Fund
Let's say hypothetically that $10,000 was invested in Select Pharmaceuticals Portfolio on June 18, 2001, when the fund started. The chart shows how the value of your investment would have changed, and also shows how the S&P 500 Index performed over the same period.
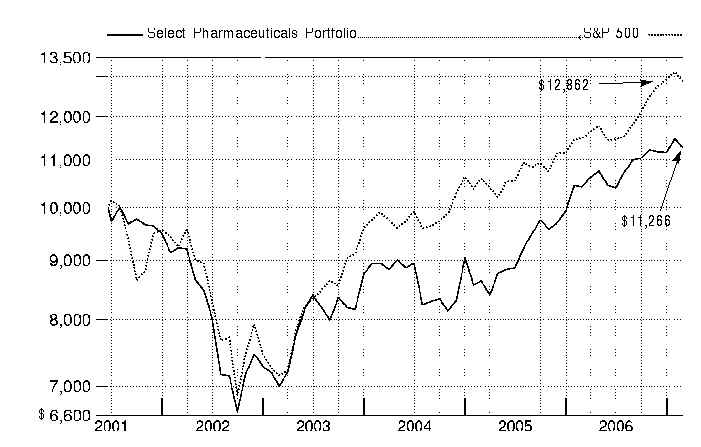
Annual Report
Select Pharmaceuticals Portfolio
Management's Discussion of Fund Performance
Comments from Andrew Oh, Portfolio Manager of Fidelity® Select Pharmaceuticals Portfolio
A rosy year for stocks wilted just prior to the end of the 12-month period ending February 28, 2007. On the day prior to the period's close, the Dow Jones Industrial AverageSM plunged 416 points and the Standard & Poor's 500SM Index lost roughly 3.5% of its value, plummeting nearly 50 points and marking the benchmark's worst single-day performance since the day the market reopened after the 9/11 terrorist attacks. Though investors were obviously rattled by the development, it was only the 22nd-biggest decline for the S&P 500® in 20 years, and it could not overshadow how well stocks performed for the 12 months overall. For much of the past year, investors grew confident that the economy would not fall into a recession, and they bid up most broad-based stock indexes for six consecutive months from August through January. Overall for the year ending February 28, 2007, the S&P 500 was up 11.97%, the Dow advanced 14.24%, the small-cap Russell 2000® Index gained 9.87% and the NASDAQ Composite® Index rose 6.66%.
For the 12 months ending February 28, 2007, the fund was up 8.05%, underperforming the 9.88% gain of the Morgan Stanley Capital InternationalSM (MSCI®) US Investable Market Pharmaceuticals Index but outperforming the 1.13% gain of a blended index specific to this fund. This blended index is a combination of the Goldman Sachs® Health Care Index, with which the fund was compared through September, and the new MSCI benchmark mentioned above, with which the fund was compared during the period's final five months.1 The fund also trailed the S&P 500 for the 12-month period. For the first seven months of the review period, the fund outperformed the benchmark Goldman Sachs index largely because of our narrow focus on pharmaceuticals, an area of relative strength within the index, and our underweightings in medical device and managed care stocks, which were relatively weak. Leading contributors among pharma companies included an out-of-benchmark position in U.K.-based AstraZeneca, which showed good clinical results for cholesterol-fighting Crestor, and Merck, which gained approval for its vaccine for preventing cervical cancer. NutriSystem, a weight-loss product stock outside of the benchmark that we eventually sold, also contributed strongly. Detractors included an out-of-index investment in Israel's Teva Pharmaceutical, which fell because of investor concerns about the prospects for generic drug companies. In the final five months of the reporting period, the fund outperformed its new MSCI benchmark as a result of good stock picking in pharmaceuticals, health care technology and biotechnology. An underweighting in Pfizer, a major drug company that suffered a setback in its pipeline, was among the contributors. Out-of-benchmark investments in Cerner, a health care technology company, and Memory Pharmaceuticals, a biotech company working on an Alzheimer's drug, also contributed. On the other hand, the fund's underweighting in drug firm Abbott Laboratories and large stake in AstraZeneca - which struggled during this period - detracted from performance.
1 The fund's blended index is a customized index developed by Fidelity for the limited purpose of discussing the fund's performance for the 12-month period ending February 28, 2007. From March 1, 2006, through September 30, 2006, the fund compared its performance to the Goldman Sachs Health Care Index, which returned 1.62% during that period. On October 1, 2006, the fund began comparing its performance to a different index, the MSCI US Investable Market Pharmaceuticals Index, which lost 0.48% from October 1, 2006, through February 28, 2007. For the 12-month period ending February 28, 2007, the blended index (Goldman Sachs and MSCI) returned 1.13%.
The views expressed above reflect those of the portfolio manager(s) only through the end of the period as stated on the cover of this report and do not necessarily represent the views of Fidelity or any other person in the Fidelity organization. Any such views are subject to change at any time based upon market or other conditions and Fidelity disclaims any responsibility to update such views. These views may not be relied on as investment advice and, because investment decisions for a Fidelity fund are based on numerous factors, may not be relied on as an indication of trading intent on behalf of any Fidelity fund.
Annual Report
Select Pharmaceuticals Portfolio
Investment Changes
Top Ten Stocks as of February 28, 2007 | ||
% of fund's | % of fund's net assets | |
Merck & Co., Inc. | 16.6 | 10.7 |
Johnson & Johnson | 7.1 | 0.0 |
Roche Holding AG (participation certificate) | 6.9 | 5.2 |
Bristol-Myers Squibb Co. | 6.4 | 5.1 |
Schering-Plough Corp. | 5.8 | 3.6 |
Wyeth | 5.7 | 4.8 |
Abbott Laboratories | 4.7 | 0.1 |
Pfizer, Inc. | 4.5 | 10.0 |
Cerner Corp. | 3.2 | 0.4 |
Allergan, Inc. | 2.6 | 2.0 |
63.5 | ||
Top Industries (% of fund's net assets) | |||
As of February 28, 2007 | |||
| Pharmaceuticals | 78.6% | |
| Biotechnology | 8.6% | |
| Health Care Technology | 5.0% | |
| Health Care Equipment & Supplies | 3.1% | |
| Chemicals | 1.5% | |
| All Others* | 3.2% | |

As of August 31, 2006 | |||
| Pharmaceuticals | 86.2% | |
| Biotechnology | 4.6% | |
| Health Care Providers & Services | 4.5% | |
| Health Care Equipment & Supplies | 0.6% | |
| Health Care Technology | 0.4% | |
| All Others* | 3.7% | |

* Includes short-term investments and net other assets. |
Annual Report
Select Pharmaceuticals Portfolio
Investments February 28, 2007
Showing Percentage of Net Assets
Common Stocks - 99.4% | |||
Shares | Value | ||
BIOTECHNOLOGY - 8.6% | |||
Biotechnology - 8.6% | |||
3SBio, Inc. ADR | 11,200 | $ 158,592 | |
Alnylam Pharmaceuticals, Inc. (a) | 13,000 | 244,400 | |
Altus Pharmaceuticals, Inc. | 6,300 | 102,879 | |
Ambrilia Biopharma, Inc. (a) | 100,000 | 303,536 | |
Amgen, Inc. (a) | 3,000 | 192,780 | |
Amylin Pharmaceuticals, Inc. (a) | 6,060 | 235,795 | |
Arena Pharmaceuticals, Inc. (a)(d) | 32,300 | 408,595 | |
ArQule, Inc. (a) | 51,800 | 342,916 | |
Biogen Idec, Inc. (a) | 14,800 | 668,812 | |
BioMarin Pharmaceutical, Inc. (a) | 23,900 | 407,017 | |
Biomira, Inc. (a) | 1,000 | 1,150 | |
Celgene Corp. (a) | 7,900 | 421,070 | |
Cephalon, Inc. (a) | 5,400 | 383,832 | |
Cougar Biotechnology, Inc. (a) | 5,200 | 91,000 | |
CSL Ltd. | 15,165 | 927,860 | |
CytRx Corp. (a) | 29,100 | 121,929 | |
Digene Corp. (a) | 400 | 18,912 | |
Genentech, Inc. (a) | 17,200 | 1,451,164 | |
Genmab AS (a)(d) | 8,300 | 492,337 | |
Genomic Health, Inc. (a) | 1,100 | 20,669 | |
Genzyme Corp. (a) | 3,400 | 210,120 | |
Gilead Sciences, Inc. (a) | 13,800 | 987,528 | |
GPC Biotech AG sponsored ADR (a)(d) | 14,600 | 404,274 | |
GTx, Inc. (a) | 9,200 | 200,836 | |
Human Genome Sciences, Inc. (a) | 15,000 | 165,000 | |
Indevus Pharmaceuticals, Inc. (a)(d) | 96,300 | 666,396 | |
Insmed, Inc. (a) | 92,500 | 131,350 | |
Isis Pharmaceuticals, Inc. (a) | 30,000 | 273,600 | |
MannKind Corp. (a)(d) | 72,735 | 1,157,214 | |
Medarex, Inc. (a) | 9,000 | 123,120 | |
Medicure, Inc. (a) | 15,200 | 16,376 | |
MedImmune, Inc. (a) | 35,400 | 1,129,614 | |
Memory Pharmaceuticals Corp. (a) | 256,000 | 744,960 | |
Metabasis Therapeutics, Inc. (a) | 30,300 | 243,915 | |
Momenta Pharmaceuticals, Inc. (a) | 100 | 1,226 | |
Monogram Biosciences, Inc. (a) | 100 | 198 | |
Nabi Biopharmaceuticals (a) | 7,200 | 38,160 | |
Neurogen Corp. (a) | 9,525 | 59,722 | |
Omrix Biopharmaceuticals, Inc. | 3,000 | 107,400 | |
OSI Pharmaceuticals, Inc. (a) | 35,600 | 1,231,760 | |
Panacos Pharmaceuticals, Inc. (a) | 23,100 | 99,330 | |
Prana Biotechnology Ltd. ADR (a)(d) | 72,500 | 205,175 | |
Progenics Pharmaceuticals, Inc. (a) | 11,300 | 313,575 | |
Regeneron Pharmaceuticals, Inc. (a) | 6,400 | 126,976 | |
Speedel Holding AG (a) | 1,610 | 222,725 | |
Tercica, Inc. (a) | 3,800 | 19,760 | |
Theravance, Inc. (a) | 10,000 | 322,500 | |
Transition Therapeutics, Inc. (a) | 20,000 | 36,595 | |
Shares | Value | ||
Vanda Pharmaceuticals, Inc. | 3,700 | $ 89,022 | |
Zymogenetics, Inc. (a) | 27,000 | 405,000 | |
16,728,672 | |||
CHEMICALS - 1.5% | |||
Commodity Chemicals - 0.0% | |||
Solvay SA | 100 | 14,230 | |
Diversified Chemicals - 1.0% | |||
Akzo Nobel NV | 300 | 18,438 | |
Bayer AG sponsored ADR | 31,800 | 1,828,182 | |
1,846,620 | |||
Specialty Chemicals - 0.5% | |||
Lonza Group AG | 4,205 | 374,353 | |
Sigma Aldrich Corp. | 14,800 | 606,800 | |
981,153 | |||
TOTAL CHEMICALS | 2,842,003 | ||
FOOD PRODUCTS - 0.0% | |||
Packaged Foods & Meats - 0.0% | |||
China Mengniu Dairy Co. Ltd. | 6,000 | 16,472 | |
HEALTH CARE EQUIPMENT & SUPPLIES - 3.1% | |||
Health Care Equipment - 2.6% | |||
Angiodynamics, Inc. (a) | 5,800 | 139,200 | |
Baxter International, Inc. | 11,300 | 565,113 | |
Beckman Coulter, Inc. | 4,600 | 295,136 | |
Becton, Dickinson & Co. | 7,900 | 600,321 | |
BioLase Technology, Inc. (a) | 6,700 | 56,548 | |
Boston Scientific Corp. (a) | 1,100 | 17,941 | |
C.R. Bard, Inc. | 1,300 | 103,740 | |
China Medical Technologies, Inc. sponsored ADR (a)(d) | 23,400 | 585,468 | |
EPIX Pharmaceuticals, Inc. (a) | 1,700 | 11,424 | |
Golden Meditech Co. Ltd. (a) | 24,000 | 10,506 | |
Hologic, Inc. (a) | 4,200 | 231,210 | |
Medtronic, Inc. | 400 | 20,144 | |
Mindray Medical International Ltd. sponsored ADR | 56,500 | 1,454,310 | |
NeuroMetrix, Inc. (a) | 3,100 | 35,278 | |
Sirona Dental Systems, Inc. | 4,100 | 152,602 | |
St. Jude Medical, Inc. (a) | 6,400 | 253,760 | |
Thermogenesis Corp. (a) | 5,200 | 15,964 | |
Varian Medical Systems, Inc. (a) | 2,100 | 96,495 | |
Volcano Corp. | 10,400 | 197,704 | |
Zimmer Holdings, Inc. (a) | 3,700 | 312,021 | |
5,154,885 | |||
Health Care Supplies - 0.5% | |||
Bausch & Lomb, Inc. | 3,800 | 198,588 | |
Chembio Diagnostics, Inc. (a) | 100 | 75 | |
Gen-Probe, Inc. (a) | 6,200 | 297,724 | |
Immucor, Inc. (a) | 9,600 | 285,504 | |
Inverness Medical Innovations, Inc. (a) | 1,200 | 50,640 | |
Common Stocks - continued | |||
Shares | Value | ||
HEALTH CARE EQUIPMENT & SUPPLIES - CONTINUED | |||
Health Care Supplies - continued | |||
Regeneration Technologies, Inc. (a) | 5,800 | $ 41,006 | |
Shandong Weigao Group Medical Polymer Co. Ltd. | 16,000 | 23,346 | |
896,883 | |||
TOTAL HEALTH CARE EQUIPMENT & SUPPLIES | 6,051,768 | ||
HEALTH CARE PROVIDERS & SERVICES - 1.2% | |||
Health Care Distributors & Services - 0.0% | |||
Chindex International, Inc. (a) | 100 | 1,704 | |
Health Care Facilities - 0.6% | |||
Brookdale Senior Living, Inc. | 9,600 | 453,216 | |
Capital Senior Living Corp. (a) | 24,200 | 260,876 | |
HealthSouth Corp. (a) | 19,000 | 455,240 | |
Sun Healthcare Group, Inc. (a) | 1,500 | 19,725 | |
1,189,057 | |||
Health Care Services - 0.6% | |||
AMN Healthcare Services, Inc. (a) | 24,100 | 669,980 | |
DaVita, Inc. (a) | 3,900 | 212,745 | |
Express Scripts, Inc. (a) | 100 | 7,541 | |
Fresenius Medical Care AG sponsored ADR | 6,500 | 309,075 | |
Healthways, Inc. (a) | 500 | 21,745 | |
Medco Health Solutions, Inc. (a) | 100 | 6,761 | |
1,227,847 | |||
TOTAL HEALTH CARE PROVIDERS & SERVICES | 2,418,608 | ||
HEALTH CARE TECHNOLOGY - 5.0% | |||
Health Care Technology - 5.0% | |||
Allscripts Healthcare Solutions, Inc. (a)(d) | 68,400 | 1,852,272 | |
Cerner Corp. (a) | 120,500 | 6,279,255 | |
Eclipsys Corp. (a) | 25,900 | 541,828 | |
Merge Technologies, Inc. | 11,200 | 56,448 | |
TriZetto Group, Inc. (a) | 19,900 | 414,517 | |
Vital Images, Inc. (a) | 19,500 | 670,215 | |
9,814,535 | |||
INDUSTRIAL CONGLOMERATES - 0.0% | |||
Industrial Conglomerates - 0.0% | |||
Shanghai Industrial Holdings Ltd. (H Shares) | 18,000 | 42,160 | |
INSURANCE - 0.2% | |||
Life & Health Insurance - 0.2% | |||
China Life Insurance Co. Ltd. ADR (d) | 9,366 | 370,987 | |
Universal American Financial Corp. (a) | 4,500 | 86,355 | |
457,342 | |||
LIFE SCIENCES TOOLS & SERVICES - 1.0% | |||
Life Sciences Tools & Services - 1.0% | |||
Covance, Inc. (a) | 300 | 18,498 | |
Shares | Value | ||
Exelixis, Inc. (a) | 39,800 | $ 400,786 | |
Medivation, Inc. (a) | 9,600 | 160,800 | |
Millipore Corp. (a) | 7,500 | 536,400 | |
Pharmaceutical Product Development, Inc. | 7,200 | 228,888 | |
PRA International (a) | 900 | 18,054 | |
Techne Corp. (a) | 2,066 | 116,357 | |
Thermo Fisher Scientific, Inc. (a) | 5,600 | 253,512 | |
Third Wave Technologies, Inc. (a) | 15,900 | 83,634 | |
Ventana Medical Systems, Inc. (a) | 4,800 | 193,200 | |
2,010,129 | |||
PERSONAL PRODUCTS - 0.0% | |||
Personal Products - 0.0% | |||
Hengan International Group Co. Ltd. | 8,000 | 22,117 | |
PHARMACEUTICALS - 78.6% | |||
Pharmaceuticals - 78.6% | |||
Abbott Laboratories (d) | 166,200 | 9,077,844 | |
Abraxis BioScience, Inc. (a) | 16,700 | 439,878 | |
Adams Respiratory Therapeutics, Inc. (a) | 19,300 | 700,976 | |
Allergan, Inc. | 44,950 | 5,021,365 | |
Astellas Pharma, Inc. | 400 | 17,449 | |
AstraZeneca PLC sponsored ADR | 48,930 | 2,746,441 | |
Atherogenics, Inc. (a) | 100 | 1,093 | |
Barr Pharmaceuticals, Inc. (a) | 4,550 | 241,150 | |
Beijing Med-Pharm Corp. (a) | 24,300 | 196,344 | |
BioMimetic Therapeutics, Inc. | 400 | 6,604 | |
Biovail Corp. | 14,210 | 294,394 | |
Bradley Pharmaceuticals, Inc. (a) | 9,700 | 187,986 | |
Bristol-Myers Squibb Co. | 473,800 | 12,503,582 | |
Cardiome Pharma Corp. (a) | 24,600 | 271,092 | |
China Shineway Pharmaceutical Group Ltd. | 33,000 | 22,470 | |
Chugai Pharmaceutical Co. Ltd. | 20,800 | 513,112 | |
Cipla Ltd. | 15,000 | 78,912 | |
Collagenex Pharmaceuticals, Inc. (a)(d) | 37,100 | 501,592 | |
Daiichi Sankyo Co. Ltd. | 6,800 | 217,758 | |
Eisai Co. Ltd. | 400 | 20,273 | |
Elan Corp. PLC sponsored ADR (a) | 74,400 | 962,736 | |
Eli Lilly & Co. | 82,600 | 4,348,064 | |
Endo Pharmaceuticals Holdings, Inc. (a) | 31,200 | 973,752 | |
Forest Laboratories, Inc. (a) | 72,120 | 3,732,931 | |
GlaxoSmithKline PLC sponsored ADR | 12,300 | 690,891 | |
Guangzhou Pharmaceutical Co. Ltd. (H Shares) | 25,000 | 20,799 | |
Inspire Pharmaceuticals, Inc. (a)(d) | 81,700 | 563,730 | |
Ipsen SA | 5,800 | 264,879 | |
Johnson & Johnson | 218,500 | 13,776,425 | |
King Pharmaceuticals, Inc. (a) | 31,500 | 587,475 | |
Medicines Co. (a) | 700 | 18,879 | |
Medicis Pharmaceutical Corp. Class A | 2,700 | 98,172 | |
Merck & Co., Inc. | 735,700 | 32,488,510 | |
Merck KGaA (d) | 18,161 | 2,260,337 | |
MGI Pharma, Inc. (a) | 25,300 | 536,866 | |
Common Stocks - continued | |||
Shares | Value | ||
PHARMACEUTICALS - CONTINUED | |||
Pharmaceuticals - continued | |||
New River Pharmaceuticals, Inc. | 24,600 | $ 1,555,950 | |
Nexmed, Inc. (a) | 353,700 | 459,810 | |
Novartis AG sponsored ADR | 69,040 | 3,826,887 | |
Novo Nordisk AS Series B sponsored ADR | 7,200 | 615,672 | |
Ono Pharmaceutical Co. Ltd. | 7,800 | 419,074 | |
Penwest Pharmaceuticals Co. (a)(d) | 27,900 | 369,117 | |
Pfizer, Inc. | 351,700 | 8,778,432 | |
Pharmaxis Ltd. (a) | 100 | 250 | |
Pipex Pharmaceuticals, Inc. (a) | 200 | 280 | |
Renovo Group PLC | 20,800 | 78,450 | |
Roche Holding AG (participation certificate) (d) | 75,344 | 13,439,824 | |
Sanofi-Aventis sponsored ADR | 27,256 | 1,155,927 | |
Schering-Plough Corp. | 484,390 | 11,373,477 | |
Shionogi & Co. Ltd. | 1,000 | 19,248 | |
Shire PLC | 136,100 | 2,887,432 | |
Spectrum Pharmaceuticals, Inc. (a)(d) | 15,600 | 93,132 | |
Takeda Pharamaceutical Co. Ltd. | 10,700 | 732,063 | |
Teva Pharmaceutical Industries Ltd. sponsored ADR | 6,000 | 213,360 | |
Valeant Pharmaceuticals International | 68,500 | 1,228,205 | |
Vectura Group PLC (a) | 10,800 | 19,890 | |
ViroPharma, Inc. (a) | 21,700 | 347,200 | |
Warner Chilcott Ltd. | 14,300 | 212,784 | |
Wuyi International Pharmaceutical Co. Ltd. | 20,000 | 4,966 | |
Wyeth | 226,620 | 11,086,250 | |
153,302,441 | |||
SOFTWARE - 0.2% | |||
Systems Software - 0.2% | |||
Quality Systems, Inc. | 7,100 | 290,603 | |
TOTAL COMMON STOCKS (Cost $176,350,470) | 193,996,850 | ||
Money Market Funds - 14.9% | |||
Fidelity Securities Lending Cash Central Fund, 5.34% (b)(c) | 28,974,702 | 28,974,702 | |
Cash Equivalents - 0.0% | |||
Maturity Amount | Value | ||
Investments in repurchase agreements in a joint trading account at 5.29%, dated 2/28/07 due 3/1/07 (Collateralized by U.S. Treasury Obligations) # | $ 39,006 | $ 39,000 | |
TOTAL INVESTMENT PORTFOLIO - 114.3% (Cost $205,364,172) | 223,010,552 | ||
NET OTHER ASSETS - (14.3)% | (27,882,331) | ||
NET ASSETS - 100% | $ 195,128,221 | ||
Legend |
(a) Non-income producing |
(b) Affiliated fund that is available only to investment companies and other accounts managed by Fidelity Investments. The rate quoted is the annualized seven-day yield of the fund at period end. A complete unaudited listing of the fund's holdings as of its most recent quarter end is available upon request. |
(c) Investment made with cash collateral received from securities on loan. |
(d) Security or a portion of the security is on loan at period end. |
# Additional Information on each counterparty to the repurchase agreement is as follows: |
Repurchase Agreement / Counterparty | Value |
$39,000 due 3/01/07 at 5.29% | |
BNP Paribas Securities Corp. | $ 9,346 |
Banc of America Securities LLC | 3,115 |
HSBC Securities (USA), Inc. | 4,195 |
Merrill Lynch Government Securities, Inc. | 12,461 |
Merrill Lynch, Pierce, Fenner & Smith, Inc. | 9,883 |
$ 39,000 | |
Affiliated Central Funds |
Information regarding fiscal year to date income earned by the Fund from investments in Fidelity Central Funds is as follows: |
Fund | Income earned |
Fidelity Cash Central Fund | $ 125,278 |
Fidelity Securities Lending Cash Central Fund | 131,997 |
Total | $ 257,275 |
Other Information |
Distribution of investments by country of issue, as a percentage of total net assets, is as follows: |
United States of America | 79.5% |
Switzerland | 9.2% |
United Kingdom | 3.3% |
Germany | 2.6% |
Japan | 1.0% |
Others (individually less than 1%) | 4.4% |
100.0% |
See accompanying notes which are an integral part of the financial statements.
Annual Report
Select Pharmaceuticals Portfolio
Financial Statements
Statement of Assets and Liabilities
February 28, 2007 | ||
Assets | ||
Investment in securities, at value (including securities loaned of $28,059,419 and repurchase agreements of $39,000) - - See accompanying schedule: Unaffiliated issuers (cost $176,389,470) | $ 194,035,850 | |
Fidelity Central Funds (cost $28,974,702) | 28,974,702 | |
Total Investments (cost $205,364,172) | $ 223,010,552 | |
Cash | 220,509 | |
Receivable for investments sold | 5,919,762 | |
Receivable for fund shares sold | 370,799 | |
Dividends receivable | 420,752 | |
Distributions receivable from Fidelity Central Funds | 2,667 | |
Prepaid expenses | 664 | |
Other receivables | 18,254 | |
Total assets | 229,963,959 | |
Liabilities | ||
Payable for investments purchased | $ 4,748,402 | |
Payable for fund shares redeemed | 910,985 | |
Payable to custodian bank | 91 | |
Accrued management fee | 95,430 | |
Other affiliated payables | 57,523 | |
Other payables and accrued expenses | 48,605 | |
Collateral on securities loaned, at value | 28,974,702 | |
Total liabilities | 34,835,738 | |
Net Assets | $ 195,128,221 | |
Net Assets consist of: | ||
Paid in capital | $ 173,732,858 | |
Undistributed net investment income | 807,588 | |
Accumulated undistributed net realized gain (loss) on investments and foreign currency transactions | 2,941,326 | |
Net unrealized appreciation (depreciation) on investments and assets and liabilities in foreign currencies | 17,646,449 | |
Net Assets, for 17,942,355 shares outstanding | $ 195,128,221 | |
Net Asset Value, offering price and redemption price per share ($195,128,221 ÷ 17,942,355 shares) | $ 10.88 | |
Statement of Operations
Year ended February 28, 2007 | ||
Investment Income | ||
Dividends | $ 3,246,966 | |
Income from Fidelity Central Funds (including $131,997 from security lending) | 257,275 | |
Total income | 3,504,241 | |
Expenses | ||
Management fee | $ 1,140,232 | |
Transfer agent fees | 646,892 | |
Accounting and security lending fees | 91,410 | |
Custodian fees and expenses | 65,300 | |
Independent trustees' compensation | 700 | |
Registration fees | 52,760 | |
Audit | 35,394 | |
Legal | 3,453 | |
Interest | 6,801 | |
Miscellaneous | 11,574 | |
Total expenses before reductions | 2,054,516 | |
Expense reductions | (23,246) | 2,031,270 |
Net investment income (loss) | 1,472,971 | |
Realized and Unrealized Gain (Loss) Net realized gain (loss) on: | ||
Investment securities: | ||
Unaffiliated issuers | 3,355,614 | |
Foreign currency transactions | 51,832 | |
Total net realized gain (loss) | 3,407,446 | |
Change in net unrealized appreciation (depreciation) on: Investment securities (net of decrease in deferred foreign taxes of $192) | 9,452,647 | |
Assets and liabilities in foreign currencies | (50) | |
Total change in net unrealized appreciation (depreciation) | 9,452,597 | |
Net gain (loss) | 12,860,043 | |
Net increase (decrease) in net assets resulting from operations | $ 14,333,014 | |
See accompanying notes which are an integral part of the financial statements.
Annual Report
Select Pharmaceuticals Portfolio
Financial Statements - continued
Statement of Changes in Net Assets
Year ended | Year ended | |
Increase (Decrease) in Net Assets | ||
Operations | ||
Net investment income (loss) | $ 1,472,971 | $ 259,282 |
Net realized gain (loss) | 3,407,446 | 9,714,264 |
Change in net unrealized appreciation (depreciation) | 9,452,597 | 10,590,843 |
Net increase (decrease) in net assets resulting from operations | 14,333,014 | 20,564,389 |
Distributions to shareholders from net investment income | (782,855) | (167,947) |
Distributions to shareholders from net realized gain | (4,395,701) | - |
Total distributions | (5,178,556) | (167,947) |
Share transactions | 286,567,788 | 127,608,958 |
Reinvestment of distributions | 4,802,781 | 139,899 |
Cost of shares redeemed | (247,920,783) | (101,231,583) |
Net increase (decrease) in net assets resulting from share transactions | 43,449,786 | 26,517,274 |
Redemption fees | 52,583 | 56,069 |
Total increase (decrease) in net assets | 52,656,827 | 46,969,785 |
Net Assets | ||
Beginning of period | 142,471,394 | 95,501,609 |
End of period (including undistributed net investment income of $807,588 and undistributed net investment income of $128,024, respectively) | $ 195,128,221 | $ 142,471,394 |
Other Information Shares | ||
Sold | 27,141,862 | 13,503,357 |
Issued in reinvestment of distributions | 462,448 | 14,823 |
Redeemed | (23,347,236) | (10,882,911) |
Net increase (decrease) | 4,257,074 | 2,635,269 |
Financial Highlights
Years ended February 28, | 2007 | 2006 | 2005 | 2004 G | 2003 |
Selected Per-Share Data | |||||
Net asset value, beginning of period | $ 10.41 | $ 8.64 | $ 8.95 | $ 7.00 | $ 9.23 |
Income from Investment Operations | |||||
Net investment income (loss) C | .08 | .02 | -H | (.01) | (.02) |
Net realized and unrealized gain (loss) | .74 | 1.77 | (.31) | 1.95 | (2.22) |
Total from investment operations | .82 | 1.79 | (.31) | 1.94 | (2.24) |
Distributions from net investment income | (.04) | (.02) | - | - | - |
Distributions from net realized gain | (.31) | - | - | - | - |
Total distributions | (.35) | (.02) | - | - | - |
Redemption fees added to paid in capitalC | - H | -H | -H | .01 | .01 |
Net asset value, end of period | $ 10.88 | $ 10.41 | $ 8.64 | $ 8.95 | $ 7.00 |
Total Return A,B | 8.05% | 20.68% | (3.46)% | 27.86% | (24.16)% |
Ratios to Average Net Assets D, F | |||||
Expenses before reductions | 1.02% | 1.11% | 1.20% | 1.59% | 1.80% |
Expenses net of fee waivers, if any | 1.02% | 1.11% | 1.20% | 1.59% | 1.80% |
Expenses net of all reductions | 1.01% | 1.03% | 1.19% | 1.57% | 1.74% |
Net investment income (loss) | .73% | .23% | .05% | (.10)% | (.26)% |
Supplemental Data | |||||
Net assets, end of period (000 omitted) | $ 195,128 | $ 142,471 | $ 95,502 | $ 87,158 | $ 50,456 |
Portfolio turnover rate E | 204% | 207% | 42% | 80% | 140% |
A Total returns would have been lower had certain expenses not been reduced during the periods shown. B Total returns do not include the effect of the former sales charges. C Calculated based on average shares outstanding during the period. D Fees and expenses of the underlying Fidelity Central Funds are not included in the Fund's expense ratio. The Fund indirectly bears its proportionate share of the expenses of any underlying Fidelity Central Funds. E Amount does not include the portfolio activity of any underlying Fidelity Central Funds. F Expense ratios reflect operating expenses of the Fund. Expenses before reductions do not reflect amounts reimbursed by the investment adviser or reductions from brokerage service arrangements or other expense offset arrangements and do not represent the amount paid by the Fund during periods when reimbursements or reductions occur. Expenses net of fee waivers reflect expenses after reimbursement by the investment adviser but prior to reductions from brokerage service arrangements or other expense offset arrangements. Expenses net of all reductions represent the net expenses paid by the Fund. G For the year ended February 29. H Amount represents less than $.01 per share. |
See accompanying notes which are an integral part of the financial statements.
Annual Report
Notes to Financial Statements
For the period ended February 28, 2007
1. Organization.
Biotechnology Portfolio, Health Care Portfolio, Medical Delivery Portfolio, Medical Equipment and Systems Portfolio, and Pharmaceuticals Portfolio (the Funds) are non-diversified funds of Fidelity Select Portfolios (the trust). The trust is registered under the Investment Company Act of 1940, as amended (the 1940 Act), as an open-end management investment company organized as a Massachusetts business trust. The Funds invest primarily in securities of companies whose principal business activities fall within specific industries. Each Fund is authorized to issue an unlimited number of shares. The financial statements have been prepared in conformity with accounting principles generally accepted in the United States of America, which require management to make certain estimates and assumptions at the date of the financial statements.
2. Investments in Fidelity Central Funds.
The Funds may invest in Fidelity Central Funds which are open-end investment companies available only to other investment companies and accounts managed by FMR and its affiliates. The Funds' Schedule of Investments lists each of the Fidelity Central Funds as an investment of each Fund but does not include the underlying holdings of each Fidelity Central Fund. As an Investing Fund, the Funds indirectly bear their proportionate share of the expenses of the underlying Fidelity Central Funds. A complete unaudited list of holdings for each Fidelity Central Fund is available upon request. In addition, the financial statements of the Fidelity Central Funds, which are not covered by the Funds' Report of Independent Registered Public Accounting Firm, are available on the EDGAR Database on the SEC's web site, www.sec.gov, or upon request.
The Money Market Central Funds seek preservation of capital and current income and are managed by Fidelity Investments Money Management, Inc. (FIMM) an affiliate of Fidelity Management & Research Company (FMR).
3. Significant Accounting Policies.
The following summarizes the significant accounting policies of the Funds:
Security Valuation. Investments are valued and net asset value (NAV) per share is calculated (NAV calculation) as of the close of business of the New York Stock Exchange (NYSE), normally 4:00 p.m. Eastern time. During the period each Fund also calculated a NAV each hour on the hour (commencing at 10:00 a.m. Eastern time until one hour prior to the close of business on the NYSE). Effective October 1, 2006 each Fund eliminated the hourly NAV calculation.
Wherever possible, each Fund uses independent pricing services approved by the Board of Trustees to value their investments. Equity securities, including restricted securities, for which market quotations are readily available, are valued at the last reported sale price or official closing price as reported by an independent pricing service on the primary market or exchange on which they are traded. In the event there were no sales during the day or closing prices are not available, securities are valued at the last quoted bid price. Debt securities, including restricted securities, for which quotations are readily available, are valued by independent pricing services or by dealers who make markets in such securities. Pricing services consider yield or price of bonds of comparable quality, coupon, maturity and type as well as dealer supplied prices. Investments in open-end mutual funds, including the Fidelity Central Funds, are valued at their closing net asset value each business day. Short-term securities with remaining maturities of sixty days or less for which quotations are not readily available are valued at amortized cost, which approximates value.
When current market prices or quotations are not readily available or do not accurately reflect fair value, valuations may be determined in accordance with procedures adopted by the Board of Trustees. For example, when developments occur between the close of a market and the close of the NYSE that may materially affect the value of some or all of the securities, or when trading in a security is halted, those securities may be fair valued. Factors used in the determination of fair value may include monitoring news to identify significant market or security specific events such as changes in the value of U.S. securities markets, reviewing developments in foreign markets and evaluating the performance of ADRs, futures contracts and exchange-traded funds. Because each Fund's utilization of fair value pricing depends on market activity, the frequency with which fair value pricing is used cannot be predicted and may be utilized to a significant extent. The value of securities used for NAV calculation under fair value pricing may differ from published prices for the same securities.
Foreign Currency. Funds may use foreign currency contracts to facilitate transactions in foreign-denominated securities. Losses from these transactions may arise from changes in the value of the foreign currency or if the counterparties do not perform under the contracts' terms.
Foreign-denominated assets, including investment securities, and liabilities are translated into U.S. dollars at the exchange rate at period end. Purchases and sales of investment securities, income and dividends received and expenses denominated in foreign currencies are translated into U.S. dollars at the exchange rate in effect on the transaction date.
The effects of exchange rate fluctuations on investments are included with the net realized and unrealized gain (loss) on investment securities. Other foreign currency transactions resulting in realized and unrealized gain (loss) are disclosed separately.
Annual Report
Notes to Financial Statements - continued
3. Significant Accounting Policies - continued
Investment Transactions and Income. For financial reporting purposes, the Funds' investment holdings and NAV include trades executed through the end of the last business day of the period. The NAV for processing shareholder transactions includes trades executed through the end of the prior business day. Gains and losses on securities sold are determined on the basis of identified cost and may include proceeds received from litigation. Dividend income is recorded on the ex-dividend date, except for certain dividends from foreign securities where the ex-dividend date may have passed, which are recorded as soon as the Fund is informed of the ex-dividend date. Non-cash dividends included in dividend income, if any, are recorded at the fair market value of the securities received. Distributions received on securities that represent a return of capital or capital gain are recorded as a reduction of cost of investments and/or as a realized gain. The Funds estimate the components of distributions received that may be considered return of capital distributions or capital gain distributions. Interest income and distributions from the Fidelity Central Funds are accrued as earned, with any distributions receivable as of period end included in Distributions receivable from Fidelity Central Funds on the Statement of Assets and Liabilities. Interest income includes coupon interest and amortization of premium and accretion of discount on debt securities. Investment income is recorded net of foreign taxes withheld where recovery of such taxes is uncertain.
Expenses. Most expenses of each trust can be directly attributed to a fund. Expenses which cannot be directly attributed are apportioned among each Fund in the trust. Expense estimates are accrued in the period to which they relate and adjustments are made when actual amounts are known.
Deferred Trustee Compensation. Under a Deferred Compensation Plan (the Plan) for Health Care Portfolio, Independent Trustees must defer receipt of a portion of, and may elect to defer receipt of an additional portion of, their annual compensation. Deferred amounts are invested in a cross-section of Fidelity funds, are marked-to-market and remain in the Fund until distributed in accordance with the Plan. The investment of deferred amounts and the offsetting payable to the Trustees are included in the accompanying Statement of Assets and Liabilities.
Income Tax Information and Distributions to Shareholders. Each year, each Fund intends to qualify as a regulated investment company by distributing all of its taxable income and realized gains under Subchapter M of the Internal Revenue Code. As a result, no provision for income taxes is required in the accompanying financial statements. Foreign taxes are provided for based on each Fund's understanding of the tax rules and rates that exist in the foreign markets in which it invests.
Distributions are recorded on the ex-dividend date. Income and capital gain distributions are determined in accordance with income tax regulations, which may differ from generally accepted accounting principles. In addition, certain Funds will claim a portion of the payment made to redeeming shareholders as a distribution for income tax purposes.
Capital accounts within the financial statements are adjusted for permanent book-tax differences. These adjustments have no impact on net assets or the results of operations. Temporary book-tax differences will reverse in a subsequent period.
Book-tax differences are primarily due to short-term capital gains, foreign currency transactions, deferred trustees compensation, net operating losses, capital loss carryforwards, losses deferred due to wash sales, certain foreign taxes and excise tax regulations.
The tax-basis components of distributable earnings and the federal tax cost as of period end were as follows for each Fund:
Cost for | Unrealized | Unrealized | Net Unrealized | |
Biotechnology Portfolio | $ 1,651,111,331 | $ 148,425,902 | $ (112,227,471) | $ 36,198,431 |
Health Care Portfolio | 1,690,628,580 | 419,820,337 | (27,569,045) | 392,251,292 |
Medical Delivery Portfolio | 533,145,096 | 134,555,395 | (12,930,686) | 121,624,709 |
Medical Equipment and Systems Portfolio | 748,850,594 | 184,638,113 | (46,183,431) | 138,454,682 |
Pharmaceuticals Portfolio | 205,657,875 | 20,574,198 | (3,221,521) | 17,352,677 |
Undistributed | Undistributed | Capital | |
Biotechnology Portfolio | $ - | $ - | $ (382,410,343) |
Health Care Portfolio | 21,900,467 | 50,634,008 | - |
Medical Delivery Portfolio | - | 16,533,615 | - |
Medical Equipment and Systems Portfolio | - | 21,099,677 | - |
Pharmaceuticals Portfolio | 697,046 | 3,025,568 | - |
Annual Report
3. Significant Accounting Policies - continued
Income Tax Information and Distributions to Shareholders - continued
The tax character of distributions paid was as follows:
February 28, 2007 | |||
Ordinary | Long-term | Total | |
Health Care Portfolio | $ 26,055,370 | $ 261,690,773 | $ 287,746,143 |
Medical Delivery Portfolio | 17,789,600 | 61,486,626 | 79,276,226 |
Medical Equipment and Systems Portfolio | - | 84,052,518 | 84,052,518 |
Pharmaceuticals Portfolio | 2,484,417 | 2,694,139 | 5,178,556 |
February 28, 2006 | |||
Ordinary | Long-term | Total | |
Health Care Portfolio | $ 592,623 | $ 214,985,606 | $ 215,578,229 |
Medical Delivery Portfolio | 42,224,323 | 20,918,426 | 63,142,749 |
Medical Equipment and Systems Portfolio | - | 39,838,684 | 39,838,684 |
Pharmaceuticals Portfolio | 167,947 | - | 167,947 |
Trading (Redemption) Fees. Shares in the Funds held less than 30 days are subject to a redemption fee equal to .75% of the net asset value of shares redeemed. All redemption fees, including any estimated redemption fees paid by FMR, are retained by the Funds and accounted for as an addition to paid in capital. Shareholders were also subject to an additional $7.50 fee for shares exchanged into another Fidelity fund (see Note 6).
New Accounting Pronouncements. In July 2006, Financial Accounting Standards Board Interpretation No. 48, Accounting for Uncertainty in Income Taxes - an interpretation of FASB Statement 109 (FIN 48), was issued and is effective on the last business day of the semiannual reporting period for fiscal years beginning after December 15, 2006. FIN 48 sets forth a threshold for financial statement recognition, measurement and disclosure of a tax position taken or expected to be taken on a tax return. Management is currently evaluating the impact, if any, the adoption of FIN 48 will have on the Funds' net assets, results of operations and financial statement disclosures.
In addition, in September 2006, Statement of Financial Accounting Standards No. 157, Fair Value Measurements (SFAS 157), was issued and is effective for fiscal years beginning after November 15, 2007. SFAS 157 defines fair value, establishes a framework for measuring fair value and expands disclosures about fair value measurements. Management is currently evaluating the impact the adoption of SFAS 157 will have on the Funds' financial statement disclosures.
4. Operating Policies.
Repurchase Agreements. FMR has received an Exemptive Order from the Securities and Exchange Commission (the SEC) which permits certain Funds and other affiliated entities of FMR to transfer uninvested cash balances into joint trading accounts which are then invested in repurchase agreements. Certain Funds may also invest directly with institutions in repurchase agreements. Repurchase agreements are collateralized by government or non-government securities. Upon settlement date, collateral is held in segregated accounts with custodian banks and may be obtained in the event of a default of the counterparty. Each applicable Fund monitors, on a daily basis, the value of the collateral to ensure it is at least equal to the principal amount of the repurchase agreement (including accrued interest). In the event of a default by the counterparty, realization of the collateral proceeds could be delayed, during which time the value of the collateral may decline.
Restricted Securities. Certain Funds may invest in securities that are subject to legal or contractual restrictions on resale. These securities generally may be resold in transactions exempt from registration or to the public if the securities are registered. Disposal of these securities may involve time-consuming negotiations and expense, and prompt sale at an acceptable price may be difficult. Information regarding restricted securities is included at the end of each applicable Fund's Schedule of Investments.
Annual Report
Notes to Financial Statements - continued
5. Purchases and Sales of Investments.
Purchases and sales of securities, other than short-term securities, are noted in the table below.
Purchases ($) | Sales ($) | |
Biotechnology Portfolio | 1,084,758,346 | 1,407,140,410 |
Health Care Portfolio | 1,959,539,427 | 2,350,871,271 |
Medical Delivery Portfolio | 772,207,964 | 1,578,972,072 |
Medical Equipment and Systems Portfolio | 619,490,487 | 978,562,197 |
Pharmaceuticals Portfolio | 443,530,422 | 403,526,610 |
Medical Equipment and Systems Portfolio realized a loss on the sale of an investment not meeting the investment restrictions of the Fund. The loss was fully reimbursed by the Fund's investment advisor.
6. Fees and Other Transactions with Affiliates.
Management Fee. FMR and its affiliates provide the Funds with investment management related services for which the Funds pay a monthly management fee. The management fee is the sum of an individual fund fee rate and a group fee rate. The individual fund fee rate is applied to each Fund's average net assets. The group fee rate is based upon the average net assets of all the mutual funds advised by FMR. The group fee rate decreases as assets under management increase and increases as assets under management decrease. For the period, each Fund's annual management fee rate expressed as a percentage of each Fund's average net assets was as follows:
Individual Rate | Group Rate | Total | |
Biotechnology Portfolio | .30% | .26% | .56% |
Health Care Portfolio | .30% | .26% | .56% |
Medical Delivery Portfolio | .30% | .26% | .56% |
Medical Equipment and Systems Portfolio | .30% | .26% | .56% |
Pharmaceuticals Portfolio | .30% | .26% | .56% |
Transfer Agent Fees. Fidelity Service Company, Inc. (FSC), an affiliate of FMR, is the Funds' transfer, dividend disbursing and shareholder servicing agent. FSC receives account fees and asset-based fees that vary according to account size and type of account. FSC pays for typesetting, printing and mailing of shareholder reports, except proxy statements. For the period, the transfer agent fees were equivalent to the following annual rates expressed as a percentage of average net assets:
Biotechnology Portfolio | .30% |
Health Care Portfolio | .26% |
Medical Delivery Portfolio | .30% |
Medical Equipment and Systems Portfolio | .30% |
Pharmaceuticals Portfolio | .32% |
Accounting and Security Lending Fees. FSC maintains each Fund's accounting records. The accounting fee is based on the level of average net assets for the month. Under a separate contract, FSC administers the security lending program. The security lending fee is based on the number and duration of lending transactions.
Exchange Fees. During the period, FSC received the proceeds of a $7.50 fee to cover administrative costs associated with exchanges out of the Funds to any other Fidelity Select fund or to any other Fidelity fund made through non-automated channels. Effective October 1, 2006, the exchange fees were eliminated. For the period, exchange fees retained by FSC were as follows:
Retained | |
Biotechnology Portfolio | $ 15,308 |
Health Care Portfolio | 11,670 |
Medical Delivery Portfolio | 24,608 |
Medical Equipment and Systems Portfolio | 12,495 |
Pharmaceuticals Portfolio | 1,455 |
Annual Report
6. Fees and Other Transactions with Affiliates - continued
Brokerage Commissions. Certain Funds placed a portion of their portfolio transactions with brokerage firms which are affiliates of the investment adviser. The commissions paid to these affiliated firms were as follows:
Amount | |
Biotechnology Portfolio | $ 5,997 |
Health Care Portfolio | 7,378 |
Medical Delivery Portfolio | 10,628 |
Medical Equipment and Systems Portfolio | 4,915 |
Pharmaceuticals Portfolio | 1,929 |
Interfund Lending Program. Pursuant to an Exemptive Order issued by the SEC, the Funds, along with other registered investment companies having management contracts with FMR, may participate in an interfund lending program. This program provides an alternative credit facility allowing the funds to borrow from, or lend money to, other participating affiliated funds. At period end, there were no interfund loans outstanding. Each applicable fund's activity in this program during the period for which loans were outstanding was as follows:
Borrower | Average Daily | Weighted Average Interest Rate | Interest | |
Borrower | $ 5,183,364 | 5.26% | $ 16,656 | |
Borrower | 4,183,174 | 4.94% | 13,201 | |
Borrower | 7,968,976 | 5.00% | 46,474 | |
Borrower | 5,437,741 | 4.93% | 20,091 | |
Borrower | 3,539,538 | 5.32% | 6,802 |
7. Committed Line of Credit.
Certain Funds participate with other funds managed by FMR in a $4.2 billion credit facility (the "line of credit") to be utilized for temporary or emergency purposes to fund shareholder redemptions or for other short-term liquidity purposes. The participating funds have agreed to pay commitment fees on their pro rata portion of the line of credit, which is reflected in Miscellaneous Expense on the Statement of Operations, and is as follows:
Amount | |
Biotechnology Portfolio | $ 4,236 |
Health Care Portfolio | 5,868 |
Medical Delivery Portfolio | 2,700 |
Medical Equipment and Systems Portfolio | 2,506 |
Pharmaceuticals Portfolio | 497 |
During the period, there were no borrowings on this line of credit.
8. Security Lending.
Certain Funds lend portfolio securities from time to time in order to earn additional income. On the settlement date of the loan, each applicable Fund receives collateral (in the form of U.S. Treasury obligations, letters of credit and/or cash) against the loaned securities and maintains collateral in an amount not less than 100% of the market value of the loaned securities during the period of the loan. The market value of the loaned securities is determined at the close of business of the Funds and any additional required collateral is delivered to the Funds on the next business day. If the borrower defaults on its obligation to return the securities loaned because of insolvency or other reasons, a fund could experience delays and costs in recovering the securities loaned or in gaining access to the collateral. Any cash collateral received is invested in Fidelity Securities Lending Cash Central Fund. The value of loaned securities and cash collateral at period end are disclosed on each applicable Fund's Statement of Assets and Liabilities. Security lending income represents the income earned on investing cash collateral, less fees and expenses associated with the loan, plus any premium payments that may be received on the loan of certain types of securities. Security lending income is presented on each applicable Fund's Statement of Operations as a component of income from Fidelity Central Funds.
Annual Report
Notes to Financial Statements - continued
9. Bank Borrowings.
Each Fund is permitted to have bank borrowings for temporary or emergency purposes to fund shareholder redemptions. Each Fund has established borrowing arrangements with certain banks. The interest rate on the borrowings is the bank's base rate, as revised from time to time. Each applicable Fund's activity in this program during the period for which loans were outstanding was as follows:
Average Daily | Weighted Average Interest Rate | |
$ 1,422,250 | 5.25% | |
Medical Delivery Portfolio | 15,322,500 | 5.03% |
10. Expense Reductions.
Many of the brokers with whom FMR places trades on behalf of certain Funds provided services to these Funds in addition to trade execution. These services included payments of expenses on behalf of each applicable Fund. In addition, through arrangements with each applicable fund's custodian and transfer agent, credits realized as a result of uninvested cash balances were used to reduce each applicable fund's expenses. All of the applicable expense reductions are noted in the table below.
Brokerage | Custody | Transfer | Accounting | |
Biotechnology Portfolio | $ 21,077 | $ - | $ 25,010 | $ - |
Health Care Portfolio | 71,886 | 4,641 | 40,544 | - |
Medical Delivery Portfolio | 33,675 | - | 10,967 | - |
Medical Equipment and Systems Portfolio | 27,923 | - | 8,817 | - |
Pharmaceuticals Portfolio | 11,654 | - | 8,890 | - |
11. Other.
The Funds' organizational documents provide former and current trustees and officers with a limited indemnification against liabilities arising in connection with the performance of their duties to the Funds. In the normal course of business, the Funds may also enter into contracts that provide general indemnifications. The Funds' maximum exposure under these arrangements is unknown as this would be dependent on future claims that may be made against the Funds. The risk of material loss from such claims is considered remote.
The United States Securities and Exchange Commission ("SEC") is conducting an investigation of FMR (covering the years 2002 to 2004) arising from gifts, gratuities and business entertainment provided by certain brokers to certain individuals who were employed on FMR's domestic equity trading desk during that period. FMR is in discussions with the SEC staff regarding the possible resolution of the matter, but as of period-end no final resolution has been reached.
In December 2006, the Independent Trustees completed their own investigation of the matter with the assistance of independent counsel. The Independent Trustees and FMR agree that, despite the absence of proof that the Fidelity mutual funds experienced diminished execution quality as a result of the improper receipt of gifts and business entertainment, the conduct at issue was serious and is worthy of redress. Accordingly, the Independent Trustees have requested and FMR has agreed to pay $42 million to Fidelity mutual funds, plus interest to be determined at the time that payment is made. A method of allocating this payment among the funds has not yet been determined. The total payment to each of the Funds is not anticipated to have a material impact on such Fund's net assets. In addition, FMR reimbursed related legal expenses which are recorded in the accompanying Statement of Operations as an expense reduction.
Annual Report
Report of Independent Registered Public Accounting Firm
To the Trustees of Fidelity Select Portfolios and the Shareholders of Biotechnology Portfolio, Health Care Portfolio, Medical Delivery Portfolio, Medical Equipment and Systems Portfolio and Pharmaceuticals Portfolio:
In our opinion, the accompanying statements of assets and liabilities, including the schedules of investments, and the related statements of operations and of changes in net assets and the financial highlights present fairly, in all material respects, the financial position of Biotechnology Portfolio, Health Care Portfolio, Medical Delivery Portfolio, Medical Equipment and Systems Portfolio and Pharmaceuticals Portfolio (funds of Fidelity Select Portfolios) at February 28, 2007, the results of each of their operations for the year then ended, the changes in each of their net assets for each of the two years in the period then ended and the financial highlights for each of the five years in the period then ended, in conformity with accounting principles generally accepted in the United States of America. These financial statements and financial highlights (hereafter referred to as "financial statements") are the responsibility of the Fidelity Select Portfolios' management. Our responsibility is to express an opinion on these financial statements based on our audits. We conducted our audits of these financial statements in accordance with the standards of the Public Company Accounting Oversight Board (United States). Those standards require that we plan and perform the audit to obtain reasonable assurance about whether the financial statements are free of material misstatement. An audit includes examining, on a test basis, evidence supporting the amounts and disclosures in the financial statements, assessing the accounting principles used and significant estimates made by management, and evaluating the overall financial statement presentation. We believe that our audits, which included confirmation of securities at February 28, 2007 by correspondence with the custodian and brokers, provide a reasonable basis for our opinion.
/s/PricewaterhouseCoopers LLP
PricewaterhouseCoopers LLP
Boston, Massachusetts
April 20, 2007
Annual Report
Trustees and Officers
The Trustees, Member of the Advisory Board, and executive officers of the trust and funds, as applicable, are listed below. The Board of Trustees governs each fund and is responsible for protecting the interests of shareholders. The Trustees are experienced executives who meet periodically throughout the year to oversee each fund's activities, review contractual arrangements with companies that provide services to each fund, and review each fund's performance. Each of the Trustees oversees 349 funds advised by FMR or an affiliate.
The Trustees hold office without limit in time except that (a) any Trustee may resign; (b) any Trustee may be removed by written instrument, signed by at least two-thirds of the number of Trustees prior to such removal; (c) any Trustee who requests to be retired or who has become incapacitated by illness or injury may be retired by written instrument signed by a majority of the other Trustees; and (d) any Trustee may be removed at any special meeting of shareholders by a two-thirds vote of the outstanding voting securities of the trust. Each Trustee who is not an interested person (as defined in the 1940 Act) (Independent Trustee), shall retire not later than the last day of the calendar year in which his or her 72nd birthday occurs. The Independent Trustees may waive this mandatory retirement age policy with respect to individual Trustees. The executive officers and Advisory Board Member hold office without limit in time, except that any officer and Advisory Board Member may resign or may be removed by a vote of a majority of the Trustees at any regular meeting or any special meeting of the Trustees. Except as indicated, each individual has held the office shown or other offices in the same company for the past five years.
The funds' Statement of Additional Information (SAI) includes more information about the Trustees. To request a free copy, call Fidelity at 1-800-544-8544.
Interested Trustees*:
Correspondence intended for each Trustee who is an interested person may be sent to Fidelity Investments, 82 Devonshire Street, Boston, Massachusetts 02109.
Name, Age; Principal Occupation | |
Edward C. Johnson 3d (76) | |
Year of Election or Appointment: 1980 Mr. Johnson is Chairman of the Board of Trustees. Mr. Johnson serves as President (2006-present), Chief Executive Officer, Chairman, and a Director of FMR Corp.; Chairman and a Director of FMR; Chairman and a Director of Fidelity Research & Analysis Company (FRAC); Chairman and a Director of Fidelity Investments Money Management, Inc.; and Chairman (2001-present) and a Director of FMR Co., Inc. In addition, Mr. Johnson serves as Chairman and Director of Fidelity International Limited (FIL). | |
Robert L. Reynolds (54) | |
Year of Election or Appointment: 2003 Mr. Reynolds is President and a Director of FMR (2005-present), Fidelity Investments Money Management, Inc. (2005-present), and FMR Co., Inc. (2005-present). Mr. Reynolds also serves as Vice Chairman (2006-present), a Director (2003-present), and Chief Operating Officer of FMR Corp. and a Director of Strategic Advisers, Inc. (2005-present). He also serves on the Board at Fidelity Investments Canada, Ltd. | |
* Trustees have been determined to be "Interested Trustees" by virtue of, among other things, their affiliation with the trust or various entities under common control with FMR.
Independent Trustees:
Correspondence intended for each Independent Trustee (that is, the Trustees other than the Interested Trustees) may be sent to Fidelity Investments, P.O. Box 55235, Boston, Massachusetts 02205-5235.
Name, Age; Principal Occupation | |
Dennis J. Dirks (58) | |
Year of Election or Appointment: 2005 Prior to his retirement in May 2003, Mr. Dirks was Chief Operating Officer and a member of the Board of The Depository Trust & Clearing Corporation (DTCC) (1999-2003). He also served as President, Chief Operating Officer, and Board member of The Depository Trust Company (DTC) (1999-2003) and President and Board member of the National Securities Clearing Corporation (NSCC) (1999-2003). In addition, Mr. Dirks served as Chief Executive Officer and Board member of the Government Securities Clearing Corporation (2001-2003) and Chief Executive Officer and Board member of the Mortgage-Backed Securities Clearing Corporation (2001-2003). Mr. Dirks also serves as a Trustee and a member of the Finance Committee of Manhattan College (2005-present) and a Trustee and a member of the Finance Committee of AHRC of Nassau County (2006-present). | |
Albert R. Gamper, Jr. (64) | |
Year of Election or Appointment: 2006 Prior to his retirement in December 2004, Mr. Gamper served as Chairman of the Board of CIT Group Inc. (commercial finance). During his tenure with CIT Group Inc. Mr. Gamper served in numerous senior management positions, including Chairman (1987-1989; 1999-2001; 2002-2004), Chief Executive Officer (1987-2004), and President (1989-2002). He currently serves as a member of the Board of Directors of Public Service Enterprise Group (utilities, 2001-present), Chairman of the Board of Governors, Rutgers University (2004-present), and Chairman of the Board of Saint Barnabas Health Care System. | |
George H. Heilmeier (70) | |
Year of Election or Appointment: 2004 Dr. Heilmeier is Chairman Emeritus of Telcordia Technologies (communication software and systems), where prior to his retirement, he served as company Chairman and Chief Executive Officer. He currently serves on the Boards of Directors of The Mitre Corporation (systems engineering and information technology support for the government), and HRL Laboratories (private research and development, 2004-present). He is Chairman of the General Motors Science & Technology Advisory Board and a Life Fellow of the Institute of Electrical and Electronics Engineers (IEEE). Dr. Heilmeier is a member of the Defense Science Board and the National Security Agency Advisory Board. He is also a member of the National Academy of Engineering, the American Academy of Arts and Sciences, and the Board of Overseers of the School of Engineering and Applied Science of the University of Pennsylvania. Previously, Dr. Heilmeier served as a Director of TRW Inc. (automotive, space, defense, and information technology, 1992-2002), Compaq (1994-2002), Automatic Data Processing, Inc. (ADP) (technology-based business outsourcing, 1995-2002), INET Technologies Inc. (telecommunications network surveillance, 2001-2004), and Teletech Holdings (customer management services). He is the recipient of the 2005 Kyoto Prize in Advanced Technology for his invention of the liquid crystal display, and a member of the Consumer Electronics Hall of Fame. | |
James H. Keyes (66) | |
Year of Election or Appointment: 2007 Prior to his retirement in 2003, Mr. Keyes was Chairman, President, and Chief Executive Officer of Johnson Controls, Inc. (automotive supplier, 1993-2003). He currently serves as a member of the boards of LSI Logic Corporation (semiconductor technologies), Navistar International Corporation (manufacture and sale of trucks, buses, and diesel engines, 2002-present), and Pitney Bowes, Inc. (integrated mail, messaging, and document management solutions). | |
Marie L. Knowles (60) | |
Year of Election or Appointment: 2001 Prior to Ms. Knowles' retirement in June 2000, she served as Executive Vice President and Chief Financial Officer of Atlantic Richfield Company (ARCO) (diversified energy, 1996-2000). From 1993 to 1996, she was a Senior Vice President of ARCO and President of ARCO Transportation Company. She served as a Director of ARCO from 1996 to 1998. She currently serves as a Director of Phelps Dodge Corporation (copper mining and manufacturing) and McKesson Corporation (healthcare service, 2002-present). Ms. Knowles is a Trustee of the Brookings Institution and the Catalina Island Conservancy and also serves as a member of the Advisory Board for the School of Engineering of the University of Southern California. | |
Ned C. Lautenbach (63) | |
Year of Election or Appointment: 2000 Mr. Lautenbach is Chairman of the Independent Trustees (2006-present). Mr. Lautenbach has been a partner of Clayton, Dubilier & Rice, Inc. (private equity investment firm) since September 1998. Previously, Mr. Lautenbach was with the International Business Machines Corporation (IBM) from 1968 until his retirement in 1998. Mr. Lautenbach serves as a Director of Sony Corporation (2006-present) and Eaton Corporation (diversified industrial) as well as the Philharmonic Center for the Arts in Naples, Florida. He also is a member of the Board of Trustees of Fairfield University (2005-present), as well as a member of the Council on Foreign Relations. | |
Cornelia M. Small (62) | |
Year of Election or Appointment: 2005 Ms. Small is a member (2000-present) and Chairperson (2002-present) of the Investment Committee, and a member (2002-present) of the Board of Trustees of Smith College. Previously, she served as Chief Investment Officer (1999-2000), Director of Global Equity Investments (1996-1999), and a member of the Board of Directors of Scudder, Stevens & Clark (1990-1997) and Scudder Kemper Investments (1997-1999). In addition, Ms. Small served as Co-Chair (2000-2003) of the Annual Fund for the Fletcher School of Law and Diplomacy. | |
William S. Stavropoulos (67) | |
Year of Election or Appointment: 2001 Mr. Stavropoulos is Chairman Emeritus of the Board of Directors of The Dow Chemical Company. Since joining The Dow Chemical Company in 1967, Mr. Stavropoulos served in numerous senior management positions, including President (1993-2000; 2002-2003), CEO (1995-2000; 2002-2004), and Chairman of the Executive Committee (2000-2004). Currently, he is a Director of NCR Corporation (data warehousing and technology solutions), Chemical Financial Corporation, Maersk Inc. (industrial conglomerate, 2002-present), Tyco International, Inc. (multinational manufacturing and services, 2007-present), and a member of the Advisory Board for Metalmark Capital (private equity investment firm, 2005-present). He is a special advisor to Clayton, Dubilier & Rice, Inc., a private equity investment firm. He also serves as a member of the Board of Trustees of the American Enterprise Institute for Public Policy Research. In addition, Mr. Stavropoulos is a member of The Business Council, J.P. Morgan International Council and the University of Notre Dame Advisory Council for the College of Science. | |
Kenneth L. Wolfe (68) | |
Year of Election or Appointment: 2005 Prior to his retirement in 2001, Mr. Wolfe was Chairman and Chief Executive Officer of Hershey Foods Corporation (1993-2001). He currently serves as a member of the boards of Adelphia Communications Corporation (2003-present), Bausch & Lomb, Inc., and Revlon Inc. (2004-present). | |
Advisory Board Member and Executive Officers:
Correspondence intended for each executive officer and Mr. Lynch may be sent to Fidelity Investments, 82 Devonshire Street, Boston, Massachusetts 02109.
Name, Age; Principal Occupation | |
Peter S. Lynch (63) | |
Year of Election or Appointment: 2003 Member of the Advisory Board of Fidelity Select Portfolios. Mr. Lynch is Vice Chairman and a Director of FMR, and Vice Chairman (2001-present) and a Director of FMR Co., Inc. Previously, Mr. Lynch served as a Trustee of the Fidelity funds (1990-2003). In addition, he serves as a Trustee of Boston College and as the Chairman of the Inner-City Scholarship Fund. | |
Kimberley H. Monasterio (43) | |
Year of Election or Appointment: 2007 President and Treasurer of Select Biotechnology Portfolio, Select Health Care Portfolio, Select Medical Delivery Portfolio, Select Medical Equipment and Systems Portfolio, and Select Pharmaceuticals Portfolio. Ms. Monasterio also serves as President and Treasurer of other Fidelity funds (2007-present) and is an employee of FMR (2004-present). Previously, Ms. Monasterio served as Deputy Treasurer of the Fidelity funds (2004-2006). Before joining Fidelity Investments, Ms. Monasterio served as Treasurer (2000-2004) and Chief Financial Officer (2002-2004) of the Franklin Templeton Funds and Senior Vice President of Franklin Templeton Services, LLC (2000-2004). | |
Boyce I. Greer (51) | |
Year of Election or Appointment: 2005 Vice President of Select Biotechnology Portfolio, Select Health Care Portfolio, Select Medical Delivery Portfolio, Select Medical Equipment and Systems Portfolio, and Select Pharmaceuticals Portfolio. Mr. Greer also serves as Vice President of certain Equity Funds (2005-present), certain Asset Allocation Funds (2005-present), Fixed-Income Funds (2006-present), and Money Market Funds (2006-present). Mr. Greer is also a Trustee of other investment companies advised by FMR (2003-present). He is an Executive Vice President of FMR (2005-present) and FMR Co., Inc. (2005-present), and Senior Vice President of Fidelity Investments Money Management, Inc. (2006-present). Previously, Mr. Greer served as a Director and Managing Director of Strategic Advisers, Inc. (2002-2005), and Executive Vice President (2000-2002) and Money Market Group Leader (1997-2002) of the Fidelity Investments Fixed Income Division. He also served as Vice President of Fidelity's Money Market Funds (1997-2002), Senior Vice President of FMR (1997-2002), and Vice President of FIMM (1998-2002). | |
Eric D. Roiter (58) | |
Year of Election or Appointment: 1998 or 2001 Secretary of Select Biotechnology Portfolio (1998), Select Health Care Portfolio (1998), Select Medical Delivery Portfolio (1998), Select Medical Equipment and Systems Portfolio (1998), and Select Pharmaceuticals Portfolio (2001). He also serves as Secretary of other Fidelity funds; Vice President, General Counsel, and Secretary of FMR Co., Inc. (2001-present) and FMR; Assistant Secretary of Fidelity Management & Research (U.K.) Inc. (2001-present), Fidelity Research & Analysis Company (2001-present), and Fidelity Investments Money Management, Inc. (2001-present). Mr. Roiter is an Adjunct Member, Faculty of Law, at Boston College Law School (2003-present). Previously, Mr. Roiter served as Vice President and Secretary of Fidelity Distributors Corporation (FDC) (1998-2005). | |
Scott C. Goebel (39) | |
Year of Election or Appointment: 2007 Assistant Secretary of Select Biotechnology Portfolio, Select Health Care Portfolio, Select Medical Delivery Portfolio, Select Medical Equipment and Systems Portfolio, and Select Pharmaceuticals Portfolio. Mr. Goebel also serves as Assistant Secretary of other Fidelity funds (2007-present), Vice President and Secretary of FDC (2006-present), and is an employee of FMR. | |
R. Stephen Ganis (40) | |
Year of Election or Appointment: 2006 Anti-Money Laundering (AML) officer of Select Biotechnology Portfolio, Select Health Care Portfolio, Select Medical Delivery Portfolio, Select Medical Equipment and Systems Portfolio, and Select Pharmaceuticals Portfolio. Mr. Ganis also serves as AML officer of other Fidelity funds (2006-present) and FMR Corp. (2003-present). Before joining Fidelity Investments, Mr. Ganis practiced law at Goodwin Procter, LLP (2000-2002). | |
Joseph B. Hollis (58) | |
Year of Election or Appointment: 2006 Chief Financial Officer of Select Biotechnology Portfolio, Select Health Care Portfolio, Select Medical Delivery Portfolio, Select Medical Equipment and Systems Portfolio, and Select Pharmaceuticals Portfolio. Mr. Hollis also serves as Chief Financial Officer of other Fidelity funds. Mr. Hollis is President of Fidelity Pricing and Cash Management Services (FPCMS) (2005-present). Mr. Hollis also serves as President and Director of Fidelity Service Company, Inc. (2006-present). Previously, Mr. Hollis served as Senior Vice President of Cash Management Services (1999-2002) and Investment Management Operations (2002-2005). | |
Kenneth A. Rathgeber (59) | |
Year of Election or Appointment: 2004 Chief Compliance Officer of Select Biotechnology Portfolio, Select Health Care Portfolio, Select Medical Delivery Portfolio, Select Medical Equipment and Systems Portfolio, and Select Pharmaceuticals Portfolio. Mr. Rathgeber also serves as Chief Compliance Officer of other Fidelity funds (2004-present) and Executive Vice President of Risk Oversight for Fidelity Investments (2002-present). He is Chief Compliance Officer of FMR (2005-present), FMR Co., Inc. (2005-present), Fidelity Management & Research (U.K.) Inc. (2005-present), Fidelity Research & Analysis Company (2005-present), Fidelity Investments Money Management, Inc. (2005-present), and Strategic Advisers, Inc. (2005-present). Previously, Mr. Rathgeber served as Executive Vice President and Chief Operating Officer for Fidelity Investments Institutional Services Company, Inc. (1998-2002). | |
Bryan A. Mehrmann (45) | |
Year of Election or Appointment: 2005 Deputy Treasurer of Select Biotechnology Portfolio, Select Health Care Portfolio, Select Medical Delivery Portfolio, Select Medical Equipment and Systems Portfolio, and Select Pharmaceuticals Portfolio. Mr. Mehrmann also serves as Deputy Treasurer of other Fidelity funds (2005-present) and is an employee of FMR. Previously, Mr. Mehrmann served as Vice President of Fidelity Investments Institutional Services Group (FIIS)/Fidelity Investments Institutional Operations Corporation, Inc. (FIIOC) Client Services (1998-2004). | |
Kenneth B. Robins (37) | |
Year of Election or Appointment: 2005 Deputy Treasurer of Select Biotechnology Portfolio, Select Health Care Portfolio, Select Medical Delivery Portfolio, Select Medical Equipment and Systems Portfolio, and Select Pharmaceuticals Portfolio. Mr. Robins also serves as Deputy Treasurer of other Fidelity funds (2005-present) and is an employee of FMR (2004-present). Before joining Fidelity Investments, Mr. Robins worked at KPMG LLP, where he was a partner in KPMG's department of professional practice (2002-2004) and a Senior Manager (1999-2000). In addition, Mr. Robins served as Assistant Chief Accountant, United States Securities and Exchange Commission (2000-2002). | |
Robert G. Byrnes (40) | |
Year of Election or Appointment: 2005 Assistant Treasurer of Select Biotechnology Portfolio, Select Health Care Portfolio, Select Medical Delivery Portfolio, Select Medical Equipment and Systems Portfolio, and Select Pharmaceuticals Portfolio. Mr. Byrnes also serves as Assistant Treasurer of other Fidelity funds (2005-present) and is an employee of FMR (2005-present). Previously, Mr. Byrnes served as Vice President of FPCMS (2003-2005). Before joining Fidelity Investments, Mr. Byrnes worked at Deutsche Asset Management where he served as Vice President of the Investment Operations Group (2000-2003). | |
Peter L. Lydecker (53) | |
Year of Election or Appointment: 2004 Assistant Treasurer of Select Biotechnology Portfolio, Select Health Care Portfolio, Select Medical Delivery Portfolio, Select Medical Equipment and Systems Portfolio, and Select Pharmaceuticals Portfolio. Mr. Lydecker also serves as Assistant Treasurer of other Fidelity funds (2004) and is an employee of FMR. | |
Gary W. Ryan (48) | |
Year of Election or Appointment: 2005 Assistant Treasurer of Select Biotechnology Portfolio, Select Health Care Portfolio, Select Medical Delivery Portfolio, Select Medical Equipment and Systems Portfolio, and Select Pharmaceuticals Portfolio. Mr. Ryan also serves as Assistant Treasurer of other Fidelity funds (2005-present) and is an employee of FMR (2005-present). Previously, Mr. Ryan served as Vice President of Fund Reporting in FPCMS (1999-2005). | |
Salvatore Schiavone (41) | |
Year of Election or Appointment: 2005 Assistant Treasurer of Select Biotechnology Portfolio, Select Health Care Portfolio, Select Medical Delivery Portfolio, Select Medical Equipment and Systems Portfolio, and Select Pharmaceuticals Portfolio. Mr. Schiavone also serves as Assistant Treasurer of other Fidelity funds (2005-present) and is an employee of FMR (2005-present). Before joining Fidelity Investments, Mr. Schiavone worked at Deutsche Asset Management, where he most recently served as Assistant Treasurer (2003-2005) of the Scudder Funds and Vice President and Head of Fund Reporting (1996-2003). | |
Annual Report
Distributions
The Board of Trustees of each fund voted to pay to shareholders of record at the opening of business on record date, the following distributions per share derived from capital gains realized from sales of portfolio securities, and dividends derived from net investment income:
Pay Date | Record Date | Dividends | Capital Gains | |
Health Care | 04/16/2007 | 04/13/2007 | $0.18 | $4.33 |
Medical Delivery | 04/16/2007 | 04/13/2007 | $0.00 | $1.27 |
Medical Equipment and Systems | 04/16/2007 | 04/13/2007 | $0.00 | $0.64 |
Pharmaceuticals | 04/16/2007 | 04/13/2007 | $0.04 | $0.19 |
The funds hereby designate as capital gain dividend the amounts noted below for the taxable year ended February 28, 2007, or, if subsequently determined to be different, the net capital gain of such year.
Health Care | $ 127,121,259 |
Medical Delivery | $ 86,158,560 |
Medical Equipment and Systems | $ 66,797,910 |
Pharmaceuticals | $ 3,459,732 |
A percentage of the dividends distributed during the fiscal year for the following funds qualifies for the dividends-received deduction for corporate shareholders:
Health Care | |
April, 2006 | 64% |
December, 2006 | 100% |
Medical Delivery | |
April, 2006 | 2% |
Pharmaceuticals | |
April, 2006 | 22% |
December, 2006 | 100% |
A percentage of the dividends distributed during the fiscal year for the following funds may be taken into account as a dividend for purposes of the maximum rate under section 1(h)(11) of the Internal Revenue Code.
Health Care | |
April, 2006 | 64% |
December, 2006 | 100% |
Medical Delivery | |
April, 2006 | 3% |
Pharmaceuticals | |
April, 2006 | 43% |
December, 2006 | 100% |
The fund will notify shareholders in January 2008 of amounts for use in preparing 2007 income tax returns.
Annual Report
Proxy Voting Results
A special meeting of Fidelity Select Portfolios' shareholders was held on September 20, 2006. The results of votes taken among shareholders on the proposal before them are reported below. Each vote reported represents one dollar of net asset value held on the record date for the meeting.
PROPOSAL 1 | ||
To elect a Board of Trustees. A | ||
# of | % of | |
Dennis J. Dirks | ||
Affirmative | 13,182,341,755.09 | 94.980 |
Withheld | 696,736,162.41 | 5.020 |
TOTAL | 13,879,077,917.50 | 100.000 |
Albert R. Gamper, Jr. | ||
Affirmative | 13,177,593,614.43 | 94.946 |
Withheld | 701,484,303.07 | 5.054 |
TOTAL | 13,879,077,917.50 | 100.000 |
Robert M. Gates | ||
Affirmative | 13,141,235,622.81 | 94.684 |
Withheld | 737,842,294.69 | 5.316 |
TOTAL | 13,879,077,917.50 | 100.000 |
George H. Heilmeier | ||
Affirmative | 13,140,073,210.00 | 94.675 |
Withheld | 739,004,707.50 | 5.325 |
TOTAL | 13,879,077,917.50 | 100.000 |
Edward C. Johnson 3d | ||
Affirmative | 13,106,284,587.54 | 94.432 |
Withheld | 772,793,329.96 | 5.568 |
TOTAL | 13,879,077,917.50 | 100.000 |
Stephen P. Jonas | ||
Affirmative | 13,168,282,872.88 | 94.879 |
Withheld | 710,795,044.62 | 5.121 |
TOTAL | 13,879,077,917.50 | 100.000 |
James H. KeyesB | ||
Affirmative | 13,164,603,089.66 | 94.852 |
Withheld | 714,474,827.84 | 5.148 |
TOTAL | 13,879,077,917.50 | 100.000 |
Marie L. Knowles | ||
Affirmative | 13,169,356,779.66 | 94.886 |
Withheld | 709,721,137.84 | 5.114 |
TOTAL | 13,879,077,917.50 | 100.000 |
Ned C. Lautenbach | ||
Affirmative | 13,166,485,155.52 | 94.866 |
Withheld | 712,592,761.98 | 5.134 |
TOTAL | 13,879,077,917.50 | 100.000 |
William O. McCoy | ||
Affirmative | 13,129,548,996.59 | 94.600 |
Withheld | 749,528,920.91 | 5.400 |
TOTAL | 13,879,077,917.50 | 100.000 |
Robert L. Reynolds | ||
Affirmative | 13,180,813,649.06 | 94.969 |
Withheld | 698,264,268.44 | 5.031 |
TOTAL | 13,879,077,917.50 | 100.000 |
# of | % of | |
Cornelia M. Small | ||
Affirmative | 13,170,500,616.42 | 94.895 |
Withheld | 708,577,301.08 | 5.105 |
TOTAL | 13,879,077,917.50 | 100.000 |
William S. Stavropoulos | ||
Affirmative | 13,143,284,328.22 | 94.699 |
Withheld | 735,793,589.28 | 5.301 |
TOTAL | 13,879,077,917.50 | 100.000 |
Kenneth L. Wolfe | ||
Affirmative | 13,162,946,758.47 | 94.840 |
Withheld | 716,131,159.03 | 5.160 |
TOTAL | 13,879,077,917.50 | 100.000 |
A Denotes trust-wide proposal and voting results. B Effective on or about January 1, 2007. | ||
Annual Report
Managing Your Investments
Fidelity offers several ways to conveniently manage your personal investments via your telephone or PC. You can access your account information, conduct trades and research your investments 24 hours a day.
By Phone
Fidelity Automated Service Telephone provides a single toll-free number to access account balances, positions, quotes and trading. It's easy to navigate the service, and on your first call, the system will help you create a personal identification number (PIN) for security.
(phone_graphic)Fidelity Automated Service Telephone (FAST®)
1-800-544-5555
Press
1 For mutual fund and brokerage trading.
2 For quotes.*
3 For account balances and holdings.
4 To review orders and mutual fund activity.
5 To change your PIN.
*0 To speak to a Fidelity representative.
By PC
Fidelity's web site on the Internet provides a wide range of information, including daily financial news, fund performance, interactive planning tools and news about Fidelity products and services.
(computer_graphic)Fidelity's Web Site
www.fidelity.com
* When you call the quotes line, please remember that a fund's yield and return will vary and, except for money market funds, share price will also vary. This means that you may have a gain or loss when you sell your shares. There is no assurance that money market funds will be able to maintain a stable $1 share price; an investment in a money market fund is not insured or guaranteed by the U.S. government. Total returns are historical and include changes in share price, reinvestment of dividends and capital gains, and the effects of any sales charges.
Annual Report
To Write Fidelity
We'll give your correspondence immediate attention and send you written confirmation upon completion of your request.
(letter_graphic)Making Changes
To Your Account
(such as changing name, address, bank, etc.)
Fidelity Investments
P.O. Box 770001
Cincinnati, OH 45277-0002
(letter_graphic)For Non-Retirement
Accounts
Buying shares
Fidelity Investments
P.O. Box 770001
Cincinnati, OH 45277-0003
Overnight Express
Fidelity Investments
Attn: Distribution Services
100 Crosby Parkway - KC1H
Covington, KY 41015
Selling shares
Fidelity Investments
P.O. Box 770001
Cincinnati, OH 45277-0035
Overnight Express
Fidelity Investments
Attn: Distribution Services
100 Crosby Parkway - KC1H
Covington, KY 41015
General Correspondence
Fidelity Investments
P.O. Box 500
Merrimack, NH 03054-0500
(letter_graphic)For Retirement
Accounts
Buying shares
Fidelity Investments
P.O. Box 770001
Cincinnati, OH 45277-0003
Selling shares
Fidelity Investments
P.O. Box 770001
Cincinnati, OH 45277-0035
Overnight Express
Fidelity Investments
Attn: Distribution Services
100 Crosby Parkway - KC1H
Covington, KY 41015
General Correspondence
Fidelity Investments
P.O. Box 500
Merrimack, NH 03054-0500
Annual Report
To Visit Fidelity
For directions and hours,
please call 1-800-544-9797.
Arizona
7001 West Ray Road
Chandler, AZ
15445 N. Scottsdale Road
Scottsdale, AZ
California
815 East Birch Street
Brea, CA
1411 Chapin Avenue
Burlingame, CA
851 East Hamilton Avenue
Campbell, CA
19200 Von Karman Avenue
Irvine, CA
601 Larkspur Landing Circle
Larkspur, CA
10100 Santa Monica Blvd.
Los Angeles, CA
27101 Puerta Real
Mission Viejo, CA
73-575 El Paseo
Palm Desert, CA
251 University Avenue
Palo Alto, CA
123 South Lake Avenue
Pasadena, CA
16995 Bernardo Ctr. Drive
Rancho Bernardo, CA
1220 Roseville Parkway
Roseville, CA
1740 Arden Way
Sacramento, CA
7676 Hazard Center Drive
San Diego, CA
11943 El Camino Real
San Diego, CA
8 Montgomery Street
San Francisco, CA
3793 State Street
Santa Barbara, CA
1200 Wilshire Boulevard
Santa Monica, CA
21701 Hawthorne Boulevard
Torrance, CA
2001 North Main Street
Walnut Creek, CA
6300 Canoga Avenue
Woodland Hills, CA
Colorado
1625 Broadway
Denver, CO
9185 Westview Road
Lone Tree, CO
Connecticut
48 West Putnam Avenue
Greenwich, CT
265 Church Street
New Haven, CT
300 Atlantic Street
Stamford, CT
29 South Main Street
West Hartford, CT
Delaware
400 Delaware Avenue
Wilmington, DE
Florida
4400 N. Federal Highway
Boca Raton, FL
121 Alhambra Plaza
Coral Gables, FL
2948 N. Federal Highway
Ft. Lauderdale, FL
4671 Town Center Parkway
Jacksonville, FL
1907 West State Road 434
Longwood, FL
8880 Tamiami Trail, North
Naples, FL
3501 PGA Boulevard
Palm Beach Gardens, FL
3550 Tamiami Trail, South
Sarasota, FL
1502 N. Westshore Blvd.
Tampa, FL
2465 State Road 7
Wellington, FL
Georgia
3445 Peachtree Road, N.E.
Atlanta, GA
1000 Abernathy Road
Atlanta, GA
Illinois
One North LaSalle Street
Chicago, IL
875 North Michigan Ave.
Chicago, IL
1415 West 22nd Street
Oak Brook, IL
1572 East Golf Road
Schaumburg, IL
3232 Lake Avenue
Wilmette, IL
Indiana
4729 East 82nd Street
Indianapolis, IN
Kansas
5400 College Boulevard
Overland Park, KS
Maine
Three Canal Plaza
Portland, ME
Maryland
7315 Wisconsin Avenue
Bethesda, MD
One W. Pennsylvania Ave.
Towson, MD
Massachusetts
801 Boylston Street
Boston, MA
155 Congress Street
Boston, MA
300 Granite Street
Braintree, MA
44 Mall Road
Burlington, MA
238 Main Street
Cambridge, MA
405 Cochituate Road
Framingham, MA
416 Belmont Street
Worcester, MA
Michigan
500 E. Eisenhower Pkwy.
Ann Arbor, MI
280 Old N. Woodward Ave.
Birmingham, MI
43420 Grand River Avenue
Novi, MI
29155 Northwestern Hwy.
Southfield, MI
Minnesota
7600 France Avenue South
Edina, MN
Missouri
1524 South Lindbergh Blvd.
St. Louis, MO
Nevada
2225 Village Walk Drive
Henderson, NV
New Jersey
150 Essex Street
Millburn, NJ
56 South Street
Morristown, NJ
396 Route 17, North
Paramus, NJ
3518 Route 1 North
Princeton, NJ
530 Broad Street
Shrewsbury, NJ
New York
1055 Franklin Avenue
Garden City, NY
37 West Jericho Turnpike
Huntington Station, NY
1271 Avenue of the Americas
New York, NY
980 Madison Avenue
New York, NY
61 Broadway
New York, NY
350 Park Avenue
New York, NY
200 Fifth Avenue
New York, NY
733 Third Avenue
New York, NY
11 Penn Plaza
New York, NY
2070 Broadway
New York, NY
1075 Northern Blvd.
Roslyn, NY
799 Central Park Avenue
Scarsdale, NY
North Carolina
4611 Sharon Road
Charlotte, NC
7011 Fayetteville Road
Durham, NC
Ohio
3805 Edwards Road
Cincinnati, OH
1324 Polaris Parkway
Columbus, OH
28699 Chagrin Boulevard
Woodmere Village, OH
Oregon
7493 SW Bridgeport Road
Tigard, OR
Pennsylvania
600 West DeKalb Pike
King of Prussia, PA
1735 Market Street
Philadelphia, PA
12001 Perry Highway
Wexford, PA
Rhode Island
47 Providence Place
Providence, RI
Tennessee
6150 Poplar Avenue
Memphis, TN
Texas
10000 Research Boulevard
Austin, TX
4001 Northwest Parkway
Dallas, TX
12532 Memorial Drive
Houston, TX
2701 Drexel Drive
Houston, TX
6560 Fannin Street
Houston, TX
6500 N. MacArthur Blvd.
Irving, TX
6005 West Park Boulevard
Plano, TX
14100 San Pedro
San Antonio, TX
1576 East Southlake Blvd.
Southlake, TX
19740 IH 45 North
Spring, TX
Utah
279 West South Temple
Salt Lake City, UT
Virginia
1861 International Drive
McLean, VA
Washington
411 108th Avenue, N.E.
Bellevue, WA
1518 6th Avenue
Seattle, WA
Washington, DC
1900 K Street, N.W.
Washington, DC
Wisconsin
595 North Barker Road
Brookfield, WI
Annual Report
Fidelity Brokerage Services, Inc., 100 Summer St., Boston, MA 02110 Member NYSE/SIPC
Investment Adviser
Fidelity Management & Research Company
Boston, MA
Investment Sub-Advisers
FMR Co., Inc.
Fidelity Management & Research
(U.K.) Inc.
Fidelity Research & Analysis Company
Fidelity Investments Japan Limited
Fidelity International Investment Advisors
Fidelity International Investment Advisors
(U.K. Limited)
General Distributor
Fidelity Distributors Corporation
Boston, MA
Transfer and Service Agent
Fidelity Service Company, Inc.
Boston, MA
Custodian
Brown Brothers Harriman & Co.
Boston, MA
Corporate Headquarters
82 Devonshire Street
Boston, MA 02109
1-800-544-8888
The Fidelity Telephone Connection
Mutual Fund 24-Hour Service
Exchanges/Redemptions
and Account Assistance 1-800-544-6666
Product Information 1-800-544-8888
Retirement Accounts 1-800-544-4774
(8 a.m. - 9 p.m.)
TDD Service 1-800-544-0118
for the deaf and hearing impaired
(9 a.m. - 9 p.m. Eastern time)
Fidelity Automated Service
Telephone (FAST®) (automated graphic) 1-800-544-5555
(automated graphic) Automated line for quickest service
(Fidelity Investment logo)(registered trademark)
Corporate Headquarters
82 Devonshire St., Boston, MA 02109
www.fidelity.com
SELHC-UANN-0407
1.813639.102
Fidelity®
Select Portfolios®
Financials Sector
Select Banking Portfolio
Select Brokerage and Investment Management Portfolio
Select Financial Services Portfolio
Select Home Finance Portfolio
Select Insurance Portfolio
Annual Report
February 28, 2007
(2_fidelity_logos) (Registered_Trademark)
Contents
Chairman's Message | ||
Notes to Shareholders | ||
Shareholder Expense Example | ||
Fund Updates* | ||
Financials Sector | ||
Banking | ||
Brokerage and Investment Management | ||
Financial Services | ||
Home Finance | ||
Insurance | ||
Notes to Financial Statements | ||
Report of Independent Registered Public Accounting Firm | ||
Trustees and Officers | ||
Distributions | ||
Proxy Voting Results |
* Fund updates for each Select Portfolio include: Performance, Management's Discussion of Fund Performance, Investment Changes, Investments, and Financial Statements.
To view a fund's proxy voting guidelines and proxy voting record for the 12-month period ended June 30, visit www.fidelity.com/proxyvotingresults or visit the Securities and Exchange Commission's (SEC) web site at www.sec.gov. You may also call 1-800-544-8544 to request a free copy of the proxy voting guidelines.
Standard & Poor's, S&P and S&P 500 are registered service marks of The McGraw-Hill Companies, Inc. and have been licensed for use by Fidelity Distributors Corporation.
Other third party marks appearing herein are the property of their respective owners.
All other marks appearing herein are registered or unregistered trademarks or service marks of FMR Corp. or an affiliated company.
This report and the financial statements contained herein are submitted for the general information of the shareholders of the funds. This report is not authorized for distribution to prospective investors in the funds unless preceded or accompanied by an effective prospectus.
A fund files its complete schedule of portfolio holdings with the SEC for the first and third quarters of each fiscal year on Form N-Q. Forms N-Q are available on the SEC's web site at http://www.sec.gov. A fund's Forms N-Q may be reviewed and copied at the SEC's Public Reference Room in Washington, DC. Information regarding the operation of the SEC's Public Reference Room may be obtained by calling 1-800-SEC-0330. For a complete list of a fund's portfolio holdings, view the most recent quarterly holdings report, semiannual report, or annual report on Fidelity's web site at http://www.fidelity.com/holdings.
NOT FDIC INSURED · MAY LOSE VALUE · NO BANK GUARANTEE
Neither the funds nor Fidelity Distributors Corporation is a bank.
Semiannual Report
Chairman's Message
(Photograph of Edward C. Johnson 3d.)
Dear Shareholder:
Substantial single-day losses are not uncommon in the equity markets, and when they occur - as in late February - investors can be better served in the long term by buying good stocks at lower prices than by moving their money to the sidelines. While financial markets are always unpredictable, there are a number of time-tested principles that can put the historical odds in your favor.
One of the basic tenets is to invest for the long term. Over time, riding out the markets' inevitable ups and downs has proven much more effective than selling into panic or chasing the hottest trend. Even missing only a few of the markets' best days can significantly diminish investor returns. Patience also affords the benefits of compounding - of earning interest on additional income or reinvested dividends and capital gains. There are tax advantages and cost benefits to consider as well. The more you sell, the more taxes you pay, and the more you trade, the higher the costs. While staying the course doesn't eliminate risk, it can considerably lessen the effect of short-term declines.
You can further manage your investing risk through diversification. And today, more than ever, geographic diversification should be taken into account. Studies
indicate that asset allocation is the single most important determinant of a portfolio's long-term success. The right mix of stocks, bonds and cash - aligned to your particular risk tolerance and investment objective - is very important. Age-appropriate rebalancing is also an essential aspect of asset allocation. For younger investors, an emphasis on equities - which historically have been the best performing asset class over time - is encouraged. As investors near their specific goal, such as retirement or sending a child to college, consideration may be given to replacing volatile assets (e.g. common stocks) with more-stable fixed investments (bonds or savings plans).
A third investment principle - investing regularly - can help lower the average cost of your purchases. Investing a certain amount of money each month or quarter helps ensure you won't pay for all your shares at market highs. This strategy - known as dollar cost averaging - also reduces unconstructive "emotion" from investing, helping shareholders avoid selling weak performers just prior to an upswing, or chasing a hot performer just before a correction.
We invite you to contact us via the Internet, through our Investor Centers or over the phone. It is our privilege to provide you the information you need to make the investments that are right for you.
Sincerely,
/s/Edward C. Johnson 3d
Edward C. Johnson 3d
Annual Report
Notes to Shareholders:
Effective October 1, 2006, Fidelity restructured the Fidelity® Select Portfolios® equity product line. The restructuring aligned the equity funds' investment goals more closely with standard industry classifications and facilitated adoption of more-specific benchmark indexes to evaluate fund performance. As restructured, the equity funds generally align under the 10 sectors in the widely recognized Global Industry Classification Standard (GICS), developed by Standard & Poor's® (S&P®) and Morgan Stanley Capital InternationalSM (MSCI®): Consumer Discretionary, Consumer Staples, Energy, Financials, Health Care, Industrials, Information Technology, Materials, Telecommunications Services and Utilities. Changes to the funds ranged from simply adopting a new supplemental benchmark to, in some cases, changing investment policies and fund names.
For Banking, Communications Equipment (formerly Developing Communications), Construction and Housing, Consumer Discretionary (formerly Consumer Industries), Consumer Staples (formerly Food and Agriculture), Home Finance, Industrials (formerly Cyclical Industries), IT Services (formerly Business Services and Outsourcing) and Materials (formerly Industrial Materials), shareholders approved certain fundamental investment policy changes related to the restructuring at a special meeting of shareholders held September 20, 2006. All the equity funds adopted new benchmark indexes from MSCI, except for Gold (which adopted an S&P/Citigroup index), Natural Gas (which adopted an S&P index) and Natural Resources (which retained its current Goldman Sachs® index). Taken together, the name, policy and benchmark changes will make it easier for investors to distinguish funds in the product line and to evaluate Fidelity Management & Research Company's skill in managing the funds.
The Select equity portfolios also eliminated hourly pricing. The funds now price each business day as of the close of the New York Stock Exchange, normally 4:00 pm Eastern time. The funds also adopted Fidelity's standard fund market timing policy, as described in the funds' current prospectus, and removed the $7.50 fee formerly charged on exchanges made through non-automated channels.
Changes for each fund in the GICS Financials Sector are described in detail below.
Banking
Shareholders approved modernizing the fund's definition of banking to better reflect its focus on the banking industry, including commercial banks and financial institutions providing mortgage and mortgage-related services. The fund is now benchmarked to the MSCI US Investable Market Banks Index.
Brokerage and Investment Management
The fund is now benchmarked to the MSCI US Investable Market Capital Markets Index.
Financial Services
The fund is now benchmarked to the MSCI US Investable Market Financials Index.
Home Finance
Shareholders approved modernizing the fund's definition of mortgage finance to better reflect its investment focus. The fund is now benchmarked to the MSCI US Investable Market Thrifts & Mortgage Finance Index.
Insurance
The fund is now benchmarked to the MSCI US Investable Market Insurance Index.
Not Part of Annual Report
Shareholder Expense Example
As a shareholder of a Fund, you incur two types of costs: (1) transaction costs, including redemption fees, exchange fees, and (2) ongoing costs, including management fees and other Fund expenses. This Example is intended to help you understand your ongoing costs (in dollars) of investing in the Funds and to compare these costs with the ongoing costs of investing in other mutual funds.
The Example is based on an investment of $1,000 invested at the beginning of the period and held for the entire period (September 1, 2006 to February 28, 2007).
Actual Expenses
The first line of the accompanying table for each fund provides information about actual account values and actual expenses. You may use the information in this line, together with the amount you invested, to estimate the expenses that you paid over the period. Simply divide your account value by $1,000.00 (for example, an $8,600 account value divided by $1,000.00 = 8.6), then multiply the result by the number in the first line for a fund under the heading entitled "Expenses Paid During Period" to estimate the expenses you paid on your account during this period. A small balance maintenance fee of $12.00 that is charged once a year may apply for certain accounts with a value of less than $2,000. This fee is not included in the table below. If it was, the estimate of expenses you paid during the period would be higher, and your ending account value lower, by this amount.
Hypothetical Example for Comparison Purposes
The second line of the accompanying table for each fund provides information about hypothetical account values and hypothetical expenses based on a fund's actual expense ratio and an assumed rate of return of 5% per year before expenses, which is not the Fund's actual return. The hypothetical account values and expenses may not be used to estimate the actual ending account balance or expenses you paid for the period. You may use this information to compare the ongoing costs of investing in the Fund and other funds. To do so, compare this 5% hypothetical example with the 5% hypothetical examples that appear in the shareholder reports of the other funds. A small balance maintenance fee of $12.00 that is charged once a year may apply for certain accounts with a value of less than $2,000. This fee is not included in the table below. If it was, the estimate of expenses you paid during the period would be higher, and your ending account value lower, by this amount.
Please note that the expenses shown in the table are meant to highlight your ongoing costs only and do not reflect any transaction costs. Therefore, the second line of the table is useful in comparing ongoing costs only, and will not help you determine the relative total costs of owning different funds. In addition, if these transactional costs were included, your costs would have been higher.
Beginning | Ending | Expenses Paid | |
Banking Portfolio | |||
Actual | $ 1,000.00 | $ 1,044.20 | $ 4.61 |
HypotheticalA | $ 1,000.00 | $ 1,020.28 | $ 4.56 |
Brokerage and Investment Management Portfolio | |||
Actual | $ 1,000.00 | $ 1,140.80 | $ 4.72 |
HypotheticalA | $ 1,000.00 | $ 1,020.38 | $ 4.46 |
Financial Services Portfolio | |||
Actual | $ 1,000.00 | $ 1,087.90 | $ 4.71 |
HypotheticalA | $ 1,000.00 | $ 1,020.28 | $ 4.56 |
Home Finance Portfolio | |||
Actual | $ 1,000.00 | $ 1,059.00 | $ 4.70 |
HypotheticalA | $ 1,000.00 | $ 1,020.23 | $ 4.61 |
Insurance Portfolio | |||
Actual | $ 1,000.00 | $ 1,077.10 | $ 4.94 |
HypotheticalA | $ 1,000.00 | $ 1,020.03 | $ 4.81 |
A 5% return per year before expenses
* Expenses are equal to each Fund's annualized expense ratio (shown in the table below); multiplied by the average account value over the period, multiplied by 181/365 (to reflect the one-half year period).
Annualized | |
Banking Portfolio | .91% |
Brokerage and Investment Management Portfolio | .89% |
Financial Services Portfolio | .91% |
Home Finance Portfolio | .92% |
Insurance Portfolio | .96% |
Annual Report
Performance
Average annual total return reflects the change in the value of an investment, assuming reinvestment of the fund's dividend income and capital gains (the profits earned upon the sale of securities that have grown in value) and assuming a constant rate of performance each year. The $10,000 table and the fund's returns do not reflect the deduction of taxes that a shareholder would pay on fund distributions or the redemption of fund shares. During periods of reimbursement by Fidelity a fund's total returns will be greater than it would be had the reimbursement not occurred. How a fund did yesterday is no guarantee of how it will do tomorrow.
Average Annual Total Returns
Periods ended February 28, 2007 | Past 1 | Past 5 | Past 10 |
Select Banking Portfolio | 8.23% | 8.66% | 8.94% |
$10,000 Over 10 Years
Let's say hypothetically that $10,000 was invested in Select Banking Portfolio on February 28, 1997. The chart shows how the value of your investment would have changed, and also shows how the S&P 500® Index performed over the same period.
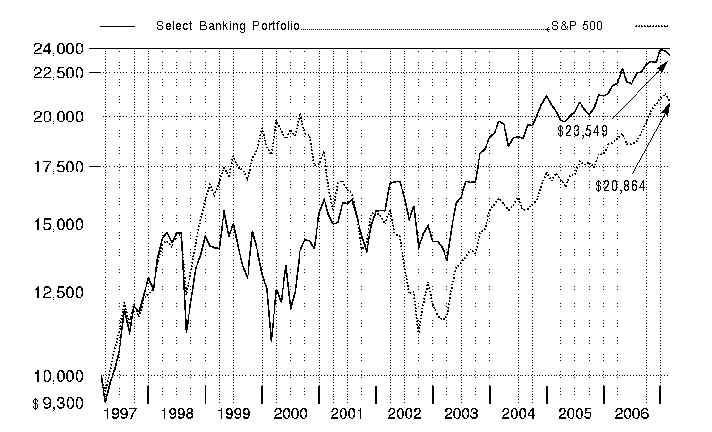
Annual Report
Management's Discussion of Fund Performance
Comments from Ramona Persaud, Portfolio Manager of Fidelity® Select Banking Portfolio
A rosy year for stocks wilted just prior to the end of the 12-month period ending February 28, 2007. On the day prior to the period's close, the Dow Jones Industrial AverageSM plunged 416 points and the Standard & Poor's 500SM Index lost roughly 3.5% of its value, plummeting nearly 50 points and marking the benchmark's worst single-day performance since the day the market reopened after the 9/11 terrorist attacks. Though investors were obviously rattled by the development, it was only the 22nd-biggest decline for the S&P 500® in 20 years, and it could not overshadow how well stocks performed for the 12 months overall. For much of the past year, investors grew confident that the economy would not fall into a recession, and they bid up most broad-based stock indexes for six consecutive months from August through January. Overall for the year ending February 28, 2007, the S&P 500 was up 11.97%, the Dow advanced 14.24%, the small-cap Russell 2000® Index gained 9.87% and the NASDAQ Composite® Index rose 6.66%.
For the 12 months ending February 28, 2007, the fund returned 8.23%, roughly in line with the 8.88% gain of the Morgan Stanley Capital InternationalSM (MSCI®) US Investable Market Banks Index and below the 9.86% advance of a blended index specific to this fund. This blended index is a combination of the Goldman Sachs® Financial Services Index, which the fund was compared with through September, and the new MSCI benchmark mentioned above, which the fund was compared with during the period's final five months1. The fund lagged the S&P 500 over the past 12 months. The main factors behind the fund's underperformance of the Goldman Sachs index during the first seven months were overweighting regional banks and underweighting investment banking/brokerage stocks and real estate investment trusts (REITs). Underweighting the life and health insurance, consumer finance and thrifts/mortgage finance groups helped the fund's relative return. Stocks that detracted included Utah-based Zions Bancorp, California-based City National and not owning Morgan Stanley or Goldman Sachs, investment banking/brokerage firms in the index. Wells Fargo and Texas Regional Bancshares helped performance, as did underweighting insurance firm American International Group (AIG). During the last five months of the period, the fund outperformed its new MSCI Banks index due to strong security selection in diversified banks and asset management/custody banks. Performance was held back by less-successful security selection among regional banks. Contributors during this time frame included underweighting thrift/mortgage financing firm Freddie Mac, as well as overweighted investments in California-based First Republic Bank, Alabama-based Compass Bancshares and National Australia Bank. Not owning thrift/mortgage finance company and index component Sovereign Bancorp hurt relative performance, as did underweighting Mercantile Bankshares and holding Wells Fargo.
1 The fund's blended index is a customized index developed by Fidelity for the limited purpose of discussing the fund's performance for the 12-month period ending February 28, 2007. From March 1, 2006, through September 30, 2006, the fund compared its performance to the Goldman Sachs Financial Services Index, which returned 7.66% during that period. On October 1, 2006, the fund began comparing its performance to a different index, the MSCI US Investable Market Banks Index, which returned 2.04% from October 1, 2006, through February 28, 2007. For the 12-month period ending February 28, 2007, the blended index (Goldman Sachs and MSCI) returned 9.86%.
The views expressed above reflect those of the portfolio manager(s) only through the end of the period as stated on the cover of this report and do not necessarily represent the views of Fidelity or any other person in the Fidelity organization. Any such views are subject to change at any time based upon market or other conditions and Fidelity disclaims any responsibility to update such views. These views may not be relied on as investment advice and, because investment decisions for a Fidelity fund are based on numerous factors, may not be relied on as an indication of trading intent on behalf of any Fidelity fund.
Annual Report
Select Banking Portfolio
Investment Changes
Top Ten Stocks as of February 28, 2007 | ||
% of fund's | % of fund's net assets | |
Wells Fargo & Co. | 13.9 | 7.7 |
Wachovia Corp. | 10.9 | 5.9 |
U.S. Bancorp, Delaware | 5.8 | 2.0 |
Fannie Mae | 4.7 | 0.0 |
PNC Financial Services Group, Inc. | 4.2 | 4.9 |
Countrywide Financial Corp. | 3.1 | 0.0 |
SunTrust Banks, Inc. | 2.9 | 3.0 |
Regions Financial Corp. | 2.5 | 1.7 |
BB&T Corp. | 2.1 | 2.7 |
National City Corp. | 1.9 | 1.4 |
52.0 | ||
Top Industries (% of fund's net assets) |
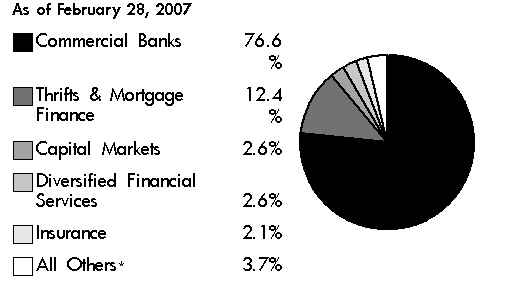

* Includes short-term investments and net other assets. |
Annual Report
Select Banking Portfolio
Investments February 28, 2007
Showing Percentage of Net Assets
Common Stocks - 96.8% | |||
Shares | Value | ||
CAPITAL MARKETS - 2.6% | |||
Asset Management & Custody Banks - 1.9% | |||
Bank of New York Co., Inc. | 21,716 | $ 882,104 | |
Franklin Resources, Inc. | 7,300 | 856,947 | |
Investors Financial Services Corp. | 25,700 | 1,504,478 | |
Mellon Financial Corp. | 19,900 | 864,257 | |
Northern Trust Corp. | 29,100 | 1,754,730 | |
State Street Corp. | 12,700 | 831,977 | |
6,694,493 | |||
Diversified Capital Markets - 0.4% | |||
UBS AG (NY Shares) | 23,900 | 1,411,056 | |
Investment Banking & Brokerage - 0.3% | |||
Macquarie Bank Ltd. | 13,400 | 834,018 | |
TOTAL CAPITAL MARKETS | 8,939,567 | ||
COMMERCIAL BANKS - 76.6% | |||
Diversified Banks - 35.1% | |||
Allied Irish Banks PLC sponsored ADR | 15,100 | 899,356 | |
Alpha Bank AE | 33,300 | 1,026,774 | |
Anglo Irish Bank Corp. PLC | 42,100 | 896,980 | |
Bank Hapoalim BM (Reg.) | 232,000 | 1,071,954 | |
Bank of Piraeus | 31,000 | 1,066,620 | |
Comerica, Inc. | 20,800 | 1,256,112 | |
DnB Nor ASA | 12,000 | 162,382 | |
EFG Eurobank Ergasias SA | 27,600 | 1,024,146 | |
ICICI Bank Ltd. | 57,137 | 1,079,443 | |
Kookmin Bank sponsored ADR | 3,900 | 348,426 | |
National Australia Bank Ltd. Sponsored ADR | 11,100 | 1,761,903 | |
Societe Generale Series A | 7,200 | 1,213,311 | |
Sumitomo Trust & Banking Co. Ltd. | 83,000 | 936,205 | |
Turkiye Garanti Bankasi AS | 87,000 | 332,484 | |
U.S. Bancorp, Delaware (d) | 568,200 | 20,262,012 | |
Uniao de Bancos Brasileiros SA (Unibanco) GDR | 19,400 | 1,658,312 | |
Unicredito Italiano Spa | 112,400 | 1,041,956 | |
Wachovia Corp. | 689,592 | 38,182,709 | |
Wells Fargo & Co. | 1,394,800 | 48,399,560 | |
122,620,645 | |||
Regional Banks - 41.5% | |||
Associated Banc-Corp. | 58,820 | 2,033,996 | |
BancorpSouth, Inc. | 49,900 | 1,242,510 | |
Bank of Georgia unit (a) | 40,100 | 1,082,700 | |
Bank of Hawaii Corp. | 26,500 | 1,370,580 | |
Bank of Yokohama Ltd. | 49,000 | 398,668 | |
Banner Corp. | 24,300 | 1,013,553 | |
BB&T Corp. | 171,542 | 7,287,104 | |
BOK Financial Corp. | 26,700 | 1,338,471 | |
Boston Private Financial Holdings, Inc. | 61,900 | 1,785,815 | |
Cascade Bancorp (d) | 42,550 | 1,107,151 | |
Shares | Value | ||
Cathay General Bancorp | 28,300 | $ 960,219 | |
Center Financial Corp., California | 45,100 | 973,709 | |
Chiba Bank Ltd. | 22,000 | 208,950 | |
City National Corp. | 30,700 | 2,215,926 | |
Colonial Bancgroup, Inc. | 102,500 | 2,647,575 | |
Columbia Banking Systems, Inc. | 17,000 | 573,240 | |
Commerce Bancorp, Inc., New Jersey | 102,400 | 3,422,208 | |
Community Bank of Nevada (a) | 16,200 | 503,334 | |
Compass Bancshares, Inc. | 75,510 | 5,210,945 | |
Crescent Banking Co. | 4,600 | 200,560 | |
Cullen/Frost Bankers, Inc. | 37,800 | 2,044,224 | |
East West Bancorp, Inc. | 59,300 | 2,210,111 | |
Fidelity Southern Corp. | 19,000 | 359,290 | |
Fifth Third Bancorp | 110,800 | 4,463,024 | |
First Charter Corp. | 19,900 | 479,789 | |
First Community Bancorp, California | 37,000 | 2,008,360 | |
First Republic Bank, California | 20,800 | 1,114,880 | |
Frontier Financial Corp., Washington | 44,450 | 1,162,812 | |
Fulton Financial Corp. | 136,900 | 2,104,153 | |
GB&T Bancshares, Inc. | 9,800 | 188,454 | |
Glacier Bancorp, Inc. | 33,500 | 819,075 | |
Hanmi Financial Corp. | 33,000 | 644,490 | |
Home Bancshares, Inc. (d) | 15,600 | 356,304 | |
IBERIABANK Corp. | 12,800 | 691,584 | |
KeyCorp | 112,700 | 4,253,298 | |
M&T Bank Corp. | 33,800 | 4,053,296 | |
Marshall & Ilsley Corp. | 108,900 | 5,176,017 | |
Metrocorp Bancshares, Inc. | 18,900 | 381,591 | |
Nara Bancorp, Inc. | 47,300 | 875,523 | |
National City Corp. | 171,589 | 6,494,644 | |
Placer Sierra Bancshares | 21,300 | 576,804 | |
PNC Financial Services Group, Inc. | 200,700 | 14,713,317 | |
Preferred Bank, Los Angeles California | 13,200 | 544,236 | |
PrivateBancorp, Inc. | 35,000 | 1,281,700 | |
Prosperity Bancshares, Inc. | 29,100 | 1,011,807 | |
Regions Financial Corp. | 241,171 | 8,638,745 | |
Seacoast Banking Corp., Florida (d) | 21,600 | 512,568 | |
Signature Bank, New York (a) | 27,000 | 829,440 | |
South Financial Group, Inc. | 46,900 | 1,255,982 | |
Sterling Bancshares, Inc. | 70,450 | 814,402 | |
Sterling Financial Corp., Washington | 32,200 | 1,059,058 | |
SunTrust Banks, Inc. | 118,848 | 10,020,075 | |
SVB Financial Group (a) | 48,200 | 2,328,060 | |
Synovus Financial Corp. | 141,200 | 4,570,644 | |
TCF Financial Corp. | 74,400 | 1,967,136 | |
Texas Capital Bancshares, Inc. (a) | 27,300 | 549,549 | |
Tokyo Tomin Bank Ltd. | 45,300 | 1,871,025 | |
Trustmark Corp. | 8,000 | 228,800 | |
UCBH Holdings, Inc. | 57,200 | 1,090,232 | |
UMB Financial Corp. | 23,700 | 894,201 | |
Umpqua Holdings Corp. | 53,400 | 1,442,334 | |
UnionBanCal Corp. | 36,600 | 2,238,822 | |
Valley National Bancorp | 70,595 | 1,777,582 | |
Westamerica Bancorp. | 34,000 | 1,669,400 | |
Common Stocks - continued | |||
Shares | Value | ||
COMMERCIAL BANKS - CONTINUED | |||
Regional Banks - continued | |||
Western Alliance Bancorp. (a) | 31,700 | $ 1,063,218 | |
Whitney Holding Corp. | 53,300 | 1,690,676 | |
Wilshire Bancorp, Inc. | 16,400 | 279,456 | |
Zions Bancorp | 54,901 | 4,687,447 | |
145,064,849 | |||
TOTAL COMMERCIAL BANKS | 267,685,494 | ||
CONSUMER FINANCE - 0.3% | |||
Consumer Finance - 0.3% | |||
Capital One Financial Corp. | 15,738 | 1,213,085 | |
DIVERSIFIED FINANCIAL SERVICES - 2.6% | |||
Other Diversifed Financial Services - 2.4% | |||
African Bank Investments Ltd. | 135,400 | 516,951 | |
Bank of America Corp. | 84,169 | 4,281,677 | |
Citigroup, Inc. | 16,900 | 851,760 | |
FirstRand Ltd. | 178,700 | 592,041 | |
JPMorgan Chase & Co. | 36,026 | 1,779,684 | |
Kotak Mahindra Bank Ltd. sponsored GDR (e) | 18,732 | 179,778 | |
8,201,891 | |||
Specialized Finance - 0.2% | |||
Singapore Exchange Ltd. | 160,000 | 711,553 | |
TOTAL DIVERSIFIED FINANCIAL SERVICES | 8,913,444 | ||
INSURANCE - 2.1% | |||
Insurance Brokers - 0.3% | |||
Willis Group Holdings Ltd. | 24,600 | 976,620 | |
Life & Health Insurance - 0.1% | |||
Lincoln National Corp. | 5,200 | 354,380 | |
Multi-Line Insurance - 0.1% | |||
American International Group, Inc. | 5,100 | 342,210 | |
Property & Casualty Insurance - 0.5% | |||
Aspen Insurance Holdings Ltd. | 33,600 | 890,400 | |
The Travelers Companies, Inc. | 17,500 | 888,300 | |
1,778,700 | |||
Reinsurance - 1.1% | |||
Endurance Specialty Holdings Ltd. | 25,200 | 893,592 | |
IPC Holdings Ltd. | 37,000 | 1,075,220 | |
Platinum Underwriters Holdings Ltd. | 64,900 | 2,073,555 | |
4,042,367 | |||
TOTAL INSURANCE | 7,494,277 | ||
REAL ESTATE INVESTMENT TRUSTS - 0.2% | |||
Mortgage REITs - 0.2% | |||
CapitalSource, Inc. (d) | 26,600 | 686,014 | |
Shares | Value | ||
THRIFTS & MORTGAGE FINANCE - 12.4% | |||
Thrifts & Mortgage Finance - 12.4% | |||
BankAtlantic Bancorp, Inc. Class A (non-vtg.) | 58,800 | $ 750,288 | |
BankUnited Financial Corp. Class A | 33,500 | 818,070 | |
Countrywide Financial Corp. | 279,374 | 10,694,437 | |
Fannie Mae | 292,000 | 16,565,160 | |
Franklin Bank Corp. | 36,000 | 664,200 | |
Freddie Mac | 80,900 | 5,192,162 | |
Fremont General Corp. | 50,300 | 442,640 | |
Hudson City Bancorp, Inc. | 308,600 | 4,135,240 | |
IndyMac Bancorp, Inc. | 33,000 | 1,132,890 | |
NetBank, Inc. | 57,900 | 186,438 | |
People's Bank | 29,500 | 1,309,505 | |
Webster Financial Corp. | 28,600 | 1,412,554 | |
43,303,584 | |||
TOTAL COMMON STOCKS (Cost $268,427,573) | 338,235,465 | ||
Money Market Funds - 8.3% | |||
Fidelity Cash Central Fund, 5.35% (b) | 13,059,278 | 13,059,278 | |
Fidelity Securities Lending Cash Central Fund, 5.34% (b)(c) | 15,731,675 | 15,731,675 | |
TOTAL MONEY MARKET FUNDS (Cost $28,790,953) | 28,790,953 | ||
TOTAL INVESTMENT PORTFOLIO - 105.1% (Cost $297,218,526) | 367,026,418 |
NET OTHER ASSETS - (5.1)% | (17,755,504) | ||
NET ASSETS - 100% | $ 349,270,914 | ||
Legend |
(a) Non-income producing |
(b) Affiliated fund that is available only to investment companies and other accounts managed by Fidelity Investments. The rate quoted is the annualized seven-day yield of the fund at period end. A complete unaudited listing of the fund's holdings as of its most recent quarter end is available upon request. |
(c) Investment made with cash collateral received from securities on loan. |
(d) Security or a portion of the security is on loan at period end. |
(e) Security exempt from registration under Rule 144A of the Securities Act of 1933. These securities may be resold in transactions exempt from registration, normally to qualified institutional buyers. At the end of the period, the value of these securities amounted to $179,778 or 0.1% of net assets. |
Affiliated Central Funds |
Information regarding fiscal year to date income earned by the Fund from investments in Fidelity Central Funds is as follows: |
Fund | Income earned |
Fidelity Cash Central Fund | $ 799,582 |
Fidelity Securities Lending Cash Central Fund | 61,673 |
Total | $ 861,255 |
See accompanying notes which are an integral part of the financial statements.
Annual Report
Financial Statements
Statement of Assets and Liabilities
February 28, 2007 | ||
Assets | ||
Investment in securities, at value (including securities loaned of $15,362,486) - See accompanying schedule: Unaffiliated issuers (cost $268,427,573) | $ 338,235,465 | |
Fidelity Central Funds (cost $28,790,953) | 28,790,953 | |
Total Investments (cost $297,218,526) | $ 367,026,418 | |
Receivable for investments sold | 17,325 | |
Receivable for fund shares sold | 122,385 | |
Dividends receivable | 1,144,483 | |
Distributions receivable from Fidelity Central Funds | 50,509 | |
Prepaid expenses | 1,541 | |
Other receivables | 7,702 | |
Total assets | 368,370,363 | |
Liabilities | ||
Payable to custodian bank | $ 55,180 | |
Payable for investments purchased | 1,753,634 | |
Payable for fund shares redeemed | 1,251,123 | |
Accrued management fee | 169,179 | |
Other affiliated payables | 90,388 | |
Other payables and accrued expenses | 48,270 | |
Collateral on securities loaned, at value | 15,731,675 | |
Total liabilities | 19,099,449 | |
Net Assets | $ 349,270,914 | |
Net Assets consist of: | ||
Paid in capital | $ 258,072,347 | |
Undistributed net investment income | 2,602,015 | |
Accumulated undistributed net realized gain (loss) on investments and foreign currency transactions | 18,814,329 | |
Net unrealized appreciation (depreciation) on investments and assets and liabilities in foreign currencies | 69,782,223 | |
Net Assets, for 10,420,614 shares outstanding | $ 349,270,914 | |
Net Asset Value, offering price and redemption price per share ($349,270,914 ÷ 10,420,614 shares) | $ 33.52 | |
Statement of Operations
Year ended February 28, 2007 | ||
Investment Income | ||
Dividends | $ 10,632,068 | |
Interest | 27 | |
Income from Fidelity Central Funds | 861,255 | |
Total income | 11,493,350 | |
Expenses | ||
Management fee | $ 2,120,724 | |
Transfer agent fees | 1,024,935 | |
Accounting and security lending fees | 173,709 | |
Custodian fees and expenses | 62,995 | |
Independent trustees' compensation | 1,436 | |
Registration fees | 33,008 | |
Audit | 36,604 | |
Legal | 6,962 | |
Miscellaneous | 22,228 | |
Total expenses before reductions | 3,482,601 | |
Expense reductions | (56,576) | 3,426,025 |
Net investment income (loss) | 8,067,325 | |
Realized and Unrealized Gain (Loss) Net realized gain (loss) on: | ||
Investment securities: | ||
Unaffiliated issuers (net of foreign taxes of $46,359) | 65,381,502 | |
Foreign currency transactions | 28,700 | |
Total net realized gain (loss) | 65,410,202 | |
Change in net unrealized appreciation (depreciation) on: Investment securities (net of increase in deferred foreign taxes of $25,759) | (43,368,811) | |
Assets and liabilities in foreign currencies | 206 | |
Total change in net unrealized appreciation (depreciation) | (43,368,605) | |
Net gain (loss) | 22,041,597 | |
Net increase (decrease) in net assets resulting from operations | $ 30,108,922 | |
See accompanying notes which are an integral part of the financial statements.
Annual Report
Statement of Changes in Net Assets
Year ended | Year ended | |
Increase (Decrease) in Net Assets | ||
Operations | ||
Net investment income (loss) | $ 8,067,325 | $ 8,332,734 |
Net realized gain (loss) | 65,410,202 | 39,193,239 |
Change in net unrealized appreciation (depreciation) | (43,368,605) | (20,357,590) |
Net increase (decrease) in net assets resulting from operations | 30,108,922 | 27,168,383 |
Distributions to shareholders from net investment income | (6,850,404) | (6,336,315) |
Distributions to shareholders from net realized gain | (51,988,884) | (32,980,078) |
Total distributions | (58,839,288) | (39,316,393) |
Share transactions | 139,550,400 | 85,190,205 |
Reinvestment of distributions | 55,233,195 | 37,286,501 |
Cost of shares redeemed | (183,848,844) | (218,870,245) |
Net increase (decrease) in net assets resulting from share transactions | 10,934,751 | (96,393,539) |
Redemption fees | 57,667 | 41,260 |
Total increase (decrease) in net assets | (17,737,948) | (108,500,289) |
Net Assets | ||
Beginning of period | 367,008,862 | 475,509,151 |
End of period (including undistributed net investment income of $2,602,015 and undistributed net investment income of $3,248,767, respectively) | $ 349,270,914 | $ 367,008,862 |
Other Information Shares | ||
Sold | 3,797,777 | 2,286,589 |
Issued in reinvestment of distributions | 1,648,055 | 1,042,335 |
Redeemed | (5,022,905) | (5,850,883) |
Net increase (decrease) | 422,927 | (2,521,959) |
Financial Highlights
Years ended February 28, | 2007 | 2006 | 2005 | 2004 G | 2003 |
Selected Per-Share Data | |||||
Net asset value, beginning of period | $ 36.71 | $ 37.98 | $ 40.80 | $ 29.86 | $ 33.26 |
Income from Investment Operations | |||||
Net investment income (loss) C | .78 | .76 | .67 | .52 | .50 |
Net realized and unrealized gain (loss) | 2.12 | 1.82 | .54 | 11.36 | (3.57) |
Total from investment operations | 2.90 | 2.58 | 1.21 | 11.88 | (3.07) |
Distributions from net investment income | (.71) | (.62) | (.57) | (.48) | (.34) |
Distributions from net realized gain | (5.39) | (3.23) | (3.46) | (.46) | - |
Total distributions | (6.10) | (3.85) | (4.03) | (.94) | (.34) |
Redemption fees added to paid in capital C | .01 | - H | - H | - H | .01 |
Net asset value, end of period | $ 33.52 | $ 36.71 | $ 37.98 | $ 40.80 | $ 29.86 |
Total Return A,B | 8.23% | 7.22% | 2.68% | 40.08% | (9.24)% |
Ratios to Average Net Assets D,F | |||||
Expenses before reductions | .93% | .94% | .95% | 1.08% | 1.11% |
Expenses net of fee waivers, if any | .93% | .94% | .95% | 1.08% | 1.11% |
Expenses net of all reductions | .91% | .92% | .94% | 1.07% | 1.10% |
Net investment income (loss) | 2.15% | 2.04% | 1.70% | 1.46% | 1.54% |
Supplemental Data | |||||
Net assets, end of period (000 omitted) | $ 349,271 | $ 367,009 | $ 475,509 | $ 489,376 | $ 383,138 |
Portfolio turnover rate E | 112% | 70% | 51% | 28% | 33% |
A Total returns would have been lower had certain expenses not been reduced during the periods shown. B Total returns do not include the effect of the former sales charges. C Calculated based on average shares outstanding during the period. D Fees and expenses of the underlying Fidelity Central Funds are not included in the Fund's expense ratio. The Fund indirectly bears its proportionate share of the expenses of any underlying Fidelity Central Funds. E Amount does not include the portfolio activity of any underlying Fidelity Central Funds. F Expense ratios reflect operating expenses of the Fund. Expenses before reductions do not reflect amounts reimbursed by the investment adviser or reductions from brokerage service arrangements or other expense offset arrangements and do not represent the amount paid by the Fund during periods when reimbursements or reductions occur. Expenses net of fee waivers reflect expenses after reimbursement by the investment adviser but prior to reductions from brokerage service arrangements or other expense offset arrangements. Expenses net of all reductions represent the net expenses paid by the Fund. G For the year ended February 29. H Amount represents less than $.01 per share. |
See accompanying notes which are an integral part of the financial statements.
Annual Report
Select Brokerage and Investment Management Portfolio
Performance
Average annual total return reflects the change in the value of an investment, assuming reinvestment of the fund's dividend income and capital gains (the profits earned upon the sale of securities that have grown in value) and assuming a constant rate of performance each year. The $10,000 table and the fund's returns do not reflect the deduction of taxes that a shareholder would pay on fund distributions or the redemption of fund shares. During periods of reimbursement by Fidelity a fund's total returns will be greater than it would be had the reimbursement not occurred. How a fund did yesterday is no guarantee of how it will do tomorrow.
Average Annual Total Returns
Periods ended February 28, 2007 | Past 1 | Past 5 | Past 10 |
Select Brokerage and Investment Management Portfolio | 9.27% | 15.97% | 16.72% |
$10,000 Over 10 Years
Let's say hypothetically that $10,000 was invested in Select Brokerage and Investment Management Portfolio on February 28, 1997. The chart shows how the value of your investment would have changed, and also shows how the S&P 500 Index performed over the same period.
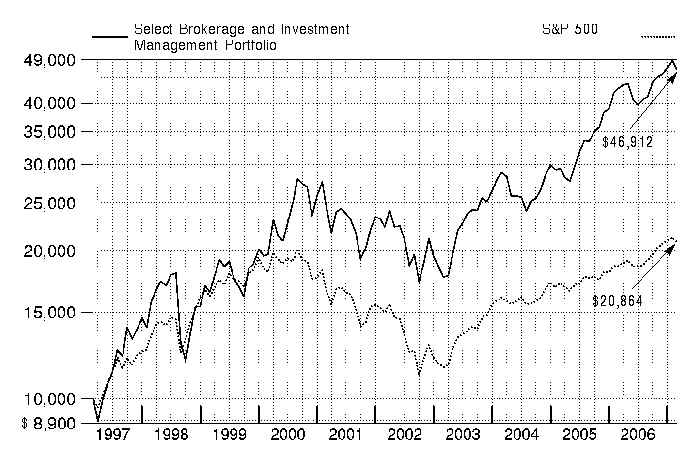
Annual Report
Select Brokerage and Investment Management Portfolio
Management's Discussion of Fund Performance
Comments from Yolanda Taylor, Portfolio Manager of Fidelity® Select Brokerage and Investment Management Portfolio
A rosy year for stocks wilted just prior to the end of the 12-month period ending February 28, 2007. On the day prior to the period's close, the Dow Jones Industrial AverageSM plunged 416 points and the Standard & Poor's 500SM Index lost roughly 3.5% of its value, plummeting nearly 50 points and marking the benchmark's worst single-day performance since the day the market reopened after the 9/11 terrorist attacks. Though investors were obviously rattled by the development, it was only the 22nd-biggest decline for the S&P 500® in 20 years, and it could not overshadow how well stocks performed for the 12 months overall. For much of the past year, investors grew confident that the economy would not fall into a recession, and they bid up most broad-based stock indexes for six consecutive months from August through January. Overall for the year ending February 28, 2007, the S&P 500 was up 11.97%, the Dow advanced 14.24%, the small-cap Russell 2000® Index gained 9.87% and the NASDAQ Composite® Index rose 6.66%.
For the 12 months that ended February 28, 2007, Select Brokerage and Investment Management Portfolio produced a total return of 9.27%, trailing the S&P 500 and the 16.66% gain of the Morgan Stanley Capital InternationalSM(MSCI®) US Investable Market Capital Markets Index. During the same period, a blended index specific to this fund returned 16.54%. This blended index is a combination of the Goldman Sachs® Financial Services Index, which the fund was compared with through September 2006, and the new MSCI benchmark mentioned above, which the fund was compared with during the period's final five months.1 During the first seven months of the review period, the fund underperformed the Goldman Sachs index principally because several of the more volatile investment banks and brokerage stocks in which the fund was heavily overweighted struggled. Leading detractors included TD Ameritrade, E*TRADE and optionsXpress, all of which suffered as electronic trading activity declined. In addition, shares of the NASDAQ Stock Market declined when an anticipated acquisition deal was called off. Helping during these seven months were investments in IntercontinentalExchange - an electronic exchange for energy futures trading - asset manager T. Rowe Price and investment bank Morgan Stanley. A primary reason the fund trailed its new MSCI Capital Markets index during the final five months was the underweighting, due to diversification requirements, of several strong-performing investment banks and brokerages that were major index components. The low exposure to Goldman Sachs relative to the index was an example. Other investments that detracted over the five months included Jefferies Group, a small investment bank whose earnings suffered as a result of expenditures to diversify its business, and Swiss-based UBS, which was similarly affected by business expansion costs. On the positive side, contributors during the final five months included boutique investment bank Lazard, as well as Julius Baer and Credit Suisse, two Swiss-based companies whose wealth management businesses flourished. I sold the NASDAQ and T. Rowe Price investments before the period's end.
1 The fund's blended index is a customized index developed by Fidelity for the limited purpose of discussing the fund's performance for the 12-month period ending February 28, 2007. From March 1, 2006, through September 30, 2006, the fund compared its performance to the Goldman Sachs Financial Services Index, which returned 7.66% during that period. On October 1, 2006, the fund began comparing its performance to a different index, the MSCI US Investable Market Capital Markets Index, which returned 8.25% from October 1, 2006, through February 28, 2007. For the 12-month period ending February 28, 2007, the blended index (Goldman Sachs and MSCI) returned 16.54%.
The views expressed above reflect those of the portfolio manager(s) only through the end of the period as stated on the cover of this report and do not necessarily represent the views of Fidelity or any other person in the Fidelity organization. Any such views are subject to change at any time based upon market or other conditions and Fidelity disclaims any responsibility to update such views. These views may not be relied on as investment advice and, because investment decisions for a Fidelity fund are based on numerous factors, may not be relied on as an indication of trading intent on behalf of any Fidelity fund.
Annual Report
Select Brokerage and Investment Management Portfolio
Investment Changes
Top Ten Stocks as of February 28, 2007 | ||
% of fund's | % of fund's net assets | |
State Street Corp. | 5.9 | 2.5 |
Bank of New York Co., Inc. | 5.2 | 0.0 |
Morgan Stanley | 4.9 | 6.0 |
Charles Schwab Corp. | 4.9 | 5.0 |
Julius Baer Holding AG (Bearer) | 4.9 | 0.0 |
Goldman Sachs Group, Inc. | 4.9 | 0.0 |
Franklin Resources, Inc. | 4.6 | 5.1 |
Bear Stearns Companies, Inc. | 4.4 | 0.0 |
Merrill Lynch & Co., Inc. | 4.4 | 5.0 |
Greenhill & Co., Inc. | 4.3 | 3.3 |
48.4 | ||
Top Industries (% of fund's net assets) |
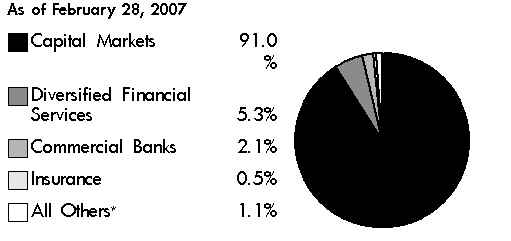
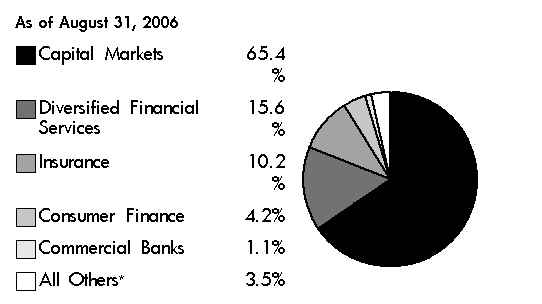
* Includes short-term investments and net other assets. |
Annual Report
Select Brokerage and Investment Management Portfolio
Investments February 28, 2007
Showing Percentage of Net Assets
Common Stocks - 98.9% | |||
Shares | Value | ||
CAPITAL MARKETS - 91.0% | |||
Asset Management & Custody Banks - 43.6% | |||
Affiliated Managers Group, Inc. (a)(d) | 310,400 | $ 35,230,400 | |
AllianceBernstein Holding LP | 229,900 | 19,725,420 | |
American Capital Strategies Ltd. (d) | 1,070,400 | 47,611,392 | |
Ameriprise Financial, Inc. | 672,700 | 39,326,042 | |
Ashmore Group plc | 1,322,100 | 7,077,188 | |
Bank of New York Co., Inc. | 1,591,900 | 64,662,978 | |
EFG International (a) | 685,820 | 24,562,907 | |
Franklin Resources, Inc. | 487,900 | 57,274,581 | |
Investors Financial Services Corp. | 221,707 | 12,978,728 | |
Julius Baer Holding AG (Bearer) | 483,771 | 61,168,501 | |
KKR Private Equity Investors, LP Restricted Depositary Units (e) | 104,600 | 2,526,090 | |
Legg Mason, Inc. (d) | 78,348 | 8,049,474 | |
Mellon Financial Corp. | 1,100,600 | 47,799,058 | |
Northern Trust Corp. | 531,700 | 32,061,510 | |
Nuveen Investments, Inc. Class A | 254,400 | 12,386,736 | |
State Street Corp. | 1,126,600 | 73,803,564 | |
546,244,569 | |||
Diversified Capital Markets - 7.1% | |||
Credit Suisse Group sponsored ADR | 712,400 | 49,333,700 | |
UBS AG (NY Shares) | 663,000 | 39,143,520 | |
88,477,220 | |||
Investment Banking & Brokerage - 40.3% | |||
Bear Stearns Companies, Inc. (d) | 362,800 | 55,232,672 | |
Charles Schwab Corp. | 3,322,900 | 61,407,192 | |
Cowen Group, Inc. | 644,900 | 12,794,816 | |
E*TRADE Financial Corp. | 1,100 | 25,399 | |
GFI Group, Inc. (a)(d) | 91,700 | 5,649,637 | |
Goldman Sachs Group, Inc. | 302,700 | 61,024,320 | |
Greenhill & Co., Inc. (d) | 803,700 | 54,153,306 | |
Jefferies Group, Inc. | 1,628,700 | 44,056,335 | |
Lazard Ltd. Class A | 650,300 | 33,483,947 | |
Lehman Brothers Holdings, Inc. | 690,000 | 50,577,000 | |
Merrill Lynch & Co., Inc. | 650,550 | 54,438,024 | |
Morgan Stanley | 819,700 | 61,411,924 | |
optionsXpress Holdings, Inc. | 185,693 | 4,309,935 | |
TD Ameritrade Holding Corp. | 649 | 10,384 | |
Thomas Weisel Partners Group, Inc. (d) | 337,085 | 6,141,689 | |
TradeStation Group, Inc. (a) | 2,113 | 24,976 | |
504,741,556 | |||
TOTAL CAPITAL MARKETS | 1,139,463,345 | ||
COMMERCIAL BANKS - 2.1% | |||
Diversified Banks - 1.1% | |||
Barclays PLC | 904,700 | 13,238,023 | |
Shares | Value | ||
Industrial & Commercial Bank of China | 756,000 | $ 417,041 | |
Societe Generale Series A | 100 | 16,852 | |
13,671,916 | |||
Regional Banks - 1.0% | |||
City National Corp. | 181,200 | 13,079,016 | |
TOTAL COMMERCIAL BANKS | 26,750,932 | ||
DIVERSIFIED FINANCIAL SERVICES - 5.3% | |||
Other Diversifed Financial Services - 2.4% | |||
Citigroup, Inc. | 346,300 | 17,453,520 | |
JPMorgan Chase & Co. | 263,900 | 13,036,660 | |
30,490,180 | |||
Specialized Finance - 2.9% | |||
Fortress Investment Group LLC | 783,994 | 23,676,619 | |
IntercontinentalExchange, Inc. (a) | 1,112 | 167,745 | |
Moody's Corp. | 183,600 | 11,882,592 | |
NYMEX Holdings, Inc. (d) | 600 | 77,040 | |
35,803,996 | |||
TOTAL DIVERSIFIED FINANCIAL SERVICES | 66,294,176 | ||
INSURANCE - 0.5% | |||
Property & Casualty Insurance - 0.5% | |||
AMBAC Financial Group, Inc. | 71,200 | 6,239,968 | |
TOTAL COMMON STOCKS (Cost $1,062,328,727) | 1,238,748,421 | ||
Money Market Funds - 13.9% | |||
Fidelity Cash Central Fund, 5.35% (b) | 56,660,795 | 56,660,795 | |
Fidelity Securities Lending Cash Central Fund, 5.34% (b)(c) | 117,895,975 | 117,895,975 | |
TOTAL MONEY MARKET FUNDS (Cost $174,556,770) | 174,556,770 | ||
TOTAL INVESTMENT PORTFOLIO - 112.8% (Cost $1,236,885,497) | 1,413,305,191 |
NET OTHER ASSETS - (12.8)% | (160,740,439) | ||
NET ASSETS - 100% | $ 1,252,564,752 | ||
Legend |
(a) Non-income producing |
(b) Affiliated fund that is available only to investment companies and other accounts managed by Fidelity Investments. The rate quoted is the annualized seven-day yield of the fund at period end. A complete unaudited listing of the fund's holdings as of its most recent quarter end is available upon request. |
(c) Investment made with cash collateral received from securities on loan. |
(d) Security or a portion of the security is on loan at period end. |
(e) Security exempt from registration under Rule 144A of the Securities Act of 1933. These securities may be resold in transactions exempt from registration, normally to qualified institutional buyers. At the end of the period, the value of these securities amounted to $2,526,090 or 0.2% of net assets. |
Affiliated Central Funds |
Information regarding fiscal year to date income earned by the Fund from investments in Fidelity Central Funds is as follows: |
Fund | Income earned |
Fidelity Cash Central Fund | $ 2,403,355 |
Fidelity Securities Lending Cash Central Fund | 830,530 |
Total | $ 3,233,885 |
Other Information |
Distribution of investments by country of issue, as a percentage of total net assets, is as follows: |
United States of America | 81.4% |
Switzerland | 14.0% |
Bermuda | 2.7% |
United Kingdom | 1.9% |
Others (individually less than 1%) | 0.0% |
100.0% |
See accompanying notes which are an integral part of the financial statements.
Annual Report
Select Brokerage and Investment Management Portfolio
Financial Statements
Statement of Assets and Liabilities
February 28, 2007 | ||
Assets | ||
Investment in securities, at value (including securities loaned of $115,702,512) - See accompanying schedule: Unaffiliated issuers (cost $1,062,328,727) | $ 1,238,748,421 | |
Fidelity Central Funds (cost $174,556,770) | 174,556,770 | |
Total Investments (cost $1,236,885,497) | $ 1,413,305,191 | |
Foreign currency held at value (cost $11,366) | 11,363 | |
Receivable for investments sold | 2,363,308 | |
Receivable for fund shares sold | 6,416,838 | |
Dividends receivable | 1,485,265 | |
Distributions receivable from Fidelity Central Funds | 330,078 | |
Prepaid expenses | 3,669 | |
Other receivables | 70,363 | |
Total assets | 1,423,986,075 | |
Liabilities | ||
Payable for investments purchased | $ 40,969,364 | |
Payable for fund shares redeemed | 11,551,958 | |
Accrued management fee | 624,387 | |
Other affiliated payables | 303,039 | |
Other payables and accrued expenses | 76,600 | |
Collateral on securities loaned, at value | 117,895,975 | |
Total liabilities | 171,421,323 | |
Net Assets | $ 1,252,564,752 | |
Net Assets consist of: | ||
Paid in capital | $ 1,014,217,711 | |
Undistributed net investment income | 4,700,292 | |
Accumulated undistributed net realized gain (loss) on investments and foreign currency transactions | 57,229,003 | |
Net unrealized appreciation (depreciation) on investments and assets and liabilities in foreign currencies | 176,417,746 | |
Net Assets, for 16,996,990 shares outstanding | $ 1,252,564,752 | |
Net Asset Value, offering price and redemption price per share ($1,252,564,752 ÷ 16,996,990 shares) | $ 73.69 | |
Statement of Operations
Year ended February 28, 2007 | ||
Investment Income | ||
Dividends | $ 15,827,117 | |
Interest | 25,263 | |
Income from Fidelity Central Funds | 3,233,885 | |
Total income | 19,086,265 | |
Expenses | ||
Management fee | $ 6,333,827 | |
Transfer agent fees | 2,954,767 | |
Accounting and security lending fees | 438,001 | |
Custodian fees and expenses | 79,407 | |
Independent trustees' compensation | 3,960 | |
Registration fees | 113,207 | |
Audit | 45,188 | |
Legal | 29,086 | |
Interest | 38,578 | |
Miscellaneous | 47,799 | |
Total expenses before reductions | 10,083,820 | |
Expense reductions | (149,253) | 9,934,567 |
Net investment income (loss) | 9,151,698 | |
Realized and Unrealized Gain (Loss) Net realized gain (loss) on: | ||
Investment securities: | ||
Unaffiliated issuers (net of foreign taxes of $473,330) | 154,478,970 | |
Foreign currency transactions | (87,732) | |
Total net realized gain (loss) | 154,391,238 | |
Change in net unrealized appreciation (depreciation) on: Investment securities (net of decrease in deferred foreign taxes of $149,940) | (77,208,155) | |
Assets and liabilities in foreign currencies | (2,568) | |
Total change in net unrealized appreciation (depreciation) | (77,210,723) | |
Net gain (loss) | 77,180,515 | |
Net increase (decrease) in net assets resulting from operations | $ 86,332,213 | |
See accompanying notes which are an integral part of the financial statements.
Annual Report
Select Brokerage and Investment Management Portfolio
Financial Statements - continued
Statement of Changes in Net Assets
Year ended | Year ended | |
Increase (Decrease) in Net Assets | ||
Operations | ||
Net investment income (loss) | $ 9,151,698 | $ 9,820,701 |
Net realized gain (loss) | 154,391,238 | 103,309,298 |
Change in net unrealized appreciation (depreciation) | (77,210,723) | 153,341,117 |
Net increase (decrease) in net assets resulting from operations | 86,332,213 | 266,471,116 |
Distributions to shareholders from net investment income | (9,257,191) | (2,635,364) |
Distributions to shareholders from net realized gain | (134,546,271) | (49,077,063) |
Total distributions | (143,803,462) | (51,712,427) |
Share transactions | 1,025,478,285 | 905,653,225 |
Reinvestment of distributions | 137,702,286 | 49,399,557 |
Cost of shares redeemed | (1,099,716,887) | (338,928,303) |
Net increase (decrease) in net assets resulting from share transactions | 63,463,684 | 616,124,479 |
Redemption fees | 274,372 | 178,219 |
Total increase (decrease) in net assets | 6,266,807 | 831,061,387 |
Net Assets | ||
Beginning of period | 1,246,297,945 | 415,236,558 |
End of period (including undistributed net investment income of $4,700,292 and undistributed net investment income of $7,022,564, respectively) | $ 1,252,564,752 | $ 1,246,297,945 |
Other Information Shares | ||
Sold | 13,617,953 | 13,298,513 |
Issued in reinvestment of distributions | 1,869,952 | 708,725 |
Redeemed | (14,864,176) | (5,190,450) |
Net increase (decrease) | 623,729 | 8,816,788 |
Financial Highlights
Years ended February 28, | 2007 | 2006 | 2005 | 2004 H | 2003 |
Selected Per-Share Data | |||||
Net asset value, beginning of period | $ 76.12 | $ 54.95 | $ 54.13 | $ 33.22 | $ 42.32 |
Income from Investment Operations | |||||
Net investment income (loss) C | .61 | .98 F | .20 | .17 | .30 |
Net realized and unrealized gain (loss) | 6.18 | 23.81 | .85 | 20.88 | (9.19) |
Total from investment operations | 6.79 | 24.79 | 1.05 | 21.05 | (8.89) |
Distributions from net investment income | (.59) | (.19) | (.24) | (.16) | (.23) |
Distributions from net realized gain | (8.65) | (3.45) | - | - | - |
Total distributions | (9.24) | (3.64) | (.24) | (.16) | (.23) |
Redemption fees added to paid in capital C | .02 | .02 | .01 | .02 | .02 |
Net asset value, end of period | $ 73.69 | $ 76.12 | $ 54.95 | $ 54.13 | $ 33.22 |
Total Return A,B | 9.27% | 45.77% | 1.96% | 63.56% | (21.02)% |
Ratios to Average Net Assets D,G | |||||
Expenses before reductions | .90% | .95% | .98% | 1.12% | 1.20% |
Expenses net of fee waivers, if any | .90% | .95% | .98% | 1.12% | 1.20% |
Expenses net of all reductions | .89% | .89% | .94% | 1.10% | 1.16% |
Net investment income (loss) | .82% | 1.51% F | .40% | .39% | .78% |
Supplemental Data | |||||
Net assets, end of period (000 omitted) | $ 1,252,565 | $ 1,246,298 | $ 415,237 | $ 460,574 | $ 281,885 |
Portfolio turnover rate E | 124% | 112% | 98% | 64% | 64% |
A Total returns would have been lower had certain expenses not been reduced during the periods shown. B Total returns do not include the effect of the former sales charges. C Calculated based on average shares outstanding during the period. D Fees and expenses of the underlying Fidelity Central Funds are not included in the Fund's expense ratio. The Fund indirectly bears its proportionate share of the expenses of any underlying Fidelity Central Funds. E Amount does not include the portfolio activity of any underlying Fidelity Central Funds. F Investment income per share reflects a special dividend which amounted to $.58 per share. Excluding the special dividend, the ratio of net investment income (loss) to average net assets would have been .63%. G Expense ratios reflect operating expenses of the Fund. Expenses before reductions do not reflect amounts reimbursed by the investment adviser or reductions from brokerage service arrangements or other expense offset arrangements and do not represent the amount paid by the Fund during periods when reimbursements or reductions occur. Expenses net of fee waivers reflect expenses after reimbursement by the investment adviser but prior to reductions from brokerage service arrangements or other expense offset arrangements. Expenses net of all reductions represent the net expenses paid by the Fund. H For the year ended February 29. |
See accompanying notes which are an integral part of the financial statements.
Annual Report
Select Financial Services Portfolio
Performance
Average annual total return reflects the change in the value of an investment, assuming reinvestment of the fund's dividend income and capital gains (the profits earned upon the sale of securities that have grown in value) and assuming a constant rate of performance each year. The $10,000 table and the fund's returns do not reflect the deduction of taxes that a shareholder would pay on fund distributions or the redemption of fund shares. During periods of reimbursement by Fidelity a fund's total returns will be greater than it would be had the reimbursement not occurred. How a fund did yesterday is no guarantee of how it will do tomorrow.
Average Annual Total Returns
Periods ended February 28, 2007 | Past 1 | Past 5 | Past 10 |
Select Financial Services Portfolio | 10.14% | 9.94% | 10.92% |
$10,000 Over 10 Years
Let's say hypothetically that $10,000 was invested in Select Financial Services Portfolio on February 28, 1997. The chart shows how the value of your investment would have changed, and also shows how the S&P 500 Index performed over the same period.
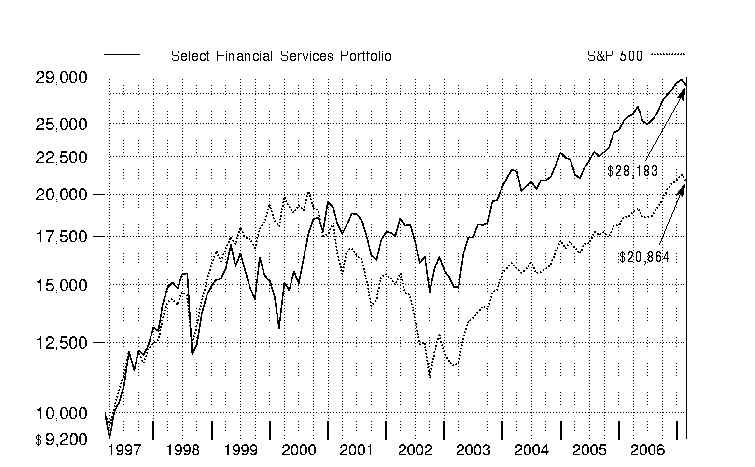
Annual Report
Select Financial Services Portfolio
Management's Discussion of Fund Performance
Comments from Charles Hebard, who managed Fidelity® Select Financial Services Portfolio for most of the period covered by this report
A rosy year for stocks wilted just prior to the end of the 12-month period ending February 28, 2007. On the day prior to the period's close, the Dow Jones Industrial AverageSM plunged 416 points and the Standard & Poor's 500SM Index lost roughly 3.5% of its value, plummeting nearly 50 points and marking the benchmark's worst single-day performance since the day the market reopened after the 9/11 terrorist attacks. Though investors were obviously rattled by the development, it was only the 22nd-biggest decline for the S&P 500® in 20 years, and it could not overshadow how well stocks performed for the 12 months overall. For much of the past year, investors grew confident that the economy would not fall into a recession, and they bid up most broad-based stock indexes for six consecutive months from August through January. Overall for the year ending February 28, 2007, the S&P 500 was up 11.97%, the Dow advanced 14.24%, the small-cap Russell 2000® Index gained 9.87% and the NASDAQ Composite® Index rose 6.66%.
For the 12 months that ended February 28, 2007, Select Financial Services Portfolio produced a total return of 10.14%, trailing the S&P 500 and the 13.47% gain of the Morgan Stanley Capital InternationalSM (MSCI®) US Investable Market Financials Index. During the same period, a blended index specific to this fund returned 13.35%. This blended index is a combination of the Goldman Sachs® Financial Services Index, which the fund was compared with through September 2006, and the new MSCI benchmark mentioned above, which the fund was compared with during the period's final five months.1 During the first seven months of the review period, the fund underperformed the Goldman Sachs index principally because of significant positions in underperforming multi-line insurance, reinsurance and specialized finance companies, along with weak stock selection in the investment banking and brokerage industry. Overweightings in Bermuda-based insurers Scottish Re and ACE Ltd. as well as in insurance giant American International Group (AIG) and UK-based online payment processor NETeller held back results. Consumer lender Dollar Financial, reinsurance company Endurance Specialty Holdings and IntercontinentalExchange, operator of an electronic exchange of energy futures, were among the contributors during the first seven months. The fund narrowly trailed its new MSCI index during the final five months. A lack of exposure to office and specialized real estate investment trusts (REITs) was a notable factor in this underperformance. Not owning investment bank Goldman Sachs - a major index component - and overweighting AIG also hurt during this period. Mitsubishi Estate, a Japanese real estate company, and General Growth Properties, a U.S. REIT, were among the contributors. Several stocks mentioned here were no longer held by the fund at period end.
1 The fund's blended index is a customized index developed by Fidelity for the limited purpose of discussing the fund's performance for the 12-month period ending February 28, 2007. From March 1, 2006, through September 30, 2006, the fund compared its performance to the Goldman Sachs Financial Services Index, which returned 7.66% during that period. On October 1, 2006, the fund began comparing its performance to a different index, the MSCI US Investable Market Financials Index, which returned 5.28% from October 1, 2006, through February 28, 2007. For the 12-month period ending February 28, 2007, the blended index (Goldman Sachs and MSCI) returned 13.35%.
Note to shareholders: Brian Younger and Richard Manuel became co-managers of the fund on February 1, 2007, replacing Charles Hebard.
The views expressed above reflect those of the portfolio manager(s) only through the end of the period as stated on the cover of this report and do not necessarily represent the views of Fidelity or any other person in the Fidelity organization. Any such views are subject to change at any time based upon market or other conditions and Fidelity disclaims any responsibility to update such views. These views may not be relied on as investment advice and, because investment decisions for a Fidelity fund are based on numerous factors, may not be relied on as an indication of trading intent on behalf of any Fidelity fund.
Annual Report
Select Financial Services Portfolio
Investment Changes
Top Ten Stocks as of February 28, 2007 | ||
% of fund's | % of fund's net assets | |
American International Group, Inc. | 8.9 | 9.0 |
JPMorgan Chase & Co. | 5.1 | 5.4 |
Bank of America Corp. | 4.8 | 6.3 |
Wells Fargo & Co. | 4.2 | 3.6 |
Wachovia Corp. | 4.1 | 4.3 |
Merrill Lynch & Co., Inc. | 3.4 | 3.0 |
Morgan Stanley | 3.1 | 2.1 |
Endurance Specialty Holdings Ltd. | 3.1 | 2.7 |
ACE Ltd. | 2.8 | 2.7 |
Citigroup, Inc. | 2.5 | 1.5 |
42.0 | ||
Top Industries (% of fund's net assets) |
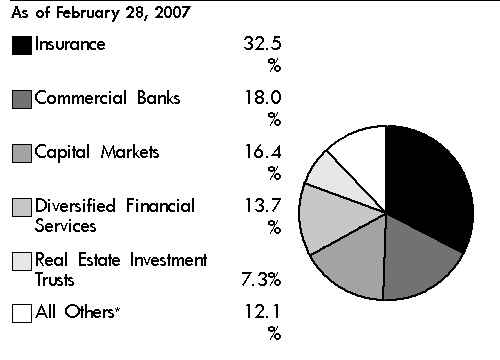
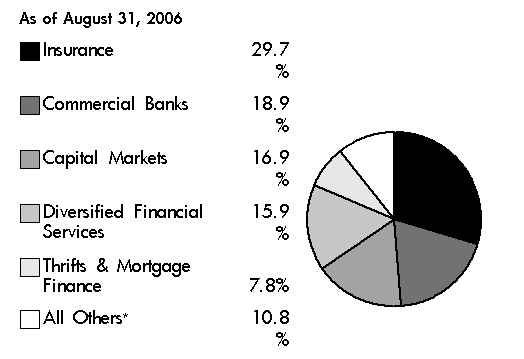
* Includes short-term investments and net other assets. |
Annual Report
Select Financial Services Portfolio
Investments February 28, 2007
Showing Percentage of Net Assets
Common Stocks - 98.3% | |||
Shares | Value | ||
CAPITAL MARKETS - 16.4% | |||
Asset Management & Custody Banks - 5.1% | |||
Affiliated Managers Group, Inc. (a) | 26,200 | $ 2,973,700 | |
American Capital Strategies Ltd. | 48,900 | 2,175,072 | |
Franklin Resources, Inc. | 49,700 | 5,834,283 | |
Investors Financial Services Corp. | 98,700 | 5,777,898 | |
Julius Baer Holding AG (Bearer) | 10,751 | 1,359,367 | |
KKR Private Equity Investors, LP | 31,700 | 765,555 | |
KKR Private Equity Investors, LP Restricted Depositary Units (e) | 47,000 | 1,135,050 | |
State Street Corp. | 116,300 | 7,618,813 | |
27,639,738 | |||
Diversified Capital Markets - 1.0% | |||
UBS AG (NY Shares) | 95,000 | 5,608,800 | |
Investment Banking & Brokerage - 10.3% | |||
Charles Schwab Corp. | 245,200 | 4,531,296 | |
E*TRADE Financial Corp. | 248,900 | 5,747,101 | |
Lazard Ltd. Class A | 103,700 | 5,339,513 | |
MarketAxess Holdings, Inc. (a) | 2,100 | 29,442 | |
Merrill Lynch & Co., Inc. | 218,500 | 18,284,080 | |
Morgan Stanley | 222,900 | 16,699,668 | |
Nomura Holdings, Inc. | 187,600 | 4,044,656 | |
optionsXpress Holdings, Inc. | 47,000 | 1,090,870 | |
55,766,626 | |||
TOTAL CAPITAL MARKETS | 89,015,164 | ||
COMMERCIAL BANKS - 18.0% | |||
Diversified Banks - 13.7% | |||
Banco Bilbao Vizcaya Argentaria SA | 237,000 | 5,773,320 | |
ICICI Bank Ltd. sponsored ADR | 66,400 | 2,545,112 | |
Kookmin Bank sponsored ADR | 29,800 | 2,662,332 | |
Mizrahi Tefahot Bank Ltd. | 115,300 | 819,899 | |
U.S. Bancorp, Delaware | 260,000 | 9,271,600 | |
Unicredito Italiano Spa | 886,800 | 8,220,695 | |
Wachovia Corp. | 402,068 | 22,262,505 | |
Wells Fargo & Co. | 655,900 | 22,759,730 | |
74,315,193 | |||
Regional Banks - 4.3% | |||
Cathay General Bancorp | 77,341 | 2,624,180 | |
Center Financial Corp., California | 72,800 | 1,571,752 | |
Colonial Bancgroup, Inc. | 114,200 | 2,949,786 | |
Commerce Bancorp, Inc., New Jersey | 44,000 | 1,470,480 | |
Nara Bancorp, Inc. | 46,141 | 854,070 | |
PNC Financial Services Group, Inc. | 116,800 | 8,562,608 | |
SVB Financial Group (a) | 62,500 | 3,018,750 | |
Wintrust Financial Corp. | 4,033 | 184,873 | |
Zions Bancorp | 21,000 | 1,792,980 | |
23,029,479 | |||
TOTAL COMMERCIAL BANKS | 97,344,672 | ||
Shares | Value | ||
CONSUMER FINANCE - 3.8% | |||
Consumer Finance - 3.8% | |||
American Express Co. | 205,600 | $ 11,692,472 | |
Capital One Financial Corp. | 72,100 | 5,557,468 | |
Dollar Financial Corp. (a) | 131,779 | 3,376,178 | |
20,626,118 | |||
DIVERSIFIED FINANCIAL SERVICES - 13.7% | |||
Other Diversifed Financial Services - 12.4% | |||
Bank of America Corp. (d) | 515,831 | 26,240,323 | |
Citigroup, Inc. | 266,834 | 13,448,434 | |
JPMorgan Chase & Co. | 555,945 | 27,463,683 | |
67,152,440 | |||
Specialized Finance - 1.3% | |||
CBOT Holdings, Inc. Class A (a) | 12,100 | 1,955,360 | |
Chicago Mercantile Exchange Holdings, Inc. Class A | 2,500 | 1,347,825 | |
Fortress Investment Group LLC | 1,400 | 42,280 | |
The NASDAQ Stock Market, Inc. (a) | 117,700 | 3,522,761 | |
6,868,226 | |||
TOTAL DIVERSIFIED FINANCIAL SERVICES | 74,020,666 | ||
INSURANCE - 32.5% | |||
Insurance Brokers - 0.8% | |||
National Financial Partners Corp. (d) | 68,500 | 3,161,960 | |
Willis Group Holdings Ltd. | 28,560 | 1,133,832 | |
4,295,792 | |||
Life & Health Insurance - 5.0% | |||
AFLAC, Inc. | 130,200 | 6,145,440 | |
MetLife, Inc. (d) | 200,200 | 12,642,630 | |
Prudential Financial, Inc. | 88,800 | 8,075,472 | |
26,863,542 | |||
Multi-Line Insurance - 10.7% | |||
American International Group, Inc. | 719,051 | 48,248,322 | |
Hartford Financial Services Group, Inc. | 102,900 | 9,730,224 | |
57,978,546 | |||
Property & Casualty Insurance - 8.4% | |||
ACE Ltd. | 268,800 | 15,095,808 | |
Allied World Assurance Co. Holdings Ltd. | 33,800 | 1,409,122 | |
Aspen Insurance Holdings Ltd. | 138,400 | 3,667,600 | |
Axis Capital Holdings Ltd. | 114,300 | 3,864,483 | |
MBIA, Inc. | 70,700 | 4,699,429 | |
Old Republic International Corp. | 94,300 | 2,104,776 | |
The Travelers Companies, Inc. | 242,500 | 12,309,300 | |
XL Capital Ltd. Class A | 31,300 | 2,222,300 | |
45,372,818 | |||
Reinsurance - 7.6% | |||
Endurance Specialty Holdings Ltd. | 468,270 | 16,604,854 | |
Everest Re Group Ltd. | 33,400 | 3,246,814 | |
IPC Holdings Ltd. | 87,745 | 2,549,870 | |
Common Stocks - continued | |||
Shares | Value | ||
INSURANCE - CONTINUED | |||
Reinsurance - continued | |||
Max Re Capital Ltd. | 163,399 | $ 3,996,740 | |
Montpelier Re Holdings Ltd. | 38,500 | 670,285 | |
PartnerRe Ltd. | 19,700 | 1,368,756 | |
Platinum Underwriters Holdings Ltd. | 401,288 | 12,821,152 | |
41,258,471 | |||
TOTAL INSURANCE | 175,769,169 | ||
REAL ESTATE INVESTMENT TRUSTS - 7.3% | |||
Mortgage REITs - 0.3% | |||
Annaly Capital Management, Inc. | 116,500 | 1,633,330 | |
Residential REITs - 2.6% | |||
Equity Lifestyle Properties, Inc. | 60,800 | 3,420,000 | |
Equity Residential (SBI) | 150,000 | 7,618,500 | |
United Dominion Realty Trust, Inc. (SBI) | 90,000 | 2,938,500 | |
13,977,000 | |||
Retail REITs - 4.4% | |||
CBL & Associates Properties, Inc. | 30,360 | 1,430,867 | |
Developers Diversified Realty Corp. | 116,700 | 7,650,852 | |
General Growth Properties, Inc. | 165,800 | 10,516,694 | |
Simon Property Group, Inc. | 36,300 | 4,092,462 | |
23,690,875 | |||
TOTAL REAL ESTATE INVESTMENT TRUSTS | 39,301,205 | ||
REAL ESTATE MANAGEMENT & DEVELOPMENT - 1.2% | |||
Real Estate Management & Development - 1.2% | |||
Mitsubishi Estate Co. Ltd. | 210,000 | 6,513,073 | |
THRIFTS & MORTGAGE FINANCE - 5.4% | |||
Thrifts & Mortgage Finance - 5.4% | |||
Countrywide Financial Corp. | 183,569 | 7,027,021 | |
Fannie Mae | 219,000 | 12,423,870 | |
Hudson City Bancorp, Inc. | 290,511 | 3,892,847 | |
Radian Group, Inc. | 14,600 | 838,770 | |
Washington Mutual, Inc. | 123,400 | 5,316,072 | |
29,498,580 | |||
TOTAL COMMON STOCKS (Cost $390,937,630) | 532,088,647 | ||
Money Market Funds - 4.0% | |||
Shares | Value | ||
Fidelity Cash Central Fund, 5.35% (b) | 2,183,535 | $ 2,183,535 | |
Fidelity Securities Lending Cash Central Fund, 5.34% (b)(c) | 19,540,000 | 19,540,000 | |
TOTAL MONEY MARKET FUNDS (Cost $21,723,535) | 21,723,535 | ||
TOTAL INVESTMENT PORTFOLIO - 102.3% (Cost $412,661,165) | 553,812,182 |
NET OTHER ASSETS - (2.3)% | (12,236,190) | ||
NET ASSETS - 100% | $ 541,575,992 | ||
Legend |
(a) Non-income producing |
(b) Affiliated fund that is available only to investment companies and other accounts managed by Fidelity Investments. The rate quoted is the annualized seven-day yield of the fund at period end. A complete unaudited listing of the fund's holdings as of its most recent quarter end is available upon request. |
(c) Investment made with cash collateral received from securities on loan. |
(d) Security or a portion of the security is on loan at period end. |
(e) Security exempt from registration under Rule 144A of the Securities Act of 1933. These securities may be resold in transactions exempt from registration, normally to qualified institutional buyers. At the end of the period, the value of these securities amounted to $1,135,050 or 0.2% of net assets. |
Affiliated Central Funds |
Information regarding fiscal year to date income earned by the Fund from investments in Fidelity Central Funds is as follows: |
Fund | Income earned |
Fidelity Cash Central Fund | $ 178,589 |
Fidelity Securities Lending Cash Central Fund | 71,542 |
Total | $ 250,131 |
Other Information |
Distribution of investments by country of issue, as a percentage of total net assets, is as follows: |
United States of America | 79.6% |
Bermuda | 10.4% |
Cayman Islands | 2.8% |
Japan | 1.9% |
Italy | 1.5% |
Switzerland | 1.3% |
Spain | 1.1% |
Others (individually less than 1%) | 1.4% |
100.0% |
See accompanying notes which are an integral part of the financial statements.
Annual Report
Select Financial Services Portfolio
Financial Statements
Statement of Assets and Liabilities
February 28, 2007 | ||
Assets | ||
Investment in securities, at value (including securities loaned of $19,097,010) - See accompanying schedule: Unaffiliated issuers (cost $390,937,630) | $ 532,088,647 | |
Fidelity Central Funds (cost $21,723,535) | 21,723,535 | |
Total Investments (cost $412,661,165) | $ 553,812,182 | |
Receivable for investments sold | 8,504,145 | |
Receivable for fund shares sold | 987,224 | |
Dividends receivable | 1,158,892 | |
Distributions receivable from Fidelity Central Funds | 13,540 | |
Prepaid expenses | 1,939 | |
Other receivables | 5,900 | |
Total assets | 564,483,822 | |
Liabilities | ||
Payable to custodian bank | $ 27,535 | |
Payable for investments purchased | 1,240,244 | |
Payable for fund shares redeemed | 1,638,410 | |
Accrued management fee | 264,545 | |
Other affiliated payables | 140,952 | |
Other payables and accrued expenses | 56,144 | |
Collateral on securities loaned, at value | 19,540,000 | |
Total liabilities | 22,907,830 | |
Net Assets | $ 541,575,992 | |
Net Assets consist of: | ||
Paid in capital | $ 389,377,964 | |
Undistributed net investment income | 2,225,926 | |
Accumulated undistributed net realized gain (loss) on investments and foreign currency transactions | 8,820,800 | |
Net unrealized appreciation (depreciation) on investments and assets and liabilities in foreign currencies | 141,151,302 | |
Net Assets, for 4,615,668 shares outstanding | $ 541,575,992 | |
Net Asset Value, offering price and redemption price per share ($541,575,992 ÷ 4,615,668 shares) | $ 117.33 | |
Statement of Operations
Year ended February 28, 2007 | ||
Investment Income | ||
Dividends | $ 11,132,724 | |
Interest | 26 | |
Income from Fidelity Central Funds | 250,131 | |
Total income | 11,382,881 | |
Expenses | ||
Management fee | $ 2,888,408 | |
Transfer agent fees | 1,465,046 | |
Accounting and security lending fees | 228,387 | |
Custodian fees and expenses | 55,486 | |
Independent trustees' compensation | 1,900 | |
Registration fees | 38,771 | |
Audit | 40,112 | |
Legal | 8,677 | |
Miscellaneous | 29,100 | |
Total expenses before reductions | 4,755,887 | |
Expense reductions | (52,045) | 4,703,842 |
Net investment income (loss) | 6,679,039 | |
Realized and Unrealized Gain (Loss) Net realized gain (loss) on: | ||
Investment securities: | ||
Unaffiliated issuers (net of foreign taxes of $115,909) | 51,266,104 | |
Foreign currency transactions | 79,550 | |
Total net realized gain (loss) | 51,345,654 | |
Change in net unrealized appreciation (depreciation) on: Investment securities (net of decrease in deferred foreign taxes of $6,747) | (8,075,393) | |
Assets and liabilities in foreign currencies | 241 | |
Total change in net unrealized appreciation (depreciation) | (8,075,152) | |
Net gain (loss) | 43,270,502 | |
Net increase (decrease) in net assets resulting from operations | $ 49,949,541 | |
See accompanying notes which are an integral part of the financial statements.
Annual Report
Select Financial Services Portfolio
Financial Statements - continued
Statement of Changes in Net Assets
Year ended | Year ended | |
Increase (Decrease) in Net Assets | ||
Operations | ||
Net investment income (loss) | $ 6,679,039 | $ 5,848,396 |
Net realized gain (loss) | 51,345,654 | 29,891,242 |
Change in net unrealized appreciation (depreciation) | (8,075,152) | 27,118,166 |
Net increase (decrease) in net assets resulting from operations | 49,949,541 | 62,857,804 |
Distributions to shareholders from net investment income | (5,509,123) | (5,599,282) |
Distributions to shareholders from net realized gain | (55,761,519) | (34,940,068) |
Total distributions | (61,270,642) | (40,539,350) |
Share transactions | 178,601,633 | 130,389,343 |
Reinvestment of distributions | 58,356,068 | 38,466,222 |
Cost of shares redeemed | (174,338,840) | (188,068,301) |
Net increase (decrease) in net assets resulting from share transactions | 62,618,861 | (19,212,736) |
Redemption fees | 39,370 | 59,944 |
Total increase (decrease) in net assets | 51,337,130 | 3,165,662 |
Net Assets | ||
Beginning of period | 490,238,862 | 487,073,200 |
End of period (including undistributed net investment income of $2,225,926 and undistributed net investment income of $1,375,614, respectively) | $ 541,575,992 | $ 490,238,862 |
Other Information Shares | ||
Sold | 1,484,101 | 1,151,335 |
Issued in reinvestment of distributions | 501,082 | 360,852 |
Redeemed | (1,454,591) | (1,673,743) |
Net increase (decrease) | 530,592 | (161,556) |
Financial Highlights
Years ended February 28, | 2007 | 2006 | 2005 | 2004 G | 2003 |
Selected Per-Share Data | |||||
Net asset value, beginning of period | $ 120.01 | $ 114.70 | $ 121.09 | $ 84.14 | $ 99.95 |
Income from Investment Operations | |||||
Net investment income (loss) C | 1.56 | 1.41 | 1.11 | .96 | .74 |
Net realized and unrealized gain (loss) | 10.14 | 13.73 | 2.75 | 36.92 | (15.75) |
Total from investment operations | 11.70 | 15.14 | 3.86 | 37.88 | (15.01) |
Distributions from net investment income | (1.29) | (1.34) | (.89) | (.94) | (.82) |
Distributions from net realized gain | (13.10) | (8.50) | (9.37) | - | - |
Total distributions | (14.39) | (9.84) | (10.26) | (.94) | (.82) |
Redemption fees added to paid in capital C | .01 | .01 | .01 | .01 | .02 |
Net asset value, end of period | $ 117.33 | $ 120.01 | $ 114.70 | $ 121.09 | $ 84.14 |
Total Return A,B | 10.14% | 14.51% | 3.29% | 45.17% | (15.06)% |
Ratios to Average Net Assets D,F | |||||
Expenses before reductions | .93% | .97% | .97% | 1.09% | 1.12% |
Expenses net of fee waivers, if any | .93% | .97% | .97% | 1.09% | 1.12% |
Expenses net of all reductions | .92% | .95% | .94% | 1.07% | 1.09% |
Net investment income (loss) | 1.31% | 1.26% | .96% | .92% | .79% |
Supplemental Data | |||||
Net assets, end of period (000 omitted) | $ 541,576 | $ 490,239 | $ 487,073 | $ 555,577 | $ 389,392 |
Portfolio turnover rate E | 55% | 47% | 101% | 51% | 76% |
A Total returns would have been lower had certain expenses not been reduced during the periods shown. B Total returns do not include the effect of the former sales charges. C Calculated based on average shares outstanding during the period. D Fees and expenses of the underlying Fidelity Central Funds are not included in the Fund's expense ratio. The Fund indirectly bears its proportionate share of the expenses of any underlying Fidelity Central Funds. E Amount does not include the portfolio activity of any underlying Fidelity Central Funds. F Expense ratios reflect operating expenses of the Fund. Expenses before reductions do not reflect amounts reimbursed by the investment adviser or reductions from brokerage service arrangements or other expense offset arrangements and do not represent the amount paid by the Fund during periods when reimbursements or reductions occur. Expenses net of fee waivers reflect expenses after reimbursement by the investment adviser but prior to reductions from brokerage service arrangements or other expense offset arrangements. Expenses net of all reductions represent the net expenses paid by the Fund. G For the year ended February 29. |
See accompanying notes which are an integral part of the financial statements.
Annual Report
Performance
Average annual total return reflects the change in the value of an investment, assuming reinvestment of the fund's dividend income and capital gains (the profits earned upon the sale of securities that have grown in value) and assuming a constant rate of performance each year. The $10,000 table and the fund's returns do not reflect the deduction of taxes that a shareholder would pay on fund distributions or the redemption of fund shares. During periods of reimbursement by Fidelity a fund's total returns will be greater than it would be had the reimbursement not occurred. How a fund did yesterday is no guarantee of how it will do tomorrow.
Average Annual Total Returns
Periods ended February 28, 2007 | Past 1 | Past 5 | Past 10 |
Select Home Finance Portfolio | 7.10% | 8.08% | 8.16% |
$10,000 Over 10 Years
Let's say hypothetically that $10,000 was invested in Select Home Finance Portfolio on February 28, 1997. The chart shows how the value of your investment would have changed, and also shows how the S&P 500 Index performed over the same period.
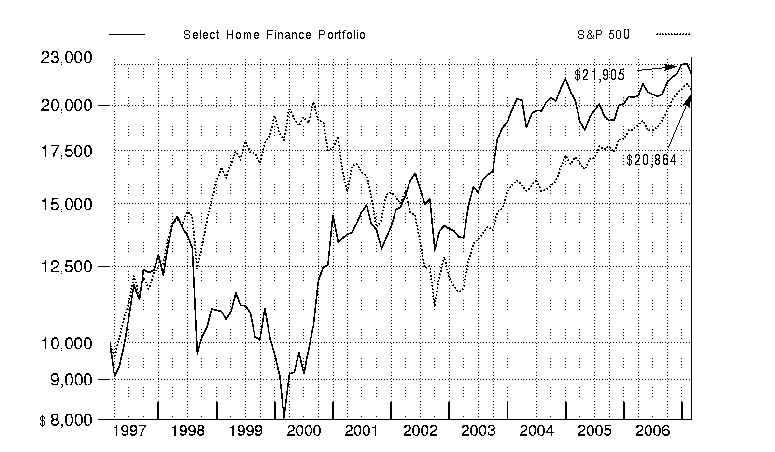
Annual Report
Select Home Finance Portfolio
Management's Discussion of Fund Performance
Comments from Richard Manuel, Portfolio Manager of Fidelity® Select Home Finance Portfolio
A rosy year for stocks wilted just prior to the end of the 12-month period ending February 28, 2007. On the day prior to the period's close, the Dow Jones Industrial AverageSM plunged 416 points and the Standard & Poor's 500SM Index lost roughly 3.5% of its value, plummeting nearly 50 points and marking the benchmark's worst single-day performance since the day the market reopened after the 9/11 terrorist attacks. Though investors were obviously rattled by the development, it was only the 22nd-biggest decline for the S&P 500® in 20 years, and it could not overshadow how well stocks performed for the 12 months overall. For much of the past year, investors grew confident that the economy would not fall into a recession, and they bid up most broad-based stock indexes for six consecutive months from August through January. Overall for the year ending February 28, 2007, the S&P 500 was up 11.97%, the Dow advanced 14.24%, the small-cap Russell 2000® Index gained 9.87% and the NASDAQ Composite® Index rose 6.66%.
For the year, the fund was up 7.10%, compared with a gain of 4.32% for its new benchmark, the Morgan Stanley Capital International (MSCI®) US Investable Market Thrifts & Mortgage Finance Index, and an advance of 9.17% for a blended index specific to this fund. This blended index is a combination of the Goldman Sachs® Financial Services Index, which the fund was compared with through September, and the new MSCI index mentioned above, which the fund was compared with during the period's final five months1. For the same 12-month period, the fund underperformed the S&P 500. During the review period's first seven months, the fund fell short of the Goldman Sachs index, mostly because of its large overweighting in the thrifts and mortgage finance group, which suffered concurrently with the pronounced slowing of the U.S. housing market. Weak stock selection within regional banks also hurt. Among the biggest detractors were mortgage insurance writer MGIC Investment and Puerto Rican lender Doral Financial, as well as regional lender TD Banknorth and Bank of America, the latter of which hurt because we did not own a large enough stake in this strong performer. TD Banknorth was no longer held at period end. A few good picks among diversified banks and multi-line insurance companies helped results. Among the top contributors were People's Bank, title insurance provider Fidelity National Financial and mortgage lender Golden West Financial, which rose on the news of its takeover by Wachovia. Not owning insurance giant American International Group, whose stock price continued to struggle, also helped. During the final five months of the period, the fund beat its new, more narrowly constructed MSCI benchmark, mostly on the basis of favorable security selection. Notable contributors included a handful of non-index holdings, including custodian bank Investors Financial Services, which was the target of a takeover; Clayton Holdings, a provider of analytic tools to the mortgage lending industry; and Fidelity National Information Services, a provider of mortgage loan processing services. An underweighting in weak performing mortgage underwriter Freddie Mac also helped. Among the detractors were an underweighted position in Fannie Mae, which did fairly well during the period, and a stake in subprime lender Accredited Home Lenders, whose stock lost more than a third of its value during the period. An out-of-index position in diversified bank Wells Fargo also hurt.
1 The fund's blended index is a customized index developed by Fidelity for the limited purpose of discussing the fund's performance for the 12-month period ending February 28, 2007. From March 1, 2006, through September 30, 2006, the fund compared its performance to the Goldman Sachs Financial Services Index, which returned 7.66% during that period. On October 1, 2006, the fund began comparing its performance to a different index, the MSCI US Investable Market Thrifts & Mortgage Finance Index, which returned 1.40% from October 1, 2006, through February 28, 2007. For the 12-month period ending February 28, 2007, the blended index (Goldman Sachs and MSCI) returned 9.17%.
The views expressed above reflect those of the portfolio manager(s) only through the end of the period as stated on the cover of this report and do not necessarily represent the views of Fidelity or any other person in the Fidelity organization. Any such views are subject to change at any time based upon market or other conditions and Fidelity disclaims any responsibility to update such views. These views may not be relied on as investment advice and, because investment decisions for a Fidelity fund are based on numerous factors, may not be relied on as an indication of trading intent on behalf of any Fidelity fund.
Annual Report
Select Home Finance Portfolio
Investment Changes
Top Ten Stocks as of February 28, 2007 | ||
% of fund's | % of fund's net assets | |
Countrywide Financial Corp. | 11.6 | 4.7 |
Fannie Mae | 10.8 | 6.4 |
Washington Mutual, Inc. | 5.3 | 3.0 |
Freddie Mac | 5.2 | 5.9 |
Radian Group, Inc. | 4.9 | 4.8 |
Wells Fargo & Co. | 4.4 | 5.6 |
Hudson City Bancorp, Inc. | 4.3 | 0.0 |
MGIC Investment Corp. | 4.1 | 4.2 |
Capital One Financial Corp. | 3.7 | 1.4 |
People's Bank | 2.7 | 2.9 |
57.0 | ||
Top Industries (% of fund's net assets) |
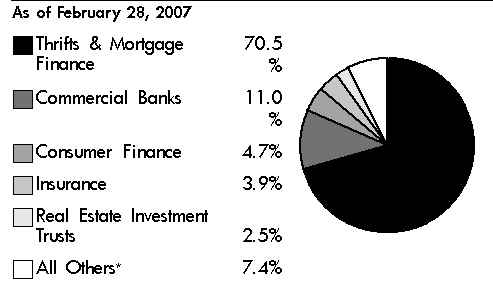
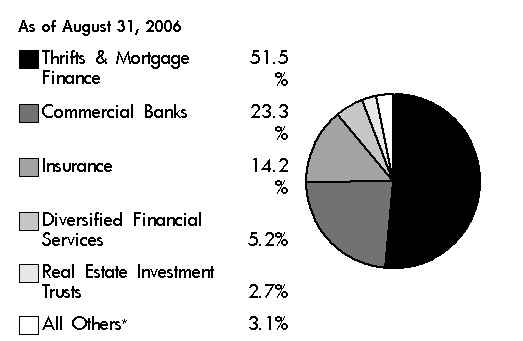
* Includes short-term investments and net other assets. |
Annual Report
Select Home Finance Portfolio
Investments February 28, 2007
Showing Percentage of Net Assets
Common Stocks - 96.6% | |||
Shares | Value | ||
CAPITAL MARKETS - 1.0% | |||
Asset Management & Custody Banks - 1.0% | |||
Investors Financial Services Corp. | 45,950 | $ 2,689,913 | |
COMMERCIAL BANKS - 11.0% | |||
Diversified Banks - 7.2% | |||
HDFC Bank Ltd. sponsored ADR | 18,900 | 1,254,393 | |
ICICI Bank Ltd. sponsored ADR | 34,900 | 1,337,717 | |
Wachovia Corp. | 84,015 | 4,651,911 | |
Wells Fargo & Co. | 326,200 | 11,319,140 | |
18,563,161 | |||
Regional Banks - 3.8% | |||
Center Financial Corp., California | 16,788 | 362,453 | |
Colonial Bancgroup, Inc. | 96,500 | 2,492,595 | |
Commerce Bancorp, Inc., New Jersey | 140,200 | 4,685,484 | |
EuroBancshares, Inc. (a) | 31,908 | 272,813 | |
National City Corp. | 15,309 | 579,446 | |
PNC Financial Services Group, Inc. | 16,100 | 1,180,291 | |
9,573,082 | |||
TOTAL COMMERCIAL BANKS | 28,136,243 | ||
CONSUMER FINANCE - 4.7% | |||
Consumer Finance - 4.7% | |||
American Express Co. | 44,200 | 2,513,654 | |
Capital One Financial Corp. | 122,702 | 9,457,870 | |
11,971,524 | |||
DIVERSIFIED FINANCIAL SERVICES - 1.2% | |||
Other Diversifed Financial Services - 1.2% | |||
Bank of America Corp. | 59,500 | 3,026,765 | |
INSURANCE - 3.9% | |||
Property & Casualty Insurance - 3.9% | |||
Fidelity National Financial, Inc. Class A | 163,829 | 3,931,896 | |
First American Corp., California | 129,000 | 6,082,350 | |
10,014,246 | |||
IT SERVICES - 1.5% | |||
Data Processing & Outsourced Services - 1.5% | |||
Fidelity National Information Services, Inc. | 84,032 | 3,861,270 | |
REAL ESTATE INVESTMENT TRUSTS - 2.5% | |||
Mortgage REITs - 2.5% | |||
Annaly Capital Management, Inc. | 345,500 | 4,843,910 | |
Shares | Value | ||
CapitalSource, Inc. (d) | 50,813 | $ 1,310,467 | |
HomeBanc Mortgage Corp., Georgia | 103,100 | 286,618 | |
6,440,995 | |||
REAL ESTATE MANAGEMENT & DEVELOPMENT - 0.3% | |||
Real Estate Management & Development - 0.3% | |||
Move, Inc. | 141,290 | 843,501 | |
THRIFTS & MORTGAGE FINANCE - 70.5% | |||
Thrifts & Mortgage Finance - 70.5% | |||
Accredited Home Lenders Holding Co. (a)(d) | 122,400 | 2,751,552 | |
Astoria Financial Corp. | 137,900 | 3,898,433 | |
Bank Mutual Corp. | 61,900 | 723,611 | |
BankUnited Financial Corp. Class A | 55,200 | 1,347,984 | |
Beverly Hills Bancorp, Inc. | 50,000 | 381,000 | |
Brookline Bancorp, Inc., Delaware | 64,900 | 828,124 | |
Capitol Federal Financial | 63,300 | 2,370,585 | |
Clayton Holdings, Inc. | 61,774 | 1,370,147 | |
Countrywide Financial Corp. | 777,700 | 29,770,357 | |
Dime Community Bancshares, Inc. | 30,500 | 383,385 | |
Doral Financial Corp. (d) | 132,092 | 286,640 | |
Downey Financial Corp. | 22,300 | 1,461,542 | |
Fannie Mae | 491,000 | 27,854,430 | |
First Niagara Financial Group, Inc. | 112,600 | 1,598,920 | |
FirstFed Financial Corp., Delaware (a)(d) | 56,100 | 3,208,920 | |
Flagstar Bancorp, Inc. | 73,800 | 1,021,392 | |
Freddie Mac (d) | 206,200 | 13,233,916 | |
Hudson City Bancorp, Inc. | 828,700 | 11,104,580 | |
IndyMac Bancorp, Inc. (d) | 51,200 | 1,757,696 | |
MAF Bancorp., Inc. | 200 | 8,850 | |
MGIC Investment Corp. (d) | 172,500 | 10,410,375 | |
New York Community Bancorp, Inc. | 344,837 | 5,772,571 | |
NewAlliance Bancshares, Inc. | 133,700 | 2,112,460 | |
NexCen Brands, Inc. (a) | 68,100 | 710,964 | |
People's Bank | 158,900 | 7,053,571 | |
PFF Bancorp, Inc. | 23,700 | 749,394 | |
Provident Financial Services, Inc. | 65,100 | 1,143,156 | |
Radian Group, Inc. | 220,500 | 12,667,725 | |
Sovereign Bancorp, Inc. (d) | 265,843 | 6,717,853 | |
The PMI Group, Inc. | 111,657 | 5,233,364 | |
Triad Guaranty, Inc. (a) | 36,500 | 1,659,290 | |
Trustco Bank Corp., New York | 80,000 | 791,200 | |
Washington Federal, Inc. | 145,612 | 3,462,653 | |
Washington Mutual, Inc. | 314,300 | 13,540,044 | |
Webster Financial Corp. | 61,700 | 3,047,363 | |
Westfield Financial, Inc. | 60,900 | 643,713 | |
181,077,760 | |||
TOTAL COMMON STOCKS (Cost $202,634,098) | 248,062,217 | ||
Money Market Funds - 14.8% | |||
Shares | Value | ||
Fidelity Cash Central Fund, 5.35% (b) | 8,948,450 | $ 8,948,450 | |
Fidelity Securities Lending Cash Central Fund, 5.34% (b)(c) | 29,085,850 | 29,085,850 | |
TOTAL MONEY MARKET FUNDS (Cost $38,034,300) | 38,034,300 | ||
TOTAL INVESTMENT PORTFOLIO - 111.4% (Cost $240,668,398) | 286,096,517 |
NET OTHER ASSETS - (11.4)% | (29,223,905) | ||
NET ASSETS - 100% | $ 256,872,612 | ||
Legend |
(a) Non-income producing |
(b) Affiliated fund that is available only to investment companies and other accounts managed by Fidelity Investments. The rate quoted is the annualized seven-day yield of the fund at period end. A complete unaudited listing of the fund's holdings as of its most recent quarter end is available upon request. |
(c) Investment made with cash collateral received from securities on loan. |
(d) Security or a portion of the security is on loan at period end. |
Affiliated Central Funds |
Information regarding fiscal year to date income earned by the Fund from investments in Fidelity Central Funds is as follows: |
Fund | Income earned |
Fidelity Cash Central Fund | $ 426,763 |
Fidelity Securities Lending Cash Central Fund | 61,034 |
Total | $ 487,797 |
See accompanying notes which are an integral part of the financial statements.
Annual Report
Select Home Finance Portfolio
Financial Statements
Statement of Assets and Liabilities
February 28, 2007 | ||
Assets | ||
Investment in securities, at value (including securities loaned of $28,544,733) - See accompanying schedule: Unaffiliated issuers (cost $202,634,098) | $ 248,062,217 | |
Fidelity Central Funds (cost $38,034,300) | 38,034,300 | |
Total Investments (cost $240,668,398) | $ 286,096,517 | |
Receivable for fund shares sold | 144,303 | |
Dividends receivable | 364,742 | |
Distributions receivable from Fidelity Central Funds | 41,050 | |
Prepaid expenses | 1,141 | |
Other receivables | 7,230 | |
Total assets | 286,654,983 | |
Liabilities | ||
Payable for fund shares redeemed | 458,046 | |
Accrued management fee | 125,952 | |
Other affiliated payables | 70,153 | |
Other payables and accrued expenses | 42,370 | |
Collateral on securities loaned, at value | 29,085,850 | |
Total liabilities | 29,782,371 | |
Net Assets | $ 256,872,612 | |
Net Assets consist of: | ||
Paid in capital | $ 203,869,324 | |
Undistributed net investment income | 1,248,552 | |
Accumulated undistributed net realized gain (loss) on investments | 6,326,617 | |
Net unrealized appreciation (depreciation) on investments | 45,428,119 | |
Net Assets, for 5,307,621 shares outstanding | $ 256,872,612 | |
Net Asset Value, offering price and redemption price per share ($256,872,612 ÷ 5,307,621 shares) | $ 48.40 | |
Statement of Operations
Year ended February 28, 2007 | ||
Investment Income | ||
Dividends | $ 6,374,064 | |
Interest | 1,034 | |
Income from Fidelity Central Funds | 487,797 | |
Total income | 6,862,895 | |
Expenses | ||
Management fee | $ 1,559,343 | |
Transfer agent fees | 798,611 | |
Accounting and security lending fees | 129,161 | |
Custodian fees and expenses | 8,371 | |
Independent trustees' compensation | 1,091 | |
Registration fees | 22,303 | |
Audit | 36,742 | |
Legal | 5,889 | |
Interest | 1,277 | |
Miscellaneous | 18,380 | |
Total expenses before reductions | 2,581,168 | |
Expense reductions | (10,885) | 2,570,283 |
Net investment income (loss) | 4,292,612 | |
Realized and Unrealized Gain (Loss) Net realized gain (loss) on: | ||
Investment securities: | ||
Unaffiliated issuers | 38,216,841 | |
Change in net unrealized appreciation (depreciation) on investment securities | (23,566,971) | |
Net gain (loss) | 14,649,870 | |
Net increase (decrease) in net assets resulting from operations | $ 18,942,482 | |
See accompanying notes which are an integral part of the financial statements.
Annual Report
Select Home Finance Portfolio
Financial Statements - continued
Statement of Changes in Net Assets
Year ended | Year ended | |
Increase (Decrease) in Net Assets | ||
Operations | ||
Net investment income (loss) | $ 4,292,612 | $ 7,870,259 |
Net realized gain (loss) | 38,216,841 | 40,457,175 |
Change in net unrealized appreciation (depreciation) | (23,566,971) | (47,918,726) |
Net increase (decrease) in net assets resulting from operations | 18,942,482 | 408,708 |
Distributions to shareholders from net investment income | (4,052,900) | (5,380,189) |
Distributions to shareholders from net realized gain | (32,100,974) | (37,238,765) |
Total distributions | (36,153,874) | (42,618,954) |
Share transactions | 45,152,786 | 36,144,380 |
Reinvestment of distributions | 34,666,757 | 40,625,810 |
Cost of shares redeemed | (97,876,938) | (138,541,892) |
Net increase (decrease) in net assets resulting from share transactions | (18,057,395) | (61,771,702) |
Redemption fees | 17,147 | 18,308 |
Total increase (decrease) in net assets | (35,251,640) | (103,963,640) |
Net Assets | ||
Beginning of period | 292,124,252 | 396,087,892 |
End of period (including undistributed net investment income of $1,248,552 and undistributed net investment income of $2,696,950, respectively) | $ 256,872,612 | $ 292,124,252 |
Other Information Shares | ||
Sold | 867,552 | 643,172 |
Issued in reinvestment of distributions | 693,890 | 783,468 |
Redeemed | (1,889,744) | (2,490,689) |
Net increase (decrease) | (328,302) | (1,064,049) |
Financial Highlights
Years ended February 28, | 2007 | 2006 | 2005 | 2004 H | 2003 |
Selected Per-Share Data | |||||
Net asset value, beginning of period | $ 51.83 | $ 59.12 | $ 68.76 | $ 47.60 | $ 52.95 |
Income from Investment Operations | |||||
Net investment income (loss) C | .81 | 1.32 F | .54 | .61 | .39 |
Net realized and unrealized gain (loss) | 3.01 | (.77) | (.54) | 22.67 | (4.77) |
Total from investment operations | 3.82 | .55 | - | 23.28 | (4.38) |
Distributions from net investment income | (.80) | (.99) | (.56) | (.41) | (.30) |
Distributions from net realized gain | (6.45) | (6.85) | (9.09) | (1.72) | (.70) |
Total distributions | (7.25) | (7.84) | (9.65) | (2.13) | (1.00) |
Redemption fees added to paid in capital C | - I | - I | .01 | .01 | .03 |
Net asset value, end of period | $ 48.40 | $ 51.83 | $ 59.12 | $ 68.76 | $ 47.60 |
Total Return A,B | 7.10% | .99% | (.46)% | 49.39% | (8.30)% |
Ratios to Average Net Assets D,G | |||||
Expenses before reductions | .93% | .97% | .97% | 1.11% | 1.14% |
Expenses net of fee waivers, if any | .93% | .97% | .97% | 1.11% | 1.14% |
Expenses net of all reductions | .93% | .94% | .96% | 1.10% | 1.11% |
Net investment income (loss) | 1.55% | 2.36% F | .83% | 1.05% | .75% |
Supplemental Data | |||||
Net assets, end of period (000 omitted) | $ 256,873 | $ 292,124 | $ 396,088 | $ 449,060 | $ 327,394 |
Portfolio turnover rate E | 52% | 76% | 37% | 38% | 78% |
A Total returns would have been lower had certain expenses not been reduced during the periods shown. B Total returns do not include the effect of the former sales charges. C Calculated based on average shares outstanding during the period. D Fees and expenses of the underlying Fidelity Central Funds are not included in the Fund's expense ratio. The Fund indirectly bears its proportionate share of the expenses of any underlying Fidelity Central Funds E Amount does not include the portfolio activity of any underlying Fidelity Central Funds. F Investment income per share reflects a special dividend which amounted to $.54 per share. Excluding the special dividend, the ratio of net investment income (loss) to average net assets would have been 1.40%. G Expense ratios reflect operating expenses of the Fund. Expenses before reductions do not reflect amounts reimbursed by the investment adviser or reductions from brokerage service arrangements or other expense offset arrangements and do not represent the amount paid by the Fund during periods when reimbursements or reductions occur. Expenses net of fee waivers reflect expenses after reimbursement by the investment adviser but prior to reductions from brokerage service arrangements or other expense offset arrangements. Expenses net of all reductions represent the net expenses paid by the Fund. H For the year ended February 29. I Amount represents less than $.01 per share. |
See accompanying notes which are an integral part of the financial statements.
Annual Report
Performance
Average annual total return reflects the change in the value of an investment, assuming reinvestment of the fund's dividend income and capital gains (the profits earned upon the sale of securities that have grown in value) and assuming a constant rate of performance each year. The $10,000 table and the fund's returns do not reflect the deduction of taxes that a shareholder would pay on fund distributions or the redemption of fund shares. During periods of reimbursement by Fidelity a fund's total returns will be greater than it would be had the reimbursement not occurred. How a fund did yesterday is no guarantee of how it will do tomorrow.
Average Annual Total Returns
Periods ended February 28, 2007 | Past 1 | Past 5 | Past 10 |
Select Insurance Portfolio | 8.33% | 10.08% | 14.01% |
$10,000 Over 10 Years
Let's say hypothetically that $10,000 was invested in Select Insurance Portfolio on February 28, 1997. The chart shows how the value of your investment would have changed, and also shows how the S&P 500 Index performed over the same period.
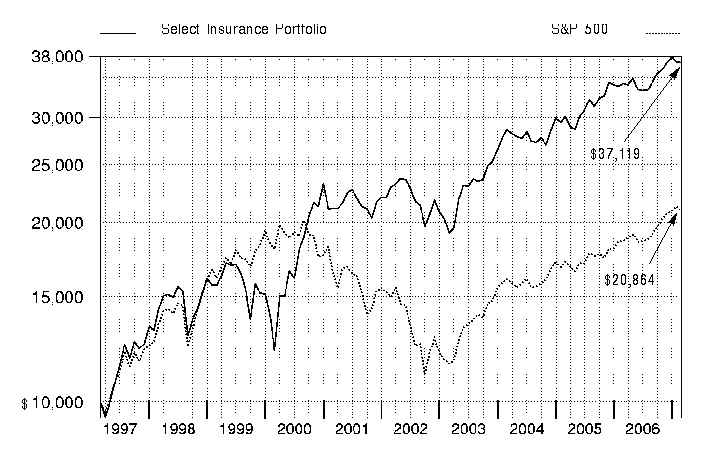
Annual Report
Select Insurance Portfolio
Management's Discussion of Fund Performance
Comments from Stephen Hermsdorf, Portfolio Manager of Fidelity® Select Insurance Portfolio
A rosy year for stocks wilted just prior to the end of the 12-month period ending February 28, 2007. On the day prior to the period's close, the Dow Jones Industrial AverageSM plunged 416 points and the Standard & Poor's 500SM Index lost roughly 3.5% of its value, plummeting nearly 50 points and marking the benchmark's worst single-day performance since the day the market reopened after the 9/11 terrorist attacks. Though investors were obviously rattled by the development, it was only the 22nd-biggest decline for the S&P 500® in 20 years, and it could not overshadow how well stocks performed for the 12 months overall. For much of the past year, investors grew confident that the economy would not fall into a recession, and they bid up most broad-based stock indexes for six consecutive months from August through January. Overall for the year ending February 28, 2007, the S&P 500 was up 11.97%, the Dow advanced 14.24%, the small-cap Russell 2000® Index gained 9.87% and the NASDAQ Composite® Index rose 6.66%.
For the year ending February 28, 2007, Select Insurance Portfolio produced a total return of 8.33%, trailing the S&P 500 and the 10.12% gain of the Morgan Stanley Capital InternationalSM (MSCI®) US Investable Market Insurance Index. During the same period, a blended index specific to this fund returned 13.72%. This blended index is a combination of the Goldman Sachs® Financial Services Index, which the fund was compared with through September 2006, and the new MSCI benchmark mentioned above, which the fund was compared with during the period's final five months.1 For the first seven months of the review period, the fund underperformed the Goldman Sachs index primarily because of its focus on insurance stocks, which generally trailed the performance of the financials sector. Performance also was held back by weak stock selection in the reinsurance industry and earnings disappointments among several life insurers we owned. Detractors during the period included Bermuda-based insurers Scottish Re and ACE Ltd., as well as property-and-casualty company W.R. Berkley. I sold the Scottish Re position. Not owning major index component Bank of America detracted as well. During the final five months of the period, the fund trailed the new MSCI index due to an overweighting and unproductive stock picking in reinsurance, along with lackluster results in multi-line insurance. The fund's holdings in Scottish Re continued to be a drag on performance, as did the limited exposure to conglomerates Loews and Berkshire Hathaway. Other negatives included not owning 401(k) provider Principal Financial and underweighting insurance giant American International Group during the final five months. Helping results were the overweighted position in Travelers, a property-and-casualty company, and the avoidance of weak performing index components such as property-and-casualty insurers Progressive and Cincinnati Financial.
1 The fund's blended index is a customized index developed by Fidelity for the limited purpose of discussing the fund's performance for the 12-month period ending February 28, 2007. From March 1, 2006, through September 30, 2006, the fund compared its performance to the Goldman Sachs Financial Services Index, which returned 7.66% during that period. On October 1, 2006, the fund began comparing its performance to a different index, the MSCI US Investable Market Insurance Index, which returned 5.63% from October 1, 2006, through February 28, 2007. For the 12-month period ending February 28, 2007, the blended index (Goldman Sachs and MSCI) returned 13.72%.
The views expressed above reflect those of the portfolio manager(s) only through the end of the period as stated on the cover of this report and do not necessarily represent the views of Fidelity or any other person in the Fidelity organization. Any such views are subject to change at any time based upon market or other conditions and Fidelity disclaims any responsibility to update such views. These views may not be relied on as investment advice and, because investment decisions for a Fidelity fund are based on numerous factors, may not be relied on as an indication of trading intent on behalf of any Fidelity fund.
Annual Report
Select Insurance Portfolio
Investment Changes
Top Ten Stocks as of February 28, 2007 | ||
% of fund's | % of fund's net assets | |
American International Group, Inc. | 23.2 | 8.6 |
MetLife, Inc. | 7.1 | 5.5 |
The Travelers Companies, Inc. | 5.5 | 5.2 |
Prudential Financial, Inc. | 5.2 | 4.2 |
The Chubb Corp. | 5.1 | 3.5 |
Hartford Financial Services Group, Inc. | 5.0 | 5.8 |
ACE Ltd. | 5.0 | 6.3 |
Allstate Corp. | 4.0 | 3.9 |
Axis Capital Holdings Ltd. | 3.3 | 2.0 |
AFLAC, Inc. | 3.3 | 4.3 |
66.7 | ||
Top Industries (% of fund's net assets) |

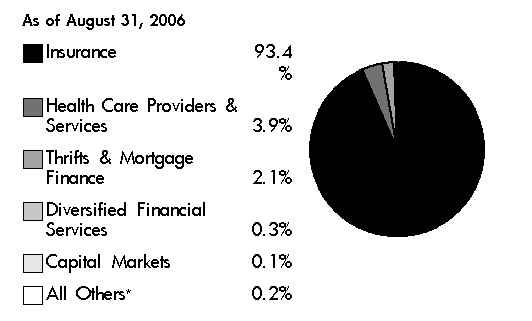
* Includes short-term investments and net other assets. |
Annual Report
Select Insurance Portfolio
Investments February 28, 2007
Showing Percentage of Net Assets
Common Stocks - 100.0% | |||
Shares | Value | ||
BUILDING PRODUCTS - 0.3% | |||
Building Products - 0.3% | |||
PGT, Inc. | 52,600 | $ 679,592 | |
CAPITAL MARKETS - 0.2% | |||
Asset Management & Custody Banks - 0.2% | |||
Ameriprise Financial, Inc. | 7,000 | 409,220 | |
INSURANCE - 99.5% | |||
Insurance Brokers - 4.0% | |||
Aon Corp. | 52,800 | 1,987,920 | |
Brown & Brown, Inc. | 59,800 | 1,683,370 | |
Hilb Rogal & Hobbs Co. | 9,400 | 425,820 | |
Marsh & McLennan Companies, Inc. | 14,900 | 438,358 | |
National Financial Partners Corp. (d) | 57,000 | 2,631,120 | |
Willis Group Holdings Ltd. | 63,100 | 2,505,070 | |
9,671,658 | |||
Life & Health Insurance - 19.7% | |||
AFLAC, Inc. | 170,800 | 8,061,760 | |
American Equity Investment Life Holding Co. | 19,000 | 251,940 | |
Lincoln National Corp. | 91,030 | 6,203,695 | |
MetLife, Inc. (d) | 276,300 | 17,448,345 | |
Old Mutual plc | 158,100 | 547,383 | |
Protective Life Corp. | 12,800 | 568,448 | |
Prudential Financial, Inc. | 140,000 | 12,731,600 | |
Shin Kong Financial Holding Co. Ltd. | 377,403 | 368,409 | |
StanCorp Financial Group, Inc. | 19,300 | 930,260 | |
T&D Holdings, Inc. | 15,350 | 1,105,680 | |
48,217,520 | |||
Multi-Line Insurance - 29.9% | |||
American International Group, Inc. (d) | 843,200 | 56,578,718 | |
Assurant, Inc. | 36,800 | 1,966,960 | |
AXA SA sponsored ADR | 18,700 | 798,303 | |
Genworth Financial, Inc. Class A (non-vtg.) | 40,300 | 1,425,411 | |
Hartford Financial Services Group, Inc. | 129,600 | 12,254,976 | |
73,024,368 | |||
Property & Casualty Insurance - 34.5% | |||
21st Century Insurance Group | 15,200 | 321,784 | |
ACE Ltd. | 215,449 | 12,099,616 | |
Admiral Group PLC | 57,900 | 1,176,059 | |
Alleghany Corp. | 1,472 | 574,993 | |
Allied World Assurance Co. Holdings Ltd. | 38,100 | 1,588,389 | |
Allstate Corp. | 161,400 | 9,693,684 | |
AMBAC Financial Group, Inc. | 12,950 | 1,134,938 | |
Aspen Insurance Holdings Ltd. | 64,900 | 1,719,850 | |
Axis Capital Holdings Ltd. | 241,700 | 8,171,877 | |
Berkshire Hathaway, Inc. Class A (a) | 9 | 955,710 | |
Catlin Group Ltd. | 142,900 | 1,333,386 | |
Fidelity National Financial, Inc. Class A | 68,694 | 1,648,656 | |
Markel Corp. (a) | 2,800 | 1,340,780 | |
Shares | Value | ||
MBIA, Inc. | 52,900 | $ 3,516,263 | |
Navigators Group, Inc. (a) | 52,400 | 2,604,280 | |
Old Republic International Corp. | 23,825 | 531,774 | |
OneBeacon Insurance Group Ltd. | 2,200 | 58,740 | |
Philadelphia Consolidated Holdings Corp. (a) | 18,000 | 826,380 | |
RLI Corp. | 18,700 | 1,048,322 | |
Samsung Fire & Marine Insurance Co. Ltd. | 7,420 | 1,307,906 | |
Specialty Underwriters' Alliance, Inc. (a) | 78,500 | 569,125 | |
The Chubb Corp. | 243,658 | 12,438,741 | |
The Travelers Companies, Inc. | 264,791 | 13,440,791 | |
United America Indemnity Ltd. Class A (a) | 92,091 | 2,175,189 | |
W.R. Berkley Corp. | 118,701 | 3,869,653 | |
84,146,886 | |||
Reinsurance - 11.4% | |||
Endurance Specialty Holdings Ltd. | 186,500 | 6,613,290 | |
Everest Re Group Ltd. | 47,900 | 4,656,359 | |
IPC Holdings Ltd. | 93,700 | 2,722,922 | |
Max Re Capital Ltd. | 34,400 | 841,424 | |
Montpelier Re Holdings Ltd. | 72,300 | 1,258,743 | |
Muenchener Rueckversicherungs-Gesellschaft AG (Reg.) | 5,000 | 796,855 | |
PartnerRe Ltd. (d) | 57,000 | 3,960,360 | |
Platinum Underwriters Holdings Ltd. | 139,925 | 4,470,604 | |
Reinsurance Group of America, Inc. | 2,900 | 165,532 | |
RenaissanceRe Holdings Ltd. | 26,695 | 1,368,920 | |
Swiss Reinsurance Co. (Reg.) | 7,976 | 680,619 | |
Transatlantic Holdings, Inc. | 6,262 | 413,918 | |
27,949,546 | |||
TOTAL INSURANCE | 243,009,978 | ||
TOTAL COMMON STOCKS (Cost $189,747,314) | 244,098,790 | ||
Money Market Funds - 11.6% | |||
Fidelity Cash Central Fund, 5.35% (b) | 85,514 | 85,514 | |
Fidelity Securities Lending Cash Central Fund, 5.34% (b)(c) | 28,316,950 | 28,316,950 | |
TOTAL MONEY MARKET FUNDS (Cost $28,402,464) | 28,402,464 | ||
TOTAL INVESTMENT PORTFOLIO - 111.6% (Cost $218,149,778) | 272,501,254 |
NET OTHER ASSETS - (11.6)% | (28,250,233) | ||
NET ASSETS - 100% | $ 244,251,021 | ||
Legend |
(a) Non-income producing |
(b) Affiliated fund that is available only to investment companies and other accounts managed by Fidelity Investments. The rate quoted is the annualized seven-day yield of the fund at period end. A complete unaudited listing of the fund's holdings as of its most recent quarter end is available upon request. |
(c) Investment made with cash collateral received from securities on loan. |
(d) Security or a portion of the security is on loan at period end. |
Affiliated Central Funds |
Information regarding fiscal year to date income earned by the Fund from investments in Fidelity Central Funds is as follows: |
Fund | Income earned |
Fidelity Cash Central Fund | $ 71,866 |
Fidelity Securities Lending Cash Central Fund | 44,071 |
Total | $ 115,937 |
Other Information |
Distribution of investments by country of issue, as a percentage of total net assets, is as follows: |
United States of America | 74.5% |
Bermuda | 16.8% |
Cayman Islands | 5.9% |
Others (individually less than 1%) | 2.8% |
100.0% |
See accompanying notes which are an integral part of the financial statements.
Annual Report
Select Insurance Portfolio
Financial Statements
Statement of Assets and Liabilities
February 28, 2007 | ||
Assets | ||
Investment in securities, at value (including securities loaned of $27,799,206) - See accompanying schedule: Unaffiliated issuers (cost $189,747,314) | $ 244,098,790 | |
Fidelity Central Funds (cost $28,402,464) | 28,402,464 | |
Total Investments (cost $218,149,778) | $ 272,501,254 | |
Receivable for investments sold | 611,801 | |
Receivable for fund shares sold | 609,493 | |
Dividends receivable | 284,696 | |
Distributions receivable from Fidelity Central Funds | 1,239 | |
Prepaid expenses | 781 | |
Other receivables | 3,794 | |
Total assets | 274,013,058 | |
Liabilities | ||
Payable for investments purchased | $ 290,399 | |
Payable for fund shares redeemed | 931,670 | |
Accrued management fee | 117,890 | |
Other affiliated payables | 65,459 | |
Other payables and accrued expenses | 39,669 | |
Collateral on securities loaned, at value | 28,316,950 | |
Total liabilities | 29,762,037 | |
Net Assets | $ 244,251,021 | |
Net Assets consist of: | ||
Paid in capital | $ 186,058,538 | |
Undistributed net investment income | 326,407 | |
Accumulated undistributed net realized gain (loss) on investments and foreign currency transactions | 3,514,456 | |
Net unrealized appreciation (depreciation) on investments and assets and liabilities in foreign currencies | 54,351,620 | |
Net Assets, for 3,520,305 shares outstanding | $ 244,251,021 | |
Net Asset Value, offering price and redemption price per share ($244,251,021 ÷ 3,520,305 shares) | $ 69.38 | |
Statement of Operations
Year ended February 28, 2007 | ||
Investment Income | ||
Dividends | $ 3,197,891 | |
Income from Fidelity Central Funds | 115,937 | |
Total income | 3,313,828 | |
Expenses | ||
Management fee | $ 1,160,548 | |
Transfer agent fees | 654,361 | |
Accounting and security lending fees | 94,393 | |
Custodian fees and expenses | 17,060 | |
Independent trustees' compensation | 723 | |
Registration fees | 36,582 | |
Audit | 35,452 | |
Legal | 3,781 | |
Interest | 1,737 | |
Miscellaneous | 13,918 | |
Total expenses before reductions | 2,018,555 | |
Expense reductions | (8,028) | 2,010,527 |
Net investment income (loss) | 1,303,301 | |
Realized and Unrealized Gain (Loss) Net realized gain (loss) on: | ||
Investment securities: | ||
Unaffiliated issuers | 16,082,269 | |
Foreign currency transactions | 2,092 | |
Total net realized gain (loss) | 16,084,361 | |
Change in net unrealized appreciation (depreciation) on: Investment securities | (2,360,686) | |
Assets and liabilities in foreign currencies | (346) | |
Total change in net unrealized appreciation (depreciation) | (2,361,032) | |
Net gain (loss) | 13,723,329 | |
Net increase (decrease) in net assets resulting from operations | $ 15,026,630 | |
See accompanying notes which are an integral part of the financial statements.
Annual Report
Select Insurance Portfolio
Financial Statements - continued
Statement of Changes in Net Assets
Year ended | Year ended | |
Increase (Decrease) in Net Assets | ||
Operations | ||
Net investment income (loss) | $ 1,303,301 | $ 2,044,551 |
Net realized gain (loss) | 16,084,361 | 6,240,077 |
Change in net unrealized appreciation (depreciation) | (2,361,032) | 15,534,827 |
Net increase (decrease) in net assets resulting from operations | 15,026,630 | 23,819,455 |
Distributions to shareholders from net investment income | (1,139,050) | (1,925,489) |
Distributions to shareholders from net realized gain | (13,198,155) | (4,025,157) |
Total distributions | (14,337,205) | (5,950,646) |
Share transactions | 142,013,492 | 160,969,117 |
Reinvestment of distributions | 13,737,229 | 5,726,500 |
Cost of shares redeemed | (121,134,580) | (149,078,874) |
Net increase (decrease) in net assets resulting from share transactions | 34,616,141 | 17,616,743 |
Redemption fees | 18,394 | 64,892 |
Total increase (decrease) in net assets | 35,323,960 | 35,550,444 |
Net Assets | ||
Beginning of period | 208,927,061 | 173,376,617 |
End of period (including undistributed net investment income of $326,407 and undistributed net investment income of $356,778, respectively) | $ 244,251,021 | $ 208,927,061 |
Other Information Shares | ||
Sold | 2,025,862 | 2,435,562 |
Issued in reinvestment of distributions | 197,602 | 85,883 |
Redeemed | (1,743,525) | (2,270,942) |
Net increase (decrease) | 479,939 | 250,503 |
Financial Highlights
Years ended February 28, | 2007 | 2006 | 2005 | 2004 H | 2003 |
Selected Per-Share Data | |||||
Net asset value, beginning of period | $ 68.72 | $ 62.15 | $ 59.67 | $ 41.06 | $ 50.79 |
Income from Investment Operations | |||||
Net investment income (loss) C | .44 | .70 F | .23 | .08 | .02 |
Net realized and unrealized gain (loss) | 5.25 | 7.71 | 2.92 | 19.88 | (8.14) |
Total from investment operations | 5.69 | 8.41 | 3.15 | 19.96 | (8.12) |
Distributions from net investment income | (.40) | (.60) | (.10) | (.08) | (.09) |
Distributions from net realized gain | (4.64) | (1.26) | (.59) | (1.29) | (1.55) |
Total distributions | (5.04) | (1.86) | (.69) | (1.37) | (1.64) |
Redemption fees added to paid in capital C | .01 | .02 | .02 | .02 | .03 |
Net asset value, end of period | $ 69.38 | $ 68.72 | $ 62.15 | $ 59.67 | $ 41.06 |
Total Return A,B | 8.33% | 13.68% | 5.35% | 49.04% | (16.41)% |
Ratios to Average Net Assets D,G | |||||
Expenses before reductions | .98% | 1.03% | 1.05% | 1.24% | 1.26% |
Expenses net of fee waivers, if any | .98% | 1.03% | 1.05% | 1.24% | 1.26% |
Expenses net of all reductions | .98% | 1.02% | 1.04% | 1.23% | 1.24% |
Net investment income (loss) | .64% | 1.08% F | .39% | .16% | .05% |
Supplemental Data | |||||
Net assets, end of period (000 omitted) | $ 244,251 | $ 208,927 | $ 173,377 | $ 151,875 | $ 88,150 |
Portfolio turnover rate E | 58% | 44% | 50% | 59% | 95% |
A Total returns would have been lower had certain expenses not been reduced during the periods shown. B Total returns do not include the effect of the former sales charges. C Calculated based on average shares outstanding during the period. D Fees and expenses of the underlying Fidelity Central Funds are not included in the Fund's expense ratio. The Fund indirectly bears its proportionate share of the expenses of any underlying Fidelity Central Funds. E Amount does not include the portfolio activity of any underlying Fidelity Central Funds. F Investment income per share reflects a special dividend which amounted to $.38 per share. Excluding the special dividend, the ratio of net investment income (loss) to average net assets would have been .50%. G Expense ratios reflect operating expenses of the Fund. Expenses before reductions do not reflect amounts reimbursed by the investment adviser or reductions from brokerage service arrangements or other expense offset arrangements and do not represent the amount paid by the Fund during periods when reimbursements or reductions occur. Expenses net of fee waivers reflect expenses after reimbursement by the investment adviser but prior to reductions from brokerage service arrangements or other expense offset arrangements. Expenses net of all reductions represent the net expenses paid by the Fund. H For the year ended February 29. |
See accompanying notes which are an integral part of the financial statements.
Annual Report
Notes to Financial Statements
For the period ended February 28, 2007
1. Organization.
Banking Portfolio, Brokerage and Investment Management Portfolio, Financial Services Portfolio, Home Finance Portfolio, and Insurance Portfolio (the Funds) are funds of Fidelity Select Portfolios (the trust). The trust is registered under the Investment Company Act of 1940, as amended (the 1940 Act), as an open-end management investment company organized as a Massachusetts business trust. The Funds are non-diversified with the exception of Fidelity Select Home Finance, Financial Services, and Banking. The Funds invest primarily in securities of companies whose principal business activities fall within specific industries. Each Fund is authorized to issue an unlimited number of shares. Certain Funds investments in emerging markets can be subject to social, economic, regulatory, and political uncertainties and can be extremely volatile. The financial statements have been prepared in conformity with accounting principles generally accepted in the United States of America, which require management to make certain estimates and assumptions at the date of the financial statements.
2. Investments in Fidelity Central Funds.
The Funds may invest in Fidelity Central Funds which are open-end investment companies available only to other investment companies and accounts managed by Fidelity Management & Research Company (FMR) and its affiliates. The Funds' Schedule of Investments lists each of the Fidelity Central Funds as an investment of each Fund but does not include the underlying holdings of each Fidelity Central Fund. As an Investing Fund, the Funds indirectly bear their proportionate share of the expenses of the underlying Fidelity Central Funds. A complete unaudited list of holdings for each Fidelity Central Fund is available upon request. In addition, the financial statements of the Fidelity Central Funds, which are not covered by the Funds' Report of Independent Registered Public Accounting Firm, are available on the EDGAR Database on the SEC's web site, www.sec.gov, or upon request.
The Money Market Central Funds seek preservation of capital and current income and are managed by Fidelity Investments Money Management, Inc. (FIMM) an affiliate of FMR.
3. Significant Accounting Policies.
The following summarizes the significant accounting policies of the Funds:
Security Valuation. Investments are valued and net asset value (NAV) per share is calculated (NAV calculation) as of the close of business of the New York Stock Exchange (NYSE), normally 4:00 p.m. Eastern time. During the period each Fund also calculated a NAV each hour on the hour (commencing at 10:00 a.m. Eastern time until one hour prior to the close of business on the NYSE). Effective October 1, 2006 each Fund eliminated the hourly NAV calculation. Wherever possible, each Fund uses independent pricing services approved by the Board of Trustees to value their investments.
Equity securities, including restricted securities, for which market quotations are readily available, are valued at the last reported sale price or official closing price as reported by an independent pricing service on the primary market or exchange on which they are traded. In the event there were no sales during the day or closing prices are not available, securities are valued at the last quoted bid price. Investments in open-end mutual funds, including the Fidelity Central Funds, are valued at their closing net asset value each business day. Short-term securities with remaining maturities of sixty days or less for which quotations are not readily available are valued at amortized cost, which approximates value.
When current market prices or quotations are not readily available or do not accurately reflect fair value, valuations may be determined in accordance with procedures adopted by the Board of Trustees. For example, when developments occur between the close of a market and the close of the NYSE that may materially affect the value of some or all of the securities, or when trading in a security is halted, those securities may be fair valued. Factors used in the determination of fair value may include monitoring news to identify significant market or security specific events such as changes in the value of U.S. securities markets, reviewing developments in foreign markets and evaluating the performance of ADRs, futures contracts and exchange-traded funds. Because each Fund's utilization of fair value pricing depends on market activity, the frequency with which fair value pricing is used cannot be predicted and may be utilized to a significant extent. The value of securities used for NAV calculation under fair value pricing may differ from published prices for the same securities.
Foreign Currency. Certain Funds may use foreign currency contracts to facilitate transactions in foreign-denominated securities. Losses from these transactions may arise from changes in the value of the foreign currency or if the counterparties do not perform under the contracts' terms.
Foreign-denominated assets, including investment securities, and liabilities are translated into U.S. dollars at the exchange rate at period end. Purchases and sales of investment securities, income and dividends received and expenses denominated in foreign currencies are translated into U.S. dollars at the exchange rate in effect on the transaction date.
The effects of exchange rate fluctuations on investments are included with the net realized and unrealized gain (loss) on investment securities. Other foreign currency transactions resulting in realized and unrealized gain (loss) are disclosed separately.
Annual Report
Notes to Financial Statements - continued
3. Significant Accounting Policies - continued
Investment Transactions and Income. For financial reporting purposes, the Funds' investment holdings and NAV include trades executed through the end of the last business day of the period. The NAV for processing shareholder transactions includes trades executed through the end of the prior business day. Gains and losses on securities sold are determined on the basis of identified cost and may include proceeds received from litigation. Dividend income is recorded on the ex-dividend date, except for certain dividends from foreign securities where the ex-dividend date may have passed, which are recorded as soon as the Funds are informed of the ex-dividend date. Non-cash dividends included in dividend income, if any, are recorded at the fair market value of the securities received. Distributions received on securities that represent a return of capital or capital gain are recorded as a reduction of cost of investments and/or as a realized gain. The Funds estimate the components of distributions received that may be considered return of capital distributions or capital gain distributions. Interest income and distributions from the Fidelity Central Funds are accrued as earned, with any distributions receivable as of period end included in Distributions receivable from Fidelity Central Funds on the Statement of Assets and Liabilities. Interest income includes coupon interest and amortization of premium and accretion of discount on debt securities. Investment income is recorded net of foreign taxes withheld where recovery of such taxes is uncertain.
Expenses. Most expenses of the trust can be directly attributed to a fund. Expenses which cannot be directly attributed are apportioned among each Fund in the trust. Expense estimates are accrued in the period to which they relate and adjustments are made when actual amounts are known.
Income Tax Information and Distributions to Shareholders. Each year, each Fund intends to qualify as a regulated investment company by distributing all of its taxable income and realized gains under Subchapter M of the Internal Revenue Code. As a result, no provision for income taxes is required in the accompanying financial statements. Foreign taxes are provided for based on each Fund's understanding of the tax rules and rates that exist in the foreign markets in which it invests.
Distributions are recorded on the ex-dividend date. Income and capital gain distributions are determined in accordance with income tax regulations, which may differ from generally accepted accounting principles. In addition, certain Funds will claim a portion of the payment made to redeeming shareholders as a distribution for income tax purposes.
Capital accounts within the financial statements are adjusted for permanent book-tax differences. These adjustments have no impact on net assets or the results of operations. Temporary book-tax differences will reverse in a subsequent period.
Book-tax differences are primarily due to short-term capital gains, foreign currency transactions, certain foreign taxes, partnerships, deferred trustees compensation and losses deferred due to wash sales.
The tax-basis components of distributable earnings and the federal tax cost as of period end were as follows for each Fund:
Cost for | Unrealized | Unrealized | Net Unrealized | |
Banking Portfolio | $ 297,447,776 | $ 74,710,595 | $ (5,131,953) | $ 69,578,642 |
Brokerage and Investment Management Portfolio | 1,236,897,765 | 186,087,728 | (9,680,302) | 176,407,426 |
Financial Services Portfolio | 413,477,577 | 142,618,636 | (2,284,031) | 140,334,605 |
Home Finance Portfolio | 243,005,147 | 50,798,716 | (7,707,346) | 43,091,370 |
Insurance Portfolio | 218,892,182 | 55,801,839 | (2,192,767) | 53,609,072 |
Undistributed | Undistributed | |
Banking Portfolio | $ 1,198,524 | $ 8,757,243 |
Brokerage and Investment Management Portfolio | 2,701,443 | 33,237,318 |
Financial Services Portfolio | 1,868,683 | 3,988,061 |
Home Finance Portfolio | 780,681 | 5,413,133 |
Insurance Portfolio | 13,781 | 179,722 |
The tax character of distributions paid was as follows:
February 28, 2007 | |||
Ordinary | Long-term | Total | |
Banking Portfolio | $ 6,850,404 | $ 51,988,884 | $ 58,839,288 |
Brokerage and Investment Management Portfolio | 55,153,012 | 88,650,450 | 143,803,462 |
Financial Services Portfolio | 6,374,392 | 54,896,250 | 61,270,642 |
Home Finance Portfolio | 4,052,900 | 32,100,974 | 36,153,874 |
Insurance Portfolio | 1,139,050 | 13,198,155 | 14,337,205 |
Annual Report
3. Significant Accounting Policies - continued
Income Tax Information and Distributions to Shareholders - continued
February 28, 2006 | |||
Ordinary | Long-term | Total | |
Banking Portfolio | $ 7,062,913 | $ 32,253,480 | $ 39,316,393 |
Brokerage and Investment Management Portfolio | 6,267,935 | 45,444,492 | 51,712,427 |
Financial Services Portfolio | 6,776,322 | 33,763,028 | 40,539,350 |
Home Finance Portfolio | 5,380,189 | 37,238,765 | 42,618,954 |
Insurance Portfolio | 1,925,489 | 4,025,157 | 5,950,646 |
Trading (Redemption) Fees. Shares in the Funds held less than 30 days are subject to a redemption fee equal to .75% of the net asset value of shares redeemed. All redemption fees, including any estimated redemption fees paid by FMR, are retained by the Funds and accounted for as an addition to paid in capital. Shareholders were also subject to an additional $7.50 fee for shares exchanged into another Fidelity fund (see Note 6).
New Accounting Pronouncements. In July 2006, Financial Accounting Standards Board Interpretation No. 48, Accounting for Uncertainty in Income Taxes - an interpretation of FASB Statement 109 (FIN 48), was issued and is effective on the last business day of the semiannual reporting period for fiscal years beginning after December 15, 2006. FIN 48 sets forth a threshold for financial statement recognition, measurement and disclosure of a tax position taken or expected to be taken on a tax return. Management is currently evaluating the impact, if any, the adoption of FIN 48 will have on the Funds' net assets, results of operations and financial statement disclosures.
In addition, in September 2006, Statement of Financial Accounting Standards No. 157, Fair Value Measurements (SFAS 157), was issued and is effective for fiscal years beginning after November 15, 2007. SFAS 157 defines fair value, establishes a framework for measuring fair value and expands disclosures about fair value measurements. Management is currently evaluating the impact the adoption of SFAS 157 will have on the Funds' financial statement disclosures.
4. Operating Policies.
Repurchase Agreements. FMR has received an Exemptive Order from the Securities and Exchange Commission (the SEC) which permits certain Funds and other affiliated entities of FMR to transfer uninvested cash balances into joint trading accounts which are then invested in repurchase agreements. Certain Funds may also invest directly with institutions in repurchase agreements. Repurchase agreements are collateralized by government or non-government securities. Upon settlement date, collateral is held in segregated accounts with custodian banks and may be obtained in the event of a default of the counterparty. Each applicable Fund monitors, on a daily basis, the value of the collateral to ensure it is at least equal to the principal amount of the repurchase agreement (including accrued interest). In the event of a default by the counterparty, realization of the collateral proceeds could be delayed, during which time the value of the collateral may decline.
Restricted Securities. Certain Funds may invest in securities that are subject to legal or contractual restrictions on resale. These securities generally may be resold in transactions exempt from registration or to the public if the securities are registered. Disposal of these securities may involve time-consuming negotiations and expense, and prompt sale at an acceptable price may be difficult. Information regarding restricted securities is included at the end of each applicable Fund's Schedule of Investments.
5. Purchases and Sales of Investments.
Purchases and sales of securities, other than short-term securities, are noted in the table below.
Purchases ($) | Sales ($) | |
Banking Portfolio | 400,036,478 | 417,156,445 |
Brokerage and Investment Management Portfolio | 1,346,373,121 | 1,381,400,543 |
Financial Services Portfolio | 282,326,757 | 279,276,975 |
Home Finance Portfolio | 140,496,839 | 196,117,956 |
Insurance Portfolio | 140,833,148 | 118,605,609 |
6. Fees and Other Transactions with Affiliates.
Management Fee. FMR and its affiliates provide the Funds with investment management related services for which the Funds pay a monthly management fee. The management fee is the sum of an individual fund fee rate and a group fee rate. The individual fund fee rate is applied to each Fund's average net assets. The group fee rate is based upon the average net assets of all the mutual funds advised by FMR. The group fee rate decreases as
Annual Report
Notes to Financial Statements - continued
6. Fees and Other Transactions with Affiliates - continued
Management Fee - continued
assets under management increase and increases as assets under management decrease. For the period, each Fund's annual management fee rate expressed as a percentage of each Fund's average net assets was as follows:
Individual Rate | Group Rate | Total | |
Banking Portfolio | .30% | .26% | .56% |
Brokerage and Investment Management Portfolio | .30% | .26% | .57% |
Financial Services Portfolio | .30% | .26% | .57% |
Home Finance Portfolio | .30% | .26% | .56% |
Insurance Portfolio | .30% | .26% | .57% |
Transfer Agent Fees. Fidelity Service Company, Inc. (FSC), an affiliate of FMR, is the Funds' transfer, dividend disbursing and shareholder servicing agent. FSC receives account fees and asset-based fees that vary according to account size and type of account. FSC pays for typesetting, printing and mailing of shareholder reports, except proxy statements. For the period, the transfer agent fees were equivalent to the following annual rates expressed as a percentage of average net assets:
Banking Portfolio | .27% |
Brokerage and Investment Management Portfolio | .26% |
Financial Services Portfolio | .29% |
Home Finance Portfolio | .29% |
Insurance Portfolio | .32% |
Accounting and Security Lending Fees. FSC maintains each Fund's accounting records. The accounting fee is based on the level of average net assets for the month. Under a separate contract, FSC administers the security lending program. The security lending fee is based on the number and duration of lending transactions.
Exchange Fees. During the period, FSC received the proceeds of a $7.50 fee to cover administrative costs associated with exchanges out of the Funds to any other Fidelity Select fund or to any other Fidelity fund made through non-automated channels. Effective October 1, 2006, the exchange fees were eliminated. For the period, exchange fees retained by FSC were as follows:
Retained | |
Banking Portfolio | $ 2,010 |
Brokerage and Investment Management Portfolio | 8,348 |
Financial Services Portfolio | 2,033 |
Home Finance Portfolio | 2,213 |
Insurance Portfolio | 1,328 |
Brokerage Commissions. Certain Funds placed a portion of their portfolio transactions with brokerage firms which are affiliates of the investment adviser. The commissions paid to these affiliated firms were as follows:
Amount | |
Banking Portfolio | $ 1,286 |
Brokerage and Investment Management Portfolio | 4,553 |
Financial Services Portfolio | 1,306 |
Home Finance Portfolio | 1,128 |
Insurance Portfolio | 1,990 |
Interfund Lending Program. Pursuant to an Exemptive Order issued by the SEC, the Funds, along with other registered investment companies having management contracts with FMR, may participate in an interfund lending program. This program provides an alternative credit facility allowing the funds to borrow from, or lend money to, other participating affiliated funds. At period end, there were no interfund loans outstanding. Each applicable fund's activity in this program during the period for which loans were outstanding was as follows:
Borrower | Average Daily | Weighted Average Interest Rate | Interest | |
Brokerage and Investment Management Portfolio | Borrower | $ 7,991,879 | 5.10% | $ 37,395 |
Home Finance Portfolio | Borrower | 9,896,000 | 4.65% | 1,277 |
Insurance Portfolio | Borrower | 5,805,000 | 5.38% | 1,737 |
Annual Report
7. Committed Line of Credit.
Certain Funds participate with other funds managed by FMR in a $4.2 billion credit facility (the "line of credit") to be utilized for temporary or emergency purposes to fund shareholder redemptions or for other short-term liquidity purposes. The participating funds have agreed to pay commitment fees on their pro rata portion of the line of credit, which is reflected in Miscellaneous Expense on the Statement of Operations, and is as follows:
Banking Portfolio | $ 999 |
Brokerage and Investment Management Portfolio | 2,880 |
Financial Services Portfolio | 1,324 |
Home Finance Portfolio | 751 |
Insurance Portfolio | 532 |
During the period, there were no borrowings on this line of credit.
8. Security Lending.
Certain Funds lend portfolio securities from time to time in order to earn additional income. On the settlement date of the loan, each applicable Fund receives collateral (in the form of U.S. Treasury obligations, letters of credit and/or cash) against the loaned securities and maintains collateral in an amount not less than 100% of the market value of the loaned securities during the period of the loan. The market value of the loaned securities is determined at the close of business of the Funds and any additional required collateral is delivered to the Funds on the next business day. If the borrower defaults on its obligation to return the securities loaned because of insolvency or other reasons, a fund could experience delays and costs in recovering the securities loaned or in gaining access to the collateral. Any cash collateral received is invested in the Fidelity Securities Lending Cash Central Fund. The value of loaned securities and cash collateral at period end are disclosed on each applicable Fund's Statement of Assets and Liabilities. Security lending income represents the income earned on investing cash collateral, less fees and expenses associated with the loan, plus any premium payments that may be received on the loan of certain types of securities. Security lending income is presented on each applicable Fund's Statement of Operations as a component of income from Fidelity Central Funds. Net income from lending portfolio securities during the period amounted to:
Banking Portfolio | $ 61,673 |
Brokerage and Investment Management Portfolio | 830,530 |
Financial Services Portfolio | 71,542 |
Home Finance Portfolio | 61,034 |
Insurance Portfolio | 44,071 |
9. Bank Borrowings.
Each Fund is permitted to have bank borrowings for temporary or emergency purposes to fund shareholder redemptions. Each Fund has established borrowing arrangements with certain banks. The interest rate on the borrowings is the bank's base rate, as revised from time to time. At period end, there were no bank borrowings outstanding. Each applicable Fund's activity in this program during the period for which loans were outstanding was as follows:
Average Daily | Weighted Average | |
Brokerage and Investment Management Portfolio | $ 4,020,000 | 5.30% |
Annual Report
Notes to Financial Statements - continued
10. Expense Reductions.
Many of the brokers with whom FMR places trades on behalf of certain Funds provided services to these Funds in addition to trade execution. These services included payments of expenses on behalf of each applicable Fund. In addition, through arrangements with each applicable fund's custodian and transfer agent, credits realized as a result of uninvested cash balances were used to reduce each applicable fund's expenses. All of the applicable expense reductions are noted in the table below.
Brokerage | Custody | Transfer | |
Banking Portfolio | $ 46,090 | $ 789 | $ 3,820 |
Brokerage and Investment Management Portfolio | 125,286 | - | 8,587 |
Financial Services Portfolio | 31,722 | - | 12,804 |
Home Finance Portfolio | 2,022 | 584 | 3,819 |
Insurance Portfolio | 3,594 | - | 1,386 |
11. Other.
The Funds' organizational documents provide former and current trustees and officers with a limited indemnification against liabilities arising in connection with the performance of their duties to the Funds. In the normal course of business, the Funds may also enter into contracts that provide general indemnifications. The Funds' maximum exposure under these arrangements is unknown as this would be dependent on future claims that may be made against the Funds. The risk of material loss from such claims is considered remote.
The United States Securities and Exchange Commission ("SEC") is conducting an investigation of FMR (covering the years 2002 to 2004) arising from gifts, gratuities and business entertainment provided by certain brokers to certain individuals who were employed on FMR's domestic equity trading desk during that period. FMR is in discussions with the SEC staff regarding the possible resolution of the matter, but as of period-end no final resolution has been reached.
In December 2006, the Independent Trustees completed their own investigation of the matter with the assistance of independent counsel. The Independent Trustees and FMR agree that, despite the absence of proof that the Fidelity mutual funds experienced diminished execution quality as a result of the improper receipt of gifts and business entertainment, the conduct at issue was serious and is worthy of redress. Accordingly, the Independent Trustees have requested and FMR has agreed to pay $42 million to Fidelity mutual funds, plus interest to be determined at the time that payment is made. A method of allocating this payment among the funds has not yet been determined. The total payment to each of the Funds is not anticipated to have a material impact on such Fund's net assets. In addition, FMR reimbursed related legal expenses which are recorded in the accompanying Statement of Operations as an expense reduction.
Annual Report
Report of Independent Registered Public Accounting Firm
To the Trustees of Fidelity Select Portfolios and the Shareholders of Banking Portfolio, Brokerage and Investment Management Portfolio, Financial Services Portfolio, Home Finance Portfolio, and Insurance Portfolio:
In our opinion, the accompanying statements of assets and liabilities, including the schedules of investments, and the related statements of operations and of changes in net assets and the financial highlights present fairly, in all material respects, the financial position of Banking Portfolio, Brokerage and Investment Management Portfolio, Financial Services Portfolio, Home Finance Portfolio, and Insurance Portfolio (funds of Fidelity Select Portfolios) at February 28, 2007, the results of each of their operations for the year then ended, the changes in each of their net assets for each of the two years in the period then ended and the financial highlights for each of the five years in the period then ended, in conformity with accounting principles generally accepted in the United States of America. These financial statements and financial highlights (hereafter referred to as "financial statements") are the responsibility of the Fidelity Select Portfolios' management; our responsibility is to express an opinion on these financial statements based on our audits. We conducted our audits of these financial statements in accordance with the standards of the Public Company Accounting Oversight Board (United States). Those standards require that we plan and perform the audit to obtain reasonable assurance about whether the financial statements are free of material misstatement. An audit includes examining, on a test basis, evidence supporting the amounts and disclosures in the financial statements, assessing the accounting principles used and significant estimates made by management, and evaluating the overall financial statement presentation. We believe that our audits, which included confirmation of securities at February 28, 2007 by correspondence with the custodian and brokers, provide a reasonable basis for our opinion.
/s/PricewaterhouseCoopers LLP
PricewaterhouseCoopers LLP
Boston, Massachusetts
April 20, 2007
Annual Report
Trustees and Officers
The Trustees, Member of the Advisory Board, and executive officers of the trust and funds, as applicable, are listed below. The Board of Trustees governs each fund and is responsible for protecting the interests of shareholders. The Trustees are experienced executives who meet periodically throughout the year to oversee each fund's activities, review contractual arrangements with companies that provide services to each fund, and review each fund's performance. Each of the Trustees oversees 349 funds advised by FMR or an affiliate.
The Trustees hold office without limit in time except that (a) any Trustee may resign; (b) any Trustee may be removed by written instrument, signed by at least two-thirds of the number of Trustees prior to such removal; (c) any Trustee who requests to be retired or who has become incapacitated by illness or injury may be retired by written instrument signed by a majority of the other Trustees; and (d) any Trustee may be removed at any special meeting of shareholders by a two-thirds vote of the outstanding voting securities of the trust. Each Trustee who is not an interested person (as defined in the 1940 Act) (Independent Trustee), shall retire not later than the last day of the calendar year in which his or her 72nd birthday occurs. The Independent Trustees may waive this mandatory retirement age policy with respect to individual Trustees. The executive officers and Advisory Board Member hold office without limit in time, except that any officer and Advisory Board Member may resign or may be removed by a vote of a majority of the Trustees at any regular meeting or any special meeting of the Trustees. Except as indicated, each individual has held the office shown or other offices in the same company for the past five years.
The funds' Statement of Additional Information (SAI) includes more information about the Trustees. To request a free copy, call Fidelity at 1-800-544-8544.
Interested Trustees*:
Correspondence intended for each Trustee who is an interested person may be sent to Fidelity Investments, 82 Devonshire Street, Boston, Massachusetts 02109.
Name, Age; Principal Occupation | |
Edward C. Johnson 3d (76) | |
Year of Election or Appointment: 1980 Mr. Johnson is Chairman of the Board of Trustees. Mr. Johnson serves as President (2006-present), Chief Executive Officer, Chairman, and a Director of FMR Corp.; Chairman and a Director of FMR; Chairman and a Director of Fidelity Research & Analysis Company (FRAC); Chairman and a Director of Fidelity Investments Money Management, Inc.; and Chairman (2001-present) and a Director of FMR Co., Inc. In addition, Mr. Johnson serves as Chairman and Director of Fidelity International Limited (FIL). | |
Robert L. Reynolds (54) | |
Year of Election or Appointment: 2003 Mr. Reynolds is President and a Director of FMR (2005-present), Fidelity Investments Money Management, Inc. (2005-present), and FMR Co., Inc. (2005-present). Mr. Reynolds also serves as Vice Chairman (2006-present), a Director (2003-present), and Chief Operating Officer of FMR Corp. and a Director of Strategic Advisers, Inc. (2005-present). He also serves on the Board at Fidelity Investments Canada, Ltd. | |
* Trustees have been determined to be "Interested Trustees" by virtue of, among other things, their affiliation with the trust or various entities under common control with FMR.
Independent Trustees:
Correspondence intended for each Independent Trustee (that is, the Trustees other than the Interested Trustees) may be sent to Fidelity Investments, P.O. Box 55235, Boston, Massachusetts 02205-5235.
Name, Age; Principal Occupation | |
Dennis J. Dirks (58) | |
Year of Election or Appointment: 2005 Prior to his retirement in May 2003, Mr. Dirks was Chief Operating Officer and a member of the Board of The Depository Trust & Clearing Corporation (DTCC) (1999-2003). He also served as President, Chief Operating Officer, and Board member of The Depository Trust Company (DTC) (1999-2003) and President and Board member of the National Securities Clearing Corporation (NSCC) (1999-2003). In addition, Mr. Dirks served as Chief Executive Officer and Board member of the Government Securities Clearing Corporation (2001-2003) and Chief Executive Officer and Board member of the Mortgage-Backed Securities Clearing Corporation (2001-2003). Mr. Dirks also serves as a Trustee and a member of the Finance Committee of Manhattan College (2005-present) and a Trustee and a member of the Finance Committee of AHRC of Nassau County (2006-present). | |
Albert R. Gamper, Jr. (64) | |
Year of Election or Appointment: 2006 Prior to his retirement in December 2004, Mr. Gamper served as Chairman of the Board of CIT Group Inc. (commercial finance). During his tenure with CIT Group Inc. Mr. Gamper served in numerous senior management positions, including Chairman (1987-1989; 1999-2001; 2002-2004), Chief Executive Officer (1987-2004), and President (1989-2002). He currently serves as a member of the Board of Directors of Public Service Enterprise Group (utilities, 2001-present), Chairman of the Board of Governors, Rutgers University (2004-present), and Chairman of the Board of Saint Barnabas Health Care System. | |
George H. Heilmeier (70) | |
Year of Election or Appointment: 2004 Dr. Heilmeier is Chairman Emeritus of Telcordia Technologies (communication software and systems), where prior to his retirement, he served as company Chairman and Chief Executive Officer. He currently serves on the Boards of Directors of The Mitre Corporation (systems engineering and information technology support for the government), and HRL Laboratories (private research and development, 2004-present). He is Chairman of the General Motors Science & Technology Advisory Board and a Life Fellow of the Institute of Electrical and Electronics Engineers (IEEE). Dr. Heilmeier is a member of the Defense Science Board and the National Security Agency Advisory Board. He is also a member of the National Academy of Engineering, the American Academy of Arts and Sciences, and the Board of Overseers of the School of Engineering and Applied Science of the University of Pennsylvania. Previously, Dr. Heilmeier served as a Director of TRW Inc. (automotive, space, defense, and information technology, 1992-2002), Compaq (1994-2002), Automatic Data Processing, Inc. (ADP) (technology-based business outsourcing, 1995-2002), INET Technologies Inc. (telecommunications network surveillance, 2001-2004), and Teletech Holdings (customer management services). He is the recipient of the 2005 Kyoto Prize in Advanced Technology for his invention of the liquid crystal display, and a member of the Consumer Electronics Hall of Fame. | |
James H. Keyes (66) | |
Year of Election or Appointment: 2007 Prior to his retirement in 2003, Mr. Keyes was Chairman, President, and Chief Executive Officer of Johnson Controls, Inc. (automotive supplier, 1993-2003). He currently serves as a member of the boards of LSI Logic Corporation (semiconductor technologies), Navistar International Corporation (manufacture and sale of trucks, buses, and diesel engines, 2002-present), and Pitney Bowes, Inc. (integrated mail, messaging, and document management solutions). | |
Marie L. Knowles (60) | |
Year of Election or Appointment: 2001 Prior to Ms. Knowles' retirement in June 2000, she served as Executive Vice President and Chief Financial Officer of Atlantic Richfield Company (ARCO) (diversified energy, 1996-2000). From 1993 to 1996, she was a Senior Vice President of ARCO and President of ARCO Transportation Company. She served as a Director of ARCO from 1996 to 1998. She currently serves as a Director of Phelps Dodge Corporation (copper mining and manufacturing) and McKesson Corporation (healthcare service, 2002-present). Ms. Knowles is a Trustee of the Brookings Institution and the Catalina Island Conservancy and also serves as a member of the Advisory Board for the School of Engineering of the University of Southern California. | |
Ned C. Lautenbach (63) | |
Year of Election or Appointment: 2000 Mr. Lautenbach is Chairman of the Independent Trustees (2006-present). Mr. Lautenbach has been a partner of Clayton, Dubilier & Rice, Inc. (private equity investment firm) since September 1998. Previously, Mr. Lautenbach was with the International Business Machines Corporation (IBM) from 1968 until his retirement in 1998. Mr. Lautenbach serves as a Director of Sony Corporation (2006-present) and Eaton Corporation (diversified industrial) as well as the Philharmonic Center for the Arts in Naples, Florida. He also is a member of the Board of Trustees of Fairfield University (2005-present), as well as a member of the Council on Foreign Relations. | |
Cornelia M. Small (62) | |
Year of Election or Appointment: 2005 Ms. Small is a member (2000-present) and Chairperson (2002-present) of the Investment Committee, and a member (2002- present) of the Board of Trustees of Smith College. Previously, she served as Chief Investment Officer (1999-2000), Director of Global Equity Investments (1996-1999), and a member of the Board of Directors of Scudder, Stevens & Clark (1990-1997) and Scudder Kemper Investments (1997-1999). In addition, Ms. Small served as Co-Chair (2000-2003) of the Annual Fund for the Fletcher School of Law and Diplomacy. | |
William S. Stavropoulos (67) | |
Year of Election or Appointment: 2001 Mr. Stavropoulos is Chairman Emeritus of the Board of Directors of The Dow Chemical Company. Since joining The Dow Chemical Company in 1967, Mr. Stavropoulos served in numerous senior management positions, including President (1993-2000; 2002-2003), CEO (1995-2000; 2002-2004), and Chairman of the Executive Committee (2000-2004). Currently, he is a Director of NCR Corporation (data warehousing and technology solutions), Chemical Financial Corporation, Maersk Inc. (industrial conglomerate, 2002-present), Tyco International, Inc. (multinational manufacturing and services, 2007-present), and a member of the Advisory Board for Metalmark Capital (private equity investment firm, 2005-present). He is a special advisor to Clayton, Dubilier & Rice, Inc., a private equity investment firm. He also serves as a member of the Board of Trustees of the American Enterprise Institute for Public Policy Research. In addition, Mr. Stavropoulos is a member of The Business Council, J.P. Morgan International Council and the University of Notre Dame Advisory Council for the College of Science. | |
Kenneth L. Wolfe (68) | |
Year of Election or Appointment: 2005 Prior to his retirement in 2001, Mr. Wolfe was Chairman and Chief Executive Officer of Hershey Foods Corporation (1993-2001). He currently serves as a member of the boards of Adelphia Communications Corporation (2003-present), Bausch & Lomb, Inc., and Revlon Inc. (2004-present). | |
Advisory Board Member and Executive Officers:
Correspondence intended for each executive officer and Mr. Lynch may be sent to Fidelity Investments, 82 Devonshire Street, Boston, Massachusetts 02109.
Name, Age; Principal Occupation | |
Peter S. Lynch (63) | |
Year of Election or Appointment: 2003 Member of the Advisory Board of Fidelity Select Portfolios. Mr. Lynch is Vice Chairman and a Director of FMR, and Vice Chairman (2001-present) and a Director of FMR Co., Inc. Previously, Mr. Lynch served as a Trustee of the Fidelity funds (1990-2003). In addition, he serves as a Trustee of Boston College and as the Chairman of the Inner-City Scholarship Fund. | |
Kimberley H. Monasterio (43) | |
Year of Election or Appointment: 2007 President and Treasurer of Select Banking Portfolio, Select Brokerage & Investment Management Portfolio, Select Financial Services Portfolio, Select Home Finance Portfolio, and Select Insurance Portfolio. Ms. Monasterio also serves as President and Treasurer of other Fidelity funds (2007-present) and is an employee of FMR (2004-present). Previously, Ms. Monasterio served as Deputy Treasurer of the Fidelity funds (2004-2006). Before joining Fidelity Investments, Ms. Monasterio served as Treasurer (2000-2004) and Chief Financial Officer (2002-2004) of the Franklin Templeton Funds and Senior Vice President of Franklin Templeton Services, LLC (2000-2004). | |
Boyce I. Greer (51) | |
Year of Election or Appointment: 2005 Vice President of Select Banking Portfolio, Select Brokerage & Investment Management Portfolio, Select Financial Services Portfolio, Select Home Finance Portfolio, and Select Insurance Portfolio. Mr. Greer also serves as Vice President of certain Equity Funds (2005-present), certain Asset Allocation Funds (2005-present), Fixed-Income Funds (2006-present), and Money Market Funds (2006-present). Mr. Greer is also a Trustee of other investment companies advised by FMR (2003-present). He is an Executive Vice President of FMR (2005-present) and FMR Co., Inc. (2005-present), and Senior Vice President of Fidelity Investments Money Management, Inc. (2006-present). Previously, Mr. Greer served as a Director and Managing Director of Strategic Advisers, Inc. (2002-2005), and Executive Vice President (2000-2002) and Money Market Group Leader (1997-2002) of the Fidelity Investments Fixed Income Division. He also served as Vice President of Fidelity's Money Market Funds (1997-2002), Senior Vice President of FMR (1997-2002), and Vice President of FIMM (1998-2002). | |
Eric D. Roiter (58) | |
Year of Election or Appointment: 1998 Secretary of Select Banking Portfolio, Select Brokerage & Investment Management Portfolio, Select Financial Services Portfolio, Select Home Finance Portfolio, and Select Insurance Portfolio. He also serves as Secretary of other Fidelity funds; Vice President, General Counsel, and Secretary of FMR Co., Inc. (2001-present) and FMR; Assistant Secretary of Fidelity Management & Research (U.K.) Inc. (2001-present), Fidelity Research & Analysis Company (2001-present), and Fidelity Investments Money Management, Inc. (2001-present). Mr. Roiter is an Adjunct Member, Faculty of Law, at Boston College Law School (2003-present). Previously, Mr. Roiter served as Vice President and Secretary of Fidelity Distributors Corporation (FDC) (1998-2005). | |
Scott C. Goebel (39) | |
Year of Election or Appointment: 2007 Assistant Secretary of Select Banking Portfolio, Select Brokerage & Investment Management Portfolio, Select Financial Services Portfolio, Select Home Finance Portfolio, and Select Insurance Portfolio. Mr. Goebel also serves as Assistant Secretary of other Fidelity funds (2007-present), Vice President and Secretary of FDC (2006-present), and is an employee of FMR. | |
R. Stephen Ganis (40) | |
Year of Election or Appointment: 2006 Anti-Money Laundering (AML) officer of Select Banking Portfolio, Select Brokerage & Investment Management Portfolio, Select Financial Services Portfolio, Select Home Finance Portfolio, and Select Insurance Portfolio. Mr. Ganis also serves as AML officer of other Fidelity funds (2006-present) and FMR Corp. (2003-present). Before joining Fidelity Investments, Mr. Ganis practiced law at Goodwin Procter, LLP (2000-2002). | |
Joseph B. Hollis (58) | |
Year of Election or Appointment: 2006 Chief Financial Officer of Select Banking Portfolio, Select Brokerage & Investment Management Portfolio, Select Financial Services Portfolio, Select Home Finance Portfolio, and Select Insurance Portfolio. Mr. Hollis also serves as Chief Financial Officer of other Fidelity funds. Mr. Hollis is President of Fidelity Pricing and Cash Management Services (FPCMS) (2005-present). Mr. Hollis also serves as President and Director of Fidelity Service Company, Inc. (2006-present). Previously, Mr. Hollis served as Senior Vice President of Cash Management Services (1999-2002) and Investment Management Operations (2002-2005). | |
Kenneth A. Rathgeber (59) | |
Year of Election or Appointment: 2004 Chief Compliance Officer of Select Banking Portfolio, Select Brokerage & Investment Management Portfolio, Select Financial Services Portfolio, Select Home Finance Portfolio, and Select Insurance Portfolio. Mr. Rathgeber also serves as Chief Compliance Officer of other Fidelity funds (2004-present) and Executive Vice President of Risk Oversight for Fidelity Investments (2002-present). He is Chief Compliance Officer of FMR (2005-present), FMR Co., Inc. (2005-present), Fidelity Management & Research (U.K.) Inc. (2005-present), Fidelity Research & Analysis Company (2005-present), Fidelity Investments Money Management, Inc. (2005- present), and Strategic Advisers, Inc. (2005-present). Previously, Mr. Rathgeber served as Executive Vice President and Chief Operating Officer for Fidelity Investments Institutional Services Company, Inc. (1998-2002). | |
Bryan A. Mehrmann (45) | |
Year of Election or Appointment: 2005 Deputy Treasurer of Select Banking Portfolio, Select Brokerage & Investment Management Portfolio, Select Financial Services Portfolio, Select Home Finance Portfolio, and Select Insurance Portfolio. Mr. Mehrmann also serves as Deputy Treasurer of other Fidelity funds (2005-present) and is an employee of FMR. Previously, Mr. Mehrmann served as Vice President of Fidelity Investments Institutional Services Group (FIIS)/Fidelity Investments Institutional Operations Corporation, Inc. (FIIOC) Client Services (1998-2004). | |
Kenneth B. Robins (37) | |
Year of Election or Appointment: 2005 Deputy Treasurer of Select Banking Portfolio, Select Brokerage & Investment Management Portfolio, Select Financial Services Portfolio, Select Home Finance Portfolio, and Select Insurance Portfolio. Mr. Robins also serves as Deputy Treasurer of other Fidelity funds (2005-present) and is an employee of FMR (2004-present). Before joining Fidelity Investments, Mr. Robins worked at KPMG LLP, where he was a partner in KPMG's department of professional practice (2002-2004) and a Senior Manager (1999-2000). In addition, Mr. Robins served as Assistant Chief Accountant, United States Securities and Exchange Commission (2000-2002). | |
Robert G. Byrnes (40) | |
Year of Election or Appointment: 2005 Assistant Treasurer of Select Banking Portfolio, Select Brokerage & Investment Management Portfolio, Select Financial Services Portfolio, Select Home Finance Portfolio, and Select Insurance Portfolio. Mr. Byrnes also serves as Assistant Treasurer of other Fidelity funds (2005-present) and is an employee of FMR (2005-present). Previously, Mr. Byrnes served as Vice President of FPCMS (2003-2005). Before joining Fidelity Investments, Mr. Byrnes worked at Deutsche Asset Management where he served as Vice President of the Investment Operations Group (2000-2003). | |
Peter L. Lydecker (53) | |
Year of Election or Appointment: 2004 Assistant Treasurer of Select Banking Portfolio, Select Brokerage & Investment Management Portfolio, Select Financial Services Portfolio, Select Home Finance Portfolio, and Select Insurance Portfolio. Mr. Lydecker also serves as Assistant Treasurer of other Fidelity funds (2004) and is an employee of FMR. | |
Gary W. Ryan (48) | |
Year of Election or Appointment: 2005 Assistant Treasurer of Select Banking Portfolio, Select Brokerage & Investment Management Portfolio, Select Financial Services Portfolio, Select Home Finance Portfolio, and Select Insurance Portfolio. Mr. Ryan also serves as Assistant Treasurer of other Fidelity funds (2005-present) and is an employee of FMR (2005-present). Previously, Mr. Ryan served as Vice President of Fund Reporting in FPCMS (1999-2005). | |
Salvatore Schiavone (41) | |
Year of Election or Appointment: 2005 Assistant Treasurer of Select Banking Portfolio, Select Brokerage & Investment Management Portfolio, Select Financial Services Portfolio, Select Home Finance Portfolio, and Select Insurance Portfolio. Mr. Schiavone also serves as Assistant Treasurer of other Fidelity funds (2005-present) and is an employee of FMR (2005-present). Before joining Fidelity Investments, Mr. Schiavone worked at Deutsche Asset Management, where he most recently served as Assistant Treasurer (2003-2005) of the Scudder Funds and Vice President and Head of Fund Reporting (1996-2003). | |
Annual Report
Distributions
The Board of Trustees of each fund voted to pay to shareholders of record at the opening of business on record date, the following distributions per share derived from capital gains realized from sales of portfolio securities, and dividends derived from net investment income:
Fund | Pay Date | Record Date | Dividends | Capital Gains |
Select Banking | 04/16/07 | 04/13/07 | $.12 | $.88 |
Select Brokerage and Investment Management | 04/16/07 | 04/13/07 | $.15 | $2.19 |
Select Financial Services | 04/16/07 | 04/13/07 | $.25 | $1.08 |
Select Home Finance | 04/16/07 | 04/13/07 | $.16 | $1.07 |
Select Insurance | 04/16/07 | 04/13/07 | $.01 | $.05 |
The funds hereby designate as capital gain dividend the amounts noted below for the taxable year ended February 28, 2007, or, if subsequently determined to be different, the net capital gain of such year.
Fund | |
Select Banking | $ 60,618,196 |
Select Brokerage and Investment Management | $113,400,147 |
Select Financial Services | $ 45,294,296 |
Select Home Finance | $ 35,969,544 |
Select Insurance | $ 15,418,788 |
A percentage of the dividends distributed during the fiscal year for the following funds qualifies for the dividends-received deduction for corporate shareholders:
Select Banking | |
April, 2006 | 100% |
December 2006 | 100% |
Select Brokerage and Investment Management | |
April, 2006 | 21% |
December 2006 | 33% |
Select Financial Services | |
April, 2006 | 100% |
December 2006 | 100% |
Select Home Finance | |
April, 2006 | 100% |
December 2006 | 100% |
Select Insurance | |
April, 2006 | 100% |
December, 2006 | 100% |
Annual Report
Distributions - continued
A percentage of the dividends distributed during the fiscal year for the following funds may be taken into account as a dividend for purposes of the maximum rate under section 1(h)(11) of the Internal Revenue Code.
Select Banking | |
April, 2006 | 100% |
December 2006 | 100% |
Select Brokerage and Investment Management | |
April, 2006 | 21% |
December 2006 | 48% |
Select Financial Services | |
April, 2006 | 100% |
December 2006 | 100% |
Select Home Finance | |
April, 2006 | 100% |
December 2006 | 100% |
Select Insurance | |
April, 2006 | 100% |
December, 2006 | 100% |
The funds will notify shareholders in January 2008 of amounts for use in preparing 2007 income tax returns.
Annual Report
Proxy Voting Results
A special meeting of Fidelity Select Portfolios' shareholders was held on September 20, 2006. The results of votes taken among shareholders on the proposals before them are reported below. Each vote reported represents one dollar of net asset value held on the record date for the meeting.
PROPOSAL 1 | ||
To elect a Board of Trustees. A | ||
# of | % of | |
Dennis J. Dirks | ||
Affirmative | 13,182,341,755.09 | 94.980 |
Withheld | 696,736,162.41 | 5.020 |
TOTAL | 13,879,077,917.50 | 100.000 |
Albert R. Gamper, Jr. | ||
Affirmative | 13,177,593,614.43 | 94.946 |
Withheld | 701,484,303.07 | 5.054 |
TOTAL | 13,879,077,917.50 | 100.000 |
Robert M. Gates | ||
Affirmative | 13,141,235,622.81 | 94.684 |
Withheld | 737,842,294.69 | 5.316 |
TOTAL | 13,879,077,917.50 | 100.000 |
George H. Heilmeier | ||
Affirmative | 13,140,073,210.00 | 94.675 |
Withheld | 739,004,707.50 | 5.325 |
TOTAL | 13,879,077,917.50 | 100.000 |
Edward C. Johnson 3d | ||
Affirmative | 13,106,284,587.54 | 94.432 |
Withheld | 772,793,329.96 | 5.568 |
TOTAL | 13,879,077,917.50 | 100.000 |
Stephen P. Jonas | ||
Affirmative | 13,168,282,872.88 | 94.879 |
Withheld | 710,795,044.62 | 5.121 |
TOTAL | 13,879,077,917.50 | 100.000 |
James H. KeyesB | ||
Affirmative | 13,164,603,089.66 | 94.852 |
Withheld | 714,474,827.84 | 5.148 |
TOTAL | 13,879,077,917.50 | 100.000 |
Marie L. Knowles | ||
Affirmative | 13,169,356,779.66 | 94.886 |
Withheld | 709,721,137.84 | 5.114 |
TOTAL | 13,879,077,917.50 | 100.000 |
Ned C. Lautenbach | ||
Affirmative | 13,166,485,155.52 | 94.866 |
Withheld | 712,592,761.98 | 5.134 |
TOTAL | 13,879,077,917.50 | 100.000 |
William O. McCoy | ||
Affirmative | 13,129,548,996.59 | 94.600 |
Withheld | 749,528,920.91 | 5.400 |
TOTAL | 13,879,077,917.50 | 100.000 |
Robert L. Reynolds | ||
Affirmative | 13,180,813,649.06 | 94.969 |
Withheld | 698,264,268.44 | 5.031 |
TOTAL | 13,879,077,917.50 | 100.000 |
# of | % of | |
Cornelia M. Small | ||
Affirmative | 13,170,500,616.42 | 94.895 |
Withheld | 708,577,301.08 | 5.105 |
TOTAL | 13,879,077,917.50 | 100.000 |
William S. Stavropoulos | ||
Affirmative | 13,143,284,328.22 | 94.699 |
Withheld | 735,793,589.28 | 5.301 |
TOTAL | 13,879,077,917.50 | 100.000 |
Kenneth L. Wolfe | ||
Affirmative | 13,162,946,758.47 | 94.840 |
Withheld | 716,131,159.03 | 5.160 |
TOTAL | 13,879,077,917.50 | 100.000 |
PROPOSAL 9A & 10A | ||
To modify the fund's fundamental "invests primarily" policy (the investment policy concerning the fund's primary investments). | ||
Banking Portfolio | ||
# of | % of | |
Affirmative | 169,347,655.70 | 78.441 |
Against | 15,304,588.89 | 7.089 |
Abstain | 9,861,771.47 | 4.568 |
Broker Non-Votes | 21,378,320.82 | 9.902 |
TOTAL | 215,892,336.88 | 100.000 |
Home Finance Portfolio | ||
# of | % of | |
Affirmative | 124,571,494.04 | 80.299 |
Against | 8,458,103.51 | 5.452 |
Abstain | 6,962,928.43 | 4.488 |
Broker Non-Votes | 15,142,939.20 | 9.761 |
TOTAL | 155,135,465.18 | 100.000 |
PROPOSAL 9B & 10B | ||
To modify the fund's investment concentration policy. | ||
Banking Portfolio | ||
# of | % of | |
Affirmative | 169,194,304.87 | 78.370 |
Against | 15,339,699.77 | 7.105 |
Abstain | 9,980,011.42 | 4.623 |
Broker Non-Votes | 21,378,320.82 | 9.902 |
TOTAL | 215,892,336.88 | 100.000 |
Home Finance Portfolio | ||
# of | % of | |
Affirmative | 124,140,803.97 | 80.021 |
Against | 8,317,343.44 | 5.361 |
Abstain | 7,534.378.57 | 4.857 |
Broker Non-Votes | 15,142,939.20 | 9.761 |
TOTAL | 155,135,465.18 | 100.000 |
A Denotes trust-wide proposal and voting results. B Effective on or about January 1, 2007. | ||
Annual Report
Managing Your Investments
Fidelity offers several ways to conveniently manage your personal investments via your telephone or PC. You can access your account information, conduct trades and research your investments 24 hours a day.
By Phone
Fidelity Automated Service Telephone provides a single toll-free number to access account balances, positions, quotes and trading. It's easy to navigate the service, and on your first call, the system will help you create a personal identification number (PIN) for security.
(phone_graphic)Fidelity Automated Service Telephone (FAST®)
1-800-544-5555
Press
1 For mutual fund and brokerage trading.
2 For quotes.*
3 For account balances and holdings.
4 To review orders and mutual fund activity.
5 To change your PIN.
*0 To speak to a Fidelity representative.
By PC
Fidelity's web site on the Internet provides a wide range of information, including daily financial news, fund performance, interactive planning tools and news about Fidelity products and services.
(computer_graphic)Fidelity's Web Site
www.fidelity.com
* When you call the quotes line, please remember that a fund's yield and return will vary and, except for money market funds, share price will also vary. This means that you may have a gain or loss when you sell your shares. There is no assurance that money market funds will be able to maintain a stable $1 share price; an investment in a money market fund is not insured or guaranteed by the U.S. government. Total returns are historical and include changes in share price, reinvestment of dividends and capital gains, and the effects of any sales charges.
Annual Report
To Visit Fidelity
For directions and hours,
please call 1-800-544-9797.
Arizona
7001 West Ray Road
Chandler, AZ
15445 N. Scottsdale Road
Scottsdale, AZ
California
815 East Birch Street
Brea, CA
1411 Chapin Avenue
Burlingame, CA
851 East Hamilton Avenue
Campbell, CA
19200 Von Karman Avenue
Irvine, CA
601 Larkspur Landing Circle
Larkspur, CA
10100 Santa Monica Blvd.
Los Angeles, CA
27101 Puerta Real
Mission Viejo, CA
73-575 El Paseo
Palm Desert, CA
251 University Avenue
Palo Alto, CA
123 South Lake Avenue
Pasadena, CA
16995 Bernardo Ctr. Drive
Rancho Bernardo, CA
1220 Roseville Parkway
Roseville, CA
1740 Arden Way
Sacramento, CA
7676 Hazard Center Drive
San Diego, CA
11943 El Camino Real
San Diego, CA
8 Montgomery Street
San Francisco, CA
3793 State Street
Santa Barbara, CA
1200 Wilshire Boulevard
Santa Monica, CA
21701 Hawthorne Boulevard
Torrance, CA
2001 North Main Street
Walnut Creek, CA
6300 Canoga Avenue
Woodland Hills, CA
Colorado
1625 Broadway
Denver, CO
9185 Westview Road
Lone Tree, CO
Connecticut
48 West Putnam Avenue
Greenwich, CT
265 Church Street
New Haven, CT
300 Atlantic Street
Stamford, CT
29 South Main Street
West Hartford, CT
Delaware
400 Delaware Avenue
Wilmington, DE
Florida
4400 N. Federal Highway
Boca Raton, FL
121 Alhambra Plaza
Coral Gables, FL
2948 N. Federal Highway
Ft. Lauderdale, FL
4671 Town Center Parkway
Jacksonville, FL
1907 West State Road 434
Longwood, FL
8880 Tamiami Trail, North
Naples, FL
3501 PGA Boulevard
Palm Beach Gardens, FL
3550 Tamiami Trail, South
Sarasota, FL
1502 N. Westshore Blvd.
Tampa, FL
2465 State Road 7
Wellington, FL
Georgia
3445 Peachtree Road, N.E.
Atlanta, GA
1000 Abernathy Road
Atlanta, GA
Illinois
One North LaSalle Street
Chicago, IL
875 North Michigan Ave.
Chicago, IL
1415 West 22nd Street
Oak Brook, IL
1572 East Golf Road
Schaumburg, IL
3232 Lake Avenue
Wilmette, IL
Indiana
4729 East 82nd Street
Indianapolis, IN
Kansas
5400 College Boulevard
Overland Park, KS
Maine
Three Canal Plaza
Portland, ME
Maryland
7315 Wisconsin Avenue
Bethesda, MD
One W. Pennsylvania Ave.
Towson, MD
Massachusetts
801 Boylston Street
Boston, MA
155 Congress Street
Boston, MA
300 Granite Street
Braintree, MA
44 Mall Road
Burlington, MA
238 Main Street
Cambridge, MA
405 Cochituate Road
Framingham, MA
416 Belmont Street
Worcester, MA
Michigan
500 E. Eisenhower Pkwy.
Ann Arbor, MI
280 Old N. Woodward Ave.
Birmingham, MI
43420 Grand River Avenue
Novi, MI
29155 Northwestern Hwy.
Southfield, MI
Minnesota
7600 France Avenue South
Edina, MN
Missouri
1524 South Lindbergh Blvd.
St. Louis, MO
Nevada
2225 Village Walk Drive
Henderson, NV
New Jersey
150 Essex Street
Millburn, NJ
56 South Street
Morristown, NJ
396 Route 17, North
Paramus, NJ
3518 Route 1 North
Princeton, NJ
530 Broad Street
Shrewsbury, NJ
New York
1055 Franklin Avenue
Garden City, NY
37 West Jericho Turnpike
Huntington Station, NY
1271 Avenue of the Americas
New York, NY
980 Madison Avenue
New York, NY
61 Broadway
New York, NY
350 Park Avenue
New York, NY
200 Fifth Avenue
New York, NY
733 Third Avenue
New York, NY
11 Penn Plaza
New York, NY
2070 Broadway
New York, NY
1075 Northern Blvd.
Roslyn, NY
799 Central Park Avenue
Scarsdale, NY
North Carolina
4611 Sharon Road
Charlotte, NC
7011 Fayetteville Road
Durham, NC
Ohio
3805 Edwards Road
Cincinnati, OH
1324 Polaris Parkway
Columbus, OH
28699 Chagrin Boulevard
Woodmere Village, OH
Oregon
7493 SW Bridgeport Road
Tigard, OR
Pennsylvania
600 West DeKalb Pike
King of Prussia, PA
1735 Market Street
Philadelphia, PA
12001 Perry Highway
Wexford, PA
Rhode Island
47 Providence Place
Providence, RI
Tennessee
6150 Poplar Avenue
Memphis, TN
Texas
10000 Research Boulevard
Austin, TX
4001 Northwest Parkway
Dallas, TX
12532 Memorial Drive
Houston, TX
2701 Drexel Drive
Houston, TX
6560 Fannin Street
Houston, TX
6500 N. MacArthur Blvd.
Irving, TX
6005 West Park Boulevard
Plano, TX
14100 San Pedro
San Antonio, TX
1576 East Southlake Blvd.
Southlake, TX
19740 IH 45 North
Spring, TX
Utah
279 West South Temple
Salt Lake City, UT
Virginia
1861 International Drive
McLean, VA
Washington
411 108th Avenue, N.E.
Bellevue, WA
1518 6th Avenue
Seattle, WA
Washington, DC
1900 K Street, N.W.
Washington, DC
Wisconsin
595 North Barker Road
Brookfield, WI
Annual Report
Fidelity Brokerage Services, Inc., 100 Summer St., Boston, MA 02110 Member NYSE/SIPC
Investment Adviser
Fidelity Management & Research Company
Boston, MA
Investment Sub-Advisers
FMR Co., Inc.
Fidelity Management & Research
(U.K.) Inc.
Fidelity Research & Analysis Company
Fidelity Investments Japan Limited
Fidelity International Investment Advisors
Fidelity International Investment Advisors
(U.K. Limited)
General Distributor
Fidelity Distributors Corporation
Boston, MA
Transfer and Service Agent
Fidelity Service Company, Inc.
Boston, MA
Custodian
Brown Brothers Harriman & Co.
Boston, MA
Corporate Headquarters
82 Devonshire Street
Boston, MA 02109
1-800-544-8888
The Fidelity Telephone Connection
Mutual Fund 24-Hour Service
Exchanges/Redemptions
and Account Assistance 1-800-544-6666
Product Information 1-800-544-8888
Retirement Accounts 1-800-544-4774
(8 a.m. - 9 p.m.)
TDD Service 1-800-544-0118
for the deaf and hearing impaired
(9 a.m. - 9 p.m. Eastern time)
Fidelity Automated Service
Telephone (FAST®) (automated graphic) 1-800-544-5555
(automated graphic) Automated line for quickest service
(Fidelity Investment logo)(registered trademark)
Corporate Headquarters
82 Devonshire St., Boston, MA 02109
www.fidelity.com
SELFIN-UANN-0407
1.813662.102
Fidelity®
Select Portfolios®
Information Technology Sector
Select Communications Equipment Portfolio (formerly Developing Communications Portfolio)
Select Computers Portfolio
Select Electronics Portfolio
Select IT Services Portfolio (formerly Business Services and Outsourcing Portfolio)
Select Networking and Infrastructure Portfolio
Select Software and Computer Services Portfolio
Select Technology Portfolio
Annual Report
February 28, 2007
(2_fidelity_logos) (Registered_Trademark)
Contents
Chairman's Message | ||
Notes to Shareholders | ||
Shareholder Expense Example | ||
Fund Updates* | ||
Information Technology Sector | ||
Communications Equipment | ||
Computers | ||
Electronics | ||
IT Services | ||
Networking and Infrastructure | ||
Software and Computer Services | ||
Technology | ||
Notes to Financial Statements | ||
Report of Independent Registered Public Accounting Firm | ||
Trustees and Officers | ||
Distributions | ||
Proxy Voting Results |
* Fund updates for each Select Portfolio include: Performance, Management's Discussion of Fund Performance, Investment Changes, Investments, and Financial Statements.
To view a fund's proxy voting guidelines and proxy voting record for the 12-month period ended June 30, visit www.fidelity.com/proxyvotingresults or visit the Securities and Exchange Commission's (SEC) web site at www.sec.gov. You may also call 1-800-544-8544 to request a free copy of the proxy voting guidelines.
Standard & Poor's, S&P and S&P 500 are registered service marks of The McGraw-Hill Companies, Inc. and have been licensed for use by Fidelity Distributors Corporation.
Other third party marks appearing herein are the property of their respective owners.
All other marks appearing herein are registered or unregistered trademarks or service marks of FMR Corp. or an affiliated company.
This report and the financial statements contained herein are submitted for the general information of the shareholders of the funds. This report is not authorized for distribution to prospective investors in the funds unless preceded or accompanied by an effective prospectus.
A fund files its complete schedule of portfolio holdings with the SEC for the first and third quarters of each fiscal year on Form N-Q. Forms N-Q are available on the SEC's web site at http://www.sec.gov. A fund's Forms N-Q may be reviewed and copied at the SEC's Public Reference Room in Washington, DC. Information regarding the operation of the SEC's Public Reference Room may be obtained by calling 1-800-SEC-0330. For a complete list of a fund's portfolio holdings, view the most recent quarterly holdings report, semiannual report, or annual report on Fidelity's web site at http://www.fidelity.com/holdings.
NOT FDIC INSURED · MAY LOSE VALUE · NO BANK GUARANTEE
Neither the funds nor Fidelity Distributors Corporation is a bank.
Annual Report
Chairman's Message
(Photograph of Edward C. Johnson 3d.)
Dear Shareholder:
Substantial single-day losses are not uncommon in the equity markets, and when they occur - as in late February - investors can be better served in the long term by buying good stocks at lower prices than by moving their money to the sidelines. While financial markets are always unpredictable, there are a number of time-tested principles that can put the historical odds in your favor.
One of the basic tenets is to invest for the long term. Over time, riding out the markets' inevitable ups and downs has proven much more effective than selling into panic or chasing the hottest trend. Even missing only a few of the markets' best days can significantly diminish investor returns. Patience also affords the benefits of compounding - of earning interest on additional income or reinvested dividends and capital gains. There are tax advantages and cost benefits to consider as well. The more you sell, the more taxes you pay, and the more you trade, the higher the costs. While staying the course doesn't eliminate risk, it can considerably lessen the effect of short-term declines.
You can further manage your investing risk through diversification. And today, more than ever, geographic diversification should be taken into account. Studies
indicate that asset allocation is the single most important determinant of a portfolio's long-term success. The right mix of stocks, bonds and cash - aligned to your particular risk tolerance and investment objective - is very important. Age-appropriate rebalancing is also an essential aspect of asset allocation. For younger investors, an emphasis on equities - which historically have been the best performing asset class over time - is encouraged. As investors near their specific goal, such as retirement or sending a child to college, consideration may be given to replacing volatile assets (e.g. common stocks) with more-stable fixed investments (bonds or savings plans).
A third investment principle - investing regularly - can help lower the average cost of your purchases. Investing a certain amount of money each month or quarter helps ensure you won't pay for all your shares at market highs. This strategy - known as dollar cost averaging - also reduces unconstructive "emotion" from investing, helping shareholders avoid selling weak performers just prior to an upswing, or chasing a hot performer just before a correction.
We invite you to contact us via the Internet, through our Investor Centers or over the phone. It is our privilege to provide you the information you need to make the investments that are right for you.
Sincerely,
/s/Edward C. Johnson 3d
Edward C. Johnson 3d
Annual Report
Notes to Shareholders:
Effective October 1, 2006, Fidelity restructured the Fidelity® Select Portfolios® equity product line. The restructuring aligned the equity funds' investment goals more closely with standard industry classifications and facilitated adoption of more-specific benchmark indexes to evaluate fund performance. As restructured, the equity funds generally align under the 10 sectors in the widely recognized Global Industry Classification Standard (GICS), developed by Standard & Poor's® (S&P®) and Morgan Stanley Capital InternationalSM (MSCI®): Consumer Discretionary, Consumer Staples, Energy, Financials, Health Care, Industrials, Information Technology, Materials, Telecommunications Services and Utilities. Changes to the funds ranged from simply adopting a new supplemental benchmark to, in some cases, changing investment policies and fund names.
For Banking, Communications Equipment (formerly Developing Communications), Construction and Housing, Consumer Discretionary (formerly Consumer Industries), Consumer Staples (formerly Food and Agriculture), Home Finance, Industrials (formerly Cyclical Industries), IT Services (formerly Business Services and Outsourcing) and Materials (formerly Industrial Materials), shareholders approved certain fundamental investment policy changes related to the restructuring at a special meeting of shareholders held September 20, 2006. All the equity funds adopted new benchmark indexes from MSCI, except for Gold (which adopted an S&P/Citigroup index), Natural Gas (which adopted an S&P index) and Natural Resources (which retained its current Goldman Sachs® index). Taken together, the name, policy and benchmark changes will make it easier for investors to distinguish funds in the product line and to evaluate Fidelity Management & Research Company's skill in managing the funds.
The Select equity portfolios also eliminated hourly pricing. The funds now price each business day as of the close of the New York Stock Exchange, normally 4:00 pm Eastern time. The funds also adopted Fidelity's standard fund market timing policy, as described in the funds' current prospectus, and removed the $7.50 fee formerly charged on exchanges made through non-automated channels.
Changes for each fund in the GICS Information Technology Sector are described in detail below.
Communications Equipment (formerly Developing Communications)
Shareholders approved modifying the fund's policies so that it invests primarily in companies engaged in the development, manufacture or sale of communications equipment, rather than communications services companies. The fund is now benchmarked to the MSCI US Investable Market Communications Equipment Index.
Computers
The fund is now benchmarked to the MSCI US Investable Market Computers & Peripherals Index.
Electronics
The fund is now benchmarked to the MSCI US Investable Market Semiconductors & Semiconductor Equipment Index.
IT Services (formerly Business Services and Outsourcing)
Shareholders approved narrowing the fund's focus so that it invests primarily in companies engaged in providing information technology services. Information technology services, or IT services, involve the development and maintenance of telephone, computer or data networks for businesses and other organizations. The fund is now benchmarked to the MSCI US Investable Market IT Services Index.
Networking and Infrastructure
The fund is now benchmarked to the MSCI US Investable Market Information Technology Index.
Software and Computer Services
The fund is now benchmarked to the MSCI US Investable Market Software & Services Index.
Technology
The fund is now benchmarked to the MSCI US Investable Market Information Technology Index.
Annual Report
Shareholder Expense Example
As a shareholder of a Fund, you incur two types of costs: (1) transaction costs, including redemption fees, exchange fees, and (2) ongoing costs, including management fees and other Fund expenses. This Example is intended to help you understand your ongoing costs (in dollars) of investing in the Funds and to compare these costs with the ongoing costs of investing in other mutual funds.
The Example is based on an investment of $1,000 invested at the beginning of the period and held for the entire period (September 1, 2006 to February 28, 2007).
Actual Expenses
The first line of the accompanying table for each fund provides information about actual account values and actual expenses. You may use the information in this line, together with the amount you invested, to estimate the expenses that you paid over the period. Simply divide your account value by $1,000.00 (for example, an $8,600 account value divided by $1,000.00 = 8.6), then multiply the result by the number in the first line for a fund under the heading entitled "Expenses Paid During Period" to estimate the expenses you paid on your account during this period. A small balance maintenance fee of $12.00 that is charged once a year may apply for certain accounts with a value of less than $2,000. This fee is not included in the table below. If it was, the estimate of expenses you paid during the period would be higher, and your ending account value lower, by this amount.
Hypothetical Example for Comparison Purposes
The second line of the accompanying table for each fund provides information about hypothetical account values and hypothetical expenses based on a fund's actual expense ratio and an assumed rate of return of 5% per year before expenses, which is not the Fund's actual return. The hypothetical account values and expenses may not be used to estimate the actual ending account balance or expenses you paid for the period. You may use this information to compare the ongoing costs of investing in the Fund and other funds. To do so, compare this 5% hypothetical example with the 5% hypothetical examples that appear in the shareholder reports of the other funds. A small balance maintenance fee of $12.00 that is charged once a year may apply for certain accounts with a value of less than $2,000. This fee is not included in the table below. If it was, the estimate of expenses you paid during the period would be higher, and your ending account value lower, by this amount.
Please note that the expenses shown in the table are meant to highlight your ongoing costs only and do not reflect any transaction costs. Therefore, the second line of the table is useful in comparing ongoing costs only, and will not help you determine the relative total costs of owning different funds. In addition, if these transactional costs were included, your costs would have been higher.
Beginning | Ending | Expenses Paid | |
Communications Equipment Portfolio | |||
Actual | $ 1,000.00 | $ 1,053.10 | $ 5.09** |
HypotheticalA | $ 1,000.00 | $ 1,019.84 | $ 5.01** |
Computers Portfolio | |||
Actual | $ 1,000.00 | $ 1,111.10 | $ 5.23** |
HypotheticalA | $ 1,000.00 | $ 1,019.84 | $ 5.01** |
Electronics Portfolio | |||
Actual | $ 1,000.00 | $ 1,088.40 | $ 4.66 |
HypotheticalA | $ 1,000.00 | $ 1,020.33 | $ 4.51 |
IT Services Portfolio | |||
Actual | $ 1,000.00 | $ 1,121.40 | $ 6.05 |
HypotheticalA | $ 1,000.00 | $ 1,019.09 | $ 5.76 |
Networking and Infrastructure Portfolio | |||
Actual | $ 1,000.00 | $ 1,101.80 | $ 5.63** |
HypotheticalA | $ 1,000.00 | $ 1,019.44 | $ 5.41** |
Software and Computer Services Portfolio | |||
Actual | $ 1,000.00 | $ 1,129.80 | $ 4.75 |
HypotheticalA | $ 1,000.00 | $ 1,020.33 | $ 4.51 |
Technology Portfolio | |||
Actual | $ 1,000.00 | $ 1,125.70 | $ 4.95 |
HypotheticalA | $ 1,000.00 | $ 1,020.13 | $ 4.71 |
A 5% return per year before expenses
Annual Report
* Expenses are equal to each Fund's annualized expense ratio (shown in the table below); multiplied by the average account value over the period, multiplied by 181/365 (to reflect the one-half year period).
Annualized | |
Communications Equipment Portfolio | 1.00%** |
Computers Portfolio | 1.00%** |
Electronics Portfolio | .90% |
IT Services Portfolio | 1.15% |
Networking and Infrastructure Portfolio | 1.08%** |
Software and Computer Services Portfolio | .90% |
Technology Portfolio | .94% |
**If fees, effective January 1, 2007 had been in effect during the entire period, the annualized expense ratio and the expenses paid in the actual and hypothetical examples above would have been as follows:
Annualized | Expenses Paid | |
Communications Equipment Portfolio | .93% | |
Actual | $ 4.73 | |
HypotheticalA | $ 4.66 | |
Computers Portfolio | .93% | |
Actual | $ 4.87 | |
HypotheticalA | $ 4.66 | |
Networking and Infrastructure Portfolio | .99% | |
Actual | $ 5.16 | |
HypotheticalA | $ 4.96 |
A 5% return per year before expenses
Annual Report
Select Communications Equipment Portfolio
Performance
Average annual total return reflects the change in the value of an investment, assuming reinvestment of the fund's dividend income and capital gains (the profits earned upon the sale of securities that have grown in value) and assuming a constant rate of performance each year. The $10,000 table and the fund's returns do not reflect the deduction of taxes that a shareholder would pay on fund distributions or the redemption of fund shares. During periods of reimbursement by Fidelity, a fund's total returns will be greater than it would be had the reimbursement not occurred. How a fund did yesterday is no guarantee of how it will do tomorrow.
Average Annual Total Returns
Periods ended February 28, 2007 | Past 1 | Past 5 | Past 10 |
Select Communications Equipment Portfolio | -4.75% | 6.62% | 7.82% |
Prior to October 1, 2006, Select Communications Equipment Portfolio was named Select Developing Communications Portfolio and operated under certain different investment policies. The fund's historical performance may not represent its current investment policies.
$10,000 Over 10 Years
Let's say hypothetically that $10,000 was invested in Select Communications Equipment Portfolio on February 28, 1997. The chart shows how the value of your investment would have changed, and also shows how the S&P 500 Index performed over the same period.
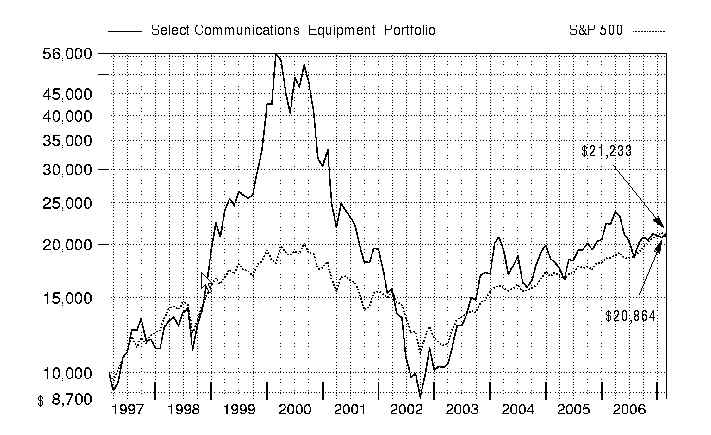
Annual Report
Select Communications Equipment Portfolio
Management's Discussion of Fund Performance
Comments from Charlie Chai, Portfolio Manager of Fidelity® Select Communications Equipment Portfolio
A rosy year for stocks wilted just prior to the end of the 12-month period ending February 28, 2007. On the day prior to the period's close, the Dow Jones Industrial AverageSM plunged 416 points and the Standard & Poor's 500SM Index lost roughly 3.5% of its value, plummeting nearly 50 points and marking the benchmark's worst single-day performance since the day the market reopened after the 9/11 terrorist attacks. Though investors were obviously rattled by the development, it was only the 22nd-biggest decline for the S&P 500® in 20 years, and it could not overshadow how well stocks performed for the 12 months overall. For much of the past year, investors grew confident that the economy would not fall into a recession, and they bid up most broad-based stock indexes for six consecutive months from August through January. Overall for the year ending February 28, 2007, the S&P 500 was up 11.97%, the Dow advanced 14.24%, the small-cap Russell 2000® Index gained 9.87% and the NASDAQ Composite® Index rose 6.66%.
During the past year, the fund returned -4.75%, falling short of the 2.15% return of the Morgan Stanley Capital InternationalSM (MSCI®) US Investable Market Communications Equipment Index and also trailing the 2.31% advance of a blended index specific to this fund. This blended index is a combination of the Goldman Sachs® Technology Index, which the fund was compared with through September, and the new MSCI benchmark mentioned above, which the fund was compared with during the period's final five months1. During the same 12-month period, the fund lagged the S&P 500. For the first seven months of the review period, the fund trailed the Goldman Sachs index primarily due to unfavorable stock selection in the former's core industry of communications equipment, where it had a huge overweighting. A sizable underweighting in systems software also limited our return, as did stock picking in that group. Additionally, performance suffered due to unrewarding picks in the computer hardware group, as well as a lighter-than-benchmark exposure there. Not owning major index component Oracle, an enterprise software provider, worked against the fund, as the stock registered a strong gain during the period. Another detractor, Comverse Technology, was one of a number of technology stocks that declined due to questions about options pricing policies. On the other hand, the fund's performance benefited from effective stock and market selection in Internet software and services, where a relatively large stake in targeted advertising provider Google added value. That said, I sold Google and nailed down profits due to my concerns about the stock's valuation getting too rich. Overweighting the wireless telecommunication services group helped as well. Versus the MSCI index during the final five months, the fund slightly trailed, with lackluster stock selection in communications equipment having the most negative impact. For example, underweighting networking equipment maker Cisco Systems hurt fund performance, as it accounted for an average weighting of more than 41% of the MSCI index and turned in a modest double-digit gain. Wireless communications equipment maker Powerwave Technologies also held back our results. Conversely, stock picking in semiconductors provided a boost to performance. Among individual holdings, Canada's Research In Motion aided our results. A successful launch of the company's new handheld messaging device, the Pearl, boosted its stock.
1 The fund's blended index is a customized index developed by Fidelity for the limited purpose of discussing the fund's performance for the 12-month period ending February 28, 2007. From March 1, 2006, through September 30, 2006, the fund compared its performance to the Goldman Sachs Technology Index, which returned -0.35% during that period. On October 1, 2006, the fund began comparing its performance to a different index, the MSCI US Investable Market Communications Equipment Index, which returned 2.67% from October 1, 2006, through February 28, 2007. For the 12-month period ending February 28, 2007, the blended index (Goldman Sachs and MSCI) returned 2.31%.
The views expressed above reflect those of the portfolio manager(s) only through the end of the period as stated on the cover of this report and do not necessarily represent the views of Fidelity or any other person in the Fidelity organization. Any such views are subject to change at any time based upon market or other conditions and Fidelity disclaims any responsibility to update such views. These views may not be relied on as investment advice and, because investment decisions for a Fidelity fund are based on numerous factors, may not be relied on as an indication of trading intent on behalf of any Fidelity fund.
Annual Report
Select Communications Equipment Portfolio
Investment Changes
Top Ten Stocks as of February 28, 2007 | ||
% of fund's | % of fund's net assets | |
QUALCOMM, Inc. | 21.0 | 7.6 |
Corning, Inc. | 8.4 | 8.7 |
Motorola, Inc. | 7.2 | 4.6 |
Research In Motion Ltd. | 6.7 | 1.5 |
Comverse Technology, Inc. | 5.7 | 5.3 |
Cisco Systems, Inc. | 4.0 | 0.0 |
Powerwave Technologies, Inc. | 3.5 | 5.3 |
F5 Networks, Inc. | 3.1 | 2.3 |
Sonus Networks, Inc. | 2.7 | 1.3 |
Juniper Networks, Inc. | 2.5 | 2.4 |
64.8 | ||
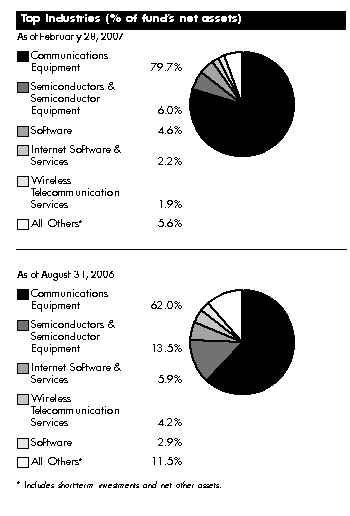
Annual Report
Select Communications Equipment Portfolio
Investments February 28, 2007
Showing Percentage of Net Assets
Common Stocks - 99.1% | |||
Shares | Value | ||
COMMERCIAL SERVICES & SUPPLIES - 1.2% | |||
Diversified Commercial & Professional Services - 1.2% | |||
Tele Atlas NV (a) | 175,600 | $ 3,676,256 | |
COMMUNICATIONS EQUIPMENT - 79.5% | |||
Communications Equipment - 79.5% | |||
Acme Packet, Inc. | 2,500 | 41,525 | |
ADC Telecommunications, Inc. (a)(d) | 138,079 | 2,267,257 | |
Adtran, Inc. | 110,600 | 2,547,118 | |
ADVA AG Optical Networking (a) | 246,763 | 2,841,018 | |
Alcatel-Lucent SA sponsored ADR (d) | 252,100 | 3,234,443 | |
AudioCodes Ltd. (a) | 445,190 | 4,340,603 | |
Bookham, Inc. (a) | 630,628 | 1,652,245 | |
Carrier Access Corp. (a) | 96,900 | 479,655 | |
Ceragon Networks Ltd. (a) | 4,100 | 23,042 | |
Ciena Corp. (a) | 169,292 | 5,327,619 | |
Cisco Systems, Inc. (a) | 491,000 | 12,736,540 | |
Comtech Group, Inc. (a)(d) | 365,900 | 5,433,615 | |
Comverse Technology, Inc. (a) | 833,810 | 18,327,144 | |
Corning, Inc. (a) | 1,315,900 | 27,147,017 | |
ECI Telecom Ltd. (a) | 185,300 | 1,486,106 | |
F5 Networks, Inc. (a)(d) | 139,800 | 10,152,276 | |
Foundry Networks, Inc. (a) | 215,500 | 3,146,300 | |
Foxconn International Holdings Ltd. (a) | 80,000 | 211,441 | |
Harris Stratex Networks, Inc. (a) | 103,975 | 2,121,090 | |
Ixia (a) | 110,837 | 1,221,424 | |
JDS Uniphase Corp. (a)(d) | 151,050 | 2,448,521 | |
Juniper Networks, Inc. (a) | 424,859 | 8,034,084 | |
Motorola, Inc. | 1,247,500 | 23,103,700 | |
Nortel Networks Corp. (a) | 23,220 | 696,074 | |
Opnext, Inc. | 15,900 | 267,915 | |
Optium Corp. | 900 | 20,709 | |
Orckit Communications Ltd. (a) | 137,900 | 1,458,982 | |
Polycom, Inc. (a) | 44,200 | 1,409,980 | |
Powerwave Technologies, Inc. (a)(d) | 2,105,000 | 11,198,600 | |
QUALCOMM, Inc. | 1,679,800 | 67,662,345 | |
Research In Motion Ltd. (a) | 153,300 | 21,555,514 | |
Riverbed Technology, Inc. | 21,100 | 671,613 | |
Riverstone Networks, Inc. (a) | 1,129,500 | 11 | |
Sonus Networks, Inc. (a) | 1,151,696 | 8,856,542 | |
Symmetricom, Inc. (a) | 262,355 | 2,219,523 | |
Tekelec (a) | 127,600 | 1,589,896 | |
255,931,487 | |||
COMPUTERS & PERIPHERALS - 1.5% | |||
Computer Hardware - 1.3% | |||
Compal Electronics, Inc. | 247,627 | 212,827 | |
Concurrent Computer Corp. (a) | 2,481,578 | 3,920,893 | |
NEC Corp. sponsored ADR | 700 | 3,682 | |
4,137,402 | |||
Shares | Value | ||
Computer Storage & Peripherals - 0.2% | |||
SanDisk Corp. (a) | 21,993 | $ 800,985 | |
TOTAL COMPUTERS & PERIPHERALS | 4,938,387 | ||
DIVERSIFIED TELECOMMUNICATION SERVICES - 0.5% | |||
Alternative Carriers - 0.5% | |||
Level 3 Communications, Inc. (a) | 223,600 | 1,469,052 | |
Integrated Telecommunication Services - 0.0% | |||
Embarq Corp. | 1,035 | 57,287 | |
TOTAL DIVERSIFIED TELECOMMUNICATION SERVICES | 1,526,339 | ||
ELECTRICAL EQUIPMENT - 0.1% | |||
Electrical Components & Equipment - 0.1% | |||
Energy Conversion Devices, Inc. (a)(d) | 14,600 | 439,460 | |
ELECTRONIC EQUIPMENT & INSTRUMENTS - 1.6% | |||
Electronic Equipment & Instruments - 0.6% | |||
Chi Mei Optoelectronics Corp. | 415,617 | 409,552 | |
HannStar Display Corp. (a) | 2,368,000 | 392,502 | |
Nippon Electric Glass Co. Ltd. | 48,000 | 1,166,557 | |
1,968,611 | |||
Electronic Manufacturing Services - 1.0% | |||
Flextronics International Ltd. (a) | 226,700 | 2,477,831 | |
Trimble Navigation Ltd. | 27,000 | 714,420 | |
3,192,251 | |||
TOTAL ELECTRONIC EQUIPMENT & INSTRUMENTS | 5,160,862 | ||
INTERNET SOFTWARE & SERVICES - 2.2% | |||
Internet Software & Services - 2.2% | |||
DivX, Inc. | 400 | 8,228 | |
Openwave Systems, Inc. (a)(d) | 535,919 | 4,373,099 | |
RADVision Ltd. (a) | 112,250 | 2,524,503 | |
6,905,830 | |||
IT SERVICES - 0.0% | |||
IT Consulting & Other Services - 0.0% | |||
Isilon Systems, Inc. | 500 | 9,735 | |
MEDIA - 0.0% | |||
Publishing - 0.0% | |||
Gemstar-TV Guide International, Inc. (a) | 10,223 | 41,403 | |
SEMICONDUCTORS & SEMICONDUCTOR EQUIPMENT - 6.0% | |||
Semiconductor Equipment - 0.3% | |||
EMCORE Corp. (a)(d) | 215,400 | 964,992 | |
Semiconductors - 5.7% | |||
Actel Corp. (a) | 19,449 | 325,576 | |
Advanced Analogic Technologies, Inc. (a) | 215,700 | 1,399,893 | |
AMIS Holdings, Inc. (a) | 226,200 | 2,562,846 | |
Applied Micro Circuits Corp. (a) | 426,568 | 1,650,818 | |
Broadcom Corp. Class A (a) | 40,100 | 1,367,009 | |
Conexant Systems, Inc. (a) | 432,400 | 860,476 | |
Common Stocks - continued | |||
Shares | Value | ||
SEMICONDUCTORS & SEMICONDUCTOR EQUIPMENT - CONTINUED | |||
Semiconductors - continued | |||
CSR PLC (a) | 69,800 | $ 988,600 | |
Exar Corp. (a) | 6,701 | 90,128 | |
Ikanos Communications, Inc. (a) | 1,700 | 15,334 | |
Intersil Corp. Class A | 73,700 | 1,949,365 | |
Marvell Technology Group Ltd. (a) | 45,200 | 927,504 | |
Microtune, Inc. (a) | 258,100 | 1,143,383 | |
Mindspeed Technologies, Inc. (a)(d) | 440,463 | 1,070,325 | |
MIPS Technologies, Inc. (a) | 48,602 | 452,971 | |
Pericom Semiconductor Corp. (a) | 58,100 | 587,972 | |
Pixelplus Co. Ltd. sponsored ADR (a) | 123,700 | 179,365 | |
PLX Technology, Inc. (a) | 48,400 | 485,452 | |
PMC-Sierra, Inc. (a) | 1,200 | 8,100 | |
Sigma Designs, Inc. (a) | 64,927 | 1,830,292 | |
SiRF Technology Holdings, Inc. (a) | 7,600 | 217,284 | |
Transmeta Corp. (a) | 236,700 | 170,424 | |
Vimicro International Corp. sponsored ADR (a) | 19,139 | 131,868 | |
18,414,985 | |||
TOTAL SEMICONDUCTORS & SEMICONDUCTOR EQUIPMENT | 19,379,977 | ||
SOFTWARE - 4.6% | |||
Application Software - 2.4% | |||
ECtel Ltd. (a) | 2,790 | 13,978 | |
NAVTEQ Corp. (a) | 71,600 | 2,288,336 | |
Ulticom, Inc. (a) | 618,378 | 5,379,889 | |
7,682,203 | |||
Home Entertainment Software - 0.6% | |||
Ubisoft Entertainment SA (a) | 44,000 | 1,938,972 | |
Systems Software - 1.6% | |||
Allot Communications Ltd. | 9,500 | 91,770 | |
Sandvine Corp. | 1,828,700 | 4,167,066 | |
Wind River Systems, Inc. (a) | 95,400 | 992,160 | |
5,250,996 | |||
TOTAL SOFTWARE | 14,872,171 | ||
WIRELESS TELECOMMUNICATION SERVICES - 1.9% | |||
Wireless Telecommunication Services - 1.9% | |||
MTN Group Ltd. | 148,900 | 1,812,588 | |
Shares | Value | ||
NII Holdings, Inc. (a) | 9,900 | $ 701,316 | |
Philippine Long Distance Telephone Co. sponsored ADR | 31,200 | 1,528,800 | |
Vimpel Communications sponsored ADR (a) | 27,300 | 2,196,558 | |
6,239,262 | |||
TOTAL COMMON STOCKS (Cost $350,127,936) | 319,121,169 | ||
Convertible Bonds - 0.2% | ||||
Principal Amount | ||||
COMMUNICATIONS EQUIPMENT - 0.2% | ||||
Communications Equipment - 0.2% | ||||
Ciena Corp. 0.25% 5/1/13 | $ 700,000 | 691,810 | ||
Money Market Funds - 7.8% | |||
Shares | |||
Fidelity Cash Central Fund, 5.35% (b) | 3,013,482 | 3,013,482 | |
Fidelity Securities Lending Cash Central Fund, 5.34% (b)(c) | 22,070,741 | 22,070,741 | |
TOTAL MONEY MARKET FUNDS (Cost $25,084,223) | 25,084,223 | ||
TOTAL INVESTMENT PORTFOLIO - 107.1% (Cost $375,912,159) | 344,897,202 | ||
NET OTHER ASSETS - (7.1)% | (22,930,101) | ||
NET ASSETS - 100% | $ 321,967,101 | ||
Legend |
(a) Non-income producing |
(b) Affiliated fund that is available only to investment companies and other accounts managed by Fidelity Investments. The rate quoted is the annualized seven-day yield of the fund at period end. A complete unaudited listing of the fund's holdings as of its most recent quarter end is available upon request. |
(c) Investment made with cash collateral received from securities on loan. |
(d) Security or a portion of the security is on loan at period end. |
Affiliated Central Funds |
Information regarding fiscal year to date income earned by the Fund from investments in Fidelity Central Funds is as follows: |
Fund | Income earned |
Fidelity Cash Central Fund | $ 166,398 |
Fidelity Securities Lending Cash Central Fund | 215,146 |
Total | $ 381,544 |
Other Information |
Distribution of investments by country of issue, as a percentage of total net assets, is as follows: |
United States of America | 81.1% |
Canada | 8.2% |
Israel | 3.0% |
France | 1.6% |
Netherlands | 1.2% |
Others (individually less than 1%) | 4.9% |
100.0% |
Income Tax Information |
At February 28, 2007, the fund had a capital loss carryforward of approximately $1,220,948,544 of which $865,500,593 and $355,447,951 will expire on February 28, 2010 and 2011, respectively. |
The fund intends to elect to defer to its fiscal year ending February 29, 2008 approximately $6,378,000 of losses recognized during the period November 1, 2006 to February 28, 2007. |
See accompanying notes which are an integral part of the financial statements.
Annual Report
Select Communications Equipment Portfolio
Financial Statements
Statement of Assets and Liabilities
February 28, 2007 | ||
Assets | ||
Investment in securities, at value (including securities loaned of $21,359,633) - See accompanying schedule: Unaffiliated issuers (cost $350,827,936) | $ 319,812,979 | |
Fidelity Central Funds (cost $25,084,223) | 25,084,223 | |
Total Investments (cost $375,912,159) | $ 344,897,202 | |
Foreign currency held at value (cost $12) | 12 | |
Receivable for investments sold | 748 | |
Receivable for fund shares sold | 361,250 | |
Dividends receivable | 201,576 | |
Interest receivable | 578 | |
Distributions receivable from Fidelity Central Funds | 4,349 | |
Prepaid expenses | 1,892 | |
Other receivables | 7,161 | |
Total assets | 345,474,768 | |
Liabilities | ||
Payable for fund shares redeemed | $ 1,124,243 | |
Accrued management fee | 154,040 | |
Other affiliated payables | 95,328 | |
Other payables and accrued expenses | 63,315 | |
Collateral on securities loaned, at value | 22,070,741 | |
Total liabilities | 23,507,667 | |
Net Assets | $ 321,967,101 | |
Net Assets consist of: | ||
Paid in capital | $ 1,582,839,972 | |
Accumulated net investment loss | (612) | |
Accumulated undistributed net realized gain (loss) on investments and foreign currency transactions | (1,229,857,302) | |
Net unrealized appreciation (depreciation) on investments | (31,014,957) | |
Net Assets, for 15,596,390 shares outstanding | $ 321,967,101 | |
Net Asset Value, offering price and redemption price per share ($321,967,101 ÷ 15,596,390 shares) | $ 20.64 | |
Statement of Operations
Year ended February 28, 2007 | ||
Investment Income | ||
Dividends | $ 1,147,332 | |
Interest | 1,607 | |
Income from Fidelity Central Funds (including $215,146 from security lending) | 381,544 | |
Total income | 1,530,483 | |
Expenses | ||
Management fee | $ 2,285,926 | |
Transfer agent fees | 1,458,137 | |
Accounting and security lending fees | 188,410 | |
Custodian fees and expenses | 46,763 | |
Independent trustees' compensation | 1,546 | |
Registration fees | 27,982 | |
Audit | 37,177 | |
Legal | 8,196 | |
Interest | 7,382 | |
Miscellaneous | 38,103 | |
Total expenses before reductions | 4,099,622 | |
Expense reductions | (29,187) | 4,070,435 |
Net investment income (loss) | (2,539,952) | |
Realized and Unrealized Gain (Loss) Net realized gain (loss) on: | ||
Investment securities: | ||
Unaffiliated issuers | 13,982,264 | |
Foreign currency transactions | (6,253) | |
Total net realized gain (loss) | 13,976,011 | |
Change in net unrealized appreciation (depreciation) on investment securities | (37,736,850) | |
Net gain (loss) | (23,760,839) | |
Net increase (decrease) in net assets resulting from operations | $ (26,300,791) | |
See accompanying notes which are an integral part of the financial statements.
Annual Report
Select Communications Equipment Portfolio
Financial Statements - continued
Statement of Changes in Net Assets
Year ended | Year ended | |
Increase (Decrease) in Net Assets | ||
Operations | ||
Net investment income (loss) | $ (2,539,952) | $ (2,247,890) |
Net realized gain (loss) | 13,976,011 | 28,080,137 |
Change in net unrealized appreciation (depreciation) | (37,736,850) | 65,837,387 |
Net increase (decrease) in net assets resulting from operations | (26,300,791) | 91,669,634 |
Share transactions | 126,757,651 | 135,493,900 |
Cost of shares redeemed | (258,665,244) | (258,336,137) |
Net increase (decrease) in net assets resulting from share transactions | (131,907,593) | (122,842,237) |
Redemption fees | 48,675 | 89,299 |
Total increase (decrease) in net assets | (158,159,709) | (31,083,304) |
Net Assets | ||
Beginning of period | 480,126,810 | 511,210,114 |
End of period (including accumulated net investment loss of $612 and accumulated net investment loss of $789, respectively) | $ 321,967,101 | $ 480,126,810 |
Other Information Shares | ||
Sold | 5,979,086 | 6,969,732 |
Redeemed | (12,536,844) | (13,742,323) |
Net increase (decrease) | (6,557,758) | (6,772,591) |
Financial Highlights
Years ended February 28, | 2007 | 2006 | 2005 | 2004 G | 2003 |
Selected Per-Share Data | |||||
Net asset value, beginning of period | $ 21.67 | $ 17.67 | $ 20.25 | $ 10.03 | $ 14.98 |
Income from Investment Operations | |||||
Net investment income (loss) C | (.13) | (.09) | (.11) | (.13) | (.10) |
Net realized and unrealized gain (loss) | (.90) | 4.09 | (2.48) | 10.34 | (4.85) |
Total from investment operations | (1.03) | 4.00 | (2.59) | 10.21 | (4.95) |
Redemption fees added to paid in capital C | - H | - H | .01 | .01 | - H |
Net asset value, end of period | $ 20.64 | $ 21.67 | $ 17.67 | $ 20.25 | $ 10.03 |
Total Return A, B | (4.75)% | 22.64% | (12.74)% | 101.89% | (33.04)% |
Ratios to Average Net Assets D, F | |||||
Expenses before reductions | 1.01% | 1.06% | 1.07% | 1.37% | 1.76% |
Expenses net of fee waivers, if any | 1.01% | 1.06% | 1.07% | 1.37% | 1.76% |
Expenses net of all reductions | 1.00% | .94% | .89% | 1.23% | 1.58% |
Net investment income (loss) | (.63)% | (.48)% | (.64)% | (.87)% | (.93)% |
Supplemental Data | |||||
Net assets, end of period (000 omitted) | $ 321,967 | $ 480,127 | $ 511,210 | $ 940,061 | $ 319,521 |
Portfolio turnover rate E | 122% | 167% | 226% | 205% | 111% |
A Total returns would have been lower had certain expenses not been reduced during the periods shown.
B Total returns do not include the effect of the former sales charges.
C Calculated based on average shares outstanding during the period.
D Fees and expenses of the underlying Fidelity Central Funds are not included in the Fund's expense ratio. The Fund indirectly bears its proportionate share of the expenses of any underlying Fidelity Central Funds.
E Amount does not include the portfolio activity of any underlying Fidelity Central Funds.
F Expense ratios reflect operating expenses of the Fund. Expenses before reductions do not reflect amounts reimbursed by the investment adviser or reductions from brokerage service arrangements or other expense offset arrangements and do not represent the amount paid by the Fund during periods when reimbursements or reductions occur. Expenses net of fee waivers reflect expenses after reimbursement by the investment adviser but prior to reductions from brokerage service arrangements or other expense offset arrangements. Expenses net of all reductions represent the net expenses paid by the Fund.
G For the year ended February 29.
H Amount represents less than $.01 per share.
See accompanying notes which are an integral part of the financial statements.
Annual Report
Performance
Average annual total return reflects the change in the value of an investment, assuming reinvestment of the fund's dividend income and capital gains (the profits earned upon the sale of securities that have grown in value) and assuming a constant rate of performance each year. The $10,000 table and the fund's returns do not reflect the deduction of taxes that a shareholder would pay on fund distributions or the redemption of fund shares. During periods of reimbursement by Fidelity, a fund's total returns will be greater than it would be had the reimbursement not occurred. How a fund did yesterday is no guarantee of how it will do tomorrow.
Average Annual Total Returns
Periods ended February 28, 2007 | Past 1 | Past 5 | Past 10 |
Select Computers Portfolio | 4.63% | 3.72% | 6.50% |
$10,000 Over 10 Years
Let's say hypothetically that $10,000 was invested in Select Computers Portfolio on February 28, 1997. The chart shows how the value of your investment would have changed, and also shows how the S&P 500 Index performed over the same period.
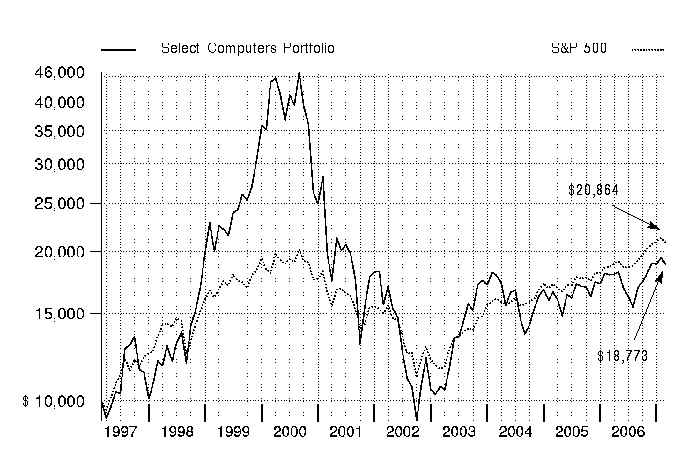
Annual Report
Management's Discussion of Fund Performance
Comments from Heather Lawrence, Portfolio Manager of Fidelity® Select Computers Portfolio
A rosy year for stocks wilted just prior to the end of the 12-month period ending February 28, 2007. On the day prior to the period's close, the Dow Jones Industrial AverageSM plunged 416 points and the Standard & Poor's 500SM Index lost roughly 3.5% of its value, plummeting nearly 50 points and marking the benchmark's worst single-day performance since the day the market reopened after the 9/11 terrorist attacks. Though investors were obviously rattled by the development, it was only the 22nd-biggest decline for the S&P 500® in 20 years, and it could not overshadow how well stocks performed for the 12 months overall. For much of the past year, investors grew confident that the economy would not fall into a recession, and they bid up most broad-based stock indexes for six consecutive months from August through January. Overall for the year ending February 28, 2007, the S&P 500 was up 11.97%, the Dow advanced 14.24%, the small-cap Russell 2000® Index gained 9.87% and the NASDAQ Composite® Index rose 6.66%.
For the year, the fund was up 4.63%, compared with a gain of 10.06% for its new benchmark, the Morgan Stanley Capital International (MSCI®) US Investable Market Computers & Peripherals Index, and an advance of 8.84% for a blended index specific to this fund. This blended index is a combination of the Goldman Sachs® Technology Index, which the fund was compared with through September, and the new MSCI index mentioned above, which the fund was compared with during the period's final five months1. For the same 12-month period, the fund underperformed the S&P 500 index. During the first seven months of the review period, a time when rising interest rates and slowing economic activity put pressure on computer-related stocks, the fund fell short of the Goldman Sachs index mainly due to unfavorable stock selection in the weak semiconductor group, as well as a large underweighting in systems software. Among semiconductor stocks, Marvell Technology detracted as investor sentiment soured in response to a proposed acqusition. Not owning positions in systems software giants Oracle and Microsoft, or in communications equipment manufacturer Motorola, also hurt. Conversely, performance was helped by being underexposed to Internet software and services stocks such as eBay, overexposed to such strong performing computer hardware stocks as Hewlett-Packard, and by choosing not to own struggling communications equipment maker QUALCOMM during this period. A modest stake in cash also helped. The outlook for tech stocks started to improve during the final five months of the period, which lifted the fund's absolute return, albeit still coming in a bit below the new MSCI index. Although I'd added to its hardware exposure during the period, the fund was underweighted there on average, which, along with some unfavorable stock picks in that segment and others, dragged on performance versus the index. Among notable detractors were large index components Hewlett-Packard and IBM, the latter of which hurt because I had underweighted it. Another laggard was non-index holding Spansion, a maker of flash memory, whose turnaround simply didn't materialize as expected, and I eliminated the position. On the upside, the fund's absolute and relative returns were driven largely by some favorable stock picks, including consumer electronics giant Sony and large index-component hardware names such as Sun Microsystems and Apple.
1 The fund's blended index is a customized index developed by Fidelity for the limited purpose of discussing the fund's performance for the 12-month period ending February 28, 2007. From March 1, 2006, through September 30, 2006, the fund compared its performance to the Goldman Sachs Technology Index, which returned -0.35% during that period. On October 1, 2006, the fund began comparing its performance to a different index, the MSCI US Investable Market Computers & Peripherals Index, which returned 9.22% from October 1, 2006, through February 28, 2007. For the 12-month period ending February 28, 2007, the blended index (Goldman Sachs and MSCI) returned 8.84%.
The views expressed above reflect those of the portfolio manager(s) only through the end of the period as stated on the cover of this report and do not necessarily represent the views of Fidelity or any other person in the Fidelity organization. Any such views are subject to change at any time based upon market or other conditions and Fidelity disclaims any responsibility to update such views. These views may not be relied on as investment advice and, because investment decisions for a Fidelity fund are based on numerous factors, may not be relied on as an indication of trading intent on behalf of any Fidelity fund.
Annual Report
Select Computers Portfolio
Investment Changes
Top Ten Stocks as of February 28, 2007 | ||
% of fund's | % of fund's net assets | |
Hewlett-Packard Co. | 15.3 | 7.6 |
Sun Microsystems, Inc. | 14.5 | 2.9 |
Apple, Inc. | 11.1 | 7.6 |
International Business Machines Corp. | 9.0 | 5.0 |
EMC Corp. | 5.1 | 4.3 |
Dell, Inc. | 4.5 | 2.1 |
Seagate Technology | 4.0 | 0.2 |
Network Appliance, Inc. | 3.5 | 2.9 |
NCR Corp. | 2.1 | 0.9 |
Cognizant Technology Solutions Corp. Class A | 2.0 | 0.3 |
71.1 | ||
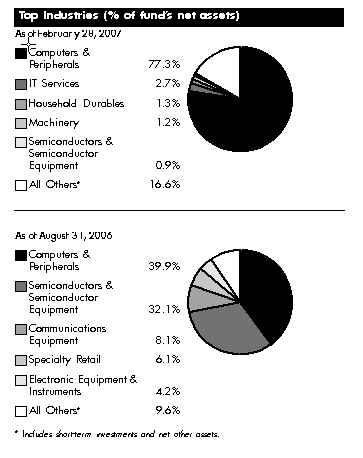
Annual Report
Select Computers Portfolio
Investments February 28, 2007
Showing Percentage of Net Assets
Common Stocks - 85.7% | |||
Shares | Value | ||
COMMUNICATIONS EQUIPMENT - 0.4% | |||
Communications Equipment - 0.4% | |||
QUALCOMM, Inc. | 45,000 | $ 1,812,600 | |
COMPUTERS & PERIPHERALS - 77.3% | |||
Computer Hardware - 57.8% | |||
Apple, Inc. (a)(d) | 602,500 | 50,977,525 | |
Dell, Inc. (a)(d) | 910,700 | 20,809,495 | |
Diebold, Inc. | 75,100 | 3,557,487 | |
Gateway, Inc. (a) | 440,500 | 911,835 | |
Hewlett-Packard Co. (d) | 1,793,200 | 70,616,216 | |
International Business Machines Corp. (d) | 447,300 | 41,603,373 | |
NCR Corp. (a) | 206,900 | 9,558,780 | |
Sun Microsystems, Inc. (a) | 10,912,500 | 66,893,625 | |
Wistron Corp. | 880,828 | 1,198,306 | |
266,126,642 | |||
Computer Storage & Peripherals - 19.5% | |||
Brocade Communications Systems, Inc. (a) | 402,000 | 3,622,020 | |
Electronics for Imaging, Inc. (a) | 142,800 | 3,258,696 | |
EMC Corp. (a) | 1,680,700 | 23,445,765 | |
Hutchinson Technology, Inc. (a) | 23,500 | 531,570 | |
InnoLux Display Corp. | 1,191,000 | 3,294,084 | |
Komag, Inc. (a) | 15,300 | 520,047 | |
Lexmark International, Inc. Class A (a) | 17,900 | 1,084,024 | |
Network Appliance, Inc. (a) | 418,000 | 16,164,060 | |
QLogic Corp. | 406,000 | 7,141,540 | |
Quantum Corp. (a) | 374,600 | 925,262 | |
SanDisk Corp. (a)(d) | 198,600 | 7,233,012 | |
Seagate Technology | 687,400 | 18,491,060 | |
Synaptics, Inc. (a) | 17,400 | 426,996 | |
Western Digital Corp. (a) | 207,700 | 3,981,609 | |
90,119,745 | |||
TOTAL COMPUTERS & PERIPHERALS | 356,246,387 | ||
ELECTRONIC EQUIPMENT & INSTRUMENTS - 0.6% | |||
Electronic Equipment & Instruments - 0.6% | |||
AU Optronics Corp. | 1,991,000 | 2,801,637 | |
HOUSEHOLD DURABLES - 1.3% | |||
Consumer Electronics - 1.3% | |||
Sony Corp. (d) | 112,900 | 5,845,962 | |
INTERNET SOFTWARE & SERVICES - 0.3% | |||
Internet Software & Services - 0.3% | |||
SonicWALL, Inc. (a) | 149,600 | 1,304,512 | |
IT SERVICES - 2.7% | |||
Data Processing & Outsourced Services - 0.3% | |||
Syntel, Inc. | 35,062 | 1,258,025 | |
IT Consulting & Other Services - 2.4% | |||
Cognizant Technology Solutions Corp. Class A (a) | 103,400 | 9,326,680 | |
Shares | Value | ||
Infosys Technologies Ltd. sponsored ADR | 18,600 | $ 1,009,236 | |
Sapient Corp. (a) | 113,000 | 705,120 | |
11,041,036 | |||
TOTAL IT SERVICES | 12,299,061 | ||
MACHINERY - 1.2% | |||
Industrial Machinery - 1.2% | |||
Shin Zu Shing Co. Ltd. | 970,000 | 5,547,600 | |
OFFICE ELECTRONICS - 0.4% | |||
Office Electronics - 0.4% | |||
Canon, Inc. | 32,000 | 1,730,240 | |
SEMICONDUCTORS & SEMICONDUCTOR EQUIPMENT - 0.9% | |||
Semiconductors - 0.9% | |||
Broadcom Corp. Class A (a) | 53,900 | 1,837,451 | |
Marvell Technology Group Ltd. (a) | 127,600 | 2,618,352 | |
4,455,803 | |||
SOFTWARE - 0.6% | |||
Application Software - 0.6% | |||
Hyperion Solutions Corp. (a) | 47,300 | 2,026,332 | |
Intuit, Inc. (a) | 23,800 | 702,338 | |
2,728,670 | |||
TOTAL COMMON STOCKS (Cost $385,878,347) | 394,772,472 | ||
Money Market Funds - 15.5% | |||
Fidelity Cash Central Fund, 5.35% (b) | 11,099,622 | 11,099,622 | |
Fidelity Securities Lending Cash Central Fund, 5.34% (b)(c) | 59,994,325 | 59,994,325 | |
TOTAL MONEY MARKET FUNDS (Cost $71,093,947) | 71,093,947 | ||
TOTAL INVESTMENT PORTFOLIO - 101.2% (Cost $456,972,294) | 465,866,419 | ||
NET OTHER ASSETS - (1.2)% | (5,334,454) | ||
NET ASSETS - 100% | $ 460,531,965 | ||
Legend |
(a) Non-income producing |
(b) Affiliated fund that is available only to investment companies and other accounts managed by Fidelity Investments. The rate quoted is the annualized seven-day yield of the fund at period end. A complete unaudited listing of the fund's holdings as of its most recent quarter end is available upon request. |
(c) Investment made with cash collateral received from securities on loan. |
(d) Security or a portion of the security is on loan at period end. |
Affiliated Central Funds |
Information regarding fiscal year to date income earned by the Fund from investments in Fidelity Central Funds is as follows: |
Fund | Income earned |
Fidelity Cash Central Fund | $ 1,262,923 |
Fidelity Securities Lending Cash Central Fund | 137,233 |
Total | $ 1,400,156 |
Income Tax Information |
At February 28, 2007, the fund had a capital loss carryforward of approximately $769,357,814 of which $517,577,615 and $251,780,199 will expire on February 28, 2010 and 2011, respectively. |
See accompanying notes which are an integral part of the financial statements.
Annual Report
Select Computers Portfolio
Financial Statements
Statement of Assets and Liabilities
February 28, 2007 | ||
Assets | ||
Investment in securities, at value (including securities loaned of $58,486,805) - See accompanying schedule: Unaffiliated issuers (cost $385,878,347) | $ 394,772,472 | |
Fidelity Central Funds (cost $71,093,947) | 71,093,947 | |
Total Investments (cost $456,972,294) | $ 465,866,419 | |
Foreign currency held at value (cost $4,432,852) | 4,432,583 | |
Receivable for investments sold | 58,731,635 | |
Receivable for fund shares sold | 451,998 | |
Dividends receivable | 189,600 | |
Distributions receivable from Fidelity Central Funds | 167,076 | |
Prepaid expenses | 1,708 | |
Other receivables | 24,027 | |
Total assets | 529,865,046 | |
Liabilities | ||
Payable to custodian bank | $ 4,435,190 | |
Payable for fund shares redeemed | 4,404,905 | |
Accrued management fee | 261,996 | |
Other affiliated payables | 162,394 | |
Other payables and accrued expenses | 74,271 | |
Collateral on securities loaned, at value | 59,994,325 | |
Total liabilities | 69,333,081 | |
Net Assets | $ 460,531,965 | |
Net Assets consist of: | ||
Paid in capital | $ 1,225,256,317 | |
Accumulated net investment loss | (689) | |
Accumulated undistributed net realized gain (loss) on investments and foreign currency transactions | (773,618,743) | |
Net unrealized appreciation (depreciation) on investments and assets and liabilities in foreign currencies | 8,895,080 | |
Net Assets, for 11,721,419 shares outstanding | $ 460,531,965 | |
Net Asset Value, offering price and redemption price per share ($460,531,965 ÷ 11,721,419 shares) | $ 39.29 | |
Statement of Operations
Year ended February 28, 2007 | ||
Investment Income | ||
Dividends | $ 2,026,525 | |
Interest | 12,306 | |
Income from Fidelity Central Funds (including $137,233 from security lending) | 1,400,156 | |
Total income | 3,438,987 | |
Expenses | ||
Management fee | $ 2,719,349 | |
Transfer agent fees | 1,700,194 | |
Accounting and security lending fees | 220,740 | |
Custodian fees and expenses | 68,554 | |
Independent trustees' compensation | 1,764 | |
Registration fees | 59,092 | |
Audit | 39,918 | |
Legal | 19,802 | |
Interest | 4,659 | |
Miscellaneous | 42,730 | |
Total expenses before reductions | 4,876,802 | |
Expense reductions | (77,594) | 4,799,208 |
Net investment income (loss) | (1,360,221) | |
Realized and Unrealized Gain (Loss) Net realized gain (loss) on: | ||
Investment securities: | ||
Unaffiliated issuers | 30,354,364 | |
Foreign currency transactions | (65,451) | |
Total net realized gain (loss) | 30,288,913 | |
Change in net unrealized appreciation (depreciation) on: Investment securities | (13,395,002) | |
Assets and liabilities in foreign currencies | (4,778) | |
Total change in net unrealized appreciation (depreciation) | (13,399,780) | |
Net gain (loss) | 16,889,133 | |
Net increase (decrease) in net assets resulting from operations | $ 15,528,912 | |
See accompanying notes which are an integral part of the financial statements.
Annual Report
Select Computers Portfolio
Financial Statements - continued
Statement of Changes in Net Assets
Year ended | Year ended | |
Increase (Decrease) in Net Assets | ||
Operations | ||
Net investment income (loss) | $ (1,360,221) | $ (3,248,250) |
Net realized gain (loss) | 30,288,913 | 47,860,490 |
Change in net unrealized appreciation (depreciation) | (13,399,780) | (1,330,783) |
Net increase (decrease) in net assets resulting from operations | 15,528,912 | 43,281,457 |
Share transactions | 239,589,680 | 56,362,094 |
Cost of shares redeemed | (326,372,795) | (235,793,382) |
Net increase (decrease) in net assets resulting from share transactions | (86,783,115) | (179,431,288) |
Redemption fees | 79,006 | 55,832 |
Total increase (decrease) in net assets | (71,175,197) | (136,093,999) |
Net Assets | ||
Beginning of period | 531,707,162 | 667,801,161 |
End of period (including accumulated net investment loss of $689 and accumulated net investment loss of $884, respectively) | $ 460,531,965 | $ 531,707,162 |
Other Information Shares | ||
Sold | 5,986,150 | 1,603,028 |
Redeemed | (8,425,910) | (6,713,561) |
Net increase (decrease) | (2,439,760) | (5,110,533) |
Financial Highlights
Years ended February 28, | 2007 | 2006 | 2005 | 2004 H | 2003 |
Selected Per-Share Data | |||||
Net asset value, beginning of period | $ 37.55 | $ 34.65 | $ 37.50 | $ 22.36 | $ 32.73 |
Income from Investment Operations | |||||
Net investment income (loss) C | (.10) | (.20) | (.21) F | (.27) | (.25) |
Net realized and unrealized gain (loss) | 1.83 | 3.10 | (2.64) | 15.40 | (10.12) |
Total from investment operations | 1.73 | 2.90 | (2.85) | 15.13 | (10.37) |
Redemption fees added to paid in capital C | .01 | - I | - I | .01 | - I |
Net asset value, end of period | $ 39.29 | $ 37.55 | $ 34.65 | $ 37.50 | $ 22.36 |
Total Return A, B | 4.63% | 8.37% | (7.60)% | 67.71% | (31.68)% |
Ratios to Average Net Assets D, G | |||||
Expenses before reductions | 1.02% | 1.04% | 1.05% | 1.23% | 1.40% |
Expenses net of fee waivers, if any | 1.02% | 1.04% | 1.05% | 1.23% | 1.40% |
Expenses net of all reductions | 1.00% | .98% | .98% | 1.16% | 1.31% |
Net investment income (loss) | (.28)% | (.56)% | (.63)% F | (.85)% | (.96)% |
Supplemental Data | |||||
Net assets, end of period (000 omitted) | $ 460,532 | $ 531,707 | $ 667,801 | $ 999,708 | $ 572,488 |
Portfolio turnover rate E | 214% | 112% | 100% | 138% | 106% |
A Total returns would have been lower had certain expenses not been reduced during the periods shown.
B Total returns do not include the effect of the former sales charges.
C Calculated based on average shares outstanding during the period.
D Fees and expenses of the underlying Fidelity Central Funds are not included in the Fund's expense ratio. The Fund indirectly bears its proportionate share of the expenses of any underlying Fidelity Central Funds.
E Amount does not include the portfolio activity of any underlying Fidelity Central Funds.
F Investment income per share reflects a special dividend which amounted to $.02 per share. Excluding the special dividend, the ratio of net investment income (loss) to average net assets would have been (.69)%.
G Expense ratios reflect operating expenses of the Fund. Expenses before reductions do not reflect amounts reimbursed by the investment adviser or reductions from brokerage service arrangements or other expense offset arrangements and do not represent the amount paid by the Fund during periods when reimbursements or reductions occur. Expenses net of fee waivers reflect expenses after reimbursement by the investment adviser but prior to reductions from brokerage service arrangements or other expense offset arrangements. Expenses net of all reductions represent the net expenses paid by the Fund.
H For the year ended February 29.
I Amount represents less than $.01 per share.
See accompanying notes which are an integral part of the financial statements.
Annual Report
Performance
Average annual total return reflects the change in the value of an investment, assuming reinvestment of the fund's dividend income and capital gains (the profits earned upon the sale of securities that have grown in value) and assuming a constant rate of performance each year. The $10,000 table and the fund's returns do not reflect the deduction of taxes that a shareholder would pay on fund distributions or the redemption of fund shares. During periods of reimbursement by Fidelity, a fund's total returns will be greater than it would be had the reimbursement not occurred. How a fund did yesterday is no guarantee of how it will do tomorrow.
Average Annual Total Returns
Periods ended February 28, 2007 | Past 1 | Past 5 | Past 10 |
Select Electronics Portfolio | -0.92% | 0.85% | 8.45% |
$10,000 Over 10 Years
Let's say hypothetically that $10,000 was invested in Select Electronics Portfolio on February 28, 1997. The chart shows how the value of your investment would have changed, and also shows how the S&P 500 Index performed over the same period.
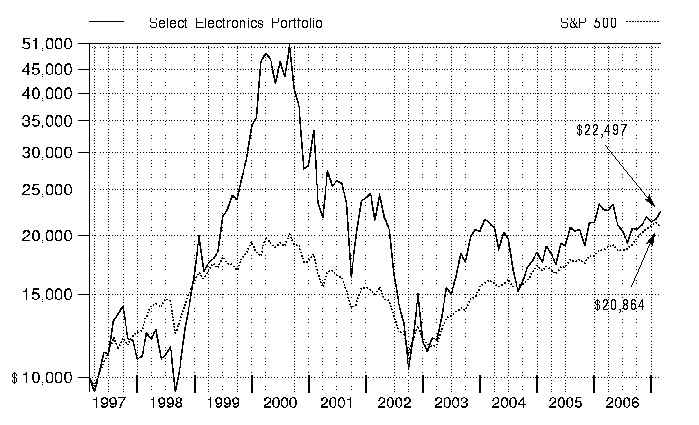
Annual Report
Select Electronics Portfolio
Management's Discussion of Fund Performance
Comments from James Morrow, who managed Fidelity® Select Electronics Portfolio for most of the period covered by this report
A rosy year for stocks wilted just prior to the end of the 12-month period ending February 28, 2007. On the day prior to the period's close, the Dow Jones Industrial AverageSM plunged 416 points and the Standard & Poor's 500SM Index lost roughly 3.5% of its value, plummeting nearly 50 points and marking the benchmark's worst single-day performance since the day the market reopened after the 9/11 terrorist attacks. Though investors were obviously rattled by the development, it was only the 22nd-biggest decline for the S&P 500® in 20 years, and it could not overshadow how well stocks performed for the 12 months overall. For much of the past year, investors grew confident that the economy would not fall into a recession, and they bid up most broad-based stock indexes for six consecutive months from August through January. Overall for the year ending February 28, 2007, the S&P 500 was up 11.97%, the Dow advanced 14.24%, the small-cap Russell 2000® Index gained 9.87% and the NASDAQ Composite® Index rose 6.66%.
During the past year, the fund returned -0.92%, outpacing the -4.01% return of the Morgan Stanley Capital InternationalSM (MSCI®) US Investable Market Semiconductors & Semiconductor Equipment Index but trailing the 2.13% advance of a blended index specific to this fund. This blended index is a combination of the Goldman Sachs® Technology Index, which the fund was compared with through September, and the new MSCI benchmark mentioned above, which the fund was compared with during the period's final five months1. During the same 12-month period, the fund underperformed the S&P 500. For the first seven months of the review period, the fund significantly trailed the Goldman Sachs index primarily due to unfavorable stock selection and a sizable overweighting in semiconductors. Not owning any systems software stocks hurt as well, as did my picks in electrical components and equipment and in technology distributors. Offsetting these negative factors to some degree were rewarding picks in electronic manufacturing services and an underweighting in Internet software and services. Individual detractors versus the Goldman Sachs index included two semiconductor stocks - Marvell Technology Group and Maxim Integrated Products - that were hurt by an inventory correction and by questions about options backdating. Not owning two major index components that performed well, systems software provider Oracle and network equipment maker Cisco Systems, further limited our results. On the positive side, avoiding two major index components that performed poorly - wireless chip manufacturer QUALCOMM and Internet auctioneer eBay - boosted the fund's relative performance. A position in Taiwan-based electronics contract manufacturer Hon Hai Precision Industry also was beneficial. During the final five months of the period, the fund beat the MSCI index by a wide margin, aided by stock selection in semiconductors, technology distributors, electronic manufacturing services, and electrical components and equipment. The stock price of electronic parts distributor Arrow Electronics - the fund's third-largest holding at period end - experienced a nice rebound. Avnet - another technology distributor - - boosted performance as well. Underweighting Advanced Micro Devices and not owning Micron Technology - two semiconductor stocks in the index - - further aided our results. Intel, by far the fund's largest holding at period end, detracted from absolute performance but helped our results versus the MSCI index. Conversely, Israeli chip stock Saifun Semiconductors was the largest detractor versus the MSCI index. The loss of a key customer and disappointing revenue numbers more than halved the stock's price. Vimicro International - a Chinese chip maker incorporated in the Cayman Islands - - also hurt performance.
1 The fund's blended index is a customized index developed by Fidelity for the limited purpose of discussing the fund's performance for the 12-month period ending February 28, 2007. From March 1, 2006, through September 30, 2006, the fund compared its performance to the Goldman Sachs Technology Index, which returned -0.35% during that period. On October 1, 2006, the fund began comparing its performance to a different index, the MSCI US Investable Market Semiconductors & Semiconductor Equipment Index, which returned 2.49% from October 1, 2006, through February 28, 2007. For the 12-month period ending February 28, 2007, the blended index (Goldman Sachs and MSCI) returned 2.13%.
Note to shareholders: Christopher Lee and Paul Jackson became co-managers of the fund on February 1, 2007, replacing James Morrow.
The views expressed above reflect those of the portfolio manager(s) only through the end of the period as stated on the cover of this report and do not necessarily represent the views of Fidelity or any other person in the Fidelity organization. Any such views are subject to change at any time based upon market or other conditions and Fidelity disclaims any responsibility to update such views. These views may not be relied on as investment advice and, because investment decisions for a Fidelity fund are based on numerous factors, may not be relied on as an indication of trading intent on behalf of any Fidelity fund.
Annual Report
Select Electronics Portfolio
Investment Changes
Top Ten Stocks as of February 28, 2007 | ||
% of fund's | % of fund's net assets | |
Intel Corp. | 14.2 | 5.7 |
Maxim Integrated Products, Inc. | 6.1 | 5.1 |
Arrow Electronics, Inc. | 5.6 | 3.4 |
Analog Devices, Inc. | 5.1 | 4.4 |
National Semiconductor Corp. | 5.0 | 6.2 |
Marvell Technology Group Ltd. | 4.9 | 4.0 |
Applied Materials, Inc. | 4.8 | 5.9 |
Broadcom Corp. Class A | 3.9 | 4.3 |
Texas Instruments, Inc. | 3.8 | 2.1 |
Linear Technology Corp. | 3.6 | 3.2 |
57.0 | ||
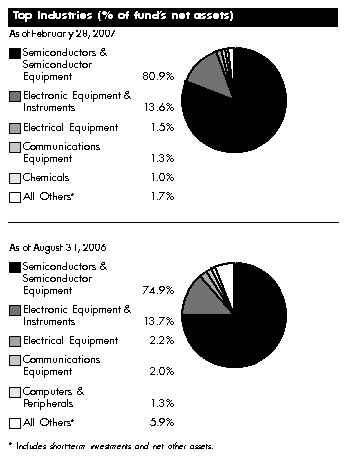
Annual Report
Select Electronics Portfolio
Investments February 28, 2007
Showing Percentage of Net Assets
Common Stocks - 98.5% | |||
Shares | Value | ||
CHEMICALS - 1.0% | |||
Specialty Chemicals - 1.0% | |||
Nitto Denko Corp. | 100,000 | $ 5,078,924 | |
Tokuyama Corp. | 533,000 | 9,195,077 | |
Wacker Chemie AG | 39,300 | 5,980,880 | |
20,254,881 | |||
COMMUNICATIONS EQUIPMENT - 1.3% | |||
Communications Equipment - 1.3% | |||
Alcatel-Lucent SA sponsored ADR | 675,800 | 8,670,514 | |
China Techfaith Wireless Communication Technology Ltd. sponsored ADR (a) | 57,700 | 520,454 | |
Nokia Corp. sponsored ADR | 393,000 | 8,579,190 | |
Telefonaktiebolaget LM Ericsson (B Shares) sponsored ADR | 206,763 | 7,393,845 | |
25,164,003 | |||
COMPUTERS & PERIPHERALS - 0.5% | |||
Computer Storage & Peripherals - 0.5% | |||
Phison Electronics Corp. | 392,000 | 3,100,828 | |
SanDisk Corp. (a) | 125,000 | 4,552,500 | |
SimpleTech, Inc. (a) | 198,562 | 1,711,604 | |
9,364,932 | |||
ELECTRICAL EQUIPMENT - 1.2% | |||
Electrical Components & Equipment - 1.2% | |||
Evergreen Solar, Inc. (a)(d) | 2,300,000 | 22,770,000 | |
ELECTRONIC EQUIPMENT & INSTRUMENTS - 13.6% | |||
Electronic Equipment & Instruments - 3.3% | |||
AU Optronics Corp. sponsored ADR (d) | 500,000 | 7,075,000 | |
LG.Philips LCD Co. Ltd. sponsored ADR (a)(d) | 1,250,000 | 20,200,000 | |
Motech Industries, Inc. | 1,525,526 | 22,240,800 | |
Nidec Corp. | 107,400 | 6,987,508 | |
Photon Dynamics, Inc. (a) | 450,000 | 5,310,000 | |
Vishay Intertechnology, Inc. (a) | 250,000 | 3,562,500 | |
65,375,808 | |||
Electronic Manufacturing Services - 2.0% | |||
Hon Hai Precision Industry Co. Ltd. (Foxconn) | 3,750,000 | 25,199,316 | |
Jabil Circuit, Inc. | 500,000 | 13,360,000 | |
38,559,316 | |||
Technology Distributors - 8.3% | |||
Arrow Electronics, Inc. (a)(d) | 2,818,400 | 108,001,088 | |
Avnet, Inc. (a)(d) | 1,300,014 | 47,541,512 | |
Wolfson Microelectronics PLC (a) | 1,000,000 | 5,863,734 | |
161,406,334 | |||
TOTAL ELECTRONIC EQUIPMENT & INSTRUMENTS | 265,341,458 | ||
SEMICONDUCTORS & SEMICONDUCTOR EQUIPMENT - 80.9% | |||
Semiconductor Equipment - 17.1% | |||
Applied Materials, Inc. (d) | 5,000,000 | 92,850,000 | |
Shares | Value | ||
Cymer, Inc. (a) | 400,000 | $ 16,624,000 | |
Entegris, Inc. (a) | 1,000,000 | 11,140,000 | |
FormFactor, Inc. (a) | 500,000 | 21,375,000 | |
KLA-Tencor Corp. (d) | 1,250,000 | 64,675,000 | |
Lam Research Corp. (a) | 900,000 | 40,194,000 | |
MEMC Electronic Materials, Inc. (a) | 865,500 | 44,633,835 | |
Tessera Technologies, Inc. (a) | 250,000 | 10,105,000 | |
Varian Semiconductor Equipment Associates, Inc. (a) | 400,000 | 19,116,000 | |
Verigy Ltd. | 500,000 | 11,745,000 | |
332,457,835 | |||
Semiconductors - 63.8% | |||
Advanced Analogic Technologies, Inc. (a) | 500,000 | 3,245,000 | |
Advanced Micro Devices, Inc. (a) | 1,000,000 | 15,060,000 | |
Altera Corp. (a)(d) | 2,050,000 | 43,275,500 | |
Analog Devices, Inc. | 2,750,000 | 99,687,500 | |
ARM Holdings PLC sponsored ADR (d) | 3,189,900 | 24,019,947 | |
Atheros Communications, Inc. (a) | 91,200 | 2,304,624 | |
Atmel Corp. (a) | 2,500,000 | 13,850,000 | |
Broadcom Corp. Class A (a) | 2,197,300 | 74,905,957 | |
Cree, Inc. (a)(d) | 500,100 | 8,801,760 | |
CSR PLC (a)(d) | 956,614 | 13,548,834 | |
Himax Technologies, Inc. sponsored ADR | 124,700 | 713,284 | |
Hittite Microwave Corp. (a) | 332,500 | 13,945,050 | |
Holtek Semiconductor, Inc. | 4,060,000 | 7,724,852 | |
Intel Corp. | 13,921,600 | 276,343,760 | |
Intersil Corp. Class A | 833,900 | 22,056,655 | |
Linear Technology Corp. | 2,108,400 | 69,977,796 | |
LSI Logic Corp. (a) | 2,000,000 | 20,280,000 | |
Marvell Technology Group Ltd. (a) | 4,611,400 | 94,625,928 | |
Maxim Integrated Products, Inc. | 3,615,000 | 118,391,250 | |
Microchip Technology, Inc. | 95,800 | 3,410,480 | |
National Semiconductor Corp. (d) | 3,800,000 | 97,356,000 | |
ON Semiconductor Corp. (a) | 592,000 | 5,813,440 | |
Power Integrations, Inc. (a) | 350,000 | 9,047,500 | |
Qimonda AG Sponsored ADR | 250,000 | 3,635,000 | |
Saifun Semiconductors Ltd. (a) | 343,800 | 4,307,814 | |
Silicon Laboratories, Inc. (a) | 300,000 | 9,060,000 | |
Silicon On Insulator Technologies SA (SOITEC) (a)(d) | 534,800 | 14,862,279 | |
Siliconware Precision Industries Co. Ltd. sponsored ADR (d) | 2,708,634 | 24,594,397 | |
Spansion, Inc. Class A (a)(d) | 500,000 | 6,080,000 | |
Taiwan Semiconductor Manufacturing Co. Ltd. | 10,000,000 | 20,434,707 | |
Texas Instruments, Inc. (d) | 2,400,000 | 74,304,000 | |
Vimicro International Corp. sponsored ADR (a) | 1,000,000 | 6,890,000 | |
Common Stocks - continued | |||
Shares | Value | ||
SEMICONDUCTORS & SEMICONDUCTOR EQUIPMENT - CONTINUED | |||
Semiconductors - continued | |||
Volterra Semiconductor Corp. (a)(d) | 400,043 | $ 5,632,605 | |
Xilinx, Inc. | 1,250,000 | 32,025,000 | |
1,240,210,919 | |||
TOTAL SEMICONDUCTORS & SEMICONDUCTOR EQUIPMENT | 1,572,668,754 | ||
TOTAL COMMON STOCKS (Cost $1,968,292,280) | 1,915,564,028 | ||
Convertible Bonds - 0.3% | ||||
Principal Amount | ||||
ELECTRICAL EQUIPMENT - 0.3% | ||||
Electrical Components & Equipment - 0.3% | ||||
Evergreen Solar, Inc.: | ||||
4.375% 7/1/12 (e) | $ 2,980,000 | 4,291,200 | ||
4.375% 7/1/12 | 520,000 | 748,800 | ||
(Cost $3,700,626) | 5,040,000 | |||
Money Market Funds - 11.0% | |||
Shares | Value | ||
Fidelity Cash Central Fund, 5.35% (b) | 18,803,550 | 18,803,550 | |
Fidelity Securities Lending Cash Central Fund, 5.34% (b)(c) | 195,000,875 | 195,000,875 | |
TOTAL MONEY MARKET FUNDS (Cost $213,804,425) | 213,804,425 | ||
TOTAL INVESTMENT PORTFOLIO - 109.8% (Cost $2,185,797,331) | 2,134,408,453 | ||
NET OTHER ASSETS - (9.8)% | (190,185,614) | ||
NET ASSETS - 100% | $ 1,944,222,839 | ||
Legend |
(a) Non-income producing |
(b) Affiliated fund that is available only to investment companies and other accounts managed by Fidelity Investments. The rate quoted is the annualized seven-day yield of the fund at period end. A complete unaudited listing of the fund's holdings as of its most recent quarter end is available upon request. |
(c) Investment made with cash collateral received from securities on loan. |
(d) Security or a portion of the security is on loan at period end. |
(e) Security exempt from registration under Rule 144A of the Securities Act of 1933. These securities may be resold in transactions exempt from registration, normally to qualified institutional buyers. At the end of the period, the value of these securities amounted to $4,291,200 or 0.2% of net assets. |
Affiliated Central Funds |
Information regarding fiscal year to date income earned by the Fund from investments in Fidelity Central Funds is as follows: |
Fund | Income earned |
Fidelity Cash Central Fund | $ 2,212,213 |
Fidelity Securities Lending Cash Central Fund | 1,723,092 |
Total | $ 3,935,305 |
Other Affiliated Issuers |
An affiliated company is a company in which the fund has ownership of at least 5% of the voting securities. Fiscal year to date transactions with companies which are or were affiliates are as follows: |
Affiliate | Value, | Purchases | Sales | Dividend | Value, |
Cohu, Inc. | $ 29,568,000 | $ - | $ 25,940,645 | $ 195,000 | $ - |
Other Information |
Distribution of investments by country of issue, as a percentage of total net assets, is as follows: |
United States of America | 81.4% |
Taiwan | 5.7% |
Bermuda | 4.9% |
United Kingdom | 2.2% |
France | 1.3% |
Japan | 1.0% |
Korea (South) | 1.0% |
Others (individually less than 1%) | 2.5% |
100.0% |
Income Tax Information |
At February 28, 2007, the fund had a capital loss carryforward of approximately $2,508,602,338 of which $926,318,519, $1,514,779,921 and $67,503,898 will expire on February 28, 2010, 2011 and February 29, 2012, respectively. |
See accompanying notes which are an integral part of the financial statements.
Annual Report
Select Electronics Portfolio
Financial Statements
Statement of Assets and Liabilities
February 28, 2007 | ||
Assets | ||
Investment in securities, at value (including securities loaned of $191,033,000) - See accompanying schedule: Unaffiliated issuers (cost $1,971,992,906) | $ 1,920,604,028 | |
Fidelity Central Funds (cost $213,804,425) | 213,804,425 | |
Total Investments (cost $2,185,797,331) | $ 2,134,408,453 | |
Foreign currency held at value (cost $237) | 235 | |
Receivable for investments sold | 234,614,240 | |
Receivable for fund shares sold | 3,182,982 | |
Dividends receivable | 2,591,347 | |
Interest receivable | 25,095 | |
Distributions receivable from Fidelity Central Funds | 58,096 | |
Prepaid expenses | 8,935 | |
Other receivables | 125,399 | |
Total assets | 2,375,014,782 | |
Liabilities | ||
Payable for investments purchased | $ 226,231,116 | |
Payable for fund shares redeemed | 7,908,700 | |
Accrued management fee | 927,276 | |
Other affiliated payables | 537,585 | |
Other payables and accrued expenses | 186,391 | |
Collateral on securities loaned, at value | 195,000,875 | |
Total liabilities | 430,791,943 | |
Net Assets | $ 1,944,222,839 | |
Net Assets consist of: | ||
Paid in capital | $ 4,510,597,900 | |
Undistributed net investment income | 471,960 | |
Accumulated undistributed net realized gain (loss) on investments and foreign currency transactions | (2,515,368,700) | |
Net unrealized appreciation (depreciation) on investments and assets and liabilities in foreign currencies | (51,478,321) | |
Net Assets, for 42,136,002 shares outstanding | $ 1,944,222,839 | |
Net Asset Value, offering price and redemption price per share ($1,944,222,839 ÷ 42,136,002 shares) | $ 46.14 | |
Statement of Operations
Year ended February 28, 2007 | ||
Investment Income | ||
Dividends (including $195,000 earned from other affiliated issuers) | $ 19,999,211 | |
Interest | 156,802 | |
Income from Fidelity Central Funds (including $1,723,092 from security lending) | 3,935,305 | |
24,091,318 | ||
Less foreign taxes withheld | (1,296,061) | |
Total income | 22,795,257 | |
Expenses | ||
Management fee | $ 12,925,235 | |
Transfer agent fees | 6,370,729 | |
Accounting and security lending fees | 826,887 | |
Custodian fees and expenses | 402,808 | |
Independent trustees' compensation | 8,617 | |
Depreciation in deferred trustee compensation account | (804) | |
Registration fees | 49,145 | |
Audit | 48,879 | |
Legal | 43,323 | |
Interest | 17,980 | |
Miscellaneous | 141,418 | |
Total expenses before reductions | 20,834,217 | |
Expense reductions | (479,840) | 20,354,377 |
Net investment income (loss) | 2,440,880 | |
Realized and Unrealized Gain (Loss) Net realized gain (loss) on: | ||
Investment securities: | ||
Unaffiliated issuers | 290,966,168 | |
Other affiliated issuers | (8,292,226) | |
Foreign currency transactions | (458,360) | |
Total net realized gain (loss) | 282,215,582 | |
Change in net unrealized appreciation (depreciation) on: Investment securities | (340,424,490) | |
Assets and liabilities in foreign currencies | (115,984) | |
Total change in net unrealized appreciation (depreciation) | (340,540,474) | |
Net gain (loss) | (58,324,892) | |
Net increase (decrease) in net assets resulting from operations | $ (55,884,012) | |
See accompanying notes which are an integral part of the financial statements.
Annual Report
Select Electronics Portfolio
Financial Statements - continued
Statement of Changes in Net Assets
Year ended | Year ended | |
Increase (Decrease) in Net Assets | ||
Operations | ||
Net investment income (loss) | $ 2,440,880 | $ (4,568,551) |
Net realized gain (loss) | 282,215,582 | 254,398,033 |
Change in net unrealized appreciation (depreciation) | (340,540,474) | 224,891,343 |
Net increase (decrease) in net assets resulting from operations | (55,884,012) | 474,720,825 |
Distributions to shareholders from net investment income | (1,472,341) | - |
Share transactions | 286,020,445 | 798,575,652 |
Reinvestment of distributions | 1,396,249 | - |
Cost of shares redeemed | (1,126,630,026) | (1,230,676,689) |
Net increase (decrease) in net assets resulting from share transactions | (839,213,332) | (432,101,037) |
Redemption fees | 222,511 | 626,614 |
Total increase (decrease) in net assets | (896,347,174) | 43,246,402 |
Net Assets | ||
Beginning of period | 2,840,570,013 | 2,797,323,611 |
End of period (including undistributed net investment income of $471,960 and accumulated net investment loss of $38,218, respectively) | $ 1,944,222,839 | $ 2,840,570,013 |
Other Information Shares | ||
Sold | 6,638,713 | 18,890,263 |
Issued in reinvestment of distributions | 31,411 | - |
Redeemed | (25,492,042) | (29,782,062) |
Net increase (decrease) | (18,821,918) | (10,891,799) |
Financial Highlights
Years ended February 28, | 2007 | 2006 | 2005 | 2004 G | 2003 |
Selected Per-Share Data | |||||
Net asset value, beginning of period | $ 46.60 | $ 38.93 | $ 43.67 | $ 24.90 | $ 44.26 |
Income from Investment Operations | |||||
Net investment income (loss) C | .05 | (.07) | (.17) | (.25) | (.26) |
Net realized and unrealized gain (loss) | (.48) | 7.73 | (4.58) | 19.01 | (19.12) |
Total from investment operations | (.43) | 7.66 | (4.75) | 18.76 | (19.38) |
Distributions from net investment income | (.03) | - | - | - | - |
Redemption fees added to paid in capital C | - H | .01 | .01 | .01 | .02 |
Net asset value, end of period | $ 46.14 | $ 46.60 | $ 38.93 | $ 43.67 | $ 24.90 |
Total Return A, B | (.92)% | 19.70% | (10.85)% | 75.38% | (43.74)% |
Ratios to Average Net Assets D, F | |||||
Expenses before reductions | .91% | .95% | .96% | 1.08% | 1.14% |
Expenses net of fee waivers, if any | .91% | .95% | .96% | 1.08% | 1.14% |
Expenses net of all reductions | .89% | .88% | .89% | 1.06% | 1.06% |
Net investment income (loss) | .11% | (.17)% | (.45)% | (.70)% | (.78)% |
Supplemental Data | |||||
Net assets, end of period (000 omitted) | $ 1,944,223 | $ 2,840,570 | $ 2,797,324 | $ 4,110,073 | $ 2,204,036 |
Portfolio turnover rate E | 97% | 80% | 119% | 50% | 70% |
A Total returns would have been lower had certain expenses not been reduced during the periods shown.
B Total returns do not include the effect of the former sales charges.
C Calculated based on average shares outstanding during the period.
D Fees and expenses of the underlying Fidelity Central Funds are not included in the Fund's expense ratio. The Fund indirectly bears its proportionate share of the expenses of any underlying Fidelity Central Funds.
E Amount does not include the portfolio activity of any underlying Fidelity Central Funds.
F Expense ratios reflect operating expenses of the Fund. Expenses before reductions do not reflect amounts reimbursed by the investment adviser or reductions from brokerage service arrangements or other expense offset arrangements and do not represent the amount paid by the Fund during periods when reimbursements or reductions occur. Expenses net of fee waivers reflect expenses after reimbursement by the investment adviser but prior to reductions from brokerage service arrangements or other expense offset arrangements. Expenses net of all reductions represent the net expenses paid by the Fund.
G For the year ended February 29.
H Amount represents less than $.01 per share.
See accompanying notes which are an integral part of the financial statements.
Annual Report
Performance
Average annual total return reflects the change in the value of an investment, assuming reinvestment of the fund's dividend income and capital gains (the profits earned upon the sale of securities that have grown in value) and assuming a constant rate of performance each year. The $10,000 table and the fund's returns do not reflect the deduction of taxes that a shareholder would pay on fund distributions or the redemption of fund shares. During periods of reimbursement by Fidelity, a fund's total returns will be greater than it would be had the reimbursement not occurred. How a fund did yesterday is no guarantee of how it will do tomorrow.
Average Annual Total Returns
Periods ended February 28, 2007 | Past 1 | Past 5 | Life of |
Select IT Services Portfolio | 10.11% | 5.93% | 10.60% |
Prior to October 1, 2006, Select IT Services Portfolio was named Select Business Services and Outsourcing Portfolio and operated under certain different operating policies. The fund's historical performance may not represent its current investment policies.
A From February 4, 1998.
$10,000 Over Life of Fund
Let's say hypothetically that $10,000 was invested in Select IT Services Portfolio on February 4, 1998, when the fund started. The chart shows how the value of your investment would have changed, and also shows how the S&P 500® Index performed over the same period.
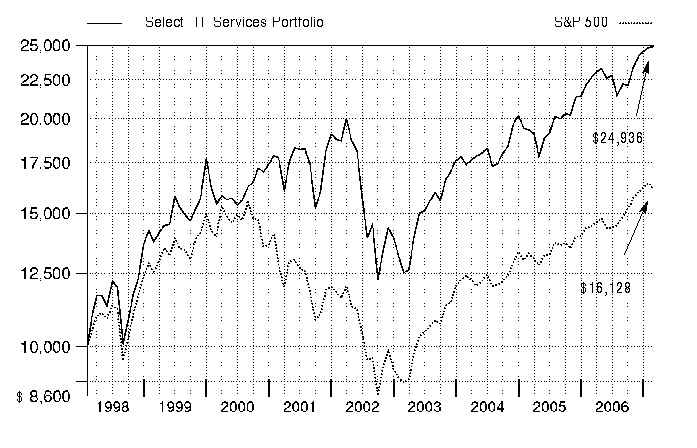
Annual Report
Select IT Services Portfolio
Management's Discussion of Fund Performance
Comments from Benjamin Hesse, who became sole Portfolio Manager of Fidelity® Select IT Services Portfolio on January 4, 2007
A rosy year for stocks wilted just prior to the end of the 12-month period ending February 28, 2007. On the day prior to the period's close, the Dow Jones Industrial AverageSM plunged 416 points and the Standard & Poor's 500SM Index lost roughly 3.5% of its value, plummeting nearly 50 points and marking the benchmark's worst single-day performance since the day the market reopened after the 9/11 terrorist attacks. Though investors were obviously rattled by the development, it was only the 22nd-biggest decline for the S&P 500® in 20 years, and it could not overshadow how well stocks performed for the 12 months overall. For much of the past year, investors grew confident that the economy would not fall into a recession, and they bid up most broad-based stock indexes for six consecutive months from August through January. Overall for the year ending February 28, 2007, the S&P 500 was up 11.97%, the Dow advanced 14.24%, the small-cap Russell 2000® Index gained 9.87% and the NASDAQ Composite® Index rose a 6.66%.
For the 12 months ending February 28, 2007, the fund returned 10.11%, compared with the 10.88% gain of the Morgan Stanley Capital InternationalSM (MSCI®) US Investable Market IT Services Index and the 12.07% advance of a blended index specific to this fund. This blended index is a combination of the Goldman Sachs® Technology Index, which the fund was compared with through September 30, 2006, and the new MSCI benchmark mentioned above, which the fund was compared with during the period's final five months1. During the same 12-month period, the fund lagged the S&P 500. For the first seven months of the review period, the fund underperformed the Goldman Sachs index. The fund actually outperformed the index for the first six months of that period due to favorable stock selection within the data processing/outsourced services and advertising groups and a lack of exposure to the weak semiconductors segment. That said, in September 2006, computer storage and peripherals company Hypercom stumbled badly, negating any gains the fund had made. The fund was further hurt by its lack of exposure to the systems software space - specifically, missing out on owning Oracle, which performed well for the Goldman Sachs index. Among the fund's top performers during the seven-month period were data processor Alliance Data Systems and IT services company Cognizant Technology Solutions. For the last five months of the period, the fund edged out the MSCI index. It benefited from strong security selection in the data processing/outsourced services and application software groups. Among the top contributors for this period were credit card giant Mastercard and application software company Open Solutions, which was acquired during the period. Hypercom continued to drag on performance. In addition, the fund was hurt by not owning data processor Sabre Holdings, a strong performer for the MSCI index.
1 The fund's blended index is a customized index developed by Fidelity for the limited purpose of discussing the fund's performance for the 12-month period ending February 28, 2007. From March 1, 2006, through September 30, 2006, the fund compared its performance to the Goldman Sachs Technology Index, which returned -0.35% during that period. On October 1, 2006, the fund began comparing its performance to a different index, the MSCI US Investable Market IT Services Index, which returned 12.46% from October 1, 2006, through February 28, 2007. For the 12-month period ending February 28, 2007, the blended index (Goldman Sachs and MSCI) returned 12.07%.
The views expressed above reflect those of the portfolio manager(s) only through the end of the period as stated on the cover of this report and do not necessarily represent the views of Fidelity or any other person in the Fidelity organization. Any such views are subject to change at any time based upon market or other conditions and Fidelity disclaims any responsibility to update such views. These views may not be relied on as investment advice and, because investment decisions for a Fidelity fund are based on numerous factors, may not be relied on as an indication of trading intent on behalf of any Fidelity fund.
Annual Report
Select IT Services Portfolio
Investment Changes
Top Ten Stocks as of February 28, 2007 | ||
% of fund's | % of fund's net assets | |
First Data Corp. | 18.2 | 11.9 |
Paychex, Inc. | 9.1 | 7.5 |
Fidelity National Information Services, Inc. | 8.8 | 0.0 |
The Western Union Co. | 8.5 | 0.0 |
MoneyGram International, Inc. | 5.7 | 4.5 |
Fair, Isaac & Co., Inc. | 5.1 | 4.3 |
Mastercard, Inc. Class A | 4.5 | 0.0 |
Accenture Ltd. Class A | 3.8 | 2.7 |
Affiliated Computer Services, Inc. Class A | 3.8 | 1.4 |
Cognizant Technology Solutions Corp. Class A | 3.6 | 4.2 |
71.1 | ||
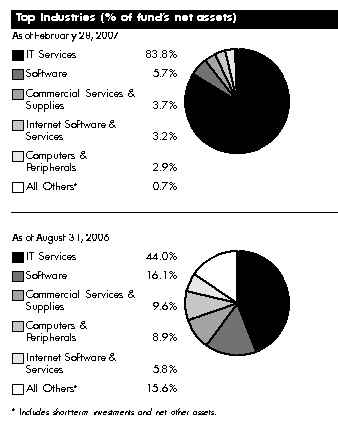
Annual Report
IT Services Portfolio
Investments February 28, 2007
Showing Percentage of Net Assets
Common Stocks - 99.8% | |||
Shares | Value | ||
COMMERCIAL SERVICES & SUPPLIES - 3.7% | |||
Diversified Commercial & Professional Services - 3.6% | |||
CoStar Group, Inc. (a) | 4,000 | $ 187,480 | |
Equifax, Inc. | 26,750 | 1,035,760 | |
IHS, Inc. Class A (a) | 100 | 3,755 | |
1,226,995 | |||
Human Resource & Employment Services - 0.1% | |||
Labor Ready, Inc. (a) | 2,500 | 45,925 | |
TOTAL COMMERCIAL SERVICES & SUPPLIES | 1,272,920 | ||
COMPUTERS & PERIPHERALS - 2.9% | |||
Computer Hardware - 1.1% | |||
Dell, Inc. (a) | 17,500 | 399,875 | |
Computer Storage & Peripherals - 1.8% | |||
Hypercom Corp. (a) | 106,900 | 606,123 | |
TOTAL COMPUTERS & PERIPHERALS | 1,005,998 | ||
DIVERSIFIED CONSUMER SERVICES - 0.3% | |||
Specialized Consumer Services - 0.3% | |||
Coinmach Service Corp. Class A | 9,800 | 108,878 | |
ELECTRONIC EQUIPMENT & INSTRUMENTS - 0.1% | |||
Electronic Equipment & Instruments - 0.1% | |||
Universal Display Corp. (a) | 1,400 | 18,228 | |
INTERNET SOFTWARE & SERVICES - 3.2% | |||
Internet Software & Services - 3.2% | |||
CyberSource Corp. (a) | 87,500 | 1,069,250 | |
Goldleaf Financial Solutions, Inc. (a) | 3,400 | 22,916 | |
1,092,166 | |||
IT SERVICES - 83.8% | |||
Data Processing & Outsourced Services - 70.5% | |||
Affiliated Computer Services, Inc. Class A (a) | 24,800 | 1,288,856 | |
Alliance Data Systems Corp. (a) | 1,800 | 107,550 | |
Automatic Data Processing, Inc. | 21,300 | 1,060,527 | |
CheckFree Corp. (a) | 9,300 | 352,656 | |
Computer Sciences Corp. (a) | 7,500 | 396,975 | |
Convergys Corp. (a) | 3,700 | 95,164 | |
DST Systems, Inc. (a) | 500 | 35,210 | |
Electronic Data Systems Corp. | 20,400 | 571,608 | |
Fidelity National Information Services, Inc. | 65,200 | 2,995,940 | |
First Data Corp. | 243,100 | 6,206,342 | |
Fiserv, Inc. (a) | 4,700 | 248,912 | |
Global Cash Access Holdings, Inc. (a) | 5,400 | 83,052 | |
Global Payments, Inc. | 13,400 | 515,498 | |
Heartland Payment Systems, Inc. | 100 | 2,492 | |
Hewitt Associates, Inc. Class A (a) | 1,900 | 57,038 | |
Iron Mountain, Inc. (a) | 10,250 | 285,463 | |
Shares | Value | ||
Lightbridge, Inc. (a) | 300 | $ 4,842 | |
Mastercard, Inc. Class A (d) | 14,400 | 1,543,392 | |
MoneyGram International, Inc. | 64,100 | 1,926,846 | |
Paychex, Inc. (d) | 76,687 | 3,115,793 | |
Syntel, Inc. | 3,500 | 125,580 | |
The Western Union Co. | 133,200 | 2,886,444 | |
VeriFone Holdings, Inc. (a) | 600 | 23,430 | |
WNS Holdings Ltd. ADR | 2,500 | 80,425 | |
Wright Express Corp. (a) | 1,100 | 31,328 | |
24,041,363 | |||
IT Consulting & Other Services - 13.3% | |||
Accenture Ltd. Class A | 36,300 | 1,295,910 | |
BearingPoint, Inc. (a) | 43,900 | 351,200 | |
CACI International, Inc. Class A (a) | 4,900 | 227,850 | |
Cognizant Technology Solutions Corp. Class A (a) | 13,608 | 1,227,442 | |
MPS Group, Inc. (a) | 4,200 | 60,144 | |
Sapient Corp. (a) | 1,700 | 10,608 | |
Satyam Computer Services Ltd. sponsored ADR | 53,900 | 1,162,084 | |
SRA International, Inc. Class A (a) | 4,800 | 113,760 | |
Unisys Corp. (a) | 10,200 | 86,598 | |
4,535,596 | |||
TOTAL IT SERVICES | 28,576,959 | ||
LEISURE EQUIPMENT & PRODUCTS - 0.1% | |||
Leisure Products - 0.1% | |||
Cybex International, Inc. (a) | 5,300 | 29,627 | |
SOFTWARE - 5.7% | |||
Application Software - 5.7% | |||
EPIQ Systems, Inc. (a) | 10,800 | 191,484 | |
Fair, Isaac & Co., Inc. | 44,700 | 1,744,641 | |
1,936,125 | |||
TOTAL COMMON STOCKS (Cost $29,570,742) | 34,040,901 | ||
Money Market Funds - 14.0% | |||
Fidelity Securities Lending Cash Central Fund, 5.34% (b)(c) | 4,756,325 | 4,756,325 | |
TOTAL INVESTMENT PORTFOLIO - 113.8% (Cost $34,327,067) | 38,797,226 | ||
NET OTHER ASSETS - (13.8)% | (4,692,868) | ||
NET ASSETS - 100% | $ 34,104,358 | ||
Legend |
(a) Non-income producing |
(b) Affiliated fund that is available only to investment companies and other accounts managed by Fidelity Investments. The rate quoted is the annualized seven-day yield of the fund at period end. A complete unaudited listing of the fund's holdings as of its most recent quarter end is available upon request. |
(c) Investment made with cash collateral received from securities on loan. |
(d) Security or a portion of the security is on loan at period end. |
Affiliated Central Funds |
Information regarding fiscal year to date income earned by the Fund from investments in Fidelity Central Funds is as follows: |
Fund | Income earned |
Fidelity Cash Central Fund | $ 54,088 |
Fidelity Securities Lending Cash Central Fund | 2,958 |
Total | $ 57,046 |
See accompanying notes which are an integral part of the financial statements.
Annual Report
Select IT Services Portfolio
Financial Statements
Statement of Assets and Liabilities
February 28, 2007 | ||
Assets | ||
Investment in securities, at value (including securities loaned of $4,657,471) - See accompanying schedule: Unaffiliated issuers (cost $29,570,742) | $ 34,040,901 | |
Fidelity Central Funds (cost $4,756,325) | 4,756,325 | |
Total Investments (cost $34,327,067) | $ 38,797,226 | |
Foreign currency held at value (cost $103,784) | 103,801 | |
Receivable for investments sold | 1,155,981 | |
Receivable for fund shares sold | 7,836 | |
Dividends receivable | 6,128 | |
Distributions receivable from Fidelity Central Funds | 386 | |
Prepaid expenses | 167 | |
Receivable from investment adviser for expense reductions | 681 | |
Other receivables | 11,830 | |
Total assets | 40,084,036 | |
Liabilities | ||
Payable to custodian bank | $ 825,403 | |
Payable for investments purchased | 9,746 | |
Payable for fund shares redeemed | 278,715 | |
Accrued management fee | 16,866 | |
Other affiliated payables | 11,023 | |
Other payables and accrued expenses | 81,600 | |
Collateral on securities loaned, at value | 4,756,325 | |
Total liabilities | 5,979,678 | |
Net Assets | $ 34,104,358 | |
Net Assets consist of: | ||
Paid in capital | $ 25,555,629 | |
Accumulated undistributed net realized gain (loss) on investments and foreign currency transactions | 4,078,553 | |
Net unrealized appreciation (depreciation) on investments and assets and liabilities in foreign currencies | 4,470,176 | |
Net Assets, for 1,960,355 shares outstanding | $ 34,104,358 | |
Net Asset Value, offering price and redemption price per share ($34,104,358 ÷ 1,960,355 shares) | $ 17.40 | |
Statement of Operations
Year ended February 28, 2007 | ||
Investment Income | ||
Dividends | $ 227,353 | |
Interest | 60 | |
Income from Fidelity Central Funds (including $2,958 from security lending) | 57,046 | |
Total income | 284,459 | |
Expenses | ||
Management fee | $ 220,514 | |
Transfer agent fees | 133,755 | |
Accounting and security lending fees | 17,773 | |
Custodian fees and expenses | 13,888 | |
Independent trustees' compensation | 141 | |
Registration fees | 23,436 | |
Audit | 39,881 | |
Legal | 11,438 | |
Miscellaneous | 3,108 | |
Total expenses before reductions | 463,934 | |
Expense reductions | (15,308) | 448,626 |
Net investment income (loss) | (164,167) | |
Realized and Unrealized Gain (Loss) Net realized gain (loss) on: | ||
Investment securities: | ||
Unaffiliated issuers | 6,739,342 | |
Foreign currency transactions | (956) | |
Total net realized gain (loss) | 6,738,386 | |
Change in net unrealized appreciation (depreciation) on: Investment securities (net of decrease in deferred foreign taxes of $6,874) | (3,734,876) | |
Assets and liabilities in foreign currencies | 17 | |
Total change in net unrealized appreciation (depreciation) | (3,734,859) | |
Net gain (loss) | 3,003,527 | |
Net increase (decrease) in net assets resulting from operations | $ 2,839,360 | |
See accompanying notes which are an integral part of the financial statements.
Annual Report
Select IT Services Portfolio
Financial Statements - continued
Statement of Changes in Net Assets
Year ended | Year ended | |
Increase (Decrease) in Net Assets | ||
Operations | ||
Net investment income (loss) | $ (164,167) | $ (60,983) |
Net realized gain (loss) | 6,738,386 | 2,848,409 |
Change in net unrealized appreciation (depreciation) | (3,734,859) | 3,037,491 |
Net increase (decrease) in net assets resulting from operations | 2,839,360 | 5,824,917 |
Distributions to shareholders from net realized gain | (4,161,629) | (1,570,115) |
Share transactions | 37,449,369 | 21,849,620 |
Reinvestment of distributions | 4,021,459 | 1,513,925 |
Cost of shares redeemed | (45,459,398) | (25,398,907) |
Net increase (decrease) in net assets resulting from share transactions | (3,988,570) | (2,035,362) |
Redemption fees | 23,192 | 7,908 |
Total increase (decrease) in net assets | (5,287,647) | 2,227,348 |
Net Assets | ||
Beginning of period | 39,392,005 | 37,164,657 |
End of period | $ 34,104,358 | $ 39,392,005 |
Other Information Shares | ||
Sold | 2,181,067 | 1,348,274 |
Issued in reinvestment of distributions | 237,885 | 98,617 |
Redeemed | (2,717,993) | (1,585,831) |
Net increase (decrease) | (299,041) | (138,940) |
Financial Highlights
Years ended February 28, | 2007 | 2006 | 2005 | 2004 I | 2003 |
Selected Per-Share Data | |||||
Net asset value, beginning of period | $ 17.43 | $ 15.50 | $ 14.14 | $ 10.20 | $ 15.21 |
Income from Investment Operations | |||||
Net investment income (loss) C | (.07) | (.03) F | (.10) G | (.15) | (.12) |
Net realized and unrealized gain (loss) | 1.73 | 2.59 | 1.70 | 4.09 | (4.90) |
Total from investment operations | 1.66 | 2.56 | 1.60 | 3.94 | (5.02) |
Distributions from net realized gain | (1.70) | (.63) | (.24) | - | - |
Redemption fees added to paid in capital C | .01 | - J | - J | - J | .01 |
Net asset value, end of period | $ 17.40 | $ 17.43 | $ 15.50 | $ 14.14 | $ 10.20 |
Total Return A, B | 10.11% | 17.14% | 11.26% | 38.63% | (32.94)% |
Ratios to Average Net Assets D, H | |||||
Expenses before reductions | 1.19% | 1.22% | 1.24% | 1.64% | 1.61% |
Expenses net of fee waivers, if any | 1.16% | 1.22% | 1.23% | 1.64% | 1.61% |
Expenses net of all reductions | 1.15% | 1.18% | 1.21% | 1.63% | 1.57% |
Net investment income (loss) | (.42)% | (.17)% F | (.66)% G | (1.17)% | (.97)% |
Supplemental Data | |||||
Net assets, end of period (000 omitted) | $ 34,104 | $ 39,392 | $ 37,165 | $ 35,068 | $ 27,888 |
Portfolio turnover rate E | 200% | 73% | 88% | 54% | 129% |
A Total returns would have been lower had certain expenses not been reduced during the periods shown.
B Total returns do not include the effect of the former sales charges.
C Calculated based on average shares outstanding during the period.
D Fees and expenses of the underlying Fidelity Central Funds are not included in the Fund's expense ratio. The Fund indirectly bears its proportionate share of the expenses of any underlying Fidelity Central Funds.
E Amount does not include the portfolio activity of any underlying Fidelity Central Funds.
F Investment income per share reflects special dividends which amounted to $.05 per share. Excluding these special dividends, the ratio of net investment income (loss) to average net assets would have been (.50)%.
G Investment income per share reflects a special dividend which amounted to $.02 per share. Excluding the special dividend, the ratio of net investment income (loss) to average net assets would have been (.81)%.
H Expense ratios reflect operating expenses of the Fund. Expenses before reductions do not reflect amounts reimbursed by the investment adviser or reductions from brokerage service arrangements or other expense offset arrangements and do not represent the amount paid by the Fund during periods when reimbursements or reductions occur. Expenses net of fee waivers reflect expenses after reimbursement by the investment adviser but prior to reductions from brokerage service arrangements or other expense offset arrangements. Expenses net of all reductions represent the net expenses paid by the Fund.
I For the year ended February 29.
J Amount represents less than $.01 per share.
See accompanying notes which are an integral part of the financial statements.
Annual Report
Select Networking and Infrastructure Portfolio
Performance
Average annual total return reflects the change in the value of an investment, assuming reinvestment of the fund's dividend income and capital gains (the profits earned upon the sale of securities that have grown in value) and assuming a constant rate of performance each year. The $10,000 table and the fund's returns do not reflect the deduction of taxes that a shareholder would pay on fund distributions or the redemption of fund shares. During periods of reimbursement by Fidelity, a fund's total returns will be greater than it would be had the reimbursement not occurred. How a fund did yesterday is no guarantee of how it will do tomorrow.
Average Annual Total Returns
Periods ended February 28, 2007 | Past 1 | Past 5 | Life of |
Select Networking and Infrastructure Portfolio | -3.49% | 0.91% | -19.41% |
A From September 21, 2000.
$10,000 Over Life of Fund
Let's say hypothetically that $10,000 was invested in Select Networking and Infrastructure Portfolio on September 21, 2000, when the fund started. The chart shows how the value of your investment would have changed, and also shows how the S&P 500 Index performed over the same period.
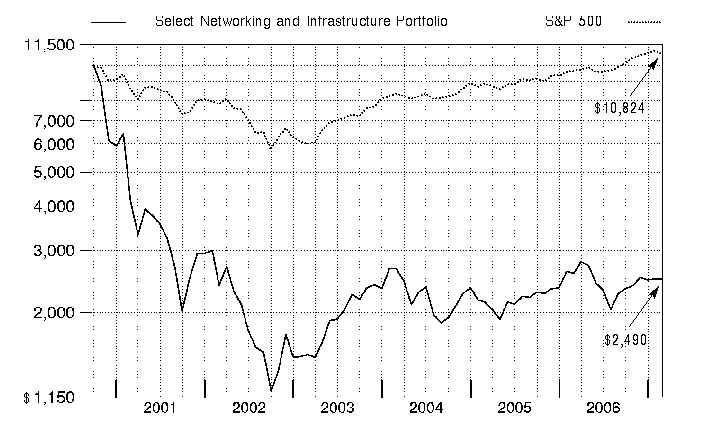
Annual Report
Select Networking and Infrastructure Portfolio
Management's Discussion of Fund Performance
Comments from Charlie Chai, Portfolio Manager of Fidelity® Select Networking and Infrastructure Portfolio
A rosy year for stocks wilted just prior to the end of the 12-month period ending February 28, 2007. On the day prior to the period's close, the Dow Jones Industrial AverageSM plunged 416 points and the Standard & Poor's 500SM Index lost roughly 3.5% of its value, plummeting nearly 50 points and marking the benchmark's worst single-day performance since the day the market reopened after the 9/11 terrorist attacks. Though investors were obviously rattled by the development, it was only the 22nd-biggest decline for the S&P 500® in 20 years, and it could not overshadow how well stocks performed for the 12 months overall. For much of the past year, investors grew confident that the economy would not fall into a recession, and they bid up most broad-based stock indexes for six consecutive months from August through January. Overall for the year ending February 28, 2007, the S&P 500 was up 11.97%, the Dow advanced 14.24%, the small-cap Russell 2000® Index gained 9.87% and the NASDAQ Composite® Index rose 6.66%.
During the past year, the fund returned -3.49%, falling short of the 5.19% return of the Morgan Stanley Capital InternationalSM (MSCI®) US Investable Market Information Technology Index and also trailing the 5.33% advance of a blended index specific to this fund. This blended index is a combination of the Goldman Sachs® Technology Index, which the fund was compared with through September, and the new MSCI benchmark mentioned above, which the fund was compared with during the period's final five months1. During the same 12-month period, the fund lagged the S&P 500. For the first seven months of the review period, the fund significantly trailed the Goldman Sachs index primarily due to adverse stock selection in semiconductors and in communications equipment, along with a large underweighting in systems software. Counterbalancing those negatives to some extent was favorable stock picking in Internet software and services, computer storage and peripherals, and computer hardware. Among individual holdings, semiconductor maker Broadcom was the biggest detractor. The stock declined early in the period due to inventory issues and the company's involvement with options backdating. Not owning major index component Oracle, an enterprise software provider, also worked against the fund. On the positive side, a large stake in targeted Internet advertising provider Google - the fund's largest holding at the end of February 2007 - added value. During the period's last five months, the fund beat the MSCI index, aided by favorable picks in semiconductors, although overweighting the group offset some of those benefits. The fund also benefited from underweighting systems software and good stock selection in computer storage and peripherals. Market selction was the most significant drag on performance, fueled by a huge overweighting in communications equipment, an underweighting in computer hardware, and having no exposure to the strong performing data processing and outsourced services group. Unrewarding picks in Internet software and services were to blame as well. At the company level, not owning a stake in poorly performing index component Motorola, a maker of wireless handsets, turned out to be a good decision. Network computing giant Sun Microsystems also aided performance, as did Broadcom. On the downside, fiber-optic cable maker Corning saw its shares decline sharply in October after the company reported mixed third-quarter results. Underweighting networking equipment maker Cisco Systems - - a major index component - also had a negative impact on fund performance.
1 The fund's blended index is a customized index developed by Fidelity for the limited purpose of discussing the fund's performance for the 12-month period ending February 28, 2007. From March 1, 2006, through September 30, 2006, the fund compared its performance to the Goldman Sachs Technology Index, which returned -0.35% during that period. On October 1, 2006, the fund began comparing its performance to a different index, the MSCI US Investable Market Information Technology Index, which returned 5.70% from October 1, 2006, through February 28, 2007. For the 12-month period ending February 28, 2007, the blended index (Goldman Sachs and MSCI) returned 5.33%.
The views expressed above reflect those of the portfolio manager(s) only through the end of the period as stated on the cover of this report and do not necessarily represent the views of Fidelity or any other person in the Fidelity organization. Any such views are subject to change at any time based upon market or other conditions and Fidelity disclaims any responsibility to update such views. These views may not be relied on as investment advice and, because investment decisions for a Fidelity fund are based on numerous factors, may not be relied on as an indication of trading intent on behalf of any Fidelity fund.
Annual Report
Select Networking and Infrastructure Portfolio
Investment Changes
Top Ten Stocks as of February 28, 2007 | ||
% of fund's | % of fund's net assets | |
Google, Inc. Class A (sub. vtg.) | 9.5 | 4.7 |
Cisco Systems, Inc. | 6.6 | 0.0 |
Sun Microsystems, Inc. | 6.6 | 4.7 |
Corning, Inc. | 6.0 | 7.7 |
Marvell Technology Group Ltd. | 5.6 | 3.3 |
Broadcom Corp. Class A | 5.4 | 8.1 |
Juniper Networks, Inc. | 4.7 | 2.6 |
EMC Corp. | 3.1 | 0.0 |
Comtech Group, Inc. | 2.7 | 0.6 |
F5 Networks, Inc. | 2.6 | 1.7 |
52.8 | ||

Annual Report
Select Networking and Infrastructure Portfolio
Investments February 28, 2007
Showing Percentage of Net Assets
Common Stocks - 99.5% | |||
Shares | Value | ||
BUILDING PRODUCTS - 0.3% | |||
Building Products - 0.3% | |||
Asahi Glass Co. Ltd. | 24,000 | $ 319,123 | |
COMMERCIAL SERVICES & SUPPLIES - 0.4% | |||
Diversified Commercial & Professional Services - 0.4% | |||
Tele Atlas NV (a) | 19,000 | 397,773 | |
COMMUNICATIONS EQUIPMENT - 42.5% | |||
Communications Equipment - 42.5% | |||
Acme Packet, Inc. | 700 | 11,627 | |
ADC Telecommunications, Inc. (a) | 20,128 | 330,502 | |
Adtran, Inc. | 38,100 | 877,443 | |
ADVA AG Optical Networking (a)(d) | 76,576 | 881,631 | |
Alcatel-Lucent SA sponsored ADR (d) | 95,600 | 1,226,548 | |
AudioCodes Ltd. (a) | 90,100 | 878,475 | |
Bookham, Inc. (a) | 220,200 | 576,924 | |
Ciena Corp. (a)(d) | 63,946 | 2,012,381 | |
Cisco Systems, Inc. (a) | 231,700 | 6,010,298 | |
Comtech Group, Inc. (a)(d) | 165,900 | 2,463,615 | |
Comverse Technology, Inc. (a) | 65,300 | 1,435,294 | |
Corning, Inc. (a) | 264,400 | 5,454,572 | |
F5 Networks, Inc. (a) | 33,200 | 2,410,984 | |
Finisar Corp. (a) | 411,200 | 1,311,728 | |
Foundry Networks, Inc. (a) | 82,900 | 1,210,340 | |
Foxconn International Holdings Ltd. (a) | 40,000 | 105,721 | |
Harris Stratex Networks, Inc. (a) | 19,700 | 401,880 | |
Ixia (a) | 16,400 | 180,728 | |
JDS Uniphase Corp. (a) | 29,700 | 481,437 | |
Juniper Networks, Inc. (a)(d) | 226,309 | 4,279,503 | |
MRV Communications, Inc. (a)(d) | 67,800 | 255,606 | |
NETGEAR, Inc. (a) | 14,500 | 391,935 | |
Oplink Communications, Inc. (a) | 40,300 | 664,547 | |
Opnext, Inc. | 4,800 | 80,880 | |
Optical Communication Products, Inc. (a) | 36,100 | 50,901 | |
Optium Corp. | 200 | 4,602 | |
Orckit Communications Ltd. (a) | 29,900 | 316,342 | |
Powerwave Technologies, Inc. (a) | 134,600 | 716,072 | |
Research In Motion Ltd. (a) | 6,200 | 871,782 | |
Riverbed Technology, Inc. | 6,300 | 200,529 | |
Riverstone Networks, Inc. (a) | 94,100 | 1 | |
Sonus Networks, Inc. (a) | 146,800 | 1,128,892 | |
Symmetricom, Inc. (a) | 91,400 | 773,244 | |
Tekelec (a) | 59,400 | 740,124 | |
38,737,088 | |||
COMPUTERS & PERIPHERALS - 12.9% | |||
Computer Hardware - 7.7% | |||
Concurrent Computer Corp. (a) | 637,000 | 1,006,460 | |
Sun Microsystems, Inc. (a) | 974,700 | 5,974,911 | |
6,981,371 | |||
Shares | Value | ||
Computer Storage & Peripherals - 5.2% | |||
EMC Corp. (a) | 201,800 | $ 2,815,110 | |
Network Appliance, Inc. (a) | 50,300 | 1,945,101 | |
4,760,211 | |||
TOTAL COMPUTERS & PERIPHERALS | 11,741,582 | ||
ELECTRICAL EQUIPMENT - 0.4% | |||
Electrical Components & Equipment - 0.4% | |||
Energy Conversion Devices, Inc. (a)(d) | 12,700 | 382,270 | |
ELECTRONIC EQUIPMENT & INSTRUMENTS - 3.0% | |||
Electronic Equipment & Instruments - 1.3% | |||
Chi Mei Optoelectronics Corp. | 3,888 | 3,831 | |
Coherent, Inc. (a)(d) | 15,000 | 450,900 | |
Nippon Electric Glass Co. Ltd. | 18,000 | 437,459 | |
Orbotech Ltd. (a) | 13,100 | 292,785 | |
1,184,975 | |||
Electronic Manufacturing Services - 1.7% | |||
Hon Hai Precision Industry Co. Ltd. (Foxconn) | 70,400 | 473,075 | |
Jabil Circuit, Inc. | 18,300 | 488,976 | |
Smart Modular Tech WWH, Inc. | 56,200 | 609,770 | |
1,571,821 | |||
Technology Distributors - 0.0% | |||
Mellanox Technologies Ltd. | 100 | 2,142 | |
TOTAL ELECTRONIC EQUIPMENT & INSTRUMENTS | 2,758,938 | ||
HOUSEHOLD DURABLES - 0.3% | |||
Consumer Electronics - 0.3% | |||
Thomson SA | 12,500 | 235,225 | |
INTERNET SOFTWARE & SERVICES - 11.2% | |||
Internet Software & Services - 11.2% | |||
Ariba, Inc. (a) | 25,100 | 233,681 | |
Baidu.com, Inc. sponsored ADR (a) | 800 | 85,360 | |
DivX, Inc. | 100 | 2,057 | |
Google, Inc. Class A (sub. vtg.) (a) | 19,200 | 8,629,438 | |
Marchex, Inc. Class B | 12,000 | 161,760 | |
Openwave Systems, Inc. (a) | 128,500 | 1,048,560 | |
Switch & Data Facilities Co., Inc. | 300 | 5,844 | |
10,166,700 | |||
IT SERVICES - 0.2% | |||
IT Consulting & Other Services - 0.2% | |||
Isilon Systems, Inc. | 100 | 1,947 | |
Sapient Corp. (a) | 21,700 | 135,408 | |
137,355 | |||
MEDIA - 0.0% | |||
Publishing - 0.0% | |||
Gemstar-TV Guide International, Inc. (a) | 390 | 1,580 | |
Common Stocks - continued | |||
Shares | Value | ||
SEMICONDUCTORS & SEMICONDUCTOR EQUIPMENT - 24.8% | |||
Semiconductor Equipment - 1.7% | |||
Credence Systems Corp. (a) | 136,500 | $ 619,710 | |
Cymer, Inc. (a) | 9,000 | 374,040 | |
EMCORE Corp. (a) | 40,700 | 182,336 | |
Verigy Ltd. | 16,577 | 389,394 | |
1,565,480 | |||
Semiconductors - 23.1% | |||
Altera Corp. (a) | 73,900 | 1,560,029 | |
AMIS Holdings, Inc. (a) | 23,000 | 260,590 | |
Applied Micro Circuits Corp. (a) | 228,900 | 885,843 | |
Broadcom Corp. Class A (a)(d) | 144,750 | 4,934,528 | |
Chartered Semiconductor Manufacturing Ltd. sponsored ADR (a)(d) | 34,700 | 340,754 | |
Conexant Systems, Inc. (a) | 402,500 | 800,975 | |
Cree, Inc. (a) | 2,700 | 47,520 | |
Cypress Semiconductor Corp. (a) | 33,300 | 632,700 | |
Ikanos Communications, Inc. (a) | 20,600 | 185,812 | |
Integrated Device Technology, Inc. (a) | 36,000 | 583,920 | |
Marvell Technology Group Ltd. (a) | 247,280 | 5,074,186 | |
Maxim Integrated Products, Inc. | 8,300 | 271,825 | |
Mindspeed Technologies, Inc. (a)(d) | 311,433 | 756,782 | |
MIPS Technologies, Inc. (a) | 43,500 | 405,420 | |
Saifun Semiconductors Ltd. (a) | 10,500 | 131,565 | |
Sigma Designs, Inc. (a) | 14,800 | 417,212 | |
Silicon Laboratories, Inc. (a) | 29,900 | 902,980 | |
Silicon On Insulator Technologies SA (SOITEC) (a) | 28,800 | 800,362 | |
Spansion, Inc. Class A (a)(d) | 30,600 | 372,096 | |
Tower Semicondutor Ltd. (a) | 256,500 | 464,265 | |
Vimicro International Corp. sponsored ADR (a) | 44,600 | 307,294 | |
Xilinx, Inc. | 35,600 | 912,072 | |
21,048,730 | |||
TOTAL SEMICONDUCTORS & SEMICONDUCTOR EQUIPMENT | 22,614,210 | ||
SOFTWARE - 3.5% | |||
Application Software - 1.9% | |||
Informatica Corp. (a) | 36,800 | 476,928 | |
TIBCO Software, Inc. (a) | 33,980 | 307,519 | |
Ulticom, Inc. (a) | 108,900 | 947,430 | |
1,731,877 | |||
Shares | Value | ||
Systems Software - 1.6% | |||
Allot Communications Ltd. | 2,800 | $ 27,048 | |
Double-Take Software, Inc. | 12,900 | 182,148 | |
Sandvine Corp. | 267,400 | 609,325 | |
Wind River Systems, Inc. (a) | 58,300 | 606,320 | |
1,424,841 | |||
TOTAL SOFTWARE | 3,156,718 | ||
TOTAL COMMON STOCKS (Cost $96,851,820) | 90,648,562 | ||
Convertible Bonds - 0.2% | ||||
Principal Amount | ||||
COMMUNICATIONS EQUIPMENT - 0.2% | ||||
Communications Equipment - 0.2% | ||||
Ciena Corp. 0.25% 5/1/13 | $ 240,000 | 237,192 | ||
Money Market Funds - 15.7% | |||
Shares | |||
Fidelity Securities Lending Cash Central Fund, 5.34% (b)(c) | 14,314,450 | 14,314,450 | |
TOTAL INVESTMENT PORTFOLIO - 115.4% (Cost $111,406,270) | 105,200,204 | ||
NET OTHER ASSETS - (15.4)% | (14,071,487) | ||
NET ASSETS - 100% | $ 91,128,717 | ||
Legend |
(a) Non-income producing |
(b) Affiliated fund that is available only to investment companies and other accounts managed by Fidelity Investments. The rate quoted is the annualized seven-day yield of the fund at period end. A complete unaudited listing of the fund's holdings as of its most recent quarter end is available upon request. |
(c) Investment made with cash collateral received from securities on loan. |
(d) Security or a portion of the security is on loan at period end. |
Affiliated Central Funds |
Information regarding fiscal year to date income earned by the Fund from investments in Fidelity Central Funds is as follows: |
Fund | Income earned |
Fidelity Cash Central Fund | $ 90,611 |
Fidelity Securities Lending Cash Central Fund | 107,350 |
Total | $ 197,961 |
Other Information |
Distribution of investments by country of issue, as a percentage of total net assets, is as follows: |
United States of America | 83.2% |
Bermuda | 5.6% |
France | 2.5% |
Israel | 2.3% |
Canada | 1.7% |
Cayman Islands | 1.1% |
Germany | 1.0% |
Others (individually less than 1%) | 2.6% |
100.0% |
Income Tax Information |
At February 28, 2007, the fund had a capital loss carryforward of approximately $186,635,331 of which $99,728,449, $83,559,188 and $3,347,694 will expire on February 28, 2010, 2011 and 2013, respectively. |
See accompanying notes which are an integral part of the financial statements.
Annual Report
Select Networking and Infrastructure Portfolio
Financial Statements
Statement of Assets and Liabilities
February 28, 2007 | ||
Assets | ||
Investment in securities, at value (including securities loaned of $13,937,381) - See accompanying schedule: Unaffiliated issuers (cost $97,091,820) | $ 90,885,754 | |
Fidelity Central Funds (cost $14,314,450) | 14,314,450 | |
Total Investments (cost $111,406,270) | $ 105,200,204 | |
Receivable for investments sold | 2,760,129 | |
Receivable for fund shares sold | 272,978 | |
Dividends receivable | 10,034 | |
Interest receivable | 198 | |
Distributions receivable from Fidelity Central Funds | 75 | |
Prepaid expenses | 399 | |
Other receivables | 5,262 | |
Total assets | 108,249,279 | |
Liabilities | ||
Payable to custodian bank | $ 1,586,319 | |
Payable for fund shares redeemed | 1,106,531 | |
Accrued management fee | 45,954 | |
Other affiliated payables | 29,032 | |
Other payables and accrued expenses | 38,276 | |
Collateral on securities loaned, at value | 14,314,450 | |
Total liabilities | 17,120,562 | |
Net Assets | $ 91,128,717 | |
Net Assets consist of: | ||
Paid in capital | $ 285,116,786 | |
Accumulated undistributed net realized gain (loss) on investments and foreign currency transactions | (187,782,008) | |
Net unrealized appreciation (depreciation) on investments and assets and liabilities in foreign currencies | (6,206,061) | |
Net Assets, for 36,580,438 shares outstanding | $ 91,128,717 | |
Net Asset Value, offering price and redemption price per share ($91,128,717 ÷ 36,580,438 shares) | $ 2.49 | |
Statement of Operations
Year ended February 28, 2007 | ||
Investment Income | ||
Dividends | $ 87,507 | |
Interest | 496 | |
Income from Fidelity Central Funds (including $107,350 from security lending) | 197,961 | |
Total income | 285,964 | |
Expenses | ||
Management fee | $ 660,885 | |
Transfer agent fees | 435,630 | |
Accounting and security lending fees | 55,157 | |
Custodian fees and expenses | 30,978 | |
Independent trustees' compensation | 434 | |
Registration fees | 42,906 | |
Audit | 35,560 | |
Legal | 2,416 | |
Miscellaneous | 10,688 | |
Total expenses before reductions | 1,274,654 | |
Expense reductions | (6,886) | 1,267,768 |
Net investment income (loss) | (981,804) | |
Realized and Unrealized Gain (Loss) Net realized gain (loss) on: | ||
Investment securities: | ||
Unaffiliated issuers | 8,838,557 | |
Foreign currency transactions | 2,130 | |
Total net realized gain (loss) | 8,840,687 | |
Change in net unrealized appreciation (depreciation) on: Investment securities | (15,162,542) | |
Assets and liabilities in foreign currencies | 5 | |
Total change in net unrealized appreciation (depreciation) | (15,162,537) | |
Net gain (loss) | (6,321,850) | |
Net increase (decrease) in net assets resulting from operations | $ (7,303,654) | |
See accompanying notes which are an integral part of the financial statements.
Annual Report
Select Networking and Infrastructure Portfolio
Financial Statements - continued
Statement of Changes in Net Assets
Year ended | Year ended | |
Increase (Decrease) in Net Assets | ||
Operations | ||
Net investment income (loss) | $ (981,804) | $ (851,863) |
Net realized gain (loss) | 8,840,687 | 8,428,855 |
Change in net unrealized appreciation (depreciation) | (15,162,537) | 10,418,364 |
Net increase (decrease) in net assets resulting from operations | (7,303,654) | 17,995,356 |
Share transactions | 146,060,492 | 99,416,849 |
Cost of shares redeemed | (173,089,291) | (102,088,170) |
Net increase (decrease) in net assets resulting from share transactions | (27,028,799) | (2,671,321) |
Redemption fees | 94,221 | 82,946 |
Total increase (decrease) in net assets | (34,238,232) | 15,406,981 |
Net Assets | ||
Beginning of period | 125,366,949 | 109,959,968 |
End of period | $ 91,128,717 | $ 125,366,949 |
Other Information Shares | ||
Sold | 57,517,022 | 42,500,481 |
Redeemed | (69,494,804) | (45,315,892) |
Net increase (decrease) | (11,977,782) | (2,815,411) |
Financial Highlights
Years ended February 28, | 2007 | 2006 | 2005 | 2004 G | 2003 |
Selected Per-Share Data | |||||
Net asset value, beginning of period | $ 2.58 | $ 2.14 | $ 2.66 | $ 1.52 | $ 2.38 |
Income from Investment Operations | |||||
Net investment income (loss) C | (.02) | (.02) | (.02) | (.02) | (.03) |
Net realized and unrealized gain (loss) | (.07) | .46 | (.50) | 1.16 | (.84) |
Total from investment operations | (.09) | .44 | (.52) | 1.14 | (.87) |
Redemption fees added to paid in capital C | - H | - H | - H | - H | .01 |
Net asset value, end of period | $ 2.49 | $ 2.58 | $ 2.14 | $ 2.66 | $ 1.52 |
Total Return A, B | (3.49)% | 20.56% | (19.55)% | 75.00% | (36.13)% |
Ratios to Average Net Assets D, F | |||||
Expenses before reductions | 1.09% | 1.14% | 1.17% | 1.43% | 1.93% |
Expenses net of fee waivers, if any | 1.09% | 1.14% | 1.17% | 1.43% | 1.93% |
Expenses net of all reductions | 1.08% | 1.02% | 1.07% | 1.39% | 1.78% |
Net investment income (loss) | (.84)% | (.84)% | (.89)% | (1.00)% | (1.45)% |
Supplemental Data | |||||
Net assets, end of period (000 omitted) | $ 91,129 | $ 125,367 | $ 109,960 | $ 211,468 | $ 77,981 |
Portfolio turnover rate E | 136% | 201% | 160% | 57% | 120% |
A Total returns would have been lower had certain expenses not been reduced during the periods shown.
B Total returns do not include the effect of the former sales charges.
C Calculated based on average shares outstanding during the period.
D Fees and expenses of the underlying Fidelity Central Funds are not included in the Fund's expense ratio. The Fund indirectly bears its proportionate share of the expenses of any underlying Fidelity Central Funds.
E Amount does not include the portfolio activity of any underlying Fidelity Central Funds.
F Expense ratios reflect operating expenses of the Fund. Expenses before reductions do not reflect amounts reimbursed by the investment adviser or reductions from brokerage service arrangements or other expense offset arrangements and do not represent the amount paid by the Fund during periods when reimbursements or reductions occur. Expenses net of fee waivers reflect expenses after reimbursement by the investment adviser but prior to reductions from brokerage service arrangements or other expense offset arrangements. Expenses net of all reductions represent the net expenses paid by the Fund.
G For the year ended February 29.
H Amount represents less than $.01 per share.
See accompanying notes which are an integral part of the financial statements.
Annual Report
Select Software and Computer Services Portfolio
Performance
Average annual total return reflects the change in the value of an investment, assuming reinvestment of the fund's dividend income and capital gains (the profits earned upon the sale of securities that have grown in value) and assuming a constant rate of performance each year. The $10,000 table and the fund's returns do not reflect the deduction of taxes that a shareholder would pay on fund distributions or the redemption of fund shares. During periods of reimbursement by Fidelity, a fund's total returns will be greater than it would be had the reimbursement not occurred. How a fund did yesterday is no guarantee of how it will do tomorrow.
Average Annual Total Returns
Periods ended February 28, 2007 | Past 1 | Past 5 | Past 10 |
Select Software and Computer Services Portfolio | 21.38% | 9.58% | 13.11% |
$10,000 Over 10 Years
Let's say hypothetically that $10,000 was invested in Select Software and Computer Services Portfolio on February 28, 1997. The chart shows how the value of your investment would have changed, and also shows how the S&P 500 Index performed over the same period.
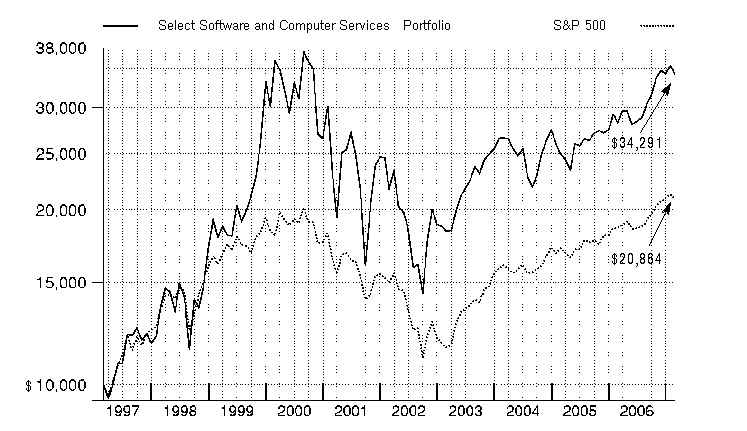
Annual Report
Select Software and Computer Services Portfolio
Management's Discussion of Fund Performance
Comments from Mayank Tandon, who became Portfolio Manager of Fidelity® Select Software and Computer Services Portfolio on January 4, 2007
A rosy year for stocks wilted just prior to the end of the 12-month period ending February 28, 2007. On the day prior to the period's close, the Dow Jones Industrial AverageSM plunged 416 points and the Standard & Poor's 500SM Index lost roughly 3.5% of its value, plummeting nearly 50 points and marking the benchmark's worst single-day performance since the day the market reopened after the 9/11 terrorist attacks. Though investors were obviously rattled by the development, it was only the 22nd-biggest decline for the S&P 500® in 20 years, and it could not overshadow how well stocks performed for the 12 months overall. For much of the past year, investors grew confident that the economy would not fall into a recession, and they bid up most broad-based stock indexes for six consecutive months from August through January. Overall for the year ending February 28, 2007, the S&P 500 was up 11.97%, the Dow advanced 14.24%, the small-cap Russell 2000® Index gained 9.87% and the NASDAQ Composite® Index rose 6.66%.
During the 12-month period, the fund returned 21.38% and soundly outperformed the 9.14% gain of the Morgan Stanley Capital InternationalSM
(MSCI®) US Investable Market Software & Services Index and the 6.52% return of a blended index specific to this fund. This blended index is a combination of the Goldman Sachs® Technology Index, which the fund was compared with through September, and the new MSCI benchmark mentioned above, which the fund was compared with during the final five months of the period1. During the same 12-month period, the fund also outpaced the S&P 500. For the first seven months of the review period, the fund handily beat its Goldman Sachs benchmark. Stock selection in software and services led to substantial gains while the technology sector pulled back overall. Attention to reasonable valuations and companies with steady cash flow paid off as well. Symantec bounced back after struggling following its takeover of VERITAS Software. Japan's Nintendo profited from excitement over its launch of the Wii console, and application server software maker BEA Systems exceeded earnings expectations. The fund missed out on gains by not owning Internet infrastructure firm Cisco Systems and was hurt by poorly timed sales of Microsoft. For the final five months, positions in IT consulting and home entertainment software stocks propelled the fund past its new MSCI benchmark. Cognizant Technology Solutions, an offshore information technology services outsourcing firm, benefited from solid growth in the industry. Nintendo rode a wave of strong sales of its new gaming system, and France's Ubisoft Entertainment, which makes games that are played on Nintendo hardware, enjoyed the ride as well. Symantec, however, reverted to its earlier struggles as it combined a poor third fiscal quarter with lower earnings guidance for the following quarter, and I subsequently eliminated the position.
1 The fund's blended index is a customized index developed by Fidelity for the limited purpose of discussing the fund's performance for the 12-month period ending February 28, 2007. From March 1, 2006, through September 30, 2006, the fund compared its performance to the Goldman Sachs Technology Index, which lost 0.35% during that period. On October 1, 2006, the fund began comparing its performance to a different index, the MSCI US Investable Market Software & Services Index, which returned 6.89% from October 1, 2006, through February 28, 2007. For the 12-month period ending February 28, 2007, the blended index (Goldman Sachs and MSCI) returned 6.52%.
The views expressed above reflect those of the portfolio manager(s) only through the end of the period as stated on the cover of this report and do not necessarily represent the views of Fidelity or any other person in the Fidelity organization. Any such views are subject to change at any time based upon market or other conditions and Fidelity disclaims any responsibility to update such views. These views may not be relied on as investment advice and, because investment decisions for a Fidelity fund are based on numerous factors, may not be relied on as an indication of trading intent on behalf of any Fidelity fund.
Annual Report
Select Software and Computer Services Portfolio
Investment Changes
Top Ten Stocks as of February 28, 2007 | ||
% of fund's | % of fund's net assets | |
Microsoft Corp. | 16.4 | 4.7 |
Google, Inc. Class A (sub. vtg.) | 13.8 | 9.6 |
Cognizant Technology Solutions Corp. Class A | 8.5 | 0.0 |
Oracle Corp. | 7.0 | 4.4 |
Yahoo!, Inc. | 5.0 | 4.5 |
Nintendo Co. Ltd. | 4.0 | 5.3 |
Quest Software, Inc. | 3.7 | 5.8 |
eBay, Inc. | 2.8 | 0.0 |
The Western Union Co. | 2.4 | 0.0 |
Utimaco Safeware AG | 2.4 | 2.0 |
66.0 | ||
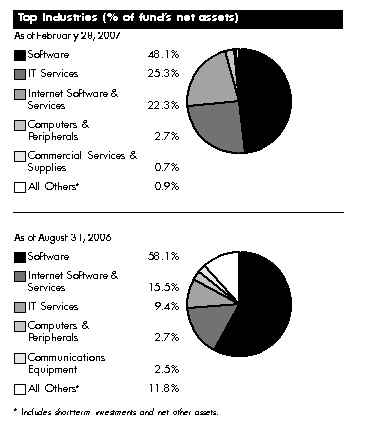
Annual Report
Select Software and Computer Services Portfolio
Investments February 28, 2007
Showing Percentage of Net Assets
Common Stocks - 99.6% | |||
Shares | Value | ||
COMMERCIAL SERVICES & SUPPLIES - 0.7% | |||
Office Services & Supplies - 0.7% | |||
APAC Customer Services, Inc. (a) | 1,000,000 | $ 4,790,000 | |
PeopleSupport, Inc. (a) | 85,700 | 1,813,412 | |
6,603,412 | |||
COMPUTERS & PERIPHERALS - 2.7% | |||
Computer Hardware - 2.7% | |||
Apple, Inc. (a) | 222,800 | 18,851,108 | |
Sun Microsystems, Inc. (a) | 1,000,000 | 6,130,000 | |
24,981,108 | |||
DIVERSIFIED TELECOMMUNICATION SERVICES - 0.4% | |||
Integrated Telecommunication Services - 0.4% | |||
NeuStar, Inc. Class A (a) | 107,100 | 3,427,200 | |
INTERNET SOFTWARE & SERVICES - 22.3% | |||
Internet Software & Services - 22.3% | |||
Akamai Technologies, Inc. (a) | 63,919 | 3,296,303 | |
eBay, Inc. (a) | 818,500 | 26,241,110 | |
Google, Inc. Class A (sub. vtg.) (a)(d) | 284,200 | 127,733,690 | |
VeriSign, Inc. (a) | 122,300 | 3,094,190 | |
Yahoo!, Inc. (a) | 1,494,900 | 46,132,614 | |
206,497,907 | |||
IT SERVICES - 25.3% | |||
Data Processing & Outsourced Services - 10.3% | |||
ExlService Holdings, Inc. | 2,400 | 54,384 | |
First Data Corp. | 759,800 | 19,397,694 | |
Mastercard, Inc. Class A (d) | 157,600 | 16,891,568 | |
MindTree Consulting Ltd. | 1,815 | 17,503 | |
MoneyGram International, Inc. | 421,600 | 12,673,296 | |
Paychex, Inc. (d) | 527,500 | 21,432,325 | |
Syntel, Inc. | 8,600 | 308,568 | |
The Western Union Co. | 1,016,200 | 22,021,054 | |
WNS Holdings Ltd. ADR | 83,600 | 2,689,412 | |
95,485,804 | |||
IT Consulting & Other Services - 15.0% | |||
Accenture Ltd. Class A | 313,900 | 11,206,230 | |
Cognizant Technology Solutions Corp. Class A (a) | 873,800 | 78,816,760 | |
Covansys Corp. (a) | 127,500 | 3,144,150 | |
HCL Technologies Ltd. | 551,742 | 7,519,033 | |
Infosys Technologies Ltd. sponsored ADR (d) | 311,000 | 16,874,860 | |
Satyam Computer Services Ltd. sponsored ADR (d) | 734,100 | 15,827,196 | |
Unisys Corp. (a) | 580,800 | 4,930,992 | |
138,319,221 | |||
TOTAL IT SERVICES | 233,805,025 | ||
Shares | Value | ||
SOFTWARE - 48.1% | |||
Application Software - 15.2% | |||
Ansys, Inc. (a) | 208,600 | $ 10,642,772 | |
Autodesk, Inc. (a) | 273,600 | 11,258,640 | |
Autonomy Corp. PLC (a) | 437,400 | 5,310,033 | |
BEA Systems, Inc. (a) | 342,400 | 4,084,832 | |
Business Objects SA sponsored ADR (a) | 124,500 | 4,494,450 | |
Cadence Design Systems, Inc. (a)(d) | 472,300 | 9,417,662 | |
Citrix Systems, Inc. (a) | 202,400 | 6,517,280 | |
Fair, Isaac & Co., Inc. | 297,600 | 11,615,328 | |
Hyperion Solutions Corp. (a) | 400,000 | 17,136,000 | |
Informatica Corp. (a) | 1,164,600 | 15,093,216 | |
Lawson Software, Inc. (a)(d) | 546,200 | 4,325,904 | |
Quest Software, Inc. (a) | 2,117,714 | 34,561,092 | |
Salesforce.com, Inc. (a) | 21,100 | 912,786 | |
Synopsys, Inc. (a) | 214,200 | 5,479,236 | |
140,849,231 | |||
Home Entertainment Software - 6.2% | |||
Electronic Arts, Inc. (a) | 154,140 | 7,771,739 | |
Nintendo Co. Ltd. | 137,800 | 36,439,810 | |
Ubisoft Entertainment SA (a)(d) | 300,068 | 13,223,263 | |
57,434,812 | |||
Systems Software - 26.7% | |||
Microsoft Corp. (d) | 5,385,500 | 151,709,535 | |
Novell, Inc. (a) | 486,600 | 3,221,292 | |
Oracle Corp. (a)(d) | 3,912,900 | 64,288,947 | |
Red Hat, Inc. (a) | 233,900 | 5,251,055 | |
Utimaco Safeware AG (e) | 1,268,953 | 21,847,289 | |
246,318,118 | |||
TOTAL SOFTWARE | 444,602,161 | ||
SPECIALTY RETAIL - 0.1% | |||
Computer & Electronics Retail - 0.1% | |||
Tweeter Home Entertainment Group, Inc. (a) | 1,060,619 | 1,548,504 | |
TOTAL COMMON STOCKS (Cost $843,602,298) | 921,465,317 | ||
Money Market Funds - 16.9% | |||
Shares | Value | ||
Fidelity Securities Lending Cash Central Fund, 5.34% (b)(c) | 155,938,542 | $ 155,938,542 | |
TOTAL INVESTMENT PORTFOLIO - 116.5% (Cost $999,540,840) | 1,077,403,859 | ||
NET OTHER ASSETS - (16.5)% | (152,739,516) | ||
NET ASSETS - 100% | $ 924,664,343 | ||
Legend |
(a) Non-income producing |
(b) Affiliated fund that is available only to investment companies and other accounts managed by Fidelity Investments. The rate quoted is the annualized seven-day yield of the fund at period end. A complete unaudited listing of the fund's holdings as of its most recent quarter end is available upon request. |
(c) Investment made with cash collateral received from securities on loan. |
(d) Security or a portion of the security is on loan at period end. |
(e) Affiliated company |
Affiliated Central Funds |
Information regarding fiscal year to date income earned by the Fund from investments in Fidelity Central Funds is as follows: |
Fund | Income earned |
Fidelity Cash Central Fund | $ 1,088,722 |
Fidelity Securities Lending Cash Central Fund | 119,780 |
Total | $ 1,208,502 |
Other Affiliated Issuers |
An affiliated company is a company in which the fund has ownership of at least 5% of the voting securities. Fiscal year to date transactions with companies which are or were affiliates are as follows: |
Affiliates | Value, | Purchases | Sales | Dividend | Value, |
Tweeter Home Entertainment Group, Inc. | $ 1,155,348 | $ 10,078,506 | $ 5,845,227 | $ - | $ - |
Utimaco Safeware AG | - | 18,243,109 | 209,726 | 185,297 | 21,847,289 |
Vitria Technology, Inc. | 5,523,254 | 822,579 | 6,120,357 | - | - |
WatchGuard Technologies, Inc. | 7,224,007 | 1,462,403 | 8,954,122 | - | - |
Total | $ 13,902,609 | $ 30,606,597 | $ 21,129,432 | $ 185,297 | $ 21,847,289 |
Other Information |
Distribution of investments by country of issue, as a percentage of total net assets, is as follows: |
United States of America | 85.3% |
India | 4.3% |
Japan | 4.0% |
Germany | 2.4% |
France | 1.9% |
Bermuda | 1.2% |
Others (individually less than 1%) | 0.9% |
100.0% |
Income Tax Information |
At February 28, 2007, the fund had a capital loss carryforward of approximately $56,672,617 all of which will expire on February 28, 2011. |
See accompanying notes which are an integral part of the financial statements.
Annual Report
Select Software and Computer Services Portfolio
Financial Statements
Statement of Assets and Liabilities
February 28, 2007 | ||
Assets | ||
Investment in securities, at value (including securities loaned of $153,117,532) - See accompanying schedule: Unaffiliated issuers (cost $825,520,389) | $ 899,618,028 | |
Fidelity Central Funds (cost $155,938,542) | 155,938,542 | |
Other affiliated issuers (cost $18,081,909) | 21,847,289 | |
Total Investments (cost $999,540,840) | $ 1,077,403,859 | |
Receivable for investments sold | 9,392,377 | |
Receivable for fund shares sold | 2,165,246 | |
Dividends receivable | 549,259 | |
Distributions receivable from Fidelity Central Funds | 50,912 | |
Prepaid expenses | 2,155 | |
Other receivables | 412,654 | |
Total assets | 1,089,976,462 | |
Liabilities | ||
Payable to custodian bank | $ 1,159,282 | |
Payable for investments purchased | 54,387 | |
Payable for fund shares redeemed | 7,411,337 | |
Accrued management fee | 453,538 | |
Other affiliated payables | 228,052 | |
Other payables and accrued expenses | 66,981 | |
Collateral on securities loaned, at value | 155,938,542 | |
Total liabilities | 165,312,119 | |
Net Assets | $ 924,664,343 | |
Net Assets consist of: | ||
Paid in capital | $ 913,768,288 | |
Accumulated net investment loss | (1,115) | |
Accumulated undistributed net realized gain (loss) on investments and foreign currency transactions | (66,965,606) | |
Net unrealized appreciation (depreciation) on investments and assets and liabilities in foreign currencies | 77,862,776 | |
Net Assets, for 14,123,838 shares outstanding | $ 924,664,343 | |
Net Asset Value, offering price and redemption price per share ($924,664,343 ÷ 14,123,838 shares) | $ 65.47 | |
Statement of Operations
Year ended February 28, 2007 | ||
Investment Income | ||
Dividends (including $185,297 earned from other affiliated issuers) | $ 2,976,519 | |
Interest | 8,212 | |
Income from Fidelity Central Funds (including $119,780 from security lending) | 1,208,502 | |
Total income | 4,193,233 | |
Expenses | ||
Management fee | $ 4,165,186 | |
Transfer agent fees | 1,987,315 | |
Accounting and security lending fees | 300,683 | |
Custodian fees and expenses | 78,875 | |
Independent trustees' compensation | 2,669 | |
Registration fees | 106,151 | |
Audit | 41,451 | |
Legal | 22,075 | |
Interest | 6,130 | |
Miscellaneous | 32,505 | |
Total expenses before reductions | 6,743,040 | |
Expense reductions | (56,141) | 6,686,899 |
Net investment income (loss) | (2,493,666) | |
Realized and Unrealized Gain (Loss) Net realized gain (loss) on: | ||
Investment securities: | ||
Unaffiliated issuers | 43,358,097 | |
Other affiliated issuers | (2,806,616) | |
Foreign currency transactions | (49,089) | |
Total net realized gain (loss) | 40,502,392 | |
Change in net unrealized appreciation (depreciation) on: Investment securities (net of decrease in deferred foreign taxes of $52,432) | 103,315,761 | |
Assets and liabilities in foreign currencies | (2,264) | |
Total change in net unrealized appreciation (depreciation) | 103,313,497 | |
Net gain (loss) | 143,815,889 | |
Net increase (decrease) in net assets resulting from operations | $ 141,322,223 | |
See accompanying notes which are an integral part of the financial statements.
Annual Report
Select Software and Computer Services Portfolio
Financial Statements - continued
Statement of Changes in Net Assets
Year ended | Year ended | |
Increase (Decrease) in Net Assets | ||
Operations | ||
Net investment income (loss) | $ (2,493,666) | $ (3,088,414) |
Net realized gain (loss) | 40,502,392 | 57,039,650 |
Change in net unrealized appreciation (depreciation) | 103,313,497 | 21,863,267 |
Net increase (decrease) in net assets resulting from operations | 141,322,223 | 75,814,503 |
Share transactions | 732,164,444 | 171,883,514 |
Cost of shares redeemed | (512,701,886) | (364,978,616) |
Net increase (decrease) in net assets resulting from share transactions | 219,462,558 | (193,095,102) |
Redemption fees | 80,891 | 90,805 |
Total increase (decrease) in net assets | 360,865,672 | (117,189,794) |
Net Assets | ||
Beginning of period | 563,798,671 | 680,988,465 |
End of period (including accumulated net investment loss of $1,115 and accumulated net investment loss of $1,204, respectively) | $ 924,664,343 | $ 563,798,671 |
Other Information Shares | ||
Sold | 11,694,868 | 3,386,990 |
Redeemed | (8,023,777) | (7,240,815) |
Net increase (decrease) | 3,671,091 | (3,853,825) |
Financial Highlights
Years ended February 28, | 2007 | 2006 | 2005 | 2004 I | 2003 |
Selected Per-Share Data | |||||
Net asset value, beginning of period | $ 53.94 | $ 47.60 | $ 51.37 | $ 35.48 | $ 41.84 |
Income from Investment Operations | |||||
Net investment income (loss) C | (.21) | (.25) | .53 F | (.24) G | (.24) |
Net realized and unrealized gain (loss) | 11.73 | 6.58 | (3.79) | 16.12 | (6.13) |
Total from investment operations | 11.52 | 6.33 | (3.26) | 15.88 | (6.37) |
Distributions from net investment income | - | - | (.51) | - | - |
Redemption fees added to paid in capital C | .01 | .01 | - J | .01 | .01 |
Net asset value, end of period | $ 65.47 | $ 53.94 | $ 47.60 | $ 51.37 | $ 35.48 |
Total Return A, B | 21.38% | 13.32% | (6.43)% | 44.79% | (15.20)% |
Ratios to Average Net Assets D, H | |||||
Expenses before reductions | .92% | .96% | .98% | 1.09% | 1.18% |
Expenses net of fee waivers, if any | .92% | .96% | .98% | 1.09% | 1.18% |
Expenses net of all reductions | .91% | .91% | .92% | 1.06% | 1.05% |
Net investment income (loss) | (.34)% | (.49)% | 1.09% F | (.53)% | (.65)% |
Supplemental Data | |||||
Net assets, end of period (000 omitted) | $ 924,664 | $ 563,799 | $ 680,988 | $ 846,946 | $ 617,904 |
Portfolio turnover rate E | 139% | 59% | 94% | 81% | 198% |
A Total returns would have been lower had certain expenses not been reduced during the periods shown.
B Total returns do not include the effect of the former sales charges.
C Calculated based on average shares outstanding during the period.
D Fees and expenses of the underlying Fidelity Central Funds are not included in the Fund's expense ratio. The Fund indirectly bears its proportionate share of the expenses of any underlying Fidelity Central Funds.
E Amount does not include the portfolio activity of any underlying Fidelity Central Funds.
F Investment income per share reflects a special dividend which amounted to $.76 per share. Excluding the special dividend, the ratio of net investment income (loss) to average net assets would have been (.48)%.
G Investment income per share reflects a special dividend which amounted to $.03 per share.
H Expense ratios reflect operating expenses of the Fund. Expenses before reductions do not reflect amounts reimbursed by the investment adviser or reductions from brokerage service arrangements or other expense offset arrangements and do not represent the amount paid by the Fund during periods when reimbursements or reductions occur. Expenses net of fee waivers reflect expenses after reimbursement by the investment adviser but prior to reductions from brokerage service arrangements or other expense offset arrangements. Expenses net of all reductions represent the net expenses paid by the Fund.
I For the year ended February 29.
J Amount represents less than $.01 per share.
See accompanying notes which are an integral part of the financial statements.
Annual Report
Performance
Average annual total return reflects the change in the value of an investment, assuming reinvestment of the fund's dividend income and capital gains (the profits earned upon the sale of securities that have grown in value) and assuming a constant rate of performance each year. The $10,000 table and the fund's returns do not reflect the deduction of taxes that a shareholder would pay on fund distributions or the redemption of fund shares. During periods of reimbursement by Fidelity, a fund's total returns will be greater than it would be had the reimbursement not occurred. How a fund did yesterday is no guarantee of how it will do tomorrow.
Average Annual Total Returns
Periods ended February 28, 2007 | Past 1 | Past 5 | Past 10 |
Select Technology Portfolio | 7.05% | 6.10% | 8.67% |
$10,000 Over 10 Years
Let's say hypothetically that $10,000 was invested in Select Technology Portfolio on February 28, 1997. The chart shows how the value of your investment would have changed, and also shows how the S&P 500 Index performed over the same period.
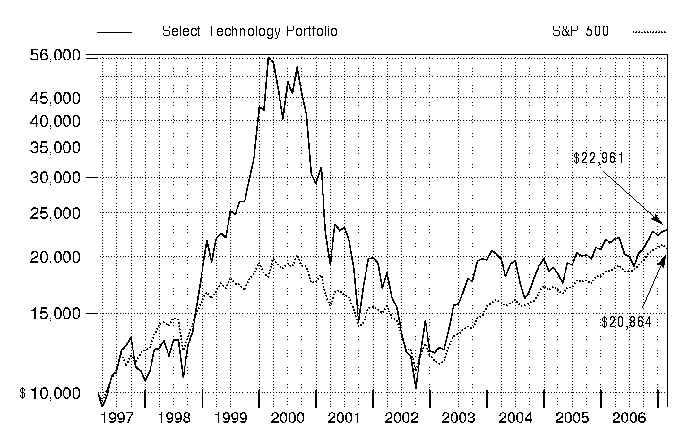
Annual Report
Select Technology Portfolio
Management's Discussion of Fund Performance
Comments from James Morrow, who managed Fidelity® Select Technology Portfolio for most of the period covered by this report
A rosy year for stocks wilted just prior to the end of the 12-month period ending February 28, 2007. On the day prior to the period's close, the Dow Jones Industrial AverageSM plunged 416 points and the Standard & Poor's 500SM Index lost roughly 3.5% of its value, plummeting nearly 50 points and marking the benchmark's worst single-day performance since the day the market reopened after the 9/11 terrorist attacks. Though investors were obviously rattled by the development, it was only the 22nd-biggest decline for the S&P 500® in 20 years, and it could not overshadow how well stocks performed for the 12 months overall. For much of the past year, investors grew confident that the economy would not fall into a recession, and they bid up most broad-based stock indexes for six consecutive months from August through January. Overall for the year ending February 28, 2007, the S&P 500 was up 11.97%, the Dow advanced 14.24%, the small-cap Russell 2000® Index gained 9.87% and the NASDAQ Composite® Index rose 6.66%.
During the past year, the fund returned 7.05%, topping the 5.19% return of the Morgan Stanley Capital InternationalSM (MSCI®) US Investable Market Information Technology Index and also beating the 5.33% advance of a blended index specific to this fund. This blended index is a combination of the Goldman Sachs® Technology Index, which the fund was compared with through September, and the new MSCI benchmark mentioned above, which the fund was compared with during the period's final five months1. During the same 12-month period, the fund fell short of the S&P 500. For the first seven months of the review period, the fund trailed the Goldman Sachs index in part due to stock picking in the electrical components and equipment industry. Unfavorable stock selection and an overweighting in semiconductors also were counterproductive, as was an underweighted exposure to the strong performing systems software group. My picks in computer hardware further held back the fund's performance. Conversely, stock selection helped in Internet software and services and in electronic manufacturing services. Among individual holdings, the share price of solar panel maker Evergreen Solar - an out-of-index position - took a hit amid the general rotation away from stocks in the higher-risk segments of the market. Underweighting a pair of large-cap index components that performed relatively well - software giant Microsoft and computer/printer maker Hewlett-Packard - further undermined our results. On the other hand, targeted Internet advertising provider Google boosted performance, as the company continued to deliver strong earnings growth and gain market share. During the final five months of the period, the fund outdistanced the MSCI index, paced by strong stock selection in semiconductors, communications equipment and technology distributors. Underweighting systems software also was beneficial during this stretch. Owning a small position in weak performing index component Motorola, a maker of wireless handsets, turned out to be a good decision. Also aiding our results was Canadian stock Research In Motion, known for its BlackBerry products and the fund's largest holding at period end. A successful launch of the company's new handheld messaging device, the Pearl, boosted its share price. Electronic parts distributor Arrow Electronics further aided our results, as the company's business fundamentals reaccelerated. Among the factors that dampened the fund's gains, unrewarding stock selection in computer storage and peripherals stood out, along with a large overweighting in semiconductors. Within the former group, SanDisk, a maker of flash memory, fared poorly, as weak pricing and analyst downgrades sidetracked the stock. Underweighting networking gear maker and major index component Cisco Systems detracted as well. Some stocks mentioned in this report were sold by period end.
1 The fund's blended index is a customized index developed by Fidelity for the limited purpose of discussing the fund's performance for the 12-month period ending February 28, 2007. From March 1, 2006, through September 30, 2006, the fund compared its performance to the Goldman Sachs Technology Index, which returned -0.35% during that period. On October 1, 2006, the fund began comparing its performance to a different index, the MSCI US Investable Market Information Technology Index, which returned 5.70% from October 1, 2006, through February 28, 2007. For the 12-month period ending February 28, 2007, the blended index (Goldman Sachs and MSCI) returned 5.33%.
Note to shareholders: Charlie Chai became manager of the fund on January 4, 2007.
The views expressed above reflect those of the portfolio manager(s) only through the end of the period as stated on the cover of this report and do not necessarily represent the views of Fidelity or any other person in the Fidelity organization. Any such views are subject to change at any time based upon market or other conditions and Fidelity disclaims any responsibility to update such views. These views may not be relied on as investment advice and, because investment decisions for a Fidelity fund are based on numerous factors, may not be relied on as an indication of trading intent on behalf of any Fidelity fund.
Annual Report
Select Technology Portfolio
Investment Changes
Top Ten Stocks as of February 28, 2007 | ||
% of fund's | % of fund's net assets | |
Research In Motion Ltd. | 6.2 | 0.0 |
QUALCOMM, Inc. | 5.7 | 3.1 |
Cisco Systems, Inc. | 5.7 | 0.0 |
Google, Inc. Class A (sub. vtg.) | 4.9 | 6.5 |
Apple, Inc. | 4.6 | 3.1 |
Maxim Integrated Products, Inc. | 3.1 | 2.6 |
Intel Corp. | 2.9 | 5.8 |
SanDisk Corp. | 2.8 | 0.0 |
Broadcom Corp. Class A | 2.7 | 1.2 |
Arrow Electronics, Inc. | 2.3 | 1.6 |
40.9 | ||
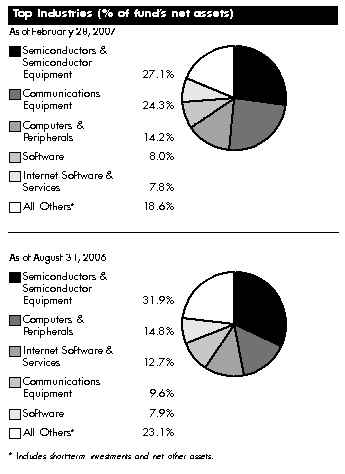
Annual Report
Select Technology Portfolio
Investments February 28, 2007
Showing Percentage of Net Assets
Common Stocks - 98.7% | |||
Shares | Value | ||
AUTO COMPONENTS - 0.3% | |||
Auto Parts & Equipment - 0.3% | |||
Fuel Systems Solutions, Inc. (a) | 200,000 | $ 4,378,000 | |
COMMUNICATIONS EQUIPMENT - 24.3% | |||
Communications Equipment - 24.3% | |||
Acme Packet, Inc. | 201,000 | 3,338,610 | |
ADC Telecommunications, Inc. (a)(d) | 425,800 | 6,991,636 | |
Adtran, Inc. | 120,000 | 2,763,600 | |
Alcatel-Lucent SA sponsored ADR | 984,000 | 12,624,720 | |
Andrew Corp. (a) | 468,500 | 4,975,470 | |
Arris Group, Inc. (a) | 200,000 | 2,628,000 | |
Balda AG | 7,100 | 94,428 | |
Cisco Systems, Inc. (a) | 3,729,300 | 96,738,042 | |
Comtech Group, Inc. (a) | 100,000 | 1,485,000 | |
Comverse Technology, Inc. (a) | 845,100 | 18,575,298 | |
Corning, Inc. (a) | 396,100 | 8,171,543 | |
ECI Telecom Ltd. (a) | 217,400 | 1,743,548 | |
F5 Networks, Inc. (a) | 229,700 | 16,680,814 | |
Finisar Corp. (a) | 1,549,400 | 4,942,586 | |
Harris Stratex Networks, Inc. (a) | 127,100 | 2,592,840 | |
Juniper Networks, Inc. (a) | 1,000,000 | 18,910,000 | |
Opnext, Inc. | 85,300 | 1,437,305 | |
QUALCOMM, Inc. | 2,415,800 | 97,308,424 | |
Research In Motion Ltd. (a) | 747,500 | 105,105,976 | |
Riverbed Technology, Inc. | 141,200 | 4,494,396 | |
411,602,236 | |||
COMPUTERS & PERIPHERALS - 14.2% | |||
Computer Hardware - 7.9% | |||
Apple, Inc. (a) | 918,600 | 77,722,746 | |
Hewlett-Packard Co. | 776,600 | 30,582,508 | |
Palm, Inc. | 444,200 | 7,351,510 | |
Sun Microsystems, Inc. (a) | 2,989,600 | 18,326,248 | |
133,983,012 | |||
Computer Storage & Peripherals - 6.3% | |||
EMC Corp. (a) | 1,472,500 | 20,541,375 | |
Hypercom Corp. (a) | 450,000 | 2,551,500 | |
Network Appliance, Inc. (a) | 238,400 | 9,218,928 | |
QLogic Corp. | 852,400 | 14,993,716 | |
Rackable Systems, Inc. (a) | 200,000 | 3,482,000 | |
SanDisk Corp. (a) | 1,322,836 | 48,177,687 | |
Seagate Technology | 25,000 | 672,500 | |
SimpleTech, Inc. (a) | 580,325 | 5,002,402 | |
TPV Technology Ltd. | 3,000,000 | 1,793,154 | |
106,433,262 | |||
TOTAL COMPUTERS & PERIPHERALS | 240,416,274 | ||
Shares | Value | ||
DIVERSIFIED CONSUMER SERVICES - 2.0% | |||
Education Services - 2.0% | |||
Apollo Group, Inc. Class A (non-vtg.) (a) | 467,500 | $ 22,108,075 | |
New Oriental Education & Technology Group, Inc. sponsored ADR | 291,200 | 12,265,344 | |
34,373,419 | |||
DIVERSIFIED TELECOMMUNICATION SERVICES - 0.0% | |||
Integrated Telecommunication Services - 0.0% | |||
NeuStar, Inc. Class A (a) | 27,100 | 867,200 | |
ELECTRICAL EQUIPMENT - 3.7% | |||
Electrical Components & Equipment - 3.6% | |||
Energy Conversion Devices, Inc. (a)(d) | 100,000 | 3,010,000 | |
Evergreen Solar, Inc. (a)(d) | 1,756,700 | 17,391,330 | |
SolarWorld AG (d) | 467,500 | 33,766,797 | |
Suntech Power Holdings Co. Ltd. sponsored ADR (a)(d) | 175,000 | 6,343,750 | |
60,511,877 | |||
Heavy Electrical Equipment - 0.1% | |||
Suzlon Energy Ltd. | 100,000 | 2,364,028 | |
TOTAL ELECTRICAL EQUIPMENT | 62,875,905 | ||
ELECTRONIC EQUIPMENT & INSTRUMENTS - 6.5% | |||
Electronic Equipment & Instruments - 1.0% | |||
Amphenol Corp. Class A | 75,000 | 4,840,500 | |
Cogent, Inc. (a) | 20,992 | 237,000 | |
Motech Industries, Inc. | 762,763 | 11,120,400 | |
Tektronix, Inc. | 61,400 | 1,756,654 | |
17,954,554 | |||
Electronic Manufacturing Services - 1.3% | |||
Hon Hai Precision Industry Co. Ltd. (Foxconn) | 2,338,965 | 15,717,418 | |
Jabil Circuit, Inc. | 132,500 | 3,540,400 | |
Molex, Inc. | 50,000 | 1,466,500 | |
TTM Technologies, Inc. (a) | 80,200 | 909,468 | |
21,633,786 | |||
Technology Distributors - 4.2% | |||
Arrow Electronics, Inc. (a) | 1,034,019 | 39,623,608 | |
Avnet, Inc. (a) | 600,000 | 21,942,000 | |
Brightpoint, Inc. (a) | 701,400 | 8,465,898 | |
Mellanox Technologies Ltd. | 1,900 | 40,698 | |
Wolfson Microelectronics PLC (a) | 200,000 | 1,172,747 | |
71,244,951 | |||
TOTAL ELECTRONIC EQUIPMENT & INSTRUMENTS | 110,833,291 | ||
Common Stocks - continued | |||
Shares | Value | ||
HOTELS, RESTAURANTS & LEISURE - 0.5% | |||
Hotels, Resorts & Cruise Lines - 0.5% | |||
Ctrip.com International Ltd. sponsored ADR | 119,200 | $ 7,033,992 | |
eLong, Inc. sponsored ADR (a) | 150,000 | 1,866,000 | |
8,899,992 | |||
HOUSEHOLD DURABLES - 0.1% | |||
Consumer Electronics - 0.1% | |||
Garmin Ltd. | 46,200 | 2,529,912 | |
INTERNET SOFTWARE & SERVICES - 7.8% | |||
Internet Software & Services - 7.8% | |||
aQuantive, Inc. (a) | 130,700 | 3,311,938 | |
CNET Networks, Inc. (a) | 500,000 | 4,390,000 | |
Equinix, Inc. (a)(d) | 80,400 | 6,646,668 | |
Google, Inc. Class A (sub. vtg.) (a) | 185,200 | 83,238,140 | |
LoopNet, Inc. | 150,000 | 2,515,500 | |
Omniture, Inc. | 12,300 | 191,265 | |
Openwave Systems, Inc. (a) | 740,510 | 6,042,562 | |
Switch & Data Facilities Co., Inc. | 5,900 | 114,932 | |
WebSideStory, Inc. (a) | 55,374 | 703,250 | |
Yahoo!, Inc. (a) | 803,200 | 24,786,752 | |
131,941,007 | |||
IT SERVICES - 3.4% | |||
Data Processing & Outsourced Services - 2.0% | |||
First Data Corp. | 322,900 | 8,243,637 | |
Paychex, Inc. | 165,100 | 6,708,013 | |
The Western Union Co. | 888,300 | 19,249,461 | |
34,201,111 | |||
IT Consulting & Other Services - 1.4% | |||
Cognizant Technology Solutions Corp. Class A (a) | 119,200 | 10,751,840 | |
HCL Technologies Ltd. | 250,000 | 3,406,952 | |
Isilon Systems, Inc. | 69,700 | 1,357,059 | |
Satyam Computer Services Ltd. sponsored ADR (d) | 381,400 | 8,222,984 | |
23,738,835 | |||
TOTAL IT SERVICES | 57,939,946 | ||
MEDIA - 0.8% | |||
Advertising - 0.5% | |||
Focus Media Holding Ltd. ADR (a) | 108,100 | 8,658,810 | |
Publishing - 0.3% | |||
Gemstar-TV Guide International, Inc. (a) | 9,503 | 38,487 | |
Getty Images, Inc. (a) | 100,000 | 5,245,000 | |
5,283,487 | |||
TOTAL MEDIA | 13,942,297 | ||
Shares | Value | ||
SEMICONDUCTORS & SEMICONDUCTOR EQUIPMENT - 27.1% | |||
Semiconductor Equipment - 4.4% | |||
Applied Materials, Inc. | 1,090,538 | $ 20,251,291 | |
ASML Holding NV (NY Shares) (a) | 250,000 | 6,145,000 | |
Cohu, Inc. | 125,000 | 2,330,000 | |
Cymer, Inc. (a) | 116,700 | 4,850,052 | |
FormFactor, Inc. (a) | 93,200 | 3,984,300 | |
Lam Research Corp. (a) | 286,000 | 12,772,760 | |
MEMC Electronic Materials, Inc. (a) | 194,700 | 10,040,679 | |
MKS Instruments, Inc. (a) | 175,000 | 4,221,000 | |
Varian Semiconductor Equipment Associates, Inc. (a) | 194,700 | 9,304,713 | |
73,899,795 | |||
Semiconductors - 22.7% | |||
Advanced Analogic Technologies, Inc. (a) | 94,101 | 610,715 | |
Advanced Micro Devices, Inc. (a) | 686,000 | 10,331,160 | |
Altera Corp. (a) | 667,500 | 14,090,925 | |
AMIS Holdings, Inc. (a) | 146,200 | 1,656,446 | |
ARM Holdings PLC sponsored ADR | 1,206,500 | 9,084,945 | |
Atmel Corp. (a) | 1,494,522 | 8,279,652 | |
Broadcom Corp. Class A (a) | 1,330,900 | 45,370,381 | |
Conexant Systems, Inc. (a) | 2,776,700 | 5,525,633 | |
CSR PLC (a) | 691,300 | 9,791,106 | |
Diodes, Inc. (a) | 48,100 | 1,805,674 | |
Fairchild Semiconductor International, Inc. (a) | 96,400 | 1,803,644 | |
Hittite Microwave Corp. (a) | 154,300 | 6,471,342 | |
Infineon Technologies AG sponsored ADR (a) | 112,600 | 1,725,032 | |
Integrated Device Technology, Inc. (a) | 294,800 | 4,781,656 | |
Intel Corp. | 2,495,400 | 49,533,690 | |
Linear Technology Corp. | 333,700 | 11,075,503 | |
LSI Logic Corp. (a) | 1,538,200 | 15,597,348 | |
Marvell Technology Group Ltd. (a) | 1,590,000 | 32,626,800 | |
Maxim Integrated Products, Inc. | 1,589,400 | 52,052,850 | |
Micrel, Inc. (a) | 147,500 | 1,719,850 | |
Microchip Technology, Inc. | 243,900 | 8,682,840 | |
Microsemi Corp. (a) | 78,160 | 1,583,522 | |
Mindspeed Technologies, Inc. (a) | 1,546,800 | 3,758,724 | |
National Semiconductor Corp. | 1,523,700 | 39,037,194 | |
Netlogic Microsystems, Inc. (a) | 1 | 25 | |
Omnivision Technologies, Inc. (a) | 67,500 | 874,800 | |
Qimonda AG Sponsored ADR | 60,300 | 876,762 | |
Richtek Technology Corp. | 185,000 | 1,733,347 | |
Samsung Electronics Co. Ltd. | 28,600 | 17,219,221 | |
Siliconware Precision Industries Co. Ltd. sponsored ADR | 500,000 | 4,540,000 | |
SiRF Technology Holdings, Inc. (a) | 143,200 | 4,094,088 | |
Supertex, Inc. (a) | 43,700 | 1,793,885 | |
Taiwan Semiconductor Manufacturing Co. Ltd. sponsored ADR (d) | 1,178,285 | 13,078,964 | |
Common Stocks - continued | |||
Shares | Value | ||
SEMICONDUCTORS & SEMICONDUCTOR EQUIPMENT - CONTINUED | |||
Semiconductors - continued | |||
Vimicro International Corp. sponsored ADR (a) | 421,600 | $ 2,904,824 | |
Zoran Corp. (a) | 101,900 | 1,678,293 | |
385,790,841 | |||
TOTAL SEMICONDUCTORS & SEMICONDUCTOR EQUIPMENT | 459,690,636 | ||
SOFTWARE - 8.0% | |||
Application Software - 5.0% | |||
Adobe Systems, Inc. (a) | 618,300 | 24,268,275 | |
Amdocs Ltd. (a) | 254,500 | 8,808,245 | |
Ansys, Inc. (a) | 169,500 | 8,647,890 | |
Autonomy Corp. PLC (a) | 500,000 | 6,069,996 | |
Hyperion Solutions Corp. (a) | 194,700 | 8,340,948 | |
Intuit, Inc. (a) | 559,000 | 16,496,090 | |
NAVTEQ Corp. (a) | 100,000 | 3,196,000 | |
Nuance Communications, Inc. (a) | 123,100 | 1,734,479 | |
Opsware, Inc. (a) | 8,600 | 63,468 | |
Salesforce.com, Inc. (a) | 141,300 | 6,112,638 | |
Ulticom, Inc. (a) | 62,400 | 542,880 | |
84,280,909 | |||
Home Entertainment Software - 2.5% | |||
Electronic Arts, Inc. (a) | 325,700 | 16,421,794 | |
Nintendo Co. Ltd. | 76,900 | 20,335,423 | |
THQ, Inc. (a) | 150,000 | 4,831,500 | |
41,588,717 | |||
Systems Software - 0.5% | |||
Double-Take Software, Inc. | 179,737 | 2,537,886 | |
Sandvine Corp. | 2,000,000 | 4,557,408 | |
Utimaco Safeware AG | 125,000 | 2,152,098 | |
9,247,392 | |||
TOTAL SOFTWARE | 135,117,018 | ||
TOTAL COMMON STOCKS (Cost $1,600,535,820) | 1,675,407,133 | ||
Convertible Preferred Stocks - 0.0% | |||
Shares | Value | ||
COMMUNICATIONS EQUIPMENT - 0.0% | |||
Communications Equipment - 0.0% | |||
Chorum Technologies, Inc. Series E (a)(e) | 33,100 | $ 0 | |
Money Market Funds - 4.0% | |||
Fidelity Securities Lending Cash Central Fund, 5.34% (b)(c) | 67,232,090 | 67,232,090 | |
TOTAL INVESTMENT PORTFOLIO - 102.7% (Cost $1,668,264,472) | 1,742,639,223 | ||
NET OTHER ASSETS - (2.7)% | (46,250,360) | ||
NET ASSETS - 100% | $ 1,696,388,863 | ||
Legend |
(a) Non-income producing |
(b) Affiliated fund that is available only to investment companies and other accounts managed by Fidelity Investments. The rate quoted is the annualized seven-day yield of the fund at period end. A complete unaudited listing of the fund's holdings as of its most recent quarter end is available upon request. |
(c) Investment made with cash collateral received from securities on loan. |
(d) Security or a portion of the security is on loan at period end. |
(e) Restricted securities - Investment in securities not registered under the Securities Act of 1933 (excluding 144A issues). At the end of the period, the value of restricted securities (excluding 144A issues) amounted to $0 or 0.0% of net assets. |
Additional information on each holding is as follows: |
Security | Acquisition Date | Acquisition Cost |
Chorum Technologies, Inc. Series E | 9/19/00 | $ 496,562 |
Affiliated Central Funds |
Information regarding fiscal year to date income earned by the Fund from investments in Fidelity Central Funds is as follows: |
Fund | Income earned |
Fidelity Cash Central Fund | $ 2,896,595 |
Fidelity Securities Lending Cash Central Fund | 809,120 |
Total | $ 3,705,715 |
Other Information |
Distribution of investments by country of issue, as a percentage of total net assets, is as follows: |
United States of America | 77.8% |
Canada | 6.5% |
Taiwan | 2.7% |
Germany | 2.3% |
United Kingdom | 2.1% |
Bermuda | 2.0% |
Cayman Islands | 1.9% |
Japan | 1.2% |
Korea (South) | 1.0% |
Others (individually less than 1%) | 2.5% |
100.0% |
Income Tax Information |
At February 28, 2007, the fund had a capital loss carryforward of approximately $2,499,857,819 of which $1,721,407,331 and $778,450,488 will expire on February 28, 2010 and 2011, respectively. |
The fund intends to elect to defer to its fiscal year ending February 29, 2008 approximately $18,772,000 of losses recognized during the period November 1, 2006 to February 28, 2007. |
See accompanying notes which are an integral part of the financial statements.
Annual Report
Select Technnology Portfolio
Financial Statements
Statement of Assets and Liabilities
February 28, 2007 | ||
Assets | ||
Investment in securities, at value (including securities loaned of $67,812,083) - See accompanying schedule: Unaffiliated issuers (cost $1,601,032,382) | $ 1,675,407,133 | |
Fidelity Central Funds (cost $67,232,090) | 67,232,090 | |
Total Investments (cost $1,668,264,472) | $ 1,742,639,223 | |
Receivable for investments sold | 64,004,362 | |
Receivable for fund shares sold | 1,928,171 | |
Dividends receivable | 1,203,501 | |
Distributions receivable from Fidelity Central Funds | 14,673 | |
Prepaid expenses | 6,579 | |
Other receivables | 79,264 | |
Total assets | 1,809,875,773 | |
Liabilities | ||
Payable to custodian bank | $ 4,474,690 | |
Payable for investments purchased | 33,484,972 | |
Payable for fund shares redeemed | 6,787,545 | |
Accrued management fee | 819,362 | |
Other affiliated payables | 480,331 | |
Other payables and accrued expenses | 207,920 | |
Collateral on securities loaned, at value | 67,232,090 | |
Total liabilities | 113,486,910 | |
Net Assets | $ 1,696,388,863 | |
Net Assets consist of: | ||
Paid in capital | $ 4,143,056,672 | |
Distributions in excess of net investment income | (1,582) | |
Accumulated undistributed net realized gain (loss) on investments and foreign currency transactions | (2,520,994,165) | |
Net unrealized appreciation (depreciation) on investments and assets and liabilities in foreign currencies | 74,327,938 | |
Net Assets, for 24,289,426 shares outstanding | $ 1,696,388,863 | |
Net Asset Value, offering price and redemption price per share ($1,696,388,863 ÷ 24,289,426 shares) | $ 69.84 | |
Statement of Operations
Year ended February 28, 2007 | ||
Investment Income | ||
Dividends | $ 8,501,592 | |
Interest | 87,858 | |
Income from Fidelity Central Funds (including $809,120 from security lending) | 3,705,715 | |
Total income | 12,295,165 | |
Expenses | ||
Management fee | $ 9,811,688 | |
Transfer agent fees | 5,625,698 | |
Accounting and security lending fees | 629,337 | |
Custodian fees and expenses | 247,419 | |
Independent trustees' compensation | 6,397 | |
Registration fees | 47,680 | |
Audit | 48,909 | |
Legal | 32,302 | |
Interest | 4,193 | |
Miscellaneous | 131,767 | |
Total expenses before reductions | 16,585,390 | |
Expense reductions | (153,515) | 16,431,875 |
Net investment income (loss) | (4,136,710) | |
Realized and Unrealized Gain (Loss) Net realized gain (loss) on: | ||
Investment securities: | ||
Unaffiliated issuers (net of foreign taxes of $613,610) | 114,665,293 | |
Foreign currency transactions | (284,781) | |
Total net realized gain (loss) | 114,380,512 | |
Change in net unrealized appreciation (depreciation) on: Investment securities (net of decrease in deferred foreign taxes of $234,153) | (848,548) | |
Assets and liabilities in foreign currencies | (5,074) | |
Total change in net unrealized appreciation (depreciation) | (853,622) | |
Net gain (loss) | 113,526,890 | |
Net increase (decrease) in net assets resulting from operations | $ 109,390,180 | |
See accompanying notes which are an integral part of the financial statements.
Annual Report
Select Technnology Portfolio
Financial Statements - continued
Statement of Changes in Net Assets
Year ended | Year ended | |
Increase (Decrease) in Net Assets | ||
Operations | ||
Net investment income (loss) | $ (4,136,710) | $ (8,274,738) |
Net realized gain (loss) | 114,380,512 | 159,248,895 |
Change in net unrealized appreciation (depreciation) | (853,622) | 78,145,959 |
Net increase (decrease) in net assets resulting from operations | 109,390,180 | 229,120,116 |
Share transactions | 329,179,074 | 453,428,844 |
Cost of shares redeemed | (665,608,727) | (713,469,270) |
Net increase (decrease) in net assets resulting from share transactions | (336,429,653) | (260,040,426) |
Redemption fees | 112,006 | 219,628 |
Total increase (decrease) in net assets | (226,927,467) | (30,700,682) |
Net Assets | ||
Beginning of period | 1,923,316,330 | 1,954,017,012 |
End of period (including distributions in excess of net investment income of $1,582 and distributions in excess of net investment income of $2,084, respectively) | $ 1,696,388,863 | $ 1,923,316,330 |
Other Information Shares | ||
Sold | 5,002,429 | 7,377,352 |
Redeemed | (10,193,730) | (11,808,572) |
Net increase (decrease) | (5,191,301) | (4,431,220) |
Financial Highlights
Years ended February 28, | 2007 | 2006 | 2005 | 2004 H | 2003 |
Selected Per-Share Data | |||||
Net asset value, beginning of period | $ 65.24 | $ 57.62 | $ 61.94 | $ 38.44 | $ 52.07 |
Income from Investment Operations | |||||
Net investment income (loss) C | (.15) | (.27) | .11 F | (.42) | (.37) |
Net realized and unrealized gain (loss) | 4.75 | 7.88 | (4.28) | 23.91 | (13.28) |
Total from investment operations | 4.60 | 7.61 | (4.17) | 23.49 | (13.65) |
Distributions from net investment income | - | - | (.16) | - | - |
Redemption fees added to paid in capital C | - I | .01 | .01 | .01 | .02 |
Net asset value, end of period | $ 69.84 | $ 65.24 | $ 57.62 | $ 61.94 | $ 38.44 |
Total Return A, B | 7.05% | 13.22% | (6.73)% | 61.13% | (26.18)% |
Ratios to Average Net Assets D, G | |||||
Expenses before reductions | .95% | .99% | 1.01% | 1.19% | 1.39% |
Expenses net of fee waivers, if any | .95% | .99% | 1.01% | 1.19% | 1.39% |
Expenses net of all reductions | .95% | .93% | .94% | 1.14% | 1.22% |
Net investment income (loss) | (.24)% | (.44)% | .20% F | (.80)% | (.86)% |
Supplemental Data | |||||
Net assets, end of period (000 omitted) | $ 1,696,389 | $ 1,923,316 | $ 1,954,017 | $ 2,599,172 | $ 1,484,150 |
Portfolio turnover rate E | 113% | 100% | 104% | 127% | 153% |
A Total returns would have been lower had certain expenses not been reduced during the periods shown.
B Total returns do not include the effect of the former sales charges.
C Calculated based on average shares outstanding during the period.
D Fees and expenses of the underlying Fidelity Central Funds are not included in the Fund's expense ratio. The Fund indirectly bears its proportionate share of the expenses of any underlying Fidelity Central Funds.
E Amount does not include the portfolio activity of any underlying Fidelity Central Funds.
F Investment income per share reflects a special dividend which amounted to $.48 per share. Excluding the special dividend, the ratio of net investment income (loss) to average net assets would have been (.65)%.
G Expense ratios reflect operating expenses of the Fund. Expenses before reductions do not reflect amounts reimbursed by the investment adviser or reductions from brokerage service arrangements or other expense offset arrangements and do not represent the amount paid by the Fund during periods when reimbursements or reductions occur. Expenses net of fee waivers reflect expenses after reimbursement by the investment adviser but prior to reductions from brokerage service arrangements or other expense offset arrangements. Expenses net of all reductions represent the net expenses paid by the Fund.
H For the year ended February 29.
I Amount represents less than $.01 per share.
See accompanying notes which are an integral part of the financial statements.
Annual Report
Notes to Financial Statements
For the period ended February 28, 2007
1. Organization.
Communications Equipment Portfolio (formerly Developing Communications Portfolio), Computers Portfolio, Electronics Portfolio, IT Services Portfolio (formerly Business Services and Outsourcing Portfolio), Networking and Infrastructure Portfolio, Software and Computer Services Portfolio, and Technology Portfolio (the Funds) are non-diversified funds of Fidelity Select Portfolios (the trust). The trust is registered under the Investment Company Act of 1940, as amended (the 1940 Act), as an open-end management investment company organized as a Massachusetts business trust. The Funds invest primarily in securities of companies whose principal business activities fall within specific industries. Each Fund is authorized to issue an unlimited number of shares. Certain Fund's investments in emerging markets can be subject to social, economic, regulatory, and political uncertainties and can be extremely volatile. The financial statements have been prepared in conformity with accounting principles generally accepted in the United States of America, which require management to make certain estimates and assumptions at the date of the financial statements.
2. Investments in Fidelity Central Funds.
The Funds may invest in Fidelity Central Funds which are open-end investment companies available only to other investment companies and accounts managed by Fidelity Management & Research Company (FMR) and its affiliates. The Funds' Schedule of Investments lists each of the Fidelity Central Funds as an investment of each Fund but does not include the underlying holdings of each Fidelity Central Fund. As an Investing Fund, the Funds indirectly bear their proportionate share of the expenses of the underlying Fidelity Central Funds. A complete unaudited list of holdings for each Fidelity Central Fund is available upon request. In addition, the financial statements of the Fidelity Central Funds, which are not covered by the Funds' Report of Independent Registered Public Accounting Firm, are available on the EDGAR Database on the SEC's web site, www.sec.gov, or upon request.
The Money Market Central Funds seek preservation of capital and current income and are managed by Fidelity Investments Money Management, Inc. (FIMM) an affiliate of FMR.
3. Significant Accounting Policies.
The following summarizes the significant accounting policies of the Funds:
Security Valuation. Investments are valued and net asset value (NAV) per share is calculated (NAV calculation) as of the close of business of the New York Stock Exchange (NYSE), normally 4:00 p.m. Eastern time. During the period each Fund also calculated a NAV each hour on the hour (commencing at 10:00 a.m. Eastern time until one hour prior to the close of business on the NYSE). Effective October 1, 2006 each Fund eliminated hourly NAV calculation. Wherever possible, each Fund uses independent pricing services approved by the Board of Trustees to value their investments.
Equity securities, including restricted securities, for which market quotations are readily available, are valued at the last reported sale price or official closing price as reported by an independent pricing service on the primary market or exchange on which they are traded. In the event there were no sales during the day or closing prices are not available, securities are valued at the last quoted bid price. Debt securities, including restricted securities, for which quotations are readily available, are valued by independent pricing services or by dealers who make markets in such securities. Pricing services consider yield or price of bonds of comparable quality, coupon, maturity and type as well as dealer supplied prices. Investments in open-end mutual funds, including the Fidelity Central Funds, are valued at their closing net asset value each business day. Short-term securities with remaining maturities of sixty days or less for which quotations are not readily available are valued at amortized cost, which approximates value.
When current market prices or quotations are not readily available or do not accurately reflect fair value, valuations may be determined in accordance with procedures adopted by the Board of Trustees. For example, when developments occur between the close of a market and the close of the NYSE that may materially affect the value of some or all of the securities, or when trading in a security is halted, those securities may be fair valued. Factors used in the determination of fair value may include monitoring news to identify significant market or security specific events such as changes in the value of U.S. securities markets, reviewing developments in foreign markets and evaluating the performance of ADRs, futures contracts and exchange-traded funds. Because each Fund's utilization of fair value pricing depends on market activity, the frequency with which fair value pricing is used cannot be predicted and may be utilized to a significant extent. The value of securities used for NAV calculation under fair value pricing may differ from published prices for the same securities.
Foreign Currency. Certain Funds may use foreign currency contracts to facilitate transactions in foreign-denominated securities. Losses from these transactions may arise from changes in the value of the foreign currency or if the counterparties do not perform under the contracts' terms.
Foreign-denominated assets, including investment securities, and liabilities are translated into U.S. dollars at the exchange rate at period end. Purchases and sales of investment securities, income and dividends received and expenses denominated in foreign currencies are translated into U.S. dollars at the exchange rate in effect on the transaction date.
The effects of exchange rate fluctuations on investments are included with the net realized and unrealized gain (loss) on investment securities. Other foreign currency transactions resulting in realized and unrealized gain (loss) are disclosed separately.
Annual Report
Notes to Financial Statements - continued
3. Significant Accounting Policies - continued
Investment Transactions and Income. For financial reporting purposes, the Funds' investment holdings and NAV include trades executed through the end of the last business day of the period. The NAV for processing shareholder transactions includes trades executed through the end of the prior business day. Gains and losses on securities sold are determined on the basis of identified cost and may include proceeds received from litigation. Dividend income is recorded on the ex-dividend date, except for certain dividends from foreign securities where the ex-dividend date may have passed, which are recorded as soon as the Fund is informed of the ex-dividend date. Non-cash dividends included in dividend income, if any, are recorded at the fair market value of the securities received. Distributions received on securities that represent a return of capital or capital gain are recorded as a reduction of cost of investments and/or as a realized gain. The Funds estimate the components of distributions received that may be considered return of capital distributions or capital gain distributions. Interest income and distributions from the Fidelity Central Funds are accrued as earned, with any distributions receivable as of period end included in Distributions receivable from Fidelity Central Funds on the Statement of Assets and Liabilities. Interest income includes coupon interest and amortization of premium and accretion of discount on debt securities. Investment income is recorded net of foreign taxes withheld where recovery of such taxes is uncertain.
Expenses. Most expenses of each trust can be directly attributed to a fund. Expenses which cannot be directly attributed are apportioned among each Fund in the trust. Expense estimates are accrued in the period to which they relate and adjustments are made when actual amounts are known.
Deferred Trustee Compensation. Under a Deferred Compensation Plan (the Plan) for Electronics Portfolio, Independent Trustees must defer receipt of a portion of, and may elect to defer receipt of an additional portion of, their annual compensation. Deferred amounts are invested in a cross-section of Fidelity funds, are marked-to-market and remain in the Fund until distributed in accordance with the Plan. The investment of deferred amounts and the offsetting payable to the Trustees are included in the accompanying Statement of Assets and Liabilities.
Income Tax Information and Distributions to Shareholders. Each year, each Fund intends to qualify as a regulated investment company by distributing all of its taxable income and realized gains under Subchapter M of the Internal Revenue Code. As a result, no provision for income taxes is required in the accompanying financial statements. Foreign taxes are provided for based on each Fund's understanding of the tax rules and rates that exist in the foreign markets in which it invests.
Distributions are recorded on the ex-dividend date. Income and capital gain distributions are determined in accordance with income tax regulations, which may differ from generally accepted accounting principles. In addition, certain Funds will claim a portion of the payment made to redeeming shareholders as a distribution for income tax purposes.
Capital accounts within the financial statements are adjusted for permanent book-tax differences. These adjustments have no impact on net assets or the results of operations. Temporary book-tax differences will reverse in a subsequent period.
Book-tax differences are primarily due to short-term capital gains, foreign currency transactions, certain foreign taxes, deferred trustees compensation, net operating losses, capital loss carryforwards and losses deferred due to wash sales and excise tax regulations.
The tax-basis components of distributable earnings and the federal tax cost as of period end were as follows for each Fund:
Cost for | Unrealized | Unrealized | Net Unrealized | |
Communications Equipment Portfolio | $ 378,443,027 | $ 25,311,250 | $ (58,857,075) | $ (33,545,825) |
Computers Portfolio | 461,232,267 | 27,745,751 | (23,111,599) | 4,634,152 |
Electronics Portfolio | 2,192,653,137 | 168,048,672 | (226,293,356) | (58,244,684) |
IT Services Portfolio | 34,378,925 | 5,162,025 | (743,724) | 4,418,301 |
Networking and Infrastructure Portfolio | 111,994,546 | 7,215,647 | (14,009,989) | (6,794,342) |
Software and Computer Services Portfolio | 1,004,240,031 | 104,894,174 | (31,730,346) | 73,163,828 |
Technology Portfolio | 1,670,675,385 | 176,518,302 | (104,554,464) | 71,963,838 |
Undistributed | Undistributed | Capital Loss | |
Communications Equipment Portfolio | $ - | $ - | $ (1,220,948,544) |
Computers Portfolio | - | - | (769,357,814) |
Electronics Portfolio | 510,771 | - | (2,508,602,338) |
IT Services Portfolio | - | 2,128,324 | - |
Networking and Infrastructure Portfolio | - | - | (186,635,331) |
Software and Computer Services Portfolio | - | - | (56,672,617) |
Technology Portfolio | - | - | (2,499,857,819) |
Annual Report
3. Significant Accounting Policies - continued
Income Tax Information and Distributions to Shareholders - continued
The tax character of distributions paid was as follows:
February 28, 2007 | |||
Ordinary | Long-term | Total | |
Electronics Portfolio | $ 1,472,341 | $ - | $ 1,472,341 |
IT Services Portfolio | 122,360 | 4,039,269 | 4,161,629 |
February 28, 2006 | |||
Ordinary | Long-term | Total | |
IT Services Portfolio | $ - | $ 1,570,115 | $ 1,570,115 |
Trading (Redemption) Fees. Shares in the Funds held less than 30 days are subject to a redemption fee equal to .75% of the net asset value of shares redeemed. All redemption fees, including any estimated redemption fees paid by FMR, are retained by the Funds and accounted for as an addition to paid in capital. Shareholders were also subject to an additional $7.50 fee for shares exchanged into another Fidelity fund (see Note 6).
New Accounting Pronouncements. In July 2006, Financial Accounting Standards Board Interpretation No. 48, Accounting for Uncertainty in Income Taxes - an interpretation of FASB Statement 109 (FIN 48), was issued and is effective on the last business day of the semiannual reporting period for fiscal years beginning after December 15, 2006. FIN 48 sets forth a threshold for financial statement recognition, measurement and disclosure of a tax position taken or expected to be taken on a tax return. Management is currently evaluating the impact, if any, the adoption of FIN 48 will have on the Funds' net assets, results of operations and financial statement disclosures.
In addition, in September 2006, Statement of Financial Accounting Standards No. 157, Fair Value Measurements (SFAS 157), was issued and is effective for fiscal years beginning after November 15, 2007. SFAS 157 defines fair value, establishes a framework for measuring fair value and expands disclosures about fair value measurements. Management is currently evaluating the impact the adoption of SFAS 157 will have on the Funds' financial statement disclosures.
4. Operating Policies.
Repurchase Agreements. FMR has received an Exemptive Order from the Securities and Exchange Commission (the SEC) which permits certain Funds and other affiliated entities of FMR to transfer uninvested cash balances into joint trading accounts which are then invested in repurchase agreements. Certain Funds may also invest directly with institutions in repurchase agreements. Repurchase agreements are collateralized by government or non-government securities. Upon settlement date, collateral is held in segregated accounts with custodian banks and may be obtained in the event of a default of the counterparty. Each applicable Fund monitors, on a daily basis, the value of the collateral to ensure it is at least equal to the principal amount of the repurchase agreement (including accrued interest). In the event of a default by the counterparty, realization of the collateral proceeds could be delayed, during which time the value of the collateral may decline.
Restricted Securities. Certain Funds may invest in securities that are subject to legal or contractual restrictions on resale. These securities generally may be resold in transactions exempt from registration or to the public if the securities are registered. Disposal of these securities may involve time-consuming negotiations and expense, and prompt sale at an acceptable price may be difficult. Information regarding restricted securities is included at the end of each applicable Fund's Schedule of Investments.
5. Purchases and Sales of Investments.
Purchases and sales of securities, other than short-term securities, are noted in the table below.
Purchases ($) | Sales ($) | |
Communications Equipment Portfolio | 490,165,725 | 626,958,564 |
Computers Portfolio | 979,421,948 | 1,131,647,819 |
Electronics Portfolio | 2,204,304,160 | 3,024,158,134 |
IT Services Portfolio | 76,944,339 | 84,436,065 |
Networking and Infrastructure Portfolio | 156,645,632 | 185,148,764 |
Software and Computer Services Portfolio | 1,226,673,193 | 1,004,250,076 |
Technology Portfolio | 1,910,183,710 | 2,255,198,664 |
Annual Report
Notes to Financial Statements - continued
6. Fees and Other Transactions with Affiliates.
Management Fee. FMR and its affiliates provide the Funds with investment management related services for which the Funds pay a monthly management fee. The management fee is the sum of an individual fund fee rate and a group fee rate. The individual fund fee rate is applied to each Fund's average net assets. The group fee rate is based upon the average net assets of all the mutual funds advised by FMR. The group fee rate decreases as assets under management increase and increases as assets under management decrease. For the period, each Fund's annual management fee rate expressed as a percentage of each Fund's average net assets was as follows:
Individual Rate | Group Rate | Total | |
Communications Equipment Portfolio | .30% | .26% | .56% |
Computers Portfolio | .30% | .26% | .57% |
Electronics Portfolio | .30% | .26% | .56% |
IT Services Portfolio | .30% | .26% | .57% |
Networking and Infrastructure Portfolio | .30% | .26% | .56% |
Software and Computer Services Portfolio | .30% | .26% | .57% |
Technology Portfolio | .30% | .26% | .56% |
Transfer Agent Fees. Fidelity Service Company, Inc. (FSC), an affiliate of FMR, is the Funds' transfer, dividend disbursing and shareholder servicing agent. FSC receives account fees and asset-based fees that vary according to account size and type of account. FSC pays for typesetting, printing and mailing of shareholder reports, except proxy statements. For the period, the transfer agent fees were equivalent to the following annual rates expressed as a percentage of average net assets:
Communications Equipment Portfolio | .36% |
Computers Portfolio | .35% |
Electronics Portfolio | .28% |
IT Services Portfolio | .34% |
Networking and Infrastructure Portfolio | .37% |
Software and Computer Services Portfolio | .27% |
Technology Portfolio | .32% |
Accounting and Security Lending Fees. FSC maintains each Fund's accounting records. The accounting fee is based on the level of average net assets for the month. Under a separate contract, FSC administers the security lending program. The security lending fee is based on the number and duration of lending transactions.
Exchange Fees. During the period, FSC received the proceeds of a $7.50 fee to cover administrative costs associated with exchanges out of the Funds to any other Fidelity Select fund or to any other Fidelity fund made through non-automated channels. Effective October 1, 2006, the exchange fees were eliminated. For the period, exchange fees retained by FSC were as follows:
Retained | |
Communications Equipment Portfolio | $ 6,773 |
Computers Portfolio | 7,088 |
Electronics Portfolio | 23,205 |
IT Services Portfolio | 1,890 |
Networking and Infrastructure Portfolio | 2,055 |
Software and Computer Services Portfolio | 3,608 |
Technology Portfolio | 17,933 |
Brokerage Commissions. Certain Funds placed a portion of their portfolio transactions with brokerage firms which are affiliates of the investment adviser. The commissions paid to these affiliated firms were as follows:
Amount | |
Communications Equipment Portfolio | $ 31,089 |
Computers Portfolio | 11,015 |
Electronics Portfolio | 21,840 |
IT Services Portfolio | 2,159 |
Networking and Infrastructure Portfolio | 19,868 |
Software and Computer Services Portfolio | 31,171 |
Technology Portfolio | 35,817 |
Annual Report
6. Fees and Other Transactions with Affiliates - continued
Interfund Lending Program. Pursuant to an Exemptive Order issued by the SEC, the Funds, along with other registered investment companies having management contracts with FMR, may participate in an interfund lending program. This program provides an alternative credit facility allowing the funds to borrow from, or lend money to, other participating affiliated funds. At period end, there were no interfund loans outstanding. Each applicable fund's activity in this program during the period for which loans were outstanding was as follows:
Borrower | Average Daily Loan Balance | Weighted | Interest | |
Communications Equipment Portfolio | Borrower | $ 4,567,364 | 5.29% | $ 7,382 |
Computers Portfolio | Borrower | 10,699,333 | 5.23% | 4,659 |
Electronics Portfolio | Borrower | 11,271,818 | 5.22% | 17,980 |
Software and Computer Services Portfolio | Borrower | 10,317,250 | 5.35% | 6,130 |
Technology Portfolio | Borrower | 7,001,250 | 5.39% | 4,193 |
7. Committed Line of Credit.
Certain Funds participate with other funds managed by FMR in a $4.2 billion credit facility (the "line of credit") to be utilized for temporary or emergency purposes to fund shareholder redemptions or for other short-term liquidity purposes. The participating funds have agreed to pay commitment fees on their pro rata portion of the line of credit, which is reflected in Miscellaneous Expense on the Statement of Operations, and is as follows:
Communications Equipment Portfolio | $ 1,143 |
Computers Portfolio | 1,279 |
Electronics Portfolio | 6,528 |
IT Services Portfolio | 104 |
Networking and Infrastructure Portfolio | 315 |
Software and Computer Services Portfolio | 1,786 |
Technology Portfolio | 4,720 |
During the period, there were no borrowings on this line of credit.
8. Security Lending.
Certain Funds lend portfolio securities from time to time in order to earn additional income. On the settlement date of the loan, each applicable Fund receives collateral (in the form of U.S. Treasury obligations, letters of credit and/or cash) against the loaned securities and maintains collateral in an amount not less than 100% of the market value of the loaned securities during the period of the loan. The market value of the loaned securities is determined at the close of business of the Funds and any additional required collateral is delivered to the Funds on the next business day. If the borrower defaults on its obligation to return the securities loaned because of insolvency or other reasons, a fund could experience delays and costs in recovering the securities loaned or in gaining access to the collateral. Any cash collateral received is invested in the Fidelity Securities Lending Cash Central Fund. The value of loaned securities and cash collateral at period end are disclosed on each applicable Fund's Statement of Assets and Liabilities. Security lending income represents the income earned on investing cash collateral, less fees and expenses associated with the loan, plus any premium payments that may be received on the loan of certain types of securities. Security lending income is presented on each applicable Fund's Statement of Operations as a component of income from Fidelity Central Funds.
9. Expense Reductions.
Effective January 1, 2007, FMR voluntarily agreed to reimburse funds to the extent annual operating expenses exceeded certain levels of average net assets as noted in the table below. Some expenses, for example interest expense, including commitment fees, are excluded from this reimbursement.
The following Funds were in reimbursement during the period:
Expense Limitations | Reimbursement | |
IT Services Portfolio | 1.25% - 1.15%* | $ 12,223 |
* Expense limitation in effect at period end.
Annual Report
Notes to Financial Statements - continued
9. Expense Reductions - continued
Many of the brokers with whom FMR places trades on behalf of certain Funds provided services to these Funds in addition to trade execution. These services included payments of expenses on behalf of each applicable Fund. In addition, through arrangements with each applicable Fund's custodian and transfer agent, credits realized as a result of uninvested cash balances were used to reduce each applicable Fund's expenses. All of the applicable expense reductions are noted in the table below.
Brokerage Service Arrangements | Custody | Transfer Agent | |
Communications Equipment Portfolio | $ 16,390 | $ - | $ 6,001 |
Computers Portfolio | 61,521 | - | 8,454 |
Electronics Portfolio | 404,989 | - | 36,328 |
IT Services Portfolio | 2,506 | - | - |
Networking and Infrastructure Portfolio | 3,257 | - | 1,841 |
Software and Computer Services Portfolio | 36,969 | 2,638 | 6,790 |
Technology Portfolio | 83,551 | 429 | 42,045 |
10. Other.
The Funds' organizational documents provide former and current trustees and officers with a limited indemnification against liabilities arising in connection with the performance of their duties to the Funds. In the normal course of business, the Funds may also enter into contracts that provide general indemnifications. The Funds' maximum exposure under these arrangements is unknown as this would be dependent on future claims that may be made against the Funds. The risk of material loss from such claims is considered remote.
The United States Securities and Exchange Commission ("SEC") is conducting an investigation of FMR (covering the years 2002 to 2004) arising from gifts, gratuities and business entertainment provided by certain brokers to certain individuals who were employed on FMR's domestic equity trading desk during that period. FMR is in discussions with the SEC staff regarding the possible resolution of the matter, but as of period-end no final resolution has been reached.
In December 2006, the Independent Trustees completed their own investigation of the matter with the assistance of independent counsel. The Independent Trustees and FMR agree that, despite the absence of proof that the Fidelity mutual funds experienced diminished execution quality as a result of the improper receipt of gifts and business entertainment, the conduct at issue was serious and is worthy of redress. Accordingly, the Independent Trustees have requested and FMR has agreed to pay $42 million to Fidelity mutual funds, plus interest to be determined at the time that payment is made. A method of allocating this payment among the funds has not yet been determined. The total payment to each of the Funds is not anticipated to have a material impact on such Fund's net assets. In addition, FMR reimbursed related legal expenses which are recorded in the accompanying Statement of Operations as an expense reduction.
Annual Report
Report of Independent Registered Public Accounting Firm
To the Trustees of Fidelity Select Portfolios and the Shareholders of Communications Equipment Portfolio (formerly Developing Communications Portfolio), Computers Portfolio, Electronics Portfolio, IT Services Portfolio (formerly Business Services and Outsourcing Portfolio), Networking and Infrastructure Portfolio, Software and Computer Services Portfolio, and Technology Portfolio (the Funds)
In our opinion, the accompanying statements of assets and liabilities, including the schedules of investments, and the related statements of operations and of changes in net assets and the financial highlights present fairly, in all material respects, the financial position of Communications Equipment Portfolio (formerly Developing Communications Portfolio), Computers Portfolio, Electronics Portfolio, IT Services Portfolio (formerly Business Services and Outsourcing Portfolio), Networking and Infrastructure Portfolio, Software and Computer Services Portfolio, and Technology Portfolio (funds of Fidelity Select Portfolios) at February 28, 2007, the results of each of their operations for the year then ended, the changes in each of their net assets for each of the two years in the period then ended and the financial highlights for each of the five years in the period then ended, in conformity with accounting principles generally accepted in the United States of America. These financial statements and financial highlights (hereafter referred to as "financial statements") are the responsibility of the Fidelity Select Portfolios' management; our responsibility is to express an opinion on these financial statements based on our audits. We conducted our audits of these financial statements in accordance with the standards of the Public Company Accounting Oversight Board (United States). Those standards require that we plan and perform the audit to obtain reasonable assurance about whether the financial statements are free of material misstatement. An audit includes examining, on a test basis, evidence supporting the amounts and disclosures in the financial statements, assessing the accounting principles used and significant estimates made by management, and evaluating the overall financial statement presentation. We believe that our audits, which included confirmation of securities at February 28, 2007 by correspondence with the custodian and brokers, provide a reasonable basis for our opinion.
/s/ PricewaterhouseCoopers LLP
PricewaterhouseCoopers LLP
Boston, Massachusetts
April 20, 2007
Annual Report
Trustees and Officers
The Trustees, Member of the Advisory Board, and executive officers of the trust and funds, as applicable, are listed below. The Board of Trustees governs each fund and is responsible for protecting the interests of shareholders. The Trustees are experienced executives who meet periodically throughout the year to oversee each fund's activities, review contractual arrangements with companies that provide services to each fund, and review each fund's performance. Each of the Trustees oversees 349 funds advised by FMR or an affiliate.
The Trustees hold office without limit in time except that (a) any Trustee may resign; (b) any Trustee may be removed by written instrument, signed by at least two-thirds of the number of Trustees prior to such removal; (c) any Trustee who requests to be retired or who has become incapacitated by illness or injury may be retired by written instrument signed by a majority of the other Trustees; and (d) any Trustee may be removed at any special meeting of shareholders by a two-thirds vote of the outstanding voting securities of the trust. Each Trustee who is not an interested person (as defined in the 1940 Act) (Independent Trustee), shall retire not later than the last day of the calendar year in which his or her 72nd birthday occurs. The Independent Trustees may waive this mandatory retirement age policy with respect to individual Trustees. The executive officers and Advisory Board Member hold office without limit in time, except that any officer and Advisory Board Member may resign or may be removed by a vote of a majority of the Trustees at any regular meeting or any special meeting of the Trustees. Except as indicated, each individual has held the office shown or other offices in the same company for the past five years.
The funds' Statement of Additional Information (SAI) includes more information about the Trustees. To request a free copy, call Fidelity at 1-800-544-8544.
Interested Trustees*:
Correspondence intended for each Trustee who is an interested person may be sent to Fidelity Investments, 82 Devonshire Street, Boston, Massachusetts 02109.
Name, Age; Principal Occupation | |
Edward C. Johnson 3d (76) | |
Year of Election or Appointment: 1980 Mr. Johnson is Chairman of the Board of Trustees. Mr. Johnson serves as President (2006-present), Chief Executive Officer, Chairman, and a Director of FMR Corp.; Chairman and a Director of FMR; Chairman and a Director of Fidelity Research & Analysis Company (FRAC); Chairman and a Director of Fidelity Investments Money Management, Inc.; and Chairman (2001- present) and a Director of FMR Co., Inc. In addition, Mr. Johnson serves as Chairman and Director of Fidelity International Limited (FIL). | |
Robert L. Reynolds (54) | |
Year of Election or Appointment: 2003 Mr. Reynolds is President and a Director of FMR (2005-present), Fidelity Investments Money Management, Inc. (2005-present), and FMR Co., Inc. (2005-present). Mr. Reynolds also serves as Vice Chairman (2006-present), a Director (2003-present), and Chief Operating Officer of FMR Corp. and a Director of Strategic Advisers, Inc. (2005-present). He also serves on the Board at Fidelity Investments Canada, Ltd. | |
* Trustees have been determined to be "Interested Trustees" by virtue of, among other things, their affiliation with the trust or various entities under common control with FMR.
Independent Trustees:
Correspondence intended for each Independent Trustee (that is, the Trustees other than the Interested Trustees) may be sent to Fidelity Investments, P.O. Box 55235, Boston, Massachusetts 02205-5235.
Name, Age; Principal Occupation | |
Dennis J. Dirks (58) | |
Year of Election or Appointment: 2005 Prior to his retirement in May 2003, Mr. Dirks was Chief Operating Officer and a member of the Board of The Depository Trust & Clearing Corporation (DTCC) (1999-2003). He also served as President, Chief Operating Officer, and Board member of The Depository Trust Company (DTC) (1999-2003) and President and Board member of the National Securities Clearing Corporation (NSCC) (1999-2003). In addition, Mr. Dirks served as Chief Executive Officer and Board member of the Government Securities Clearing Corporation (2001-2003) and Chief Executive Officer and Board member of the Mortgage-Backed Securities Clearing Corporation (2001-2003). Mr. Dirks also serves as a Trustee and a member of the Finance Committee of Manhattan College (2005-present) and a Trustee and a member of the Finance Committee of AHRC of Nassau County (2006-present). | |
Albert R. Gamper, Jr. (64) | |
Year of Election or Appointment: 2006 Prior to his retirement in December 2004, Mr. Gamper served as Chairman of the Board of CIT Group Inc. (commercial finance). During his tenure with CIT Group Inc. Mr. Gamper served in numerous senior management positions, including Chairman (1987-1989; 1999-2001; 2002-2004), Chief Executive Officer (1987-2004), and President (1989-2002). He currently serves as a member of the Board of Directors of Public Service Enterprise Group (utilities, 2001-present), Chairman of the Board of Governors, Rutgers University (2004-present), and Chairman of the Board of Saint Barnabas Health Care System. | |
George H. Heilmeier (70) | |
Year of Election or Appointment: 2004 Dr. Heilmeier is Chairman Emeritus of Telcordia Technologies (communication software and systems), where prior to his retirement, he served as company Chairman and Chief Executive Officer. He currently serves on the Boards of Directors of The Mitre Corporation (systems engineering and information technology support for the government), and HRL Laboratories (private research and development, 2004-present). He is Chairman of the General Motors Science & Technology Advisory Board and a Life Fellow of the Institute of Electrical and Electronics Engineers (IEEE). Dr. Heilmeier is a member of the Defense Science Board and the National Security Agency Advisory Board. He is also a member of the National Academy of Engineering, the American Academy of Arts and Sciences, and the Board of Overseers of the School of Engineering and Applied Science of the University of Pennsylvania. Previously, Dr. Heilmeier served as a Director of TRW Inc. (automotive, space, defense, and information technology, 1992-2002), Compaq (1994-2002), Automatic Data Processing, Inc. (ADP) (technology-based business outsourcing, 1995-2002), INET Technologies Inc. (telecommunications network surveillance, 2001-2004), and Teletech Holdings (customer management services). He is the recipient of the 2005 Kyoto Prize in Advanced Technology for his invention of the liquid crystal display, and a member of the Consumer Electronics Hall of Fame. | |
James H. Keyes (66) | |
Year of Election or Appointment: 2007 Prior to his retirement in 2003, Mr. Keyes was Chairman, President, and Chief Executive Officer of Johnson Controls, Inc. (automotive supplier, 1993-2003). He currently serves as a member of the boards of LSI Logic Corporation (semiconductor technologies), Navistar International Corporation (manufacture and sale of trucks, buses, and diesel engines, 2002-present), and Pitney Bowes, Inc. (integrated mail, messaging, and document management solutions). | |
Marie L. Knowles (60) | |
Year of Election or Appointment: 2001 Prior to Ms. Knowles' retirement in June 2000, she served as Executive Vice President and Chief Financial Officer of Atlantic Richfield Company (ARCO) (diversified energy, 1996-2000). From 1993 to 1996, she was a Senior Vice President of ARCO and President of ARCO Transportation Company. She served as a Director of ARCO from 1996 to 1998. She currently serves as a Director of Phelps Dodge Corporation (copper mining and manufacturing) and McKesson Corporation (healthcare service, 2002-present). Ms. Knowles is a Trustee of the Brookings Institution and the Catalina Island Conservancy and also serves as a member of the Advisory Board for the School of Engineering of the University of Southern California. | |
Ned C. Lautenbach (63) | |
Year of Election or Appointment: 2000 Mr. Lautenbach is Chairman of the Independent Trustees (2006-present). Mr. Lautenbach has been a partner of Clayton, Dubilier & Rice, Inc. (private equity investment firm) since September 1998. Previously, Mr. Lautenbach was with the International Business Machines Corporation (IBM) from 1968 until his retirement in 1998. Mr. Lautenbach serves as a Director of Sony Corporation (2006-present) and Eaton Corporation (diversified industrial) as well as the Philharmonic Center for the Arts in Naples, Florida. He also is a member of the Board of Trustees of Fairfield University (2005-present), as well as a member of the Council on Foreign Relations. | |
Cornelia M. Small (62) | |
Year of Election or Appointment: 2005 Ms. Small is a member (2000-present) and Chairperson (2002-present) of the Investment Committee, and a member (2002- present) of the Board of Trustees of Smith College. Previously, she served as Chief Investment Officer (1999-2000), Director of Global Equity Investments (1996-1999), and a member of the Board of Directors of Scudder, Stevens & Clark (1990-1997) and Scudder Kemper Investments (1997-1999). In addition, Ms. Small served as Co-Chair (2000-2003) of the Annual Fund for the Fletcher School of Law and Diplomacy. | |
William S. Stavropoulos (67) | |
Year of Election or Appointment: 2001 Mr. Stavropoulos is Chairman Emeritus of the Board of Directors of The Dow Chemical Company. Since joining The Dow Chemical Company in 1967, Mr. Stavropoulos served in numerous senior management positions, including President (1993-2000; 2002-2003), CEO (1995-2000; 2002-2004), and Chairman of the Executive Committee (2000-2004). Currently, he is a Director of NCR Corporation (data warehousing and technology solutions), Chemical Financial Corporation, Maersk Inc. (industrial conglomerate, 2002-present), Tyco International, Inc. (multinational manufacturing and services, 2007-present), and a member of the Advisory Board for Metalmark Capital (private equity investment firm, 2005-present). He is a special advisor to Clayton, Dubilier & Rice, Inc., a private equity investment firm. He also serves as a member of the Board of Trustees of the American Enterprise Institute for Public Policy Research. In addition, Mr. Stavropoulos is a member of The Business Council, J.P. Morgan International Council and the University of Notre Dame Advisory Council for the College of Science. | |
Kenneth L. Wolfe (68) | |
Year of Election or Appointment: 2005 Prior to his retirement in 2001, Mr. Wolfe was Chairman and Chief Executive Officer of Hershey Foods Corporation (1993-2001). He currently serves as a member of the boards of Adelphia Communications Corporation (2003-present), Bausch & Lomb, Inc., and Revlon Inc. (2004-present). | |
Advisory Board Member and Executive Officers:
Correspondence intended for each executive officer and Mr. Lynch may be sent to Fidelity Investments, 82 Devonshire Street, Boston, Massachusetts 02109.
Name, Age; Principal Occupation | |
Peter S. Lynch (63) | |
Year of Election or Appointment: 2003 Member of the Advisory Board of Fidelity Select Portfolios. Mr. Lynch is Vice Chairman and a Director of FMR, and Vice Chairman (2001-present) and a Director of FMR Co., Inc. Previously, Mr. Lynch served as a Trustee of the Fidelity funds (1990-2003). In addition, he serves as a Trustee of Boston College and as the Chairman of the Inner-City Scholarship Fund. | |
Kimberley H. Monasterio (43) | |
Year of Election or Appointment: 2007 President and Treasurer of Select Communications Equipment Portfolio, Select Computers Portfolio, Select Electronics Portfolio, Select IT Services Portfolio, Select Networking and Infrastructure Portfolio, Select Software and Computer Services Portfolio, and Select Technology Portfolio. Ms. Monasterio also serves as President and Treasurer of other Fidelity funds (2007-present) and is an employee of FMR (2004-present). Previously, Ms. Monasterio served as Deputy Treasurer of the Fidelity funds (2004-2006). Before joining Fidelity Investments, Ms. Monasterio served as Treasurer (2000-2004) and Chief Financial Officer (2002-2004) of the Franklin Templeton Funds and Senior Vice President of Franklin Templeton Services, LLC (2000-2004). | |
Boyce I. Greer (51) | |
Year of Election or Appointment: 2005 Vice President of Select Communications Equipment Portfolio, Select Computers Portfolio, Select Electronics Portfolio, Select IT Services Portfolio, Select Networking and Infrastructure Portfolio, Select Software and Computer Services Portfolio, and Select Technology Portfolio. Mr. Greer also serves as Vice President of certain Equity Funds (2005-present), certain Asset Allocation Funds (2005-present), Fixed-Income Funds (2006-present), and Money Market Funds (2006-present). Mr. Greer is also a Trustee of other investment companies advised by FMR (2003-present). He is an Executive Vice President of FMR (2005-present) and FMR Co., Inc. (2005-present), and Senior Vice President of Fidelity Investments Money Management, Inc. (2006-present). Previously, Mr. Greer served as a Director and Managing Director of Strategic Advisers, Inc. (2002-2005), and Executive Vice President (2000-2002) and Money Market Group Leader (1997-2002) of the Fidelity Investments Fixed Income Division. He also served as Vice President of Fidelity's Money Market Funds (1997-2002), Senior Vice President of FMR (1997-2002), and Vice President of FIMM (1998-2002). | |
Eric D. Roiter (58) | |
Year of Election or Appointment: 1998 and 2000 Secretary of Select Communications Equipment Portfolio (1998), Select Computers Portfolio (1998), Select Electronics Portfolio (1998), Select IT Services Portfolio (1998), Select Networking and Infrastructure Portfolio (2000), Select Software and Computer Services Portfolio (1998), and Select Technology Portfolio (1998). He also serves as Secretary of other Fidelity funds; Vice President, General Counsel, and Secretary of FMR Co., Inc. (2001-present) and FMR; Assistant Secretary of Fidelity Management & Research (U.K.) Inc. (2001-present), Fidelity Research & Analysis Company (2001-present), and Fidelity Investments Money Management, Inc. (2001-present). Mr. Roiter is an Adjunct Member, Faculty of Law, at Boston College Law School (2003-present). Previously, Mr. Roiter served as Vice President and Secretary of Fidelity Distributors Corporation (FDC) (1998-2005). | |
Scott C. Goebel (39) | |
Year of Election or Appointment: 2007 Assistant Secretary of Select Communications Equipment Portfolio, Select Computers Portfolio, Select Electronics Portfolio, Select IT Services Portfolio, Select Networking and Infrastructure Portfolio, Select Software and Computer Services Portfolio, and Select Technology Portfolio. Mr. Goebel also serves as Assistant Secretary of other Fidelity funds (2007-present), Vice President and Secretary of FDC (2006-present), and is an employee of FMR. | |
R. Stephen Ganis (40) | |
Year of Election or Appointment: 2006 Anti-Money Laundering (AML) officer of Select Communications Equipment Portfolio, Select Computers Portfolio, Select Electronics Portfolio, Select IT Services Portfolio, Select Networking and Infrastructure Portfolio, Select Software and Computer Services Portfolio, and Select Technology Portfolio. Mr. Ganis also serves as AML officer of other Fidelity funds (2006-present) and FMR Corp. (2003-present). Before joining Fidelity Investments, Mr. Ganis practiced law at Goodwin Procter, LLP (2000-2002). | |
Joseph B. Hollis (58) | |
Year of Election or Appointment: 2006 Chief Financial Officer of Select Communications Equipment Portfolio, Select Computers Portfolio, Select Electronics Portfolio, Select IT Services Portfolio, Select Networking and Infrastructure Portfolio, Select Software and Computer Services Portfolio, and Select Technology Portfolio. Mr. Hollis also serves as Chief Financial Officer of other Fidelity funds. Mr. Hollis is President of Fidelity Pricing and Cash Management Services (FPCMS) (2005-present). Mr. Hollis also serves as President and Director of Fidelity Service Company, Inc. (2006-present). Previously, Mr. Hollis served as Senior Vice President of Cash Management Services (1999-2002) and Investment Management Operations (2002-2005). | |
Kenneth A. Rathgeber (59) | |
Year of Election or Appointment: 2004 Chief Compliance Officer of Select Communications Equipment Portfolio, Select Computers Portfolio, Select Electronics Portfolio, Select IT Services Portfolio, Select Networking and Infrastructure Portfolio, Select Software and Computer Services Portfolio, and Select Technology Portfolio. Mr. Rathgeber also serves as Chief Compliance Officer of other Fidelity funds (2004-present) and Executive Vice President of Risk Oversight for Fidelity Investments (2002-present). He is Chief Compliance Officer of FMR (2005-present), FMR Co., Inc. (2005-present), Fidelity Management & Research (U.K.) Inc. (2005-present), Fidelity Research & Analysis Company (2005-present), Fidelity Investments Money Management, Inc. (2005-present), and Strategic Advisers, Inc. (2005-present). Previously, Mr. Rathgeber served as Executive Vice President and Chief Operating Officer for Fidelity Investments Institutional Services Company, Inc. (1998-2002). | |
Bryan A. Mehrmann (45) | |
Year of Election or Appointment: 2005 Deputy Treasurer of Select Communications Equipment Portfolio, Select Computers Portfolio, Select Electronics Portfolio, Select IT Services Portfolio, Select Networking and Infrastructure Portfolio, Select Software and Computer Services Portfolio, and Select Technology Portfolio. Mr. Mehrmann also serves as Deputy Treasurer of other Fidelity funds (2005-present) and is an employee of FMR. Previously, Mr. Mehrmann served as Vice President of Fidelity Investments Institutional Services Group (FIIS)/Fidelity Investments Institutional Operations Corporation, Inc. (FIIOC) Client Services (1998-2004). | |
Kenneth B. Robins (37) | |
Year of Election or Appointment: 2005 Deputy Treasurer of Select Communications Equipment Portfolio, Select Computers Portfolio, Select Electronics Portfolio, Select IT Services Portfolio, Select Networking and Infrastructure Portfolio, Select Software and Computer Services Portfolio, and Select Technology Portfolio. Mr. Robins also serves as Deputy Treasurer of other Fidelity funds (2005-present) and is an employee of FMR (2004-present). Before joining Fidelity Investments, Mr. Robins worked at KPMG LLP, where he was a partner in KPMG's department of professional practice (2002-2004) and a Senior Manager (1999-2000). In addition, Mr. Robins served as Assistant Chief Accountant, United States Securities and Exchange Commission (2000-2002). | |
Robert G. Byrnes (40) | |
Year of Election or Appointment: 2005 Assistant Treasurer of Select Communications Equipment Portfolio, Select Computers Portfolio, Select Electronics Portfolio, Select IT Services Portfolio, Select Networking and Infrastructure Portfolio, Select Software and Computer Services Portfolio, and Select Technology Portfolio. Mr. Byrnes also serves as Assistant Treasurer of other Fidelity funds (2005-present) and is an employee of FMR (2005-present). Previously, Mr. Byrnes served as Vice President of FPCMS (2003-2005). Before joining Fidelity Investments, Mr. Byrnes worked at Deutsche Asset Management where he served as Vice President of the Investment Operations Group (2000-2003). | |
Peter L. Lydecker (53) | |
Year of Election or Appointment: 2004 Assistant Treasurer of Select Communications Equipment Portfolio, Select Computers Portfolio, Select Electronics Portfolio, Select IT Services Portfolio, Select Networking and Infrastructure Portfolio, Select Software and Computer Services Portfolio, and Select Technology Portfolio. Mr. Lydecker also serves as Assistant Treasurer of other Fidelity funds (2004) and is an employee of FMR. | |
Gary W. Ryan (48) | |
Year of Election or Appointment: 2005 Assistant Treasurer of Select Communications Equipment Portfolio, Select Computers Portfolio, Select Electronics Portfolio, Select IT Services Portfolio, Select Networking and Infrastructure Portfolio, Select Software and Computer Services Portfolio, and Select Technology Portfolio. Mr. Ryan also serves as Assistant Treasurer of other Fidelity funds (2005-present) and is an employee of FMR (2005-present). Previously, Mr. Ryan served as Vice President of Fund Reporting in FPCMS (1999-2005). | |
Salvatore Schiavone (41) | |
Year of Election or Appointment: 2005 Assistant Treasurer of Select Communications Equipment Portfolio, Select Computers Portfolio, Select Electronics Portfolio, Select IT Services Portfolio, Select Networking and Infrastructure Portfolio, Select Software and Computer Services Portfolio, and Select Technology Portfolio. Mr. Schiavone also serves as Assistant Treasurer of other Fidelity funds (2005-present) and is an employee of FMR (2005-present). Before joining Fidelity Investments, Mr. Schiavone worked at Deutsche Asset Management, where he most recently served as Assistant Treasurer (2003-2005) of the Scudder Funds and Vice President and Head of Fund Reporting (1996-2003). | |
Annual Report
Distributions
The Board of Trustees of each fund voted to pay to shareholders of record at the opening of business on record date, the following distributions per share derived from capital gains realized from sales of portfolio securities, and dividends derived from net investment income:
Pay Date | Record Date | Dividends | Capital Gains | |
IT Services | 04/16/07 | 04/13/07 | $0.000 | $0.960 |
The funds hereby designate as capital gain dividend the amounts noted below for the taxable year ended February 28, 2007, or, if subsequently determined to be different, the net capital gain of such year.
IT Services | $4,862,111 |
A percentage of the dividends distributed during the fiscal year for the following funds qualifies for the dividends-received deduction for corporate shareholders:
Electronics | 100% |
IT Services | 100% |
A percentage of the dividends distributed during the fiscal year for the following funds may be taken into account as a dividend for purposes of the maximum rate under section 1(h)(11) of the Internal Revenue Code.
Electronics | 100% |
IT Services | 100% |
The fund will notify shareholders in January 2008 of amounts for use in preparing 2007 income tax returns.
Annual Report
Proxy Voting Results
A special meeting of Fidelity Select Portfolios' shareholders was held on September 20, 2006. The results of votes taken among shareholders on the proposals before them are reported below. Each vote reported represents one dollar of net asset value held on the record date for the meeting.
PROPOSAL 1 | ||
To elect a Board of Trustees. A | ||
# of | % of | |
Dennis J. Dirks | ||
Affirmative | 13,182,341,755.09 | 94.980 |
Withheld | 696,736,162.41 | 5.020 |
TOTAL | 13,879,077,917.50 | 100.000 |
Albert R. Gamper, Jr. | ||
Affirmative | 13,177,593,614.43 | 94.946 |
Withheld | 701,484,303.07 | 5.054 |
TOTAL | 13,879,077,917.50 | 100.000 |
Robert M. Gates | ||
Affirmative | 13,141,235,622.81 | 94.684 |
Withheld | 737,842,294.69 | 5.316 |
TOTAL | 13,879,077,917.50 | 100.000 |
George H. Heilmeier | ||
Affirmative | 13,140,073,210.00 | 94.675 |
Withheld | 739,004,707.50 | 5.325 |
TOTAL | 13,879,077,917.50 | 100.000 |
Edward C. Johnson 3d | ||
Affirmative | 13,106,284,587.54 | 94.432 |
Withheld | 772,793,329.96 | 5.568 |
TOTAL | 13,879,077,917.50 | 100.000 |
Stephen P. Jonas | ||
Affirmative | 13,168,282,872.88 | 94.879 |
Withheld | 710,795,044.62 | 5.121 |
TOTAL | 13,879,077,917.50 | 100.000 |
James H. KeyesB | ||
Affirmative | 13,164,603,089.66 | 94.852 |
Withheld | 714,474,827.84 | 5.148 |
TOTAL | 13,879,077,917.50 | 100.000 |
Marie L. Knowles | ||
Affirmative | 13,169,356,779.66 | 94.886 |
Withheld | 709,721,137.84 | 5.114 |
TOTAL | 13,879,077,917.50 | 100.000 |
Ned C. Lautenbach | ||
Affirmative | 13,166,485,155.52 | 94.866 |
Withheld | 712,592,761.98 | 5.134 |
TOTAL | 13,879,077,917.50 | 100.000 |
William O. McCoy | ||
Affirmative | 13,129,548,996.59 | 94.600 |
Withheld | 749,528,920.91 | 5.400 |
TOTAL | 13,879,077,917.50 | 100.000 |
Robert L. Reynolds | ||
Affirmative | 13,180,813,649.06 | 94.969 |
Withheld | 698,264,268.44 | 5.031 |
TOTAL | 13,879,077,917.50 | 100.000 |
# of | % of | |
Cornelia M. Small | ||
Affirmative | 13,170,500,616.42 | 94.895 |
Withheld | 708,577,301.08 | 5.105 |
TOTAL | 13,879,077,917.50 | 100.000 |
William S. Stavropoulos | ||
Affirmative | 13,143,284,328.22 | 94.699 |
Withheld | 735,793,589.28 | 5.301 |
TOTAL | 13,879,077,917.50 | 100.000 |
Kenneth L. Wolfe | ||
Affirmative | 13,162,946,758.47 | 94.840 |
Withheld | 716,131,159.03 | 5.160 |
TOTAL | 13,879,077,917.50 | 100.000 |
PROPOSAL 4A & 7A | ||
To modify the fund's fundamental "invests primarily" policy (the investment policy concerning the fund's primary investments). | ||
Communications Equipment Portfolio | ||
# of | % of | |
Affirmative | 168,688,858.20 | 84.770 |
Against | 10,025,316.66 | 5.038 |
Abstain | 8,835,301.16 | 4.440 |
Broker Non-Votes | 11,446,932.29 | 5.752 |
TOTAL | 198,996,408.31 | 100.000 |
IT Services Portfolio | ||
# of | % of | |
Affirmative | 19,358,948.48 | 85.091 |
Against | 1,812,263.15 | 7.966 |
Abstain | 956,663.07 | 4.205 |
Broker Non-Votes | 623,012.85 | 2.738 |
TOTAL | 22,750,887.55 | 100.000 |
PROPOSAL 4B & 7B | ||
To modify the fund's investment concentration policy. | ||
Communications Equipment Portfolio | ||
# of | % of | |
Affirmative | 168,085,859.71 | 84.467 |
Against | 10,284,988.86 | 5.168 |
Abstain | 9,178,627.45 | 4.613 |
Broker Non-Votes | 11,446,932.29 | 5.752 |
TOTAL | 198,996,408.31 | 100.000 |
IT Services Portfolio | ||
# of | % of | |
Affirmative | 18,677,110.78 | 82.094 |
Against | 2,365,740.10 | 10.398 |
Abstain | 1,085,023.82 | 4.770 |
Broker Non-Votes | 623,012.85 | 2.738 |
TOTAL | 22,750,887.55 | 100.000 |
A Denotes trust-wide proposal and voting results. B Effective on or about January 1, 2007. | ||
Annual Report
Managing Your Investments
Fidelity offers several ways to conveniently manage your personal investments via your telephone or PC. You can access your account information, conduct trades and research your investments 24 hours a day.
By Phone
Fidelity Automated Service Telephone provides a single toll-free number to access account balances, positions, quotes and trading. It's easy to navigate the service, and on your first call, the system will help you create a personal identification number (PIN) for security.
(phone_graphic)Fidelity Automated Service Telephone (FAST®)
1-800-544-5555
Press
1 For mutual fund and brokerage trading.
2 For quotes.*
3 For account balances and holdings.
4 To review orders and mutual fund activity.
5 To change your PIN.
*0 To speak to a Fidelity representative.
By PC
Fidelity's web site on the Internet provides a wide range of information, including daily financial news, fund performance, interactive planning tools and news about Fidelity products and services.
(computer_graphic)Fidelity's Web Site
www.fidelity.com
* When you call the quotes line, please remember that a fund's yield and return will vary and, except for money market funds, share price will also vary. This means that you may have a gain or loss when you sell your shares. There is no assurance that money market funds will be able to maintain a stable $1 share price; an investment in a money market fund is not insured or guaranteed by the U.S. government. Total returns are historical and include changes in share price, reinvestment of dividends and capital gains, and the effects of any sales charges.
Annual Report
To Write Fidelity
We'll give your correspondence immediate attention and send you written confirmation upon completion of your request.
(letter_graphic)Making Changes
To Your Account
(such as changing name, address, bank, etc.)
Fidelity Investments
P.O. Box 770001
Cincinnati, OH 45277-0002
(letter_graphic)For Non-Retirement
Accounts
Buying shares
Fidelity Investments
P.O. Box 770001
Cincinnati, OH 45277-0003
Overnight Express
Fidelity Investments
Attn: Distribution Services
100 Crosby Parkway - KC1H
Covington, KY 41015
Selling shares
Fidelity Investments
P.O. Box 770001
Cincinnati, OH 45277-0035
Overnight Express
Fidelity Investments
Attn: Distribution Services
100 Crosby Parkway - KC1H
Covington, KY 41015
General Correspondence
Fidelity Investments
P.O. Box 500
Merrimack, NH 03054-0500
(letter_graphic)For Retirement
Accounts
Buying shares
Fidelity Investments
P.O. Box 770001
Cincinnati, OH 45277-0003
Selling shares
Fidelity Investments
P.O. Box 770001
Cincinnati, OH 45277-0035
Overnight Express
Fidelity Investments
Attn: Distribution Services
100 Crosby Parkway - KC1H
Covington, KY 41015
General Correspondence
Fidelity Investments
P.O. Box 500
Merrimack, NH 03054-0500
Annual Report
To Visit Fidelity
For directions and hours,
please call 1-800-544-9797.
Arizona
7001 West Ray Road
Chandler, AZ
15445 N. Scottsdale Road
Scottsdale, AZ
California
815 East Birch Street
Brea, CA
1411 Chapin Avenue
Burlingame, CA
851 East Hamilton Avenue
Campbell, CA
19200 Von Karman Avenue
Irvine, CA
601 Larkspur Landing Circle
Larkspur, CA
10100 Santa Monica Blvd.
Los Angeles, CA
27101 Puerta Real
Mission Viejo, CA
73-575 El Paseo
Palm Desert, CA
251 University Avenue
Palo Alto, CA
123 South Lake Avenue
Pasadena, CA
16995 Bernardo Ctr. Drive
Rancho Bernardo, CA
1220 Roseville Parkway
Roseville, CA
1740 Arden Way
Sacramento, CA
7676 Hazard Center Drive
San Diego, CA
11943 El Camino Real
San Diego, CA
8 Montgomery Street
San Francisco, CA
3793 State Street
Santa Barbara, CA
1200 Wilshire Boulevard
Santa Monica, CA
21701 Hawthorne Boulevard
Torrance, CA
2001 North Main Street
Walnut Creek, CA
6300 Canoga Avenue
Woodland Hills, CA
Colorado
1625 Broadway
Denver, CO
9185 Westview Road
Lone Tree, CO
Connecticut
48 West Putnam Avenue
Greenwich, CT
265 Church Street
New Haven, CT
300 Atlantic Street
Stamford, CT
29 South Main Street
West Hartford, CT
Delaware
400 Delaware Avenue
Wilmington, DE
Florida
4400 N. Federal Highway
Boca Raton, FL
121 Alhambra Plaza
Coral Gables, FL
2948 N. Federal Highway
Ft. Lauderdale, FL
4671 Town Center Parkway
Jacksonville, FL
1907 West State Road 434
Longwood, FL
8880 Tamiami Trail, North
Naples, FL
3501 PGA Boulevard
Palm Beach Gardens, FL
3550 Tamiami Trail, South
Sarasota, FL
1502 N. Westshore Blvd.
Tampa, FL
2465 State Road 7
Wellington, FL
Georgia
3445 Peachtree Road, N.E.
Atlanta, GA
1000 Abernathy Road
Atlanta, GA
Illinois
One North LaSalle Street
Chicago, IL
875 North Michigan Ave.
Chicago, IL
1415 West 22nd Street
Oak Brook, IL
1572 East Golf Road
Schaumburg, IL
3232 Lake Avenue
Wilmette, IL
Indiana
4729 East 82nd Street
Indianapolis, IN
Kansas
5400 College Boulevard
Overland Park, KS
Maine
Three Canal Plaza
Portland, ME
Maryland
7315 Wisconsin Avenue
Bethesda, MD
One W. Pennsylvania Ave.
Towson, MD
Massachusetts
801 Boylston Street
Boston, MA
155 Congress Street
Boston, MA
300 Granite Street
Braintree, MA
44 Mall Road
Burlington, MA
238 Main Street
Cambridge, MA
405 Cochituate Road
Framingham, MA
416 Belmont Street
Worcester, MA
Michigan
500 E. Eisenhower Pkwy.
Ann Arbor, MI
280 Old N. Woodward Ave.
Birmingham, MI
43420 Grand River Avenue
Novi, MI
29155 Northwestern Hwy.
Southfield, MI
Minnesota
7600 France Avenue South
Edina, MN
Missouri
1524 South Lindbergh Blvd.
St. Louis, MO
Nevada
2225 Village Walk Drive
Henderson, NV
New Jersey
150 Essex Street
Millburn, NJ
56 South Street
Morristown, NJ
396 Route 17, North
Paramus, NJ
3518 Route 1 North
Princeton, NJ
530 Broad Street
Shrewsbury, NJ
New York
1055 Franklin Avenue
Garden City, NY
37 West Jericho Turnpike
Huntington Station, NY
1271 Avenue of the Americas
New York, NY
980 Madison Avenue
New York, NY
61 Broadway
New York, NY
350 Park Avenue
New York, NY
200 Fifth Avenue
New York, NY
733 Third Avenue
New York, NY
11 Penn Plaza
New York, NY
2070 Broadway
New York, NY
1075 Northern Blvd.
Roslyn, NY
799 Central Park Avenue
Scarsdale, NY
North Carolina
4611 Sharon Road
Charlotte, NC
7011 Fayetteville Road
Durham, NC
Ohio
3805 Edwards Road
Cincinnati, OH
1324 Polaris Parkway
Columbus, OH
28699 Chagrin Boulevard
Woodmere Village, OH
Oregon
7493 SW Bridgeport Road
Tigard, OR
Pennsylvania
600 West DeKalb Pike
King of Prussia, PA
1735 Market Street
Philadelphia, PA
12001 Perry Highway
Wexford, PA
Rhode Island
47 Providence Place
Providence, RI
Tennessee
6150 Poplar Avenue
Memphis, TN
Texas
10000 Research Boulevard
Austin, TX
4001 Northwest Parkway
Dallas, TX
12532 Memorial Drive
Houston, TX
2701 Drexel Drive
Houston, TX
6560 Fannin Street
Houston, TX
6500 N. MacArthur Blvd.
Irving, TX
6005 West Park Boulevard
Plano, TX
14100 San Pedro
San Antonio, TX
1576 East Southlake Blvd.
Southlake, TX
19740 IH 45 North
Spring, TX
Utah
279 West South Temple
Salt Lake City, UT
Virginia
1861 International Drive
McLean, VA
Washington
411 108th Avenue, N.E.
Bellevue, WA
1518 6th Avenue
Seattle, WA
Washington, DC
1900 K Street, N.W.
Washington, DC
Wisconsin
595 North Barker Road
Brookfield, WI
Annual Report
Fidelity Brokerage Services, Inc., 100 Summer St., Boston, MA 02110 Member NYSE/SIPC
Investment Adviser
Fidelity Management & Research Company
Boston, MA
Investment Sub-Advisers
FMR Co., Inc.
Fidelity Management & Research
(U.K.) Inc.
Fidelity Research & Analysis Company (formerly Fidelity Management & Research (Far East) Inc.)
Fidelity Investments Japan Limited
Fidelity International Investment Advisors
Fidelity International Investment Advisors
(U.K. Limited)
General Distributor
Fidelity Distributors Corporation
Boston, MA
Transfer and Service Agent
Fidelity Service Company, Inc.
Boston, MA
Custodian
Brown Brothers Harriman & Co.
Boston, MA
Corporate Headquarters
82 Devonshire Street
Boston, MA 02109
1-800-544-8888
The Fidelity Telephone Connection
Mutual Fund 24-Hour Service
Exchanges/Redemptions
and Account Assistance 1-800-544-6666
Product Information 1-800-544-8888
Retirement Accounts 1-800-544-4774
(8 a.m. - 9 p.m.)
TDD Service 1-800-544-0118
for the deaf and hearing impaired
(9 a.m. - 9 p.m. Eastern time)
Fidelity Automated Service
Telephone (FAST®) (automated graphic) 1-800-544-5555
(automated graphic) Automated line for quickest service
(Fidelity Investment logo)(registered trademark)
Corporate Headquarters
82 Devonshire St., Boston, MA 02109
www.fidelity.com
SELTEC-UANN-0407
1.813668.102
Fidelity®
Select Portfolios®
Select Money Market Portfolio
Annual Report
February 28, 2007
(2_fidelity_logos) (Registered_Trademark)
Contents
Chairman's Message | ||
Note to Shareholders | ||
Shareholder Expense Example | ||
Fund Update * | ||
Money Market | ||
Notes to Financial Statements | ||
Report of Independent Registered Public Accounting Firm | ||
Trustees and Officers | ||
Distributions | ||
Proxy Voting Results |
* Fund update includes: Investment Changes/Performance, Investments, and Financial Statements.
To view a fund's proxy voting guidelines and proxy voting record for the 12-month period ended June 30, visit www.fidelity.com/proxyvotingresults or visit the Securities and Exchange Commission's (SEC) web site at www.sec.gov. You may also call 1-800-544-8544 to request a free copy of the proxy voting guidelines.
Standard & Poor's, S&P and S&P 500 are registered service marks of The McGraw-Hill Companies, Inc. and have been licensed for use by Fidelity Distributors Corporation.
Other third party marks appearing herein are the property of their respective owners.
All other marks appearing herein are registered or unregistered trademarks or service marks of FMR Corp. or an affiliated company.
This report and the financial statements contained herein are submitted for the general information of the shareholders of the fund. This report is not authorized for distribution to prospective investors in the fund unless preceded or accompanied by an effective prospectus.
A fund files its complete schedule of portfolio holdings with the SEC for the first and third quarters of each fiscal year on Form N-Q. Forms N-Q are available on the SEC's web site at http://www.sec.gov. A fund's Forms N-Q may be reviewed and copied at the SEC's Public Reference Room in Washington, DC. Information regarding the operation of the SEC's Public Reference Room may be obtained by calling 1-800-SEC-0330. For a complete list of a fund's portfolio holdings, view the most recent quarterly holdings report, semiannual report, or annual report on Fidelity's web site at http://www.fidelity.com/holdings.
NOT FDIC INSURED · MAY LOSE VALUE · NO BANK GUARANTEE
Neither the funds nor Fidelity Distributors Corporation is a bank.
Semiannual Report
Chairman's Message
(Photograph of Edward C. Johnson 3d.)
Dear Shareholder:
Substantial single-day losses are not uncommon in the equity markets, and when they occur - as in late February - investors can be better served in the long term by buying good stocks at lower prices than by moving their money to the sidelines. While financial markets are always unpredictable, there are a number of time-tested principles that can put the historical odds in your favor.
One of the basic tenets is to invest for the long term. Over time, riding out the markets' inevitable ups and downs has proven much more effective than selling into panic or chasing the hottest trend. Even missing only a few of the markets' best days can significantly diminish investor returns. Patience also affords the benefits of compounding - of earning interest on additional income or reinvested dividends and capital gains. There are tax advantages and cost benefits to consider as well. The more you sell, the more taxes you pay, and the more you trade, the higher the costs. While staying the course doesn't eliminate risk, it can considerably lessen the effect of short-term declines.
You can further manage your investing risk through diversification. And today, more than ever, geographic diversification should be taken into account. Studies
indicate that asset allocation is the single most important determinant of a portfolio's long-term success. The right mix of stocks, bonds and cash - aligned to your particular risk tolerance and investment objective - is very important. Age-appropriate rebalancing is also an essential aspect of asset allocation. For younger investors, an emphasis on equities - which historically have been the best performing asset class over time - is encouraged. As investors near their specific goal, such as retirement or sending a child to college, consideration may be given to replacing volatile assets (e.g. common stocks) with more-stable fixed investments (bonds or savings plans).
A third investment principle - investing regularly - can help lower the average cost of your purchases. Investing a certain amount of money each month or quarter helps ensure you won't pay for all your shares at market highs. This strategy - known as dollar cost averaging - also reduces unconstructive "emotion" from investing, helping shareholders avoid selling weak performers just prior to an upswing, or chasing a hot performer just before a correction.
We invite you to contact us via the Internet, through our Investor Centers or over the phone. It is our privilege to provide you the information you need to make the investments that are right for you.
Sincerely,
/s/Edward C. Johnson 3d
Edward C. Johnson 3d
Annual Report
Note to Shareholders:
Effective October 1, 2006, Fidelity restructured the Fidelity® Select Portfolios® equity product line. The restructuring aligned the equity funds' investment goals more closely with standard industry classifications and facilitated adoption of more-specific benchmark indexes to evaluate fund performance. As restructured, the equity funds generally align under the 10 sectors in the widely recognized Global Industry Classification Standard (GICS), developed by Standard & Poor's® (S&P®) and Morgan Stanley Capital InternationalSM (MSCI®): Consumer Discretionary, Consumer Staples, Energy, Financials, Health Care, Industrials, Information Technology, Materials, Telecommunications Services and Utilities. Changes to the funds ranged from simply adopting a new supplemental benchmark to, in some cases, changing investment policies and fund names.
For Banking, Communications Equipment (formerly Developing Communications), Construction and Housing, Consumer Discretionary (formerly Consumer Industries), Consumer Staples (formerly Food and Agriculture), Home Finance, Industrials (formerly Cyclical Industries), IT Services (formerly Business Services and Outsourcing) and Materials (formerly Industrial Materials), shareholders approved certain fundamental investment policy changes related to the restructuring at a special meeting of shareholders held September 20, 2006. All the equity funds adopted new benchmark indexes from MSCI, except for Gold (which adopted an S&P/Citigroup index), Natural Gas (which adopted an S&P index) and Natural Resources (which retained its current Goldman Sachs® index). Taken together, the name, policy and benchmark changes will make it easier for investors to distinguish funds in the product line and to evaluate Fidelity Management & Research Company's skill in managing the funds.
The Select equity portfolios also eliminated hourly pricing. The funds now price each business day as of the close of the New York Stock Exchange, normally 4:00 pm Eastern time. The funds also adopted Fidelity's standard fund market timing policy, as described in the funds' current prospectus, and removed the $7.50 fee formerly charged on exchanges made through non-automated channels.
Annual Report
Shareholder Expense Example
As a shareholder of the Fund, you incur two types of costs: (1) transaction costs, and (2) ongoing costs, including management fees and other Fund expenses. This Example is intended to help you understand your ongoing costs (in dollars) of investing in the Fund and to compare these costs with the ongoing costs of investing in other mutual funds.
The Example is based on an investment of $1,000 invested at the beginning of the period and held for the entire period (September 1, 2006 to February 28, 2007).
Actual Expenses
The first line of the accompanying table provides information about actual account values and actual expenses. You may use the information in this line, together with the amount you invested, to estimate the expenses that you paid over the period. Simply divide your account value by $1,000.00 (for example, an $8,600 account value divided by $1,000.00 = 8.6), then multiply the result by the number in the first line under the heading entitled "Expenses Paid During Period" to estimate the expenses you paid on your account during this period. A small balance maintenance fee of $12.00 that is charged once a year may apply for certain accounts with a value of less than $2,000. This fee is not included in the table below. If it was, the estimate of expenses you paid during the period would be higher, and your ending account value lower, by this amount.
Hypothetical Example for Comparison Purposes
The second line of the accompanying table provides information about hypothetical account values and hypothetical expenses based on the Fund's actual expense ratio and an assumed rate of return of 5% per year before expenses, which is not the Fund's actual return. The hypothetical account values and expenses may not be used to estimate the actual ending account balance or expenses you paid for the period. You may use this information to compare the ongoing costs of investing in the Fund and other funds. To do so, compare this 5% hypothetical example with the 5% hypothetical examples that appear in the shareholder reports of the other funds. A small balance maintenance fee of $12.00 that is charged once a year may apply for certain accounts with a value of less than $2,000. This fee is not included in the table below. If it was, the estimate of expenses you paid during the period would be higher, and your ending account value lower, by this amount.
Please note that the expenses shown in the table are meant to highlight your ongoing costs only and do not reflect any transaction costs. Therefore, the second line of the table is useful in comparing ongoing costs only, and will not help you determine the relative total costs of owning different funds.
Beginning | Ending | Expenses Paid | |
Actual | $ 1,000.00 | $ 1,025.20 | $ 1.91 |
Hypothetical (5% return per year before expenses) | $ 1,000.00 | $ 1,022.91 | $ 1.91 |
* Expenses are equal to the Fund's annualized expense ratio of .38%; multiplied by the average account value over the period, multiplied by 181/365 (to reflect the one-half year period).
Annual Report
Investment Changes/Performance
Maturity Diversification | |||
Days | % of fund's investments 2/28/07 | % of fund's investments 8/31/06 | % of fund's |
0 - 30 | 63.4 | 67.7 | 70.8 |
31 - 90 | 21.4 | 20.7 | 19.5 |
91 - 180 | 7.8 | 6.9 | 5.3 |
181 - 397 | 7.4 | 4.7 | 4.4 |
Weighted Average Maturity | |||
2/28/07 | 8/31/06 | 2/28/06 | |
Money Market Portfolio | 51 Days | 43 Days | 39 Days |
All Taxable Money Market Funds Average* | 42 Days | 38 Days | 39 Days |
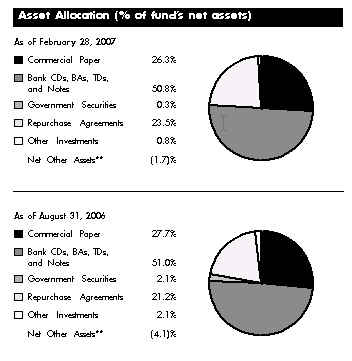
Current and Historical Seven-Day Yields |
2/27/07 | 11/28/06 | 8/29/06 | 5/30/06 | 2/28/06 | |
Money Market Portfolio | 5.03% | 5.04% | 5.04% | 4.69% | 4.24% |
Yield refers to the income paid by the fund over a given period. Yields for money market funds are usually for seven-day periods, as they are here, though they are expressed as annual percentage rates. Past performance is no guarantee of future results. Yield will vary and it is possible to lose money by investing in the fund.
* Source: iMoneyNet, Inc.
** Net Other Assets are not included in the pie chart.
Annual Report
Select Money Market Portfolio
Investments February 28, 2007
Showing Percentage of Net Assets
Corporate Bonds - 0.3% | |||
Due | Yield (a) | Principal Amount | Value |
Countrywide Home Loans, Inc. | |||
5/15/07 | 5.37% | $ 7,000,000 | $ 7,002,724 |
Certificates of Deposit - 21.9% | |||
Domestic Certificates of Deposit - 0.6% | |||
American Express Centurion Bank | |||
6/20/07 | 5.35 | 7,000,000 | 7,000,000 |
Countrywide Bank, Alexandria Virginia | |||
3/16/07 | 5.35 (d) | 2,000,000 | 1,999,909 |
Washington Mutual Bank FA | |||
7/5/07 | 5.75 | 5,000,000 | 5,000,000 |
13,999,909 | |||
London Branch, Eurodollar, Foreign Banks - 8.7% | |||
Banco Bilbao Vizcaya Argentaria SA | |||
7/31/07 | 5.36 | 20,000,000 | 20,000,000 |
Barclays Bank PLC | |||
6/11/07 | 5.44 | 5,000,000 | 5,000,000 |
Bayerische Hypo-und Vereinsbank AG | |||
4/5/07 | 5.33 | 5,000,000 | 5,000,000 |
Credit Agricole SA | |||
4/12/07 | 5.34 | 15,000,000 | 15,000,000 |
Credit Industriel et Commercial | |||
3/12/07 to 7/30/07 | 5.22 to 5.40 | 48,000,000 | 48,000,000 |
Dresdner Bank AG | |||
3/5/07 | 5.40 | 5,000,000 | 5,000,000 |
HBOS Treasury Services PLC | |||
3/8/07 to 5/23/07 | 5.30 to 5.36 | 30,000,000 | 30,000,000 |
Landesbank Hessen-Thuringen | |||
4/17/07 to 9/17/07 | 5.36 to 5.37 | 45,000,000 | 45,000,000 |
Societe Generale | |||
4/17/07 to 9/28/07 | 5.30 to 5.39 | 45,000,000 | 45,000,000 |
Unicredito Italiano Spa | |||
7/30/07 | 5.36 | 5,000,000 | 5,000,000 |
223,000,000 | |||
New York Branch, Yankee Dollar, Foreign Banks - 12.6% | |||
Bank Tokyo-Mitsubishi UFJ Ltd. | |||
4/2/07 to 8/8/07 | 5.30 to 5.36 | 56,000,000 | 56,000,000 |
BNP Paribas SA | |||
3/8/07 to 10/2/07 | 5.30 to 5.45 | 30,000,000 | 30,000,000 |
Canadian Imperial Bank of Commerce | |||
3/15/07 | 5.40 (d) | 14,000,000 | 14,000,000 |
Credit Suisse First Boston | |||
3/12/07 to 5/26/07 | 5.33 to 5.34 (d) | 40,000,000 | 40,000,000 |
Credit Suisse Group | |||
6/4/07 | 5.44 | 3,000,000 | 3,000,000 |
Deutsche Bank AG | |||
3/5/07 to 12/12/07 | 5.40 to 5.43 (d) | 30,000,000 | 30,000,000 |
HBOS Treasury Services PLC | |||
5/23/07 | 5.36 | 5,000,000 | 5,000,000 |
Due | Yield (a) | Principal Amount | Value |
Landesbank Baden-Wuert | |||
4/13/07 | 5.35% | $ 7,000,000 | $ 7,000,041 |
Mizuho Corporate Bank Ltd. | |||
4/16/07 to 5/14/07 | 5.32 to 5.34 | 10,000,000 | 10,000,000 |
Natexis Banques Populaires NY CD | |||
12/12/07 to 2/4/08 | 5.33 to 5.42 | 77,000,000 | 76,999,998 |
Norinchukin Bank | |||
3/1/07 | 5.35 | 11,000,000 | 11,000,000 |
Skandinaviska Enskilda Banken AB | |||
3/30/07 | 5.35 | 1,400,000 | 1,399,827 |
Societe Generale | |||
1/16/08 | 5.42 | 10,000,000 | 10,000,000 |
Sumitomo Mitsui Banking Corp. | |||
3/7/07 to 4/2/07 | 5.31 to 5.32 | 5,000,000 | 5,000,000 |
UniCredito Italiano Spa, New York | |||
4/30/07 | 5.32 (d) | 25,000,000 | 24,995,928 |
324,395,794 | |||
TOTAL CERTIFICATES OF DEPOSIT | 561,395,703 | ||
Commercial Paper - 26.3% | |||
Aegis Finance LLC | |||
3/12/07 | 5.31 | 5,000,000 | 4,991,933 |
American Wtr. Cap. Corp. | |||
3/5/07 to 5/17/07 | 5.40 to 5.45 (b) | 5,000,000 | 4,972,674 |
Aquifer Funding LLC | |||
3/5/07 to 3/7/07 | 5.30 | 39,000,000 | 38,971,563 |
Aspen Funding Corp. | |||
3/29/07 | 5.30 | 5,000,000 | 4,979,486 |
BellSouth Corp. | |||
3/1/07 | 5.35 | 1,000,000 | 1,000,000 |
Burlington Northern Santa Fe Corp. | |||
4/20/07 to 5/17/07 | 5.37 to 5.38 (b) | 6,000,000 | 5,948,770 |
Capital One Multi-Asset Execution Trust | |||
3/14/07 | 5.35 | 1,000,000 | 998,093 |
Citigroup Funding, Inc. | |||
3/19/07 to 5/8/07 | 5.31 to 5.35 | 45,000,000 | 44,790,376 |
ConocoPhillips Qatar Funding Ltd. | |||
3/20/07 to 4/13/07 | 5.37 to 5.43 (b) | 17,664,000 | 17,611,068 |
Countrywide Financial Corp. | |||
3/8/07 to 4/13/07 | 5.30 to 5.37 | 19,500,000 | 19,416,008 |
CVS Corp. | |||
3/19/07 to 4/27/07 | 5.34 to 5.39 | 4,000,000 | 3,983,597 |
DaimlerChrysler NA Holding Corp. | |||
3/2/07 to 5/11/07 | 5.38 to 5.45 | 13,500,000 | 13,421,343 |
Davis Square Funding V Corp. | |||
3/5/07 to 3/16/07 | 5.31 to 5.35 | 12,000,000 | 11,983,140 |
DEPFA BANK PLC | |||
3/20/07 | 5.35 | 5,000,000 | 4,986,199 |
Commercial Paper - continued | |||
Due | Yield (a) | Principal Amount | Value |
Devon Energy Corp. | |||
3/15/07 to 8/16/07 | 5.35 to 5.44% | $ 6,500,000 | $ 6,357,603 |
Dominion Resources, Inc. | |||
3/6/07 to 3/22/07 | 5.36 to 5.37 | 3,000,000 | 2,993,189 |
Emerald (MBNA Credit Card Master Note Trust) | |||
3/1/07 to 4/26/07 | 5.32 to 5.33 | 21,000,000 | 20,909,428 |
FCAR Owner Trust | |||
3/15/07 | 5.32 to 5.33 | 7,000,000 | 6,985,724 |
Fortune Brands, Inc. | |||
3/23/07 to 5/11/07 | 5.35 to 5.39 | 6,800,000 | 6,749,349 |
France Telecom SA | |||
3/14/07 to 5/31/07 | 5.38 to 5.40 (b) | 4,000,000 | 3,963,534 |
Giro Funding US Corp. | |||
3/26/07 to 5/3/07 | 5.30 to 5.34 | 53,000,000 | 52,583,928 |
Grampian Funding LLC | |||
3/5/07 to 4/10/07 | 5.32 to 5.35 | 65,000,000 | 64,794,040 |
Grenadier Funding Corp. | |||
3/6/07 to 3/22/07 | 5.32 to 5.35 | 6,000,000 | 5,993,274 |
Harrier Finance Funding LLC | |||
6/27/07 | 5.35 (b) | 5,000,000 | 4,914,843 |
HSBC Finance Corp. | |||
3/23/07 | 5.35 | 5,000,000 | 4,983,867 |
Hypo Real Estate Bank International AG | |||
3/12/07 to 5/24/07 | 5.36 to 5.38 | 6,000,000 | 5,964,393 |
ITT Corp. | |||
5/24/07 | 5.38 | 500,000 | 493,805 |
John Deere Capital Corp. | |||
3/9/07 to 3/16/07 | 5.38 to 5.42 | 3,000,000 | 2,994,828 |
Kellogg Co. | |||
3/9/07 to 3/22/07 | 5.38 | 2,000,000 | 1,995,723 |
Liberty Harbour II CDO Ltd./LLC | |||
4/5/07 to 5/25/07 | 5.31 to 5.35 (b) | 15,000,000 | 14,870,089 |
Market Street Funding Corp. | |||
3/22/07 | 5.36 | 1,000,000 | 996,914 |
Michigan Gen. Oblig. | |||
10/4/07 | 5.41 to 5.50 | 5,100,000 | 5,097,883 |
Monument Gardens Funding | |||
3/1/07 to 5/14/07 | 5.30 to 5.33 | 32,000,000 | 31,897,709 |
Motown Notes Program | |||
3/15/07 to 5/7/07 | 5.35 to 5.38 | 8,000,000 | 7,965,618 |
Nationwide Building Society | |||
3/9/07 | 5.34 | 2,000,000 | 1,997,667 |
Nelnet Student Funding Ext CP LLC | |||
3/7/07 to 5/8/07 | 5.30 to 5.34 | 46,000,000 | 45,921,122 |
Nissan Motor Acceptance Corp. | |||
3/1/07 to 5/3/07 | 5.34 to 5.40 | 6,500,000 | 6,473,715 |
Pacific Gas & Electric Co. | |||
3/5/07 | 5.35 (b) | 3,000,000 | 2,998,220 |
Paradigm Funding LLC | |||
3/26/07 | 5.39 | 4,000,000 | 3,985,444 |
Due | Yield (a) | Principal Amount | Value |
Park Granada LLC | |||
3/20/07 to 3/30/07 | 5.31 to 5.37% | $ 19,000,000 | $ 18,927,934 |
Park Sienna LLC | |||
3/28/07 to 5/29/07 | 5.31 to 5.36 | 49,000,000 | 48,789,502 |
Rockies Express Pipeline LLC | |||
3/20/07 to 5/8/07 | 5.44 to 5.47 (b) | 4,000,000 | 3,977,747 |
SABMiller PLC | |||
3/7/07 to 3/22/07 | 5.34 to 5.35 | 7,750,000 | 7,738,571 |
Skandinaviska Enskilda Banken AB | |||
7/19/07 | 5.35 | 2,000,000 | 1,959,322 |
Stratford Receivables Co. LLC | |||
3/12/07 to 3/27/07 | 5.30 to 5.33 | 32,000,000 | 31,916,500 |
Textron Financial Corp. | |||
3/21/07 to 5/31/07 | 5.35 | 3,000,000 | 2,980,790 |
The Walt Disney Co. | |||
4/23/07 to 5/23/07 | 5.35 to 5.36 | 3,000,000 | 2,972,251 |
Three Rivers Funding Corp. | |||
3/16/07 | 5.30 | 1,000,000 | 997,800 |
Time Warner Cable, Inc. | |||
3/27/07 to 4/24/07 | 5.38 to 5.40 | 12,000,000 | 11,929,431 |
Time Warner, Inc. | |||
4/5/07 | 5.38 (b) | 1,000,000 | 994,808 |
Toyota Motor Credit Corp. | |||
5/23/07 to 5/30/07 | 5.26 to 5.27 | 10,000,000 | 9,876,680 |
UniCredito Italiano Bank (Ireland) PLC | |||
3/13/07 to 4/16/07 | 5.35 to 5.36 | 15,000,000 | 14,929,040 |
Verizon Communications, Inc. | |||
3/13/07 to 4/3/07 | 5.32 to 5.34 (b) | 2,000,000 | 1,993,363 |
Virginia Electric & Power Co. | |||
3/13/07 to 3/14/07 | 5.34 to 5.35 | 1,507,000 | 1,504,173 |
Weatherford International Ltd. | |||
3/6/07 to 3/26/07 | 5.34 to 5.35 (b) | 3,000,000 | 2,991,865 |
WellPoint, Inc. | |||
3/16/07 to 5/21/07 | 5.37 to 5.40 | 4,000,000 | 3,977,112 |
Whirlpool Corp. | |||
5/31/07 | 5.38 | 1,500,000 | 1,479,866 |
Wisconsin Energy Corp. | |||
3/16/07 to 8/8/07 | 5.36 to 5.46 | 4,000,000 | 3,969,728 |
Xcel Energy, Inc. | |||
4/13/07 | 5.56 | 1,000,000 | 993,538 |
Zenith Funding Corp. | |||
5/11/07 | 5.33 (b) | 9,086,000 | 8,991,743 |
TOTAL COMMERCIAL PAPER | 676,827,923 | ||
Federal Agencies - 0.3% | |||
Federal Home Loan Bank | |||
3/17/08 | 5.34 | 7,000,000 | 7,000,000 |
Master Notes - 1.5% | |||
Due | Yield (a) | Principal Amount | Value |
Asset Funding Co. III LLC | |||
3/5/07 | 5.38 to 5.39% (d)(f) | $ 19,000,000 | $ 19,000,000 |
Bear Stearns & Co., Inc. | |||
8/27/07 | 5.38 (d) | 12,000,000 | 12,000,000 |
Lehman Brothers Holdings, Inc. | |||
3/12/07 to 6/28/07 | 5.43 to 5.46 (d)(f) | 8,000,000 | 8,000,000 |
TOTAL MASTER NOTES | 39,000,000 | ||
Medium-Term Notes - 26.0% | |||
AIG Matched Funding Corp. | |||
5/15/07 | 5.35 (d) | 15,000,000 | 15,000,000 |
5/15/07 to 11/15/07 | 5.35 to 5.37 (b)(d) | 23,000,000 | 23,000,000 |
Australia & New Zealand Banking Group Ltd. | |||
3/23/07 | 5.32 (b)(d) | 2,000,000 | 2,000,000 |
Banco Santander Totta SA | |||
3/16/07 | 5.32 (b)(d) | 10,000,000 | 10,000,000 |
Bank of New York Co., Inc. | |||
3/27/07 | 5.38 (b)(d) | 5,000,000 | 5,000,000 |
Banque Federative du Credit Mutuel (BFCM) | |||
3/13/07 | 5.32 (b)(d) | 28,000,000 | 28,000,000 |
Bayerische Landesbank Girozentrale | |||
5/21/07 | 5.40 (d) | 5,000,000 | 5,000,000 |
BellSouth Corp. | |||
4/26/07 | 5.34 (b) | 10,000,000 | 9,982,316 |
BMW U.S. Capital LLC | |||
3/15/07 | 5.32 (d) | 1,000,000 | 1,000,000 |
3/5/07 | 5.30 (b)(d) | 1,000,000 | 1,000,000 |
BNP Paribas SA | |||
5/21/07 | 5.33 (b)(d) | 5,000,000 | 5,000,000 |
Caixa Catalunya | |||
9/7/07 | 5.34 (c)(d) | 10,000,000 | 10,000,000 |
Caja Madrid SA | |||
4/19/07 | 5.36 (d) | 5,000,000 | 5,000,000 |
Calyon New York Branch | |||
3/2/07 | 5.26 (d) | 5,000,000 | 4,999,338 |
CIT Group, Inc. | |||
5/18/07 | 5.58 (d) | 11,000,000 | 11,005,812 |
Commonwealth Bank of Australia | |||
3/26/07 | 5.32 (d) | 17,000,000 | 17,002,061 |
Compagnie Financiere du Credit Mutuel | |||
6/9/07 | 5.36 (d) | 8,000,000 | 8,000,000 |
ConocoPhillips | |||
4/11/07 | 5.36 (d) | 2,000,000 | 2,000,000 |
Countrywide Bank, Alexandria Virginia | |||
3/15/07 to 3/23/07 | 5.33 (d) | 7,000,000 | 6,999,840 |
Countrywide Financial Corp. | |||
4/11/07 | 5.52 (d) | 250,000 | 250,035 |
Due | Yield (a) | Principal Amount | Value |
Credit Agricole SA | |||
4/23/07 | 5.33% (d) | $ 30,000,000 | $ 30,000,000 |
Cullinan Finance Corp. | |||
5/27/07 to 6/25/07 | 5.32 to 5.38 (b)(d) | 17,000,000 | 16,998,521 |
Cullinan Finance Ltd./Corp. MTN 144A | |||
10/15/07 | 5.33 (b) | 5,000,000 | 5,000,000 |
DnB NORBank ASA | |||
3/26/07 | 5.31 (b)(d) | 14,500,000 | 14,499,967 |
General Electric Capital Corp. | |||
3/8/07 to 3/19/07 | 5.36 to 5.45 (d) | 24,000,000 | 24,002,558 |
Genworth Life Insurance Co. | |||
3/1/07 | 5.40 (d)(f) | 5,000,000 | 5,000,000 |
Harrier Finance Funding LLC | |||
3/20/07 to 4/11/07 | 5.31 to 5.35 (b)(d) | 2,000,000 | 1,999,738 |
HBOS Treasury Services PLC | |||
3/26/07 | 5.44 (d) | 10,000,000 | 10,000,000 |
3/9/07 | 5.31 (b)(d) | 5,000,000 | 4,999,684 |
HSBC Finance Corp. | |||
3/26/07 | 5.35 (d) | 2,000,000 | 2,000,000 |
HSH Nordbank AG | |||
3/21/07 to 3/23/07 | 5.33 to 5.35 (b)(d) | 11,000,000 | 11,000,000 |
ING USA Annuity & Life Insurance Co. | |||
3/23/07 | 5.46 (d)(f) | 1,000,000 | 1,000,000 |
Intesa Bank Ireland PLC | |||
3/26/07 | 5.32 (b)(d) | 24,000,000 | 24,000,000 |
John Deere Capital Corp. | |||
4/20/07 | 5.43 (d) | 4,000,000 | 4,001,079 |
K2 (USA) LLC | |||
3/12/07 | 5.31 (b)(d) | 4,000,000 | 3,999,791 |
Kestrel Funding PLC US LLC 144A | |||
3/1/07 | 5.34 (b)(d) | 1,000,000 | 1,000,000 |
Key Bank NA | |||
3/19/07 | 5.38 (d) | 1,000,000 | 1,000,019 |
Merrill Lynch & Co., Inc. | |||
3/5/07 to 3/26/07 | 5.30 to 5.57 (d) | 27,000,000 | 27,001,415 |
Metropolitan Life Global Funding I | |||
3/6/07 | 5.33 (b)(d) | 2,213,000 | 2,213,000 |
Morgan Stanley | |||
3/1/07 to 3/15/07 | 5.38 to 5.45 (d) | 15,016,000 | 15,021,139 |
National Rural Utils. Coop. Finance Corp. | |||
3/5/07 | 5.30 (d) | 1,000,000 | 1,000,000 |
Nationwide Building Society | |||
3/28/07 | 5.44 (d) | 5,000,000 | 5,001,339 |
Nordea Bank AB | |||
3/2/07 | 5.26 (d) | 16,000,000 | 15,997,892 |
Pacific Life Global Funding | |||
3/5/07 | 5.37 (b)(d) | 2,000,000 | 2,000,684 |
Medium-Term Notes - continued | |||
Due | Yield (a) | Principal Amount | Value |
RACERS | |||
3/22/07 | 5.34% (b)(d) | $ 10,000,000 | $ 10,000,000 |
Royal Bank of Scotland PLC | |||
3/21/07 | 5.31 (b)(d) | 8,500,000 | 8,500,000 |
Security Life of Denver Insurance Co. | |||
5/29/07 | 5.44 (d)(f) | 1,000,000 | 1,000,000 |
Sigma Finance, Inc. | |||
3/12/07 to 3/15/07 | 5.31 to 5.32 (b)(d) | 11,000,000 | 10,999,550 |
Skandinaviska Enskilda Banken AB | |||
3/6/07 to 3/8/07 | 5.27 to 5.34 (d) | 46,000,000 | 45,998,975 |
SLM Corp. | |||
3/15/07 | 5.32 (b)(d) | 5,000,000 | 5,000,000 |
4/25/07 | 5.58 (d) | 20,000,000 | 20,017,936 |
Societe Generale | |||
3/2/07 | 5.31 (b)(d) | 11,000,000 | 11,000,276 |
3/30/07 | 5.27 (d) | 25,000,000 | 24,997,619 |
UniCredito Italiano Bank (Ireland) PLC | |||
3/30/07 | 5.29 (d) | 5,000,000 | 4,999,627 |
3/9/07 to 3/15/07 | 5.33 (b)(d) | 23,000,000 | 22,999,934 |
UniCredito Italiano Spa, New York | |||
3/5/07 to 5/20/07 | 5.33 to 5.37 (d) | 33,000,000 | 32,997,825 |
Vodafone Group PLC | |||
3/29/07 | 5.42 (d) | 3,000,000 | 2,999,963 |
Washington Mutual Bank | |||
5/16/07 to 6/26/07 | 5.34 to 5.40 (d) | 24,000,000 | 24,001,407 |
Washington Mutual Bank FA | |||
3/26/07 | 5.30 (d) | 12,000,000 | 11,999,979 |
4/30/07 | 5.34 (b)(d) | 13,000,000 | 13,000,000 |
Wells Fargo & Co. | |||
3/2/07 to 3/15/07 | 5.33 to 5.38 (d) | 10,000,000 | 10,000,000 |
WestLB AG | |||
3/12/07 to 3/30/07 | 5.36 to 5.39 (b)(d) | 7,500,000 | 7,500,388 |
TOTAL MEDIUM-TERM NOTES | 666,989,707 | ||
Short-Term Notes - 0.4% | |||
Metropolitan Life Insurance Co. | |||
4/2/07 | 5.48 (d)(f) | 5,000,000 | 5,000,000 |
New York Life Insurance Co. | |||
4/1/07 | 5.44 (d)(f) | 5,000,000 | 5,000,000 |
TOTAL SHORT-TERM NOTES | 10,000,000 | ||
Asset-Backed Securities - 0.5% | |||
Master Funding Trust I | |||
3/26/07 to 8/27/07 | 5.35 to 5.42 (d) | 10,504,000 | 10,504,000 |
Wind Trust | |||
1/25/08 | 5.32 (b)(d) | 2,000,000 | 2,000,000 |
TOTAL ASSET-BACKED SECURITIES | 12,504,000 | ||
Municipal Securities - 1.0% |
Due | Yield (a) | Principal Amount | Value |
Catholic Health Initiatives | $ 10,600,000 | $ 10,600,000 | ||
Connecticut Hsg. Fin. Auth. (Hsg. Mortgage Fin. Prog.) Series F2, 5.32%, 3/7/07 VRDN (d) | 5,000,000 | 5,000,000 | ||
Texas Gen. Oblig. | 11,500,000 | 11,500,000 | ||
TOTAL MUNICIPAL SECURITIES | 27,100,000 | |||
Repurchase Agreements - 23.5% | |||
Maturity Amount | |||
In a joint trading account at 5.34% dated 2/28/07 due 3/1/07 (Collateralized by U.S. Government Obligations) # | $ 417,062 | 417,000 | |
With: | |||
Banc of America Securities LLC at 5.35%, dated 2/28/07 due 3/1/07 (Collateralized by Corporate Obligations valued at $89,760,000, 5.25% - 5.79%, 8/15/13 - 11/15/14) | 88,013,078 | 88,000,000 | |
Barclays Capital, Inc. at 5.35%, dated 2/28/07 due 3/1/07 (Collateralized by Corporate Obligations valued at $116,280,000, 5.07% - 6.57%, 12/15/09 - 3/25/37) | 114,016,942 | 114,000,000 | |
Citigroup Global Markets, Inc. at 5.37%, dated 2/28/07 due 3/1/07 (Collateralized by Mortgage Loan Obligations valued at $84,000,001, 4.36% - 6.12%, 9/15/21 - 1/25/46) | 80,011,939 | 80,000,000 | |
Deutsche Bank Securities, Inc. at: | |||
5.35%, dated: | |||
1/2/07 due 3/2/07 (Collateralized by Corporate Obligations valued at $18,394,406, 0% - 13.5%, 3/1/08 - 6/15/37) | 18,157,825 | 18,000,000 | |
1/29/07 due 4/30/07 (Collateralized by Corporate Obligations valued at $9,450,001, 12.39%, 11/1/13) | 9,121,713 | 9,000,000 | |
5.37%, dated: | |||
1/19/07 due 4/19/07 (Collateralized by Corporate Obligations valued at $6,153,201, 5.15% - 9.5%, 1/15/11 - 5/10/45) | 6,080,550 | 6,000,000 | |
Repurchase Agreements - continued | |||
Maturity Amount | Value | ||
With: - continued | |||
Deutsche Bank Securities, Inc. at: - continued | |||
5.37%, dated: - continued | |||
2/12/07 due 5/14/07 (Collateralized by Corporate Obligations valued at $13,293,941, 0.92% - 9.5%, 10/1/07 - 5/25/36) | $ 13,176,464 | $ 13,000,000 | |
2/13/07 due 5/15/07 (Collateralized by Corporate Obligations valued at $13,292,380, 5.5% - 11.5%, 11/1/08 - 12/13/51) | 13,176,464 | 13,000,000 | |
Goldman Sachs & Co. at 5.41%, dated 2/21/07 due 5/24/07 (Collateralized by Corporate Obligations valued at $27,300,001, 6.85% - 8.75%, 11/15/13 - 11/15/15) (d)(e) | 26,359,464 | 26,000,000 | |
J.P. Morgan Securities, Inc. at 5.41%, dated 2/1/07 due 3/22/07 (Collateralized by Corporate Obligations valued at $19,027,388, 7.11% - 7.38%, 3/25/09 - 3/18/13) (d)(e) | 18,132,545 | 18,000,000 | |
Lehman Brothers, Inc. at 5.41%, dated 2/28/07 due 3/1/07 (Collateralized by Mortgage Loan Obligations valued at $99,752,009, 0% - 13.32%, 8/25/28 - 9/20/46) | 95,014,276 | 95,000,000 | |
Merrill Lynch, Pierce, Fenner & Smith at 5.42%, dated 1/17/07 due 4/17/07 (Collateralized by Corporate Obligations valued at $14,730,242, 9.86% - 10.75%, 12/1/11 - 2/1/16) (d)(e) | 14,189,700 | 14,000,000 | |
Morgan Stanley & Co. at: | |||
5.36%, dated 2/1/07 due 3/22/07 (Collateralized by Mortgage Loan Obligations valued at $19,072,799, 4.87% - 6.5%, 6/25/35 - 7/19/36) | 18,131,320 | 18,000,000 | |
5.43%, dated 2/28/07 due 3/1/07 (Collateralized by | 92,013,877 | 92,000,000 | |
TOTAL REPURCHASE AGREEMENTS | 604,417,000 | ||
TOTAL INVESTMENT PORTFOLIO - 101.7% (Cost $2,612,237,057) | 2,612,237,057 | ||
NET OTHER ASSETS - (1.7)% | (44,597,216) | ||
NET ASSETS - 100% | $ 2,567,639,841 | ||
Security Type Abbreviations |
VRDN VARIABLE RATE DEMAND NOTE |
Legend |
(a) Yield represents either the annualized yield at the date of purchase, or the stated coupon rate, or, for floating rate securities, the rate at period end. |
(b) Security exempt from registration under Rule 144A of the Securities Act of 1933. These securities may be resold in transactions exempt from registration, normally to qualified institutional buyers. At the end of the period, the value of these securities amounted to $336,922,573 or 13.1% of net assets. |
(c) Security or a portion of the security purchased on a delayed delivery or when-issued basis. |
(d) Coupon rates for floating and adjustable rate securities reflect the rates in effect at period end. Due dates for these security types are the next interest rate reset date or, when applicable, the final maturity date. |
(e) The maturity amount is based on the rate at period end. |
(f) Restricted securities - Investment in securities not registered under the Securities Act of 1933 (excluding 144A issues). At the end of the period, the value of restricted securities (excluding 144A issues) amounted to $44,000,000 or 1.7% of net assets. |
Additional information on each holding is as follows: |
Security | Acquisition Date | Cost |
Asset Funding Co. III LLC: | 11/7/06 | $ 10,000,000 |
5.39%, 3/5/07 | 8/29/06 | $ 9,000,000 |
Genworth Life Insurance Co. 5.40%, 3/1/07 | 7/31/06 | $ 5,000,000 |
ING USA Annuity & Life Insurance Co. 5.46%, 3/23/07 | 6/23/05 | $ 1,000,000 |
Lehman Brothers Holdings, Inc.: 5.43%, 3/12/07 | 1/10/07 | $ 6,000,000 |
5.46%, 6/28/07 | 12/11/06 | $ 2,000,000 |
Metropolitan Life Insurance Co. 5.48%, 4/2/07 | 3/26/02 | $ 5,000,000 |
New York Life Insurance Co. 5.44%, 4/1/07 | 2/28/02 | $ 5,000,000 |
Security Life of Denver Insurance Co. 5.44%, 5/29/07 | 8/26/05 | $ 1,000,000 |
# Additional Information on each counterparty to the repurchase agreement is as follows: |
Repurchase Agreement / Counterparty | Value |
$417,000 due 3/01/07 at 5.34% | |
ABN AMRO Bank N.V., New York Branch | $ 34,991 |
Banc of America Securities LLC | 112,581 |
Barclays Capital, Inc. | 111,970 |
Bear Stearns & Co., Inc. | 17,495 |
Countrywide Securities Corp. | 34,991 |
Credit Suisse Securities (USA) LLC | 17,495 |
Greenwich Capital Markets, Inc. | 17,495 |
HSBC Securities (USA), Inc. | 34,991 |
WestLB AG | 34,991 |
$ 417,000 | |
Income Tax Information |
At February 28, 2007, the fund had a capital loss carryforward of approximately $113,648 of which $88,157 and $25,491 will expire on February 28, 2013 and 2014, respectively. |
See accompanying notes which are an integral part of the financial statements.
Annual Report
Financial Statements
Statement of Assets and Liabilities
February 28, 2007 | ||
Assets | ||
Investment in securities, at value (including repurchase agreements of $604,417,000) - See accompanying schedule: Unaffiliated issuers (cost $2,612,237,057) | $ 2,612,237,057 | |
Cash | 35,461 | |
Receivable for fund shares sold | 53,177,864 | |
Interest receivable | 10,122,511 | |
Prepaid expenses | 5,695 | |
Total assets | 2,675,578,588 | |
Liabilities | ||
Payable for investments purchased | $ 72,870,089 | |
Delayed delivery | 10,000,000 | |
Payable for fund shares redeemed | 23,563,492 | |
Distributions payable | 751,857 | |
Accrued management fee | 455,475 | |
Other affiliated payables | 234,316 | |
Other payables and accrued expenses | 63,518 | |
Total liabilities | 107,938,747 | |
Net Assets | $ 2,567,639,841 | |
Net Assets consist of: | ||
Paid in capital | $ 2,567,848,433 | |
Distributions in excess of net investment income | (94,944) | |
Accumulated undistributed net realized gain (loss) on investments | (113,648) | |
Net Assets, for 2,567,636,760 shares outstanding | $ 2,567,639,841 | |
Net Asset Value, offering price and redemption price per share ($2,567,639,841 ÷ 2,567,636,760 shares) | $ 1.00 | |
Statement of Operations
Year ended February 28, 2007 | ||
Investment Income | ||
Interest (including $93,999 from affiliated interfund lending) | $ 84,402,611 | |
Expenses | ||
Management fee | $ 3,748,566 | |
Transfer agent fees | 1,985,005 | |
Accounting fees and expenses | 158,573 | |
Custodian fees and expenses | 46,177 | |
Independent trustees' compensation | 5,193 | |
Registration fees | 117,801 | |
Audit | 39,996 | |
Legal | 3,484 | |
Interest | 15,334 | |
Miscellaneous | 26,697 | |
Total expenses before reductions | 6,146,826 | |
Expense reductions | (49,985) | 6,096,841 |
Net investment income | 78,305,770 | |
Realized and Unrealized Gain (Loss) Net realized gain (loss) on: | ||
Investment securities: | ||
Unaffiliated issuers | 25,093 | |
Net increase in net assets resulting from operations | $ 78,330,863 | |
See accompanying notes which are an integral part of the financial statements.
Annual Report
Select Money Market Portfolio
Financial Statements - continued
Statement of Changes in Net Assets
Year ended | Year ended | |
Increase (Decrease) in Net Assets | ||
Operations | ||
Net investment income | $ 78,305,770 | $ 23,835,548 |
Net realized gain (loss) | 25,093 | 9,709 |
Net increase in net assets resulting from operations | 78,330,863 | 23,845,257 |
Distributions to shareholders from net investment income | (78,307,384) | (23,834,293) |
Share transactions at net asset value of $1.00 per share | 4,415,464,744 | 1,877,724,222 |
Reinvestment of distributions | 72,185,112 | 22,431,760 |
Cost of shares redeemed | (2,811,829,894) | (1,593,125,497) |
Net increase (decrease) in net assets and shares resulting from share transactions | 1,675,819,962 | 307,030,485 |
Total increase (decrease) in net assets | 1,675,843,441 | 307,041,449 |
Net Assets | ||
Beginning of period | 891,796,400 | 584,754,951 |
End of period (including distributions in excess of net investment income of $94,944 and distributions in excess of net investment income of $93,331, respectively) | $ 2,567,639,841 | $ 891,796,400 |
Financial Highlights
Years ended February 28, | 2007 | 2006 | 2005 | 2004 D | 2003 |
Selected Per-Share Data | |||||
Net asset value, beginning of period | $ 1.00 | $ 1.00 | $ 1.00 | $ 1.00 | $ 1.00 |
Income from Investment Operations | |||||
Net investment income | .049 | .033 | .013 | .009 | .015 |
Distributions from net investment income | (.049) | (.033) | (.013) | (.009) | (.015) |
Net asset value, end of period | $ 1.00 | $ 1.00 | $ 1.00 | $ 1.00 | $ 1.00 |
Total Return A, B | 4.97% | 3.32% | 1.29% | .86% | 1.50% |
Ratios to Average Net Assets C | |||||
Expenses before reductions | .39% | .40% | .39% | .40% | .38% |
Expenses net of fee waivers, if any | .39% | .40% | .39% | .40% | .38% |
Expenses net of all reductions | .38% | .40% | .39% | .40% | .38% |
Net investment income | 4.92% | 3.34% | 1.26% | .86% | 1.45% |
Supplemental Data | |||||
Net assets, end of period (000 omitted) | $ 2,567,640 | $ 891,796 | $ 584,755 | $ 607,620 | $ 1,079,578 |
A Total returns would have been lower had certain expenses not been reduced during the periods shown.
B Total returns do not include the effect of the former sales charges.
C Expense ratios reflect operating expenses of the Fund. Expenses before reductions do not reflect amounts reimbursed by the investment adviser or expense offset arrangements and do not represent the amount paid by the Fund during periods when reimbursements or reductions occur. Expenses net of fee waivers reflect expenses after reimbursement by the investment adviser but prior to reductions from expense offset arrangements. Expenses net of all reductions represent the net expenses paid by the Fund.
D For the year ended February 29.
See accompanying notes which are an integral part of the financial statements.
Annual Report
Notes to Financial Statements
For the period ended February 28, 2007
Money Market Portfolio (the Fund) is a fund of Fidelity Select Portfolios (the trust) and is authorized to issue an unlimited number of shares. The trust is registered under the Investment Company Act of 1940, as amended (the 1940 Act), as an open-end management investment company organized as a Massachusetts business trust. The financial statements have been prepared in conformity with accounting principles generally accepted in the United States of America, which require management to make certain estimates and assumptions at the date of the financial statements.
2. Significant Accounting Policies.
The following summarizes the significant accounting policies of the Fund:
Security Valuation. Net asset value per share is calculated as of the close of business of the New York Stock Exchange, normally 4:00 p.m. Eastern time. As permitted by compliance with certain conditions under Rule 2a-7 of the 1940 Act, securities are valued at amortized cost, which approximates value.
Investment Transactions and Income. Security transactions are accounted for as of trade date. Gains and losses on securities sold are determined on the basis of identified cost. Interest income is accrued as earned. Interest income includes coupon interest and amortization of premium and accretion of discount on debt securities.
Expenses. Most expenses of the trust can be directly attributed to a fund. Expenses which cannot be directly attributed are apportioned among each Fund in the trust. Expense estimates are accrued in the period to which they relate and adjustments are made when actual amounts are known.
Income Tax Information and Distributions to Shareholders. Each year, the Fund intends to qualify as a regulated investment company by distributing all of its taxable income and realized gains under Subchapter M of the Internal Revenue Code. As a result, no provision for income taxes is required in the accompanying financial statements.
Dividends are declared daily and paid monthly from net investment income. Distributions from realized gains, if any, are recorded on the ex-dividend date. Income and capital gain distributions are determined in accordance with income tax regulations, which may differ from generally accepted accounting principles.
Capital accounts within the financial statements are adjusted for permanent book-tax differences. These adjustments have no impact on net assets or the results of operations. Temporary book-tax differences will reverse in a subsequent period.
Book-tax differences are primarily due to deferred trustees compensation and capital loss carryforwards.
The tax-basis components of distributable earnings and the federal tax cost as of period end were as follows:
Unrealized appreciation | $ - |
Unrealized depreciation | - |
Net unrealized appreciation (depreciation) | - |
Capital loss carryforward | (113,648) |
Cost for federal income tax purposes | $ 2,612,237,057 |
The tax character of distributions paid was as follows:
February 28, 2007 | February 28, 2006 | |
Ordinary Income | $ 78,307,384 | $ 23,834,293 |
New Accounting Pronouncements. In July 2006, Financial Accounting Standards Board Interpretation No. 48, Accounting for Uncertainty in Income Taxes - an interpretation of FASB Statement 109 (FIN 48), was issued and is effective on the last business day of the semiannual reporting period for fiscal years beginning after December 15, 2006. FIN 48 sets forth a threshold for financial statement recognition, measurement and disclosure of a tax position taken or expected to be taken on a tax return. Management is currently evaluating the impact, if any, the adoption of FIN 48 will have on the Fund's net assets, results of operations and financial statement disclosures.
In addition, in September 2006, Statement of Financial Accounting Standards No. 157, Fair Value Measurements (SFAS 157), was issued and is effective for fiscal years beginning after November 15, 2007. SFAS 157 defines fair value, establishes a framework for measuring fair value and expands disclosures about fair value measurements. Management is currently evaluating the impact the adoption of SFAS 157 will have on the Fund's financial statement disclosures.
Annual Report
Notes to Financial Statements - continued
3. Operating Policies.
Repurchase Agreements. Fidelity Management & Research Company (FMR) has received an Exemptive Order from the Securities and Exchange Commission (the SEC) which permits the Fund and other affiliated entities of FMR to transfer uninvested cash balances into joint trading accounts which are then invested in repurchase agreements. The Fund may also invest directly with institutions in repurchase agreements. Repurchase agreements are collateralized by government or non-government securities. Upon settlement date, collateral is held in segregated accounts with custodian banks and may be obtained in the event of a default of the counterparty. The Fund monitors, on a daily basis, the value of the collateral to ensure it is at least equal to the principal amount of the repurchase agreement (including accrued interest). In the event of a default by the counterparty, realization of the collateral proceeds could be delayed, during which time the value of the collateral may decline.
Reverse Repurchase Agreements. To enhance its yield, the Fund may enter into reverse repurchase agreements whereby the Fund transfers securities to a counterparty who then agrees to transfer them back to the Fund at a future date and agreed upon price, reflecting a rate of interest below market rate. The Fund receives cash proceeds, which are invested in other securities, and agrees to repay the proceeds plus accrued interest in return for the same securities transferred. The Fund continues to receive interest payments on the transferred securities during the term of the reverse repurchase agreement. During the period that a reverse repurchase agreement is outstanding, the Fund identifies cash and liquid securities as segregated in its custodian records with a value at least equal to its obligation under the agreement. If the counterparty defaults on its obligation, because of insolvency or other reasons, the Fund could experience delays and costs in recovering the security or in gaining access to the collateral. The average daily balance during the period for which reverse repurchase agreements were outstanding amounted to $6,758,053. The weighted average interest rate was 4.30%. At period end, there were no reverse repurchase agreements outstanding.
Delayed Delivery Transactions and When-Issued Securities. The Fund may purchase or sell securities on a delayed delivery or when-issued basis. Payment and delivery may take place after the customary settlement period for that security. The price of the underlying securities and the date when the securities will be delivered and paid for are fixed at the time the transaction is negotiated. During the time a delayed delivery sell is outstanding, the contract is marked-to-market daily and equivalent deliverable securities are held for the transaction. The value of the securities purchased on a delayed delivery or when-issued basis are identified as such in the Fund's Schedule of Investments. The Fund may receive compensation for interest forgone in the purchase of a delayed delivery or when-issued security. With respect to purchase commitments, the Fund identifies securities as segregated in its records with a value at least equal to the amount of the commitment. Losses may arise due to changes in the value of the underlying securities or if the counterparty does not perform under the contract's terms, or if the issuer does not issue the securities due to political, economic, or other factors.
Restricted Securities. The Fund may invest in securities that are subject to legal or contractual restrictions on resale. These securities generally may be resold in transactions exempt from registration or to the public if the securities are registered. Disposal of these securities may involve time-consuming negotiations and expense, and prompt sale at an acceptable price may be difficult. Information regarding restricted securities is included at the end of the Fund's Schedule of Investments.
4. Fees and Other Transactions with Affiliates.
Management Fee. FMR and its affiliates provide the Fund with investment management related services for which the Fund pays a monthly management fee. The management fee is calculated on the basis of a group fee rate plus a total income-based component. The group fee rate averaged .12% during the period. The group fee rate is based upon the average net assets of all the mutual funds advised by FMR. The group fee rate decreases as assets under management increase and increases as assets under management decrease. The total income-based component is calculated according to a graduated schedule providing for different rates based on the Fund's gross annualized yield. The rate increases as the Fund's gross yield increases.
During the period the income-based portion of this fee was $1,847,345 or an annual rate of .12% of the Fund's average net assets. For the period, the Fund's total annual management fee rate was .24% of the Fund's average net assets.
Transfer Agent Fees. Fidelity Service Company, Inc. (FSC), an affiliate of FMR, is the Fund's transfer, dividend disbursing and shareholder servicing agent. FSC receives account fees and asset-based fees that vary according to account size and type of account. FSC pays for typesetting, printing and mailing of shareholder reports, except proxy statements. For the period the transfer agent fees were equivalent to an annual rate of ..12% of average net assets.
Accounting Fees. FSC maintains the Fund's accounting records. The fee is based on the level of average net assets for the month.
Annual Report
4. Fees and Other Transactions with Affiliates - continued
Interfund Lending Program. Pursuant to an Exemptive Order issued by the SEC, the Fund, along with other registered investment companies having management contracts with FMR, may participate in an interfund lending program. This program provides an alternative credit facility allowing the funds to borrow from, or lend money to, other participating affiliated funds. At period end, there were no interfund loans outstanding. The Fund's activity in this program during the period for which loans were outstanding was as follows:
Borrower or Lender | Average Daily | Weighted Average Interest Rate |
Lender | $ 16,256,359 | 5.34% |
5. Expense Reductions.
Through arrangements with the Fund's custodian and transfer agent, credits realized as a result of uninvested cash balances were used to reduce the Fund's expenses. During the period, these credits reduced the Fund's custody and transfer agent expenses by $2,508 and $47,477, respectively.
6. Other.
The Fund's organizational documents provide former and current trustees and officers with a limited indemnification against liabilities arising in connection with the performance of their duties to the Fund. In the normal course of business, the Fund may also enter into contracts that provide general indemnifications. The Fund's maximum exposure under these arrangements is unknown as this would be dependent on future claims that may be made against the Fund. The risk of material loss from such claims is considered remote.
Annual Report
Report of Independent Registered Public Accounting Firm
To the Trustees of Fidelity Select Portfolios and the Shareholders of Money Market Portfolio:
In our opinion, the accompanying statement of assets and liabilities, including the schedule of investments, and the related statements of operations and of changes in net assets and the financial highlights present fairly, in all material respects, the financial position of Money Market Portfolio (a fund of Fidelity Select Portfolios) at February 28, 2007, the results of its operations for the year then ended, the changes in its net assets for each of the two years in the period then ended and the financial highlights for each of the five years in the period then ended, in conformity with accounting principles generally accepted in the United States of America. These financial statements and financial highlights (hereafter referred to as "financial statements") are the responsibility of the Money Market Portfolio's management. Our responsibility is to express an opinion on these financial statements based on our audits. We conducted our audits of these financial statements in accordance with the standards of the Public Company Accounting Oversight Board (United States). Those standards require that we plan and perform the audit to obtain reasonable assurance about whether the financial statements are free of material misstatement. An audit includes examining, on a test basis, evidence supporting the amounts and disclosures in the financial statements, assessing the accounting principles used and significant estimates made by management, and evaluating the overall financial statement presentation. We believe that our audits, which included confirmation of securities at February 28, 2007 by correspondence with the custodian and brokers, provide a reasonable basis for our opinion.
/s/ PricewaterhouseCoopers LLP
PricewaterhouseCoopers LLP
Boston, Massachusetts
April 17, 2007
Annual Report
Trustees and Officers
The Trustees, Member of the Advisory Board, and executive officers of the trust and fund, as applicable, are listed below. The Board of Trustees governs the fund and is responsible for protecting the interests of shareholders. The Trustees are experienced executives who meet periodically throughout the year to oversee the fund's activities, review contractual arrangements with companies that provide services to the fund, and review the fund's performance. Each of the Trustees oversees 349 funds advised by FMR or an affiliate.
The Trustees hold office without limit in time except that (a) any Trustee may resign; (b) any Trustee may be removed by written instrument, signed by at least two-thirds of the number of Trustees prior to such removal; (c) any Trustee who requests to be retired or who has become incapacitated by illness or injury may be retired by written instrument signed by a majority of the other Trustees; and (d) any Trustee may be removed at any special meeting of shareholders by a two-thirds vote of the outstanding voting securities of the trust. Each Trustee who is not an interested person (as defined in the 1940 Act) (Independent Trustee), shall retire not later than the last day of the calendar year in which his or her 72nd birthday occurs. The Independent Trustees may waive this mandatory retirement age policy with respect to individual Trustees. The executive officers and Advisory Board Member hold office without limit in time, except that any officer and Advisory Board Member may resign or may be removed by a vote of a majority of the Trustees at any regular meeting or any special meeting of the Trustees. Except as indicated, each individual has held the office shown or other offices in the same company for the past five years.
The fund's Statement of Additional Information (SAI) includes more information about the Trustees. To request a free copy, call Fidelity at 1-800-544-8544.
Interested Trustees*:
Correspondence intended for each Trustee who is an interested person may be sent to Fidelity Investments, 82 Devonshire Street, Boston, Massachusetts 02109.
Name, Age; Principal Occupation | |
Edward C. Johnson 3d (76) | |
Year of Election or Appointment: 1980 Mr. Johnson is Chairman of the Board of Trustees. Mr. Johnson serves as President (2006-present), Chief Executive Officer, Chairman, and a Director of FMR Corp.; Chairman and a Director of FMR; Chairman and a Director of Fidelity Research & Analysis Company (FRAC); Chairman and a Director of Fidelity Investments Money Management, Inc.; and Chairman (2001- present) and a Director of FMR Co., Inc. In addition, Mr. Johnson serves as Chairman and Director of Fidelity International Limited (FIL). | |
Robert L. Reynolds (54) | |
Year of Election or Appointment: 2003 Mr. Reynolds is President and a Director of FMR (2005-present), Fidelity Investments Money Management, Inc. (2005-present), and FMR Co., Inc. (2005-present). Mr. Reynolds also serves as Vice Chairman (2006-present), a Director (2003-present), and Chief Operating Officer of FMR Corp. and a Director of Strategic Advisers, Inc. (2005-present). He also serves on the Board at Fidelity Investments Canada, Ltd. | |
* Trustees have been determined to be "Interested Trustees" by virtue of, among other things, their affiliation with the trust or various entities under common control with FMR.
Independent Trustees:
Correspondence intended for each Independent Trustee (that is, the Trustees other than the Interested Trustees) may be sent to Fidelity Investments, P.O. Box 55235, Boston, Massachusetts 02205-5235.
Name, Age; Principal Occupation | |
Dennis J. Dirks (58) | |
Year of Election or Appointment: 2005 Prior to his retirement in May 2003, Mr. Dirks was Chief Operating Officer and a member of the Board of The Depository Trust & Clearing Corporation (DTCC) (1999-2003). He also served as President, Chief Operating Officer, and Board member of The Depository Trust Company (DTC) (1999-2003) and President and Board member of the National Securities Clearing Corporation (NSCC) (1999-2003). In addition, Mr. Dirks served as Chief Executive Officer and Board member of the Government Securities Clearing Corporation (2001-2003) and Chief Executive Officer and Board member of the Mortgage-Backed Securities Clearing Corporation (2001-2003). Mr. Dirks also serves as a Trustee and a member of the Finance Committee of Manhattan College (2005-present) and a Trustee and a member of the Finance Committee of AHRC of Nassau County (2006-present). | |
Albert R. Gamper, Jr. (64) | |
Year of Election or Appointment: 2006 Prior to his retirement in December 2004, Mr. Gamper served as Chairman of the Board of CIT Group Inc. (commercial finance). During his tenure with CIT Group Inc. Mr. Gamper served in numerous senior management positions, including Chairman (1987-1989; 1999-2001; 2002-2004), Chief Executive Officer (1987-2004), and President (1989-2002). He currently serves as a member of the Board of Directors of Public Service Enterprise Group (utilities, 2001-present), Chairman of the Board of Governors, Rutgers University (2004-present), and Chairman of the Board of Saint Barnabas Health Care System. | |
George H. Heilmeier (70) | |
Year of Election or Appointment: 2004 Dr. Heilmeier is Chairman Emeritus of Telcordia Technologies (communication software and systems), where prior to his retirement, he served as company Chairman and Chief Executive Officer. He currently serves on the Boards of Directors of The Mitre Corporation (systems engineering and information technology support for the government), and HRL Laboratories (private research and development, 2004-present). He is Chairman of the General Motors Science & Technology Advisory Board and a Life Fellow of the Institute of Electrical and Electronics Engineers (IEEE). Dr. Heilmeier is a member of the Defense Science Board and the National Security Agency Advisory Board. He is also a member of the National Academy of Engineering, the American Academy of Arts and Sciences, and the Board of Overseers of the School of Engineering and Applied Science of the University of Pennsylvania. Previously, Dr. Heilmeier served as a Director of TRW Inc. (automotive, space, defense, and information technology, 1992-2002), Compaq (1994-2002), Automatic Data Processing, Inc. (ADP) (technology-based business outsourcing, 1995-2002), INET Technologies Inc. (telecommunications network surveillance, 2001-2004), and Teletech Holdings (customer management services). He is the recipient of the 2005 Kyoto Prize in Advanced Technology for his invention of the liquid crystal display, and a member of the Consumer Electronics Hall of Fame. | |
James H. Keyes (66) | |
Year of Election or Appointment: 2007 Prior to his retirement in 2003, Mr. Keyes was Chairman, President, and Chief Executive Officer of Johnson Controls, Inc. (automotive supplier, 1993-2003). He currently serves as a member of the boards of LSI Logic Corporation (semiconductor technologies), Navistar International Corporation (manufacture and sale of trucks, buses, and diesel engines, 2002-present), and Pitney Bowes, Inc. (integrated mail, messaging, and document management solutions). | |
Marie L. Knowles (60) | |
Year of Election or Appointment: 2001 Prior to Ms. Knowles' retirement in June 2000, she served as Executive Vice President and Chief Financial Officer of Atlantic Richfield Company (ARCO) (diversified energy, 1996-2000). From 1993 to 1996, she was a Senior Vice President of ARCO and President of ARCO Transportation Company. She served as a Director of ARCO from 1996 to 1998. She currently serves as a Director of Phelps Dodge Corporation (copper mining and manufacturing) and McKesson Corporation (healthcare service, 2002-present). Ms. Knowles is a Trustee of the Brookings Institution and the Catalina Island Conservancy and also serves as a member of the Advisory Board for the School of Engineering of the University of Southern California. | |
Ned C. Lautenbach (63) | |
Year of Election or Appointment: 2000 Mr. Lautenbach is Chairman of the Independent Trustees (2006-present). Mr. Lautenbach has been a partner of Clayton, Dubilier & Rice, Inc. (private equity investment firm) since September 1998. Previously, Mr. Lautenbach was with the International Business Machines Corporation (IBM) from 1968 until his retirement in 1998. Mr. Lautenbach serves as a Director of Sony Corporation (2006-present) and Eaton Corporation (diversified industrial) as well as the Philharmonic Center for the Arts in Naples, Florida. He also is a member of the Board of Trustees of Fairfield University (2005-present), as well as a member of the Council on Foreign Relations. | |
Cornelia M. Small (62) | |
Year of Election or Appointment: 2005 Ms. Small is a member (2000-present) and Chairperson (2002-present) of the Investment Committee, and a member (2002- present) of the Board of Trustees of Smith College. Previously, she served as Chief Investment Officer (1999-2000), Director of Global Equity Investments (1996-1999), and a member of the Board of Directors of Scudder, Stevens & Clark (1990-1997) and Scudder Kemper Investments (1997-1999). In addition, Ms. Small served as Co-Chair (2000-2003) of the Annual Fund for the Fletcher School of Law and Diplomacy. | |
William S. Stavropoulos (67) | |
Year of Election or Appointment: 2001 Mr. Stavropoulos is Chairman Emeritus of the Board of Directors of The Dow Chemical Company. Since joining The Dow Chemical Company in 1967, Mr. Stavropoulos served in numerous senior management positions, including President (1993-2000; 2002-2003), CEO (1995-2000; 2002-2004), and Chairman of the Executive Committee (2000-2004). Currently, he is a Director of NCR Corporation (data warehousing and technology solutions), Chemical Financial Corporation, Maersk Inc. (industrial conglomerate, 2002-present), Tyco International, Inc. (multinational manufacturing and services, 2007-present), and a member of the Advisory Board for Metalmark Capital (private equity investment firm, 2005-present). He is a special advisor to Clayton, Dubilier & Rice, Inc., a private equity investment firm. He also serves as a member of the Board of Trustees of the American Enterprise Institute for Public Policy Research. In addition, Mr. Stavropoulos is a member of The Business Council, J.P. Morgan International Council and the University of Notre Dame Advisory Council for the College of Science. | |
Kenneth L. Wolfe (68) | |
Year of Election or Appointment: 2005 Prior to his retirement in 2001, Mr. Wolfe was Chairman and Chief Executive Officer of Hershey Foods Corporation (1993-2001). He currently serves as a member of the boards of Adelphia Communications Corporation (2003-present), Bausch & Lomb, Inc., and Revlon Inc. (2004-present). | |
Advisory Board Member and Executive Officers:
Correspondence intended for each executive officer and Mr. Lynch may be sent to Fidelity Investments, 82 Devonshire Street, Boston, Massachusetts 02109.
Name, Age; Principal Occupation | |
Peter S. Lynch (63) | |
Year of Election or Appointment: 2003 Member of the Advisory Board of Fidelity Select Portfolios. Mr. Lynch is Vice Chairman and a Director of FMR, and Vice Chairman (2001-present) and a Director of FMR Co., Inc. Previously, Mr. Lynch served as a Trustee of the Fidelity funds (1990-2003). In addition, he serves as a Trustee of Boston College and as the Chairman of the Inner-City Scholarship Fund. | |
Kimberley H. Monasterio (43) | |
Year of Election or Appointment: 2007 President and Treasurer of Select Money Market Portfolio. Ms. Monasterio also serves as President and Treasurer of other Fidelity funds (2007-present) and is an employee of FMR (2004-present). Previously, Ms. Monasterio served as Deputy Treasurer of the Fidelity funds (2004-2006). Before joining Fidelity Investments, Ms. Monasterio served as Treasurer (2000-2004) and Chief Financial Officer (2002-2004) of the Franklin Templeton Funds and Senior Vice President of Franklin Templeton Services, LLC (2000-2004). | |
Boyce I. Greer (51) | |
Year of Election or Appointment: 2005 Vice President of Select Money Market Portfolio. Mr. Greer also serves as Vice President of certain Equity Funds (2005-present), certain Asset Allocation Funds (2005-present), Fixed-Income Funds (2006-present), and Money Market Funds (2006-present). Mr. Greer is also a Trustee of other investment companies advised by FMR (2003-present). He is an Executive Vice President of FMR (2005-present) and FMR Co., Inc. (2005-present), and Senior Vice President of Fidelity Investments Money Management, Inc. (2006-present). Previously, Mr. Greer served as a Director and Managing Director of Strategic Advisers, Inc. (2002-2005), and Executive Vice President (2000-2002) and Money Market Group Leader (1997-2002) of the Fidelity Investments Fixed Income Division. He also served as Vice President of Fidelity's Money Market Funds (1997-2002), Senior Vice President of FMR (1997-2002), and Vice President of FIMM (1998-2002). | |
Charles S. Morrison (46) | |
Year of Election or Appointment: 2005 Vice President of Select Money Market Portfolio. Mr. Morrison also serves as Vice President of Fidelity's Money Market Funds (2005-present) and certain Asset Allocation Funds (2002-present). Previously, he served as Vice President of Fidelity's Bond Funds (2002-2005) and certain Balanced Funds (2002-2005). He served as Vice President (2002-2005) and Bond Group Leader (2002-2005) of Fidelity Investments Fixed Income Division. Mr. Morrison is also Vice President of FIMM (2002-present) and FMR (2002-present). Mr. Morrison joined Fidelity Investments in 1987 as a Corporate Bond Analyst in the Fixed Income Research Division. | |
David L. Murphy (59) | |
Year of Election or Appointment: 2002 Vice President of Select Money Market Portfolio. Mr. Murphy also serves as Vice President of Fidelity's Money Market Funds (2002-present), certain Asset Allocation Funds (2003-present), Fixed-Income Funds (2005-present), and Balanced Funds (2005-present). He serves as Senior Vice President (2000-present) and Head (2004-present) of the Fidelity Investments Fixed Income Division. Mr. Murphy is also a Senior Vice President of Fidelity Investments Money Management, Inc. (2003-present) and an Executive Vice President of FMR (2005-present). Previously, Mr. Murphy served as Money Market Group Leader (2002-2004), Bond Group Leader (2000-2002), and Vice President of Fidelity's Taxable Bond Funds (2000-2002) and Fidelity's Municipal Bond Funds (2001-2002). | |
Eric D. Roiter (58) | |
Year of Election or Appointment: 1998 Secretary of Select Money Market Portfolio. He also serves as Secretary of other Fidelity funds; Vice President, General Counsel, and Secretary of FMR Co., Inc. (2001-present) and FMR; Assistant Secretary of Fidelity Management & Research (U.K.) Inc. (2001-present), Fidelity Research & Analysis Company (2001-present), and Fidelity Investments Money Management, Inc. (2001-present). Mr. Roiter is an Adjunct Member, Faculty of Law, at Boston College Law School (2003-present). Previously, Mr. Roiter served as Vice President and Secretary of Fidelity Distributors Corporation (FDC) (1998-2005). | |
Scott C. Goebel (39) | |
Year of Election or Appointment: 2007 Assistant Secretary of Select Money Market Portfolio. Mr. Goebel also serves as Assistant Secretary of other Fidelity funds (2007-present), Vice President and Secretary of FDC (2006-present), and is an employee of FMR. | |
R. Stephen Ganis (40) | |
Year of Election or Appointment: 2006 Anti-Money Laundering (AML) officer of Select Money Market Portfolio. Mr. Ganis also serves as AML officer of other Fidelity funds (2006-present) and FMR Corp. (2003-present). Before joining Fidelity Investments, Mr. Ganis practiced law at Goodwin Procter, LLP (2000-2002). | |
Joseph B. Hollis (58) | |
Year of Election or Appointment: 2006 Chief Financial Officer of Select Money Market Portfolio. Mr. Hollis also serves as Chief Financial Officer of other Fidelity funds. Mr. Hollis is President of Fidelity Pricing and Cash Management Services (FPCMS) (2005-present). Mr. Hollis also serves as President and Director of Fidelity Service Company, Inc. (2006-present). Previously, Mr. Hollis served as Senior Vice President of Cash Management Services (1999-2002) and Investment Management Operations (2002-2005). | |
Kenneth A. Rathgeber (59) | |
Year of Election or Appointment: 2004 Chief Compliance Officer of Select Money Market Portfolio. Mr. Rathgeber also serves as Chief Compliance Officer of other Fidelity funds (2004-present) and Executive Vice President of Risk Oversight for Fidelity Investments (2002-present). He is Chief Compliance Officer of FMR (2005-present), FMR Co., Inc. (2005-present), Fidelity Management & Research (U.K.) Inc. (2005-present), Fidelity Research & Analysis Company (2005-present), Fidelity Investments Money Management, Inc. (2005- present), and Strategic Advisers, Inc. (2005-present). Previously, Mr. Rathgeber served as Executive Vice President and Chief Operating Officer for Fidelity Investments Institutional Services Company, Inc. (1998-2002). | |
Bryan A. Mehrmann (45) | |
Year of Election or Appointment: 2005 Deputy Treasurer of Select Money Market Portfolio. Mr. Mehrmann also serves as Deputy Treasurer of other Fidelity funds (2005-present) and is an employee of FMR. Previously, Mr. Mehrmann served as Vice President of Fidelity Investments Institutional Services Group (FIIS)/Fidelity Investments Institutional Operations Corporation, Inc. (FIIOC) Client Services (1998-2004). | |
Kenneth B. Robins (37) | |
Year of Election or Appointment: 2005 Deputy Treasurer of Select Money Market Portfolio. Mr. Robins also serves as Deputy Treasurer of other Fidelity funds (2005- present) and is an employee of FMR (2004-present). Before joining Fidelity Investments, Mr. Robins worked at KPMG LLP, where he was a partner in KPMG's department of professional practice (2002-2004) and a Senior Manager (1999-2000). In addition, Mr. Robins served as Assistant Chief Accountant, United States Securities and Exchange Commission (2000-2002). | |
Robert G. Byrnes (40) | |
Year of Election or Appointment: 2005 Assistant Treasurer of Select Money Market Portfolio. Mr. Byrnes also serves as Assistant Treasurer of other Fidelity funds (2005-present) and is an employee of FMR (2005-present). Previously, Mr. Byrnes served as Vice President of FPCMS (2003-2005). Before joining Fidelity Investments, Mr. Byrnes worked at Deutsche Asset Management where he served as Vice President of the Investment Operations Group (2000-2003). | |
Peter L. Lydecker (53) | |
Year of Election or Appointment: 2004 Assistant Treasurer of Select Money Market Portfolio. Mr. Lydecker also serves as Assistant Treasurer of other Fidelity funds (2004) and is an employee of FMR. | |
Gary W. Ryan (48) | |
Year of Election or Appointment: 2005 Assistant Treasurer of Select Money Market Portfolio. Mr. Ryan also serves as Assistant Treasurer of other Fidelity funds (2005-present) and is an employee of FMR (2005-present). Previously, Mr. Ryan served as Vice President of Fund Reporting in FPCMS (1999-2005). | |
Salvatore Schiavone (41) | |
Year of Election or Appointment: 2005 Assistant Treasurer of Select Money Market Portfolio. Mr. Schiavone also serves as Assistant Treasurer of other Fidelity funds (2005-present) and is an employee of FMR (2005-present). Before joining Fidelity Investments, Mr. Schiavone worked at Deutsche Asset Management, where he most recently served as Assistant Treasurer (2003-2005) of the Scudder Funds and Vice President and Head of Fund Reporting (1996-2003). | |
Annual Report
Distributions
A total of .65% of the dividends distributed during the fiscal year was derived from interest on U.S. Government securities which is generally exempt from state income tax.
The fund designates $78,194,455 of distributions paid during the period January 1, 2007 year to February 28, 2007 as qualifying to be taxed as interest-related dividends for nonresident alien shareholders.
The fund will notify shareholders in January 2008 of amounts for use in preparing 2007 income tax returns.
Annual Report
Proxy Voting Results
A special meeting of Fidelity Select Portfolios' shareholders was held on September 20, 2006. The results of votes taken among shareholders on the proposal before them are reported below. Each vote reported represents one dollar of net asset value held on the record date for the meeting.
PROPOSAL 1 | ||
To elect a Board of Trustees. A | ||
# of | % of | |
Dennis J. Dirks | ||
Affirmative | 13,182,341,755.09 | 94.980 |
Withheld | 696,736,162.41 | 5.020 |
TOTAL | 13,879,077,917.50 | 100.000 |
Albert R. Gamper, Jr. | ||
Affirmative | 13,177,593,614.43 | 94.946 |
Withheld | 701,484,303.07 | 5.054 |
TOTAL | 13,879,077,917.50 | 100.000 |
Robert M. Gates | ||
Affirmative | 13,141,235,622.81 | 94.684 |
Withheld | 737,842,294.69 | 5.316 |
TOTAL | 13,879,077,917.50 | 100.000 |
George H. Heilmeier | ||
Affirmative | 13,140,073,210.00 | 94.675 |
Withheld | 739,004,707.50 | 5.325 |
TOTAL | 13,879,077,917.50 | 100.000 |
Edward C. Johnson 3d | ||
Affirmative | 13,106,284,587.54 | 94.432 |
Withheld | 772,793,329.96 | 5.568 |
TOTAL | 13,879,077,917.50 | 100.000 |
Stephen P. Jonas | ||
Affirmative | 13,168,282,872.88 | 94.879 |
Withheld | 710,795,044.62 | 5.121 |
TOTAL | 13,879,077,917.50 | 100.000 |
James H. KeyesB | ||
Affirmative | 13,164,603,089.66 | 94.852 |
Withheld | 714,474,827.84 | 5.148 |
TOTAL | 13,879,077,917.50 | 100.000 |
Marie L. Knowles | ||
Affirmative | 13,169,356,779.66 | 94.886 |
Withheld | 709,721,137.84 | 5.114 |
TOTAL | 13,879,077,917.50 | 100.000 |
Ned C. Lautenbach | ||
Affirmative | 13,166,485,155.52 | 94.866 |
Withheld | 712,592,761.98 | 5.134 |
TOTAL | 13,879,077,917.50 | 100.000 |
William O. McCoy | ||
Affirmative | 13,129,548,996.59 | 94.600 |
Withheld | 749,528,920.91 | 5.400 |
TOTAL | 13,879,077,917.50 | 100.000 |
Robert L. Reynolds | ||
Affirmative | 13,180,813,649.06 | 94.969 |
Withheld | 698,264,268.44 | 5.031 |
TOTAL | 13,879,077,917.50 | 100.000 |
# of | % of | |
Cornelia M. Small | ||
Affirmative | 13,170,500,616.42 | 94.895 |
Withheld | 708,577,301.08 | 5.105 |
TOTAL | 13,879,077,917.50 | 100.000 |
William S. Stavropoulos | ||
Affirmative | 13,143,284,328.22 | 94.699 |
Withheld | 735,793,589.28 | 5.301 |
TOTAL | 13,879,077,917.50 | 100.000 |
Kenneth L. Wolfe | ||
Affirmative | 13,162,946,758.47 | 94.840 |
Withheld | 716,131,159.03 | 5.160 |
TOTAL | 13,879,077,917.50 | 100.000 |
A Denotes trust-wide proposal and voting results. B Effective on or about January 1, 2007. | ||
Annual Report
Managing Your Investments
Fidelity offers several ways to conveniently manage your personal investments via your telephone or PC. You can access your account information, conduct trades and research your investments 24 hours a day.
By Phone
Fidelity Automated Service Telephone provides a single toll-free number to access account balances, positions, quotes and trading. It's easy to navigate the service, and on your first call, the system will help you create a personal identification number (PIN) for security.
(phone_graphic)Fidelity Automated Service Telephone (FAST®)
1-800-544-5555
Press
1 For mutual fund and brokerage trading.
2 For quotes.*
3 For account balances and holdings.
4 To review orders and mutual fund activity.
5 To change your PIN.
*0 To speak to a Fidelity representative.
By PC
Fidelity's web site on the Internet provides a wide range of information, including daily financial news, fund performance, interactive planning tools and news about Fidelity products and services.
(computer_graphic)Fidelity's Web Site
www.fidelity.com
* When you call the quotes line, please remember that a fund's yield and return will vary and, except for money market funds, share price will also vary. This means that you may have a gain or loss when you sell your shares. There is no assurance that money market funds will be able to maintain a stable $1 share price; an investment in a money market fund is not insured or guaranteed by the U.S. government. Total returns are historical and include changes in share price, reinvestment of dividends and capital gains, and the effects of any sales charges.
Annual Report
To Write Fidelity
We'll give your correspondence immediate attention and send you written confirmation upon completion of your request.
(letter_graphic)Making Changes
To Your Account
(such as changing name, address, bank, etc.)
Fidelity Investments
P.O. Box 770001
Cincinnati, OH 45277-0002
(letter_graphic)For Non-Retirement
Accounts
Buying shares
Fidelity Investments
P.O. Box 770001
Cincinnati, OH 45277-0003
Overnight Express
Fidelity Investments
Attn: Distribution Services
100 Crosby Parkway - KC1H
Covington, KY 41015
Selling shares
Fidelity Investments
P.O. Box 770001
Cincinnati, OH 45277-0035
Overnight Express
Fidelity Investments
Attn: Distribution Services
100 Crosby Parkway - KC1H
Covington, KY 41015
General Correspondence
Fidelity Investments
P.O. Box 500
Merrimack, NH 03054-0500
(letter_graphic)For Retirement
Accounts
Buying shares
Fidelity Investments
P.O. Box 770001
Cincinnati, OH 45277-0003
Selling shares
Fidelity Investments
P.O. Box 770001
Cincinnati, OH 45277-0035
Overnight Express
Fidelity Investments
Attn: Distribution Services
100 Crosby Parkway - KC1H
Covington, KY 41015
General Correspondence
Fidelity Investments
P.O. Box 500
Merrimack, NH 03054-0500
Annual Report
Investment Adviser
Fidelity Management & Research Company
Boston, MA
Investment Sub-Advisers
Fidelity Investments Money Management, Inc.,
Fidelity International Investment Advisors
Fidelity International Investment Advisors
(U.K. Limited)
Fidelity Research & Analysis Company
(formerly Fidelity Management & Research (Far East) Inc.)
General Distributor
Fidelity Distributors Corporation
Boston, MA
Transfer and Service Agent
Fidelity Service Company, Inc.
Boston, MA
Custodian
The Bank of New York
New York, NY
Corporate Headquarters
82 Devonshire Street
Boston, MA 02109
1-800-544-8888
The Fidelity Telephone Connection
Mutual Fund 24-Hour Service
Exchanges/Redemptions
and Account Assistance 1-800-544-6666
Product Information 1-800-544-8888
Retirement Accounts 1-800-544-4774
(8 a.m. - 9 p.m.)
TDD Service 1-800-544-0118
for the deaf and hearing impaired
(9 a.m. - 9 p.m. Eastern time)
Fidelity Automated Service
Telephone (FAST®) (automated graphic) 1-800-544-5555
(automated graphic) Automated line for quickest service
(Fidelity Investment logo)(registered trademark)
Corporate Headquarters
82 Devonshire St., Boston, MA 02109
www.fidelity.com
SELMM-UANN-0407
1.813604.102
Fidelity®
Select Portfolios®
Materials Sector
Select Chemicals Portfolio
Select Gold Portfolio
Select Materials Portfolio (formerly Select Industrial Materials Portfolio)
Select Paper and Forest Products Portfolio
Annual Report
February 28, 2007
(2_fidelity_logos) (Registered_Trademark)
Contents
Chairman's Message | ||
Notes to Shareholders | An explanation of the changes to the funds. | |
Chemicals | Performance | |
Management's Discussion | ||
Shareholder Expense Example | ||
Investment Changes | ||
Investments | ||
Financial Statements | ||
Notes to the Financial Statements | ||
Gold | Performance | |
Management's Discussion | ||
Shareholder Expense Example | ||
Investment Changes | ||
Investments | ||
Financial Statements | ||
Notes to the Financial Statements | ||
Materials | Performance | |
Management's Discussion | ||
Shareholder Expense Example | ||
Investment Changes | ||
Investments | ||
Financial Statements | ||
Notes to the Financial Statements | ||
Paper and Forest Products | Performance | |
Management's Discussion | ||
Shareholder Expense Example | ||
Investment Changes | ||
Investments | ||
Financial Statements | ||
Notes to the Financial Statements | ||
Report of Independent Registered Public Accounting Firm | ||
Trustees and Officers | ||
Distributions | ||
Proxy Voting Results |
To view a fund's proxy voting guidelines and proxy voting record for the 12-month period ended June 30, visit www.fidelity.com/proxyvotingresults or visit the Securities and Exchange Commission's (SEC) web site at www.sec.gov. You may also call 1-800-544-8544 to request a free copy of the proxy voting guidelines.
Standard & Poor's, S&P and S&P 500 are registered service marks of The McGraw-Hill Companies, Inc. and have been licensed for use by
Fidelity Distributors Corporation.
Other third party marks appearing herein are the property of their respective owners.
All other marks appearing herein are registered or unregistered trademarks or service marks of FMR Corp. or an affiliated company.
Annual Report
This report and the financial statements contained herein are submitted for the general information of the shareholders of the funds. This report is not authorized for distribution to prospective investors in the funds unless preceded or accompanied by an effective prospectus.
A fund files its complete schedule of portfolio holdings with the SEC for the first and third quarters of each fiscal year on Form N-Q. Forms N-Q are available on the SEC's web site at http://www.sec.gov. A fund's Forms N-Q may be reviewed and copied at the SEC's Public Reference Room in Washington, DC. Information regarding the operation of the SEC's Public Reference Room may be obtained by calling 1-800-SEC-0330. For a complete list of a fund's portfolio holdings, view the most recent quarterly holdings report, semiannual report, or annual report on Fidelity's web site at http://www.fidelity.com/holdings.
NOT FDIC INSURED · MAY LOSE VALUE · NO BANK GUARANTEE
Neither the funds nor Fidelity Distributors Corporation is a bank.
Annual Report
Chairman's Message
(Photograph of Edward C. Johnson 3d.)
Dear Shareholder:
Substantial single-day losses are not uncommon in the equity markets, and when they occur - as in late February - investors can be better served in the long term by buying good stocks at lower prices than by moving their money to the sidelines. While financial markets are always unpredictable, there are a number of time-tested principles that can put the historical odds in your favor.
One of the basic tenets is to invest for the long term. Over time, riding out the markets' inevitable ups and downs has proven much more effective than selling into panic or chasing the hottest trend. Even missing only a few of the markets' best days can significantly diminish investor returns. Patience also affords the benefits of compounding - of earning interest on additional income or reinvested dividends and capital gains. There are tax advantages and cost benefits to consider as well. The more you sell, the more taxes you pay, and the more you trade, the higher the costs. While staying the course doesn't eliminate risk, it can considerably lessen the effect of short-term declines.
You can further manage your investing risk through diversification. And today, more than ever, geographic diversification should be taken into account. Studies
indicate that asset allocation is the single most important determinant of a portfolio's long-term success. The right mix of stocks, bonds and cash - aligned to your particular risk tolerance and investment objective - is very important. Age-appropriate rebalancing is also an essential aspect of asset allocation. For younger investors, an emphasis on equities - which historically have been the best performing asset class over time - is encouraged. As investors near their specific goal, such as retirement or sending a child to college, consideration may be given to replacing volatile assets (e.g. common stocks) with more-stable fixed investments (bonds or savings plans).
A third investment principle - investing regularly - can help lower the average cost of your purchases. Investing a certain amount of money each month or quarter helps ensure you won't pay for all your shares at market highs. This strategy - known as dollar cost averaging - also reduces unconstructive "emotion" from investing, helping shareholders avoid selling weak performers just prior to an upswing, or chasing a hot performer just before a correction.
We invite you to contact us via the Internet, through our Investor Centers or over the phone. It is our privilege to provide you the information you need to make the investments that are right for you.
Sincerely,
/s/Edward C. Johnson 3d
Edward C. Johnson 3d
Annual Report
Notes to Shareholders:
Effective October 1, 2006, Fidelity restructured the Fidelity® Select Portfolios® equity product line. The restructuring aligned the equity funds' investment goals more closely with standard industry classifications and facilitated adoption of more-specific benchmark indexes to evaluate fund performance. As restructured, the equity funds generally align under the 10 sectors in the widely recognized Global Industry Classification Standard (GICS), developed by Standard & Poor's® (S&P®) and Morgan Stanley Capital InternationalSM (MSCI®): Consumer Discretionary, Consumer Staples, Energy, Financials, Health Care, Industrials, Information Technology, Materials, Telecommunications Services and Utilities. Changes to the funds ranged from simply adopting a new supplemental benchmark to, in some cases, changing investment policies and fund names.
For Banking, Communications Equipment (formerly Developing Communications), Construction and Housing, Consumer Discretionary (formerly Consumer Industries), Consumer Staples (formerly Food and Agriculture), Home Finance, Industrials (formerly Cyclical Industries), IT Services (formerly Business Services and Outsourcing) and Materials (formerly Industrial Materials), shareholders approved certain fundamental investment policy changes related to the restructuring at a special meeting of shareholders held September 20, 2006. All the equity funds adopted new benchmark indexes from MSCI, except for Gold (which adopted an S&P/Citigroup index), Natural Gas (which adopted an S&P index) and Natural Resources (which retained its current Goldman Sachs® index). Taken together, the name, policy and benchmark changes will make it easier for investors to distinguish funds in the product line and to evaluate Fidelity Management & Research Company's skill in managing the funds.
The Select equity portfolios also eliminated hourly pricing. The funds now price each business day as of the close of the New York Stock Exchange, normally 4:00 pm Eastern time. The funds also adopted Fidelity's standard fund market timing policy, as described in the funds' current prospectus, and removed the $7.50 fee formerly charged on exchanges made through non-automated channels.
Changes for each fund in the GICS Materials Sector are described in detail below.
Chemicals
The fund is now benchmarked to the MSCI US Investable Market Chemicals Index.
Gold
The fund is now benchmarked to the S&P/Citigroup BMI Global Gold Index.
Materials (formerly Industrial Materials)
Shareholders approved broadening the fund's focus beyond materials used in the industrials sector. The fund will invest in companies engaged in the manufacture, mining, processing or distribution of raw materials and intermediate goods of all types, including industrial or agricultural materials and unfinished goods, such as chemicals, gases, metals or other natural or synthetic materials. The fund is now benchmarked to the MSCI US Investable Market Materials Index.
Paper and Forest Products
The fund is now benchmarked to the MSCI US Investable Market Materials Index.
Annual Report
Performance
Average annual total return reflects the change in the value of an investment, assuming reinvestment of the fund's dividend income and capital gains (the profits earned upon the sale of securities that have grown in value) and assuming a constant rate of performance each year. The $10,000 table and the fund's returns do not reflect the deduction of taxes that a shareholder would pay on fund distributions or the redemption of fund shares. During periods of reimbursement by Fidelity a fund's total returns will be greater than it would be had the reimbursement not occurred. How a fund did yesterday is no guarantee of how it will do tomorrow.
Average Annual Total Returns
Periods ended February 28, 2007 | Past 1 | Past 5 | Past 10 |
Select Chemicals Portfolio | 18.51% | 15.28% | 10.32% |
$10,000 Over 10 Years
Let's say hypothetically that $10,000 was invested in Select Chemicals Portfolio on February 28, 1997. The chart shows how the value of your investment would have changed, and also shows how the S&P 500 Index performed over the same period.
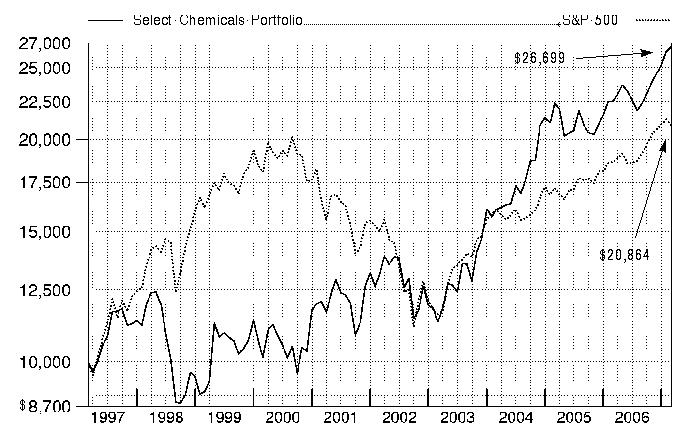
Annual Report
Management's Discussion of Fund Performance
Comments from Duffy Fischer, who became Portfolio Manager of Fidelity® Select Chemicals Portfolio on December 1, 2006
A rosy year for stocks wilted just prior to the end of the 12-month period ending February 28, 2007. On the day prior to the period's close, the Dow Jones Industrial AverageSM plunged 416 points and the Standard & Poor's 500SM Index lost roughly 3.5% of its value, plummeting nearly 50 points and marking the benchmark's worst single-day performance since the day the market reopened after the 9/11 terrorist attacks. Though investors were obviously rattled by the development, it was only the 22nd-biggest decline for the S&P 500® in 20 years, and it could not overshadow how well stocks performed for the 12 months overall. For much of the past year, investors grew confident that the economy would not fall into a recession, and they bid up most broad-based stock indexes for six consecutive months from August through January. Overall for the year ending February 28, 2007, the S&P 500 was up 11.97%, the Dow advanced 14.24%, the small-cap Russell 2000® Index gained 9.87% and the NASDAQ Composite® Index rose 6.66%.
For the 12 months ending February 28, 2007, the fund returned 18.51%, versus a gain of 21.18% for Morgan Stanley Capital InternationalSM
(MSCI®) US Investable Market Chemicals Index and the 17.23% advance of a blended index specific to this fund. This blended index is a combination of the Goldman Sachs® Cyclical Industries Index, which the fund was compared with through September, and the new MSCI benchmark mentioned above, which the fund was compared with during the period's final five months 1. During the same 12-month period, the fund also outpaced the S&P 500. During the first seven months of the review period, the fund outperformed the Goldman Sachs index. The fund's focus on chemicals stocks helped it avoid exposure to a number of lagging industries within the more broadly based index. For example, having no investments in homebuilders - an area typically outside the focus of the fund - boosted returns. At the same time, the fund's overweighting in traditional segments of the chemicals industry that performed well, including fertilizers/agricultural chemicals and industrial gases, helped the return, as did some good picks within diversified chemicals. Among individual names, Albemarle, which makes additives for end markets such as plastics, was a top contributor, as was specialty chemicals producer OM Group and agricultural biotechnology concern Monsanto. We sold Albemarle by period end. On the other hand, the fund had disappointing results from some holdings within the otherwise strong commodity and specialty chemicals groups, including Celanese and Chemtura, respectively. Having virtually no exposure to the solid gains from aerospace and defense stocks - the largest segment of the Goldman Sachs index - also hurt. In the final five months of the review period, the fund outperformed the MSCI index. Strong stock selection drove results, with Celanese and Chemtura bouncing back from their weak performances in the first seven months to become top contributors. Unfavorable industry positioning partially offset gains. Specifically, the fund's underweighting in the strong performing fertilizer/agricultural chemicals group and overweightings in the lagging industrial gases and specialty chemicals segments detracted. Among individual detractors, Georgia Gulf, which makes plastics primarily for the housing industry, declined sharply.
1 The fund's blended index is a customized index developed by Fidelity for the limited purpose of discussing the fund's performance for the 12-month period ending February 28, 2007. From March 1, 2006, through September 30, 2006, the fund compared its performance to the Goldman Sachs Cyclical Industries Index, which returned 1.77% during that period. On October 1, 2006, the fund began comparing its performance to a different index, the MSCI US Investable Market Chemicals Index, which returned 15.19% from October 1, 2006, through February 28, 2007. For the 12-month period ending February 28, 2007, the blended index (Goldman Sachs and MSCI) returned 17.23%
The views expressed above reflect those of the portfolio manager(s) only through the end of the period as stated on the cover of this report and do not necessarily represent the views of Fidelity or any other person in the Fidelity organization. Any such views are subject to change at any time based upon market or other conditions and Fidelity disclaims any responsibility to update such views. These views may not be relied on as investment advice and, because investment decisions for a Fidelity fund are based on numerous factors, may not be relied on as an indication of trading intent on behalf of any Fidelity fund.
Annual Report
Shareholder Expense Example
As a shareholder of the Fund, you incur two types of costs: (1) transaction costs, including redemption fees, exchange fees, and (2) ongoing costs, including management fees and other Fund expenses. This Example is intended to help you understand your ongoing costs (in dollars) of investing in the Fund and to compare these costs with the ongoing costs of investing in other mutual funds.
The Example is based on an investment of $1,000 invested at the beginning of the period and held for the entire period (September 1, 2006 to February 28, 2007).
Actual Expenses
The first line of the accompanying table provides information about actual account values and actual expenses. You may use the information in this line, together with the amount you invested, to estimate the expenses that you paid over the period. Simply divide your account value by $1,000.00 (for example, an $8,600 account value divided by $1,000.00 = 8.6), then multiply the result by the number in the first line under the heading entitled "Expenses Paid During Period" to estimate the expenses you paid on your account during this period. A small balance maintenance fee of $12.00 that is charged once a year may apply for certain accounts with a value of less than $2,000. This fee is not included in the table below. If it was, the estimate of expenses you paid during the period would be higher, and your ending account value lower, by this amount.
Hypothetical Example for Comparison Purposes
The second line of the accompanying table provides information about hypothetical account values and hypothetical expenses based on the Fund's actual expense ratio and an assumed rate of return of 5% per year before expenses, which is not the Fund's actual return. The hypothetical account values and expenses may not be used to estimate the actual ending account balance or expenses you paid for the period. You may use this information to compare the ongoing costs of investing in the Fund and other funds. To do so, compare this 5% hypothetical example with the 5% hypothetical examples that appear in the shareholder reports of the other funds. A small balance maintenance fee of $12.00 that is charged once a year may apply for certain accounts with a value of less than $2,000. This fee is not included in the table below. If it was, the estimate of expenses you paid during the period would be higher, and your ending account value lower, by this amount.
Please note that the expenses shown in the table are meant to highlight your ongoing costs only and do not reflect any transaction costs. Therefore, the second line of the table is useful in comparing ongoing costs only, and will not help you determine the relative total costs of owning different funds. In addition, if these transactional costs were included, your costs would have been higher.
Beginning | Ending | Expenses Paid | |
Actual | $ 1,000.00 | $ 1,192.50 | $ 5.49** |
Hypothetical (5% return per year before expenses) | $ 1,000.00 | $ 1,019.79 | $ 5.06** |
* Expenses are equal to the Fund's annualized expense ratio of 1.01%; multiplied by the average account value over the period, multiplied by 181/365 (to reflect the one-half year period).
**If fees effective January 1, 2007 had been in effect during the entire period, the annualized expense ratio would have been .94% and the expenses paid in the actual and hypothetical examples above would have been $5.11 and $4.71 respectively.
Annual Report
Investment Changes
Top Ten Stocks as of February 28, 2007 | ||
% of fund's | % of fund's net assets | |
E.I. du Pont de Nemours & Co. | 11.2 | 3.9 |
Dow Chemical Co. | 9.5 | 0.5 |
Monsanto Co. | 7.6 | 6.9 |
Air Products & Chemicals, Inc. | 6.8 | 6.2 |
Praxair, Inc. | 6.1 | 4.8 |
Ecolab, Inc. | 4.6 | 0.9 |
PPG Industries, Inc. | 4.5 | 3.1 |
Celanese Corp. Class A | 4.5 | 3.4 |
Sigma Aldrich Corp. | 4.1 | 0.0 |
Rohm & Haas Co. | 4.1 | 5.2 |
63.0 | ||
Top Industries (% of fund's net assets) | |||
As of February 28, 2007 | |||
 | Chemicals | 93.1% | |
 | All Others* | 6.9% | |

As of August 31, 2006 | |||
| Chemicals | 85.7% | |
 | Industrial Conglomerates | 6.1% | |
 | Trading Companies & Distributors | 4.0% | |
 | Metals & Mining | 1.1% | |
 | Marine | 0.8% | |
| All Others* | 2.3% | |

* Includes short-term investments and net other assets. |
Annual Report
Investments February 28, 2007
Showing Percentage of Net Assets
Common Stocks - 93.1% | |||
Shares | Value | ||
CHEMICALS - 93.1% | |||
Commodity Chemicals - 5.7% | |||
Celanese Corp. Class A | 187,886 | $ 5,369,782 | |
Georgia Gulf Corp. | 21,116 | 405,005 | |
Lyondell Chemical Co. | 14,200 | 452,412 | |
Spartech Corp. | 20,000 | 529,600 | |
6,756,799 | |||
Diversified Chemicals - 32.2% | |||
Ashland, Inc. | 35,400 | 2,321,532 | |
Cabot Corp. | 24,600 | 1,100,112 | |
Dow Chemical Co. | 258,300 | 11,313,540 | |
E.I. du Pont de Nemours & Co. | 265,100 | 13,453,825 | |
FMC Corp. | 33,356 | 2,454,001 | |
Fufeng Group Ltd. | 36,000 | 12,210 | |
Hercules, Inc. (a) | 28,700 | 578,592 | |
Huntsman Corp. | 70,000 | 1,431,500 | |
Olin Corp. | 29,000 | 501,700 | |
PPG Industries, Inc. | 81,600 | 5,406,000 | |
38,573,012 | |||
Fertilizers & Agricultural Chemicals - 9.9% | |||
American Vanguard Corp. (d) | 30,000 | 517,800 | |
Monsanto Co. | 173,200 | 9,125,908 | |
The Mosaic Co. | 53,900 | 1,371,216 | |
The Scotts Miracle-Gro Co. Class A | 20,000 | 882,200 | |
11,897,124 | |||
Industrial Gases - 16.0% | |||
Air Products & Chemicals, Inc. | 108,700 | 8,132,934 | |
Airgas, Inc. | 77,000 | 3,177,790 | |
L'Air Liquide SA | 2,310 | 529,676 | |
Praxair, Inc. | 118,060 | 7,283,121 | |
19,123,521 | |||
Specialty Chemicals - 29.3% | |||
Chemtura Corp. | 287,773 | 3,303,634 | |
Cytec Industries, Inc. | 45,000 | 2,646,900 | |
Ecolab, Inc. | 131,500 | 5,562,450 | |
H.B. Fuller Co. | 19,435 | 485,292 | |
International Flavors & Fragrances, Inc. | 10,000 | 468,000 | |
Lubrizol Corp. | 19,800 | 1,029,600 | |
Minerals Technologies, Inc. | 57,200 | 3,540,108 | |
Shares | Value | ||
Nalco Holding Co. | 24,600 | $ 587,940 | |
OM Group, Inc. (a) | 14,600 | 739,782 | |
OMNOVA Solutions, Inc. (a) | 195,300 | 1,187,424 | |
PolyOne Corp. (a) | 65,000 | 436,150 | |
Rockwood Holdings, Inc. (a) | 54,200 | 1,476,950 | |
Rohm & Haas Co. | 93,300 | 4,931,838 | |
RPM International, Inc. | 123,800 | 2,896,920 | |
Sigma Aldrich Corp. | 121,000 | 4,961,000 | |
Valspar Corp. | 30,300 | 821,433 | |
35,075,421 | |||
TOTAL CHEMICALS | 111,425,877 | ||
TOTAL COMMON STOCKS (Cost $86,736,383) | 111,425,877 | ||
Money Market Funds - 5.8% | |||
Fidelity Cash Central Fund, 5.35% (b) | 6,507,449 | 6,507,449 | |
Fidelity Securities Lending Cash Central Fund, 5.34% (b)(c) | 469,900 | 469,900 | |
TOTAL MONEY MARKET FUNDS (Cost $6,977,349) | 6,977,349 | ||
TOTAL INVESTMENT PORTFOLIO - 98.9% (Cost $93,713,732) | 118,403,226 | ||
NET OTHER ASSETS - 1.1% | 1,271,287 | ||
NET ASSETS - 100% | $ 119,674,513 | ||
Legend |
(a) Non-income producing |
(b) Affiliated fund that is available only to investment companies and other accounts managed by Fidelity Investments. The rate quoted is the annualized seven-day yield of the fund at period end. A complete unaudited listing of the fund's holdings as of its most recent quarter end is available upon request. |
(c) Investment made with cash collateral received from securities on loan. |
(d) Security or a portion of the security is on loan at period end. |
Affiliated Central Funds |
Information regarding fiscal year to date income earned by the Fund from investments in Fidelity Central Funds is as follows: |
Fund | Income earned |
Fidelity Cash Central Fund | $ 130,732 |
Fidelity Securities Lending Cash Central Fund | 8,007 |
Total | $ 138,739 |
See accompanying notes which are an integral part of the financial statements.
Annual Report
Financial Statements
Statement of Assets and Liabilities
February 28, 2007 | ||
Assets | ||
Investment in securities, at value (including securities loaned of $438,404) - See accompanying schedule: Unaffiliated issuers (cost $86,736,383) | $ 111,425,877 | |
Fidelity Central Funds (cost $6,977,349) | 6,977,349 | |
Total Investments (cost $93,713,732) | $ 118,403,226 | |
Cash | 4,435,190 | |
Receivable for fund shares sold | 1,645,238 | |
Dividends receivable | 215,246 | |
Distributions receivable from Fidelity Central Funds | 26,200 | |
Prepaid expenses | 364 | |
Other receivables | 1,726 | |
Total assets | 124,727,190 | |
Liabilities | ||
Payable for investments purchased | $ 3,973,742 | |
Payable for fund shares redeemed | 490,642 | |
Accrued management fee | 53,778 | |
Other affiliated payables | 29,785 | |
Other payables and accrued expenses | 34,830 | |
Collateral on securities loaned, at value | 469,900 | |
Total liabilities | 5,052,677 | |
Net Assets | $ 119,674,513 | |
Net Assets consist of: | ||
Paid in capital | $ 91,946,188 | |
Undistributed net investment income | 335,388 | |
Accumulated undistributed net realized gain (loss) on investments and foreign currency transactions | 2,703,407 | |
Net unrealized appreciation (depreciation) on investments and assets and liabilities in foreign currencies | 24,689,530 | |
Net Assets, for 1,695,123 shares outstanding | $ 119,674,513 | |
Net Asset Value, offering price and redemption price per share ($119,674,513 ÷ 1,695,123 shares) | $ 70.60 | |
Statement of Operations
Year ended February 28, 2007 | ||
Investment Income | ||
Dividends | $ 1,678,928 | |
Special dividends | 361,080 | |
Interest | 34 | |
Income from Fidelity Central Funds | 138,739 | |
Total income | 2,178,781 | |
Expenses | ||
Management fee | $ 548,328 | |
Transfer agent fees | 338,395 | |
Accounting and security lending fees | 43,988 | |
Custodian fees and expenses | 17,494 | |
Independent trustees' compensation | 393 | |
Registration fees | 26,970 | |
Audit | 38,648 | |
Legal | 2,015 | |
Interest | 4,428 | |
Miscellaneous | 8,799 | |
Total expenses before reductions | 1,029,458 | |
Expense reductions | (4,421) | 1,025,037 |
Net investment income (loss) | 1,153,744 | |
Realized and Unrealized Gain (Loss) Net realized gain (loss) on: | ||
Investment securities: | ||
Unaffiliated issuers | 12,883,229 | |
Foreign currency transactions | (373) | |
Total net realized gain (loss) | 12,882,856 | |
Change in net unrealized appreciation (depreciation) on: Investment securities | 1,610,917 | |
Assets and liabilities in foreign currencies | 36 | |
Total change in net unrealized appreciation (depreciation) | 1,610,953 | |
Net gain (loss) | 14,493,809 | |
Net increase (decrease) in net assets resulting from operations | $ 15,647,553 | |
See accompanying notes which are an integral part of the financial statements.
Annual Report
Statement of Changes in Net Assets
Year ended | Year ended | |
Increase (Decrease) in Net Assets | ||
Operations | ||
Net investment income (loss) | $ 1,153,744 | $ 1,392,660 |
Net realized gain (loss) | 12,882,856 | 8,464,954 |
Change in net unrealized appreciation (depreciation) | 1,610,953 | (19,060,117) |
Net increase (decrease) in net assets resulting from operations | 15,647,553 | (9,202,503) |
Distributions to shareholders from net investment income | (1,181,285) | (1,112,957) |
Distributions to shareholders from net realized gain | (13,503,574) | (3,981,293) |
Total distributions | (14,684,859) | (5,094,250) |
Share transactions | 64,860,259 | 165,619,044 |
Reinvestment of distributions | 14,065,125 | 4,584,255 |
Cost of shares redeemed | (74,979,800) | (278,412,897) |
Net increase (decrease) in net assets resulting from share transactions | 3,945,584 | (108,209,598) |
Redemption fees | 36,993 | 91,100 |
Total increase (decrease) in net assets | 4,945,271 | (122,415,251) |
Net Assets | ||
Beginning of period | 114,729,242 | 237,144,493 |
End of period (including undistributed net investment income of $335,388 and undistributed net investment income of $599,195, respectively) | $ 119,674,513 | $ 114,729,242 |
Other Information Shares | ||
Sold | 935,612 | 2,445,897 |
Issued in reinvestment of distributions | 209,640 | 70,266 |
Redeemed | (1,100,860) | (4,180,989) |
Net increase (decrease) | 44,392 | (1,664,826) |
Financial Highlights
Years ended February 28, | 2007 | 2006 | 2005 | 2004 I | 2003 |
Selected Per-Share Data | |||||
Net asset value, beginning of period | $ 69.50 | $ 71.52 | $ 51.75 | $ 36.79 | $ 43.09 |
Income from Investment Operations | |||||
Net investment income (loss) C | .82 F | .52 | .45 G | .46 | .38 |
Net realized and unrealized gain (loss) | 11.08 | (.33) | 19.83 | 14.82 | (6.21) |
Total from investment operations | 11.90 | .19 | 20.28 | 15.28 | (5.83) |
Distributions from net investment income | (.87) | (.52) | (.18) | (.37) | (.39) |
Distributions from net realized gain | (9.96) | (1.72) | (.38) | - | (.14) |
Total distributions | (10.83) | (2.24) | (.56) | (.37) | (.53) |
Redemption fees added to paid in capital C | .03 | .03 | .05 | .05 | .06 |
Net asset value, end of period | $ 70.60 | $ 69.50 | $ 71.52 | $ 51.75 | $ 36.79 |
Total Return A,B | 18.51% | .51% | 39.38% | 41.73% | (13.49)% |
Ratios to Average Net Assets D,H | |||||
Expenses before reductions | 1.06% | 1.04% | 1.08% | 1.48% | 1.54% |
Expenses net of fee waivers, if any | 1.06% | 1.04% | 1.08% | 1.48% | 1.54% |
Expenses net of all reductions | 1.06% | .99% | 1.04% | 1.43% | 1.50% |
Net investment income (loss) | 1.19% F | .78% | .73% G | 1.03% | .91% |
Supplemental Data | |||||
Net assets, end of period (000 omitted) | $ 119,675 | $ 114,729 | $ 237,144 | $ 50,502 | $ 28,339 |
Portfolio turnover rate E | 90% | 141% | 73% | 107% | 114% |
A Total returns would have been lower had certain expenses not been reduced during the periods shown. B Total returns do not include the effect of the former sales charges. C Calculated based on average shares outstanding during the period. D Fees and expenses of the underlying Fidelity Central Funds are not included in the Fund's expense ratio. The Fund indirectly bears its proportionate share of the expenses of any underlying Fidelity Central Funds. E Amount does not include the portfolio activity of any underlying Fidelity Central Funds. F Investment income per share reflects a special dividend which amounted to $.26 per share. Excluding the special dividend, the ratio of net investment income (loss) to average net assets would have been .82%. G As a result in the change in the estimate of the return of capital components of dividend income realized in the year ended February 28, 2004, net investment income per share and the ratio of net investment income to average net assets for the year ended February 28, 2005 have been reduced by $0.07 per share and .12%, respectively. The change in estimate has no impact on total net assets or total return of the Fund. H Expense ratios reflect operating expenses of the Fund. Expenses before reductions do not reflect amounts reimbursed by the investment adviser or reductions from brokerage service arrangements or other expense offset arrangements and do not represent the amount paid by the Fund during periods when reimbursements or reductions occur. Expenses net of fee waivers reflect expenses after reimbursement by the investment adviser but prior to reductions from brokerage service arrangements or other expense offset arrangements. Expenses net of all reductions represent the net expenses paid by the Fund. I For the year ended February 29. |
See accompanying notes which are an integral part of the financial statements.
Annual Report
Notes to Financial Statements
For the period ended February 28, 2007
1. Organization.
Chemicals Portfolio (the Fund) is a non-diversified fund of Fidelity Select Portfolios (the trust). The trust is registered under the Investment Company Act of 1940, as amended (the 1940 Act), as an open-end management investment company organized as a Massachusetts business trust. The Fund invests primarily in securities of companies whose principal business activities fall within specific industries. The Fund is authorized to issue an unlimited number of shares. The financial statements have been prepared in conformity with accounting principles generally accepted in the United States of America, which require management to make certain estimates and assumptions at the date of the financial statements.
2. Investments in Fidelity Central Funds.
The Fund may invest in Fidelity Central Funds which are open-end investment companies available only to other investment companies and accounts managed by FMR and its affiliates. The Fund's Schedule of Investments lists each of the Fidelity Central Funds as an investment of the Fund but does not include the underlying holdings of each Fidelity Central Fund. As an Investing Fund, the Fund indirectly bears its proportionate share of the expenses of the underlying Fidelity Central Funds. A complete unaudited list of holdings for each Fidelity Central Fund is available upon request. In addition, the financial statements of the Fidelity Central Funds, which are not covered by the Fund's Report of Independent Registered Public Accounting Firm, are available on the EDGAR Database on the SEC's web site, www.sec.gov, or upon request.
The Money Market Central Funds seek preservation of capital and current income and are managed by Fidelity Investments Money Management, Inc. (FIMM) an affiliate of Fidelity Management & Research Company (FMR).
3. Significant Accounting Policies.
The following summarizes the significant accounting policies of the Fund:
Security Valuation. Investments are valued and net asset value (NAV) per share is calculated (NAV calculation) as of the close of business of the New York Stock Exchange (NYSE), normally 4:00 p.m. Eastern time. During the period the Fund also calculated a NAV each hour on the hour (commencing at 10:00 a.m. Eastern time until one hour prior to the close of business on the NYSE). Effective October 1, 2006 the Fund eliminated hourly NAV calculation.
Wherever possible, the Fund uses independent pricing services approved by the Board of Trustees to value its investments. Equity securities, including restricted securities, for which market quotations are readily available, are valued at the last reported sale price or official closing price as reported by an independent pricing service on the primary market or exchange on which they are traded. In the event there were no sales during the day or closing prices are not available, securities are valued at the last quoted bid price. Investments in open-end mutual funds, including the Fidelity Central Funds, are valued at their closing net asset value each business day. Short-term securities with remaining maturities of sixty days or less for which quotations are not readily available are valued at amortized cost, which approximates value.
When current market prices or quotations are not readily available or do not accurately reflect fair value, valuations may be determined in accordance with procedures adopted by the Board of Trustees. For example, when developments occur between the close of a market and the close of the NYSE that may materially affect the value of some or all of the securities, or when trading in a security is halted, those securities may be fair valued. Factors used in the determination of fair value may include monitoring news to identify significant market or security specific events such as changes in the value of U.S. securities markets, reviewing developments in foreign markets and evaluating the performance of ADRs, futures contracts and exchange-traded funds. Because the Fund's utilization of fair value pricing depends on market activity, the frequency with which fair value pricing is used cannot be predicted and may be utilized to a significant extent. The value of securities used for NAV calculation under fair value pricing may differ from published prices for the same securities.
Foreign Currency. The Fund uses foreign currency contracts to facilitate transactions in foreign-denominated securities. Losses from these transactions may arise from changes in the value of the foreign currency or if the counterparties do not perform under the contracts' terms.
Foreign-denominated assets, including investment securities, and liabilities are translated into U.S. dollars at the exchange rate at period end. Purchases and sales of investment securities, income and dividends received and expenses denominated in foreign currencies are translated into U.S. dollars at the exchange rate in effect on the transaction date.
The effects of exchange rate fluctuations on investments are included with the net realized and unrealized gain (loss) on investment securities. Other foreign currency transactions resulting in realized and unrealized gain (loss) are disclosed separately.
Investment Transactions and Income. For financial reporting purposes, the Fund's investment holdings and NAV include trades executed through the end of the last business day of the period. The NAV for processing shareholder transactions includes trades executed through the end of the prior business day. Gains and losses on securities sold are determined on the basis of identified cost. Dividend income is recorded on the ex-dividend date, except for certain dividends from foreign securities where the ex-dividend date may have passed, which are recorded as soon as the Fund is informed of
Annual Report
Notes to Financial Statements - continued
3. Significant Accounting Policies - continued
Investment Transactions and Income - continued
the ex-dividend date. Non-cash dividends included in dividend income, if any, are recorded at the fair market value of the securities received. Large, non-recurring dividends recognized by the Fund are presented separately on the Statement of Operations as "Special Dividends" and the impact of these dividends is represented in the Financial Highlights. Distributions received on securities that represent a return of capital or capital gain are recorded as a reduction of cost of investments and/or as a realized gain. The Fund estimates the components of distributions received that may be considered return of capital distributions or capital gain distributions. Interest income and distributions from the Fidelity Central Funds are accrued as earned, with any distributions receivable as of period end included in Distributions receivable from Fidelity Central Funds on the Statement of Assets and Liabilities. Interest income includes coupon interest and amortization of premium and accretion of discount on debt securities. Investment income is recorded net of foreign taxes withheld where recovery of such taxes is uncertain.
Expenses. Most expenses of the trust can be directly attributed to a fund. Expenses which cannot be directly attributed are apportioned among each Fund in the trust. Expense estimates are accrued in the period to which they relate and adjustments are made when actual amounts are known.
Income Tax Information and Distributions to Shareholders. Each year, the Fund intends to qualify as a regulated investment company by distributing all of its taxable income and realized gains under Subchapter M of the Internal Revenue Code. As a result, no provision for income taxes is required in the accompanying financial statements. Foreign taxes are provided for based on the Fund's understanding of the tax rules and rates that exist in the foreign markets in which it invests.
Distributions are recorded on the ex-dividend date. Income and capital gain distributions are determined in accordance with income tax regulations, which may differ from generally accepted accounting principles. In addition, the Fund will claim a portion of the payment made to redeeming shareholders as a distribution for income tax purposes.
Capital accounts within the financial statements are adjusted for permanent book-tax differences. These adjustments have no impact on net assets or the results of operations. Temporary book-tax differences will reverse in a subsequent period.
Book-tax differences are primarily due to losses deferred due to wash sales.
The tax-basis components of distributable earnings and the federal tax cost as of period end were as follows:
Unrealized appreciation | $ 25,492,549 |
Unrealized depreciation | (893,925) |
Net unrealized appreciation (depreciation) | 24,598,624 |
Undistributed ordinary income | 1,038,532 |
Undistributed long-term capital gain | 166,603 |
Cost for federal income tax purposes | $ 93,804,602 |
The tax character of distributions paid was as follows:
February 28, 2007 | February 28, 2006 | |
Ordinary Income | $ 1,181,285 | $ 2,230,128 |
Long-term Capital Gains | 13,503,574 | 2,864,122 |
Total | $ 14,684,859 | $ 5,094,250 |
Trading (Redemption) Fees. Shares in the Fund held less than 30 days are subject to a redemption fee equal to .75% of the net asset value of shares redeemed. All redemption fees, including any estimated redemption fees paid by FMR, are retained by the Fund and accounted for as an addition to paid in capital. Shareholders were also subject to an additional $7.50 fee for shares exchanged into another Fidelity fund (see Note 6).
New Accounting Pronouncements. In July 2006, Financial Accounting Standards Board Interpretation No. 48, Accounting for Uncertainty in Income Taxes - an interpretation of FASB Statement 109 (FIN 48), was issued and is effective on the last business day of the semiannual reporting period for fiscal years beginning after December 15, 2006. FIN 48 sets forth a threshold for financial statement recognition, measurement and disclosure of a tax position taken or expected to be taken on a tax return. Management is currently evaluating the impact, if any, the adoption of FIN 48 will have on the Fund's net assets, results of operations and financial statement disclosures.
In addition, in September 2006, Statement of Financial Accounting Standards No. 157, Fair Value Measurements (SFAS 157), was issued and is effective for fiscal years beginning after November 15, 2007. SFAS 157 defines fair value, establishes a framework for measuring fair value and expands disclosures about fair value measurements. Management is currently evaluating the impact the adoption of SFAS 157 will have on the Fund's financial statement disclosures.
Annual Report
4. Operating Policies.
Repurchase Agreements. FMR has received an Exemptive Order from the Securities and Exchange Commission (the SEC) which permits the Fund and other affiliated entities of FMR to transfer uninvested cash balances into joint trading accounts which are then invested in repurchase agreements. The Fund may also invest directly with institutions in repurchase agreements. Repurchase agreements are collateralized by government or non-government securities. Upon settlement date, collateral is held in segregated accounts with custodian banks and may be obtained in the event of a default of the counterparty. The Fund monitors, on a daily basis, the value of the collateral to ensure it is at least equal to the principal amount of the repurchase agreement (including accrued interest). In the event of a default by the counterparty, realization of the collateral proceeds could be delayed, during which time the value of the collateral may decline.
5. Purchases and Sales of Investments.
Purchases and sales of securities, other than short-term securities, aggregated $87,471,462 and $105,061,835, respectively.
6. Fees and Other Transactions with Affiliates.
Management Fee. FMR and its affiliates provide the Fund with investment management related services for which the Fund pays a monthly management fee. The management fee is the sum of an individual fund fee rate that is based on an annual rate of .30% of the Fund's average net assets and a group fee rate that averaged .26% during the period. The group fee rate is based upon the average net assets of all the mutual funds advised by FMR. The group fee rate decreases as assets under management increase and increases as assets under management decrease. For the period, the total annual management fee rate was .56% of the Fund's average net assets.
Transfer Agent Fees. Fidelity Service Company, Inc. (FSC), an affiliate of FMR, is the Fund's transfer, dividend disbursing and shareholder servicing agent. FSC receives account fees and asset-based fees that vary according to account size and type of account. FSC pays for typesetting, printing and mailing of shareholder reports, except proxy statements. For the period the transfer agent fees were equivalent to an annual rate of ..35% of average net assets.
Accounting and Security Lending Fees. FSC maintains the Fund's accounting records. The accounting fee is based on the level of average net assets for the month. Under a separate contract, FSC administers the security lending program. The security lending fee is based on the number and duration of lending transactions.
Exchange Fees. During the period, FSC received the proceeds of a $7.50 fee to cover administrative costs associated with exchanges out of the Fund to any other Fidelity Select fund or to any other Fidelity fund made through non-automated channels. Effective October 1, 2006, the exchange fees were eliminated. For the period, exchange fees retained by FSC were as follows:
Retained | |
Chemicals Portfolio | $ 690 |
Brokerage Commissions. The Fund placed a portion of its portfolio transactions with brokerage firms which are affiliates of the investment adviser. The commissions paid to these affiliated firms were $372 for the period.
Interfund Lending Program. Pursuant to an Exemptive Order issued by the SEC, the Fund, along with other registered investment companies having management contracts with FMR, may participate in an interfund lending program. This program provides an alternative credit facility allowing the funds to borrow from, or lend money to, other participating affiliated funds. At period end, there were no interfund loans outstanding. The Fund's activity in this program during the period for which loans were outstanding was as follows:
Borrower or Lender | Average Daily | Weighted Average | Interest |
Borrower | $ 6,874,800 | 4.64% | $ 4,428 |
7. Committed Line of Credit.
The Fund participates with other funds managed by FMR in a $4.2 billion credit facility (the "line of credit") to be utilized for temporary or emergency purposes to fund shareholder redemptions or for other short-term liquidity purposes. The Fund has agreed to pay commitment fees on its pro rata portion of the line of credit, which amounted to $266 and is reflected in Miscellaneous Expense on the Statement of Operations. During the period, there were no borrowings on this line of credit.
Annual Report
Notes to Financial Statements - continued
8. Security Lending.
The Fund lends portfolio securities from time to time in order to earn additional income. On the settlement date of the loan, the Fund receives collateral (in the form of U.S. Treasury obligations, letters of credit and/or cash) against the loaned securities and maintains collateral in an amount not less than 100% of the market value of the loaned securities during the period of the loan. The market value of the loaned securities is determined at the close of business of the Fund and any additional required collateral is delivered to the Fund on the next business day. If the borrower defaults on its obligation to return the securities loaned because of insolvency or other reasons, a fund could experience delays and costs in recovering the securities loaned or in gaining access to the collateral. Any cash collateral received is invested in the Fidelity Securities Lending Cash Central Fund. The value of loaned securities and cash collateral at period end are disclosed on the Fund's Statement of Assets and Liabilities. Security lending income represents the income earned on investing cash collateral, less fees and expenses associated with the loan, plus any premium payments that may be received on the loan of certain types of securities. Security lending income is presented in the Statement of Operations as a component of income from Fidelity Central Funds. Net income from lending portfolio securities during the period amounted to $8,007.
9. Expense Reductions.
Many of the brokers with whom FMR places trades on behalf of the Fund provided services to the Fund in addition to trade execution. These services included payments of certain expenses on behalf of the Fund totaling $1,254 for the period. In addition, through arrangements with the Fund's transfer agent, credits realized as a result of uninvested cash balances were used to reduce the Fund's expenses. During the period, these credits reduced the Fund's transfer agent expenses by $1,509.
10. Other.
The Fund's organizational documents provide former and current trustees and officers with a limited indemnification against liabilities arising in connection with the performance of their duties to the Fund. In the normal course of business, the Fund may also enter into contracts that provide general indemnifications. The Fund's maximum exposure under these arrangements is unknown as this would be dependent on future claims that may be made against the Fund. The risk of material loss from such claims is considered remote.
The United States Securities and Exchange Commission ("SEC") is conducting an investigation of FMR (covering the years 2002 to 2004) arising from gifts, gratuities and business entertainment provided by certain brokers to certain individuals who were employed on FMR's domestic equity trading desk during that period. FMR is in discussions with the SEC staff regarding the possible resolution of the matter, but as of period-end no final resolution has been reached.
In December 2006, the Independent Trustees completed their own investigation of the matter with the assistance of independent counsel. The Independent Trustees and FMR agree that, despite the absence of proof that the Fidelity mutual funds experienced diminished execution quality as a result of the improper receipt of gifts and business entertainment, the conduct at issue was serious and is worthy of redress. Accordingly, the Independent Trustees have requested and FMR has agreed to pay $42 million to Fidelity mutual funds, plus interest to be determined at the time that payment is made. A method of allocating this payment among the funds has not yet been determined. The total payment to the Fund is not anticipated to have a material impact on the Fund's net assets. In addition, FMR reimbursed related legal expenses which are recorded in the accompanying Statement of Operations as an expense reduction.
Annual Report
Performance
Average annual total return reflects the change in the value of an investment, assuming reinvestment of the fund's dividend income and capital gains (the profits earned upon the sale of securities that have grown in value) and assuming a constant rate of performance each year. The $10,000 table and the fund's returns do not reflect the deduction of taxes that a shareholder would pay on fund distributions or the redemption of fund shares. During periods of reimbursement by Fidelity, a fund's total returns will be greater than it would be had the reimbursement not occurred. How a fund did yesterday is no guarantee of how it will do tomorrow.
Average Annual Total Returns
Periods ended February 28, 2007 | Past 1 | Past 5 | Past 10 |
Gold | 16.19% | 22.89% | 6.96% |
$10,000 Over 10 Years
Let's say hypothetically that $10,000 was invested in Gold on February 28, 1997. The chart shows how the value of your investment would have changed, and also shows how the S&P 500 Index performed over the same period.
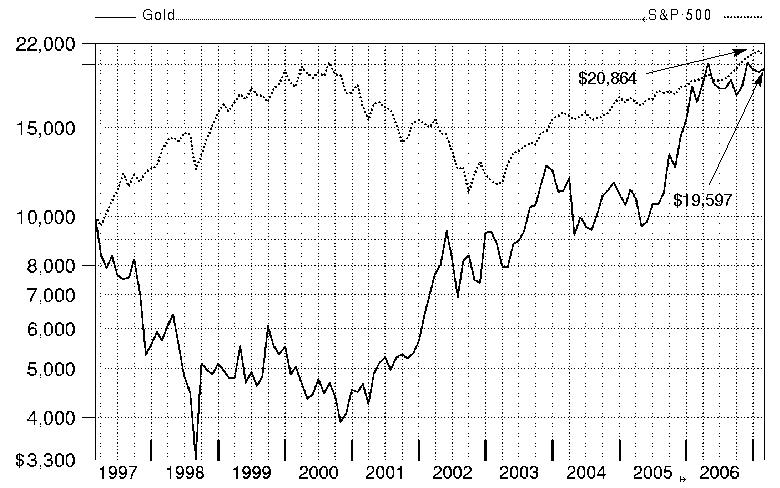
Annual Report
Management's Discussion of Fund Performance
Comments from Daniel Dupont, Portfolio Manager of Fidelity® Select Gold Portfolio
A rosy year for stocks wilted just prior to the end of the 12-month period ending February 28, 2007. On the day prior to the period's close, the Dow Jones Industrial AverageSM plunged 416 points and the Standard & Poor's 500SM Index lost roughly 3.5% of its value, plummeting nearly 50 points and marking the benchmark's worst single-day performance since the day the market reopened after the 9/11 terrorist attacks. Though investors were obviously rattled by the development, it was only the 22nd-biggest decline for the S&P 500® in 20 years, and it could not overshadow how well stocks performed for the 12 months overall. For much of the past year, investors grew confident that the economy would not fall into a recession, and they bid up most broad-based stock indexes for six consecutive months from August through January. Overall for the year ending February 28, 2007, the S&P 500 was up 11.97%, the Dow advanced 14.24%, the small-cap Russell 2000® Index gained 9.87% and the NASDAQ Composite® Index rose 6.66%.
During the past year, Gold returned 16.19%, beating the 10.69% return of the Standard & Poor's®/Citigroup BMI Global Gold Index and also topping the 12.67% gain of a blended index specific to this fund. This blended index is a combination of the Goldman Sachs® Natural Resources Index, which the fund was compared with through September, and the new S&P®/Citigroup benchmark mentioned above, which the fund was compared with during the period's final five months1. During the same 12-month period, the portfolio also beat the S&P 500. For the first seven months of the review period, the fund outperformed the Goldman Sachs index. Favorable stock selection in precious metals and minerals added considerable value, although the benefits largely were offset by an overweighted exposure to that group, which lagged the index. The fund's positions in platinum producers were especially beneficial. A lack of exposure to most energy-related groups also helped, as crude oil and natural gas prices fell sharply in the early fall after peaking during the summer. During the same seven months, the price of gold finished modestly higher, which helped the fund. Our cash position provided a boost as well. Conversely, unrewarding picks in the diversified metals and mining segment hurt the fund's results. Not owning integrated oil and gas producers, one of the stronger energy categories and a major group in the Goldman Sachs index, also detracted. Further, the fund's absolute performance was curbed by unfavorable currency movements. Among individual holdings, Canada-based Cambior was a notable contributor; the company received a lucrative buyout offer from IAMGOLD in September, helping the stock. Also boosting the fund's return was Aquarius Platinum, a Bermuda-incorporated company based in Australia, with significant properties in South Africa. Both contributors were out-of-benchmark positions, and I sold Aquarius Platinum to lock in profits. On the downside, Aber Diamond was the fund's largest detractor during the seven-month period. Flat diamond prices and a harsh Canadian winter that closed access roads for longer than normal were factors hurting the stock. During the final five months of the period, the fund handily outperformed the S&P/Citigroup index. Stock picking in precious metals and minerals again added value, along with effective choices in diversified metals and mining. Significantly underweighting Canada-based Barrick Gold aided our results. Also having a positive impact on performance was Bema Gold, another Canadian producer of the yellow metal, which was acquired during the period by Kinross Gold. Conversely, not owning Yamana Gold detracted. Although I thought the stock was overvalued, it advanced amid excitement about the company's flagship Chapada mine in Brazil beginning production on schedule in November and early indications that production was meeting or exceeding expectations. Overall, the fund shifted to a higher concentration in gold stocks, bringing it more in line with the new S&P/Citigroup benchmark.
1 The fund's blended index is a customized index developed by Fidelity for the limited purpose of discussing the fund's performance for the 12-month period ending February 28, 2007. From March 1, 2006, through September 30, 2006, the fund compared its performance to the Goldman Sachs Natural Resources Index, which returned 2.61% during that period. On October 1, 2006, the fund began comparing its performance to a different index, the S&P/Citigroup BMI Global Gold Index, which returned 9.80% from October 1, 2006, through February 28, 2007. For the 12-month period ending February 28, 2007, the blended index (Goldman Sachs and S&P/Citigroup) returned 12.67%.
The views expressed above reflect those of the portfolio manager(s) only through the end of the period as stated on the cover of this report and do not necessarily represent the views of Fidelity or any other person in the Fidelity organization. Any such views are subject to change at any time based upon market or other conditions and Fidelity disclaims any responsibility to update such views. These views may not be relied on as investment advice and, because investment decisions for a Fidelity fund are based on numerous factors, may not be relied on as an indication of trading intent on behalf of any Fidelity fund.
Annual Report
Shareholder Expense Example
As a shareholder of the Fund, you incur two types of costs: (1) transaction costs, including sales charges (loads) on purchase payments or redemption proceeds, redemption fees, exchange fees, and (2) ongoing costs, including management fees, distribution and/or service (12b-1) fees and other Fund expenses. This Example is intended to help you understand your ongoing costs (in dollars) of investing in the Fund and to compare these costs with the ongoing costs of investing in other mutual funds.
The actual Example is based on an investment of $1,000 at the beginning of the period and held for the entire period (September 1, 2006 to February 28, 2007) for the Gold class and for the entire period (December 12, 2006 to February 28, 2007) for Class A, Class T, Class B, Class C, and Institutional Class. The hypothetical expense Example is based on an investment of $1,000 invested for one-half year period (September 1, 2006 to February 28, 2007).
Actual Expenses
The first line of the accompanying table for each class of the Fund provides information about actual account values and actual expenses. You may use the information in this line, together with the amount you invested, to estimate the expenses that you paid over the period. Simply divide your account value by $1,000.00 (for example, an $8,600 account value divided by $1,000.00 = 8.6), then multiply the result by the number in the first line for a class of the Fund under the heading entitled "Expenses Paid During Period" to estimate the expenses you paid on your account during this period. A small balance maintenance fee of $12.00 that is charged once a year may apply for certain accounts with a value of less than $2,000. This fee is not included in the table below. If it was, the estimate of expenses you paid during the period would be higher, and your ending account value lower, by this amount.
Hypothetical Example for Comparison Purposes
The second line of the accompanying table for each class of the Fund provides information about hypothetical account values and hypothetical expenses based on a Class' actual expense ratio and an assumed rate of return of 5% per year before expenses, which is not the Class' actual return. The hypothetical account values and expenses may not be used to estimate the actual ending account balance or expenses you paid for the period. You may use this information to compare the ongoing costs of investing in the Fund and other funds. To do so, compare this 5% hypothetical example with the 5% hypothetical examples that appear in the shareholder reports of the other funds. A small balance maintenance fee of $12.00 that is charged once a year may apply for certain accounts with a value of less than $2,000. This fee is not included in the table below. If it was, the estimate of expenses you paid during the period would be higher, and your ending account value lower, by this amount.
Please note that the expenses shown in the table are meant to highlight your ongoing costs only and do not reflect any transaction costs. Therefore, the second line of the table is useful in comparing ongoing costs only, and will not help you determine the relative total costs of owning different funds. In addition, if these transactional costs were included, your costs would have been higher.
Beginning | Ending | Expenses | |
Class A | |||
Actual | $ 1,000.00 | $ 998.10 | $ 2.44B |
HypotheticalA | $ 1,000.00 | $ 1,019.19 | $ 5.66 C |
Class T | |||
Actual | $ 1,000.00 | $ 997.00 | $ 3.16B |
HypotheticalA | $ 1,000.00 | $ 1,017.55 | $ 7.30 C |
Class B | |||
Actual | $ 1,000.00 | $ 996.20 | $ 4.23B |
HypotheticalA | $ 1,000.00 | $ 1,015.08 | $ 9.79 C |
Class C | |||
Actual | $ 1,000.00 | $ 995.60 | $ 4.36 B |
HypotheticalA | $ 1,000.00 | $ 1,014.78 | $ 10.09 C |
Gold | |||
Actual | $ 1,000.00 | $ 1,050.90 | $ 4.47 B |
HypotheticalA | $ 1,000.00 | $ 1,020.43 | $ 4.41 C |
Institutional Class | |||
Actual | $ 1,000.00 | $ 998.40 | $ 2.03 B |
HypotheticalA | $ 1,000.00 | $ 1,020.13 | $ 4.71 C |
A 5% return per year before expenses
B Actual expenses are equal to each Class' annualized expense ratio (shown in the table below); multiplied by the average account value over the period, multiplied by 181/365 (to reflect the one-half year period) for the Gold class and multiplied by 79/365 (to reflect the period December 12, 2006 to February 28, 2007) for the Class A, Class T, Class B, Class C and Institutional Class.
C Hypothetical expenses are equal to each Class' annualized expense ratio (shown in the table below); multiplied by the average account value over the period, multiplied by 181/365 (to reflect the one-half year period).
Annual Report
Select Gold Portfolio
Shareholder Expense Example - continued
Annualized | |
Class A | 1.13% |
Class T | 1.46% |
Class B | 1.96% |
Class C | 2.02% |
Gold | .88% |
Institutional Class | .94% |
Annual Report
Investment Changes
Top Ten Stocks as of February 28, 2007 | ||
% of fund's | % of fund's net assets | |
Newcrest Mining Ltd. | 9.6 | 9.1 |
Meridian Gold, Inc. | 9.6 | 9.5 |
Newmont Mining Corp. | 8.5 | 4.6 |
Barrick Gold Corp. | 8.1 | 5.4 |
IAMGOLD Corp. | 5.7 | 2.5 |
Kinross Gold Corp. | 5.5 | 0.0 |
Goldcorp, Inc. | 4.6 | 2.3 |
Lihir Gold Ltd. | 4.4 | 1.9 |
Gold Fields Ltd. sponsored ADR | 4.1 | 1.3 |
Arizona Star Resource Corp. | 3.0 | 2.0 |
63.1 | ||
Top Industries (% of fund's net assets) | |||
As of February 28, 2007 | |||
| Gold | 78.8% | |
 | Precious Metals & Minerals | 10.4% | |
 | Diversified Metals & Mining | 1.1% | |
| All Others* | 9.7% | |

As of August 31, 2006 | |||
| Gold | 54.8% | |
| Precious Metals & Minerals | 26.4% | |
| Diversified Metals & Mining | 9.2% | |
| All Others* | 9.6% | |

* Includes short-term investments and net other assets. |
Annual Report
Investments February 28, 2007
Showing Percentage of Net Assets
Common Stocks - 90.3% | |||
Shares | Value | ||
Australia - 10.0% | |||
METALS & MINING - 10.0% | |||
Gold - 9.6% | |||
Newcrest Mining Ltd. | 7,999,971 | $ 142,145,664 | |
Precious Metals & Minerals - 0.4% | |||
Central Asia Gold Ltd. (a)(e) | 12,025,834 | 5,874,969 | |
TOTAL METALS & MINING | 148,020,633 | ||
Canada - 51.0% | |||
METALS & MINING - 51.0% | |||
Gold - 42.9% | |||
Agnico-Eagle Mines Ltd. | 200,000 | 7,873,114 | |
Alamos Gold, Inc. (a) | 600,000 | 4,745,415 | |
Arizona Star Resource Corp. (a)(e) | 3,800,000 | 43,863,024 | |
Barrick Gold Corp. | 4,000,000 | 119,430,550 | |
Bema Gold Corp. warrants 9/7/11 (a) | 600,000 | 1,282,545 | |
Coral Gold Resources Ltd. (a)(e) | 672,200 | 2,034,618 | |
Crystallex International Corp. (a) | 11,000,000 | 32,918,644 | |
Eldorado Gold Corp. (a) | 1,500,000 | 8,952,161 | |
Goldcorp, Inc. | 2,516,900 | 67,530,522 | |
High River Gold Mines Ltd. (a)(f) | 1,000,000 | 1,915,267 | |
High River Gold Mines Ltd. warrants 1/27/08 (a) | 332,500 | 107,730 | |
IAMGOLD Corp. | 10,000,000 | 83,536,403 | |
Kinross Gold Corp. (a) | 5,787,600 | 81,354,490 | |
Meridian Gold, Inc. (a)(e) | 5,160,000 | 141,535,462 | |
Novagold Resources, Inc. (a) | 600,000 | 9,901,244 | |
Orezone Resources, Inc. Class A (a)(e) | 10,000,000 | 18,041,127 | |
Tone Resources Ltd. (a)(e) | 1,908,400 | 2,366,021 | |
White Knight Resources Ltd. (a)(e) | 3,955,300 | 6,087,418 | |
633,475,755 | |||
Precious Metals & Minerals - 8.1% | |||
Aber Diamond Corp. | 799,990 | 28,591,836 | |
Minefinders Corp. Ltd. (a)(e) | 3,100,000 | 33,742,038 | |
Nevada Pacific Gold Ltd. (a) | 2,699,900 | 2,677,854 | |
Pan American Silver Corp. (a)(d) | 500,000 | 15,010,004 | |
Shore Gold, Inc. (a) | 6,000,000 | 39,245,864 | |
SouthernEra Diamonds, Inc. Class A (a) | 2,210,000 | 510,196 | |
119,777,792 | |||
TOTAL METALS & MINING | 753,253,547 | ||
Shares | Value | ||
Papua New Guinea - 4.4% | |||
METALS & MINING - 4.4% | |||
Gold - 4.4% | |||
Lihir Gold Ltd. (a)(d) | 25,000,020 | $ 65,399,902 | |
Peru - 1.9% | |||
METALS & MINING - 1.9% | |||
Precious Metals & Minerals - 1.9% | |||
Compania de Minas Buenaventura SA | 400,000 | 10,905,672 | |
Compania de Minas Buenaventura SA sponsored ADR (d) | 600,000 | 16,632,000 | |
27,537,672 | |||
Russia - 0.5% | |||
METALS & MINING - 0.5% | |||
Gold - 0.5% | |||
Polyus Gold OJSC sponsored ADR (a) | 150,000 | 7,807,500 | |
South Africa - 8.1% | |||
METALS & MINING - 8.1% | |||
Gold - 8.1% | |||
Anglogold Ashanti Ltd. sponsored ADR | 800,000 | 35,248,000 | |
Gold Fields Ltd. | 175,000 | 3,085,250 | |
Gold Fields Ltd. sponsored ADR (d) | 3,400,000 | 59,942,000 | |
Harmony Gold Mining Co. Ltd. (a) | 1,300,000 | 17,979,000 | |
Harmony Gold Mining Co. Ltd. sponsored ADR (a)(d) | 200,000 | 2,766,000 | |
119,020,250 | |||
United Kingdom - 3.4% | |||
METALS & MINING - 3.4% | |||
Diversified Metals & Mining - 1.1% | |||
African Platinum PLC (a) | 15,000,000 | 15,985,305 | |
Gold - 2.3% | |||
Randgold Resources Ltd. sponsored ADR | 1,500,000 | 34,350,000 | |
TOTAL METALS & MINING | 50,335,305 | ||
United States of America - 11.0% | |||
METALS & MINING - 11.0% | |||
Gold - 11.0% | |||
Newmont Mining Corp. | 2,800,000 | 126,196,000 | |
Royal Gold, Inc. (d) | 1,000,000 | 33,100,000 | |
US Gold Corp. (a) | 728,400 | 3,350,640 | |
US Gold Corp. warrants 2/22/11 (a)(g) | 364,200 | 566,753 | |
163,213,393 | |||
TOTAL COMMON STOCKS (Cost $1,065,462,510) | 1,334,588,202 | ||
Money Market Funds - 9.6% | |||
Shares | Value | ||
Fidelity Cash Central Fund, 5.35% (b) | 129,196,888 | $ 129,196,888 | |
Fidelity Securities Lending Cash Central Fund, 5.34% (b)(c) | 12,653,825 | 12,653,825 | |
TOTAL MONEY MARKET FUNDS (Cost $141,850,713) | 141,850,713 | ||
TOTAL INVESTMENT PORTFOLIO - 99.9% (Cost $1,207,313,223) | 1,476,438,915 |
NET OTHER ASSETS - 0.1% | 1,635,942 | ||
NET ASSETS - 100% | $ 1,478,074,857 | ||
Legend |
(a) Non-income producing |
(b) Affiliated fund that is available only to investment companies and other accounts managed by Fidelity Investments. The rate quoted is the annualized seven-day yield of the fund at period end. A complete unaudited listing of the fund's holdings as of its most recent quarter end is available upon request. |
(c) Investment made with cash collateral received from securities on loan. |
(d) Security or a portion of the security is on loan at period end. |
(e) Affiliated company |
(f) Security exempt from registration under Rule 144A of the Securities Act of 1933. These securities may be resold in transactions exempt from registration, normally to qualified institutional buyers. At the end of the period, the value of these securities amounted to $1,915,267, or 0.1% of net assets. |
(g) Restricted securities - Investment in securities not registered under the Securities Act of 1933 (excluding 144A issues). At the end of the period, the value of restricted securities (excluding 144A issues) amounted to $566,753 or 0.0% of net assets. |
Additional information on each holding is as follows: |
Security | Acquisition Date | Acquisition Cost |
US Gold Corp. warrants 2/22/11 | 2/8/06 | $ 179,112 |
Affiliated Central Funds |
Information regarding fiscal year to date income earned by the Fund from investments in Fidelity Central Funds is as follows: |
Fund | Income earned |
Fidelity Cash Central Fund | $ 7,327,656 |
Fidelity Securities Lending Cash Central Fund | 679,059 |
Total | $ 8,006,715 |
Other Affiliated Issuers |
An affiliated company is a company in which the fund has ownership of at least 5% of the voting securities. Fiscal year to date transactions with companies which are or were affiliates are as follows: |
Affiliates | Value, | Purchases | Sales | Dividend | Value, |
Aber Diamond Corp. | $ 101,949,189 | $ 42,793,742 | $ 99,101,298 | $ 2,210,686 | $ - |
Arizona Star Resource Corp. | 15,418,356 | 22,659,170 | - | - | 43,863,024 |
Bolivar Gold Corp. | 31,025,393 | - | 31,022,986 | - | - |
Cambior, Inc. | 65,449,104 | 16,604,300 | 30,024,720 | - | - |
Central Asia Gold Ltd. | - | 4,104,140 | - | - | 5,874,969 |
Coral Gold Resources Ltd. | - | 2,147,230 | - | - | 2,034,618 |
Crystallex International Corp. | 42,908,067 | 2,972,762 | 17,990,417 | - | - |
Meridian Gold, Inc. | 126,303,743 | 31,759,576 | 29,346,935 | - | 141,535,462 |
Minefinders Corp. Ltd. | 29,636,932 | 4,727,146 | 12,087,665 | - | 33,742,038 |
Orezone Resources, Inc. Class A | 14,417,110 | 5,744,298 | - | - | 18,041,127 |
Tone Resources Ltd. | - | 2,726,660 | - | - | 2,366,021 |
White Knight Resources Ltd. | - | 7,289,086 | - | - | 6,087,418 |
Total | $ 427,107,894 | $ 143,528,110 | $ 219,574,021 | $ 2,210,686 | $ 253,544,677 |
Income Tax Information |
The fund has a capital loss carryforward of $5,961,929, which was acquired in the merger with Select Precious Metals and Minerals, which will expire on February 29, 2008, and is available to offset future capital gains of the fund up to $5,961,929 per year as provided by regulations. |
See accompanying notes which are an integral part of the financial statements.
Annual Report
Financial Statements
Statement of Assets and Liabilities
February 28, 2007 | ||
Assets | ||
Investment in securities, at value (including securities loaned of $12,630,696) - See accompanying schedule: Unaffiliated issuers (cost $874,630,732) | $ 1,081,043,525 | |
Fidelity Central Funds (cost $141,850,713) | 141,850,713 | |
Other affiliated issuers (cost $190,831,778) | 253,544,677 | |
Total Investments (cost $1,207,313,223) | $ 1,476,438,915 | |
Receivable for investments sold | 16,410,389 | |
Receivable for fund shares sold | 6,177,590 | |
Dividends receivable | 593,802 | |
Distributions receivable from Fidelity Central Funds | 447,486 | |
Prepaid expenses | 6,183 | |
Other receivables | 68,504 | |
Total assets | 1,500,142,869 | |
Liabilities | ||
Payable for fund shares redeemed | $ 8,250,825 | |
Accrued management fee | 705,891 | |
Distribution fees payable | 1,403 | |
Other affiliated payables | 328,864 | |
Other payables and accrued expenses | 127,204 | |
Collateral on securities loaned, at value | 12,653,825 | |
Total liabilities | 22,068,012 | |
Net Assets | $ 1,478,074,857 | |
Net Assets consist of: | ||
Paid in capital | $ 1,198,251,552 | |
Undistributed net investment income | 9,093,033 | |
Accumulated undistributed net realized gain (loss) on investments and foreign currency transactions | 1,645,198 | |
Net unrealized appreciation (depreciation) on investments and assets and liabilities in foreign currencies | 269,085,074 | |
Net Assets | $ 1,478,074,857 | |
Statement of Assets and Liabilities - continued
February 28, 2007 | ||
Calculation of Maximum Offering Price Class A: | $ 36.53 | |
Maximum offering price per share (100/94.25 of $36.53) | $ 38.76 | |
Class T: | $ 36.49 | |
Maximum offering price per share (100/96.50 of $36.49) | $ 37.81 | |
Class B: | $ 36.46 | |
Class C: | $ 36.44 | |
Gold: | $ 36.54 | |
Institutional Class: | $ 36.54 | |
A Redemption price per share is equal to net asset value less any applicable contingent deferred sales charge.
See accompanying notes which are an integral part of the financial statements.
Annual Report
Statement of Operations
Year ended February 28, 2007 | ||
Investment Income | ||
Dividends (including $2,210,686 earned from other affiliated issuers) | $ 10,716,485 | |
Special dividends | 3,157,383 | |
Interest | 10,770 | |
Income from Fidelity Central Funds | 8,006,715 | |
Total income | 21,891,353 | |
Expenses | ||
Management fee | $ 8,349,362 | |
Transfer agent fees | 3,783,836 | |
Distribution fees | 2,316 | |
Accounting and security lending fees | 542,179 | |
Custodian fees and expenses | 314,883 | |
Independent trustees' compensation | 5,822 | |
Registration fees | 203,492 | |
Audit | 42,802 | |
Legal | 25,393 | |
Miscellaneous | 63,112 | |
Total expenses before reductions | 13,333,197 | |
Expense reductions | (537,549) | 12,795,648 |
Net investment income (loss) | 9,095,705 | |
Realized and Unrealized Gain (Loss) Net realized gain (loss) on: | ||
Investment securities: | ||
Unaffiliated issuers | 107,844,457 | |
Other affiliated issuers | (63,460) | |
Foreign currency transactions | (538,205) | |
Total net realized gain (loss) | 107,242,792 | |
Change in net unrealized appreciation (depreciation) on: Investment securities | 60,342,102 | |
Assets and liabilities in foreign currencies | (202,987) | |
Total change in net unrealized appreciation (depreciation) | 60,139,115 | |
Net gain (loss) | 167,381,907 | |
Net increase (decrease) in net assets resulting from operations | $ 176,477,612 | |
Statement of Changes in Net Assets
Year ended | Year ended | |
Increase (Decrease) in Net Assets | ||
Operations | ||
Net investment income (loss) | $ 9,095,705 | $ 1,051,643 |
Net realized gain (loss) | 107,242,792 | 215,186,894 |
Change in net unrealized appreciation (depreciation) | 60,139,115 | 130,381,517 |
Net increase (decrease) in net assets resulting from operations | 176,477,612 | 346,620,054 |
Distributions to shareholders from net investment income | (754,152) | (507,609) |
Distributions to shareholders from net realized gain | (195,955,908) | (106,134,254) |
Total distributions | (196,710,060) | (106,641,863) |
Share transactions - net increase (decrease) | 170,798,657 | 378,795,227 |
Redemption fees | 1,843,164 | 1,675,648 |
Total increase (decrease) in net assets | 152,409,373 | 620,449,066 |
Net Assets | ||
Beginning of period | 1,325,665,484 | 705,216,418 |
End of period (including undistributed net investment income of $9,093,033 and undistributed net investment income of $1,049,798, respectively) | $ 1,478,074,857 | $ 1,325,665,484 |
See accompanying notes which are an integral part of the financial statements.
Annual Report
Financial Highlights - Class A
Year ended February 28, | 2007 I |
Selected Per-Share Data | |
Net asset value, beginning of period | $ 36.60 |
Income from Investment Operations | |
Net investment income (loss) E | (.01) |
Net realized and unrealized gain (loss) | (.07) H |
Total from investment operations | (.08) |
Redemption fees added to paid in capital E | .01 |
Net asset value, end of period | $ 36.53 |
Total Return B,C,D | (.19)% |
Ratios to Average Net Assets F,J | |
Expenses before reductions | 1.13% A |
Expenses net of fee waivers, if any | 1.13% A |
Expenses net of all reductions | 1.10% A |
Net investment income (loss) | (.18)% A |
Supplemental Data | |
Net assets, end of period (000 omitted) | $ 1,857 |
Portfolio turnover rate G | 85% |
A Annualized B Total returns for periods of less than one year are not annualized. C Total returns would have been lower had certain expenses not been reduced during the periods shown. D Total returns do not include the effect of the sales charges. E Calculated based on average shares outstanding during the period. F Fees and expenses of the underlying Fidelity Central Funds are not included in the Fund's expense ratio. The Fund indirectly bears its proportionate share of the expenses of any underlying Fidelity Central Funds. G Amount does not include the portfolio activity of any underlying Fidelity Central Funds. H The amount shown for a share outstanding does not correspond with the aggregate net gain (loss) on investments for the period due to the timing of sales and repurchases of shares in relation to fluctuating market values of the investments of the Fund. I For the period December 12, 2006 (commencement of sale of shares) to February 28, 2007. J Expense ratios reflect operating expenses of the class. Expenses before reductions do not reflect amounts reimbursed by the investment adviser or reductions from brokerage service arrangements or other expense offset arrangements and do not represent the amount paid by the class during periods when reimbursements or reductions occur. Expenses net of fee waivers reflect expenses after reimbursement by the investment adviser but prior to reductions from brokerage service arrangements or other expense offset arrangements. Expenses net of all reductions represent the net expenses paid by the class. |
Financial Highlights - Class T
Year ended February 28, | 2007 I |
Selected Per-Share Data | |
Net asset value, beginning of period | $ 36.60 |
Income from Investment Operations | |
Net investment income (loss) E | (.03) |
Net realized and unrealized gain (loss) | (.09) H |
Total from investment operations | (.12) |
Redemption fees added to paid in capital E | .01 |
Net asset value, end of period | $ 36.49 |
Total Return B,C,D | (.30)% |
Ratios to Average Net Assets F,J | |
Expenses before reductions | 1.46% A |
Expenses net of fee waivers, if any | 1.46% A |
Expenses net of all reductions | 1.43% A |
Net investment income (loss) | (.40)% A |
Supplemental Data | |
Net assets, end of period (000 omitted) | $ 1,093 |
Portfolio turnover rate G | 85% |
A Annualized B Total returns for periods of less than one year are not annualized. C Total returns would have been lower had certain expenses not been reduced during the periods shown. D Total returns do not include the effect of the sales charges. E Calculated based on average shares outstanding during the period. F Fees and expenses of the underlying Fidelity Central Funds are not included in the Fund's expense ratio. The Fund indirectly bears its proportionate share of the expenses of any underlying Fidelity Central Funds. G Amount does not include the portfolio activity of any underlying Fidelity Central Funds. H The amount shown for a share outstanding does not correspond with the aggregate net gain (loss) on investments for the period due to the timing of sales and repurchases of shares in relation to fluctuating market values of the investments of the Fund. I For the period December 12, 2006 (commencement of sale of shares) to February 28, 2007. J Expense ratios reflect operating expenses of the class. Expenses before reductions do not reflect amounts reimbursed by the investment adviser or reductions from brokerage service arrangements or other expense offset arrangements and do not represent the amount paid by the class during periods when reimbursements or reductions occur. Expenses net of fee waivers reflect expenses after reimbursement by the investment adviser but prior to reductions from brokerage service arrangements or other expense offset arrangements. Expenses net of all reductions represent the net expenses paid by the class. |
See accompanying notes which are an integral part of the financial statements.
Annual Report
Financial Highlights - Class B
Year ended February 28, | 2007 I |
Selected Per-Share Data | |
Net asset value, beginning of period | $ 36.60 |
Income from Investment Operations | |
Net investment income (loss) E | (.07) |
Net realized and unrealized gain (loss) | (.08) H |
Total from investment operations | (.15) |
Redemption fees added to paid in capital E | .01 |
Net asset value, end of period | $ 36.46 |
Total Return B,C,D | (.38)% |
Ratios to Average Net Assets F,J | |
Expenses before reductions | 1.96% A |
Expenses net of fee waivers, if any | 1.96% A |
Expenses net of all reductions | 1.93% A |
Net investment income (loss) | (.93)% A |
Supplemental Data | |
Net assets, end of period (000 omitted) | $ 902 |
Portfolio turnover rate G | 85% |
A Annualized B Total returns for periods of less than one year are not annualized. C Total returns would have been lower had certain expenses not been reduced during the periods shown. D Total returns do not include the effect of the contingent deferred sales charge. E Calculated based on average shares outstanding during the period. F Fees and expenses of the underlying Fidelity Central Funds are not included in the Fund's expense ratio. The Fund indirectly bears its proportionate share of the expenses of any underlying Fidelity Central Funds. G Amount does not include the portfolio activity of any underlying Fidelity Central Funds. H The amount shown for a share outstanding does not correspond with the aggregate net gain (loss) on investments for the period due to the timing of sales and repurchases of shares in relation to fluctuating market values of the investments of the Fund. I For the period December 12, 2006 (commencement of sale of shares) to February 28, 2007. J Expense ratios reflect operating expenses of the class. Expenses before reductions do not reflect amounts reimbursed by the investment adviser or reductions from brokerage service arrangements or other expense offset arrangements and do not represent the amount paid by the class during periods when reimbursements or reductions occur. Expenses net of fee waivers reflect expenses after reimbursement by the investment adviser but prior to reductions from brokerage service arrangements or other expense offset arrangements. Expenses net of all reductions represent the net expenses paid by the class. |
Financial Highlights - Class C
Year ended February 28, | 2007 I |
Selected Per-Share Data | |
Net asset value, beginning of period | $ 36.60 |
Income from Investment Operations | |
Net investment income (loss) E | (.07) |
Net realized and unrealized gain (loss) | (.10) H |
Total from investment operations | (.17) |
Redemption fees added to paid in capital E | .01 |
Net asset value, end of period | $ 36.44 |
Total Return B,C,D | (.44)% |
Ratios to Average Net Assets F,J | |
Expenses before reductions | 2.02% A |
Expenses net of fee waivers, if any | 2.02% A |
Expenses net of all reductions | 1.99% A |
Net investment income (loss) | (1.03)% A |
Supplemental Data | |
Net assets, end of period (000 omitted) | $ 437 |
Portfolio turnover rate G | 85% |
A Annualized B Total returns for periods of less than one year are not annualized. C Total returns would have been lower had certain expenses not been reduced during the periods shown. D Total returns do not include the effect of the contingent deferred sales charge. E Calculated based on average shares outstanding during the period. F Fees and expenses of the underlying Fidelity Central Funds are not included in the Fund's expense ratio. The Fund indirectly bears its proportionate share of the expenses of any underlying Fidelity Central Funds. G Amount does not include the portfolio activity of any underlying Fidelity Central Funds. H The amount shown for a share outstanding does not correspond with the aggregate net gain (loss) on investments for the period due to the timing of sales and repurchases of shares in relation to fluctuating market values of the investments of the Fund. I For the period December 12, 2006 (commencement of sale of shares) to February 28, 2007. J Expense ratios reflect operating expenses of the class. Expenses before reductions do not reflect amounts reimbursed by the investment adviser or reductions from brokerage service arrangements or other expense offset arrangements and do not represent the amount paid by the class during periods when reimbursements or reductions occur. Expenses net of fee waivers reflect expenses after reimbursement by the investment adviser but prior to reductions from brokerage service arrangements or other expense offset arrangements. Expenses net of all reductions represent the net expenses paid by the class. |
See accompanying notes which are an integral part of the financial statements.
Annual Report
Financial Highlights - Gold
Years ended February 28, | 2007 | 2006 | 2005 | 2004 I | 2003 |
Selected Per-Share Data | |||||
Net asset value, beginning of period | $ 35.91 | $ 27.46 | $ 27.21 | $ 22.73 | $ 18.25 |
Income from Investment Operations | |||||
Net investment income (loss) C | .22 F | .04 | .02 G | (.01) | .05 |
Net realized and unrealized gain (loss) | 5.49 | 12.21 | .18 | 5.85 | 4.67 |
Total from investment operations | 5.71 | 12.25 | .20 | 5.84 | 4.72 |
Distributions from net investment income | (.02) | (.02) | - | (1.42) | (.36) |
Distributions from net realized gain | (5.10) | (3.84) | - | - | - |
Total distributions | (5.12) | (3.86) | - | (1.42) | (.36) |
Redemption fees added to paid in capital C | .04 | .06 | .05 | .06 | .12 |
Net asset value, end of period | $ 36.54 | $ 35.91 | $ 27.46 | $ 27.21 | $ 22.73 |
Total Return A,B | 16.19% | 48.84% | .92% | 26.79% | 26.68% |
Ratios to Average Net Assets D,H | |||||
Expenses before reductions | .90% | .97% | 1.00% | 1.12% | 1.18% |
Expenses net of fee waivers, if any | .90% | .97% | 1.00% | 1.12% | 1.18% |
Expenses net of all reductions | .87% | .82% | .89% | 1.04% | 1.11% |
Net investment income (loss) | .62% F | .13% | .07% G | (.03)% | .22% |
Supplemental Data | |||||
Net assets, end of period (000 omitted) | $ 1,473,400 | $ 1,325,665 | $ 705,216 | $ 735,744 | $ 686,029 |
Portfolio turnover rate E | 85% | 108% | 79% | 41% | 44% |
A Total returns would have been lower had certain expenses not been reduced during the periods shown. B Total returns do not include the effect of the former sales charges. C Calculated based on average shares outstanding during the period. D Fees and expenses of the underlying Fidelity Central Funds are not included in the Fund's expense ratio. The Fund indirectly bears its proportionate share of the expenses of any underlying Fidelity Central Funds. E Amount does not include the portfolio activity of any underlying Fidelity Central Funds. F Investment income per share reflects a special dividend which amounted to $.08 per share. Excluding the special dividend, the ratio of net investment income (loss) to average net assets would have been .40%. G Investment income per share reflects a special dividend which amounted to $.04 per share. Excluding the special dividend, the ratio of net investment income (loss) to average net assets would have been (.08)%. H Expense ratios reflect operating expenses of the class. Expenses before reductions do not reflect amounts reimbursed by the investment adviser or reductions from brokerage service arrangements or other expense offset arrangements and do not represent the amount paid by the class during periods when reimbursements or reductions occur. Expenses net of fee waivers reflect expenses after reimbursement by the investment adviser but prior to reductions from brokerage service arrangements or other expense offset arrangements. Expenses net of all reductions represent the net expenses paid by the class. I For the year ended February 29. |
Financial Highlights - Institutional Class
Year ended February 28, | 2007 H |
Selected Per-Share Data | |
Net asset value, beginning of period | $ 36.60 |
Income from Investment Operations | |
Net investment income (loss) D | .01 |
Net realized and unrealized gain (loss) | (.08) G |
Total from investment operations | (.07) |
Redemption fees added to paid in capital D | .01 |
Net asset value, end of period | $ 36.54 |
Total Return B,C | (.16)% |
Ratios to Average Net Assets E,I | |
Expenses before reductions | .94% A |
Expenses net of fee waivers, if any | .94% A |
Expenses net of all reductions | .91% A |
Net investment income (loss) | .12% A |
Supplemental Data | |
Net assets, end of period (000 omitted) | $ 385 |
Portfolio turnover rate F | 85% |
A Annualized B Total returns for periods of less than one year are not annualized. C Total returns would have been lower had certain expenses not been reduced during the periods shown. D Calculated based on average shares outstanding during the period. E Fees and expenses of the underlying Fidelity Central Funds are not included in the Fund's expense ratio. The Fund indirectly bears its proportionate share of the expenses of any underlying Fidelity Central Funds. F Amount does not include the portfolio activity of any underlying Fidelity Central Funds. G The amount shown for a share outstanding does not correspond with the aggregate net gain (loss) on investments for the period due to the timing of sales and repurchases of shares in relation to fluctuating market values of the investments of the Fund. H For the period December 12, 2006 (commencement of sale of shares) to February 28, 2007. I Expense ratios reflect operating expenses of the class. Expenses before reductions do not reflect amounts reimbursed by the investment adviser or reductions from brokerage service arrangements or other expense offset arrangements and do not represent the amount paid by the class during periods when reimbursements or reductions occur. Expenses net of fee waivers reflect expenses after reimbursement by the investment adviser but prior to reductions from brokerage service arrangements or other expense offset arrangements. Expenses net of all reductions represent the net expenses paid by the class. |
See accompanying notes which are an integral part of the financial statements.
Annual Report
Notes to Financial Statements
For the period ended February 28, 2007
1. Organization.
Gold Portfolio (the Fund) is a non-diversified fund of Fidelity Select Portfolios (the trust) and is authorized to issue an unlimited number of shares. The trust is registered under the Investment Company Act of 1940, as amended (the 1940 Act), as an open-end management investment company organized as a Massachusetts business trust. The Fund invests primarily in securities of companies whose principal business activities fall within specific industries. The Fund offers Class A, Class T, Class B, Class C, Gold, and Institutional Class shares, each of which has equal rights as to assets and voting privileges. Each class has exclusive voting rights with respect to matters that affect that class. The Fund commenced sale of Class A, Class T, Class B, Class C and Institutional Class shares and the existing class was designated Gold on December 12, 2006. Class B shares will automatically convert to Class A shares after a holding period of seven years from the initial date of purchase. Investment income, realized and unrealized capital gains and losses, the common expenses of the Fund, and certain fund-level expense reductions, if any, are allocated on a pro rata basis to each class based on the relative net assets of each class to the total net assets of the Fund. Each class differs with respect to transfer agent and distribution and service plan fees incurred. Certain expense reductions also differ by class. The Fund may also invest in certain precious metals. The financial statements have been prepared in conformity with accounting principles generally accepted in the United States of America, which require management to make certain estimates and assumptions at the date of the financial statements.
2. Investments in Fidelity Central Funds.
The Fund may invest in Fidelity Central Funds which are open-end investment companies available only to other investment companies and accounts managed by FMR and its affiliates. The Fund's Schedule of Investments lists each of the Fidelity Central Funds as an investment of the Fund but does not include the underlying holdings of each Fidelity Central Fund. As an Investing Fund, the Fund indirectly bears its proportionate share of the expenses of the underlying Fidelity Central Funds. A complete unaudited list of holdings for each Fidelity Central Fund is available upon request. In addition, the financial statements of the Fidelity Central Funds, which are not covered by the Fund's Report of Independent Registered Public Accounting Firm, are available on the EDGAR Database on the SEC's web site, www.sec.gov, or upon request.
The Money Market Central Funds seek preservation of capital and current income and are managed by Fidelity Investments Money Management, Inc. (FIMM) an affiliate of Fidelity Management & Research Company (FMR).
3. Significant Accounting Policies.
The following summarizes the significant accounting policies of the Fund:
Security Valuation. Investments are valued and net asset value (NAV) per share is calculated (NAV calculation) as of the close of business of the New York Stock Exchange (NYSE), normally 4:00 p.m. Eastern time. During the period the Fund also calculated a NAV each hour on the hour (commencing at 10:00 a.m. Eastern time until one hour prior to the close of business on the NYSE). Effective October 1, 2006 the Fund eliminated hourly NAV calculation.
Wherever possible, the Fund uses independent pricing services approved by the Board of Trustees to value its investments. Equity securities, including restricted securities, for which market quotations are readily available, are valued at the last reported sale price or official closing price as reported by an independent pricing service on the primary market or exchange on which they are traded. In the event there were no sales during the day or closing prices are not available, securities are valued at the last quoted bid price. Investments in open-end mutual funds, including the Fidelity Central Funds, are valued at their closing net asset value each business day. Short-term securities with remaining maturities of sixty days or less for which quotations are not readily available are valued at amortized cost, which approximates value.
When current market prices or quotations are not readily available or do not accurately reflect fair value, valuations may be determined in accordance with procedures adopted by the Board of Trustees. For example, when developments occur between the close of a market and the close of the NYSE that may materially affect the value of some or all of the securities, or when trading in a security is halted, those securities may be fair valued. Factors used in the determination of fair value may include monitoring news to identify significant market or security specific events such as changes in the value of U.S. securities markets, reviewing developments in foreign markets and evaluating the performance of ADRs, futures contracts and exchange-traded funds. Because the Fund's utilization of fair value pricing depends on market activity, the frequency with which fair value pricing is used cannot be predicted and may be utilized to a significant extent. The value of securities used for NAV calculation under fair value pricing may differ from published prices for the same securities.
Foreign Currency. The Fund uses foreign currency contracts to facilitate transactions in foreign-denominated securities. Losses from these transactions may arise from changes in the value of the foreign currency or if the counterparties do not perform under the contracts' terms.
Foreign-denominated assets, including investment securities, and liabilities are translated into U.S. dollars at the exchange rate at period end. Purchases and sales of investment securities, income and dividends received and expenses denominated in foreign currencies are translated into U.S. dollars at the exchange rate in effect on the transaction date.
The effects of exchange rate fluctuations on investments are included with the net realized and unrealized gain (loss) on investment securities. Other foreign currency transactions resulting in realized and unrealized gain (loss) are disclosed separately.
Annual Report
Notes to Financial Statements - continued
3. Significant Accounting Policies - continued
Investment Transactions and Income. For financial reporting purposes, the Fund's investment holdings and NAV include trades executed through the end of the last business day of the period. The NAV for processing shareholder transactions includes trades executed through the end of the prior business day. Gains and losses on securities sold are determined on the basis of identified cost and may include proceeds received from litigation. Dividend income is recorded on the ex-dividend date, except for certain dividends from foreign securities where the ex-dividend date may have passed, which are recorded as soon as the Fund is informed of the ex-dividend date. Non-cash dividends included in dividend income, if any, are recorded at the fair market value of the securities received. Large, non-recurring dividends recognized by the Fund are presented separately on the Statement of Operations as "Special Dividends" and the impact of these dividends is presented in the Financial Highlights. Interest income and distributions from the Fidelity Central Funds are accrued as earned, with any distributions receivable as of period end included in Distributions receivable from Fidelity Central Funds on the Statement of Assets and Liabilities. Interest income includes coupon interest and amortization of premium and accretion of discount on debt securities. Investment income is recorded net of foreign taxes withheld where recovery of such taxes is uncertain.
Expenses. Most expenses of the trust can be directly attributed to a fund. Expenses which cannot be directly attributed are apportioned among each Fund in the trust. Expense estimates are accrued in the period to which they relate and adjustments are made when actual amounts are known.
Income Tax Information and Distributions to Shareholders. Each year, the Fund intends to qualify as a regulated investment company by distributing all of its taxable income and realized gains under Subchapter M of the Internal Revenue Code. As a result, no provision for income taxes is required in the accompanying financial statements. Foreign taxes are provided for based on the Fund's understanding of the tax rules and rates that exist in the foreign markets in which it invests.
Distributions are recorded on the ex-dividend date. Income dividends and capital gain distributions are declared separately for each class. Income and capital gain distributions are determined in accordance with income tax regulations, which may differ from generally accepted accounting principles. In addition, the Fund will claim a portion of the payment made to redeeming shareholders as a distribution for income tax purposes.
Capital accounts within the financial statements are adjusted for permanent book-tax differences. These adjustments have no impact on net assets or the results of operations. Temporary book-tax differences will reverse in a subsequent period.
Book-tax differences are primarily due to short term capital gains, foreign currency transactions, passive foreign investment companies (PFIC), deferred trustees compensation, capital loss carryforwards and losses deferred due to wash sales.
The tax-basis components of distributable earnings and the federal tax cost as of period end were as follows:
Unrealized appreciation | $ 209,837,322 |
Unrealized depreciation | (18,779,101) |
Net unrealized appreciation (depreciation) | 191,058,221 |
Undistributed ordinary income | 37,037,784 |
Undistributed long-term capital gain | 32,067,203 |
Cost for federal income tax purposes | $ 1,285,380,694 |
The tax character of distributions paid was as follows:
February 28, 2007 | February 28, 2006 | |
Ordinary Income | $ 72,402,616 | $ 8,912,605 |
Long-term Capital Gains | 124,307,444 | 97,688,205 |
Total | $ 196,710,060 | $ 106,600,810 |
Trading (Redemption) Fees. Shares in the Fund held less than 30 days are subject to a redemption fee equal to .75% of the net asset value of shares redeemed. All redemption fees, including any estimated redemption fees paid by FMR, are retained by the Fund and accounted for as an addition to paid in capital. Shareholders were also subject to an additional $7.50 fee for shares exchanged into another Fidelity fund (see Note 6).
New Accounting Pronouncements. In July 2006, Financial Accounting Standards Board Interpretation No. 48, Accounting for Uncertainty in Income Taxes - an interpretation of FASB Statement 109 (FIN 48), was issued and is effective on the last business day of the semiannual reporting period for fiscal years beginning after December 15, 2006. FIN 48 sets forth a threshold for financial statement recognition, measurement and disclosure of a tax position taken or expected to be taken on a tax return. Management is currently evaluating the impact, if any, the adoption of FIN 48 will have on the Fund's net assets, results of operations and financial statement disclosures.
In addition, in September 2006, Statement of Financial Accounting Standards No. 157, Fair Value Measurements (SFAS 157), was issued and is effective for fiscal years beginning after November 15, 2007. SFAS 157 defines fair value, establishes a framework for measuring fair value and expands disclosures about fair value measurements. Management is currently evaluating the impact the adoption of SFAS 157 will have on the Fund's financial statement disclosures.
Annual Report
4. Operating Policies.
Repurchase Agreements. FMR has received an Exemptive Order from the Securities and Exchange Commission (the SEC) which permits the Fund and other affiliated entities of FMR to transfer uninvested cash balances into joint trading accounts which are then invested in repurchase agreements. The Fund may also invest directly with institutions in repurchase agreements. Repurchase agreements are collateralized by government or non-government securities. Upon settlement date, collateral is held in segregated accounts with custodian banks and may be obtained in the event of a default of the counterparty. The Fund monitors, on a daily basis, the value of the collateral to ensure it is at least equal to the principal amount of the repurchase agreement (including accrued interest). In the event of a default by the counterparty, realization of the collateral proceeds could be delayed, during which time the value of the collateral may decline.
Restricted Securities. The Fund may invest in securities that are subject to legal or contractual restrictions on resale. These securities generally may be resold in transactions exempt from registration or to the public if the securities are registered. Disposal of these securities may involve time-consuming negotiations and expense, and prompt sale at an acceptable price may be difficult. Information regarding restricted securities is included at the end of the Fund's Schedule of Investments.
5. Purchases and Sales of Investments.
Purchases and sales of securities, other than short-term securities, aggregated $1,177,686,107 and $1,142,903,243, respectively.
6. Fees and Other Transactions with Affiliates.
Management Fee. FMR and its affiliates provide the Fund with investment management related services for which the Fund pays a monthly management fee. The management fee is the sum of an individual fund fee rate that is based on an annual rate of .30% of the Fund's average net assets and a group fee rate that averaged .26% during the period. The group fee rate is based upon the average net assets of all the mutual funds advised by FMR. The group fee rate decreases as assets under management increase and increases as assets under management decrease. For the period, the total annual management fee rate was .57% of the Fund's average net assets.
Distribution and Service Plan. In accordance with Rule 12b-1 of the 1940 Act, the Fund has adopted separate Distribution and Service Plans for each class of shares. Certain classes pay Fidelity Distributors Corporation (FDC), an affiliate of FMR, separate Distribution and Service Fees, each of which is based on an annual percentage of each class' average net assets. In addition, FDC may pay financial intermediaries for selling shares of the Fund and providing shareholder support services. For the period, the Distribution and Service Fee rates and the total amounts paid to and retained by FDC were as follows:
Distribution | Service | Paid to | Retained | |
Class A | -% | .25% | $ 339 | $ 59 |
Class T | .25% | .25% | 811 | 97 |
Class B | .75% | .25% | 783 | 646 |
Class C | .75% | .25% | 383 | 286 |
$ 2,316 | $ 1,088 |
Sales Load. FDC receives a front-end sales charge of up to 5.75% for selling Class A shares, and 3.50% for selling Class T shares, some of which is paid to financial intermediaries for selling shares of the Fund. FDC receives the proceeds of contingent deferred sales charges levied on Class A, Class T, Class B, and Class C redemptions. These charges depend on the holding period. The deferred sales charges range from 5% to 1% for Class B, 1% for Class C, 1.00% to .50% for certain purchases of Class A shares and .25% for certain purchases of Class T shares.
For the period, sales charge amounts retained by FDC were as follows:
Retained | |
Class A | $ 4,097 |
Class T | 551 |
$ 4,648 |
Annual Report
Notes to Financial Statements - continued
6. Fees and Other Transactions with Affiliates - continued
Transfer Agent Fees. Fidelity Investments Institutional Operations Company, Inc. (FIIOC), an affiliate of FMR, is the transfer, dividend disbursing and shareholder servicing agent for each class of the Fund, except for Gold. Fidelity Service Company, Inc. (FSC), an affiliate of FMR, is the transfer agent for Gold shares. FIIOC and FSC receive account fees and asset-based fees that vary according to the account size and type of account of the shareholders of the respective classes of the Fund. FIIOC and FSC pay for typesetting, printing and mailing of shareholder reports, except proxy statements. For the period, the total transfer agent fees paid by each class to FIIOC or FSC, were as follows:
Amount | % of | |
Class A | $ 163 | .13 |
Class T | 354 | .23 |
Class B | 118 | .16 |
Class C | 94 | .26 |
Gold | 3,783,019 | .26 |
Institutional Class | 88 | .25 |
$ 3,783,836 |
Accounting and Security Lending Fees. FSC maintains the Fund's accounting records. The accounting fee is based on the level of average net assets for the month. Under a separate contract, FSC administers the security lending program. The security lending fee is based on the number and duration of lending transactions.
Exchange Fees. During the period, FSC received the proceeds of a $7.50 fee to cover administrative costs associated with exchanges out of the Fund to any other Fidelity Select fund or to any other Fidelity fund made through non-automated channels. Effective October 1, 2006, the exchange fees were eliminated. For the period, exchange fees retained by FSC were as follows:
Retained | |
Gold Portfolio | $ 8,580 |
Brokerage Commissions. The Fund placed a portion of its portfolio transactions with brokerage firms which are affiliates of the investment adviser. The commissions paid to these affiliated firms were $165 for the period.
7. Committed Line of Credit.
The Fund participates with other funds managed by FMR in a $4.2 billion credit facility (the "line of credit") to be utilized for temporary or emergency purposes to fund shareholder redemptions or for other short-term liquidity purposes. The Fund has agreed to pay commitment fees on its pro rata portion of the line of credit, which amounted to $3,802 and is reflected in Miscellaneous Expense on the Statement of Operations. During the period, there were no borrowings on this line of credit.
8. Security Lending.
The Fund lends portfolio securities from time to time in order to earn additional income. On the settlement date of the loan, the Fund receives collateral (in the form of U.S. Treasury obligations, letters of credit and/or cash) against the loaned securities and maintains collateral in an amount not less than 100% of the market value of the loaned securities during the period of the loan. The market value of the loaned securities is determined at the close of business of the Fund and any additional required collateral is delivered to the Fund on the next business day. If the borrower defaults on its obligation to return the securities loaned because of insolvency or other reasons, a fund could experience delays and costs in recovering the securities loaned or in gaining access to the collateral. Any cash collateral received is invested in the Fidelity Securities Lending Cash Central Fund. The value of loaned securities and cash collateral at period end are disclosed on the Fund's Statement of Assets and Liabilities. Security lending income represents the income earned on investing cash collateral, less fees and expenses associated with the loan, plus any premium payments that may be received on the loan of certain types of securities. Security lending income is presented in the Statement of Operations as a component of income from Fidelity Central Funds. Net income from lending portfolio securities during the period amounted to $679,059.
Annual Report
9. Expense Reductions.
FMR voluntarily agreed to reimburse a portion of Gold's operating expenses. During the period, this reimbursement reduced the class' expenses by $57,675.
Many of the brokers with whom FMR places trades on behalf of the Fund provided services to the Fund in addition to trade execution. These services included payments of certain expenses on behalf of the Fund totaling $419,936 for the period. In addition, through arrangements with the Fund's custodian and each class' transfer agent, credits realized as a result of uninvested cash balances were used to reduce the Fund's expenses. During the period, these credits reduced the Fund's custody expenses by $18,002. During the period, credits reduced each class' transfer agent expense as noted in the table below.
Transfer Agent | |
Gold | $ 21,672 |
10. Other.
The Fund's organizational documents provide former and current trustees and officers with a limited indemnification against liabilities arising in connection with the performance of their duties to the Fund. In the normal course of business, the Fund may also enter into contracts that provide general indemnifications. The Fund's maximum exposure under these arrangements is unknown as this would be dependent on future claims that may be made against the Fund. The risk of material loss from such claims is considered remote.
The United States Securities and Exchange Commission ("SEC") is conducting an investigation of FMR (covering the years 2002 to 2004) arising from gifts, gratuities and business entertainment provided by certain brokers to certain individuals who were employed on FMR's domestic equity trading desk during that period. FMR is in discussions with the SEC staff regarding the possible resolution of the matter, but as of period-end no final resolution has been reached.
In December 2006, the Independent Trustees completed their own investigation of the matter with the assistance of independent counsel. The Independent Trustees and FMR agree that, despite the absence of proof that the Fidelity mutual funds experienced diminished execution quality as a result of the improper receipt of gifts and business entertainment, the conduct at issue was serious and is worthy of redress. Accordingly, the Independent Trustees have requested and FMR has agreed to pay $42 million to Fidelity mutual funds, plus interest to be determined at the time that payment is made. A method of allocating this payment among the funds has not yet been determined. The total payment to the Fund is not anticipated to have a material impact on the Fund's net assets. In addition, FMR reimbursed related legal expenses which are recorded in the accompanying Statement of Operations as an expense reduction.
11. Distributions to Shareholders.
Distributions to shareholders of each class were as follows:
Years ended February 28, | 2007 | 2006 |
From net investment income | ||
Gold | $ 754,152 | $ 507,609 |
From net realized gain | ||
Gold | $ 195,955,908 | $ 106,134,254 |
Annual Report
Notes to Financial Statements - continued
12. Share Transactions.
Transactions for each class of shares were as follows:
Shares | Dollars | |||
Years ended February 28, | 2007A | 2006 | 2007A | 2006 |
Class A | ||||
Shares sold | 52,274 | - | $ 1,914,223 | $ - |
Shares redeemed | (1,428) | - | (52,108) | - |
Net increase (decrease) | 50,846 | - | $ 1,862,115 | $ - |
Class T | ||||
Shares sold | 29,954 | - | $ 1,097,866 | $ - |
Shares redeemed | - | - | - | - |
Net increase (decrease) | 29,954 | - | $ 1,097,866 | $ - |
Class B | ||||
Shares sold | 24,802 | - | $ 903,324 | $ - |
Shares redeemed | (60) | - | (2,269) | - |
Net increase (decrease) | 24,742 | - | $ 901,055 | - |
Class C | ||||
Shares sold | 12,002 | - | $ 438,523 | $ - |
Shares redeemed | - | - | - | - |
Net increase (decrease) | 12,002 | - | $ 438,523 | - |
Gold | ||||
Shares sold | 37,990,378 | 35,716,956 | $ 1,364,967,296 | $ 1,098,070,139 |
Reinvestment of distributions | 5,102,742 | 3,522,978 | 188,386,905 | 102,614,627 |
Shares redeemed | (39,683,634) | (28,011,502) | (1,387,242,690) | (821,889,539) |
Net increase (decrease) | 3,409,486 | 11,228,432 | $ 166,111,511 | $ 378,795,227 |
Institutional Class | ||||
Shares sold | 11,934 | - | $ 438,322 | $ - |
Shares redeemed | (1,395) | - | (50,735) | - |
Net increase (decrease) | 10,539 | - | $ 387,587 | - |
A Share transactions for Class A, Class T, Class B, Class C and Institutional Class are for the period December 12, 2006 (commencement of sale of shares) to February 28, 2007.
Annual Report
Performance
Average annual total return reflects the change in the value of an investment, assuming reinvestment of the fund's dividend income and capital gains (the profits earned upon the sale of securities that have grown in value) and assuming a constant rate of performance each year. The $10,000 table and the fund's returns do not reflect the deduction of taxes that a shareholder would pay on fund distributions or the redemption of fund shares. During periods of reimbursement by Fidelity a fund's total returns will be greater than it would be had the reimbursement not occurred. How a fund did yesterday is no guarantee of how it will do tomorrow.
Average Annual Total Returns
Periods ended February 28, 2007 | Past 1 | Past 5 | Past 10 |
Materials | 22.29% | 18.79% | 10.24% |
Prior to October 1, 2006, Select Materials Portfolio was named Select Industrial Materials Portfolio and operated under certain different investment policies. The historical performance for this fund may not represent its current investment policies.
$10,000 Over 10 Years
Let's say hypothetically that $10,000 was invested in Materials on February 28, 1997. The chart shows how the value of your investment would have changed, and also shows how the S&P 500 Index performed over the same period.
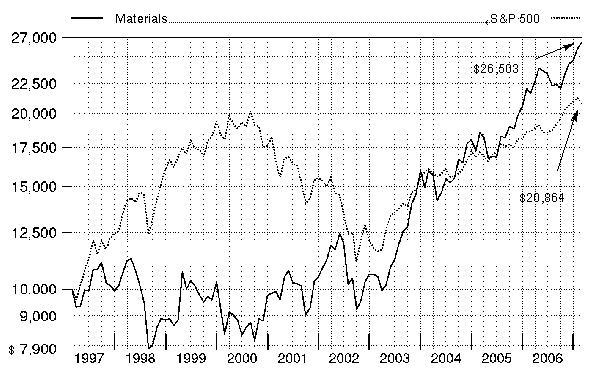
Annual Report
Management's Discussion of Fund Performance
Comments from Jody Simes, Portfolio Manager of Fidelity® Select Materials Portfolio during the period covered by this report
A rosy year for stocks wilted just prior to the end of the 12-month period ending February 28, 2007. On the day prior to the period's close, the Dow Jones Industrial AverageSM plunged 416 points and the Standard & Poor's 500SM Index lost roughly 3.5% of its value, plummeting nearly 50 points and marking the benchmark's worst single-day performance since the day the market reopened after the 9/11 terrorist attacks. Though investors were obviously rattled by the development, it was only the 22nd-biggest decline for the S&P 500® in 20 years, and it could not overshadow how well stocks performed for the 12 months overall. For much of the past year, investors grew confident that the economy would not fall into a recession, and they bid up most broad-based stock indexes for six consecutive months from August through January. Overall for the year ending February 28, 2007, the S&P 500 was up 11.97%, the Dow advanced 14.24%, the small-cap Russell 2000® Index gained 9.87% and the NASDAQ Composite® Index rose 6.66%.
For the 12 months ending February 28, 2007, Materials returned 22.29%, underperforming the 23.99% gain of the Morgan Stanley Capital InternationalSM (MSCI®) US Investable Market Materials Index and the 23.58% advance of a blended index specific to this fund. This blended index is a combination of the Goldman Sachs® Cyclical Industries Index, which the fund was compared with through September, and the new MSCI benchmark mentioned above, which the fund was compared with during the period's final five months1. During the same 12-month period, the fund beat the S&P 500. The new supplemental benchmark reflects a broadening of the fund's focus beyond materials used in the industrials sector. As such, the fund experienced some shifts in its industry weightings. The main factor behind the fund's modest outperformance of the Goldman Sachs index during the first seven months was strong security selection in diversified metals and mining, a group that is not part of the index. Not owning homebuilding stocks also helped, as this area of the index declined. Overweighting coal and consumable fuels dampened the fund's return, although that loss was partially offset by good security selection there. Not owning aerospace and defense, a strong performing part of the index during the seven-month period, hurt as well. Top contributors included our out-of-benchmark positions in three Canadian metals and mining stocks: Falconbridge, Inco and Skye Resources. The two main detractors also were not found in the index: coal company Peabody Energy and aluminum producer Alcan. During the last five months of the period, the fund underperformed its new MSCI index due to unsuccessful security selection in diversified metals and mining and the fund's modest average cash position, which dampened its return in a strong market. Positive stock selection in and an underweighting of specialty chemicals buoyed the fund's return, as did good security selection in and an overweighting of construction materials. Detractors included out-of-benchmark holdings in Skye Resources, Canadian metals and mining company Birch Mountain Resources and uranium producer Cameco. Top contributions came from Canadian construction materials firm Polaris Minerals - not part of the benchmark - as well as overweighting specialty chemical manufacturer Albemarle. Some stocks mentioned here were not held at period end.
1 The fund's blended index is a customized index developed by Fidelity for the limited purpose of discussing the fund's performance for the 12-month period ending February 28, 2007. From March 1, 2006, through September 30, 2006, the fund compared its performance to the Goldman Sachs Cyclical Industries Index, which returned 1.77% during that period. On October 1, 2006, the fund began comparing its performance to a different index, the MSCI US Investable Market Materials Index, which returned 21.43% from October 1, 2006, through February 28, 2007. For the 12-month period ending February 28, 2007, the blended index (Goldman Sachs and MSCI) returned 23.58%.
Note to shareholders: Duffy Fischer will become manager of the fund on April 2, 2007.
The views expressed above reflect those of the portfolio manager(s) only through the end of the period as stated on the cover of this report and do not necessarily represent the views of Fidelity or any other person in the Fidelity organization. Any such views are subject to change at any time based upon market or other conditions and Fidelity disclaims any responsibility to update such views. These views may not be relied on as investment advice and, because investment decisions for a Fidelity fund are based on numerous factors, may not be relied on as an indication of trading intent on behalf of any Fidelity fund.
Annual Report
Shareholder Expense Example
As a shareholder of the Fund, you incur two types of costs: (1) transaction costs, including sales charges (loads) on purchase payments or redemption proceeds, redemption fees, exchange fees, and (2) ongoing costs, including management fees, distribution and/or service (12b-1) fees and other Fund expenses. This Example is intended to help you understand your ongoing costs (in dollars) of investing in the Fund and to compare these costs with the ongoing costs of investing in other mutual funds.
The actual Example is based on an investment of $1,000 at the beginning of the period and held for the entire period (September 1, 2006 to February 28, 2007) for the Materials class and for the entire period (December 12, 2006 to February 28, 2007) for Class A, Class T, Class B, Class C and Institutional Class. The hypothetical expense Example is based on an investment of $1,000 invested for the one-half year period (September 1, 2006 to February 28, 2007).
Actual Expenses
The first line of the accompanying table for each class of the Fund provides information about actual account values and actual expenses. You may use the information in this line, together with the amount you invested, to estimate the expenses that you paid over the period. Simply divide your account value by $1,000.00 (for example, an $8,600 account value divided by $1,000.00 = 8.6), then multiply the result by the number in the first line for a class of the Fund under the heading entitled "Expenses Paid During Period" to estimate the expenses you paid on your account during this period. A small balance maintenance fee of $12.00 that is charged once a year may apply for certain accounts with a value of less than $2,000. This fee is not included in the table below. If it was, the estimate of expenses you paid during the period would be higher, and your ending account value lower, by this amount.
Hypothetical Example for Comparison Purposes
The second line of the accompanying table for each class of the Fund provides information about hypothetical account values and hypothetical expenses based on a Class' actual expense ratio and an assumed rate of return of 5% per year before expenses, which is not the Class' actual return. The hypothetical account values and expenses may not be used to estimate the actual ending account balance or expenses you paid for the period. You may use this information to compare the ongoing costs of investing in the Fund and other funds. To do so, compare this 5% hypothetical example with the 5% hypothetical examples that appear in the shareholder reports of the other funds. A small balance maintenance fee of $12.00 that is charged once a year may apply for certain accounts with a value of less than $2,000. This fee is not included in the table below. If it was, the estimate of expenses you paid during the period would be higher, and your ending account value lower, by this amount.
Please note that the expenses shown in the table are meant to highlight your ongoing costs only and do not reflect any transaction costs. Therefore, the second line of the table is useful in comparing ongoing costs only, and will not help you determine the relative total costs of owning different funds. In addition, if these transactional costs were included, your costs would have been higher.
Beginning | Ending | Expenses | |
Class A | |||
Actual | $ 1,000.00 | $ 1,087.60 | $ 3.16 B |
HypotheticalA | $ 1,000.00 | $ 1,017.85 | $ 7.00 C |
Class T | |||
Actual | $ 1,000.00 | $ 1,085.10 | $ 3.72 B |
HypotheticalA | $ 1,000.00 | $ 1,016.61 | $ 8.25 C |
Class B | |||
Actual | $ 1,000.00 | $ 1,083.40 | $ 4.85 B |
HypotheticalA | $ 1,000.00 | $ 1,014.13 | $ 10.74 C |
Class C | |||
Actual | $ 1,000.00 | $ 1,083.40 | $ 4.85 B |
HypotheticalA | $ 1,000.00 | $ 1,014.13 | $ 10.74 C |
Materials | |||
Actual | $ 1,000.00 | $ 1,181.30 | $ 5.08 B |
HypotheticalA | $ 1,000.00 | $ 1,020.13 | $ 4.71 C |
Institutional Class | |||
Actual | $ 1,000.00 | $ 1,085.50 | $ 2.39 B |
HypotheticalA | $ 1,000.00 | $ 1,019.54 | $ 5.31 C |
A 5% return per year before expenses
B Actual expenses are equal to each Class' annualized expense ratio (shown in the table below); multiplied by the average account value over the period, multiplied by 181/365 (to reflect the one-half year period) for the Materials class and multiplied by 79/365 (to reflect the period December 12, 2006 to February 28, 2007) for Class A, Class T, Class B, Class C and Institutional Class.
C Hypothetical expenses are equal to each Class' annualized expense ratio (shown in the table below); multiplied by the average account value over the period, multiplied by 181/365 (to reflect the one-half year period).
Annual Report
Select Materials Portfolio
Shareholder Expense Example - continued
Annualized | |
Class A | 1.40% |
Class T | 1.65% |
Class B | 2.15% |
Class C | 2.15% |
Materials | .94% |
Institutional Class | 1.06% |
Annual Report
Investment Changes
Top Ten Stocks as of February 28, 2007 | ||
% of fund's | % of fund's net assets | |
E.I. du Pont de Nemours & Co. | 8.2 | 5.2 |
Monsanto Co. | 5.7 | 0.0 |
Dow Chemical Co. | 5.1 | 5.4 |
Alcoa, Inc. | 4.4 | 4.8 |
Phelps Dodge Corp. | 4.2 | 2.5 |
Praxair, Inc. | 3.9 | 3.1 |
Weyerhaeuser Co. | 3.8 | 0.0 |
Air Products & Chemicals, Inc. | 3.4 | 2.6 |
Nucor Corp. | 3.0 | 2.1 |
United States Steel Corp. | 3.0 | 3.1 |
44.7 | ||
Top Industries (% of fund's net assets) | |||
As of February 28, 2007 | |||
| Chemicals | 43.5% | |
| Metals & Mining | 29.6% | |
| Paper & Forest Products | 7.5% | |
| Construction Materials | 5.9% | |
| Containers & Packaging | 5.7% | |
| All Others * | 7.8% | |
As of August 31, 2006 | |||
| Metals & Mining | 34.7% | |
| Chemicals | 21.9% | |
| Road & Rail | 15.2% | |
| Oil, Gas & Consumable Fuels | 11.4% | |
| Construction Materials | 4.5% | |
| All Others * | 12.3% | |
* Includes short-term investments and net other assets. |
Annual Report
Investments February 28, 2007
Showing Percentage of Net Assets
Common Stocks - 94.4% | |||
Shares | Value | ||
CHEMICALS - 43.5% | |||
Commodity Chemicals - 1.6% | |||
Lyondell Chemical Co. | 116,800 | $ 3,721,248 | |
Diversified Chemicals - 15.9% | |||
Dow Chemical Co. | 272,100 | 11,917,980 | |
E.I. du Pont de Nemours & Co. | 374,100 | 18,985,575 | |
PPG Industries, Inc. | 92,700 | 6,141,375 | |
37,044,930 | |||
Fertilizers & Agricultural Chemicals - 9.1% | |||
Agrium, Inc. | 66,500 | 2,552,422 | |
CF Industries Holdings, Inc. | 16,100 | 622,426 | |
Monsanto Co. | 254,400 | 13,404,336 | |
Potash Corp. of Saskatchewan, Inc. | 9,800 | 1,546,538 | |
The Mosaic Co. | 96,600 | 2,457,504 | |
The Scotts Miracle-Gro Co. Class A | 16,800 | 741,048 | |
21,324,274 | |||
Industrial Gases - 8.0% | |||
Air Products & Chemicals, Inc. | 104,300 | 7,803,726 | |
Airgas, Inc. | 41,400 | 1,708,578 | |
Praxair, Inc. | 147,200 | 9,080,768 | |
18,593,072 | |||
Specialty Chemicals - 8.9% | |||
Albemarle Corp. | 48,000 | 3,928,800 | |
Chemtura Corp. | 88,900 | 1,020,572 | |
Cytec Industries, Inc. | 28,100 | 1,652,842 | |
Minerals Technologies, Inc. | 14,000 | 866,460 | |
Nalco Holding Co. | 187,900 | 4,490,810 | |
Rohm & Haas Co. | 125,400 | 6,628,644 | |
Sigma Aldrich Corp. | 52,500 | 2,152,500 | |
20,740,628 | |||
TOTAL CHEMICALS | 101,424,152 | ||
CONSTRUCTION MATERIALS - 5.9% | |||
Construction Materials - 5.9% | |||
Martin Marietta Materials, Inc. | 22,200 | 2,782,104 | |
Polaris Minerals Corp. | 89,500 | 701,736 | |
Polaris Minerals Corp. (e) | 760,000 | 5,958,873 | |
Vulcan Materials Co. | 37,900 | 4,414,971 | |
13,857,684 | |||
CONTAINERS & PACKAGING - 5.7% | |||
Metal & Glass Containers - 3.3% | |||
Ball Corp. | 37,800 | 1,750,140 | |
Crown Holdings, Inc. (a) | 66,100 | 1,509,724 | |
Owens-Illinois, Inc. | 63,300 | 1,504,008 | |
Pactiv Corp. (a) | 64,000 | 2,060,800 | |
Silgan Holdings, Inc. | 14,400 | 708,624 | |
7,533,296 | |||
Shares | Value | ||
Paper Packaging - 2.4% | |||
Packaging Corp. of America | 177,900 | $ 4,358,550 | |
Smurfit-Stone Container Corp. | 104,100 | 1,284,594 | |
5,643,144 | |||
TOTAL CONTAINERS & PACKAGING | 13,176,440 | ||
MACHINERY - 0.6% | |||
Construction & Farm Machinery & Heavy Trucks - 0.6% | |||
Deere & Co. | 13,600 | 1,474,512 | |
METALS & MINING - 29.6% | |||
Aluminum - 4.4% | |||
Alcoa, Inc. | 306,600 | 10,243,506 | |
Diversified Metals & Mining - 9.0% | |||
BHP Billiton Ltd. sponsored ADR | 73,200 | 3,149,064 | |
Coalcorp Mining, Inc. (a) | 7,470,000 | 4,023,855 | |
Coalcorp Mining, Inc. warrants 2/8/11 (a) | 89,000 | 17,502 | |
Phelps Dodge Corp. | 78,400 | 9,792,944 | |
Rio Tinto PLC sponsored ADR | 14,800 | 3,206,568 | |
Skye Resources, Inc. (a) | 74,100 | 753,957 | |
20,943,890 | |||
Gold - 4.2% | |||
Agnico-Eagle Mines Ltd. | 54,000 | 2,125,741 | |
Goldcorp, Inc. | 167,700 | 4,499,531 | |
Meridian Gold, Inc. (a) | 112,300 | 3,080,316 | |
9,705,588 | |||
Precious Metals & Minerals - 0.1% | |||
Apex Silver Mines Ltd. (a) | 18,100 | 258,468 | |
Steel - 11.9% | |||
A.M. Castle & Co. | 36,500 | 1,051,200 | |
Allegheny Technologies, Inc. | 45,400 | 4,651,230 | |
Carpenter Technology Corp. | 16,000 | 1,896,800 | |
Chaparral Steel Co. | 84,800 | 4,225,584 | |
Companhia Vale do Rio Doce sponsored ADR | 59,000 | 2,013,080 | |
Nucor Corp. | 115,400 | 7,024,398 | |
United States Steel Corp. | 78,500 | 6,956,670 | |
27,818,962 | |||
TOTAL METALS & MINING | 68,970,414 | ||
OIL, GAS & CONSUMABLE FUELS - 1.6% | |||
Coal & Consumable Fuels - 1.6% | |||
Cameco Corp. | 98,300 | 3,635,137 | |
PAPER & FOREST PRODUCTS - 7.5% | |||
Forest Products - 3.8% | |||
Weyerhaeuser Co. (d) | 104,200 | 8,947,654 | |
Paper Products - 3.7% | |||
Bowater, Inc. | 27,400 | 662,532 | |
Common Stocks - continued | |||
Shares | Value | ||
PAPER & FOREST PRODUCTS - CONTINUED | |||
Paper Products - continued | |||
International Paper Co. | 168,700 | $ 6,074,887 | |
MeadWestvaco Corp. | 62,000 | 1,887,900 | |
8,625,319 | |||
TOTAL PAPER & FOREST PRODUCTS | 17,572,973 | ||
TOTAL COMMON STOCKS (Cost $189,632,363) | 220,111,312 | ||
Money Market Funds - 8.7% | |||
Fidelity Cash Central Fund, 5.35% (b) | 11,345,736 | 11,345,736 | |
Fidelity Securities Lending Cash Central Fund, 5.34% (b)(c) | 8,996,000 | 8,996,000 | |
TOTAL MONEY MARKET FUNDS (Cost $20,341,736) | 20,341,736 | ||
TOTAL INVESTMENT PORTFOLIO - 103.1% (Cost $209,974,099) | 240,453,048 | ||
NET OTHER ASSETS - (3.1)% | (7,253,808) | ||
NET ASSETS - 100% | $ 233,199,240 | ||
Legend |
(a) Non-income producing |
(b) Affiliated fund that is available only to investment companies and other accounts managed by Fidelity Investments. The rate quoted is the annualized seven-day yield of the fund at period end. A complete unaudited listing of the fund's holdings as of its most recent quarter end is available upon request. |
(c) Investment made with cash collateral received from securities on loan. |
(d) Security or a portion of the security is on loan at period end. |
(e) Security exempt from registration under Rule 144A of the Securities Act of 1933. These securities may be resold in transactions exempt from registration, normally to qualified institutional buyers. At the end of the period, the value of these securities amounted to $5,958,873 or 2.6% of net assets. |
Affiliated Central Funds |
Information regarding fiscal year to date income earned by the Fund from investments in Fidelity Central Funds is as follows: |
Fund | Income earned |
Fidelity Cash Central Fund | $ 479,587 |
Fidelity Securities Lending Cash Central Fund | 41,460 |
Total | $ 521,047 |
Other Information |
Distribution of investments by country of issue, as a percentage of total net assets, is as follows: |
United States of America | 83.8% |
Canada | 12.4% |
United Kingdom | 1.4% |
Australia | 1.4% |
Others (individually less than 1%) | 1.0% |
100.0% |
See accompanying notes which are an integral part of the financial statements.
Annual Report
Financial Statements
Statement of Assets and Liabilities
February 28, 2007 | ||
Assets | ||
Investment in securities, at value (including securities loaned of $8,934,640) - See accompanying schedule: Unaffiliated issuers (cost $189,632,363) | $ 220,111,312 | |
Fidelity Central Funds (cost $20,341,736) | 20,341,736 | |
Total Investments (cost $209,974,099) | $ 240,453,048 | |
Receivable for fund shares sold | 11,633,830 | |
Dividends receivable | 466,522 | |
Distributions receivable from Fidelity Central Funds | 52,504 | |
Prepaid expenses | 977 | |
Receivable from investment adviser for expense reductions | 253 | |
Other receivables | 7,378 | |
Total assets | 252,614,512 | |
Liabilities | ||
Payable for investments purchased | $ 9,034,723 | |
Payable for fund shares redeemed | 1,207,549 | |
Accrued management fee | 89,327 | |
Distribution fees payable | 867 | |
Other affiliated payables | 46,122 | |
Other payables and accrued expenses | 40,684 | |
Collateral on securities loaned, at value | 8,996,000 | |
Total liabilities | 19,415,272 | |
Net Assets | $ 233,199,240 | |
Net Assets consist of: | ||
Paid in capital | $ 195,867,931 | |
Undistributed net investment income | 276,784 | |
Accumulated undistributed net realized gain (loss) on investments and foreign currency transactions | 6,575,289 | |
Net unrealized appreciation (depreciation) on investments and assets and liabilities in foreign currencies | 30,479,236 | |
Net Assets | $ 233,199,240 | |
Statement of Assets and Liabilities - continued
February 28, 2007 | ||
Calculation of Maximum Offering Price Class A: | $ 51.01 | |
Maximum offering price per share (100/94.25 of $51.01) | $ 54.12 | |
Class T: | $ 50.89 | |
Maximum offering price per share (100/96.50 of $50.88) | $ 52.74 | |
Class B: | $ 50.81 | |
Class C: | $ 50.81 | |
Materials: | $ 50.92 | |
Institutional Class: | $ 50.91 | |
A Redemption price per share is equal to net asset value less any applicable contingent deferred sales charge.
See accompanying notes which are an integral part of the financial statements.
Annual Report
Statement of Operations
Year ended February 28, 2007 | ||
Investment Income | ||
Dividends | $ 3,072,290 | |
Interest | 1,871 | |
Income from Fidelity Central Funds | 521,047 | |
Total income | 3,595,208 | |
Expenses | ||
Management fee | $ 1,110,432 | |
Transfer agent fees | 582,866 | |
Distribution fees | 1,383 | |
Accounting and security lending fees | 91,132 | |
Custodian fees and expenses | 24,762 | |
Independent trustees' compensation | 702 | |
Registration fees | 126,372 | |
Audit | 37,168 | |
Legal | 3,517 | |
Interest | 2,189 | |
Miscellaneous | 12,463 | |
Total expenses before reductions | 1,992,986 | |
Expense reductions | (107,567) | 1,885,419 |
Net investment income (loss) | 1,709,789 | |
Realized and Unrealized Gain (Loss) Net realized gain (loss) on: | ||
Investment securities: | ||
Unaffiliated issuers | 18,867,914 | |
Foreign currency transactions | (725) | |
Total net realized gain (loss) | 18,867,189 | |
Change in net unrealized appreciation (depreciation) on: Investment securities | 2,128,190 | |
Assets and liabilities in foreign currencies | (123) | |
Total change in net unrealized appreciation (depreciation) | 2,128,067 | |
Net gain (loss) | 20,995,256 | |
Net increase (decrease) in net assets resulting from operations | $ 22,705,045 | |
Statement of Changes in Net Assets
Year ended | Year ended | |
Increase (Decrease) in Net Assets | ||
Operations | ||
Net investment income (loss) | $ 1,709,789 | $ 1,058,337 |
Net realized gain (loss) | 18,867,189 | 8,503,088 |
Change in net unrealized appreciation (depreciation) | 2,128,067 | 6,934,391 |
Net increase (decrease) in net assets resulting from operations | 22,705,045 | 16,495,816 |
Distributions to shareholders from net investment income | (1,721,356) | (770,963) |
Distributions to shareholders from net realized gain | (17,315,347) | (3,187,200) |
Total distributions | (19,036,703) | (3,958,163) |
Share transactions - net increase (decrease) | 59,771,650 | 12,434,145 |
Redemption fees | 236,747 | 108,867 |
Total increase (decrease) in net assets | 63,676,739 | 25,080,665 |
Net Assets | ||
Beginning of period | 169,522,501 | 144,441,836 |
End of period (including undistributed net investment income of $276,784 and undistributed net investment income of $394,580, respectively) | $ 233,199,240 | $ 169,522,501 |
See accompanying notes which are an integral part of the financial statements.
Annual Report
Financial Highlights - Class A
Year ended February 28, | 2007 H |
Selected Per-Share Data | |
Net asset value, beginning of period | $ 46.90 |
Income from Investment Operations | |
Net investment income (loss) E | .17 |
Net realized and unrealized gain (loss) | 3.93 |
Total from investment operations | 4.10 |
Redemption fees added to paid in capital E | .01 |
Net asset value, end of period | $ 51.01 |
Total Return B, C, D | 8.76% |
Ratios to Average Net Assets F, I | |
Expenses before reductions | 1.50% A |
Expenses net of fee waivers, if any | 1.40% A |
Expenses net of all reductions | 1.38% A |
Net investment income (loss) | 1.76% A |
Supplemental Data | |
Net assets, end of period (000 omitted) | $ 1,018 |
Portfolio turnover rate G | 185% |
A Annualized B Total returns for periods of less than one year are not annualized. C Total returns would have been lower had certain expenses not been reduced during the periods shown. D Total returns do not include the effect of the sales charges. E Calculated based on average shares outstanding during the period. F Fees and expenses of the underlying Fidelity Central Funds are not included in the Fund's expense ratio. The Fund indirectly bears its proportionate share of the expenses of any underlying Fidelity Central Funds. G Amount does not include the portfolio activity of any underlying Fidelity Central Funds. H For the period December 12, 2006 (commencement of sale of shares) to February 28, 2007. |
Financial Highlights - Class T
Year ended February 28, | 2007 H |
Selected Per-Share Data | |
Net asset value, beginning of period | $ 46.90 |
Income from Investment Operations | |
Net investment income (loss) E | .11 |
Net realized and unrealized gain (loss) | 3.87 |
Total from investment operations | 3.98 |
Redemption fees added to paid in capital E | .01 |
Net asset value, end of period | $ 50.89 |
Total Return B, C, D | 8.51% |
Ratios to Average Net Assets F, I | |
Expenses before reductions | 1.80% A |
Expenses net of fee waivers, if any | 1.65% A |
Expenses net of all reductions | 1.62% A |
Net investment income (loss) | 1.18% A |
Supplemental Data | |
Net assets, end of period (000 omitted) | $ 707 |
Portfolio turnover rate G | 185% |
A Annualized B Total returns for periods of less than one year are not annualized. C Total returns would have been lower had certain expenses not been reduced during the periods shown. D Total returns do not include the effect of the sales charges. E Calculated based on average shares outstanding during the period. F Fees and expenses of the underlying Fidelity Central Funds are not included in the Fund's expense ratio. The Fund indirectly bears its proportionate share of the expenses of any underlying Fidelity Central Funds. G Amount does not include the portfolio activity of any underlying Fidelity Central Funds. H For the period December 12, 2006 (commencement of sale of shares) to February 28, 2007. I Expense ratios reflect operating expenses of the class. Expenses before reductions do not reflect amounts reimbursed by the investment adviser or reductions from brokerage service arrangements or other expense offset arrangements and do not represent the amount paid by the class during periods when reimbursements or reductions occur. Expenses net of fee waivers reflect expenses after reimbursement by the investment adviser but prior to reductions from brokerage service arrangements or other expense offset arrangements. Expenses net of all reductions represent the net expenses paid by the class. |
See accompanying notes which are an integral part of the financial statements.
Annual Report
Financial Highlights - Class B
Year ended February 28, | 2007 H |
Selected Per-Share Data | |
Net asset value, beginning of period | $ 46.90 |
Income from Investment Operations | |
Net investment income (loss) E | .06 |
Net realized and unrealized gain (loss) | 3.84 |
Total from investment operations | 3.90 |
Redemption fees added to paid in capital E | .01 |
Net asset value, end of period | $ 50.81 |
Total Return B, C, D | 8.34% |
Ratios to Average Net Assets F, I | |
Expenses before reductions | 2.26% A |
Expenses net of fee waivers, if any | 2.15% A |
Expenses net of all reductions | 2.12% A |
Net investment income (loss) | .60% A |
Supplemental Data | |
Net assets, end of period (000 omitted) | $ 662 |
Portfolio turnover rate G | 185% |
A Annualized B Total returns for periods of less than one year are not annualized. C Total returns would have been lower had certain expenses not been reduced during the periods shown. D Total returns do not include the effect of the contingent deferred sales charge. E Calculated based on average shares outstanding during the period. F Fees and expenses of the underlying Fidelity Central Funds are not included in the Fund's expense ratio. The Fund indirectly bears its proportionate share of the expenses of any underlying Fidelity Central Funds. G Amount does not include the portfolio activity of any underlying Fidelity Central Funds. H For the period December 12, 2006 (commencement of sale of shares) to February 28, 2007. |
Financial Highlights - Class C
Year ended February 28, | 2007 H |
Selected Per-Share Data | |
Net asset value, beginning of period | $ 46.90 |
Income from Investment Operations | |
Net investment income (loss) E | .09 |
Net realized and unrealized gain (loss) | 3.81 |
Total from investment operations | 3.90 |
Redemption fees added to paid in capital E | .01 |
Net asset value, end of period | $ 50.81 |
Total Return B, C, D | 8.34% |
Ratios to Average Net Assets F, I | |
Expenses before reductions | 2.31% A |
Expenses net of fee waivers, if any | 2.15% A |
Expenses net of all reductions | 2.13% A |
Net investment income (loss) | .89% A |
Supplemental Data | |
Net assets, end of period (000 omitted) | $ 547 |
Portfolio turnover rate G | 185% |
A Annualized B Total returns for periods of less than one year are not annualized. C Total returns would have been lower had certain expenses not been reduced during the periods shown. D Total returns do not include the effect of the contingent deferred sales charge. E Calculated based on average shares outstanding during the period. F Fees and expenses of the underlying Fidelity Central Funds are not included in the Fund's expense ratio. The Fund indirectly bears its proportionate share of the expenses of any underlying Fidelity Central Funds. G Amount does not include the portfolio activity of any underlying Fidelity Central Funds. H For the period December 12, 2006 (commencement of sale of shares) to February 28, 2007. |
See accompanying notes which are an integral part of the financial statements.
Annual Report
Financial Highlights - Materials
Years ended February 28, | 2007 | 2006 | 2005 | 2004 H | 2003 |
Selected Per-Share Data | |||||
Net asset value, beginning of period | $ 46.35 | $ 40.78 | $ 35.99 | $ 23.83 | $ 25.89 |
Income from Investment Operations | |||||
Net investment income (loss) C | .42 | .32 | .15 | .13 F | .04 F |
Net realized and unrealized gain (loss) | 9.36 | 6.40 | 5.47 | 12.07 | (1.69) |
Total from investment operations | 9.78 | 6.72 | 5.62 | 12.20 | (1.65) |
Distributions from net investment income | (.48) | (.25) | (.12) | (.12) | (.46) |
Distributions from net realized gain | (4.79) | (.93) | (.74) | - | - |
Total distributions | (5.27) | (1.18) | (.86) | (.12) | (.46) |
Redemption fees added to paid in capital C | .06 | .03 | .03 | .08 | .05 |
Net asset value, end of period | $ 50.92 | $ 46.35 | $ 40.78 | $ 35.99 | $ 23.83 |
Total Return A, B | 22.29% | 17.01% | 16.09% | 51.73% | (6.16)% |
Ratios to Average Net Assets D, G | |||||
Expenses before reductions | 1.01% | 1.05% | 1.06% | 1.31% | 1.57% |
Expenses net of fee waivers, if any | .98% | 1.05% | 1.06% | 1.31% | 1.57% |
Expenses net of all reductions | .96% | 1.01% | 1.02% | 1.17% | 1.42% |
Net investment income (loss) | .87% | .78% | .42% | .43% | .16% |
Supplemental Data | |||||
Net assets, end of period (000 omitted) | $ 230,147 | $ 169,523 | $ 144,442 | $ 135,131 | $ 41,275 |
Portfolio turnover rate E | 185% | 124% | 89% | 175% | 226% |
A Total returns would have been lower had certain expenses not been reduced during the periods shown. B Total returns do not include the effect of the former sales charges. C Calculated based on average shares outstanding during the period. |
Financial Highlights - Institutional Class
Years ended February 28, | 2007 G |
Selected Per-Share Data | |
Net asset value, beginning of period | $ 46.90 |
Income from Investment Operations | |
Net investment income (loss) D | .08 |
Net realized and unrealized gain (loss) | 3.92 |
Total from investment operations | 4.00 |
Redemption fees added to paid in capital D | .01 |
Net asset value, end of period | $ 50.91 |
Total Return B, C | 8.55% |
Ratios to Average Net Assets E, H | |
Expenses before reductions | 1.06% A |
Expenses net of fee waivers, if any | 1.06% A |
Expenses net of all reductions | 1.04% A |
Net investment income (loss) | .79% A |
Supplemental Data | |
Net assets, end of period (000 omitted) | $ 119 |
Portfolio turnover rate F | 185% |
A Annualized B Total returns for periods of less than one year are not annualized. C Total returns would have been lower had certain expenses not been reduced during the periods shown. D Calculated based on average shares outstanding during the period. E Fees and expenses of the underlying Fidelity Central Funds are not included in the Fund's expense ratio. The Fund indirectly bears its proportionate share of the expenses of any underlying Fidelity Central Funds. F Amount does not include the portfolio activity of any underlying Fidelity Central Funds. G For the period December 12, 2006 (commencement of sale of shares) to February 28, 2007. H Expense ratios reflect operating expenses of the class. Expenses before reductions do not reflect amounts reimbursed by the investment adviser or reductions from brokerage service arrangements or other expense offset arrangements and do not represent the amount paid by the class during periods when reimbursements or reductions occur. Expenses net of fee waivers reflect expenses after reimbursement by the investment adviser but prior to reductions from brokerage service arrangements or other expense offset arrangements. Expenses net of all reductions represent the net expenses paid by the class. |
See accompanying notes which are an integral part of the financial statements.
Annual Report
Notes to Financial Statements
For the period ended February 28, 2007
1. Organization.
Materials Portfolio (the Fund) (formerly Industrial Materials Portfolio) is a non-diversified fund of Fidelity Select Portfolios (the trust) and is authorized to issue an unlimited number of shares. The trust is registered under the Investment Company Act of 1940, as amended (the 1940 Act), as an open-end management investment company organized as a Massachusetts business trust. The Fund invests primarily in securities of companies whose principal business activities fall within specific industries. The Fund offers Class A, Class T, Class B, Class C, Materials, and Institutional Class shares, each of which has equal rights as to assets and voting privileges. Each class has exclusive voting rights with respect to matters that affect that class. The Fund commenced sale of Class A, Class T, Class B, Class C and Institutional Class shares and the existing class was designated Materials on December 12, 2006. Class B shares will automatically convert to Class A shares after a holding period of seven years from the initial date of purchase. Investment income, realized and unrealized capital gains and losses, the common expenses of the Fund, and certain fund-level expense reductions, if any, are allocated on a pro rata basis to each class based on the relative net assets of each class to the total net assets of the Fund. Each class differs with respect to transfer agent and distribution and service plan fees incurred. Certain expense reductions also differ by class. The financial statements have been prepared in conformity with accounting principles generally accepted in the United States of America, which require management to make certain estimates and assumptions at the date of the financial statements.
2. Investments in Fidelity Central Funds.
The Fund may invest in Fidelity Central Funds which are open-end investment companies available only to other investment companies and accounts managed by FMR and its affiliates. The Fund's Schedule of Investments lists each of the Fidelity Central Funds as an investment of the Fund but does not include the underlying holdings of each Fidelity Central Fund. As an Investing Fund, the Fund indirectly bears its proportionate share of the expenses of the underlying Fidelity Central Funds. A complete unaudited list of holdings for each Fidelity Central Fund is available upon request. In addition, the financial statements of the Fidelity Central Funds, which are not covered by the Fund's Report of Independent Registered Public Accounting Firm, are available on the EDGAR Database on the SEC's web site, www.sec.gov, or upon request.
The Money Market Central Funds seek preservation of capital and current income and are managed by Fidelity Investments Money Management, Inc. (FIMM) an affiliate of Fidelity Management & Research Company (FMR).
3. Significant Accounting Policies.
The following summarizes the significant accounting policies of the Fund:
Security Valuation. Investments are valued and net asset value (NAV) per share is calculated (NAV calculation) as of the close of business of the New York Stock Exchange (NYSE), normally 4:00 p.m. Eastern time. During the period the Fund also calculated a NAV each hour on the hour (commencing at 10:00 a.m. Eastern time until one hour prior to the close of business on the NYSE). Effective October 1, 2006 the Fund eliminated hourly NAV calculation.
Wherever possible, the Fund uses independent pricing services approved by the Board of Trustees to value its investments. Equity securities, including restricted securities, for which market quotations are readily available, are valued at the last reported sale price or official closing price as reported by an independent pricing service on the primary market or exchange on which they are traded. In the event there were no sales during the day or closing prices are not available, securities are valued at the last quoted bid price. Investments in open-end mutual funds, including the Fidelity Central Funds, are valued at their closing net asset value each business day. Short-term securities with remaining maturities of sixty days or less for which quotations are not readily available are valued at amortized cost, which approximates value.
When current market prices or quotations are not readily available or do not accurately reflect fair value, valuations may be determined in accordance with procedures adopted by the Board of Trustees. For example, when developments occur between the close of a market and the close of the NYSE that may materially affect the value of some or all of the securities, or when trading in a security is halted, those securities may be fair valued. Factors used in the determination of fair value may include monitoring news to identify significant market or security specific events such as changes in the value of U.S. securities markets, reviewing developments in foreign markets and evaluating the performance of ADRs, futures contracts and exchange-traded funds. Because the Fund's utilization of fair value pricing depends on market activity, the frequency with which fair value pricing is used cannot be predicted and may be utilized to a significant extent. The value of securities used for NAV calculation under fair value pricing may differ from published prices for the same securities.
Annual Report
Notes to Financial Statements - continued
3. Significant Accounting Policies - continued
Foreign Currency. The Fund uses foreign currency contracts to facilitate transactions in foreign-denominated securities. Losses from these transactions may arise from changes in the value of the foreign currency or if the counterparties do not perform under the contracts' terms.
Foreign-denominated assets, including investment securities, and liabilities are translated into U.S. dollars at the exchange rate at period end. Purchases and sales of investment securities, income and dividends received and expenses denominated in foreign currencies are translated into U.S. dollars at the exchange rate in effect on the transaction date.
The effects of exchange rate fluctuations on investments are included with the net realized and unrealized gain (loss) on investment securities. Other foreign currency transactions resulting in realized and unrealized gain (loss) are disclosed separately.
Investment Transactions and Income. For financial reporting purposes, the Fund's investment holdings and NAV include trades executed through the end of the last business day of the period. The NAV for processing shareholder transactions includes trades executed through the end of the prior business day. Gains and losses on securities sold are determined on the basis of identified cost and may include proceeds received from litigation. Dividend income is recorded on the ex-dividend date, except for certain dividends from foreign securities where the ex-dividend date may have passed, which are recorded as soon as the Fund is informed of the ex-dividend date. Non-cash dividends included in dividend income, if any, are recorded at the fair market value of the securities received. Interest income and capital gain distributions from the Fidelity Central Funds are accrued as earned, with any distributions receivable as of period end included in Distributions receivable from Fidelity Central Funds on the Statement of Assets and Liabilities. Interest income includes coupon interest and amortization of premium and accretion of discount on debt securities. Investment income is recorded net of foreign taxes withheld where recovery of such taxes is uncertain.
Expenses. Most expenses of the trust can be directly attributed to a fund. Expenses which cannot be directly attributed are apportioned among each Fund in the trust. Expense estimates are accrued in the period to which they relate and adjustments are made when actual amounts are known.
Income Tax Information and Distributions to Shareholders. Each year, the Fund intends to qualify as a regulated investment company by distributing all of its taxable income and realized gains under Subchapter M of the Internal Revenue Code. As a result, no provision for income taxes is required in the accompanying financial statements. Foreign taxes are provided for based on the Fund's understanding of the tax rules and rates that exist in the foreign markets in which it invests.
Distributions are recorded on the ex-dividend date. Income dividends and capital gain distributions are declared separately for each class. Income and capital gain distributions are determined in accordance with income tax regulations, which may differ from generally accepted accounting principles.
Capital accounts within the financial statements are adjusted for permanent book-tax differences. These adjustments have no impact on net assets or the results of operations. Temporary book-tax differences will reverse in a subsequent period.
Book-tax differences are primarily due to foreign currency transactions, passive foreign investment companies (PFIC), deferred trustees compensation, and losses deferred due to wash sales.
The tax-basis components of distributable earnings and the federal tax cost as of period end were as follows:
Unrealized appreciation | $ 31,287,329 |
Unrealized depreciation | (4,284,560) |
Net unrealized appreciation (depreciation) | 27,002,769 |
Undistributed ordinary income | 276,796 |
Undistributed long-term capital gain | 3,618,826 |
Cost for federal income tax purposes | $ 213,450,279 |
The tax character of distributions paid was as follows:
February 28, 2007 | February 28, 2006 | |
Ordinary Income | $ 4,275,377 | $ 770,963 |
Long-term Capital Gains | 14,761,326 | 3,187,200 |
Total | $ 19,036,703 | $ 3,958,163 |
Trading (Redemption) Fees. Shares in the Fund held less than 30 days are subject to a redemption fee equal to .75% of the net asset value of shares redeemed. All redemption fees, including any estimated redemption fees paid by FMR, are retained by the Fund and accounted for as an addition to paid in capital. Shareholders were also subject to an additional $7.50 fee for shares exchanged into another Fidelity fund (see Note 6).
Annual Report
3. Significant Accounting Policies - continued
New Accounting Pronouncements. In July 2006, Financial Accounting Standards Board Interpretation No. 48, Accounting for Uncertainty in Income Taxes - an interpretation of FASB Statement 109 (FIN 48), was issued and is effective on the last business day of the semiannual reporting period for fiscal years beginning after December 15, 2006. FIN 48 sets forth a threshold for financial statement recognition, measurement and disclosure of a tax position taken or expected to be taken on a tax return. Management is currently evaluating the impact, if any, the adoption of FIN 48 will have on the Fund's net assets, results of operations and financial statement disclosures.
In addition, in September 2006, Statement of Financial Accounting Standards No. 157, Fair Value Measurements (SFAS 157), was issued and is effective for fiscal years beginning after November 15, 2007. SFAS 157 defines fair value, establishes a framework for measuring fair value and expands disclosures about fair value measurements. Management is currently evaluating the impact the adoption of SFAS 157 will have on the Fund's financial statement disclosures.
4. Operating Policies.
Repurchase Agreements. FMR has received an Exemptive Order from the Securities and Exchange Commission (the SEC) which permits the Fund and other affiliated entities of FMR to transfer uninvested cash balances into joint trading accounts which are then invested in repurchase agreements. The Fund may also invest directly with institutions in repurchase agreements. Repurchase agreements are collateralized by government or non-government securities. Upon settlement date, collateral is held in segregated accounts with custodian banks and may be obtained in the event of a default of the counterparty. The Fund monitors, on a daily basis, the value of the collateral to ensure it is at least equal to the principal amount of the repurchase agreement (including accrued interest). In the event of a default by the counterparty, realization of the collateral proceeds could be delayed, during which time the value of the collateral may decline.
Restricted Securities. The Fund may invest in securities that are subject to legal or contractual restrictions on resale. These securities generally may be resold in transactions exempt from registration or to the public if the securities are registered. Disposal of these securities may involve time-consuming negotiations and expense, and prompt sale at an acceptable price may be difficult. Information regarding restricted securities is included at the end of the Fund's Schedule of Investments.
5. Purchases and Sales of Investments.
Purchases and sales of securities, other than short-term securities, aggregated $385,380,320 and $348,269,722, respectively.
6. Fees and Other Transactions with Affiliates.
Management Fee. FMR and its affiliates provide the Fund with investment management related services for which the Fund pays a monthly management fee. The management fee is the sum of an individual fund fee rate that is based on an annual rate of .30% of the Fund's average net assets and a group fee rate that averaged .26% during the period. The group fee rate is based upon the average net assets of all the mutual funds advised by FMR. The group fee rate decreases as assets under management increase and increases as assets under management decrease. For the period, the total annual management fee rate was .56% of the Fund's average net assets.
Distribution and Service Plan. In accordance with Rule 12b-1 of the 1940 Act, the Fund has adopted separate Distribution and Service Plans for each class of shares. Certain classes pay Fidelity Distributors Corporation (FDC), an affiliate of FMR, separate Distribution and Service Fees, each of which is based on an annual percentage of each class' average net assets. In addition, FDC may pay financial intermediaries for selling shares of the Fund and providing shareholder support services. For the period, the Distribution and Service Fee rates and the total amounts paid to and retained by FDC were as follows:
Distribution | Service | Paid to | Retained | |
Class A | -% | .25% | $ 175 | $ 107 |
Class T | .25% | .25% | 224 | 110 |
Class B | .75% | .25% | 620 | 527 |
Class C | .75% | .25% | 364 | 280 |
$ 1,383 | $ 1,024 |
Sales Load. FDC receives a front-end sales charge of up to 5.75% for selling Class A shares, and 3.50% for selling Class T shares, some of which is paid to financial intermediaries for selling shares of the Fund. FDC receives the proceeds of contingent deferred sales charges levied on Class A, Class T, Class B, and Class C redemptions. These charges depend on the holding period. The deferred sales charges range from 5% to 1% for Class B, 1% for Class C, 1.00% to .50% for certain purchases of Class A shares and .25% for certain purchases of Class T shares.
Annual Report
Notes to Financial Statements - continued
6. Fees and Other Transactions with Affiliates - continued
Sales Load - continued
For the period, sales charge amounts retained by FDC were as follows:
Retained | |
Class A | $ 973 |
Class T | 311 |
$ 1,284 |
Transfer Agent Fees. Fidelity Investments Institutional Operations Company, Inc. (FIIOC), an affiliate of FMR, is the transfer, dividend disbursing and shareholder servicing agent for each class of the Fund, except for Materials class. Fidelity Service Company, Inc. (FSC), an affiliate of FMR, is the transfer agent for Materials class shares. FIIOC and FSC receive account fees and asset-based fees that vary according to the account size and type of account of the shareholders of the respective classes of the Fund. FIIOC and FSC pay for typesetting, printing and mailing of shareholder reports, except proxy statements. For the period, the total transfer agent fees paid by each class to FIIOC or FSC, were as follows:
Amount | % of | |
Class A | $ 89 | .14 |
Class T | 91 | .21 |
Class B | 126 | .22 |
Class C | 63 | .18 |
Materials | 582,390 | .30 |
Institutional Class | 107 | .29 |
$ 582,866 |
Accounting and Security Lending Fees. FSC maintains the Fund's accounting records. The accounting fee is based on the level of average net assets for the month. Under a separate contract, FSC administers the security lending program. The security lending fee is based on the number and duration of lending transactions.
Exchange Fees. During the period, FSC received the proceeds of a $7.50 fee to cover administrative costs associated with exchanges out of the Fund to any other Fidelity Select fund or to any other Fidelity fund made through non-automated channels. Effective October 1, 2006, the exchange fees were eliminated. For the period, exchange fees retained by FSC were as follows:
Retained | |
Materials Portfolio | $ 3,510 |
Brokerage Commissions. The Fund placed a portion of its portfolio transactions with brokerage firms which are affiliates of the investment adviser. The commissions paid to these affiliated firms were $847 for the period.
Interfund Lending Program. Pursuant to an Exemptive Order issued by the SEC, the Fund, along with other registered investment companies having management contracts with FMR, may participate in an interfund lending program. This program provides an alternative credit facility allowing the funds to borrow from, or lend money to, other participating affiliated funds. At period end, there were no interfund loans outstanding. The Fund's activity in this program during the period for which loans were outstanding was as follows:
Borrower or Lender | Average Daily | Weighted Average Interest Rate | Interest |
Borrower | $ 7,629,000 | 5.17% | $ 2,189 |
7. Committed Line of Credit.
The Fund participates with other funds managed by FMR in a $4.2 billion credit facility (the "line of credit") to be utilized for temporary or emergency purposes to fund shareholder redemptions or for other short-term liquidity purposes. The Fund has agreed to pay commitment fees on its pro rata portion of the line of credit, which amounted to $512 and is reflected in Miscellaneous Expense on the Statement of Operations. During the period, there were no borrowings on this line of credit.
Annual Report
8. Security Lending.
The Fund lends portfolio securities from time to time in order to earn additional income. On the settlement date of the loan, the Fund receives collateral (in the form of U.S. Treasury obligations, letters of credit and/or cash) against the loaned securities and maintains collateral in an amount not less than 100% of the market value of the loaned securities during the period of the loan. The market value of the loaned securities is determined at the close of business of the Fund and any additional required collateral is delivered to the Fund on the next business day. If the borrower defaults on its obligation to return the securities loaned because of insolvency or other reasons, a fund could experience delays and costs in recovering the securities loaned or in gaining access to the collateral. Any cash collateral received is invested in the Fidelity Securities Lending Cash Central Fund. The value of loaned securities and cash collateral at period end are disclosed on the Fund's Statement of Assets and Liabilities. Security lending income represents the income earned on investing cash collateral, less fees and expenses associated with the loan, plus any premium payments that may be received on the loan of certain types of securities. Security lending income is presented in the Statement of Operations as a component of income from Fidelity Central Funds. Net income from lending portfolio securities during the period amounted to $41,460.
9. Expense Reductions.
FMR voluntarily agreed to reimburse each class to the extent annual operating expenses exceeded certain levels of average net assets as noted in the table below. Some expenses, for example interest expense, including commitment fees, are excluded from this reimbursement.
The following classes were in reimbursement during the period:
Expense | Reimbursement | |
Class A | 1.40% | $ 67 |
Class T | 1.65% | 64 |
Class B | 2.15% | 66 |
Class C | 2.15% | 56 |
$ 253 |
FMR voluntarily agreed to reimburse a portion of Material's operating expenses. During the period, this reimbursement reduced the class' expenses by $56,875.
Many of the brokers with whom FMR places trades on behalf of the Fund provided services to the Fund in addition to trade execution. These services included payments of certain expenses on behalf of the Fund totaling $46,655 for the period. In addition, through arrangements with the each class' transfer agent, credits realized as a result of uninvested cash balances were used to reduce the Fund's expenses. During the period, credits reduced each class' transfer agent expense as noted in the table below.
Transfer Agent | |
Materials | $ 978 |
10. Other.
The Fund's organizational documents provide former and current trustees and officers with a limited indemnification against liabilities arising in connection with the performance of their duties to the Fund. In the normal course of business, the Fund may also enter into contracts that provide general indemnifications. The Fund's maximum exposure under these arrangements is unknown as this would be dependent on future claims that may be made against the Fund. The risk of material loss from such claims is considered remote.
The United States Securities and Exchange Commission ("SEC") is conducting an investigation of FMR (covering the years 2002 to 2004) arising from gifts, gratuities and business entertainment provided by certain brokers to certain individuals who were employed on FMR's domestic equity trading desk during that period. FMR is in discussions with the SEC staff regarding the possible resolution of the matter, but as of period-end no final resolution has been reached.
In December 2006, the Independent Trustees completed their own investigation of the matter with the assistance of independent counsel. The Independent Trustees and FMR agree that, despite the absence of proof that the Fidelity mutual funds experienced diminished execution quality as a result of the improper receipt of gifts and business entertainment, the conduct at issue was serious and is worthy of redress. Accordingly, the Independent Trustees have requested and FMR has agreed to pay $42 million to Fidelity mutual funds, plus interest to be determined at the time that payment is made. A method of allocating this payment among the funds has not yet been determined. The total payment to the Fund is not anticipated to have a material impact on the Fund's net assets. In addition, FMR reimbursed related legal expenses which are recorded in the accompanying Statement of Operations as an expense reduction.
Annual Report
Notes to Financial Statements - continued
11. Distributions to Shareholders.
Distributions to shareholders of each class were as follows:
Years ended February 28, | 2007 | 2006 |
From net investment income | ||
Materials | $ 1,721,356 | $ 770,963 |
From net realized gain | ||
Materials | $ 17,315,347 | $ 3,187,200 |
12. Share Transactions.
Transactions for each class of shares were as follows:
Shares | Dollars | |||
Years ended February 28, | 2007 A | 2006 | 2007 A | 2006 |
Class A | ||||
Shares sold | 19,960 | - | $ 1,010,235 | $ - |
Shares redeemed | - | - | - | - |
Net increase (decrease) | 19,960 | - | $ 1,010,235 | $ - |
Class T | ||||
Shares sold | 13,890 | - | $ 703,837 | $ - |
Shares redeemed | - | - | - | - |
Net increase (decrease) | 13,890 | - | $ 703,837 | $ - |
Class B | ||||
Shares sold | 13,022 | - | $ 643,438 | $ - |
Shares redeemed | - | - | - | - |
Net increase (decrease) | 13,022 | - | $ 643,438 | $ - |
Class C | ||||
Shares sold | 10,758 | - | $ 546,127 | $ - |
Shares redeemed | - | - | - | - |
Net increase (decrease) | 10,758 | - | $ 546,127 | $ - |
Materials | ||||
Shares sold | 6,290,426 | 4,217,962 | $ 311,961,345 | $ 177,007,921 |
Reinvestment of distributions | 378,787 | 93,814 | 18,026,752 | 3,742,752 |
Shares redeemed | (5,806,915) | (4,196,527) | (273,224,056) | (168,316,528) |
Net increase (decrease) | 862,298 | - | $ 56,764,041 | $ 12,434,145 |
Institutional Class | ||||
Shares sold | 4,445 | - | $ 210,000 | $ - |
Shares redeemed | (2,112) | - | (106,028) | - |
Net increase (decrease) | 2,333 | - | $ 103,972 | $ - |
A Share transactions for Class A, Class T, Class B, Class C and Institutional Class are for the period December 12, 2006 (commencement of sale of shares) to February 28, 2007.
Annual Report
Select Paper and Forest Products Portfolio
Performance
Average annual total return reflects the change in the value of an investment, assuming reinvestment of the fund's dividend income and capital gains (the profits earned upon the sale of securities that have grown in value) and assuming a constant rate of performance each year. The $10,000 table and the fund's returns do not reflect the deduction of taxes that a shareholder would pay on fund distributions or the redemption of fund shares. During periods of reimbursement by Fidelity, a fund's total returns will be greater than it would be had the reimbursement not occurred. How a fund did yesterday is no guarantee of how it will do tomorrow.
Average Annual Total Returns
Periods ended February 28, 2007 | Past 1 | Past 5 | Past 10 |
Select Paper and Forest Products Portfolio | 17.70% | 4.78% | 6.70% |
$10,000 Over 10 Years
Let's say hypothetically that $10,000 was invested in Select Paper and Forest Products Portfolio on February 28, 1997. The chart shows how the value of your investment would have changed, and also shows how the S&P 500 Index performed over the same period.
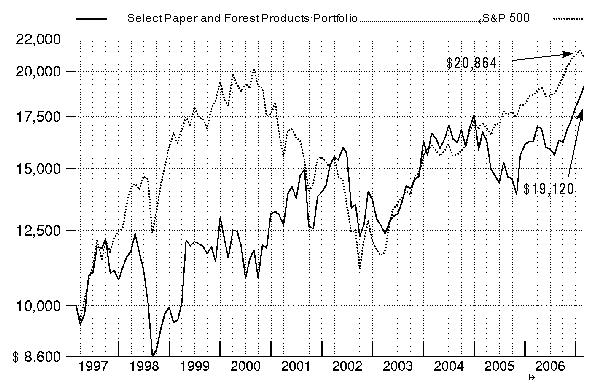
Annual Report
Select Paper and Forest Products Portfolio
Management's Discussion of Fund Performance
Comments from Justin Bennett, who became sole Portfolio Manager of Fidelity® Select Paper and Forest Products Portfolio on
January 4, 2007
A rosy year for stocks wilted just prior to the end of the 12-month period ending February 28, 2007. On the day prior to the period's close, the Dow Jones Industrial AverageSM plunged 416 points and the Standard & Poor's 500SM Index lost roughly 3.5% of its value, plummeting nearly 50 points and marking the benchmark's worst single-day performance since the day the market reopened after the 9/11 terrorist attacks. Though investors were obviously rattled by the development, it was only the 22nd-biggest decline for the S&P 500® in 20 years, and it could not overshadow how well stocks performed for the 12 months overall. For much of the past year, investors grew confident that the economy would not fall into a recession, and they bid up most broad-based stock indexes for six consecutive months from August through January. Overall for the year ending February 28, 2007, the S&P 500 was up 11.97%, the Dow advanced 14.24%, the small-cap Russell 2000® Index gained 9.87% and the NASDAQ Composite® Index rose 6.66%.
During the past year, the fund returned 17.70%, falling short of the 23.99% return of the Morgan Stanley Capital InternationalSM (MSCI®) US Investable Market Materials Index and also trailing the 24.60% advance of a blended index specific to this fund. This blended index is a combination of the Goldman Sachs® Natural Resources Index, which the fund was compared with through September, and the new MSCI benchmark mentioned above, which the fund was compared with during the period's final five months1. During the same 12-month period, the fund beat the S&P 500. For the first seven months of the review period, the fund trailed the Goldman Sachs index, as large overweightings in forest products and in paper packaging hampered its results. Having no investments in integrated oil and gas or in diversified metals and mining also was detrimental. On the other hand, stock selection in paper packaging was helpful, despite that group's overall mediocre performance. My picks in specialized REITs (real estate investment trusts) also helped, as did a lack of exposure to various other energy groups. Among individual holdings, not owning integrated energy stocks and major index components Chevron and Exxon Mobil had a negative impact. A large overweighting in containerboard manufacturer Smurfit-Stone Container also hurt. Despite higher containerboard prices, the stock was hampered by surging energy prices for much of the period. On the positive side, an out-of-index position in REIT Longview Fibre added value. Canada-based Domtar also boosted performance and I sold it to nail down profits. The fund trailed the MSCI index during the final five months, with a lack of exposure to steel, diversified metals and mining, and construction materials, together with a higher-than-benchmark weighting in paper-related stocks, having the most negative impact. Conversely, an overweighting in the strong performing forest products segment was beneficial, along with not having stakes in the diversified chemicals, industrial gases or specialty chemicals groups. Overall, stock selection had a net negative impact on performance, while market selection helped. At the company level, an out-of-benchmark position in Abitibi-Consolidated, a Canadian maker of newsprint, detracted from performance. The company's decision to cease capacity closures resulted in oversupply, and newsprint prices began to fall because of steadily declining demand. The share price of packaging maker Bemis also struggled. Not owning copper producer and index component Phelps Dodge further detracted, as the stock surged on the news that the company would be acquired by rival Freeport-McMoRan Copper & Gold. Among contributors, the stocks of forest products company Weyerhaeuser and packaging provider Temple-Inland both surged, as interest in companies with extensive land holdings captivated the market.
1 The fund's blended index is a customized index developed by Fidelity for the limited purpose of discussing the fund's performance for the 12-month period ending February 28, 2007. From March 1, 2006, through September 30, 2006, the fund compared its performance to the Goldman Sachs Natural Resources Index, which returned 2.61% during that period. On October 1, 2006, the fund began comparing its performance to a different index, the MSCI US Investable Market Materials Index, which returned 21.43% from October 1, 2006, through February 28, 2007. For the 12-month period ending February 28, 2007, the blended index (Goldman Sachs and MSCI) returned 24.60%.
The views expressed above reflect those of the portfolio manager(s) only through the end of the period as stated on the cover of this report and do not necessarily represent the views of Fidelity or any other person in the Fidelity organization. Any such views are subject to change at any time based upon market or other conditions and Fidelity disclaims any responsibility to update such views. These views may not be relied on as investment advice and, because investment decisions for a Fidelity fund are based on numerous factors, may not be relied on as an indication of trading intent on behalf of any Fidelity fund.
Annual Report
Select Paper and Forest Products Portfolio
Shareholder Expense Example
As a shareholder of the Fund, you incur two types of costs: (1) transaction costs, including redemption fees, exchange fees, and (2) ongoing costs, including management fees and other Fund expenses. This Example is intended to help you understand your ongoing costs (in dollars) of investing in the Fund and to compare these costs with the ongoing costs of investing in other mutual funds.
The Example is based on an investment of $1,000 invested at the beginning of the period and held for the entire period (September 1, 2006 to February 28, 2007).
Actual Expenses
The first line of the accompanying table provides information about actual account values and actual expenses. You may use the information in this line, together with the amount you invested, to estimate the expenses that you paid over the period. Simply divide your account value by $1,000.00 (for example, an $8,600 account value divided by $1,000.00 = 8.6), then multiply the result by the number in the first line under the heading entitled "Expenses Paid During Period" to estimate the expenses you paid on your account during this period. A small balance maintenance fee of $12.00 that is charged once a year may apply for certain accounts with a value of less than $2,000. This fee is not included in the table below. If it was, the estimate of expenses you paid during the period would be higher, and your ending account value lower, by this amount.
Hypothetical Example for Comparison Purposes
The second line of the accompanying table provides information about hypothetical account values and hypothetical expenses based on the Fund's actual expense ratio and an assumed rate of return of 5% per year before expenses, which is not the Fund's actual return. The hypothetical account values and expenses may not be used to estimate the actual ending account balance or expenses you paid for the period. You may use this information to compare the ongoing costs of investing in the Fund and other funds. To do so, compare this 5% hypothetical example with the 5% hypothetical examples that appear in the shareholder reports of the other funds. A small balance maintenance fee of $12.00 that is charged once a year may apply for certain accounts with a value of less than $2,000. This fee is not included in the table below. If it was, the estimate of expenses you paid during the period would be higher, and your ending account value lower, by this amount.
Please note that the expenses shown in the table are meant to highlight your ongoing costs only and do not reflect any transaction costs. Therefore, the second line of the table is useful in comparing ongoing costs only, and will not help you determine the relative total costs of owning different funds. In addition, if these transactional costs were included, your costs would have been higher.
Beginning | Ending | Expenses Paid | |
Actual | $ 1,000.00 | $ 1,171.10 | $ 6.19 * * |
Hypothetical (5% return per year before expenses) | $ 1,000.00 | $ 1,019.09 | $ 5.76 * * |
* Expenses are equal to the Fund's annualized expense ratio of 1.15%; multiplied by the average account value over the period, multiplied by 181/365 (to reflect the one-half year period).
**If fees effective January 1, 2007 had been in effect during the entire period, the annualized expense ratio would have been 1.05% and the expenses paid in the actual and hypothetical examples above would have been $5.65 and $5.26, respectively.
Annual Report
Select Paper and Forest Products Portfolio
Investment Changes
Top Ten Stocks as of February 28, 2007 | ||
% of fund's | % of fund's net assets | |
Weyerhaeuser Co. | 9.4 | 6.7 |
Temple-Inland, Inc. | 8.8 | 6.5 |
MeadWestvaco Corp. | 8.5 | 4.3 |
Plum Creek Timber Co., Inc. | 6.7 | 5.4 |
International Paper Co. | 4.8 | 3.0 |
Bemis Co., Inc. | 4.7 | 5.1 |
Smurfit-Stone Container Corp. | 4.3 | 6.2 |
Packaging Corp. of America | 3.7 | 3.7 |
Sealed Air Corp. | 3.1 | 5.3 |
Rayonier, Inc. | 2.9 | 4.8 |
56.9 | ||
Top Industries (% of fund's net assets) | |||
As of February 28, 2007 | |||
| Paper & Forest Products | 41.7% | |
| Containers & Packaging | 29.0% | |
| Real Estate Investment Trusts | 13.5% | |
| Machinery | 2.7% | |
| Diversified Financial Services | 0.4% | |
| All Others* | 12.7% | |
As of August 31, 2006 | |||
| Containers & Packaging | 34.9% | |
| Paper & Forest Products | 32.8% | |
| Real Estate Investment Trusts | 20.5% | |
| Household Products | 5.9% | |
| Textiles, Apparel & Luxury Goods | 1.3% | |
| All Others* | 4.6% | |
* Includes short-term investments and net other assets. |
Annual Report
Select Paper and Forest Products Portfolio
Investments February 28, 2007
Showing Percentage of Net Assets
Common Stocks - 82.5% | |||
Shares | Value | ||
CONTAINERS & PACKAGING - 29.0% | |||
Metal & Glass Containers - 1.1% | |||
Ball Corp. | 5 | $ 232 | |
Owens-Illinois, Inc. | 12,000 | 285,120 | |
Silgan Holdings, Inc. | 6,400 | 314,944 | |
600,296 | |||
Paper Packaging - 27.9% | |||
Bemis Co., Inc. | 80,000 | 2,650,400 | |
Graphic Packaging Corp. (a) | 185,600 | 890,880 | |
Packaging Corp. of America | 84,700 | 2,075,150 | |
Sealed Air Corp. | 27,100 | 1,746,324 | |
Smurfit-Stone Container Corp. | 197,570 | 2,438,014 | |
Sonoco Products Co. | 26,200 | 969,924 | |
Temple-Inland, Inc. | 83,800 | 5,011,240 | |
15,781,932 | |||
TOTAL CONTAINERS & PACKAGING | 16,382,228 | ||
DIVERSIFIED FINANCIAL SERVICES - 0.4% | |||
Specialized Finance - 0.4% | |||
Stone Arcade Acquisition Corp. (a) | 34,300 | 219,520 | |
HOUSEHOLD PRODUCTS - 0.0% | |||
Household Products - 0.0% | |||
Kimberly-Clark Corp. | 100 | 6,811 | |
MACHINERY - 2.7% | |||
Industrial Machinery - 2.7% | |||
Albany International Corp. Class A | 32,700 | 1,118,340 | |
Kadant, Inc. (a) | 17,200 | 403,168 | |
1,521,508 | |||
MEDIA - 0.2% | |||
Publishing - 0.2% | |||
McGraw-Hill Companies, Inc. | 1,800 | 116,298 | |
PAPER & FOREST PRODUCTS - 36.4% | |||
Forest Products - 16.3% | |||
Canfor Corp. New (a) | 80,800 | 795,184 | |
Deltic Timber Corp. | 4,900 | 253,918 | |
Louisiana-Pacific Corp. | 52,000 | 1,073,280 | |
Masisa SA ADR | 54,200 | 598,910 | |
West Fraser Timber Co. Ltd. | 30,200 | 1,140,037 | |
Weyerhaeuser Co. (d) | 62,000 | 5,323,939 | |
9,185,268 | |||
Paper Products - 20.1% | |||
Abitibi-Consolidated, Inc. | 271,400 | 749,538 | |
Aracruz Celulose SA (PN-B) sponsored ADR (non-vtg.) | 3,700 | 198,542 | |
Bowater, Inc. (d) | 13,800 | 333,684 | |
Buckeye Technologies, Inc. (a) | 15,500 | 197,160 | |
Canfor Pulp Income Fund | 900 | 11,389 | |
Glatfelter | 21,700 | 368,249 | |
Shares | Value | ||
International Paper Co. (d) | 76,100 | $ 2,740,361 | |
Lee & Man Paper Manufacturing Ltd. | 80,000 | 187,379 | |
MeadWestvaco Corp. | 157,400 | 4,792,830 | |
Mercer International, Inc. (SBI) (a) | 21,600 | 270,864 | |
Neenah Paper, Inc. | 15,145 | 561,880 | |
Nine Dragons Paper (Holdings) Ltd. | 13,000 | 26,955 | |
Pope & Talbot, Inc. (a) | 5,000 | 39,500 | |
Schweitzer-Mauduit International, Inc. | 9,700 | 231,442 | |
Votorantim Celulose e Papel SA sponsored ADR (non-vtg.) | 18,300 | 328,119 | |
Wausau-Mosinee Paper Corp. | 22,400 | 324,128 | |
11,362,020 | |||
TOTAL PAPER & FOREST PRODUCTS | 20,547,288 | ||
REAL ESTATE INVESTMENT TRUSTS - 13.5% | |||
Specialized REITs - 13.5% | |||
Longview Fibre Co. | 48,018 | 1,182,203 | |
Plum Creek Timber Co., Inc. | 96,300 | 3,819,258 | |
Potlatch Corp. | 22,179 | 1,002,491 | |
Rayonier, Inc. | 36,787 | 1,642,907 | |
7,646,859 | |||
REAL ESTATE MANAGEMENT & DEVELOPMENT - 0.3% | |||
Real Estate Management & Development - 0.3% | |||
Consolidated-Tomoka Land Co. | 2,300 | 176,226 | |
TOTAL COMMON STOCKS (Cost $45,252,934) | 46,616,738 | ||
Nonconvertible Bonds - 5.3% | ||||
Principal Amount | ||||
PAPER & FOREST PRODUCTS - 5.3% | ||||
Paper Products - 5.3% | ||||
Buckeye Cellulose Corp. 9.25% 9/15/08 | $ 3,000,000 | 3,000,000 | ||
Money Market Funds - 30.9% | ||||
Shares | Value | |||
Fidelity Cash Central Fund, 5.35% (b) | 11,980,939 | $ 11,980,939 | ||
Fidelity Securities Lending Cash Central Fund, 5.34% (b)(c) | 5,484,925 | 5,484,925 | ||
TOTAL MONEY MARKET FUNDS (Cost $17,465,864) | 17,465,864 | |||
TOTAL INVESTMENT PORTFOLIO - 118.7% (Cost $65,726,249) | 67,082,602 | |||
NET OTHER ASSETS - (18.7)% | (10,556,016) | |||
NET ASSETS - 100% | $ 56,526,586 | |||
Legend |
(a) Non-income producing |
(b) Affiliated fund that is available only to investment companies and other accounts managed by Fidelity Investments. The rate quoted is the annualized seven-day yield of the fund at period end. A complete unaudited listing of the fund's holdings as of its most recent quarter end is available upon request. |
(c) Investment made with cash collateral received from securities on loan. |
(d) Security or a portion of the security is on loan at period end. |
Affiliated Central Funds |
Information regarding fiscal year to date income earned by the Fund from investments in Fidelity Central Funds is as follows: |
Fund | Income earned |
Fidelity Cash Central Fund | $ 81,308 |
Fidelity Securities Lending Cash Central Fund | 3,612 |
Total | $ 84,920 |
Income Tax Information |
At February 28, 2007, the fund had a capital loss carryforward of approximately $4,223,818 of which $1,366,068 and $2,857,750 will expire on February 28, 2010 and 2011, respectively. |
See accompanying notes which are an integral part of the financial statements.
Annual Report
Select Paper and Forest Products Portfolio
Financial Statements
Statement of Assets and Liabilities
February 28, 2007 | ||
Assets | ||
Investment in securities, at value (including securities loaned of $5,419,274) - See accompanying schedule: Unaffiliated issuers (cost $48,260,385) | $ 49,616,738 | |
Fidelity Central Funds (cost $17,465,864) | 17,465,864 | |
Total Investments (cost $65,726,249) | $ 67,082,602 | |
Receivable for investments sold | 692,807 | |
Receivable for fund shares sold | 1,126,274 | |
Dividends receivable | 134,422 | |
Interest receivable | 127,188 | |
Distributions receivable from Fidelity Central Funds | 24,081 | |
Prepaid expenses | 88 | |
Other receivables | 2,457 | |
Total assets | 69,189,919 | |
Liabilities | ||
Payable for investments purchased | $ 6,682,144 | |
Payable for fund shares redeemed | 432,379 | |
Accrued management fee | 22,071 | |
Other affiliated payables | 11,268 | |
Other payables and accrued expenses | 30,546 | |
Collateral on securities loaned, at value | 5,484,925 | |
Total liabilities | 12,663,333 | |
Net Assets | $ 56,526,586 | |
Net Assets consist of: | ||
Paid in capital | $ 59,394,406 | |
Undistributed net investment income | 167,591 | |
Accumulated undistributed net realized gain (loss) on investments and foreign currency transactions | (4,391,939) | |
Net unrealized appreciation (depreciation) on investments and assets and liabilities in foreign currencies | 1,356,528 | |
Net Assets, for 1,636,801 shares outstanding | $ 56,526,586 | |
Net Asset Value, offering price and redemption price per share ($56,526,586 ÷ 1,636,801 shares) | $ 34.53 | |
Statement of Operations
Year ended February 28, 2007 | ||
Investment Income | ||
Dividends | $ 684,386 | |
Special dividends | 255,606 | |
Interest | 37,736 | |
Income from Fidelity Central Funds | 84,920 | |
Total income | 1,062,648 | |
Expenses | ||
Management fee | $ 149,656 | |
Transfer agent fees | 91,771 | |
Accounting and security lending fees | 11,840 | |
Custodian fees and expenses | 20,314 | |
Independent trustees' compensation | 90 | |
Registration fees | 17,722 | |
Audit | 34,670 | |
Legal | 688 | |
Miscellaneous | 2,364 | |
Total expenses before reductions | 329,115 | |
Expense reductions | (17,125) | 311,990 |
Net investment income (loss) | 750,658 | |
Realized and Unrealized Gain (Loss) Net realized gain (loss) on: | ||
Investment securities: | ||
Unaffiliated issuers | 711,585 | |
Foreign currency transactions | (1,747) | |
Total net realized gain (loss) | 709,838 | |
Change in net unrealized appreciation (depreciation) on: Investment securities | 3,083,403 | |
Assets and liabilities in foreign currencies | 1,060 | |
Total change in net unrealized appreciation (depreciation) | 3,084,463 | |
Net gain (loss) | 3,794,301 | |
Net increase (decrease) in net assets resulting from operations | $ 4,544,959 | |
See accompanying notes which are an integral part of the financial statements.
Annual Report
Select Paper and Forest Products Portfolio
Financial Statements - continued
Statement of Changes in Net Assets
Year ended | Year ended | |
Increase (Decrease) in Net Assets | ||
Operations | ||
Net investment income (loss) | $ 750,658 | $ 600,245 |
Net realized gain (loss) | 709,838 | 1,357,825 |
Change in net unrealized appreciation (depreciation) | 3,084,463 | (1,962,608) |
Net increase (decrease) in net assets resulting from operations | 4,544,959 | (4,538) |
Distributions to shareholders from net investment income | (1,010,431) | (163,629) |
Share transactions | 54,434,705 | 68,917,639 |
Reinvestment of distributions | 912,003 | 148,392 |
Cost of shares redeemed | (31,078,414) | (67,907,502) |
Net increase (decrease) in net assets resulting from share transactions | 24,268,294 | 1,158,529 |
Redemption fees | 7,802 | 40,871 |
Total increase (decrease) in net assets | 27,810,624 | 1,031,233 |
Net Assets | ||
Beginning of period | 28,715,962 | 27,684,729 |
End of period (including undistributed net investment income of $167,591 and undistributed net investment income of $448,818, respectively) | $ 56,526,586 | $ 28,715,962 |
Other Information Shares | ||
Sold | 1,659,581 | 2,357,344 |
Issued in reinvestment of distributions | 28,970 | 4,956 |
Redeemed | (989,339) | (2,299,721) |
Net increase (decrease) | 699,212 | 62,579 |
Financial Highlights
Years ended February 28, | 2007 | 2006 | 2005 | 2004 I | 2003 |
Selected Per-Share Data | |||||
Net asset value, beginning of period | $ 30.63 | $ 31.64 | $ 31.64 | $ 24.07 | $ 28.78 |
Income from Investment Operations | |||||
Net investment income (loss) C | .89 F | .61 G | .14 | (.05) | (.02) |
Net realized and unrealized gain (loss) | 4.37 | (1.53) | (.06) | 7.59 | (4.74) |
Total from investment operations | 5.26 | (.92) | .08 | 7.54 | (4.76) |
Distributions from net investment income | (1.37) | (.13) | (.12) | - | - |
Redemption fees added to paid in capital C | .01 | .04 | .04 | .03 | .05 |
Net asset value, end of period | $ 34.53 | $ 30.63 | $ 31.64 | $ 31.64 | $ 24.07 |
Total Return A, B | 17.70% | (2.77)% | .37% | 31.45% | (16.37)% |
Ratios to Average Net Assets D, H | |||||
Expenses before reductions | 1.25% | 1.31% | 1.33% | 2.01% | 1.81% |
Expenses net of fee waivers, if any | 1.20% | 1.25% | 1.32% | 2.01% | 1.81% |
Expenses net of all reductions | 1.19% | 1.21% | 1.30% | 1.94% | 1.73% |
Net investment income (loss) | 2.85% F | 2.10% G | .45% | (.20)% | (.07)% |
Supplemental Data | |||||
Net assets, end of period (000 omitted) | $ 56,527 | $ 28,716 | $ 27,685 | $ 28,818 | $ 21,308 |
Portfolio turnover rate E | 126% | 207% | 65% | 188% | 201% |
A Total returns would have been lower had certain expenses not been reduced during the periods shown. B Total returns do not include the effect of the former sales charges. C Calculated based on average shares outstanding during the period. |
See accompanying notes which are an integral part of the financial statements.
Annual Report
Notes to Financial Statements
For the period ended February 28, 2007
1. Organization.
Paper and Forest Products Portfolio (the Fund) is a non-diversified fund of Fidelity Select Portfolios (the trust). The trust is registered under the Investment Company Act of 1940, as amended (the 1940 Act), as an open-end management investment company organized as a Massachusetts business trust. The Fund invests primarily in securities of companies whose principal business activities fall within specific industries. The Fund is authorized to issue an unlimited number of shares. The financial statements have been prepared in conformity with accounting principles generally accepted in the United States of America, which require management to make certain estimates and assumptions at the date of the financial statements.
2. Investments in Fidelity Central Funds.
The Fund may invest in Fidelity Central Funds which are open-end investment companies available only to other investment companies and accounts managed by FMR and its affiliates. The Fund's Schedule of Investments lists each of the Fidelity Central Funds as an investment of the Fund but does not include the underlying holdings of each Fidelity Central Fund. As an Investing Fund, the Fund indirectly bears its proportionate share of the expenses of the underlying Fidelity Central Funds. A complete unaudited list of holdings for each Fidelity Central Fund is available upon request. In addition, the financial statements of the Fidelity Central Funds, which are not covered by the Fund's Report of Independent Registered Public Accounting Firm, are available on the EDGAR Database on the SEC's web site, www.sec.gov, or upon request.
The Money Market Central Funds seek preservation of capital and current income and are managed by Fidelity Investments Money Management, Inc. (FIMM) an affiliate of Fidelity Management & Research Company (FMR).
3. Significant Accounting Policies.
The following summarizes the significant accounting policies of the Fund:
Security Valuation. Investments are valued and net asset value (NAV) per share is calculated (NAV calculation) as of the close of business of the New York Stock Exchange (NYSE), normally 4:00 p.m. Eastern time. During the period the Fund also calculated a NAV each hour on the hour (commencing at 10:00 a.m. Eastern time until one hour prior to the close of business on the NYSE). Effective October 1, 2006 the Fund eliminated hourly NAV calculation.
Wherever possible, the Fund uses independent pricing services approved by the Board of Trustees to value its investments. Equity securities, including restricted securities, for which market quotations are readily available, are valued at the last reported sale price or official closing price as reported by an independent pricing service on the primary market or exchange on which they are traded. In the event there were no sales during the day or closing prices are not available, securities are valued at the last quoted bid price. Debt securities, including restricted securities, for which quotations are readily available, are valued by independent pricing services or by dealers who make markets in such securities. Pricing services consider yield or price of bonds of comparable quality, coupon, maturity and type as well as dealer supplied prices. Investments in open-end mutual funds, including the Fidelity Central Funds, are valued at their closing net asset value each business day. Short-term securities with remaining maturities of sixty days or less for which quotations are not readily available are valued at amortized cost, which approximates value.
When current market prices or quotations are not readily available or do not accurately reflect fair value, valuations may be determined in accordance with procedures adopted by the Board of Trustees. For example, when developments occur between the close of a market and the close of the NYSE that may materially affect the value of some or all of the securities, or when trading in a security is halted, those securities may be fair valued. Factors used in the determination of fair value may include monitoring news to identify significant market or security specific events such as changes in the value of U.S. securities markets, reviewing developments in foreign markets and evaluating the performance of ADRs, futures contracts and exchange-traded funds. Because the Fund's utilization of fair value pricing depends on market activity, the frequency with which fair value pricing is used cannot be predicted and may be utilized to a significant extent. The value of securities used for NAV calculation under fair value pricing may differ from published prices for the same securities.
Foreign Currency. The Fund uses foreign currency contracts to facilitate transactions in foreign-denominated securities. Losses from these transactions may arise from changes in the value of the foreign currency or if the counterparties do not perform under the contracts' terms.
Foreign-denominated assets, including investment securities, and liabilities are translated into U.S. dollars at the exchange rate at period end. Purchases and sales of investment securities, income and dividends received and expenses denominated in foreign currencies are translated into U.S. dollars at the exchange rate in effect on the transaction date.
The effects of exchange rate fluctuations on investments are included with the net realized and unrealized gain (loss) on investment securities. Other foreign currency transactions resulting in realized and unrealized gain (loss) are disclosed separately.
Annual Report
Notes to Financial Statements - continued
3. Significant Accounting Policies - continued
Investment Transactions and Income. For financial reporting purposes, the Fund's investment holdings and NAV include trades executed through the end of the last business day of the period. The NAV for processing shareholder transactions includes trades executed through the end of the prior business day. Gains and losses on securities sold are determined on the basis of identified cost. Dividend income is recorded on the ex-dividend date, except for certain dividends from foreign securities where the ex-dividend date may have passed, which are recorded as soon as the Fund is informed of the ex-dividend date. Non-cash dividends included in dividend income, if any, are recorded at the fair market value of the securities received. Distributions received on securities that represent a return of capital or capital gain are recorded as a reduction of cost of investments and/or as a realized gain. The Fund estimates the components of distributions received that may be considered return of capital distributions or capital gain distributions. Large, non-recurring dividends recognized by the Fund are presented separately on the Statement of Operations as "Special Dividends" and the impact of these dividends is presented in the Financial Highlights. Interest income and distributions from the Fidelity Central Funds are accrued as earned, with any distributions receivable as of period end included in Distributions receivable from Fidelity Central Funds on the Statement of Assets and Liabilities. Interest income includes coupon interest and amortization of premium and accretion of discount on debt securities. Investment income is recorded net of foreign taxes withheld where recovery of such taxes is uncertain.
Expenses. Most expenses of the trust can be directly attributed to a fund. Expenses which cannot be directly attributed are apportioned among each Fund in the trust. Expense estimates are accrued in the period to which they relate and adjustments are made when actual amounts are known.
Income Tax Information and Distributions to Shareholders. Each year, the Fund intends to qualify as a regulated investment company by distributing all of its taxable income and realized gains under Subchapter M of the Internal Revenue Code. As a result, no provision for income taxes is required in the accompanying financial statements. Foreign taxes are provided for based on the Fund's understanding of the tax rules and rates that exist in the foreign markets in which it invests.
Distributions are recorded on the ex-dividend date. Income and capital gain distributions are determined in accordance with income tax regulations, which may differ from generally accepted accounting principles.
Capital accounts within the financial statements are adjusted for permanent book-tax differences. These adjustments have no impact on net assets or the results of operations. Temporary book-tax differences will reverse in a subsequent period.
Book-tax differences are primarily due to foreign currency transactions, capital loss carryforwards and losses deferred due to wash sales.
The tax-basis components of distributable earnings and the federal tax cost as of period end were as follows:
Unrealized appreciation | $ 2,947,846 |
Unrealized depreciation | (1,759,440) |
Net unrealized appreciation (depreciation) | 1,188,406 |
Undistributed ordinary income | 167,591 |
Capital loss carryforward | (4,223,818) |
Cost for federal income tax purposes | $ 65,894,196 |
The tax character of distributions paid was as follows:
February 28, 2007 | February 28, 2006 | |
Ordinary Income | $ 1,010,431 | $ 163,629 |
Trading (Redemption) Fees. Shares in the Fund held less than 30 days are subject to a redemption fee equal to .75% of the net asset value of shares redeemed. All redemption fees, including any estimated redemption fees paid by FMR, are retained by the Fund and accounted for as an addition to paid in capital. Shareholders were also subject to an additional $7.50 fee for shares exchanged into another Fidelity fund (see Note 6).
New Accounting Pronouncements. In July 2006, Financial Accounting Standards Board Interpretation No. 48, Accounting for Uncertainty in Income Taxes - an interpretation of FASB Statement 109 (FIN 48), was issued and is effective on the last business day of the semiannual reporting period for fiscal years beginning after December 15, 2006. FIN 48 sets forth a threshold for financial statement recognition, measurement and disclosure of a tax position taken or expected to be taken on a tax return. Management is currently evaluating the impact, if any, the adoption of FIN 48 will have on the Fund's net assets, results of operations and financial statement disclosures.
In addition, in September 2006, Statement of Financial Accounting Standards No. 157, Fair Value Measurements (SFAS 157), was issued and is effective for fiscal years beginning after November 15, 2007. SFAS 157 defines fair value, establishes a framework for measuring fair value and expands disclosures about fair value measurements. Management is currently evaluating the impact the adoption of SFAS 157 will have on the Fund's financial statement disclosures.
Annual Report
4. Operating Policies.
Repurchase Agreements. FMR has received an Exemptive Order from the Securities and Exchange Commission (the SEC) which permits the Fund and other affiliated entities of FMR to transfer uninvested cash balances into joint trading accounts which are then invested in repurchase agreements. The Fund may also invest directly with institutions in repurchase agreements. Repurchase agreements are collateralized by government or non-government securities. Upon settlement date, collateral is held in segregated accounts with custodian banks and may be obtained in the event of a default of the counterparty. The Fund monitors, on a daily basis, the value of the collateral to ensure it is at least equal to the principal amount of the repurchase agreement (including accrued interest). In the event of a default by the counterparty, realization of the collateral proceeds could be delayed, during which time the value of the collateral may decline.
5. Purchases and Sales of Investments.
Purchases and sales of securities, other than short-term securities, aggregated $51,285,256 and $33,141,070, respectively.
6. Fees and Other Transactions with Affiliates.
Management Fee. FMR and its affiliates provide the Fund with investment management related services for which the Fund pays a monthly management fee. The management fee is the sum of an individual fund fee rate that is based on an annual rate of .30% of the Fund's average net assets and a group fee rate that averaged .26% during the period. The group fee rate is based upon the average net assets of all the mutual funds advised by FMR. The group fee rate decreases as assets under management increase and increases as assets under management decrease. For the period, the total annual management fee rate was .57% of the Fund's average net assets.
Transfer Agent Fees. Fidelity Service Company, Inc. (FSC), an affiliate of FMR, is the Fund's transfer, dividend disbursing and shareholder servicing agent. FSC receives account fees and asset-based fees that vary according to account size and type of account. FSC pays for typesetting, printing and mailing of shareholder reports, except proxy statements. For the period the transfer agent fees were equivalent to an annual rate of ..35% of average net assets.
Accounting and Security Lending Fees. FSC maintains the Fund's accounting records. The accounting fee is based on the level of average net assets for the month. Under a separate contract, FSC administers the security lending program. The security lending fee is based on the number and duration of lending transactions.
Exchange Fees. During the period, FSC received the proceeds of a $7.50 fee to cover administrative costs associated with exchanges out of the Fund to any other Fidelity Select fund or to any other Fidelity fund made through non-automated channels. Effective October 1, 2006, the exchange fees were eliminated. For the period, exchange fees retained by FSC were as follows:
Retained | |
Paper and Forest Products Portfolio | $ 158 |
Brokerage Commissions. The Fund placed a portion of its portfolio transactions with brokerage firms which are affiliates of the investment adviser. The commissions paid to these affiliated firms were $397 for the period.
7. Committed Line of Credit.
The Fund participates with other funds managed by FMR in a $4.2 billion credit facility (the "line of credit") to be utilized for temporary or emergency purposes to fund shareholder redemptions or for other short-term liquidity purposes. The Fund has agreed to pay commitment fees on its pro rata portion of the line of credit, which amounted to $70 and is reflected in Miscellaneous Expense on the Statement of Operations. During the period, there were no borrowings on this line of credit.
8. Security Lending.
The Fund lends portfolio securities from time to time in order to earn additional income. On the settlement date of the loan, the Fund receives collateral (in the form of U.S. Treasury obligations, letters of credit and/or cash) against the loaned securities and maintains collateral in an amount not less than 100% of the market value of the loaned securities during the period of the loan. The market value of the loaned securities is determined at the close of business of the Fund and any additional required collateral is delivered to the Fund on the next business day. If the borrower defaults on its obligation to return the securities loaned because of insolvency or other reasons, a fund could experience delays and costs in recovering the securities loaned or in gaining access to the collateral. Any cash collateral received is invested in the Fidelity Securities Lending Cash Central Fund. The value of
Annual Report
Notes to Financial Statements - continued
8. Security Lending - continued
loaned securities and cash collateral at period end are disclosed on the Fund's Statement of Assets and Liabilities. Security lending income represents the income earned on investing cash collateral, less fees and expenses associated with the loan, plus any premium payments that may be received on the loan of certain types of securities. Security lending income is presented in the Statement of Operations as a component of income from Fidelity Central Funds. Net income from lending portfolio securities during the period amounted to $3,612.
9. Expense Reductions.
FMR voluntarily agreed to reimburse the Fund to the extent annual operating expenses exceeded certain levels of average net assets. During the period, these levels ranged between 1.15% and 1.25%. The expense limitation in effect at period end was 1.15%. Some expenses, for example interest expense, including commitment fees, are excluded from this reimbursement. During the period this reimbursement reduced the Fund's expenses by $13,866.
Many of the brokers with whom FMR places trades on behalf of the Fund provided services to the Fund in addition to trade execution. These services included payments of certain expenses on behalf of the Fund totaling $2,856 for the period.
10. Other.
The Fund's organizational documents provide former and current trustees and officers with a limited indemnification against liabilities arising in connection with the performance of their duties to the Fund. In the normal course of business, the Fund may also enter into contracts that provide general indemnifications. The Fund's maximum exposure under these arrangements is unknown as this would be dependent on future claims that may be made against the Fund. The risk of material loss from such claims is considered remote.
The United States Securities and Exchange Commission ("SEC") is conducting an investigation of FMR (covering the years 2002 to 2004) arising from gifts, gratuities and business entertainment provided by certain brokers to certain individuals who were employed on FMR's domestic equity trading desk during that period. FMR is in discussions with the SEC staff regarding the possible resolution of the matter, but as of period-end no final resolution has been reached.
In December 2006, the Independent Trustees completed their own investigation of the matter with the assistance of independent counsel. The Independent Trustees and FMR agree that, despite the absence of proof that the Fidelity mutual funds experienced diminished execution quality as a result of the improper receipt of gifts and business entertainment, the conduct at issue was serious and is worthy of redress. Accordingly, the Independent Trustees have requested and FMR has agreed to pay $42 million to Fidelity mutual funds, plus interest to be determined at the time that payment is made. A method of allocating this payment among the funds has not yet been determined. The total payment to the Fund is not anticipated to have a material impact on the Fund's net assets. In addition, FMR reimbursed related legal expenses which are recorded in the accompanying Statement of Operations as an expense reduction.
Annual Report
Report of Independent Registered Public Accounting Firm
To the Trustees of Fidelity Select Portfolios and the Shareholders of Chemicals Portfolio, Gold Portfolio, Materials Portfolio (formerly Industrial Materials Portfolio), and Paper and Forest Products Portfolio:
In our opinion, the accompanying statements of assets and liabilities, including the schedules of investments, and the related statements of operations and of changes in net assets and the financial highlights present fairly, in all material respects, the financial position of Chemicals Portfolio, Gold Portfolio, Materials Portfolio (formerly Industrial Materials Portfolio), and Paper and Forest Products Portfolio (funds of Fidelity Select Portfolios) at February 28, 2007, the results of each of their operations for the year then ended, the changes in each of their net assets for each of the two years in the period then ended and the financial highlights for each of the periods indicated, in conformity with accounting principles generally accepted in the United States of America. These financial statements and financial highlights (hereafter referred to as "financial statements") are the responsibility of the Select Portfolios' management. Our responsibility is to express an opinion on these financial statements based on our audits. We conducted our audits of these financial statements in accordance with the standards of the Public Company Accounting Oversight Board (United States). Those standards require that we plan and perform the audit to obtain reasonable assurance about whether the financial statements are free of material misstatement. An audit includes examining, on a test basis, evidence supporting the amounts and disclosures in the financial statements, assessing the accounting principles used and significant estimates made by management, and evaluating the overall financial statement presentation. We believe that our audits, which included confirmation of securities at February 28, 2007 by correspondence with the custodian and brokers, provide a reasonable basis for our opinion.
/s/PricewaterhouseCoopers LLP
PricewaterhouseCoopers LLP
Boston, Massachusetts
April 23, 2007
Annual Report
Trustees and Officers
The Trustees, Member of the Advisory Board, and executive officers of the trust and funds, as applicable, are listed below. The Board of Trustees governs each fund and is responsible for protecting the interests of shareholders. The Trustees are experienced executives who meet periodically throughout the year to oversee each fund's activities, review contractual arrangements with companies that provide services to each fund, and review each fund's performance. Each of the Trustees oversees 349 funds advised by FMR or an affiliate.
The Trustees hold office without limit in time except that (a) any Trustee may resign; (b) any Trustee may be removed by written instrument, signed by at least two-thirds of the number of Trustees prior to such removal; (c) any Trustee who requests to be retired or who has become incapacitated by illness or injury may be retired by written instrument signed by a majority of the other Trustees; and (d) any Trustee may be removed at any special meeting of shareholders by a two-thirds vote of the outstanding voting securities of the trust. Each Trustee who is not an interested person (as defined in the 1940 Act) (Independent Trustee), shall retire not later than the last day of the calendar year in which his or her 72nd birthday occurs. The Independent Trustees may waive this mandatory retirement age policy with respect to individual Trustees. The executive officers and Advisory Board Member hold office without limit in time, except that any officer and Advisory Board Member may resign or may be removed by a vote of a majority of the Trustees at any regular meeting or any special meeting of the Trustees. Except as indicated, each individual has held the office shown or other offices in the same company for the past five years.
The funds' Statement of Additional Information (SAI) includes more information about the Trustees. To request a free copy, call Fidelity at 1-800-544-8544.
Interested Trustees*:
Correspondence intended for each Trustee who is an interested person may be sent to Fidelity Investments, 82 Devonshire Street, Boston, Massachusetts 02109.
Name, Age; Principal Occupation | |
Edward C. Johnson 3d (76) | |
Year of Election or Appointment: 1980 Mr. Johnson is Chairman of the Board of Trustees. Mr. Johnson serves as President (2006-present), Chief Executive Officer, Chairman, and a Director of FMR Corp.; Chairman and a Director of FMR; Chairman and a Director of Fidelity Research & Analysis Company (FRAC); Chairman and a Director of Fidelity Investments Money Management, Inc.; and Chairman (2001- present) and a Director of FMR Co., Inc. In addition, Mr. Johnson serves as Chairman and Director of Fidelity International Limited (FIL). | |
Robert L. Reynolds (54) | |
Year of Election or Appointment: 2003 Mr. Reynolds is President and a Director of FMR (2005-present), Fidelity Investments Money Management, Inc. (2005-present), and FMR Co., Inc. (2005-present). Mr. Reynolds also serves as Vice Chairman (2006-present), a Director (2003-present), and Chief Operating Officer of FMR Corp. and a Director of Strategic Advisers, Inc. (2005-present). He also serves on the Board at Fidelity Investments Canada, Ltd. | |
* Trustees have been determined to be "Interested Trustees" by virtue of, among other things, their affiliation with the trust or various entities under common control with FMR.
Independent Trustees:
Correspondence intended for each Independent Trustee (that is, the Trustees other than the Interested Trustees) may be sent to Fidelity Investments, P.O. Box 55235, Boston, Massachusetts 02205-5235.
Name, Age; Principal Occupation | |
Dennis J. Dirks (58) | |
Year of Election or Appointment: 2005 Prior to his retirement in May 2003, Mr. Dirks was Chief Operating Officer and a member of the Board of The Depository Trust & Clearing Corporation (DTCC) (1999-2003). He also served as President, Chief Operating Officer, and Board member of The Depository Trust Company (DTC) (1999-2003) and President and Board member of the National Securities Clearing Corporation (NSCC) (1999-2003). In addition, Mr. Dirks served as Chief Executive Officer and Board member of the Government Securities Clearing Corporation (2001-2003) and Chief Executive Officer and Board member of the Mortgage-Backed Securities Clearing Corporation (2001-2003). Mr. Dirks also serves as a Trustee and a member of the Finance Committee of Manhattan College (2005-present) and a Trustee and a member of the Finance Committee of AHRC of Nassau County (2006-present). | |
Albert R. Gamper, Jr. (64) | |
Year of Election or Appointment: 2006 Prior to his retirement in December 2004, Mr. Gamper served as Chairman of the Board of CIT Group Inc. (commercial finance). During his tenure with CIT Group Inc. Mr. Gamper served in numerous senior management positions, including Chairman (1987-1989; 1999-2001; 2002-2004), Chief Executive Officer (1987-2004), and President (1989-2002). He currently serves as a member of the Board of Directors of Public Service Enterprise Group (utilities, 2001-present), Chairman of the Board of Governors, Rutgers University (2004-present), and Chairman of the Board of Saint Barnabas Health Care System. | |
George H. Heilmeier (70) | |
Year of Election or Appointment: 2004 Dr. Heilmeier is Chairman Emeritus of Telcordia Technologies (communication software and systems), where prior to his retirement, he served as company Chairman and Chief Executive Officer. He currently serves on the Boards of Directors of The Mitre Corporation (systems engineering and information technology support for the government), and HRL Laboratories (private research and development, 2004-present). He is Chairman of the General Motors Science & Technology Advisory Board and a Life Fellow of the Institute of Electrical and Electronics Engineers (IEEE). Dr. Heilmeier is a member of the Defense Science Board and the National Security Agency Advisory Board. He is also a member of the National Academy of Engineering, the American Academy of Arts and Sciences, and the Board of Overseers of the School of Engineering and Applied Science of the University of Pennsylvania. Previously, Dr. Heilmeier served as a Director of TRW Inc. (automotive, space, defense, and information technology, 1992-2002), Compaq (1994-2002), Automatic Data Processing, Inc. (ADP) (technology-based business outsourcing, 1995-2002), INET Technologies Inc. (telecommunications network surveillance, 2001-2004), and Teletech Holdings (customer management services). He is the recipient of the 2005 Kyoto Prize in Advanced Technology for his invention of the liquid crystal display, and a member of the Consumer Electronics Hall of Fame. | |
James H. Keyes (66) | |
Year of Election or Appointment: 2007 Prior to his retirement in 2003, Mr. Keyes was Chairman, President, and Chief Executive Officer of Johnson Controls, Inc. (automotive supplier, 1993-2003). He currently serves as a member of the boards of LSI Logic Corporation (semiconductor technologies), Navistar International Corporation (manufacture and sale of trucks, buses, and diesel engines, 2002-present), and Pitney Bowes, Inc. (integrated mail, messaging, and document management solutions). | |
Marie L. Knowles (60) | |
Year of Election or Appointment: 2001 Prior to Ms. Knowles' retirement in June 2000, she served as Executive Vice President and Chief Financial Officer of Atlantic Richfield Company (ARCO) (diversified energy, 1996-2000). From 1993 to 1996, she was a Senior Vice President of ARCO and President of ARCO Transportation Company. She served as a Director of ARCO from 1996 to 1998. She currently serves as a Director of Phelps Dodge Corporation (copper mining and manufacturing) and McKesson Corporation (healthcare service, 2002-present). Ms. Knowles is a Trustee of the Brookings Institution and the Catalina Island Conservancy and also serves as a member of the Advisory Board for the School of Engineering of the University of Southern California. | |
Ned C. Lautenbach (63) | |
Year of Election or Appointment: 2000 Mr. Lautenbach is Chairman of the Independent Trustees (2006-present). Mr. Lautenbach has been a partner of Clayton, Dubilier & Rice, Inc. (private equity investment firm) since September 1998. Previously, Mr. Lautenbach was with the International Business Machines Corporation (IBM) from 1968 until his retirement in 1998. Mr. Lautenbach serves as a Director of Sony Corporation (2006-present) and Eaton Corporation (diversified industrial) as well as the Philharmonic Center for the Arts in Naples, Florida. He also is a member of the Board of Trustees of Fairfield University (2005-present), as well as a member of the Council on Foreign Relations. | |
Cornelia M. Small (62) | |
Year of Election or Appointment: 2005 Ms. Small is a member (2000-present) and Chairperson (2002-present) of the Investment Committee, and a member (2002- present) of the Board of Trustees of Smith College. Previously, she served as Chief Investment Officer (1999-2000), Director of Global Equity Investments (1996-1999), and a member of the Board of Directors of Scudder, Stevens & Clark (1990-1997) and Scudder Kemper Investments (1997-1999). In addition, Ms. Small served as Co-Chair (2000-2003) of the Annual Fund for the Fletcher School of Law and Diplomacy. | |
William S. Stavropoulos (67) | |
Year of Election or Appointment: 2001 Mr. Stavropoulos is Chairman Emeritus of the Board of Directors of The Dow Chemical Company. Since joining The Dow Chemical Company in 1967, Mr. Stavropoulos served in numerous senior management positions, including President (1993-2000; 2002-2003), CEO (1995-2000; 2002-2004), and Chairman of the Executive Committee (2000-2004). Currently, he is a Director of NCR Corporation (data warehousing and technology solutions), Chemical Financial Corporation, Maersk Inc. (industrial conglomerate, 2002-present), Tyco International, Inc. (multinational manufacturing and services, 2007-present), and a member of the Advisory Board for Metalmark Capital (private equity investment firm, 2005-present). He is a special advisor to Clayton Dubilier & Rice, Inc., a private equity investment firm. He also serves as a member of the Board of Trustees of the American Enterprise Institute for Public Policy Research. In addition, Mr. Stavropoulos is a member of The Business Council, J.P. Morgan International Council and the University of Notre Dame Advisory Council for the College of Science. | |
Kenneth L. Wolfe (68) | |
Year of Election or Appointment: 2005 Prior to his retirement in 2001, Mr. Wolfe was Chairman and Chief Executive Officer of Hershey Foods Corporation (1993-2001). He currently serves as a member of the boards of Adelphia Communications Corporation (2003-present), Bausch & Lomb, Inc., and Revlon Inc. (2004-present). | |
Advisory Board Member and Executive Officers:
Correspondence intended for each executive officer and Mr. Lynch may be sent to Fidelity Investments, 82 Devonshire Street, Boston, Massachusetts 02109.
Name, Age; Principal Occupation | |
Peter S. Lynch (63) | |
Year of Election or Appointment: 2003 Member of the Advisory Board of Fidelity Select Portfolios. Mr. Lynch is Vice Chairman and a Director of FMR, and Vice Chairman (2001-present) and a Director of FMR Co., Inc. Previously, Mr. Lynch served as a Trustee of the Fidelity funds (1990-2003). In addition, he serves as a Trustee of Boston College and as the Chairman of the Inner-City Scholarship Fund. | |
Kimberley H. Monasterio (43) | |
Year of Election or Appointment: 2007 President and Treasurer of Select Chemicals Portfolio, Select Gold Portfolio, Select Materials Portfolio, and Select Paper and Forest Products Portfolio. Ms. Monasterio also serves as President and Treasurer of other Fidelity funds (2007-present) and is an employee of FMR (2004-present). Previously, Ms. Monasterio served as Deputy Treasurer of the Fidelity funds (2004-2006). Before joining Fidelity Investments, Ms. Monasterio served as Treasurer (2000-2004) and Chief Financial Officer (2002-2004) of the Franklin Templeton Funds and Senior Vice President of Franklin Templeton Services, LLC (2000-2004). | |
Boyce I. Greer (51) | |
Year of Election or Appointment: 2005 Vice President of Select Chemicals Portfolio, Select Gold Portfolio, Select Materials Portfolio, and Select Paper and Forest Products Portfolio. Mr. Greer also serves as Vice President of certain Equity Funds (2005-present), certain Asset Allocation Funds (2005-present), Fixed-Income Funds (2006-present), and Money Market Funds (2006-present). Mr. Greer is also a Trustee of other investment companies advised by FMR (2003-present). He is an Executive Vice President of FMR (2005-present) and FMR Co., Inc. (2005-present), and Senior Vice President of Fidelity Investments Money Management, Inc. (2006-present). Previously, Mr. Greer served as a Director and Managing Director of Strategic Advisers, Inc. (2002-2005), and Executive Vice President (2000-2002) and Money Market Group Leader (1997-2002) of the Fidelity Investments Fixed Income Division. He also served as Vice President of Fidelity's Money Market Funds (1997-2002), Senior Vice President of FMR (1997-2002), and Vice President of FIMM (1998-2002). | |
Eric D. Roiter (58) | |
Year of Election or Appointment: 1998 Secretary of Select Chemicals Portfolio, Select Gold Portfolio, Select Materials Portfolio, and Select Paper and Forest Products Portfolio. He also serves as Secretary of other Fidelity funds; Vice President, General Counsel, and Secretary of FMR Co., Inc. (2001-present) and FMR; Assistant Secretary of Fidelity Management & Research (U.K.) Inc. (2001-present), Fidelity Research & Analysis Company (2001-present), and Fidelity Investments Money Management, Inc. (2001-present). Mr. Roiter is an Adjunct Member, Faculty of Law, at Boston College Law School (2003-present). Previously, Mr. Roiter served as Vice President and Secretary of Fidelity Distributors Corporation (FDC) (1998-2005). | |
Scott C. Goebel (39) | |
Year of Election or Appointment: 2007 Assistant Secretary of Select Chemicals Portfolio, Select Gold Portfolio, Select Materials Portfolio, and Select Paper and Forest Products Portfolio. Mr. Goebel also serves as Assistant Secretary of other Fidelity funds (2007-present), Vice President and Secretary of FDC (2006-present), and is an employee of FMR. | |
R. Stephen Ganis (40) | |
Year of Election or Appointment: 2006 Anti-Money Laundering (AML) officer of Select Chemicals Portfolio, Select Gold Portfolio, Select Materials Portfolio, and Select Paper and Forest Products Portfolio. Mr. Ganis also serves as AML officer of other Fidelity funds (2006-present) and FMR Corp. (2003-present). Before joining Fidelity Investments, Mr. Ganis practiced law at Goodwin Procter, LLP (2000-2002). | |
Joseph B. Hollis (58) | |
Year of Election or Appointment: 2006 Chief Financial Officer of Select Chemicals Portfolio, Select Gold Portfolio, Select Materials Portfolio, and Select Paper and Forest Products Portfolio. Mr. Hollis also serves as Chief Financial Officer of other Fidelity funds. Mr. Hollis is President of Fidelity Pricing and Cash Management Services (FPCMS) (2005-present). Mr. Hollis also serves as President and Director of Fidelity Service Company, Inc. (2006-present). Previously, Mr. Hollis served as Senior Vice President of Cash Management Services (1999-2002) and Investment Management Operations (2002-2005). | |
Kenneth A. Rathgeber (59) | |
Year of Election or Appointment: 2004 Chief Compliance Officer of Select Chemicals Portfolio, Select Gold Portfolio, Select Materials Portfolio, and Select Paper and Forest Products Portfolio. Mr. Rathgeber also serves as Chief Compliance Officer of other Fidelity funds (2004-present) and Executive Vice President of Risk Oversight for Fidelity Investments (2002-present). He is Chief Compliance Officer of FMR (2005-present), FMR Co., Inc. (2005-present), Fidelity Management & Research (U.K.) Inc. (2005-present), Fidelity Research & Analysis Company (2005-present), Fidelity Investments Money Management, Inc. (2005-present), and Strategic Advisers, Inc. (2005-present). Previously, Mr. Rathgeber served as Executive Vice President and Chief Operating Officer for Fidelity Investments Institutional Services Company, Inc. (1998-2002). | |
Bryan A. Mehrmann (45) | |
Year of Election or Appointment: 2005 Deputy Treasurer of Select Chemicals Portfolio, Select Gold Portfolio, Select Materials Portfolio, and Select Paper and Forest Products Portfolio. Mr. Mehrmann also serves as Deputy Treasurer of other Fidelity funds (2005-present) and is an employee of FMR. Previously, Mr. Mehrmann served as Vice President of Fidelity Investments Institutional Services Group (FIIS)/Fidelity Investments Institutional Operations Corporation, Inc. (FIIOC) Client Services (1998-2004). | |
Kenneth B. Robins (37) | |
Year of Election or Appointment: 2005 Deputy Treasurer of Select Chemicals Portfolio, Select Gold Portfolio, Select Materials Portfolio, and Select Paper and Forest Products Portfolio. Mr. Robins also serves as Deputy Treasurer of other Fidelity funds (2005-present) and is an employee of FMR (2004-present). Before joining Fidelity Investments, Mr. Robins worked at KPMG LLP, where he was a partner in KPMG's department of professional practice (2002-2004) and a Senior Manager (1999-2000). In addition, Mr. Robins served as Assistant Chief Accountant, United States Securities and Exchange Commission (2000-2002). | |
Robert G. Byrnes (40) | |
Year of Election or Appointment: 2005 Assistant Treasurer of Select Chemicals Portfolio, Select Gold Portfolio, Select Materials Portfolio, and Select Paper and Forest Products Portfolio. Mr. Byrnes also serves as Assistant Treasurer of other Fidelity funds (2005-present) and is an employee of FMR (2005-present). Previously, Mr. Byrnes served as Vice President of FPCMS (2003-2005). Before joining Fidelity Investments, Mr. Byrnes worked at Deutsche Asset Management where he served as Vice President of the Investment Operations Group (2000-2003). | |
Peter L. Lydecker (53) | |
Year of Election or Appointment: 2004 Assistant Treasurer of Select Chemicals Portfolio, Select Gold Portfolio, Select Materials Portfolio, and Select Paper and Forest Products Portfolio. Mr. Lydecker also serves as Assistant Treasurer of other Fidelity funds (2004) and is an employee of FMR. | |
Gary W. Ryan (48) | |
Year of Election or Appointment: 2005 Assistant Treasurer of Select Chemicals Portfolio, Select Gold Portfolio, Select Materials Portfolio, and Select Paper and Forest Products Portfolio. Mr. Ryan also serves as Assistant Treasurer of other Fidelity funds (2005-present) and is an employee of FMR (2005-present). Previously, Mr. Ryan served as Vice President of Fund Reporting in FPCMS (1999-2005). | |
Salvatore Schiavone (41) | |
Year of Election or Appointment: 2005 Assistant Treasurer of Select Chemicals Portfolio, Select Gold Portfolio, Select Materials Portfolio, and Select Paper and Forest Products Portfolio. Mr. Schiavone also serves as Assistant Treasurer of other Fidelity funds (2005-present) and is an employee of FMR (2005-present). Before joining Fidelity Investments, Mr. Schiavone worked at Deutsche Asset Management, where he most recently served as Assistant Treasurer (2003-2005) of the Scudder Funds and Vice President and Head of Fund Reporting (1996-2003). | |
Annual Report
Distributions
The Board of Trustees of each fund voted to pay to shareholders of record at the opening of business on record date, the following distributions per share derived from capital gains realized from sales of portfolio securities, and dividends derived from net investment income:
Pay Date | Record Date | Dividends | Capital Gains | |
Chemicals | 04/16/07 | 04/13/07 | $0.05 | $0.44 |
Gold | 04/16/07 | 04/13/07 | $0.179 | $1.580 |
Materials | 04/16/07 | 04/13/07 | $0.044 | $0.610 |
Paper and Forest Products | 04/16/07 | 04/13/07 | $0.11 |
The funds hereby designate as capital gain dividend the amounts noted below for the taxable year ended February 28, 2007, or, if subsequently determined to be different, the net capital gain of such year.
Chemicals | $ 9,891,975 |
Gold | $75,675,851 |
Materials | $17,855,413 |
A percentage of the dividends distributed during the fiscal year for the following funds qualifies for the dividends-received deduction for corporate shareholders:
Chemicals | |
April, 2006 | 100% |
December, 2006 | 100% |
Gold | |
April, 2006 | 3% |
Materials | |
April, 2006 | 29% |
December, 2006 | 100% |
Paper and Forest Products | |
April, 2006 | 100% |
December, 2006 | 100% |
A percentage of the dividends distributed during the fiscal year for the following funds may be taken into account as a dividend for purposes of the maximum rate under section 1(h)(11) of the Internal Revenue Code.
Chemicals | |
April, 2006 | 100% |
December, 2006 | 100% |
Gold | |
April, 2006 | 7% |
Materials | |
April, 2006 | 36% |
December, 2006 | 100% |
Paper and Forest Products | |
April, 2006 | 100% |
December, 2006 | 100% |
The amounts per share which represent income derived from sources within, and taxes pais to, foreign countries or possessions of the United States are as follows:
Pay Date | Income | Taxes | |
Gold | 04/10/06 | $0.019 | $0.0004 |
The funds will notify shareholders in January 2008 of amounts for use in preparing 2007 income tax returns.
Annual Report
Proxy Voting Results
A special meeting of Fidelity Select Portfolios' shareholders was held on September 20, 2006. The results of votes taken among shareholders on the proposals before them are reported below. Each vote reported represents one dollar of net asset value held on the record date for the meeting.
PROPOSAL 1 | ||
To elect a Board of Trustees. A | ||
# of | % of | |
Dennis J. Dirks | ||
Affirmative | 13,182,341,755.09 | 94.980 |
Withheld | 696,736,162.41 | 5.020 |
TOTAL | 13,879,077,917.50 | 100.000 |
Albert R. Gamper, Jr. | ||
Affirmative | 13,177,593,614.43 | 94.946 |
Withheld | 701,484,303.07 | 5.054 |
TOTAL | 13,879,077,917.50 | 100.000 |
Robert M. Gates | ||
Affirmative | 13,141,235,622.81 | 94.684 |
Withheld | 737,842,294.69 | 5.316 |
TOTAL | 13,879,077,917.50 | 100.000 |
George H. Heilmeier | ||
Affirmative | 13,140,073,210.00 | 94.675 |
Withheld | 739,004,707.50 | 5.325 |
TOTAL | 13,879,077,917.50 | 100.000 |
Edward C. Johnson 3d | ||
Affirmative | 13,106,284,587.54 | 94.432 |
Withheld | 772,793,329.96 | 5.568 |
TOTAL | 13,879,077,917.50 | 100.000 |
Stephen P. Jonas | ||
Affirmative | 13,168,282,872.88 | 94.879 |
Withheld | 710,795,044.62 | 5.121 |
TOTAL | 13,879,077,917.50 | 100.000 |
James H. KeyesB | ||
Affirmative | 13,164,603,089.66 | 94.852 |
Withheld | 714,474,827.84 | 5.148 |
TOTAL | 13,879,077,917.50 | 100.000 |
Marie L. Knowles | ||
Affirmative | 13,169,356,779.66 | 94.886 |
Withheld | 709,721,137.84 | 5.114 |
TOTAL | 13,879,077,917.50 | 100.000 |
Ned C. Lautenbach | ||
Affirmative | 13,166,485,155.52 | 94.866 |
Withheld | 712,592,761.98 | 5.134 |
TOTAL | 13,879,077,917.50 | 100.000 |
William O. McCoy | ||
Affirmative | 13,129,548,996.59 | 94.600 |
Withheld | 749,528,920.91 | 5.400 |
TOTAL | 13,879,077,917.50 | 100.000 |
Robert L. Reynolds | ||
Affirmative | 13,180,813,649.06 | 94.969 |
Withheld | 698,264,268.44 | 5.031 |
TOTAL | 13,879,077,917.50 | 100.000 |
# of | % of | |
Cornelia M. Small | ||
Affirmative | 13,170,500,616.42 | 94.895 |
Withheld | 708,577,301.08 | 5.105 |
TOTAL | 13,879,077,917.50 | 100.000 |
William S. Stavropoulos | ||
Affirmative | 13,143,284,328.22 | 94.699 |
Withheld | 735,793,589.28 | 5.301 |
TOTAL | 13,879,077,917.50 | 100.000 |
Kenneth L. Wolfe | ||
Affirmative | 13,162,946,758.47 | 94.840 |
Withheld | 716,131,159.03 | 5.160 |
TOTAL | 13,879,077,917.50 | 100.000 |
PROPOSAL 6A | ||
To modify the fund's fundamental "invests primarily" policy (the investment policy concerning the fund's primary investments). | ||
Materials Portfolio | ||
# of | % of | |
Affirmative | 108,411,437.40 | 81.739 |
Against | 7,936,411.09 | 5.983 |
Abstain | 5,272,593.97 | 3.976 |
Broker Non-Votes | 11,011,327.60 | 8.302 |
TOTAL | 132,631,770.06 | 100.000 |
PROPOSAL 6B | ||
To modify the fund's investment concentration policy. | ||
Materials Portfolio | ||
# of | % of | |
Affirmative | 108,476,307.14 | 81.788 |
Against | 7,596,656.39 | 5.727 |
Abstain | 5,547,478.93 | 4.183 |
Broker Non-Votes | 11,011,327.60 | 8.302 |
TOTAL | 132,631,770.06 | 100.000 |
A Denotes trust-wide proposal and voting results. B Effective on or about January 1, 2007. | ||
Annual Report
Managing Your Investments
Fidelity offers several ways to conveniently manage your personal investments via your telephone or PC. You can access your account information, conduct trades and research your investments 24 hours a day.
By Phone
Fidelity Automated Service Telephone provides a single toll-free number to access account balances, positions, quotes and trading. It's easy to navigate the service, and on your first call, the system will help you create a personal identification number (PIN) for security.
(phone_graphic)
Fidelity Automated Service Telephone (FAST®)
1-800-544-5555
Press
1 For mutual fund and brokerage trading.
2 For quotes.*
3 For account balances and holdings.
4 To review orders and mutual fund activity.
5 To change your PIN.
*0 To speak to a Fidelity representative.
By PC
Fidelity's web site on the Internet provides a wide range of information, including daily financial news, fund performance, interactive planning tools and news about Fidelity products and services.
(computer_graphic)
Fidelity's Web Site
www.fidelity.com
* When you call the quotes line, please remember that a fund's yield and return will vary and, except for money market funds, share price will also vary. This means that you may have a gain or loss when you sell your shares. There is no assurance that money market funds will be able to maintain a stable $1 share price; an investment in a money market fund is not insured or guaranteed by the U.S. government. Total returns are historical and include changes in share price, reinvestment of dividends and capital gains, and the effects of any sales charges.
Annual Report
Investment Adviser
Fidelity Management & Research Company
Boston, MA
Investment Sub-Advisers
FMR Co., Inc.
Fidelity Management & Research
(U.K.) Inc.
Fidelity Research & Analysis Company
Fidelity Investments Japan Limited
Fidelity International Investment Advisors
Fidelity International Investment Advisors
(U.K. Limited)
General Distributor
Fidelity Distributors Corporation
Boston, MA
Transfer and Service Agent
Fidelity Service Company, Inc.
Boston, MA
Custodian
Brown Brothers Harriman & Co.
Boston, MA
Corporate Headquarters
82 Devonshire Street
Boston, MA 02109
1-800-544-8888
The Fidelity Telephone Connection
Mutual Fund 24-Hour Service
Exchanges/Redemptions
and Account Assistance 1-800-544-6666
Product Information 1-800-544-8888
Retirement Accounts 1-800-544-4774
(8 a.m. - 9 p.m.)
TDD Service 1-800-544-0118
for the deaf and hearing impaired
(9 a.m. - 9 p.m. Eastern time)
Fidelity Automated Service
Telephone (FAST®) (automated graphic) 1-800-544-5555
(automated graphic) Automated line for quickest service
SELMT-UANN-0407
1.846031.100
(Fidelity Investment logo)(registered trademark)
Corporate Headquarters
82 Devonshire St., Boston, MA 02109
www.fidelity.com
Fidelity®
Select Portfolios®
Consumer Staples Sector
Select Consumer Staples Portfolio (formerly Select Food and Agriculture Portfolio)
Annual Report
February 28, 2007
(2_fidelity_logos) (Registered_Trademark)
Contents
Chairman's Message | ||
Note to Shareholders | ||
Consumer Staples | Performance | |
Management's Discussion | ||
Shareholder Expense Example | ||
Investment Changes | ||
Investments | ||
Financial Statements | ||
Notes to the Financial Statements | ||
Report of Independent Registered Public Accounting Firm | ||
Trustees and Officers | ||
Distributions | ||
Proxy Voting Results |
To view a fund's proxy voting guidelines and proxy voting record for the 12-month period ended June 30, visit www.fidelity.com/proxyvotingresults or visit the Securities and Exchange Commission's (SEC) web site at www.sec.gov. You may also call 1-800-544-8544 to request a free copy of the proxy voting guidelines.
Standard & Poor's, S&P and S&P 500 are registered service marks of The McGraw-Hill Companies, Inc. and have been licensed for use by Fidelity Distributors Corporation.
Other third party marks appearing herein are the property of their respective owners.
All other marks appearing herein are registered or unregistered trademarks or service marks of FMR Corp. or an affiliated company.
This report and the financial statements contained herein are submitted for the general information of the shareholders of the funds. This report is not authorized for distribution to prospective investors in the funds unless preceded or accompanied by an effective prospectus.
A fund files its complete schedule of portfolio holdings with the SEC for the first and third quarters of each fiscal year on Form N-Q. Forms N-Q are available on the SEC's web site at http://www.sec.gov. A fund's Forms N-Q may be reviewed and copied at the SEC's Public Reference Room in Washington, DC. Information regarding the operation of the SEC's Public Reference Room may be obtained by calling 1-800-SEC-0330. For a complete list of a fund's portfolio holdings, view the most recent quarterly holdings report, semiannual report, or annual report on Fidelity's web site at http://www.fidelity.com/holdings.
NOT FDIC INSURED · MAY LOSE VALUE · NO BANK GUARANTEE
Neither the funds nor Fidelity Distributors Corporation is a bank.
Annual Report
Chairman's Message
(Photograph of Edward C. Johnson 3d.)
Dear Shareholder:
Substantial single-day losses are not uncommon in the equity markets, and when they occur - as in late February - investors can be better served in the long term by buying good stocks at lower prices than by moving their money to the sidelines. While financial markets are always unpredictable, there are a number of time-tested principles that can put the historical odds in your favor.
One of the basic tenets is to invest for the long term. Over time, riding out the markets' inevitable ups and downs has proven much more effective than selling into panic or chasing the hottest trend. Even missing only a few of the markets' best days can significantly diminish investor returns. Patience also affords the benefits of compounding - of earning interest on additional income or reinvested dividends and capital gains. There are tax advantages and cost benefits to consider as well. The more you sell, the more taxes you pay, and the more you trade, the higher the costs. While staying the course doesn't eliminate risk, it can considerably lessen the effect of short-term declines.
You can further manage your investing risk through diversification. And today, more than ever, geographic diversification should be taken into account. Studies
indicate that asset allocation is the single most important determinant of a portfolio's long-term success. The right mix of stocks, bonds and cash - aligned to your particular risk tolerance and investment objective - is very important. Age-appropriate rebalancing is also an essential aspect of asset allocation. For younger investors, an emphasis on equities - which historically have been the best performing asset class over time - is encouraged. As investors near their specific goal, such as retirement or sending a child to college, consideration may be given to replacing volatile assets (e.g. common stocks) with more-stable fixed investments (bonds or savings plans).
A third investment principle - investing regularly - can help lower the average cost of your purchases. Investing a certain amount of money each month or quarter helps ensure you won't pay for all your shares at market highs. This strategy - known as dollar cost averaging - also reduces unconstructive "emotion" from investing, helping shareholders avoid selling weak performers just prior to an upswing, or chasing a hot performer just before a correction.
We invite you to contact us via the Internet, through our Investor Centers or over the phone. It is our privilege to provide you the information you need to make the investments that are right for you.
Sincerely,
/s/Edward C. Johnson 3d
Edward C. Johnson 3d
Annual Report
Note to Shareholders:
Effective October 1, 2006, Fidelity restructured the Fidelity® Select Portfolios® equity product line. The restructuring aligned the equity funds' investment goals more closely with standard industry classifications and facilitated adoption of more-specific benchmark indexes to evaluate fund performance. As restructured, the equity funds generally align under the 10 sectors in the widely recognized Global Industry Classification Standard (GICS), developed by Standard & Poor's® (S&P®) and Morgan Stanley Capital InternationalSM (MSCI®): Consumer Discretionary, Consumer Staples, Energy, Financials, Health Care, Industrials, Information Technology, Materials, Telecommunications Services and Utilities. Changes to the funds ranged from simply adopting a new supplemental benchmark to, in some cases, changing investment policies and fund names.
For Banking, Communications Equipment (formerly Developing Communications), Construction and Housing, Consumer Discretionary (formerly Consumer Industries), Consumer Staples (formerly Food and Agriculture), Home Finance, Industrials (formerly Cyclical Industries), IT Services (formerly Business Services and Outsourcing) and Materials (formerly Industrial Materials), shareholders approved certain fundamental investment policy changes related to the restructuring at a special meeting of shareholders held September 20, 2006. All the equity funds adopted new benchmark indexes from MSCI, except for Gold (which adopted an S&P/Citigroup index), Natural Gas (which adopted an S&P index) and Natural Resources (which retained its current Goldman Sachs® index). Taken together, the name, policy and benchmark changes will make it easier for investors to distinguish funds in the product line and to evaluate Fidelity Management & Research Company's skill in managing the funds.
For Consumer Staples, shareholders approved broadening the fund's focus so that it invests primarily in companies engaged in the manufacture, sale or distribution of consumer staples. The broad consumer staples sector includes food and agriculture companies in which the fund may invest currently, but also includes other consumer staples. The fund is now benchmarked to the MSCI US Investable Market Consumer Staples Index.
The Select equity portfolios also eliminated hourly pricing. The funds now price each business day as of the close of the New York Stock Exchange, normally 4:00 pm Eastern time. The funds also adopted Fidelity's standard fund market timing policy, as described in the funds' current prospectus, and removed the $7.50 fee formerly charged on exchanges made through non-automated channels.
Annual Report
Performance
Average annual total return reflects the change in the value of an investment, assuming reinvestment of Consumer Staples' dividend income and capital gains (the profits earned upon the sale of securities that have grown in value) and assuming a constant rate of performance each year. The $10,000 table and the fund's returns do not reflect the deduction of taxes that a shareholder would pay on fund distributions or the redemption of fund shares. During periods of reimbursement by Fidelity a fund's total returns will be greater than it would be had the reimbursement not occurred. How a fund did yesterday is no guarantee of how it will do tomorrow.
Average Annual Total Returns
Periods ended February 28, 2007 | Past 1 | Past 5 | Past 10 |
Consumer Staples | 18.43% | 8.78% | 8.67% |
Prior to October 1, 2006, Select Consumer Staples Portfolio was named Select Food and Agriculture Portfolio and operated under certain different investment policies. The historical performance for the fund may not represent its current investment policies.
$10,000 Over 10 Years
Let's say hypothetically that $10,000 was invested in Consumer Staples on February 28, 1997. The chart shows how the value of your investment would have changed, and also shows how the Standard & Poor's 500SM Index (S&P 500®) performed over the same period.
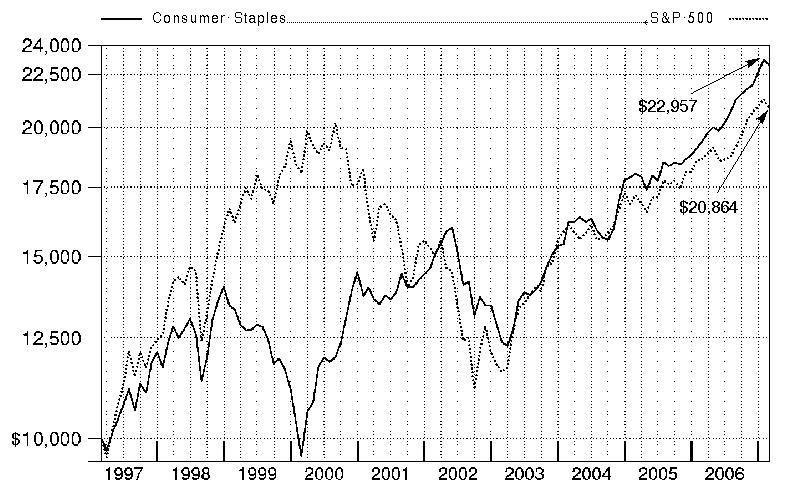
Annual Report
Select Consumer Staples Portfolio
Management's Discussion of Fund Performance
Comments from Robert Lee, Portfolio Manager of Fidelity® Select Consumer Staples Portfolio
A strong year for stocks encountered some volatility near the end of the 12-month period ending February 28, 2007. On the day prior to the period's close, the Dow Jones Industrial AverageSM plunged 416 points and the Standard & Poor's 500SM Index lost roughly 3.5% of its value, plummeting nearly 50 points and marking the benchmark's worst single-day performance since the day the market reopened after the 9/11 terrorist attacks. Though investors were obviously rattled by the development, it was only the 22nd-biggest decline for the S&P 500® in 20 years, and it could not overshadow how well stocks performed for the 12 months overall. For much of the past year, investors grew confident that the economy would not fall into a recession, and they bid up most broad-based stock indexes for six consecutive months from August through January. Overall for the year ending February 28, 2007, the S&P 500 was up 11.97%, the Dow advanced 14.24%, the small-cap Russell 2000® Index gained 9.87% and the NASDAQ Composite® Index rose 6.66%.
For the 12 months ending February 28, 2007, Consumer Staples was up 18.43%, outpacing the Morgan Stanley Capital InternationalSM (MSCI®) US Investable Market Consumer Staples Index, which returned 14.32%, and a blended index specific to this fund, which advanced 11.06%. This blended index is a combination of the Goldman Sachs® Consumer Industries Index, which the fund was compared with through September, and the new MSCI benchmark mentioned above, which the fund was compared with during the period's final five months 1. The new supplemental benchmark and name change reflected a broadening of the fund's focus, from primarily food and agriculture stocks to the larger universe of all consumer staples issues. The portfolio also outperformed the S&P 500 for the 12-month period. For the first seven months of the review period, the fund performed better than the Goldman Sachs index, driven by good stock selection and a strong showing from food and agriculture stocks in general, relative to weaker performing areas of the index such as home improvement retail, travel and publishing - which we did not own because they were outside the fund's narrow focus. Key contributors included supermarket chain Safeway, whose stock performed well as the company delivered improved sales and profit growth, and out-of-index Swiss food conglomerate Nestle. Not owning home improvement retailers Home Depot and Lowe's also aided relative results as those index components declined in price. On the negative side, the portfolio missed out on strong performance by cable giant Comcast and media conglomerate News Corp., two index components that were not owned because they were outside of our investment universe. The fund outperformed the MSCI index during the final five months of the period, powered by favorable stock selection. Strong performers included out-of-index holding British American Tobacco, Molson Coors Brewing and cigarette maker Loews Corp.-Carolina Group, which surpassed investor expectations when it delivered solid profit growth. I avoided discount warehouse chain Costco because I felt its stock was already richly valued, but the index component performed well and the fund's relative performance suffered. Drug retailer CVS also hurt fund results when its stock retreated. In response to the fund's benchmark and name changes, I shifted the portfolio's positioning to reflect the broadening of its investment universe. The weighting in packaged foods and meats was cut sharply, restaurant stocks were nearly eliminated, and I increased the weighting in household products and drug retailers.
1 The fund's blended index is a customized index developed by Fidelity for the limited purpose of discussing the fund's performance for the 12-month period ending February 28, 2007. From March 1, 2006, through September 30, 2006, the fund compared its performance to the Goldman Sachs Consumer Industries Index, which returned 6.22% during that period. On October 1, 2006, the fund began comparing its performance to a different index, the MSCI US Investable Market Consumer Staples Index, which returned 4.56% from October 1, 2006, through February 28, 2007. For the 12-month period ending February 28, 2007, the blended index (Goldman Sachs and MSCI) returned 11.06%.
The views expressed above reflect those of the portfolio manager(s) only through the end of the period as stated on the cover of this report and do not necessarily represent the views of Fidelity or any other person in the Fidelity organization. Any such views are subject to change at any time based upon market or other conditions and Fidelity disclaims any responsibility to update such views. These views may not be relied on as investment advice and, because investment decisions for a Fidelity fund are based on numerous factors, may not be relied on as an indication of trading intent on behalf of any Fidelity fund.
Annual Report
Select Consumer Staples Portfolio
Shareholder Expense Example
As a shareholder of the Fund, you incur two types of costs: (1) transaction costs, including sales charges (loads) on purchase payments or redemption proceeds, redemption fees, exchange fees, and (2) ongoing costs, including management fees, distribution and/or service (12-1) fees and other Fund expenses. This Example is intended to help you understand your ongoing costs (in dollars) of investing in the Fund and to compare these costs with the ongoing costs of investing in other mutual funds.
The actual Example is based on an investment of $1,000 at the beginning of the period and held for the entire period (September 1, 2006 to February 28, 2007) for the Consumer Staples class and for the entire period (December 12, 2006 to February 28, 2007) for Class A, Class T, Class B, Class C, and Institutional Class. The hypothetical expense Example is based on an investment of $1,000 invested for one-half year period (September 1, 2006 to February 28, 2007).
Actual Expenses
The first line of the accompanying table for each class of the Fund provides information about actual account values and actual expenses. You may use the information in this line, together with the amount you invested, to estimate the expenses that you paid over the period. Simply divide your account value by $1,000.00 (for example, an $8,600 account value divided by $1,000.00 = 8.6), then multiply the result by the number in the first line for a class of the Fund under the heading entitled "Expenses Paid During Period" to estimate the expenses you paid on your account during this period. A small balance maintenance fee of $12.00 that is charged once a year may apply for certain accounts with a value of less than $2,000. This fee is not included in the table below. If it was, the estimate of expenses you paid during the period would be higher, and your ending account value lower, by this amount.
Hypothetical Example for Comparison Purposes
The second line of the accompanying table for each class of the Fund provides information about hypothetical account values and hypothetical expenses based on a Class' actual expense ratio and an assumed rate of return of 5% per year before expenses, which is not the Class' actual return. The hypothetical account values and expenses may not be used to estimate the actual ending account balance or expenses you paid for the period. You may use this information to compare the ongoing costs of investing in the Fund and other funds. To do so, compare this 5% hypothetical example with the 5% hypothetical examples that appear in the shareholder reports of the other funds. A small balance maintenance fee of $12.00 that is charged once a year may apply for certain accounts with a value of less than $2,000. This fee is not included in the table below. If it was, the estimate of expenses you paid during the period would be higher, and your ending account value lower, by this amount.
Please note that the expenses shown in the table are meant to highlight your ongoing costs only and do not reflect any transaction costs. Therefore, the second line of the table is useful in comparing ongoing costs only, and will not help you determine the relative total costs of owning different funds. In addition, if these transactional costs were included, your costs would have been higher.
Beginning | Ending | Expenses | |
Class A | |||
Actual | $ 1,000.00 | $ 1,022.30 | $ 2.82B |
HypotheticalA | $ 1,000.00 | $ 1,018.40 | $ 6.46C |
Class T | |||
Actual | $ 1,000.00 | $ 1,020.60 | $ 3.52B |
HypotheticalA | $ 1,000.00 | $ 1,016.81 | $ 8.05C |
Class B | |||
Actual | $ 1,000.00 | $ 1,019.50 | $ 4.57B |
HypotheticalA | $ 1,000.00 | $ 1,014.43 | $ 10.44C |
Class C | |||
Actual | $ 1,000.00 | $ 1,019.30 | $ 4.68B |
HypotheticalA | $ 1,000.00 | $ 1,014.18 | $ 10.69C |
Consumer Staples | |||
Actual | $ 1,000.00 | $ 1,078.60 | $ 5.00B |
HypotheticalA | $ 1,000.00 | $ 1,019.98 | $ 4.86C |
Institutional Class | |||
Actual | $ 1,000.00 | $ 1,021.60 | $ 2.19B |
HypotheticalA | $ 1,000.00 | $ 1,019.84 | $ 5.01C |
A 5% return per year before expenses
B Actual expenses are equal to each Class' annualized expense ratio (shown in the table below); multiplied by the average account value over the period, multiplied by 181/365 (to reflect the one-half year period) for the Consumer Staples class and multiplied by 79/365 (to reflect the period December 12, 2006 to February 28, 2007) for the Class A, Class T, Class B, Class C and Institutional Class.
C Hypothetical expenses are equal to each Class' annualized expense ratio (shown in the table below); multiplied by the average account value over the period, multiplied by 181/365 (to reflect the one-half year period).
Annual Report
Select Consumer Staples Portfolio
Shareholder Expense Example - continued
Annualized | |
Class A | 1.29% |
Class T | 1.61% |
Class B | 2.09% |
Class C | 2.14% |
Consumer Staples | .97% |
Institutional Class | 1.00% |
Annual Report
Select Consumer Staples Portfolio
Investment Changes
Top Ten Stocks as of February 28, 2007 | ||
% of fund's | % of fund's net assets | |
Procter & Gamble Co. | 18.0 | 1.5 |
PepsiCo, Inc. | 9.8 | 5.3 |
The Coca-Cola Co. | 8.0 | 5.8 |
Altria Group, Inc. | 5.7 | 6.5 |
British American Tobacco PLC sponsored ADR | 4.2 | 1.0 |
Colgate-Palmolive Co. | 4.1 | 1.4 |
CVS Corp. | 4.1 | 0.7 |
Nestle SA sponsored ADR | 4.0 | 7.5 |
Kroger Co. | 2.8 | 3.7 |
Safeway, Inc. | 2.2 | 2.9 |
62.9 | ||
Top Industries (% of fund's net assets) | |||
As of February 28, 2007 | |||
 | Beverages | 29.2% | |
 | Household Products | 22.1% | |
 | Food & Staples Retailing | 15.4% | |
 | Food Products | 14.4% | |
 | Tobacco | 12.3% | |
 | All Others* | 6.6% | |

As of August 31, 2006 | |||
| Food Products | 29.7% | |
| Beverages | 20.0% | |
| Hotels, Restaurants & Leisure | 12.3% | |
| Food & Staples Retailing | 11.8% | |
| Tobacco | 9.1% | |
| All Others* | 17.1% | |
* Includes short-term investments and net other assets. |
Annual Report
Select Consumer Staples Portfolio
Investments February 28, 2007
Showing Percentage of Net Assets
Common Stocks - 96.6% | |||
Shares | Value | ||
BEVERAGES - 29.2% | |||
Brewers - 5.7% | |||
Anadolu Efes Biracilk Ve Malt Sanyii AS | 23,000 | $ 712,137 | |
Boston Beer Co., Inc. Class A (a) | 15,500 | 508,245 | |
Companhia de Bebidas das Americas (AmBev) (PN) sponsored ADR | 18,000 | 870,660 | |
Grupo Modelo SA de CV Series C | 173,000 | 889,921 | |
Heineken NV (Bearer) | 38,000 | 1,873,202 | |
InBev SA | 81,400 | 5,397,884 | |
Molson Coors Brewing Co. Class B | 90,700 | 7,658,708 | |
SABMiller PLC | 164,900 | 3,653,925 | |
21,564,682 | |||
Distillers & Vintners - 3.8% | |||
Brown-Forman Corp. Class B (non-vtg.) | 28,000 | 1,834,000 | |
Constellation Brands, Inc. Class A (sub. vtg.) | 50,900 | 1,194,114 | |
Diageo PLC sponsored ADR | 69,800 | 5,541,422 | |
Pernod Ricard SA | 27,200 | 5,614,879 | |
14,184,415 | |||
Soft Drinks - 19.7% | |||
Coca-Cola Femsa SA de CV sponsored ADR | 44,500 | 1,535,250 | |
Coca-Cola Hellenic Bottling Co. SA sponsored ADR | 92,000 | 3,591,680 | |
Coca-Cola Icecek AS | 124,000 | 921,444 | |
Fomento Economico Mexicano SA de CV sponsored ADR | 7,300 | 805,190 | |
Hansen Natural Corp. (a)(d) | 7,700 | 269,500 | |
PepsiCo, Inc. | 584,800 | 36,930,120 | |
The Coca-Cola Co. | 649,200 | 30,304,656 | |
74,357,840 | |||
TOTAL BEVERAGES | 110,106,937 | ||
BIOTECHNOLOGY - 0.2% | |||
Biotechnology - 0.2% | |||
Senomyx, Inc. (a) | 72,300 | 912,426 | |
FOOD & STAPLES RETAILING - 15.4% | |||
Drug Retail - 6.3% | |||
CVS Corp. | 488,300 | 15,337,503 | |
Rite Aid Corp. | 157,500 | 940,275 | |
Walgreen Co. | 171,300 | 7,658,823 | |
23,936,601 | |||
Food Distributors - 1.0% | |||
Sysco Corp. | 89,400 | 2,946,624 | |
United Natural Foods, Inc. (a) | 27,200 | 810,016 | |
3,756,640 | |||
Food Retail - 6.0% | |||
Kroger Co. | 407,600 | 10,463,092 | |
Safeway, Inc. | 241,100 | 8,334,827 | |
Tesco PLC | 107,000 | 908,024 | |
Shares | Value | ||
The Great Atlantic & Pacific Tea Co. (d) | 31,200 | $ 992,160 | |
Whole Foods Market, Inc. | 38,500 | 1,839,145 | |
22,537,248 | |||
Hypermarkets & Super Centers - 2.1% | |||
Wal-Mart Stores, Inc. | 163,900 | 7,916,370 | |
TOTAL FOOD & STAPLES RETAILING | 58,146,859 | ||
FOOD PRODUCTS - 14.4% | |||
Agricultural Products - 2.8% | |||
Archer-Daniels-Midland Co. | 168,500 | 5,793,030 | |
BioMar Holding AS | 10,000 | 461,754 | |
Bunge Ltd. | 35,000 | 2,777,600 | |
Corn Products International, Inc. | 28,600 | 914,342 | |
Nutreco Holding NV | 8,000 | 555,807 | |
10,502,533 | |||
Packaged Foods & Meats - 11.6% | |||
Cadbury Schweppes PLC sponsored ADR | 71,900 | 3,093,857 | |
Chiquita Brands International, Inc. | 35,500 | 514,750 | |
Groupe Danone | 23,200 | 3,675,917 | |
Industrias Bachoco SA de CV sponsored ADR | 32,000 | 921,600 | |
Kellogg Co. | 86,200 | 4,303,104 | |
Koninklijke Numico NV | 72,300 | 3,727,623 | |
Lindt & Spruengli AG | 72 | 1,845,858 | |
Marine Harvest ASA (a) | 1,123,000 | 1,373,152 | |
Nestle SA sponsored ADR | 160,800 | 15,010,680 | |
Smithfield Foods, Inc. (a) | 30,000 | 876,300 | |
TreeHouse Foods, Inc. (a) | 100 | 2,885 | |
Tyson Foods, Inc. Class A | 51,200 | 934,400 | |
Unilever NV (NY Shares) | 289,600 | 7,520,912 | |
43,801,038 | |||
TOTAL FOOD PRODUCTS | 54,303,571 | ||
HOTELS, RESTAURANTS & LEISURE - 0.1% | |||
Restaurants - 0.1% | |||
Starbucks Corp. (a) | 8,000 | 247,200 | |
HOUSEHOLD PRODUCTS - 22.1% | |||
Household Products - 22.1% | |||
Colgate-Palmolive Co. | 230,800 | 15,546,688 | |
Procter & Gamble Co. | 1,065,697 | 67,661,103 | |
83,207,791 | |||
PERSONAL PRODUCTS - 2.4% | |||
Personal Products - 2.4% | |||
Avon Products, Inc. | 218,100 | 7,995,546 | |
Bare Escentuals, Inc. | 27,205 | 946,462 | |
Herbalife Ltd. (a) | 100 | 3,765 | |
8,945,773 | |||
Common Stocks - continued | |||
Shares | Value | ||
PHARMACEUTICALS - 0.5% | |||
Pharmaceuticals - 0.5% | |||
Johnson & Johnson | 29,000 | $ 1,828,450 | |
TOBACCO - 12.3% | |||
Tobacco - 12.3% | |||
Altria Group, Inc. | 253,700 | 21,381,836 | |
British American Tobacco PLC sponsored ADR | 259,400 | 15,825,994 | |
Japan Tobacco, Inc. | 197 | 895,785 | |
Loews Corp. - Carolina Group | 102,000 | 7,347,060 | |
Souza Cruz Industria Comerico | 57,000 | 1,032,209 | |
46,482,884 | |||
TOTAL COMMON STOCKS (Cost $327,830,942) | 364,181,891 | ||
Money Market Funds - 2.7% | |||
Fidelity Cash Central Fund, 5.35% (b) | 9,119,079 | $ 9,119,079 | |
Fidelity Securities Lending Cash Central Fund, 5.34% (b)(c) | 1,106,675 | 1,106,675 | |
TOTAL MONEY MARKET FUNDS (Cost $10,225,754) | 10,225,754 | ||
TOTAL INVESTMENT PORTFOLIO - 99.3% (Cost $338,056,696) | 374,407,645 |
NET OTHER ASSETS - 0.7% | 2,574,384 | ||
NET ASSETS - 100% | $ 376,982,029 | ||
Legend |
(a) Non-income producing |
(b) Affiliated fund that is available only to investment companies and other accounts managed by Fidelity Investments. The rate quoted is the annualized seven-day yield of the fund at period end. A complete unaudited listing of the fund's holdings as of its most recent quarter end is available upon request. |
(c) Investment made with cash collateral received from securities on loan. |
(d) Security or a portion of the security is on loan at period end. |
Affiliated Central Funds |
Information regarding fiscal year to date income earned by the Fund from investments in Fidelity Central Funds is as follows: |
Fund | Income earned |
Fidelity Cash Central Fund | $ 570,365 |
Fidelity Securities Lending Cash Central Fund | 75,627 |
Total | $ 645,992 |
Other Information |
Distribution of investments by country of issue, as a percentage of total net assets, is as follows: |
United States of America | 75.8% |
United Kingdom | 7.7% |
Switzerland | 4.5% |
Netherlands | 3.7% |
France | 2.5% |
Belgium | 1.4% |
Mexico | 1.1% |
Greece | 1.0% |
Others (individually less than 1%) | 2.3% |
100.0% |
See accompanying notes which are an integral part of the financial statements.
Annual Report
Select Consumer Staples Portfolio
Financial Statements
Statement of Assets and Liabilities
February 28, 2007 | ||
Assets | ||
Investment in securities, at value (including securities loaned of $1,032,700) - See accompanying schedule: Unaffiliated issuers (cost $327,830,942) | $ 364,181,891 | |
Fidelity Central Funds (cost $10,225,754) | 10,225,754 | |
Total Investments (cost $338,056,696) | $ 374,407,645 | |
Receivable for investments sold | 2,050,469 | |
Receivable for fund shares sold | 6,163,051 | |
Dividends receivable | 214,904 | |
Distributions receivable from Fidelity Central Funds | 49,643 | |
Prepaid expenses | 694 | |
Other receivables | 6,547 | |
Total assets | 382,892,953 | |
Liabilities | ||
Payable for investments purchased | $ 3,114,636 | |
Payable for fund shares redeemed | 1,377,606 | |
Accrued management fee | 173,754 | |
Distribution fees payable | 557 | |
Other affiliated payables | 89,302 | |
Other payables and accrued expenses | 48,394 | |
Collateral on securities loaned, at value | 1,106,675 | |
Total liabilities | 5,910,924 | |
Net Assets | $ 376,982,029 | |
Net Assets consist of: | ||
Paid in capital | $ 331,654,886 | |
Undistributed net investment income | 810,260 | |
Accumulated undistributed net realized gain (loss) on investments and foreign currency transactions | 8,165,882 | |
Net unrealized appreciation (depreciation) on investments and assets and liabilities in foreign currencies | 36,351,001 | |
Net Assets | $ 376,982,029 | |
Statement of Assets and Liabilities - continued
February 28, 2007 | ||
Calculation of Maximum Offering Price Class A: | $ 58.16 | |
Maximum offering price per share (100/94.25 of $58.16) | $ 61.71 | |
Class T: | $ 58.06 | |
Maximum offering price per share (100/96.50 of $58.06) | $ 60.17 | |
Class B: | $ 58.00 | |
Class C: | $ 57.99 | |
Consumer Staples: | $ 58.13 | |
Institutional Class: | $ 58.12 | |
A Redemption price per share is equal to net asset value less any applicable contingent deferred sales charge.
See accompanying notes which are an integral part of the financial statements.
Annual Report
Statement of Operations
Year ended February 28, 2007 | ||
Investment Income | ||
Dividends | $ 3,921,319 | |
Interest | 53 | |
Income from Fidelity Central Funds | 645,992 | |
Total income | 4,567,364 | |
Expenses | ||
Management fee | $ 1,315,325 | |
Transfer agent fees | 691,650 | |
Distribution fees | 1,011 | |
Accounting and security lending fees | 102,795 | |
Custodian fees and expenses | 53,919 | |
Independent trustees' compensation | 822 | |
Registration fees | 127,628 | |
Audit | 36,636 | |
Legal | 3,326 | |
Miscellaneous | 10,350 | |
Total expenses before reductions | 2,343,462 | |
Expense reductions | (68,570) | 2,274,892 |
Net investment income (loss) | 2,292,472 | |
Realized and Unrealized Gain (Loss) Net realized gain (loss) on: | ||
Investment securities: | ||
Unaffiliated issuers | 23,020,008 | |
Foreign currency transactions | (10,609) | |
Total net realized gain (loss) | 23,009,399 | |
Change in net unrealized appreciation (depreciation) on: Investment securities | 13,327,071 | |
Assets and liabilities in foreign currencies | 311 | |
Total change in net unrealized appreciation (depreciation) | 13,327,382 | |
Net gain (loss) | 36,336,781 | |
Net increase (decrease) in net assets resulting from operations | $ 38,629,253 | |
Statement of Changes in Net Assets
Year ended | Year ended | |
Increase (Decrease) in Net Assets | ||
Operations | ||
Net investment income (loss) | $ 2,292,472 | $ 1,263,331 |
Net realized gain (loss) | 23,009,399 | 8,287,843 |
Change in net unrealized appreciation (depreciation) | 13,327,382 | (385,129) |
Net increase (decrease) in net assets resulting from operations | 38,629,253 | 9,166,045 |
Distributions to shareholders from net investment income | (1,582,908) | (1,049,605) |
Distributions to shareholders from net realized gain | (15,661,672) | (6,158,772) |
Total distributions | (17,244,580) | (7,208,377) |
Share transactions - net increase (decrease) | 230,543,294 | (16,300,126) |
Redemption fees | 47,547 | 20,664 |
Total increase (decrease) in net assets | 251,975,514 | (14,321,794) |
Net Assets | ||
Beginning of period | 125,006,515 | 139,328,309 |
End of period (including undistributed net investment income of $810,260 and undistributed net investment income of $237,173, respectively) | $ 376,982,029 | $ 125,006,515 |
See accompanying notes which are an integral part of the financial statements.
Annual Report
Financial Highlights - Class A
Years ended February 28, | 2007 H |
Selected Per-Share Data | |
Net asset value, beginning of period | $ 56.89 |
Income from Investment Operations | |
Net investment income (loss) E | (.01) |
Net realized and unrealized gain (loss) | 1.28 |
Total from investment operations | 1.27 |
Redemption fees added to paid in capital E | - J |
Net asset value, end of period | $ 58.16 |
Total Return B,C,D | 2.23% |
Ratios to Average Net Assets F,I | |
Expenses before reductions | 1.29% A |
Expenses net of fee waivers, if any | 1.29% A |
Expenses net of all reductions | 1.28% A |
Net investment income (loss) | (.11)% A |
Supplemental Data | |
Net assets, end of period (000 omitted) | $ 986 |
Portfolio turnover rate G | 99% |
A Annualized B Total returns for periods of less than one year are not annualized. C Total returns would have been lower had certain expenses not been reduced during the periods shown. D Total returns do not include the effect of the sales charges. E Calculated based on average shares outstanding during the period. F Fees and expenses of the underlying Fidelity Central Funds are not included in the Fund's expense ratio. The Fund indirectly bears its proportionate share of the expenses of any underlying Fidelity Central Funds. G Amount does not include the portfolio activity of any underlying Fidelity Central Funds. H For the period December 12, 2006 (commencement of sale of shares) to February 28, 2007. I Expense ratios reflect operating expenses of the class. Expenses before reductions do not reflect amounts reimbursed by the investment adviser or reductions from brokerage service arrangements or other expense offset arrangements and do not represent the amount paid by the class during periods when reimbursements or reductions occur. Expenses net of fee waivers reflect expenses after reimbursement by the investment adviser but prior to reductions from brokerage service arrangements or other expense offset arrangements. Expenses net of all reductions represent the net expenses paid by the class. J Amount represents less than $.01 per share. |
Financial Highlights - Class T
Years ended February 28, | 2007 H |
Selected Per-Share Data | |
Net asset value, beginning of period | $ 56.89 |
Income from Investment Operations | |
Net investment income (loss) E | (.01) |
Net realized and unrealized gain (loss) | 1.18 |
Total from investment operations | 1.17 |
Redemption fees added to paid in capital E | - J |
Net asset value, end of period | $ 58.06 |
Total Return B,C,D | 2.06% |
Ratios to Average Net Assets F,I | |
Expenses before reductions | 1.61% A |
Expenses net of fee waivers, if any | 1.61% A |
Expenses net of all reductions | 1.60% A |
Net investment income (loss) | (.11)% A |
Supplemental Data | |
Net assets, end of period (000 omitted) | $ 529 |
Portfolio turnover rate G | 99% |
A Annualized B Total returns for periods of less than one year are not annualized. C Total returns would have been lower had certain expenses not been reduced during the periods shown. D Total returns do not include the effect of the sales charges. E Calculated based on average shares outstanding during the period. F Fees and expenses of the underlying Fidelity Central Funds are not included in the Fund's expense ratio. The Fund indirectly bears its proportionate share of the expenses of any underlying Fidelity Central Funds. G Amount does not include the portfolio activity of any underlying Fidelity Central Funds. H For the period December 12, 2006 (commencement of sale of shares) to February 28, 2007. I Expense ratios reflect operating expenses of the class. Expenses before reductions do not reflect amounts reimbursed by the investment adviser or reductions from brokerage service arrangements or other expense offset arrangements and do not represent the amount paid by the class during periods when reimbursements or reductions occur. Expenses net of fee waivers reflect expenses after reimbursement by the investment adviser but prior to reductions from brokerage service arrangements or other expense offset arrangements. Expenses net of all reductions represent the net expenses paid by the class. J Amount represents less than $.01 per share. |
See accompanying notes which are an integral part of the financial statements.
Annual Report
Financial Highlights - Class B
Years ended February 28, | 2007 H |
Selected Per-Share Data | |
Net asset value, beginning of period | $ 56.89 |
Income from Investment Operations | |
Net investment income (loss) E | (.07) |
Net realized and unrealized gain (loss) | 1.18 |
Total from investment operations | 1.11 |
Redemption fees added to paid in capital E | - J |
Net asset value, end of period | $ 58.00 |
Total Return B,C,D | 1.95% |
Ratios to Average Net Assets F,I | |
Expenses before reductions | 2.09% A |
Expenses net of fee waivers, if any | 2.09% A |
Expenses net of all reductions | 2.09% A |
Net investment income (loss) | (.59)% A |
Supplemental Data | |
Net assets, end of period (000 omitted) | $ 226 |
Portfolio turnover rate G | 99% |
A Annualized B Total returns for periods of less than one year are not annualized. C Total returns would have been lower had certain expenses not been reduced during the periods shown. D Total returns do not include the effect of the contingent deferred sales charge. E Calculated based on average shares outstanding during the period. F Fees and expenses of the underlying Fidelity Central Funds are not included in the Fund's expense ratio. The Fund indirectly bears its proportionate share of the expenses of any underlying Fidelity Central Funds. G Amount does not include the portfolio activity of any underlying Fidelity Central Funds. H For the period December 12, 2006 (commencement of sale of shares) to February 28, 2007. I Expense ratios reflect operating expenses of the class. Expenses before reductions do not reflect amounts reimbursed by the investment adviser or reductions from brokerage service arrangements or other expense offset arrangements and do not represent the amount paid by the class during periods when reimbursements or reductions occur. Expenses net of fee waivers reflect expenses after reimbursement by the investment adviser but prior to reductions from brokerage service arrangements or other expense offset arrangements. Expenses net of all reductions represent the net expenses paid by the class. J Amount represents less than $.01 per share. |
Financial Highlights - Class C
Years ended February 28, | 2007 H |
Selected Per-Share Data | |
Net asset value, beginning of period | $ 56.89 |
Income from Investment Operations | |
Net investment income (loss) E | (.08) |
Net realized and unrealized gain (loss) | 1.18 |
Total from investment operations | 1.10 |
Redemption fees added to paid in capital E | - J |
Net asset value, end of period | $ 57.99 |
Total Return B,C,D | 1.93% |
Ratios to Average Net Assets F,I | |
Expenses before reductions | 2.14% A |
Expenses net of fee waivers, if any | 2.14% A |
Expenses net of all reductions | 2.14% A |
Net investment income (loss) | (.66)% A |
Supplemental Data | |
Net assets, end of period (000 omitted) | $ 178 |
Portfolio turnover rate G | 99% |
A Annualized B Total returns for periods of less than one year are not annualized. C Total returns would have been lower had certain expenses not been reduced during the periods shown. D Total returns do not include the effect of the contingent deferred sales charge. E Calculated based on average shares outstanding during the period. F Fees and expenses of the underlying Fidelity Central Funds are not included in the Fund's expense ratio. The Fund indirectly bears its proportionate share of the expenses of any underlying Fidelity Central Funds. G Amount does not include the portfolio activity of any underlying Fidelity Central Funds. H For the period December 12, 2006 (commencement of sale of shares) to February 28, 2007. I Expense ratios reflect operating expenses of the class. Expenses before reductions do not reflect amounts reimbursed by the investment adviser or reductions from brokerage service arrangements or other expense offset arrangements and do not represent the amount paid by the class during periods when reimbursements or reductions occur. Expenses net of fee waivers reflect expenses after reimbursement by the investment adviser but prior to reductions from brokerage service arrangements or other expense offset arrangements. Expenses net of all reductions represent the net expenses paid by the class. J Amount represents less than $.01 per share. |
See accompanying notes which are an integral part of the financial statements.
Annual Report
Financial Highlights - Consumer Staples
Years ended February 28, | 2007 | 2006 | 2005 | 2004 G | 2003 |
Selected Per-Share Data | |||||
Net asset value, beginning of period | $ 52.18 | $ 51.42 | $ 46.50 | $ 35.71 | $ 44.68 |
Income from Investment Operations | |||||
Net investment income (loss) C | .56 | .50 | .29 | .22 | .25 |
Net realized and unrealized gain (loss) | 8.88 | 3.25 | 4.90 | 10.80 | (8.06) |
Total from investment operations | 9.44 | 3.75 | 5.19 | 11.02 | (7.81) |
Distributions from net investment income | (.32) | (.44) | (.29) | (.24) | (.32) |
Distributions from net realized gain | (3.18) | (2.56) | - | - | (.88) |
Total distributions | (3.50) | (3.00) | (.29) | (.24) | (1.20) |
Redemption fees added to paid in capital C | .01 | .01 | .02 | .01 | .04 |
Net asset value, end of period | $ 58.13 | $ 52.18 | $ 51.42 | $ 46.50 | $ 35.71 |
Total Return A,B | 18.43% | 7.50% | 11.24% | 30.94% | (17.85)% |
Ratios to Average Net Assets D,F | |||||
Expenses before reductions | 1.01% | 1.04% | 1.06% | 1.27% | 1.25% |
Expenses net of fee waivers, if any | .99% | 1.04% | 1.06% | 1.27% | 1.25% |
Expenses net of all reductions | .98% | 1.03% | 1.05% | 1.25% | 1.17% |
Net investment income (loss) | .99% | .97% | .61% | .55% | .59% |
Supplemental Data | |||||
Net assets, end of period (000 omitted) | $ 374,930 | $ 125,007 | $ 139,328 | $ 104,436 | $ 88,123 |
Portfolio turnover rate E | 99% | 75% | 86% | 62% | 225% |
A Total returns would have been lower had certain expenses not been reduced during the periods shown. B Total returns do not include the effect of the former sales charges. C Calculated based on average shares outstanding during the period. D Fees and expenses of the underlying Fidelity Central Funds are not included in the Fund's expense ratio. The Fund indirectly bears its proportionate share of the expenses of any underlying Fidelity Central Funds. E Amount does not include the portfolio activity of any underlying Fidelity Central Funds. F Expense ratios reflect operating expenses of the class. Expenses before reductions do not reflect amounts reimbursed by the investment adviser or reductions from brokerage service arrangements or other expense offset arrangements and do not represent the amount paid by the class during periods when reimbursements or reductions occur. Expenses net of fee waivers reflect expenses after reimbursement by the investment adviser but prior to reductions from brokerage service arrangements or other expense offset arrangements. Expenses net of all reductions represent the net expenses paid by the class. G For the year ended February 29. |
Financial Highlights - Institutional Class
Years ended February 28, | 2007 G |
Selected Per-Share Data | |
Net asset value, beginning of period | $ 56.89 |
Income from Investment Operations | |
Net investment income (loss)D | .07 |
Net realized and unrealized gain (loss) | 1.16 |
Total from investment operations | 1.23 |
Redemption fees added to paid in capitalD | - I |
Net asset value, end of period | $ 58.12 |
Total Return B,C | 2.16% |
Ratios to Average Net Assets E,H | |
Expenses before reductions | 1.00% A |
Expenses net of fee waivers, if any | 1.00% A |
Expenses net of all reductions | 1.00% A |
Net investment income (loss) | .57% A |
Supplemental Data | |
Net assets, end of period (000 omitted) | $ 132 |
Portfolio turnover rate F | 99% |
A Annualized B Total returns for periods of less than one year are not annualized. C Total returns would have been lower had certain expenses not been reduced during the periods shown. D Calculated based on average shares outstanding during the period. E Fees and expenses of the underlying Fidelity Central Funds are not included in the Fund's expense ratio. The Fund indirectly bears its proportionate share of the expenses of any underlying Fidelity Central Funds. F Amount does not include the portfolio activity of any underlying Fidelity Central Funds. G For the period December 12, 2006 (commencement of sale of shares) to February 28, 2007. H Expense ratios reflect operating expenses of the class. Expenses before reductions do not reflect amounts reimbursed by the investment adviser or reductions from brokerage service arrangements or other expense offset arrangements and do not represent the amount paid by the class during periods when reimbursements or reductions occur. Expenses net of fee waivers reflect expenses after reimbursement by the investment adviser but prior to reductions from brokerage service arrangements or other expense offset arrangements. Expenses net of all reductions represent the net expenses paid by the class. I Amount represents less than $.01 per share. |
See accompanying notes which are an integral part of the financial statements.
Annual Report
Notes to Financial Statements
For the period ended February 28, 2007
1. Organization.
Consumer Staples Portfolio (formerly Food and Agriculture Portfolio) (the Fund) is a non-diversified fund of Fidelity Select Portfolios (the trust) and is authorized to issue an unlimited number of shares. The trust is registered under the Investment Company Act of 1940, as amended (the 1940 Act), as an open-end management investment company organized as a Massachusetts business trust. The Fund invests primarily in securities of companies whose principal business activities fall within specific industries. The Fund offers Class A, Class T, Class B, Class C, Consumer Staples, and Institutional Class shares, each of which has equal rights as to assets and voting privileges. Each class has exclusive voting rights with respect to matters that affect that class. The Fund commenced sale of Class A, Class T, Class B, Class C and Institutional Class shares and the existing class was designated Consumer Staples on December 12, 2006. Class B shares will automatically convert to Class A shares after a holding period of seven years from the initial date of purchase. Investment income, realized and unrealized capital gains and losses, the common expenses of the Fund, and certain fund-level expense reductions, if any, are allocated on a pro rata basis to each class based on the relative net assets of each class to the total net assets of the Fund. Each class differs with respect to transfer agent and distribution and service plan fees incurred. Certain expense reductions also differ by class. The financial statements have been prepared in conformity with accounting principles generally accepted in the United States of America, which require management to make certain estimates and assumptions at the date of the financial statements.
2. Investments in Fidelity Central Funds.
The Fund may invest in Fidelity Central Funds which are open-end investment companies available only to other investment companies and accounts managed by FMR and its affiliates. The Fund's Schedule of Investments lists each of the Fidelity Central Funds as an investment of the Fund but does not include the underlying holdings of each Fidelity Central Fund. As an Investing Fund, the Fund indirectly bears its proportionate share of the expenses of the underlying Fidelity Central Funds. A complete unaudited list of holdings for each Fidelity Central Fund is available upon request. In addition, the financial statements of the Fidelity Central Funds, which are not covered by the Fund's Report of Independent Registered Public Accounting Firm, are available on the EDGAR Database on the SEC's web site, www.sec.gov, or upon request.
The Money Market Central Funds seek preservation of capital and current income and are managed by Fidelity Investments Money Management, Inc. (FIMM), an affiliate of Fidelity Management & Research Company (FMR).
3. Significant Accounting Policies.
The following summarizes the significant accounting policies of the Fund:
Security Valuation. Investments are valued and net asset value (NAV) per share is calculated (NAV calculation) as of the close of business of the New York Stock Exchange (NYSE), normally 4:00 p.m. Eastern time. During the period the Fund also calculated a NAV each hour on the hour (commencing at 10:00 a.m. Eastern time until one hour prior to the close of business on the NYSE). Effective October 1, 2006 the Fund eliminated hourly NAV calculation.
Wherever possible, the Fund uses independent pricing services approved by the Board of Trustees to value its investments. Equity securities, including restricted securities, for which market quotations are readily available, are valued at the last reported sale price or official closing price as reported by an independent pricing service on the primary market or exchange on which they are traded. In the event there were no sales during the day or closing prices are not available, securities are valued at the last quoted bid price. Investments in open-end mutual funds, including the Fidelity Central Funds, are valued at their closing net asset value each business day. Short-term securities with remaining maturities of sixty days or less for which quotations are not readily available are valued at amortized cost, which approximates value.
When current market prices or quotations are not readily available or do not accurately reflect fair value, valuations may be determined in accordance with procedures adopted by the Board of Trustees. For example, when developments occur between the close of a market and the close of the NYSE that may materially affect the value of some or all of the securities, or when trading in a security is halted, those securities may be fair valued. Factors used in the determination of fair value may include monitoring news to identify significant market or security specific events such as changes in the value of U.S. securities markets, reviewing developments in foreign markets and evaluating the performance of ADRs, futures contracts and exchange-traded funds. Because the Fund's utilization of fair value pricing depends on market activity, the frequency with which fair value pricing is used cannot be predicted and may be utilized to a significant extent. The value of securities used for NAV calculation under fair value pricing may differ from published prices for the same securities.
Foreign Currency. The Fund uses foreign currency contracts to facilitate transactions in foreign-denominated securities. Losses from these transactions may arise from changes in the value of the foreign currency or if the counterparties do not perform under the contracts' terms.
Annual Report
Notes to Financial Statements - continued
3. Significant Accounting Policies - continued
Foreign Currency - continued
Foreign-denominated assets, including investment securities, and liabilities are translated into U.S. dollars at the exchange rate at period end. Purchases and sales of investment securities, income and dividends received and expenses denominated in foreign currencies are translated into U.S. dollars at the exchange rate in effect on the transaction date.
The effects of exchange rate fluctuations on investments are included with the net realized and unrealized gain (loss) on investment securities. Other foreign currency transactions resulting in realized and unrealized gain (loss) are disclosed separately.
Investment Transactions and Income. For financial reporting purposes, the Fund's investment holdings and NAV include trades executed through the end of the last business day of the period. The NAV for processing shareholder transactions includes trades executed through the end of the prior business day. Gains and losses on securities sold are determined on the basis of identified cost and may include proceeds received from litigation. Dividend income is recorded on the ex-dividend date, except for certain dividends from foreign securities where the ex-dividend date may have passed, which are recorded as soon as the Fund is informed of the ex-dividend date. Non-cash dividends included in dividend income, if any, are recorded at the fair market value of the securities received. Distributions received on securities that represent a return of capital or capital gain are recorded as a reduction of cost of investments and/or as a realized gain. The Fund estimates the components of distributions received that may be considered return of capital distributions or capital gain distributions. Interest income and distributions from the Fidelity Central Funds are accrued as earned, with any distributions receivable as of period end included in Distributions receivable from Fidelity Central Funds on the Statement of Assets and Liabilities. Interest income includes coupon interest and amortization of premium and accretion of discount on debt securities. Investment income is recorded net of foreign taxes withheld where recovery of such taxes is uncertain.
Expenses. Most expenses of the trust can be directly attributed to a fund. Expenses which cannot be directly attributed are apportioned among each Fund in the trust. Expense estimates are accrued in the period to which they relate and adjustments are made when actual amounts are known.
Income Tax Information and Distributions to Shareholders. Each year, the Fund intends to qualify as a regulated investment company by distributing all of its taxable income and realized gains under Subchapter M of the Internal Revenue Code. As a result, no provision for income taxes is required in the accompanying financial statements. Foreign taxes are provided for based on the Fund's understanding of the tax rules and rates that exist in the foreign markets in which it invests.
Distributions are recorded on the ex-dividend date. Income dividends and capital gain distributions are declared separately for each class. Income and capital gain distributions are determined in accordance with income tax regulations, which may differ from generally accepted accounting principles. In addition, the Fund will claim a portion of the payment made to redeeming shareholders as a distribution for income tax purposes.
Capital accounts within the financial statements are adjusted for permanent book-tax differences. These adjustments have no impact on net assets or the results of operations. Temporary book-tax differences will reverse in a subsequent period.
Book-tax differences are primarily due to short-term capital gains, foreign currency transactions and losses deferred due to wash sales.
The tax-basis components of distributable earnings and the federal tax cost as of period end were as follows:
Unrealized appreciation | $ 38,446,201 |
Unrealized depreciation | (2,642,135) |
Net unrealized appreciation (depreciation) | 35,804,066 |
Undistributed ordinary income | 2,363,461 |
Undistributed long-term capital gain | 2,384,179 |
Cost for federal income tax purposes | $ 338,603,579 |
The tax character of distributions paid was as follows:
February 28, 2007 | February 28, 2006 | |
Ordinary Income | $ 1,582,908 | $ 1,906,227 |
Long-term Capital Gains | 15,661,672 | 5,302,150 |
Total | $ 17,244,580 | $ 7,208,377 |
Trading (Redemption) Fees. Shares in the Fund held less than 30 days are subject to a redemption fee equal to .75% of the net asset value of shares redeemed. All redemption fees, including any estimated redemption fees paid by FMR, are retained by the Fund and accounted for as an addition to paid in capital. Shareholders were also subject to an additional $7.50 fee for shares exchanged into another Fidelity fund (see Note 6).
Annual Report
3. Significant Accounting Policies - continued
New Accounting Pronouncements. In July 2006, Financial Accounting Standards Board Interpretation No. 48, Accounting for Uncertainty in Income Taxes - an interpretation of FASB Statement 109 (FIN 48), was issued and is effective on the last business day of the semiannual reporting period for fiscal years beginning after December 15, 2006. FIN 48 sets forth a threshold for financial statement recognition, measurement and disclosure of a tax position taken or expected to be taken on a tax return. Management is currently evaluating the impact, if any, the adoption of FIN 48 will have on the Fund's net assets, results of operations and financial statement disclosures.
In addition, in September 2006, Statement of Financial Accounting Standards No. 157, Fair Value Measurements (SFAS 157), was issued and is effective for fiscal years beginning after November 15, 2007. SFAS 157 defines fair value, establishes a framework for measuring fair value and expands disclosures about fair value measurements. Management is currently evaluating the impact the adoption of SFAS 157 will have on the Fund's financial statement disclosures.
4. Operating Policies.
Repurchase Agreements. FMR has received an Exemptive Order from the Securities and Exchange Commission (the SEC) which permits the Fund and other affiliated entities of FMR to transfer uninvested cash balances into joint trading accounts which are then invested in repurchase agreements. The Fund may also invest directly with institutions in repurchase agreements. Repurchase agreements are collateralized by government or non-government securities. Upon settlement date, collateral is held in segregated accounts with custodian banks and may be obtained in the event of a default of the counterparty. The Fund monitors, on a daily basis, the value of the collateral to ensure it is at least equal to the principal amount of the repurchase agreement (including accrued interest). In the event of a default by the counterparty, realization of the collateral proceeds could be delayed, during which time the value of the collateral may decline.
5. Purchases and Sales of Investments.
Purchases and sales of securities, other than short-term securities, aggregated $426,154,222 and $222,805,678, respectively.
6. Fees and Other Transactions with Affiliates.
Management Fee. FMR and its affiliates provide the Fund with investment management related services for which the Fund pays a monthly management fee. The management fee is the sum of an individual fund fee rate that is based on an annual rate of .30% of the Fund's average net assets and a group fee rate that averaged .26% during the period. The group fee rate is based upon the average net assets of all the mutual funds advised by FMR. The group fee rate decreases as assets under management increase and increases as assets under management decrease. For the period, the total annual management fee rate was .57% of the Fund's average net assets.
Distribution and Service Plan. In accordance with Rule 12b-1 of the 1940 Act, the Fund has adopted separate Distribution and Service Plans for each class of shares. Certain classes pay Fidelity Distributors Corporation (FDC), an affiliate of FMR, separate Distribution and Service Fees, each of which is based on an annual percentage of each class' average net assets. In addition, FDC may pay financial intermediaries for selling shares of the Fund and providing shareholder support services. For the period, the Distribution and Service Fee rates and the total amounts paid to and retained by FDC were as follows:
Distribution | Service | Paid to | Retained | |
Class A | -% | .25% | $ 241 | $ 130 |
Class T | .25% | .25% | 208 | 112 |
Class B | .75% | .25% | 290 | 275 |
Class C | .75% | .25% | 272 | 261 |
$ 1,011 | $ 778 |
Sales Load. FDC receives a front-end sales charge of up to 5.75% for selling Class A shares, and 3.50% for selling Class T shares, some of which is paid to financial intermediaries for selling shares of the Fund. FDC receives the proceeds of contingent deferred sales charges levied on Class A, Class T, Class B, and Class C redemptions. These charges depend on the holding period. The deferred sales charges range from 5% to 1% for Class B, 1% for Class C, 1.00% to .50% for certain purchases of Class A shares and .25% for certain purchases of Class T shares.
Annual Report
Notes to Financial Statements - continued
6. Fees and Other Transactions with Affiliates - continued
Sales Load - continued
For the period, sales charge amounts retained by FDC were as follows:
Retained | |
Class A | $ 357 |
Class T | 405 |
$ 762 |
Transfer Agent Fees. Fidelity Investments Institutional Operations Company, Inc. (FIIOC), an affiliate of FMR, is the transfer, dividend disbursing and shareholder servicing agent for each class of the Fund, except for Consumer Staples. Fidelity Service Company, Inc. (FSC), an affiliate of FMR, is the transfer agent for Consumer Staples shares. FIIOC and FSC receive account fees and asset-based fees that vary according to the account size and type of account of the shareholders of the respective classes of the Fund. FIIOC and FSC pay for typesetting, printing and mailing of shareholder reports, except proxy statements. For the period, the total transfer agent fees paid by each class to FIIOC or FSC, were as follows:
Amount | % of | |
Class A | $ 112 | .13 |
Class T | 82 | .21 |
Class B | 61 | .22 |
Class C | 73 | .29 |
Consumer Staples | 691,220 | .30 |
Institutional Class | 102 | .27 |
$ 691,650 |
Accounting and Security Lending Fees. FSC maintains the Fund's accounting records. The accounting fee is based on the level of average net assets for the month. Under a separate contract, FSC administers the security lending program. The security lending fee is based on the number and duration of lending transactions.
Exchange Fees. During the period, FSC received the proceeds of a $7.50 fee to cover administrative costs associated with exchanges out of the Fund to any other Fidelity Select fund or to any other Fidelity fund made through non-automated channels. Effective October 1, 2006, the exchange fees were eliminated. For the period, exchange fees retained by FSC were as follows:
Retained | |
Consumer Staples Portfolio | $ 923 |
Brokerage Commissions. The Fund placed a portion of its portfolio transactions with brokerage firms which are affiliates of the investment adviser. The commissions paid to these affiliated firms were $1,593 for the period.
7. Committed Line of Credit.
The Fund participates with other funds managed by FMR in a $4.2 billion credit facility (the "line of credit") to be utilized for temporary or emergency purposes to fund shareholder redemptions or for other short-term liquidity purposes. The Fund has agreed to pay commitment fees on its pro rata portion of the line of credit, which amounted to $506 and is reflected in Miscellaneous Expense on the Statement of Operations. During the period, there were no borrowings on this line of credit.
Annual Report
8. Security Lending.
The Fund lends portfolio securities from time to time in order to earn additional income. On the settlement date of the loan, the Fund receives collateral (in the form of U.S. Treasury obligations, letters of credit and/or cash) against the loaned securities and maintains collateral in an amount not less than 100% of the market value of the loaned securities during the period of the loan. The market value of the loaned securities is determined at the close of business of the Fund and any additional required collateral is delivered to the Fund on the next business day. If the borrower defaults on its obligation to return the securities loaned because of insolvency or other reasons, a fund could experience delays and costs in recovering the securities loaned or in gaining access to the collateral. Any cash collateral received is invested in the Fidelity Securities Lending Cash Central Fund. The value of loaned securities and cash collateral at period end are disclosed on the Fund's Statement of Assets and Liabilities. Security lending income represents the income earned on investing cash collateral, less fees and expenses associated with the loan, plus any premium payments that may be received on the loan of certain types of securities. Security lending income is presented in the Statement of Operations as a component of income from Fidelity Central Funds. Net income from lending portfolio securities during the period amounted to $75,627.
9. Expense Reductions.
FMR voluntarily agreed to reimburse a portion of Consumer Staples' operating expenses. During the period, this reimbursement reduced the class' expenses by $56,875.
Many of the brokers with whom FMR places trades on behalf of the Fund provided services to the Fund in addition to trade execution. These services included payments of certain expenses on behalf of the Fund totaling $5,788 for the period. In addition, through arrangements with the Fund's custodian and each class' transfer agent, credits realized as a result of uninvested cash balances were used to reduce the Fund's expenses. During the period, these credits reduced the Fund's custody expenses by $970. During the period, credits reduced each class' transfer agent expense as noted in the table below.
Transfer Agent | |
Consumer Staples | $ 2,309 |
10. Other.
The Fund's organizational documents provide former and current trustees and officers with a limited indemnification against liabilities arising in connection with the performance of their duties to the Fund. In the normal course of business, the Fund may also enter into contracts that provide general indemnifications. The Fund's maximum exposure under these arrangements is unknown as this would be dependent on future claims that may be made against the Fund. The risk of material loss from such claims is considered remote.
The United States Securities and Exchange Commission ("SEC") is conducting an investigation of FMR (covering the years 2002 to 2004) arising from gifts, gratuities and business entertainment provided by certain brokers to certain individuals who were employed on FMR's domestic equity trading desk during that period. FMR is in discussions with the SEC staff regarding the possible resolution of the matter, but as of period-end no final resolution has been reached.
In December 2006, the Independent Trustees completed their own investigation of the matter with the assistance of independent counsel. The Independent Trustees and FMR agree that, despite the absence of proof that the Fidelity mutual funds experienced diminished execution quality as a result of the improper receipt of gifts and business entertainment, the conduct at issue was serious and is worthy of redress. Accordingly, the Independent Trustees have requested and FMR has agreed to pay $42 million to Fidelity mutual funds, plus interest to be determined at the time that payment is made. A method of allocating this payment among the funds has not yet been determined. The total payment to the Fund is not anticipated to have a material impact on the Fund's net assets. In addition, FMR reimbursed related legal expenses which are recorded in the accompanying Statement of Operations as an expense reduction.
11. Distributions to Shareholders.
Distributions to shareholders of each class were as follows:
Years ended February 28, | 2007 | 2006 |
From net investment income | ||
Consumer Staples | $ 1,582,908 | $ 1,049,605 |
From net realized gain | ||
Consumer Staples | $ 15,661,672 | $ 6,158,772 |
Annual Report
Notes to Financial Statements - continued
12. Share Transactions.
Transactions for each class of shares were as follows:
Shares | Dollars | |||
Years ended February 28, | 2007 A | 2006 | 2007 A | 2006 |
Class A | ||||
Shares sold | 17,300 | - | $ 1,017,780 | $ - |
Shares redeemed | (340) | - | (20,214) | - |
Net increase (decrease) | 16,960 | - | $ 997,566 | $ - |
Class T | ||||
Shares sold | 9,119 | - | $ 531,803 | $ - |
Shares redeemed | - | - | - | - |
Net increase (decrease) | 9,119 | - | $ 531,803 | $ - |
Class B | ||||
Shares sold | 3,902 | - | $ 225,744 | $ - |
Shares redeemed | - | - | - | - |
Net increase (decrease) | 3,902 | - | $ 225,744 | $ - |
Class C | ||||
Shares sold | 3,073 | - | $ 177,350 | $ - |
Shares redeemed | - | - | - | - |
Net increase (decrease) | 3,073 | - | $ 177,350 | $ - |
Consumer Staples | ||||
Shares sold | 6,369,570 | 932,427 | $ 359,958,201 | $ 47,926,666 |
Reinvestment of distributions | 292,584 | 133,891 | 16,482,463 | 6,802,073 |
Shares redeemed | (2,608,360) | (1,380,263) | (147,956,526) | (71,028,865) |
Net increase (decrease) | 4,053,794 | (313,945) | $ 228,484,138 | $ (16,300,126) |
Institutional Class | ||||
Shares sold | 4,028 | - | $ 230,500 | $ - |
Shares redeemed | (1,758) | - | (103,807) | - |
Net increase (decrease) | 2,270 | - | $ 126,693 | $ - |
A Share transactions for Class A, Class T, Class B, Class C and Institutional Class are for the period December 12, 2006 (commencement of sale of shares) to February 28, 2007.
Annual Report
Report of Independent Registered Public Accounting Firm
To the Trustees of Fidelity Select Portfolios and the Shareholders of Consumer Staples Portfolio:
In our opinion, the accompanying statement of assets and liabilities, including the schedule of investments, and the related statements of operations and of changes in net assets and the financial highlights present fairly, in all material respects, the financial position of Consumer Staples Portfolio (a fund of Fidelity Select Portfolios) at February 28, 2007, the results of its operations for the year then ended, the changes in its net assets for each of the two years in the period then ended and the financial highlights for each of the periods indicated, in conformity with accounting principles generally accepted in the United States of America. These financial statements and financial highlights (hereafter referred to as "financial statements") are the responsibility of the Consumer Staples Portfolio's management. Our responsibility is to express an opinion on these financial statements based on our audits. We conducted our audits of these financial statements in accordance with the standards of the Public Company Accounting Oversight Board (United States). Those standards require that we plan and perform the audit to obtain reasonable assurance about whether the financial statements are free of material misstatement. An audit includes examining, on a test basis, evidence supporting the amounts and disclosures in the financial statements, assessing the accounting principles used and significant estimates made by management, and evaluating the overall financial statement presentation. We believe that our audits, which included confirmation of securities at February 28, 2007 by correspondence with the custodian and brokers, provide a reasonable basis for our opinion.
/s/PricewaterhouseCoopers LLP
PricewaterhouseCoopers LLP
Boston, Massachusetts
April 23, 2007
Annual Report
Trustees and Officers
The Trustees, Member of the Advisory Board, and executive officers of the trust and fund, as applicable, are listed below. The Board of Trustees governs the fund and is responsible for protecting the interests of shareholders. The Trustees are experienced executives who meet periodically throughout the year to oversee the fund's activities, review contractual arrangements with companies that provide services to the fund, and review the fund's performance. Each of the Trustees oversees 349 funds advised by FMR or an affiliate.
The Trustees hold office without limit in time except that (a) any Trustee may resign; (b) any Trustee may be removed by written instrument, signed by at least two-thirds of the number of Trustees prior to such removal; (c) any Trustee who requests to be retired or who has become incapacitated by illness or injury may be retired by written instrument signed by a majority of the other Trustees; and (d) any Trustee may be removed at any special meeting of shareholders by a two-thirds vote of the outstanding voting securities of the trust. Each Trustee who is not an interested person (as defined in the 1940 Act) (Independent Trustee), shall retire not later than the last day of the calendar year in which his or her 72nd birthday occurs. The Independent Trustees may waive this mandatory retirement age policy with respect to individual Trustees. The executive officers and Advisory Board Member hold office without limit in time, except that any officer and Advisory Board Member may resign or may be removed by a vote of a majority of the Trustees at any regular meeting or any special meeting of the Trustees. Except as indicated, each individual has held the office shown or other offices in the same company for the past five years.
The fund's Statement of Additional Information (SAI) includes more information about the Trustees. To request a free copy, call Fidelity at 1-800-544-8544.
Interested Trustees*:
Correspondence intended for each Trustee who is an interested person may be sent to Fidelity Investments, 82 Devonshire Street, Boston, Massachusetts 02109.
Name, Age; Principal Occupation | |
Edward C. Johnson 3d (76) | |
Year of Election or Appointment: 1980 Mr. Johnson is Chairman of the Board of Trustees. Mr. Johnson serves as President (2006-present), Chief Executive Officer, Chairman, and a Director of FMR Corp.; Chairman and a Director of FMR; Chairman and a Director of Fidelity Research & Analysis Company (FRAC); Chairman and a Director of Fidelity Investments Money Management, Inc.; and Chairman (2001- present) and a Director of FMR Co., Inc. In addition, Mr. Johnson serves as Chairman and Director of Fidelity International Limited (FIL). | |
Robert L. Reynolds (54) | |
Year of Election or Appointment: 2003 Mr. Reynolds is President and a Director of FMR (2005-present), Fidelity Investments Money Management, Inc. (2005-present), and FMR Co., Inc. (2005-present). Mr. Reynolds also serves as Vice Chairman (2006-present), a Director (2003-present), and Chief Operating Officer of FMR Corp. and a Director of Strategic Advisers, Inc. (2005-present). He also serves on the Board at Fidelity Investments Canada, Ltd. | |
* Trustees have been determined to be "Interested Trustees" by virtue of, among other things, their affiliation with the trust or various entities under common control with FMR.
Independent Trustees:
Correspondence intended for each Independent Trustee (that is, the Trustees other than the Interested Trustees) may be sent to Fidelity Investments, P.O. Box 55235, Boston, Massachusetts 02205-5235.
Name, Age; Principal Occupation | |
Dennis J. Dirks (58) | |
Year of Election or Appointment: 2005 Prior to his retirement in May 2003, Mr. Dirks was Chief Operating Officer and a member of the Board of The Depository Trust & Clearing Corporation (DTCC) (1999-2003). He also served as President, Chief Operating Officer, and Board member of The Depository Trust Company (DTC) (1999-2003) and President and Board member of the National Securities Clearing Corporation (NSCC) (1999-2003). In addition, Mr. Dirks served as Chief Executive Officer and Board member of the Government Securities Clearing Corporation (2001-2003) and Chief Executive Officer and Board member of the Mortgage-Backed Securities Clearing Corporation (2001-2003). Mr. Dirks also serves as a Trustee and a member of the Finance Committee of Manhattan College (2005-present) and a Trustee and a member of the Finance Committee of AHRC of Nassau County (2006-present). | |
Albert R. Gamper, Jr. (64) | |
Year of Election or Appointment: 2006 Prior to his retirement in December 2004, Mr. Gamper served as Chairman of the Board of CIT Group Inc. (commercial finance). During his tenure with CIT Group Inc. Mr. Gamper served in numerous senior management positions, including Chairman (1987-1989; 1999-2001; 2002-2004), Chief Executive Officer (1987-2004), and President (1989-2002). He currently serves as a member of the Board of Directors of Public Service Enterprise Group (utilities, 2001-present), Chairman of the Board of Governors, Rutgers University (2004-present), and Chairman of the Board of Saint Barnabas Health Care System. | |
George H. Heilmeier (70) | |
Year of Election or Appointment: 2004 Dr. Heilmeier is Chairman Emeritus of Telcordia Technologies (communication software and systems), where prior to his retirement, he served as company Chairman and Chief Executive Officer. He currently serves on the Boards of Directors of The Mitre Corporation (systems engineering and information technology support for the government), and HRL Laboratories (private research and development, 2004-present). He is Chairman of the General Motors Science & Technology Advisory Board and a Life Fellow of the Institute of Electrical and Electronics Engineers (IEEE). Dr. Heilmeier is a member of the Defense Science Board and the National Security Agency Advisory Board. He is also a member of the National Academy of Engineering, the American Academy of Arts and Sciences, and the Board of Overseers of the School of Engineering and Applied Science of the University of Pennsylvania. Previously, Dr. Heilmeier served as a Director of TRW Inc. (automotive, space, defense, and information technology, 1992-2002), Compaq (1994-2002), Automatic Data Processing, Inc. (ADP) (technology-based business outsourcing, 1995-2002), INET Technologies Inc. (telecommunications network surveillance, 2001-2004), and Teletech Holdings (customer management services). He is the recipient of the 2005 Kyoto Prize in Advanced Technology for his invention of the liquid crystal display, and a member of the Consumer Electronics Hall of Fame. | |
James H. Keyes (66) | |
Year of Election or Appointment: 2007 Prior to his retirement in 2003, Mr. Keyes was Chairman, President, and Chief Executive Officer of Johnson Controls, Inc. (automotive supplier, 1993-2003). He currently serves as a member of the boards of LSI Logic Corporation (semiconductor technologies), Navistar International Corporation (manufacture and sale of trucks, buses, and diesel engines, 2002-present), and Pitney Bowes, Inc. (integrated mail, messaging, and document management solutions). | |
Marie L. Knowles (60) | |
Year of Election or Appointment: 2001 Prior to Ms. Knowles' retirement in June 2000, she served as Executive Vice President and Chief Financial Officer of Atlantic Richfield Company (ARCO) (diversified energy, 1996-2000). From 1993 to 1996, she was a Senior Vice President of ARCO and President of ARCO Transportation Company. She served as a Director of ARCO from 1996 to 1998. She currently serves as a Director of Phelps Dodge Corporation (copper mining and manufacturing) and McKesson Corporation (healthcare service, 2002-present). Ms. Knowles is a Trustee of the Brookings Institution and the Catalina Island Conservancy and also serves as a member of the Advisory Board for the School of Engineering of the University of Southern California. | |
Ned C. Lautenbach (63) | |
Year of Election or Appointment: 2000 Mr. Lautenbach is Chairman of the Independent Trustees (2006-present). Mr. Lautenbach has been a partner of Clayton, Dubilier & Rice, Inc. (private equity investment firm) since September 1998. Previously, Mr. Lautenbach was with the International Business Machines Corporation (IBM) from 1968 until his retirement in 1998. Mr. Lautenbach serves as a Director of Sony Corporation (2006-present) and Eaton Corporation (diversified industrial) as well as the Philharmonic Center for the Arts in Naples, Florida. He also is a member of the Board of Trustees of Fairfield University (2005-present), as well as a member of the Council on Foreign Relations. | |
Cornelia M. Small (62) | |
Year of Election or Appointment: 2005 Ms. Small is a member (2000-present) and Chairperson (2002-present) of the Investment Committee, and a member (2002- present) of the Board of Trustees of Smith College. Previously, she served as Chief Investment Officer (1999-2000), Director of Global Equity Investments (1996-1999), and a member of the Board of Directors of Scudder, Stevens & Clark (1990-1997) and Scudder Kemper Investments (1997-1999). In addition, Ms. Small served as Co-Chair (2000-2003) of the Annual Fund for the Fletcher School of Law and Diplomacy. | |
William S. Stavropoulos (67) | |
Year of Election or Appointment: 2001 Mr. Stavropoulos is Chairman Emeritus of the Board of Directors of The Dow Chemical Company. Since joining The Dow Chemical Company in 1967, Mr. Stavropoulos served in numerous senior management positions, including President (1993-2000; 2002-2003), CEO (1995-2000; 2002-2004), and Chairman of the Executive Committee (2000-2004). Currently, he is a Director of NCR Corporation (data warehousing and technology solutions), Chemical Financial Corporation, Maersk Inc. (industrial conglomerate, 2002-present), Tyco International, Inc. (multinational manufacturing and services, 2007-present), and a member of the Advisory Board for Metalmark Capital (private equity investment firm, 2005-present). He is a special advisor to Clayton, Dubilier & Rice, Inc., a private equity investment firm. He also serves as a member of the Board of Trustees of the American Enterprise Institute for Public Policy Research. In addition, Mr. Stavropoulos is a member of The Business Council, J.P. Morgan International Council and the University of Notre Dame Advisory Council for the College of Science. | |
Kenneth L. Wolfe (68) | |
Year of Election or Appointment: 2005 Prior to his retirement in 2001, Mr. Wolfe was Chairman and Chief Executive Officer of Hershey Foods Corporation (1993-2001). He currently serves as a member of the boards of Adelphia Communications Corporation (2003-present), Bausch & Lomb, Inc., and Revlon Inc. (2004-present). | |
Advisory Board Member and Executive Officers:
Correspondence intended for each executive officer and Mr. Lynch may be sent to Fidelity Investments, 82 Devonshire Street, Boston, Massachusetts 02109.
Name, Age; Principal Occupation | |
Peter S. Lynch (63) | |
Year of Election or Appointment: 2003 Member of the Advisory Board of Fidelity Select Portfolios. Mr. Lynch is Vice Chairman and a Director of FMR, and Vice Chairman (2001-present) and a Director of FMR Co., Inc. Previously, Mr. Lynch served as a Trustee of the Fidelity funds (1990-2003). In addition, he serves as a Trustee of Boston College and as the Chairman of the Inner-City Scholarship Fund. | |
Kimberley H. Monasterio (43) | |
Year of Election or Appointment: 2007 President and Treasurer of Select Consumer Staples Portfolio. Ms. Monasterio also serves as President and Treasurer of other Fidelity funds (2007-present) and is an employee of FMR (2004-present). Previously, Ms. Monasterio served as Deputy Treasurer of the Fidelity funds (2004-2006). Before joining Fidelity Investments, Ms. Monasterio served as Treasurer (2000-2004) and Chief Financial Officer (2002-2004) of the Franklin Templeton Funds and Senior Vice President of Franklin Templeton Services, LLC (2000-2004). | |
Boyce I. Greer (51) | |
Year of Election or Appointment: 2005 Vice President of Select Consumer Staples Portfolio. Mr. Greer also serves as Vice President of certain Equity Funds (2005-present), certain Asset Allocation Funds (2005-present), Fixed-Income Funds (2006-present), and Money Market Funds (2006-present). Mr. Greer is also a Trustee of other investment companies advised by FMR (2003-present). He is an Executive Vice President of FMR (2005-present) and FMR Co., Inc. (2005-present), and Senior Vice President of Fidelity Investments Money Management, Inc. (2006-present). Previously, Mr. Greer served as a Director and Managing Director of Strategic Advisers, Inc. (2002-2005), and Executive Vice President (2000-2002) and Money Market Group Leader (1997-2002) of the Fidelity Investments Fixed Income Division. He also served as Vice President of Fidelity's Money Market Funds (1997-2002), Senior Vice President of FMR (1997-2002), and Vice President of FIMM (1998-2002). | |
Eric D. Roiter (58) | |
Year of Election or Appointment: 1998 Secretary of Select Consumer Staples Portfolio. He also serves as Secretary of other Fidelity funds; Vice President, General Counsel, and Secretary of FMR Co., Inc. (2001-present) and FMR; Assistant Secretary of Fidelity Management & Research (U.K.) Inc. (2001-present), Fidelity Research & Analysis Company (2001-present), and Fidelity Investments Money Management, Inc. (2001-present). Mr. Roiter is an Adjunct Member, Faculty of Law, at Boston College Law School (2003-present). Previously, Mr. Roiter served as Vice President and Secretary of Fidelity Distributors Corporation (FDC) (1998-2005). | |
Scott C. Goebel (39) | |
Year of Election or Appointment: 2007 Assistant Secretary of Select Consumer Staples Portfolio. Mr. Goebel also serves as Assistant Secretary of other Fidelity funds (2007-present), Vice President and Secretary of FDC (2006-present), and is an employee of FMR. | |
R. Stephen Ganis (40) | |
Year of Election or Appointment: 2006 Anti-Money Laundering (AML) officer of Select Consumer Staples Portfolio. Mr. Ganis also serves as AML officer of other Fidelity funds (2006-present) and FMR Corp. (2003-present). Before joining Fidelity Investments, Mr. Ganis practiced law at Goodwin Procter, LLP (2000-2002). | |
Joseph B. Hollis (58) | |
Year of Election or Appointment: 2006 Chief Financial Officer of Select Consumer Staples Portfolio. Mr. Hollis also serves as Chief Financial Officer of other Fidelity funds. Mr. Hollis is President of Fidelity Pricing and Cash Management Services (FPCMS) (2005-present). Mr. Hollis also serves as President and Director of Fidelity Service Company, Inc. (2006-present). Previously, Mr. Hollis served as Senior Vice President of Cash Management Services (1999-2002) and Investment Management Operations (2002-2005). | |
Kenneth A. Rathgeber (59) | |
Year of Election or Appointment: 2004 Chief Compliance Officer of Select Consumer Staples Portfolio. Mr. Rathgeber also serves as Chief Compliance Officer of other Fidelity funds (2004-present) and Executive Vice President of Risk Oversight for Fidelity Investments (2002-present). He is Chief Compliance Officer of FMR (2005-present), FMR Co., Inc. (2005-present), Fidelity Management & Research (U.K.) Inc. (2005-present), Fidelity Research & Analysis Company (2005-present), Fidelity Investments Money Management, Inc. (2005- present), and Strategic Advisers, Inc. (2005-present). Previously, Mr. Rathgeber served as Executive Vice President and Chief Operating Officer for Fidelity Investments Institutional Services Company, Inc. (1998-2002). | |
Bryan A. Mehrmann (45) | |
Year of Election or Appointment: 2005 Deputy Treasurer of Select Consumer Staples Portfolio. Mr. Mehrmann also serves as Deputy Treasurer of other Fidelity funds (2005-present) and is an employee of FMR. Previously, Mr. Mehrmann served as Vice President of Fidelity Investments Institutional Services Group (FIIS)/Fidelity Investments Institutional Operations Corporation, Inc. (FIIOC) Client Services (1998-2004). | |
Kenneth B. Robins (37) | |
Year of Election or Appointment: 2005 Deputy Treasurer of Select Consumer Staples Portfolio. Mr. Robins also serves as Deputy Treasurer of other Fidelity funds (2005-present) and is an employee of FMR (2004-present). Before joining Fidelity Investments, Mr. Robins worked at KPMG LLP, where he was a partner in KPMG's department of professional practice (2002-2004) and a Senior Manager (1999-2000). In addition, Mr. Robins served as Assistant Chief Accountant, United States Securities and Exchange Commission (2000-2002). | |
Robert G. Byrnes (40) | |
Year of Election or Appointment: 2005 Assistant Treasurer of Select Consumer Staples Portfolio. Mr. Byrnes also serves as Assistant Treasurer of other Fidelity funds (2005-present) and is an employee of FMR (2005-present). Previously, Mr. Byrnes served as Vice President of FPCMS (2003-2005). Before joining Fidelity Investments, Mr. Byrnes worked at Deutsche Asset Management where he served as Vice President of the Investment Operations Group (2000-2003). | |
Peter L. Lydecker (53) | |
Year of Election or Appointment: 2004 Assistant Treasurer of Select Consumer Staples Portfolio. Mr. Lydecker also serves as Assistant Treasurer of other Fidelity funds (2004) and is an employee of FMR. | |
Gary W. Ryan (48) | |
Year of Election or Appointment: 2005 Assistant Treasurer of Select Consumer Staples Portfolio. Mr. Ryan also serves as Assistant Treasurer of other Fidelity funds (2005-present) and is an employee of FMR (2005-present). Previously, Mr. Ryan served as Vice President of Fund Reporting in FPCMS (1999-2005). | |
Salvatore Schiavone (41) | |
Year of Election or Appointment: 2005 Assistant Treasurer of Select Consumer Staples Portfolio. Mr. Schiavone also serves as Assistant Treasurer of other Fidelity funds (2005-present) and is an employee of FMR (2005-present). Before joining Fidelity Investments, Mr. Schiavone worked at Deutsche Asset Management, where he most recently served as Assistant Treasurer (2003-2005) of the Scudder Funds and Vice President and Head of Fund Reporting (1996-2003). | |
Annual Report
Distributions
The Board of Trustees of Select Consumer Staples Portfolio voted to pay on April 16, 2007, to shareholders of record at the opening of business on April 13, 2007, a distribution of $.67 per share derived from capital gains realized from sales of portfolio securities and a dividend of $.062 per share from net investment income.
The fund hereby designates as a capital gain dividend with respect to the taxable year ended February 28, 2007, $16,772,704 or, if subsequently determined to be different, the net capital gain of such year.
The fund designates 100% of the dividends distributed during the fiscal year as qualifying for the dividends-received deduction for corporate shareholders.
The fund designates 100% of the dividends distributed during the fiscal year as amounts which may be taken into account as a dividend for the purposes of the maximum rate under section 1(h)(11) of the Internal Revenue Code.
The fund will notify shareholders in January 2008 of amounts for use in preparing 2007 income tax returns.
Annual Report
Proxy Voting Results
A special meeting of Fidelity Select Portfolios' shareholders was held on September 20, 2006. The results of votes taken among shareholders on the proposals before them are reported below. Each vote reported represents one dollar of net asset value held on the record date for the meeting.
PROPOSAL 1 | ||
To elect a Board of Trustees. A | ||
# of | % of | |
Dennis J. Dirks | ||
Affirmative | 13,182,341,755.09 | 94.980 |
Withheld | 696,736,162.41 | 5.020 |
TOTAL | 13,879,077,917.50 | 100.000 |
Albert R. Gamper, Jr. | ||
Affirmative | 13,177,593,614.43 | 94.946 |
Withheld | 701,484,303.07 | 5.054 |
TOTAL | 13,879,077,917.50 | 100.000 |
Robert M. Gates | ||
Affirmative | 13,141,235,622.81 | 94.684 |
Withheld | 737,842,294.69 | 5.316 |
TOTAL | 13,879,077,917.50 | 100.000 |
George H. Heilmeier | ||
Affirmative | 13,140,073,210.00 | 94.675 |
Withheld | 739,004,707.50 | 5.325 |
TOTAL | 13,879,077,917.50 | 100.000 |
Edward C. Johnson 3d | ||
Affirmative | 13,106,284,587.54 | 94.432 |
Withheld | 772,793,329.96 | 5.568 |
TOTAL | 13,879,077,917.50 | 100.000 |
Stephen P. Jonas | ||
Affirmative | 13,168,282,872.88 | 94.879 |
Withheld | 710,795,044.62 | 5.121 |
TOTAL | 13,879,077,917.50 | 100.000 |
James H. KeyesB | ||
Affirmative | 13,164,603,089.66 | 94.852 |
Withheld | 714,474,827.84 | 5.148 |
TOTAL | 13,879,077,917.50 | 100.000 |
Marie L. Knowles | ||
Affirmative | 13,169,356,779.66 | 94.886 |
Withheld | 709,721,137.84 | 5.114 |
TOTAL | 13,879,077,917.50 | 100.000 |
Ned C. Lautenbach | ||
Affirmative | 13,166,485,155.52 | 94.866 |
Withheld | 712,592,761.98 | 5.134 |
TOTAL | 13,879,077,917.50 | 100.000 |
William O. McCoy | ||
Affirmative | 13,129,548,996.59 | 94.600 |
Withheld | 749,528,920.91 | 5.400 |
TOTAL | 13,879,077,917.50 | 100.000 |
Robert L. Reynolds | ||
Affirmative | 13,180,813,649.06 | 94.969 |
Withheld | 698,264,268.44 | 5.031 |
TOTAL | 13,879,077,917.50 | 100.000 |
# of | % of | |
Cornelia M. Small | ||
Affirmative | 13,170,500,616.42 | 94.895 |
Withheld | 708,577,301.08 | 5.105 |
TOTAL | 13,879,077,917.50 | 100.000 |
William S. Stavropoulos | ||
Affirmative | 13,143,284,328.22 | 94.699 |
Withheld | 735,793,589.28 | 5.301 |
TOTAL | 13,879,077,917.50 | 100.000 |
Kenneth L. Wolfe | ||
Affirmative | 13,162,946,758.47 | 94.840 |
Withheld | 716,131,159.03 | 5.160 |
TOTAL | 13,879,077,917.50 | 100.000 |
PROPOSAL 5A | ||
To modify the fund's fundamental "invests primarily" policy (the investment policy concerning the fund's primary investments). | ||
Consumer Staples Portfolio | ||
# of | % of | |
Affirmative | 75,186,262.69 | 73.993 |
Against | 12,513,957.55 | 12.315 |
Abstain | 4,755,941.37 | 4.681 |
Broker Non-Votes | 9,157,134.36 | 9.012 |
TOTAL | 101,613,295.97 | 100.000 |
PROPOSAL 5B | ||
To modify the fund's investment concentration policy. | ||
Consumer Staples Portfolio | ||
# of | % of | |
Affirmative | 75,739,148.90 | 74.537 |
Against | 11,467,272.86 | 11.285 |
Abstain | 5,249,739.85 | 5.167 |
Broker Non-Votes | 9,157,134.36 | 9.012 |
TOTAL | 101,613,295.97 | 100.000 |
A Denotes trust-wide proposal and voting results. B Effective on or about January 1, 2007. | ||
Annual Report
Investment Adviser
Fidelity Management & Research Company
Boston, MA
Investment Sub-Advisers
FMR Co., Inc.
Fidelity Management & Research
(U.K.) Inc.
Fidelity Research & Analysis Company
Fidelity Investments Japan Limited
Fidelity International Investment Advisors
Fidelity International Investment Advisors
(U.K. Limited)
General Distributor
Fidelity Distributors Corporation
Boston, MA
Transfer and Service Agents
Fidelity Service Company, Inc.
Boston, MA
Fidelity Investments Institutional
Operations Company, Inc.
Boston, MA
Custodian
Brown Brothers Harriman & Co.
Boston, MA
Corporate Headquarters
82 Devonshire Street
Boston, MA 02109
1-800-544-8888
The Fidelity Telephone Connection
Mutual Fund 24-Hour Service
Exchanges/Redemptions
and Account Assistance 1-800-544-6666
Product Information 1-800-544-8888
Retirement Accounts 1-800-544-4774
(8 a.m. - 9 p.m.)
TDD Service 1-800-544-0118
for the deaf and hearing impaired
(9 a.m. - 9 p.m. Eastern time)
Fidelity Automated Service
Telephone (FAST®) (automated graphic) 1-800-544-5555
(automated graphic) Automated line for quickest service
SELCS-UANN-0407
1.846041.100
(Fidelity Investment logo)(registered trademark)
Corporate Headquarters
82 Devonshire St., Boston, MA 02109
www.fidelity.com
Fidelity®
Select Portfolios®
Telecommunications Services Sector
Select Telecommunications Portfolio
Select Wireless Portfolio
Annual Report
February 28, 2007
(2_fidelity_logos) (Registered_Trademark)
Contents
Chairman's Message | Ned Johnson's message to shareholders. | |
Notes to Shareholders | An explanation of the changes to the fund. | |
Telecommunications | Performance | |
Management's Discussion | ||
Shareholder Expense Example | ||
Investment Changes | ||
Investments | ||
Financial Statements | ||
Notes to the Financial Statements | ||
Wireless | Performance | |
Management's Discussion | ||
Shareholder Expense Example | ||
Investment Changes | ||
Investments | ||
Financial Statements | ||
Notes to the Financial Statements | ||
Report of Independent Registered Public Accounting Firm | ||
Trustees and Officers | ||
Distributions | ||
Proxy Voting Results | ||
To view a fund's proxy voting guidelines and proxy voting record for the 12-month period ended June 30, visit www.fidelity.com/proxyvotingresults or visit the Securities and Exchange Commission's (SEC) web site at www.sec.gov. You may also call 1-800-544-8544 to request a free copy of the proxy voting guidelines.
Standard & Poor's, S&P and S&P 500 are registered service marks of The McGraw-Hill Companies, Inc. and have been licensed for use by Fidelity Distributors Corporation.
Other third party marks appearing herein are the property of their respective owners.
All other marks appearing herein are registered or unregistered trademarks or service marks of FMR Corp. or an affiliated company.
This report and the financial statements contained herein are submitted for the general information of the shareholders of the funds. This report is not authorized for distribution to prospective investors in the funds unless preceded or accompanied by an effective prospectus.
A fund files its complete schedule of portfolio holdings with the SEC for the first and third quarters of each fiscal year on Form N-Q. Forms N-Q are available on the SEC's web site at http://www.sec.gov. A fund's Forms N-Q may be reviewed and copied at the SEC's Public Reference Room in Washington, DC. Information regarding the operation of the SEC's Public Reference Room may be obtained by calling 1-800-SEC-0330. For a complete list of a fund's portfolio holdings, view the most recent quarterly holdings report, semiannual report, or annual report on Fidelity's web site at http://www.fidelity.com/holdings.
NOT FDIC INSURED · MAY LOSE VALUE · NO BANK GUARANTEE
Neither the funds nor Fidelity Distributors Corporation is a bank.
Annual Report
Chairman's Message
(Photograph of Edward C. Johnson 3d.)
Dear Shareholder:
Substantial single-day losses are not uncommon in the equity markets, and when they occur - as in late February - investors can be better served in the long term by buying good stocks at lower prices than by moving their money to the sidelines. While financial markets are always unpredictable, there are a number of time-tested principles that can put the historical odds in your favor.
One of the basic tenets is to invest for the long term. Over time, riding out the markets' inevitable ups and downs has proven much more effective than selling into panic or chasing the hottest trend. Even missing only a few of the markets' best days can significantly diminish investor returns. Patience also affords the benefits of compounding - of earning interest on additional income or reinvested dividends and capital gains. There are tax advantages and cost benefits to consider as well. The more you sell, the more taxes you pay, and the more you trade, the higher the costs. While staying the course doesn't eliminate risk, it can considerably lessen the effect of short-term declines.
You can further manage your investing risk through diversification. And today, more than ever, geographic diversification should be taken into account. Studies
indicate that asset allocation is the single most important determinant of a portfolio's long-term success. The right mix of stocks, bonds and cash - aligned to your particular risk tolerance and investment objective - is very important. Age-appropriate rebalancing is also an essential aspect of asset allocation. For younger investors, an emphasis on equities - which historically have been the best performing asset class over time - is encouraged. As investors near their specific goal, such as retirement or sending a child to college, consideration may be given to replacing volatile assets (e.g. common stocks) with more-stable fixed investments (bonds or savings plans).
A third investment principle - investing regularly - can help lower the average cost of your purchases. Investing a certain amount of money each month or quarter helps ensure you won't pay for all your shares at market highs. This strategy - known as dollar cost averaging - also reduces unconstructive "emotion" from investing, helping shareholders avoid selling weak performers just prior to an upswing, or chasing a hot performer just before a correction.
We invite you to contact us via the Internet, through our Investor Centers or over the phone. It is our privilege to provide you the information you need to make the investments that are right for you.
Sincerely,
/s/Edward C. Johnson 3d
Edward C. Johnson 3d
Annual Report
Notes to Shareholders:
Effective October 1, 2006, Fidelity restructured the Fidelity® Select Portfolios® equity product line. The restructuring aligned the equity funds' investment goals more closely with standard industry classifications and facilitated adoption of more-specific benchmark indexes to evaluate fund performance. As restructured, the equity funds generally align under the 10 sectors in the widely recognized Global Industry Classification Standard (GICS), developed by Standard & Poor's® (S&P®) and Morgan Stanley Capital InternationalSM (MSCI®): Consumer Discretionary, Consumer Staples, Energy, Financials, Health Care, Industrials, Information Technology, Materials, Telecommunications Services and Utilities. Changes to the funds ranged from simply adopting a new supplemental benchmark to, in some cases, changing investment policies and fund names.
For Banking, Communications Equipment (formerly Developing Communications), Construction and Housing, Consumer Discretionary (formerly Consumer Industries), Consumer Staples (formerly Food and Agriculture), Home Finance, Industrials (formerly Cyclical Industries), IT Services (formerly Business Services and Outsourcing) and Materials (formerly Industrial Materials), shareholders approved certain fundamental investment policy changes related to the restructuring at a special meeting of shareholders held September 20, 2006. All the equity funds adopted new benchmark indexes from MSCI, except for Gold (which adopted an S&P/Citigroup index), Natural Gas (which adopted an S&P index) and Natural Resources (which retained its current Goldman Sachs® index). Taken together, the name, policy and benchmark changes will make it easier for investors to distinguish funds in the product line and to evaluate Fidelity Management & Research Company's skill in managing the funds.
The Select equity portfolios also eliminated hourly pricing. The funds now price each business day as of the close of the New York Stock Exchange, normally 4:00 pm Eastern time. The funds also adopted Fidelity's standard fund market timing policy, as described in the funds' current prospectus, and removed the $7.50 fee formerly charged on exchanges made through non-automated channels.
Changes for each fund in the GICS Telecommunications Services Sector are described in detail below.
Telecommunications
The fund is now benchmarked to the MSCI US Investable Market Telecommunications Services Index, generally emphasizing communications services companies and not communications equipment companies.
Wireless
The fund is now benchmarked to the MSCI US Investable Market Telecommunications Services Index.
Annual Report
Select Telecommunications Portfolio
Performance
Average annual total return reflects the change in the value of an investment, assuming reinvestment of Telecommunications' dividend income and capital gains (the profits earned upon the sale of securities that have grown in value) and assuming a constant rate of performance each year. The $10,000 table and the fund's returns do not reflect the deduction of taxes that a shareholder would pay on fund distributions or the redemption of fund shares. During periods of reimbursement by Fidelity, a fund's total returns will be greater than it would be had the reimbursement not occurred. How a fund did yesterday is no guarantee of how it will do tomorrow.
Average Annual Total Returns
Periods ended February 28, 2007 | Past 1 | Past 5 | Past 10 |
Telecommunications | 22.69% | 11.55% | 6.70% |
$10,000 Over 10 Years
Let's say hypothetically that $10,000 was invested in Telecommunications on February 28, 1997. The chart shows how the value of your investment would have changed, and also shows how the S&P 500® Index performed over the same period.
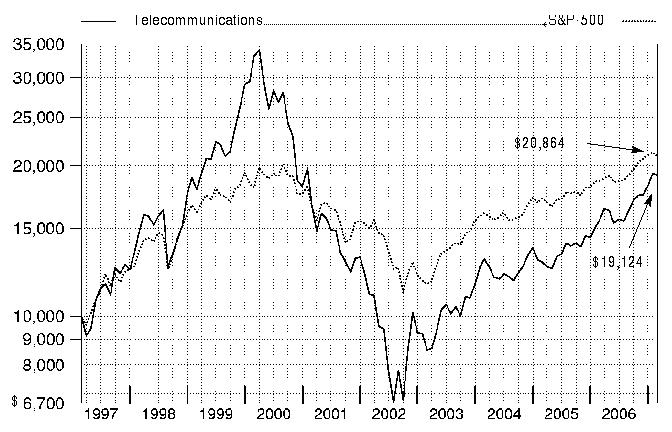
Annual Report
Select Telecommunications Portfolio
Management's Discussion of Fund Performance
Comments from Brian Younger, Portfolio Manager of Fidelity® Select Telecommunications Portfolio during the period covered by this report
A rosy year for stocks wilted just prior to the end of the 12-month period ending February 28, 2007. On the day prior to the period's close, the Dow Jones Industrial AverageSM plunged 416 points and the Standard & Poor's 500SM Index lost roughly 3.5% of its value, plummeting nearly 50 points and marking the benchmark's worst single-day performance since the day the market reopened after the 9/11 terrorist attacks. Though investors were obviously rattled by the development, it was only the 22nd biggest decline for the S&P 500® in 20 years, and it could not overshadow how well stocks performed for the 12 months overall. For much of the past year, investors grew confident that the economy would not fall into a recession, and they bid up most broad-based stock indexes for six consecutive months from August through January. Overall for the year ending February 28, 2007, the S&P 500 was up 11.97%, the Dow advanced 14.24%, the small-cap Russell 2000® Index gained 9.87% and the NASDAQ Composite® Index rose 6.66%.
During the past 12 months, Telecommunications returned 22.69%, trailing the 27.72% gain of the Morgan Stanley Capital InternationalSM (MSCI ®) US Investable Market Telecommunications Services Index, but beating the 21.44% return of a blended index specific to this fund. This blended index is a combination of the Goldman Sachs® Utilities Index, which the fund was compared with through September, and the new MSCI benchmark mentioned above, which the fund was compared with during the period's final five months.1 For the 12-month period, the fund also did better than the S&P 500. During the first seven months of the review period, the fund outpaced the Goldman Sachs index, driven by an overweighting and strong stock selection among integrated telecommunications services stocks. Of note were Qwest Communications and AT&T. Qwest benefited from improved pricing in its residential wireline business, while recent merger activity drove AT&T's earnings beyond expectations. Communications equipment stocks, which had virtually no representation in the index but were a sizable stake in the fund, hurt performance as intense competition pressured industry pricing. Detractors included QUALCOMM, which provides leading-edge technology for wireless networks, and Nortel Networks, which supplies both wireline and wireless equipment. The fund performed roughly in line with the MSCI index during the last five months of the period, with its biggest gains coming from alternative carriers, which compete with the well-known incumbents. An overweighting and strong security selection in the industry boosted returns. Winners included Cogent Communications and Iliad, both of which enjoyed strong market share gains. Cogent supplies high-speed Internet services, and non-index holding Iliad, a French company, sells voice and high-speed data services mainly to residential customers in Paris. Disappointing stock selection in integrated telecommunications services - which represented on average more than 50% of the fund's assets, versus nearly 75% for the MSCI index - cost the fund. Detractors included Qwest Communications, which took a breather after its earlier run-up, and AT&T, which rallied on strong earnings and revenue growth. The fund had an underweighting in AT&T and an overweighting in Qwest. By period end, I had completely eliminated equipment stocks to bring the fund in line with its new benchmark.
1 The fund's blended index is a customized index developed by Fidelity for the limited purpose of discussing the fund's performance for the 12-month period ending February 28, 2007. From March 1, 2006, through September 30, 2006, the fund compared its performance to the Goldman Sachs Utilities Index, which returned 8.34% during that period. On October 1, 2006, the fund began comparing its performance to a different index, the MSCI US Investable Market Telecommunications Services Index, which returned 12.09% from October 1, 2006, through February 28, 2007. For the 12-month period ending February 28, 2007, the blended index (Goldman Sachs and MSCI) returned 21.44%.
Note to shareholders: Gavin Baker will become manager of the fund on March 1, 2007.
The views expressed above reflect those of the portfolio manager(s) only through the end of the period as stated on the cover of this report and do not necessarily represent the views of Fidelity or any other person in the Fidelity organization. Any such views are subject to change at any time based upon market or other conditions and Fidelity disclaims any responsibility to update such views. These views may not be relied on as investment advice and, because investment decisions for a Fidelity fund are based on numerous factors, may not be relied on as an indication of trading intent on behalf of any Fidelity fund.
Annual Report
Select Telecommunications Portfolio
Shareholder Expense Example
As a shareholder of the Fund, you incur two types of costs: (1) transaction costs, including sales charges (loads) on purchase payments or redemption proceeds, redemption fees, exchange fees, and (2) ongoing costs, including management fees, distribution and/or service (12b-1) fees and other Fund expenses. This Example is intended to help you understand your ongoing costs (in dollars) of investing in the Fund and to compare these costs with the ongoing costs of investing in other mutual funds.
The actual Example is based on an investment of $1,000 at the beginning of the period and held for the entire period (September 1, 2006 to February 28, 2007) for the Telecommunications class and for the entire period (December 12, 2006 to February 28, 2007) for Class A, Class T, Class B, Class C and Institutional Class. The hypothetical expense Example is based on an investment of $1,000 invested for the one-half year period (September 1, 2006 to February 28, 2007).
Actual Expenses
The first line of the accompanying table for each class of the Fund provides information about actual account values and actual expenses. You may use the information in this line, together with the amount you invested, to estimate the expenses that you paid over the period. Simply divide your account value by $1,000.00 (for example, an $8,600 account value divided by $1,000.00 = 8.6), then multiply the result by the number in the first line for a class of the Fund under the heading entitled "Expenses Paid During Period" to estimate the expenses you paid on your account during this period. A small balance maintenance fee of $12.00 that is charged once a year may apply for certain accounts with a value of less than $2,000. This fee is not included in the table below. If it was, the estimate of expenses you paid during the period would be higher, and your ending account value lower, by this amount.
Hypothetical Example for Comparison Purposes
The second line of the accompanying table for each class of the Fund provides information about hypothetical account values and hypothetical expenses based on a Class' actual expense ratio and an assumed rate of return of 5% per year before expenses, which is not the Class' actual return. The hypothetical account values and expenses may not be used to estimate the actual ending account balance or expenses you paid for the period. You may use this information to compare the ongoing costs of investing in the Fund and other funds. To do so, compare this 5% hypothetical example with the 5% hypothetical examples that appear in the shareholder reports of the other funds. A small balance maintenance fee of $12.00 that is charged once a year may apply for certain accounts with a value of less than $2,000. This fee is not included in the table below. If it was, the estimate of expenses you paid during the period would be higher, and your ending account value lower, by this amount.
Please note that the expenses shown in the table are meant to highlight your ongoing costs only and do not reflect any transaction costs. Therefore, the second line of the table is useful in comparing ongoing costs only, and will not help you determine the relative total costs of owning different funds. In addition, if these transactional costs were included, your costs would have been higher.
Beginning | Ending | Expenses Paid | |
Class A | |||
Actual | $ 1,000.00 | $ 1,066.00 | $ 2.75B |
HypotheticalA | $ 1,000.00 | $ 1,018.70 | $ 6.16C |
Class T | |||
Actual | $ 1,000.00 | $ 1,065.40 | $ 3.44B |
HypotheticalA | $ 1,000.00 | $ 1,017.16 | $ 7.70C |
Class B | |||
Actual | $ 1,000.00 | $ 1,064.10 | $ 4.58B |
HypotheticalA | $ 1,000.00 | $ 1,014.63 | $ 10.24C |
Class C | |||
Actual | $ 1,000.00 | $ 1,064.30 | $ 4.62B |
HypotheticalA | $ 1,000.00 | $ 1,014.53 | $ 10.34C |
Telecommunications | |||
Actual | $ 1,000.00 | $ 1,172.20 | $ 5.01B |
HypotheticalA | $ 1,000.00 | $ 1,020.18 | $ 4.66C |
Institutional Class | |||
Actual | $ 1,000.00 | $ 1,066.40 | $ 2.19B |
HypotheticalA | $ 1,000.00 | $ 1,019.93 | $ 4.91C |
A 5% return per year before expenses
B Actual expenses are equal to each Class' annualized expense ratio (shown in the table below); multiplied by the average account value over the period, multiplied by 181/365 (to reflect the one-half year period) for the Telecommunications class and multiplied by 79/365 (to reflect the period December 12, 2006 to February 28, 2007) for Class A, Class T, Class B, Class C and Institutional Class.
C Hypothetical expenses are equal to each Class' annualized expense ratio (shown in the table below); multiplied by the average account value over the period, multiplied by 181/365 (to reflect the one-half year period).
Annualized | |
Class A | 1.23% |
Class T | 1.54% |
Class B | 2.05% |
Class C | 2.07% |
Telecommunications | .93% |
Institutional Class | .98% |
Annual Report
Select Telecommunications Portfolio
Investment Changes
Top Ten Stocks as of February 28, 2007 | ||
% of fund's | % of fund's net assets | |
AT&T, Inc. | 17.5 | 15.2 |
Verizon Communications, Inc. | 14.6 | 11.6 |
Qwest Communications International, Inc. | 9.8 | 14.7 |
ALLTEL Corp. | 5.0 | 4.3 |
Iliad Group SA | 4.9 | 0.0 |
Dobson Communications Corp. Class A | 4.8 | 0.8 |
Leap Wireless International, Inc. | 4.6 | 0.5 |
Time Warner Telecom, Inc. Class A (sub. vtg.) | 4.5 | 2.0 |
SBA Communications Corp. Class A | 4.5 | 0.0 |
Level 3 Communications, Inc. | 4.5 | 3.1 |
74.7 | ||
Top Industries (% of fund's net assets) | |||
As of February 28, 2007 | |||
| Diversified Telecommunication Services | 65.1% | |
 | Wireless Telecommunication Services | 30.7% | |
 | Diversified Financial Services | 1.4% | |
| Electronic Equipment & Instruments | 0.0% | |
| All Others* | 2.8% | |

As of August 31, 2006 | |||
| Diversified Telecommunication Services | 55.5% | |
| Communications Equipment | 29.4% | |
 | Wireless Telecommunication Services | 12.0% | |
| All Others* | 3.1% | |

* Includes short-term investments and net other assets. |
Annual Report
Select Telecommunications Portfolio
Investments February 28, 2007
Showing Percentage of Net Assets
Common Stocks - 97.2% | |||
Shares | Value | ||
DIVERSIFIED FINANCIAL SERVICES - 1.4% | |||
Specialized Finance - 1.4% | |||
Fortress Investment Group LLC | 281,700 | $ 8,507,340 | |
DIVERSIFIED TELECOMMUNICATION SERVICES - 65.1% | |||
Alternative Carriers - 16.5% | |||
Cogent Communications Group, Inc. (a) | 472,208 | 10,653,012 | |
Global Crossing Ltd. (a) | 199,200 | 5,663,256 | |
Iliad Group SA (d) | 290,500 | 30,531,683 | |
Level 3 Communications, Inc. (a)(d) | 4,283,664 | 28,143,672 | |
Time Warner Telecom, Inc. Class A (sub. vtg.) (a) | 1,292,200 | 28,441,322 | |
103,432,945 | |||
Integrated Telecommunication Services - 48.6% | |||
AT&T, Inc. | 2,985,702 | 109,873,835 | |
BT Group PLC | 1,094,800 | 6,358,598 | |
Cbeyond, Inc. | 5,300 | 164,671 | |
FairPoint Communications, Inc. | 289,000 | 5,519,900 | |
NeuStar, Inc. Class A (a) | 213,900 | 6,844,800 | |
NTELOS Holding Corp. | 796,868 | 14,877,526 | |
Qwest Communications International, Inc. (a)(d) | 6,892,344 | 61,204,015 | |
Telefonica SA sponsored ADR | 101,500 | 6,534,570 | |
Verizon Communications, Inc. | 2,435,924 | 91,176,635 | |
Windstream Corp. | 109,708 | 1,651,105 | |
304,205,655 | |||
TOTAL DIVERSIFIED TELECOMMUNICATION | 407,638,600 | ||
ELECTRONIC EQUIPMENT & INSTRUMENTS - 0.0% | |||
Electronic Manufacturing Services - 0.0% | |||
Trimble Navigation Ltd. (a) | 8,940 | 236,552 | |
WIRELESS TELECOMMUNICATION SERVICES - 30.7% | |||
Wireless Telecommunication Services - 30.7% | |||
ALLTEL Corp. | 518,900 | 31,440,151 | |
American Tower Corp. Class A (a) | 710,000 | 27,505,400 | |
Bharti Airtel Ltd. (a) | 660,000 | 10,815,295 | |
Centennial Communications Corp. Class A | 294,900 | 2,323,812 | |
Shares | Value | ||
Crown Castle International Corp. (a) | 813,800 | $ 26,660,088 | |
Dobson Communications Corp. Class A | 3,418,300 | 30,354,504 | |
InPhonic, Inc. (a)(d) | 76,500 | 950,895 | |
Leap Wireless International, Inc. (a) | 422,414 | 28,542,514 | |
Rural Cellular Corp. Class A (a) | 168,700 | 2,198,161 | |
SBA Communications Corp. Class A (a) | 1,049,000 | 28,291,530 | |
Vodafone Group PLC sponsored ADR | 122,700 | 3,423,330 | |
192,505,680 | |||
TOTAL COMMON STOCKS (Cost $516,438,124) | 608,888,172 | ||
Money Market Funds - 9.3% | |||
Fidelity Cash Central Fund, 5.35% (b) | 3,550,096 | 3,550,096 | |
Fidelity Securities Lending Cash Central Fund, 5.34% (b)(c) | 54,414,050 | 54,414,050 | |
TOTAL MONEY MARKET FUNDS (Cost $57,964,146) | 57,964,146 | ||
TOTAL INVESTMENT PORTFOLIO - 106.5% (Cost $574,402,270) | 666,852,318 | ||
NET OTHER ASSETS - (6.5)% | (40,470,502) | ||
NET ASSETS - 100% | $ 626,381,816 | ||
Legend |
(a) Non-income producing |
(b) Affiliated fund that is available only to investment companies and other accounts managed by Fidelity Investments. The rate quoted is the annualized seven-day yield of the fund at period end. A complete unaudited listing of the fund's holdings as of its most recent quarter end is available upon request. |
(c) Investment made with cash collateral received from securities on loan. |
(d) Security or a portion of the security is on loan at period end. |
Affiliated Central Funds |
Information regarding fiscal year to date income earned by the Fund from investments in Fidelity Central Funds is as follows: |
Fund | Income earned |
Fidelity Cash Central Fund | $ 599,879 |
Fidelity Securities Lending Cash Central Fund | 208,152 |
Total | $ 808,031 |
Other Information |
Distribution of investments by country of issue, as a percentage of total net assets, is as follows: |
United States of America | 90.0% |
France | 4.9% |
India | 1.7% |
United Kingdom | 1.5% |
Spain | 1.0% |
Others (individually less than 1%) | 0.9% |
100.0% |
Income Tax Information |
At February 28, 2007, the fund had a capital loss carryforward of approximately $495,069,450 of which $321,438,292, $161,866,685 and $11,764,473 will expire on February 28, 2010, 2011 and February 29, 2012, respectively. |
See accompanying notes which are an integral part of the financial statements.
Annual Report
Select Telecommunications Portfolio
Financial Statements
Statement of Assets and Liabilities
February 28, 2007 | ||
Assets | ||
Investment in securities, at value (including securities loaned of $53,537,450) - See accompanying schedule: Unaffiliated issuers (cost $516,438,124) | $ 608,888,172 | |
Fidelity Central Funds (cost $57,964,146) | 57,964,146 | |
Total Investments (cost $574,402,270) | $ 666,852,318 | |
Receivable for investments sold | 16,144,628 | |
Receivable for fund shares sold | 2,247,368 | |
Dividends receivable | 64,863 | |
Distributions receivable from Fidelity Central Funds | 71,935 | |
Prepaid expenses | 1,607 | |
Other receivables | 18,974 | |
Total assets | 685,401,693 | |
Liabilities | ||
Payable for investments purchased | $ 461,351 | |
Payable for fund shares redeemed | 3,431,023 | |
Accrued management fee | 291,823 | |
Distribution fees payable | 687 | |
Other affiliated payables | 150,185 | |
Other payables and accrued expenses | 270,758 | |
Collateral on securities loaned, at value | 54,414,050 | |
Total liabilities | 59,019,877 | |
Net Assets | $ 626,381,816 | |
Net Assets consist of: | ||
Paid in capital | $ 1,030,874,491 | |
Undistributed net investment income | 1,385,280 | |
Accumulated undistributed net realized gain (loss) on investments and foreign currency transactions | (498,119,362) | |
Net unrealized appreciation (depreciation) on investments | 92,241,407 | |
Net Assets | $ 626,381,816 | |
February 28, 2007 | ||
Calculation of Maximum Offering Price Class A: | $ 50.89 | |
Maximum offering price per share (100/94.25 of $50.89) | $ 53.99 | |
Class T: | $ 50.86 | |
Maximum offering price per share (100/96.50 of $50.86) | $ 52.70 | |
Class B: | $ 50.80 | |
Class C: | $ 50.81 | |
Telecommunications: | $ 50.91 | |
Institutional Class: | $ 50.91 | |
A Redemption price per share is equal to net asset value less any applicable contingent deferred sales charge.
See accompanying notes which are an integral part of the financial statements.
Annual Report
Select Telecommunications Portfolio
Financial Statements - continued
Statement of Operations
Year ended February 28, 2007 | ||
Investment Income | ||
Dividends | $ 9,195,804 | |
Special dividends | 1,230,657 | |
Interest | 137 | |
Income from Fidelity Central Funds | 808,031 | |
Total income | 11,234,629 | |
Expenses | ||
Management fee | $ 2,765,966 | |
Transfer agent fees | 1,520,519 | |
Distribution fees | 1,168 | |
Accounting and security lending fees | 225,781 | |
Custodian fees and expenses | 36,123 | |
Independent trustees' compensation | 1,860 | |
Registration fees | 150,014 | |
Audit | 40,413 | |
Legal | 8,851 | |
Interest | 15,851 | |
Miscellaneous | 34,145 | |
Total expenses before reductions | 4,800,691 | |
Expense reductions | (101,322) | 4,699,369 |
Net investment income (loss) | 6,535,260 | |
Realized and Unrealized Gain (Loss) Net realized gain (loss) on: | ||
Investment securities: | ||
Unaffiliated issuers (net of foreign taxes of $101,904) | 31,904,030 | |
Foreign currency transactions | (25,988) | |
Total net realized gain (loss) | 31,878,042 | |
Change in net unrealized appreciation (depreciation) on investment securities (net of increase in deferred foreign taxes of $208,641) | 54,610,776 | |
Net gain (loss) | 86,488,818 | |
Net increase (decrease) in net assets resulting from operations | $ 93,024,078 | |
Statement of Changes in Net Assets
Year ended | Year ended | |
Increase (Decrease) in Net Assets | ||
Operations | ||
Net investment income (loss) | $ 6,535,260 | $ 3,338,999 |
Net realized gain (loss) | 31,878,042 | 55,407,188 |
Change in net unrealized appreciation (depreciation) | 54,610,776 | 10,244,776 |
Net increase (decrease) in net assets resulting from operations | 93,024,078 | 68,990,963 |
Distributions to shareholders from net investment income | (5,987,382) | (3,005,035) |
Share transactions - net increase (decrease) | 136,866,943 | 2,681,402 |
Redemption fees | 144,270 | 25,069 |
Total increase (decrease) in net assets | 224,047,909 | 68,692,399 |
Net Assets | ||
Beginning of period | 402,333,907 | 333,641,508 |
End of period (including undistributed net investment income of $1,385,280 and undistributed net investment income of $965,295, respectively) | $ 626,381,816 | $ 402,333,907 |
See accompanying notes which are an integral part of the financial statements.
Annual Report
Financial Highlights - Class A
Years ended February 28, | 2007 H |
Selected Per-Share Data | |
Net asset value, beginning of period | $ 47.74 |
Income from Investment Operations | |
Net investment income (loss) E | - J |
Net realized and unrealized gain (loss) | 3.15 |
Total from investment operations | 3.15 |
Redemption fees added to paid in capital E | - J |
Net asset value, end of period | $ 50.89 |
Total Return B, C, D | 6.60% |
Ratios to Average Net Assets F, I | |
Expenses before reductions | 1.23% A |
Expenses net of fee waivers, if any | 1.23% A |
Expenses net of all reductions | 1.22% A |
Net investment income (loss) | (.03)% A |
Supplemental Data | |
Net assets, end of period (000 omitted) | $ 658 |
Portfolio turnover rate G | 162% |
A Annualized B Total returns for periods of less than one year are not annualized. C Total returns would have been lower had certain expenses not been reduced during the periods shown. D Total returns do not include the effect of the sales charges. E Calculated based on average shares outstanding during the period. F Fees and expenses of the underlying Fidelity Central Funds are not included in the Fund's expense ratio. The Fund indirectly bears its proportionate share of the expenses of any underlying Fidelity Central Funds. G Amount does not include the portfolio activity of any underlying Fidelity Central Funds. H For the period December 12, 2006 (commencement of sale of shares) to February 28, 2007. I Expense ratios reflect operating expenses of the class. Expenses before reductions do not reflect amounts reimbursed by the investment adviser or reductions from brokerage service arrangements or other expense offset arrangements and do not represent the amount paid by the class during periods when reimbursements or reductions occur. Expenses net of fee waivers reflect expenses after reimbursement by the investment adviser but prior to reductions from brokerage service arrangements or other expense offset arrangements. Expenses net of all reductions represent the net expenses paid by the class. J Amount represents less than $.01 per share. |
Financial Highlights - Class T
Years ended February 28, | 2007 H |
Selected Per-Share Data | |
Net asset value, beginning of period | $ 47.74 |
Income from Investment Operations | |
Net investment income (loss) E | (.02) |
Net realized and unrealized gain (loss) | 3.14 |
Total from investment operations | 3.12 |
Redemption fees added to paid in capital E | - J |
Net asset value, end of period | $ 50.86 |
Total Return B, C, D | 6.54% |
Ratios to Average Net Assets F, I | |
Expenses before reductions | 1.54% A |
Expenses net of fee waivers, if any | 1.54% A |
Expenses net of all reductions | 1.53% A |
Net investment income (loss) | (.24)% A |
Supplemental Data | |
Net assets, end of period (000 omitted) | $ 560 |
Portfolio turnover rate G | 162% |
A Annualized B Total returns for periods of less than one year are not annualized. C Total returns would have been lower had certain expenses not been reduced during the periods shown. D Total returns do not include the effect of the sales charges. E Calculated based on average shares outstanding during the period. F Fees and expenses of the underlying Fidelity Central Funds are not included in the Fund's expense ratio. The Fund indirectly bears its proportionate share of the expenses of any underlying Fidelity Central Funds. G Amount does not include the portfolio activity of any underlying Fidelity Central Funds. H For the period December 12, 2006 (commencement of sale of shares) to February 28, 2007. I Expense ratios reflect operating expenses of the class. Expenses before reductions do not reflect amounts reimbursed by the investment adviser or reductions from brokerage service arrangements or other expense offset arrangements and do not represent the amount paid by the class during periods when reimbursements or reductions occur. Expenses net of fee waivers reflect expenses after reimbursement by the investment adviser but prior to reductions from brokerage service arrangements or other expense offset arrangements. Expenses net of all reductions represent the net expenses paid by the class. J Amount represents less than $.01 per share. |
See accompanying notes which are an integral part of the financial statements.
Annual Report
Financial Highlights - Class B
Years ended February 28, | 2007 H |
Selected Per-Share Data | |
Net asset value, beginning of period | $ 47.74 |
Income from Investment Operations | |
Net investment income (loss) E | (.05) |
Net realized and unrealized gain (loss) | 3.11 |
Total from investment operations | 3.06 |
Redemption fees added to paid in capital E | - J |
Net asset value, end of period | $ 50.80 |
Total Return B, C, D | 6.41% |
Ratios to Average Net Assets F, I | |
Expenses before reductions | 2.05% A |
Expenses net of fee waivers, if any | 2.05% A |
Expenses net of all reductions | 2.05% A |
Net investment income (loss) | (.49)% A |
Supplemental Data | |
Net assets, end of period (000 omitted) | $ 291 |
Portfolio turnover rate G | 162% |
A Annualized B Total returns for periods of less than one year are not annualized. C Total returns would have been lower had certain expenses not been reduced during the periods shown. D Total returns do not include the effect of the contingent deferred sales charge. E Calculated based on average shares outstanding during the period. F Fees and expenses of the underlying Fidelity Central Funds are not included in the Fund's expense ratio. The Fund indirectly bears its proportionate share of the expenses of any underlying Fidelity Central Funds. G Amount does not include the portfolio activity of any underlying Fidelity Central Funds. H For the period December 12, 2006 (commencement of sale of shares) to February 28, 2007. I Expense ratios reflect operating expenses of the class. Expenses before reductions do not reflect amounts reimbursed by the investment adviser or reductions from brokerage service arrangements or other expense offset arrangements and do not represent the amount paid by the class during periods when reimbursements or reductions occur. Expenses net of fee waivers reflect expenses after reimbursement by the investment adviser but prior to reductions from brokerage service arrangements or other expense offset arrangements. Expenses net of all reductions represent the net expenses paid by the class. J Amount represents less than $.01 per share. |
Financial Highlights - Class C
Years ended February 28, | 2007 H |
Selected Per-Share Data | |
Net asset value, beginning of period | $ 47.74 |
Income from Investment Operations | |
Net investment income (loss) E | (.07) |
Net realized and unrealized gain (loss) | 3.14 |
Total from investment operations | 3.07 |
Redemption fees added to paid in capital E | - J |
Net asset value, end of period | $ 50.81 |
Total Return B, C, D | 6.43% |
Ratios to Average Net Assets F, I | |
Expenses before reductions | 2.07% A |
Expenses net of fee waivers, if any | 2.07% A |
Expenses net of all reductions | 2.06% A |
Net investment income (loss) | (.65)% A |
Supplemental Data | |
Net assets, end of period (000 omitted) | $ 332 |
Portfolio turnover rate G | 162% |
A Annualized B Total returns for periods of less than one year are not annualized. C Total returns would have been lower had certain expenses not been reduced during the periods shown. D Total returns do not include the effect of the contingent deferred sales charge. E Calculated based on average shares outstanding during the period. F Fees and expenses of the underlying Fidelity Central Funds are not included in the Fund's expense ratio. The Fund indirectly bears its proportionate share of the expenses of any underlying Fidelity Central Funds. G Amount does not include the portfolio activity of any underlying Fidelity Central Funds. H For the period December 12, 2006 (commencement of sale of shares) to February 28, 2007. I Expense ratios reflect operating expenses of the class. Expenses before reductions do not reflect amounts reimbursed by the investment adviser or reductions from brokerage service arrangements or other expense offset arrangements and do not represent the amount paid by the class during periods when reimbursements or reductions occur. Expenses net of fee waivers reflect expenses after reimbursement by the investment adviser but prior to reductions from brokerage service arrangements or other expense offset arrangements. Expenses net of all reductions represent the net expenses paid by the class. J Amount represents less than $.01 per share. |
See accompanying notes which are an integral part of the financial statements.
Annual Report
Financial Highlights - Telecommunications
Years ended February 28, | 2007 | 2006 | 2005 | 2004 I | 2003 |
Selected Per-Share Data | |||||
Net asset value, beginning of period | $ 41.97 | $ 34.83 | $ 35.79 | $ 23.62 | $ 30.55 |
Income from Investment Operations | |||||
Net investment income (loss) C | .61 F | .36 | .49 G | .08 | .03 |
Net realized and unrealized gain (loss) | 8.85 | 7.11 | (.96) | 12.13 | (6.95) |
Total from investment operations | 9.46 | 7.47 | (.47) | 12.21 | (6.92) |
Distributions from net investment income | (.53) | (.33) | (.49) | (.05) | (.03) |
Redemption fees added to paid in capital C | .01 | - J | - J | .01 | .02 |
Net asset value, end of period | $ 50.91 | $ 41.97 | $ 34.83 | $ 35.79 | $ 23.62 |
Total Return A, B | 22.69% | 21.54% | (1.40)% | 51.78% | (22.60)% |
Ratios to Average Net Assets D, H | |||||
Expenses before reductions | .99% | 1.05% | 1.09% | 1.40% | 1.56% |
Expenses net of fee waivers, if any | .97% | 1.05% | 1.09% | 1.40% | 1.56% |
Expenses net of all reductions | .97% | .96% | 1.02% | 1.34% | 1.34% |
Net investment income (loss) | 1.34% F | .96% | 1.44% G | .27% | .13% |
Supplemental Data | |||||
Net assets, end of period (000 omitted) | $ 624,427 | $ 402,334 | $ 333,642 | $ 439,350 | $ 312,839 |
Portfolio turnover rate E | 162% | 148% | 56% | 98% | 163% |
A Total returns would have been lower had certain expenses not been reduced during the periods shown. B Total returns do not include the effect of the former sales charges. C Calculated based on average shares outstanding during the period. D Fees and expenses of the underlying Fidelity Central Funds are not included in the Fund's expense ratio. The Fund indirectly bears its proportionate share of the expenses of any underlying Fidelity Central Funds. E Amount does not include the portfolio activity of any underlying Fidelity Central Funds. F Investment income per share reflects a special dividend which amounted to $.11 per share. Excluding the special dividend, the ratio of net investment income (loss) to average net assets would have been 1.09%. G Investment income per share reflects a special dividend which amounted to $.26 per share. Excluding the special dividend, the ratio of net investment income (loss) to average net assets would have been ..68%. H Expense ratios reflect operating expenses of the class. Expenses before reductions do not reflect amounts reimbursed by the investment adviser or reductions from brokerage service arrangements or other expense offset arrangements and do not represent the amount paid by the class during periods when reimbursements or reductions occur. Expenses net of fee waivers reflect expenses after reimbursement by the investment adviser but prior to reductions from brokerage service arrangements or other expense offset arrangements. Expenses net of all reductions represent the net expenses paid by the class. I For the year ended February 29. J Amount represents less than $.01 per share. |
Financial Highlights - Institutional Class
Years ended February 28, | 2007 G |
Selected Per-Share Data | |
Net asset value, beginning of period | $ 47.74 |
Income from Investment Operations | |
Net investment income (loss) D | .16 |
Net realized and unrealized gain (loss) | 3.01 |
Total from investment operations | 3.17 |
Redemption fees added to paid in capital D | - I |
Net asset value, end of period | $ 50.91 |
Total Return B, C | 6.64% |
Ratios to Average Net Assets E, H | |
Expenses before reductions | .98% A |
Expenses net of fee waivers, if any | .98% A |
Expenses net of all reductions | .97% A |
Net investment income (loss) | 1.52% A |
Supplemental Data | |
Net assets, end of period (000 omitted) | $ 114 |
Portfolio turnover rate F | 162% |
A Annualized B Total returns for periods of less than one year are not annualized. C Total returns would have been lower had certain expenses not been reduced during the periods shown. D Calculated based on average shares outstanding during the period. E Fees and expenses of the underlying Fidelity Central Funds are not included in the Fund's expense ratio. The Fund indirectly bears its proportionate share of the expenses of any underlying Fidelity Central Funds. F Amount does not include the portfolio activity of any underlying Fidelity Central Funds. G For the period December 12, 2006 (commencement of sale of shares) to February 28, 2007. H Expense ratios reflect operating expenses of the class. Expenses before reductions do not reflect amounts reimbursed by the investment adviser or reductions from brokerage service arrangements or other expense offset arrangements and do not represent the amount paid by the class during periods when reimbursements or reductions occur. Expenses net of fee waivers reflect expenses after reimbursement by the investment adviser but prior to reductions from brokerage service arrangements or other expense offset arrangements. Expenses net of all reductions represent the net expenses paid by the class. I Amount represents less than $.01 per share. |
See accompanying notes which are an integral part of the financial statements.
Annual Report
Notes to Financial Statements
For the period ended February 28, 2007
1. Organization.
Telecommunications Portfolio (the Fund) is a non-diversified fund of Fidelity Select Portfolios (the trust) and is authorized to issue an unlimited number of shares. The trust is registered under the Investment Company Act of 1940, as amended (the 1940 Act), as an open-end management investment company organized as a Massachusetts business trust. The Fund invests primarily in securities of companies whose principal business activities fall within specific industries. The Fund offers Class A, Class T, Class B, Class C, Telecommunications, and Institutional Class shares, each of which has equal rights as to assets and voting privileges. Each class has exclusive voting rights with respect to matters that affect that class. The Fund commenced sale of Class A, Class T, Class B, Class C and Institutional Class shares and the existing class was designated Telecommunications on December 12, 2006. Class B shares will automatically convert to Class A shares after a holding period of seven years from the initial date of purchase. Investment income, realized and unrealized capital gains and losses, the common expenses of the Fund, and certain fund-level expense reductions, if any, are allocated on a pro rata basis to each class based on the relative net assets of each class to the total net assets of the Fund. Each class differs with respect to transfer agent and distribution and service plan fees incurred. Certain expense reductions also differ by class. The financial statements have been prepared in conformity with accounting principles generally accepted in the United States of America, which require management to make certain estimates and assumptions at the date of the financial statements.
2. Investments in Fidelity Central Funds.
The Fund may invest in Fidelity Central Funds which are open-end investment companies available only to other investment companies and accounts managed by FMR and its affiliates. The Fund's Schedule of Investments lists each of the Fidelity Central Funds as an investment of the Fund but does not include the underlying holdings of each Fidelity Central Fund. As an Investing Fund, the Fund indirectly bears its proportionate share of the expenses of the underlying Fidelity Central Funds. A complete unaudited list of holdings for each Fidelity Central Fund is available upon request. In addition, the financial statements of the Fidelity Central Funds, which are not covered by the Fund's Report of Independent Registered Public Accounting Firm, are available on the EDGAR Database on the SEC's web site, www.sec.gov, or upon request.
The Money Market Central Funds seek preservation of capital and current income and are managed by Fidelity Investments Money Management, Inc. (FIMM) an affiliate of Fidelity Management & Research Company (FMR).
3. Significant Accounting Policies.
The following summarizes the significant accounting policies of the Fund:
Security Valuation. Investments are valued and net asset value (NAV) per share is calculated (NAV calculation) as of the close of business of the New York Stock Exchange (NYSE), normally 4:00 p.m. Eastern time. During the period the Fund also calculated a NAV each hour on the hour (commencing at 10:00 a.m. Eastern time until one hour prior to the close of business on the NYSE). Effective October 1, 2006 the Fund eliminated hourly NAV calculation.
Wherever possible, the Fund uses independent pricing services approved by the Board of Trustees to value its investments. Equity securities, including restricted securities, for which market quotations are readily available, are valued at the last reported sale price or official closing price as reported by an independent pricing service on the primary market or exchange on which they are traded. In the event there were no sales during the day or closing prices are not available, securities are valued at the last quoted bid price. Investments in open-end mutual funds, including the Fidelity Central Funds, are valued at their closing net asset value each business day. Short-term securities with remaining maturities of sixty days or less for which quotations are not readily available are valued at amortized cost, which approximates value.
When current market prices or quotations are not readily available or do not accurately reflect fair value, valuations may be determined in accordance with procedures adopted by the Board of Trustees. For example, when developments occur between the close of a market and the close of the NYSE that may materially affect the value of some or all of the securities, or when trading in a security is halted, those securities may be fair valued. Factors used in the determination of fair value may include monitoring news to identify significant market or security specific events such as changes in the value of U.S. securities markets, reviewing developments in foreign markets and evaluating the performance of ADRs, futures contracts and exchange-traded funds. Because the Fund's utilization of fair value pricing depends on market activity, the frequency with which fair value pricing is used cannot be predicted and may be utilized to a significant extent. The value of securities used for NAV calculation under fair value pricing may differ from published prices for the same securities.
Foreign Currency. The Fund uses foreign currency contracts to facilitate transactions in foreign-denominated securities. Losses from these transactions may arise from changes in the value of the foreign currency or if the counterparties do not perform under the contracts' terms.
Foreign-denominated assets, including investment securities, and liabilities are translated into U.S. dollars at the exchange rate at period end. Purchases and sales of investment securities, income and dividends received and expenses denominated in foreign currencies are translated into U.S. dollars at the exchange rate in effect on the transaction date.
Annual Report
3. Significant Accounting Policies - continued
Foreign Currency - continued
The effects of exchange rate fluctuations on investments are included with the net realized and unrealized gain (loss) on investment securities. Other foreign currency transactions resulting in realized and unrealized gain (loss) are disclosed separately.
Investment Transactions and Income. For financial reporting purposes, the Fund's investment holdings and NAV include trades executed through the end of the last business day of the period. The NAV for processing shareholder transactions includes trades executed through the end of the prior business day. Gains and losses on securities sold are determined on the basis of identified cost and may include proceeds received from litigation. Dividend income is recorded on the ex-dividend date, except for certain dividends from foreign securities where the ex-dividend date may have passed, which are recorded as soon as the Fund is informed of the ex-dividend date. Non-cash dividends included in dividend income, if any, are recorded at the fair market value of the securities received. Distributions received on securities that represent a return of capital or capital gain are recorded as a reduction of cost of investments and/or as a realized gain. The Fund estimates the components of distributions received that may be considered return of capital distributions or capital gain distributions. Large, non-recurring dividends recognized by the Fund are presented separately on the Statement of Operations as "Special Dividends" and the impact of these dividends is presented in the Financial Highlights. Interest income and distributions from the Fidelity Central Funds are accrued as earned, with any distributions receivable as of period end included in Distributions receivable from Fidelity Central Funds on the Statement of Assets and Liabilities. Interest income includes coupon interest and amortization of premium and accretion of discount on debt securities. Investment income is recorded net of foreign taxes withheld where recovery of such taxes is uncertain.
Expenses. Most expenses of the trust can be directly attributed to a fund. Expenses which cannot be directly attributed are apportioned among each Fund in the trust. Expense estimates are accrued in the period to which they relate and adjustments are made when actual amounts are known.
Income Tax Information and Distributions to Shareholders. Each year, the Fund intends to qualify as a regulated investment company by distributing all of its taxable income and realized gains under Subchapter M of the Internal Revenue Code. As a result, no provision for income taxes is required in the accompanying financial statements. Foreign taxes are provided for based on the Fund's understanding of the tax rules and rates that exist in the foreign markets in which it invests.
Distributions are recorded on the ex-dividend date. Income dividends and capital gain distributions are declared separately for each class. Income and capital gain distributions are determined in accordance with income tax regulations, which may differ from generally accepted accounting principles.
Capital accounts within the financial statements are adjusted for permanent book-tax differences. These adjustments have no impact on net assets or the results of operations. Temporary book-tax differences will reverse in a subsequent period.
Book-tax differences are primarily due to foreign currency transactions, certain foreign taxes, capital loss carryforwards and losses deferred due to wash sales.
The tax-basis components of distributable earnings and the federal tax cost as of period end were as follows:
Unrealized appreciation | $ 102,069,768 |
Unrealized depreciation | (12,878,269) |
Net unrealized appreciation (depreciation) | 89,191,499 |
Undistributed ordinary income | 1,386,172 |
Capital loss carryforward | (495,069,450) |
Cost for federal income tax purposes | $ 577,660,819 |
The tax character of distributions paid was as follows:
February 28, 2007 | February 28, 2006 | |
Ordinary Income | $ 5,987,382 | $ 3,005,035 |
Trading (Redemption) Fees. Shares in the Fund held less than 30 days are subject to a redemption fee equal to .75% of the net asset value of shares redeemed. All redemption fees, including any estimated redemption fees paid by FMR, are retained by the Fund and accounted for as an addition to paid in capital. Shareholders were also subject to an additional $7.50 fee for shares exchanged into another Fidelity fund (see Note 6).
Annual Report
Notes to Financial Statements - continued
3. Significant Accounting Policies - continued
New Accounting Pronouncements. In July 2006, Financial Accounting Standards Board Interpretation No. 48, Accounting for Uncertainty in Income Taxes - an interpretation of FASB Statement 109 (FIN 48), was issued and is effective on the last business day of the semiannual reporting period for fiscal years beginning after December 15, 2006. FIN 48 sets forth a threshold for financial statement recognition, measurement and disclosure of a tax position taken or expected to be taken on a tax return. Management is currently evaluating the impact, if any, the adoption of FIN 48 will have on the Fund's net assets, results of operations and financial statement disclosures.
In addition, in September 2006, Statement of Financial Accounting Standards No. 157, Fair Value Measurements (SFAS 157), was issued and is effective for fiscal years beginning after November 15, 2007. SFAS 157 defines fair value, establishes a framework for measuring fair value and expands disclosures about fair value measurements. Management is currently evaluating the impact the adoption of SFAS 157 will have on the Fund's financial statement disclosures.
4. Operating Policies.
Repurchase Agreements. FMR has received an Exemptive Order from the Securities and Exchange Commission (the SEC) which permits the Fund and other affiliated entities of FMR to transfer uninvested cash balances into joint trading accounts which are then invested in repurchase agreements. The Fund may also invest directly with institutions in repurchase agreements. Repurchase agreements are collateralized by government or non-government securities. Upon settlement date, collateral is held in segregated accounts with custodian banks and may be obtained in the event of a default of the counterparty. The Fund monitors, on a daily basis, the value of the collateral to ensure it is at least equal to the principal amount of the repurchase agreement (including accrued interest). In the event of a default by the counterparty, realization of the collateral proceeds could be delayed, during which time the value of the collateral may decline.
5. Purchases and Sales of Investments.
Purchases and sales of securities, other than short-term securities, aggregated $915,897,899 and $790,008,297, respectively.
6. Fees and Other Transactions with Affiliates.
Management Fee. FMR and its affiliates provide the Fund with investment management related services for which the Fund pays a monthly management fee. The management fee is the sum of an individual fund fee rate that is based on an annual rate of .30% of the Fund's average net assets and a group fee rate that averaged .26% during the period. The group fee rate is based upon the average net assets of all the mutual funds advised by FMR. The group fee rate decreases as assets under management increase and increases as assets under management decrease. For the period, the total annual management fee rate was .57% of the Fund's average net assets.
Distribution and Service Plan. In accordance with Rule 12b-1 of the 1940 Act, the Fund has adopted separate Distribution and Service Plans for each class of shares. Certain classes pay Fidelity Distributors Corporation (FDC), an affiliate of FMR, separate Distribution and Service Fees, each of which is based on an annual percentage of each class' average net assets. In addition, FDC may pay financial intermediaries for selling shares of the Fund and providing shareholder support services. For the period, the Distribution and Service Fee rates and the total amounts paid to and retained by FDC were as follows:
Distribution | Service | Paid to | Retained | |
Class A | -% | .25% | $ 139 | $ 84 |
Class T | .25% | .25% | 274 | 123 |
Class B | .75% | .25% | 359 | 332 |
Class C | .75% | .25% | 396 | 323 |
$ 1,168 | $ 862 |
Sales Load. FDC receives a front-end sales charge of up to 5.75% for selling Class A shares, and 3.50% for selling Class T shares, some of which is paid to financial intermediaries for selling shares of the Fund. FDC receives the proceeds of contingent deferred sales charges levied on Class A, Class T, Class B, and Class C redemptions. These charges depend on the holding period. The deferred sales charges range from 5% to 1% for Class B, 1% for Class C, 1.00% to .50% for certain purchases of Class A shares and .25% for certain purchases of Class T shares.
For the period, sales charge amounts retained by FDC were as follows:
Retained | |
Class A | $ 564 |
Class T | 104 |
$ 668 |
Annual Report
6. Fees and Other Transactions with Affiliates - continued
Transfer Agent Fees. Fidelity Investments Institutional Operations Company, Inc. (FIIOC), an affiliate of FMR, is the transfer, dividend disbursing and shareholder servicing agent for each class of the Fund, except for Telecommunications. Fidelity Service Company, Inc. (FSC), an affiliate of FMR, is the transfer agent for Telecommunications shares. FIIOC and FSC receive account fees and asset-based fees that vary according to the account size and type of account of the shareholders of the respective classes of the Fund. FIIOC and FSC pay for typesetting, printing and mailing of shareholder reports, except proxy statements. For the period, the total transfer agent fees paid by each class to FIIOC or FSC, were as follows:
Amount | % of | |
Class A | $ 87 | .17 |
Class T | 119 | .23 |
Class B | 73 | .22 |
Class C | 87 | .24 |
Telecommunications | 1,520,066 | .31 |
Institutional Class | 87 | .27 |
$ 1,520,519 |
Accounting and Security Lending Fees. FSC maintains the Fund's accounting records. The accounting fee is based on the level of average net assets for the month. Under a separate contract, FSC administers the security lending program. The security lending fee is based on the number and duration of lending transactions.
Exchange Fees. During the period, FSC received the proceeds of a $7.50 fee to cover administrative costs associated with exchanges out of the Fund to any other Fidelity Select fund or to any other Fidelity fund made through non-automated channels. Effective October 1, 2006, the exchange fees were eliminated. For the period, exchange fees retained by FSC were as follows:
Retained | |
Telecommunications Portfolio | $ 4,433 |
Brokerage Commissions. The Fund placed a portion of its portfolio transactions with brokerage firms which are affiliates of the investment adviser. The commissions paid to these affiliated firms were $40,816 for the period.
Interfund Lending Program. Pursuant to an Exemptive Order issued by the SEC, the Fund, along with other registered investment companies having management contracts with FMR, may participate in an interfund lending program. This program provides an alternative credit facility allowing the funds to borrow from, or lend money to, other participating affiliated funds. At period end, there were no interfund loans outstanding. The Fund's activity in this program during the period for which loans were outstanding was as follows:
Borrower or Lender | Average Daily | Weighted Average | Interest |
Borrower | $ 9,539,417 | 4.98% | $ 15,851 |
7. Committed Line of Credit.
The Fund participates with other funds managed by FMR in a $4.2 billion credit facility (the "line of credit") to be utilized for temporary or emergency purposes to fund shareholder redemptions or for other short-term liquidity purposes. The Fund has agreed to pay commitment fees on its pro rata portion of the line of credit, which amounted to $1,183 and is reflected in Miscellaneous Expense on the Statement of Operations. During the period, there were no borrowings on this line of credit.
Annual Report
Notes to Financial Statements - continued
8. Security Lending.
The Fund lends portfolio securities from time to time in order to earn additional income. On the settlement date of the loan, the Fund receives collateral (in the form of U.S. Treasury obligations, letters of credit and/or cash) against the loaned securities and maintains collateral in an amount not less than 100% of the market value of the loaned securities during the period of the loan. The market value of the loaned securities is determined at the close of business of the Fund and any additional required collateral is delivered to the Fund on the next business day. If the borrower defaults on its obligation to return the securities loaned because of insolvency or other reasons, a fund could experience delays and costs in recovering the securities loaned or in gaining access to the collateral. Any cash collateral received is invested in the Fidelity Securities Lending Cash Central Fund. The value of loaned securities and cash collateral at period end are disclosed on the Fund's Statement of Assets and Liabilities. Security lending income represents the income earned on investing cash collateral, less fees and expenses associated with the loan, plus any premium payments that may be received on the loan of certain types of securities. Security lending income is presented in the Statement of Operations as a component of income from Fidelity Central Funds. Net income from lending portfolio securities during the period amounted to $208,152.
9. Expense Reductions.
FMR voluntarily agreed to reimburse a portion of Telecommunications' operating expenses. During the period, this reimbursement reduced the class' expenses by $56,875.
Many of the brokers with whom FMR places trades on behalf of the Fund provided services to the Fund in addition to trade execution. These services included payments of certain expenses on behalf of the Fund totaling $32,107 for the period. In addition, through arrangements with the each class' transfer agent, credits realized as a result of uninvested cash balances were used to reduce the Fund's expenses. During the period, credits reduced each class' transfer agent expense as noted in the table below.
Transfer Agent | |
Telecommunications | $ 5,774 |
10. Other.
The Fund's organizational documents provide former and current trustees and officers with a limited indemnification against liabilities arising in connection with the performance of their duties to the Fund. In the normal course of business, the Fund may also enter into contracts that provide general indemnifications. The Fund's maximum exposure under these arrangements is unknown as this would be dependent on future claims that may be made against the Fund. The risk of material loss from such claims is considered remote.
The United States Securities and Exchange Commission ("SEC") is conducting an investigation of FMR (covering the years 2002 to 2004) arising from gifts, gratuities and business entertainment provided by certain brokers to certain individuals who were employed on FMR's domestic equity trading desk during that period. FMR is in discussions with the SEC staff regarding the possible resolution of the matter, but as of period-end no final resolution has been reached.
In December 2006, the Independent Trustees completed their own investigation of the matter with the assistance of independent counsel. The Independent Trustees and FMR agree that, despite the absence of proof that the Fidelity mutual funds experienced diminished execution quality as a result of the improper receipt of gifts and business entertainment, the conduct at issue was serious and is worthy of redress. Accordingly, the Independent Trustees have requested and FMR has agreed to pay $42 million to Fidelity mutual funds, plus interest to be determined at the time that payment is made. A method of allocating this payment among the funds has not yet been determined. The total payment to the Fund is not anticipated to have a material impact on the Fund's net assets. In addition, FMR reimbursed related legal expenses which are recorded in the accompanying Statement of Operations as an expense reduction.
11. Distributions to Shareholders.
Distributions to shareholders of each class were as follows:
Years ended February 28, | 2007 | 2006 |
From net investment income | ||
Telecommunications | $ 5,987,382 | $ 3,005,035 |
Annual Report
12. Share Transactions.
Transactions for each class of shares were as follows:
Shares | Dollars | |||
Years ended February 28, | 2007A | 2006 | 2007A | 2006 |
Class A | ||||
Shares sold | 12,932 | - | $ 655,617 | $ - |
Shares redeemed | - | - | - | - |
Net increase (decrease) | 12,932 | - | $ 655,617 | $ - |
Class T | ||||
Shares sold | 11,066 | - | $ 555,092 | $ - |
Shares redeemed | (60) | - | (3,110) | - |
Net increase (decrease) | 11,006 | - | $ 551,982 | $ - |
Class B | ||||
Shares sold | 5,729 | - | $ 285,388 | $ - |
Shares redeemed | - | - | - | - |
Net increase (decrease) | 5,729 | - | $ 285,388 | $ - |
Class C | ||||
Shares sold | 6,538 | - | $ 326,374 | $ - |
Shares redeemed | - | - | - | - |
Net increase (decrease) | 6,538 | - | $ 326,374 | $ - |
Telecommunications | ||||
Shares sold | 12,699,449 | 3,070,553 | $ 581,140,315 | $ 116,810,248 |
Reinvestment of distributions | 124,102 | 74,920 | 5,727,266 | 2,869,866 |
Shares redeemed | (10,144,422) | (3,137,526) | (451,923,224) | (116,998,712) |
Net increase (decrease) | 2,679,129 | 7,947 | $ 134,944,357 | $ 2,681,402 |
Institutional Class | ||||
Shares sold | 3,391 | - | $ 162,500 | $ - |
Shares redeemed | (1,150) | - | (59,275) | - |
Net increase (decrease) | 2,241 | - | $ 103,225 | $ - |
A Share transactions for Class A, Class T, Class B, Class C and Institutional Class are for the period December 12, 2006 (commencement of sale of shares) to February 28, 2007.
Annual Report
Performance
Average annual total return reflects the change in the value of an investment, assuming reinvestment of the fund's dividend income and capital gains (the profits earned upon the sale of securities that have grown in value) and assuming a constant rate of performance each year. The $10,000 table and the fund's returns do not reflect the deduction of taxes that a shareholder would pay on fund distributions or the redemption of fund shares. During periods of reimbursement by Fidelity, a fund's total returns will be greater than it would be had the reimbursement not occurred. How a fund did yesterday is no guarantee of how it will do tomorrow.
Average Annual Total Returns
Periods ended February 28, 2007 | Past 1 | Past 5 | Life of |
Select Wireless Portfolio | 5.16% | 15.52% | -4.21% |
A From September 21, 2000.
$10,000 Over Life of Fund
Let's say hypothetically that $10,000 was invested in Fidelity Select Wireless Portfolio on September 21, 2000, when the fund started. The chart shows how the value of your investment would have changed, and also shows how the S&P 500 Index performed over the same period.
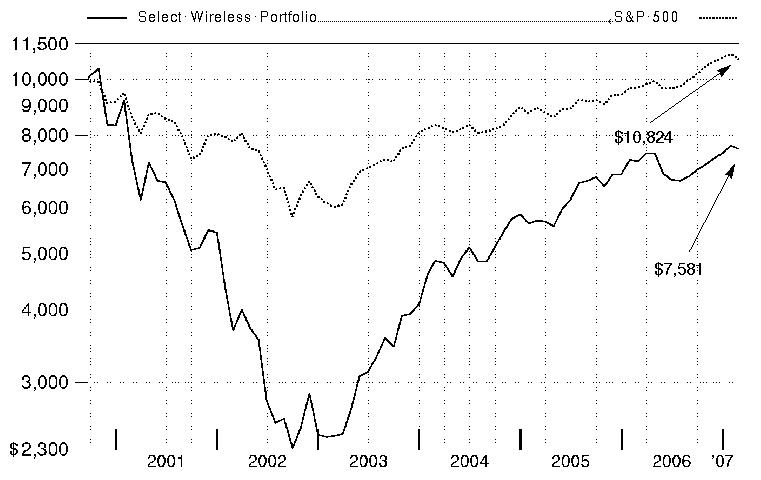
Annual Report
Management's Discussion of Fund Performance
A rosy year for stocks wilted just prior to the end of the 12-month period ending February 28, 2007. On the day prior to the period's close, the Dow Jones Industrial AverageSM plunged 416 points and the Standard & Poor's 500SM Index lost roughly 3.5% of its value, plummeting nearly 50 points and marking the benchmark's worst single-day performance since the day the market reopened after the 9/11 terrorist attacks. Though investors were obviously rattled by the development, it was only the 22nd biggest decline for the S&P 500® in 20 years, and it could not overshadow how well stocks performed for the 12 months overall. For much of the past year, investors grew confident that the economy would not fall into a recession, and they bid up most broad-based stock indexes for six consecutive months from August through January. Overall for the year ending February 28, 2007, the S&P 500 was up 11.97%, the Dow advanced 14.24%, the small-cap Russell 2000® Index gained 9.87% and the NASDAQ Composite® Index rose 6.66%.
The fund returned 5.16% during the past year, lagging both the 27.72% gain of the Morgan Stanley Capital InternationalSM (MSCI®) US Investable Market Telecommunications Services Index and the 21.44% return of a blended index specific to the fund. This blended index is a combination of the Goldman Sachs® Utilities Index, which the fund was compared with through September, and the new MSCI benchmark mentioned above, which the fund was compared with during the period's final five months.1 For the 12-month period, the fund also trailed the S&P 500. The fund fell far behind the Goldman Sachs Utilities Index during the first seven months of the review period as investors avoided higher-risk investments, including wireless stocks. Communications equipment stocks, which have virtually no representation in the index, were the biggest detractors, led by Comverse Technology and QUALCOMM. Comverse, whose software helps run voice mail on wireless devices, declined after an options scandal prompted its CEO to flee the country. QUALCOMM, which provides leading-edge technology for wireless networks, fell amid a pending patent dispute. An underweighting in integrated telecommunications services, which did well, and an overweighting in wireless services, which were weak, further undermined returns relative to the index. Some of these losses were offset by not owning NTL, a British cable company in the index that fell sharply as competition increased. During the last five months of the period, the fund again lagged the MSCI index. Communications equipment stocks, which are not in this index, again hampered returns. Although I reduced the fund's equipment stake, returns were disappointing relative to the index, as investors worried about pricing pressures on the industry. The biggest detractor was Motorola, which sank when investors realized that a successor to its popular RAZR phone was not imminent. A big underweighting in AT&T also proved costly, as the stock rallied on improved revenue and earnings growth. On the upside, Telenor - a Norwegian integrated telecom services provider - posted strong gains, driven by the company's decision to take its wireless services into emerging markets. A sizable underweighting in Verizon Communications, the large U.S. integrated telecom provider, further aided returns, as the stock turned in lackluster results. Motorola and Telenor are not in the MSCI index.
1 The fund's blended index is a customized index developed by Fidelity for the limited purpose of discussing the fund's performance for the 12-month period ending February 28, 2007. From March 1, 2006, through September 30, 2006, the fund compared its performance to the Goldman Sachs Utilities Index, which returned 8.34% during that period. On October 1, 2006, the fund began comparing its performance to a different index, the MSCI US Investable Market Telecommunications Services Index, which returned 12.09% from October 1, 2006, through February 28, 2007. For the 12-month period ending February 28, 2007, the blended index (Goldman Sachs and MSCI) returned 21.44%.
Note to shareholders: Gavin Baker will become manager of the fund on March 1, 2007.
The views expressed above reflect those of the portfolio manager(s) only through the end of the period as stated on the cover of this report and do not necessarily represent the views of Fidelity or any other person in the Fidelity organization. Any such views are subject to change at any time based upon market or other conditions and Fidelity disclaims any responsibility to update such views. These views may not be relied on as investment advice and, because investment decisions for a Fidelity fund are based on numerous factors, may not be relied on as an indication of trading intent on behalf of any Fidelity fund.
Annual Report
As a shareholder of the Fund, you incur two types of costs: (1) transaction costs, including redemption fees, exchange fees, and (2) ongoing costs, including management fees and other Fund expenses. This Example is intended to help you understand your ongoing costs (in dollars) of investing in the Fund and to compare these costs with the ongoing costs of investing in other mutual funds.
The Example is based on an investment of $1,000 invested at the beginning of the period and held for the entire period (September 1, 2006 to February 28, 2007).
Actual Expenses
The first line of the accompanying table provides information about actual account values and actual expenses. You may use the information in this line, together with the amount you invested, to estimate the expenses that you paid over the period. Simply divide your account value by $1,000.00 (for example, an $8,600 account value divided by $1,000.00 = 8.6), then multiply the result by the number in the first line under the heading entitled "Expenses Paid During Period" to estimate the expenses you paid on your account during this period. A small balance maintenance fee of $12.00 that is charged once a year may apply for certain accounts with a value of less than $2,000. This fee is not included in the table below. If it was, the estimate of expenses you paid during the period would be higher, and your ending account value lower, by this amount.
Hypothetical Example for Comparison Purposes
The second line of the accompanying table provides information about hypothetical account values and hypothetical expenses based on the Fund's actual expense ratio and an assumed rate of return of 5% per year before expenses, which is not the Fund's actual return. The hypothetical account values and expenses may not be used to estimate the actual ending account balance or expenses you paid for the period. You may use this information to compare the ongoing costs of investing in the Fund and other funds. To do so, compare this 5% hypothetical example with the 5% hypothetical examples that appear in the shareholder reports of the other funds. A small balance maintenance fee of $12.00 that is charged once a year may apply for certain accounts with a value of less than $2,000. This fee is not included in the table below. If it was, the estimate of expenses you paid during the period would be higher, and your ending account value lower, by this amount.
Please note that the expenses shown in the table are meant to highlight your ongoing costs only and do not reflect any transaction costs. Therefore, the second line of the table is useful in comparing ongoing costs only, and will not help you determine the relative total costs of owning different funds. In addition, if these transactional costs were included, your costs would have been higher.
Beginning | Ending | Expenses Paid | |
Actual | $ 1,000.00 | $ 1,117.60 | $ 5.09 |
Hypothetical (5% return per year before expenses) | $ 1,000.00 | $ 1,019.98 | $ 4.86 |
* Expenses are equal to the Fund's annualized expense ratio of .97%; multiplied by the average account value over the period, multiplied by 181/365 (to reflect the one-half year period).
Annual Report
Investment Changes
Top Ten Stocks as of February 28, 2007 | ||
% of fund's | % of fund's net assets | |
ALLTEL Corp. | 11.7 | 10.0 |
American Tower Corp. Class A | 9.2 | 8.0 |
QUALCOMM, Inc. | 8.7 | 8.7 |
AT&T, Inc. | 7.3 | 4.0 |
Comverse Technology, Inc. | 6.7 | 6.8 |
Crown Castle International Corp. | 5.4 | 3.4 |
Leap Wireless International, Inc. | 5.1 | 3.2 |
Vodafone Group PLC sponsored ADR | 4.9 | 0.0 |
Dobson Communications Corp. Class A | 4.8 | 2.7 |
SBA Communications Corp. | 4.7 | 0.0 |
68.5 | ||
Top Industries (% of fund's net assets) | |||
As of February 28, 2007 | |||
| Wireless Telecommunication Services | 49.7% | |
| Communications Equipment | 26.5% | |
| Diversified Telecommunication Services | 14.5% | |
| Diversified Financial Services | 2.2% | |
| Electronic Equipment & Instruments | 1.6% | |
| All Others * | 5.5% | |

As of August 31, 2006 | |||
| Communications Equipment | 37.7% | |
| Wireless Telecommunication Services | 36.6% | |
| Diversified Telecommunication Services | 17.8% | |
| Electronic Equipment & Instruments | 2.1% | |
| Semiconductors & Semiconductor Equipment | 2.0% | |
| All Others * | 3.8% | |
* Includes short-term investments and net other assets. |
Annual Report
Investments February 28, 2007
Showing Percentage of Net Assets
Common Stocks - 96.2% | |||
Shares | Value | ||
COMMUNICATIONS EQUIPMENT - 26.5% | |||
Communications Equipment - 26.5% | |||
Comverse Technology, Inc. (a) | 853,620 | $ 18,762,568 | |
Harris Corp. | 213,300 | 10,468,764 | |
Motorola, Inc. | 148,880 | 2,757,258 | |
QUALCOMM, Inc. | 604,250 | 24,339,190 | |
Research In Motion Ltd. (a) | 78,900 | 11,094,129 | |
Tekelec (a) | 86,700 | 1,080,282 | |
Telefonaktiebolaget LM Ericsson | 145,500 | 5,203,080 | |
73,705,271 | |||
DIVERSIFIED FINANCIAL SERVICES - 2.2% | |||
Specialized Finance - 2.2% | |||
Fortress Investment Group LLC | 201,200 | 6,076,240 | |
DIVERSIFIED TELECOMMUNICATION SERVICES - 14.5% | |||
Alternative Carriers - 0.3% | |||
Iliad Group SA | 8,200 | 861,824 | |
Integrated Telecommunication Services - 14.2% | |||
AT&T, Inc. | 549,897 | 20,236,210 | |
BT Group PLC | 245,400 | 1,425,283 | |
NeuStar, Inc. Class A (a) | 175,000 | 5,600,000 | |
NTELOS Holding Corp. | 274,000 | 5,115,580 | |
Telenor ASA sponsored ADR (d) | 78,600 | 4,389,024 | |
Verizon Communications, Inc. | 74,200 | 2,777,306 | |
39,543,403 | |||
TOTAL DIVERSIFIED TELECOMMUNICATION | 40,405,227 | ||
ELECTRONIC EQUIPMENT & INSTRUMENTS - 1.6% | |||
Electronic Manufacturing Services - 1.6% | |||
Trimble Navigation Ltd. (a) | 168,400 | 4,455,864 | |
INTERNET SOFTWARE & SERVICES - 0.7% | |||
Internet Software & Services - 0.7% | |||
Openwave Systems, Inc. (a) | 238,641 | 1,947,311 | |
SEMICONDUCTORS & SEMICONDUCTOR EQUIPMENT - 1.0% | |||
Semiconductors - 1.0% | |||
Atheros Communications, Inc. (a) | 20,600 | 520,562 | |
Skyworks Solutions, Inc. (a) | 344,800 | 2,275,680 | |
2,796,242 | |||
WIRELESS TELECOMMUNICATION SERVICES - 49.7% | |||
Wireless Telecommunication Services - 49.7% | |||
ALLTEL Corp. (d) | 537,488 | 32,566,397 | |
Shares | Value | ||
American Tower Corp. Class A (a) | 658,992 | $ 25,529,350 | |
Bharti Airtel Ltd. (a) | 151,941 | 2,489,828 | |
Crown Castle International Corp. (a) | 456,400 | 14,951,664 | |
Dobson Communications Corp. Class A | 1,504,700 | 13,361,736 | |
InPhonic, Inc. (a)(d) | 97,700 | 1,214,411 | |
Leap Wireless International, Inc. (a) | 209,283 | 14,141,252 | |
SBA Communications Corp. | 489,700 | 13,207,209 | |
Sprint Nextel Corp. (d) | 380,331 | 7,332,782 | |
Vodafone Group PLC sponsored ADR | 491,000 | 13,698,900 | |
138,493,529 | |||
TOTAL COMMON STOCKS (Cost $230,207,176) | 267,879,684 | ||
Money Market Funds - 8.3% | |||
Fidelity Cash Central Fund, 5.35% (b) | 7,321,137 | 7,321,137 | |
Fidelity Securities Lending Cash Central Fund, 5.34% (b)(c) | 15,827,589 | 15,827,589 | |
TOTAL MONEY MARKET FUNDS (Cost $23,148,726) | 23,148,726 | ||
TOTAL INVESTMENT PORTFOLIO - 104.5% (Cost $253,355,902) | 291,028,410 |
NET OTHER ASSETS - (4.5)% | (12,657,457) | ||
NET ASSETS - 100% | $ 278,370,953 | ||
Legend |
(a) Non-income producing |
(b) Affiliated fund that is available only to investment companies and other accounts managed by Fidelity Investments. The rate quoted is the annualized seven-day yield of the fund at period end. A complete unaudited listing of the fund's holdings as of its most recent quarter end is available upon request. |
(c) Investment made with cash collateral received from securities on loan. |
(d) Security or a portion of the security is on loan at period end. |
Affiliated Central Funds |
Information regarding fiscal year to date income earned by the Fund from investments in Fidelity Central Funds is as follows: |
Fund | Income earned |
Fidelity Cash Central Fund | $ 260,297 |
Fidelity Securities Lending Cash Central Fund | 121,005 |
Total | $ 381,302 |
Other Information |
Distribution of investments by country of issue, as a percentage of total net assets, is as follows: |
United States of America | 85.9% |
United Kingdom | 5.4% |
Canada | 4.0% |
Sweden | 1.9% |
Norway | 1.6% |
Others (individually less than 1%) | 1.2% |
100.0% |
See accompanying notes which are an integral part of the financial statements.
Annual Report
Financial Statements
Statement of Assets and Liabilities
February 28, 2007 | ||
Assets | ||
Investment in securities, at value (including securities loaned of $15,791,490) - See accompanying schedule: Unaffiliated issuers (cost $230,207,176) | $ 267,879,684 | |
Fidelity Central Funds (cost $23,148,726) | 23,148,726 | |
Total Investments (cost $253,355,902) | $ 291,028,410 | |
Foreign currency held at value (cost $93) | 93 | |
Receivable for investments sold | 9,420,664 | |
Receivable for fund shares sold | 330,933 | |
Dividends receivable | 139,696 | |
Distributions receivable from Fidelity Central Funds | 9,258 | |
Prepaid expenses | 1,456 | |
Other receivables | 7,562 | |
Total assets | 300,938,072 | |
Liabilities | ||
Payable for investments purchased | $ 4,832,350 | |
Payable for fund shares redeemed | 1,524,557 | |
Accrued management fee | 135,401 | |
Other affiliated payables | 82,456 | |
Other payables and accrued expenses | 164,766 | |
Collateral on securities loaned, at value | 15,827,589 | |
Total liabilities | 22,567,119 | |
Net Assets | $ 278,370,953 | |
Net Assets consist of: | ||
Paid in capital | $ 238,266,603 | |
Undistributed net investment income | 1,698,246 | |
Accumulated undistributed net realized gain (loss) on investments and foreign currency transactions | 845,134 | |
Net unrealized appreciation (depreciation) on investments | 37,560,970 | |
Net Assets, for 39,027,066 shares outstanding | $ 278,370,953 | |
Net Asset Value, offering price and redemption price per share ($278,370,953 ÷ 39,027,066 shares) | $ 7.13 | |
Statement of Operations
Year ended February 28, 2007 | ||
Investment Income | ||
Dividends | $ 4,256,984 | |
Special dividends | 1,475,599 | |
Interest | 923 | |
Income from Fidelity Central Funds | 381,302 | |
Total income | 6,114,808 | |
Expenses | ||
Management fee | $ 2,081,653 | |
Transfer agent fees | 1,180,666 | |
Accounting and security lending fees | 172,843 | |
Custodian fees and expenses | 25,932 | |
Independent trustees' compensation | 1,417 | |
Registration fees | 34,014 | |
Audit | 37,712 | |
Legal | 7,752 | |
Interest | 1,337 | |
Miscellaneous | 41,581 | |
Total expenses before reductions | 3,584,907 | |
Expense reductions | (39,197) | 3,545,710 |
Net investment income (loss) | 2,569,098 | |
Realized and Unrealized Gain (Loss) Net realized gain (loss) on: | ||
Investment securities: | ||
Unaffiliated issuers (net of foreign taxes of $160,443) | 4,203,894 | |
Foreign currency transactions | (37,780) | |
Total net realized gain (loss) | 4,166,114 | |
Change in net unrealized appreciation (depreciation) on investment securities (net of increase in deferred foreign taxes of $15,865) | (3,617,184) | |
Net gain (loss) | 548,930 | |
Net increase (decrease) in net assets resulting from operations | $ 3,118,028 | |
See accompanying notes which are an integral part of the financial statements.
Annual Report
Statement of Changes in Net Assets
Year ended | Year ended | |
Increase (Decrease) in Net Assets | ||
Operations | ||
Net investment income (loss) | $ 2,569,098 | $ 183,237 |
Net realized gain (loss) | 4,166,114 | 122,872,136 |
Change in net unrealized appreciation (depreciation) | (3,617,184) | (26,620,651) |
Net increase (decrease) in net assets resulting from operations | 3,118,028 | 96,434,722 |
Distributions to shareholders from net realized gain | (30,965,053) | - |
Share transactions | 94,138,809 | 340,148,847 |
Reinvestment of distributions | 29,981,288 | - |
Cost of shares redeemed | (320,642,345) | (306,680,611) |
Net increase (decrease) in net assets resulting from share transactions | (196,522,248) | 33,468,236 |
Redemption fees | 37,734 | 94,936 |
Total increase (decrease) in net assets | (224,331,539) | 129,997,894 |
Net Assets | ||
Beginning of period | 502,702,492 | 372,704,598 |
End of period (including undistributed net investment income of $1,698,246 and undistributed net investment income of $161,188, respectively) | $ 278,370,953 | $ 502,702,492 |
Other Information Shares | ||
Sold | 13,650,120 | 52,205,281 |
Issued in reinvestment of distributions | 4,216,778 | - |
Redeemed | (48,675,978) | (47,885,529) |
Net increase (decrease) | (30,809,080) | 4,319,752 |
Financial Highlights
Years ended February 28, | 2007 | 2006 | 2005 | 2004 H | 2003 |
Selected Per-Share Data | |||||
Net asset value, beginning of period | $ 7.20 | $ 5.69 | $ 4.85 | $ 2.42 | $ 3.68 |
Income from Investment Operations | |||||
Net investment income (loss) C | .05 F | - I | (.01) | (.03) | (.03) |
Net realized and unrealized gain (loss) | .32 | 1.51 | .85 | 2.46 | (1.23) |
Total from investment operations | .37 | 1.51 | .84 | 2.43 | (1.26) |
Distributions from net realized gain | (.44) | - | - | - | - |
Redemption fees added to paid in capital C | - I | - I | - I | - I | - I |
Net asset value, end of period | $ 7.13 | $ 7.20 | $ 5.69 | $ 4.85 | $ 2.42 |
Total Return A, B | 5.16% | 26.54% | 17.32% | 100.41% | (34.24)% |
Ratios to Average Net Assets D, G | |||||
Expenses before reductions | .97% | 1.00% | 1.04% | 1.55% | 2.17% |
Expenses net of fee waivers, if any | .97% | 1.00% | 1.04% | 1.55% | 2.17% |
Expenses net of all reductions | .96% | .89% | .97% | 1.43% | 2.01% |
Net investment income (loss) | .69% F | .04% | (.27)% | (.77)% | (1.16)% |
Supplemental Data | |||||
Net assets, end of period (000 omitted) | $ 278,371 | $ 502,702 | $ 372,705 | $ 283,040 | $ 51,720 |
Portfolio turnover rate E | 124% | 162% | 96% | 79% | 110% |
A Total returns would have been lower had certain expenses not been reduced during the periods shown. B Total returns do not include the effect of the former sales charges. C Calculated based on average shares outstanding during the period. D Fees and expenses of the underlying Fidelity Central Funds are not included in the Fund's expense ratio. The Fund indirectly bears its proportionate share of the expenses of any underlying Fidelity Central Funds. E Amount does not include the portfolio activity of any underlying Fidelity Central Funds. F Investment income per share reflects a special dividend which amounted to $.03 per share. Excluding the special dividend, the ratio of net investment income (loss) to average net assets would have been .30%. G Expense ratios reflect operating expenses of the Fund. Expenses before reductions do not reflect amounts reimbursed by the investment adviser or reductions from brokerage service arrangements or other expense offset arrangements and do not represent the amount paid by the Fund during periods when reimbursements or reductions occur. Expenses net of fee waivers reflect expenses after reimbursement by the investment adviser but prior to reductions from brokerage service arrangements or other expense offset arrangements. Expenses net of all reductions represent the net expenses paid by the Fund. H For the year ended February 29. I Amount represents less than $.01 per share. |
See accompanying notes which are an integral part of the financial statements.
Annual Report
Notes to Financial Statements
For the period ended February 28, 2007
1. Organization.
Wireless Portfolio (the Fund) is a non-diversified fund of Fidelity Select Portfolios (the trust) and is authorized to issue an unlimited number of shares. The trust is registered under the Investment Company Act of 1940, as amended (the 1940 Act), as an open-end management investment company organized as a Massachusetts business trust. The Fund invests primarily in securities of companies whose principal business activities fall within specific industries. The financial statements have been prepared in conformity with accounting principles generally accepted in the United States of America, which require management to make certain estimates and assumptions at the date of the financial statements.
2. Investments in Fidelity Central Funds.
The Fund may invest in Fidelity Central Funds which are open-end investment companies available only to other investment companies and accounts managed by FMR and its affiliates. The Fund's Schedule of Investments lists each of the Fidelity Central Funds as an investment of the Fund but does not include the underlying holdings of each Fidelity Central Fund. As an Investing Fund, the Fund indirectly bears its proportionate share of the expenses of the underlying Fidelity Central Funds. A complete unaudited list of holdings for each Fidelity Central Fund is available upon request. In addition, the financial statements of the Fidelity Central Funds, which are not covered by the Fund's Report of Independent Registered Public Accounting Firm, are available on the EDGAR Database on the SEC's web site, www.sec.gov, or upon request.
The Money Market Central Funds seek preservation of capital and current income and are managed by Fidelity Investments Money Management, Inc. (FIMM) an affiliate of Fidelity Management & Research Company (FMR).
3. Significant Accounting Policies.
The following summarizes the significant accounting policies of the Fund:
Security Valuation. Investments are valued and net asset value (NAV) per share is calculated (NAV calculation) as of the close of business of the New York Stock Exchange (NYSE), normally 4:00 p.m. Eastern time. During the period the Fund also calculated a NAV each hour on the hour (commencing at 10:00 a.m. Eastern time until one hour prior to the close of business on the NYSE). Effective October 1, 2006 the Fund eliminated hourly NAV calculation.
Wherever possible, the Fund uses independent pricing services approved by the Board of Trustees to value its investments. Equity securities, including restricted securities, for which market quotations are readily available, are valued at the last reported sale price or official closing price as reported by an independent pricing service on the primary market or exchange on which they are traded. In the event there were no sales during the day or closing prices are not available, securities are valued at the last quoted bid price. Investments in open-end mutual funds, including the Fidelity Central Funds, are valued at their closing net asset value each business day. Short-term securities with remaining maturities of sixty days or less for which quotations are not readily available are valued at amortized cost, which approximates value.
When current market prices or quotations are not readily available or do not accurately reflect fair value, valuations may be determined in accordance with procedures adopted by the Board of Trustees. For example, when developments occur between the close of a market and the close of the NYSE that may materially affect the value of some or all of the securities, or when trading in a security is halted, those securities may be fair valued. Factors used in the determination of fair value may include monitoring news to identify significant market or security specific events such as changes in the value of U.S. securities markets, reviewing developments in foreign markets and evaluating the performance of ADRs, futures contracts and exchange-traded funds. Because the Fund's utilization of fair value pricing depends on market activity, the frequency with which fair value pricing is used cannot be predicted and may be utilized to a significant extent. The value of securities used for NAV calculation under fair value pricing may differ from published prices for the same securities.
Foreign Currency. The Fund uses foreign currency contracts to facilitate transactions in foreign-denominated securities. Losses from these transactions may arise from changes in the value of the foreign currency or if the counterparties do not perform under the contracts' terms.
Foreign-denominated assets, including investment securities, and liabilities are translated into U.S. dollars at the exchange rate at period end. Purchases and sales of investment securities, income and dividends received and expenses denominated in foreign currencies are translated into U.S. dollars at the exchange rate in effect on the transaction date.
The effects of exchange rate fluctuations on investments are included with the net realized and unrealized gain (loss) on investment securities. Other foreign currency transactions resulting in realized and unrealized gain (loss) are disclosed separately.
Investment Transactions and Income. For financial reporting purposes, the Fund's investment holdings and NAV include trades executed through the end of the last business day of the period. The NAV for processing shareholder transactions includes trades executed through the end of the prior business day. Gains and losses on securities sold are determined on the basis of identified cost and may include proceeds received from litigation. Dividend income is recorded on the ex-dividend date, except for certain dividends from foreign securities where the ex-dividend date may have passed,
Annual Report
3. Significant Accounting Policies - continued
Investment Transactions and Income - continued
which are recorded as soon as the Fund is informed of the ex-dividend date. Non-cash dividends included in dividend income, if any, are recorded at the fair market value of the securities received. Distributions received on securities that represent a return of capital or capital gain are recorded as a reduction of cost of investments and/or as a realized gain. The Fund estimates the components of distributions received that may be considered return of capital distributions or capital gain distributions. Large, non-recurring dividends recognized by the Fund are presented separately on the Statement of Operations as "Special Dividends" and the impact of these dividends is presented in the Financial Highlights. Interest income and distributions from the Fidelity Central Funds are accrued as earned, with any distributions receivable as of period end included in Distributions receivable from Fidelity Central Funds on the Statement of Assets and Liabilities. Interest income includes coupon interest and amortization of premium and accretion of discount on debt securities. Investment income is recorded net of foreign taxes withheld where recovery of such taxes is uncertain.
Expenses. Most expenses of the trust can be directly attributed to a fund. Expenses which cannot be directly attributed are apportioned among each Fund in the trust. Expense estimates are accrued in the period to which they relate and adjustments are made when actual amounts are known.
Income Tax Information and Distributions to Shareholders. Each year, the Fund intends to qualify as a regulated investment company by distributing all of its taxable income and realized gains under Subchapter M of the Internal Revenue Code. As a result, no provision for income taxes is required in the accompanying financial statements. Foreign taxes are provided for based on the Fund's understanding of the tax rules and rates that exist in the foreign markets in which it invests.
Distributions are recorded on the ex-dividend date. Income and capital gain distributions are determined in accordance with income tax regulations, which may differ from generally accepted accounting principles. In addition, the Fund will claim a portion of the payment made to redeeming shareholders as a distribution for income tax purposes.
Capital accounts within the financial statements are adjusted for permanent book-tax differences. These adjustments have no impact on net assets or the results of operations. Temporary book-tax differences will reverse in a subsequent period.
Book-tax differences are primarily due to foreign currency transactions, certain foreign taxes and losses deferred due to wash sales.
The tax-basis components of distributable earnings and the federal tax cost as of period end were as follows:
Unrealized appreciation | $ 41,810,497 |
Unrealized depreciation | (5,960,506) |
Net unrealized appreciation (depreciation) | 35,849,991 |
Cost for federal income tax purposes | $ 255,178,419 |
The tax character of distributions paid was as follows:
February 28, 2007 | February 28, 2006 | |
Ordinary Income | $ 844,181 | $ - |
Long-term Capital Gains | 30,120,872 | - |
Total | $ 30,965,053 | $ - |
Trading (Redemption) Fees. Shares in the Fund held less than 30 days are subject to a redemption fee equal to .75% of the net asset value of shares redeemed. All redemption fees, including any estimated redemption fees paid by FMR, are retained by the Fund and accounted for as an addition to paid in capital. Shareholders were also subject to an additional $7.50 fee for shares exchanged into another Fidelity fund (see Note 6).
New Accounting Pronouncements. In July 2006, Financial Accounting Standards Board Interpretation No. 48, Accounting for Uncertainty in Income Taxes - an interpretation of FASB Statement 109 (FIN 48), was issued and is effective on the last business day of the semiannual reporting period for fiscal years beginning after December 15, 2006. FIN 48 sets forth a threshold for financial statement recognition, measurement and disclosure of a tax position taken or expected to be taken on a tax return. Management is currently evaluating the impact, if any, the adoption of FIN 48 will have on the Fund's net assets, results of operations and financial statement disclosures.
In addition, in September 2006, Statement of Financial Accounting Standards No. 157, Fair Value Measurements (SFAS 157), was issued and is effective for fiscal years beginning after November 15, 2007. SFAS 157 defines fair value, establishes a framework for measuring fair value and expands disclosures about fair value measurements. Management is currently evaluating the impact the adoption of SFAS 157 will have on the Fund's financial statement disclosures.
Annual Report
Notes to Financial Statements - continued
4. Operating Policies.
Repurchase Agreements. FMR has received an Exemptive Order from the Securities and Exchange Commission (the SEC) which permits the Fund and other affiliated entities of FMR to transfer uninvested cash balances into joint trading accounts which are then invested in repurchase agreements. The Fund may also invest directly with institutions in repurchase agreements. Repurchase agreements are collateralized by government or non-government securities. Upon settlement date, collateral is held in segregated accounts with custodian banks and may be obtained in the event of a default of the counterparty. The Fund monitors, on a daily basis, the value of the collateral to ensure it is at least equal to the principal amount of the repurchase agreement (including accrued interest). In the event of a default by the counterparty, realization of the collateral proceeds could be delayed, during which time the value of the collateral may decline.
5. Purchases and Sales of Investments.
Purchases and sales of securities, other than short-term securities, aggregated $451,179,003 and $677,531,295, respectively.
6. Fees and Other Transactions with Affiliates.
Management Fee. FMR and its affiliates provide the Fund with investment management related services for which the Fund pays a monthly management fee. The management fee is the sum of an individual fund fee rate that is based on an annual rate of .30% of the Fund's average net assets and a group fee rate that averaged .26% during the period. The group fee rate is based upon the average net assets of all the mutual funds advised by FMR. The group fee rate decreases as assets under management increase and increases as assets under management decrease. For the period, the total annual management fee rate was .56% of the Fund's average net assets.
Transfer Agent Fees. Fidelity Service Company, Inc. (FSC), an affiliate of FMR, is the Fund's transfer, dividend disbursing and shareholder servicing agent. FSC receives account fees and asset-based fees that vary according to account size and type of account. FSC pays for typesetting, printing and mailing of shareholder reports, except proxy statements. For the period the transfer agent fees were equivalent to an annual rate of ..32% of average net assets.
Accounting and Security Lending Fees. FSC maintains the Fund's accounting records. The accounting fee is based on the level of average net assets for the month. Under a separate contract, FSC administers the security lending program. The security lending fee is based on the number and duration of lending transactions.
Exchange Fees. During the period, FSC received the proceeds of a $7.50 fee to cover administrative costs associated with exchanges out of the Fund to any other Fidelity Select fund or to any other Fidelity fund made through non-automated channels. Effective October 1, 2006, the exchange fees were eliminated. For the period, exchange fees retained by FSC were as follows:
Retained | |
Wireless Portfolio | $ 6,503 |
Brokerage Commissions. The Fund placed a portion of its portfolio transactions with brokerage firms which are affiliates of the investment adviser. The commissions paid to these affiliated firms were $7,667 for the period.
7. Committed Line of Credit.
The Fund participates with other funds managed by FMR in a $4.2 billion credit facility (the "line of credit") to be utilized for temporary or emergency purposes to fund shareholder redemptions or for other short-term liquidity purposes. The Fund has agreed to pay commitment fees on its pro rata portion of the line of credit, which amounted to $1,080 and is reflected in Miscellaneous Expense on the Statement of Operations. During the period, there were no borrowings on this line of credit.
8. Security Lending.
The Fund lends portfolio securities from time to time in order to earn additional income. On the settlement date of the loan, the Fund receives collateral (in the form of U.S. Treasury obligations, letters of credit and/or cash) against the loaned securities and maintains collateral in an amount not less than 100% of the market value of the loaned securities during the period of the loan. The market value of the loaned securities is determined at the close of business of the Fund and any additional required collateral is delivered to the Fund on the next business day. If the borrower defaults on its obligation to return the securities loaned because of insolvency or other reasons, a fund could experience delays and costs in recovering the securities loaned or in gaining access to the collateral. Any cash collateral received is invested in the Fidelity Securities Lending Cash Central Fund. The value of loaned securities and cash collateral at period end are disclosed on the Fund's Statement of Assets and Liabilities. Security lending income represents the income earned on investing cash collateral, less fees and expenses associated with the loan, plus any premium payments that may be received on
Annual Report
8. Security Lending - continued
the loan of certain types of securities. Security lending income is presented in the Statement of Operations as a component of income from Fidelity Central Funds. Net income from lending portfolio securities during the period amounted to $121,005.
9. Bank Borrowings.
The Fund is permitted to have bank borrowings for temporary or emergency purposes to fund shareholder redemptions. The Fund has established borrowing arrangements with certain banks. The interest rate on the borrowings is the bank's base rate, as revised from time to time. The average daily loan balance during the period for which loans were outstanding amounted to $5,034,500. The weighted average interest rate was 4.78%. At period end, there were no bank borrowings outstanding.
10. Expense Reductions.
Many of the brokers with whom FMR places trades on behalf of the Fund provided services to the Fund in addition to trade execution. These services included payments of certain expenses on behalf of the Fund totaling $27,007 for the period. In addition, through arrangements with the Fund's transfer agent, credits realized as a result of uninvested cash balances were used to reduce the Fund's expenses. During the period, these credits reduced the Fund's transfer agent expenses by $5,751.
11. Other.
The Fund's organizational documents provide former and current trustees and officers with a limited indemnification against liabilities arising in connection with the performance of their duties to the Fund. In the normal course of business, the Fund may also enter into contracts that provide general indemnifications. The Fund's maximum exposure under these arrangements is unknown as this would be dependent on future claims that may be made against the Fund. The risk of material loss from such claims is considered remote.
The United States Securities and Exchange Commission ("SEC") is conducting an investigation of FMR (covering the years 2002 to 2004) arising from gifts, gratuities and business entertainment provided by certain brokers to certain individuals who were employed on FMR's domestic equity trading desk during that period. FMR is in discussions with the SEC staff regarding the possible resolution of the matter, but as of period-end no final resolution has been reached.
In December 2006, the Independent Trustees completed their own investigation of the matter with the assistance of independent counsel. The Independent Trustees and FMR agree that, despite the absence of proof that the Fidelity mutual funds experienced diminished execution quality as a result of the improper receipt of gifts and business entertainment, the conduct at issue was serious and is worthy of redress. Accordingly, the Independent Trustees have requested and FMR has agreed to pay $42 million to Fidelity mutual funds, plus interest to be determined at the time that payment is made. A method of allocating this payment among the funds has not yet been determined. The total payment to the Fund is not anticipated to have a material impact on the Fund's net assets. In addition, FMR reimbursed related legal expenses which are recorded in the accompanying Statement of Operations as an expense reduction.
Annual Report
Report of Independent Registered Public Accounting Firm
To the Trustees of Fidelity Select Portfolios and the Shareholders of Telecommunications Portfolio and Wireless Portfolio:
In our opinion, the accompanying statements of assets and liabilities, including the schedules of investments, and the related statements of operations and of changes in net assets and the financial highlights present fairly, in all material respects, the financial position of Telecommunications Portfolio and Wireless Portfolio ( funds of Fidelity Select Portfolios) at February 28, 2007, the results of each of their operations for the year then ended, the changes in each of their net assets for each of the two years in the period then ended and the financial highlights for each of the periods indicated, in conformity with accounting principles generally accepted in the United States of America. These financial statements and financial highlights (hereafter referred to as "financial statements") are the responsibility of the Fidelity Select Portfolios' management. Our responsibility is to express an opinion on these financial statements based on our audits. We conducted our audits of these financial statements in accordance with the standards of the Public Company Accounting Oversight Board (United States). Those standards require that we plan and perform the audit to obtain reasonable assurance about whether the financial statements are free of material misstatement. An audit includes examining, on a test basis, evidence supporting the amounts and disclosures in the financial statements, assessing the accounting principles used and significant estimates made by management, and evaluating the overall financial statement presentation. We believe that our audits, which included confirmation of securities at February 28, 2007 by correspondence with the custodian and brokers, provide a reasonable basis for our opinion.
/s/PricewaterhouseCoopers LLP
PricewaterhouseCoopers LLP
Boston, Massachusetts
April 23, 2007
Annual Report
Trustees and Officers
The Trustees, Member of the Advisory Board, and executive officers of the trust and funds, as applicable, are listed below. The Board of Trustees governs each fund and is responsible for protecting the interests of shareholders. The Trustees are experienced executives who meet periodically throughout the year to oversee each fund's activities, review contractual arrangements with companies that provide services to each fund, and review each fund's performance. Each of the Trustees oversees 349 funds advised by FMR or an affiliate.
The Trustees hold office without limit in time except that (a) any Trustee may resign; (b) any Trustee may be removed by written instrument, signed by at least two-thirds of the number of Trustees prior to such removal; (c) any Trustee who requests to be retired or who has become incapacitated by illness or injury may be retired by written instrument signed by a majority of the other Trustees; and (d) any Trustee may be removed at any special meeting of shareholders by a two-thirds vote of the outstanding voting securities of the trust. Each Trustee who is not an interested person (as defined in the 1940 Act) (Independent Trustee), shall retire not later than the last day of the calendar year in which his or her 72nd birthday occurs. The Independent Trustees may waive this mandatory retirement age policy with respect to individual Trustees. The executive officers and Advisory Board Member hold office without limit in time, except that any officer and Advisory Board Member may resign or may be removed by a vote of a majority of the Trustees at any regular meeting or any special meeting of the Trustees. Except as indicated, each individual has held the office shown or other offices in the same company for the past five years.
The funds' Statement of Additional Information (SAI) includes more information about the Trustees. To request a free copy, call Fidelity at 1-800-544-8544.
Interested Trustees*:
Correspondence intended for each Trustee who is an interested person may be sent to Fidelity Investments, 82 Devonshire Street, Boston, Massachusetts 02109.
Name, Age; Principal Occupation | |
Edward C. Johnson 3d (76) | |
Year of Election or Appointment: 1980 Mr. Johnson is Chairman of the Board of Trustees. Mr. Johnson serves as President (2006-present), Chief Executive Officer, Chairman, and a Director of FMR Corp.; Chairman and a Director of FMR; Chairman and a Director of Fidelity Research & Analysis Company (FRAC); Chairman and a Director of Fidelity Investments Money Management, Inc.; and Chairman (2001- present) and a Director of FMR Co., Inc. In addition, Mr. Johnson serves as Chairman and Director of Fidelity International Limited (FIL). | |
Robert L. Reynolds (54) | |
Year of Election or Appointment: 2003 Mr. Reynolds is President and a Director of FMR (2005-present), Fidelity Investments Money Management, Inc. (2005-present), and FMR Co., Inc. (2005-present). Mr. Reynolds also serves as Vice Chairman (2006-present), a Director (2003-present), and Chief Operating Officer of FMR Corp. and a Director of Strategic Advisers, Inc. (2005-present). He also serves on the Board at Fidelity Investments Canada, Ltd. | |
* Trustees have been determined to be "Interested Trustees" by virtue of, among other things, their affiliation with the trust or various entities under common control with FMR.
Independent Trustees:
Correspondence intended for each Independent Trustee (that is, the Trustees other than the Interested Trustees) may be sent to Fidelity Investments, P.O. Box 55235, Boston, Massachusetts 02205-5235.
Name, Age; Principal Occupation | |
Dennis J. Dirks (58) | |
Year of Election or Appointment: 2005 Prior to his retirement in May 2003, Mr. Dirks was Chief Operating Officer and a member of the Board of The Depository Trust & Clearing Corporation (DTCC) (1999-2003). He also served as President, Chief Operating Officer, and Board member of The Depository Trust Company (DTC) (1999-2003) and President and Board member of the National Securities Clearing Corporation (NSCC) (1999-2003). In addition, Mr. Dirks served as Chief Executive Officer and Board member of the Government Securities Clearing Corporation (2001-2003) and Chief Executive Officer and Board member of the Mortgage-Backed Securities Clearing Corporation (2001-2003). Mr. Dirks also serves as a Trustee and a member of the Finance Committee of Manhattan College (2005-present) and a Trustee and a member of the Finance Committee of AHRC of Nassau County (2006-present). | |
Albert R. Gamper, Jr. (64) | |
Year of Election or Appointment: 2006 Prior to his retirement in December 2004, Mr. Gamper served as Chairman of the Board of CIT Group Inc. (commercial finance). During his tenure with CIT Group Inc. Mr. Gamper served in numerous senior management positions, including Chairman (1987-1989; 1999-2001; 2002-2004), Chief Executive Officer (1987-2004), and President (1989-2002). He currently serves as a member of the Board of Directors of Public Service Enterprise Group (utilities, 2001-present), Chairman of the Board of Governors, Rutgers University (2004-present), and Chairman of the Board of Saint Barnabas Health Care System. | |
George H. Heilmeier (70) | |
Year of Election or Appointment: 2004 Dr. Heilmeier is Chairman Emeritus of Telcordia Technologies (communication software and systems), where prior to his retirement, he served as company Chairman and Chief Executive Officer. He currently serves on the Boards of Directors of The Mitre Corporation (systems engineering and information technology support for the government), and HRL Laboratories (private research and development, 2004-present). He is Chairman of the General Motors Science & Technology Advisory Board and a Life Fellow of the Institute of Electrical and Electronics Engineers (IEEE). Dr. Heilmeier is a member of the Defense Science Board and the National Security Agency Advisory Board. He is also a member of the National Academy of Engineering, the American Academy of Arts and Sciences, and the Board of Overseers of the School of Engineering and Applied Science of the University of Pennsylvania. Previously, Dr. Heilmeier served as a Director of TRW Inc. (automotive, space, defense, and information technology, 1992-2002), Compaq (1994-2002), Automatic Data Processing, Inc. (ADP) (technology-based business outsourcing, 1995-2002), INET Technologies Inc. (telecommunications network surveillance, 2001-2004), and Teletech Holdings (customer management services). He is the recipient of the 2005 Kyoto Prize in Advanced Technology for his invention of the liquid crystal display, and a member of the Consumer Electronics Hall of Fame. | |
James H. Keyes (66) | |
Year of Election or Appointment: 2007 Prior to his retirement in 2003, Mr. Keyes was Chairman, President, and Chief Executive Officer of Johnson Controls, Inc. (automotive supplier, 1993-2003). He currently serves as a member of the boards of LSI Logic Corporation (semiconductor technologies), Navistar International Corporation (manufacture and sale of trucks, buses, and diesel engines, 2002-present), and Pitney Bowes, Inc. (integrated mail, messaging, and document management solutions). | |
Marie L. Knowles (60) | |
Year of Election or Appointment: 2001 Prior to Ms. Knowles' retirement in June 2000, she served as Executive Vice President and Chief Financial Officer of Atlantic Richfield Company (ARCO) (diversified energy, 1996-2000). From 1993 to 1996, she was a Senior Vice President of ARCO and President of ARCO Transportation Company. She served as a Director of ARCO from 1996 to 1998. She currently serves as a Director of Phelps Dodge Corporation (copper mining and manufacturing) and McKesson Corporation (healthcare service, 2002-present). Ms. Knowles is a Trustee of the Brookings Institution and the Catalina Island Conservancy and also serves as a member of the Advisory Board for the School of Engineering of the University of Southern California. | |
Ned C. Lautenbach (63) | |
Year of Election or Appointment: 2000 Mr. Lautenbach is Chairman of the Independent Trustees (2006-present). Mr. Lautenbach has been a partner of Clayton, Dubilier & Rice, Inc. (private equity investment firm) since September 1998. Previously, Mr. Lautenbach was with the International Business Machines Corporation (IBM) from 1968 until his retirement in 1998. Mr. Lautenbach serves as a Director of Sony Corporation (2006-present) and Eaton Corporation (diversified industrial) as well as the Philharmonic Center for the Arts in Naples, Florida. He also is a member of the Board of Trustees of Fairfield University (2005-present), as well as a member of the Council on Foreign Relations. | |
Cornelia M. Small (62) | |
Year of Election or Appointment: 2005 Ms. Small is a member (2000-present) and Chairperson (2002-present) of the Investment Committee, and a member (2002- present) of the Board of Trustees of Smith College. Previously, she served as Chief Investment Officer (1999-2000), Director of Global Equity Investments (1996-1999), and a member of the Board of Directors of Scudder, Stevens & Clark (1990-1997) and Scudder Kemper Investments (1997-1999). In addition, Ms. Small served as Co-Chair (2000-2003) of the Annual Fund for the Fletcher School of Law and Diplomacy. | |
William S. Stavropoulos (67) | |
Year of Election or Appointment: 2001 Mr. Stavropoulos is Chairman Emeritus of the Board of Directors of The Dow Chemical Company. Since joining The Dow Chemical Company in 1967, Mr. Stavropoulos served in numerous senior management positions, including President (1993-2000; 2002-2003), CEO (1995-2000; 2002-2004), and Chairman of the Executive Committee (2000-2004). Currently, he is a Director of NCR Corporation (data warehousing and technology solutions), Chemical Financial Corporation, Maersk Inc. (industrial conglomerate, 2002-present), Tyco International, Inc. (multinational manufacturing and services, 2007-present), and a member of the Advisory Board for Metalmark Capital (private equity investment firm, 2005-present). He is a special advisor to Clayton Dubilier & Rice, Inc., a private equity investment firm. He also serves as a member of the Board of Trustees of the American Enterprise Institute for Public Policy Research. In addition, Mr. Stavropoulos is a member of The Business Council, J.P. Morgan International Council and the University of Notre Dame Advisory Council for the College of Science. | |
Kenneth L. Wolfe (68) | |
Year of Election or Appointment: 2005 Prior to his retirement in 2001, Mr. Wolfe was Chairman and Chief Executive Officer of Hershey Foods Corporation (1993-2001). He currently serves as a member of the boards of Adelphia Communications Corporation (2003-present), Bausch & Lomb, Inc., and Revlon Inc. (2004-present). | |
Advisory Board Member and Executive Officers:
Correspondence intended for each executive officer and Mr. Lynch may be sent to Fidelity Investments, 82 Devonshire Street, Boston, Massachusetts 02109.
Name, Age; Principal Occupation | |
Peter S. Lynch (63) | |
Year of Election or Appointment: 2003 Member of the Advisory Board of Fidelity Select Portfolios. Mr. Lynch is Vice Chairman and a Director of FMR, and Vice Chairman (2001-present) and a Director of FMR Co., Inc. Previously, Mr. Lynch served as a Trustee of the Fidelity funds (1990-2003). In addition, he serves as a Trustee of Boston College and as the Chairman of the Inner-City Scholarship Fund. | |
Kimberley H. Monasterio (43) | |
Year of Election or Appointment: 2007 President and Treasurer of Select Telecommunications Portfolio and Select Wireless Portfolio. Ms. Monasterio also serves as President and Treasurer of other Fidelity funds (2007-present) and is an employee of FMR (2004-present). Previously, Ms. Monasterio served as Deputy Treasurer of the Fidelity funds (2004-2006). Before joining Fidelity Investments, Ms. Monasterio served as Treasurer (2000-2004) and Chief Financial Officer (2002-2004) of the Franklin Templeton Funds and Senior Vice President of Franklin Templeton Services, LLC (2000-2004). | |
Boyce I. Greer (51) | |
Year of Election or Appointment: 2005 Vice President of Select Telecommunications Portfolio and Select Wireless Portfolio. Mr. Greer also serves as Vice President of certain Equity Funds (2005-present), certain Asset Allocation Funds (2005-present), Fixed-Income Funds (2006-present), and Money Market Funds (2006-present). Mr. Greer is also a Trustee of other investment companies advised by FMR (2003-present). He is an Executive Vice President of FMR (2005-present) and FMR Co., Inc. (2005-present), and Senior Vice President of Fidelity Investments Money Management, Inc. (2006-present). Previously, Mr. Greer served as a Director and Managing Director of Strategic Advisers, Inc. (2002-2005), and Executive Vice President (2000-2002) and Money Market Group Leader (1997-2002) of the Fidelity Investments Fixed Income Division. He also served as Vice President of Fidelity's Money Market Funds (1997-2002), Senior Vice President of FMR (1997-2002), and Vice President of FIMM (1998-2002). | |
Eric D. Roiter (58) | |
Year of Election or Appointment: 1998 and 2000 Secretary of Select Telecommunications Portfolio (1998) and Select Wireless Portfolio (2000). He also serves as Secretary of other Fidelity funds; Vice President, General Counsel, and Secretary of FMR Co., Inc. (2001-present) and FMR; Assistant Secretary of Fidelity Management & Research (U.K.) Inc. (2001-present), Fidelity Research & Analysis Company (2001-present), and Fidelity Investments Money Management, Inc. (2001-present). Mr. Roiter is an Adjunct Member, Faculty of Law, at Boston College Law School (2003-present). Previously, Mr. Roiter served as Vice President and Secretary of Fidelity Distributors Corporation (FDC) (1998-2005). | |
Scott C. Goebel (39) | |
Year of Election or Appointment: 2007 Assistant Secretary of Select Telecommunications Portfolio and Select Wireless Portfolio. Mr. Goebel also serves as Assistant Secretary of other Fidelity funds (2007-present), Vice President and Secretary of FDC (2006-present), and is an employee of FMR. | |
R. Stephen Ganis (40) | |
Year of Election or Appointment: 2006 Anti-Money Laundering (AML) officer of Select Telecommunications Portfolio and Select Wireless Portfolio. Mr. Ganis also serves as AML officer of other Fidelity funds (2006-present) and FMR Corp. (2003-present). Before joining Fidelity Investments, Mr. Ganis practiced law at Goodwin Procter, LLP (2000-2002). | |
Joseph B. Hollis (58) | |
Year of Election or Appointment: 2006 Chief Financial Officer of Select Telecommunications Portfolio and Select Wireless Portfolio. Mr. Hollis also serves as Chief Financial Officer of other Fidelity funds. Mr. Hollis is President of Fidelity Pricing and Cash Management Services (FPCMS) (2005-present). Mr. Hollis also serves as President and Director of Fidelity Service Company, Inc. (2006-present). Previously, Mr. Hollis served as Senior Vice President of Cash Management Services (1999-2002) and Investment Management Operations (2002-2005). | |
Kenneth A. Rathgeber (59) | |
Year of Election or Appointment: 2004 Chief Compliance Officer of Select Telecommunications Portfolio and Select Wireless Portfolio. Mr. Rathgeber also serves as Chief Compliance Officer of other Fidelity funds (2004-present) and Executive Vice President of Risk Oversight for Fidelity Investments (2002-present). He is Chief Compliance Officer of FMR (2005-present), FMR Co., Inc. (2005-present), Fidelity Management & Research (U.K.) Inc. (2005-present), Fidelity Research & Analysis Company (2005-present), Fidelity Investments Money Management, Inc. (2005-present), and Strategic Advisers, Inc. (2005-present). Previously, Mr. Rathgeber served as Executive Vice President and Chief Operating Officer for Fidelity Investments Institutional Services Company, Inc. (1998-2002). | |
Bryan A. Mehrmann (45) | |
Year of Election or Appointment: 2005 Deputy Treasurer of Select Telecommunications Portfolio and Select Wireless Portfolio. Mr. Mehrmann also serves as Deputy Treasurer of other Fidelity funds (2005-present) and is an employee of FMR. Previously, Mr. Mehrmann served as Vice President of Fidelity Investments Institutional Services Group (FIIS)/Fidelity Investments Institutional Operations Corporation, Inc. (FIIOC) Client Services (1998-2004). | |
Kenneth B. Robins (37) | |
Year of Election or Appointment: 2005 Deputy Treasurer of Select Telecommunications Portfolio and Select Wireless Portfolio. Mr. Robins also serves as Deputy Treasurer of other Fidelity funds (2005-present) and is an employee of FMR (2004-present). Before joining Fidelity Investments, Mr. Robins worked at KPMG LLP, where he was a partner in KPMG's department of professional practice (2002-2004) and a Senior Manager (1999-2000). In addition, Mr. Robins served as Assistant Chief Accountant, United States Securities and Exchange Commission (2000-2002). | |
Robert G. Byrnes (40) | |
Year of Election or Appointment: 2005 Assistant Treasurer of Select Telecommunications Portfolio and Select Wireless Portfolio. Mr. Byrnes also serves as Assistant Treasurer of other Fidelity funds (2005-present) and is an employee of FMR (2005-present). Previously, Mr. Byrnes served as Vice President of FPCMS (2003-2005). Before joining Fidelity Investments, Mr. Byrnes worked at Deutsche Asset Management where he served as Vice President of the Investment Operations Group (2000-2003). | |
Peter L. Lydecker (53) | |
Year of Election or Appointment: 2004 Assistant Treasurer of Select Telecommunications Portfolio and Select Wireless Portfolio. Mr. Lydecker also serves as Assistant Treasurer of other Fidelity funds (2004) and is an employee of FMR. | |
Gary W. Ryan (48) | |
Year of Election or Appointment: 2005 Assistant Treasurer of Select Telecommunications Portfolio and Select Wireless Portfolio. Mr. Ryan also serves as Assistant Treasurer of other Fidelity funds (2005-present) and is an employee of FMR (2005-present). Previously, Mr. Ryan served as Vice President of Fund Reporting in FPCMS (1999-2005). | |
Salvatore Schiavone (41) | |
Year of Election or Appointment: 2005 Assistant Treasurer of Select Telecommunications Portfolio and Select Wireless Portfolio. Mr. Schiavone also serves as Assistant Treasurer of other Fidelity funds (2005-present) and is an employee of FMR (2005-present). Before joining Fidelity Investments, Mr. Schiavone worked at Deutsche Asset Management, where he most recently served as Assistant Treasurer (2003-2005) of the Scudder Funds and Vice President and Head of Fund Reporting (1996-2003). | |
Annual Report
Distributions
The funds hereby designate as capital gain dividend the amounts noted below for the taxable year ended February 28, 2007, or, if subsequently determined to be different, the net capital gain of such year.
Wireless | $2,556,118 |
A percentage of the dividends distributed during the fiscal year for the following funds qualifies for the dividends-received deduction for corporate shareholders:
Telecommunications | |
April, 2006 | 100% |
December, 2006 | 100% |
Wireless | |
April, 2006 | 100% |
A percentage of the dividends distributed during the fiscal year for the following funds may be taken into account as a dividend for purposes of the maximum rate under section 1(h)(11) of the Internal Revenue Code.
Telecommunications | |
April, 2006 | 100% |
December, 2006 | 100% |
Wireless | |
April, 2006 | 100% |
The funds will notify shareholders in January 2008 of amounts for use in preparing 2007 income tax returns.
Annual Report
Proxy Voting Results
A special meeting of Fidelity Select Portfolios' shareholders was held on September 20, 2006. The results of votes taken among shareholders on the proposal before them are reported below. Each vote reported represents one dollar of net asset value held on the record date for the meeting.
PROPOSAL 1 | ||
To elect a Board of Trustees. A | ||
# of | % of | |
Dennis J. Dirks | ||
Affirmative | 13,182,341,755.09 | 94.980 |
Withheld | 696,736,162.41 | 5.020 |
TOTAL | 13,879,077,917.50 | 100.000 |
Albert R. Gamper, Jr. | ||
Affirmative | 13,177,593,614.43 | 94.946 |
Withheld | 701,484,303.07 | 5.054 |
TOTAL | 13,879,077,917.50 | 100.000 |
Robert M. Gates | ||
Affirmative | 13,141,235,622.81 | 94.684 |
Withheld | 737,842,294.69 | 5.316 |
TOTAL | 13,879,077,917.50 | 100.000 |
George H. Heilmeier | ||
Affirmative | 13,140,073,210.00 | 94.675 |
Withheld | 739,004,707.50 | 5.325 |
TOTAL | 13,879,077,917.50 | 100.000 |
Edward C. Johnson 3d | ||
Affirmative | 13,106,284,587.54 | 94.432 |
Withheld | 772,793,329.96 | 5.568 |
TOTAL | 13,879,077,917.50 | 100.000 |
Stephen P. Jonas | ||
Affirmative | 13,168,282,872.88 | 94.879 |
Withheld | 710,795,044.62 | 5.121 |
TOTAL | 13,879,077,917.50 | 100.000 |
James H. KeyesB | ||
Affirmative | 13,164,603,089.66 | 94.852 |
Withheld | 714,474,827.84 | 5.148 |
TOTAL | 13,879,077,917.50 | 100.000 |
Marie L. Knowles | ||
Affirmative | 13,169,356,779.66 | 94.886 |
Withheld | 709,721,137.84 | 5.114 |
TOTAL | 13,879,077,917.50 | 100.000 |
Ned C. Lautenbach | ||
Affirmative | 13,166,485,155.52 | 94.866 |
Withheld | 712,592,761.98 | 5.134 |
TOTAL | 13,879,077,917.50 | 100.000 |
William O. McCoy | ||
Affirmative | 13,129,548,996.59 | 94.600 |
Withheld | 749,528,920.91 | 5.400 |
TOTAL | 13,879,077,917.50 | 100.000 |
Robert L. Reynolds | ||
Affirmative | 13,180,813,649.06 | 94.969 |
Withheld | 698,264,268.44 | 5.031 |
TOTAL | 13,879,077,917.50 | 100.000 |
# of | % of | |
Cornelia M. Small | ||
Affirmative | 13,170,500,616.42 | 94.895 |
Withheld | 708,577,301.08 | 5.105 |
TOTAL | 13,879,077,917.50 | 100.000 |
William S. Stavropoulos | ||
Affirmative | 13,143,284,328.22 | 94.699 |
Withheld | 735,793,589.28 | 5.301 |
TOTAL | 13,879,077,917.50 | 100.000 |
Kenneth L. Wolfe | ||
Affirmative | 13,162,946,758.47 | 94.840 |
Withheld | 716,131,159.03 | 5.160 |
TOTAL | 13,879,077,917.50 | 100.000 |
A Denotes trust-wide proposal and voting results. B Effective on or about January 1, 2007. | ||
Annual Report
Managing Your Investments
Fidelity offers several ways to conveniently manage your personal investments via your telephone or PC. You can access your account information, conduct trades and research your investments 24 hours a day.
By Phone
Fidelity Automated Service Telephone provides a single toll-free number to access account balances, positions, quotes and trading. It's easy to navigate the service, and on your first call, the system will help you create a personal identification number (PIN) for security.
(phone_graphic)
Fidelity Automated Service Telephone (FAST®)
1-800-544-5555
Press
1 For mutual fund and brokerage trading.
2 For quotes.*
3 For account balances and holdings.
4 To review orders and mutual fund activity.
5 To change your PIN.
*0 To speak to a Fidelity representative.
By PC
Fidelity's web site on the Internet provides a wide range of information, including daily financial news, fund performance, interactive planning tools and news about Fidelity products and services.
(computer_graphic)
Fidelity's Web Site
www.fidelity.com
* When you call the quotes line, please remember that a fund's yield and return will vary and, except for money market funds, share price will also vary. This means that you may have a gain or loss when you sell your shares. There is no assurance that money market funds will be able to maintain a stable $1 share price; an investment in a money market fund is not insured or guaranteed by the U.S. government. Total returns are historical and include changes in share price, reinvestment of dividends and capital gains, and the effects of any sales charges.
Annual Report
To Write Fidelity
We'll give your correspondence immediate attention and send you written confirmation upon completion of your request.
(letter_graphic)
Making Changes
To Your Account
(such as changing name, address, bank, etc.)
Fidelity Investments
P.O. Box 770001
Cincinnati, OH 45277-0002
(letter_graphic)
For Non-Retirement
Accounts
Buying shares
Fidelity Investments
P.O. Box 770001
Cincinnati, OH 45277-0003
Overnight Express
Fidelity Investments
Attn: Distribution Services
100 Crosby Parkway - KC1H
Covington, KY 41015
Selling shares
Fidelity Investments
P.O. Box 770001
Cincinnati, OH 45277-0035
Overnight Express
Fidelity Investments
Attn: Distribution Services
100 Crosby Parkway - KC1H
Covington, KY 41015
General Correspondence
Fidelity Investments
P.O. Box 500
Merrimack, NH 03054-0500
(letter_graphic)
For Retirement
Accounts
Buying shares
Fidelity Investments
P.O. Box 770001
Cincinnati, OH 45277-0003
Selling shares
Fidelity Investments
P.O. Box 770001
Cincinnati, OH 45277-0035
Overnight Express
Fidelity Investments
Attn: Distribution Services
100 Crosby Parkway - KC1H
Covington, KY 41015
General Correspondence
Fidelity Investments
P.O. Box 500
Merrimack, NH 03054-0500
Annual Report
To Visit Fidelity
For directions and hours,
please call 1-800-544-9797.
Arizona
7001 West Ray Road
Chandler, AZ
15445 N. Scottsdale Road
Scottsdale, AZ
California
815 East Birch Street
Brea, CA
1411 Chapin Avenue
Burlingame, CA
851 East Hamilton Avenue
Campbell, CA
19200 Von Karman Avenue
Irvine, CA
601 Larkspur Landing Circle
Larkspur, CA
10100 Santa Monica Blvd.
Los Angeles, CA
27101 Puerta Real
Mission Viejo, CA
73-575 El Paseo
Palm Desert, CA
251 University Avenue
Palo Alto, CA
123 South Lake Avenue
Pasadena, CA
16995 Bernardo Ctr. Drive
Rancho Bernardo, CA
1220 Roseville Parkway
Roseville, CA
1740 Arden Way
Sacramento, CA
7676 Hazard Center Drive
San Diego, CA
11943 El Camino Real
San Diego, CA
8 Montgomery Street
San Francisco, CA
3793 State Street
Santa Barbara, CA
1200 Wilshire Boulevard
Santa Monica, CA
21701 Hawthorne Boulevard
Torrance, CA
2001 North Main Street
Walnut Creek, CA
6300 Canoga Avenue
Woodland Hills, CA
Colorado
1625 Broadway
Denver, CO
9185 Westview Road
Lone Tree, CO
Connecticut
48 West Putnam Avenue
Greenwich, CT
265 Church Street
New Haven, CT
300 Atlantic Street
Stamford, CT
29 South Main Street
West Hartford, CT
Delaware
400 Delaware Avenue
Wilmington, DE
Florida
4400 N. Federal Highway
Boca Raton, FL
121 Alhambra Plaza
Coral Gables, FL
2948 N. Federal Highway
Ft. Lauderdale, FL
4671 Town Center Parkway
Jacksonville, FL
1907 West State Road 434
Longwood, FL
8880 Tamiami Trail, North
Naples, FL
3501 PGA Boulevard
Palm Beach Gardens, FL
3550 Tamiami Trail, South
Sarasota, FL
1502 N. Westshore Blvd.
Tampa, FL
2465 State Road 7
Wellington, FL
Georgia
3445 Peachtree Road, N.E.
Atlanta, GA
1000 Abernathy Road
Atlanta, GA
Illinois
One North LaSalle Street
Chicago, IL
875 North Michigan Ave.
Chicago, IL
1415 West 22nd Street
Oak Brook, IL
1572 East Golf Road
Schaumburg, IL
3232 Lake Avenue
Wilmette, IL
Indiana
4729 East 82nd Street
Indianapolis, IN
Kansas
5400 College Boulevard
Overland Park, KS
Maine
Three Canal Plaza
Portland, ME
Maryland
7315 Wisconsin Avenue
Bethesda, MD
One W. Pennsylvania Ave.
Towson, MD
Massachusetts
801 Boylston Street
Boston, MA
155 Congress Street
Boston, MA
300 Granite Street
Braintree, MA
44 Mall Road
Burlington, MA
238 Main Street
Cambridge, MA
405 Cochituate Road
Framingham, MA
416 Belmont Street
Worcester, MA
Michigan
500 E. Eisenhower Pkwy.
Ann Arbor, MI
280 Old N. Woodward Ave.
Birmingham, MI
43420 Grand River Avenue
Novi, MI
29155 Northwestern Hwy.
Southfield, MI
Minnesota
7600 France Avenue South
Edina, MN
Missouri
1524 South Lindbergh Blvd.
St. Louis, MO
Nevada
2225 Village Walk Drive
Henderson, NV
New Jersey
150 Essex Street
Millburn, NJ
56 South Street
Morristown, NJ
396 Route 17, North
Paramus, NJ
3518 Route 1 North
Princeton, NJ
530 Broad Street
Shrewsbury, NJ
New York
1055 Franklin Avenue
Garden City, NY
37 West Jericho Turnpike
Huntington Station, NY
1271 Avenue of the Americas
New York, NY
980 Madison Avenue
New York, NY
61 Broadway
New York, NY
350 Park Avenue
New York, NY
200 Fifth Avenue
New York, NY
733 Third Avenue
New York, NY
11 Penn Plaza
New York, NY
2070 Broadway
New York, NY
1075 Northern Blvd.
Roslyn, NY
799 Central Park Avenue
Scarsdale, NY
North Carolina
4611 Sharon Road
Charlotte, NC
7011 Fayetteville Road
Durham, NC
Ohio
3805 Edwards Road
Cincinnati, OH
1324 Polaris Parkway
Columbus, OH
28699 Chagrin Boulevard
Woodmere Village, OH
Oregon
7493 SW Bridgeport Road
Tigard, OR
Pennsylvania
600 West DeKalb Pike
King of Prussia, PA
1735 Market Street
Philadelphia, PA
12001 Perry Highway
Wexford, PA
Rhode Island
47 Providence Place
Providence, RI
Tennessee
6150 Poplar Avenue
Memphis, TN
Texas
10000 Research Boulevard
Austin, TX
4001 Northwest Parkway
Dallas, TX
12532 Memorial Drive
Houston, TX
2701 Drexel Drive
Houston, TX
6560 Fannin Street
Houston, TX
6500 N. MacArthur Blvd.
Irving, TX
6005 West Park Boulevard
Plano, TX
14100 San Pedro
San Antonio, TX
1576 East Southlake Blvd.
Southlake, TX
19740 IH 45 North
Spring, TX
Utah
279 West South Temple
Salt Lake City, UT
Virginia
1861 International Drive
McLean, VA
Washington
411 108th Avenue, N.E.
Bellevue, WA
1518 6th Avenue
Seattle, WA
Washington, DC
1900 K Street, N.W.
Washington, DC
Wisconsin
595 North Barker Road
Brookfield, WI
Annual Report
Annual Report
Annual Report
Annual Report
Investment Adviser
Fidelity Management & Research Company
Boston, MA
Investment Sub-Advisers
FMR Co., Inc.
Fidelity Management & Research
(U.K.) Inc.
Fidelity Research & Analysis Company (formerly Fidelity
Management & Research (Far East) Inc.)
Fidelity Investments Japan Limited
Fidelity International Investment Advisors
Fidelity International Investment Advisors
(U.K. Limited)
General Distributor
Fidelity Distributors Corporation
Boston, MA
Transfer and Service Agents
Fidelity Service Company, Inc.
Boston, MA
Fidelity Investments Institutional Operations
Company, Inc.
Boston, MA
Custodian
Brown Brothers Harriman & Co.
Boston, MA
Corporate Headquarters
82 Devonshire Street
Boston, MA 02109
1-800-544-8888
The Fidelity Telephone Connection
Mutual Fund 24-Hour Service
Exchanges/Redemptions
and Account Assistance 1-800-544-6666
Product Information 1-800-544-8888
Retirement Accounts 1-800-544-4774
(8 a.m. - 9 p.m.)
TDD Service 1-800-544-0118
for the deaf and hearing impaired
(9 a.m. - 9 p.m. Eastern time)
Fidelity Automated Service
Telephone (FAST®) (automated graphic) 1-800-544-5555
(automated graphic) Automated line for quickest service
SELTS-UANN-0407
1.846049.100
(Fidelity Investment logo)(registered trademark)
Corporate Headquarters
82 Devonshire St., Boston, MA 02109
www.fidelity.com

Fidelity Advisor
Focus Funds®
Class A, Class T, Class B and Class C
Fidelity Advisor Consumer Staples Fund
Fidelity Advisor Gold Fund
Fidelity Advisor Materials Fund
Fidelity Advisor Telecommunications Fund
Each Advisor fund listed above are classes
of the Fidelity® Select Portfolios®.
Annual Report
February 28, 2007
(2_fidelity_logos) (Registered_Trademark)
Contents
Chairman's Message | Ned Johnson's message to shareholders. | |
Consumer Staples | Performance | |
Management's Discussion | ||
Shareholder Expense Example | ||
Investment Changes | ||
Investments | ||
Financial Statements | ||
Notes to the Financial Statements | ||
Gold | Performance | |
Management's Discussion | ||
Shareholder Expense Example | ||
Investment Changes | ||
Investments | ||
Financial Statements | ||
Notes to the Financial Statements | ||
Materials | Performance | |
Management's Discussion | ||
Shareholder Expense Example | ||
Investment Changes | ||
Investments | ||
Financial Statements | ||
Notes to the Financial Statements | ||
Telecommunications | Performance | |
Management's Discussion | ||
Shareholder Expense Example | ||
Investment Changes | ||
Investments | ||
Financial Statements | ||
Notes to the Financial Statements | ||
Report of Independent Registered Public Accounting Firm | ||
Trustees and Officers | ||
Distributions |
To view a fund's proxy voting guidelines and proxy voting record for the 12-month period ended June 30, visit www.fidelity.com/proxyvotingresults or visit the Securities and Exchange Commission's (SEC) web site at www.sec.gov. You may also call 1-877-208-0098 to request a free copy of the proxy voting guidelines.
Standard & Poor's, S&P and S&P 500 are registered service marks of The McGraw-Hill Companies, Inc. and have been licensed for use by Fidelity Distributors Corporation.
Other third party marks appearing herein are the property of their respective owners.
All other marks appearing herein are registered or unregistered trademarks or service marks of FMR Corp. or an affiliated company.
This report and the financial statements contained herein are submitted for the general information of the shareholders of the funds. This report is not authorized for distribution to prospective investors in the funds unless preceded or accompanied by an effective prospectus.
A fund files its complete schedule of portfolio holdings with the SEC for the first and third quarters of each fiscal year on Form N-Q. Forms N-Q are available on the SEC's web site at http://www.sec.gov. A fund's Forms N-Q may be reviewed and copied at the SEC's Public Reference Room in Washington, DC. Information regarding the operation of the SEC's Public Reference Room may be obtained by calling 1-800-SEC-0330. For a complete list of a fund's portfolio holdings, view the most recent quarterly holdings report, semiannual report, or annual report on Fidelity's web site at http://www.advisor.fidelity.com.
NOT FDIC INSURED · MAY LOSE VALUE · NO BANK GUARANTEE
Neither the funds nor Fidelity Distributors Corporation is a bank.
Annual Report
Chairman's Message
(Photograph of Edward C. Johnson 3d.)
Dear Shareholder:
Substantial single-day losses are not uncommon in the equity markets, and when they occur - as in late February - investors can be better served in the long term by buying good stocks at lower prices than by moving their money to the sidelines. While financial markets are always unpredictable, there are a number of time-tested principles that can put the historical odds in your favor.
One of the basic tenets is to invest for the long term. Over time, riding out the markets' inevitable ups and downs has proven much more effective than selling into panic or chasing the hottest trend. Even missing only a few of the markets' best days can significantly diminish investor returns. Patience also affords the benefits of compounding - of earning interest on additional income or reinvested dividends and capital gains. There are tax advantages and cost benefits to consider as well. The more you sell, the more taxes you pay, and the more you trade, the higher the costs. While staying the course doesn't eliminate risk, it can considerably lessen the effect of short-term declines.
You can further manage your investing risk through diversification. And today, more than ever, geographic diversification should be taken into account. Studies
indicate that asset allocation is the single most important determinant of a portfolio's long-term success. The right mix of stocks, bonds and cash - aligned to your particular risk tolerance and investment objective - is very important. Age-appropriate rebalancing is also an essential aspect of asset allocation. For younger investors, an emphasis on equities - which historically have been the best performing asset class over time - is encouraged. As investors near their specific goal, such as retirement or sending a child to college, consideration may be given to replacing volatile assets (e.g. common stocks) with more-stable fixed investments (bonds or savings plans).
A third investment principle - investing regularly - can help lower the average cost of your purchases. Investing a certain amount of money each month or quarter helps ensure you won't pay for all your shares at market highs. This strategy - known as dollar cost averaging - also reduces unconstructive "emotion" from investing, helping shareholders avoid selling weak performers just prior to an upswing, or chasing a hot performer just before a correction.
We invite you to contact us via the Internet, through our Investor Centers or over the phone. It is our privilege to provide you the information you need to make the investments that are right for you.
Sincerely,
/s/Edward C. Johnson 3d
Edward C. Johnson 3d
Annual Report
Fidelity Advisor Consumer Staples Fund - Class A, T, B and C
Performance
Average annual total return reflects the change in the value of an investment, assuming reinvestment of the class' dividend income and capital gains (the profits earned upon the sale of securities that have grown in value) and assuming a constant rate of performance each year. The $10,000 table and the fund's returns do not reflect the deduction of taxes that a shareholder would pay on fund distributions or the redemption of fund shares. During periods of reimbursement by Fidelity, a fund's total return will be greater than it would be had the reimbursement not occurred. How a fund did yesterday is no guarantee of how it will do tomorrow.
Average Annual Total Returns
Periods ended February 28, 2007 | Past 1 | Past 5 years | Past 10 |
Class A (incl. 5.75% sales charge) A | 11.68% | 7.51% | 8.03% |
Class T (incl. 3.50% sales charge) B | 14.15% | 7.98% | 8.27% |
Class B (incl. contingent deferred sales charge) C | 13.16% | 8.45% | 8.64% |
Class C (incl. contingent deferred sales charge) D | 17.14% | 8.73% | 8.64% |
A Class A shares bear a 0.25% 12b-1 fee. The initial offering of Class A shares took place on December 12, 2006. Returns prior to December 12, 2006 are those of Consumer Staples, the original class of the fund, which has no 12b-1 fee. Had Class A shares' 12b-1 fee been reflected, returns prior to December 12, 2006 would have been lower.
B Class T shares bear a 0.50% 12b-1 fee. The initial offering of Class T shares took place on December 12, 2006. Returns prior to December 12, 2006 are those of Consumer Staples, the original class of the fund, which has no 12b-1 fee. Had Class T shares' 12b-1 fee been reflected, returns prior to December 12, 2006 would have been lower.
C Class B shares bear a 1.00% 12b-1 fee. The initial offering of Class B shares took place on December 12, 2006. Returns prior to December 12, 2006 are those of Consumer Staples, the original class of the fund, which has no 12b-1 fee. Had Class B shares' 12b-1 fee been reflected, returns prior to December 12, 2006 would have been lower. Class B shares' contingent deferred sales charge included in the past one year, past five years, and past ten years total return figures are 5%, 2%, and 0%, respectively.
D Class C shares bear a 1.00% 12b-1 fee. The initial offering of Class C shares took place on December 12, 2006. Returns prior to December 12, 2006 are those of Consumer Staples, the original class of the fund, which has no 12b-1 fee. Had Class C shares' 12b-1 fee been reflected, returns prior to December 12, 2006 would have been lower. Class C shares' contingent deferred sales charge included in the past one year, past five years, and past ten years total return figures are 1%, 0%, and 0%, respectively.
Prior to October 1, 2006, Select Consumer Staples Portfolio was named Select Food and Agriculture Portfolio and operated under certain different investment policies. Effective October 1, 2006, shareholders of Select Consumer Staples Portfolio approved broadening the fund's focus so that it invests primarily in companies engaged in the manufacture, sale or distribution of consumer staples, including food and agriculture companies in which the fund previously invested, but also other consumer staples companies. The historical performance of the fund may not represent its current investment policies.
$10,000 Over 10 Years
Let's say hypothetically that $10,000 was invested in Fidelity Advisor Consumer Staples Fund - Class T (dagger) on February 28, 1997, and the current 3.50% sales charge was paid. The chart shows how the value of your investment would have changed, and also shows how the Standard & Poor's 500SM Index (S&P 500®) performed over the same period.
(dagger) Class T shares bear a 0.50% 12b-1 fee. The initial offering of Class T shares took place on December 12, 2006. Returns prior to December 12, 2006 are those of Consumer Staples, the original class of the fund, which has no 12b-1 fee. Had Class T shares' 12b-1 fee been reflected, returns prior to December 12, 2006 would have been lower.
Annual Report
Fidelity Advisor Consumer Staples Fund - Class A, T, B and C
Management's Discussion of Fund Performance
Comments from Robert Lee, Portfolio Manager of Fidelity Advisor Consumer Staples Fund
A strong year for stocks encountered some volatility near the end of the 12-month period ending February 28, 2007. On the day prior to the period's close, the Dow Jones Industrial AverageSM plunged 416 points and the Standard & Poor's 500SM Index lost roughly 3.5% of its value, plummeting nearly 50 points and marking the benchmark's worst single-day performance since the day the market reopened after the 9/11 terrorist attacks. Though investors were obviously rattled by the development, it was only the 22nd-biggest decline for the S&P 500® in 20 years, and it could not overshadow how well stocks performed for the 12 months overall. For much of the past year, investors grew confident that the economy would not fall into a recession, and they bid up most broad-based stock indexes for six consecutive months from August through January. Overall for the year ending February 28, 2007, the S&P 500 was up 11.97%, the Dow advanced 14.24%, the small-cap Russell 2000® Index gained 9.87% and the NASDAQ Composite® Index rose 6.66%.
It's important to point out that in connection with a restructuring of the product line effective October 1, 2006, the fund changed the benchmark to which it compares its performance. For the 12 months ending February 28, 2007, the fund outpaced the Morgan Stanley Capital InternationalSM (MSCI®) US Investable Market Consumer Staples Index, which returned 14.32%, and a blended index specific to this fund, which advanced 11.06%. This blended index is a combination of the Goldman Sachs® Consumer Industries Index, which the fund was compared with through September, and the new MSCI benchmark mentioned above, which the fund was compared with during the period's final five months1. The new supplemental benchmark and name change reflected a broadening of the fund's focus, from primarily food and agriculture stocks to the larger universe of all consumer staples issues. The portfolio also outperformed the S&P 500 for the 12-month period. (For specific performance information on the fund's Class A, Class T, Class B and Class C shares, please refer to the performance section of this report.) For the first seven months of the review period, the fund performed better than the Goldman Sachs index, driven by good stock selection and a strong showing from food and agriculture stocks in general, relative to weaker performing areas of the index such as home improvement retail, travel and publishing-which we did not own because they were outside the fund's narrow focus. Key contributors included supermarket chain Safeway, whose stock performed well as the company delivered improved sales and profit growth, and out-of-index Swiss food conglomerate Nestle. Not owning home improvement retailers Home Depot and Lowe's also aided relative results as those index components declined in price. On the negative side, the portfolio missed out on strong performance by cable giant Comcast and media conglomerate News Corp., two index components that were not owned because they were outside of our investment universe. The fund outperformed the MSCI index during the final five months of the period, powered by favorable stock selection. Strong performers included out-of-index holding British American Tobacco, Molson Coors Brewing and cigarette maker Loews Corp.-Carolina Group, which surpassed investor expectations when it delivered solid profit growth. I avoided discount warehouse chain Costco because I felt its stock was already richly valued, but the index component performed well and the fund's relative performance suffered. Drug retailer CVS also hurt fund results when its stock retreated. In response to the fund's benchmark and name changes, I shifted the portfolio's positioning to reflect the broadening of its investment universe. The weighting in packaged foods and meats was cut sharply, restaurant stocks were nearly eliminated, and I increased the weighting in household products and drug retailers.
1 The fund's blended index is a customized index developed by Fidelity for the limited purpose of discussing the fund's performance for the 12-month period ending February 28, 2007. From March 1, 2006, through September 30, 2006, the fund compared its performance to the Goldman Sachs Consumer Industries Index, which returned 6.22% during that period. On October 1, 2006, the fund began comparing its performance to a different index, the MSCI US Investable Market Consumer Staples Index, which returned 4.56% from October 1, 2006, through February 28, 2007. For the 12-month period ending February 28, 2007, the blended index (Goldman Sachs and MSCI) returned 11.06%.
The views expressed above reflect those of the portfolio manager(s) only through the end of the period as stated on the cover of this report and do not necessarily represent the views of Fidelity or any other person in the Fidelity organization. Any such views are subject to change at any time based upon market or other conditions and Fidelity disclaims any responsibility to update such views. These views may not be relied on as investment advice and, because investment decisions for a Fidelity fund are based on numerous factors, may not be relied on as an indication of trading intent on behalf of any Fidelity fund.
Annual Report
Select Consumer Staples Portfolio
Shareholder Expense Example
As a shareholder of the Fund, you incur two types of costs: (1) transaction costs, including sales charges (loads) on purchase payments or redemption proceeds, redemption fees, exchange fees, and (2) ongoing costs, including management fees, distribution and/or service (12-1) fees and other Fund expenses. This Example is intended to help you understand your ongoing costs (in dollars) of investing in the Fund and to compare these costs with the ongoing costs of investing in other mutual funds.
The actual Example is based on an investment of $1,000 at the beginning of the period and held for the entire period (September 1, 2006 to February 28, 2007) for the Consumer Staples class and for the entire period (December 12, 2006 to February 28, 2007) for Class A, Class T, Class B, Class C, and Institutional Class. The hypothetical expense Example is based on an investment of $1,000 invested for one-half year period (September 1, 2006 to February 28, 2007).
Actual Expenses
The first line of the accompanying table for each class of the Fund provides information about actual account values and actual expenses. You may use the information in this line, together with the amount you invested, to estimate the expenses that you paid over the period. Simply divide your account value by $1,000.00 (for example, an $8,600 account value divided by $1,000.00 = 8.6), then multiply the result by the number in the first line for a class of the Fund under the heading entitled "Expenses Paid During Period" to estimate the expenses you paid on your account during this period. A small balance maintenance fee of $12.00 that is charged once a year may apply for certain accounts with a value of less than $2,000. This fee is not included in the table below. If it was, the estimate of expenses you paid during the period would be higher, and your ending account value lower, by this amount.
Hypothetical Example for Comparison Purposes
The second line of the accompanying table for each class of the Fund provides information about hypothetical account values and hypothetical expenses based on a Class' actual expense ratio and an assumed rate of return of 5% per year before expenses, which is not the Class' actual return. The hypothetical account values and expenses may not be used to estimate the actual ending account balance or expenses you paid for the period. You may use this information to compare the ongoing costs of investing in the Fund and other funds. To do so, compare this 5% hypothetical example with the 5% hypothetical examples that appear in the shareholder reports of the other funds. A small balance maintenance fee of $12.00 that is charged once a year may apply for certain accounts with a value of less than $2,000. This fee is not included in the table below. If it was, the estimate of expenses you paid during the period would be higher, and your ending account value lower, by this amount.
Please note that the expenses shown in the table are meant to highlight your ongoing costs only and do not reflect any transaction costs. Therefore, the second line of the table is useful in comparing ongoing costs only, and will not help you determine the relative total costs of owning different funds. In addition, if these transactional costs were included, your costs would have been higher.
Beginning | Ending | Expenses | |
Class A | |||
Actual | $ 1,000.00 | $ 1,022.30 | $ 2.82B |
HypotheticalA | $ 1,000.00 | $ 1,018.40 | $ 6.46C |
Class T | |||
Actual | $ 1,000.00 | $ 1,020.60 | $ 3.52B |
HypotheticalA | $ 1,000.00 | $ 1,016.81 | $ 8.05C |
Class B | |||
Actual | $ 1,000.00 | $ 1,019.50 | $ 4.57B |
HypotheticalA | $ 1,000.00 | $ 1,014.43 | $ 10.44C |
Class C | |||
Actual | $ 1,000.00 | $ 1,019.30 | $ 4.68B |
HypotheticalA | $ 1,000.00 | $ 1,014.18 | $ 10.69C |
Consumer Staples | |||
Actual | $ 1,000.00 | $ 1,078.60 | $ 5.00B |
HypotheticalA | $ 1,000.00 | $ 1,019.98 | $ 4.86C |
Institutional Class | |||
Actual | $ 1,000.00 | $ 1,021.60 | $ 2.19B |
HypotheticalA | $ 1,000.00 | $ 1,019.84 | $ 5.01C |
A 5% return per year before expenses
B Actual expenses are equal to each Class' annualized expense ratio (shown in the table below); multiplied by the average account value over the period, multiplied by 181/365 (to reflect the one-half year period) for the Consumer Staples class and multiplied by 79/365 (to reflect the period December 12, 2006 to February 28, 2007) for the Class A, Class T, Class B, Class C and Institutional Class.
C Hypothetical expenses are equal to each Class' annualized expense ratio (shown in the table below); multiplied by the average account value over the period, multiplied by 181/365 (to reflect the one-half year period).
Annual Report
Annualized | |
Class A | 1.29% |
Class T | 1.61% |
Class B | 2.09% |
Class C | 2.14% |
Consumer Staples | .97% |
Institutional Class | 1.00% |
Annual Report
Select Consumer Staples Portfolio
Investment Changes
Top Ten Stocks as of February 28, 2007 | ||
% of fund's | % of fund's net assets | |
Procter & Gamble Co. | 18.0 | 1.5 |
PepsiCo, Inc. | 9.8 | 5.3 |
The Coca-Cola Co. | 8.0 | 5.8 |
Altria Group, Inc. | 5.7 | 6.5 |
British American Tobacco PLC sponsored ADR | 4.2 | 1.0 |
Colgate-Palmolive Co. | 4.1 | 1.4 |
CVS Corp. | 4.1 | 0.7 |
Nestle SA sponsored ADR | 4.0 | 7.5 |
Kroger Co. | 2.8 | 3.7 |
Safeway, Inc. | 2.2 | 2.9 |
62.9 | ||
Top Industries (% of fund's net assets) | |||
As of February 28, 2007 | |||
 | Beverages | 29.2% | |
 | Household Products | 22.1% | |
 | Food & Staples Retailing | 15.4% | |
 | Food Products | 14.4% | |
 | Tobacco | 12.3% | |
 | All Others* | 6.6% | |
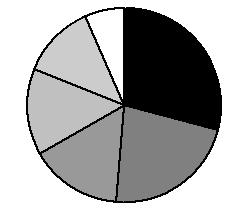
As of August 31, 2006 | |||
| Food Products | 29.7% | |
| Beverages | 20.0% | |
| Hotels, Restaurants & Leisure | 12.3% | |
| Food & Staples Retailing | 11.8% | |
| Tobacco | 9.1% | |
| All Others* | 17.1% | |

* Includes short-term investments and net other assets. |
Annual Report
Select Consumer Staples Portfolio
Investments February 28, 2007
Showing Percentage of Net Assets
Common Stocks - 96.6% | |||
Shares | Value | ||
BEVERAGES - 29.2% | |||
Brewers - 5.7% | |||
Anadolu Efes Biracilk Ve Malt Sanyii AS | 23,000 | $ 712,137 | |
Boston Beer Co., Inc. Class A (a) | 15,500 | 508,245 | |
Companhia de Bebidas das Americas (AmBev) (PN) sponsored ADR | 18,000 | 870,660 | |
Grupo Modelo SA de CV Series C | 173,000 | 889,921 | |
Heineken NV (Bearer) | 38,000 | 1,873,202 | |
InBev SA | 81,400 | 5,397,884 | |
Molson Coors Brewing Co. Class B | 90,700 | 7,658,708 | |
SABMiller PLC | 164,900 | 3,653,925 | |
21,564,682 | |||
Distillers & Vintners - 3.8% | |||
Brown-Forman Corp. Class B (non-vtg.) | 28,000 | 1,834,000 | |
Constellation Brands, Inc. Class A (sub. vtg.) | 50,900 | 1,194,114 | |
Diageo PLC sponsored ADR | 69,800 | 5,541,422 | |
Pernod Ricard SA | 27,200 | 5,614,879 | |
14,184,415 | |||
Soft Drinks - 19.7% | |||
Coca-Cola Femsa SA de CV sponsored ADR | 44,500 | 1,535,250 | |
Coca-Cola Hellenic Bottling Co. SA sponsored ADR | 92,000 | 3,591,680 | |
Coca-Cola Icecek AS | 124,000 | 921,444 | |
Fomento Economico Mexicano SA de CV sponsored ADR | 7,300 | 805,190 | |
Hansen Natural Corp. (a)(d) | 7,700 | 269,500 | |
PepsiCo, Inc. | 584,800 | 36,930,120 | |
The Coca-Cola Co. | 649,200 | 30,304,656 | |
74,357,840 | |||
TOTAL BEVERAGES | 110,106,937 | ||
BIOTECHNOLOGY - 0.2% | |||
Biotechnology - 0.2% | |||
Senomyx, Inc. (a) | 72,300 | 912,426 | |
FOOD & STAPLES RETAILING - 15.4% | |||
Drug Retail - 6.3% | |||
CVS Corp. | 488,300 | 15,337,503 | |
Rite Aid Corp. | 157,500 | 940,275 | |
Walgreen Co. | 171,300 | 7,658,823 | |
23,936,601 | |||
Food Distributors - 1.0% | |||
Sysco Corp. | 89,400 | 2,946,624 | |
United Natural Foods, Inc. (a) | 27,200 | 810,016 | |
3,756,640 | |||
Food Retail - 6.0% | |||
Kroger Co. | 407,600 | 10,463,092 | |
Safeway, Inc. | 241,100 | 8,334,827 | |
Tesco PLC | 107,000 | 908,024 | |
Shares | Value | ||
The Great Atlantic & Pacific Tea Co. (d) | 31,200 | $ 992,160 | |
Whole Foods Market, Inc. | 38,500 | 1,839,145 | |
22,537,248 | |||
Hypermarkets & Super Centers - 2.1% | |||
Wal-Mart Stores, Inc. | 163,900 | 7,916,370 | |
TOTAL FOOD & STAPLES RETAILING | 58,146,859 | ||
FOOD PRODUCTS - 14.4% | |||
Agricultural Products - 2.8% | |||
Archer-Daniels-Midland Co. | 168,500 | 5,793,030 | |
BioMar Holding AS | 10,000 | 461,754 | |
Bunge Ltd. | 35,000 | 2,777,600 | |
Corn Products International, Inc. | 28,600 | 914,342 | |
Nutreco Holding NV | 8,000 | 555,807 | |
10,502,533 | |||
Packaged Foods & Meats - 11.6% | |||
Cadbury Schweppes PLC sponsored ADR | 71,900 | 3,093,857 | |
Chiquita Brands International, Inc. | 35,500 | 514,750 | |
Groupe Danone | 23,200 | 3,675,917 | |
Industrias Bachoco SA de CV sponsored ADR | 32,000 | 921,600 | |
Kellogg Co. | 86,200 | 4,303,104 | |
Koninklijke Numico NV | 72,300 | 3,727,623 | |
Lindt & Spruengli AG | 72 | 1,845,858 | |
Marine Harvest ASA (a) | 1,123,000 | 1,373,152 | |
Nestle SA sponsored ADR | 160,800 | 15,010,680 | |
Smithfield Foods, Inc. (a) | 30,000 | 876,300 | |
TreeHouse Foods, Inc. (a) | 100 | 2,885 | |
Tyson Foods, Inc. Class A | 51,200 | 934,400 | |
Unilever NV (NY Shares) | 289,600 | 7,520,912 | |
43,801,038 | |||
TOTAL FOOD PRODUCTS | 54,303,571 | ||
HOTELS, RESTAURANTS & LEISURE - 0.1% | |||
Restaurants - 0.1% | |||
Starbucks Corp. (a) | 8,000 | 247,200 | |
HOUSEHOLD PRODUCTS - 22.1% | |||
Household Products - 22.1% | |||
Colgate-Palmolive Co. | 230,800 | 15,546,688 | |
Procter & Gamble Co. | 1,065,697 | 67,661,103 | |
83,207,791 | |||
PERSONAL PRODUCTS - 2.4% | |||
Personal Products - 2.4% | |||
Avon Products, Inc. | 218,100 | 7,995,546 | |
Bare Escentuals, Inc. | 27,205 | 946,462 | |
Herbalife Ltd. (a) | 100 | 3,765 | |
8,945,773 | |||
Common Stocks - continued | |||
Shares | Value | ||
PHARMACEUTICALS - 0.5% | |||
Pharmaceuticals - 0.5% | |||
Johnson & Johnson | 29,000 | $ 1,828,450 | |
TOBACCO - 12.3% | |||
Tobacco - 12.3% | |||
Altria Group, Inc. | 253,700 | 21,381,836 | |
British American Tobacco PLC sponsored ADR | 259,400 | 15,825,994 | |
Japan Tobacco, Inc. | 197 | 895,785 | |
Loews Corp. - Carolina Group | 102,000 | 7,347,060 | |
Souza Cruz Industria Comerico | 57,000 | 1,032,209 | |
46,482,884 | |||
TOTAL COMMON STOCKS (Cost $327,830,942) | 364,181,891 | ||
Money Market Funds - 2.7% | |||
Fidelity Cash Central Fund, 5.35% (b) | 9,119,079 | $ 9,119,079 | |
Fidelity Securities Lending Cash Central Fund, 5.34% (b)(c) | 1,106,675 | 1,106,675 | |
TOTAL MONEY MARKET FUNDS (Cost $10,225,754) | 10,225,754 | ||
TOTAL INVESTMENT PORTFOLIO - 99.3% (Cost $338,056,696) | 374,407,645 |
NET OTHER ASSETS - 0.7% | 2,574,384 | ||
NET ASSETS - 100% | $ 376,982,029 | ||
Legend |
(a) Non-income producing |
(b) Affiliated fund that is available only to investment companies and other accounts managed by Fidelity Investments. The rate quoted is the annualized seven-day yield of the fund at period end. A complete unaudited listing of the fund's holdings as of its most recent quarter end is available upon request. |
(c) Investment made with cash collateral received from securities on loan. |
(d) Security or a portion of the security is on loan at period end. |
Affiliated Central Funds |
Information regarding fiscal year to date income earned by the Fund from investments in Fidelity Central Funds is as follows: |
Fund | Income earned |
Fidelity Cash Central Fund | $ 570,365 |
Fidelity Securities Lending Cash Central Fund | 75,627 |
Total | $ 645,992 |
Other Information |
Distribution of investments by country of issue, as a percentage of total net assets, is as follows: |
United States of America | 75.8% |
United Kingdom | 7.7% |
Switzerland | 4.5% |
Netherlands | 3.7% |
France | 2.5% |
Belgium | 1.4% |
Mexico | 1.1% |
Greece | 1.0% |
Others (individually less than 1%) | 2.3% |
100.0% |
See accompanying notes which are an integral part of the financial statements.
Annual Report
Select Consumer Staples Portfolio
Financial Statements
Statement of Assets and Liabilities
February 28, 2007 | ||
Assets | ||
Investment in securities, at value (including securities loaned of $1,032,700) - See accompanying schedule: Unaffiliated issuers (cost $327,830,942) | $ 364,181,891 | |
Fidelity Central Funds (cost $10,225,754) | 10,225,754 | |
Total Investments (cost $338,056,696) | $ 374,407,645 | |
Receivable for investments sold | 2,050,469 | |
Receivable for fund shares sold | 6,163,051 | |
Dividends receivable | 214,904 | |
Distributions receivable from Fidelity Central Funds | 49,643 | |
Prepaid expenses | 694 | |
Other receivables | 6,547 | |
Total assets | 382,892,953 | |
Liabilities | ||
Payable for investments purchased | $ 3,114,636 | |
Payable for fund shares redeemed | 1,377,606 | |
Accrued management fee | 173,754 | |
Distribution fees payable | 557 | |
Other affiliated payables | 89,302 | |
Other payables and accrued expenses | 48,394 | |
Collateral on securities loaned, at value | 1,106,675 | |
Total liabilities | 5,910,924 | |
Net Assets | $ 376,982,029 | |
Net Assets consist of: | ||
Paid in capital | $ 331,654,886 | |
Undistributed net investment income | 810,260 | |
Accumulated undistributed net realized gain (loss) on investments and foreign currency transactions | 8,165,882 | |
Net unrealized appreciation (depreciation) on investments and assets and liabilities in foreign currencies | 36,351,001 | |
Net Assets | $ 376,982,029 | |
Statement of Assets and Liabilities - continued
February 28, 2007 | ||
Calculation of Maximum Offering Price Class A: | $ 58.16 | |
Maximum offering price per share (100/94.25 of $58.16) | $ 61.71 | |
Class T: | $ 58.06 | |
Maximum offering price per share (100/96.50 of $58.06) | $ 60.17 | |
Class B: | $ 58.00 | |
Class C: | $ 57.99 | |
Consumer Staples: | $ 58.13 | |
Institutional Class: | $ 58.12 | |
A Redemption price per share is equal to net asset value less any applicable contingent deferred sales charge.
See accompanying notes which are an integral part of the financial statements.
Annual Report
Select Consumer Staples Portfolio
Financial Statements - continued
Statement of Operations
Year ended February 28, 2007 | ||
Investment Income | ||
Dividends | $ 3,921,319 | |
Interest | 53 | |
Income from Fidelity Central Funds | 645,992 | |
Total income | 4,567,364 | |
Expenses | ||
Management fee | $ 1,315,325 | |
Transfer agent fees | 691,650 | |
Distribution fees | 1,011 | |
Accounting and security lending fees | 102,795 | |
Custodian fees and expenses | 53,919 | |
Independent trustees' compensation | 822 | |
Registration fees | 127,628 | |
Audit | 36,636 | |
Legal | 3,326 | |
Miscellaneous | 10,350 | |
Total expenses before reductions | 2,343,462 | |
Expense reductions | (68,570) | 2,274,892 |
Net investment income (loss) | 2,292,472 | |
Realized and Unrealized Gain (Loss) Net realized gain (loss) on: | ||
Investment securities: | ||
Unaffiliated issuers | 23,020,008 | |
Foreign currency transactions | (10,609) | |
Total net realized gain (loss) | 23,009,399 | |
Change in net unrealized appreciation (depreciation) on: Investment securities | 13,327,071 | |
Assets and liabilities in foreign currencies | 311 | |
Total change in net unrealized appreciation (depreciation) | 13,327,382 | |
Net gain (loss) | 36,336,781 | |
Net increase (decrease) in net assets resulting from operations | $ 38,629,253 | |
Statement of Changes in Net Assets
Year ended | Year ended | |
Increase (Decrease) in Net Assets | ||
Operations | ||
Net investment income (loss) | $ 2,292,472 | $ 1,263,331 |
Net realized gain (loss) | 23,009,399 | 8,287,843 |
Change in net unrealized appreciation (depreciation) | 13,327,382 | (385,129) |
Net increase (decrease) in net assets resulting from operations | 38,629,253 | 9,166,045 |
Distributions to shareholders from net investment income | (1,582,908) | (1,049,605) |
Distributions to shareholders from net realized gain | (15,661,672) | (6,158,772) |
Total distributions | (17,244,580) | (7,208,377) |
Share transactions - net increase (decrease) | 230,543,294 | (16,300,126) |
Redemption fees | 47,547 | 20,664 |
Total increase (decrease) in net assets | 251,975,514 | (14,321,794) |
Net Assets | ||
Beginning of period | 125,006,515 | 139,328,309 |
End of period (including undistributed net investment income of $810,260 and undistributed net investment income of $237,173, respectively) | $ 376,982,029 | $ 125,006,515 |
See accompanying notes which are an integral part of the financial statements.
Annual Report
Financial Highlights - Class A
Years ended February 28, | 2007 H |
Selected Per-Share Data | |
Net asset value, beginning of period | $ 56.89 |
Income from Investment Operations | |
Net investment income (loss) E | (.01) |
Net realized and unrealized gain (loss) | 1.28 |
Total from investment operations | 1.27 |
Redemption fees added to paid in capital E | - J |
Net asset value, end of period | $ 58.16 |
Total Return B,C,D | 2.23% |
Ratios to Average Net Assets F,I | |
Expenses before reductions | 1.29% A |
Expenses net of fee waivers, if any | 1.29% A |
Expenses net of all reductions | 1.28% A |
Net investment income (loss) | (.11)% A |
Supplemental Data | |
Net assets, end of period (000 omitted) | $ 986 |
Portfolio turnover rate G | 99% |
A Annualized B Total returns for periods of less than one year are not annualized. C Total returns would have been lower had certain expenses not been reduced during the periods shown. D Total returns do not include the effect of the sales charges. E Calculated based on average shares outstanding during the period. F Fees and expenses of the underlying Fidelity Central Funds are not included in the Fund's expense ratio. The Fund indirectly bears its proportionate share of the expenses of any underlying Fidelity Central Funds. G Amount does not include the portfolio activity of any underlying Fidelity Central Funds. H For the period December 12, 2006 (commencement of sale of shares) to February 28, 2007. I Expense ratios reflect operating expenses of the class. Expenses before reductions do not reflect amounts reimbursed by the investment adviser or reductions from brokerage service arrangements or other expense offset arrangements and do not represent the amount paid by the class during periods when reimbursements or reductions occur. Expenses net of fee waivers reflect expenses after reimbursement by the investment adviser but prior to reductions from brokerage service arrangements or other expense offset arrangements. Expenses net of all reductions represent the net expenses paid by the class. J Amount represents less than $.01 per share. |
Financial Highlights - Class T
Years ended February 28, | 2007 H |
Selected Per-Share Data | |
Net asset value, beginning of period | $ 56.89 |
Income from Investment Operations | |
Net investment income (loss) E | (.01) |
Net realized and unrealized gain (loss) | 1.18 |
Total from investment operations | 1.17 |
Redemption fees added to paid in capital E | - J |
Net asset value, end of period | $ 58.06 |
Total Return B,C,D | 2.06% |
Ratios to Average Net Assets F,I | |
Expenses before reductions | 1.61% A |
Expenses net of fee waivers, if any | 1.61% A |
Expenses net of all reductions | 1.60% A |
Net investment income (loss) | (.11)% A |
Supplemental Data | |
Net assets, end of period (000 omitted) | $ 529 |
Portfolio turnover rate G | 99% |
A Annualized B Total returns for periods of less than one year are not annualized. C Total returns would have been lower had certain expenses not been reduced during the periods shown. D Total returns do not include the effect of the sales charges. E Calculated based on average shares outstanding during the period. F Fees and expenses of the underlying Fidelity Central Funds are not included in the Fund's expense ratio. The Fund indirectly bears its proportionate share of the expenses of any underlying Fidelity Central Funds. G Amount does not include the portfolio activity of any underlying Fidelity Central Funds. H For the period December 12, 2006 (commencement of sale of shares) to February 28, 2007. I Expense ratios reflect operating expenses of the class. Expenses before reductions do not reflect amounts reimbursed by the investment adviser or reductions from brokerage service arrangements or other expense offset arrangements and do not represent the amount paid by the class during periods when reimbursements or reductions occur. Expenses net of fee waivers reflect expenses after reimbursement by the investment adviser but prior to reductions from brokerage service arrangements or other expense offset arrangements. Expenses net of all reductions represent the net expenses paid by the class. J Amount represents less than $.01 per share. |
See accompanying notes which are an integral part of the financial statements.
Annual Report
Financial Highlights - Class B
Years ended February 28, | 2007 H |
Selected Per-Share Data | |
Net asset value, beginning of period | $ 56.89 |
Income from Investment Operations | |
Net investment income (loss) E | (.07) |
Net realized and unrealized gain (loss) | 1.18 |
Total from investment operations | 1.11 |
Redemption fees added to paid in capital E | - J |
Net asset value, end of period | $ 58.00 |
Total Return B,C,D | 1.95% |
Ratios to Average Net Assets F,I | |
Expenses before reductions | 2.09% A |
Expenses net of fee waivers, if any | 2.09% A |
Expenses net of all reductions | 2.09% A |
Net investment income (loss) | (.59)% A |
Supplemental Data | |
Net assets, end of period (000 omitted) | $ 226 |
Portfolio turnover rate G | 99% |
A Annualized B Total returns for periods of less than one year are not annualized. C Total returns would have been lower had certain expenses not been reduced during the periods shown. D Total returns do not include the effect of the contingent deferred sales charge. E Calculated based on average shares outstanding during the period. F Fees and expenses of the underlying Fidelity Central Funds are not included in the Fund's expense ratio. The Fund indirectly bears its proportionate share of the expenses of any underlying Fidelity Central Funds. G Amount does not include the portfolio activity of any underlying Fidelity Central Funds. H For the period December 12, 2006 (commencement of sale of shares) to February 28, 2007. I Expense ratios reflect operating expenses of the class. Expenses before reductions do not reflect amounts reimbursed by the investment adviser or reductions from brokerage service arrangements or other expense offset arrangements and do not represent the amount paid by the class during periods when reimbursements or reductions occur. Expenses net of fee waivers reflect expenses after reimbursement by the investment adviser but prior to reductions from brokerage service arrangements or other expense offset arrangements. Expenses net of all reductions represent the net expenses paid by the class. J Amount represents less than $.01 per share. |
Financial Highlights - Class C
Years ended February 28, | 2007 H |
Selected Per-Share Data | |
Net asset value, beginning of period | $ 56.89 |
Income from Investment Operations | |
Net investment income (loss) E | (.08) |
Net realized and unrealized gain (loss) | 1.18 |
Total from investment operations | 1.10 |
Redemption fees added to paid in capital E | - J |
Net asset value, end of period | $ 57.99 |
Total Return B,C,D | 1.93% |
Ratios to Average Net Assets F,I | |
Expenses before reductions | 2.14% A |
Expenses net of fee waivers, if any | 2.14% A |
Expenses net of all reductions | 2.14% A |
Net investment income (loss) | (.66)% A |
Supplemental Data | |
Net assets, end of period (000 omitted) | $ 178 |
Portfolio turnover rate G | 99% |
A Annualized B Total returns for periods of less than one year are not annualized. C Total returns would have been lower had certain expenses not been reduced during the periods shown. D Total returns do not include the effect of the contingent deferred sales charge. E Calculated based on average shares outstanding during the period. F Fees and expenses of the underlying Fidelity Central Funds are not included in the Fund's expense ratio. The Fund indirectly bears its proportionate share of the expenses of any underlying Fidelity Central Funds. G Amount does not include the portfolio activity of any underlying Fidelity Central Funds. H For the period December 12, 2006 (commencement of sale of shares) to February 28, 2007. I Expense ratios reflect operating expenses of the class. Expenses before reductions do not reflect amounts reimbursed by the investment adviser or reductions from brokerage service arrangements or other expense offset arrangements and do not represent the amount paid by the class during periods when reimbursements or reductions occur. Expenses net of fee waivers reflect expenses after reimbursement by the investment adviser but prior to reductions from brokerage service arrangements or other expense offset arrangements. Expenses net of all reductions represent the net expenses paid by the class. J Amount represents less than $.01 per share. |
See accompanying notes which are an integral part of the financial statements.
Annual Report
Financial Highlights - Consumer Staples
Years ended February 28, | 2007 | 2006 | 2005 | 2004 G | 2003 |
Selected Per-Share Data | |||||
Net asset value, beginning of period | $ 52.18 | $ 51.42 | $ 46.50 | $ 35.71 | $ 44.68 |
Income from Investment Operations | |||||
Net investment income (loss) C | .56 | .50 | .29 | .22 | .25 |
Net realized and unrealized gain (loss) | 8.88 | 3.25 | 4.90 | 10.80 | (8.06) |
Total from investment operations | 9.44 | 3.75 | 5.19 | 11.02 | (7.81) |
Distributions from net investment income | (.32) | (.44) | (.29) | (.24) | (.32) |
Distributions from net realized gain | (3.18) | (2.56) | - | - | (.88) |
Total distributions | (3.50) | (3.00) | (.29) | (.24) | (1.20) |
Redemption fees added to paid in capital C | .01 | .01 | .02 | .01 | .04 |
Net asset value, end of period | $ 58.13 | $ 52.18 | $ 51.42 | $ 46.50 | $ 35.71 |
Total Return A,B | 18.43% | 7.50% | 11.24% | 30.94% | (17.85)% |
Ratios to Average Net Assets D,F | |||||
Expenses before reductions | 1.01% | 1.04% | 1.06% | 1.27% | 1.25% |
Expenses net of fee waivers, if any | .99% | 1.04% | 1.06% | 1.27% | 1.25% |
Expenses net of all reductions | .98% | 1.03% | 1.05% | 1.25% | 1.17% |
Net investment income (loss) | .99% | .97% | .61% | .55% | .59% |
Supplemental Data | |||||
Net assets, end of period (000 omitted) | $ 374,930 | $ 125,007 | $ 139,328 | $ 104,436 | $ 88,123 |
Portfolio turnover rate E | 99% | 75% | 86% | 62% | 225% |
A Total returns would have been lower had certain expenses not been reduced during the periods shown. B Total returns do not include the effect of the former sales charges. C Calculated based on average shares outstanding during the period. D Fees and expenses of the underlying Fidelity Central Funds are not included in the Fund's expense ratio. The Fund indirectly bears its proportionate share of the expenses of any underlying Fidelity Central Funds. E Amount does not include the portfolio activity of any underlying Fidelity Central Funds. F Expense ratios reflect operating expenses of the class. Expenses before reductions do not reflect amounts reimbursed by the investment adviser or reductions from brokerage service arrangements or other expense offset arrangements and do not represent the amount paid by the class during periods when reimbursements or reductions occur. Expenses net of fee waivers reflect expenses after reimbursement by the investment adviser but prior to reductions from brokerage service arrangements or other expense offset arrangements. Expenses net of all reductions represent the net expenses paid by the class. G For the year ended February 29. |
Financial Highlights - Institutional Class
Years ended February 28, | 2007 G |
Selected Per-Share Data | |
Net asset value, beginning of period | $ 56.89 |
Income from Investment Operations | |
Net investment income (loss)D | .07 |
Net realized and unrealized gain (loss) | 1.16 |
Total from investment operations | 1.23 |
Redemption fees added to paid in capitalD | - I |
Net asset value, end of period | $ 58.12 |
Total Return B,C | 2.16% |
Ratios to Average Net Assets E,H | |
Expenses before reductions | 1.00% A |
Expenses net of fee waivers, if any | 1.00% A |
Expenses net of all reductions | 1.00% A |
Net investment income (loss) | .57% A |
Supplemental Data | |
Net assets, end of period (000 omitted) | $ 132 |
Portfolio turnover rate F | 99% |
A Annualized B Total returns for periods of less than one year are not annualized. C Total returns would have been lower had certain expenses not been reduced during the periods shown. D Calculated based on average shares outstanding during the period. E Fees and expenses of the underlying Fidelity Central Funds are not included in the Fund's expense ratio. The Fund indirectly bears its proportionate share of the expenses of any underlying Fidelity Central Funds. F Amount does not include the portfolio activity of any underlying Fidelity Central Funds. G For the period December 12, 2006 (commencement of sale of shares) to February 28, 2007. H Expense ratios reflect operating expenses of the class. Expenses before reductions do not reflect amounts reimbursed by the investment adviser or reductions from brokerage service arrangements or other expense offset arrangements and do not represent the amount paid by the class during periods when reimbursements or reductions occur. Expenses net of fee waivers reflect expenses after reimbursement by the investment adviser but prior to reductions from brokerage service arrangements or other expense offset arrangements. Expenses net of all reductions represent the net expenses paid by the class. I Amount represents less than $.01 per share. |
See accompanying notes which are an integral part of the financial statements.
Annual Report
Notes to Financial Statements
For the period ended February 28, 2007
1. Organization.
Consumer Staples Portfolio (formerly Food and Agriculture Portfolio) (the Fund) is a non-diversified fund of Fidelity Select Portfolios (the trust) and is authorized to issue an unlimited number of shares. The trust is registered under the Investment Company Act of 1940, as amended (the 1940 Act), as an open-end management investment company organized as a Massachusetts business trust. The Fund invests primarily in securities of companies whose principal business activities fall within specific industries. The Fund offers Class A, Class T, Class B, Class C, Consumer Staples, and Institutional Class shares, each of which has equal rights as to assets and voting privileges. Each class has exclusive voting rights with respect to matters that affect that class. The Fund commenced sale of Class A, Class T, Class B, Class C and Institutional Class shares and the existing class was designated Consumer Staples on December 12, 2006. Class B shares will automatically convert to Class A shares after a holding period of seven years from the initial date of purchase. Investment income, realized and unrealized capital gains and losses, the common expenses of the Fund, and certain fund-level expense reductions, if any, are allocated on a pro rata basis to each class based on the relative net assets of each class to the total net assets of the Fund. Each class differs with respect to transfer agent and distribution and service plan fees incurred. Certain expense reductions also differ by class. The financial statements have been prepared in conformity with accounting principles generally accepted in the United States of America, which require management to make certain estimates and assumptions at the date of the financial statements.
2. Investments in Fidelity Central Funds.
The Fund may invest in Fidelity Central Funds which are open-end investment companies available only to other investment companies and accounts managed by FMR and its affiliates. The Fund's Schedule of Investments lists each of the Fidelity Central Funds as an investment of the Fund but does not include the underlying holdings of each Fidelity Central Fund. As an Investing Fund, the Fund indirectly bears its proportionate share of the expenses of the underlying Fidelity Central Funds. A complete unaudited list of holdings for each Fidelity Central Fund is available upon request. In addition, the financial statements of the Fidelity Central Funds, which are not covered by the Fund's Report of Independent Registered Public Accounting Firm, are available on the EDGAR Database on the SEC's web site, www.sec.gov, or upon request.
The Money Market Central Funds seek preservation of capital and current income and are managed by Fidelity Investments Money Management, Inc. (FIMM), an affiliate of Fidelity Management & Research Company (FMR).
3. Significant Accounting Policies.
The following summarizes the significant accounting policies of the Fund:
Security Valuation. Investments are valued and net asset value (NAV) per share is calculated (NAV calculation) as of the close of business of the New York Stock Exchange (NYSE), normally 4:00 p.m. Eastern time. During the period the Fund also calculated a NAV each hour on the hour (commencing at 10:00 a.m. Eastern time until one hour prior to the close of business on the NYSE). Effective October 1, 2006 the Fund eliminated hourly NAV calculation.
Wherever possible, the Fund uses independent pricing services approved by the Board of Trustees to value its investments. Equity securities, including restricted securities, for which market quotations are readily available, are valued at the last reported sale price or official closing price as reported by an independent pricing service on the primary market or exchange on which they are traded. In the event there were no sales during the day or closing prices are not available, securities are valued at the last quoted bid price. Investments in open-end mutual funds, including the Fidelity Central Funds, are valued at their closing net asset value each business day. Short-term securities with remaining maturities of sixty days or less for which quotations are not readily available are valued at amortized cost, which approximates value.
When current market prices or quotations are not readily available or do not accurately reflect fair value, valuations may be determined in accordance with procedures adopted by the Board of Trustees. For example, when developments occur between the close of a market and the close of the NYSE that may materially affect the value of some or all of the securities, or when trading in a security is halted, those securities may be fair valued. Factors used in the determination of fair value may include monitoring news to identify significant market or security specific events such as changes in the value of U.S. securities markets, reviewing developments in foreign markets and evaluating the performance of ADRs, futures contracts and exchange-traded funds. Because the Fund's utilization of fair value pricing depends on market activity, the frequency with which fair value pricing is used cannot be predicted and may be utilized to a significant extent. The value of securities used for NAV calculation under fair value pricing may differ from published prices for the same securities.
Foreign Currency. The Fund uses foreign currency contracts to facilitate transactions in foreign-denominated securities. Losses from these transactions may arise from changes in the value of the foreign currency or if the counterparties do not perform under the contracts' terms.
Annual Report
3. Significant Accounting Policies - continued
Foreign Currency - continued
Foreign-denominated assets, including investment securities, and liabilities are translated into U.S. dollars at the exchange rate at period end. Purchases and sales of investment securities, income and dividends received and expenses denominated in foreign currencies are translated into U.S. dollars at the exchange rate in effect on the transaction date.
The effects of exchange rate fluctuations on investments are included with the net realized and unrealized gain (loss) on investment securities. Other foreign currency transactions resulting in realized and unrealized gain (loss) are disclosed separately.
Investment Transactions and Income. For financial reporting purposes, the Fund's investment holdings and NAV include trades executed through the end of the last business day of the period. The NAV for processing shareholder transactions includes trades executed through the end of the prior business day. Gains and losses on securities sold are determined on the basis of identified cost and may include proceeds received from litigation. Dividend income is recorded on the ex-dividend date, except for certain dividends from foreign securities where the ex-dividend date may have passed, which are recorded as soon as the Fund is informed of the ex-dividend date. Non-cash dividends included in dividend income, if any, are recorded at the fair market value of the securities received. Distributions received on securities that represent a return of capital or capital gain are recorded as a reduction of cost of investments and/or as a realized gain. The Fund estimates the components of distributions received that may be considered return of capital distributions or capital gain distributions. Interest income and distributions from the Fidelity Central Funds are accrued as earned, with any distributions receivable as of period end included in Distributions receivable from Fidelity Central Funds on the Statement of Assets and Liabilities. Interest income includes coupon interest and amortization of premium and accretion of discount on debt securities. Investment income is recorded net of foreign taxes withheld where recovery of such taxes is uncertain.
Expenses. Most expenses of the trust can be directly attributed to a fund. Expenses which cannot be directly attributed are apportioned among each Fund in the trust. Expense estimates are accrued in the period to which they relate and adjustments are made when actual amounts are known.
Income Tax Information and Distributions to Shareholders. Each year, the Fund intends to qualify as a regulated investment company by distributing all of its taxable income and realized gains under Subchapter M of the Internal Revenue Code. As a result, no provision for income taxes is required in the accompanying financial statements. Foreign taxes are provided for based on the Fund's understanding of the tax rules and rates that exist in the foreign markets in which it invests.
Distributions are recorded on the ex-dividend date. Income dividends and capital gain distributions are declared separately for each class. Income and capital gain distributions are determined in accordance with income tax regulations, which may differ from generally accepted accounting principles. In addition, the Fund will claim a portion of the payment made to redeeming shareholders as a distribution for income tax purposes.
Capital accounts within the financial statements are adjusted for permanent book-tax differences. These adjustments have no impact on net assets or the results of operations. Temporary book-tax differences will reverse in a subsequent period.
Book-tax differences are primarily due to short-term capital gains, foreign currency transactions and losses deferred due to wash sales.
The tax-basis components of distributable earnings and the federal tax cost as of period end were as follows:
Unrealized appreciation | $ 38,446,201 |
Unrealized depreciation | (2,642,135) |
Net unrealized appreciation (depreciation) | 35,804,066 |
Undistributed ordinary income | 2,363,461 |
Undistributed long-term capital gain | 2,384,179 |
Cost for federal income tax purposes | $ 338,603,579 |
The tax character of distributions paid was as follows:
February 28, 2007 | February 28, 2006 | |
Ordinary Income | $ 1,582,908 | $ 1,906,227 |
Long-term Capital Gains | 15,661,672 | 5,302,150 |
Total | $ 17,244,580 | $ 7,208,377 |
Trading (Redemption) Fees. Shares in the Fund held less than 30 days are subject to a redemption fee equal to .75% of the net asset value of shares redeemed. All redemption fees, including any estimated redemption fees paid by FMR, are retained by the Fund and accounted for as an addition to paid in capital. Shareholders were also subject to an additional $7.50 fee for shares exchanged into another Fidelity fund (see Note 6).
Annual Report
Notes to Financial Statements - continued
3. Significant Accounting Policies - continued
New Accounting Pronouncements. In July 2006, Financial Accounting Standards Board Interpretation No. 48, Accounting for Uncertainty in Income Taxes - an interpretation of FASB Statement 109 (FIN 48), was issued and is effective on the last business day of the semiannual reporting period for fiscal years beginning after December 15, 2006. FIN 48 sets forth a threshold for financial statement recognition, measurement and disclosure of a tax position taken or expected to be taken on a tax return. Management is currently evaluating the impact, if any, the adoption of FIN 48 will have on the Fund's net assets, results of operations and financial statement disclosures.
In addition, in September 2006, Statement of Financial Accounting Standards No. 157, Fair Value Measurements (SFAS 157), was issued and is effective for fiscal years beginning after November 15, 2007. SFAS 157 defines fair value, establishes a framework for measuring fair value and expands disclosures about fair value measurements. Management is currently evaluating the impact the adoption of SFAS 157 will have on the Fund's financial statement disclosures.
4. Operating Policies.
Repurchase Agreements. FMR has received an Exemptive Order from the Securities and Exchange Commission (the SEC) which permits the Fund and other affiliated entities of FMR to transfer uninvested cash balances into joint trading accounts which are then invested in repurchase agreements. The Fund may also invest directly with institutions in repurchase agreements. Repurchase agreements are collateralized by government or non-government securities. Upon settlement date, collateral is held in segregated accounts with custodian banks and may be obtained in the event of a default of the counterparty. The Fund monitors, on a daily basis, the value of the collateral to ensure it is at least equal to the principal amount of the repurchase agreement (including accrued interest). In the event of a default by the counterparty, realization of the collateral proceeds could be delayed, during which time the value of the collateral may decline.
5. Purchases and Sales of Investments.
Purchases and sales of securities, other than short-term securities, aggregated $426,154,222 and $222,805,678, respectively.
6. Fees and Other Transactions with Affiliates.
Management Fee. FMR and its affiliates provide the Fund with investment management related services for which the Fund pays a monthly management fee. The management fee is the sum of an individual fund fee rate that is based on an annual rate of .30% of the Fund's average net assets and a group fee rate that averaged .26% during the period. The group fee rate is based upon the average net assets of all the mutual funds advised by FMR. The group fee rate decreases as assets under management increase and increases as assets under management decrease. For the period, the total annual management fee rate was .57% of the Fund's average net assets.
Distribution and Service Plan. In accordance with Rule 12b-1 of the 1940 Act, the Fund has adopted separate Distribution and Service Plans for each class of shares. Certain classes pay Fidelity Distributors Corporation (FDC), an affiliate of FMR, separate Distribution and Service Fees, each of which is based on an annual percentage of each class' average net assets. In addition, FDC may pay financial intermediaries for selling shares of the Fund and providing shareholder support services. For the period, the Distribution and Service Fee rates and the total amounts paid to and retained by FDC were as follows:
Distribution | Service | Paid to | Retained | |
Class A | -% | .25% | $ 241 | $ 130 |
Class T | .25% | .25% | 208 | 112 |
Class B | .75% | .25% | 290 | 275 |
Class C | .75% | .25% | 272 | 261 |
$ 1,011 | $ 778 |
Sales Load. FDC receives a front-end sales charge of up to 5.75% for selling Class A shares, and 3.50% for selling Class T shares, some of which is paid to financial intermediaries for selling shares of the Fund. FDC receives the proceeds of contingent deferred sales charges levied on Class A, Class T, Class B, and Class C redemptions. These charges depend on the holding period. The deferred sales charges range from 5% to 1% for Class B, 1% for Class C, 1.00% to .50% for certain purchases of Class A shares and .25% for certain purchases of Class T shares.
Annual Report
6. Fees and Other Transactions with Affiliates - continued
Sales Load - continued
For the period, sales charge amounts retained by FDC were as follows:
Retained | |
Class A | $ 357 |
Class T | 405 |
$ 762 |
Transfer Agent Fees. Fidelity Investments Institutional Operations Company, Inc. (FIIOC), an affiliate of FMR, is the transfer, dividend disbursing and shareholder servicing agent for each class of the Fund, except for Consumer Staples. Fidelity Service Company, Inc. (FSC), an affiliate of FMR, is the transfer agent for Consumer Staples shares. FIIOC and FSC receive account fees and asset-based fees that vary according to the account size and type of account of the shareholders of the respective classes of the Fund. FIIOC and FSC pay for typesetting, printing and mailing of shareholder reports, except proxy statements. For the period, the total transfer agent fees paid by each class to FIIOC or FSC, were as follows:
Amount | % of | |
Class A | $ 112 | .13 |
Class T | 82 | .21 |
Class B | 61 | .22 |
Class C | 73 | .29 |
Consumer Staples | 691,220 | .30 |
Institutional Class | 102 | .27 |
$ 691,650 |
Accounting and Security Lending Fees. FSC maintains the Fund's accounting records. The accounting fee is based on the level of average net assets for the month. Under a separate contract, FSC administers the security lending program. The security lending fee is based on the number and duration of lending transactions.
Exchange Fees. During the period, FSC received the proceeds of a $7.50 fee to cover administrative costs associated with exchanges out of the Fund to any other Fidelity Select fund or to any other Fidelity fund made through non-automated channels. Effective October 1, 2006, the exchange fees were eliminated. For the period, exchange fees retained by FSC were as follows:
Retained | |
Consumer Staples Portfolio | $ 923 |
Brokerage Commissions. The Fund placed a portion of its portfolio transactions with brokerage firms which are affiliates of the investment adviser. The commissions paid to these affiliated firms were $1,593 for the period.
7. Committed Line of Credit.
The Fund participates with other funds managed by FMR in a $4.2 billion credit facility (the "line of credit") to be utilized for temporary or emergency purposes to fund shareholder redemptions or for other short-term liquidity purposes. The Fund has agreed to pay commitment fees on its pro rata portion of the line of credit, which amounted to $506 and is reflected in Miscellaneous Expense on the Statement of Operations. During the period, there were no borrowings on this line of credit.
Annual Report
Notes to Financial Statements - continued
8. Security Lending.
The Fund lends portfolio securities from time to time in order to earn additional income. On the settlement date of the loan, the Fund receives collateral (in the form of U.S. Treasury obligations, letters of credit and/or cash) against the loaned securities and maintains collateral in an amount not less than 100% of the market value of the loaned securities during the period of the loan. The market value of the loaned securities is determined at the close of business of the Fund and any additional required collateral is delivered to the Fund on the next business day. If the borrower defaults on its obligation to return the securities loaned because of insolvency or other reasons, a fund could experience delays and costs in recovering the securities loaned or in gaining access to the collateral. Any cash collateral received is invested in the Fidelity Securities Lending Cash Central Fund. The value of loaned securities and cash collateral at period end are disclosed on the Fund's Statement of Assets and Liabilities. Security lending income represents the income earned on investing cash collateral, less fees and expenses associated with the loan, plus any premium payments that may be received on the loan of certain types of securities. Security lending income is presented in the Statement of Operations as a component of income from Fidelity Central Funds. Net income from lending portfolio securities during the period amounted to $75,627.
9. Expense Reductions.
FMR voluntarily agreed to reimburse a portion of Consumer Staples' operating expenses. During the period, this reimbursement reduced the class' expenses by $56,875.
Many of the brokers with whom FMR places trades on behalf of the Fund provided services to the Fund in addition to trade execution. These services included payments of certain expenses on behalf of the Fund totaling $5,788 for the period. In addition, through arrangements with the Fund's custodian and each class' transfer agent, credits realized as a result of uninvested cash balances were used to reduce the Fund's expenses. During the period, these credits reduced the Fund's custody expenses by $970. During the period, credits reduced each class' transfer agent expense as noted in the table below.
Transfer Agent | |
Consumer Staples | $ 2,309 |
10. Other.
The Fund's organizational documents provide former and current trustees and officers with a limited indemnification against liabilities arising in connection with the performance of their duties to the Fund. In the normal course of business, the Fund may also enter into contracts that provide general indemnifications. The Fund's maximum exposure under these arrangements is unknown as this would be dependent on future claims that may be made against the Fund. The risk of material loss from such claims is considered remote.
The United States Securities and Exchange Commission ("SEC") is conducting an investigation of FMR (covering the years 2002 to 2004) arising from gifts, gratuities and business entertainment provided by certain brokers to certain individuals who were employed on FMR's domestic equity trading desk during that period. FMR is in discussions with the SEC staff regarding the possible resolution of the matter, but as of period-end no final resolution has been reached.
In December 2006, the Independent Trustees completed their own investigation of the matter with the assistance of independent counsel. The Independent Trustees and FMR agree that, despite the absence of proof that the Fidelity mutual funds experienced diminished execution quality as a result of the improper receipt of gifts and business entertainment, the conduct at issue was serious and is worthy of redress. Accordingly, the Independent Trustees have requested and FMR has agreed to pay $42 million to Fidelity mutual funds, plus interest to be determined at the time that payment is made. A method of allocating this payment among the funds has not yet been determined. The total payment to the Fund is not anticipated to have a material impact on the Fund's net assets. In addition, FMR reimbursed related legal expenses which are recorded in the accompanying Statement of Operations as an expense reduction.
11. Distributions to Shareholders.
Distributions to shareholders of each class were as follows:
Years ended February 28, | 2007 | 2006 |
From net investment income | ||
Consumer Staples | $ 1,582,908 | $ 1,049,605 |
From net realized gain | ||
Consumer Staples | $ 15,661,672 | $ 6,158,772 |
Annual Report
12. Share Transactions.
Transactions for each class of shares were as follows:
Shares | Dollars | |||
Years ended February 28, | 2007 A | 2006 | 2007 A | 2006 |
Class A | ||||
Shares sold | 17,300 | - | $ 1,017,780 | $ - |
Shares redeemed | (340) | - | (20,214) | - |
Net increase (decrease) | 16,960 | - | $ 997,566 | $ - |
Class T | ||||
Shares sold | 9,119 | - | $ 531,803 | $ - |
Shares redeemed | - | - | - | - |
Net increase (decrease) | 9,119 | - | $ 531,803 | $ - |
Class B | ||||
Shares sold | 3,902 | - | $ 225,744 | $ - |
Shares redeemed | - | - | - | - |
Net increase (decrease) | 3,902 | - | $ 225,744 | $ - |
Class C | ||||
Shares sold | 3,073 | - | $ 177,350 | $ - |
Shares redeemed | - | - | - | - |
Net increase (decrease) | 3,073 | - | $ 177,350 | $ - |
Consumer Staples | ||||
Shares sold | 6,369,570 | 932,427 | $ 359,958,201 | $ 47,926,666 |
Reinvestment of distributions | 292,584 | 133,891 | 16,482,463 | 6,802,073 |
Shares redeemed | (2,608,360) | (1,380,263) | (147,956,526) | (71,028,865) |
Net increase (decrease) | 4,053,794 | (313,945) | $ 228,484,138 | $ (16,300,126) |
Institutional Class | ||||
Shares sold | 4,028 | - | $ 230,500 | $ - |
Shares redeemed | (1,758) | - | (103,807) | - |
Net increase (decrease) | 2,270 | - | $ 126,693 | $ - |
A Share transactions for Class A, Class T, Class B, Class C and Institutional Class are for the period December 12, 2006 (commencement of sale of shares) to February 28, 2007.
Annual Report
Fidelity Advisor Gold Fund - Class A, T, B and C
Performance
Average annual total return reflects the change in the value of an investment, assuming reinvestment of the class' dividend income and capital gains (the profits earned upon the sale of securities that have grown in value) and assuming a constant rate of performance each year. The $10,000 table and the fund's returns do not reflect the deduction of taxes that a shareholder would pay on fund distributions or the redemption of fund shares. During periods of reimbursement by Fidelity, a fund's total return will be greater than it would be had the reimbursement not occurred. How a fund did yesterday is no guarantee of how it will do tomorrow.
Average Annual Total Returns
Periods ended February 28, 2007 | Past 1 | Past 5 | Past 10 |
Class A (incl. 5.75% sales charge) A | 9.48% | 21.44% | 6.32% |
Class T (incl. 3.50% sales charge) B | 11.97% | 21.99% | 6.56% |
Class B (incl. contingent deferred sales charge) C | 10.93% | 22.66% | 6.94% |
Class C (incl. contingent deferred sales charge) D | 14.87% | 22.83% | 6.93% |
A Class A shares bear a 0.25% 12b-1 fee. The initial offering of Class A shares took place on December 12, 2006. Returns prior to December 12, 2006 are those of Gold, the original class of the fund, which has no 12b-1 fee. Had Class A shares' 12b-1 fee been reflected, returns prior to December 12, 2006 would have been lower.
B Class T shares bear a 0.50% 12b-1 fee. The initial offering of Class T shares took place on December 12, 2006. Returns prior to December 12, 2006 are those of Gold, the original class of the fund, which has no 12b-1 fee. Had Class T shares' 12b-1 fee been reflected, returns prior to December 12, 2006 would have been lower.
C Class B shares bear a 1.00% 12b-1 fee. The initial offering of Class B shares took place on December 12, 2006. Returns prior to December 12, 2006 are those of Gold, the original class of the fund, which has no 12b-1 fee. Had Class B shares' 12b-1 fee been reflected, returns prior to December 12, 2006 would have been lower. Class B shares' contingent deferred sales charge included in the past one year, past five years, and past ten years total return figures are 5%, 2%, and 0%, respectively.
D Class C shares bear a 1.00% 12b-1 fee. The initial offering of Class C shares took place on December 12, 2006. Returns prior to December 12, 2006 are those of Gold, the original class of the fund, which has no 12b-1 fee. Had Class C shares' 12b-1 fee been reflected, returns prior to December 12, 2006 would have been lower. Class C shares' contingent deferred sales charge included in the past one year, past five years, and past ten years total return figures are 1%, 0%, and 0%, respectively.
$10,000 Over 10 Years
Let's say hypothetically that $10,000 was invested in Fidelity Advisor Gold Fund - Class T (dagger) on February 28, 1997, and the current 3.50% sales charge was paid. The chart shows how the value of your investment would have changed, and also shows how the Standard & Poor's 500 Index performed over the same period.
(dagger) Class T shares bear a 0.50% 12b-1 fee. The initial offering of Class T shares took place on December 12, 2006. Returns prior to December 12, 2006 are those of Gold, the original class of the fund, which has no 12b-1 fee. Had Class T shares' 12b-1 fee been reflected, returns prior to December 12, 2006 would have been lower.
Annual Report
Fidelity Advisor Gold Fund - Class A, T, B and C
Management's Discussion of Fund Performance
Comments from Daniel Dupont, Portfolio Manager of Fidelity Advisor Gold Fund
A rosy year for stocks wilted just prior to the end of the 12-month period ending February 28, 2007. On the day prior to the period's close, the Dow Jones Industrial AverageSM plunged 416 points and the Standard & Poor's 500SM Index lost roughly 3.5% of its value, plummeting nearly 50 points and marking the benchmark's worst single-day performance since the day the market reopened after the 9/11 terrorist attacks. Though investors were obviously rattled by the development, it was only the 22nd-biggest decline for the S&P 500® in 20 years, and it could not overshadow how well stocks performed for the 12 months overall. For much of the past year, investors grew confident that the economy would not fall into a recession, and they bid up most broad-based stock indexes for six consecutive months from August through January. Overall for the year ending February 28, 2007, the S&P 500 was up 11.97%, the Dow advanced 14.24%, the small-cap Russell 2000® Index gained 9.87% and the NASDAQ Composite® Index rose 6.66%.
It's important to point out that in conjunction with a restructuring of the product line effective October 1, 2006, the fund changed the benchmark to which it compares its performance. During the past year, the fund handily outperformed the 10.69% return of the Standard & Poor's®/Citigroup BMI Global Gold Index and also topped the 12.67% gain of a blended index specific to this fund. This blended index is a combination of the Goldman Sachs® Natural Resources Index, which the fund was compared with through September, and the new S&P®/Citigroup benchmark mentioned above, which the fund was compared with during the period's final five months1. During the same 12-month period, the portfolio also beat the S&P 500. (For specific performance information on the fund's Class A, Class T, Class B and Class C shares, please refer to the performance section of this report.) For the first seven months of the review period, the fund outperformed the Goldman Sachs index. Favorable stock selection in precious metals and minerals added considerable value, although the benefits largely were offset by an overweighted exposure to that group, which lagged the index. The fund's positions in platinum producers were especially beneficial. A lack of exposure to most energy-related groups also helped, as crude oil and natural gas prices fell sharply in the early fall after peaking during the summer. During the same seven months, the price of gold finished modestly higher, which helped the fund. Our cash position provided a boost as well. Conversely, unrewarding picks in the diversified metals and mining segment hurt the fund's results. Not owning integrated oil and gas producers, one of the stronger energy categories and a major group in the Goldman Sachs index, also detracted. Further, the fund's absolute performance was curbed by unfavorable currency movements. Among individual holdings, Canada-based Cambior was a notable contributor; the company received a lucrative buyout offer from IAMGOLD in September, helping the stock. Also boosting the fund's return was Aquarius Platinum, a Bermuda-incorporated company based in Australia, with significant properties in South Africa. Both contributors were out-of-benchmark positions, and I sold Aquarius Platinum to lock in profits. On the downside, Aber Diamond was the fund's largest detractor during the seven-month period. Flat diamond prices and a harsh Canadian winter that closed access roads for longer than normal were factors hurting the stock. During the final five months of the period, the fund handily outperformed the S&P/Citigroup index. Stock picking in precious metals and minerals again added value, along with effective choices in diversified metals and mining. Significantly underweighting Canada-based Barrick Gold aided our results. Also having a positive impact on performance was Bema Gold, another Canadian producer of the yellow metal, which was acquired during the period by Kinross Gold. Conversely, not owning Yamana Gold detracted. Although I thought the stock was overvalued, it advanced amid excitement about the company's flagship Chapada mine in Brazil beginning production on schedule in November and early indications that production was meeting or exceeding expectations. Overall, the fund shifted to a higher concentration in gold stocks, bringing it more in line with the new S&P/Citigroup benchmark.
1 The fund's blended index is a customized index developed by Fidelity for the limited purpose of discussing the fund's performance for the 12-month period ending February 28, 2007. From March 1, 2006, through September 30, 2006, the fund compared its performance to the Goldman Sachs Natural Resources Index, which returned 2.61% during that period. On October 1, 2006, the fund began comparing its performance to a different index, the S&P/Citigroup BMI Global Gold Index, which returned 9.80% from October 1, 2006, through February 28, 2007. For the 12-month period ending February 28, 2007, the blended index (Goldman Sachs and S&P/Citigroup) returned 12.67%.
The views expressed above reflect those of the portfolio manager(s) only through the end of the period as stated on the cover of this report and do not necessarily represent the views of Fidelity or any other person in the Fidelity organization. Any such views are subject to change at any time based upon market or other conditions and Fidelity disclaims any responsibility to update such views. These views may not be relied on as investment advice and, because investment decisions for a Fidelity fund are based on numerous factors, may not be relied on as an indication of trading intent on behalf of any Fidelity fund.
Annual Report
Shareholder Expense Example
As a shareholder of the Fund, you incur two types of costs: (1) transaction costs, including sales charges (loads) on purchase payments or redemption proceeds, redemption fees, exchange fees, and (2) ongoing costs, including management fees, distribution and/or service (12b-1) fees and other Fund expenses. This Example is intended to help you understand your ongoing costs (in dollars) of investing in the Fund and to compare these costs with the ongoing costs of investing in other mutual funds.
The actual Example is based on an investment of $1,000 at the beginning of the period and held for the entire period (September 1, 2006 to February 28, 2007) for the Gold class and for the entire period (December 12, 2006 to February 28, 2007) for Class A, Class T, Class B, Class C, and Institutional Class. The hypothetical expense Example is based on an investment of $1,000 invested for one-half year period (September 1, 2006 to February 28, 2007).
Actual Expenses
The first line of the accompanying table for each class of the Fund provides information about actual account values and actual expenses. You may use the information in this line, together with the amount you invested, to estimate the expenses that you paid over the period. Simply divide your account value by $1,000.00 (for example, an $8,600 account value divided by $1,000.00 = 8.6), then multiply the result by the number in the first line for a class of the Fund under the heading entitled "Expenses Paid During Period" to estimate the expenses you paid on your account during this period. A small balance maintenance fee of $12.00 that is charged once a year may apply for certain accounts with a value of less than $2,000. This fee is not included in the table below. If it was, the estimate of expenses you paid during the period would be higher, and your ending account value lower, by this amount.
Hypothetical Example for Comparison Purposes
The second line of the accompanying table for each class of the Fund provides information about hypothetical account values and hypothetical expenses based on a Class' actual expense ratio and an assumed rate of return of 5% per year before expenses, which is not the Class' actual return. The hypothetical account values and expenses may not be used to estimate the actual ending account balance or expenses you paid for the period. You may use this information to compare the ongoing costs of investing in the Fund and other funds. To do so, compare this 5% hypothetical example with the 5% hypothetical examples that appear in the shareholder reports of the other funds. A small balance maintenance fee of $12.00 that is charged once a year may apply for certain accounts with a value of less than $2,000. This fee is not included in the table below. If it was, the estimate of expenses you paid during the period would be higher, and your ending account value lower, by this amount.
Please note that the expenses shown in the table are meant to highlight your ongoing costs only and do not reflect any transaction costs. Therefore, the second line of the table is useful in comparing ongoing costs only, and will not help you determine the relative total costs of owning different funds. In addition, if these transactional costs were included, your costs would have been higher.
Beginning | Ending | Expenses | |
Class A | |||
Actual | $ 1,000.00 | $ 998.10 | $ 2.44B |
HypotheticalA | $ 1,000.00 | $ 1,019.19 | $ 5.66 C |
Class T | |||
Actual | $ 1,000.00 | $ 997.00 | $ 3.16B |
HypotheticalA | $ 1,000.00 | $ 1,017.55 | $ 7.30 C |
Class B | |||
Actual | $ 1,000.00 | $ 996.20 | $ 4.23B |
HypotheticalA | $ 1,000.00 | $ 1,015.08 | $ 9.79 C |
Class C | |||
Actual | $ 1,000.00 | $ 995.60 | $ 4.36 B |
HypotheticalA | $ 1,000.00 | $ 1,014.78 | $ 10.09 C |
Gold | |||
Actual | $ 1,000.00 | $ 1,050.90 | $ 4.47 B |
HypotheticalA | $ 1,000.00 | $ 1,020.43 | $ 4.41 C |
Institutional Class | |||
Actual | $ 1,000.00 | $ 998.40 | $ 2.03 B |
HypotheticalA | $ 1,000.00 | $ 1,020.13 | $ 4.71 C |
A 5% return per year before expenses
B Actual expenses are equal to each Class' annualized expense ratio (shown in the table below); multiplied by the average account value over the period, multiplied by 181/365 (to reflect the one-half year period) for the Gold class and multiplied by 79/365 (to reflect the period December 12, 2006 to February 28, 2007) for the Class A, Class T, Class B, Class C and Institutional Class.
C Hypothetical expenses are equal to each Class' annualized expense ratio (shown in the table below); multiplied by the average account value over the period, multiplied by 181/365 (to reflect the one-half year period).
Annual Report
Annualized | |
Class A | 1.13% |
Class T | 1.46% |
Class B | 1.96% |
Class C | 2.02% |
Gold | .88% |
Institutional Class | .94% |
Annual Report
Investment Changes
Top Ten Stocks as of February 28, 2007 | ||
% of fund's | % of fund's net assets | |
Newcrest Mining Ltd. | 9.6 | 9.1 |
Meridian Gold, Inc. | 9.6 | 9.5 |
Newmont Mining Corp. | 8.5 | 4.6 |
Barrick Gold Corp. | 8.1 | 5.4 |
IAMGOLD Corp. | 5.7 | 2.5 |
Kinross Gold Corp. | 5.5 | 0.0 |
Goldcorp, Inc. | 4.6 | 2.3 |
Lihir Gold Ltd. | 4.4 | 1.9 |
Gold Fields Ltd. sponsored ADR | 4.1 | 1.3 |
Arizona Star Resource Corp. | 3.0 | 2.0 |
63.1 | ||
Top Industries (% of fund's net assets) | |||
As of February 28, 2007 | |||
| Gold | 78.8% | |
 | Precious Metals & Minerals | 10.4% | |
 | Diversified Metals & Mining | 1.1% | |
| All Others* | 9.7% | |

As of August 31, 2006 | |||
| Gold | 54.8% | |
| Precious Metals & Minerals | 26.4% | |
| Diversified Metals & Mining | 9.2% | |
| All Others* | 9.6% | |

* Includes short-term investments and net other assets. |
Annual Report
Investments February 28, 2007
Showing Percentage of Net Assets
Common Stocks - 90.3% | |||
Shares | Value | ||
Australia - 10.0% | |||
METALS & MINING - 10.0% | |||
Gold - 9.6% | |||
Newcrest Mining Ltd. | 7,999,971 | $ 142,145,664 | |
Precious Metals & Minerals - 0.4% | |||
Central Asia Gold Ltd. (a)(e) | 12,025,834 | 5,874,969 | |
TOTAL METALS & MINING | 148,020,633 | ||
Canada - 51.0% | |||
METALS & MINING - 51.0% | |||
Gold - 42.9% | |||
Agnico-Eagle Mines Ltd. | 200,000 | 7,873,114 | |
Alamos Gold, Inc. (a) | 600,000 | 4,745,415 | |
Arizona Star Resource Corp. (a)(e) | 3,800,000 | 43,863,024 | |
Barrick Gold Corp. | 4,000,000 | 119,430,550 | |
Bema Gold Corp. warrants 9/7/11 (a) | 600,000 | 1,282,545 | |
Coral Gold Resources Ltd. (a)(e) | 672,200 | 2,034,618 | |
Crystallex International Corp. (a) | 11,000,000 | 32,918,644 | |
Eldorado Gold Corp. (a) | 1,500,000 | 8,952,161 | |
Goldcorp, Inc. | 2,516,900 | 67,530,522 | |
High River Gold Mines Ltd. (a)(f) | 1,000,000 | 1,915,267 | |
High River Gold Mines Ltd. warrants 1/27/08 (a) | 332,500 | 107,730 | |
IAMGOLD Corp. | 10,000,000 | 83,536,403 | |
Kinross Gold Corp. (a) | 5,787,600 | 81,354,490 | |
Meridian Gold, Inc. (a)(e) | 5,160,000 | 141,535,462 | |
Novagold Resources, Inc. (a) | 600,000 | 9,901,244 | |
Orezone Resources, Inc. Class A (a)(e) | 10,000,000 | 18,041,127 | |
Tone Resources Ltd. (a)(e) | 1,908,400 | 2,366,021 | |
White Knight Resources Ltd. (a)(e) | 3,955,300 | 6,087,418 | |
633,475,755 | |||
Precious Metals & Minerals - 8.1% | |||
Aber Diamond Corp. | 799,990 | 28,591,836 | |
Minefinders Corp. Ltd. (a)(e) | 3,100,000 | 33,742,038 | |
Nevada Pacific Gold Ltd. (a) | 2,699,900 | 2,677,854 | |
Pan American Silver Corp. (a)(d) | 500,000 | 15,010,004 | |
Shore Gold, Inc. (a) | 6,000,000 | 39,245,864 | |
SouthernEra Diamonds, Inc. Class A (a) | 2,210,000 | 510,196 | |
119,777,792 | |||
TOTAL METALS & MINING | 753,253,547 | ||
Shares | Value | ||
Papua New Guinea - 4.4% | |||
METALS & MINING - 4.4% | |||
Gold - 4.4% | |||
Lihir Gold Ltd. (a)(d) | 25,000,020 | $ 65,399,902 | |
Peru - 1.9% | |||
METALS & MINING - 1.9% | |||
Precious Metals & Minerals - 1.9% | |||
Compania de Minas Buenaventura SA | 400,000 | 10,905,672 | |
Compania de Minas Buenaventura SA sponsored ADR (d) | 600,000 | 16,632,000 | |
27,537,672 | |||
Russia - 0.5% | |||
METALS & MINING - 0.5% | |||
Gold - 0.5% | |||
Polyus Gold OJSC sponsored ADR (a) | 150,000 | 7,807,500 | |
South Africa - 8.1% | |||
METALS & MINING - 8.1% | |||
Gold - 8.1% | |||
Anglogold Ashanti Ltd. sponsored ADR | 800,000 | 35,248,000 | |
Gold Fields Ltd. | 175,000 | 3,085,250 | |
Gold Fields Ltd. sponsored ADR (d) | 3,400,000 | 59,942,000 | |
Harmony Gold Mining Co. Ltd. (a) | 1,300,000 | 17,979,000 | |
Harmony Gold Mining Co. Ltd. sponsored ADR (a)(d) | 200,000 | 2,766,000 | |
119,020,250 | |||
United Kingdom - 3.4% | |||
METALS & MINING - 3.4% | |||
Diversified Metals & Mining - 1.1% | |||
African Platinum PLC (a) | 15,000,000 | 15,985,305 | |
Gold - 2.3% | |||
Randgold Resources Ltd. sponsored ADR | 1,500,000 | 34,350,000 | |
TOTAL METALS & MINING | 50,335,305 | ||
United States of America - 11.0% | |||
METALS & MINING - 11.0% | |||
Gold - 11.0% | |||
Newmont Mining Corp. | 2,800,000 | 126,196,000 | |
Royal Gold, Inc. (d) | 1,000,000 | 33,100,000 | |
US Gold Corp. (a) | 728,400 | 3,350,640 | |
US Gold Corp. warrants 2/22/11 (a)(g) | 364,200 | 566,753 | |
163,213,393 | |||
TOTAL COMMON STOCKS (Cost $1,065,462,510) | 1,334,588,202 | ||
Money Market Funds - 9.6% | |||
Shares | Value | ||
Fidelity Cash Central Fund, 5.35% (b) | 129,196,888 | $ 129,196,888 | |
Fidelity Securities Lending Cash Central Fund, 5.34% (b)(c) | 12,653,825 | 12,653,825 | |
TOTAL MONEY MARKET FUNDS (Cost $141,850,713) | 141,850,713 | ||
TOTAL INVESTMENT PORTFOLIO - 99.9% (Cost $1,207,313,223) | 1,476,438,915 |
NET OTHER ASSETS - 0.1% | 1,635,942 | ||
NET ASSETS - 100% | $ 1,478,074,857 | ||
Legend |
(a) Non-income producing |
(b) Affiliated fund that is available only to investment companies and other accounts managed by Fidelity Investments. The rate quoted is the annualized seven-day yield of the fund at period end. A complete unaudited listing of the fund's holdings as of its most recent quarter end is available upon request. |
(c) Investment made with cash collateral received from securities on loan. |
(d) Security or a portion of the security is on loan at period end. |
(e) Affiliated company |
(f) Security exempt from registration under Rule 144A of the Securities Act of 1933. These securities may be resold in transactions exempt from registration, normally to qualified institutional buyers. At the end of the period, the value of these securities amounted to $1,915,267, or 0.1% of net assets. |
(g) Restricted securities - Investment in securities not registered under the Securities Act of 1933 (excluding 144A issues). At the end of the period, the value of restricted securities (excluding 144A issues) amounted to $566,753 or 0.0% of net assets. |
Additional information on each holding is as follows: |
Security | Acquisition Date | Acquisition Cost |
US Gold Corp. warrants 2/22/11 | 2/8/06 | $ 179,112 |
Affiliated Central Funds |
Information regarding fiscal year to date income earned by the Fund from investments in Fidelity Central Funds is as follows: |
Fund | Income earned |
Fidelity Cash Central Fund | $ 7,327,656 |
Fidelity Securities Lending Cash Central Fund | 679,059 |
Total | $ 8,006,715 |
Other Affiliated Issuers |
An affiliated company is a company in which the fund has ownership of at least 5% of the voting securities. Fiscal year to date transactions with companies which are or were affiliates are as follows: |
Affiliates | Value, | Purchases | Sales | Dividend | Value, |
Aber Diamond Corp. | $ 101,949,189 | $ 42,793,742 | $ 99,101,298 | $ 2,210,686 | $ - |
Arizona Star Resource Corp. | 15,418,356 | 22,659,170 | - | - | 43,863,024 |
Bolivar Gold Corp. | 31,025,393 | - | 31,022,986 | - | - |
Cambior, Inc. | 65,449,104 | 16,604,300 | 30,024,720 | - | - |
Central Asia Gold Ltd. | - | 4,104,140 | - | - | 5,874,969 |
Coral Gold Resources Ltd. | - | 2,147,230 | - | - | 2,034,618 |
Crystallex International Corp. | 42,908,067 | 2,972,762 | 17,990,417 | - | - |
Meridian Gold, Inc. | 126,303,743 | 31,759,576 | 29,346,935 | - | 141,535,462 |
Minefinders Corp. Ltd. | 29,636,932 | 4,727,146 | 12,087,665 | - | 33,742,038 |
Orezone Resources, Inc. Class A | 14,417,110 | 5,744,298 | - | - | 18,041,127 |
Tone Resources Ltd. | - | 2,726,660 | - | - | 2,366,021 |
White Knight Resources Ltd. | - | 7,289,086 | - | - | 6,087,418 |
Total | $ 427,107,894 | $ 143,528,110 | $ 219,574,021 | $ 2,210,686 | $ 253,544,677 |
Income Tax Information |
The fund has a capital loss carryforward of $5,961,929, which was acquired in the merger with Select Precious Metals and Minerals, which will expire on February 29, 2008, and is available to offset future capital gains of the fund up to $5,961,929 per year as provided by regulations. |
See accompanying notes which are an integral part of the financial statements.
Annual Report
Financial Statements
Statement of Assets and Liabilities
February 28, 2007 | ||
Assets | ||
Investment in securities, at value (including securities loaned of $12,630,696) - See accompanying schedule: Unaffiliated issuers (cost $874,630,732) | $ 1,081,043,525 | |
Fidelity Central Funds (cost $141,850,713) | 141,850,713 | |
Other affiliated issuers (cost $190,831,778) | 253,544,677 | |
Total Investments (cost $1,207,313,223) | $ 1,476,438,915 | |
Receivable for investments sold | 16,410,389 | |
Receivable for fund shares sold | 6,177,590 | |
Dividends receivable | 593,802 | |
Distributions receivable from Fidelity Central Funds | 447,486 | |
Prepaid expenses | 6,183 | |
Other receivables | 68,504 | |
Total assets | 1,500,142,869 | |
Liabilities | ||
Payable for fund shares redeemed | $ 8,250,825 | |
Accrued management fee | 705,891 | |
Distribution fees payable | 1,403 | |
Other affiliated payables | 328,864 | |
Other payables and accrued expenses | 127,204 | |
Collateral on securities loaned, at value | 12,653,825 | |
Total liabilities | 22,068,012 | |
Net Assets | $ 1,478,074,857 | |
Net Assets consist of: | ||
Paid in capital | $ 1,198,251,552 | |
Undistributed net investment income | 9,093,033 | |
Accumulated undistributed net realized gain (loss) on investments and foreign currency transactions | 1,645,198 | |
Net unrealized appreciation (depreciation) on investments and assets and liabilities in foreign currencies | 269,085,074 | |
Net Assets | $ 1,478,074,857 | |
Statement of Assets and Liabilities - continued
February 28, 2007 | ||
Calculation of Maximum Offering Price Class A: | $ 36.53 | |
Maximum offering price per share (100/94.25 of $36.53) | $ 38.76 | |
Class T: | $ 36.49 | |
Maximum offering price per share (100/96.50 of $36.49) | $ 37.81 | |
Class B: | $ 36.46 | |
Class C: | $ 36.44 | |
Gold: | $ 36.54 | |
Institutional Class: | $ 36.54 | |
A Redemption price per share is equal to net asset value less any applicable contingent deferred sales charge.
See accompanying notes which are an integral part of the financial statements.
Annual Report
Select Gold Portfolio
Financial Statements - continued
Statement of Operations
Year ended February 28, 2007 | ||
Investment Income | ||
Dividends (including $2,210,686 earned from other affiliated issuers) | $ 10,716,485 | |
Special dividends | 3,157,383 | |
Interest | 10,770 | |
Income from Fidelity Central Funds | 8,006,715 | |
Total income | 21,891,353 | |
Expenses | ||
Management fee | $ 8,349,362 | |
Transfer agent fees | 3,783,836 | |
Distribution fees | 2,316 | |
Accounting and security lending fees | 542,179 | |
Custodian fees and expenses | 314,883 | |
Independent trustees' compensation | 5,822 | |
Registration fees | 203,492 | |
Audit | 42,802 | |
Legal | 25,393 | |
Miscellaneous | 63,112 | |
Total expenses before reductions | 13,333,197 | |
Expense reductions | (537,549) | 12,795,648 |
Net investment income (loss) | 9,095,705 | |
Realized and Unrealized Gain (Loss) Net realized gain (loss) on: | ||
Investment securities: | ||
Unaffiliated issuers | 107,844,457 | |
Other affiliated issuers | (63,460) | |
Foreign currency transactions | (538,205) | |
Total net realized gain (loss) | 107,242,792 | |
Change in net unrealized appreciation (depreciation) on: Investment securities | 60,342,102 | |
Assets and liabilities in foreign currencies | (202,987) | |
Total change in net unrealized appreciation (depreciation) | 60,139,115 | |
Net gain (loss) | 167,381,907 | |
Net increase (decrease) in net assets resulting from operations | $ 176,477,612 | |
Statement of Changes in Net Assets
Year ended | Year ended | |
Increase (Decrease) in Net Assets | ||
Operations | ||
Net investment income (loss) | $ 9,095,705 | $ 1,051,643 |
Net realized gain (loss) | 107,242,792 | 215,186,894 |
Change in net unrealized appreciation (depreciation) | 60,139,115 | 130,381,517 |
Net increase (decrease) in net assets resulting from operations | 176,477,612 | 346,620,054 |
Distributions to shareholders from net investment income | (754,152) | (507,609) |
Distributions to shareholders from net realized gain | (195,955,908) | (106,134,254) |
Total distributions | (196,710,060) | (106,641,863) |
Share transactions - net increase (decrease) | 170,798,657 | 378,795,227 |
Redemption fees | 1,843,164 | 1,675,648 |
Total increase (decrease) in net assets | 152,409,373 | 620,449,066 |
Net Assets | ||
Beginning of period | 1,325,665,484 | 705,216,418 |
End of period (including undistributed net investment income of $9,093,033 and undistributed net investment income of $1,049,798, respectively) | $ 1,478,074,857 | $ 1,325,665,484 |
See accompanying notes which are an integral part of the financial statements.
Annual Report
Financial Highlights - Class A
Year ended February 28, | 2007 I |
Selected Per-Share Data | |
Net asset value, beginning of period | $ 36.60 |
Income from Investment Operations | |
Net investment income (loss) E | (.01) |
Net realized and unrealized gain (loss) | (.07) H |
Total from investment operations | (.08) |
Redemption fees added to paid in capital E | .01 |
Net asset value, end of period | $ 36.53 |
Total Return B,C,D | (.19)% |
Ratios to Average Net Assets F,J | |
Expenses before reductions | 1.13% A |
Expenses net of fee waivers, if any | 1.13% A |
Expenses net of all reductions | 1.10% A |
Net investment income (loss) | (.18)% A |
Supplemental Data | |
Net assets, end of period (000 omitted) | $ 1,857 |
Portfolio turnover rate G | 85% |
A Annualized B Total returns for periods of less than one year are not annualized. C Total returns would have been lower had certain expenses not been reduced during the periods shown. D Total returns do not include the effect of the sales charges. E Calculated based on average shares outstanding during the period. F Fees and expenses of the underlying Fidelity Central Funds are not included in the Fund's expense ratio. The Fund indirectly bears its proportionate share of the expenses of any underlying Fidelity Central Funds. G Amount does not include the portfolio activity of any underlying Fidelity Central Funds. H The amount shown for a share outstanding does not correspond with the aggregate net gain (loss) on investments for the period due to the timing of sales and repurchases of shares in relation to fluctuating market values of the investments of the Fund. I For the period December 12, 2006 (commencement of sale of shares) to February 28, 2007. J Expense ratios reflect operating expenses of the class. Expenses before reductions do not reflect amounts reimbursed by the investment adviser or reductions from brokerage service arrangements or other expense offset arrangements and do not represent the amount paid by the class during periods when reimbursements or reductions occur. Expenses net of fee waivers reflect expenses after reimbursement by the investment adviser but prior to reductions from brokerage service arrangements or other expense offset arrangements. Expenses net of all reductions represent the net expenses paid by the class. |
Financial Highlights - Class T
Year ended February 28, | 2007 I |
Selected Per-Share Data | |
Net asset value, beginning of period | $ 36.60 |
Income from Investment Operations | |
Net investment income (loss) E | (.03) |
Net realized and unrealized gain (loss) | (.09) H |
Total from investment operations | (.12) |
Redemption fees added to paid in capital E | .01 |
Net asset value, end of period | $ 36.49 |
Total Return B,C,D | (.30)% |
Ratios to Average Net Assets F,J | |
Expenses before reductions | 1.46% A |
Expenses net of fee waivers, if any | 1.46% A |
Expenses net of all reductions | 1.43% A |
Net investment income (loss) | (.40)% A |
Supplemental Data | |
Net assets, end of period (000 omitted) | $ 1,093 |
Portfolio turnover rate G | 85% |
A Annualized B Total returns for periods of less than one year are not annualized. C Total returns would have been lower had certain expenses not been reduced during the periods shown. D Total returns do not include the effect of the sales charges. E Calculated based on average shares outstanding during the period. F Fees and expenses of the underlying Fidelity Central Funds are not included in the Fund's expense ratio. The Fund indirectly bears its proportionate share of the expenses of any underlying Fidelity Central Funds. G Amount does not include the portfolio activity of any underlying Fidelity Central Funds. H The amount shown for a share outstanding does not correspond with the aggregate net gain (loss) on investments for the period due to the timing of sales and repurchases of shares in relation to fluctuating market values of the investments of the Fund. I For the period December 12, 2006 (commencement of sale of shares) to February 28, 2007. J Expense ratios reflect operating expenses of the class. Expenses before reductions do not reflect amounts reimbursed by the investment adviser or reductions from brokerage service arrangements or other expense offset arrangements and do not represent the amount paid by the class during periods when reimbursements or reductions occur. Expenses net of fee waivers reflect expenses after reimbursement by the investment adviser but prior to reductions from brokerage service arrangements or other expense offset arrangements. Expenses net of all reductions represent the net expenses paid by the class. |
See accompanying notes which are an integral part of the financial statements.
Annual Report
Financial Highlights - Class B
Year ended February 28, | 2007 I |
Selected Per-Share Data | |
Net asset value, beginning of period | $ 36.60 |
Income from Investment Operations | |
Net investment income (loss) E | (.07) |
Net realized and unrealized gain (loss) | (.08) H |
Total from investment operations | (.15) |
Redemption fees added to paid in capital E | .01 |
Net asset value, end of period | $ 36.46 |
Total Return B,C,D | (.38)% |
Ratios to Average Net Assets F,J | |
Expenses before reductions | 1.96% A |
Expenses net of fee waivers, if any | 1.96% A |
Expenses net of all reductions | 1.93% A |
Net investment income (loss) | (.93)% A |
Supplemental Data | |
Net assets, end of period (000 omitted) | $ 902 |
Portfolio turnover rate G | 85% |
A Annualized B Total returns for periods of less than one year are not annualized. C Total returns would have been lower had certain expenses not been reduced during the periods shown. D Total returns do not include the effect of the contingent deferred sales charge. E Calculated based on average shares outstanding during the period. F Fees and expenses of the underlying Fidelity Central Funds are not included in the Fund's expense ratio. The Fund indirectly bears its proportionate share of the expenses of any underlying Fidelity Central Funds. G Amount does not include the portfolio activity of any underlying Fidelity Central Funds. H The amount shown for a share outstanding does not correspond with the aggregate net gain (loss) on investments for the period due to the timing of sales and repurchases of shares in relation to fluctuating market values of the investments of the Fund. I For the period December 12, 2006 (commencement of sale of shares) to February 28, 2007. J Expense ratios reflect operating expenses of the class. Expenses before reductions do not reflect amounts reimbursed by the investment adviser or reductions from brokerage service arrangements or other expense offset arrangements and do not represent the amount paid by the class during periods when reimbursements or reductions occur. Expenses net of fee waivers reflect expenses after reimbursement by the investment adviser but prior to reductions from brokerage service arrangements or other expense offset arrangements. Expenses net of all reductions represent the net expenses paid by the class. |
Financial Highlights - Class C
Year ended February 28, | 2007 I |
Selected Per-Share Data | |
Net asset value, beginning of period | $ 36.60 |
Income from Investment Operations | |
Net investment income (loss) E | (.07) |
Net realized and unrealized gain (loss) | (.10) H |
Total from investment operations | (.17) |
Redemption fees added to paid in capital E | .01 |
Net asset value, end of period | $ 36.44 |
Total Return B,C,D | (.44)% |
Ratios to Average Net Assets F,J | |
Expenses before reductions | 2.02% A |
Expenses net of fee waivers, if any | 2.02% A |
Expenses net of all reductions | 1.99% A |
Net investment income (loss) | (1.03)% A |
Supplemental Data | |
Net assets, end of period (000 omitted) | $ 437 |
Portfolio turnover rate G | 85% |
A Annualized B Total returns for periods of less than one year are not annualized. C Total returns would have been lower had certain expenses not been reduced during the periods shown. D Total returns do not include the effect of the contingent deferred sales charge. E Calculated based on average shares outstanding during the period. F Fees and expenses of the underlying Fidelity Central Funds are not included in the Fund's expense ratio. The Fund indirectly bears its proportionate share of the expenses of any underlying Fidelity Central Funds. G Amount does not include the portfolio activity of any underlying Fidelity Central Funds. H The amount shown for a share outstanding does not correspond with the aggregate net gain (loss) on investments for the period due to the timing of sales and repurchases of shares in relation to fluctuating market values of the investments of the Fund. I For the period December 12, 2006 (commencement of sale of shares) to February 28, 2007. J Expense ratios reflect operating expenses of the class. Expenses before reductions do not reflect amounts reimbursed by the investment adviser or reductions from brokerage service arrangements or other expense offset arrangements and do not represent the amount paid by the class during periods when reimbursements or reductions occur. Expenses net of fee waivers reflect expenses after reimbursement by the investment adviser but prior to reductions from brokerage service arrangements or other expense offset arrangements. Expenses net of all reductions represent the net expenses paid by the class. |
See accompanying notes which are an integral part of the financial statements.
Annual Report
Financial Highlights - Gold
Years ended February 28, | 2007 | 2006 | 2005 | 2004 I | 2003 |
Selected Per-Share Data | |||||
Net asset value, beginning of period | $ 35.91 | $ 27.46 | $ 27.21 | $ 22.73 | $ 18.25 |
Income from Investment Operations | |||||
Net investment income (loss) C | .22 F | .04 | .02 G | (.01) | .05 |
Net realized and unrealized gain (loss) | 5.49 | 12.21 | .18 | 5.85 | 4.67 |
Total from investment operations | 5.71 | 12.25 | .20 | 5.84 | 4.72 |
Distributions from net investment income | (.02) | (.02) | - | (1.42) | (.36) |
Distributions from net realized gain | (5.10) | (3.84) | - | - | - |
Total distributions | (5.12) | (3.86) | - | (1.42) | (.36) |
Redemption fees added to paid in capital C | .04 | .06 | .05 | .06 | .12 |
Net asset value, end of period | $ 36.54 | $ 35.91 | $ 27.46 | $ 27.21 | $ 22.73 |
Total Return A,B | 16.19% | 48.84% | .92% | 26.79% | 26.68% |
Ratios to Average Net Assets D,H | |||||
Expenses before reductions | .90% | .97% | 1.00% | 1.12% | 1.18% |
Expenses net of fee waivers, if any | .90% | .97% | 1.00% | 1.12% | 1.18% |
Expenses net of all reductions | .87% | .82% | .89% | 1.04% | 1.11% |
Net investment income (loss) | .62% F | .13% | .07% G | (.03)% | .22% |
Supplemental Data | |||||
Net assets, end of period (000 omitted) | $ 1,473,400 | $ 1,325,665 | $ 705,216 | $ 735,744 | $ 686,029 |
Portfolio turnover rate E | 85% | 108% | 79% | 41% | 44% |
A Total returns would have been lower had certain expenses not been reduced during the periods shown. B Total returns do not include the effect of the former sales charges. C Calculated based on average shares outstanding during the period. D Fees and expenses of the underlying Fidelity Central Funds are not included in the Fund's expense ratio. The Fund indirectly bears its proportionate share of the expenses of any underlying Fidelity Central Funds. E Amount does not include the portfolio activity of any underlying Fidelity Central Funds. F Investment income per share reflects a special dividend which amounted to $.08 per share. Excluding the special dividend, the ratio of net investment income (loss) to average net assets would have been .40%. G Investment income per share reflects a special dividend which amounted to $.04 per share. Excluding the special dividend, the ratio of net investment income (loss) to average net assets would have been (.08)%. H Expense ratios reflect operating expenses of the class. Expenses before reductions do not reflect amounts reimbursed by the investment adviser or reductions from brokerage service arrangements or other expense offset arrangements and do not represent the amount paid by the class during periods when reimbursements or reductions occur. Expenses net of fee waivers reflect expenses after reimbursement by the investment adviser but prior to reductions from brokerage service arrangements or other expense offset arrangements. Expenses net of all reductions represent the net expenses paid by the class. I For the year ended February 29. |
Financial Highlights - Institutional Class
Year ended February 28, | 2007 H |
Selected Per-Share Data | |
Net asset value, beginning of period | $ 36.60 |
Income from Investment Operations | |
Net investment income (loss) D | .01 |
Net realized and unrealized gain (loss) | (.08) G |
Total from investment operations | (.07) |
Redemption fees added to paid in capital D | .01 |
Net asset value, end of period | $ 36.54 |
Total Return B,C | (.16)% |
Ratios to Average Net Assets E,I | |
Expenses before reductions | .94% A |
Expenses net of fee waivers, if any | .94% A |
Expenses net of all reductions | .91% A |
Net investment income (loss) | .12% A |
Supplemental Data | |
Net assets, end of period (000 omitted) | $ 385 |
Portfolio turnover rate F | 85% |
A Annualized B Total returns for periods of less than one year are not annualized. C Total returns would have been lower had certain expenses not been reduced during the periods shown. D Calculated based on average shares outstanding during the period. E Fees and expenses of the underlying Fidelity Central Funds are not included in the Fund's expense ratio. The Fund indirectly bears its proportionate share of the expenses of any underlying Fidelity Central Funds. F Amount does not include the portfolio activity of any underlying Fidelity Central Funds. G The amount shown for a share outstanding does not correspond with the aggregate net gain (loss) on investments for the period due to the timing of sales and repurchases of shares in relation to fluctuating market values of the investments of the Fund. H For the period December 12, 2006 (commencement of sale of shares) to February 28, 2007. I Expense ratios reflect operating expenses of the class. Expenses before reductions do not reflect amounts reimbursed by the investment adviser or reductions from brokerage service arrangements or other expense offset arrangements and do not represent the amount paid by the class during periods when reimbursements or reductions occur. Expenses net of fee waivers reflect expenses after reimbursement by the investment adviser but prior to reductions from brokerage service arrangements or other expense offset arrangements. Expenses net of all reductions represent the net expenses paid by the class. |
See accompanying notes which are an integral part of the financial statements.
Annual Report
Notes to Financial Statements
For the period ended February 28, 2007
1. Organization.
Gold Portfolio (the Fund) is a non-diversified fund of Fidelity Select Portfolios (the trust) and is authorized to issue an unlimited number of shares. The trust is registered under the Investment Company Act of 1940, as amended (the 1940 Act), as an open-end management investment company organized as a Massachusetts business trust. The Fund invests primarily in securities of companies whose principal business activities fall within specific industries. The Fund offers Class A, Class T, Class B, Class C, Gold, and Institutional Class shares, each of which has equal rights as to assets and voting privileges. Each class has exclusive voting rights with respect to matters that affect that class. The Fund commenced sale of Class A, Class T, Class B, Class C and Institutional Class shares and the existing class was designated Gold on December 12, 2006. Class B shares will automatically convert to Class A shares after a holding period of seven years from the initial date of purchase. Investment income, realized and unrealized capital gains and losses, the common expenses of the Fund, and certain fund-level expense reductions, if any, are allocated on a pro rata basis to each class based on the relative net assets of each class to the total net assets of the Fund. Each class differs with respect to transfer agent and distribution and service plan fees incurred. Certain expense reductions also differ by class. The Fund may also invest in certain precious metals. The financial statements have been prepared in conformity with accounting principles generally accepted in the United States of America, which require management to make certain estimates and assumptions at the date of the financial statements.
2. Investments in Fidelity Central Funds.
The Fund may invest in Fidelity Central Funds which are open-end investment companies available only to other investment companies and accounts managed by FMR and its affiliates. The Fund's Schedule of Investments lists each of the Fidelity Central Funds as an investment of the Fund but does not include the underlying holdings of each Fidelity Central Fund. As an Investing Fund, the Fund indirectly bears its proportionate share of the expenses of the underlying Fidelity Central Funds. A complete unaudited list of holdings for each Fidelity Central Fund is available upon request. In addition, the financial statements of the Fidelity Central Funds, which are not covered by the Fund's Report of Independent Registered Public Accounting Firm, are available on the EDGAR Database on the SEC's web site, www.sec.gov, or upon request.
The Money Market Central Funds seek preservation of capital and current income and are managed by Fidelity Investments Money Management, Inc. (FIMM) an affiliate of Fidelity Management & Research Company (FMR).
3. Significant Accounting Policies.
The following summarizes the significant accounting policies of the Fund:
Security Valuation. Investments are valued and net asset value (NAV) per share is calculated (NAV calculation) as of the close of business of the New York Stock Exchange (NYSE), normally 4:00 p.m. Eastern time. During the period the Fund also calculated a NAV each hour on the hour (commencing at 10:00 a.m. Eastern time until one hour prior to the close of business on the NYSE). Effective October 1, 2006 the Fund eliminated hourly NAV calculation.
Wherever possible, the Fund uses independent pricing services approved by the Board of Trustees to value its investments. Equity securities, including restricted securities, for which market quotations are readily available, are valued at the last reported sale price or official closing price as reported by an independent pricing service on the primary market or exchange on which they are traded. In the event there were no sales during the day or closing prices are not available, securities are valued at the last quoted bid price. Investments in open-end mutual funds, including the Fidelity Central Funds, are valued at their closing net asset value each business day. Short-term securities with remaining maturities of sixty days or less for which quotations are not readily available are valued at amortized cost, which approximates value.
When current market prices or quotations are not readily available or do not accurately reflect fair value, valuations may be determined in accordance with procedures adopted by the Board of Trustees. For example, when developments occur between the close of a market and the close of the NYSE that may materially affect the value of some or all of the securities, or when trading in a security is halted, those securities may be fair valued. Factors used in the determination of fair value may include monitoring news to identify significant market or security specific events such as changes in the value of U.S. securities markets, reviewing developments in foreign markets and evaluating the performance of ADRs, futures contracts and exchange-traded funds. Because the Fund's utilization of fair value pricing depends on market activity, the frequency with which fair value pricing is used cannot be predicted and may be utilized to a significant extent. The value of securities used for NAV calculation under fair value pricing may differ from published prices for the same securities.
Foreign Currency. The Fund uses foreign currency contracts to facilitate transactions in foreign-denominated securities. Losses from these transactions may arise from changes in the value of the foreign currency or if the counterparties do not perform under the contracts' terms.
Foreign-denominated assets, including investment securities, and liabilities are translated into U.S. dollars at the exchange rate at period end. Purchases and sales of investment securities, income and dividends received and expenses denominated in foreign currencies are translated into U.S. dollars at the exchange rate in effect on the transaction date.
The effects of exchange rate fluctuations on investments are included with the net realized and unrealized gain (loss) on investment securities. Other foreign currency transactions resulting in realized and unrealized gain (loss) are disclosed separately.
Annual Report
3. Significant Accounting Policies - continued
Investment Transactions and Income. For financial reporting purposes, the Fund's investment holdings and NAV include trades executed through the end of the last business day of the period. The NAV for processing shareholder transactions includes trades executed through the end of the prior business day. Gains and losses on securities sold are determined on the basis of identified cost and may include proceeds received from litigation. Dividend income is recorded on the ex-dividend date, except for certain dividends from foreign securities where the ex-dividend date may have passed, which are recorded as soon as the Fund is informed of the ex-dividend date. Non-cash dividends included in dividend income, if any, are recorded at the fair market value of the securities received. Large, non-recurring dividends recognized by the Fund are presented separately on the Statement of Operations as "Special Dividends" and the impact of these dividends is presented in the Financial Highlights. Interest income and distributions from the Fidelity Central Funds are accrued as earned, with any distributions receivable as of period end included in Distributions receivable from Fidelity Central Funds on the Statement of Assets and Liabilities. Interest income includes coupon interest and amortization of premium and accretion of discount on debt securities. Investment income is recorded net of foreign taxes withheld where recovery of such taxes is uncertain.
Expenses. Most expenses of the trust can be directly attributed to a fund. Expenses which cannot be directly attributed are apportioned among each Fund in the trust. Expense estimates are accrued in the period to which they relate and adjustments are made when actual amounts are known.
Income Tax Information and Distributions to Shareholders. Each year, the Fund intends to qualify as a regulated investment company by distributing all of its taxable income and realized gains under Subchapter M of the Internal Revenue Code. As a result, no provision for income taxes is required in the accompanying financial statements. Foreign taxes are provided for based on the Fund's understanding of the tax rules and rates that exist in the foreign markets in which it invests.
Distributions are recorded on the ex-dividend date. Income dividends and capital gain distributions are declared separately for each class. Income and capital gain distributions are determined in accordance with income tax regulations, which may differ from generally accepted accounting principles. In addition, the Fund will claim a portion of the payment made to redeeming shareholders as a distribution for income tax purposes.
Capital accounts within the financial statements are adjusted for permanent book-tax differences. These adjustments have no impact on net assets or the results of operations. Temporary book-tax differences will reverse in a subsequent period.
Book-tax differences are primarily due to short term capital gains, foreign currency transactions, passive foreign investment companies (PFIC), deferred trustees compensation, capital loss carryforwards and losses deferred due to wash sales.
The tax-basis components of distributable earnings and the federal tax cost as of period end were as follows:
Unrealized appreciation | $ 209,837,322 |
Unrealized depreciation | (18,779,101) |
Net unrealized appreciation (depreciation) | 191,058,221 |
Undistributed ordinary income | 37,037,784 |
Undistributed long-term capital gain | 32,067,203 |
Cost for federal income tax purposes | $ 1,285,380,694 |
The tax character of distributions paid was as follows:
February 28, 2007 | February 28, 2006 | |
Ordinary Income | $ 72,402,616 | $ 8,912,605 |
Long-term Capital Gains | 124,307,444 | 97,688,205 |
Total | $ 196,710,060 | $ 106,600,810 |
Trading (Redemption) Fees. Shares in the Fund held less than 30 days are subject to a redemption fee equal to .75% of the net asset value of shares redeemed. All redemption fees, including any estimated redemption fees paid by FMR, are retained by the Fund and accounted for as an addition to paid in capital. Shareholders were also subject to an additional $7.50 fee for shares exchanged into another Fidelity fund (see Note 6).
New Accounting Pronouncements. In July 2006, Financial Accounting Standards Board Interpretation No. 48, Accounting for Uncertainty in Income Taxes - an interpretation of FASB Statement 109 (FIN 48), was issued and is effective on the last business day of the semiannual reporting period for fiscal years beginning after December 15, 2006. FIN 48 sets forth a threshold for financial statement recognition, measurement and disclosure of a tax position taken or expected to be taken on a tax return. Management is currently evaluating the impact, if any, the adoption of FIN 48 will have on the Fund's net assets, results of operations and financial statement disclosures.
In addition, in September 2006, Statement of Financial Accounting Standards No. 157, Fair Value Measurements (SFAS 157), was issued and is effective for fiscal years beginning after November 15, 2007. SFAS 157 defines fair value, establishes a framework for measuring fair value and expands disclosures about fair value measurements. Management is currently evaluating the impact the adoption of SFAS 157 will have on the Fund's financial statement disclosures.
Annual Report
Notes to Financial Statements - continued
4. Operating Policies.
Repurchase Agreements. FMR has received an Exemptive Order from the Securities and Exchange Commission (the SEC) which permits the Fund and other affiliated entities of FMR to transfer uninvested cash balances into joint trading accounts which are then invested in repurchase agreements. The Fund may also invest directly with institutions in repurchase agreements. Repurchase agreements are collateralized by government or non-government securities. Upon settlement date, collateral is held in segregated accounts with custodian banks and may be obtained in the event of a default of the counterparty. The Fund monitors, on a daily basis, the value of the collateral to ensure it is at least equal to the principal amount of the repurchase agreement (including accrued interest). In the event of a default by the counterparty, realization of the collateral proceeds could be delayed, during which time the value of the collateral may decline.
Restricted Securities. The Fund may invest in securities that are subject to legal or contractual restrictions on resale. These securities generally may be resold in transactions exempt from registration or to the public if the securities are registered. Disposal of these securities may involve time-consuming negotiations and expense, and prompt sale at an acceptable price may be difficult. Information regarding restricted securities is included at the end of the Fund's Schedule of Investments.
5. Purchases and Sales of Investments.
Purchases and sales of securities, other than short-term securities, aggregated $1,177,686,107 and $1,142,903,243, respectively.
6. Fees and Other Transactions with Affiliates.
Management Fee. FMR and its affiliates provide the Fund with investment management related services for which the Fund pays a monthly management fee. The management fee is the sum of an individual fund fee rate that is based on an annual rate of .30% of the Fund's average net assets and a group fee rate that averaged .26% during the period. The group fee rate is based upon the average net assets of all the mutual funds advised by FMR. The group fee rate decreases as assets under management increase and increases as assets under management decrease. For the period, the total annual management fee rate was .57% of the Fund's average net assets.
Distribution and Service Plan. In accordance with Rule 12b-1 of the 1940 Act, the Fund has adopted separate Distribution and Service Plans for each class of shares. Certain classes pay Fidelity Distributors Corporation (FDC), an affiliate of FMR, separate Distribution and Service Fees, each of which is based on an annual percentage of each class' average net assets. In addition, FDC may pay financial intermediaries for selling shares of the Fund and providing shareholder support services. For the period, the Distribution and Service Fee rates and the total amounts paid to and retained by FDC were as follows:
Distribution | Service | Paid to | Retained | |
Class A | -% | .25% | $ 339 | $ 59 |
Class T | .25% | .25% | 811 | 97 |
Class B | .75% | .25% | 783 | 646 |
Class C | .75% | .25% | 383 | 286 |
$ 2,316 | $ 1,088 |
Sales Load. FDC receives a front-end sales charge of up to 5.75% for selling Class A shares, and 3.50% for selling Class T shares, some of which is paid to financial intermediaries for selling shares of the Fund. FDC receives the proceeds of contingent deferred sales charges levied on Class A, Class T, Class B, and Class C redemptions. These charges depend on the holding period. The deferred sales charges range from 5% to 1% for Class B, 1% for Class C, 1.00% to .50% for certain purchases of Class A shares and .25% for certain purchases of Class T shares.
For the period, sales charge amounts retained by FDC were as follows:
Retained | |
Class A | $ 4,097 |
Class T | 551 |
$ 4,648 |
Annual Report
6. Fees and Other Transactions with Affiliates - continued
Transfer Agent Fees. Fidelity Investments Institutional Operations Company, Inc. (FIIOC), an affiliate of FMR, is the transfer, dividend disbursing and shareholder servicing agent for each class of the Fund, except for Gold. Fidelity Service Company, Inc. (FSC), an affiliate of FMR, is the transfer agent for Gold shares. FIIOC and FSC receive account fees and asset-based fees that vary according to the account size and type of account of the shareholders of the respective classes of the Fund. FIIOC and FSC pay for typesetting, printing and mailing of shareholder reports, except proxy statements. For the period, the total transfer agent fees paid by each class to FIIOC or FSC, were as follows:
Amount | % of | |
Class A | $ 163 | .13 |
Class T | 354 | .23 |
Class B | 118 | .16 |
Class C | 94 | .26 |
Gold | 3,783,019 | .26 |
Institutional Class | 88 | .25 |
$ 3,783,836 |
Accounting and Security Lending Fees. FSC maintains the Fund's accounting records. The accounting fee is based on the level of average net assets for the month. Under a separate contract, FSC administers the security lending program. The security lending fee is based on the number and duration of lending transactions.
Exchange Fees. During the period, FSC received the proceeds of a $7.50 fee to cover administrative costs associated with exchanges out of the Fund to any other Fidelity Select fund or to any other Fidelity fund made through non-automated channels. Effective October 1, 2006, the exchange fees were eliminated. For the period, exchange fees retained by FSC were as follows:
Retained | |
Gold Portfolio | $ 8,580 |
Brokerage Commissions. The Fund placed a portion of its portfolio transactions with brokerage firms which are affiliates of the investment adviser. The commissions paid to these affiliated firms were $165 for the period.
7. Committed Line of Credit.
The Fund participates with other funds managed by FMR in a $4.2 billion credit facility (the "line of credit") to be utilized for temporary or emergency purposes to fund shareholder redemptions or for other short-term liquidity purposes. The Fund has agreed to pay commitment fees on its pro rata portion of the line of credit, which amounted to $3,802 and is reflected in Miscellaneous Expense on the Statement of Operations. During the period, there were no borrowings on this line of credit.
8. Security Lending.
The Fund lends portfolio securities from time to time in order to earn additional income. On the settlement date of the loan, the Fund receives collateral (in the form of U.S. Treasury obligations, letters of credit and/or cash) against the loaned securities and maintains collateral in an amount not less than 100% of the market value of the loaned securities during the period of the loan. The market value of the loaned securities is determined at the close of business of the Fund and any additional required collateral is delivered to the Fund on the next business day. If the borrower defaults on its obligation to return the securities loaned because of insolvency or other reasons, a fund could experience delays and costs in recovering the securities loaned or in gaining access to the collateral. Any cash collateral received is invested in the Fidelity Securities Lending Cash Central Fund. The value of loaned securities and cash collateral at period end are disclosed on the Fund's Statement of Assets and Liabilities. Security lending income represents the income earned on investing cash collateral, less fees and expenses associated with the loan, plus any premium payments that may be received on the loan of certain types of securities. Security lending income is presented in the Statement of Operations as a component of income from Fidelity Central Funds. Net income from lending portfolio securities during the period amounted to $679,059.
Annual Report
Notes to Financial Statements - continued
9. Expense Reductions.
FMR voluntarily agreed to reimburse a portion of Gold's operating expenses. During the period, this reimbursement reduced the class' expenses by $57,675.
Many of the brokers with whom FMR places trades on behalf of the Fund provided services to the Fund in addition to trade execution. These services included payments of certain expenses on behalf of the Fund totaling $419,936 for the period. In addition, through arrangements with the Fund's custodian and each class' transfer agent, credits realized as a result of uninvested cash balances were used to reduce the Fund's expenses. During the period, these credits reduced the Fund's custody expenses by $18,002. During the period, credits reduced each class' transfer agent expense as noted in the table below.
Transfer Agent | |
Gold | $ 21,672 |
10. Other.
The Fund's organizational documents provide former and current trustees and officers with a limited indemnification against liabilities arising in connection with the performance of their duties to the Fund. In the normal course of business, the Fund may also enter into contracts that provide general indemnifications. The Fund's maximum exposure under these arrangements is unknown as this would be dependent on future claims that may be made against the Fund. The risk of material loss from such claims is considered remote.
The United States Securities and Exchange Commission ("SEC") is conducting an investigation of FMR (covering the years 2002 to 2004) arising from gifts, gratuities and business entertainment provided by certain brokers to certain individuals who were employed on FMR's domestic equity trading desk during that period. FMR is in discussions with the SEC staff regarding the possible resolution of the matter, but as of period-end no final resolution has been reached.
In December 2006, the Independent Trustees completed their own investigation of the matter with the assistance of independent counsel. The Independent Trustees and FMR agree that, despite the absence of proof that the Fidelity mutual funds experienced diminished execution quality as a result of the improper receipt of gifts and business entertainment, the conduct at issue was serious and is worthy of redress. Accordingly, the Independent Trustees have requested and FMR has agreed to pay $42 million to Fidelity mutual funds, plus interest to be determined at the time that payment is made. A method of allocating this payment among the funds has not yet been determined. The total payment to the Fund is not anticipated to have a material impact on the Fund's net assets. In addition, FMR reimbursed related legal expenses which are recorded in the accompanying Statement of Operations as an expense reduction.
11. Distributions to Shareholders.
Distributions to shareholders of each class were as follows:
Years ended February 28, | 2007 | 2006 |
From net investment income | ||
Gold | $ 754,152 | $ 507,609 |
From net realized gain | ||
Gold | $ 195,955,908 | $ 106,134,254 |
Annual Report
12. Share Transactions.
Transactions for each class of shares were as follows:
Shares | Dollars | |||
Years ended February 28, | 2007A | 2006 | 2007A | 2006 |
Class A | ||||
Shares sold | 52,274 | - | $ 1,914,223 | $ - |
Shares redeemed | (1,428) | - | (52,108) | - |
Net increase (decrease) | 50,846 | - | $ 1,862,115 | $ - |
Class T | ||||
Shares sold | 29,954 | - | $ 1,097,866 | $ - |
Shares redeemed | - | - | - | - |
Net increase (decrease) | 29,954 | - | $ 1,097,866 | $ - |
Class B | ||||
Shares sold | 24,802 | - | $ 903,324 | $ - |
Shares redeemed | (60) | - | (2,269) | - |
Net increase (decrease) | 24,742 | - | $ 901,055 | - |
Class C | ||||
Shares sold | 12,002 | - | $ 438,523 | $ - |
Shares redeemed | - | - | - | - |
Net increase (decrease) | 12,002 | - | $ 438,523 | - |
Gold | ||||
Shares sold | 37,990,378 | 35,716,956 | $ 1,364,967,296 | $ 1,098,070,139 |
Reinvestment of distributions | 5,102,742 | 3,522,978 | 188,386,905 | 102,614,627 |
Shares redeemed | (39,683,634) | (28,011,502) | (1,387,242,690) | (821,889,539) |
Net increase (decrease) | 3,409,486 | 11,228,432 | $ 166,111,511 | $ 378,795,227 |
Institutional Class | ||||
Shares sold | 11,934 | - | $ 438,322 | $ - |
Shares redeemed | (1,395) | - | (50,735) | - |
Net increase (decrease) | 10,539 | - | $ 387,587 | - |
A Share transactions for Class A, Class T, Class B, Class C and Institutional Class are for the period December 12, 2006 (commencement of sale of shares) to February 28, 2007.
Annual Report
Fidelity Advisor Materials Fund - Class A, T, B and C
Performance
Average annual total return reflects the change in the value of an investment, assuming reinvestment of the class' dividend income and capital gains (the profits earned upon the sale of securities that have grown in value) and assuming a constant rate of performance each year. The $10,000 table and the fund's returns do not reflect the deduction of taxes that a shareholder would pay on fund distributions or the redemption of fund shares. During periods of reimbursement by Fidelity, a fund's total return will be greater than it would be had the reimbursement not occurred. How a fund did yesterday is no guarantee of how it will do tomorrow.
Average Annual Total Returns
Periods ended February 28, 2007 | Past 1 | Past 5 | Past 10 |
Class A (incl. 5.75% sales charge) A | 15.47% | 17.43% | 9.61% |
Class T (incl. 3.50% sales charge) B | 17.94% | 17.93% | 9.84% |
Class B (incl. contingent deferred sales charge) C | 17.03% | 18.54% | 10.21% |
Class C (incl. contingent deferred sales charge) D | 21.03% | 18.74% | 10.21% |
A Class A shares bear a 0.25% 12b-1 fee. The initial offering of Class A shares took place on December 12, 2006. Returns prior to December 12, 2006 are those of Materials, the original class of the fund, which has no 12b-1 fee. Had Class A shares' 12b-1 fee been reflected, returns prior to December 12, 2006 would have been lower.
B Class T shares bear a 0.50% 12b-1 fee. The initial offering of Class T shares took place on December 12, 2006. Returns prior to December 12, 2006 are those of Materials, the original class of the fund, which has no 12b-1 fee. Had Class T shares' 12b-1 fee been reflected, returns prior to December 12, 2006 would have been lower.
C Class B shares bear a 1.00% 12b-1 fee. The initial offering of Class B shares took place on December 12, 2006. Returns prior to December 12, 2006 are those of Materials, the original class of the fund, which has no 12b-1 fee. Had Class B shares' 12b-1 fee been reflected, returns prior to December 12, 2006 would have been lower. Class B shares' contingent deferred sales charge included in the past one year, past five years, and past ten years total return figures are 5%, 2%, and 0%, respectively.
D Class C shares bear a 1.00% 12b-1 fee. The initial offering of Class C shares took place on December 12, 2006. Returns prior to December 12, 2006 are those of Materials, the original class of the fund, which has no 12b-1 fee. Had Class C shares' 12b-1 fee been reflected, returns prior to December 12, 2006 would have been lower. Class C shares' contingent deferred sales charge included in the past one year, past five years, and past ten years total return figures are 1%, 0%, and 0%, respectively.
Prior to October 1, 2006, Select Materials Portfolio was named Select Industrial Materials Portfolio and operated under certain different investment policies. Effective October 1, 2006, shareholders of Select Materials Portfolio approved broadening the fund's focus beyond materials used in the industrial sector so that it now invests in companies engaged in the manufacture, mining, processing or distribution of raw materials and intermediate goods of all types, including industrial or agricultural materials and unfinished goods, such as chemicals, gases, metals or other natural or synthetic materials. The historical performance of the fund may not represent its current investment policies.
$10,000 Over 10 Years
Let's say hypothetically that $10,000 was invested in Fidelity Advisor Materials Fund - Class T (dagger) on February 28, 1997, and the current 3.50% sales charge was paid. The chart shows how the value of your investment would have changed, and also shows how the Standard & Poor's 500 Index performed over the same period.
(dagger) Class T shares bear a 0.50% 12b-1 fee. The initial offering of Class T shares took place on December 12, 2006. Returns prior to December 12, 2006 are those of Materials, the original class of the fund, which has no 12b-1 fee. Had Class T shares' 12b-1 fee been reflected, returns prior to December 12, 2006 would have been lower.
Annual Report
Fidelity Advisor Materials Fund - Class A, T, B and C
Management's Discussion of Fund Performance
Comments from Jody Simes, Portfolio Manager of Fidelity Advisor Materials Fund during the period covered by this report
A rosy year for stocks wilted just prior to the end of the 12-month period ending February 28, 2007. On the day prior to the period's close, the Dow Jones Industrial AverageSM plunged 416 points and the Standard & Poor's 500SM Index lost roughly 3.5% of its value, plummeting nearly 50 points and marking the benchmark's worst single-day performance since the day the market reopened after the 9/11 terrorist attacks. Though investors were obviously rattled by the development, it was only the 22nd-biggest decline for the S&P 500® in 20 years, and it could not overshadow how well stocks performed for the 12 months overall. For much of the past year, investors grew confident that the economy would not fall into a recession, and they bid up most broad-based stock indexes for six consecutive months from August through January. Overall for the year ending February 28, 2007, the S&P 500 was up 11.97%, the Dow advanced 14.24%, the small-cap Russell 2000® Index gained 9.87% and the NASDAQ Composite® Index rose 6.66%.
It's important to point out that in connection with a restructuring of the product line effective October 1, 2006, the fund changed the benchmark to which it compares its performance. For the 12 months ending February 28, 2007, the fund underperformed the 23.99% gain of the Morgan Stanley Capital InternationalSM (MSCI®) US Investable Market Materials Index and the 23.58% advance of a blended index specific to this fund. This blended index is a combination of the Goldman Sachs® Cyclical Industries Index, which the fund was compared with through September, and the new MSCI benchmark mentioned above, which the fund was compared with during the period's final five months1. During the same 12-month period, the fund beat the S&P 500. The new supplemental benchmark reflects a broadening of the fund's focus beyond materials used in the industrials sector. As such, the fund experienced some shifts in its industry weightings. (For specific performance information on the fund's Class A, Class T, Class B and Class C shares, please refer to the performance section of this report.) The main factor behind the fund's modest outperformance of the Goldman Sachs index during the first seven months was strong security selection in diversified metals and mining, a group that is not part of the index. Not owning homebuilding stocks also helped, as this area of the index declined. Overweighting coal and consumable fuels dampened the fund's return, although that loss was partially offset by good security selection there. Not owning aerospace and defense, a strong performing part of the index during the seven-month period, hurt as well. Top contributors included our out-of-benchmark positions in three Canadian metals and mining stocks: Falconbridge, Inco and Skye Resources. The two main detractors also were not found in the index: coal company Peabody Energy and aluminum producer Alcan. During the last five months of the period, the fund underperformed its new MSCI index due to unsuccessful security selection in diversified metals and mining and the fund's modest average cash position, which dampened its return in a strong market. Positive stock selection in and an underweighting of specialty chemicals buoyed the fund's return, as did good security selection in and an overweighting of construction materials. Detractors included out-of-benchmark holdings in Skye Resources, Canadian metals and mining company Birch Mountain Resources and uranium producer Cameco. Top contributions came from Canadian construction materials firm Polaris Minerals - not part of the benchmark - as well as overweighting specialty chemical manufacturer Albemarle. Some stocks mentioned here were not held at period end.
1 The fund's blended index is a customized index developed by Fidelity for the limited purpose of discussing the fund's performance for the 12-month period ending February 28, 2007. From March 1, 2006, through September 30, 2006, the fund compared its performance to the Goldman Sachs Cyclical Industries Index, which returned 1.77% during that period. On October 1, 2006, the fund began comparing its performance to a different index, the MSCI US Investable Market Materials Index, which returned 21.43% from October 1, 2006, through February 28, 2007. For the 12-month period ending February 28, 2007, the blended index (Goldman Sachs and MSCI) returned 23.58%.
Note to shareholders: Duffy Fischer will become manager of the fund on April 2, 2007.
The views expressed above reflect those of the portfolio manager(s) only through the end of the period as stated on the cover of this report and do not necessarily represent the views of Fidelity or any other person in the Fidelity organization. Any such views are subject to change at any time based upon market or other conditions and Fidelity disclaims any responsibility to update such views. These views may not be relied on as investment advice and, because investment decisions for a Fidelity fund are based on numerous factors, may not be relied on as an indication of trading intent on behalf of any Fidelity fund.
Annual Report
Shareholder Expense Example
As a shareholder of the Fund, you incur two types of costs: (1) transaction costs, including sales charges (loads) on purchase payments or redemption proceeds, redemption fees, exchange fees, and (2) ongoing costs, including management fees, distribution and/or service (12b-1) fees and other Fund expenses. This Example is intended to help you understand your ongoing costs (in dollars) of investing in the Fund and to compare these costs with the ongoing costs of investing in other mutual funds.
The actual Example is based on an investment of $1,000 at the beginning of the period and held for the entire period (September 1, 2006 to February 28, 2007) for the Materials class and for the entire period (December 12, 2006 to February 28, 2007) for Class A, Class T, Class B, Class C and Institutional Class. The hypothetical expense Example is based on an investment of $1,000 invested for the one-half year period (September 1, 2006 to February 28, 2007).
Actual Expenses
The first line of the accompanying table for each class of the Fund provides information about actual account values and actual expenses. You may use the information in this line, together with the amount you invested, to estimate the expenses that you paid over the period. Simply divide your account value by $1,000.00 (for example, an $8,600 account value divided by $1,000.00 = 8.6), then multiply the result by the number in the first line for a class of the Fund under the heading entitled "Expenses Paid During Period" to estimate the expenses you paid on your account during this period. A small balance maintenance fee of $12.00 that is charged once a year may apply for certain accounts with a value of less than $2,000. This fee is not included in the table below. If it was, the estimate of expenses you paid during the period would be higher, and your ending account value lower, by this amount.
Hypothetical Example for Comparison Purposes
The second line of the accompanying table for each class of the Fund provides information about hypothetical account values and hypothetical expenses based on a Class' actual expense ratio and an assumed rate of return of 5% per year before expenses, which is not the Class' actual return. The hypothetical account values and expenses may not be used to estimate the actual ending account balance or expenses you paid for the period. You may use this information to compare the ongoing costs of investing in the Fund and other funds. To do so, compare this 5% hypothetical example with the 5% hypothetical examples that appear in the shareholder reports of the other funds. A small balance maintenance fee of $12.00 that is charged once a year may apply for certain accounts with a value of less than $2,000. This fee is not included in the table below. If it was, the estimate of expenses you paid during the period would be higher, and your ending account value lower, by this amount.
Please note that the expenses shown in the table are meant to highlight your ongoing costs only and do not reflect any transaction costs. Therefore, the second line of the table is useful in comparing ongoing costs only, and will not help you determine the relative total costs of owning different funds. In addition, if these transactional costs were included, your costs would have been higher.
Beginning | Ending | Expenses | |
Class A | |||
Actual | $ 1,000.00 | $ 1,087.60 | $ 3.16 B |
HypotheticalA | $ 1,000.00 | $ 1,017.85 | $ 7.00 C |
Class T | |||
Actual | $ 1,000.00 | $ 1,085.10 | $ 3.72 B |
HypotheticalA | $ 1,000.00 | $ 1,016.61 | $ 8.25 C |
Class B | |||
Actual | $ 1,000.00 | $ 1,083.40 | $ 4.85 B |
HypotheticalA | $ 1,000.00 | $ 1,014.13 | $ 10.74 C |
Class C | |||
Actual | $ 1,000.00 | $ 1,083.40 | $ 4.85 B |
HypotheticalA | $ 1,000.00 | $ 1,014.13 | $ 10.74 C |
Materials | |||
Actual | $ 1,000.00 | $ 1,181.30 | $ 5.08 B |
HypotheticalA | $ 1,000.00 | $ 1,020.13 | $ 4.71 C |
Institutional Class | |||
Actual | $ 1,000.00 | $ 1,085.50 | $ 2.39 B |
HypotheticalA | $ 1,000.00 | $ 1,019.54 | $ 5.31 C |
A 5% return per year before expenses
B Actual expenses are equal to each Class' annualized expense ratio (shown in the table below); multiplied by the average account value over the period, multiplied by 181/365 (to reflect the one-half year period) for the Materials class and multiplied by 79/365 (to reflect the period December 12, 2006 to February 28, 2007) for Class A, Class T, Class B, Class C and Institutional Class.
C Hypothetical expenses are equal to each Class' annualized expense ratio (shown in the table below); multiplied by the average account value over the period, multiplied by 181/365 (to reflect the one-half year period).
Annual Report
Annualized | |
Class A | 1.40% |
Class T | 1.65% |
Class B | 2.15% |
Class C | 2.15% |
Materials | .94% |
Institutional Class | 1.06% |
Annual Report
Investment Changes
Top Ten Stocks as of February 28, 2007 | ||
% of fund's | % of fund's net assets | |
E.I. du Pont de Nemours & Co. | 8.2 | 5.2 |
Monsanto Co. | 5.7 | 0.0 |
Dow Chemical Co. | 5.1 | 5.4 |
Alcoa, Inc. | 4.4 | 4.8 |
Phelps Dodge Corp. | 4.2 | 2.5 |
Praxair, Inc. | 3.9 | 3.1 |
Weyerhaeuser Co. | 3.8 | 0.0 |
Air Products & Chemicals, Inc. | 3.4 | 2.6 |
Nucor Corp. | 3.0 | 2.1 |
United States Steel Corp. | 3.0 | 3.1 |
44.7 | ||
Top Industries (% of fund's net assets) | |||
As of February 28, 2007 | |||
| Chemicals | 43.5% | |
| Metals & Mining | 29.6% | |
| Paper & Forest Products | 7.5% | |
| Construction Materials | 5.9% | |
| Containers & Packaging | 5.7% | |
| All Others * | 7.8% | |

As of August 31, 2006 | |||
| Metals & Mining | 34.7% | |
| Chemicals | 21.9% | |
| Road & Rail | 15.2% | |
| Oil, Gas & Consumable Fuels | 11.4% | |
| Construction Materials | 4.5% | |
| All Others * | 12.3% | |

* Includes short-term investments and net other assets. |
Annual Report
Investments February 28, 2007
Showing Percentage of Net Assets
Common Stocks - 94.4% | |||
Shares | Value | ||
CHEMICALS - 43.5% | |||
Commodity Chemicals - 1.6% | |||
Lyondell Chemical Co. | 116,800 | $ 3,721,248 | |
Diversified Chemicals - 15.9% | |||
Dow Chemical Co. | 272,100 | 11,917,980 | |
E.I. du Pont de Nemours & Co. | 374,100 | 18,985,575 | |
PPG Industries, Inc. | 92,700 | 6,141,375 | |
37,044,930 | |||
Fertilizers & Agricultural Chemicals - 9.1% | |||
Agrium, Inc. | 66,500 | 2,552,422 | |
CF Industries Holdings, Inc. | 16,100 | 622,426 | |
Monsanto Co. | 254,400 | 13,404,336 | |
Potash Corp. of Saskatchewan, Inc. | 9,800 | 1,546,538 | |
The Mosaic Co. | 96,600 | 2,457,504 | |
The Scotts Miracle-Gro Co. Class A | 16,800 | 741,048 | |
21,324,274 | |||
Industrial Gases - 8.0% | |||
Air Products & Chemicals, Inc. | 104,300 | 7,803,726 | |
Airgas, Inc. | 41,400 | 1,708,578 | |
Praxair, Inc. | 147,200 | 9,080,768 | |
18,593,072 | |||
Specialty Chemicals - 8.9% | |||
Albemarle Corp. | 48,000 | 3,928,800 | |
Chemtura Corp. | 88,900 | 1,020,572 | |
Cytec Industries, Inc. | 28,100 | 1,652,842 | |
Minerals Technologies, Inc. | 14,000 | 866,460 | |
Nalco Holding Co. | 187,900 | 4,490,810 | |
Rohm & Haas Co. | 125,400 | 6,628,644 | |
Sigma Aldrich Corp. | 52,500 | 2,152,500 | |
20,740,628 | |||
TOTAL CHEMICALS | 101,424,152 | ||
CONSTRUCTION MATERIALS - 5.9% | |||
Construction Materials - 5.9% | |||
Martin Marietta Materials, Inc. | 22,200 | 2,782,104 | |
Polaris Minerals Corp. | 89,500 | 701,736 | |
Polaris Minerals Corp. (e) | 760,000 | 5,958,873 | |
Vulcan Materials Co. | 37,900 | 4,414,971 | |
13,857,684 | |||
CONTAINERS & PACKAGING - 5.7% | |||
Metal & Glass Containers - 3.3% | |||
Ball Corp. | 37,800 | 1,750,140 | |
Crown Holdings, Inc. (a) | 66,100 | 1,509,724 | |
Owens-Illinois, Inc. | 63,300 | 1,504,008 | |
Pactiv Corp. (a) | 64,000 | 2,060,800 | |
Silgan Holdings, Inc. | 14,400 | 708,624 | |
7,533,296 | |||
Shares | Value | ||
Paper Packaging - 2.4% | |||
Packaging Corp. of America | 177,900 | $ 4,358,550 | |
Smurfit-Stone Container Corp. | 104,100 | 1,284,594 | |
5,643,144 | |||
TOTAL CONTAINERS & PACKAGING | 13,176,440 | ||
MACHINERY - 0.6% | |||
Construction & Farm Machinery & Heavy Trucks - 0.6% | |||
Deere & Co. | 13,600 | 1,474,512 | |
METALS & MINING - 29.6% | |||
Aluminum - 4.4% | |||
Alcoa, Inc. | 306,600 | 10,243,506 | |
Diversified Metals & Mining - 9.0% | |||
BHP Billiton Ltd. sponsored ADR | 73,200 | 3,149,064 | |
Coalcorp Mining, Inc. (a) | 7,470,000 | 4,023,855 | |
Coalcorp Mining, Inc. warrants 2/8/11 (a) | 89,000 | 17,502 | |
Phelps Dodge Corp. | 78,400 | 9,792,944 | |
Rio Tinto PLC sponsored ADR | 14,800 | 3,206,568 | |
Skye Resources, Inc. (a) | 74,100 | 753,957 | |
20,943,890 | |||
Gold - 4.2% | |||
Agnico-Eagle Mines Ltd. | 54,000 | 2,125,741 | |
Goldcorp, Inc. | 167,700 | 4,499,531 | |
Meridian Gold, Inc. (a) | 112,300 | 3,080,316 | |
9,705,588 | |||
Precious Metals & Minerals - 0.1% | |||
Apex Silver Mines Ltd. (a) | 18,100 | 258,468 | |
Steel - 11.9% | |||
A.M. Castle & Co. | 36,500 | 1,051,200 | |
Allegheny Technologies, Inc. | 45,400 | 4,651,230 | |
Carpenter Technology Corp. | 16,000 | 1,896,800 | |
Chaparral Steel Co. | 84,800 | 4,225,584 | |
Companhia Vale do Rio Doce sponsored ADR | 59,000 | 2,013,080 | |
Nucor Corp. | 115,400 | 7,024,398 | |
United States Steel Corp. | 78,500 | 6,956,670 | |
27,818,962 | |||
TOTAL METALS & MINING | 68,970,414 | ||
OIL, GAS & CONSUMABLE FUELS - 1.6% | |||
Coal & Consumable Fuels - 1.6% | |||
Cameco Corp. | 98,300 | 3,635,137 | |
PAPER & FOREST PRODUCTS - 7.5% | |||
Forest Products - 3.8% | |||
Weyerhaeuser Co. (d) | 104,200 | 8,947,654 | |
Paper Products - 3.7% | |||
Bowater, Inc. | 27,400 | 662,532 | |
Common Stocks - continued | |||
Shares | Value | ||
PAPER & FOREST PRODUCTS - CONTINUED | |||
Paper Products - continued | |||
International Paper Co. | 168,700 | $ 6,074,887 | |
MeadWestvaco Corp. | 62,000 | 1,887,900 | |
8,625,319 | |||
TOTAL PAPER & FOREST PRODUCTS | 17,572,973 | ||
TOTAL COMMON STOCKS (Cost $189,632,363) | 220,111,312 | ||
Money Market Funds - 8.7% | |||
Fidelity Cash Central Fund, 5.35% (b) | 11,345,736 | 11,345,736 | |
Fidelity Securities Lending Cash Central Fund, 5.34% (b)(c) | 8,996,000 | 8,996,000 | |
TOTAL MONEY MARKET FUNDS (Cost $20,341,736) | 20,341,736 | ||
TOTAL INVESTMENT PORTFOLIO - 103.1% (Cost $209,974,099) | 240,453,048 | ||
NET OTHER ASSETS - (3.1)% | (7,253,808) | ||
NET ASSETS - 100% | $ 233,199,240 | ||
Legend |
(a) Non-income producing |
(b) Affiliated fund that is available only to investment companies and other accounts managed by Fidelity Investments. The rate quoted is the annualized seven-day yield of the fund at period end. A complete unaudited listing of the fund's holdings as of its most recent quarter end is available upon request. |
(c) Investment made with cash collateral received from securities on loan. |
(d) Security or a portion of the security is on loan at period end. |
(e) Security exempt from registration under Rule 144A of the Securities Act of 1933. These securities may be resold in transactions exempt from registration, normally to qualified institutional buyers. At the end of the period, the value of these securities amounted to $5,958,873 or 2.6% of net assets. |
Affiliated Central Funds |
Information regarding fiscal year to date income earned by the Fund from investments in Fidelity Central Funds is as follows: |
Fund | Income earned |
Fidelity Cash Central Fund | $ 479,587 |
Fidelity Securities Lending Cash Central Fund | 41,460 |
Total | $ 521,047 |
Other Information |
Distribution of investments by country of issue, as a percentage of total net assets, is as follows: |
United States of America | 83.8% |
Canada | 12.4% |
United Kingdom | 1.4% |
Australia | 1.4% |
Others (individually less than 1%) | 1.0% |
100.0% |
See accompanying notes which are an integral part of the financial statements.
Annual Report
Financial Statements
Statement of Assets and Liabilities
February 28, 2007 | ||
Assets | ||
Investment in securities, at value (including securities loaned of $8,934,640) - See accompanying schedule: Unaffiliated issuers (cost $189,632,363) | $ 220,111,312 | |
Fidelity Central Funds (cost $20,341,736) | 20,341,736 | |
Total Investments (cost $209,974,099) | $ 240,453,048 | |
Receivable for fund shares sold | 11,633,830 | |
Dividends receivable | 466,522 | |
Distributions receivable from Fidelity Central Funds | 52,504 | |
Prepaid expenses | 977 | |
Receivable from investment adviser for expense reductions | 253 | |
Other receivables | 7,378 | |
Total assets | 252,614,512 | |
Liabilities | ||
Payable for investments purchased | $ 9,034,723 | |
Payable for fund shares redeemed | 1,207,549 | |
Accrued management fee | 89,327 | |
Distribution fees payable | 867 | |
Other affiliated payables | 46,122 | |
Other payables and accrued expenses | 40,684 | |
Collateral on securities loaned, at value | 8,996,000 | |
Total liabilities | 19,415,272 | |
Net Assets | $ 233,199,240 | |
Net Assets consist of: | ||
Paid in capital | $ 195,867,931 | |
Undistributed net investment income | 276,784 | |
Accumulated undistributed net realized gain (loss) on investments and foreign currency transactions | 6,575,289 | |
Net unrealized appreciation (depreciation) on investments and assets and liabilities in foreign currencies | 30,479,236 | |
Net Assets | $ 233,199,240 | |
Statement of Assets and Liabilities - continued
February 28, 2007 | ||
Calculation of Maximum Offering Price Class A: | $ 51.01 | |
Maximum offering price per share (100/94.25 of $51.01) | $ 54.12 | |
Class T: | $ 50.89 | |
Maximum offering price per share (100/96.50 of $50.88) | $ 52.74 | |
Class B: | $ 50.81 | |
Class C: | $ 50.81 | |
Materials: | $ 50.92 | |
Institutional Class: | $ 50.91 | |
A Redemption price per share is equal to net asset value less any applicable contingent deferred sales charge.
See accompanying notes which are an integral part of the financial statements.
Annual Report
Select Materials Portfolio
Financial Statements - continued
Statement of Operations
Year ended February 28, 2007 | ||
Investment Income | ||
Dividends | $ 3,072,290 | |
Interest | 1,871 | |
Income from Fidelity Central Funds | 521,047 | |
Total income | 3,595,208 | |
Expenses | ||
Management fee | $ 1,110,432 | |
Transfer agent fees | 582,866 | |
Distribution fees | 1,383 | |
Accounting and security lending fees | 91,132 | |
Custodian fees and expenses | 24,762 | |
Independent trustees' compensation | 702 | |
Registration fees | 126,372 | |
Audit | 37,168 | |
Legal | 3,517 | |
Interest | 2,189 | |
Miscellaneous | 12,463 | |
Total expenses before reductions | 1,992,986 | |
Expense reductions | (107,567) | 1,885,419 |
Net investment income (loss) | 1,709,789 | |
Realized and Unrealized Gain (Loss) Net realized gain (loss) on: | ||
Investment securities: | ||
Unaffiliated issuers | 18,867,914 | |
Foreign currency transactions | (725) | |
Total net realized gain (loss) | 18,867,189 | |
Change in net unrealized appreciation (depreciation) on: Investment securities | 2,128,190 | |
Assets and liabilities in foreign currencies | (123) | |
Total change in net unrealized appreciation (depreciation) | 2,128,067 | |
Net gain (loss) | 20,995,256 | |
Net increase (decrease) in net assets resulting from operations | $ 22,705,045 | |
Statement of Changes in Net Assets
Year ended | Year ended | |
Increase (Decrease) in Net Assets | ||
Operations | ||
Net investment income (loss) | $ 1,709,789 | $ 1,058,337 |
Net realized gain (loss) | 18,867,189 | 8,503,088 |
Change in net unrealized appreciation (depreciation) | 2,128,067 | 6,934,391 |
Net increase (decrease) in net assets resulting from operations | 22,705,045 | 16,495,816 |
Distributions to shareholders from net investment income | (1,721,356) | (770,963) |
Distributions to shareholders from net realized gain | (17,315,347) | (3,187,200) |
Total distributions | (19,036,703) | (3,958,163) |
Share transactions - net increase (decrease) | 59,771,650 | 12,434,145 |
Redemption fees | 236,747 | 108,867 |
Total increase (decrease) in net assets | 63,676,739 | 25,080,665 |
Net Assets | ||
Beginning of period | 169,522,501 | 144,441,836 |
End of period (including undistributed net investment income of $276,784 and undistributed net investment income of $394,580, respectively) | $ 233,199,240 | $ 169,522,501 |
See accompanying notes which are an integral part of the financial statements.
Annual Report
Financial Highlights - Class A
Year ended February 28, | 2007 H |
Selected Per-Share Data | |
Net asset value, beginning of period | $ 46.90 |
Income from Investment Operations | |
Net investment income (loss) E | .17 |
Net realized and unrealized gain (loss) | 3.93 |
Total from investment operations | 4.10 |
Redemption fees added to paid in capital E | .01 |
Net asset value, end of period | $ 51.01 |
Total Return B, C, D | 8.76% |
Ratios to Average Net Assets F, I | |
Expenses before reductions | 1.50% A |
Expenses net of fee waivers, if any | 1.40% A |
Expenses net of all reductions | 1.38% A |
Net investment income (loss) | 1.76% A |
Supplemental Data | |
Net assets, end of period (000 omitted) | $ 1,018 |
Portfolio turnover rate G | 185% |
A Annualized B Total returns for periods of less than one year are not annualized. C Total returns would have been lower had certain expenses not been reduced during the periods shown. D Total returns do not include the effect of the sales charges. E Calculated based on average shares outstanding during the period. F Fees and expenses of the underlying Fidelity Central Funds are not included in the Fund's expense ratio. The Fund indirectly bears its proportionate share of the expenses of any underlying Fidelity Central Funds. G Amount does not include the portfolio activity of any underlying Fidelity Central Funds. H For the period December 12, 2006 (commencement of sale of shares) to February 28, 2007. |
Financial Highlights - Class T
Year ended February 28, | 2007 H |
Selected Per-Share Data | |
Net asset value, beginning of period | $ 46.90 |
Income from Investment Operations | |
Net investment income (loss) E | .11 |
Net realized and unrealized gain (loss) | 3.87 |
Total from investment operations | 3.98 |
Redemption fees added to paid in capital E | .01 |
Net asset value, end of period | $ 50.89 |
Total Return B, C, D | 8.51% |
Ratios to Average Net Assets F, I | |
Expenses before reductions | 1.80% A |
Expenses net of fee waivers, if any | 1.65% A |
Expenses net of all reductions | 1.62% A |
Net investment income (loss) | 1.18% A |
Supplemental Data | |
Net assets, end of period (000 omitted) | $ 707 |
Portfolio turnover rate G | 185% |
A Annualized B Total returns for periods of less than one year are not annualized. C Total returns would have been lower had certain expenses not been reduced during the periods shown. D Total returns do not include the effect of the sales charges. E Calculated based on average shares outstanding during the period. F Fees and expenses of the underlying Fidelity Central Funds are not included in the Fund's expense ratio. The Fund indirectly bears its proportionate share of the expenses of any underlying Fidelity Central Funds. G Amount does not include the portfolio activity of any underlying Fidelity Central Funds. H For the period December 12, 2006 (commencement of sale of shares) to February 28, 2007. I Expense ratios reflect operating expenses of the class. Expenses before reductions do not reflect amounts reimbursed by the investment adviser or reductions from brokerage service arrangements or other expense offset arrangements and do not represent the amount paid by the class during periods when reimbursements or reductions occur. Expenses net of fee waivers reflect expenses after reimbursement by the investment adviser but prior to reductions from brokerage service arrangements or other expense offset arrangements. Expenses net of all reductions represent the net expenses paid by the class. |
See accompanying notes which are an integral part of the financial statements.
Annual Report
Financial Highlights - Class B
Year ended February 28, | 2007 H |
Selected Per-Share Data | |
Net asset value, beginning of period | $ 46.90 |
Income from Investment Operations | |
Net investment income (loss) E | .06 |
Net realized and unrealized gain (loss) | 3.84 |
Total from investment operations | 3.90 |
Redemption fees added to paid in capital E | .01 |
Net asset value, end of period | $ 50.81 |
Total Return B, C, D | 8.34% |
Ratios to Average Net Assets F, I | |
Expenses before reductions | 2.26% A |
Expenses net of fee waivers, if any | 2.15% A |
Expenses net of all reductions | 2.12% A |
Net investment income (loss) | .60% A |
Supplemental Data | |
Net assets, end of period (000 omitted) | $ 662 |
Portfolio turnover rate G | 185% |
A Annualized B Total returns for periods of less than one year are not annualized. C Total returns would have been lower had certain expenses not been reduced during the periods shown. D Total returns do not include the effect of the contingent deferred sales charge. E Calculated based on average shares outstanding during the period. F Fees and expenses of the underlying Fidelity Central Funds are not included in the Fund's expense ratio. The Fund indirectly bears its proportionate share of the expenses of any underlying Fidelity Central Funds. G Amount does not include the portfolio activity of any underlying Fidelity Central Funds. H For the period December 12, 2006 (commencement of sale of shares) to February 28, 2007. |
Financial Highlights - Class C
Year ended February 28, | 2007 H |
Selected Per-Share Data | |
Net asset value, beginning of period | $ 46.90 |
Income from Investment Operations | |
Net investment income (loss) E | .09 |
Net realized and unrealized gain (loss) | 3.81 |
Total from investment operations | 3.90 |
Redemption fees added to paid in capital E | .01 |
Net asset value, end of period | $ 50.81 |
Total Return B, C, D | 8.34% |
Ratios to Average Net Assets F, I | |
Expenses before reductions | 2.31% A |
Expenses net of fee waivers, if any | 2.15% A |
Expenses net of all reductions | 2.13% A |
Net investment income (loss) | .89% A |
Supplemental Data | |
Net assets, end of period (000 omitted) | $ 547 |
Portfolio turnover rate G | 185% |
A Annualized B Total returns for periods of less than one year are not annualized. C Total returns would have been lower had certain expenses not been reduced during the periods shown. D Total returns do not include the effect of the contingent deferred sales charge. E Calculated based on average shares outstanding during the period. F Fees and expenses of the underlying Fidelity Central Funds are not included in the Fund's expense ratio. The Fund indirectly bears its proportionate share of the expenses of any underlying Fidelity Central Funds. G Amount does not include the portfolio activity of any underlying Fidelity Central Funds. H For the period December 12, 2006 (commencement of sale of shares) to February 28, 2007. |
See accompanying notes which are an integral part of the financial statements.
Annual Report
Financial Highlights - Materials
Years ended February 28, | 2007 | 2006 | 2005 | 2004 H | 2003 |
Selected Per-Share Data | |||||
Net asset value, beginning of period | $ 46.35 | $ 40.78 | $ 35.99 | $ 23.83 | $ 25.89 |
Income from Investment Operations | |||||
Net investment income (loss) C | .42 | .32 | .15 | .13 F | .04 F |
Net realized and unrealized gain (loss) | 9.36 | 6.40 | 5.47 | 12.07 | (1.69) |
Total from investment operations | 9.78 | 6.72 | 5.62 | 12.20 | (1.65) |
Distributions from net investment income | (.48) | (.25) | (.12) | (.12) | (.46) |
Distributions from net realized gain | (4.79) | (.93) | (.74) | - | - |
Total distributions | (5.27) | (1.18) | (.86) | (.12) | (.46) |
Redemption fees added to paid in capital C | .06 | .03 | .03 | .08 | .05 |
Net asset value, end of period | $ 50.92 | $ 46.35 | $ 40.78 | $ 35.99 | $ 23.83 |
Total Return A, B | 22.29% | 17.01% | 16.09% | 51.73% | (6.16)% |
Ratios to Average Net Assets D, G | |||||
Expenses before reductions | 1.01% | 1.05% | 1.06% | 1.31% | 1.57% |
Expenses net of fee waivers, if any | .98% | 1.05% | 1.06% | 1.31% | 1.57% |
Expenses net of all reductions | .96% | 1.01% | 1.02% | 1.17% | 1.42% |
Net investment income (loss) | .87% | .78% | .42% | .43% | .16% |
Supplemental Data | |||||
Net assets, end of period (000 omitted) | $ 230,147 | $ 169,523 | $ 144,442 | $ 135,131 | $ 41,275 |
Portfolio turnover rate E | 185% | 124% | 89% | 175% | 226% |
A Total returns would have been lower had certain expenses not been reduced during the periods shown. B Total returns do not include the effect of the former sales charges. C Calculated based on average shares outstanding during the period. |
Financial Highlights - Institutional Class
Years ended February 28, | 2007 G |
Selected Per-Share Data | |
Net asset value, beginning of period | $ 46.90 |
Income from Investment Operations | |
Net investment income (loss) D | .08 |
Net realized and unrealized gain (loss) | 3.92 |
Total from investment operations | 4.00 |
Redemption fees added to paid in capital D | .01 |
Net asset value, end of period | $ 50.91 |
Total Return B, C | 8.55% |
Ratios to Average Net Assets E, H | |
Expenses before reductions | 1.06% A |
Expenses net of fee waivers, if any | 1.06% A |
Expenses net of all reductions | 1.04% A |
Net investment income (loss) | .79% A |
Supplemental Data | |
Net assets, end of period (000 omitted) | $ 119 |
Portfolio turnover rate F | 185% |
A Annualized B Total returns for periods of less than one year are not annualized. C Total returns would have been lower had certain expenses not been reduced during the periods shown. D Calculated based on average shares outstanding during the period. E Fees and expenses of the underlying Fidelity Central Funds are not included in the Fund's expense ratio. The Fund indirectly bears its proportionate share of the expenses of any underlying Fidelity Central Funds. F Amount does not include the portfolio activity of any underlying Fidelity Central Funds. G For the period December 12, 2006 (commencement of sale of shares) to February 28, 2007. H Expense ratios reflect operating expenses of the class. Expenses before reductions do not reflect amounts reimbursed by the investment adviser or reductions from brokerage service arrangements or other expense offset arrangements and do not represent the amount paid by the class during periods when reimbursements or reductions occur. Expenses net of fee waivers reflect expenses after reimbursement by the investment adviser but prior to reductions from brokerage service arrangements or other expense offset arrangements. Expenses net of all reductions represent the net expenses paid by the class. |
See accompanying notes which are an integral part of the financial statements.
Annual Report
Notes to Financial Statements
For the period ended February 28, 2007
1. Organization.
Materials Portfolio (the Fund) (formerly Industrial Materials Portfolio) is a non-diversified fund of Fidelity Select Portfolios (the trust) and is authorized to issue an unlimited number of shares. The trust is registered under the Investment Company Act of 1940, as amended (the 1940 Act), as an open-end management investment company organized as a Massachusetts business trust. The Fund invests primarily in securities of companies whose principal business activities fall within specific industries. The Fund offers Class A, Class T, Class B, Class C, Materials, and Institutional Class shares, each of which has equal rights as to assets and voting privileges. Each class has exclusive voting rights with respect to matters that affect that class. The Fund commenced sale of Class A, Class T, Class B, Class C and Institutional Class shares and the existing class was designated Materials on December 12, 2006. Class B shares will automatically convert to Class A shares after a holding period of seven years from the initial date of purchase. Investment income, realized and unrealized capital gains and losses, the common expenses of the Fund, and certain fund-level expense reductions, if any, are allocated on a pro rata basis to each class based on the relative net assets of each class to the total net assets of the Fund. Each class differs with respect to transfer agent and distribution and service plan fees incurred. Certain expense reductions also differ by class. The financial statements have been prepared in conformity with accounting principles generally accepted in the United States of America, which require management to make certain estimates and assumptions at the date of the financial statements.
2. Investments in Fidelity Central Funds.
The Fund may invest in Fidelity Central Funds which are open-end investment companies available only to other investment companies and accounts managed by FMR and its affiliates. The Fund's Schedule of Investments lists each of the Fidelity Central Funds as an investment of the Fund but does not include the underlying holdings of each Fidelity Central Fund. As an Investing Fund, the Fund indirectly bears its proportionate share of the expenses of the underlying Fidelity Central Funds. A complete unaudited list of holdings for each Fidelity Central Fund is available upon request. In addition, the financial statements of the Fidelity Central Funds, which are not covered by the Fund's Report of Independent Registered Public Accounting Firm, are available on the EDGAR Database on the SEC's web site, www.sec.gov, or upon request.
The Money Market Central Funds seek preservation of capital and current income and are managed by Fidelity Investments Money Management, Inc. (FIMM) an affiliate of Fidelity Management & Research Company (FMR).
3. Significant Accounting Policies.
The following summarizes the significant accounting policies of the Fund:
Security Valuation. Investments are valued and net asset value (NAV) per share is calculated (NAV calculation) as of the close of business of the New York Stock Exchange (NYSE), normally 4:00 p.m. Eastern time. During the period the Fund also calculated a NAV each hour on the hour (commencing at 10:00 a.m. Eastern time until one hour prior to the close of business on the NYSE). Effective October 1, 2006 the Fund eliminated hourly NAV calculation.
Wherever possible, the Fund uses independent pricing services approved by the Board of Trustees to value its investments. Equity securities, including restricted securities, for which market quotations are readily available, are valued at the last reported sale price or official closing price as reported by an independent pricing service on the primary market or exchange on which they are traded. In the event there were no sales during the day or closing prices are not available, securities are valued at the last quoted bid price. Investments in open-end mutual funds, including the Fidelity Central Funds, are valued at their closing net asset value each business day. Short-term securities with remaining maturities of sixty days or less for which quotations are not readily available are valued at amortized cost, which approximates value.
When current market prices or quotations are not readily available or do not accurately reflect fair value, valuations may be determined in accordance with procedures adopted by the Board of Trustees. For example, when developments occur between the close of a market and the close of the NYSE that may materially affect the value of some or all of the securities, or when trading in a security is halted, those securities may be fair valued. Factors used in the determination of fair value may include monitoring news to identify significant market or security specific events such as changes in the value of U.S. securities markets, reviewing developments in foreign markets and evaluating the performance of ADRs, futures contracts and exchange-traded funds. Because the Fund's utilization of fair value pricing depends on market activity, the frequency with which fair value pricing is used cannot be predicted and may be utilized to a significant extent. The value of securities used for NAV calculation under fair value pricing may differ from published prices for the same securities.
Annual Report
3. Significant Accounting Policies - continued
Foreign Currency. The Fund uses foreign currency contracts to facilitate transactions in foreign-denominated securities. Losses from these transactions may arise from changes in the value of the foreign currency or if the counterparties do not perform under the contracts' terms.
Foreign-denominated assets, including investment securities, and liabilities are translated into U.S. dollars at the exchange rate at period end. Purchases and sales of investment securities, income and dividends received and expenses denominated in foreign currencies are translated into U.S. dollars at the exchange rate in effect on the transaction date.
The effects of exchange rate fluctuations on investments are included with the net realized and unrealized gain (loss) on investment securities. Other foreign currency transactions resulting in realized and unrealized gain (loss) are disclosed separately.
Investment Transactions and Income. For financial reporting purposes, the Fund's investment holdings and NAV include trades executed through the end of the last business day of the period. The NAV for processing shareholder transactions includes trades executed through the end of the prior business day. Gains and losses on securities sold are determined on the basis of identified cost and may include proceeds received from litigation. Dividend income is recorded on the ex-dividend date, except for certain dividends from foreign securities where the ex-dividend date may have passed, which are recorded as soon as the Fund is informed of the ex-dividend date. Non-cash dividends included in dividend income, if any, are recorded at the fair market value of the securities received. Interest income and capital gain distributions from the Fidelity Central Funds are accrued as earned, with any distributions receivable as of period end included in Distributions receivable from Fidelity Central Funds on the Statement of Assets and Liabilities. Interest income includes coupon interest and amortization of premium and accretion of discount on debt securities. Investment income is recorded net of foreign taxes withheld where recovery of such taxes is uncertain.
Expenses. Most expenses of the trust can be directly attributed to a fund. Expenses which cannot be directly attributed are apportioned among each Fund in the trust. Expense estimates are accrued in the period to which they relate and adjustments are made when actual amounts are known.
Income Tax Information and Distributions to Shareholders. Each year, the Fund intends to qualify as a regulated investment company by distributing all of its taxable income and realized gains under Subchapter M of the Internal Revenue Code. As a result, no provision for income taxes is required in the accompanying financial statements. Foreign taxes are provided for based on the Fund's understanding of the tax rules and rates that exist in the foreign markets in which it invests.
Distributions are recorded on the ex-dividend date. Income dividends and capital gain distributions are declared separately for each class. Income and capital gain distributions are determined in accordance with income tax regulations, which may differ from generally accepted accounting principles.
Capital accounts within the financial statements are adjusted for permanent book-tax differences. These adjustments have no impact on net assets or the results of operations. Temporary book-tax differences will reverse in a subsequent period.
Book-tax differences are primarily due to foreign currency transactions, passive foreign investment companies (PFIC), deferred trustees compensation, and losses deferred due to wash sales.
The tax-basis components of distributable earnings and the federal tax cost as of period end were as follows:
Unrealized appreciation | $ 31,287,329 |
Unrealized depreciation | (4,284,560) |
Net unrealized appreciation (depreciation) | 27,002,769 |
Undistributed ordinary income | 276,796 |
Undistributed long-term capital gain | 3,618,826 |
Cost for federal income tax purposes | $ 213,450,279 |
The tax character of distributions paid was as follows:
February 28, 2007 | February 28, 2006 | |
Ordinary Income | $ 4,275,377 | $ 770,963 |
Long-term Capital Gains | 14,761,326 | 3,187,200 |
Total | $ 19,036,703 | $ 3,958,163 |
Trading (Redemption) Fees. Shares in the Fund held less than 30 days are subject to a redemption fee equal to .75% of the net asset value of shares redeemed. All redemption fees, including any estimated redemption fees paid by FMR, are retained by the Fund and accounted for as an addition to paid in capital. Shareholders were also subject to an additional $7.50 fee for shares exchanged into another Fidelity fund (see Note 6).
Annual Report
Notes to Financial Statements - continued
3. Significant Accounting Policies - continued
New Accounting Pronouncements. In July 2006, Financial Accounting Standards Board Interpretation No. 48, Accounting for Uncertainty in Income Taxes - an interpretation of FASB Statement 109 (FIN 48), was issued and is effective on the last business day of the semiannual reporting period for fiscal years beginning after December 15, 2006. FIN 48 sets forth a threshold for financial statement recognition, measurement and disclosure of a tax position taken or expected to be taken on a tax return. Management is currently evaluating the impact, if any, the adoption of FIN 48 will have on the Fund's net assets, results of operations and financial statement disclosures.
In addition, in September 2006, Statement of Financial Accounting Standards No. 157, Fair Value Measurements (SFAS 157), was issued and is effective for fiscal years beginning after November 15, 2007. SFAS 157 defines fair value, establishes a framework for measuring fair value and expands disclosures about fair value measurements. Management is currently evaluating the impact the adoption of SFAS 157 will have on the Fund's financial statement disclosures.
4. Operating Policies.
Repurchase Agreements. FMR has received an Exemptive Order from the Securities and Exchange Commission (the SEC) which permits the Fund and other affiliated entities of FMR to transfer uninvested cash balances into joint trading accounts which are then invested in repurchase agreements. The Fund may also invest directly with institutions in repurchase agreements. Repurchase agreements are collateralized by government or non-government securities. Upon settlement date, collateral is held in segregated accounts with custodian banks and may be obtained in the event of a default of the counterparty. The Fund monitors, on a daily basis, the value of the collateral to ensure it is at least equal to the principal amount of the repurchase agreement (including accrued interest). In the event of a default by the counterparty, realization of the collateral proceeds could be delayed, during which time the value of the collateral may decline.
Restricted Securities. The Fund may invest in securities that are subject to legal or contractual restrictions on resale. These securities generally may be resold in transactions exempt from registration or to the public if the securities are registered. Disposal of these securities may involve time-consuming negotiations and expense, and prompt sale at an acceptable price may be difficult. Information regarding restricted securities is included at the end of the Fund's Schedule of Investments.
5. Purchases and Sales of Investments.
Purchases and sales of securities, other than short-term securities, aggregated $385,380,320 and $348,269,722, respectively.
6. Fees and Other Transactions with Affiliates.
Management Fee. FMR and its affiliates provide the Fund with investment management related services for which the Fund pays a monthly management fee. The management fee is the sum of an individual fund fee rate that is based on an annual rate of .30% of the Fund's average net assets and a group fee rate that averaged .26% during the period. The group fee rate is based upon the average net assets of all the mutual funds advised by FMR. The group fee rate decreases as assets under management increase and increases as assets under management decrease. For the period, the total annual management fee rate was .56% of the Fund's average net assets.
Distribution and Service Plan. In accordance with Rule 12b-1 of the 1940 Act, the Fund has adopted separate Distribution and Service Plans for each class of shares. Certain classes pay Fidelity Distributors Corporation (FDC), an affiliate of FMR, separate Distribution and Service Fees, each of which is based on an annual percentage of each class' average net assets. In addition, FDC may pay financial intermediaries for selling shares of the Fund and providing shareholder support services. For the period, the Distribution and Service Fee rates and the total amounts paid to and retained by FDC were as follows:
Distribution | Service | Paid to | Retained | |
Class A | -% | .25% | $ 175 | $ 107 |
Class T | .25% | .25% | 224 | 110 |
Class B | .75% | .25% | 620 | 527 |
Class C | .75% | .25% | 364 | 280 |
$ 1,383 | $ 1,024 |
Sales Load. FDC receives a front-end sales charge of up to 5.75% for selling Class A shares, and 3.50% for selling Class T shares, some of which is paid to financial intermediaries for selling shares of the Fund. FDC receives the proceeds of contingent deferred sales charges levied on Class A, Class T, Class B, and Class C redemptions. These charges depend on the holding period. The deferred sales charges range from 5% to 1% for Class B, 1% for Class C, 1.00% to .50% for certain purchases of Class A shares and .25% for certain purchases of Class T shares.
Annual Report
6. Fees and Other Transactions with Affiliates - continued
Sales Load - continued
For the period, sales charge amounts retained by FDC were as follows:
Retained | |
Class A | $ 973 |
Class T | 311 |
$ 1,284 |
Transfer Agent Fees. Fidelity Investments Institutional Operations Company, Inc. (FIIOC), an affiliate of FMR, is the transfer, dividend disbursing and shareholder servicing agent for each class of the Fund, except for Materials class. Fidelity Service Company, Inc. (FSC), an affiliate of FMR, is the transfer agent for Materials class shares. FIIOC and FSC receive account fees and asset-based fees that vary according to the account size and type of account of the shareholders of the respective classes of the Fund. FIIOC and FSC pay for typesetting, printing and mailing of shareholder reports, except proxy statements. For the period, the total transfer agent fees paid by each class to FIIOC or FSC, were as follows:
Amount | % of | |
Class A | $ 89 | .14 |
Class T | 91 | .21 |
Class B | 126 | .22 |
Class C | 63 | .18 |
Materials | 582,390 | .30 |
Institutional Class | 107 | .29 |
$ 582,866 |
Accounting and Security Lending Fees. FSC maintains the Fund's accounting records. The accounting fee is based on the level of average net assets for the month. Under a separate contract, FSC administers the security lending program. The security lending fee is based on the number and duration of lending transactions.
Exchange Fees. During the period, FSC received the proceeds of a $7.50 fee to cover administrative costs associated with exchanges out of the Fund to any other Fidelity Select fund or to any other Fidelity fund made through non-automated channels. Effective October 1, 2006, the exchange fees were eliminated. For the period, exchange fees retained by FSC were as follows:
Retained | |
Materials Portfolio | $ 3,510 |
Brokerage Commissions. The Fund placed a portion of its portfolio transactions with brokerage firms which are affiliates of the investment adviser. The commissions paid to these affiliated firms were $847 for the period.
Interfund Lending Program. Pursuant to an Exemptive Order issued by the SEC, the Fund, along with other registered investment companies having management contracts with FMR, may participate in an interfund lending program. This program provides an alternative credit facility allowing the funds to borrow from, or lend money to, other participating affiliated funds. At period end, there were no interfund loans outstanding. The Fund's activity in this program during the period for which loans were outstanding was as follows:
Borrower or Lender | Average Daily | Weighted Average Interest Rate | Interest |
Borrower | $ 7,629,000 | 5.17% | $ 2,189 |
7. Committed Line of Credit.
The Fund participates with other funds managed by FMR in a $4.2 billion credit facility (the "line of credit") to be utilized for temporary or emergency purposes to fund shareholder redemptions or for other short-term liquidity purposes. The Fund has agreed to pay commitment fees on its pro rata portion of the line of credit, which amounted to $512 and is reflected in Miscellaneous Expense on the Statement of Operations. During the period, there were no borrowings on this line of credit.
Annual Report
Notes to Financial Statements - continued
8. Security Lending.
The Fund lends portfolio securities from time to time in order to earn additional income. On the settlement date of the loan, the Fund receives collateral (in the form of U.S. Treasury obligations, letters of credit and/or cash) against the loaned securities and maintains collateral in an amount not less than 100% of the market value of the loaned securities during the period of the loan. The market value of the loaned securities is determined at the close of business of the Fund and any additional required collateral is delivered to the Fund on the next business day. If the borrower defaults on its obligation to return the securities loaned because of insolvency or other reasons, a fund could experience delays and costs in recovering the securities loaned or in gaining access to the collateral. Any cash collateral received is invested in the Fidelity Securities Lending Cash Central Fund. The value of loaned securities and cash collateral at period end are disclosed on the Fund's Statement of Assets and Liabilities. Security lending income represents the income earned on investing cash collateral, less fees and expenses associated with the loan, plus any premium payments that may be received on the loan of certain types of securities. Security lending income is presented in the Statement of Operations as a component of income from Fidelity Central Funds. Net income from lending portfolio securities during the period amounted to $41,460.
9. Expense Reductions.
FMR voluntarily agreed to reimburse each class to the extent annual operating expenses exceeded certain levels of average net assets as noted in the table below. Some expenses, for example interest expense, including commitment fees, are excluded from this reimbursement.
The following classes were in reimbursement during the period:
Expense | Reimbursement | |
Class A | 1.40% | $ 67 |
Class T | 1.65% | 64 |
Class B | 2.15% | 66 |
Class C | 2.15% | 56 |
$ 253 |
FMR voluntarily agreed to reimburse a portion of Material's operating expenses. During the period, this reimbursement reduced the class' expenses by $56,875.
Many of the brokers with whom FMR places trades on behalf of the Fund provided services to the Fund in addition to trade execution. These services included payments of certain expenses on behalf of the Fund totaling $46,655 for the period. In addition, through arrangements with the each class' transfer agent, credits realized as a result of uninvested cash balances were used to reduce the Fund's expenses. During the period, credits reduced each class' transfer agent expense as noted in the table below.
Transfer Agent | |
Materials | $ 978 |
10. Other.
The Fund's organizational documents provide former and current trustees and officers with a limited indemnification against liabilities arising in connection with the performance of their duties to the Fund. In the normal course of business, the Fund may also enter into contracts that provide general indemnifications. The Fund's maximum exposure under these arrangements is unknown as this would be dependent on future claims that may be made against the Fund. The risk of material loss from such claims is considered remote.
The United States Securities and Exchange Commission ("SEC") is conducting an investigation of FMR (covering the years 2002 to 2004) arising from gifts, gratuities and business entertainment provided by certain brokers to certain individuals who were employed on FMR's domestic equity trading desk during that period. FMR is in discussions with the SEC staff regarding the possible resolution of the matter, but as of period-end no final resolution has been reached.
In December 2006, the Independent Trustees completed their own investigation of the matter with the assistance of independent counsel. The Independent Trustees and FMR agree that, despite the absence of proof that the Fidelity mutual funds experienced diminished execution quality as a result of the improper receipt of gifts and business entertainment, the conduct at issue was serious and is worthy of redress. Accordingly, the Independent Trustees have requested and FMR has agreed to pay $42 million to Fidelity mutual funds, plus interest to be determined at the time that payment is made. A method of allocating this payment among the funds has not yet been determined. The total payment to the Fund is not anticipated to have a material impact on the Fund's net assets. In addition, FMR reimbursed related legal expenses which are recorded in the accompanying Statement of Operations as an expense reduction.
Annual Report
11. Distributions to Shareholders.
Distributions to shareholders of each class were as follows:
Years ended February 28, | 2007 | 2006 |
From net investment income | ||
Materials | $ 1,721,356 | $ 770,963 |
From net realized gain | ||
Materials | $ 17,315,347 | $ 3,187,200 |
12. Share Transactions.
Transactions for each class of shares were as follows:
Shares | Dollars | |||
Years ended February 28, | 2007 A | 2006 | 2007 A | 2006 |
Class A | ||||
Shares sold | 19,960 | - | $ 1,010,235 | $ - |
Shares redeemed | - | - | - | - |
Net increase (decrease) | 19,960 | - | $ 1,010,235 | $ - |
Class T | ||||
Shares sold | 13,890 | - | $ 703,837 | $ - |
Shares redeemed | - | - | - | - |
Net increase (decrease) | 13,890 | - | $ 703,837 | $ - |
Class B | ||||
Shares sold | 13,022 | - | $ 643,438 | $ - |
Shares redeemed | - | - | - | - |
Net increase (decrease) | 13,022 | - | $ 643,438 | $ - |
Class C | ||||
Shares sold | 10,758 | - | $ 546,127 | $ - |
Shares redeemed | - | - | - | - |
Net increase (decrease) | 10,758 | - | $ 546,127 | $ - |
Materials | ||||
Shares sold | 6,290,426 | 4,217,962 | $ 311,961,345 | $ 177,007,921 |
Reinvestment of distributions | 378,787 | 93,814 | 18,026,752 | 3,742,752 |
Shares redeemed | (5,806,915) | (4,196,527) | (273,224,056) | (168,316,528) |
Net increase (decrease) | 862,298 | - | $ 56,764,041 | $ 12,434,145 |
Institutional Class | ||||
Shares sold | 4,445 | - | $ 210,000 | $ - |
Shares redeemed | (2,112) | - | (106,028) | - |
Net increase (decrease) | 2,333 | - | $ 103,972 | $ - |
A Share transactions for Class A, Class T, Class B, Class C and Institutional Class are for the period December 12, 2006 (commencement of sale of shares) to February 28, 2007.
Annual Report
Fidelity Advisor Telecommunications Fund - Class A, T, B and C
Performance
Average annual total return reflects the change in the value of an investment, assuming reinvestment of the class' dividend income and capital gains (the profits earned upon the sale of securities that have grown in value) and assuming a constant rate of performance each year. The $10,000 table and the fund's returns do not reflect the deduction of taxes that a shareholder would pay on fund distributions or the redemption of fund shares. During periods of reimbursement by Fidelity, a fund's total return will be greater than it would be had the reimbursement not occurred. How a fund did yesterday is no guarantee of how it will do tomorrow.
Average Annual Total Returns
Periods ended February 28, 2007 | Past 1 | Past 5 | Past 10 |
Class A (incl. 5.75% sales charge) A | 15.59% | 10.23% | 6.06% |
Class T (incl. 3.50% sales charge) B | 18.28% | 10.74% | 6.31% |
Class B (incl. contingent deferred sales charge) C | 17.43% | 11.24% | 6.68% |
Class C (incl. contingent deferred sales charge) D | 21.45% | 11.51% | 6.68% |
A Class A shares bear a 0.25% 12b-1 fee. The initial offering of Class A shares took place on December 12, 2006. Returns prior to December 12, 2006 are those of Telecommunications, the original class of the fund, which has no 12b-1 fee. Had Class A shares' 12b-1 fee been reflected, returns prior to December 12, 2006 would have been lower.
B Class T shares bear a 0.50% 12b-1 fee. The initial offering of Class T shares took place on December 12, 2006. Returns prior to December 12, 2006 are those of Telecommunications, the original class of the fund, which has no 12b-1 fee. Had Class T shares' 12b-1 fee been reflected, returns prior to December 12, 2006 would have been lower.
C Class B shares bear a 1.00% 12b-1 fee. The initial offering of Class B shares took place on December 12, 2006. Returns prior to December 12, 2006 are those of Telecommunications, the original class of the fund, which has no 12b-1 fee. Had Class B shares' 12b-1 fee been reflected, returns prior to December 12, 2006 would have been lower. Class B shares' contingent deferred sales charge included in the past one year, past five years, and past ten years total return figures are 5%, 2%, and 0%, respectively.
D Class C shares bear a 1.00% 12b-1 fee. The initial offering of Class C shares took place on December 12, 2006. Returns prior to December 12, 2006 are those of Telecommunications, the original class of the fund, which has no 12b-1 fee. Had Class C shares' 12b-1 fee been reflected, returns prior to December 12, 2006 would have been lower. Class C shares' contingent deferred sales charge included in the past one year, past five years, and past ten years total return figures are 1%, 0%, and 0%, respectively.
$10,000 Over 10 Years
Let's say hypothetically that $10,000 was invested in Fidelity Advisor Telecommunications Fund - Class T (dagger) on February 28, 1997, and the current 3.50% sales charge was paid. The chart shows how the value of your investment would have changed, and also shows how the Standard & Poor's 500 Index performed over the same period.
(dagger) Class T shares bear a 0.50% 12b-1 fee. The initial offering of Class T shares took place on December 12, 2006. Returns prior to December 12, 2006 are those of Telecommunications, the original class of the fund, which has no 12b-1 fee. Had Class T shares' 12b-1 fee been reflected, returns prior to December 12, 2006 would have been lower.
Annual Report
Fidelity Advisor Telecommunications Fund - Class A, T, B and C
Management's Discussion of Fund Performance
Comments from Brian Younger, Portfolio Manager of Fidelity Advisor Telecommunications Fund during the period covered by the report
A rosy year for stocks wilted just prior to the end of the 12-month period ending February 28, 2007. On the day prior to the period's close, the Dow Jones Industrial AverageSM plunged 416 points and the Standard & Poor's 500SM Index lost roughly 3.5% of its value, plummeting nearly 50 points and marking the benchmark's worst single-day performance since the day the market reopened after the 9/11 terrorist attacks. Though investors were obviously rattled by the development, it was only the 22nd biggest decline for the S&P 500® in 20 years, and it could not overshadow how well stocks performed for the 12 months overall. For much of the past year, investors grew confident that the economy would not fall into a recession, and they bid up most broad-based stock indexes for six consecutive months from August through January. Overall for the year ending February 28, 2007, the S&P 500 was up 11.97%, the Dow advanced 14.24%, the small-cap Russell 2000® Index gained 9.87% and the NASDAQ Composite® Index rose 6.66%.
It's important to point out that in connection with a restructuring of the product line effective October 1, 2006, the fund changed the benchmark to which it compares its performance. During the 12 months ending February 28, 2007, the fund trailed the 27.72% gain of the Morgan Stanley Capital InternationalSM (MSCI®) US Investable Market Telecommunications Services Index, but beat the 21.44% return of a blended index specific to this fund. This blended index is a combination of the Goldman Sachs® Utilities Index, which the fund was compared with through September, and the new MSCI benchmark mentioned above, which the fund was compared with during the period's final five months1. F or the 12-month period, the fund also did better than the S&P 500. (For specific performance information on the fund's Class A, Class T, Class B and Class C shares, please refer to the performance section of this report.) During the first seven months of the review period, the fund outpaced the Goldman Sachs index, driven by an overweighting and strong stock selection among integrated telecommunications services stocks. Of note were Qwest Communications and AT&T. Qwest benefited from improved pricing in its residential wireline business, while recent merger activity drove AT&T's earnings beyond expectations. Communications equipment stocks, which had virtually no representation in the index but were a sizable stake in the fund, hurt performance as intense competition pressured industry pricing. Detractors included QUALCOMM, which provides leading-edge technology for wireless networks, and Nortel Networks, which supplies both wireline and wireless equipment. The fund performed roughly in line with the MSCI index during the last five months of the period, with its biggest gains coming from alternative carriers, which compete with the well-known incumbents. An overweighting and strong security selection in the industry boosted returns. Winners included Cogent Communications and Iliad, both of which enjoyed strong market share gains. Cogent supplies high-speed Internet services, and non-index holding Iliad, a French company, sells voice and high-speed data services mainly to residential customers in Paris. Disappointing stock selection in integrated telecommunications services - which represented on average more than 50% of the fund's assets, versus nearly 75% for the MSCI index - cost the fund. Detractors included Qwest Communications, which took a breather after its earlier run-up, and AT&T, which rallied on strong earnings and revenue growth. The fund had an underweighting in AT&T and an overweighting in Qwest. By period end, I had completely eliminated equipment stocks to bring the fund in line with its new benchmark.
1 The fund's blended index is a customized index developed by Fidelity for the limited purpose of discussing the fund's performance for the 12-month period ending February 28, 2007. From March 1, 2006, through September 30, 2006, the fund compared its performance to the Goldman Sachs Utilities Index, which returned 8.34% during that period. On October 1, 2006, the fund began comparing its performance to a different index, the MSCI US Investable Market Telecommunications Services Index, which returned 12.09% from October 1, 2006, through February 28, 2007. For the 12-month period ending February 28, 2007, the blended index (Goldman Sachs and MSCI) returned 21.44%.
Note to shareholders: Gavin Baker will become manager of the fund on March 1, 2007.
The views expressed above reflect those of the portfolio manager(s) only through the end of the period as stated on the cover of this report and do not necessarily represent the views of Fidelity or any other person in the Fidelity organization. Any such views are subject to change at any time based upon market or other conditions and Fidelity disclaims any responsibility to update such views. These views may not be relied on as investment advice and, because investment decisions for a Fidelity fund are based on numerous factors, may not be relied on as an indication of trading intent on behalf of any Fidelity fund.
Annual Report
Select Telecommunications Portfolio
Shareholder Expense Example
As a shareholder of the Fund, you incur two types of costs: (1) transaction costs, including sales charges (loads) on purchase payments or redemption proceeds, redemption fees, exchange fees, and (2) ongoing costs, including management fees, distribution and/or service (12b-1) fees and other Fund expenses. This Example is intended to help you understand your ongoing costs (in dollars) of investing in the Fund and to compare these costs with the ongoing costs of investing in other mutual funds.
The actual Example is based on an investment of $1,000 at the beginning of the period and held for the entire period (September 1, 2006 to February 28, 2007) for the Telecommunications class and for the entire period (December 12, 2006 to February 28, 2007) for Class A, Class T, Class B, Class C and Institutional Class. The hypothetical expense Example is based on an investment of $1,000 invested for the one-half year period (September 1, 2006 to February 28, 2007).
Actual Expenses
The first line of the accompanying table for each class of the Fund provides information about actual account values and actual expenses. You may use the information in this line, together with the amount you invested, to estimate the expenses that you paid over the period. Simply divide your account value by $1,000.00 (for example, an $8,600 account value divided by $1,000.00 = 8.6), then multiply the result by the number in the first line for a class of the Fund under the heading entitled "Expenses Paid During Period" to estimate the expenses you paid on your account during this period. A small balance maintenance fee of $12.00 that is charged once a year may apply for certain accounts with a value of less than $2,000. This fee is not included in the table below. If it was, the estimate of expenses you paid during the period would be higher, and your ending account value lower, by this amount.
Hypothetical Example for Comparison Purposes
The second line of the accompanying table for each class of the Fund provides information about hypothetical account values and hypothetical expenses based on a Class' actual expense ratio and an assumed rate of return of 5% per year before expenses, which is not the Class' actual return. The hypothetical account values and expenses may not be used to estimate the actual ending account balance or expenses you paid for the period. You may use this information to compare the ongoing costs of investing in the Fund and other funds. To do so, compare this 5% hypothetical example with the 5% hypothetical examples that appear in the shareholder reports of the other funds. A small balance maintenance fee of $12.00 that is charged once a year may apply for certain accounts with a value of less than $2,000. This fee is not included in the table below. If it was, the estimate of expenses you paid during the period would be higher, and your ending account value lower, by this amount.
Please note that the expenses shown in the table are meant to highlight your ongoing costs only and do not reflect any transaction costs. Therefore, the second line of the table is useful in comparing ongoing costs only, and will not help you determine the relative total costs of owning different funds. In addition, if these transactional costs were included, your costs would have been higher.
Beginning | Ending | Expenses Paid | |
Class A | |||
Actual | $ 1,000.00 | $ 1,066.00 | $ 2.75B |
HypotheticalA | $ 1,000.00 | $ 1,018.70 | $ 6.16C |
Class T | |||
Actual | $ 1,000.00 | $ 1,065.40 | $ 3.44B |
HypotheticalA | $ 1,000.00 | $ 1,017.16 | $ 7.70C |
Class B | |||
Actual | $ 1,000.00 | $ 1,064.10 | $ 4.58B |
HypotheticalA | $ 1,000.00 | $ 1,014.63 | $ 10.24C |
Class C | |||
Actual | $ 1,000.00 | $ 1,064.30 | $ 4.62B |
HypotheticalA | $ 1,000.00 | $ 1,014.53 | $ 10.34C |
Telecommunications | |||
Actual | $ 1,000.00 | $ 1,172.20 | $ 5.01B |
HypotheticalA | $ 1,000.00 | $ 1,020.18 | $ 4.66C |
Institutional Class | |||
Actual | $ 1,000.00 | $ 1,066.40 | $ 2.19B |
HypotheticalA | $ 1,000.00 | $ 1,019.93 | $ 4.91C |
A 5% return per year before expenses
B Actual expenses are equal to each Class' annualized expense ratio (shown in the table below); multiplied by the average account value over the period, multiplied by 181/365 (to reflect the one-half year period) for the Telecommunications class and multiplied by 79/365 (to reflect the period December 12, 2006 to February 28, 2007) for Class A, Class T, Class B, Class C and Institutional Class.
C Hypothetical expenses are equal to each Class' annualized expense ratio (shown in the table below); multiplied by the average account value over the period, multiplied by 181/365 (to reflect the one-half year period).
Annualized | |
Class A | 1.23% |
Class T | 1.54% |
Class B | 2.05% |
Class C | 2.07% |
Telecommunications | .93% |
Institutional Class | .98% |
Annual Report
Select Telecommunications Portfolio
Investment Changes
Top Ten Stocks as of February 28, 2007 | ||
% of fund's | % of fund's net assets | |
AT&T, Inc. | 17.5 | 15.2 |
Verizon Communications, Inc. | 14.6 | 11.6 |
Qwest Communications International, Inc. | 9.8 | 14.7 |
ALLTEL Corp. | 5.0 | 4.3 |
Iliad Group SA | 4.9 | 0.0 |
Dobson Communications Corp. Class A | 4.8 | 0.8 |
Leap Wireless International, Inc. | 4.6 | 0.5 |
Time Warner Telecom, Inc. Class A (sub. vtg.) | 4.5 | 2.0 |
SBA Communications Corp. Class A | 4.5 | 0.0 |
Level 3 Communications, Inc. | 4.5 | 3.1 |
74.7 | ||
Top Industries (% of fund's net assets) | |||
As of February 28, 2007 | |||
| Diversified Telecommunication Services | 65.1% | |
| Wireless Telecommunication Services | 30.7% | |
 | Diversified Financial Services | 1.4% | |
| Electronic Equipment & Instruments | 0.0% | |
| All Others* | 2.8% | |

As of August 31, 2006 | |||
| Diversified Telecommunication Services | 55.5% | |
| Communications Equipment | 29.4% | |
| Wireless Telecommunication Services | 12.0% | |
| All Others* | 3.1% | |

* Includes short-term investments and net other assets. |
Annual Report
Select Telecommunications Portfolio
Investments February 28, 2007
Showing Percentage of Net Assets
Common Stocks - 97.2% | |||
Shares | Value | ||
DIVERSIFIED FINANCIAL SERVICES - 1.4% | |||
Specialized Finance - 1.4% | |||
Fortress Investment Group LLC | 281,700 | $ 8,507,340 | |
DIVERSIFIED TELECOMMUNICATION SERVICES - 65.1% | |||
Alternative Carriers - 16.5% | |||
Cogent Communications Group, Inc. (a) | 472,208 | 10,653,012 | |
Global Crossing Ltd. (a) | 199,200 | 5,663,256 | |
Iliad Group SA (d) | 290,500 | 30,531,683 | |
Level 3 Communications, Inc. (a)(d) | 4,283,664 | 28,143,672 | |
Time Warner Telecom, Inc. Class A (sub. vtg.) (a) | 1,292,200 | 28,441,322 | |
103,432,945 | |||
Integrated Telecommunication Services - 48.6% | |||
AT&T, Inc. | 2,985,702 | 109,873,835 | |
BT Group PLC | 1,094,800 | 6,358,598 | |
Cbeyond, Inc. | 5,300 | 164,671 | |
FairPoint Communications, Inc. | 289,000 | 5,519,900 | |
NeuStar, Inc. Class A (a) | 213,900 | 6,844,800 | |
NTELOS Holding Corp. | 796,868 | 14,877,526 | |
Qwest Communications International, Inc. (a)(d) | 6,892,344 | 61,204,015 | |
Telefonica SA sponsored ADR | 101,500 | 6,534,570 | |
Verizon Communications, Inc. | 2,435,924 | 91,176,635 | |
Windstream Corp. | 109,708 | 1,651,105 | |
304,205,655 | |||
TOTAL DIVERSIFIED TELECOMMUNICATION | 407,638,600 | ||
ELECTRONIC EQUIPMENT & INSTRUMENTS - 0.0% | |||
Electronic Manufacturing Services - 0.0% | |||
Trimble Navigation Ltd. (a) | 8,940 | 236,552 | |
WIRELESS TELECOMMUNICATION SERVICES - 30.7% | |||
Wireless Telecommunication Services - 30.7% | |||
ALLTEL Corp. | 518,900 | 31,440,151 | |
American Tower Corp. Class A (a) | 710,000 | 27,505,400 | |
Bharti Airtel Ltd. (a) | 660,000 | 10,815,295 | |
Centennial Communications Corp. Class A | 294,900 | 2,323,812 | |
Shares | Value | ||
Crown Castle International Corp. (a) | 813,800 | $ 26,660,088 | |
Dobson Communications Corp. Class A | 3,418,300 | 30,354,504 | |
InPhonic, Inc. (a)(d) | 76,500 | 950,895 | |
Leap Wireless International, Inc. (a) | 422,414 | 28,542,514 | |
Rural Cellular Corp. Class A (a) | 168,700 | 2,198,161 | |
SBA Communications Corp. Class A (a) | 1,049,000 | 28,291,530 | |
Vodafone Group PLC sponsored ADR | 122,700 | 3,423,330 | |
192,505,680 | |||
TOTAL COMMON STOCKS (Cost $516,438,124) | 608,888,172 | ||
Money Market Funds - 9.3% | |||
Fidelity Cash Central Fund, 5.35% (b) | 3,550,096 | 3,550,096 | |
Fidelity Securities Lending Cash Central Fund, 5.34% (b)(c) | 54,414,050 | 54,414,050 | |
TOTAL MONEY MARKET FUNDS (Cost $57,964,146) | 57,964,146 | ||
TOTAL INVESTMENT PORTFOLIO - 106.5% (Cost $574,402,270) | 666,852,318 | ||
NET OTHER ASSETS - (6.5)% | (40,470,502) | ||
NET ASSETS - 100% | $ 626,381,816 | ||
Legend |
(a) Non-income producing |
(b) Affiliated fund that is available only to investment companies and other accounts managed by Fidelity Investments. The rate quoted is the annualized seven-day yield of the fund at period end. A complete unaudited listing of the fund's holdings as of its most recent quarter end is available upon request. |
(c) Investment made with cash collateral received from securities on loan. |
(d) Security or a portion of the security is on loan at period end. |
Affiliated Central Funds |
Information regarding fiscal year to date income earned by the Fund from investments in Fidelity Central Funds is as follows: |
Fund | Income earned |
Fidelity Cash Central Fund | $ 599,879 |
Fidelity Securities Lending Cash Central Fund | 208,152 |
Total | $ 808,031 |
Other Information |
Distribution of investments by country of issue, as a percentage of total net assets, is as follows: |
United States of America | 90.0% |
France | 4.9% |
India | 1.7% |
United Kingdom | 1.5% |
Spain | 1.0% |
Others (individually less than 1%) | 0.9% |
100.0% |
Income Tax Information |
At February 28, 2007, the fund had a capital loss carryforward of approximately $495,069,450 of which $321,438,292, $161,866,685 and $11,764,473 will expire on February 28, 2010, 2011 and February 29, 2012, respectively. |
See accompanying notes which are an integral part of the financial statements.
Annual Report
Select Telecommunications Portfolio
Financial Statements
Statement of Assets and Liabilities
February 28, 2007 | ||
Assets | ||
Investment in securities, at value (including securities loaned of $53,537,450) - See accompanying schedule: Unaffiliated issuers (cost $516,438,124) | $ 608,888,172 | |
Fidelity Central Funds (cost $57,964,146) | 57,964,146 | |
Total Investments (cost $574,402,270) | $ 666,852,318 | |
Receivable for investments sold | 16,144,628 | |
Receivable for fund shares sold | 2,247,368 | |
Dividends receivable | 64,863 | |
Distributions receivable from Fidelity Central Funds | 71,935 | |
Prepaid expenses | 1,607 | |
Other receivables | 18,974 | |
Total assets | 685,401,693 | |
Liabilities | ||
Payable for investments purchased | $ 461,351 | |
Payable for fund shares redeemed | 3,431,023 | |
Accrued management fee | 291,823 | |
Distribution fees payable | 687 | |
Other affiliated payables | 150,185 | |
Other payables and accrued expenses | 270,758 | |
Collateral on securities loaned, at value | 54,414,050 | |
Total liabilities | 59,019,877 | |
Net Assets | $ 626,381,816 | |
Net Assets consist of: | ||
Paid in capital | $ 1,030,874,491 | |
Undistributed net investment income | 1,385,280 | |
Accumulated undistributed net realized gain (loss) on investments and foreign currency transactions | (498,119,362) | |
Net unrealized appreciation (depreciation) on investments | 92,241,407 | |
Net Assets | $ 626,381,816 | |
February 28, 2007 | ||
Calculation of Maximum Offering Price Class A: | $ 50.89 | |
Maximum offering price per share (100/94.25 of $50.89) | $ 53.99 | |
Class T: | $ 50.86 | |
Maximum offering price per share (100/96.50 of $50.86) | $ 52.70 | |
Class B: | $ 50.80 | |
Class C: | $ 50.81 | |
Telecommunications: | $ 50.91 | |
Institutional Class: | $ 50.91 | |
A Redemption price per share is equal to net asset value less any applicable contingent deferred sales charge.
See accompanying notes which are an integral part of the financial statements.
Annual Report
Statement of Operations
Year ended February 28, 2007 | ||
Investment Income | ||
Dividends | $ 9,195,804 | |
Special dividends | 1,230,657 | |
Interest | 137 | |
Income from Fidelity Central Funds | 808,031 | |
Total income | 11,234,629 | |
Expenses | ||
Management fee | $ 2,765,966 | |
Transfer agent fees | 1,520,519 | |
Distribution fees | 1,168 | |
Accounting and security lending fees | 225,781 | |
Custodian fees and expenses | 36,123 | |
Independent trustees' compensation | 1,860 | |
Registration fees | 150,014 | |
Audit | 40,413 | |
Legal | 8,851 | |
Interest | 15,851 | |
Miscellaneous | 34,145 | |
Total expenses before reductions | 4,800,691 | |
Expense reductions | (101,322) | 4,699,369 |
Net investment income (loss) | 6,535,260 | |
Realized and Unrealized Gain (Loss) Net realized gain (loss) on: | ||
Investment securities: | ||
Unaffiliated issuers (net of foreign taxes of $101,904) | 31,904,030 | |
Foreign currency transactions | (25,988) | |
Total net realized gain (loss) | 31,878,042 | |
Change in net unrealized appreciation (depreciation) on investment securities (net of increase in deferred foreign taxes of $208,641) | 54,610,776 | |
Net gain (loss) | 86,488,818 | |
Net increase (decrease) in net assets resulting from operations | $ 93,024,078 | |
Statement of Changes in Net Assets
Year ended | Year ended | |
Increase (Decrease) in Net Assets | ||
Operations | ||
Net investment income (loss) | $ 6,535,260 | $ 3,338,999 |
Net realized gain (loss) | 31,878,042 | 55,407,188 |
Change in net unrealized appreciation (depreciation) | 54,610,776 | 10,244,776 |
Net increase (decrease) in net assets resulting from operations | 93,024,078 | 68,990,963 |
Distributions to shareholders from net investment income | (5,987,382) | (3,005,035) |
Share transactions - net increase (decrease) | 136,866,943 | 2,681,402 |
Redemption fees | 144,270 | 25,069 |
Total increase (decrease) in net assets | 224,047,909 | 68,692,399 |
Net Assets | ||
Beginning of period | 402,333,907 | 333,641,508 |
End of period (including undistributed net investment income of $1,385,280 and undistributed net investment income of $965,295, respectively) | $ 626,381,816 | $ 402,333,907 |
See accompanying notes which are an integral part of the financial statements.
Annual Report
Financial Highlights - Class A
Years ended February 28, | 2007 H |
Selected Per-Share Data | |
Net asset value, beginning of period | $ 47.74 |
Income from Investment Operations | |
Net investment income (loss) E | - J |
Net realized and unrealized gain (loss) | 3.15 |
Total from investment operations | 3.15 |
Redemption fees added to paid in capital E | - J |
Net asset value, end of period | $ 50.89 |
Total Return B, C, D | 6.60% |
Ratios to Average Net Assets F, I | |
Expenses before reductions | 1.23% A |
Expenses net of fee waivers, if any | 1.23% A |
Expenses net of all reductions | 1.22% A |
Net investment income (loss) | (.03)% A |
Supplemental Data | |
Net assets, end of period (000 omitted) | $ 658 |
Portfolio turnover rate G | 162% |
A Annualized B Total returns for periods of less than one year are not annualized. C Total returns would have been lower had certain expenses not been reduced during the periods shown. D Total returns do not include the effect of the sales charges. E Calculated based on average shares outstanding during the period. F Fees and expenses of the underlying Fidelity Central Funds are not included in the Fund's expense ratio. The Fund indirectly bears its proportionate share of the expenses of any underlying Fidelity Central Funds. G Amount does not include the portfolio activity of any underlying Fidelity Central Funds. H For the period December 12, 2006 (commencement of sale of shares) to February 28, 2007. I Expense ratios reflect operating expenses of the class. Expenses before reductions do not reflect amounts reimbursed by the investment adviser or reductions from brokerage service arrangements or other expense offset arrangements and do not represent the amount paid by the class during periods when reimbursements or reductions occur. Expenses net of fee waivers reflect expenses after reimbursement by the investment adviser but prior to reductions from brokerage service arrangements or other expense offset arrangements. Expenses net of all reductions represent the net expenses paid by the class. J Amount represents less than $.01 per share. |
Financial Highlights - Class T
Years ended February 28, | 2007 H |
Selected Per-Share Data | |
Net asset value, beginning of period | $ 47.74 |
Income from Investment Operations | |
Net investment income (loss) E | (.02) |
Net realized and unrealized gain (loss) | 3.14 |
Total from investment operations | 3.12 |
Redemption fees added to paid in capital E | - J |
Net asset value, end of period | $ 50.86 |
Total Return B, C, D | 6.54% |
Ratios to Average Net Assets F, I | |
Expenses before reductions | 1.54% A |
Expenses net of fee waivers, if any | 1.54% A |
Expenses net of all reductions | 1.53% A |
Net investment income (loss) | (.24)% A |
Supplemental Data | |
Net assets, end of period (000 omitted) | $ 560 |
Portfolio turnover rate G | 162% |
A Annualized B Total returns for periods of less than one year are not annualized. C Total returns would have been lower had certain expenses not been reduced during the periods shown. D Total returns do not include the effect of the sales charges. E Calculated based on average shares outstanding during the period. F Fees and expenses of the underlying Fidelity Central Funds are not included in the Fund's expense ratio. The Fund indirectly bears its proportionate share of the expenses of any underlying Fidelity Central Funds. G Amount does not include the portfolio activity of any underlying Fidelity Central Funds. H For the period December 12, 2006 (commencement of sale of shares) to February 28, 2007. I Expense ratios reflect operating expenses of the class. Expenses before reductions do not reflect amounts reimbursed by the investment adviser or reductions from brokerage service arrangements or other expense offset arrangements and do not represent the amount paid by the class during periods when reimbursements or reductions occur. Expenses net of fee waivers reflect expenses after reimbursement by the investment adviser but prior to reductions from brokerage service arrangements or other expense offset arrangements. Expenses net of all reductions represent the net expenses paid by the class. J Amount represents less than $.01 per share. |
See accompanying notes which are an integral part of the financial statements.
Annual Report
Financial Highlights - Class B
Years ended February 28, | 2007 H |
Selected Per-Share Data | |
Net asset value, beginning of period | $ 47.74 |
Income from Investment Operations | |
Net investment income (loss) E | (.05) |
Net realized and unrealized gain (loss) | 3.11 |
Total from investment operations | 3.06 |
Redemption fees added to paid in capital E | - J |
Net asset value, end of period | $ 50.80 |
Total Return B, C, D | 6.41% |
Ratios to Average Net Assets F, I | |
Expenses before reductions | 2.05% A |
Expenses net of fee waivers, if any | 2.05% A |
Expenses net of all reductions | 2.05% A |
Net investment income (loss) | (.49)% A |
Supplemental Data | |
Net assets, end of period (000 omitted) | $ 291 |
Portfolio turnover rate G | 162% |
A Annualized B Total returns for periods of less than one year are not annualized. C Total returns would have been lower had certain expenses not been reduced during the periods shown. D Total returns do not include the effect of the contingent deferred sales charge. E Calculated based on average shares outstanding during the period. F Fees and expenses of the underlying Fidelity Central Funds are not included in the Fund's expense ratio. The Fund indirectly bears its proportionate share of the expenses of any underlying Fidelity Central Funds. G Amount does not include the portfolio activity of any underlying Fidelity Central Funds. H For the period December 12, 2006 (commencement of sale of shares) to February 28, 2007. I Expense ratios reflect operating expenses of the class. Expenses before reductions do not reflect amounts reimbursed by the investment adviser or reductions from brokerage service arrangements or other expense offset arrangements and do not represent the amount paid by the class during periods when reimbursements or reductions occur. Expenses net of fee waivers reflect expenses after reimbursement by the investment adviser but prior to reductions from brokerage service arrangements or other expense offset arrangements. Expenses net of all reductions represent the net expenses paid by the class. J Amount represents less than $.01 per share. |
Financial Highlights - Class C
Years ended February 28, | 2007 H |
Selected Per-Share Data | |
Net asset value, beginning of period | $ 47.74 |
Income from Investment Operations | |
Net investment income (loss) E | (.07) |
Net realized and unrealized gain (loss) | 3.14 |
Total from investment operations | 3.07 |
Redemption fees added to paid in capital E | - J |
Net asset value, end of period | $ 50.81 |
Total Return B, C, D | 6.43% |
Ratios to Average Net Assets F, I | |
Expenses before reductions | 2.07% A |
Expenses net of fee waivers, if any | 2.07% A |
Expenses net of all reductions | 2.06% A |
Net investment income (loss) | (.65)% A |
Supplemental Data | |
Net assets, end of period (000 omitted) | $ 332 |
Portfolio turnover rate G | 162% |
A Annualized B Total returns for periods of less than one year are not annualized. C Total returns would have been lower had certain expenses not been reduced during the periods shown. D Total returns do not include the effect of the contingent deferred sales charge. E Calculated based on average shares outstanding during the period. F Fees and expenses of the underlying Fidelity Central Funds are not included in the Fund's expense ratio. The Fund indirectly bears its proportionate share of the expenses of any underlying Fidelity Central Funds. G Amount does not include the portfolio activity of any underlying Fidelity Central Funds. H For the period December 12, 2006 (commencement of sale of shares) to February 28, 2007. I Expense ratios reflect operating expenses of the class. Expenses before reductions do not reflect amounts reimbursed by the investment adviser or reductions from brokerage service arrangements or other expense offset arrangements and do not represent the amount paid by the class during periods when reimbursements or reductions occur. Expenses net of fee waivers reflect expenses after reimbursement by the investment adviser but prior to reductions from brokerage service arrangements or other expense offset arrangements. Expenses net of all reductions represent the net expenses paid by the class. J Amount represents less than $.01 per share. |
See accompanying notes which are an integral part of the financial statements.
Annual Report
Financial Highlights - Telecommunications
Years ended February 28, | 2007 | 2006 | 2005 | 2004 I | 2003 |
Selected Per-Share Data | |||||
Net asset value, beginning of period | $ 41.97 | $ 34.83 | $ 35.79 | $ 23.62 | $ 30.55 |
Income from Investment Operations | |||||
Net investment income (loss) C | .61 F | .36 | .49 G | .08 | .03 |
Net realized and unrealized gain (loss) | 8.85 | 7.11 | (.96) | 12.13 | (6.95) |
Total from investment operations | 9.46 | 7.47 | (.47) | 12.21 | (6.92) |
Distributions from net investment income | (.53) | (.33) | (.49) | (.05) | (.03) |
Redemption fees added to paid in capital C | .01 | - J | - J | .01 | .02 |
Net asset value, end of period | $ 50.91 | $ 41.97 | $ 34.83 | $ 35.79 | $ 23.62 |
Total Return A, B | 22.69% | 21.54% | (1.40)% | 51.78% | (22.60)% |
Ratios to Average Net Assets D, H | |||||
Expenses before reductions | .99% | 1.05% | 1.09% | 1.40% | 1.56% |
Expenses net of fee waivers, if any | .97% | 1.05% | 1.09% | 1.40% | 1.56% |
Expenses net of all reductions | .97% | .96% | 1.02% | 1.34% | 1.34% |
Net investment income (loss) | 1.34% F | .96% | 1.44% G | .27% | .13% |
Supplemental Data | |||||
Net assets, end of period (000 omitted) | $ 624,427 | $ 402,334 | $ 333,642 | $ 439,350 | $ 312,839 |
Portfolio turnover rate E | 162% | 148% | 56% | 98% | 163% |
A Total returns would have been lower had certain expenses not been reduced during the periods shown. B Total returns do not include the effect of the former sales charges. C Calculated based on average shares outstanding during the period. D Fees and expenses of the underlying Fidelity Central Funds are not included in the Fund's expense ratio. The Fund indirectly bears its proportionate share of the expenses of any underlying Fidelity Central Funds. E Amount does not include the portfolio activity of any underlying Fidelity Central Funds. F Investment income per share reflects a special dividend which amounted to $.11 per share. Excluding the special dividend, the ratio of net investment income (loss) to average net assets would have been 1.09%. G Investment income per share reflects a special dividend which amounted to $.26 per share. Excluding the special dividend, the ratio of net investment income (loss) to average net assets would have been ..68%. H Expense ratios reflect operating expenses of the class. Expenses before reductions do not reflect amounts reimbursed by the investment adviser or reductions from brokerage service arrangements or other expense offset arrangements and do not represent the amount paid by the class during periods when reimbursements or reductions occur. Expenses net of fee waivers reflect expenses after reimbursement by the investment adviser but prior to reductions from brokerage service arrangements or other expense offset arrangements. Expenses net of all reductions represent the net expenses paid by the class. I For the year ended February 29. J Amount represents less than $.01 per share. |
Financial Highlights - Institutional Class
Years ended February 28, | 2007 G |
Selected Per-Share Data | |
Net asset value, beginning of period | $ 47.74 |
Income from Investment Operations | |
Net investment income (loss) D | .16 |
Net realized and unrealized gain (loss) | 3.01 |
Total from investment operations | 3.17 |
Redemption fees added to paid in capital D | - I |
Net asset value, end of period | $ 50.91 |
Total Return B, C | 6.64% |
Ratios to Average Net Assets E, H | |
Expenses before reductions | .98% A |
Expenses net of fee waivers, if any | .98% A |
Expenses net of all reductions | .97% A |
Net investment income (loss) | 1.52% A |
Supplemental Data | |
Net assets, end of period (000 omitted) | $ 114 |
Portfolio turnover rate F | 162% |
A Annualized B Total returns for periods of less than one year are not annualized. C Total returns would have been lower had certain expenses not been reduced during the periods shown. D Calculated based on average shares outstanding during the period. E Fees and expenses of the underlying Fidelity Central Funds are not included in the Fund's expense ratio. The Fund indirectly bears its proportionate share of the expenses of any underlying Fidelity Central Funds. F Amount does not include the portfolio activity of any underlying Fidelity Central Funds. G For the period December 12, 2006 (commencement of sale of shares) to February 28, 2007. H Expense ratios reflect operating expenses of the class. Expenses before reductions do not reflect amounts reimbursed by the investment adviser or reductions from brokerage service arrangements or other expense offset arrangements and do not represent the amount paid by the class during periods when reimbursements or reductions occur. Expenses net of fee waivers reflect expenses after reimbursement by the investment adviser but prior to reductions from brokerage service arrangements or other expense offset arrangements. Expenses net of all reductions represent the net expenses paid by the class. I Amount represents less than $.01 per share. |
See accompanying notes which are an integral part of the financial statements.
Annual Report
Notes to Financial Statements
For the period ended February 28, 2007
1. Organization.
Telecommunications Portfolio (the Fund) is a non-diversified fund of Fidelity Select Portfolios (the trust) and is authorized to issue an unlimited number of shares. The trust is registered under the Investment Company Act of 1940, as amended (the 1940 Act), as an open-end management investment company organized as a Massachusetts business trust. The Fund invests primarily in securities of companies whose principal business activities fall within specific industries. The Fund offers Class A, Class T, Class B, Class C, Telecommunications, and Institutional Class shares, each of which has equal rights as to assets and voting privileges. Each class has exclusive voting rights with respect to matters that affect that class. The Fund commenced sale of Class A, Class T, Class B, Class C and Institutional Class shares and the existing class was designated Telecommunications on December 12, 2006. Class B shares will automatically convert to Class A shares after a holding period of seven years from the initial date of purchase. Investment income, realized and unrealized capital gains and losses, the common expenses of the Fund, and certain fund-level expense reductions, if any, are allocated on a pro rata basis to each class based on the relative net assets of each class to the total net assets of the Fund. Each class differs with respect to transfer agent and distribution and service plan fees incurred. Certain expense reductions also differ by class. The financial statements have been prepared in conformity with accounting principles generally accepted in the United States of America, which require management to make certain estimates and assumptions at the date of the financial statements.
2. Investments in Fidelity Central Funds.
The Fund may invest in Fidelity Central Funds which are open-end investment companies available only to other investment companies and accounts managed by FMR and its affiliates. The Fund's Schedule of Investments lists each of the Fidelity Central Funds as an investment of the Fund but does not include the underlying holdings of each Fidelity Central Fund. As an Investing Fund, the Fund indirectly bears its proportionate share of the expenses of the underlying Fidelity Central Funds. A complete unaudited list of holdings for each Fidelity Central Fund is available upon request. In addition, the financial statements of the Fidelity Central Funds, which are not covered by the Fund's Report of Independent Registered Public Accounting Firm, are available on the EDGAR Database on the SEC's web site, www.sec.gov, or upon request.
The Money Market Central Funds seek preservation of capital and current income and are managed by Fidelity Investments Money Management, Inc. (FIMM) an affiliate of Fidelity Management & Research Company (FMR).
3. Significant Accounting Policies.
The following summarizes the significant accounting policies of the Fund:
Security Valuation. Investments are valued and net asset value (NAV) per share is calculated (NAV calculation) as of the close of business of the New York Stock Exchange (NYSE), normally 4:00 p.m. Eastern time. During the period the Fund also calculated a NAV each hour on the hour (commencing at 10:00 a.m. Eastern time until one hour prior to the close of business on the NYSE). Effective October 1, 2006 the Fund eliminated hourly NAV calculation.
Wherever possible, the Fund uses independent pricing services approved by the Board of Trustees to value its investments. Equity securities, including restricted securities, for which market quotations are readily available, are valued at the last reported sale price or official closing price as reported by an independent pricing service on the primary market or exchange on which they are traded. In the event there were no sales during the day or closing prices are not available, securities are valued at the last quoted bid price. Investments in open-end mutual funds, including the Fidelity Central Funds, are valued at their closing net asset value each business day. Short-term securities with remaining maturities of sixty days or less for which quotations are not readily available are valued at amortized cost, which approximates value.
When current market prices or quotations are not readily available or do not accurately reflect fair value, valuations may be determined in accordance with procedures adopted by the Board of Trustees. For example, when developments occur between the close of a market and the close of the NYSE that may materially affect the value of some or all of the securities, or when trading in a security is halted, those securities may be fair valued. Factors used in the determination of fair value may include monitoring news to identify significant market or security specific events such as changes in the value of U.S. securities markets, reviewing developments in foreign markets and evaluating the performance of ADRs, futures contracts and exchange-traded funds. Because the Fund's utilization of fair value pricing depends on market activity, the frequency with which fair value pricing is used cannot be predicted and may be utilized to a significant extent. The value of securities used for NAV calculation under fair value pricing may differ from published prices for the same securities.
Foreign Currency. The Fund uses foreign currency contracts to facilitate transactions in foreign-denominated securities. Losses from these transactions may arise from changes in the value of the foreign currency or if the counterparties do not perform under the contracts' terms.
Foreign-denominated assets, including investment securities, and liabilities are translated into U.S. dollars at the exchange rate at period end. Purchases and sales of investment securities, income and dividends received and expenses denominated in foreign currencies are translated into U.S. dollars at the exchange rate in effect on the transaction date.
Annual Report
Notes to Financial Statements - continued
3. Significant Accounting Policies - continued
Foreign Currency - continued
The effects of exchange rate fluctuations on investments are included with the net realized and unrealized gain (loss) on investment securities. Other foreign currency transactions resulting in realized and unrealized gain (loss) are disclosed separately.
Investment Transactions and Income. For financial reporting purposes, the Fund's investment holdings and NAV include trades executed through the end of the last business day of the period. The NAV for processing shareholder transactions includes trades executed through the end of the prior business day. Gains and losses on securities sold are determined on the basis of identified cost and may include proceeds received from litigation. Dividend income is recorded on the ex-dividend date, except for certain dividends from foreign securities where the ex-dividend date may have passed, which are recorded as soon as the Fund is informed of the ex-dividend date. Non-cash dividends included in dividend income, if any, are recorded at the fair market value of the securities received. Distributions received on securities that represent a return of capital or capital gain are recorded as a reduction of cost of investments and/or as a realized gain. The Fund estimates the components of distributions received that may be considered return of capital distributions or capital gain distributions. Large, non-recurring dividends recognized by the Fund are presented separately on the Statement of Operations as "Special Dividends" and the impact of these dividends is presented in the Financial Highlights. Interest income and distributions from the Fidelity Central Funds are accrued as earned, with any distributions receivable as of period end included in Distributions receivable from Fidelity Central Funds on the Statement of Assets and Liabilities. Interest income includes coupon interest and amortization of premium and accretion of discount on debt securities. Investment income is recorded net of foreign taxes withheld where recovery of such taxes is uncertain.
Expenses. Most expenses of the trust can be directly attributed to a fund. Expenses which cannot be directly attributed are apportioned among each Fund in the trust. Expense estimates are accrued in the period to which they relate and adjustments are made when actual amounts are known.
Income Tax Information and Distributions to Shareholders. Each year, the Fund intends to qualify as a regulated investment company by distributing all of its taxable income and realized gains under Subchapter M of the Internal Revenue Code. As a result, no provision for income taxes is required in the accompanying financial statements. Foreign taxes are provided for based on the Fund's understanding of the tax rules and rates that exist in the foreign markets in which it invests.
Distributions are recorded on the ex-dividend date. Income dividends and capital gain distributions are declared separately for each class. Income and capital gain distributions are determined in accordance with income tax regulations, which may differ from generally accepted accounting principles.
Capital accounts within the financial statements are adjusted for permanent book-tax differences. These adjustments have no impact on net assets or the results of operations. Temporary book-tax differences will reverse in a subsequent period.
Book-tax differences are primarily due to foreign currency transactions, certain foreign taxes, capital loss carryforwards and losses deferred due to wash sales.
The tax-basis components of distributable earnings and the federal tax cost as of period end were as follows:
Unrealized appreciation | $ 102,069,768 |
Unrealized depreciation | (12,878,269) |
Net unrealized appreciation (depreciation) | 89,191,499 |
Undistributed ordinary income | 1,386,172 |
Capital loss carryforward | (495,069,450) |
Cost for federal income tax purposes | $ 577,660,819 |
The tax character of distributions paid was as follows:
February 28, 2007 | February 28, 2006 | |
Ordinary Income | $ 5,987,382 | $ 3,005,035 |
Trading (Redemption) Fees. Shares in the Fund held less than 30 days are subject to a redemption fee equal to .75% of the net asset value of shares redeemed. All redemption fees, including any estimated redemption fees paid by FMR, are retained by the Fund and accounted for as an addition to paid in capital. Shareholders were also subject to an additional $7.50 fee for shares exchanged into another Fidelity fund (see Note 6).
Annual Report
3. Significant Accounting Policies - continued
New Accounting Pronouncements. In July 2006, Financial Accounting Standards Board Interpretation No. 48, Accounting for Uncertainty in Income Taxes - an interpretation of FASB Statement 109 (FIN 48), was issued and is effective on the last business day of the semiannual reporting period for fiscal years beginning after December 15, 2006. FIN 48 sets forth a threshold for financial statement recognition, measurement and disclosure of a tax position taken or expected to be taken on a tax return. Management is currently evaluating the impact, if any, the adoption of FIN 48 will have on the Fund's net assets, results of operations and financial statement disclosures.
In addition, in September 2006, Statement of Financial Accounting Standards No. 157, Fair Value Measurements (SFAS 157), was issued and is effective for fiscal years beginning after November 15, 2007. SFAS 157 defines fair value, establishes a framework for measuring fair value and expands disclosures about fair value measurements. Management is currently evaluating the impact the adoption of SFAS 157 will have on the Fund's financial statement disclosures.
4. Operating Policies.
Repurchase Agreements. FMR has received an Exemptive Order from the Securities and Exchange Commission (the SEC) which permits the Fund and other affiliated entities of FMR to transfer uninvested cash balances into joint trading accounts which are then invested in repurchase agreements. The Fund may also invest directly with institutions in repurchase agreements. Repurchase agreements are collateralized by government or non-government securities. Upon settlement date, collateral is held in segregated accounts with custodian banks and may be obtained in the event of a default of the counterparty. The Fund monitors, on a daily basis, the value of the collateral to ensure it is at least equal to the principal amount of the repurchase agreement (including accrued interest). In the event of a default by the counterparty, realization of the collateral proceeds could be delayed, during which time the value of the collateral may decline.
5. Purchases and Sales of Investments.
Purchases and sales of securities, other than short-term securities, aggregated $915,897,899 and $790,008,297, respectively.
6. Fees and Other Transactions with Affiliates.
Management Fee. FMR and its affiliates provide the Fund with investment management related services for which the Fund pays a monthly management fee. The management fee is the sum of an individual fund fee rate that is based on an annual rate of .30% of the Fund's average net assets and a group fee rate that averaged .26% during the period. The group fee rate is based upon the average net assets of all the mutual funds advised by FMR. The group fee rate decreases as assets under management increase and increases as assets under management decrease. For the period, the total annual management fee rate was .57% of the Fund's average net assets.
Distribution and Service Plan. In accordance with Rule 12b-1 of the 1940 Act, the Fund has adopted separate Distribution and Service Plans for each class of shares. Certain classes pay Fidelity Distributors Corporation (FDC), an affiliate of FMR, separate Distribution and Service Fees, each of which is based on an annual percentage of each class' average net assets. In addition, FDC may pay financial intermediaries for selling shares of the Fund and providing shareholder support services. For the period, the Distribution and Service Fee rates and the total amounts paid to and retained by FDC were as follows:
Distribution | Service | Paid to | Retained | |
Class A | -% | .25% | $ 139 | $ 84 |
Class T | .25% | .25% | 274 | 123 |
Class B | .75% | .25% | 359 | 332 |
Class C | .75% | .25% | 396 | 323 |
$ 1,168 | $ 862 |
Sales Load. FDC receives a front-end sales charge of up to 5.75% for selling Class A shares, and 3.50% for selling Class T shares, some of which is paid to financial intermediaries for selling shares of the Fund. FDC receives the proceeds of contingent deferred sales charges levied on Class A, Class T, Class B, and Class C redemptions. These charges depend on the holding period. The deferred sales charges range from 5% to 1% for Class B, 1% for Class C, 1.00% to .50% for certain purchases of Class A shares and .25% for certain purchases of Class T shares.
For the period, sales charge amounts retained by FDC were as follows:
Retained | |
Class A | $ 564 |
Class T | 104 |
$ 668 |
Annual Report
Notes to Financial Statements - continued
6. Fees and Other Transactions with Affiliates - continued
Transfer Agent Fees. Fidelity Investments Institutional Operations Company, Inc. (FIIOC), an affiliate of FMR, is the transfer, dividend disbursing and shareholder servicing agent for each class of the Fund, except for Telecommunications. Fidelity Service Company, Inc. (FSC), an affiliate of FMR, is the transfer agent for Telecommunications shares. FIIOC and FSC receive account fees and asset-based fees that vary according to the account size and type of account of the shareholders of the respective classes of the Fund. FIIOC and FSC pay for typesetting, printing and mailing of shareholder reports, except proxy statements. For the period, the total transfer agent fees paid by each class to FIIOC or FSC, were as follows:
Amount | % of | |
Class A | $ 87 | .17 |
Class T | 119 | .23 |
Class B | 73 | .22 |
Class C | 87 | .24 |
Telecommunications | 1,520,066 | .31 |
Institutional Class | 87 | .27 |
$ 1,520,519 |
Accounting and Security Lending Fees. FSC maintains the Fund's accounting records. The accounting fee is based on the level of average net assets for the month. Under a separate contract, FSC administers the security lending program. The security lending fee is based on the number and duration of lending transactions.
Exchange Fees. During the period, FSC received the proceeds of a $7.50 fee to cover administrative costs associated with exchanges out of the Fund to any other Fidelity Select fund or to any other Fidelity fund made through non-automated channels. Effective October 1, 2006, the exchange fees were eliminated. For the period, exchange fees retained by FSC were as follows:
Retained | |
Telecommunications Portfolio | $ 4,433 |
Brokerage Commissions. The Fund placed a portion of its portfolio transactions with brokerage firms which are affiliates of the investment adviser. The commissions paid to these affiliated firms were $40,816 for the period.
Interfund Lending Program. Pursuant to an Exemptive Order issued by the SEC, the Fund, along with other registered investment companies having management contracts with FMR, may participate in an interfund lending program. This program provides an alternative credit facility allowing the funds to borrow from, or lend money to, other participating affiliated funds. At period end, there were no interfund loans outstanding. The Fund's activity in this program during the period for which loans were outstanding was as follows:
Borrower or Lender | Average Daily | Weighted Average | Interest |
Borrower | $ 9,539,417 | 4.98% | $ 15,851 |
7. Committed Line of Credit.
The Fund participates with other funds managed by FMR in a $4.2 billion credit facility (the "line of credit") to be utilized for temporary or emergency purposes to fund shareholder redemptions or for other short-term liquidity purposes. The Fund has agreed to pay commitment fees on its pro rata portion of the line of credit, which amounted to $1,183 and is reflected in Miscellaneous Expense on the Statement of Operations. During the period, there were no borrowings on this line of credit.
Annual Report
8. Security Lending.
The Fund lends portfolio securities from time to time in order to earn additional income. On the settlement date of the loan, the Fund receives collateral (in the form of U.S. Treasury obligations, letters of credit and/or cash) against the loaned securities and maintains collateral in an amount not less than 100% of the market value of the loaned securities during the period of the loan. The market value of the loaned securities is determined at the close of business of the Fund and any additional required collateral is delivered to the Fund on the next business day. If the borrower defaults on its obligation to return the securities loaned because of insolvency or other reasons, a fund could experience delays and costs in recovering the securities loaned or in gaining access to the collateral. Any cash collateral received is invested in the Fidelity Securities Lending Cash Central Fund. The value of loaned securities and cash collateral at period end are disclosed on the Fund's Statement of Assets and Liabilities. Security lending income represents the income earned on investing cash collateral, less fees and expenses associated with the loan, plus any premium payments that may be received on the loan of certain types of securities. Security lending income is presented in the Statement of Operations as a component of income from Fidelity Central Funds. Net income from lending portfolio securities during the period amounted to $208,152.
9. Expense Reductions.
FMR voluntarily agreed to reimburse a portion of Telecommunications' operating expenses. During the period, this reimbursement reduced the class' expenses by $56,875.
Many of the brokers with whom FMR places trades on behalf of the Fund provided services to the Fund in addition to trade execution. These services included payments of certain expenses on behalf of the Fund totaling $32,107 for the period. In addition, through arrangements with the each class' transfer agent, credits realized as a result of uninvested cash balances were used to reduce the Fund's expenses. During the period, credits reduced each class' transfer agent expense as noted in the table below.
Transfer Agent | |
Telecommunications | $ 5,774 |
10. Other.
The Fund's organizational documents provide former and current trustees and officers with a limited indemnification against liabilities arising in connection with the performance of their duties to the Fund. In the normal course of business, the Fund may also enter into contracts that provide general indemnifications. The Fund's maximum exposure under these arrangements is unknown as this would be dependent on future claims that may be made against the Fund. The risk of material loss from such claims is considered remote.
The United States Securities and Exchange Commission ("SEC") is conducting an investigation of FMR (covering the years 2002 to 2004) arising from gifts, gratuities and business entertainment provided by certain brokers to certain individuals who were employed on FMR's domestic equity trading desk during that period. FMR is in discussions with the SEC staff regarding the possible resolution of the matter, but as of period-end no final resolution has been reached.
In December 2006, the Independent Trustees completed their own investigation of the matter with the assistance of independent counsel. The Independent Trustees and FMR agree that, despite the absence of proof that the Fidelity mutual funds experienced diminished execution quality as a result of the improper receipt of gifts and business entertainment, the conduct at issue was serious and is worthy of redress. Accordingly, the Independent Trustees have requested and FMR has agreed to pay $42 million to Fidelity mutual funds, plus interest to be determined at the time that payment is made. A method of allocating this payment among the funds has not yet been determined. The total payment to the Fund is not anticipated to have a material impact on the Fund's net assets. In addition, FMR reimbursed related legal expenses which are recorded in the accompanying Statement of Operations as an expense reduction.
11. Distributions to Shareholders.
Distributions to shareholders of each class were as follows:
Years ended February 28, | 2007 | 2006 |
From net investment income | ||
Telecommunications | $ 5,987,382 | $ 3,005,035 |
Annual Report
Notes to Financial Statements - continued
12. Share Transactions.
Transactions for each class of shares were as follows:
Shares | Dollars | |||
Years ended February 28, | 2007A | 2006 | 2007A | 2006 |
Class A | ||||
Shares sold | 12,932 | - | $ 655,617 | $ - |
Shares redeemed | - | - | - | - |
Net increase (decrease) | 12,932 | - | $ 655,617 | $ - |
Class T | ||||
Shares sold | 11,066 | - | $ 555,092 | $ - |
Shares redeemed | (60) | - | (3,110) | - |
Net increase (decrease) | 11,006 | - | $ 551,982 | $ - |
Class B | ||||
Shares sold | 5,729 | - | $ 285,388 | $ - |
Shares redeemed | - | - | - | - |
Net increase (decrease) | 5,729 | - | $ 285,388 | $ - |
Class C | ||||
Shares sold | 6,538 | - | $ 326,374 | $ - |
Shares redeemed | - | - | - | - |
Net increase (decrease) | 6,538 | - | $ 326,374 | $ - |
Telecommunications | ||||
Shares sold | 12,699,449 | 3,070,553 | $ 581,140,315 | $ 116,810,248 |
Reinvestment of distributions | 124,102 | 74,920 | 5,727,266 | 2,869,866 |
Shares redeemed | (10,144,422) | (3,137,526) | (451,923,224) | (116,998,712) |
Net increase (decrease) | 2,679,129 | 7,947 | $ 134,944,357 | $ 2,681,402 |
Institutional Class | ||||
Shares sold | 3,391 | - | $ 162,500 | $ - |
Shares redeemed | (1,150) | - | (59,275) | - |
Net increase (decrease) | 2,241 | - | $ 103,225 | $ - |
A Share transactions for Class A, Class T, Class B, Class C and Institutional Class are for the period December 12, 2006 (commencement of sale of shares) to February 28, 2007.
Annual Report
Report of Independent Registered Public Accounting Firm
To the Trustees of Fidelity Select Portfolios and the Shareholders of Consumer Staples Portfolio, Gold Portfolio, Materials Portfolio and Telecommunications Portfolio:
In our opinion, the accompanying statements of assets and liabilities, including the schedules of investments, and the related statements of operations and of changes in net assets and the financial highlights present fairly, in all material respects, the financial position of Consumer Staples Portfolio, Gold Portfolio, Materials Portfolio and Telecommunications Portfolio (funds of Fidelity Select Portfolios) at February 28, 2007, the results of each of their operations for the year then ended, the changes in each of their net assets for each of the two years in the period then ended and the financial highlights for each of the periods indicated, in conformity with accounting principles generally accepted in the United States of America. These financial statements and financial highlights (hereafter referred to as "financial statements") are the responsibility of the Fidelity Select portfolios management. Our responsibility is to express an opinion on these financial statements based on our audits. We conducted our audits of these financial statements in accordance with the standards of the Public Company Accounting Oversight Board (United States). Those standards require that we plan and perform the audit to obtain reasonable assurance about whether the financial statements are free of material misstatement. An audit includes examining, on a test basis, evidence supporting the amounts and disclosures in the financial statements, assessing the accounting principles used and significant estimates made by management, and evaluating the overall financial statement presentation. We believe that our audits, which included confirmation of securities at February 28, 2007 by correspondence with the custodian and brokers, provide a reasonable basis for our opinion.
/s/ PricewaterhouseCoopers LLP
PricewaterhouseCoopers LLP
Boston, Massachusetts
April 23, 2007
Annual Report
Trustees and Officers
The Trustees, Member of the Advisory Board, and executive officers of the trust and funds, as applicable, are listed below. The Board of Trustees governs each fund and is responsible for protecting the interests of shareholders. The Trustees are experienced executives who meet periodically throughout the year to oversee each fund's activities, review contractual arrangements with companies that provide services to each fund, and review each fund's performance. Each of the Trustees oversees 349 funds advised by FMR or an affiliate.
The Trustees hold office without limit in time except that (a) any Trustee may resign; (b) any Trustee may be removed by written instrument, signed by at least two-thirds of the number of Trustees prior to such removal; (c) any Trustee who requests to be retired or who has become incapacitated by illness or injury may be retired by written instrument signed by a majority of the other Trustees; and (d) any Trustee may be removed at any special meeting of shareholders by a two-thirds vote of the outstanding voting securities of the trust. Each Trustee who is not an interested person (as defined in the 1940 Act) (Independent Trustee), shall retire not later than the last day of the calendar year in which his or her 72nd birthday occurs. The Independent Trustees may waive this mandatory retirement age policy with respect to individual Trustees. The executive officers and Advisory Board Member hold office without limit in time, except that any officer and Advisory Board Member may resign or may be removed by a vote of a majority of the Trustees at any regular meeting or any special meeting of the Trustees. Except as indicated, each individual has held the office shown or other offices in the same company for the past five years.
The funds' Statements of Additional Information (SAIs) include more information about the Trustees. To request a free copy, call Fidelity at 1-877-208-0098.
Interested Trustees*:
Correspondence intended for each Trustee who is an interested person may be sent to Fidelity Investments, 82 Devonshire Street, Boston, Massachusetts 02109.
Name, Age; Principal Occupation | |
Edward C. Johnson 3d (76) | |
Year of Election or Appointment: 1980 Mr. Johnson is Chairman of the Board of Trustees. Mr. Johnson serves as President (2006-present), Chief Executive Officer, Chairman, and a Director of FMR Corp.; Chairman and a Director of FMR; Chairman and a Director of Fidelity Research & Analysis Company (FRAC); Chairman and a Director of Fidelity Investments Money Management, Inc.; and Chairman (2001-present) and a Director of FMR Co., Inc. In addition, Mr. Johnson serves as Chairman and Director of Fidelity International Limited (FIL). | |
Robert L. Reynolds (54) | |
Year of Election or Appointment: 2003 Mr. Reynolds is President and a Director of FMR (2005-present), Fidelity Investments Money Management, Inc. (2005-present), and FMR Co., Inc. (2005-present). Mr. Reynolds also serves as Vice Chairman (2006-present), a Director (2003-present), and Chief Operating Officer of FMR Corp. and a Director of Strategic Advisers, Inc. (2005-present). He also serves on the Board at Fidelity Investments Canada, Ltd. | |
* Trustees have been determined to be "Interested Trustees" by virtue of, among other things, their affiliation with the trust or various entities under common control with FMR.
Independent Trustees:
Correspondence intended for each Independent Trustee (that is, the Trustees other than the Interested Trustees) may be sent to Fidelity Investments, P.O. Box 55235, Boston, Massachusetts 02205-5235.
Name, Age; Principal Occupation | |
Dennis J. Dirks (58) | |
Year of Election or Appointment: 2005 Prior to his retirement in May 2003, Mr. Dirks was Chief Operating Officer and a member of the Board of The Depository Trust & Clearing Corporation (DTCC) (1999-2003). He also served as President, Chief Operating Officer, and Board member of The Depository Trust Company (DTC) (1999-2003) and President and Board member of the National Securities Clearing Corporation (NSCC) (1999-2003). In addition, Mr. Dirks served as Chief Executive Officer and Board member of the Government Securities Clearing Corporation (2001-2003) and Chief Executive Officer and Board member of the Mortgage-Backed Securities Clearing Corporation (2001-2003). Mr. Dirks also serves as a Trustee and a member of the Finance Committee of Manhattan College (2005-present) and a Trustee and a member of the Finance Committee of AHRC of Nassau County (2006-present). | |
Albert R. Gamper, Jr. (64) | |
Year of Election or Appointment: 2006 Prior to his retirement in December 2004, Mr. Gamper served as Chairman of the Board of CIT Group Inc. (commercial finance). During his tenure with CIT Group Inc. Mr. Gamper served in numerous senior management positions, including Chairman (1987-1989; 1999-2001; 2002-2004), Chief Executive Officer (1987-2004), and President (1989-2002). He currently serves as a member of the Board of Directors of Public Service Enterprise Group (utilities, 2001-present), Chairman of the Board of Governors, Rutgers University (2004-present), and Chairman of the Board of Saint Barnabas Health Care System. | |
George H. Heilmeier (70) | |
Year of Election or Appointment: 2004 Dr. Heilmeier is Chairman Emeritus of Telcordia Technologies (communication software and systems), where prior to his retirement, he served as company Chairman and Chief Executive Officer. He currently serves on the Boards of Directors of The Mitre Corporation (systems engineering and information technology support for the government), and HRL Laboratories (private research and development, 2004-present). He is Chairman of the General Motors Science & Technology Advisory Board and a Life Fellow of the Institute of Electrical and Electronics Engineers (IEEE). Dr. Heilmeier is a member of the Defense Science Board and the National Security Agency Advisory Board. He is also a member of the National Academy of Engineering, the American Academy of Arts and Sciences, and the Board of Overseers of the School of Engineering and Applied Science of the University of Pennsylvania. Previously, Dr. Heilmeier served as a Director of TRW Inc. (automotive, space, defense, and information technology, 1992-2002), Compaq (1994-2002), Automatic Data Processing, Inc. (ADP) (technology-based business outsourcing, 1995-2002), INET Technologies Inc. (telecommunications network surveillance, 2001-2004), and Teletech Holdings (customer management services). He is the recipient of the 2005 Kyoto Prize in Advanced Technology for his invention of the liquid crystal display, and a member of the Consumer Electronics Hall of Fame. | |
James H. Keyes (66) | |
Year of Election or Appointment: 2007 Prior to his retirement in 2003, Mr. Keyes was Chairman, President, and Chief Executive Officer of Johnson Controls, Inc. (automotive supplier, 1993-2003). He currently serves as a member of the boards of LSI Logic Corporation (semiconductor technologies), Navistar International Corporation (manufacture and sale of trucks, buses, and diesel engines, 2002-present), and Pitney Bowes, Inc. (integrated mail, messaging, and document management solutions). | |
Marie L. Knowles (60) | |
Year of Election or Appointment: 2001 Prior to Ms. Knowles' retirement in June 2000, she served as Executive Vice President and Chief Financial Officer of Atlantic Richfield Company (ARCO) (diversified energy, 1996-2000). From 1993 to 1996, she was a Senior Vice President of ARCO and President of ARCO Transportation Company. She served as a Director of ARCO from 1996 to 1998. She currently serves as a Director of Phelps Dodge Corporation (copper mining and manufacturing) and McKesson Corporation (healthcare service, 2002-present). Ms. Knowles is a Trustee of the Brookings Institution and the Catalina Island Conservancy and also serves as a member of the Advisory Board for the School of Engineering of the University of Southern California. | |
Ned C. Lautenbach (63) | |
Year of Election or Appointment: 2000 Mr. Lautenbach is Chairman of the Independent Trustees (2006-present). Mr. Lautenbach has been a partner of Clayton, Dubilier & Rice, Inc. (private equity investment firm) since September 1998. Previously, Mr. Lautenbach was with the International Business Machines Corporation (IBM) from 1968 until his retirement in 1998. Mr. Lautenbach serves as a Director of Sony Corporation (2006-present) and Eaton Corporation (diversified industrial) as well as the Philharmonic Center for the Arts in Naples, Florida. He also is a member of the Board of Trustees of Fairfield University (2005-present), as well as a member of the Council on Foreign Relations. | |
Cornelia M. Small (62) | |
Year of Election or Appointment: 2005 Ms. Small is a member (2000-present) and Chairperson (2002-present) of the Investment Committee, and a member (2002-present) of the Board of Trustees of Smith College. Previously, she served as Chief Investment Officer (1999-2000), Director of Global Equity Investments (1996-1999), and a member of the Board of Directors of Scudder, Stevens & Clark (1990-1997) and Scudder Kemper Investments (1997-1999). In addition, Ms. Small served as Co-Chair (2000-2003) of the Annual Fund for the Fletcher School of Law and Diplomacy. | |
William S. Stavropoulos (67) | |
Year of Election or Appointment: 2001 Mr. Stavropoulos is Chairman Emeritus of the Board of Directors of The Dow Chemical Company. Since joining The Dow Chemical Company in 1967, Mr. Stavropoulos served in numerous senior management positions, including President (1993-2000; 2002-2003), CEO (1995-2000; 2002-2004), and Chairman of the Executive Committee (2000-2004). Currently, he is a Director of NCR Corporation (data warehousing and technology solutions), Chemical Financial Corporation, Maersk Inc. (industrial conglomerate, 2002-present), Tyco International, Inc. (multinational manufacturing and services, 2007-present), and a member of the Advisory Board for Metalmark Capital (private equity investment firm, 2005-present). He is a special advisor to Clayton, Dubilier & Rice, Inc., a private equity investment firm. He also serves as a member of the Board of Trustees of the American Enterprise Institute for Public Policy Research. In addition, Mr. Stavropoulos is a member of The Business Council, J.P. Morgan International Council and the University of Notre Dame Advisory Council for the College of Science. | |
Kenneth L. Wolfe (68) | |
Year of Election or Appointment: 2005 Prior to his retirement in 2001, Mr. Wolfe was Chairman and Chief Executive Officer of Hershey Foods Corporation (1993-2001). He currently serves as a member of the boards of Adelphia Communications Corporation (2003-present), Bausch & Lomb, Inc., and Revlon Inc. (2004-present). | |
Advisory Board Member and Executive Officers:
Correspondence intended for each executive officer and Mr. Lynch may be sent to Fidelity Investments, 82 Devonshire Street, Boston, Massachusetts 02109.
Name, Age; Principal Occupation | |
Peter S. Lynch (63) | |
Year of Election or Appointment: 2003 Member of the Advisory Board of Fidelity Select Portfolios. Mr. Lynch is Vice Chairman and a Director of FMR, and Vice Chairman (2001-present) and a Director of FMR Co., Inc. Previously, Mr. Lynch served as a Trustee of the Fidelity funds (1990-2003). In addition, he serves as a Trustee of Boston College and as the Chairman of the Inner-City Scholarship Fund. | |
Kimberley H. Monasterio (43) | |
Year of Election or Appointment: 2007 President and Treasurer of the funds. Ms. Monasterio also serves as President and Treasurer of other Fidelity funds (2007-present) and is an employee of FMR (2004-present). Previously, Ms. Monasterio served as Deputy Treasurer of the Fidelity funds (2004-2006). Before joining Fidelity Investments, Ms. Monasterio served as Treasurer (2000-2004) and Chief Financial Officer (2002-2004) of the Franklin Templeton Funds and Senior Vice President of Franklin Templeton Services, LLC (2000-2004). | |
Boyce I. Greer (51) | |
Year of Election or Appointment: 2005 Vice President of the funds. Mr. Greer also serves as Vice President of certain Equity Funds (2005-present), certain Asset Allocation Funds (2005-present), Fixed-Income Funds (2006-present), and Money Market Funds (2006-present). Mr. Greer is also a Trustee of other investment companies advised by FMR (2003-present). He is an Executive Vice President of FMR (2005-present) and FMR Co., Inc. (2005-present), and Senior Vice President of Fidelity Investments Money Management, Inc. (2006-present). Previously, Mr. Greer served as a Director and Managing Director of Strategic Advisers, Inc. (2002-2005), and Executive Vice President (2000-2002) and Money Market Group Leader (1997-2002) of the Fidelity Investments Fixed Income Division. He also served as Vice President of Fidelity's Money Market Funds (1997-2002), Senior Vice President of FMR (1997-2002), and Vice President of FIMM (1998-2002). | |
Eric D. Roiter (58) | |
Year of Election or Appointment: 1998 Secretary of the funds. He also serves as Secretary of other Fidelity funds; Vice President, General Counsel, and Secretary of FMR Co., Inc. (2001-present) and FMR; Assistant Secretary of Fidelity Management & Research (U.K.) Inc. (2001-present), Fidelity Research & Analysis Company (2001-present), and Fidelity Investments Money Management, Inc. (2001-present). Mr. Roiter is an Adjunct Member, Faculty of Law, at Boston College Law School (2003-present). Previously, Mr. Roiter served as Vice President and Secretary of Fidelity Distributors Corporation (FDC) (1998-2005). | |
Scott C. Goebel (39) | |
Year of Election or Appointment: 2007 Assistant Secretary of the funds. Mr. Goebel also serves as Assistant Secretary of other Fidelity funds (2007-present), Vice President and Secretary of FDC (2006-present), and is an employee of FMR. | |
R. Stephen Ganis (40) | |
Year of Election or Appointment: 2006 Anti-Money Laundering (AML) officer of the funds. Mr. Ganis also serves as AML officer of other Fidelity funds (2006-present) and FMR Corp. (2003-present). Before joining Fidelity Investments, Mr. Ganis practiced law at Goodwin Procter, LLP (2000-2002). | |
Joseph B. Hollis (58) | |
Year of Election or Appointment: 2006 Chief Financial Officer of the funds. Mr. Hollis also serves as Chief Financial Officer of other Fidelity funds. Mr. Hollis is President of Fidelity Pricing and Cash Management Services (FPCMS) (2005-present). Mr. Hollis also serves as President and Director of Fidelity Service Company, Inc. (2006-present). Previously, Mr. Hollis served as Senior Vice President of Cash Management Services (1999-2002) and Investment Management Operations (2002-2005). | |
Kenneth A. Rathgeber (59) | |
Year of Election or Appointment: 2004 Chief Compliance Officer of the funds. Mr. Rathgeber also serves as Chief Compliance Officer of other Fidelity funds (2004-present) and Executive Vice President of Risk Oversight for Fidelity Investments (2002-present). He is Chief Compliance Officer of FMR (2005-present), FMR Co., Inc. (2005-present), Fidelity Management & Research (U.K.) Inc. (2005-present), Fidelity Research & Analysis Company (2005-present), Fidelity Investments Money Management, Inc. (2005-present), and Strategic Advisers, Inc. (2005-present). Previously, Mr. Rathgeber served as Executive Vice President and Chief Operating Officer for Fidelity Investments Institutional Services Company, Inc. (1998-2002). | |
Bryan A. Mehrmann (45) | |
Year of Election or Appointment: 2005 Deputy Treasurer of the funds. Mr. Mehrmann also serves as Deputy Treasurer of other Fidelity funds (2005-present) and is an employee of FMR. Previously, Mr. Mehrmann served as Vice President of Fidelity Investments Institutional Services Group (FIIS)/Fidelity Investments Institutional Operations Corporation, Inc. (FIIOC) Client Services (1998-2004). | |
Kenneth B. Robins (37) | |
Year of Election or Appointment: 2005 Deputy Treasurer of the funds. Mr. Robins also serves as Deputy Treasurer of other Fidelity funds (2005-present) and is an employee of FMR (2004-present). Before joining Fidelity Investments, Mr. Robins worked at KPMG LLP, where he was a partner in KPMG's department of professional practice (2002-2004) and a Senior Manager (1999-2000). In addition, Mr. Robins served as Assistant Chief Accountant, United States Securities and Exchange Commission (2000-2002). | |
Robert G. Byrnes (40) | |
Year of Election or Appointment: 2005 Assistant Treasurer of the funds. Mr. Byrnes also serves as Assistant Treasurer of other Fidelity funds (2005-present) and is an employee of FMR (2005-present). Previously, Mr. Byrnes served as Vice President of FPCMS (2003-2005). Before joining Fidelity Investments, Mr. Byrnes worked at Deutsche Asset Management where he served as Vice President of the Investment Operations Group (2000-2003). | |
Peter L. Lydecker (53) | |
Year of Election or Appointment: 2004 Assistant Treasurer of the funds. Mr. Lydecker also serves as Assistant Treasurer of other Fidelity funds (2004) and is an employee of FMR. | |
Gary W. Ryan (48) | |
Year of Election or Appointment: 2005 Assistant Treasurer of the funds. Mr. Ryan also serves as Assistant Treasurer of other Fidelity funds (2005-present) and is an employee of FMR (2005-present). Previously, Mr. Ryan served as Vice President of Fund Reporting in FPCMS (1999-2005). | |
Salvatore Schiavone (41) | |
Year of Election or Appointment: 2005 Assistant Treasurer of the funds. Mr. Schiavone also serves as Assistant Treasurer of other Fidelity funds (2005-present) and is an employee of FMR (2005-present). Before joining Fidelity Investments, Mr. Schiavone worked at Deutsche Asset Management, where he most recently served as Assistant Treasurer (2003-2005) of the Scudder Funds and Vice President and Head of Fund Reporting (1996-2003). | |
Annual Report
Distributions
The Board of Trustees of each voted to pay to shareholders of record at the opening of business on record date, the following distributions per share derived from capital gains realized from sales of portfolio securities, and dividends derived from net investment income:
Consumer Staples | Pay Date | Record Date | Dividends | Capital Gains |
Class A | 04/16/07 | 04/13/07 | $0.063 | $0.670 |
Class T | 04/16/07 | 04/13/07 | $0.061 | $0.670 |
Class B | 04/16/07 | 04/13/07 | $0.040 | $0.670 |
Class C | 04/16/07 | 04/13/07 | $0.019 | $0.670 |
Gold | ||||
Class A | 04/16/07 | 04/13/07 | $0.186 | $1.580 |
Class T | 04/16/07 | 04/13/07 | $0.163 | $1.580 |
Class B | 04/16/07 | 04/13/07 | $0.159 | $1.580 |
Class C | 04/16/07 | 04/13/07 | $0.171 | $1.580 |
Materials | ||||
Class A | 04/16/07 | 04/13/07 | $0.041 | $0.610 |
Class T | 04/16/07 | 04/13/07 | $0.039 | $0.610 |
Class B | 04/16/07 | 04/13/07 | $0.020 | $0.610 |
Class C | 04/16/07 | 04/13/07 | $0.031 | $0.610 |
Telecommunications | ||||
Class A | 04/16/07 | 04/13/07 | $0.123 | $0.000 |
Class T | 04/16/07 | 04/13/07 | $0.109 | $0.000 |
Class B | 04/16/07 | 04/13/07 | $0.074 | $0.000 |
Class C | 04/16/07 | 04/13/07 | $0.082 | $0.000 |
The funds hereby designate as capital gain dividend the amounts noted below for the taxable year ended February 28, 2007, or, if subsequently determined to be different, the net capital gain of such year.
Consumer Staples | $16,772,704 |
Gold | $75,675,851 |
Materials | $17,855,413 |
The funds will notify shareholders in January 2008 of amounts for use in preparing 2007 income tax returns.
Annual Report
Annual Report
Annual Report
Annual Report
Investment Adviser
Fidelity Management & Research Company
Boston, MA
Investment Sub-Advisers
FMR Co., Inc.
Fidelity Management & Research
(U.K.) Inc.
Fidelity Research & Analysis Company
Fidelity Investments Japan Limited
Fidelity International Investment Advisors
Fidelity International Investment Advisors
(U.K. Limited)
General Distributor
Fidelity Distributors Corporation
Boston, MA
Transfer and Service Agents
Fidelity Investments Institutional
Operations Company, Inc.
Boston, MA
Fidelity Service Company, Inc.
Boston, MA
Custodian
Brown Brothers Harriman & Co.
Boston, MA
Corporate Headquarters
82 Devonshire Street
Boston, MA 02109
1-800-544-8888
The Fidelity Telephone Connection
Mutual Fund 24-Hour Service
Exchanges/Redemptions
and Account Assistance 1-800-544-6666
Product Information 1-800-544-8888
Retirement Accounts 1-800-544-4774
(8 a.m. - 9 p.m.)
TDD Service 1-800-544-0118
for the deaf and hearing impaired
(9 a.m. - 9 p.m. Eastern time)
Fidelity Automated Service
Telephone (FAST®) (automated graphic) 1-800-544-5555
(automated graphic) Automated line for quickest service
ASGMT-UANN-0407
1.845779.100
(Fidelity Investment logo)(registered trademark)
Corporate Headquarters
82 Devonshire St., Boston, MA 02109
www.fidelity.com
Fidelity Advisor
Focus Funds®
Institutional Class
Fidelity Advisor Consumer Staples Fund
Fidelity Advisor Gold Fund
Fidelity Advisor Materials Fund
Fidelity Advisor Telecommunications Fund
Each Advisor fund listed above are classes
of the Fidelity® Select Portfolios®.
Annual Report
February 28, 2007
(2_fidelity_logos) (Registered_Trademark)
Contents
Chairman's Message | Ned Johnson's message to shareholders. | |
Consumer Staples | Performance | |
Management's Discussion | ||
Shareholder Expense Example | ||
Investment Changes | ||
Investments | ||
Financial Statements | ||
Notes to the Financial Statements | ||
Gold | Performance | |
Management's Discussion | ||
Shareholder Expense Example | ||
Investment Changes | ||
Investments | ||
Financial Statements | ||
Notes to the Financial Statements | ||
Materials | Performance | |
Management's Discussion | ||
Shareholder Expense Example | ||
Investment Changes | ||
Investments | ||
Financial Statements | ||
Notes to the Financial Statements | ||
Telecommunications | Performance | |
Management's Discussion | ||
Shareholder Expense Example | ||
Investment Changes | ||
Investments | ||
Financial Statements | ||
Notes to the Financial Statements | ||
Report of Independent Registered Public Accounting Firm | ||
Trustees and Officers | ||
Distributions |
To view a fund's proxy voting guidelines and proxy voting record for the 12-month period ended June 30, visit www.fidelity.com/proxyvotingresults or visit the Securities and Exchange Commission's (SEC) web site at www.sec.gov. You may also call 1-877-208-0098 to request a free copy of the proxy voting guidelines.
Standard & Poor's, S&P and S&P 500 are registered service marks of The McGraw-Hill Companies, Inc. and have been licensed for use by Fidelity Distributors Corporation.
Other third party marks appearing herein are the property of their respective owners.
All other marks appearing herein are registered or unregistered trademarks or service marks of FMR Corp. or an affiliated company.
This report and the financial statements contained herein are submitted for the general information of the shareholders of the funds. This report is not authorized for distribution to prospective investors in the funds unless preceded or accompanied by an effective prospectus.
A fund files its complete schedule of portfolio holdings with the SEC for the first and third quarters of each fiscal year on Form N-Q. Forms N-Q are available on the SEC's web site at http://www.sec.gov. A fund's Forms N-Q may be reviewed and copied at the SEC's Public Reference Room in Washington, DC. Information regarding the operation of the SEC's Public Reference Room may be obtained by calling 1-800-SEC-0330. For a complete list of a fund's portfolio holdings, view the most recent quarterly holdings report, semiannual report, or annual report on Fidelity's web site at http://www.advisor.fidelity.com.
NOT FDIC INSURED · MAY LOSE VALUE · NO BANK GUARANTEE
Neither the funds nor Fidelity Distributors Corporation is a bank.
Annual Report
Chairman's Message
(Photograph of Edward C. Johnson 3d.)
Dear Shareholder:
Substantial single-day losses are not uncommon in the equity markets, and when they occur - as in late February - investors can be better served in the long term by buying good stocks at lower prices than by moving their money to the sidelines. While financial markets are always unpredictable, there are a number of time-tested principles that can put the historical odds in your favor.
One of the basic tenets is to invest for the long term. Over time, riding out the markets' inevitable ups and downs has proven much more effective than selling into panic or chasing the hottest trend. Even missing only a few of the markets' best days can significantly diminish investor returns. Patience also affords the benefits of compounding - of earning interest on additional income or reinvested dividends and capital gains. There are tax advantages and cost benefits to consider as well. The more you sell, the more taxes you pay, and the more you trade, the higher the costs. While staying the course doesn't eliminate risk, it can considerably lessen the effect of short-term declines.
You can further manage your investing risk through diversification. And today, more than ever, geographic diversification should be taken into account. Studies
indicate that asset allocation is the single most important determinant of a portfolio's long-term success. The right mix of stocks, bonds and cash - aligned to your particular risk tolerance and investment objective - is very important. Age-appropriate rebalancing is also an essential aspect of asset allocation. For younger investors, an emphasis on equities - which historically have been the best performing asset class over time - is encouraged. As investors near their specific goal, such as retirement or sending a child to college, consideration may be given to replacing volatile assets (e.g. common stocks) with more-stable fixed investments (bonds or savings plans).
A third investment principle - investing regularly - can help lower the average cost of your purchases. Investing a certain amount of money each month or quarter helps ensure you won't pay for all your shares at market highs. This strategy - known as dollar cost averaging - also reduces unconstructive "emotion" from investing, helping shareholders avoid selling weak performers just prior to an upswing, or chasing a hot performer just before a correction.
We invite you to contact us via the Internet, through our Investor Centers or over the phone. It is our privilege to provide you the information you need to make the investments that are right for you.
Sincerely,
/s/Edward C. Johnson 3d
Edward C. Johnson 3d
Annual Report
Fidelity Advisor Consumer Staples Fund - Institutional Class
Performance
Average annual total return reflects the change in the value of an investment, assuming reinvestment of the class' dividend income and capital gains (the profits earned upon the sale of securities that have grown in value) and assuming a constant rate of performance each year. The $10,000 table and the fund's returns do not reflect the deduction of taxes that a shareholder would pay on fund distributions or the redemption of fund shares. During periods of reimbursement by Fidelity, a fund's total return will be greater than it would be had the reimbursement not occurred. How a fund did yesterday is no guarantee of how it will do tomorrow.
Average Annual Total Returns
Periods ended February 28, 2007 | Past 1 | Past 5 | Past 10 |
Institutional Class A | 18.41% | 8.78% | 8.66% |
A The initial offering of Institutional Class shares took place on December 12, 2006. Returns prior to December 12, 2006 are those of Consumer Staples, the original class of the fund.
Prior to October 1, 2006, Select Consumer Staples Portfolio was named Select Food and Agriculture Portfolio and operated under certain different investment policies. Effective October 1, 2006, shareholders of Select Consumer Staples Portfolio approved broadening the fund's focus so that it invests primarily in companies engaged in the manufacture, sale or distribution of consumer staples, including food and agriculture companies in which the fund previously invested, but also other consumer staples companies. The historical performance of the fund may not represent its current investment policies.
$10,000 Over 10 Years
Let's say hypothetically that $10,000 was invested in Fidelity Advisor Consumer Staples Fund - Institutional Class (dagger) on February 28, 1997. The chart shows how the value of your investment would have changed, and also shows how the Standard & Poor's 500SM Index (S&P 500®) performed over the same period.
* The initial offering of Institutional Class shares took place on December 12, 2006. Returns prior to December 12, 2006 are those of Consumer Staples, the original class of the fund.
Annual Report
Fidelity Advisor Consumer Staples Fund - Institutional Class
Management's Discussion of Fund Performance
Comments from Robert Lee, Portfolio Manager of Fidelity Advisor Consumer Staples Fund
A strong year for stocks encountered some volatility near the end of the 12-month period ending February 28, 2007. On the day prior to the period's close, the Dow Jones Industrial AverageSM plunged 416 points and the Standard & Poor's 500SM Index lost roughly 3.5% of its value, plummeting nearly 50 points and marking the benchmark's worst single-day performance since the day the market reopened after the 9/11 terrorist attacks. Though investors were obviously rattled by the development, it was only the 22nd-biggest decline for the S&P 500® in 20 years, and it could not overshadow how well stocks performed for the 12 months overall. For much of the past year, investors grew confident that the economy would not fall into a recession, and they bid up most broad-based stock indexes for six consecutive months from August through January. Overall for the year ending February 28, 2007, the S&P 500 was up 11.97%, the Dow advanced 14.24%, the small-cap Russell 2000® Index gained 9.87% and the NASDAQ Composite® Index rose 6.66%.
It's important to point out that in connection with a restructuring of the product line effective October 1, 2006, the fund changed the benchmark to which it compares its performance. For the 12 months ending February 28, 2007, the fund outpaced the Morgan Stanley Capital InternationalSM (MSCI®) US Investable Market Consumer Staples Index, which returned 14.32%, and a blended index specific to this fund, which advanced 11.06%. This blended index is a combination of the Goldman Sachs® Consumer Industries Index, which the fund was compared with through September, and the new MSCI benchmark mentioned above, which the fund was compared with during the period's final five months1. The new supplemental benchmark and name change reflected a broadening of the fund's focus, from primarily food and agriculture stocks to the larger universe of all consumer staples issues. The portfolio also outperformed the S&P 500 for the 12-month period. (For specific performance information on the fund's Institutional Class shares, please refer to the performance section of this report.) For the first seven months of the review period, the fund performed better than the Goldman Sachs index, driven by good stock selection and a strong showing from food and agriculture stocks in general, relative to weaker performing areas of the index such as home improvement retail, travel and publishing - which we did not own because they were outside the fund's narrow focus. Key contributors included supermarket chain Safeway, whose stock performed well as the company delivered improved sales and profit growth, and out-of-index Swiss food conglomerate Nestle. Not owning home improvement retailers Home Depot and Lowe's also aided relative results as those index components declined in price. On the negative side, the portfolio missed out on strong performance by cable giant Comcast and media conglomerate News Corp., two index components that were not owned because they were outside of our investment universe. The fund outperformed the MSCI index during the final five months of the period, powered by favorable stock selection. Strong performers included out-of-index holding British American Tobacco, Molson Coors Brewing and cigarette maker Loews Corp.-Carolina Group, which surpassed investor expectations when it delivered solid profit growth. I avoided discount warehouse chain Costco because I felt its stock was already richly valued, but the index component performed well and the fund's relative performance suffered. Drug retailer CVS also hurt fund results when its stock retreated. In response to the fund's benchmark and name changes, I shifted the portfolio's positioning to reflect the broadening of its investment universe. The weighting in packaged foods and meats was cut sharply, restaurant stocks were nearly eliminated, and I increased the weighting in household products and drug retailers.
1 The fund's blended index is a customized index developed by Fidelity for the limited purpose of discussing the fund's performance for the 12-month period ending February 28, 2007. From March 1, 2006, through September 30, 2006, the fund compared its performance to the Goldman Sachs Consumer Industries Index, which returned 6.22% during that period. On October 1, 2006, the fund began comparing its performance to a different index, the MSCI US Investable Market Consumer Staples Index, which returned 4.56% from October 1, 2006, through February 28, 2007. For the 12-month period ending February 28, 2007, the blended index (Goldman Sachs and MSCI) returned 11.06%.
The views expressed above reflect those of the portfolio manager(s) only through the end of the period as stated on the cover of this report and do not necessarily represent the views of Fidelity or any other person in the Fidelity organization. Any such views are subject to change at any time based upon market or other conditions and Fidelity disclaims any responsibility to update such views. These views may not be relied on as investment advice and, because investment decisions for a Fidelity fund are based on numerous factors, may not be relied on as an indication of trading intent on behalf of any Fidelity fund.
Annual Report
Select Consumer Staples Portfolio
Shareholder Expense Example
As a shareholder of the Fund, you incur two types of costs: (1) transaction costs, including sales charges (loads) on purchase payments or redemption proceeds, redemption fees, exchange fees, and (2) ongoing costs, including management fees, distribution and/or service (12-1) fees and other Fund expenses. This Example is intended to help you understand your ongoing costs (in dollars) of investing in the Fund and to compare these costs with the ongoing costs of investing in other mutual funds.
The actual Example is based on an investment of $1,000 at the beginning of the period and held for the entire period (September 1, 2006 to February 28, 2007) for the Consumer Staples class and for the entire period (December 12, 2006 to February 28, 2007) for Class A, Class T, Class B, Class C, and Institutional Class. The hypothetical expense Example is based on an investment of $1,000 invested for one-half year period (September 1, 2006 to February 28, 2007).
Actual Expenses
The first line of the accompanying table for each class of the Fund provides information about actual account values and actual expenses. You may use the information in this line, together with the amount you invested, to estimate the expenses that you paid over the period. Simply divide your account value by $1,000.00 (for example, an $8,600 account value divided by $1,000.00 = 8.6), then multiply the result by the number in the first line for a class of the Fund under the heading entitled "Expenses Paid During Period" to estimate the expenses you paid on your account during this period. A small balance maintenance fee of $12.00 that is charged once a year may apply for certain accounts with a value of less than $2,000. This fee is not included in the table below. If it was, the estimate of expenses you paid during the period would be higher, and your ending account value lower, by this amount.
Hypothetical Example for Comparison Purposes
The second line of the accompanying table for each class of the Fund provides information about hypothetical account values and hypothetical expenses based on a Class' actual expense ratio and an assumed rate of return of 5% per year before expenses, which is not the Class' actual return. The hypothetical account values and expenses may not be used to estimate the actual ending account balance or expenses you paid for the period. You may use this information to compare the ongoing costs of investing in the Fund and other funds. To do so, compare this 5% hypothetical example with the 5% hypothetical examples that appear in the shareholder reports of the other funds. A small balance maintenance fee of $12.00 that is charged once a year may apply for certain accounts with a value of less than $2,000. This fee is not included in the table below. If it was, the estimate of expenses you paid during the period would be higher, and your ending account value lower, by this amount.
Please note that the expenses shown in the table are meant to highlight your ongoing costs only and do not reflect any transaction costs. Therefore, the second line of the table is useful in comparing ongoing costs only, and will not help you determine the relative total costs of owning different funds. In addition, if these transactional costs were included, your costs would have been higher.
Beginning | Ending | Expenses | |
Class A | |||
Actual | $ 1,000.00 | $ 1,022.30 | $ 2.82B |
HypotheticalA | $ 1,000.00 | $ 1,018.40 | $ 6.46C |
Class T | |||
Actual | $ 1,000.00 | $ 1,020.60 | $ 3.52B |
HypotheticalA | $ 1,000.00 | $ 1,016.81 | $ 8.05C |
Class B | |||
Actual | $ 1,000.00 | $ 1,019.50 | $ 4.57B |
HypotheticalA | $ 1,000.00 | $ 1,014.43 | $ 10.44C |
Class C | |||
Actual | $ 1,000.00 | $ 1,019.30 | $ 4.68B |
HypotheticalA | $ 1,000.00 | $ 1,014.18 | $ 10.69C |
Consumer Staples | |||
Actual | $ 1,000.00 | $ 1,078.60 | $ 5.00B |
HypotheticalA | $ 1,000.00 | $ 1,019.98 | $ 4.86C |
Institutional Class | |||
Actual | $ 1,000.00 | $ 1,021.60 | $ 2.19B |
HypotheticalA | $ 1,000.00 | $ 1,019.84 | $ 5.01C |
A 5% return per year before expenses
B Actual expenses are equal to each Class' annualized expense ratio (shown in the table below); multiplied by the average account value over the period, multiplied by 181/365 (to reflect the one-half year period) for the Consumer Staples class and multiplied by 79/365 (to reflect the period December 12, 2006 to February 28, 2007) for the Class A, Class T, Class B, Class C and Institutional Class.
C Hypothetical expenses are equal to each Class' annualized expense ratio (shown in the table below); multiplied by the average account value over the period, multiplied by 181/365 (to reflect the one-half year period).
Annual Report
Annualized | |
Class A | 1.29% |
Class T | 1.61% |
Class B | 2.09% |
Class C | 2.14% |
Consumer Staples | .97% |
Institutional Class | 1.00% |
Annual Report
Select Consumer Staples Portfolio
Investment Changes
Top Ten Stocks as of February 28, 2007 | ||
% of fund's | % of fund's net assets | |
Procter & Gamble Co. | 18.0 | 1.5 |
PepsiCo, Inc. | 9.8 | 5.3 |
The Coca-Cola Co. | 8.0 | 5.8 |
Altria Group, Inc. | 5.7 | 6.5 |
British American Tobacco PLC sponsored ADR | 4.2 | 1.0 |
Colgate-Palmolive Co. | 4.1 | 1.4 |
CVS Corp. | 4.1 | 0.7 |
Nestle SA sponsored ADR | 4.0 | 7.5 |
Kroger Co. | 2.8 | 3.7 |
Safeway, Inc. | 2.2 | 2.9 |
62.9 | ||
Top Industries (% of fund's net assets) | |||
As of February 28, 2007 | |||
 | Beverages | 29.2% | |
 | Household Products | 22.1% | |
 | Food & Staples Retailing | 15.4% | |
 | Food Products | 14.4% | |
 | Tobacco | 12.3% | |
 | All Others* | 6.6% | |
As of August 31, 2006 | |||
| Food Products | 29.7% | |
 | Beverages | 20.0% | |
| Hotels, Restaurants & Leisure | 12.3% | |
| Food & Staples Retailing | 11.8% | |
| Tobacco | 9.1% | |
| All Others* | 17.1% | |
* Includes short-term investments and net other assets. |
Annual Report
Select Consumer Staples Portfolio
Investments February 28, 2007
Showing Percentage of Net Assets
Common Stocks - 96.6% | |||
Shares | Value | ||
BEVERAGES - 29.2% | |||
Brewers - 5.7% | |||
Anadolu Efes Biracilk Ve Malt Sanyii AS | 23,000 | $ 712,137 | |
Boston Beer Co., Inc. Class A (a) | 15,500 | 508,245 | |
Companhia de Bebidas das Americas (AmBev) (PN) sponsored ADR | 18,000 | 870,660 | |
Grupo Modelo SA de CV Series C | 173,000 | 889,921 | |
Heineken NV (Bearer) | 38,000 | 1,873,202 | |
InBev SA | 81,400 | 5,397,884 | |
Molson Coors Brewing Co. Class B | 90,700 | 7,658,708 | |
SABMiller PLC | 164,900 | 3,653,925 | |
21,564,682 | |||
Distillers & Vintners - 3.8% | |||
Brown-Forman Corp. Class B (non-vtg.) | 28,000 | 1,834,000 | |
Constellation Brands, Inc. Class A (sub. vtg.) | 50,900 | 1,194,114 | |
Diageo PLC sponsored ADR | 69,800 | 5,541,422 | |
Pernod Ricard SA | 27,200 | 5,614,879 | |
14,184,415 | |||
Soft Drinks - 19.7% | |||
Coca-Cola Femsa SA de CV sponsored ADR | 44,500 | 1,535,250 | |
Coca-Cola Hellenic Bottling Co. SA sponsored ADR | 92,000 | 3,591,680 | |
Coca-Cola Icecek AS | 124,000 | 921,444 | |
Fomento Economico Mexicano SA de CV sponsored ADR | 7,300 | 805,190 | |
Hansen Natural Corp. (a)(d) | 7,700 | 269,500 | |
PepsiCo, Inc. | 584,800 | 36,930,120 | |
The Coca-Cola Co. | 649,200 | 30,304,656 | |
74,357,840 | |||
TOTAL BEVERAGES | 110,106,937 | ||
BIOTECHNOLOGY - 0.2% | |||
Biotechnology - 0.2% | |||
Senomyx, Inc. (a) | 72,300 | 912,426 | |
FOOD & STAPLES RETAILING - 15.4% | |||
Drug Retail - 6.3% | |||
CVS Corp. | 488,300 | 15,337,503 | |
Rite Aid Corp. | 157,500 | 940,275 | |
Walgreen Co. | 171,300 | 7,658,823 | |
23,936,601 | |||
Food Distributors - 1.0% | |||
Sysco Corp. | 89,400 | 2,946,624 | |
United Natural Foods, Inc. (a) | 27,200 | 810,016 | |
3,756,640 | |||
Food Retail - 6.0% | |||
Kroger Co. | 407,600 | 10,463,092 | |
Safeway, Inc. | 241,100 | 8,334,827 | |
Tesco PLC | 107,000 | 908,024 | |
Shares | Value | ||
The Great Atlantic & Pacific Tea Co. (d) | 31,200 | $ 992,160 | |
Whole Foods Market, Inc. | 38,500 | 1,839,145 | |
22,537,248 | |||
Hypermarkets & Super Centers - 2.1% | |||
Wal-Mart Stores, Inc. | 163,900 | 7,916,370 | |
TOTAL FOOD & STAPLES RETAILING | 58,146,859 | ||
FOOD PRODUCTS - 14.4% | |||
Agricultural Products - 2.8% | |||
Archer-Daniels-Midland Co. | 168,500 | 5,793,030 | |
BioMar Holding AS | 10,000 | 461,754 | |
Bunge Ltd. | 35,000 | 2,777,600 | |
Corn Products International, Inc. | 28,600 | 914,342 | |
Nutreco Holding NV | 8,000 | 555,807 | |
10,502,533 | |||
Packaged Foods & Meats - 11.6% | |||
Cadbury Schweppes PLC sponsored ADR | 71,900 | 3,093,857 | |
Chiquita Brands International, Inc. | 35,500 | 514,750 | |
Groupe Danone | 23,200 | 3,675,917 | |
Industrias Bachoco SA de CV sponsored ADR | 32,000 | 921,600 | |
Kellogg Co. | 86,200 | 4,303,104 | |
Koninklijke Numico NV | 72,300 | 3,727,623 | |
Lindt & Spruengli AG | 72 | 1,845,858 | |
Marine Harvest ASA (a) | 1,123,000 | 1,373,152 | |
Nestle SA sponsored ADR | 160,800 | 15,010,680 | |
Smithfield Foods, Inc. (a) | 30,000 | 876,300 | |
TreeHouse Foods, Inc. (a) | 100 | 2,885 | |
Tyson Foods, Inc. Class A | 51,200 | 934,400 | |
Unilever NV (NY Shares) | 289,600 | 7,520,912 | |
43,801,038 | |||
TOTAL FOOD PRODUCTS | 54,303,571 | ||
HOTELS, RESTAURANTS & LEISURE - 0.1% | |||
Restaurants - 0.1% | |||
Starbucks Corp. (a) | 8,000 | 247,200 | |
HOUSEHOLD PRODUCTS - 22.1% | |||
Household Products - 22.1% | |||
Colgate-Palmolive Co. | 230,800 | 15,546,688 | |
Procter & Gamble Co. | 1,065,697 | 67,661,103 | |
83,207,791 | |||
PERSONAL PRODUCTS - 2.4% | |||
Personal Products - 2.4% | |||
Avon Products, Inc. | 218,100 | 7,995,546 | |
Bare Escentuals, Inc. | 27,205 | 946,462 | |
Herbalife Ltd. (a) | 100 | 3,765 | |
8,945,773 | |||
Common Stocks - continued | |||
Shares | Value | ||
PHARMACEUTICALS - 0.5% | |||
Pharmaceuticals - 0.5% | |||
Johnson & Johnson | 29,000 | $ 1,828,450 | |
TOBACCO - 12.3% | |||
Tobacco - 12.3% | |||
Altria Group, Inc. | 253,700 | 21,381,836 | |
British American Tobacco PLC sponsored ADR | 259,400 | 15,825,994 | |
Japan Tobacco, Inc. | 197 | 895,785 | |
Loews Corp. - Carolina Group | 102,000 | 7,347,060 | |
Souza Cruz Industria Comerico | 57,000 | 1,032,209 | |
46,482,884 | |||
TOTAL COMMON STOCKS (Cost $327,830,942) | 364,181,891 | ||
Money Market Funds - 2.7% | |||
Fidelity Cash Central Fund, 5.35% (b) | 9,119,079 | $ 9,119,079 | |
Fidelity Securities Lending Cash Central Fund, 5.34% (b)(c) | 1,106,675 | 1,106,675 | |
TOTAL MONEY MARKET FUNDS (Cost $10,225,754) | 10,225,754 | ||
TOTAL INVESTMENT PORTFOLIO - 99.3% (Cost $338,056,696) | 374,407,645 |
NET OTHER ASSETS - 0.7% | 2,574,384 | ||
NET ASSETS - 100% | $ 376,982,029 | ||
Legend |
(a) Non-income producing |
(b) Affiliated fund that is available only to investment companies and other accounts managed by Fidelity Investments. The rate quoted is the annualized seven-day yield of the fund at period end. A complete unaudited listing of the fund's holdings as of its most recent quarter end is available upon request. |
(c) Investment made with cash collateral received from securities on loan. |
(d) Security or a portion of the security is on loan at period end. |
Affiliated Central Funds |
Information regarding fiscal year to date income earned by the Fund from investments in Fidelity Central Funds is as follows: |
Fund | Income earned |
Fidelity Cash Central Fund | $ 570,365 |
Fidelity Securities Lending Cash Central Fund | 75,627 |
Total | $ 645,992 |
Other Information |
Distribution of investments by country of issue, as a percentage of total net assets, is as follows: |
United States of America | 75.8% |
United Kingdom | 7.7% |
Switzerland | 4.5% |
Netherlands | 3.7% |
France | 2.5% |
Belgium | 1.4% |
Mexico | 1.1% |
Greece | 1.0% |
Others (individually less than 1%) | 2.3% |
100.0% |
See accompanying notes which are an integral part of the financial statements.
Annual Report
Select Consumer Staples Portfolio
Financial Statements
Statement of Assets and Liabilities
February 28, 2007 | ||
Assets | ||
Investment in securities, at value (including securities loaned of $1,032,700) - See accompanying schedule: Unaffiliated issuers (cost $327,830,942) | $ 364,181,891 | |
Fidelity Central Funds (cost $10,225,754) | 10,225,754 | |
Total Investments (cost $338,056,696) | $ 374,407,645 | |
Receivable for investments sold | 2,050,469 | |
Receivable for fund shares sold | 6,163,051 | |
Dividends receivable | 214,904 | |
Distributions receivable from Fidelity Central Funds | 49,643 | |
Prepaid expenses | 694 | |
Other receivables | 6,547 | |
Total assets | 382,892,953 | |
Liabilities | ||
Payable for investments purchased | $ 3,114,636 | |
Payable for fund shares redeemed | 1,377,606 | |
Accrued management fee | 173,754 | |
Distribution fees payable | 557 | |
Other affiliated payables | 89,302 | |
Other payables and accrued expenses | 48,394 | |
Collateral on securities loaned, at value | 1,106,675 | |
Total liabilities | 5,910,924 | |
Net Assets | $ 376,982,029 | |
Net Assets consist of: | ||
Paid in capital | $ 331,654,886 | |
Undistributed net investment income | 810,260 | |
Accumulated undistributed net realized gain (loss) on investments and foreign currency transactions | 8,165,882 | |
Net unrealized appreciation (depreciation) on investments and assets and liabilities in foreign currencies | 36,351,001 | |
Net Assets | $ 376,982,029 | |
Statement of Assets and Liabilities - continued
February 28, 2007 | ||
Calculation of Maximum Offering Price Class A: | $ 58.16 | |
Maximum offering price per share (100/94.25 of $58.16) | $ 61.71 | |
Class T: | $ 58.06 | |
Maximum offering price per share (100/96.50 of $58.06) | $ 60.17 | |
Class B: | $ 58.00 | |
Class C: | $ 57.99 | |
Consumer Staples: | $ 58.13 | |
Institutional Class: | $ 58.12 | |
A Redemption price per share is equal to net asset value less any applicable contingent deferred sales charge.
See accompanying notes which are an integral part of the financial statements.
Annual Report
Select Consumer Staples Portfolio
Financial Statements - continued
Statement of Operations
Year ended February 28, 2007 | ||
Investment Income | ||
Dividends | $ 3,921,319 | |
Interest | 53 | |
Income from Fidelity Central Funds | 645,992 | |
Total income | 4,567,364 | |
Expenses | ||
Management fee | $ 1,315,325 | |
Transfer agent fees | 691,650 | |
Distribution fees | 1,011 | |
Accounting and security lending fees | 102,795 | |
Custodian fees and expenses | 53,919 | |
Independent trustees' compensation | 822 | |
Registration fees | 127,628 | |
Audit | 36,636 | |
Legal | 3,326 | |
Miscellaneous | 10,350 | |
Total expenses before reductions | 2,343,462 | |
Expense reductions | (68,570) | 2,274,892 |
Net investment income (loss) | 2,292,472 | |
Realized and Unrealized Gain (Loss) Net realized gain (loss) on: | ||
Investment securities: | ||
Unaffiliated issuers | 23,020,008 | |
Foreign currency transactions | (10,609) | |
Total net realized gain (loss) | 23,009,399 | |
Change in net unrealized appreciation (depreciation) on: Investment securities | 13,327,071 | |
Assets and liabilities in foreign currencies | 311 | |
Total change in net unrealized appreciation (depreciation) | 13,327,382 | |
Net gain (loss) | 36,336,781 | |
Net increase (decrease) in net assets resulting from operations | $ 38,629,253 | |
Statement of Changes in Net Assets
Year ended | Year ended | |
Increase (Decrease) in Net Assets | ||
Operations | ||
Net investment income (loss) | $ 2,292,472 | $ 1,263,331 |
Net realized gain (loss) | 23,009,399 | 8,287,843 |
Change in net unrealized appreciation (depreciation) | 13,327,382 | (385,129) |
Net increase (decrease) in net assets resulting from operations | 38,629,253 | 9,166,045 |
Distributions to shareholders from net investment income | (1,582,908) | (1,049,605) |
Distributions to shareholders from net realized gain | (15,661,672) | (6,158,772) |
Total distributions | (17,244,580) | (7,208,377) |
Share transactions - net increase (decrease) | 230,543,294 | (16,300,126) |
Redemption fees | 47,547 | 20,664 |
Total increase (decrease) in net assets | 251,975,514 | (14,321,794) |
Net Assets | ||
Beginning of period | 125,006,515 | 139,328,309 |
End of period (including undistributed net investment income of $810,260 and undistributed net investment income of $237,173, respectively) | $ 376,982,029 | $ 125,006,515 |
See accompanying notes which are an integral part of the financial statements.
Annual Report
Financial Highlights - Class A
Years ended February 28, | 2007 H |
Selected Per-Share Data | |
Net asset value, beginning of period | $ 56.89 |
Income from Investment Operations | |
Net investment income (loss) E | (.01) |
Net realized and unrealized gain (loss) | 1.28 |
Total from investment operations | 1.27 |
Redemption fees added to paid in capital E | - J |
Net asset value, end of period | $ 58.16 |
Total Return B,C,D | 2.23% |
Ratios to Average Net Assets F,I | |
Expenses before reductions | 1.29% A |
Expenses net of fee waivers, if any | 1.29% A |
Expenses net of all reductions | 1.28% A |
Net investment income (loss) | (.11)% A |
Supplemental Data | |
Net assets, end of period (000 omitted) | $ 986 |
Portfolio turnover rate G | 99% |
A Annualized B Total returns for periods of less than one year are not annualized. C Total returns would have been lower had certain expenses not been reduced during the periods shown. D Total returns do not include the effect of the sales charges. E Calculated based on average shares outstanding during the period. F Fees and expenses of the underlying Fidelity Central Funds are not included in the Fund's expense ratio. The Fund indirectly bears its proportionate share of the expenses of any underlying Fidelity Central Funds. G Amount does not include the portfolio activity of any underlying Fidelity Central Funds. H For the period December 12, 2006 (commencement of sale of shares) to February 28, 2007. I Expense ratios reflect operating expenses of the class. Expenses before reductions do not reflect amounts reimbursed by the investment adviser or reductions from brokerage service arrangements or other expense offset arrangements and do not represent the amount paid by the class during periods when reimbursements or reductions occur. Expenses net of fee waivers reflect expenses after reimbursement by the investment adviser but prior to reductions from brokerage service arrangements or other expense offset arrangements. Expenses net of all reductions represent the net expenses paid by the class. J Amount represents less than $.01 per share. |
Financial Highlights - Class T
Years ended February 28, | 2007 H |
Selected Per-Share Data | |
Net asset value, beginning of period | $ 56.89 |
Income from Investment Operations | |
Net investment income (loss) E | (.01) |
Net realized and unrealized gain (loss) | 1.18 |
Total from investment operations | 1.17 |
Redemption fees added to paid in capital E | - J |
Net asset value, end of period | $ 58.06 |
Total Return B,C,D | 2.06% |
Ratios to Average Net Assets F,I | |
Expenses before reductions | 1.61% A |
Expenses net of fee waivers, if any | 1.61% A |
Expenses net of all reductions | 1.60% A |
Net investment income (loss) | (.11)% A |
Supplemental Data | |
Net assets, end of period (000 omitted) | $ 529 |
Portfolio turnover rate G | 99% |
A Annualized B Total returns for periods of less than one year are not annualized. C Total returns would have been lower had certain expenses not been reduced during the periods shown. D Total returns do not include the effect of the sales charges. E Calculated based on average shares outstanding during the period. F Fees and expenses of the underlying Fidelity Central Funds are not included in the Fund's expense ratio. The Fund indirectly bears its proportionate share of the expenses of any underlying Fidelity Central Funds. G Amount does not include the portfolio activity of any underlying Fidelity Central Funds. H For the period December 12, 2006 (commencement of sale of shares) to February 28, 2007. I Expense ratios reflect operating expenses of the class. Expenses before reductions do not reflect amounts reimbursed by the investment adviser or reductions from brokerage service arrangements or other expense offset arrangements and do not represent the amount paid by the class during periods when reimbursements or reductions occur. Expenses net of fee waivers reflect expenses after reimbursement by the investment adviser but prior to reductions from brokerage service arrangements or other expense offset arrangements. Expenses net of all reductions represent the net expenses paid by the class. J Amount represents less than $.01 per share. |
See accompanying notes which are an integral part of the financial statements.
Annual Report
Financial Highlights - Class B
Years ended February 28, | 2007 H |
Selected Per-Share Data | |
Net asset value, beginning of period | $ 56.89 |
Income from Investment Operations | |
Net investment income (loss) E | (.07) |
Net realized and unrealized gain (loss) | 1.18 |
Total from investment operations | 1.11 |
Redemption fees added to paid in capital E | - J |
Net asset value, end of period | $ 58.00 |
Total Return B,C,D | 1.95% |
Ratios to Average Net Assets F,I | |
Expenses before reductions | 2.09% A |
Expenses net of fee waivers, if any | 2.09% A |
Expenses net of all reductions | 2.09% A |
Net investment income (loss) | (.59)% A |
Supplemental Data | |
Net assets, end of period (000 omitted) | $ 226 |
Portfolio turnover rate G | 99% |
A Annualized B Total returns for periods of less than one year are not annualized. C Total returns would have been lower had certain expenses not been reduced during the periods shown. D Total returns do not include the effect of the contingent deferred sales charge. E Calculated based on average shares outstanding during the period. F Fees and expenses of the underlying Fidelity Central Funds are not included in the Fund's expense ratio. The Fund indirectly bears its proportionate share of the expenses of any underlying Fidelity Central Funds. G Amount does not include the portfolio activity of any underlying Fidelity Central Funds. H For the period December 12, 2006 (commencement of sale of shares) to February 28, 2007. I Expense ratios reflect operating expenses of the class. Expenses before reductions do not reflect amounts reimbursed by the investment adviser or reductions from brokerage service arrangements or other expense offset arrangements and do not represent the amount paid by the class during periods when reimbursements or reductions occur. Expenses net of fee waivers reflect expenses after reimbursement by the investment adviser but prior to reductions from brokerage service arrangements or other expense offset arrangements. Expenses net of all reductions represent the net expenses paid by the class. J Amount represents less than $.01 per share. |
Financial Highlights - Class C
Years ended February 28, | 2007 H |
Selected Per-Share Data | |
Net asset value, beginning of period | $ 56.89 |
Income from Investment Operations | |
Net investment income (loss) E | (.08) |
Net realized and unrealized gain (loss) | 1.18 |
Total from investment operations | 1.10 |
Redemption fees added to paid in capital E | - J |
Net asset value, end of period | $ 57.99 |
Total Return B,C,D | 1.93% |
Ratios to Average Net Assets F,I | |
Expenses before reductions | 2.14% A |
Expenses net of fee waivers, if any | 2.14% A |
Expenses net of all reductions | 2.14% A |
Net investment income (loss) | (.66)% A |
Supplemental Data | |
Net assets, end of period (000 omitted) | $ 178 |
Portfolio turnover rate G | 99% |
A Annualized B Total returns for periods of less than one year are not annualized. C Total returns would have been lower had certain expenses not been reduced during the periods shown. D Total returns do not include the effect of the contingent deferred sales charge. E Calculated based on average shares outstanding during the period. F Fees and expenses of the underlying Fidelity Central Funds are not included in the Fund's expense ratio. The Fund indirectly bears its proportionate share of the expenses of any underlying Fidelity Central Funds. G Amount does not include the portfolio activity of any underlying Fidelity Central Funds. H For the period December 12, 2006 (commencement of sale of shares) to February 28, 2007. I Expense ratios reflect operating expenses of the class. Expenses before reductions do not reflect amounts reimbursed by the investment adviser or reductions from brokerage service arrangements or other expense offset arrangements and do not represent the amount paid by the class during periods when reimbursements or reductions occur. Expenses net of fee waivers reflect expenses after reimbursement by the investment adviser but prior to reductions from brokerage service arrangements or other expense offset arrangements. Expenses net of all reductions represent the net expenses paid by the class. J Amount represents less than $.01 per share. |
See accompanying notes which are an integral part of the financial statements.
Annual Report
Financial Highlights - Consumer Staples
Years ended February 28, | 2007 | 2006 | 2005 | 2004 G | 2003 |
Selected Per-Share Data | |||||
Net asset value, beginning of period | $ 52.18 | $ 51.42 | $ 46.50 | $ 35.71 | $ 44.68 |
Income from Investment Operations | |||||
Net investment income (loss) C | .56 | .50 | .29 | .22 | .25 |
Net realized and unrealized gain (loss) | 8.88 | 3.25 | 4.90 | 10.80 | (8.06) |
Total from investment operations | 9.44 | 3.75 | 5.19 | 11.02 | (7.81) |
Distributions from net investment income | (.32) | (.44) | (.29) | (.24) | (.32) |
Distributions from net realized gain | (3.18) | (2.56) | - | - | (.88) |
Total distributions | (3.50) | (3.00) | (.29) | (.24) | (1.20) |
Redemption fees added to paid in capital C | .01 | .01 | .02 | .01 | .04 |
Net asset value, end of period | $ 58.13 | $ 52.18 | $ 51.42 | $ 46.50 | $ 35.71 |
Total Return A,B | 18.43% | 7.50% | 11.24% | 30.94% | (17.85)% |
Ratios to Average Net Assets D,F | |||||
Expenses before reductions | 1.01% | 1.04% | 1.06% | 1.27% | 1.25% |
Expenses net of fee waivers, if any | .99% | 1.04% | 1.06% | 1.27% | 1.25% |
Expenses net of all reductions | .98% | 1.03% | 1.05% | 1.25% | 1.17% |
Net investment income (loss) | .99% | .97% | .61% | .55% | .59% |
Supplemental Data | |||||
Net assets, end of period (000 omitted) | $ 374,930 | $ 125,007 | $ 139,328 | $ 104,436 | $ 88,123 |
Portfolio turnover rate E | 99% | 75% | 86% | 62% | 225% |
A Total returns would have been lower had certain expenses not been reduced during the periods shown. B Total returns do not include the effect of the former sales charges. C Calculated based on average shares outstanding during the period. D Fees and expenses of the underlying Fidelity Central Funds are not included in the Fund's expense ratio. The Fund indirectly bears its proportionate share of the expenses of any underlying Fidelity Central Funds. E Amount does not include the portfolio activity of any underlying Fidelity Central Funds. F Expense ratios reflect operating expenses of the class. Expenses before reductions do not reflect amounts reimbursed by the investment adviser or reductions from brokerage service arrangements or other expense offset arrangements and do not represent the amount paid by the class during periods when reimbursements or reductions occur. Expenses net of fee waivers reflect expenses after reimbursement by the investment adviser but prior to reductions from brokerage service arrangements or other expense offset arrangements. Expenses net of all reductions represent the net expenses paid by the class. G For the year ended February 29. |
Financial Highlights - Institutional Class
Years ended February 28, | 2007 G |
Selected Per-Share Data | |
Net asset value, beginning of period | $ 56.89 |
Income from Investment Operations | |
Net investment income (loss)D | .07 |
Net realized and unrealized gain (loss) | 1.16 |
Total from investment operations | 1.23 |
Redemption fees added to paid in capitalD | - I |
Net asset value, end of period | $ 58.12 |
Total Return B,C | 2.16% |
Ratios to Average Net Assets E,H | |
Expenses before reductions | 1.00% A |
Expenses net of fee waivers, if any | 1.00% A |
Expenses net of all reductions | 1.00% A |
Net investment income (loss) | .57% A |
Supplemental Data | |
Net assets, end of period (000 omitted) | $ 132 |
Portfolio turnover rate F | 99% |
A Annualized B Total returns for periods of less than one year are not annualized. C Total returns would have been lower had certain expenses not been reduced during the periods shown. D Calculated based on average shares outstanding during the period. E Fees and expenses of the underlying Fidelity Central Funds are not included in the Fund's expense ratio. The Fund indirectly bears its proportionate share of the expenses of any underlying Fidelity Central Funds. F Amount does not include the portfolio activity of any underlying Fidelity Central Funds. G For the period December 12, 2006 (commencement of sale of shares) to February 28, 2007. H Expense ratios reflect operating expenses of the class. Expenses before reductions do not reflect amounts reimbursed by the investment adviser or reductions from brokerage service arrangements or other expense offset arrangements and do not represent the amount paid by the class during periods when reimbursements or reductions occur. Expenses net of fee waivers reflect expenses after reimbursement by the investment adviser but prior to reductions from brokerage service arrangements or other expense offset arrangements. Expenses net of all reductions represent the net expenses paid by the class. I Amount represents less than $.01 per share. |
See accompanying notes which are an integral part of the financial statements.
Annual Report
Notes to Financial Statements
For the period ended February 28, 2007
1. Organization.
Consumer Staples Portfolio (formerly Food and Agriculture Portfolio) (the Fund) is a non-diversified fund of Fidelity Select Portfolios (the trust) and is authorized to issue an unlimited number of shares. The trust is registered under the Investment Company Act of 1940, as amended (the 1940 Act), as an open-end management investment company organized as a Massachusetts business trust. The Fund invests primarily in securities of companies whose principal business activities fall within specific industries. The Fund offers Class A, Class T, Class B, Class C, Consumer Staples, and Institutional Class shares, each of which has equal rights as to assets and voting privileges. Each class has exclusive voting rights with respect to matters that affect that class. The Fund commenced sale of Class A, Class T, Class B, Class C and Institutional Class shares and the existing class was designated Consumer Staples on December 12, 2006. Class B shares will automatically convert to Class A shares after a holding period of seven years from the initial date of purchase. Investment income, realized and unrealized capital gains and losses, the common expenses of the Fund, and certain fund-level expense reductions, if any, are allocated on a pro rata basis to each class based on the relative net assets of each class to the total net assets of the Fund. Each class differs with respect to transfer agent and distribution and service plan fees incurred. Certain expense reductions also differ by class. The financial statements have been prepared in conformity with accounting principles generally accepted in the United States of America, which require management to make certain estimates and assumptions at the date of the financial statements.
2. Investments in Fidelity Central Funds.
The Fund may invest in Fidelity Central Funds which are open-end investment companies available only to other investment companies and accounts managed by FMR and its affiliates. The Fund's Schedule of Investments lists each of the Fidelity Central Funds as an investment of the Fund but does not include the underlying holdings of each Fidelity Central Fund. As an Investing Fund, the Fund indirectly bears its proportionate share of the expenses of the underlying Fidelity Central Funds. A complete unaudited list of holdings for each Fidelity Central Fund is available upon request. In addition, the financial statements of the Fidelity Central Funds, which are not covered by the Fund's Report of Independent Registered Public Accounting Firm, are available on the EDGAR Database on the SEC's web site, www.sec.gov, or upon request.
The Money Market Central Funds seek preservation of capital and current income and are managed by Fidelity Investments Money Management, Inc. (FIMM), an affiliate of Fidelity Management & Research Company (FMR).
3. Significant Accounting Policies.
The following summarizes the significant accounting policies of the Fund:
Security Valuation. Investments are valued and net asset value (NAV) per share is calculated (NAV calculation) as of the close of business of the New York Stock Exchange (NYSE), normally 4:00 p.m. Eastern time. During the period the Fund also calculated a NAV each hour on the hour (commencing at 10:00 a.m. Eastern time until one hour prior to the close of business on the NYSE). Effective October 1, 2006 the Fund eliminated hourly NAV calculation.
Wherever possible, the Fund uses independent pricing services approved by the Board of Trustees to value its investments. Equity securities, including restricted securities, for which market quotations are readily available, are valued at the last reported sale price or official closing price as reported by an independent pricing service on the primary market or exchange on which they are traded. In the event there were no sales during the day or closing prices are not available, securities are valued at the last quoted bid price. Investments in open-end mutual funds, including the Fidelity Central Funds, are valued at their closing net asset value each business day. Short-term securities with remaining maturities of sixty days or less for which quotations are not readily available are valued at amortized cost, which approximates value.
When current market prices or quotations are not readily available or do not accurately reflect fair value, valuations may be determined in accordance with procedures adopted by the Board of Trustees. For example, when developments occur between the close of a market and the close of the NYSE that may materially affect the value of some or all of the securities, or when trading in a security is halted, those securities may be fair valued. Factors used in the determination of fair value may include monitoring news to identify significant market or security specific events such as changes in the value of U.S. securities markets, reviewing developments in foreign markets and evaluating the performance of ADRs, futures contracts and exchange-traded funds. Because the Fund's utilization of fair value pricing depends on market activity, the frequency with which fair value pricing is used cannot be predicted and may be utilized to a significant extent. The value of securities used for NAV calculation under fair value pricing may differ from published prices for the same securities.
Foreign Currency. The Fund uses foreign currency contracts to facilitate transactions in foreign-denominated securities. Losses from these transactions may arise from changes in the value of the foreign currency or if the counterparties do not perform under the contracts' terms.
Annual Report
3. Significant Accounting Policies - continued
Foreign Currency - continued
Foreign-denominated assets, including investment securities, and liabilities are translated into U.S. dollars at the exchange rate at period end. Purchases and sales of investment securities, income and dividends received and expenses denominated in foreign currencies are translated into U.S. dollars at the exchange rate in effect on the transaction date.
The effects of exchange rate fluctuations on investments are included with the net realized and unrealized gain (loss) on investment securities. Other foreign currency transactions resulting in realized and unrealized gain (loss) are disclosed separately.
Investment Transactions and Income. For financial reporting purposes, the Fund's investment holdings and NAV include trades executed through the end of the last business day of the period. The NAV for processing shareholder transactions includes trades executed through the end of the prior business day. Gains and losses on securities sold are determined on the basis of identified cost and may include proceeds received from litigation. Dividend income is recorded on the ex-dividend date, except for certain dividends from foreign securities where the ex-dividend date may have passed, which are recorded as soon as the Fund is informed of the ex-dividend date. Non-cash dividends included in dividend income, if any, are recorded at the fair market value of the securities received. Distributions received on securities that represent a return of capital or capital gain are recorded as a reduction of cost of investments and/or as a realized gain. The Fund estimates the components of distributions received that may be considered return of capital distributions or capital gain distributions. Interest income and distributions from the Fidelity Central Funds are accrued as earned, with any distributions receivable as of period end included in Distributions receivable from Fidelity Central Funds on the Statement of Assets and Liabilities. Interest income includes coupon interest and amortization of premium and accretion of discount on debt securities. Investment income is recorded net of foreign taxes withheld where recovery of such taxes is uncertain.
Expenses. Most expenses of the trust can be directly attributed to a fund. Expenses which cannot be directly attributed are apportioned among each Fund in the trust. Expense estimates are accrued in the period to which they relate and adjustments are made when actual amounts are known.
Income Tax Information and Distributions to Shareholders. Each year, the Fund intends to qualify as a regulated investment company by distributing all of its taxable income and realized gains under Subchapter M of the Internal Revenue Code. As a result, no provision for income taxes is required in the accompanying financial statements. Foreign taxes are provided for based on the Fund's understanding of the tax rules and rates that exist in the foreign markets in which it invests.
Distributions are recorded on the ex-dividend date. Income dividends and capital gain distributions are declared separately for each class. Income and capital gain distributions are determined in accordance with income tax regulations, which may differ from generally accepted accounting principles. In addition, the Fund will claim a portion of the payment made to redeeming shareholders as a distribution for income tax purposes.
Capital accounts within the financial statements are adjusted for permanent book-tax differences. These adjustments have no impact on net assets or the results of operations. Temporary book-tax differences will reverse in a subsequent period.
Book-tax differences are primarily due to short-term capital gains, foreign currency transactions and losses deferred due to wash sales.
The tax-basis components of distributable earnings and the federal tax cost as of period end were as follows:
Unrealized appreciation | $ 38,446,201 |
Unrealized depreciation | (2,642,135) |
Net unrealized appreciation (depreciation) | 35,804,066 |
Undistributed ordinary income | 2,363,461 |
Undistributed long-term capital gain | 2,384,179 |
Cost for federal income tax purposes | $ 338,603,579 |
The tax character of distributions paid was as follows:
February 28, 2007 | February 28, 2006 | |
Ordinary Income | $ 1,582,908 | $ 1,906,227 |
Long-term Capital Gains | 15,661,672 | 5,302,150 |
Total | $ 17,244,580 | $ 7,208,377 |
Trading (Redemption) Fees. Shares in the Fund held less than 30 days are subject to a redemption fee equal to .75% of the net asset value of shares redeemed. All redemption fees, including any estimated redemption fees paid by FMR, are retained by the Fund and accounted for as an addition to paid in capital. Shareholders were also subject to an additional $7.50 fee for shares exchanged into another Fidelity fund (see Note 6).
Annual Report
Notes to Financial Statements - continued
3. Significant Accounting Policies - continued
New Accounting Pronouncements. In July 2006, Financial Accounting Standards Board Interpretation No. 48, Accounting for Uncertainty in Income Taxes - an interpretation of FASB Statement 109 (FIN 48), was issued and is effective on the last business day of the semiannual reporting period for fiscal years beginning after December 15, 2006. FIN 48 sets forth a threshold for financial statement recognition, measurement and disclosure of a tax position taken or expected to be taken on a tax return. Management is currently evaluating the impact, if any, the adoption of FIN 48 will have on the Fund's net assets, results of operations and financial statement disclosures.
In addition, in September 2006, Statement of Financial Accounting Standards No. 157, Fair Value Measurements (SFAS 157), was issued and is effective for fiscal years beginning after November 15, 2007. SFAS 157 defines fair value, establishes a framework for measuring fair value and expands disclosures about fair value measurements. Management is currently evaluating the impact the adoption of SFAS 157 will have on the Fund's financial statement disclosures.
4. Operating Policies.
Repurchase Agreements. FMR has received an Exemptive Order from the Securities and Exchange Commission (the SEC) which permits the Fund and other affiliated entities of FMR to transfer uninvested cash balances into joint trading accounts which are then invested in repurchase agreements. The Fund may also invest directly with institutions in repurchase agreements. Repurchase agreements are collateralized by government or non-government securities. Upon settlement date, collateral is held in segregated accounts with custodian banks and may be obtained in the event of a default of the counterparty. The Fund monitors, on a daily basis, the value of the collateral to ensure it is at least equal to the principal amount of the repurchase agreement (including accrued interest). In the event of a default by the counterparty, realization of the collateral proceeds could be delayed, during which time the value of the collateral may decline.
5. Purchases and Sales of Investments.
Purchases and sales of securities, other than short-term securities, aggregated $426,154,222 and $222,805,678, respectively.
6. Fees and Other Transactions with Affiliates.
Management Fee. FMR and its affiliates provide the Fund with investment management related services for which the Fund pays a monthly management fee. The management fee is the sum of an individual fund fee rate that is based on an annual rate of .30% of the Fund's average net assets and a group fee rate that averaged .26% during the period. The group fee rate is based upon the average net assets of all the mutual funds advised by FMR. The group fee rate decreases as assets under management increase and increases as assets under management decrease. For the period, the total annual management fee rate was .57% of the Fund's average net assets.
Distribution and Service Plan. In accordance with Rule 12b-1 of the 1940 Act, the Fund has adopted separate Distribution and Service Plans for each class of shares. Certain classes pay Fidelity Distributors Corporation (FDC), an affiliate of FMR, separate Distribution and Service Fees, each of which is based on an annual percentage of each class' average net assets. In addition, FDC may pay financial intermediaries for selling shares of the Fund and providing shareholder support services. For the period, the Distribution and Service Fee rates and the total amounts paid to and retained by FDC were as follows:
Distribution | Service | Paid to | Retained | |
Class A | -% | .25% | $ 241 | $ 130 |
Class T | .25% | .25% | 208 | 112 |
Class B | .75% | .25% | 290 | 275 |
Class C | .75% | .25% | 272 | 261 |
$ 1,011 | $ 778 |
Sales Load. FDC receives a front-end sales charge of up to 5.75% for selling Class A shares, and 3.50% for selling Class T shares, some of which is paid to financial intermediaries for selling shares of the Fund. FDC receives the proceeds of contingent deferred sales charges levied on Class A, Class T, Class B, and Class C redemptions. These charges depend on the holding period. The deferred sales charges range from 5% to 1% for Class B, 1% for Class C, 1.00% to .50% for certain purchases of Class A shares and .25% for certain purchases of Class T shares.
Annual Report
6. Fees and Other Transactions with Affiliates - continued
Sales Load - continued
For the period, sales charge amounts retained by FDC were as follows:
Retained | |
Class A | $ 357 |
Class T | 405 |
$ 762 |
Transfer Agent Fees. Fidelity Investments Institutional Operations Company, Inc. (FIIOC), an affiliate of FMR, is the transfer, dividend disbursing and shareholder servicing agent for each class of the Fund, except for Consumer Staples. Fidelity Service Company, Inc. (FSC), an affiliate of FMR, is the transfer agent for Consumer Staples shares. FIIOC and FSC receive account fees and asset-based fees that vary according to the account size and type of account of the shareholders of the respective classes of the Fund. FIIOC and FSC pay for typesetting, printing and mailing of shareholder reports, except proxy statements. For the period, the total transfer agent fees paid by each class to FIIOC or FSC, were as follows:
Amount | % of | |
Class A | $ 112 | .13 |
Class T | 82 | .21 |
Class B | 61 | .22 |
Class C | 73 | .29 |
Consumer Staples | 691,220 | .30 |
Institutional Class | 102 | .27 |
$ 691,650 |
Accounting and Security Lending Fees. FSC maintains the Fund's accounting records. The accounting fee is based on the level of average net assets for the month. Under a separate contract, FSC administers the security lending program. The security lending fee is based on the number and duration of lending transactions.
Exchange Fees. During the period, FSC received the proceeds of a $7.50 fee to cover administrative costs associated with exchanges out of the Fund to any other Fidelity Select fund or to any other Fidelity fund made through non-automated channels. Effective October 1, 2006, the exchange fees were eliminated. For the period, exchange fees retained by FSC were as follows:
Retained | |
Consumer Staples Portfolio | $ 923 |
Brokerage Commissions. The Fund placed a portion of its portfolio transactions with brokerage firms which are affiliates of the investment adviser. The commissions paid to these affiliated firms were $1,593 for the period.
7. Committed Line of Credit.
The Fund participates with other funds managed by FMR in a $4.2 billion credit facility (the "line of credit") to be utilized for temporary or emergency purposes to fund shareholder redemptions or for other short-term liquidity purposes. The Fund has agreed to pay commitment fees on its pro rata portion of the line of credit, which amounted to $506 and is reflected in Miscellaneous Expense on the Statement of Operations. During the period, there were no borrowings on this line of credit.
Annual Report
Notes to Financial Statements - continued
8. Security Lending.
The Fund lends portfolio securities from time to time in order to earn additional income. On the settlement date of the loan, the Fund receives collateral (in the form of U.S. Treasury obligations, letters of credit and/or cash) against the loaned securities and maintains collateral in an amount not less than 100% of the market value of the loaned securities during the period of the loan. The market value of the loaned securities is determined at the close of business of the Fund and any additional required collateral is delivered to the Fund on the next business day. If the borrower defaults on its obligation to return the securities loaned because of insolvency or other reasons, a fund could experience delays and costs in recovering the securities loaned or in gaining access to the collateral. Any cash collateral received is invested in the Fidelity Securities Lending Cash Central Fund. The value of loaned securities and cash collateral at period end are disclosed on the Fund's Statement of Assets and Liabilities. Security lending income represents the income earned on investing cash collateral, less fees and expenses associated with the loan, plus any premium payments that may be received on the loan of certain types of securities. Security lending income is presented in the Statement of Operations as a component of income from Fidelity Central Funds. Net income from lending portfolio securities during the period amounted to $75,627.
9. Expense Reductions.
FMR voluntarily agreed to reimburse a portion of Consumer Staples' operating expenses. During the period, this reimbursement reduced the class' expenses by $56,875.
Many of the brokers with whom FMR places trades on behalf of the Fund provided services to the Fund in addition to trade execution. These services included payments of certain expenses on behalf of the Fund totaling $5,788 for the period. In addition, through arrangements with the Fund's custodian and each class' transfer agent, credits realized as a result of uninvested cash balances were used to reduce the Fund's expenses. During the period, these credits reduced the Fund's custody expenses by $970. During the period, credits reduced each class' transfer agent expense as noted in the table below.
Transfer Agent | |
Consumer Staples | $ 2,309 |
10. Other.
The Fund's organizational documents provide former and current trustees and officers with a limited indemnification against liabilities arising in connection with the performance of their duties to the Fund. In the normal course of business, the Fund may also enter into contracts that provide general indemnifications. The Fund's maximum exposure under these arrangements is unknown as this would be dependent on future claims that may be made against the Fund. The risk of material loss from such claims is considered remote.
The United States Securities and Exchange Commission ("SEC") is conducting an investigation of FMR (covering the years 2002 to 2004) arising from gifts, gratuities and business entertainment provided by certain brokers to certain individuals who were employed on FMR's domestic equity trading desk during that period. FMR is in discussions with the SEC staff regarding the possible resolution of the matter, but as of period-end no final resolution has been reached.
In December 2006, the Independent Trustees completed their own investigation of the matter with the assistance of independent counsel. The Independent Trustees and FMR agree that, despite the absence of proof that the Fidelity mutual funds experienced diminished execution quality as a result of the improper receipt of gifts and business entertainment, the conduct at issue was serious and is worthy of redress. Accordingly, the Independent Trustees have requested and FMR has agreed to pay $42 million to Fidelity mutual funds, plus interest to be determined at the time that payment is made. A method of allocating this payment among the funds has not yet been determined. The total payment to the Fund is not anticipated to have a material impact on the Fund's net assets. In addition, FMR reimbursed related legal expenses which are recorded in the accompanying Statement of Operations as an expense reduction.
11. Distributions to Shareholders.
Distributions to shareholders of each class were as follows:
Years ended February 28, | 2007 | 2006 |
From net investment income | ||
Consumer Staples | $ 1,582,908 | $ 1,049,605 |
From net realized gain | ||
Consumer Staples | $ 15,661,672 | $ 6,158,772 |
Annual Report
12. Share Transactions.
Transactions for each class of shares were as follows:
Shares | Dollars | |||
Years ended February 28, | 2007 A | 2006 | 2007 A | 2006 |
Class A | ||||
Shares sold | 17,300 | - | $ 1,017,780 | $ - |
Shares redeemed | (340) | - | (20,214) | - |
Net increase (decrease) | 16,960 | - | $ 997,566 | $ - |
Class T | ||||
Shares sold | 9,119 | - | $ 531,803 | $ - |
Shares redeemed | - | - | - | - |
Net increase (decrease) | 9,119 | - | $ 531,803 | $ - |
Class B | ||||
Shares sold | 3,902 | - | $ 225,744 | $ - |
Shares redeemed | - | - | - | - |
Net increase (decrease) | 3,902 | - | $ 225,744 | $ - |
Class C | ||||
Shares sold | 3,073 | - | $ 177,350 | $ - |
Shares redeemed | - | - | - | - |
Net increase (decrease) | 3,073 | - | $ 177,350 | $ - |
Consumer Staples | ||||
Shares sold | 6,369,570 | 932,427 | $ 359,958,201 | $ 47,926,666 |
Reinvestment of distributions | 292,584 | 133,891 | 16,482,463 | 6,802,073 |
Shares redeemed | (2,608,360) | (1,380,263) | (147,956,526) | (71,028,865) |
Net increase (decrease) | 4,053,794 | (313,945) | $ 228,484,138 | $ (16,300,126) |
Institutional Class | ||||
Shares sold | 4,028 | - | $ 230,500 | $ - |
Shares redeemed | (1,758) | - | (103,807) | - |
Net increase (decrease) | 2,270 | - | $ 126,693 | $ - |
A Share transactions for Class A, Class T, Class B, Class C and Institutional Class are for the period December 12, 2006 (commencement of sale of shares) to February 28, 2007.
Annual Report
Fidelity Advisor Gold Fund - Institutional Class
Performance
Average annual total return reflects the change in the value of an investment, assuming reinvestment of the class' dividend income and capital gains (the profits earned upon the sale of securities that have grown in value) and assuming a constant rate of performance each year. The $10,000 table and the fund's returns do not reflect the deduction of taxes that a shareholder would pay on fund distributions or the redemption of fund shares. During periods of reimbursement by Fidelity, a fund's total return will be greater than it would be had the reimbursement not occurred. How a fund did yesterday is no guarantee of how it will do tomorrow.
Average Annual Total Returns
Periods ended February 28, 2007 | Past 1 | Past 5 | Past 10 |
Institutional Class A | 16.19% | 22.89% | 6.96% |
A The initial offering of Institutional Class A shares took place on December 12, 2006. Returns prior to December 12, 2006 are those of Gold, the original class of the fund.
$10,000 Over 10 Years
Let's say hypothetically that $10,000 was invested in Fidelity Advisor Gold Fund - Institutional Class (dagger) on February 28, 1997. The chart shows how the value of your investment would have changed, and also shows how the Standard & Poor's 500 Index performed over the same period.
* The initial offering of Institutional Class A shares took place on December 12, 2006. Returns prior to December 12, 2006 are those of Gold, the original class of the fund.
Annual Report
Fidelity Advisor Gold Fund - Institutional Class
Management's Discussion of Fund Performance
Comments from Daniel Dupont, Portfolio Manager of Fidelity Advisor Gold Fund
A rosy year for stocks wilted just prior to the end of the 12-month period ending February 28, 2007. On the day prior to the period's close, the Dow Jones Industrial AverageSM plunged 416 points and the Standard & Poor's 500SM Index lost roughly 3.5% of its value, plummeting nearly 50 points and marking the benchmark's worst single-day performance since the day the market reopened after the 9/11 terrorist attacks. Though investors were obviously rattled by the development, it was only the 22nd-biggest decline for the S&P 500® in 20 years, and it could not overshadow how well stocks performed for the 12 months overall. For much of the past year, investors grew confident that the economy would not fall into a recession, and they bid up most broad-based stock indexes for six consecutive months from August through January. Overall for the year ending February 28, 2007, the S&P 500 was up 11.97%, the Dow advanced 14.24%, the small-cap Russell 2000® Index gained 9.87% and the NASDAQ Composite® Index rose 6.66%.
It's important to point out that in conjunction with a restructuring of the product line effective October 1, 2006, the fund changed the benchmark to which it compares its performance. During the past year, the fund handily outperformed the 10.69% return of the Standard & Poor's®/Citigroup BMI Global Gold Index and also topped the 12.67% gain of a blended index specific to this fund. This blended index is a combination of the Goldman Sachs® Natural Resources Index, which the fund was compared with through September, and the new S&P®/Citigroup benchmark mentioned above, which the fund was compared with during the period's final five months1. During the same 12-month period, the portfolio also beat the S&P 500. (For specific performance information on the fund's Institutional Class shares, please refer to the performance section of this report.) For the first seven months of the review period, the fund outperformed the Goldman Sachs index. Favorable stock selection in precious metals and minerals added considerable value, although the benefits largely were offset by an overweighted exposure to that group, which lagged the index. The fund's positions in platinum producers were especially beneficial. A lack of exposure to most energy-related groups also helped, as crude oil and natural gas prices fell sharply in the early fall after peaking during the summer. During the same seven months, the price of gold finished modestly higher, which helped the fund. Our cash position provided a boost as well. Conversely, unrewarding picks in the diversified metals and mining segment hurt the fund's results. Not owning integrated oil and gas producers, one of the stronger energy categories and a major group in the Goldman Sachs index, also detracted. Further, the fund's absolute performance was curbed by unfavorable currency movements. Among individual holdings, Canada-based Cambior was a notable contributor; the company received a lucrative buyout offer from IAMGOLD in September, helping the stock. Also boosting the fund's return was Aquarius Platinum, a Bermuda-incorporated company based in Australia, with significant properties in South Africa. Both contributors were out-of-benchmark positions, and I sold Aquarius Platinum to lock in profits. On the downside, Aber Diamond was the fund's largest detractor during the seven-month period. Flat diamond prices and a harsh Canadian winter that closed access roads for longer than normal were factors hurting the stock. During the final five months of the period, the fund handily outperformed the S&P/Citigroup index. Stock picking in precious metals and minerals again added value, along with effective choices in diversified metals and mining. Significantly underweighting Canada-based Barrick Gold aided our results. Also having a positive impact on performance was Bema Gold, another Canadian producer of the yellow metal, which was acquired during the period by Kinross Gold. Conversely, not owning Yamana Gold detracted. Although I thought the stock was overvalued, it advanced amid excitement about the company's flagship Chapada mine in Brazil beginning production on schedule in November and early indications that production was meeting or exceeding expectations. Overall, the fund shifted to a higher concentration in gold stocks, bringing it more in line with the new S&P/Citigroup benchmark.
1 The fund's blended index is a customized index developed by Fidelity for the limited purpose of discussing the fund's performance for the 12-month period ending February 28, 2007. From March 1, 2006, through September 30, 2006, the fund compared its performance to the Goldman Sachs Natural Resources Index, which returned 2.61% during that period. On October 1, 2006, the fund began comparing its performance to a different index, the S&P/Citigroup BMI Global Gold Index, which returned 9.80% from October 1, 2006, through February 28, 2007. For the 12-month period ending February 28, 2007, the blended index (Goldman Sachs and S&P/Citigroup) returned 12.67%.
The views expressed above reflect those of the portfolio manager(s) only through the end of the period as stated on the cover of this report and do not necessarily represent the views of Fidelity or any other person in the Fidelity organization. Any such views are subject to change at any time based upon market or other conditions and Fidelity disclaims any responsibility to update such views. These views may not be relied on as investment advice and, because investment decisions for a Fidelity fund are based on numerous factors, may not be relied on as an indication of trading intent on behalf of any Fidelity fund.
Annual Report
Shareholder Expense Example
As a shareholder of the Fund, you incur two types of costs: (1) transaction costs, including sales charges (loads) on purchase payments or redemption proceeds, redemption fees, exchange fees, and (2) ongoing costs, including management fees, distribution and/or service (12b-1) fees and other Fund expenses. This Example is intended to help you understand your ongoing costs (in dollars) of investing in the Fund and to compare these costs with the ongoing costs of investing in other mutual funds.
The actual Example is based on an investment of $1,000 at the beginning of the period and held for the entire period (September 1, 2006 to February 28, 2007) for the Gold class and for the entire period (December 12, 2006 to February 28, 2007) for Class A, Class T, Class B, Class C, and Institutional Class. The hypothetical expense Example is based on an investment of $1,000 invested for one-half year period (September 1, 2006 to February 28, 2007).
Actual Expenses
The first line of the accompanying table for each class of the Fund provides information about actual account values and actual expenses. You may use the information in this line, together with the amount you invested, to estimate the expenses that you paid over the period. Simply divide your account value by $1,000.00 (for example, an $8,600 account value divided by $1,000.00 = 8.6), then multiply the result by the number in the first line for a class of the Fund under the heading entitled "Expenses Paid During Period" to estimate the expenses you paid on your account during this period. A small balance maintenance fee of $12.00 that is charged once a year may apply for certain accounts with a value of less than $2,000. This fee is not included in the table below. If it was, the estimate of expenses you paid during the period would be higher, and your ending account value lower, by this amount.
Hypothetical Example for Comparison Purposes
The second line of the accompanying table for each class of the Fund provides information about hypothetical account values and hypothetical expenses based on a Class' actual expense ratio and an assumed rate of return of 5% per year before expenses, which is not the Class' actual return. The hypothetical account values and expenses may not be used to estimate the actual ending account balance or expenses you paid for the period. You may use this information to compare the ongoing costs of investing in the Fund and other funds. To do so, compare this 5% hypothetical example with the 5% hypothetical examples that appear in the shareholder reports of the other funds. A small balance maintenance fee of $12.00 that is charged once a year may apply for certain accounts with a value of less than $2,000. This fee is not included in the table below. If it was, the estimate of expenses you paid during the period would be higher, and your ending account value lower, by this amount.
Please note that the expenses shown in the table are meant to highlight your ongoing costs only and do not reflect any transaction costs. Therefore, the second line of the table is useful in comparing ongoing costs only, and will not help you determine the relative total costs of owning different funds. In addition, if these transactional costs were included, your costs would have been higher.
Beginning | Ending | Expenses | |
Class A | |||
Actual | $ 1,000.00 | $ 998.10 | $ 2.44B |
HypotheticalA | $ 1,000.00 | $ 1,019.19 | $ 5.66 C |
Class T | |||
Actual | $ 1,000.00 | $ 997.00 | $ 3.16B |
HypotheticalA | $ 1,000.00 | $ 1,017.55 | $ 7.30 C |
Class B | |||
Actual | $ 1,000.00 | $ 996.20 | $ 4.23B |
HypotheticalA | $ 1,000.00 | $ 1,015.08 | $ 9.79 C |
Class C | |||
Actual | $ 1,000.00 | $ 995.60 | $ 4.36 B |
HypotheticalA | $ 1,000.00 | $ 1,014.78 | $ 10.09 C |
Gold | |||
Actual | $ 1,000.00 | $ 1,050.90 | $ 4.47 B |
HypotheticalA | $ 1,000.00 | $ 1,020.43 | $ 4.41 C |
Institutional Class | |||
Actual | $ 1,000.00 | $ 998.40 | $ 2.03 B |
HypotheticalA | $ 1,000.00 | $ 1,020.13 | $ 4.71 C |
A 5% return per year before expenses
B Actual expenses are equal to each Class' annualized expense ratio (shown in the table below); multiplied by the average account value over the period, multiplied by 181/365 (to reflect the one-half year period) for the Gold class and multiplied by 79/365 (to reflect the period December 12, 2006 to February 28, 2007) for the Class A, Class T, Class B, Class C and Institutional Class.
C Hypothetical expenses are equal to each Class' annualized expense ratio (shown in the table below); multiplied by the average account value over the period, multiplied by 181/365 (to reflect the one-half year period).
Annual Report
Annualized | |
Class A | 1.13% |
Class T | 1.46% |
Class B | 1.96% |
Class C | 2.02% |
Gold | .88% |
Institutional Class | .94% |
Annual Report
Investment Changes
Top Ten Stocks as of February 28, 2007 | ||
% of fund's | % of fund's net assets | |
Newcrest Mining Ltd. | 9.6 | 9.1 |
Meridian Gold, Inc. | 9.6 | 9.5 |
Newmont Mining Corp. | 8.5 | 4.6 |
Barrick Gold Corp. | 8.1 | 5.4 |
IAMGOLD Corp. | 5.7 | 2.5 |
Kinross Gold Corp. | 5.5 | 0.0 |
Goldcorp, Inc. | 4.6 | 2.3 |
Lihir Gold Ltd. | 4.4 | 1.9 |
Gold Fields Ltd. sponsored ADR | 4.1 | 1.3 |
Arizona Star Resource Corp. | 3.0 | 2.0 |
63.1 | ||
Top Industries (% of fund's net assets) | |||
As of February 28, 2007 | |||
| Gold | 78.8% | |
 | Precious Metals & Minerals | 10.4% | |
 | Diversified Metals & Mining | 1.1% | |
| All Others* | 9.7% | |

As of August 31, 2006 | |||
| Gold | 54.8% | |
| Precious Metals & Minerals | 26.4% | |
| Diversified Metals & Mining | 9.2% | |
| All Others* | 9.6% | |

* Includes short-term investments and net other assets. |
Annual Report
Investments February 28, 2007
Showing Percentage of Net Assets
Common Stocks - 90.3% | |||
Shares | Value | ||
Australia - 10.0% | |||
METALS & MINING - 10.0% | |||
Gold - 9.6% | |||
Newcrest Mining Ltd. | 7,999,971 | $ 142,145,664 | |
Precious Metals & Minerals - 0.4% | |||
Central Asia Gold Ltd. (a)(e) | 12,025,834 | 5,874,969 | |
TOTAL METALS & MINING | 148,020,633 | ||
Canada - 51.0% | |||
METALS & MINING - 51.0% | |||
Gold - 42.9% | |||
Agnico-Eagle Mines Ltd. | 200,000 | 7,873,114 | |
Alamos Gold, Inc. (a) | 600,000 | 4,745,415 | |
Arizona Star Resource Corp. (a)(e) | 3,800,000 | 43,863,024 | |
Barrick Gold Corp. | 4,000,000 | 119,430,550 | |
Bema Gold Corp. warrants 9/7/11 (a) | 600,000 | 1,282,545 | |
Coral Gold Resources Ltd. (a)(e) | 672,200 | 2,034,618 | |
Crystallex International Corp. (a) | 11,000,000 | 32,918,644 | |
Eldorado Gold Corp. (a) | 1,500,000 | 8,952,161 | |
Goldcorp, Inc. | 2,516,900 | 67,530,522 | |
High River Gold Mines Ltd. (a)(f) | 1,000,000 | 1,915,267 | |
High River Gold Mines Ltd. warrants 1/27/08 (a) | 332,500 | 107,730 | |
IAMGOLD Corp. | 10,000,000 | 83,536,403 | |
Kinross Gold Corp. (a) | 5,787,600 | 81,354,490 | |
Meridian Gold, Inc. (a)(e) | 5,160,000 | 141,535,462 | |
Novagold Resources, Inc. (a) | 600,000 | 9,901,244 | |
Orezone Resources, Inc. Class A (a)(e) | 10,000,000 | 18,041,127 | |
Tone Resources Ltd. (a)(e) | 1,908,400 | 2,366,021 | |
White Knight Resources Ltd. (a)(e) | 3,955,300 | 6,087,418 | |
633,475,755 | |||
Precious Metals & Minerals - 8.1% | |||
Aber Diamond Corp. | 799,990 | 28,591,836 | |
Minefinders Corp. Ltd. (a)(e) | 3,100,000 | 33,742,038 | |
Nevada Pacific Gold Ltd. (a) | 2,699,900 | 2,677,854 | |
Pan American Silver Corp. (a)(d) | 500,000 | 15,010,004 | |
Shore Gold, Inc. (a) | 6,000,000 | 39,245,864 | |
SouthernEra Diamonds, Inc. Class A (a) | 2,210,000 | 510,196 | |
119,777,792 | |||
TOTAL METALS & MINING | 753,253,547 | ||
Shares | Value | ||
Papua New Guinea - 4.4% | |||
METALS & MINING - 4.4% | |||
Gold - 4.4% | |||
Lihir Gold Ltd. (a)(d) | 25,000,020 | $ 65,399,902 | |
Peru - 1.9% | |||
METALS & MINING - 1.9% | |||
Precious Metals & Minerals - 1.9% | |||
Compania de Minas Buenaventura SA | 400,000 | 10,905,672 | |
Compania de Minas Buenaventura SA sponsored ADR (d) | 600,000 | 16,632,000 | |
27,537,672 | |||
Russia - 0.5% | |||
METALS & MINING - 0.5% | |||
Gold - 0.5% | |||
Polyus Gold OJSC sponsored ADR (a) | 150,000 | 7,807,500 | |
South Africa - 8.1% | |||
METALS & MINING - 8.1% | |||
Gold - 8.1% | |||
Anglogold Ashanti Ltd. sponsored ADR | 800,000 | 35,248,000 | |
Gold Fields Ltd. | 175,000 | 3,085,250 | |
Gold Fields Ltd. sponsored ADR (d) | 3,400,000 | 59,942,000 | |
Harmony Gold Mining Co. Ltd. (a) | 1,300,000 | 17,979,000 | |
Harmony Gold Mining Co. Ltd. sponsored ADR (a)(d) | 200,000 | 2,766,000 | |
119,020,250 | |||
United Kingdom - 3.4% | |||
METALS & MINING - 3.4% | |||
Diversified Metals & Mining - 1.1% | |||
African Platinum PLC (a) | 15,000,000 | 15,985,305 | |
Gold - 2.3% | |||
Randgold Resources Ltd. sponsored ADR | 1,500,000 | 34,350,000 | |
TOTAL METALS & MINING | 50,335,305 | ||
United States of America - 11.0% | |||
METALS & MINING - 11.0% | |||
Gold - 11.0% | |||
Newmont Mining Corp. | 2,800,000 | 126,196,000 | |
Royal Gold, Inc. (d) | 1,000,000 | 33,100,000 | |
US Gold Corp. (a) | 728,400 | 3,350,640 | |
US Gold Corp. warrants 2/22/11 (a)(g) | 364,200 | 566,753 | |
163,213,393 | |||
TOTAL COMMON STOCKS (Cost $1,065,462,510) | 1,334,588,202 | ||
Money Market Funds - 9.6% | |||
Shares | Value | ||
Fidelity Cash Central Fund, 5.35% (b) | 129,196,888 | $ 129,196,888 | |
Fidelity Securities Lending Cash Central Fund, 5.34% (b)(c) | 12,653,825 | 12,653,825 | |
TOTAL MONEY MARKET FUNDS (Cost $141,850,713) | 141,850,713 | ||
TOTAL INVESTMENT PORTFOLIO - 99.9% (Cost $1,207,313,223) | 1,476,438,915 |
NET OTHER ASSETS - 0.1% | 1,635,942 | ||
NET ASSETS - 100% | $ 1,478,074,857 | ||
Legend |
(a) Non-income producing |
(b) Affiliated fund that is available only to investment companies and other accounts managed by Fidelity Investments. The rate quoted is the annualized seven-day yield of the fund at period end. A complete unaudited listing of the fund's holdings as of its most recent quarter end is available upon request. |
(c) Investment made with cash collateral received from securities on loan. |
(d) Security or a portion of the security is on loan at period end. |
(e) Affiliated company |
(f) Security exempt from registration under Rule 144A of the Securities Act of 1933. These securities may be resold in transactions exempt from registration, normally to qualified institutional buyers. At the end of the period, the value of these securities amounted to $1,915,267, or 0.1% of net assets. |
(g) Restricted securities - Investment in securities not registered under the Securities Act of 1933 (excluding 144A issues). At the end of the period, the value of restricted securities (excluding 144A issues) amounted to $566,753 or 0.0% of net assets. |
Additional information on each holding is as follows: |
Security | Acquisition Date | Acquisition Cost |
US Gold Corp. warrants 2/22/11 | 2/8/06 | $ 179,112 |
Affiliated Central Funds |
Information regarding fiscal year to date income earned by the Fund from investments in Fidelity Central Funds is as follows: |
Fund | Income earned |
Fidelity Cash Central Fund | $ 7,327,656 |
Fidelity Securities Lending Cash Central Fund | 679,059 |
Total | $ 8,006,715 |
Other Affiliated Issuers |
An affiliated company is a company in which the fund has ownership of at least 5% of the voting securities. Fiscal year to date transactions with companies which are or were affiliates are as follows: |
Affiliates | Value, | Purchases | Sales | Dividend | Value, |
Aber Diamond Corp. | $ 101,949,189 | $ 42,793,742 | $ 99,101,298 | $ 2,210,686 | $ - |
Arizona Star Resource Corp. | 15,418,356 | 22,659,170 | - | - | 43,863,024 |
Bolivar Gold Corp. | 31,025,393 | - | 31,022,986 | - | - |
Cambior, Inc. | 65,449,104 | 16,604,300 | 30,024,720 | - | - |
Central Asia Gold Ltd. | - | 4,104,140 | - | - | 5,874,969 |
Coral Gold Resources Ltd. | - | 2,147,230 | - | - | 2,034,618 |
Crystallex International Corp. | 42,908,067 | 2,972,762 | 17,990,417 | - | - |
Meridian Gold, Inc. | 126,303,743 | 31,759,576 | 29,346,935 | - | 141,535,462 |
Minefinders Corp. Ltd. | 29,636,932 | 4,727,146 | 12,087,665 | - | 33,742,038 |
Orezone Resources, Inc. Class A | 14,417,110 | 5,744,298 | - | - | 18,041,127 |
Tone Resources Ltd. | - | 2,726,660 | - | - | 2,366,021 |
White Knight Resources Ltd. | - | 7,289,086 | - | - | 6,087,418 |
Total | $ 427,107,894 | $ 143,528,110 | $ 219,574,021 | $ 2,210,686 | $ 253,544,677 |
Income Tax Information |
The fund has a capital loss carryforward of $5,961,929, which was acquired in the merger with Select Precious Metals and Minerals, which will expire on February 29, 2008, and is available to offset future capital gains of the fund up to $5,961,929 per year as provided by regulations. |
See accompanying notes which are an integral part of the financial statements.
Annual Report
Financial Statements
Statement of Assets and Liabilities
February 28, 2007 | ||
Assets | ||
Investment in securities, at value (including securities loaned of $12,630,696) - See accompanying schedule: Unaffiliated issuers (cost $874,630,732) | $ 1,081,043,525 | |
Fidelity Central Funds (cost $141,850,713) | 141,850,713 | |
Other affiliated issuers (cost $190,831,778) | 253,544,677 | |
Total Investments (cost $1,207,313,223) | $ 1,476,438,915 | |
Receivable for investments sold | 16,410,389 | |
Receivable for fund shares sold | 6,177,590 | |
Dividends receivable | 593,802 | |
Distributions receivable from Fidelity Central Funds | 447,486 | |
Prepaid expenses | 6,183 | |
Other receivables | 68,504 | |
Total assets | 1,500,142,869 | |
Liabilities | ||
Payable for fund shares redeemed | $ 8,250,825 | |
Accrued management fee | 705,891 | |
Distribution fees payable | 1,403 | |
Other affiliated payables | 328,864 | |
Other payables and accrued expenses | 127,204 | |
Collateral on securities loaned, at value | 12,653,825 | |
Total liabilities | 22,068,012 | |
Net Assets | $ 1,478,074,857 | |
Net Assets consist of: | ||
Paid in capital | $ 1,198,251,552 | |
Undistributed net investment income | 9,093,033 | |
Accumulated undistributed net realized gain (loss) on investments and foreign currency transactions | 1,645,198 | |
Net unrealized appreciation (depreciation) on investments and assets and liabilities in foreign currencies | 269,085,074 | |
Net Assets | $ 1,478,074,857 | |
Statement of Assets and Liabilities - continued
February 28, 2007 | ||
Calculation of Maximum Offering Price Class A: | $ 36.53 | |
Maximum offering price per share (100/94.25 of $36.53) | $ 38.76 | |
Class T: | $ 36.49 | |
Maximum offering price per share (100/96.50 of $36.49) | $ 37.81 | |
Class B: | $ 36.46 | |
Class C: | $ 36.44 | |
Gold: | $ 36.54 | |
Institutional Class: | $ 36.54 | |
A Redemption price per share is equal to net asset value less any applicable contingent deferred sales charge.
See accompanying notes which are an integral part of the financial statements.
Annual Report
Select Gold Portfolio
Financial Statements - continued
Statement of Operations
Year ended February 28, 2007 | ||
Investment Income | ||
Dividends (including $2,210,686 earned from other affiliated issuers) | $ 10,716,485 | |
Special dividends | 3,157,383 | |
Interest | 10,770 | |
Income from Fidelity Central Funds | 8,006,715 | |
Total income | 21,891,353 | |
Expenses | ||
Management fee | $ 8,349,362 | |
Transfer agent fees | 3,783,836 | |
Distribution fees | 2,316 | |
Accounting and security lending fees | 542,179 | |
Custodian fees and expenses | 314,883 | |
Independent trustees' compensation | 5,822 | |
Registration fees | 203,492 | |
Audit | 42,802 | |
Legal | 25,393 | |
Miscellaneous | 63,112 | |
Total expenses before reductions | 13,333,197 | |
Expense reductions | (537,549) | 12,795,648 |
Net investment income (loss) | 9,095,705 | |
Realized and Unrealized Gain (Loss) Net realized gain (loss) on: | ||
Investment securities: | ||
Unaffiliated issuers | 107,844,457 | |
Other affiliated issuers | (63,460) | |
Foreign currency transactions | (538,205) | |
Total net realized gain (loss) | 107,242,792 | |
Change in net unrealized appreciation (depreciation) on: Investment securities | 60,342,102 | |
Assets and liabilities in foreign currencies | (202,987) | |
Total change in net unrealized appreciation (depreciation) | 60,139,115 | |
Net gain (loss) | 167,381,907 | |
Net increase (decrease) in net assets resulting from operations | $ 176,477,612 | |
Statement of Changes in Net Assets
Year ended | Year ended | |
Increase (Decrease) in Net Assets | ||
Operations | ||
Net investment income (loss) | $ 9,095,705 | $ 1,051,643 |
Net realized gain (loss) | 107,242,792 | 215,186,894 |
Change in net unrealized appreciation (depreciation) | 60,139,115 | 130,381,517 |
Net increase (decrease) in net assets resulting from operations | 176,477,612 | 346,620,054 |
Distributions to shareholders from net investment income | (754,152) | (507,609) |
Distributions to shareholders from net realized gain | (195,955,908) | (106,134,254) |
Total distributions | (196,710,060) | (106,641,863) |
Share transactions - net increase (decrease) | 170,798,657 | 378,795,227 |
Redemption fees | 1,843,164 | 1,675,648 |
Total increase (decrease) in net assets | 152,409,373 | 620,449,066 |
Net Assets | ||
Beginning of period | 1,325,665,484 | 705,216,418 |
End of period (including undistributed net investment income of $9,093,033 and undistributed net investment income of $1,049,798, respectively) | $ 1,478,074,857 | $ 1,325,665,484 |
See accompanying notes which are an integral part of the financial statements.
Annual Report
Financial Highlights - Class A
Year ended February 28, | 2007 I |
Selected Per-Share Data | |
Net asset value, beginning of period | $ 36.60 |
Income from Investment Operations | |
Net investment income (loss) E | (.01) |
Net realized and unrealized gain (loss) | (.07) H |
Total from investment operations | (.08) |
Redemption fees added to paid in capital E | .01 |
Net asset value, end of period | $ 36.53 |
Total Return B,C,D | (.19)% |
Ratios to Average Net Assets F,J | |
Expenses before reductions | 1.13% A |
Expenses net of fee waivers, if any | 1.13% A |
Expenses net of all reductions | 1.10% A |
Net investment income (loss) | (.18)% A |
Supplemental Data | |
Net assets, end of period (000 omitted) | $ 1,857 |
Portfolio turnover rate G | 85% |
A Annualized B Total returns for periods of less than one year are not annualized. C Total returns would have been lower had certain expenses not been reduced during the periods shown. D Total returns do not include the effect of the sales charges. E Calculated based on average shares outstanding during the period. F Fees and expenses of the underlying Fidelity Central Funds are not included in the Fund's expense ratio. The Fund indirectly bears its proportionate share of the expenses of any underlying Fidelity Central Funds. G Amount does not include the portfolio activity of any underlying Fidelity Central Funds. H The amount shown for a share outstanding does not correspond with the aggregate net gain (loss) on investments for the period due to the timing of sales and repurchases of shares in relation to fluctuating market values of the investments of the Fund. I For the period December 12, 2006 (commencement of sale of shares) to February 28, 2007. J Expense ratios reflect operating expenses of the class. Expenses before reductions do not reflect amounts reimbursed by the investment adviser or reductions from brokerage service arrangements or other expense offset arrangements and do not represent the amount paid by the class during periods when reimbursements or reductions occur. Expenses net of fee waivers reflect expenses after reimbursement by the investment adviser but prior to reductions from brokerage service arrangements or other expense offset arrangements. Expenses net of all reductions represent the net expenses paid by the class. |
Financial Highlights - Class T
Year ended February 28, | 2007 I |
Selected Per-Share Data | |
Net asset value, beginning of period | $ 36.60 |
Income from Investment Operations | |
Net investment income (loss) E | (.03) |
Net realized and unrealized gain (loss) | (.09) H |
Total from investment operations | (.12) |
Redemption fees added to paid in capital E | .01 |
Net asset value, end of period | $ 36.49 |
Total Return B,C,D | (.30)% |
Ratios to Average Net Assets F,J | |
Expenses before reductions | 1.46% A |
Expenses net of fee waivers, if any | 1.46% A |
Expenses net of all reductions | 1.43% A |
Net investment income (loss) | (.40)% A |
Supplemental Data | |
Net assets, end of period (000 omitted) | $ 1,093 |
Portfolio turnover rate G | 85% |
A Annualized B Total returns for periods of less than one year are not annualized. C Total returns would have been lower had certain expenses not been reduced during the periods shown. D Total returns do not include the effect of the sales charges. E Calculated based on average shares outstanding during the period. F Fees and expenses of the underlying Fidelity Central Funds are not included in the Fund's expense ratio. The Fund indirectly bears its proportionate share of the expenses of any underlying Fidelity Central Funds. G Amount does not include the portfolio activity of any underlying Fidelity Central Funds. H The amount shown for a share outstanding does not correspond with the aggregate net gain (loss) on investments for the period due to the timing of sales and repurchases of shares in relation to fluctuating market values of the investments of the Fund. I For the period December 12, 2006 (commencement of sale of shares) to February 28, 2007. J Expense ratios reflect operating expenses of the class. Expenses before reductions do not reflect amounts reimbursed by the investment adviser or reductions from brokerage service arrangements or other expense offset arrangements and do not represent the amount paid by the class during periods when reimbursements or reductions occur. Expenses net of fee waivers reflect expenses after reimbursement by the investment adviser but prior to reductions from brokerage service arrangements or other expense offset arrangements. Expenses net of all reductions represent the net expenses paid by the class. |
See accompanying notes which are an integral part of the financial statements.
Annual Report
Financial Highlights - Class B
Year ended February 28, | 2007 I |
Selected Per-Share Data | |
Net asset value, beginning of period | $ 36.60 |
Income from Investment Operations | |
Net investment income (loss) E | (.07) |
Net realized and unrealized gain (loss) | (.08) H |
Total from investment operations | (.15) |
Redemption fees added to paid in capital E | .01 |
Net asset value, end of period | $ 36.46 |
Total Return B,C,D | (.38)% |
Ratios to Average Net Assets F,J | |
Expenses before reductions | 1.96% A |
Expenses net of fee waivers, if any | 1.96% A |
Expenses net of all reductions | 1.93% A |
Net investment income (loss) | (.93)% A |
Supplemental Data | |
Net assets, end of period (000 omitted) | $ 902 |
Portfolio turnover rate G | 85% |
A Annualized B Total returns for periods of less than one year are not annualized. C Total returns would have been lower had certain expenses not been reduced during the periods shown. D Total returns do not include the effect of the contingent deferred sales charge. E Calculated based on average shares outstanding during the period. F Fees and expenses of the underlying Fidelity Central Funds are not included in the Fund's expense ratio. The Fund indirectly bears its proportionate share of the expenses of any underlying Fidelity Central Funds. G Amount does not include the portfolio activity of any underlying Fidelity Central Funds. H The amount shown for a share outstanding does not correspond with the aggregate net gain (loss) on investments for the period due to the timing of sales and repurchases of shares in relation to fluctuating market values of the investments of the Fund. I For the period December 12, 2006 (commencement of sale of shares) to February 28, 2007. J Expense ratios reflect operating expenses of the class. Expenses before reductions do not reflect amounts reimbursed by the investment adviser or reductions from brokerage service arrangements or other expense offset arrangements and do not represent the amount paid by the class during periods when reimbursements or reductions occur. Expenses net of fee waivers reflect expenses after reimbursement by the investment adviser but prior to reductions from brokerage service arrangements or other expense offset arrangements. Expenses net of all reductions represent the net expenses paid by the class. |
Financial Highlights - Class C
Year ended February 28, | 2007 I |
Selected Per-Share Data | |
Net asset value, beginning of period | $ 36.60 |
Income from Investment Operations | |
Net investment income (loss) E | (.07) |
Net realized and unrealized gain (loss) | (.10) H |
Total from investment operations | (.17) |
Redemption fees added to paid in capital E | .01 |
Net asset value, end of period | $ 36.44 |
Total Return B,C,D | (.44)% |
Ratios to Average Net Assets F,J | |
Expenses before reductions | 2.02% A |
Expenses net of fee waivers, if any | 2.02% A |
Expenses net of all reductions | 1.99% A |
Net investment income (loss) | (1.03)% A |
Supplemental Data | |
Net assets, end of period (000 omitted) | $ 437 |
Portfolio turnover rate G | 85% |
A Annualized B Total returns for periods of less than one year are not annualized. C Total returns would have been lower had certain expenses not been reduced during the periods shown. D Total returns do not include the effect of the contingent deferred sales charge. E Calculated based on average shares outstanding during the period. F Fees and expenses of the underlying Fidelity Central Funds are not included in the Fund's expense ratio. The Fund indirectly bears its proportionate share of the expenses of any underlying Fidelity Central Funds. G Amount does not include the portfolio activity of any underlying Fidelity Central Funds. H The amount shown for a share outstanding does not correspond with the aggregate net gain (loss) on investments for the period due to the timing of sales and repurchases of shares in relation to fluctuating market values of the investments of the Fund. I For the period December 12, 2006 (commencement of sale of shares) to February 28, 2007. J Expense ratios reflect operating expenses of the class. Expenses before reductions do not reflect amounts reimbursed by the investment adviser or reductions from brokerage service arrangements or other expense offset arrangements and do not represent the amount paid by the class during periods when reimbursements or reductions occur. Expenses net of fee waivers reflect expenses after reimbursement by the investment adviser but prior to reductions from brokerage service arrangements or other expense offset arrangements. Expenses net of all reductions represent the net expenses paid by the class. |
See accompanying notes which are an integral part of the financial statements.
Annual Report
Financial Highlights - Gold
Years ended February 28, | 2007 | 2006 | 2005 | 2004 I | 2003 |
Selected Per-Share Data | |||||
Net asset value, beginning of period | $ 35.91 | $ 27.46 | $ 27.21 | $ 22.73 | $ 18.25 |
Income from Investment Operations | |||||
Net investment income (loss) C | .22 F | .04 | .02 G | (.01) | .05 |
Net realized and unrealized gain (loss) | 5.49 | 12.21 | .18 | 5.85 | 4.67 |
Total from investment operations | 5.71 | 12.25 | .20 | 5.84 | 4.72 |
Distributions from net investment income | (.02) | (.02) | - | (1.42) | (.36) |
Distributions from net realized gain | (5.10) | (3.84) | - | - | - |
Total distributions | (5.12) | (3.86) | - | (1.42) | (.36) |
Redemption fees added to paid in capital C | .04 | .06 | .05 | .06 | .12 |
Net asset value, end of period | $ 36.54 | $ 35.91 | $ 27.46 | $ 27.21 | $ 22.73 |
Total Return A,B | 16.19% | 48.84% | .92% | 26.79% | 26.68% |
Ratios to Average Net Assets D,H | |||||
Expenses before reductions | .90% | .97% | 1.00% | 1.12% | 1.18% |
Expenses net of fee waivers, if any | .90% | .97% | 1.00% | 1.12% | 1.18% |
Expenses net of all reductions | .87% | .82% | .89% | 1.04% | 1.11% |
Net investment income (loss) | .62% F | .13% | .07% G | (.03)% | .22% |
Supplemental Data | |||||
Net assets, end of period (000 omitted) | $ 1,473,400 | $ 1,325,665 | $ 705,216 | $ 735,744 | $ 686,029 |
Portfolio turnover rate E | 85% | 108% | 79% | 41% | 44% |
A Total returns would have been lower had certain expenses not been reduced during the periods shown. B Total returns do not include the effect of the former sales charges. C Calculated based on average shares outstanding during the period. D Fees and expenses of the underlying Fidelity Central Funds are not included in the Fund's expense ratio. The Fund indirectly bears its proportionate share of the expenses of any underlying Fidelity Central Funds. E Amount does not include the portfolio activity of any underlying Fidelity Central Funds. F Investment income per share reflects a special dividend which amounted to $.08 per share. Excluding the special dividend, the ratio of net investment income (loss) to average net assets would have been .40%. G Investment income per share reflects a special dividend which amounted to $.04 per share. Excluding the special dividend, the ratio of net investment income (loss) to average net assets would have been (.08)%. H Expense ratios reflect operating expenses of the class. Expenses before reductions do not reflect amounts reimbursed by the investment adviser or reductions from brokerage service arrangements or other expense offset arrangements and do not represent the amount paid by the class during periods when reimbursements or reductions occur. Expenses net of fee waivers reflect expenses after reimbursement by the investment adviser but prior to reductions from brokerage service arrangements or other expense offset arrangements. Expenses net of all reductions represent the net expenses paid by the class. I For the year ended February 29. |
Financial Highlights - Institutional Class
Year ended February 28, | 2007 H |
Selected Per-Share Data | |
Net asset value, beginning of period | $ 36.60 |
Income from Investment Operations | |
Net investment income (loss) D | .01 |
Net realized and unrealized gain (loss) | (.08) G |
Total from investment operations | (.07) |
Redemption fees added to paid in capital D | .01 |
Net asset value, end of period | $ 36.54 |
Total Return B,C | (.16)% |
Ratios to Average Net Assets E,I | |
Expenses before reductions | .94% A |
Expenses net of fee waivers, if any | .94% A |
Expenses net of all reductions | .91% A |
Net investment income (loss) | .12% A |
Supplemental Data | |
Net assets, end of period (000 omitted) | $ 385 |
Portfolio turnover rate F | 85% |
A Annualized B Total returns for periods of less than one year are not annualized. C Total returns would have been lower had certain expenses not been reduced during the periods shown. D Calculated based on average shares outstanding during the period. E Fees and expenses of the underlying Fidelity Central Funds are not included in the Fund's expense ratio. The Fund indirectly bears its proportionate share of the expenses of any underlying Fidelity Central Funds. F Amount does not include the portfolio activity of any underlying Fidelity Central Funds. G The amount shown for a share outstanding does not correspond with the aggregate net gain (loss) on investments for the period due to the timing of sales and repurchases of shares in relation to fluctuating market values of the investments of the Fund. H For the period December 12, 2006 (commencement of sale of shares) to February 28, 2007. I Expense ratios reflect operating expenses of the class. Expenses before reductions do not reflect amounts reimbursed by the investment adviser or reductions from brokerage service arrangements or other expense offset arrangements and do not represent the amount paid by the class during periods when reimbursements or reductions occur. Expenses net of fee waivers reflect expenses after reimbursement by the investment adviser but prior to reductions from brokerage service arrangements or other expense offset arrangements. Expenses net of all reductions represent the net expenses paid by the class. |
See accompanying notes which are an integral part of the financial statements.
Annual Report
Notes to Financial Statements
For the period ended February 28, 2007
1. Organization.
Gold Portfolio (the Fund) is a non-diversified fund of Fidelity Select Portfolios (the trust) and is authorized to issue an unlimited number of shares. The trust is registered under the Investment Company Act of 1940, as amended (the 1940 Act), as an open-end management investment company organized as a Massachusetts business trust. The Fund invests primarily in securities of companies whose principal business activities fall within specific industries. The Fund offers Class A, Class T, Class B, Class C, Gold, and Institutional Class shares, each of which has equal rights as to assets and voting privileges. Each class has exclusive voting rights with respect to matters that affect that class. The Fund commenced sale of Class A, Class T, Class B, Class C and Institutional Class shares and the existing class was designated Gold on December 12, 2006. Class B shares will automatically convert to Class A shares after a holding period of seven years from the initial date of purchase. Investment income, realized and unrealized capital gains and losses, the common expenses of the Fund, and certain fund-level expense reductions, if any, are allocated on a pro rata basis to each class based on the relative net assets of each class to the total net assets of the Fund. Each class differs with respect to transfer agent and distribution and service plan fees incurred. Certain expense reductions also differ by class. The Fund may also invest in certain precious metals. The financial statements have been prepared in conformity with accounting principles generally accepted in the United States of America, which require management to make certain estimates and assumptions at the date of the financial statements.
2. Investments in Fidelity Central Funds.
The Fund may invest in Fidelity Central Funds which are open-end investment companies available only to other investment companies and accounts managed by FMR and its affiliates. The Fund's Schedule of Investments lists each of the Fidelity Central Funds as an investment of the Fund but does not include the underlying holdings of each Fidelity Central Fund. As an Investing Fund, the Fund indirectly bears its proportionate share of the expenses of the underlying Fidelity Central Funds. A complete unaudited list of holdings for each Fidelity Central Fund is available upon request. In addition, the financial statements of the Fidelity Central Funds, which are not covered by the Fund's Report of Independent Registered Public Accounting Firm, are available on the EDGAR Database on the SEC's web site, www.sec.gov, or upon request.
The Money Market Central Funds seek preservation of capital and current income and are managed by Fidelity Investments Money Management, Inc. (FIMM) an affiliate of Fidelity Management & Research Company (FMR).
3. Significant Accounting Policies.
The following summarizes the significant accounting policies of the Fund:
Security Valuation. Investments are valued and net asset value (NAV) per share is calculated (NAV calculation) as of the close of business of the New York Stock Exchange (NYSE), normally 4:00 p.m. Eastern time. During the period the Fund also calculated a NAV each hour on the hour (commencing at 10:00 a.m. Eastern time until one hour prior to the close of business on the NYSE). Effective October 1, 2006 the Fund eliminated hourly NAV calculation.
Wherever possible, the Fund uses independent pricing services approved by the Board of Trustees to value its investments. Equity securities, including restricted securities, for which market quotations are readily available, are valued at the last reported sale price or official closing price as reported by an independent pricing service on the primary market or exchange on which they are traded. In the event there were no sales during the day or closing prices are not available, securities are valued at the last quoted bid price. Investments in open-end mutual funds, including the Fidelity Central Funds, are valued at their closing net asset value each business day. Short-term securities with remaining maturities of sixty days or less for which quotations are not readily available are valued at amortized cost, which approximates value.
When current market prices or quotations are not readily available or do not accurately reflect fair value, valuations may be determined in accordance with procedures adopted by the Board of Trustees. For example, when developments occur between the close of a market and the close of the NYSE that may materially affect the value of some or all of the securities, or when trading in a security is halted, those securities may be fair valued. Factors used in the determination of fair value may include monitoring news to identify significant market or security specific events such as changes in the value of U.S. securities markets, reviewing developments in foreign markets and evaluating the performance of ADRs, futures contracts and exchange-traded funds. Because the Fund's utilization of fair value pricing depends on market activity, the frequency with which fair value pricing is used cannot be predicted and may be utilized to a significant extent. The value of securities used for NAV calculation under fair value pricing may differ from published prices for the same securities.
Foreign Currency. The Fund uses foreign currency contracts to facilitate transactions in foreign-denominated securities. Losses from these transactions may arise from changes in the value of the foreign currency or if the counterparties do not perform under the contracts' terms.
Foreign-denominated assets, including investment securities, and liabilities are translated into U.S. dollars at the exchange rate at period end. Purchases and sales of investment securities, income and dividends received and expenses denominated in foreign currencies are translated into U.S. dollars at the exchange rate in effect on the transaction date.
The effects of exchange rate fluctuations on investments are included with the net realized and unrealized gain (loss) on investment securities. Other foreign currency transactions resulting in realized and unrealized gain (loss) are disclosed separately.
Annual Report
3. Significant Accounting Policies - continued
Investment Transactions and Income. For financial reporting purposes, the Fund's investment holdings and NAV include trades executed through the end of the last business day of the period. The NAV for processing shareholder transactions includes trades executed through the end of the prior business day. Gains and losses on securities sold are determined on the basis of identified cost and may include proceeds received from litigation. Dividend income is recorded on the ex-dividend date, except for certain dividends from foreign securities where the ex-dividend date may have passed, which are recorded as soon as the Fund is informed of the ex-dividend date. Non-cash dividends included in dividend income, if any, are recorded at the fair market value of the securities received. Large, non-recurring dividends recognized by the Fund are presented separately on the Statement of Operations as "Special Dividends" and the impact of these dividends is presented in the Financial Highlights. Interest income and distributions from the Fidelity Central Funds are accrued as earned, with any distributions receivable as of period end included in Distributions receivable from Fidelity Central Funds on the Statement of Assets and Liabilities. Interest income includes coupon interest and amortization of premium and accretion of discount on debt securities. Investment income is recorded net of foreign taxes withheld where recovery of such taxes is uncertain.
Expenses. Most expenses of the trust can be directly attributed to a fund. Expenses which cannot be directly attributed are apportioned among each Fund in the trust. Expense estimates are accrued in the period to which they relate and adjustments are made when actual amounts are known.
Income Tax Information and Distributions to Shareholders. Each year, the Fund intends to qualify as a regulated investment company by distributing all of its taxable income and realized gains under Subchapter M of the Internal Revenue Code. As a result, no provision for income taxes is required in the accompanying financial statements. Foreign taxes are provided for based on the Fund's understanding of the tax rules and rates that exist in the foreign markets in which it invests.
Distributions are recorded on the ex-dividend date. Income dividends and capital gain distributions are declared separately for each class. Income and capital gain distributions are determined in accordance with income tax regulations, which may differ from generally accepted accounting principles. In addition, the Fund will claim a portion of the payment made to redeeming shareholders as a distribution for income tax purposes.
Capital accounts within the financial statements are adjusted for permanent book-tax differences. These adjustments have no impact on net assets or the results of operations. Temporary book-tax differences will reverse in a subsequent period.
Book-tax differences are primarily due to short term capital gains, foreign currency transactions, passive foreign investment companies (PFIC), deferred trustees compensation, capital loss carryforwards and losses deferred due to wash sales.
The tax-basis components of distributable earnings and the federal tax cost as of period end were as follows:
Unrealized appreciation | $ 209,837,322 |
Unrealized depreciation | (18,779,101) |
Net unrealized appreciation (depreciation) | 191,058,221 |
Undistributed ordinary income | 37,037,784 |
Undistributed long-term capital gain | 32,067,203 |
Cost for federal income tax purposes | $ 1,285,380,694 |
The tax character of distributions paid was as follows:
February 28, 2007 | February 28, 2006 | |
Ordinary Income | $ 72,402,616 | $ 8,912,605 |
Long-term Capital Gains | 124,307,444 | 97,688,205 |
Total | $ 196,710,060 | $ 106,600,810 |
Trading (Redemption) Fees. Shares in the Fund held less than 30 days are subject to a redemption fee equal to .75% of the net asset value of shares redeemed. All redemption fees, including any estimated redemption fees paid by FMR, are retained by the Fund and accounted for as an addition to paid in capital. Shareholders were also subject to an additional $7.50 fee for shares exchanged into another Fidelity fund (see Note 6).
New Accounting Pronouncements. In July 2006, Financial Accounting Standards Board Interpretation No. 48, Accounting for Uncertainty in Income Taxes - an interpretation of FASB Statement 109 (FIN 48), was issued and is effective on the last business day of the semiannual reporting period for fiscal years beginning after December 15, 2006. FIN 48 sets forth a threshold for financial statement recognition, measurement and disclosure of a tax position taken or expected to be taken on a tax return. Management is currently evaluating the impact, if any, the adoption of FIN 48 will have on the Fund's net assets, results of operations and financial statement disclosures.
In addition, in September 2006, Statement of Financial Accounting Standards No. 157, Fair Value Measurements (SFAS 157), was issued and is effective for fiscal years beginning after November 15, 2007. SFAS 157 defines fair value, establishes a framework for measuring fair value and expands disclosures about fair value measurements. Management is currently evaluating the impact the adoption of SFAS 157 will have on the Fund's financial statement disclosures.
Annual Report
Notes to Financial Statements - continued
4. Operating Policies.
Repurchase Agreements. FMR has received an Exemptive Order from the Securities and Exchange Commission (the SEC) which permits the Fund and other affiliated entities of FMR to transfer uninvested cash balances into joint trading accounts which are then invested in repurchase agreements. The Fund may also invest directly with institutions in repurchase agreements. Repurchase agreements are collateralized by government or non-government securities. Upon settlement date, collateral is held in segregated accounts with custodian banks and may be obtained in the event of a default of the counterparty. The Fund monitors, on a daily basis, the value of the collateral to ensure it is at least equal to the principal amount of the repurchase agreement (including accrued interest). In the event of a default by the counterparty, realization of the collateral proceeds could be delayed, during which time the value of the collateral may decline.
Restricted Securities. The Fund may invest in securities that are subject to legal or contractual restrictions on resale. These securities generally may be resold in transactions exempt from registration or to the public if the securities are registered. Disposal of these securities may involve time-consuming negotiations and expense, and prompt sale at an acceptable price may be difficult. Information regarding restricted securities is included at the end of the Fund's Schedule of Investments.
5. Purchases and Sales of Investments.
Purchases and sales of securities, other than short-term securities, aggregated $1,177,686,107 and $1,142,903,243, respectively.
6. Fees and Other Transactions with Affiliates.
Management Fee. FMR and its affiliates provide the Fund with investment management related services for which the Fund pays a monthly management fee. The management fee is the sum of an individual fund fee rate that is based on an annual rate of .30% of the Fund's average net assets and a group fee rate that averaged .26% during the period. The group fee rate is based upon the average net assets of all the mutual funds advised by FMR. The group fee rate decreases as assets under management increase and increases as assets under management decrease. For the period, the total annual management fee rate was .57% of the Fund's average net assets.
Distribution and Service Plan. In accordance with Rule 12b-1 of the 1940 Act, the Fund has adopted separate Distribution and Service Plans for each class of shares. Certain classes pay Fidelity Distributors Corporation (FDC), an affiliate of FMR, separate Distribution and Service Fees, each of which is based on an annual percentage of each class' average net assets. In addition, FDC may pay financial intermediaries for selling shares of the Fund and providing shareholder support services. For the period, the Distribution and Service Fee rates and the total amounts paid to and retained by FDC were as follows:
Distribution | Service | Paid to | Retained | |
Class A | -% | .25% | $ 339 | $ 59 |
Class T | .25% | .25% | 811 | 97 |
Class B | .75% | .25% | 783 | 646 |
Class C | .75% | .25% | 383 | 286 |
$ 2,316 | $ 1,088 |
Sales Load. FDC receives a front-end sales charge of up to 5.75% for selling Class A shares, and 3.50% for selling Class T shares, some of which is paid to financial intermediaries for selling shares of the Fund. FDC receives the proceeds of contingent deferred sales charges levied on Class A, Class T, Class B, and Class C redemptions. These charges depend on the holding period. The deferred sales charges range from 5% to 1% for Class B, 1% for Class C, 1.00% to .50% for certain purchases of Class A shares and .25% for certain purchases of Class T shares.
For the period, sales charge amounts retained by FDC were as follows:
Retained | |
Class A | $ 4,097 |
Class T | 551 |
$ 4,648 |
Annual Report
6. Fees and Other Transactions with Affiliates - continued
Transfer Agent Fees. Fidelity Investments Institutional Operations Company, Inc. (FIIOC), an affiliate of FMR, is the transfer, dividend disbursing and shareholder servicing agent for each class of the Fund, except for Gold. Fidelity Service Company, Inc. (FSC), an affiliate of FMR, is the transfer agent for Gold shares. FIIOC and FSC receive account fees and asset-based fees that vary according to the account size and type of account of the shareholders of the respective classes of the Fund. FIIOC and FSC pay for typesetting, printing and mailing of shareholder reports, except proxy statements. For the period, the total transfer agent fees paid by each class to FIIOC or FSC, were as follows:
Amount | % of | |
Class A | $ 163 | .13 |
Class T | 354 | .23 |
Class B | 118 | .16 |
Class C | 94 | .26 |
Gold | 3,783,019 | .26 |
Institutional Class | 88 | .25 |
$ 3,783,836 |
Accounting and Security Lending Fees. FSC maintains the Fund's accounting records. The accounting fee is based on the level of average net assets for the month. Under a separate contract, FSC administers the security lending program. The security lending fee is based on the number and duration of lending transactions.
Exchange Fees. During the period, FSC received the proceeds of a $7.50 fee to cover administrative costs associated with exchanges out of the Fund to any other Fidelity Select fund or to any other Fidelity fund made through non-automated channels. Effective October 1, 2006, the exchange fees were eliminated. For the period, exchange fees retained by FSC were as follows:
Retained | |
Gold Portfolio | $ 8,580 |
Brokerage Commissions. The Fund placed a portion of its portfolio transactions with brokerage firms which are affiliates of the investment adviser. The commissions paid to these affiliated firms were $165 for the period.
7. Committed Line of Credit.
The Fund participates with other funds managed by FMR in a $4.2 billion credit facility (the "line of credit") to be utilized for temporary or emergency purposes to fund shareholder redemptions or for other short-term liquidity purposes. The Fund has agreed to pay commitment fees on its pro rata portion of the line of credit, which amounted to $3,802 and is reflected in Miscellaneous Expense on the Statement of Operations. During the period, there were no borrowings on this line of credit.
8. Security Lending.
The Fund lends portfolio securities from time to time in order to earn additional income. On the settlement date of the loan, the Fund receives collateral (in the form of U.S. Treasury obligations, letters of credit and/or cash) against the loaned securities and maintains collateral in an amount not less than 100% of the market value of the loaned securities during the period of the loan. The market value of the loaned securities is determined at the close of business of the Fund and any additional required collateral is delivered to the Fund on the next business day. If the borrower defaults on its obligation to return the securities loaned because of insolvency or other reasons, a fund could experience delays and costs in recovering the securities loaned or in gaining access to the collateral. Any cash collateral received is invested in the Fidelity Securities Lending Cash Central Fund. The value of loaned securities and cash collateral at period end are disclosed on the Fund's Statement of Assets and Liabilities. Security lending income represents the income earned on investing cash collateral, less fees and expenses associated with the loan, plus any premium payments that may be received on the loan of certain types of securities. Security lending income is presented in the Statement of Operations as a component of income from Fidelity Central Funds. Net income from lending portfolio securities during the period amounted to $679,059.
Annual Report
Notes to Financial Statements - continued
9. Expense Reductions.
FMR voluntarily agreed to reimburse a portion of Gold's operating expenses. During the period, this reimbursement reduced the class' expenses by $57,675.
Many of the brokers with whom FMR places trades on behalf of the Fund provided services to the Fund in addition to trade execution. These services included payments of certain expenses on behalf of the Fund totaling $419,936 for the period. In addition, through arrangements with the Fund's custodian and each class' transfer agent, credits realized as a result of uninvested cash balances were used to reduce the Fund's expenses. During the period, these credits reduced the Fund's custody expenses by $18,002. During the period, credits reduced each class' transfer agent expense as noted in the table below.
Transfer Agent | |
Gold | $ 21,672 |
10. Other.
The Fund's organizational documents provide former and current trustees and officers with a limited indemnification against liabilities arising in connection with the performance of their duties to the Fund. In the normal course of business, the Fund may also enter into contracts that provide general indemnifications. The Fund's maximum exposure under these arrangements is unknown as this would be dependent on future claims that may be made against the Fund. The risk of material loss from such claims is considered remote.
The United States Securities and Exchange Commission ("SEC") is conducting an investigation of FMR (covering the years 2002 to 2004) arising from gifts, gratuities and business entertainment provided by certain brokers to certain individuals who were employed on FMR's domestic equity trading desk during that period. FMR is in discussions with the SEC staff regarding the possible resolution of the matter, but as of period-end no final resolution has been reached.
In December 2006, the Independent Trustees completed their own investigation of the matter with the assistance of independent counsel. The Independent Trustees and FMR agree that, despite the absence of proof that the Fidelity mutual funds experienced diminished execution quality as a result of the improper receipt of gifts and business entertainment, the conduct at issue was serious and is worthy of redress. Accordingly, the Independent Trustees have requested and FMR has agreed to pay $42 million to Fidelity mutual funds, plus interest to be determined at the time that payment is made. A method of allocating this payment among the funds has not yet been determined. The total payment to the Fund is not anticipated to have a material impact on the Fund's net assets. In addition, FMR reimbursed related legal expenses which are recorded in the accompanying Statement of Operations as an expense reduction.
11. Distributions to Shareholders.
Distributions to shareholders of each class were as follows:
Years ended February 28, | 2007 | 2006 |
From net investment income | ||
Gold | $ 754,152 | $ 507,609 |
From net realized gain | ||
Gold | $ 195,955,908 | $ 106,134,254 |
Annual Report
12. Share Transactions.
Transactions for each class of shares were as follows:
Shares | Dollars | |||
Years ended February 28, | 2007A | 2006 | 2007A | 2006 |
Class A | ||||
Shares sold | 52,274 | - | $ 1,914,223 | $ - |
Shares redeemed | (1,428) | - | (52,108) | - |
Net increase (decrease) | 50,846 | - | $ 1,862,115 | $ - |
Class T | ||||
Shares sold | 29,954 | - | $ 1,097,866 | $ - |
Shares redeemed | - | - | - | - |
Net increase (decrease) | 29,954 | - | $ 1,097,866 | $ - |
Class B | ||||
Shares sold | 24,802 | - | $ 903,324 | $ - |
Shares redeemed | (60) | - | (2,269) | - |
Net increase (decrease) | 24,742 | - | $ 901,055 | - |
Class C | ||||
Shares sold | 12,002 | - | $ 438,523 | $ - |
Shares redeemed | - | - | - | - |
Net increase (decrease) | 12,002 | - | $ 438,523 | - |
Gold | ||||
Shares sold | 37,990,378 | 35,716,956 | $ 1,364,967,296 | $ 1,098,070,139 |
Reinvestment of distributions | 5,102,742 | 3,522,978 | 188,386,905 | 102,614,627 |
Shares redeemed | (39,683,634) | (28,011,502) | (1,387,242,690) | (821,889,539) |
Net increase (decrease) | 3,409,486 | 11,228,432 | $ 166,111,511 | $ 378,795,227 |
Institutional Class | ||||
Shares sold | 11,934 | - | $ 438,322 | $ - |
Shares redeemed | (1,395) | - | (50,735) | - |
Net increase (decrease) | 10,539 | - | $ 387,587 | - |
A Share transactions for Class A, Class T, Class B, Class C and Institutional Class are for the period December 12, 2006 (commencement of sale of shares) to February 28, 2007.
Annual Report
Fidelity Advisor Materials Fund - Institutional Class
Performance
Average annual total return reflects the change in the value of an investment, assuming reinvestment of the class' dividend income and capital gains (the profits earned upon the sale of securities that have grown in value) and assuming a constant rate of performance each year. The $10,000 table and the fund's returns do not reflect the deduction of taxes that a shareholder would pay on fund distributions or the redemption of fund shares. During periods of reimbursement by Fidelity, a fund's total return will be greater than it would be had the reimbursement not occurred. How a fund did yesterday is no guarantee of how it will do tomorrow.
Average Annual Total Returns
Periods ended February 28, 2007 | Past 1 | Past 5 | Past 10 |
Institutional Class A | 22.27% | 18.78% | 10.24% |
A The initial offering of Institutional Class A shares took place on December 12, 2006. Returns prior to December 12, 2006 are those of Materials, the original class of the fund.
Prior to October 1, 2006, Select Materials Portfolio was named Select Industrial Materials Portfolio and operated under certain different investment policies. Effective October 1, 2006, shareholders of Select Materials Portfolio approved broadening the fund's focus beyond materials used in the industrial sector so that it now invests in companies engaged in the manufacture, mining, processing or distribution of raw materials and intermediate goods of all types, including industrial or agricultural materials and unfinished goods, such as chemicals, gases, metals or other natural or synthetic materials. The historical performance of the fund may not represent its current investment policies.
$10,000 Over 10 Years
Let's say hypothetically that $10,000 was invested in Fidelity Advisor Materials Fund - Institutional Class (dagger) on February 28, 1997. The chart shows how the value of your investment would have changed, and also shows how the Standard & Poor's 500 Index performed over the same period.
* The initial offering of Institutional Class A shares took place on December 12, 2006. Returns prior to December 12, 2006 are those of Materials, the original class of the fund.
Annual Report
Fidelity Advisor Materials Fund - Institutional Class
Management's Discussion of Fund Performance
Comments from Jody Simes, Portfolio Manager of Fidelity Advisor Materials Fund during the period covered by this report
A rosy year for stocks wilted just prior to the end of the 12-month period ending February 28, 2007. On the day prior to the period's close, the Dow Jones Industrial AverageSM plunged 416 points and the Standard & Poor's 500SM Index lost roughly 3.5% of its value, plummeting nearly 50 points and marking the benchmark's worst single-day performance since the day the market reopened after the 9/11 terrorist attacks. Though investors were obviously rattled by the development, it was only the 22nd-biggest decline for the S&P 500® in 20 years, and it could not overshadow how well stocks performed for the 12 months overall. For much of the past year, investors grew confident that the economy would not fall into a recession, and they bid up most broad-based stock indexes for six consecutive months from August through January. Overall for the year ending February 28, 2007, the S&P 500 was up 11.97%, the Dow advanced 14.24%, the small-cap Russell 2000® Index gained 9.87% and the NASDAQ Composite® Index rose 6.66%.
It's important to point out that in connection with a restructuring of the product line effective October 1, 2006, the fund changed the benchmark to which it compares its performance. For the 12 months ending February 28, 2007, the fund underperformed the 23.99% gain of the Morgan Stanley Capital InternationalSM (MSCI®) US Investable Market Materials Index and the 23.58% advance of a blended index specific to this fund. This blended index is a combination of the Goldman Sachs Cyclical Industries Index, which the fund was compared with through September, and the new MSCI benchmark mentioned above, which the fund was compared with during the period's final five months1. During the same 12-month period, the fund beat the S&P 500. The new supplemental benchmark reflects a broadening of the fund's focus beyond materials used in the industrials sector. As such, the fund experienced some shifts in its industry weightings. (For specific performance information on the fund's Institutional Class shares, please refer to the performance section of this report.) The main factor behind the fund's modest outperformance of the Goldman Sachs index during the first seven months was strong security selection in diversified metals and mining, a group that is not part of the index. Not owning homebuilding stocks also helped, as this area of the index declined. Overweighting coal and consumable fuels dampened the fund's return, although that loss was partially offset by good security selection there. Not owning aerospace and defense, a strong performing part of the index during the seven-month period, hurt as well. Top contributors included our out-of-benchmark positions in three Canadian metals and mining stocks: Falconbridge, Inco and Skye Resources. The two main detractors also were not found in the index: coal company Peabody Energy and aluminum producer Alcan. During the last five months of the period, the fund underperformed its new MSCI index due to unsuccessful security selection in diversified metals and mining and the fund's modest average cash position, which dampened its return in a strong market. Positive stock selection in and an underweighting of specialty chemicals buoyed the fund's return, as did good security selection in and an overweighting of construction materials. Detractors included out-of-benchmark holdings in Skye Resources, Canadian metals and mining company Birch Mountain Resources and uranium producer Cameco. Top contributions came from Canadian construction materials firm Polaris Minerals - not part of the benchmark - as well as overweighting specialty chemical manufacturer Albemarle. Some stocks mentioned here were not held at period end.
1 The fund's blended index is a customized index developed by Fidelity for the limited purpose of discussing the fund's performance for the 12-month period ending February 28, 2007. From March 1, 2006, through September 30, 2006, the fund compared its performance to the Goldman Sachs Cyclical Industries Index, which returned 1.77% during that period. On October 1, 2006, the fund began comparing its performance to a different index, the MSCI US Investable Market Materials Index, which returned 21.43% from October 1, 2006, through February 28, 2007. For the 12-month period ending February 28, 2007, the blended index (Goldman Sachs and MSCI) returned 23.58%.
Note to shareholders: Duffy Fischer will become manager of the fund on April 2, 2007.
The views expressed above reflect those of the portfolio manager(s) only through the end of the period as stated on the cover of this report and do not necessarily represent the views of Fidelity or any other person in the Fidelity organization. Any such views are subject to change at any time based upon market or other conditions and Fidelity disclaims any responsibility to update such views. These views may not be relied on as investment advice and, because investment decisions for a Fidelity fund are based on numerous factors, may not be relied on as an indication of trading intent on behalf of any Fidelity fund.
Annual Report
Shareholder Expense Example
As a shareholder of the Fund, you incur two types of costs: (1) transaction costs, including sales charges (loads) on purchase payments or redemption proceeds, redemption fees, exchange fees, and (2) ongoing costs, including management fees, distribution and/or service (12b-1) fees and other Fund expenses. This Example is intended to help you understand your ongoing costs (in dollars) of investing in the Fund and to compare these costs with the ongoing costs of investing in other mutual funds.
The actual Example is based on an investment of $1,000 at the beginning of the period and held for the entire period (September 1, 2006 to February 28, 2007) for the Materials class and for the entire period (December 12, 2006 to February 28, 2007) for Class A, Class T, Class B, Class C and Institutional Class. The hypothetical expense Example is based on an investment of $1,000 invested for the one-half year period (September 1, 2006 to February 28, 2007).
Actual Expenses
The first line of the accompanying table for each class of the Fund provides information about actual account values and actual expenses. You may use the information in this line, together with the amount you invested, to estimate the expenses that you paid over the period. Simply divide your account value by $1,000.00 (for example, an $8,600 account value divided by $1,000.00 = 8.6), then multiply the result by the number in the first line for a class of the Fund under the heading entitled "Expenses Paid During Period" to estimate the expenses you paid on your account during this period. A small balance maintenance fee of $12.00 that is charged once a year may apply for certain accounts with a value of less than $2,000. This fee is not included in the table below. If it was, the estimate of expenses you paid during the period would be higher, and your ending account value lower, by this amount.
Hypothetical Example for Comparison Purposes
The second line of the accompanying table for each class of the Fund provides information about hypothetical account values and hypothetical expenses based on a Class' actual expense ratio and an assumed rate of return of 5% per year before expenses, which is not the Class' actual return. The hypothetical account values and expenses may not be used to estimate the actual ending account balance or expenses you paid for the period. You may use this information to compare the ongoing costs of investing in the Fund and other funds. To do so, compare this 5% hypothetical example with the 5% hypothetical examples that appear in the shareholder reports of the other funds. A small balance maintenance fee of $12.00 that is charged once a year may apply for certain accounts with a value of less than $2,000. This fee is not included in the table below. If it was, the estimate of expenses you paid during the period would be higher, and your ending account value lower, by this amount.
Please note that the expenses shown in the table are meant to highlight your ongoing costs only and do not reflect any transaction costs. Therefore, the second line of the table is useful in comparing ongoing costs only, and will not help you determine the relative total costs of owning different funds. In addition, if these transactional costs were included, your costs would have been higher.
Beginning | Ending | Expenses | |
Class A | |||
Actual | $ 1,000.00 | $ 1,087.60 | $ 3.16 B |
HypotheticalA | $ 1,000.00 | $ 1,017.85 | $ 7.00 C |
Class T | |||
Actual | $ 1,000.00 | $ 1,085.10 | $ 3.72 B |
HypotheticalA | $ 1,000.00 | $ 1,016.61 | $ 8.25 C |
Class B | |||
Actual | $ 1,000.00 | $ 1,083.40 | $ 4.85 B |
HypotheticalA | $ 1,000.00 | $ 1,014.13 | $ 10.74 C |
Class C | |||
Actual | $ 1,000.00 | $ 1,083.40 | $ 4.85 B |
HypotheticalA | $ 1,000.00 | $ 1,014.13 | $ 10.74 C |
Materials | |||
Actual | $ 1,000.00 | $ 1,181.30 | $ 5.08 B |
HypotheticalA | $ 1,000.00 | $ 1,020.13 | $ 4.71 C |
Institutional Class | |||
Actual | $ 1,000.00 | $ 1,085.50 | $ 2.39 B |
HypotheticalA | $ 1,000.00 | $ 1,019.54 | $ 5.31 C |
A 5% return per year before expenses
B Actual expenses are equal to each Class' annualized expense ratio (shown in the table below); multiplied by the average account value over the period, multiplied by 181/365 (to reflect the one-half year period) for the Materials class and multiplied by 79/365 (to reflect the period December 12, 2006 to February 28, 2007) for Class A, Class T, Class B, Class C and Institutional Class.
C Hypothetical expenses are equal to each Class' annualized expense ratio (shown in the table below); multiplied by the average account value over the period, multiplied by 181/365 (to reflect the one-half year period).
Annual Report
Annualized | |
Class A | 1.40% |
Class T | 1.65% |
Class B | 2.15% |
Class C | 2.15% |
Materials | .94% |
Institutional Class | 1.06% |
Annual Report
Investment Changes
Top Ten Stocks as of February 28, 2007 | ||
% of fund's | % of fund's net assets | |
E.I. du Pont de Nemours & Co. | 8.2 | 5.2 |
Monsanto Co. | 5.7 | 0.0 |
Dow Chemical Co. | 5.1 | 5.4 |
Alcoa, Inc. | 4.4 | 4.8 |
Phelps Dodge Corp. | 4.2 | 2.5 |
Praxair, Inc. | 3.9 | 3.1 |
Weyerhaeuser Co. | 3.8 | 0.0 |
Air Products & Chemicals, Inc. | 3.4 | 2.6 |
Nucor Corp. | 3.0 | 2.1 |
United States Steel Corp. | 3.0 | 3.1 |
44.7 | ||
Top Industries (% of fund's net assets) | |||
As of February 28, 2007 | |||
| Chemicals | 43.5% | |
| Metals & Mining | 29.6% | |
| Paper & Forest Products | 7.5% | |
| Construction Materials | 5.9% | |
| Containers & Packaging | 5.7% | |
| All Others * | 7.8% | |
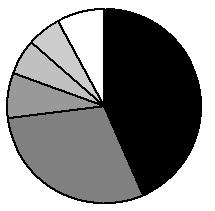
As of August 31, 2006 | |||
| Metals & Mining | 34.7% | |
| Chemicals | 21.9% | |
| Road & Rail | 15.2% | |
| Oil, Gas & Consumable Fuels | 11.4% | |
| Construction Materials | 4.5% | |
| All Others * | 12.3% | |
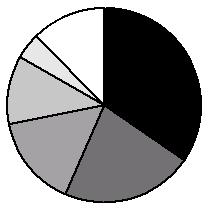
* Includes short-term investments and net other assets. |
Annual Report
Investments February 28, 2007
Showing Percentage of Net Assets
Common Stocks - 94.4% | |||
Shares | Value | ||
CHEMICALS - 43.5% | |||
Commodity Chemicals - 1.6% | |||
Lyondell Chemical Co. | 116,800 | $ 3,721,248 | |
Diversified Chemicals - 15.9% | |||
Dow Chemical Co. | 272,100 | 11,917,980 | |
E.I. du Pont de Nemours & Co. | 374,100 | 18,985,575 | |
PPG Industries, Inc. | 92,700 | 6,141,375 | |
37,044,930 | |||
Fertilizers & Agricultural Chemicals - 9.1% | |||
Agrium, Inc. | 66,500 | 2,552,422 | |
CF Industries Holdings, Inc. | 16,100 | 622,426 | |
Monsanto Co. | 254,400 | 13,404,336 | |
Potash Corp. of Saskatchewan, Inc. | 9,800 | 1,546,538 | |
The Mosaic Co. | 96,600 | 2,457,504 | |
The Scotts Miracle-Gro Co. Class A | 16,800 | 741,048 | |
21,324,274 | |||
Industrial Gases - 8.0% | |||
Air Products & Chemicals, Inc. | 104,300 | 7,803,726 | |
Airgas, Inc. | 41,400 | 1,708,578 | |
Praxair, Inc. | 147,200 | 9,080,768 | |
18,593,072 | |||
Specialty Chemicals - 8.9% | |||
Albemarle Corp. | 48,000 | 3,928,800 | |
Chemtura Corp. | 88,900 | 1,020,572 | |
Cytec Industries, Inc. | 28,100 | 1,652,842 | |
Minerals Technologies, Inc. | 14,000 | 866,460 | |
Nalco Holding Co. | 187,900 | 4,490,810 | |
Rohm & Haas Co. | 125,400 | 6,628,644 | |
Sigma Aldrich Corp. | 52,500 | 2,152,500 | |
20,740,628 | |||
TOTAL CHEMICALS | 101,424,152 | ||
CONSTRUCTION MATERIALS - 5.9% | |||
Construction Materials - 5.9% | |||
Martin Marietta Materials, Inc. | 22,200 | 2,782,104 | |
Polaris Minerals Corp. | 89,500 | 701,736 | |
Polaris Minerals Corp. (e) | 760,000 | 5,958,873 | |
Vulcan Materials Co. | 37,900 | 4,414,971 | |
13,857,684 | |||
CONTAINERS & PACKAGING - 5.7% | |||
Metal & Glass Containers - 3.3% | |||
Ball Corp. | 37,800 | 1,750,140 | |
Crown Holdings, Inc. (a) | 66,100 | 1,509,724 | |
Owens-Illinois, Inc. | 63,300 | 1,504,008 | |
Pactiv Corp. (a) | 64,000 | 2,060,800 | |
Silgan Holdings, Inc. | 14,400 | 708,624 | |
7,533,296 | |||
Shares | Value | ||
Paper Packaging - 2.4% | |||
Packaging Corp. of America | 177,900 | $ 4,358,550 | |
Smurfit-Stone Container Corp. | 104,100 | 1,284,594 | |
5,643,144 | |||
TOTAL CONTAINERS & PACKAGING | 13,176,440 | ||
MACHINERY - 0.6% | |||
Construction & Farm Machinery & Heavy Trucks - 0.6% | |||
Deere & Co. | 13,600 | 1,474,512 | |
METALS & MINING - 29.6% | |||
Aluminum - 4.4% | |||
Alcoa, Inc. | 306,600 | 10,243,506 | |
Diversified Metals & Mining - 9.0% | |||
BHP Billiton Ltd. sponsored ADR | 73,200 | 3,149,064 | |
Coalcorp Mining, Inc. (a) | 7,470,000 | 4,023,855 | |
Coalcorp Mining, Inc. warrants 2/8/11 (a) | 89,000 | 17,502 | |
Phelps Dodge Corp. | 78,400 | 9,792,944 | |
Rio Tinto PLC sponsored ADR | 14,800 | 3,206,568 | |
Skye Resources, Inc. (a) | 74,100 | 753,957 | |
20,943,890 | |||
Gold - 4.2% | |||
Agnico-Eagle Mines Ltd. | 54,000 | 2,125,741 | |
Goldcorp, Inc. | 167,700 | 4,499,531 | |
Meridian Gold, Inc. (a) | 112,300 | 3,080,316 | |
9,705,588 | |||
Precious Metals & Minerals - 0.1% | |||
Apex Silver Mines Ltd. (a) | 18,100 | 258,468 | |
Steel - 11.9% | |||
A.M. Castle & Co. | 36,500 | 1,051,200 | |
Allegheny Technologies, Inc. | 45,400 | 4,651,230 | |
Carpenter Technology Corp. | 16,000 | 1,896,800 | |
Chaparral Steel Co. | 84,800 | 4,225,584 | |
Companhia Vale do Rio Doce sponsored ADR | 59,000 | 2,013,080 | |
Nucor Corp. | 115,400 | 7,024,398 | |
United States Steel Corp. | 78,500 | 6,956,670 | |
27,818,962 | |||
TOTAL METALS & MINING | 68,970,414 | ||
OIL, GAS & CONSUMABLE FUELS - 1.6% | |||
Coal & Consumable Fuels - 1.6% | |||
Cameco Corp. | 98,300 | 3,635,137 | |
PAPER & FOREST PRODUCTS - 7.5% | |||
Forest Products - 3.8% | |||
Weyerhaeuser Co. (d) | 104,200 | 8,947,654 | |
Paper Products - 3.7% | |||
Bowater, Inc. | 27,400 | 662,532 | |
Common Stocks - continued | |||
Shares | Value | ||
PAPER & FOREST PRODUCTS - CONTINUED | |||
Paper Products - continued | |||
International Paper Co. | 168,700 | $ 6,074,887 | |
MeadWestvaco Corp. | 62,000 | 1,887,900 | |
8,625,319 | |||
TOTAL PAPER & FOREST PRODUCTS | 17,572,973 | ||
TOTAL COMMON STOCKS (Cost $189,632,363) | 220,111,312 | ||
Money Market Funds - 8.7% | |||
Fidelity Cash Central Fund, 5.35% (b) | 11,345,736 | 11,345,736 | |
Fidelity Securities Lending Cash Central Fund, 5.34% (b)(c) | 8,996,000 | 8,996,000 | |
TOTAL MONEY MARKET FUNDS (Cost $20,341,736) | 20,341,736 | ||
TOTAL INVESTMENT PORTFOLIO - 103.1% (Cost $209,974,099) | 240,453,048 | ||
NET OTHER ASSETS - (3.1)% | (7,253,808) | ||
NET ASSETS - 100% | $ 233,199,240 | ||
Legend |
(a) Non-income producing |
(b) Affiliated fund that is available only to investment companies and other accounts managed by Fidelity Investments. The rate quoted is the annualized seven-day yield of the fund at period end. A complete unaudited listing of the fund's holdings as of its most recent quarter end is available upon request. |
(c) Investment made with cash collateral received from securities on loan. |
(d) Security or a portion of the security is on loan at period end. |
(e) Security exempt from registration under Rule 144A of the Securities Act of 1933. These securities may be resold in transactions exempt from registration, normally to qualified institutional buyers. At the end of the period, the value of these securities amounted to $5,958,873 or 2.6% of net assets. |
Affiliated Central Funds |
Information regarding fiscal year to date income earned by the Fund from investments in Fidelity Central Funds is as follows: |
Fund | Income earned |
Fidelity Cash Central Fund | $ 479,587 |
Fidelity Securities Lending Cash Central Fund | 41,460 |
Total | $ 521,047 |
Other Information |
Distribution of investments by country of issue, as a percentage of total net assets, is as follows: |
United States of America | 83.8% |
Canada | 12.4% |
United Kingdom | 1.4% |
Australia | 1.4% |
Others (individually less than 1%) | 1.0% |
100.0% |
See accompanying notes which are an integral part of the financial statements.
Annual Report
Financial Statements
Statement of Assets and Liabilities
February 28, 2007 | ||
Assets | ||
Investment in securities, at value (including securities loaned of $8,934,640) - See accompanying schedule: Unaffiliated issuers (cost $189,632,363) | $ 220,111,312 | |
Fidelity Central Funds (cost $20,341,736) | 20,341,736 | |
Total Investments (cost $209,974,099) | $ 240,453,048 | |
Receivable for fund shares sold | 11,633,830 | |
Dividends receivable | 466,522 | |
Distributions receivable from Fidelity Central Funds | 52,504 | |
Prepaid expenses | 977 | |
Receivable from investment adviser for expense reductions | 253 | |
Other receivables | 7,378 | |
Total assets | 252,614,512 | |
Liabilities | ||
Payable for investments purchased | $ 9,034,723 | |
Payable for fund shares redeemed | 1,207,549 | |
Accrued management fee | 89,327 | |
Distribution fees payable | 867 | |
Other affiliated payables | 46,122 | |
Other payables and accrued expenses | 40,684 | |
Collateral on securities loaned, at value | 8,996,000 | |
Total liabilities | 19,415,272 | |
Net Assets | $ 233,199,240 | |
Net Assets consist of: | ||
Paid in capital | $ 195,867,931 | |
Undistributed net investment income | 276,784 | |
Accumulated undistributed net realized gain (loss) on investments and foreign currency transactions | 6,575,289 | |
Net unrealized appreciation (depreciation) on investments and assets and liabilities in foreign currencies | 30,479,236 | |
Net Assets | $ 233,199,240 | |
Statement of Assets and Liabilities - continued
February 28, 2007 | ||
Calculation of Maximum Offering Price Class A: | $ 51.01 | |
Maximum offering price per share (100/94.25 of $51.01) | $ 54.12 | |
Class T: | $ 50.89 | |
Maximum offering price per share (100/96.50 of $50.88) | $ 52.74 | |
Class B: | $ 50.81 | |
Class C: | $ 50.81 | |
Materials: | $ 50.92 | |
Institutional Class: | $ 50.91 | |
A Redemption price per share is equal to net asset value less any applicable contingent deferred sales charge.
See accompanying notes which are an integral part of the financial statements.
Annual Report
Select Materials Portfolio
Financial Statements - continued
Statement of Operations
Year ended February 28, 2007 | ||
Investment Income | ||
Dividends | $ 3,072,290 | |
Interest | 1,871 | |
Income from Fidelity Central Funds | 521,047 | |
Total income | 3,595,208 | |
Expenses | ||
Management fee | $ 1,110,432 | |
Transfer agent fees | 582,866 | |
Distribution fees | 1,383 | |
Accounting and security lending fees | 91,132 | |
Custodian fees and expenses | 24,762 | |
Independent trustees' compensation | 702 | |
Registration fees | 126,372 | |
Audit | 37,168 | |
Legal | 3,517 | |
Interest | 2,189 | |
Miscellaneous | 12,463 | |
Total expenses before reductions | 1,992,986 | |
Expense reductions | (107,567) | 1,885,419 |
Net investment income (loss) | 1,709,789 | |
Realized and Unrealized Gain (Loss) Net realized gain (loss) on: | ||
Investment securities: | ||
Unaffiliated issuers | 18,867,914 | |
Foreign currency transactions | (725) | |
Total net realized gain (loss) | 18,867,189 | |
Change in net unrealized appreciation (depreciation) on: Investment securities | 2,128,190 | |
Assets and liabilities in foreign currencies | (123) | |
Total change in net unrealized appreciation (depreciation) | 2,128,067 | |
Net gain (loss) | 20,995,256 | |
Net increase (decrease) in net assets resulting from operations | $ 22,705,045 | |
Statement of Changes in Net Assets
Year ended | Year ended | |
Increase (Decrease) in Net Assets | ||
Operations | ||
Net investment income (loss) | $ 1,709,789 | $ 1,058,337 |
Net realized gain (loss) | 18,867,189 | 8,503,088 |
Change in net unrealized appreciation (depreciation) | 2,128,067 | 6,934,391 |
Net increase (decrease) in net assets resulting from operations | 22,705,045 | 16,495,816 |
Distributions to shareholders from net investment income | (1,721,356) | (770,963) |
Distributions to shareholders from net realized gain | (17,315,347) | (3,187,200) |
Total distributions | (19,036,703) | (3,958,163) |
Share transactions - net increase (decrease) | 59,771,650 | 12,434,145 |
Redemption fees | 236,747 | 108,867 |
Total increase (decrease) in net assets | 63,676,739 | 25,080,665 |
Net Assets | ||
Beginning of period | 169,522,501 | 144,441,836 |
End of period (including undistributed net investment income of $276,784 and undistributed net investment income of $394,580, respectively) | $ 233,199,240 | $ 169,522,501 |
See accompanying notes which are an integral part of the financial statements.
Annual Report
Financial Highlights - Class A
Year ended February 28, | 2007 H |
Selected Per-Share Data | |
Net asset value, beginning of period | $ 46.90 |
Income from Investment Operations | |
Net investment income (loss) E | .17 |
Net realized and unrealized gain (loss) | 3.93 |
Total from investment operations | 4.10 |
Redemption fees added to paid in capital E | .01 |
Net asset value, end of period | $ 51.01 |
Total Return B, C, D | 8.76% |
Ratios to Average Net Assets F, I | |
Expenses before reductions | 1.50% A |
Expenses net of fee waivers, if any | 1.40% A |
Expenses net of all reductions | 1.38% A |
Net investment income (loss) | 1.76% A |
Supplemental Data | |
Net assets, end of period (000 omitted) | $ 1,018 |
Portfolio turnover rate G | 185% |
A Annualized B Total returns for periods of less than one year are not annualized. C Total returns would have been lower had certain expenses not been reduced during the periods shown. D Total returns do not include the effect of the sales charges. E Calculated based on average shares outstanding during the period. F Fees and expenses of the underlying Fidelity Central Funds are not included in the Fund's expense ratio. The Fund indirectly bears its proportionate share of the expenses of any underlying Fidelity Central Funds. G Amount does not include the portfolio activity of any underlying Fidelity Central Funds. H For the period December 12, 2006 (commencement of sale of shares) to February 28, 2007. |
Financial Highlights - Class T
Year ended February 28, | 2007 H |
Selected Per-Share Data | |
Net asset value, beginning of period | $ 46.90 |
Income from Investment Operations | |
Net investment income (loss) E | .11 |
Net realized and unrealized gain (loss) | 3.87 |
Total from investment operations | 3.98 |
Redemption fees added to paid in capital E | .01 |
Net asset value, end of period | $ 50.89 |
Total Return B, C, D | 8.51% |
Ratios to Average Net Assets F, I | |
Expenses before reductions | 1.80% A |
Expenses net of fee waivers, if any | 1.65% A |
Expenses net of all reductions | 1.62% A |
Net investment income (loss) | 1.18% A |
Supplemental Data | |
Net assets, end of period (000 omitted) | $ 707 |
Portfolio turnover rate G | 185% |
A Annualized B Total returns for periods of less than one year are not annualized. C Total returns would have been lower had certain expenses not been reduced during the periods shown. D Total returns do not include the effect of the sales charges. E Calculated based on average shares outstanding during the period. F Fees and expenses of the underlying Fidelity Central Funds are not included in the Fund's expense ratio. The Fund indirectly bears its proportionate share of the expenses of any underlying Fidelity Central Funds. G Amount does not include the portfolio activity of any underlying Fidelity Central Funds. H For the period December 12, 2006 (commencement of sale of shares) to February 28, 2007. I Expense ratios reflect operating expenses of the class. Expenses before reductions do not reflect amounts reimbursed by the investment adviser or reductions from brokerage service arrangements or other expense offset arrangements and do not represent the amount paid by the class during periods when reimbursements or reductions occur. Expenses net of fee waivers reflect expenses after reimbursement by the investment adviser but prior to reductions from brokerage service arrangements or other expense offset arrangements. Expenses net of all reductions represent the net expenses paid by the class. |
See accompanying notes which are an integral part of the financial statements.
Annual Report
Financial Highlights - Class B
Year ended February 28, | 2007 H |
Selected Per-Share Data | |
Net asset value, beginning of period | $ 46.90 |
Income from Investment Operations | |
Net investment income (loss) E | .06 |
Net realized and unrealized gain (loss) | 3.84 |
Total from investment operations | 3.90 |
Redemption fees added to paid in capital E | .01 |
Net asset value, end of period | $ 50.81 |
Total Return B, C, D | 8.34% |
Ratios to Average Net Assets F, I | |
Expenses before reductions | 2.26% A |
Expenses net of fee waivers, if any | 2.15% A |
Expenses net of all reductions | 2.12% A |
Net investment income (loss) | .60% A |
Supplemental Data | |
Net assets, end of period (000 omitted) | $ 662 |
Portfolio turnover rate G | 185% |
A Annualized B Total returns for periods of less than one year are not annualized. C Total returns would have been lower had certain expenses not been reduced during the periods shown. D Total returns do not include the effect of the contingent deferred sales charge. E Calculated based on average shares outstanding during the period. F Fees and expenses of the underlying Fidelity Central Funds are not included in the Fund's expense ratio. The Fund indirectly bears its proportionate share of the expenses of any underlying Fidelity Central Funds. G Amount does not include the portfolio activity of any underlying Fidelity Central Funds. H For the period December 12, 2006 (commencement of sale of shares) to February 28, 2007. |
Financial Highlights - Class C
Year ended February 28, | 2007 H |
Selected Per-Share Data | |
Net asset value, beginning of period | $ 46.90 |
Income from Investment Operations | |
Net investment income (loss) E | .09 |
Net realized and unrealized gain (loss) | 3.81 |
Total from investment operations | 3.90 |
Redemption fees added to paid in capital E | .01 |
Net asset value, end of period | $ 50.81 |
Total Return B, C, D | 8.34% |
Ratios to Average Net Assets F, I | |
Expenses before reductions | 2.31% A |
Expenses net of fee waivers, if any | 2.15% A |
Expenses net of all reductions | 2.13% A |
Net investment income (loss) | .89% A |
Supplemental Data | |
Net assets, end of period (000 omitted) | $ 547 |
Portfolio turnover rate G | 185% |
A Annualized B Total returns for periods of less than one year are not annualized. C Total returns would have been lower had certain expenses not been reduced during the periods shown. D Total returns do not include the effect of the contingent deferred sales charge. E Calculated based on average shares outstanding during the period. F Fees and expenses of the underlying Fidelity Central Funds are not included in the Fund's expense ratio. The Fund indirectly bears its proportionate share of the expenses of any underlying Fidelity Central Funds. G Amount does not include the portfolio activity of any underlying Fidelity Central Funds. H For the period December 12, 2006 (commencement of sale of shares) to February 28, 2007. |
See accompanying notes which are an integral part of the financial statements.
Annual Report
Financial Highlights - Materials
Years ended February 28, | 2007 | 2006 | 2005 | 2004 H | 2003 |
Selected Per-Share Data | |||||
Net asset value, beginning of period | $ 46.35 | $ 40.78 | $ 35.99 | $ 23.83 | $ 25.89 |
Income from Investment Operations | |||||
Net investment income (loss) C | .42 | .32 | .15 | .13 F | .04 F |
Net realized and unrealized gain (loss) | 9.36 | 6.40 | 5.47 | 12.07 | (1.69) |
Total from investment operations | 9.78 | 6.72 | 5.62 | 12.20 | (1.65) |
Distributions from net investment income | (.48) | (.25) | (.12) | (.12) | (.46) |
Distributions from net realized gain | (4.79) | (.93) | (.74) | - | - |
Total distributions | (5.27) | (1.18) | (.86) | (.12) | (.46) |
Redemption fees added to paid in capital C | .06 | .03 | .03 | .08 | .05 |
Net asset value, end of period | $ 50.92 | $ 46.35 | $ 40.78 | $ 35.99 | $ 23.83 |
Total Return A, B | 22.29% | 17.01% | 16.09% | 51.73% | (6.16)% |
Ratios to Average Net Assets D, G | |||||
Expenses before reductions | 1.01% | 1.05% | 1.06% | 1.31% | 1.57% |
Expenses net of fee waivers, if any | .98% | 1.05% | 1.06% | 1.31% | 1.57% |
Expenses net of all reductions | .96% | 1.01% | 1.02% | 1.17% | 1.42% |
Net investment income (loss) | .87% | .78% | .42% | .43% | .16% |
Supplemental Data | |||||
Net assets, end of period (000 omitted) | $ 230,147 | $ 169,523 | $ 144,442 | $ 135,131 | $ 41,275 |
Portfolio turnover rate E | 185% | 124% | 89% | 175% | 226% |
A Total returns would have been lower had certain expenses not been reduced during the periods shown. B Total returns do not include the effect of the former sales charges. C Calculated based on average shares outstanding during the period. |
Financial Highlights - Institutional Class
Years ended February 28, | 2007 G |
Selected Per-Share Data | |
Net asset value, beginning of period | $ 46.90 |
Income from Investment Operations | |
Net investment income (loss) D | .08 |
Net realized and unrealized gain (loss) | 3.92 |
Total from investment operations | 4.00 |
Redemption fees added to paid in capital D | .01 |
Net asset value, end of period | $ 50.91 |
Total Return B, C | 8.55% |
Ratios to Average Net Assets E, H | |
Expenses before reductions | 1.06% A |
Expenses net of fee waivers, if any | 1.06% A |
Expenses net of all reductions | 1.04% A |
Net investment income (loss) | .79% A |
Supplemental Data | |
Net assets, end of period (000 omitted) | $ 119 |
Portfolio turnover rate F | 185% |
A Annualized B Total returns for periods of less than one year are not annualized. C Total returns would have been lower had certain expenses not been reduced during the periods shown. D Calculated based on average shares outstanding during the period. E Fees and expenses of the underlying Fidelity Central Funds are not included in the Fund's expense ratio. The Fund indirectly bears its proportionate share of the expenses of any underlying Fidelity Central Funds. F Amount does not include the portfolio activity of any underlying Fidelity Central Funds. G For the period December 12, 2006 (commencement of sale of shares) to February 28, 2007. H Expense ratios reflect operating expenses of the class. Expenses before reductions do not reflect amounts reimbursed by the investment adviser or reductions from brokerage service arrangements or other expense offset arrangements and do not represent the amount paid by the class during periods when reimbursements or reductions occur. Expenses net of fee waivers reflect expenses after reimbursement by the investment adviser but prior to reductions from brokerage service arrangements or other expense offset arrangements. Expenses net of all reductions represent the net expenses paid by the class. |
See accompanying notes which are an integral part of the financial statements.
Annual Report
Notes to Financial Statements
For the period ended February 28, 2007
1. Organization.
Materials Portfolio (the Fund) (formerly Industrial Materials Portfolio) is a non-diversified fund of Fidelity Select Portfolios (the trust) and is authorized to issue an unlimited number of shares. The trust is registered under the Investment Company Act of 1940, as amended (the 1940 Act), as an open-end management investment company organized as a Massachusetts business trust. The Fund invests primarily in securities of companies whose principal business activities fall within specific industries. The Fund offers Class A, Class T, Class B, Class C, Materials, and Institutional Class shares, each of which has equal rights as to assets and voting privileges. Each class has exclusive voting rights with respect to matters that affect that class. The Fund commenced sale of Class A, Class T, Class B, Class C and Institutional Class shares and the existing class was designated Materials on December 12, 2006. Class B shares will automatically convert to Class A shares after a holding period of seven years from the initial date of purchase. Investment income, realized and unrealized capital gains and losses, the common expenses of the Fund, and certain fund-level expense reductions, if any, are allocated on a pro rata basis to each class based on the relative net assets of each class to the total net assets of the Fund. Each class differs with respect to transfer agent and distribution and service plan fees incurred. Certain expense reductions also differ by class. The financial statements have been prepared in conformity with accounting principles generally accepted in the United States of America, which require management to make certain estimates and assumptions at the date of the financial statements.
2. Investments in Fidelity Central Funds.
The Fund may invest in Fidelity Central Funds which are open-end investment companies available only to other investment companies and accounts managed by FMR and its affiliates. The Fund's Schedule of Investments lists each of the Fidelity Central Funds as an investment of the Fund but does not include the underlying holdings of each Fidelity Central Fund. As an Investing Fund, the Fund indirectly bears its proportionate share of the expenses of the underlying Fidelity Central Funds. A complete unaudited list of holdings for each Fidelity Central Fund is available upon request. In addition, the financial statements of the Fidelity Central Funds, which are not covered by the Fund's Report of Independent Registered Public Accounting Firm, are available on the EDGAR Database on the SEC's web site, www.sec.gov, or upon request.
The Money Market Central Funds seek preservation of capital and current income and are managed by Fidelity Investments Money Management, Inc. (FIMM) an affiliate of Fidelity Management & Research Company (FMR).
3. Significant Accounting Policies.
The following summarizes the significant accounting policies of the Fund:
Security Valuation. Investments are valued and net asset value (NAV) per share is calculated (NAV calculation) as of the close of business of the New York Stock Exchange (NYSE), normally 4:00 p.m. Eastern time. During the period the Fund also calculated a NAV each hour on the hour (commencing at 10:00 a.m. Eastern time until one hour prior to the close of business on the NYSE). Effective October 1, 2006 the Fund eliminated hourly NAV calculation.
Wherever possible, the Fund uses independent pricing services approved by the Board of Trustees to value its investments. Equity securities, including restricted securities, for which market quotations are readily available, are valued at the last reported sale price or official closing price as reported by an independent pricing service on the primary market or exchange on which they are traded. In the event there were no sales during the day or closing prices are not available, securities are valued at the last quoted bid price. Investments in open-end mutual funds, including the Fidelity Central Funds, are valued at their closing net asset value each business day. Short-term securities with remaining maturities of sixty days or less for which quotations are not readily available are valued at amortized cost, which approximates value.
When current market prices or quotations are not readily available or do not accurately reflect fair value, valuations may be determined in accordance with procedures adopted by the Board of Trustees. For example, when developments occur between the close of a market and the close of the NYSE that may materially affect the value of some or all of the securities, or when trading in a security is halted, those securities may be fair valued. Factors used in the determination of fair value may include monitoring news to identify significant market or security specific events such as changes in the value of U.S. securities markets, reviewing developments in foreign markets and evaluating the performance of ADRs, futures contracts and exchange-traded funds. Because the Fund's utilization of fair value pricing depends on market activity, the frequency with which fair value pricing is used cannot be predicted and may be utilized to a significant extent. The value of securities used for NAV calculation under fair value pricing may differ from published prices for the same securities.
Annual Report
3. Significant Accounting Policies - continued
Foreign Currency. The Fund uses foreign currency contracts to facilitate transactions in foreign-denominated securities. Losses from these transactions may arise from changes in the value of the foreign currency or if the counterparties do not perform under the contracts' terms.
Foreign-denominated assets, including investment securities, and liabilities are translated into U.S. dollars at the exchange rate at period end. Purchases and sales of investment securities, income and dividends received and expenses denominated in foreign currencies are translated into U.S. dollars at the exchange rate in effect on the transaction date.
The effects of exchange rate fluctuations on investments are included with the net realized and unrealized gain (loss) on investment securities. Other foreign currency transactions resulting in realized and unrealized gain (loss) are disclosed separately.
Investment Transactions and Income. For financial reporting purposes, the Fund's investment holdings and NAV include trades executed through the end of the last business day of the period. The NAV for processing shareholder transactions includes trades executed through the end of the prior business day. Gains and losses on securities sold are determined on the basis of identified cost and may include proceeds received from litigation. Dividend income is recorded on the ex-dividend date, except for certain dividends from foreign securities where the ex-dividend date may have passed, which are recorded as soon as the Fund is informed of the ex-dividend date. Non-cash dividends included in dividend income, if any, are recorded at the fair market value of the securities received. Interest income and capital gain distributions from the Fidelity Central Funds are accrued as earned, with any distributions receivable as of period end included in Distributions receivable from Fidelity Central Funds on the Statement of Assets and Liabilities. Interest income includes coupon interest and amortization of premium and accretion of discount on debt securities. Investment income is recorded net of foreign taxes withheld where recovery of such taxes is uncertain.
Expenses. Most expenses of the trust can be directly attributed to a fund. Expenses which cannot be directly attributed are apportioned among each Fund in the trust. Expense estimates are accrued in the period to which they relate and adjustments are made when actual amounts are known.
Income Tax Information and Distributions to Shareholders. Each year, the Fund intends to qualify as a regulated investment company by distributing all of its taxable income and realized gains under Subchapter M of the Internal Revenue Code. As a result, no provision for income taxes is required in the accompanying financial statements. Foreign taxes are provided for based on the Fund's understanding of the tax rules and rates that exist in the foreign markets in which it invests.
Distributions are recorded on the ex-dividend date. Income dividends and capital gain distributions are declared separately for each class. Income and capital gain distributions are determined in accordance with income tax regulations, which may differ from generally accepted accounting principles.
Capital accounts within the financial statements are adjusted for permanent book-tax differences. These adjustments have no impact on net assets or the results of operations. Temporary book-tax differences will reverse in a subsequent period.
Book-tax differences are primarily due to foreign currency transactions, passive foreign investment companies (PFIC), deferred trustees compensation, and losses deferred due to wash sales.
The tax-basis components of distributable earnings and the federal tax cost as of period end were as follows:
Unrealized appreciation | $ 31,287,329 |
Unrealized depreciation | (4,284,560) |
Net unrealized appreciation (depreciation) | 27,002,769 |
Undistributed ordinary income | 276,796 |
Undistributed long-term capital gain | 3,618,826 |
Cost for federal income tax purposes | $ 213,450,279 |
The tax character of distributions paid was as follows:
February 28, 2007 | February 28, 2006 | |
Ordinary Income | $ 4,275,377 | $ 770,963 |
Long-term Capital Gains | 14,761,326 | 3,187,200 |
Total | $ 19,036,703 | $ 3,958,163 |
Trading (Redemption) Fees. Shares in the Fund held less than 30 days are subject to a redemption fee equal to .75% of the net asset value of shares redeemed. All redemption fees, including any estimated redemption fees paid by FMR, are retained by the Fund and accounted for as an addition to paid in capital. Shareholders were also subject to an additional $7.50 fee for shares exchanged into another Fidelity fund (see Note 6).
Annual Report
Notes to Financial Statements - continued
3. Significant Accounting Policies - continued
New Accounting Pronouncements. In July 2006, Financial Accounting Standards Board Interpretation No. 48, Accounting for Uncertainty in Income Taxes - an interpretation of FASB Statement 109 (FIN 48), was issued and is effective on the last business day of the semiannual reporting period for fiscal years beginning after December 15, 2006. FIN 48 sets forth a threshold for financial statement recognition, measurement and disclosure of a tax position taken or expected to be taken on a tax return. Management is currently evaluating the impact, if any, the adoption of FIN 48 will have on the Fund's net assets, results of operations and financial statement disclosures.
In addition, in September 2006, Statement of Financial Accounting Standards No. 157, Fair Value Measurements (SFAS 157), was issued and is effective for fiscal years beginning after November 15, 2007. SFAS 157 defines fair value, establishes a framework for measuring fair value and expands disclosures about fair value measurements. Management is currently evaluating the impact the adoption of SFAS 157 will have on the Fund's financial statement disclosures.
4. Operating Policies.
Repurchase Agreements. FMR has received an Exemptive Order from the Securities and Exchange Commission (the SEC) which permits the Fund and other affiliated entities of FMR to transfer uninvested cash balances into joint trading accounts which are then invested in repurchase agreements. The Fund may also invest directly with institutions in repurchase agreements. Repurchase agreements are collateralized by government or non-government securities. Upon settlement date, collateral is held in segregated accounts with custodian banks and may be obtained in the event of a default of the counterparty. The Fund monitors, on a daily basis, the value of the collateral to ensure it is at least equal to the principal amount of the repurchase agreement (including accrued interest). In the event of a default by the counterparty, realization of the collateral proceeds could be delayed, during which time the value of the collateral may decline.
Restricted Securities. The Fund may invest in securities that are subject to legal or contractual restrictions on resale. These securities generally may be resold in transactions exempt from registration or to the public if the securities are registered. Disposal of these securities may involve time-consuming negotiations and expense, and prompt sale at an acceptable price may be difficult. Information regarding restricted securities is included at the end of the Fund's Schedule of Investments.
5. Purchases and Sales of Investments.
Purchases and sales of securities, other than short-term securities, aggregated $385,380,320 and $348,269,722, respectively.
6. Fees and Other Transactions with Affiliates.
Management Fee. FMR and its affiliates provide the Fund with investment management related services for which the Fund pays a monthly management fee. The management fee is the sum of an individual fund fee rate that is based on an annual rate of .30% of the Fund's average net assets and a group fee rate that averaged .26% during the period. The group fee rate is based upon the average net assets of all the mutual funds advised by FMR. The group fee rate decreases as assets under management increase and increases as assets under management decrease. For the period, the total annual management fee rate was .56% of the Fund's average net assets.
Distribution and Service Plan. In accordance with Rule 12b-1 of the 1940 Act, the Fund has adopted separate Distribution and Service Plans for each class of shares. Certain classes pay Fidelity Distributors Corporation (FDC), an affiliate of FMR, separate Distribution and Service Fees, each of which is based on an annual percentage of each class' average net assets. In addition, FDC may pay financial intermediaries for selling shares of the Fund and providing shareholder support services. For the period, the Distribution and Service Fee rates and the total amounts paid to and retained by FDC were as follows:
Distribution | Service | Paid to | Retained | |
Class A | -% | .25% | $ 175 | $ 107 |
Class T | .25% | .25% | 224 | 110 |
Class B | .75% | .25% | 620 | 527 |
Class C | .75% | .25% | 364 | 280 |
$ 1,383 | $ 1,024 |
Sales Load. FDC receives a front-end sales charge of up to 5.75% for selling Class A shares, and 3.50% for selling Class T shares, some of which is paid to financial intermediaries for selling shares of the Fund. FDC receives the proceeds of contingent deferred sales charges levied on Class A, Class T, Class B, and Class C redemptions. These charges depend on the holding period. The deferred sales charges range from 5% to 1% for Class B, 1% for Class C, 1.00% to .50% for certain purchases of Class A shares and .25% for certain purchases of Class T shares.
Annual Report
6. Fees and Other Transactions with Affiliates - continued
Sales Load - continued
For the period, sales charge amounts retained by FDC were as follows:
Retained | |
Class A | $ 973 |
Class T | 311 |
$ 1,284 |
Transfer Agent Fees. Fidelity Investments Institutional Operations Company, Inc. (FIIOC), an affiliate of FMR, is the transfer, dividend disbursing and shareholder servicing agent for each class of the Fund, except for Materials class. Fidelity Service Company, Inc. (FSC), an affiliate of FMR, is the transfer agent for Materials class shares. FIIOC and FSC receive account fees and asset-based fees that vary according to the account size and type of account of the shareholders of the respective classes of the Fund. FIIOC and FSC pay for typesetting, printing and mailing of shareholder reports, except proxy statements. For the period, the total transfer agent fees paid by each class to FIIOC or FSC, were as follows:
Amount | % of | |
Class A | $ 89 | .14 |
Class T | 91 | .21 |
Class B | 126 | .22 |
Class C | 63 | .18 |
Materials | 582,390 | .30 |
Institutional Class | 107 | .29 |
$ 582,866 |
Accounting and Security Lending Fees. FSC maintains the Fund's accounting records. The accounting fee is based on the level of average net assets for the month. Under a separate contract, FSC administers the security lending program. The security lending fee is based on the number and duration of lending transactions.
Exchange Fees. During the period, FSC received the proceeds of a $7.50 fee to cover administrative costs associated with exchanges out of the Fund to any other Fidelity Select fund or to any other Fidelity fund made through non-automated channels. Effective October 1, 2006, the exchange fees were eliminated. For the period, exchange fees retained by FSC were as follows:
Retained | |
Materials Portfolio | $ 3,510 |
Brokerage Commissions. The Fund placed a portion of its portfolio transactions with brokerage firms which are affiliates of the investment adviser. The commissions paid to these affiliated firms were $847 for the period.
Interfund Lending Program. Pursuant to an Exemptive Order issued by the SEC, the Fund, along with other registered investment companies having management contracts with FMR, may participate in an interfund lending program. This program provides an alternative credit facility allowing the funds to borrow from, or lend money to, other participating affiliated funds. At period end, there were no interfund loans outstanding. The Fund's activity in this program during the period for which loans were outstanding was as follows:
Borrower or Lender | Average Daily | Weighted Average Interest Rate | Interest |
Borrower | $ 7,629,000 | 5.17% | $ 2,189 |
7. Committed Line of Credit.
The Fund participates with other funds managed by FMR in a $4.2 billion credit facility (the "line of credit") to be utilized for temporary or emergency purposes to fund shareholder redemptions or for other short-term liquidity purposes. The Fund has agreed to pay commitment fees on its pro rata portion of the line of credit, which amounted to $512 and is reflected in Miscellaneous Expense on the Statement of Operations. During the period, there were no borrowings on this line of credit.
Annual Report
Notes to Financial Statements - continued
8. Security Lending.
The Fund lends portfolio securities from time to time in order to earn additional income. On the settlement date of the loan, the Fund receives collateral (in the form of U.S. Treasury obligations, letters of credit and/or cash) against the loaned securities and maintains collateral in an amount not less than 100% of the market value of the loaned securities during the period of the loan. The market value of the loaned securities is determined at the close of business of the Fund and any additional required collateral is delivered to the Fund on the next business day. If the borrower defaults on its obligation to return the securities loaned because of insolvency or other reasons, a fund could experience delays and costs in recovering the securities loaned or in gaining access to the collateral. Any cash collateral received is invested in the Fidelity Securities Lending Cash Central Fund. The value of loaned securities and cash collateral at period end are disclosed on the Fund's Statement of Assets and Liabilities. Security lending income represents the income earned on investing cash collateral, less fees and expenses associated with the loan, plus any premium payments that may be received on the loan of certain types of securities. Security lending income is presented in the Statement of Operations as a component of income from Fidelity Central Funds. Net income from lending portfolio securities during the period amounted to $41,460.
9. Expense Reductions.
FMR voluntarily agreed to reimburse each class to the extent annual operating expenses exceeded certain levels of average net assets as noted in the table below. Some expenses, for example interest expense, including commitment fees, are excluded from this reimbursement.
The following classes were in reimbursement during the period:
Expense | Reimbursement | |
Class A | 1.40% | $ 67 |
Class T | 1.65% | 64 |
Class B | 2.15% | 66 |
Class C | 2.15% | 56 |
$ 253 |
FMR voluntarily agreed to reimburse a portion of Material's operating expenses. During the period, this reimbursement reduced the class' expenses by $56,875.
Many of the brokers with whom FMR places trades on behalf of the Fund provided services to the Fund in addition to trade execution. These services included payments of certain expenses on behalf of the Fund totaling $46,655 for the period. In addition, through arrangements with the each class' transfer agent, credits realized as a result of uninvested cash balances were used to reduce the Fund's expenses. During the period, credits reduced each class' transfer agent expense as noted in the table below.
Transfer Agent | |
Materials | $ 978 |
10. Other.
The Fund's organizational documents provide former and current trustees and officers with a limited indemnification against liabilities arising in connection with the performance of their duties to the Fund. In the normal course of business, the Fund may also enter into contracts that provide general indemnifications. The Fund's maximum exposure under these arrangements is unknown as this would be dependent on future claims that may be made against the Fund. The risk of material loss from such claims is considered remote.
The United States Securities and Exchange Commission ("SEC") is conducting an investigation of FMR (covering the years 2002 to 2004) arising from gifts, gratuities and business entertainment provided by certain brokers to certain individuals who were employed on FMR's domestic equity trading desk during that period. FMR is in discussions with the SEC staff regarding the possible resolution of the matter, but as of period-end no final resolution has been reached.
In December 2006, the Independent Trustees completed their own investigation of the matter with the assistance of independent counsel. The Independent Trustees and FMR agree that, despite the absence of proof that the Fidelity mutual funds experienced diminished execution quality as a result of the improper receipt of gifts and business entertainment, the conduct at issue was serious and is worthy of redress. Accordingly, the Independent Trustees have requested and FMR has agreed to pay $42 million to Fidelity mutual funds, plus interest to be determined at the time that payment is made. A method of allocating this payment among the funds has not yet been determined. The total payment to the Fund is not anticipated to have a material impact on the Fund's net assets. In addition, FMR reimbursed related legal expenses which are recorded in the accompanying Statement of Operations as an expense reduction.
Annual Report
11. Distributions to Shareholders.
Distributions to shareholders of each class were as follows:
Years ended February 28, | 2007 | 2006 |
From net investment income | ||
Materials | $ 1,721,356 | $ 770,963 |
From net realized gain | ||
Materials | $ 17,315,347 | $ 3,187,200 |
12. Share Transactions.
Transactions for each class of shares were as follows:
Shares | Dollars | |||
Years ended February 28, | 2007 A | 2006 | 2007 A | 2006 |
Class A | ||||
Shares sold | 19,960 | - | $ 1,010,235 | $ - |
Shares redeemed | - | - | - | - |
Net increase (decrease) | 19,960 | - | $ 1,010,235 | $ - |
Class T | ||||
Shares sold | 13,890 | - | $ 703,837 | $ - |
Shares redeemed | - | - | - | - |
Net increase (decrease) | 13,890 | - | $ 703,837 | $ - |
Class B | ||||
Shares sold | 13,022 | - | $ 643,438 | $ - |
Shares redeemed | - | - | - | - |
Net increase (decrease) | 13,022 | - | $ 643,438 | $ - |
Class C | ||||
Shares sold | 10,758 | - | $ 546,127 | $ - |
Shares redeemed | - | - | - | - |
Net increase (decrease) | 10,758 | - | $ 546,127 | $ - |
Materials | ||||
Shares sold | 6,290,426 | 4,217,962 | $ 311,961,345 | $ 177,007,921 |
Reinvestment of distributions | 378,787 | 93,814 | 18,026,752 | 3,742,752 |
Shares redeemed | (5,806,915) | (4,196,527) | (273,224,056) | (168,316,528) |
Net increase (decrease) | 862,298 | - | $ 56,764,041 | $ 12,434,145 |
Institutional Class | ||||
Shares sold | 4,445 | - | $ 210,000 | $ - |
Shares redeemed | (2,112) | - | (106,028) | - |
Net increase (decrease) | 2,333 | - | $ 103,972 | $ - |
A Share transactions for Class A, Class T, Class B, Class C and Institutional Class are for the period December 12, 2006 (commencement of sale of shares) to February 28, 2007.
Annual Report
Fidelity Advisor Telecommunications Fund - Institutional Class
Performance
Average annual total return reflects the change in the value of an investment, assuming reinvestment of the class' dividend income and capital gains (the profits earned upon the sale of securities that have grown in value) and assuming a constant rate of performance each year. The $10,000 table and the fund's returns do not reflect the deduction of taxes that a shareholder would pay on fund distributions or the redemption of fund shares. During periods of reimbursement by Fidelity, a fund's total return will be greater than it would be had the reimbursement not occurred. How a fund did yesterday is no guarantee of how it will do tomorrow.
Average Annual Total Returns
Periods ended February 28, 2007 | Past 1 | Past 5 | Past 10 |
Institutional Class A | 22.69% | 11.55% | 6.70% |
A The initial offering of Institutional Class shares took place on December 12, 2006. Returns prior to December 12, 2006 are those of Telecommunications, the original class of the fund.
$10,000 Over 10 Years
Let's say hypothetically that $10,000 was invested in Fidelity Advisor Telecommunications Fund - Institutional Class (dagger) on February 28, 1997. The chart shows how the value of your investment would have changed, and also shows how the Standard & Poor's 500 Index performed over the same period.
* The initial offering of Institutional Class shares took place on December 12, 2006. Returns prior to December 12, 2006 are those of Telecommunications, the original class of the fund.
Annual Report
Fidelity Advisor Telecommunications Fund - Institutional Class
Management's Discussion of Fund Performance
Comments from Brian Younger, Portfolio Manager of Fidelity Advisor Telecommunications Fund during the period covered by the report
A rosy year for stocks wilted just prior to the end of the 12-month period ending February 28, 2007. On the day prior to the period's close, the Dow Jones Industrial AverageSM plunged 416 points and the Standard & Poor's 500SM Index lost roughly 3.5% of its value, plummeting nearly 50 points and marking the benchmark's worst single-day performance since the day the market reopened after the 9/11 terrorist attacks. Though investors were obviously rattled by the development, it was only the 22nd biggest decline for the S&P 500® in 20 years, and it could not overshadow how well stocks performed for the 12 months overall. For much of the past year, investors grew confident that the economy would not fall into a recession, and they bid up most broad-based stock indexes for six consecutive months from August through January. Overall for the year ending February 28, 2007, the S&P 500 was up 11.97%, the Dow advanced 14.24%, the small-cap Russell 2000® Index gained 9.87% and the NASDAQ Composite® Index rose 6.66%.
It's important to point out that in connection with a restructuring of the product line effective October 1, 2006, the fund changed the benchmark to which it compares its performance. During the 12 months ending February 28, 2007, the fund trailed the 27.72% gain of the Morgan Stanley Capital InternationalSM (MSCI®) US Investable Market Telecommunications Services Index, but beat the 21.44% return of a blended index specific to this fund. This blended index is a combination of the Goldman Sachs® Utilities Index, which the fund was compared with through September, and the new MSCI benchmark mentioned above, which the fund was compared with during the period's final five months1. F or the 12-month period, the fund also did better than the S&P 500. (For specific performance information on the fund's Institutional Class shares, please refer to the performance section of this report.) During the first seven months of the review period, the fund outpaced the Goldman Sachs index, driven by an overweighting and strong stock selection among integrated telecommunications services stocks. Of note were Qwest Communications and AT&T. Qwest benefited from improved pricing in its residential wireline business, while recent merger activity drove AT&T's earnings beyond expectations. Communications equipment stocks, which had virtually no representation in the index but were a sizable stake in the fund, hurt performance as intense competition pressured industry pricing. Detractors included QUALCOMM, which provides leading-edge technology for wireless networks, and Nortel Networks, which supplies both wireline and wireless equipment. The fund performed roughly in line with the MSCI index during the last five months of the period, with its biggest gains coming from alternative carriers, which compete with the well-known incumbents. An overweighting and strong security selection in the industry boosted returns. Winners included Cogent Communications and Iliad, both of which enjoyed strong market share gains. Cogent supplies high-speed Internet services, and non-index holding Iliad, a French company, sells voice and high-speed data services mainly to residential customers in Paris. Disappointing stock selection in integrated telecommunications services - which represented on average more than 50% of the fund's assets, versus nearly 75% for the MSCI index - cost the fund. Detractors included Qwest Communications, which took a breather after its earlier run-up, and AT&T, which rallied on strong earnings and revenue growth. The fund had an underweighting in AT&T and an overweighting in Qwest. By period end, I had completely eliminated equipment stocks to bring the fund in line with its new benchmark.
1 The fund's blended index is a customized index developed by Fidelity for the limited purpose of discussing the fund's performance for the 12-month period ending February 28, 2007. From March 1, 2006, through September 30, 2006, the fund compared its performance to the Goldman Sachs Utilities Index, which returned 8.34% during that period. On October 1, 2006, the fund began comparing its performance to a different index, the MSCI US Investable Market Telecommunications Services Index, which returned 12.09% from October 1, 2006, through February 28, 2007. For the 12-month period ending February 28, 2007, the blended index (Goldman Sachs and MSCI) returned 21.44%.
Note to shareholders: Gavin Baker will become manager of the fund on March 1, 2007.
The views expressed above reflect those of the portfolio manager(s) only through the end of the period as stated on the cover of this report and do not necessarily represent the views of Fidelity or any other person in the Fidelity organization. Any such views are subject to change at any time based upon market or other conditions and Fidelity disclaims any responsibility to update such views. These views may not be relied on as investment advice and, because investment decisions for a Fidelity fund are based on numerous factors, may not be relied on as an indication of trading intent on behalf of any Fidelity fund.
Annual Report
Select Telecommunications Portfolio
Shareholder Expense Example
As a shareholder of the Fund, you incur two types of costs: (1) transaction costs, including sales charges (loads) on purchase payments or redemption proceeds, redemption fees, exchange fees, and (2) ongoing costs, including management fees, distribution and/or service (12b-1) fees and other Fund expenses. This Example is intended to help you understand your ongoing costs (in dollars) of investing in the Fund and to compare these costs with the ongoing costs of investing in other mutual funds.
The actual Example is based on an investment of $1,000 at the beginning of the period and held for the entire period (September 1, 2006 to February 28, 2007) for the Telecommunications class and for the entire period (December 12, 2006 to February 28, 2007) for Class A, Class T, Class B, Class C and Institutional Class. The hypothetical expense Example is based on an investment of $1,000 invested for the one-half year period (September 1, 2006 to February 28, 2007).
Actual Expenses
The first line of the accompanying table for each class of the Fund provides information about actual account values and actual expenses. You may use the information in this line, together with the amount you invested, to estimate the expenses that you paid over the period. Simply divide your account value by $1,000.00 (for example, an $8,600 account value divided by $1,000.00 = 8.6), then multiply the result by the number in the first line for a class of the Fund under the heading entitled "Expenses Paid During Period" to estimate the expenses you paid on your account during this period. A small balance maintenance fee of $12.00 that is charged once a year may apply for certain accounts with a value of less than $2,000. This fee is not included in the table below. If it was, the estimate of expenses you paid during the period would be higher, and your ending account value lower, by this amount.
Hypothetical Example for Comparison Purposes
The second line of the accompanying table for each class of the Fund provides information about hypothetical account values and hypothetical expenses based on a Class' actual expense ratio and an assumed rate of return of 5% per year before expenses, which is not the Class' actual return. The hypothetical account values and expenses may not be used to estimate the actual ending account balance or expenses you paid for the period. You may use this information to compare the ongoing costs of investing in the Fund and other funds. To do so, compare this 5% hypothetical example with the 5% hypothetical examples that appear in the shareholder reports of the other funds. A small balance maintenance fee of $12.00 that is charged once a year may apply for certain accounts with a value of less than $2,000. This fee is not included in the table below. If it was, the estimate of expenses you paid during the period would be higher, and your ending account value lower, by this amount.
Please note that the expenses shown in the table are meant to highlight your ongoing costs only and do not reflect any transaction costs. Therefore, the second line of the table is useful in comparing ongoing costs only, and will not help you determine the relative total costs of owning different funds. In addition, if these transactional costs were included, your costs would have been higher.
Beginning | Ending | Expenses Paid | |
Class A | |||
Actual | $ 1,000.00 | $ 1,066.00 | $ 2.75B |
HypotheticalA | $ 1,000.00 | $ 1,018.70 | $ 6.16C |
Class T | |||
Actual | $ 1,000.00 | $ 1,065.40 | $ 3.44B |
HypotheticalA | $ 1,000.00 | $ 1,017.16 | $ 7.70C |
Class B | |||
Actual | $ 1,000.00 | $ 1,064.10 | $ 4.58B |
HypotheticalA | $ 1,000.00 | $ 1,014.63 | $ 10.24C |
Class C | |||
Actual | $ 1,000.00 | $ 1,064.30 | $ 4.62B |
HypotheticalA | $ 1,000.00 | $ 1,014.53 | $ 10.34C |
Telecommunications | |||
Actual | $ 1,000.00 | $ 1,172.20 | $ 5.01B |
HypotheticalA | $ 1,000.00 | $ 1,020.18 | $ 4.66C |
Institutional Class | |||
Actual | $ 1,000.00 | $ 1,066.40 | $ 2.19B |
HypotheticalA | $ 1,000.00 | $ 1,019.93 | $ 4.91C |
A 5% return per year before expenses
B Actual expenses are equal to each Class' annualized expense ratio (shown in the table below); multiplied by the average account value over the period, multiplied by 181/365 (to reflect the one-half year period) for the Telecommunications class and multiplied by 79/365 (to reflect the period December 12, 2006 to February 28, 2007) for Class A, Class T, Class B, Class C and Institutional Class.
C Hypothetical expenses are equal to each Class' annualized expense ratio (shown in the table below); multiplied by the average account value over the period, multiplied by 181/365 (to reflect the one-half year period).
Annualized | |
Class A | 1.23% |
Class T | 1.54% |
Class B | 2.05% |
Class C | 2.07% |
Telecommunications | .93% |
Institutional Class | .98% |
Annual Report
Select Telecommunications Portfolio
Investment Changes
Top Ten Stocks as of February 28, 2007 | ||
% of fund's | % of fund's net assets | |
AT&T, Inc. | 17.5 | 15.2 |
Verizon Communications, Inc. | 14.6 | 11.6 |
Qwest Communications International, Inc. | 9.8 | 14.7 |
ALLTEL Corp. | 5.0 | 4.3 |
Iliad Group SA | 4.9 | 0.0 |
Dobson Communications Corp. Class A | 4.8 | 0.8 |
Leap Wireless International, Inc. | 4.6 | 0.5 |
Time Warner Telecom, Inc. Class A (sub. vtg.) | 4.5 | 2.0 |
SBA Communications Corp. Class A | 4.5 | 0.0 |
Level 3 Communications, Inc. | 4.5 | 3.1 |
74.7 | ||
Top Industries (% of fund's net assets) | |||
As of February 28, 2007 | |||
| Diversified Telecommunication Services | 65.1% | |
| Wireless Telecommunication Services | 30.7% | |
 | Diversified Financial Services | 1.4% | |
| Electronic Equipment & Instruments | 0.0% | |
| All Others* | 2.8% | |

As of August 31, 2006 | |||
| Diversified Telecommunication Services | 55.5% | |
| Communications Equipment | 29.4% | |
| Wireless Telecommunication Services | 12.0% | |
| All Others* | 3.1% | |

* Includes short-term investments and net other assets. |
Annual Report
Select Telecommunications Portfolio
Investments February 28, 2007
Showing Percentage of Net Assets
Common Stocks - 97.2% | |||
Shares | Value | ||
DIVERSIFIED FINANCIAL SERVICES - 1.4% | |||
Specialized Finance - 1.4% | |||
Fortress Investment Group LLC | 281,700 | $ 8,507,340 | |
DIVERSIFIED TELECOMMUNICATION SERVICES - 65.1% | |||
Alternative Carriers - 16.5% | |||
Cogent Communications Group, Inc. (a) | 472,208 | 10,653,012 | |
Global Crossing Ltd. (a) | 199,200 | 5,663,256 | |
Iliad Group SA (d) | 290,500 | 30,531,683 | |
Level 3 Communications, Inc. (a)(d) | 4,283,664 | 28,143,672 | |
Time Warner Telecom, Inc. Class A (sub. vtg.) (a) | 1,292,200 | 28,441,322 | |
103,432,945 | |||
Integrated Telecommunication Services - 48.6% | |||
AT&T, Inc. | 2,985,702 | 109,873,835 | |
BT Group PLC | 1,094,800 | 6,358,598 | |
Cbeyond, Inc. | 5,300 | 164,671 | |
FairPoint Communications, Inc. | 289,000 | 5,519,900 | |
NeuStar, Inc. Class A (a) | 213,900 | 6,844,800 | |
NTELOS Holding Corp. | 796,868 | 14,877,526 | |
Qwest Communications International, Inc. (a)(d) | 6,892,344 | 61,204,015 | |
Telefonica SA sponsored ADR | 101,500 | 6,534,570 | |
Verizon Communications, Inc. | 2,435,924 | 91,176,635 | |
Windstream Corp. | 109,708 | 1,651,105 | |
304,205,655 | |||
TOTAL DIVERSIFIED TELECOMMUNICATION | 407,638,600 | ||
ELECTRONIC EQUIPMENT & INSTRUMENTS - 0.0% | |||
Electronic Manufacturing Services - 0.0% | |||
Trimble Navigation Ltd. (a) | 8,940 | 236,552 | |
WIRELESS TELECOMMUNICATION SERVICES - 30.7% | |||
Wireless Telecommunication Services - 30.7% | |||
ALLTEL Corp. | 518,900 | 31,440,151 | |
American Tower Corp. Class A (a) | 710,000 | 27,505,400 | |
Bharti Airtel Ltd. (a) | 660,000 | 10,815,295 | |
Centennial Communications Corp. Class A | 294,900 | 2,323,812 | |
Shares | Value | ||
Crown Castle International Corp. (a) | 813,800 | $ 26,660,088 | |
Dobson Communications Corp. Class A | 3,418,300 | 30,354,504 | |
InPhonic, Inc. (a)(d) | 76,500 | 950,895 | |
Leap Wireless International, Inc. (a) | 422,414 | 28,542,514 | |
Rural Cellular Corp. Class A (a) | 168,700 | 2,198,161 | |
SBA Communications Corp. Class A (a) | 1,049,000 | 28,291,530 | |
Vodafone Group PLC sponsored ADR | 122,700 | 3,423,330 | |
192,505,680 | |||
TOTAL COMMON STOCKS (Cost $516,438,124) | 608,888,172 | ||
Money Market Funds - 9.3% | |||
Fidelity Cash Central Fund, 5.35% (b) | 3,550,096 | 3,550,096 | |
Fidelity Securities Lending Cash Central Fund, 5.34% (b)(c) | 54,414,050 | 54,414,050 | |
TOTAL MONEY MARKET FUNDS (Cost $57,964,146) | 57,964,146 | ||
TOTAL INVESTMENT PORTFOLIO - 106.5% (Cost $574,402,270) | 666,852,318 | ||
NET OTHER ASSETS - (6.5)% | (40,470,502) | ||
NET ASSETS - 100% | $ 626,381,816 | ||
Legend |
(a) Non-income producing |
(b) Affiliated fund that is available only to investment companies and other accounts managed by Fidelity Investments. The rate quoted is the annualized seven-day yield of the fund at period end. A complete unaudited listing of the fund's holdings as of its most recent quarter end is available upon request. |
(c) Investment made with cash collateral received from securities on loan. |
(d) Security or a portion of the security is on loan at period end. |
Affiliated Central Funds |
Information regarding fiscal year to date income earned by the Fund from investments in Fidelity Central Funds is as follows: |
Fund | Income earned |
Fidelity Cash Central Fund | $ 599,879 |
Fidelity Securities Lending Cash Central Fund | 208,152 |
Total | $ 808,031 |
Other Information |
Distribution of investments by country of issue, as a percentage of total net assets, is as follows: |
United States of America | 90.0% |
France | 4.9% |
India | 1.7% |
United Kingdom | 1.5% |
Spain | 1.0% |
Others (individually less than 1%) | 0.9% |
100.0% |
Income Tax Information |
At February 28, 2007, the fund had a capital loss carryforward of approximately $495,069,450 of which $321,438,292, $161,866,685 and $11,764,473 will expire on February 28, 2010, 2011 and February 29, 2012, respectively. |
See accompanying notes which are an integral part of the financial statements.
Annual Report
Select Telecommunications Portfolio
Financial Statements
Statement of Assets and Liabilities
February 28, 2007 | ||
Assets | ||
Investment in securities, at value (including securities loaned of $53,537,450) - See accompanying schedule: Unaffiliated issuers (cost $516,438,124) | $ 608,888,172 | |
Fidelity Central Funds (cost $57,964,146) | 57,964,146 | |
Total Investments (cost $574,402,270) | $ 666,852,318 | |
Receivable for investments sold | 16,144,628 | |
Receivable for fund shares sold | 2,247,368 | |
Dividends receivable | 64,863 | |
Distributions receivable from Fidelity Central Funds | 71,935 | |
Prepaid expenses | 1,607 | |
Other receivables | 18,974 | |
Total assets | 685,401,693 | |
Liabilities | ||
Payable for investments purchased | $ 461,351 | |
Payable for fund shares redeemed | 3,431,023 | |
Accrued management fee | 291,823 | |
Distribution fees payable | 687 | |
Other affiliated payables | 150,185 | |
Other payables and accrued expenses | 270,758 | |
Collateral on securities loaned, at value | 54,414,050 | |
Total liabilities | 59,019,877 | |
Net Assets | $ 626,381,816 | |
Net Assets consist of: | ||
Paid in capital | $ 1,030,874,491 | |
Undistributed net investment income | 1,385,280 | |
Accumulated undistributed net realized gain (loss) on investments and foreign currency transactions | (498,119,362) | |
Net unrealized appreciation (depreciation) on investments | 92,241,407 | |
Net Assets | $ 626,381,816 | |
February 28, 2007 | ||
Calculation of Maximum Offering Price Class A: | $ 50.89 | |
Maximum offering price per share (100/94.25 of $50.89) | $ 53.99 | |
Class T: | $ 50.86 | |
Maximum offering price per share (100/96.50 of $50.86) | $ 52.70 | |
Class B: | $ 50.80 | |
Class C: | $ 50.81 | |
Telecommunications: | $ 50.91 | |
Institutional Class: | $ 50.91 | |
A Redemption price per share is equal to net asset value less any applicable contingent deferred sales charge.
See accompanying notes which are an integral part of the financial statements.
Annual Report
Statement of Operations
Year ended February 28, 2007 | ||
Investment Income | ||
Dividends | $ 9,195,804 | |
Special dividends | 1,230,657 | |
Interest | 137 | |
Income from Fidelity Central Funds | 808,031 | |
Total income | 11,234,629 | |
Expenses | ||
Management fee | $ 2,765,966 | |
Transfer agent fees | 1,520,519 | |
Distribution fees | 1,168 | |
Accounting and security lending fees | 225,781 | |
Custodian fees and expenses | 36,123 | |
Independent trustees' compensation | 1,860 | |
Registration fees | 150,014 | |
Audit | 40,413 | |
Legal | 8,851 | |
Interest | 15,851 | |
Miscellaneous | 34,145 | |
Total expenses before reductions | 4,800,691 | |
Expense reductions | (101,322) | 4,699,369 |
Net investment income (loss) | 6,535,260 | |
Realized and Unrealized Gain (Loss) Net realized gain (loss) on: | ||
Investment securities: | ||
Unaffiliated issuers (net of foreign taxes of $101,904) | 31,904,030 | |
Foreign currency transactions | (25,988) | |
Total net realized gain (loss) | 31,878,042 | |
Change in net unrealized appreciation (depreciation) on investment securities (net of increase in deferred foreign taxes of $208,641) | 54,610,776 | |
Net gain (loss) | 86,488,818 | |
Net increase (decrease) in net assets resulting from operations | $ 93,024,078 | |
Statement of Changes in Net Assets
Year ended | Year ended | |
Increase (Decrease) in Net Assets | ||
Operations | ||
Net investment income (loss) | $ 6,535,260 | $ 3,338,999 |
Net realized gain (loss) | 31,878,042 | 55,407,188 |
Change in net unrealized appreciation (depreciation) | 54,610,776 | 10,244,776 |
Net increase (decrease) in net assets resulting from operations | 93,024,078 | 68,990,963 |
Distributions to shareholders from net investment income | (5,987,382) | (3,005,035) |
Share transactions - net increase (decrease) | 136,866,943 | 2,681,402 |
Redemption fees | 144,270 | 25,069 |
Total increase (decrease) in net assets | 224,047,909 | 68,692,399 |
Net Assets | ||
Beginning of period | 402,333,907 | 333,641,508 |
End of period (including undistributed net investment income of $1,385,280 and undistributed net investment income of $965,295, respectively) | $ 626,381,816 | $ 402,333,907 |
See accompanying notes which are an integral part of the financial statements.
Annual Report
Financial Highlights - Class A
Years ended February 28, | 2007 H |
Selected Per-Share Data | |
Net asset value, beginning of period | $ 47.74 |
Income from Investment Operations | |
Net investment income (loss) E | - J |
Net realized and unrealized gain (loss) | 3.15 |
Total from investment operations | 3.15 |
Redemption fees added to paid in capital E | - J |
Net asset value, end of period | $ 50.89 |
Total Return B, C, D | 6.60% |
Ratios to Average Net Assets F, I | |
Expenses before reductions | 1.23% A |
Expenses net of fee waivers, if any | 1.23% A |
Expenses net of all reductions | 1.22% A |
Net investment income (loss) | (.03)% A |
Supplemental Data | |
Net assets, end of period (000 omitted) | $ 658 |
Portfolio turnover rate G | 162% |
A Annualized B Total returns for periods of less than one year are not annualized. C Total returns would have been lower had certain expenses not been reduced during the periods shown. D Total returns do not include the effect of the sales charges. E Calculated based on average shares outstanding during the period. F Fees and expenses of the underlying Fidelity Central Funds are not included in the Fund's expense ratio. The Fund indirectly bears its proportionate share of the expenses of any underlying Fidelity Central Funds. G Amount does not include the portfolio activity of any underlying Fidelity Central Funds. H For the period December 12, 2006 (commencement of sale of shares) to February 28, 2007. I Expense ratios reflect operating expenses of the class. Expenses before reductions do not reflect amounts reimbursed by the investment adviser or reductions from brokerage service arrangements or other expense offset arrangements and do not represent the amount paid by the class during periods when reimbursements or reductions occur. Expenses net of fee waivers reflect expenses after reimbursement by the investment adviser but prior to reductions from brokerage service arrangements or other expense offset arrangements. Expenses net of all reductions represent the net expenses paid by the class. J Amount represents less than $.01 per share. |
Financial Highlights - Class T
Years ended February 28, | 2007 H |
Selected Per-Share Data | |
Net asset value, beginning of period | $ 47.74 |
Income from Investment Operations | |
Net investment income (loss) E | (.02) |
Net realized and unrealized gain (loss) | 3.14 |
Total from investment operations | 3.12 |
Redemption fees added to paid in capital E | - J |
Net asset value, end of period | $ 50.86 |
Total Return B, C, D | 6.54% |
Ratios to Average Net Assets F, I | |
Expenses before reductions | 1.54% A |
Expenses net of fee waivers, if any | 1.54% A |
Expenses net of all reductions | 1.53% A |
Net investment income (loss) | (.24)% A |
Supplemental Data | |
Net assets, end of period (000 omitted) | $ 560 |
Portfolio turnover rate G | 162% |
A Annualized B Total returns for periods of less than one year are not annualized. C Total returns would have been lower had certain expenses not been reduced during the periods shown. D Total returns do not include the effect of the sales charges. E Calculated based on average shares outstanding during the period. F Fees and expenses of the underlying Fidelity Central Funds are not included in the Fund's expense ratio. The Fund indirectly bears its proportionate share of the expenses of any underlying Fidelity Central Funds. G Amount does not include the portfolio activity of any underlying Fidelity Central Funds. H For the period December 12, 2006 (commencement of sale of shares) to February 28, 2007. I Expense ratios reflect operating expenses of the class. Expenses before reductions do not reflect amounts reimbursed by the investment adviser or reductions from brokerage service arrangements or other expense offset arrangements and do not represent the amount paid by the class during periods when reimbursements or reductions occur. Expenses net of fee waivers reflect expenses after reimbursement by the investment adviser but prior to reductions from brokerage service arrangements or other expense offset arrangements. Expenses net of all reductions represent the net expenses paid by the class. J Amount represents less than $.01 per share. |
See accompanying notes which are an integral part of the financial statements.
Annual Report
Financial Highlights - Class B
Years ended February 28, | 2007 H |
Selected Per-Share Data | |
Net asset value, beginning of period | $ 47.74 |
Income from Investment Operations | |
Net investment income (loss) E | (.05) |
Net realized and unrealized gain (loss) | 3.11 |
Total from investment operations | 3.06 |
Redemption fees added to paid in capital E | - J |
Net asset value, end of period | $ 50.80 |
Total Return B, C, D | 6.41% |
Ratios to Average Net Assets F, I | |
Expenses before reductions | 2.05% A |
Expenses net of fee waivers, if any | 2.05% A |
Expenses net of all reductions | 2.05% A |
Net investment income (loss) | (.49)% A |
Supplemental Data | |
Net assets, end of period (000 omitted) | $ 291 |
Portfolio turnover rate G | 162% |
A Annualized B Total returns for periods of less than one year are not annualized. C Total returns would have been lower had certain expenses not been reduced during the periods shown. D Total returns do not include the effect of the contingent deferred sales charge. E Calculated based on average shares outstanding during the period. F Fees and expenses of the underlying Fidelity Central Funds are not included in the Fund's expense ratio. The Fund indirectly bears its proportionate share of the expenses of any underlying Fidelity Central Funds. G Amount does not include the portfolio activity of any underlying Fidelity Central Funds. H For the period December 12, 2006 (commencement of sale of shares) to February 28, 2007. I Expense ratios reflect operating expenses of the class. Expenses before reductions do not reflect amounts reimbursed by the investment adviser or reductions from brokerage service arrangements or other expense offset arrangements and do not represent the amount paid by the class during periods when reimbursements or reductions occur. Expenses net of fee waivers reflect expenses after reimbursement by the investment adviser but prior to reductions from brokerage service arrangements or other expense offset arrangements. Expenses net of all reductions represent the net expenses paid by the class. J Amount represents less than $.01 per share. |
Financial Highlights - Class C
Years ended February 28, | 2007 H |
Selected Per-Share Data | |
Net asset value, beginning of period | $ 47.74 |
Income from Investment Operations | |
Net investment income (loss) E | (.07) |
Net realized and unrealized gain (loss) | 3.14 |
Total from investment operations | 3.07 |
Redemption fees added to paid in capital E | - J |
Net asset value, end of period | $ 50.81 |
Total Return B, C, D | 6.43% |
Ratios to Average Net Assets F, I | |
Expenses before reductions | 2.07% A |
Expenses net of fee waivers, if any | 2.07% A |
Expenses net of all reductions | 2.06% A |
Net investment income (loss) | (.65)% A |
Supplemental Data | |
Net assets, end of period (000 omitted) | $ 332 |
Portfolio turnover rate G | 162% |
A Annualized B Total returns for periods of less than one year are not annualized. C Total returns would have been lower had certain expenses not been reduced during the periods shown. D Total returns do not include the effect of the contingent deferred sales charge. E Calculated based on average shares outstanding during the period. F Fees and expenses of the underlying Fidelity Central Funds are not included in the Fund's expense ratio. The Fund indirectly bears its proportionate share of the expenses of any underlying Fidelity Central Funds. G Amount does not include the portfolio activity of any underlying Fidelity Central Funds. H For the period December 12, 2006 (commencement of sale of shares) to February 28, 2007. I Expense ratios reflect operating expenses of the class. Expenses before reductions do not reflect amounts reimbursed by the investment adviser or reductions from brokerage service arrangements or other expense offset arrangements and do not represent the amount paid by the class during periods when reimbursements or reductions occur. Expenses net of fee waivers reflect expenses after reimbursement by the investment adviser but prior to reductions from brokerage service arrangements or other expense offset arrangements. Expenses net of all reductions represent the net expenses paid by the class. J Amount represents less than $.01 per share. |
See accompanying notes which are an integral part of the financial statements.
Annual Report
Financial Highlights - Telecommunications
Years ended February 28, | 2007 | 2006 | 2005 | 2004 I | 2003 |
Selected Per-Share Data | |||||
Net asset value, beginning of period | $ 41.97 | $ 34.83 | $ 35.79 | $ 23.62 | $ 30.55 |
Income from Investment Operations | |||||
Net investment income (loss) C | .61 F | .36 | .49 G | .08 | .03 |
Net realized and unrealized gain (loss) | 8.85 | 7.11 | (.96) | 12.13 | (6.95) |
Total from investment operations | 9.46 | 7.47 | (.47) | 12.21 | (6.92) |
Distributions from net investment income | (.53) | (.33) | (.49) | (.05) | (.03) |
Redemption fees added to paid in capital C | .01 | - J | - J | .01 | .02 |
Net asset value, end of period | $ 50.91 | $ 41.97 | $ 34.83 | $ 35.79 | $ 23.62 |
Total Return A, B | 22.69% | 21.54% | (1.40)% | 51.78% | (22.60)% |
Ratios to Average Net Assets D, H | |||||
Expenses before reductions | .99% | 1.05% | 1.09% | 1.40% | 1.56% |
Expenses net of fee waivers, if any | .97% | 1.05% | 1.09% | 1.40% | 1.56% |
Expenses net of all reductions | .97% | .96% | 1.02% | 1.34% | 1.34% |
Net investment income (loss) | 1.34% F | .96% | 1.44% G | .27% | .13% |
Supplemental Data | |||||
Net assets, end of period (000 omitted) | $ 624,427 | $ 402,334 | $ 333,642 | $ 439,350 | $ 312,839 |
Portfolio turnover rate E | 162% | 148% | 56% | 98% | 163% |
A Total returns would have been lower had certain expenses not been reduced during the periods shown. B Total returns do not include the effect of the former sales charges. C Calculated based on average shares outstanding during the period. D Fees and expenses of the underlying Fidelity Central Funds are not included in the Fund's expense ratio. The Fund indirectly bears its proportionate share of the expenses of any underlying Fidelity Central Funds. E Amount does not include the portfolio activity of any underlying Fidelity Central Funds. F Investment income per share reflects a special dividend which amounted to $.11 per share. Excluding the special dividend, the ratio of net investment income (loss) to average net assets would have been 1.09%. G Investment income per share reflects a special dividend which amounted to $.26 per share. Excluding the special dividend, the ratio of net investment income (loss) to average net assets would have been ..68%. H Expense ratios reflect operating expenses of the class. Expenses before reductions do not reflect amounts reimbursed by the investment adviser or reductions from brokerage service arrangements or other expense offset arrangements and do not represent the amount paid by the class during periods when reimbursements or reductions occur. Expenses net of fee waivers reflect expenses after reimbursement by the investment adviser but prior to reductions from brokerage service arrangements or other expense offset arrangements. Expenses net of all reductions represent the net expenses paid by the class. I For the year ended February 29. J Amount represents less than $.01 per share. |
Financial Highlights - Institutional Class
Years ended February 28, | 2007 G |
Selected Per-Share Data | |
Net asset value, beginning of period | $ 47.74 |
Income from Investment Operations | |
Net investment income (loss) D | .16 |
Net realized and unrealized gain (loss) | 3.01 |
Total from investment operations | 3.17 |
Redemption fees added to paid in capital D | - I |
Net asset value, end of period | $ 50.91 |
Total Return B, C | 6.64% |
Ratios to Average Net Assets E, H | |
Expenses before reductions | .98% A |
Expenses net of fee waivers, if any | .98% A |
Expenses net of all reductions | .97% A |
Net investment income (loss) | 1.52% A |
Supplemental Data | |
Net assets, end of period (000 omitted) | $ 114 |
Portfolio turnover rate F | 162% |
A Annualized B Total returns for periods of less than one year are not annualized. C Total returns would have been lower had certain expenses not been reduced during the periods shown. D Calculated based on average shares outstanding during the period. E Fees and expenses of the underlying Fidelity Central Funds are not included in the Fund's expense ratio. The Fund indirectly bears its proportionate share of the expenses of any underlying Fidelity Central Funds. F Amount does not include the portfolio activity of any underlying Fidelity Central Funds. G For the period December 12, 2006 (commencement of sale of shares) to February 28, 2007. H Expense ratios reflect operating expenses of the class. Expenses before reductions do not reflect amounts reimbursed by the investment adviser or reductions from brokerage service arrangements or other expense offset arrangements and do not represent the amount paid by the class during periods when reimbursements or reductions occur. Expenses net of fee waivers reflect expenses after reimbursement by the investment adviser but prior to reductions from brokerage service arrangements or other expense offset arrangements. Expenses net of all reductions represent the net expenses paid by the class. I Amount represents less than $.01 per share. |
See accompanying notes which are an integral part of the financial statements.
Annual Report
Notes to Financial Statements
For the period ended February 28, 2007
1. Organization.
Telecommunications Portfolio (the Fund) is a non-diversified fund of Fidelity Select Portfolios (the trust) and is authorized to issue an unlimited number of shares. The trust is registered under the Investment Company Act of 1940, as amended (the 1940 Act), as an open-end management investment company organized as a Massachusetts business trust. The Fund invests primarily in securities of companies whose principal business activities fall within specific industries. The Fund offers Class A, Class T, Class B, Class C, Telecommunications, and Institutional Class shares, each of which has equal rights as to assets and voting privileges. Each class has exclusive voting rights with respect to matters that affect that class. The Fund commenced sale of Class A, Class T, Class B, Class C and Institutional Class shares and the existing class was designated Telecommunications on December 12, 2006. Class B shares will automatically convert to Class A shares after a holding period of seven years from the initial date of purchase. Investment income, realized and unrealized capital gains and losses, the common expenses of the Fund, and certain fund-level expense reductions, if any, are allocated on a pro rata basis to each class based on the relative net assets of each class to the total net assets of the Fund. Each class differs with respect to transfer agent and distribution and service plan fees incurred. Certain expense reductions also differ by class. The financial statements have been prepared in conformity with accounting principles generally accepted in the United States of America, which require management to make certain estimates and assumptions at the date of the financial statements.
2. Investments in Fidelity Central Funds.
The Fund may invest in Fidelity Central Funds which are open-end investment companies available only to other investment companies and accounts managed by FMR and its affiliates. The Fund's Schedule of Investments lists each of the Fidelity Central Funds as an investment of the Fund but does not include the underlying holdings of each Fidelity Central Fund. As an Investing Fund, the Fund indirectly bears its proportionate share of the expenses of the underlying Fidelity Central Funds. A complete unaudited list of holdings for each Fidelity Central Fund is available upon request. In addition, the financial statements of the Fidelity Central Funds, which are not covered by the Fund's Report of Independent Registered Public Accounting Firm, are available on the EDGAR Database on the SEC's web site, www.sec.gov, or upon request.
The Money Market Central Funds seek preservation of capital and current income and are managed by Fidelity Investments Money Management, Inc. (FIMM) an affiliate of Fidelity Management & Research Company (FMR).
3. Significant Accounting Policies.
The following summarizes the significant accounting policies of the Fund:
Security Valuation. Investments are valued and net asset value (NAV) per share is calculated (NAV calculation) as of the close of business of the New York Stock Exchange (NYSE), normally 4:00 p.m. Eastern time. During the period the Fund also calculated a NAV each hour on the hour (commencing at 10:00 a.m. Eastern time until one hour prior to the close of business on the NYSE). Effective October 1, 2006 the Fund eliminated hourly NAV calculation.
Wherever possible, the Fund uses independent pricing services approved by the Board of Trustees to value its investments. Equity securities, including restricted securities, for which market quotations are readily available, are valued at the last reported sale price or official closing price as reported by an independent pricing service on the primary market or exchange on which they are traded. In the event there were no sales during the day or closing prices are not available, securities are valued at the last quoted bid price. Investments in open-end mutual funds, including the Fidelity Central Funds, are valued at their closing net asset value each business day. Short-term securities with remaining maturities of sixty days or less for which quotations are not readily available are valued at amortized cost, which approximates value.
When current market prices or quotations are not readily available or do not accurately reflect fair value, valuations may be determined in accordance with procedures adopted by the Board of Trustees. For example, when developments occur between the close of a market and the close of the NYSE that may materially affect the value of some or all of the securities, or when trading in a security is halted, those securities may be fair valued. Factors used in the determination of fair value may include monitoring news to identify significant market or security specific events such as changes in the value of U.S. securities markets, reviewing developments in foreign markets and evaluating the performance of ADRs, futures contracts and exchange-traded funds. Because the Fund's utilization of fair value pricing depends on market activity, the frequency with which fair value pricing is used cannot be predicted and may be utilized to a significant extent. The value of securities used for NAV calculation under fair value pricing may differ from published prices for the same securities.
Foreign Currency. The Fund uses foreign currency contracts to facilitate transactions in foreign-denominated securities. Losses from these transactions may arise from changes in the value of the foreign currency or if the counterparties do not perform under the contracts' terms.
Foreign-denominated assets, including investment securities, and liabilities are translated into U.S. dollars at the exchange rate at period end. Purchases and sales of investment securities, income and dividends received and expenses denominated in foreign currencies are translated into U.S. dollars at the exchange rate in effect on the transaction date.
Annual Report
Notes to Financial Statements - continued
3. Significant Accounting Policies - continued
Foreign Currency - continued
The effects of exchange rate fluctuations on investments are included with the net realized and unrealized gain (loss) on investment securities. Other foreign currency transactions resulting in realized and unrealized gain (loss) are disclosed separately.
Investment Transactions and Income. For financial reporting purposes, the Fund's investment holdings and NAV include trades executed through the end of the last business day of the period. The NAV for processing shareholder transactions includes trades executed through the end of the prior business day. Gains and losses on securities sold are determined on the basis of identified cost and may include proceeds received from litigation. Dividend income is recorded on the ex-dividend date, except for certain dividends from foreign securities where the ex-dividend date may have passed, which are recorded as soon as the Fund is informed of the ex-dividend date. Non-cash dividends included in dividend income, if any, are recorded at the fair market value of the securities received. Distributions received on securities that represent a return of capital or capital gain are recorded as a reduction of cost of investments and/or as a realized gain. The Fund estimates the components of distributions received that may be considered return of capital distributions or capital gain distributions. Large, non-recurring dividends recognized by the Fund are presented separately on the Statement of Operations as "Special Dividends" and the impact of these dividends is presented in the Financial Highlights. Interest income and distributions from the Fidelity Central Funds are accrued as earned, with any distributions receivable as of period end included in Distributions receivable from Fidelity Central Funds on the Statement of Assets and Liabilities. Interest income includes coupon interest and amortization of premium and accretion of discount on debt securities. Investment income is recorded net of foreign taxes withheld where recovery of such taxes is uncertain.
Expenses. Most expenses of the trust can be directly attributed to a fund. Expenses which cannot be directly attributed are apportioned among each Fund in the trust. Expense estimates are accrued in the period to which they relate and adjustments are made when actual amounts are known.
Income Tax Information and Distributions to Shareholders. Each year, the Fund intends to qualify as a regulated investment company by distributing all of its taxable income and realized gains under Subchapter M of the Internal Revenue Code. As a result, no provision for income taxes is required in the accompanying financial statements. Foreign taxes are provided for based on the Fund's understanding of the tax rules and rates that exist in the foreign markets in which it invests.
Distributions are recorded on the ex-dividend date. Income dividends and capital gain distributions are declared separately for each class. Income and capital gain distributions are determined in accordance with income tax regulations, which may differ from generally accepted accounting principles.
Capital accounts within the financial statements are adjusted for permanent book-tax differences. These adjustments have no impact on net assets or the results of operations. Temporary book-tax differences will reverse in a subsequent period.
Book-tax differences are primarily due to foreign currency transactions, certain foreign taxes, capital loss carryforwards and losses deferred due to wash sales.
The tax-basis components of distributable earnings and the federal tax cost as of period end were as follows:
Unrealized appreciation | $ 102,069,768 |
Unrealized depreciation | (12,878,269) |
Net unrealized appreciation (depreciation) | 89,191,499 |
Undistributed ordinary income | 1,386,172 |
Capital loss carryforward | (495,069,450) |
Cost for federal income tax purposes | $ 577,660,819 |
The tax character of distributions paid was as follows:
February 28, 2007 | February 28, 2006 | |
Ordinary Income | $ 5,987,382 | $ 3,005,035 |
Trading (Redemption) Fees. Shares in the Fund held less than 30 days are subject to a redemption fee equal to .75% of the net asset value of shares redeemed. All redemption fees, including any estimated redemption fees paid by FMR, are retained by the Fund and accounted for as an addition to paid in capital. Shareholders were also subject to an additional $7.50 fee for shares exchanged into another Fidelity fund (see Note 6).
Annual Report
3. Significant Accounting Policies - continued
New Accounting Pronouncements. In July 2006, Financial Accounting Standards Board Interpretation No. 48, Accounting for Uncertainty in Income Taxes - an interpretation of FASB Statement 109 (FIN 48), was issued and is effective on the last business day of the semiannual reporting period for fiscal years beginning after December 15, 2006. FIN 48 sets forth a threshold for financial statement recognition, measurement and disclosure of a tax position taken or expected to be taken on a tax return. Management is currently evaluating the impact, if any, the adoption of FIN 48 will have on the Fund's net assets, results of operations and financial statement disclosures.
In addition, in September 2006, Statement of Financial Accounting Standards No. 157, Fair Value Measurements (SFAS 157), was issued and is effective for fiscal years beginning after November 15, 2007. SFAS 157 defines fair value, establishes a framework for measuring fair value and expands disclosures about fair value measurements. Management is currently evaluating the impact the adoption of SFAS 157 will have on the Fund's financial statement disclosures.
4. Operating Policies.
Repurchase Agreements. FMR has received an Exemptive Order from the Securities and Exchange Commission (the SEC) which permits the Fund and other affiliated entities of FMR to transfer uninvested cash balances into joint trading accounts which are then invested in repurchase agreements. The Fund may also invest directly with institutions in repurchase agreements. Repurchase agreements are collateralized by government or non-government securities. Upon settlement date, collateral is held in segregated accounts with custodian banks and may be obtained in the event of a default of the counterparty. The Fund monitors, on a daily basis, the value of the collateral to ensure it is at least equal to the principal amount of the repurchase agreement (including accrued interest). In the event of a default by the counterparty, realization of the collateral proceeds could be delayed, during which time the value of the collateral may decline.
5. Purchases and Sales of Investments.
Purchases and sales of securities, other than short-term securities, aggregated $915,897,899 and $790,008,297, respectively.
6. Fees and Other Transactions with Affiliates.
Management Fee. FMR and its affiliates provide the Fund with investment management related services for which the Fund pays a monthly management fee. The management fee is the sum of an individual fund fee rate that is based on an annual rate of .30% of the Fund's average net assets and a group fee rate that averaged .26% during the period. The group fee rate is based upon the average net assets of all the mutual funds advised by FMR. The group fee rate decreases as assets under management increase and increases as assets under management decrease. For the period, the total annual management fee rate was .57% of the Fund's average net assets.
Distribution and Service Plan. In accordance with Rule 12b-1 of the 1940 Act, the Fund has adopted separate Distribution and Service Plans for each class of shares. Certain classes pay Fidelity Distributors Corporation (FDC), an affiliate of FMR, separate Distribution and Service Fees, each of which is based on an annual percentage of each class' average net assets. In addition, FDC may pay financial intermediaries for selling shares of the Fund and providing shareholder support services. For the period, the Distribution and Service Fee rates and the total amounts paid to and retained by FDC were as follows:
Distribution | Service | Paid to | Retained | |
Class A | -% | .25% | $ 139 | $ 84 |
Class T | .25% | .25% | 274 | 123 |
Class B | .75% | .25% | 359 | 332 |
Class C | .75% | .25% | 396 | 323 |
$ 1,168 | $ 862 |
Sales Load. FDC receives a front-end sales charge of up to 5.75% for selling Class A shares, and 3.50% for selling Class T shares, some of which is paid to financial intermediaries for selling shares of the Fund. FDC receives the proceeds of contingent deferred sales charges levied on Class A, Class T, Class B, and Class C redemptions. These charges depend on the holding period. The deferred sales charges range from 5% to 1% for Class B, 1% for Class C, 1.00% to .50% for certain purchases of Class A shares and .25% for certain purchases of Class T shares.
For the period, sales charge amounts retained by FDC were as follows:
Retained | |
Class A | $ 564 |
Class T | 104 |
$ 668 |
Annual Report
Notes to Financial Statements - continued
6. Fees and Other Transactions with Affiliates - continued
Transfer Agent Fees. Fidelity Investments Institutional Operations Company, Inc. (FIIOC), an affiliate of FMR, is the transfer, dividend disbursing and shareholder servicing agent for each class of the Fund, except for Telecommunications. Fidelity Service Company, Inc. (FSC), an affiliate of FMR, is the transfer agent for Telecommunications shares. FIIOC and FSC receive account fees and asset-based fees that vary according to the account size and type of account of the shareholders of the respective classes of the Fund. FIIOC and FSC pay for typesetting, printing and mailing of shareholder reports, except proxy statements. For the period, the total transfer agent fees paid by each class to FIIOC or FSC, were as follows:
Amount | % of | |
Class A | $ 87 | .17 |
Class T | 119 | .23 |
Class B | 73 | .22 |
Class C | 87 | .24 |
Telecommunications | 1,520,066 | .31 |
Institutional Class | 87 | .27 |
$ 1,520,519 |
Accounting and Security Lending Fees. FSC maintains the Fund's accounting records. The accounting fee is based on the level of average net assets for the month. Under a separate contract, FSC administers the security lending program. The security lending fee is based on the number and duration of lending transactions.
Exchange Fees. During the period, FSC received the proceeds of a $7.50 fee to cover administrative costs associated with exchanges out of the Fund to any other Fidelity Select fund or to any other Fidelity fund made through non-automated channels. Effective October 1, 2006, the exchange fees were eliminated. For the period, exchange fees retained by FSC were as follows:
Retained | |
Telecommunications Portfolio | $ 4,433 |
Brokerage Commissions. The Fund placed a portion of its portfolio transactions with brokerage firms which are affiliates of the investment adviser. The commissions paid to these affiliated firms were $40,816 for the period.
Interfund Lending Program. Pursuant to an Exemptive Order issued by the SEC, the Fund, along with other registered investment companies having management contracts with FMR, may participate in an interfund lending program. This program provides an alternative credit facility allowing the funds to borrow from, or lend money to, other participating affiliated funds. At period end, there were no interfund loans outstanding. The Fund's activity in this program during the period for which loans were outstanding was as follows:
Borrower or Lender | Average Daily | Weighted Average | Interest |
Borrower | $ 9,539,417 | 4.98% | $ 15,851 |
7. Committed Line of Credit.
The Fund participates with other funds managed by FMR in a $4.2 billion credit facility (the "line of credit") to be utilized for temporary or emergency purposes to fund shareholder redemptions or for other short-term liquidity purposes. The Fund has agreed to pay commitment fees on its pro rata portion of the line of credit, which amounted to $1,183 and is reflected in Miscellaneous Expense on the Statement of Operations. During the period, there were no borrowings on this line of credit.
Annual Report
8. Security Lending.
The Fund lends portfolio securities from time to time in order to earn additional income. On the settlement date of the loan, the Fund receives collateral (in the form of U.S. Treasury obligations, letters of credit and/or cash) against the loaned securities and maintains collateral in an amount not less than 100% of the market value of the loaned securities during the period of the loan. The market value of the loaned securities is determined at the close of business of the Fund and any additional required collateral is delivered to the Fund on the next business day. If the borrower defaults on its obligation to return the securities loaned because of insolvency or other reasons, a fund could experience delays and costs in recovering the securities loaned or in gaining access to the collateral. Any cash collateral received is invested in the Fidelity Securities Lending Cash Central Fund. The value of loaned securities and cash collateral at period end are disclosed on the Fund's Statement of Assets and Liabilities. Security lending income represents the income earned on investing cash collateral, less fees and expenses associated with the loan, plus any premium payments that may be received on the loan of certain types of securities. Security lending income is presented in the Statement of Operations as a component of income from Fidelity Central Funds. Net income from lending portfolio securities during the period amounted to $208,152.
9. Expense Reductions.
FMR voluntarily agreed to reimburse a portion of Telecommunications' operating expenses. During the period, this reimbursement reduced the class' expenses by $56,875.
Many of the brokers with whom FMR places trades on behalf of the Fund provided services to the Fund in addition to trade execution. These services included payments of certain expenses on behalf of the Fund totaling $32,107 for the period. In addition, through arrangements with the each class' transfer agent, credits realized as a result of uninvested cash balances were used to reduce the Fund's expenses. During the period, credits reduced each class' transfer agent expense as noted in the table below.
Transfer Agent | |
Telecommunications | $ 5,774 |
10. Other.
The Fund's organizational documents provide former and current trustees and officers with a limited indemnification against liabilities arising in connection with the performance of their duties to the Fund. In the normal course of business, the Fund may also enter into contracts that provide general indemnifications. The Fund's maximum exposure under these arrangements is unknown as this would be dependent on future claims that may be made against the Fund. The risk of material loss from such claims is considered remote.
The United States Securities and Exchange Commission ("SEC") is conducting an investigation of FMR (covering the years 2002 to 2004) arising from gifts, gratuities and business entertainment provided by certain brokers to certain individuals who were employed on FMR's domestic equity trading desk during that period. FMR is in discussions with the SEC staff regarding the possible resolution of the matter, but as of period-end no final resolution has been reached.
In December 2006, the Independent Trustees completed their own investigation of the matter with the assistance of independent counsel. The Independent Trustees and FMR agree that, despite the absence of proof that the Fidelity mutual funds experienced diminished execution quality as a result of the improper receipt of gifts and business entertainment, the conduct at issue was serious and is worthy of redress. Accordingly, the Independent Trustees have requested and FMR has agreed to pay $42 million to Fidelity mutual funds, plus interest to be determined at the time that payment is made. A method of allocating this payment among the funds has not yet been determined. The total payment to the Fund is not anticipated to have a material impact on the Fund's net assets. In addition, FMR reimbursed related legal expenses which are recorded in the accompanying Statement of Operations as an expense reduction.
11. Distributions to Shareholders.
Distributions to shareholders of each class were as follows:
Years ended February 28, | 2007 | 2006 |
From net investment income | ||
Telecommunications | $ 5,987,382 | $ 3,005,035 |
Annual Report
Notes to Financial Statements - continued
12. Share Transactions.
Transactions for each class of shares were as follows:
Shares | Dollars | |||
Years ended February 28, | 2007A | 2006 | 2007A | 2006 |
Class A | ||||
Shares sold | 12,932 | - | $ 655,617 | $ - |
Shares redeemed | - | - | - | - |
Net increase (decrease) | 12,932 | - | $ 655,617 | $ - |
Class T | ||||
Shares sold | 11,066 | - | $ 555,092 | $ - |
Shares redeemed | (60) | - | (3,110) | - |
Net increase (decrease) | 11,006 | - | $ 551,982 | $ - |
Class B | ||||
Shares sold | 5,729 | - | $ 285,388 | $ - |
Shares redeemed | - | - | - | - |
Net increase (decrease) | 5,729 | - | $ 285,388 | $ - |
Class C | ||||
Shares sold | 6,538 | - | $ 326,374 | $ - |
Shares redeemed | - | - | - | - |
Net increase (decrease) | 6,538 | - | $ 326,374 | $ - |
Telecommunications | ||||
Shares sold | 12,699,449 | 3,070,553 | $ 581,140,315 | $ 116,810,248 |
Reinvestment of distributions | 124,102 | 74,920 | 5,727,266 | 2,869,866 |
Shares redeemed | (10,144,422) | (3,137,526) | (451,923,224) | (116,998,712) |
Net increase (decrease) | 2,679,129 | 7,947 | $ 134,944,357 | $ 2,681,402 |
Institutional Class | ||||
Shares sold | 3,391 | - | $ 162,500 | $ - |
Shares redeemed | (1,150) | - | (59,275) | - |
Net increase (decrease) | 2,241 | - | $ 103,225 | $ - |
A Share transactions for Class A, Class T, Class B, Class C and Institutional Class are for the period December 12, 2006 (commencement of sale of shares) to February 28, 2007.
Annual Report
Report of Independent Registered Public Accounting Firm
To the Trustees of Fidelity Select Portfolios and the Shareholders of Consumer Staples Portfolio, Gold Portfolio, Materials Portfolio and Telecommunications Portfolio:
In our opinion, the accompanying statements of assets and liabilities, including the schedules of investments, and the related statements of operations and of changes in net assets and the financial highlights present fairly, in all material respects, the financial position of Consumer Staples Portfolio, Gold Portfolio, Materials Portfolio and Telecommunications Portfolio (funds of Fidelity Select Portfolios) at February 28, 2007, the results of each of their operations for the year then ended, the changes in each of their net assets for each of the two years in the period then ended and the financial highlights for each of the periods indicated, in conformity with accounting principles generally accepted in the United States of America. These financial statements and financial highlights (hereafter referred to as "financial statements") are the responsibility of the Fidelity Select portfolios management. Our responsibility is to express an opinion on these financial statements based on our audits. We conducted our audits of these financial statements in accordance with the standards of the Public Company Accounting Oversight Board (United States). Those standards require that we plan and perform the audit to obtain reasonable assurance about whether the financial statements are free of material misstatement. An audit includes examining, on a test basis, evidence supporting the amounts and disclosures in the financial statements, assessing the accounting principles used and significant estimates made by management, and evaluating the overall financial statement presentation. We believe that our audits, which included confirmation of securities at February 28, 2007 by correspondence with the custodian and brokers, provide a reasonable basis for our opinion.
/s/ PricewaterhouseCoopers LLP
PricewaterhouseCoopers LLP
Boston, Massachusetts
April 23, 2007
Annual Report
Trustees and Officers
The Trustees, Member of the Advisory Board, and executive officers of the trust and funds, as applicable, are listed below. The Board of Trustees governs each fund and is responsible for protecting the interests of shareholders. The Trustees are experienced executives who meet periodically throughout the year to oversee each fund's activities, review contractual arrangements with companies that provide services to each fund, and review each fund's performance. Each of the Trustees oversees 349 funds advised by FMR or an affiliate.
The Trustees hold office without limit in time except that (a) any Trustee may resign; (b) any Trustee may be removed by written instrument, signed by at least two-thirds of the number of Trustees prior to such removal; (c) any Trustee who requests to be retired or who has become incapacitated by illness or injury may be retired by written instrument signed by a majority of the other Trustees; and (d) any Trustee may be removed at any special meeting of shareholders by a two-thirds vote of the outstanding voting securities of the trust. Each Trustee who is not an interested person (as defined in the 1940 Act) (Independent Trustee), shall retire not later than the last day of the calendar year in which his or her 72nd birthday occurs. The Independent Trustees may waive this mandatory retirement age policy with respect to individual Trustees. The executive officers and Advisory Board Member hold office without limit in time, except that any officer and Advisory Board Member may resign or may be removed by a vote of a majority of the Trustees at any regular meeting or any special meeting of the Trustees. Except as indicated, each individual has held the office shown or other offices in the same company for the past five years.
The funds' Statements of Additional Information (SAIs) include more information about the Trustees. To request a free copy, call Fidelity at 1-877-208-0098.
Interested Trustees*:
Correspondence intended for each Trustee who is an interested person may be sent to Fidelity Investments, 82 Devonshire Street, Boston, Massachusetts 02109.
Name, Age; Principal Occupation | |
Edward C. Johnson 3d (76) | |
Year of Election or Appointment: 1980 Mr. Johnson is Chairman of the Board of Trustees. Mr. Johnson serves as President (2006-present), Chief Executive Officer, Chairman, and a Director of FMR Corp.; Chairman and a Director of FMR; Chairman and a Director of Fidelity Research & Analysis Company (FRAC); Chairman and a Director of Fidelity Investments Money Management, Inc.; and Chairman (2001-present) and a Director of FMR Co., Inc. In addition, Mr. Johnson serves as Chairman and Director of Fidelity International Limited (FIL). | |
Robert L. Reynolds (54) | |
Year of Election or Appointment: 2003 Mr. Reynolds is President and a Director of FMR (2005-present), Fidelity Investments Money Management, Inc. (2005-present), and FMR Co., Inc. (2005-present). Mr. Reynolds also serves as Vice Chairman (2006-present), a Director (2003-present), and Chief Operating Officer of FMR Corp. and a Director of Strategic Advisers, Inc. (2005-present). He also serves on the Board at Fidelity Investments Canada, Ltd. | |
* Trustees have been determined to be "Interested Trustees" by virtue of, among other things, their affiliation with the trust or various entities under common control with FMR.
Independent Trustees:
Correspondence intended for each Independent Trustee (that is, the Trustees other than the Interested Trustees) may be sent to Fidelity Investments, P.O. Box 55235, Boston, Massachusetts 02205-5235.
Name, Age; Principal Occupation | |
Dennis J. Dirks (58) | |
Year of Election or Appointment: 2005 Prior to his retirement in May 2003, Mr. Dirks was Chief Operating Officer and a member of the Board of The Depository Trust & Clearing Corporation (DTCC) (1999-2003). He also served as President, Chief Operating Officer, and Board member of The Depository Trust Company (DTC) (1999-2003) and President and Board member of the National Securities Clearing Corporation (NSCC) (1999-2003). In addition, Mr. Dirks served as Chief Executive Officer and Board member of the Government Securities Clearing Corporation (2001-2003) and Chief Executive Officer and Board member of the Mortgage-Backed Securities Clearing Corporation (2001-2003). Mr. Dirks also serves as a Trustee and a member of the Finance Committee of Manhattan College (2005-present) and a Trustee and a member of the Finance Committee of AHRC of Nassau County (2006-present). | |
Albert R. Gamper, Jr. (64) | |
Year of Election or Appointment: 2006 Prior to his retirement in December 2004, Mr. Gamper served as Chairman of the Board of CIT Group Inc. (commercial finance). During his tenure with CIT Group Inc. Mr. Gamper served in numerous senior management positions, including Chairman (1987-1989; 1999-2001; 2002-2004), Chief Executive Officer (1987-2004), and President (1989-2002). He currently serves as a member of the Board of Directors of Public Service Enterprise Group (utilities, 2001-present), Chairman of the Board of Governors, Rutgers University (2004-present), and Chairman of the Board of Saint Barnabas Health Care System. | |
George H. Heilmeier (70) | |
Year of Election or Appointment: 2004 Dr. Heilmeier is Chairman Emeritus of Telcordia Technologies (communication software and systems), where prior to his retirement, he served as company Chairman and Chief Executive Officer. He currently serves on the Boards of Directors of The Mitre Corporation (systems engineering and information technology support for the government), and HRL Laboratories (private research and development, 2004-present). He is Chairman of the General Motors Science & Technology Advisory Board and a Life Fellow of the Institute of Electrical and Electronics Engineers (IEEE). Dr. Heilmeier is a member of the Defense Science Board and the National Security Agency Advisory Board. He is also a member of the National Academy of Engineering, the American Academy of Arts and Sciences, and the Board of Overseers of the School of Engineering and Applied Science of the University of Pennsylvania. Previously, Dr. Heilmeier served as a Director of TRW Inc. (automotive, space, defense, and information technology, 1992-2002), Compaq (1994-2002), Automatic Data Processing, Inc. (ADP) (technology-based business outsourcing, 1995-2002), INET Technologies Inc. (telecommunications network surveillance, 2001-2004), and Teletech Holdings (customer management services). He is the recipient of the 2005 Kyoto Prize in Advanced Technology for his invention of the liquid crystal display, and a member of the Consumer Electronics Hall of Fame. | |
James H. Keyes (66) | |
Year of Election or Appointment: 2007 Prior to his retirement in 2003, Mr. Keyes was Chairman, President, and Chief Executive Officer of Johnson Controls, Inc. (automotive supplier, 1993-2003). He currently serves as a member of the boards of LSI Logic Corporation (semiconductor technologies), Navistar International Corporation (manufacture and sale of trucks, buses, and diesel engines, 2002-present), and Pitney Bowes, Inc. (integrated mail, messaging, and document management solutions). | |
Marie L. Knowles (60) | |
Year of Election or Appointment: 2001 Prior to Ms. Knowles' retirement in June 2000, she served as Executive Vice President and Chief Financial Officer of Atlantic Richfield Company (ARCO) (diversified energy, 1996-2000). From 1993 to 1996, she was a Senior Vice President of ARCO and President of ARCO Transportation Company. She served as a Director of ARCO from 1996 to 1998. She currently serves as a Director of Phelps Dodge Corporation (copper mining and manufacturing) and McKesson Corporation (healthcare service, 2002-present). Ms. Knowles is a Trustee of the Brookings Institution and the Catalina Island Conservancy and also serves as a member of the Advisory Board for the School of Engineering of the University of Southern California. | |
Ned C. Lautenbach (63) | |
Year of Election or Appointment: 2000 Mr. Lautenbach is Chairman of the Independent Trustees (2006-present). Mr. Lautenbach has been a partner of Clayton, Dubilier & Rice, Inc. (private equity investment firm) since September 1998. Previously, Mr. Lautenbach was with the International Business Machines Corporation (IBM) from 1968 until his retirement in 1998. Mr. Lautenbach serves as a Director of Sony Corporation (2006-present) and Eaton Corporation (diversified industrial) as well as the Philharmonic Center for the Arts in Naples, Florida. He also is a member of the Board of Trustees of Fairfield University (2005-present), as well as a member of the Council on Foreign Relations. | |
Cornelia M. Small (62) | |
Year of Election or Appointment: 2005 Ms. Small is a member (2000-present) and Chairperson (2002-present) of the Investment Committee, and a member (2002-present) of the Board of Trustees of Smith College. Previously, she served as Chief Investment Officer (1999-2000), Director of Global Equity Investments (1996-1999), and a member of the Board of Directors of Scudder, Stevens & Clark (1990-1997) and Scudder Kemper Investments (1997-1999). In addition, Ms. Small served as Co-Chair (2000-2003) of the Annual Fund for the Fletcher School of Law and Diplomacy. | |
William S. Stavropoulos (67) | |
Year of Election or Appointment: 2001 Mr. Stavropoulos is Chairman Emeritus of the Board of Directors of The Dow Chemical Company. Since joining The Dow Chemical Company in 1967, Mr. Stavropoulos served in numerous senior management positions, including President (1993-2000; 2002-2003), CEO (1995-2000; 2002-2004), and Chairman of the Executive Committee (2000-2004). Currently, he is a Director of NCR Corporation (data warehousing and technology solutions), Chemical Financial Corporation, Maersk Inc. (industrial conglomerate, 2002-present), Tyco International, Inc. (multinational manufacturing and services, 2007-present), and a member of the Advisory Board for Metalmark Capital (private equity investment firm, 2005-present). He is a special advisor to Clayton, Dubilier & Rice, Inc., a private equity investment firm. He also serves as a member of the Board of Trustees of the American Enterprise Institute for Public Policy Research. In addition, Mr. Stavropoulos is a member of The Business Council, J.P. Morgan International Council and the University of Notre Dame Advisory Council for the College of Science. | |
Kenneth L. Wolfe (68) | |
Year of Election or Appointment: 2005 Prior to his retirement in 2001, Mr. Wolfe was Chairman and Chief Executive Officer of Hershey Foods Corporation (1993-2001). He currently serves as a member of the boards of Adelphia Communications Corporation (2003-present), Bausch & Lomb, Inc., and Revlon Inc. (2004-present). | |
Advisory Board Member and Executive Officers:
Correspondence intended for each executive officer and Mr. Lynch may be sent to Fidelity Investments, 82 Devonshire Street, Boston, Massachusetts 02109.
Name, Age; Principal Occupation | |
Peter S. Lynch (63) | |
Year of Election or Appointment: 2003 Member of the Advisory Board of Fidelity Select Portfolios. Mr. Lynch is Vice Chairman and a Director of FMR, and Vice Chairman (2001-present) and a Director of FMR Co., Inc. Previously, Mr. Lynch served as a Trustee of the Fidelity funds (1990-2003). In addition, he serves as a Trustee of Boston College and as the Chairman of the Inner-City Scholarship Fund. | |
Kimberley H. Monasterio (43) | |
Year of Election or Appointment: 2007 President and Treasurer of the funds. Ms. Monasterio also serves as President and Treasurer of other Fidelity funds (2007-present) and is an employee of FMR (2004-present). Previously, Ms. Monasterio served as Deputy Treasurer of the Fidelity funds (2004-2006). Before joining Fidelity Investments, Ms. Monasterio served as Treasurer (2000-2004) and Chief Financial Officer (2002-2004) of the Franklin Templeton Funds and Senior Vice President of Franklin Templeton Services, LLC (2000-2004). | |
Boyce I. Greer (51) | |
Year of Election or Appointment: 2005 Vice President of the funds. Mr. Greer also serves as Vice President of certain Equity Funds (2005-present), certain Asset Allocation Funds (2005-present), Fixed-Income Funds (2006-present), and Money Market Funds (2006-present). Mr. Greer is also a Trustee of other investment companies advised by FMR (2003-present). He is an Executive Vice President of FMR (2005-present) and FMR Co., Inc. (2005-present), and Senior Vice President of Fidelity Investments Money Management, Inc. (2006-present). Previously, Mr. Greer served as a Director and Managing Director of Strategic Advisers, Inc. (2002-2005), and Executive Vice President (2000-2002) and Money Market Group Leader (1997-2002) of the Fidelity Investments Fixed Income Division. He also served as Vice President of Fidelity's Money Market Funds (1997-2002), Senior Vice President of FMR (1997-2002), and Vice President of FIMM (1998-2002). | |
Eric D. Roiter (58) | |
Year of Election or Appointment: 1998 Secretary of the funds. He also serves as Secretary of other Fidelity funds; Vice President, General Counsel, and Secretary of FMR Co., Inc. (2001-present) and FMR; Assistant Secretary of Fidelity Management & Research (U.K.) Inc. (2001-present), Fidelity Research & Analysis Company (2001-present), and Fidelity Investments Money Management, Inc. (2001-present). Mr. Roiter is an Adjunct Member, Faculty of Law, at Boston College Law School (2003-present). Previously, Mr. Roiter served as Vice President and Secretary of Fidelity Distributors Corporation (FDC) (1998-2005). | |
Scott C. Goebel (39) | |
Year of Election or Appointment: 2007 Assistant Secretary of the funds. Mr. Goebel also serves as Assistant Secretary of other Fidelity funds (2007-present), Vice President and Secretary of FDC (2006-present), and is an employee of FMR. | |
R. Stephen Ganis (40) | |
Year of Election or Appointment: 2006 Anti-Money Laundering (AML) officer of the funds. Mr. Ganis also serves as AML officer of other Fidelity funds (2006-present) and FMR Corp. (2003-present). Before joining Fidelity Investments, Mr. Ganis practiced law at Goodwin Procter, LLP (2000-2002). | |
Joseph B. Hollis (58) | |
Year of Election or Appointment: 2006 Chief Financial Officer of the funds. Mr. Hollis also serves as Chief Financial Officer of other Fidelity funds. Mr. Hollis is President of Fidelity Pricing and Cash Management Services (FPCMS) (2005-present). Mr. Hollis also serves as President and Director of Fidelity Service Company, Inc. (2006-present). Previously, Mr. Hollis served as Senior Vice President of Cash Management Services (1999-2002) and Investment Management Operations (2002-2005). | |
Kenneth A. Rathgeber (59) | |
Year of Election or Appointment: 2004 Chief Compliance Officer of the funds. Mr. Rathgeber also serves as Chief Compliance Officer of other Fidelity funds (2004-present) and Executive Vice President of Risk Oversight for Fidelity Investments (2002-present). He is Chief Compliance Officer of FMR (2005-present), FMR Co., Inc. (2005-present), Fidelity Management & Research (U.K.) Inc. (2005-present), Fidelity Research & Analysis Company (2005-present), Fidelity Investments Money Management, Inc. (2005-present), and Strategic Advisers, Inc. (2005-present). Previously, Mr. Rathgeber served as Executive Vice President and Chief Operating Officer for Fidelity Investments Institutional Services Company, Inc. (1998-2002). | |
Bryan A. Mehrmann (45) | |
Year of Election or Appointment: 2005 Deputy Treasurer of the funds. Mr. Mehrmann also serves as Deputy Treasurer of other Fidelity funds (2005-present) and is an employee of FMR. Previously, Mr. Mehrmann served as Vice President of Fidelity Investments Institutional Services Group (FIIS)/Fidelity Investments Institutional Operations Corporation, Inc. (FIIOC) Client Services (1998-2004). | |
Kenneth B. Robins (37) | |
Year of Election or Appointment: 2005 Deputy Treasurer of the funds. Mr. Robins also serves as Deputy Treasurer of other Fidelity funds (2005-present) and is an employee of FMR (2004-present). Before joining Fidelity Investments, Mr. Robins worked at KPMG LLP, where he was a partner in KPMG's department of professional practice (2002-2004) and a Senior Manager (1999-2000). In addition, Mr. Robins served as Assistant Chief Accountant, United States Securities and Exchange Commission (2000-2002). | |
Robert G. Byrnes (40) | |
Year of Election or Appointment: 2005 Assistant Treasurer of the funds. Mr. Byrnes also serves as Assistant Treasurer of other Fidelity funds (2005-present) and is an employee of FMR (2005-present). Previously, Mr. Byrnes served as Vice President of FPCMS (2003-2005). Before joining Fidelity Investments, Mr. Byrnes worked at Deutsche Asset Management where he served as Vice President of the Investment Operations Group (2000-2003). | |
Peter L. Lydecker (53) | |
Year of Election or Appointment: 2004 Assistant Treasurer of the funds. Mr. Lydecker also serves as Assistant Treasurer of other Fidelity funds (2004) and is an employee of FMR. | |
Gary W. Ryan (48) | |
Year of Election or Appointment: 2005 Assistant Treasurer of the funds. Mr. Ryan also serves as Assistant Treasurer of other Fidelity funds (2005-present) and is an employee of FMR (2005-present). Previously, Mr. Ryan served as Vice President of Fund Reporting in FPCMS (1999-2005). | |
Salvatore Schiavone (41) | |
Year of Election or Appointment: 2005 Assistant Treasurer of the funds. Mr. Schiavone also serves as Assistant Treasurer of other Fidelity funds (2005-present) and is an employee of FMR (2005-present). Before joining Fidelity Investments, Mr. Schiavone worked at Deutsche Asset Management, where he most recently served as Assistant Treasurer (2003-2005) of the Scudder Funds and Vice President and Head of Fund Reporting (1996-2003). | |
Annual Report
Distributions
The Board of Trustees of each voted to pay to shareholders of record at the opening of business on record date, the following distributions per share derived from capital gains realized from sales of portfolio securities, and dividends derived from net investment income:
Pay Date | Record Date | Dividends | Capital Gains | |
Consumer Staples | 04/16/07 | 04/13/07 | $0.071 | $0.670 |
Gold | 04/16/07 | 04/13/07 | $0.190 | $1.580 |
Materials | 04/16/07 | 04/13/07 | $0.011 | $0.610 |
Telecommunications | 04/16/07 | 04/13/07 | $0.092 | $0.000 |
The funds hereby designate as capital gain dividend the amounts noted below for the taxable year ended February 28, 2007, or, if subsequently determined to be different, the net capital gain of such year.
Consumer Staples | $16,772,704 |
Gold | $75,675,851 |
Materials | $17,855,413 |
The funds will notify shareholders in January 2008 of amounts for use in preparing 2007 income tax returns.
Annual Report
Annual Report
Annual Report
Annual Report
Investment Adviser
Fidelity Management & Research Company
Boston, MA
Investment Sub-Advisers
FMR Co., Inc.
Fidelity Management & Research
(U.K.) Inc.
Fidelity Research & Analysis Company
Fidelity Investments Japan Limited
Fidelity International Investment Advisors
Fidelity International Investment Advisors
(U.K. Limited)
General Distributor
Fidelity Distributors Corporation
Boston, MA
Transfer and Service Agents
Fidelity Investments Institutional
Operations Company, Inc.
Boston, MA
Fidelity Service Company, Inc.
Boston, MA
Custodian
Brown Brothers Harriman & Co.
Boston, MA
Corporate Headquarters
82 Devonshire Street
Boston, MA 02109
1-800-544-8888
The Fidelity Telephone Connection
Mutual Fund 24-Hour Service
Exchanges/Redemptions
and Account Assistance 1-800-544-6666
Product Information 1-800-544-8888
Retirement Accounts 1-800-544-4774
(8 a.m. - 9 p.m.)
TDD Service 1-800-544-0118
for the deaf and hearing impaired
(9 a.m. - 9 p.m. Eastern time)
Fidelity Automated Service
Telephone (FAST®) (automated graphic) 1-800-544-5555
(automated graphic) Automated line for quickest service
ASGMTI-UANN-0407
1.845768.100
(Fidelity Investment logo)(registered trademark)
Corporate Headquarters
82 Devonshire St., Boston, MA 02109
www.fidelity.com
Item 2. Code of Ethics
As of the end of the period, February 28, 2007, Fidelity Select Portfolios (the trust) has adopted a code of ethics, as defined in Item 2 of Form N-CSR, that applies to its President and Treasurer and its Chief Financial Officer. A copy of the code of ethics is filed as an exhibit to this Form N-CSR.
Item 3. Audit Committee Financial Expert
The Board of Trustees of the trust has determined that Marie L. Knowles is an audit committee financial expert, as defined in Item 3 of Form N-CSR. Ms. Knowles is independent for purposes of Item 3 of Form N-CSR.
Item 4. Principal Accountant Fees and Services
(a) Audit Fees.
For the fiscal years ended February 28, 2007 and February 28, 2006, the aggregate Audit Fees billed by PricewaterhouseCoopers LLP (PwC) for professional services rendered for the audits of the financial statements, or services that are normally provided in connection with statutory and regulatory filings or engagements for those fiscal years, for the Air Transportation Portfolio, Automotive Portfolio, Banking Portfolio, Biotechnology Portfolio, Brokerage and Investment Management Portfolio, Chemicals Portfolio, Communications Equipment Portfolio, Computers Portfolio, Construction and Housing Portfolio, Consumer Discretionary Portfolio, Consumer Staples Portfolio, Defense and Aerospace Portfolio, Electronics Portfolio, Energy Portfolio, Energy Service Portfolio, Environmental Portfolio, Financial Services Portfolio, Gold Portfolio, Health Care Portfolio, Home Finance Portfolio, Industrial Equipment Portfolio, Industrials Portfolio, Insurance Portfolio, IT Services Portfolio, Leisure Portfolio, Materials Portfolio, Medical Delivery Portfolio, Medical Equipment and Systems Portfolio, Money Market Portfolio, Multimedia Portfolio, Natural Gas Portfolio, Natural Resources Portfolio, Networking and Infrastructure Portfolio, Paper and Forest Products Portfolio, Pharmaceuticals Portfolio, Retailing Portfolio, Software and Computer Services Portfolio, Technology Portfolio, Telecommunications Portfolio, Transportation Portfolio, Utilities Growth Portfolio and Wireless Portfolio (the funds) and for all funds in the Fidelity Group of Funds are shown in the table below.
Fund | 2007A | 2006A |
Air Transportation Portfolio | $30,000 | $28,000 |
Automotive Portfolio | $30,000 | $28,000 |
Banking Portfolio | $31,000 | $30,000 |
Biotechnology Portfolio | $34,000 | $33,000 |
Brokerage and Investment Management Portfolio | $33,000 | $31,000 |
Chemicals Portfolio | $30,000 | $29,000 |
Communications Equipment Portfolio | $31,000 | $30,000 |
Computers Portfolio | $31,000 | $30,000 |
Construction and Housing Portfolio | $30,000 | $29,000 |
Consumer Discretionary Portfolio | $30,000 | $28,000 |
Consumer Staples Portfolio | $32,000 | $29,000 |
Defense and Aerospace Portfolio | $32,000 | $31,000 |
Electronics Portfolio | $36,000 | $36,000 |
Energy Portfolio | $37,000 | $34,000 |
Energy Service Portfolio | $34,000 | $32,000 |
Environmental Portfolio | $30,000 | $28,000 |
Financial Services Portfolio | $31,000 | $31,000 |
Gold Portfolio | $35,000 | $31,000 |
Health Care Portfolio | $35,000 | $36,000 |
Home Finance Portfolio | $30,000 | $30,000 |
Industrial Equipment Portfolio | $30,000 | $28,000 |
Industrials Portfolio | $30,000 | $29,000 |
Insurance Portfolio | $30,000 | $29,000 |
IT Services Portfolio | $30,000 | $28,000 |
Leisure Portfolio | $30,000 | $29,000 |
Materials Portfolio | $32,000 | $29,000 |
Medical Delivery Portfolio | $32,000 | $32,000 |
Medical Equipment and Systems Portfolio | $32,000 | $32,000 |
Money Market Portfolio | $33,000 | $28,000 |
Multimedia Portfolio | $30,000 | $29,000 |
Natural Gas Portfolio | $33,000 | $33,000 |
Natural Resources Portfolio | $33,000 | $30,000 |
Networking and Infrastructure Portfolio | $30,000 | $28,000 |
Paper and Forest Products Portfolio | $30,000 | $28,000 |
Pharmaceuticals Portfolio | $30,000 | $29,000 |
Retailing Portfolio | $30,000 | $29,000 |
Software and Computer Services Portfolio | $31,000 | $30,000 |
Technology Portfolio | $34,000 | $34,000 |
Telecommunications Portfolio | $33,000 | $29,000 |
Transportation Portfolio | $30,000 | $29,000 |
Utilities Growth Portfolio | $31,000 | $29,000 |
Wireless Portfolio | $31,000 | $29,000 |
All funds in the Fidelity Group of Funds audited by PwC | $14,100,000 | $12,500,000 |
A | Aggregate amounts may reflect rounding. |
(b) Audit-Related Fees.
In each of the fiscal years ended February 28, 2007 and February 28, 2006, the aggregate Audit-Related Fees billed by PwC for services rendered for assurance and related services to each fund that are reasonably related to the performance of the audit or review of the fund's financial statements, but not reported as Audit Fees, are shown in the table below.
Fund | 2007A | 2006A |
Air Transportation Portfolio | $0 | $0 |
Automotive Portfolio | $0 | $0 |
Banking Portfolio | $0 | $0 |
Biotechnology Portfolio | $0 | $0 |
Brokerage and Investment Management Portfolio | $0 | $0 |
Chemicals Portfolio | $0 | $0 |
Communications Equipment Portfolio | $0 | $0 |
Computers Portfolio | $0 | $0 |
Construction and Housing Portfolio | $0 | $0 |
Consumer Discretionary Portfolio | $0 | $0 |
Consumer Staples Portfolio | $0 | $0 |
Defense and Aerospace Portfolio | $0 | $0 |
Electronics Portfolio | $0 | $0 |
Energy Portfolio | $0 | $0 |
Energy Service Portfolio | $0 | $0 |
Environmental Portfolio | $0 | $0 |
Financial Services Portfolio | $0 | $0 |
Gold Portfolio | $0 | $0 |
Health Care Portfolio | $0 | $0 |
Home Finance Portfolio | $0 | $0 |
Industrial Equipment Portfolio | $0 | $0 |
Industrials Portfolio | $0 | $0 |
Insurance Portfolio | $0 | $0 |
IT Services Portfolio | $0 | $0 |
Leisure Portfolio | $0 | $0 |
Materials Portfolio | $0 | $0 |
Medical Delivery Portfolio | $0 | $0 |
Medical Equipment and Systems Portfolio | $0 | $0 |
Money Market Portfolio | $0 | $0 |
Multimedia Portfolio | $0 | $0 |
Natural Gas Portfolio | $0 | $0 |
Natural Resources Portfolio | $0 | $0 |
Networking and Infrastructure Portfolio | $0 | $0 |
Paper and Forest Products Portfolio | $0 | $0 |
Pharmaceuticals Portfolio | $0 | $0 |
Retailing Portfolio | $0 | $0 |
Software and Computer Services Portfolio | $0 | $0 |
Technology Portfolio | $0 | $0 |
Telecommunications Portfolio | $0 | $0 |
Transportation Portfolio | $0 | $0 |
Utilities Growth Portfolio | $0 | $0 |
Wireless Portfolio | $0 | $0 |
A | Aggregate amounts may reflect rounding. |
In each of the fiscal years ended February 28, 2007 and February 28, 2006, the aggregate Audit-Related Fees that were billed by PwC that were required to be approved by the Audit Committee for services rendered on behalf of Fidelity Management & Research Company (FMR) and entities controlling, controlled by, or under common control with FMR (not including any sub-adviser whose role is primarily portfolio management and is subcontracted with or overseen by another investment adviser) that provide ongoing services to the funds ("Fund Service Providers") for assurance and related services that relate directly to the operations and financial reporting of each fund that are reasonably related to the performance of the audit or review of the fund's financial statements, but not reported as Audit Fees, are shown in the table below.
Billed By | 2007A | 2006A |
PwC | $0 | $0 |
A | Aggregate amounts may reflect rounding. |
Fees included in the audit-related category comprise assurance and related services (e.g., due diligence services) that are traditionally performed by the independent registered public accounting firm. These audit-related services include due diligence related to mergers and acquisitions, accounting consultations and audits in connection with acquisitions, internal control reviews, attest services that are not required by statute or regulation and consultation concerning financial accounting and reporting standards.
(c) Tax Fees.
In each of the fiscal years ended February 28, 2007 and February 28, 2006, the aggregate Tax Fees billed by PwC for professional services rendered for tax compliance, tax advice, and tax planning for each fund is shown in the table below.
Fund | 2007A | 2006A |
Air Transportation Portfolio | $2,100 | $2,000 |
Automotive Portfolio | $2,100 | $2,000 |
Banking Portfolio | $2,100 | $2,000 |
Biotechnology Portfolio | $2,100 | $2,000 |
Brokerage and Investment Management Portfolio | $2,100 | $2,000 |
Chemicals Portfolio | $2,100 | $2,000 |
Communications Equipment Portfolio | $2,100 | $2,000 |
Computers Portfolio | $2,100 | $2,000 |
Construction and Housing Portfolio | $2,100 | $2,000 |
Consumer Discretionary Portfolio | $2,100 | $2,000 |
Consumer Staples Portfolio | $2,100 | $2,000 |
Defense and Aerospace Portfolio | $2,100 | $2,000 |
Electronics Portfolio | $2,100 | $2,000 |
Energy Portfolio | $2,100 | $2,000 |
Energy Service Portfolio | $2,100 | $2,000 |
Environmental Portfolio | $2,100 | $2,000 |
Financial Services Portfolio | $2,100 | $2,000 |
Gold Portfolio | $2,100 | $2,000 |
Health Care Portfolio | $2,100 | $2,000 |
Home Finance Portfolio | $2,100 | $2,000 |
Industrial Equipment Portfolio | $2,100 | $2,000 |
Industrials Portfolio | $2,100 | $2,000 |
Insurance Portfolio | $2,100 | $2,000 |
IT Services Portfolio | $2,100 | $2,000 |
Leisure Portfolio | $2,100 | $2,000 |
Materials Portfolio | $2,100 | $2,000 |
Medical Delivery Portfolio | $2,100 | $2,000 |
Medical Equipment and Systems Portfolio | $2,100 | $2,000 |
Money Market Portfolio | $2,100 | $2,000 |
Multimedia Portfolio | $2,100 | $2,000 |
Natural Gas Portfolio | $2,100 | $2,000 |
Natural Resources Portfolio | $2,100 | $2,000 |
Networking and Infrastructure Portfolio | $2,100 | $2,000 |
Paper and Forest Products Portfolio | $2,100 | $2,000 |
Pharmaceuticals Portfolio | $2,100 | $2,000 |
Retailing Portfolio | $2,100 | $2,000 |
Software and Computer Services Portfolio | $2,100 | $2,000 |
Technology Portfolio | $2,100 | $2,000 |
Telecommunications Portfolio | $2,100 | $2,000 |
Transportation Portfolio | $2,100 | $2,000 |
Utilities Growth Portfolio | $2,100 | $2,000 |
Wireless Portfolio | $2,100 | $2,000 |
A | Aggregate amounts may reflect rounding. |
In each of the fiscal years ended February 28, 2007 and February 28, 2006, the aggregate Tax Fees billed by PwC that were required to be approved by the Audit Committee for professional services rendered on behalf of the Fund Service Providers for tax compliance, tax advice, and tax planning that relate directly to the operations and financial reporting of each fund is shown in the table below.
Billed By | 2007A | 2006A |
PwC | $0 | $0 |
A | Aggregate amounts may reflect rounding. |
Fees included in the Tax Fees category comprise all services performed by professional staff in the independent registered public accounting firm's tax division except those services related to the audit. Typically, this category would include fees for tax compliance, tax planning, and tax advice. Tax compliance, tax advice, and tax planning services include preparation of original and amended tax returns, claims for refund and tax payment-planning services, assistance with tax audits and appeals, tax advice related to mergers and acquisitions and requests for rulings or technical advice from taxing authorities.
(d) All Other Fees.
In each of the fiscal years ended February 28, 2007 and February 28, 2006, the aggregate Other Fees billed by PwC for all other non-audit services rendered to the funds is shown in the table below.
Fund | 2007A | 2006A |
Air Transportation Portfolio | $1,100 | $1,400 |
Automotive Portfolio | $1,100 | $1,400 |
Banking Portfolio | $1,300 | $1,700 |
Biotechnology Portfolio | $2,000 | $2,800 |
Brokerage and Investment Management Portfolio | $1,700 | $1,900 |
Chemicals Portfolio | $1,100 | $1,500 |
Communications Equipment Portfolio | $1,300 | $1,800 |
Computers Portfolio | $1,300 | $1,900 |
Construction and Housing Portfolio | $1,200 | $1,600 |
Consumer Discretionary Portfolio | $1,100 | $1,400 |
Consumer Staples Portfolio | $1,200 | $1,500 |
Defense and Aerospace Portfolio | $1,600 | $2,000 |
Electronics Portfolio | $2,500 | $3,800 |
Energy Portfolio | $2,600 | $3,000 |
Energy Service Portfolio | $2,100 | $2,400 |
Environmental Portfolio | $1,100 | $1,400 |
Financial Services Portfolio | $1,300 | $1,800 |
Gold Portfolio | $1,900 | $2,100 |
Health Care Portfolio | $2,400 | $3,300 |
Home Finance Portfolio | $1,200 | $1,700 |
Industrial Equipment Portfolio | $1,100 | $1,400 |
Industrials Portfolio | $1,100 | $1,400 |
Insurance Portfolio | $1,200 | $1,500 |
IT Services Portfolio | $1,100 | $1,400 |
Leisure Portfolio | $1,200 | $1,500 |
Materials Portfolio | $1,200 | $1,500 |
Medical Delivery Portfolio | $1,600 | $2,500 |
Medical Equipment and Systems Portfolio | $1,600 | $2,400 |
Money Market Portfolio | $1,800 | $1,500 |
Multimedia Portfolio | $1,100 | $1,400 |
Natural Gas Portfolio | $1,900 | $2,600 |
Natural Resources Portfolio | $1,700 | $1,800 |
Networking and Infrastructure Portfolio | $1,100 | $1,500 |
Paper and Forest Products Portfolio | $1,100 | $1,400 |
Pharmaceuticals Portfolio | $1,100 | $1,500 |
Retailing Portfolio | $1,100 | $1,400 |
Software and Computer Services Portfolio | $1,400 | $1,900 |
Technology Portfolio | $2,100 | $3,100 |
Telecommunications Portfolio | $1,300 | $1,700 |
Transportation Portfolio | $1,100 | $1,400 |
Utilities Growth Portfolio | $1,300 | $1,700 |
Wireless Portfolio | $1,300 | $1,700 |
A | Aggregate amounts may reflect rounding. |
In each of the fiscal years ended February 28, 2007 and February 28, 2006, the aggregate Other Fees billed by PwC that were required to be approved by the Audit Committee for all other non-audit services rendered on behalf of the Fund Service Providers that relate directly to the operations and financial reporting of each fund is shown in the table below.
Billed By | 2007A | 2006A |
PwC | $125,000 | $155,000 |
A | Aggregate amounts may reflect rounding. |
Fees included in the All Other Fees category include services related to internal control reviews, strategy and other consulting, financial information systems design and implementation, consulting on other information systems, and other tax services unrelated to the fund.
(e) (1) | Audit Committee Pre-Approval Policies and Procedures: |
The trust's Audit Committee must pre-approve all audit and non-audit services provided by the independent registered public accounting firm relating to the operations or financial reporting of the funds. Prior to the commencement of any audit or non-audit services to a fund, the Audit Committee reviews the services to determine whether they are appropriate and permissible under applicable law.
The trust's Audit Committee has adopted policies and procedures to, among other purposes, provide a framework for the Committee's consideration of non-audit services by the audit firms that audit the Fidelity funds. The policies and procedures require that any non-audit service provided by a fund audit firm to a Fidelity Fund and any non-audit service provided by a fund auditor to a Fund Service Provider that relates directly to the operations and financial reporting of a Fidelity fund (Covered Service) are subject to approval by the Audit Committee before such service is provided. Non-audit services provided by a fund audit firm for a Fund Service Provider that do not relate directly to the operations and financial reporting of a Fidelity fund (Non-Covered Service) but that are expected to exceed $50,000 are also subject to pre-approval by the Audit Committee.
All Covered Services, as well as Non-Covered Services that are expected to exceed $50,000, must be approved in advance of provision of the service either: (i) by formal resolution of the Audit Committee, or (ii) by oral or written approval of the service by the Chair of the Audit Committee (or if the Chair is unavailable, such other member of the Audit Committee as may be designated by the Chair to act in the Chair's absence). The approval contemplated by (ii) above is permitted where the Treasurer determines that action on such an engagement is necessary before the next meeting of the Audit Committee. Neither pre-approval nor advance notice of Non-Covered Service engagements for which fees are not expected to exceed $50,000 is required; such engagements are to be reported to the Audit Committee monthly.
(e) (2) | Services approved pursuant to paragraph (c)(7)(i)(C) of Rule 2-01 of Regulation S-X: |
Audit-Related Fees:
There were no amounts that were approved by the Audit Committee pursuant to the de minimis exception for the fiscal years ended February 28, 2007 and February 28, 2006 on behalf of each fund.
There were no amounts that were required to be approved by the Audit Committee pursuant to the de minimis exception for the fiscal years ended February 28, 2007 and February 28, 2006 on behalf of the Fund Service Providers that relate directly to the operations and financial reporting of each fund.
Tax Fees:
There were no amounts that were approved by the Audit Committee pursuant to the de minimis exception for the fiscal years ended February 28, 2007 and February 28, 2006 on behalf of each fund.
There were no amounts that were required to be approved by the Audit Committee pursuant to the de minimis exception for the fiscal years ended February 28, 2007 and February 28, 2006 on behalf of the Fund Service Providers that relate directly to the operations and financial reporting of each fund.
All Other Fees:
There were no amounts that were approved by the Audit Committee pursuant to the de minimis exception for the fiscal years ended February 28, 2007 and February 28, 2006 on behalf of each fund.
There were no amounts that were required to be approved by the Audit Committee pursuant to the de minimis exception for the fiscal years ended February 28, 2007 and February 28, 2006 on behalf of the Fund Service Providers that relate directly to the operations and financial reporting of each fund.
(f) Not applicable.
(g) For the fiscal years ended February 28, 2007 and February 28, 2006, the aggregate fees billed by PwC of $1,405,000A and $1,325,000A for non-audit services rendered on behalf of the funds, FMR (not including any sub-adviser whose role is primarily portfolio management and is subcontracted with or overseen by another investment adviser) and Fund Service Providers relating to Covered Services and Non-Covered Services are shown in the table below.
2007A | 2006A | |
Covered Services | $275,000 | $325,000 |
Non-Covered Services | $1,130,000 | $1,000,000 |
A | Aggregate amounts may reflect rounding. |
(h) The trust's Audit Committee has considered Non-Covered Services that were not pre-approved that were provided by PwC to Fund Service Providers to be compatible with maintaining the independence of PwC in its audit of the funds, taking into account representations from PwC, in accordance with Independence Standards Board Standard No.1, regarding its independence from the funds and their related entities.
Item 5. Audit Committee of Listed Registrants
Not applicable.
Item 6. Schedule of Investments
Not applicable.
Item 7. Disclosure of Proxy Voting Policies and Procedures for Closed-End Management Investment Companies
Not applicable.
Item 8. Portfolio Managers of Closed-End Management Investment Companies
Not applicable.
Item 9. Purchase of Equity Securities by Closed-End Management Investment Company and Affiliated Purchasers
Not applicable.
Item 10. Submission of Matters to a Vote of Security Holders
There were no material changes to the procedures by which shareholders may recommend nominees to the trust's Board of Trustees.
Item 11. Controls and Procedures
(a)(i) The President and Treasurer and the Chief Financial Officer have concluded that the trust's disclosure controls and procedures (as defined in Rule 30a-3(c) under the Investment Company Act) provide reasonable assurances that material information relating to the trust is made known to them by the appropriate persons, based on their evaluation of these controls and procedures as of a date within 90 days of the filing date of this report.
(a)(ii) There was no change in the trust's internal control over financial reporting (as defined in Rule 30a-3(d) under the Investment Company Act) that occurred during the second fiscal quarter of the period covered by this report that has materially affected, or is reasonably likely to materially affect, the trust's internal control over financial reporting.
Item 12. Exhibits
(a) | (1) | Code of Ethics pursuant to Item 2 of Form N-CSR is filed and attached hereto as EX-99.CODE ETH. |
(a) | (2) | Certification pursuant to Rule 30a-2(a) under the Investment Company Act of 1940 (17 CFR 270.30a-2(a)) is filed and attached hereto as Exhibit 99.CERT. |
(a) | (3) | Not applicable. |
(b) | Certification pursuant to Rule 30a-2(b) under the Investment Company Act of 1940 (17 CFR 270.30a-2(b)) is furnished and attached hereto as Exhibit 99.906CERT. |
SIGNATURES
Pursuant to the requirements of the Securities Exchange Act of 1934 and the Investment Company Act of 1940, the registrant has duly caused this report to be signed on its behalf by the undersigned, thereunto duly authorized.
Fidelity Select Portfolios
By: | /s/Kimberley Monasterio |
Kimberley Monasterio | |
President and Treasurer | |
Date: | April 20, 2007 |
Pursuant to the requirements of the Securities Exchange Act of 1934 and the Investment Company Act of 1940, this report has been signed below by the following persons on behalf of the registrant and in the capacities and on the dates indicated.
By: | /s/Kimberley Monasterio |
Kimberley Monasterio | |
President and Treasurer | |
Date: | April 20, 2007 |
By: | /s/Joseph B. Hollis |
Joseph B. Hollis | |
Chief Financial Officer | |
Date: | April 20, 2007 |