UNITED STATES
SECURITIES AND EXCHANGE COMMISSION
Washington, D.C. 20549
FORM N-CSR
CERTIFIED SHAREHOLDER REPORT OF REGISTERED
MANAGEMENT INVESTMENT COMPANIES
Investment Company Act file number 811-02105
Fidelity Salem Street Trust
(Exact name of registrant as specified in charter)
245 Summer St., Boston, Massachusetts 02210
(Address of principal executive offices) (Zip code)
Margaret Carey, Secretary
245 Summer St.
Boston, Massachusetts 02210
(Name and address of agent for service)
Registrant's telephone number, including area code:
617-563-7000
Date of fiscal year end: | February 29 |
Date of reporting period: | February 29, 2024 |
Item 1.
Reports to Stockholders


Contents
| Average Annual Total Returns | |||
Periods ended February 29, 2024 | Past 1 year | Past 5 years | Past 10 years |
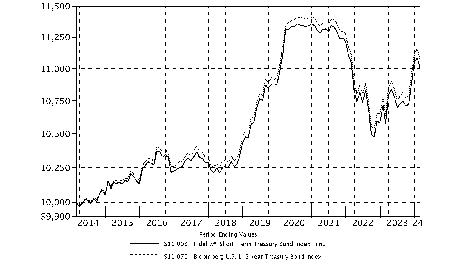
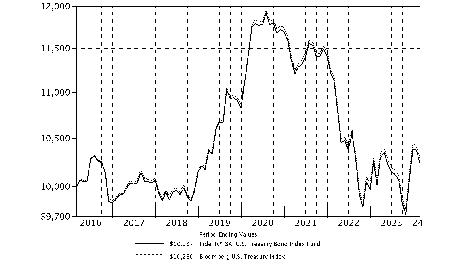
| Fidelity® Short-Term Treasury Bond Index Fund | 4.03% | 0.99% | 0.96% |
| $10,000 Over 10 Years |
Let's say hypothetically that $10,000 was invested in Fidelity® Short-Term Treasury Bond Index Fund on February 28, 2014. The chart shows how the value of your investment would have changed, and also shows how the Bloomberg U.S. 1-5 Year Treasury Bond Index performed over the same period. |
 |
| Average Annual Total Returns | |||
Periods ended February 29, 2024 | Past 1 year | Past 5 years | Past 10 years |
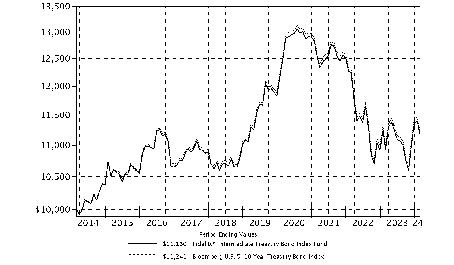
| Fidelity® Intermediate Treasury Bond Index Fund | 2.39% | 0.24% | 1.12% |
| $10,000 Over 10 Years |
Let's say hypothetically that $10,000 was invested in Fidelity® Intermediate Treasury Bond Index Fund on February 28, 2014. The chart shows how the value of your investment would have changed, and also shows how the Bloomberg U.S. 5-10 Year Treasury Bond Index performed over the same period. |
 |
| Average Annual Total Returns | |||
Periods ended February 29, 2024 | Past 1 year | Past 5 years | Past 10 years |
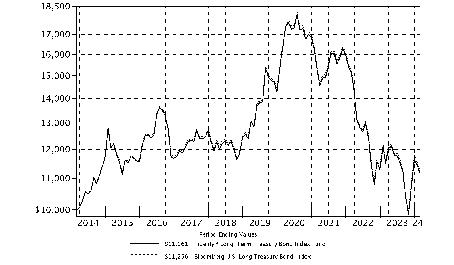
| Fidelity® Long-Term Treasury Bond Index Fund | -2.96% | -2.07% | 1.10% |
| $10,000 Over 10 Years |
Let's say hypothetically that $10,000 was invested in Fidelity® Long-Term Treasury Bond Index Fund on February 28, 2014. The chart shows how the value of your investment would have changed, and also shows how the Bloomberg U.S. Long Treasury Bond Index performed over the same period. |
 |
| Coupon Distribution (% of Fund's Investments) | ||
| 0.01 - 0.99% | 43.0 | |
| 1 - 1.99% | 18.8 | |
| 2 - 2.99% | 10.2 | |
| 3 - 3.99% | 8.3 | |
| 4 - 4.99% | 15.5 | |
| 5 - 5.99% | 0.3 | |
| 6 - 6.99% | 2.2 | |
| Coupon distribution shows the range of stated interest rates on the fund's investments, excluding short-term investments. | ||
Asset Allocation (% of Fund's net assets) |
 |
| U.S. Government and Government Agency Obligations - 99.3% | |||
Principal Amount (a) | Value ($) | ||
| U.S. Treasury Obligations - 99.3% | |||
| U.S. Treasury Bonds: | |||
| 5.5% 8/15/28 | 11,500,000 | 12,059,277 | |
| 6% 2/15/26 | 56,000,000 | 57,465,625 | |
| 6.375% 8/15/27 | 13,450,000 | 14,304,285 | |
| 6.5% 11/15/26 | 4,300,000 | 4,523,566 | |
| U.S. Treasury Notes: | |||
| 0.25% 5/15/24 | 4,000 | 3,958 | |
| 0.25% 5/31/25 | 70,999,000 | 67,019,173 | |
| 0.25% 6/30/25 | 167,297,000 | 157,429,087 | |
| 0.25% 7/31/25 | 66,709,000 | 62,555,323 | |
| 0.25% 8/31/25 | 1,777,000 | 1,661,009 | |
| 0.25% 9/30/25 | 73,948,000 | 68,892,961 | |
| 0.25% 10/31/25 | 65,108,000 | 60,453,795 | |
| 0.375% 4/30/25 | 48,530,000 | 46,044,733 | |
| 0.375% 11/30/25 | 74,272,000 | 68,904,688 | |
| 0.375% 12/31/25 (b) | 44,806,000 | 41,452,551 | |
| 0.375% 1/31/26 | 53,641,000 | 49,462,869 | |
| 0.375% 7/31/27 | 69,145,000 | 60,431,650 | |
| 0.375% 9/30/27 | 49,700,000 | 43,194,348 | |
| 0.5% 3/31/25 | 64,156,000 | 61,143,676 | |
| 0.5% 2/28/26 | 108,901,000 | 100,401,617 | |
| 0.5% 5/31/27 | 38,450,000 | 33,956,156 | |
| 0.5% 6/30/27 | 42,550,000 | 37,475,580 | |
| 0.5% 8/31/27 | 4,638,000 | 4,061,149 | |
| 0.5% 10/31/27 | 38,100,000 | 33,167,836 | |
| 0.625% 7/31/26 | 114,762,000 | 104,630,667 | |
| 0.625% 3/31/27 | 42,900,000 | 38,284,899 | |
| 0.625% 11/30/27 | 17,100,000 | 14,921,086 | |
| 0.625% 12/31/27 | 72,400,000 | 62,976,688 | |
| 0.75% 3/31/26 | 37,599,000 | 34,764,388 | |
| 0.75% 4/30/26 | 111,232,000 | 102,546,345 | |
| 0.75% 5/31/26 | 28,334,000 | 26,047,358 | |
| 0.75% 8/31/26 | 32,555,000 | 29,696,264 | |
| 0.75% 1/31/28 | 70,000,000 | 61,042,188 | |
| 0.875% 6/30/26 | 11,468,000 | 10,551,904 | |
| 0.875% 9/30/26 | 25,000,000 | 22,832,031 | |
| 1% 7/31/28 | 57,300,000 | 49,761,469 | |
| 1.125% 10/31/26 | 52,000,000 | 47,659,219 | |
| 1.125% 2/29/28 | 6,900,000 | 6,095,449 | |
| 1.25% 11/30/26 | 33,550,000 | 30,789,988 | |
| 1.25% 12/31/26 | 86,000,000 | 78,794,141 | |
| 1.25% 3/31/28 | 6,800,000 | 6,025,172 | |
| 1.25% 4/30/28 | 43,450,000 | 38,407,424 | |
| 1.25% 5/31/28 | 94,500,000 | 83,363,028 | |
| 1.25% 6/30/28 | 5,100,000 | 4,488,797 | |
| 1.25% 9/30/28 | 69,650,000 | 60,908,381 | |
| 1.5% 1/31/27 | 43,913,000 | 40,423,975 | |
| 1.625% 2/15/26 | 18,261,000 | 17,240,239 | |
| 1.625% 5/15/26 | 31,645,000 | 29,701,799 | |
| 1.625% 10/31/26 | 57,250,000 | 53,188,828 | |
| 1.875% 7/31/26 | 8,900,000 | 8,366,695 | |
| 1.875% 2/28/27 | 23,400,000 | 21,740,063 | |
| 1.875% 2/28/29 | 89,550,000 | 79,968,849 | |
| 2% 5/31/24 | 28,000 | 27,769 | |
| 2% 8/15/25 | 22,242,000 | 21,367,959 | |
| 2.125% 9/30/24 | 17,000 | 16,697 | |
| 2.125% 5/15/25 | 12,159,000 | 11,764,307 | |
| 2.125% 5/31/26 | 12,650,000 | 11,996,746 | |
| 2.25% 4/30/24 | 29,000 | 28,853 | |
| 2.25% 11/15/25 | 34,438,000 | 33,047,028 | |
| 2.25% 2/15/27 | 8,100,000 | 7,615,898 | |
| 2.25% 8/15/27 | 14,900,000 | 13,894,250 | |
| 2.25% 11/15/27 | 24,300,000 | 22,567,676 | |
| 2.5% 5/15/24 | 24,000 | 23,858 | |
| 2.5% 3/31/27 | 35,100,000 | 33,188,695 | |
| 2.625% 3/31/25 | 30,200,000 | 29,449,719 | |
| 2.625% 4/15/25 | 6,750,000 | 6,577,031 | |
| 2.625% 12/31/25 | 1,150,000 | 1,108,807 | |
| 2.625% 1/31/26 | 21,100,000 | 20,324,410 | |
| 2.625% 5/31/27 | 47,250,000 | 44,725,078 | |
| 2.75% 6/30/25 | 34,100,000 | 33,184,894 | |
| 2.75% 4/30/27 | 15,400,000 | 14,653,461 | |
| 2.75% 7/31/27 | 14,000,000 | 13,280,313 | |
| 2.75% 2/15/28 | 11,700,000 | 11,030,906 | |
| 2.875% 11/30/25 | 29,550,000 | 28,643,877 | |
| 3% 7/15/25 | 7,450,000 | 7,267,533 | |
| 3.125% 8/15/25 | 30,400,000 | 29,681,563 | |
| 3.125% 8/31/27 | 6,444,000 | 6,183,471 | |
| 3.25% 6/30/27 | 9,050,000 | 8,735,018 | |
| 3.5% 1/31/28 | 59,350,000 | 57,567,182 | |
| 3.5% 4/30/28 | 1,600,000 | 1,550,375 | |
| 3.75% 4/15/26 | 11,500,000 | 11,304,590 | |
| 3.75% 12/31/28 | 117,000,000 | 114,340,078 | |
| 3.875% 11/30/27 | 56,350,000 | 55,414,502 | |
| 4% 12/15/25 | 26,650,000 | 26,324,162 | |
| 4% 2/29/28 | 7,500,000 | 7,407,715 | |
| 4.125% 6/15/26 | 4,050,000 | 4,012,348 | |
| 4.125% 9/30/27 | 20,050,000 | 19,887,877 | |
| 4.125% 10/31/27 | 24,500,000 | 24,299,024 | |
| 4.375% 12/15/26 | 16,850,000 | 16,815,773 | |
| 4.375% 8/31/28 | 120,850,000 | 121,237,097 | |
| 4.375% 11/30/28 | 105,850,000 | 106,296,555 | |
| 4.625% 6/30/25 | 58,150,000 | 57,966,010 | |
| 4.625% 9/15/26 | 63,550,000 | 63,726,252 | |
| 4.625% 10/15/26 | 27,900,000 | 27,991,547 | |
| 4.625% 11/15/26 | 1,950,000 | 1,957,313 | |
| 4.875% 10/31/28 | 64,400,000 | 65,974,781 | |
| TOTAL U.S. GOVERNMENT AND GOVERNMENT AGENCY OBLIGATIONS (Cost $3,525,649,805) | 3,445,741,244 | ||
| Money Market Funds - 1.6% | |||
| Shares | Value ($) | ||
| Fidelity Cash Central Fund 5.39% (c) | 21,928,306 | 21,932,692 | |
| Fidelity Securities Lending Cash Central Fund 5.39% (c)(d) | 33,869,193 | 33,872,580 | |
| TOTAL MONEY MARKET FUNDS (Cost $55,805,272) | 55,805,272 | ||
| TOTAL INVESTMENT IN SECURITIES - 100.9% (Cost $3,581,455,077) | 3,501,546,516 |
NET OTHER ASSETS (LIABILITIES) - (0.9)% | (30,601,463) |
| NET ASSETS - 100.0% | 3,470,945,053 |
| (a) | Amount is stated in United States dollars unless otherwise noted. |
| (b) | Security or a portion of the security is on loan at period end. |
| (c) | Affiliated fund that is generally available only to investment companies and other accounts managed by Fidelity Investments. The rate quoted is the annualized seven-day yield of the fund at period end. A complete unaudited listing of the fund's holdings as of its most recent quarter end is available upon request. In addition, each Fidelity Central Fund's financial statements, which are not covered by the Fund's Report of Independent Registered Public Accounting Firm, are available on the SEC's website or upon request. |
| (d) | Investment made with cash collateral received from securities on loan. |
| Affiliate | Value, beginning of period ($) | Purchases ($) | Sales Proceeds ($) | Dividend Income ($) | Realized Gain (loss) ($) | Change in Unrealized appreciation (depreciation) ($) | Value, end of period ($) | % ownership, end of period |
| Fidelity Cash Central Fund 5.39% | 10,146,929 | 549,485,169 | 537,699,406 | 536,424 | - | - | 21,932,692 | 0.0% |
| Fidelity Securities Lending Cash Central Fund 5.39% | 201,134,716 | 613,875,681 | 781,137,817 | 29,090 | - | - | 33,872,580 | 0.1% |
| Total | 211,281,645 | 1,163,360,850 | 1,318,837,223 | 565,514 | - | - | 55,805,272 | |
| Valuation Inputs at Reporting Date: | ||||
| Description | Total ($) | Level 1 ($) | Level 2 ($) | Level 3 ($) |
Investments in Securities: | ||||
| U.S. Government and Government Agency Obligations | 3,445,741,244 | - | 3,445,741,244 | - |
| Money Market Funds | 55,805,272 | 55,805,272 | - | - |
| Total Investments in Securities: | 3,501,546,516 | 55,805,272 | 3,445,741,244 | - |
| Statement of Assets and Liabilities | ||||
| February 29, 2024 | ||||
| Assets | ||||
| Investment in securities, at value (including securities loaned of $33,161,435) - See accompanying schedule: | ||||
Unaffiliated issuers (cost $3,525,649,805) | $ | 3,445,741,244 | ||
Fidelity Central Funds (cost $55,805,272) | 55,805,272 | |||
| Total Investment in Securities (cost $3,581,455,077) | $ | 3,501,546,516 | ||
| Receivable for investments sold | 114,600,127 | |||
| Receivable for fund shares sold | 3,111,577 | |||
| Interest receivable | 13,453,762 | |||
| Distributions receivable from Fidelity Central Funds | 49,512 | |||
Total assets | 3,632,761,494 | |||
| Liabilities | ||||
| Payable for investments purchased | $ | 124,790,676 | ||
| Payable for fund shares redeemed | 1,847,297 | |||
| Distributions payable | 1,219,183 | |||
| Accrued management fee | 86,705 | |||
| Collateral on securities loaned | 33,872,580 | |||
| Total Liabilities | 161,816,441 | |||
| Net Assets | $ | 3,470,945,053 | ||
| Net Assets consist of: | ||||
| Paid in capital | $ | 3,657,546,306 | ||
| Total accumulated earnings (loss) | (186,601,253) | |||
| Net Assets | $ | 3,470,945,053 | ||
Net Asset Value, offering price and redemption price per share ($3,470,945,053 ÷ 345,609,207 shares) | $ | 10.04 | ||
| Statement of Operations | ||||
Year ended February 29, 2024 | ||||
| Investment Income | ||||
| Interest | $ | 116,080,302 | ||
| Income from Fidelity Central Funds (including $29,090 from security lending) | 565,514 | |||
| Total Income | 116,645,816 | |||
| Expenses | ||||
| Management fee | $ | 1,150,164 | ||
| Independent trustees' fees and expenses | 12,994 | |||
| Total expenses before reductions | 1,163,158 | |||
| Expense reductions | (125) | |||
| Total expenses after reductions | 1,163,033 | |||
| Net Investment income (loss) | 115,482,783 | |||
| Realized and Unrealized Gain (Loss) | ||||
| Net realized gain (loss) on: | ||||
| Investment Securities: | ||||
| Unaffiliated issuers | (85,090,999) | |||
| Total net realized gain (loss) | (85,090,999) | |||
| Change in net unrealized appreciation (depreciation) on investment securities | 133,588,040 | |||
| Net gain (loss) | 48,497,041 | |||
| Net increase (decrease) in net assets resulting from operations | $ | 163,979,824 | ||
| Statement of Changes in Net Assets | ||||
Year ended February 29, 2024 | Year ended February 28, 2023 | |||
| Increase (Decrease) in Net Assets | ||||
| Operations | ||||
| Net investment income (loss) | $ | 115,482,783 | $ | 61,541,099 |
| Net realized gain (loss) | (85,090,999) | (89,024,350) | ||
| Change in net unrealized appreciation (depreciation) | 133,588,040 | (132,404,510) | ||
| Net increase (decrease) in net assets resulting from operations | 163,979,824 | (159,887,761) | ||
| Distributions to shareholders | (66,054,224) | (45,142,094) | ||
| Share transactions | ||||
| Proceeds from sales of shares | 2,018,014,533 | 3,110,410,601 | ||
| Reinvestment of distributions | 52,204,755 | 35,908,118 | ||
| Cost of shares redeemed | (2,958,447,612) | (2,591,370,911) | ||
Net increase (decrease) in net assets resulting from share transactions | (888,228,324) | 554,947,808 | ||
| Total increase (decrease) in net assets | (790,302,724) | 349,917,953 | ||
| Net Assets | ||||
| Beginning of period | 4,261,247,777 | 3,911,329,824 | ||
| End of period | $ | 3,470,945,053 | $ | 4,261,247,777 |
| Other Information | ||||
| Shares | ||||
| Sold | 202,462,371 | 313,032,641 | ||
| Issued in reinvestment of distributions | 5,229,439 | 3,615,322 | ||
| Redeemed | (295,927,816) | (259,451,335) | ||
| Net increase (decrease) | (88,236,006) | 57,196,628 | ||
| Fidelity® Short-Term Treasury Bond Index Fund |
| Years ended February 28, | 2024 A | 2023 | 2022 | 2021 | 2020 A | |||||
Selected Per-Share Data | ||||||||||
| Net asset value, beginning of period | $ | 9.82 | $ | 10.38 | $ | 10.76 | $ | 10.72 | $ | 10.30 |
| Income from Investment Operations | ||||||||||
Net investment income (loss) B,C | .300 | .164 | .087 | .127 | .217 | |||||
| Net realized and unrealized gain (loss) | .094 | (.606) | (.333) | .068 | .402 | |||||
| Total from investment operations | .394 | (.442) | (.246) | .195 | .619 | |||||
| Distributions from net investment income | (.174) | (.118) | (.086) | (.125) | (.199) | |||||
| Distributions from net realized gain | - | - | (.048) | (.030) | - | |||||
| Total distributions | (.174) | (.118) | (.134) | (.155) | (.199) | |||||
| Net asset value, end of period | $ | 10.04 | $ | 9.82 | $ | 10.38 | $ | 10.76 | $ | 10.72 |
Total Return D | 4.03% | (4.26)% | (2.31)% | 1.82% | 6.06% | |||||
Ratios to Average Net Assets C,E,F | ||||||||||
| Expenses before reductions | .03% | .03% | .03% | .03% | .03% | |||||
| Expenses net of fee waivers, if any | .03% | .03% | .03% | .03% | .03% | |||||
| Expenses net of all reductions | .03% | .03% | .03% | .03% | .03% | |||||
| Net investment income (loss) | 3.01% | 1.65% | .82% | 1.17% | 2.07% | |||||
| Supplemental Data | ||||||||||
| Net assets, end of period (000 omitted) | $ | 3,470,945 | $ | 4,261,248 | $ | 3,911,330 | $ | 3,870,957 | $ | 2,570,535 |
Portfolio turnover rate G | 69% | 60% | 48% | 54% | 46% |
| Coupon Distribution (% of Fund's Investments) | ||
| 0.01 - 0.99% | 13.6 | |
| 1 - 1.99% | 25.2 | |
| 2 - 2.99% | 11.4 | |
| 3 - 3.99% | 18.3 | |
| 4 - 4.99% | 22.1 | |
| 5 - 5.99% | 3.3 | |
| 6 - 6.99% | 5.2 | |
| Coupon distribution shows the range of stated interest rates on the fund's investments, excluding short-term investments. | ||
Asset Allocation (% of Fund's net assets) |
 |
| U.S. Government and Government Agency Obligations - 99.4% | |||
Principal Amount (a) | Value ($) | ||
| U.S. Treasury Obligations - 99.4% | |||
| U.S. Treasury Bonds: | |||
| 5.25% 2/15/29 | 192,494,000 | 201,065,998 | |
| 5.375% 2/15/31 | 63,650,000 | 68,145,281 | |
| 5.5% 8/15/28 | 41,000 | 42,994 | |
| 6.125% 8/15/29 | 263,150,000 | 285,898,083 | |
| 6.25% 5/15/30 | 124,504,000 | 137,752,004 | |
| 6.375% 8/15/27 | 3,000 | 3,191 | |
| 6.625% 2/15/27 | 315,000 | 334,712 | |
| U.S. Treasury Notes: | |||
| 0.375% 7/31/27 | 17,000 | 14,858 | |
| 0.375% 9/30/27 | 28,000 | 24,335 | |
| 0.5% 4/30/27 | 48,000 | 42,527 | |
| 0.5% 6/30/27 | 26,000 | 22,899 | |
| 0.5% 10/31/27 | 38,000 | 33,081 | |
| 0.625% 11/30/27 | 115,000 | 100,346 | |
| 0.625% 12/31/27 | 2,000 | 1,740 | |
| 0.625% 5/15/30 | 319,155,000 | 256,209,157 | |
| 0.625% 8/15/30 | 491,822,000 | 391,536,420 | |
| 0.875% 11/15/30 | 577,791,000 | 465,054,044 | |
| 1% 7/31/28 | 43,000 | 37,343 | |
| 1.125% 2/15/31 | 212,188,000 | 173,024,395 | |
| 1.25% 3/31/28 | 77,000 | 68,226 | |
| 1.25% 5/31/28 | 34,000 | 29,993 | |
| 1.25% 8/15/31 | 465,608,000 | 376,887,848 | |
| 1.375% 11/15/31 | 357,485,000 | 290,163,314 | |
| 1.5% 2/15/30 | 317,987,000 | 272,027,941 | |
| 1.625% 8/15/29 | 307,376,000 | 268,881,957 | |
| 1.625% 5/15/31 | 240,066,000 | 201,158,429 | |
| 1.75% 11/15/29 | 253,086,000 | 221,993,990 | |
| 1.875% 2/15/32 | 306,022,000 | 256,915,047 | |
| 2.375% 5/15/29 | 193,998,000 | 176,954,973 | |
| 2.625% 7/31/29 | 82,150,000 | 75,658,224 | |
| 2.75% 5/31/29 | 64,500,000 | 59,916,973 | |
| 2.75% 8/15/32 | 279,400,000 | 249,440,899 | |
| 2.875% 5/15/28 | 20,000 | 18,898 | |
| 2.875% 5/15/32 | 412,100,000 | 372,467,568 | |
| 3.125% 8/31/29 | 62,800,000 | 59,267,500 | |
| 3.25% 6/30/29 | 134,250,000 | 127,705,313 | |
| 3.375% 5/15/33 | 389,600,000 | 363,454,186 | |
| 3.5% 4/30/30 | 61,000,000 | 58,436,094 | |
| 3.5% 2/15/33 | 375,350,000 | 354,075,278 | |
| 3.625% 3/31/30 | 120,200,000 | 115,993,000 | |
| 3.875% 9/30/29 | 46,800,000 | 45,860,344 | |
| 3.875% 11/30/29 | 79,350,000 | 77,722,705 | |
| 3.875% 12/31/29 | 26,700,000 | 26,146,184 | |
| 3.875% 8/15/33 | 273,250,000 | 265,095,195 | |
| 4% 10/31/29 | 50,800,000 | 50,075,703 | |
| 4% 2/28/30 | 32,650,000 | 32,158,975 | |
| 4% 7/31/30 | 250,400,000 | 246,448,375 | |
| 4% 1/31/31 | 225,850,000 | 222,179,938 | |
| 4% 2/15/34 | 155,050,000 | 152,021,680 | |
| 4.125% 8/31/30 | 36,000,000 | 35,675,156 | |
| 4.125% 11/15/32 | 226,850,000 | 224,448,580 | |
| 4.25% 2/28/31 | 181,200,000 | 180,973,500 | |
| 4.375% 11/30/30 | 113,600,000 | 114,203,500 | |
| 4.5% 11/15/33 | 386,800,000 | 394,112,938 | |
| 4.875% 10/31/30 | 148,700,000 | 153,718,625 | |
| TOTAL U.S. GOVERNMENT AND GOVERNMENT AGENCY OBLIGATIONS (Cost $8,447,679,227) | 8,101,700,457 | ||
| Money Market Funds - 0.8% | |||
| Shares | Value ($) | ||
Fidelity Cash Central Fund 5.39% (b) (Cost $66,409,718) | 66,396,439 | 66,409,718 | |
| TOTAL INVESTMENT IN SECURITIES - 100.2% (Cost $8,514,088,945) | 8,168,110,175 |
NET OTHER ASSETS (LIABILITIES) - (0.2)% | (20,193,033) |
| NET ASSETS - 100.0% | 8,147,917,142 |
| (a) | Amount is stated in United States dollars unless otherwise noted. |
| (b) | Affiliated fund that is generally available only to investment companies and other accounts managed by Fidelity Investments. The rate quoted is the annualized seven-day yield of the fund at period end. A complete unaudited listing of the fund's holdings as of its most recent quarter end is available upon request. In addition, each Fidelity Central Fund's financial statements, which are not covered by the Fund's Report of Independent Registered Public Accounting Firm, are available on the SEC's website or upon request. |
| Affiliate | Value, beginning of period ($) | Purchases ($) | Sales Proceeds ($) | Dividend Income ($) | Realized Gain (loss) ($) | Change in Unrealized appreciation (depreciation) ($) | Value, end of period ($) | % ownership, end of period |
| Fidelity Cash Central Fund 5.39% | 24,956,860 | 996,379,568 | 954,926,710 | 1,435,861 | - | - | 66,409,718 | 0.1% |
| Fidelity Securities Lending Cash Central Fund 5.39% | - | 1,290,151,372 | 1,290,151,372 | 52,001 | - | - | - | 0.0% |
| Total | 24,956,860 | 2,286,530,940 | 2,245,078,082 | 1,487,862 | - | - | 66,409,718 | |
| Valuation Inputs at Reporting Date: | ||||
| Description | Total ($) | Level 1 ($) | Level 2 ($) | Level 3 ($) |
Investments in Securities: | ||||
| U.S. Government and Government Agency Obligations | 8,101,700,457 | - | 8,101,700,457 | - |
| Money Market Funds | 66,409,718 | 66,409,718 | - | - |
| Total Investments in Securities: | 8,168,110,175 | 66,409,718 | 8,101,700,457 | - |
| Statement of Assets and Liabilities | ||||
| February 29, 2024 | ||||
| Assets | ||||
| Investment in securities, at value - See accompanying schedule: | ||||
Unaffiliated issuers (cost $8,447,679,227) | $ | 8,101,700,457 | ||
Fidelity Central Funds (cost $66,409,718) | 66,409,718 | |||
| Total Investment in Securities (cost $8,514,088,945) | $ | 8,168,110,175 | ||
| Receivable for investments sold | 337,290,705 | |||
| Receivable for fund shares sold | 4,518,875 | |||
| Interest receivable | 41,628,129 | |||
| Distributions receivable from Fidelity Central Funds | 172,467 | |||
Total assets | 8,551,720,351 | |||
| Liabilities | ||||
| Payable for investments purchased | $ | 396,660,754 | ||
| Payable for fund shares redeemed | 4,731,479 | |||
| Distributions payable | 2,207,145 | |||
| Accrued management fee | 203,831 | |||
| Total Liabilities | 403,803,209 | |||
| Net Assets | $ | 8,147,917,142 | ||
| Net Assets consist of: | ||||
| Paid in capital | $ | 8,879,970,199 | ||
| Total accumulated earnings (loss) | (732,053,057) | |||
| Net Assets | $ | 8,147,917,142 | ||
Net Asset Value, offering price and redemption price per share ($8,147,917,142 ÷ 853,464,599 shares) | $ | 9.55 | ||
| Statement of Operations | ||||
Year ended February 29, 2024 | ||||
| Investment Income | ||||
| Interest | $ | 237,769,591 | ||
| Income from Fidelity Central Funds (including $52,001 from security lending) | 1,487,862 | |||
| Total Income | 239,257,453 | |||
| Expenses | ||||
| Management fee | $ | 2,158,232 | ||
| Independent trustees' fees and expenses | 22,301 | |||
| Total expenses before reductions | 2,180,533 | |||
| Expense reductions | (23) | |||
| Total expenses after reductions | 2,180,510 | |||
| Net Investment income (loss) | 237,076,943 | |||
| Realized and Unrealized Gain (Loss) | ||||
| Net realized gain (loss) on: | ||||
| Investment Securities: | ||||
| Unaffiliated issuers | (256,157,570) | |||
| Total net realized gain (loss) | (256,157,570) | |||
| Change in net unrealized appreciation (depreciation) on investment securities | 162,127,103 | |||
| Net gain (loss) | (94,030,467) | |||
| Net increase (decrease) in net assets resulting from operations | $ | 143,046,476 | ||
| Statement of Changes in Net Assets | ||||
Year ended February 29, 2024 | Year ended February 28, 2023 | |||
| Increase (Decrease) in Net Assets | ||||
| Operations | ||||
| Net investment income (loss) | $ | 237,076,943 | $ | 87,716,548 |
| Net realized gain (loss) | (256,157,570) | (204,344,494) | ||
| Change in net unrealized appreciation (depreciation) | 162,127,103 | (394,241,058) | ||
| Net increase (decrease) in net assets resulting from operations | 143,046,476 | (510,869,004) | ||
| Distributions to shareholders | (171,642,129) | (74,113,793) | ||
| Share transactions | ||||
| Proceeds from sales of shares | 4,605,616,582 | 4,023,207,126 | ||
| Reinvestment of distributions | 147,718,337 | 62,294,822 | ||
| Cost of shares redeemed | (2,219,320,181) | (2,254,532,105) | ||
Net increase (decrease) in net assets resulting from share transactions | 2,534,014,738 | 1,830,969,843 | ||
| Total increase (decrease) in net assets | 2,505,419,085 | 1,245,987,046 | ||
| Net Assets | ||||
| Beginning of period | 5,642,498,057 | 4,396,511,011 | ||
| End of period | $ | 8,147,917,142 | $ | 5,642,498,057 |
| Other Information | ||||
| Shares | ||||
| Sold | 479,453,157 | 407,895,188 | ||
| Issued in reinvestment of distributions | 15,423,695 | 6,332,883 | ||
| Redeemed | (232,163,347) | (228,090,762) | ||
| Net increase (decrease) | 262,713,505 | 186,137,309 | ||
| Fidelity® Intermediate Treasury Bond Index Fund |
| Years ended February 28, | 2024 A | 2023 | 2022 | 2021 | 2020 A | |||||
Selected Per-Share Data | ||||||||||
| Net asset value, beginning of period | $ | 9.55 | $ | 10.87 | $ | 11.38 | $ | 11.65 | $ | 10.54 |
| Income from Investment Operations | ||||||||||
Net investment income (loss) B,C | .315 | .196 | .151 | .174 | .255 | |||||
| Net realized and unrealized gain (loss) | (.089) | (1.352) | (.443) | (.092) | 1.092 | |||||
| Total from investment operations | .226 | (1.156) | (.292) | .082 | 1.347 | |||||
| Distributions from net investment income | (.226) | (.164) | (.148) | (.171) | (.237) | |||||
| Distributions from net realized gain | - | - | (.070) | (.181) | - | |||||
| Total distributions | (.226) | (.164) | (.218) | (.352) | (.237) | |||||
| Net asset value, end of period | $ | 9.55 | $ | 9.55 | $ | 10.87 | $ | 11.38 | $ | 11.65 |
Total Return D | 2.39% | (10.67)% | (2.60)% | .63% | 12.91% | |||||
Ratios to Average Net Assets C,E,F | ||||||||||
| Expenses before reductions | .03% | .03% | .03% | .03% | .03% | |||||
| Expenses net of fee waivers, if any | .03% | .03% | .03% | .03% | .03% | |||||
| Expenses net of all reductions | .03% | .03% | .03% | .03% | .03% | |||||
| Net investment income (loss) | 3.30% | 1.97% | 1.35% | 1.46% | 2.30% | |||||
| Supplemental Data | ||||||||||
| Net assets, end of period (000 omitted) | $ | 8,147,917 | $ | 5,642,498 | $ | 4,396,511 | $ | 4,571,767 | $ | 3,508,883 |
Portfolio turnover rate G | 48% | 41% | 54% | 56% | 58% |
| Coupon Distribution (% of Fund's Investments) | ||
| 1 - 1.99% | 18.3 | |
| 2 - 2.99% | 26.3 | |
| 3 - 3.99% | 37.1 | |
| 4 - 4.99% | 16.9 | |
| 5 - 5.99% | 0.3 | |
| Coupon distribution shows the range of stated interest rates on the fund's investments, excluding short-term investments. | ||
Asset Allocation (% of Fund's net assets) |
|
| U.S. Government and Government Agency Obligations - 99.3% | |||
Principal Amount (a) | Value ($) | ||
| U.S. Treasury Obligations - 99.3% | |||
| U.S. Treasury Bonds: | |||
| 1.125% 5/15/40 | 34,209,000 | 21,109,358 | |
| 1.125% 8/15/40 | 65,704,000 | 40,146,170 | |
| 1.25% 5/15/50 | 99,203,000 | 50,384,273 | |
| 1.375% 11/15/40 | 98,738,000 | 62,706,343 | |
| 1.375% 8/15/50 | 231,295,000 | 121,411,806 | |
| 1.625% 11/15/50 | 130,631,000 | 73,362,573 | |
| 1.75% 8/15/41 | 87,455,000 | 58,242,980 | |
| 1.875% 2/15/41 | 141,748,000 | 97,678,768 | |
| 1.875% 2/15/51 | 178,310,000 | 106,742,216 | |
| 1.875% 11/15/51 | 198,350,000 | 118,173,211 | |
| 2% 11/15/41 | 77,050,000 | 53,345,086 | |
| 2% 2/15/50 | 98,616,900 | 61,400,577 | |
| 2% 8/15/51 | 94,504,000 | 58,197,483 | |
| 2.25% 5/15/41 | 102,827,000 | 75,079,777 | |
| 2.25% 8/15/46 | 9,663,000 | 6,563,291 | |
| 2.25% 8/15/49 | 68,509,000 | 45,368,479 | |
| 2.25% 2/15/52 | 118,300,000 | 77,384,835 | |
| 2.375% 2/15/42 | 79,900,000 | 58,701,531 | |
| 2.375% 11/15/49 | 87,745,000 | 59,718,013 | |
| 2.375% 5/15/51 | 193,347,000 | 130,471,462 | |
| 2.5% 2/15/45 | 22,364,000 | 16,210,406 | |
| 2.5% 2/15/46 | 18,123,000 | 13,007,500 | |
| 2.5% 5/15/46 | 41,212,000 | 29,497,167 | |
| 2.75% 8/15/42 | 20,787,000 | 16,172,448 | |
| 2.75% 11/15/42 | 30,225,000 | 23,420,833 | |
| 2.75% 8/15/47 | 21,492,000 | 15,973,761 | |
| 2.75% 11/15/47 | 10,975,000 | 8,143,364 | |
| 2.875% 5/15/43 | 78,118,000 | 61,484,358 | |
| 2.875% 8/15/45 | 75,587,500 | 58,370,675 | |
| 2.875% 11/15/46 | 72,529,000 | 55,490,351 | |
| 2.875% 5/15/49 | 84,540,000 | 63,923,468 | |
| 2.875% 5/15/52 | 121,700,000 | 91,636,297 | |
| 3% 5/15/42 | 57,501,000 | 46,609,502 | |
| 3% 11/15/44 | 45,937,000 | 36,433,783 | |
| 3% 5/15/45 | 51,614,000 | 40,811,351 | |
| 3% 11/15/45 | 62,732,000 | 49,433,306 | |
| 3% 2/15/47 | 31,990,000 | 24,990,938 | |
| 3% 5/15/47 | 11,507,000 | 8,980,404 | |
| 3% 2/15/48 | 85,947,000 | 66,786,862 | |
| 3% 8/15/48 | 105,591,000 | 81,936,141 | |
| 3% 2/15/49 | 1,900,000 | 1,472,203 | |
| 3% 8/15/52 | 99,150,000 | 76,651,471 | |
| 3.125% 11/15/41 | 64,820,000 | 53,965,182 | |
| 3.125% 2/15/42 | 106,856,000 | 88,623,695 | |
| 3.125% 2/15/43 | 47,347,000 | 38,857,831 | |
| 3.125% 8/15/44 | 10,234,300 | 8,302,976 | |
| 3.125% 5/15/48 | 88,953,000 | 70,679,413 | |
| 3.25% 5/15/42 | 162,850,000 | 136,946,674 | |
| 3.375% 8/15/42 | 45,700,000 | 39,084,211 | |
| 3.375% 5/15/44 | 17,129,300 | 14,481,619 | |
| 3.375% 11/15/48 | 77,544,000 | 64,425,130 | |
| 3.625% 8/15/43 | 123,303,000 | 108,699,301 | |
| 3.625% 2/15/44 | 73,325,000 | 64,462,986 | |
| 3.625% 2/15/53 | 79,900,000 | 69,856,321 | |
| 3.625% 5/15/53 | 117,000,000 | 102,365,860 | |
| 3.75% 8/15/41 | 95,131,000 | 86,799,606 | |
| 3.75% 11/15/43 | 80,368,000 | 72,054,935 | |
| 3.875% 8/15/40 | 19,822,000 | 18,539,764 | |
| 3.875% 2/15/43 | 7,850,000 | 7,186,736 | |
| 3.875% 5/15/43 | 43,450,000 | 39,709,229 | |
| 4% 11/15/42 | 103,350,000 | 96,474,802 | |
| 4% 11/15/52 | 81,900,000 | 76,685,273 | |
| 4.125% 8/15/53 | 121,650,000 | 116,460,867 | |
| 4.25% 5/15/39 | 12,631,000 | 12,494,822 | |
| 4.25% 11/15/40 | 37,399,000 | 36,564,827 | |
| 4.375% 11/15/39 | 16,793,000 | 16,790,376 | |
| 4.375% 5/15/40 | 23,064,000 | 22,982,015 | |
| 4.375% 5/15/41 | 61,803,000 | 61,156,000 | |
| 4.375% 8/15/43 | 25,800,000 | 25,259,813 | |
| 4.5% 2/15/36 | 20,315,000 | 21,022,851 | |
| 4.5% 5/15/38 | 510,000 | 521,555 | |
| 4.5% 8/15/39 | 3,983,000 | 4,045,546 | |
| 4.625% 2/15/40 | 16,572,000 | 17,025,141 | |
| 4.75% 2/15/37 | 18,378,000 | 19,412,480 | |
| 4.75% 2/15/41 | 38,071,000 | 39,486,765 | |
| 4.75% 11/15/43 | 28,400,000 | 29,225,375 | |
| 4.75% 11/15/53 | 90,550,000 | 96,336,711 | |
| 5% 5/15/37 | 10,719,000 | 11,571,914 | |
| TOTAL U.S. GOVERNMENT AND GOVERNMENT AGENCY OBLIGATIONS (Cost $4,897,502,248) | 4,052,183,423 | ||
| Money Market Funds - 1.1% | |||
| Shares | Value ($) | ||
Fidelity Cash Central Fund 5.39% (b) (Cost $45,152,929) | 45,143,900 | 45,152,929 | |
| TOTAL INVESTMENT IN SECURITIES - 100.4% (Cost $4,942,655,177) | 4,097,336,352 |
NET OTHER ASSETS (LIABILITIES) - (0.4)% | (14,634,425) |
| NET ASSETS - 100.0% | 4,082,701,927 |
| (a) | Amount is stated in United States dollars unless otherwise noted. |
| (b) | Affiliated fund that is generally available only to investment companies and other accounts managed by Fidelity Investments. The rate quoted is the annualized seven-day yield of the fund at period end. A complete unaudited listing of the fund's holdings as of its most recent quarter end is available upon request. In addition, each Fidelity Central Fund's financial statements, which are not covered by the Fund's Report of Independent Registered Public Accounting Firm, are available on the SEC's website or upon request. |
| Affiliate | Value, beginning of period ($) | Purchases ($) | Sales Proceeds ($) | Dividend Income ($) | Realized Gain (loss) ($) | Change in Unrealized appreciation (depreciation) ($) | Value, end of period ($) | % ownership, end of period |
| Fidelity Cash Central Fund 5.39% | 30,440,344 | 647,385,944 | 632,673,359 | 769,727 | - | - | 45,152,929 | 0.1% |
| Fidelity Securities Lending Cash Central Fund 5.39% | - | 154,018,343 | 154,018,343 | 43,702 | - | - | - | 0.0% |
| Total | 30,440,344 | 801,404,287 | 786,691,702 | 813,429 | - | - | 45,152,929 | |
| Valuation Inputs at Reporting Date: | ||||
| Description | Total ($) | Level 1 ($) | Level 2 ($) | Level 3 ($) |
Investments in Securities: | ||||
| U.S. Government and Government Agency Obligations | 4,052,183,423 | - | 4,052,183,423 | - |
| Money Market Funds | 45,152,929 | 45,152,929 | - | - |
| Total Investments in Securities: | 4,097,336,352 | 45,152,929 | 4,052,183,423 | - |
| Statement of Assets and Liabilities | ||||
| February 29, 2024 | ||||
| Assets | ||||
| Investment in securities, at value - See accompanying schedule: | ||||
Unaffiliated issuers (cost $4,897,502,248) | $ | 4,052,183,423 | ||
Fidelity Central Funds (cost $45,152,929) | 45,152,929 | |||
| Total Investment in Securities (cost $4,942,655,177) | $ | 4,097,336,352 | ||
| Receivable for fund shares sold | 79,557,778 | |||
| Interest receivable | 26,011,766 | |||
| Distributions receivable from Fidelity Central Funds | 104,145 | |||
Total assets | 4,203,010,041 | |||
| Liabilities | ||||
| Payable for investments purchased | $ | 113,931,049 | ||
| Payable for fund shares redeemed | 5,503,672 | |||
| Distributions payable | 772,985 | |||
| Accrued management fee | 100,408 | |||
| Total Liabilities | 120,308,114 | |||
| Net Assets | $ | 4,082,701,927 | ||
| Net Assets consist of: | ||||
| Paid in capital | $ | 5,342,608,829 | ||
| Total accumulated earnings (loss) | (1,259,906,902) | |||
| Net Assets | $ | 4,082,701,927 | ||
Net Asset Value, offering price and redemption price per share ($4,082,701,927 ÷ 422,494,380 shares) | $ | 9.66 | ||
| Statement of Operations | ||||
Year ended February 29, 2024 | ||||
| Investment Income | ||||
| Interest | $ | 131,519,298 | ||
| Income from Fidelity Central Funds (including $43,702 from security lending) | 813,429 | |||
| Total Income | 132,332,727 | |||
| Expenses | ||||
| Management fee | $ | 1,090,742 | ||
| Independent trustees' fees and expenses | 11,585 | |||
| Total expenses before reductions | 1,102,327 | |||
| Expense reductions | (723) | |||
| Total expenses after reductions | 1,101,604 | |||
| Net Investment income (loss) | 131,231,123 | |||
| Realized and Unrealized Gain (Loss) | ||||
| Net realized gain (loss) on: | ||||
| Investment Securities: | ||||
| Unaffiliated issuers | (200,459,923) | |||
| Total net realized gain (loss) | (200,459,923) | |||
| Change in net unrealized appreciation (depreciation) on investment securities | (32,466,761) | |||
| Net gain (loss) | (232,926,684) | |||
| Net increase (decrease) in net assets resulting from operations | $ | (101,695,561) | ||
| Statement of Changes in Net Assets | ||||
Year ended February 29, 2024 | Year ended February 28, 2023 | |||
| Increase (Decrease) in Net Assets | ||||
| Operations | ||||
| Net investment income (loss) | $ | 131,231,123 | $ | 92,144,080 |
| Net realized gain (loss) | (200,459,923) | (214,222,439) | ||
| Change in net unrealized appreciation (depreciation) | (32,466,761) | (820,112,215) | ||
| Net increase (decrease) in net assets resulting from operations | (101,695,561) | (942,190,574) | ||
| Distributions to shareholders | (120,865,981) | (88,406,732) | ||
| Share transactions | ||||
| Proceeds from sales of shares | 2,242,343,907 | 1,586,555,265 | ||
| Reinvestment of distributions | 113,470,210 | 83,448,932 | ||
| Cost of shares redeemed | (1,253,838,113) | (1,294,379,641) | ||
Net increase (decrease) in net assets resulting from share transactions | 1,101,976,004 | 375,624,556 | ||
| Total increase (decrease) in net assets | 879,414,462 | (654,972,750) | ||
| Net Assets | ||||
| Beginning of period | 3,203,287,465 | 3,858,260,215 | ||
| End of period | $ | 4,082,701,927 | $ | 3,203,287,465 |
| Other Information | ||||
| Shares | ||||
| Sold | 228,087,448 | 142,018,890 | ||
| Issued in reinvestment of distributions | 11,509,987 | 7,594,098 | ||
| Redeemed | (128,464,955) | (114,947,506) | ||
| Net increase (decrease) | 111,132,480 | 34,665,482 | ||
| Fidelity® Long-Term Treasury Bond Index Fund |
| Years ended February 28, | 2024 A | 2023 | 2022 | 2021 | 2020 A | |||||
Selected Per-Share Data | ||||||||||
| Net asset value, beginning of period | $ | 10.29 | $ | 13.94 | $ | 14.49 | $ | 16.10 | $ | 12.53 |
| Income from Investment Operations | ||||||||||
Net investment income (loss) B,C | .357 | .320 | .310 | .336 | .378 | |||||
| Net realized and unrealized gain (loss) | (.659) | (3.663) | (.448) | (1.296) | 3.562 | |||||
| Total from investment operations | (.302) | (3.343) | (.138) | (.960) | 3.940 | |||||
| Distributions from net investment income | (.328) | (.307) | (.301) | (.330) | (.370) | |||||
| Distributions from net realized gain | - | - | (.111) | (.320) | - | |||||
| Total distributions | (.328) | (.307) | (.412) | (.650) | (.370) | |||||
| Net asset value, end of period | $ | 9.66 | $ | 10.29 | $ | 13.94 | $ | 14.49 | $ | 16.10 |
Total Return D | (2.96)% | (24.10)% | (1.02)% | (6.32)% | 31.86% | |||||
Ratios to Average Net Assets C,E,F | ||||||||||
| Expenses before reductions | .03% | .03% | .03% | .03% | .03% | |||||
| Expenses net of fee waivers, if any | .03% | .03% | .03% | .03% | .03% | |||||
| Expenses net of all reductions | .03% | .03% | .03% | .03% | .03% | |||||
| Net investment income (loss) | 3.61% | 2.85% | 2.15% | 2.04% | 2.69% | |||||
| Supplemental Data | ||||||||||
| Net assets, end of period (000 omitted) | $ | 4,082,702 | $ | 3,203,287 | $ | 3,858,260 | $ | 3,011,856 | $ | 2,691,210 |
Portfolio turnover rate G | 17% | 26% | 22% | 41% | 54% |
| Fidelity Central Fund | Investment Manager | Investment Objective | Investment Practices | Expense RatioA |
| Fidelity Money Market Central Funds | Fidelity Management & Research Company LLC (FMR) | Each fund seeks to obtain a high level of current income consistent with the preservation of capital and liquidity. | Short-term Investments | Less than .005% |
| Tax cost | Gross unrealized appreciation | Gross unrealized depreciation | Net unrealized appreciation (depreciation) | |
Fidelity Short-Term Treasury Bond Index Fund | $3,531,432,300 | $35,079,725 | $(64,965,509) | $(29,885,784) |
Fidelity Intermediate Treasury Bond Index Fund | 8,481,294,743 | 31,564,397 | (344,748,965) | (313,184,568) |
Fidelity Long-Term Treasury Bond Index Fund | 4,973,982,722 | 25,270,319 | (901,916,689) | (876,646,370) |
| Undistributed ordinary income | Capital loss carryforward | Net unrealized appreciation (depreciation) on securities and other investments | |
Fidelity Short-Term Treasury Bond Index Fund | $3,568,231 | $(160,283,701) | $(29,885,784) |
Fidelity Intermediate Treasury Bond Index Fund | 3,321,168 | (422,189,656) | (313,184,568) |
Fidelity Long-Term Treasury Bond Index Fund | - | (382,455,605) | (876,646,370) |
| Short-term | Long-term | Total capital loss carryforward | |
Fidelity Short-Term Treasury Bond Index Fund | $(38,319,683) | $(121,964,018) | $(160,283,701) |
Fidelity Intermediate Treasury Bond Index Fund | (69,810,934) | (352,378,722) | (422,189,656) |
Fidelity Long-Term Treasury Bond Index Fund | (41,694,286) | (340,761,319) | (382,455,605) |
| February 29, 2024 | ||
| Ordinary Income | Total | |
Fidelity Short-Term Treasury Bond Index Fund | $66,054,224 | $66,054,224 |
Fidelity Intermediate Treasury Bond Index Fund | 171,642,129 | 171,642,129 |
Fidelity Long-Term Treasury Bond Index Fund | 120,865,981 | 120,865,981 |
| February 28, 2023 | ||
| Ordinary Income | Total | |
Fidelity Short-Term Treasury Bond Index Fund | $45,142,094 | $45,142,094 |
Fidelity Intermediate Treasury Bond Index Fund | 74,113,793 | 74,113,793 |
Fidelity Long-Term Treasury Bond Index Fund | 88,406,732 | 88,406,732 |
| Total Security Lending Fees Paid to NFS | Security Lending Income From Securities Loaned to NFS | Value of Securities Loaned to NFS at Period End | |
| Fidelity Short-Term Treasury Bond Index Fund | $3,095 | $- | $- |
| Fidelity Intermediate Treasury Bond Index Fund | $5,660 | - | - |
| Fidelity Long-Term Treasury Bond Index Fund | $4,645 | - | - |
| Custodian credits | |
Fidelity Short-Term Treasury Bond Index Fund | $125 |
Fidelity Intermediate Treasury Bond Index Fund | 23 |
Fidelity Long-Term Treasury Bond Index Fund | 723 |
| Strategic Advisers Fidelity Core Income Fund | |
| Fidelity Short-Term Treasury Bond Index Fund | 12% |
| Fidelity Intermediate Treasury Bond Index Fund | 29% |
| The Example is based on an investment of $1,000 invested at the beginning of the period and held for the entire period (September 1, 2023 to February 29, 2024). |
Annualized Expense Ratio- A | Beginning Account Value September 1, 2023 | Ending Account Value February 29, 2024 | Expenses Paid During Period- C September 1, 2023 to February 29, 2024 | |||||||
| Fidelity® Short-Term Treasury Bond Index Fund | .03% | |||||||||
| Actual | $ 1,000 | $ 1,023.50 | $ .15 | |||||||
Hypothetical-B | $ 1,000 | $ 1,024.71 | $ .15 | |||||||
| Fidelity® Intermediate Treasury Bond Index Fund | .03% | |||||||||
| Actual | $ 1,000 | $ 1,016.00 | $ .15 | |||||||
Hypothetical-B | $ 1,000 | $ 1,024.71 | $ .15 | |||||||
| Fidelity® Long-Term Treasury Bond Index Fund | .03% | |||||||||
| Actual | $ 1,000 | $ 997.00 | $ .15 | |||||||
Hypothetical-B | $ 1,000 | $ 1,024.71 | $ .15 | |||||||
| Fidelity® Short-Term Treasury Bond Index Fund | 99.56% |
| Fidelity® Intermediate Treasury Bond Index Fund | 99.43% |
| Fidelity® Long-Term Treasury Bond Index Fund | 99.44% |
| Fidelity® Short-Term Treasury Bond Index Fund | $66,476,884 |
| Fidelity® Intermediate Treasury Bond Index Fund | $150,996,870 |
| Fidelity® Long-Term Treasury Bond Index Fund | $111,959,841 |
| Fidelity® Short-Term Treasury Bond Index Fund | $66,054,224 |
| Fidelity® Intermediate Treasury Bond Index Fund | $171,642,129 |
| Fidelity® Long-Term Treasury Bond Index Fund | $120,865,981 |
- Highly liquid investments - cash or convertible to cash within three business days or less
- Moderately liquid investments - convertible to cash in three to seven calendar days
- Less liquid investments - can be sold or disposed of, but not settled, within seven calendar days
- Illiquid investments - cannot be sold or disposed of within seven calendar days
| A special meeting of shareholders was held on October 18, 2023. The results of votes taken among shareholders on the proposal before them are reported below. Each vote reported represents one dollar of net asset value held on the record date for the meeting. | ||
| Proposal 1 | ||
| To elect a Board of Trustees. | ||
# of Votes | % of Votes | |
| Abigail P. Johnson | ||
| Affirmative | 378,729,502,260.01 | 97.58 |
| Withheld | 9,407,876,478.96 | 2.42 |
| TOTAL | 388,137,378,738.97 | 100.00 |
| Jennifer Toolin McAuliffe | ||
| Affirmative | 378,454,868,010.95 | 97.51 |
| Withheld | 9,682,510,728.02 | 2.49 |
| TOTAL | 388,137,378,738.97 | 100.00 |
| Christine J. Thompson | ||
| Affirmative | 378,837,121,274.52 | 97.60 |
| Withheld | 9,300,257,464.45 | 2.40 |
| TOTAL | 388,137,378,738.97 | 100.00 |
| Elizabeth S. Acton | ||
| Affirmative | 378,262,110,794.85 | 97.46 |
| Withheld | 9,875,267,944.12 | 2.54 |
| TOTAL | 388,137,378,738.97 | 100.00 |
| Laura M. Bishop | ||
| Affirmative | 380,482,113,171.06 | 98.03 |
| Withheld | 7,655,265,567.91 | 1.97 |
| TOTAL | 388,137,378,738.97 | 100.00 |
| Ann E. Dunwoody | ||
| Affirmative | 380,016,034,008.12 | 97.91 |
| Withheld | 8,121,344,730.85 | 2.09 |
| TOTAL | 388,137,378,738.97 | 100.00 |
| John Engler | ||
| Affirmative | 379,432,488,394.20 | 97.76 |
| Withheld | 8,704,890,344.77 | 2.24 |
| TOTAL | 388,137,378,738.97 | 100.00 |
| Robert F. Gartland | ||
| Affirmative | 378,741,819,600.60 | 97.58 |
| Withheld | 9,395,559,138.37 | 2.42 |
| TOTAL | 388,137,378,738.97 | 100.00 |
| Robert W. Helm | ||
| Affirmative | 380,389,324,755.07 | 98.00 |
| Withheld | 7,748,053,983.90 | 2.00 |
| TOTAL | 388,137,378,738.97 | 100.00 |
| Arthur E. Johnson | ||
| Affirmative | 378,427,694,151.67 | 97.50 |
| Withheld | 9,709,684,587.30 | 2.50 |
| TOTAL | 388,137,378,738.97 | 100.00 |
| Michael E. Kenneally | ||
| Affirmative | 377,842,228,145.18 | 97.35 |
| Withheld | 10,295,150,593.79 | 2.65 |
| TOTAL | 388,137,378,738.97 | 100.00 |
| Mark A. Murray | ||
| Affirmative | 380,158,432,703.37 | 97.94 |
| Withheld | 7,978,946,035.60 | 2.06 |
| TOTAL | 388,137,378,738.97 | 100.00 |
| Carol J. Zierhoffer | ||
| Affirmative | 380,522,113,360.24 | 98.04 |
| Withheld | 7,615,265,378.73 | 1.96 |
| TOTAL | 388,137,378,738.97 | 100.00 |
| Proposal 1 reflects trust wide proposal and voting results. | ||
 |


Contents
| Average Annual Total Returns | |||
Periods ended February 29, 2024 | Past 1 year | Past 5 years | Life of Fund A |
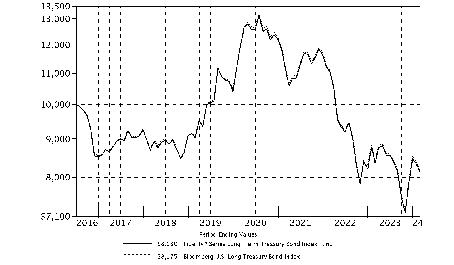
| Fidelity® Series Long-Term Treasury Bond Index Fund | -2.77% | -2.07% | -2.67% |
| $10,000 Over Life of Fund |
Let's say hypothetically that $10,000 was invested in Fidelity® Series Long-Term Treasury Bond Index Fund, on July 7, 2016, when the fund started. The chart shows how the value of your investment would have changed, and also shows how the Bloomberg U.S. Long Treasury Bond Index performed over the same period. |
 |
| Coupon Distribution (% of Fund's Investments) | ||
| 1 - 1.99% | 11.8 | |
| 2 - 2.99% | 39.1 | |
| 3 - 3.99% | 32.9 | |
| 4 - 4.99% | 14.0 | |
| 5 - 5.99% | 0.8 | |
| Coupon distribution shows the range of stated interest rates on the fund's investments, excluding short-term investments. | ||
Asset Allocation (% of Fund's net assets) |
 |
| U.S. Government and Government Agency Obligations - 99.0% | |||
Principal Amount (a) | Value ($) | ||
| U.S. Treasury Obligations - 99.0% | |||
| U.S. Treasury Bonds: | |||
| 1.125% 5/15/40 | 54,517,000 | 33,640,822 | |
| 1.125% 8/15/40 | 117,470,000 | 71,776,005 | |
| 1.25% 5/15/50 | 51,868,000 | 26,343,271 | |
| 1.375% 11/15/40 | 821,263,000 | 521,566,162 | |
| 1.375% 8/15/50 | 11,528,000 | 6,051,299 | |
| 1.625% 11/15/50 | 200,693,000 | 112,709,502 | |
| 1.75% 8/15/41 | 455,540,000 | 303,378,962 | |
| 1.875% 2/15/41 | 633,606,000 | 436,618,883 | |
| 1.875% 2/15/51 | 671,205,000 | 401,805,335 | |
| 1.875% 11/15/51 | 729,220,000 | 434,455,603 | |
| 2% 11/15/41 | 915,080,000 | 633,549,919 | |
| 2% 2/15/50 | 424,749,000 | 264,456,029 | |
| 2% 8/15/51 | 861,520,000 | 530,541,513 | |
| 2.25% 5/15/41 | 881,582,000 | 643,692,607 | |
| 2.25% 8/15/46 | 172,941,000 | 117,464,770 | |
| 2.25% 8/15/49 | 311,947,000 | 206,579,589 | |
| 2.25% 2/15/52 | 1,405,440,000 | 919,355,393 | |
| 2.375% 2/15/42 | 1,283,560,000 | 943,015,487 | |
| 2.375% 11/15/49 | 827,992,000 | 563,519,714 | |
| 2.375% 5/15/51 | 635,974,000 | 429,158,238 | |
| 2.5% 2/15/45 | 707,149,000 | 512,572,533 | |
| 2.5% 2/15/46 | 117,718,000 | 84,490,256 | |
| 2.5% 5/15/46 | 136,970,000 | 98,035,208 | |
| 2.75% 8/15/42 | 252,260,000 | 196,260,250 | |
| 2.75% 11/15/42 | 193,274,000 | 149,764,700 | |
| 2.75% 8/15/47 | 458,264,000 | 340,601,139 | |
| 2.75% 11/15/47 | 316,957,000 | 235,179,619 | |
| 2.875% 5/15/43 | 241,482,000 | 190,063,313 | |
| 2.875% 8/15/45 | 36,432,000 | 28,133,758 | |
| 2.875% 11/15/46 | 25,000 | 19,127 | |
| 2.875% 5/15/49 | 634,799,000 | 479,992,352 | |
| 2.875% 5/15/52 | 237,580,000 | 178,890,316 | |
| 3% 5/15/42 | 119,579,000 | 96,929,056 | |
| 3% 11/15/44 | 172,537,000 | 136,843,408 | |
| 3% 5/15/45 | 158,044,000 | 124,965,884 | |
| 3% 11/15/45 | 381,862,000 | 300,910,238 | |
| 3% 2/15/47 | 489,794,000 | 382,632,431 | |
| 3% 5/15/47 | 234,862,000 | 183,293,278 | |
| 3% 2/15/48 | 595,209,000 | 462,519,242 | |
| 3% 8/15/48 | 203,982,000 | 158,285,251 | |
| 3% 2/15/49 | 527,487,000 | 408,720,005 | |
| 3% 8/15/52 | 656,180,000 | 507,283,532 | |
| 3.125% 11/15/41 | 59,163,000 | 49,255,508 | |
| 3.125% 2/15/42 | 154,840,000 | 128,420,425 | |
| 3.125% 2/15/43 | 170,521,000 | 139,947,117 | |
| 3.125% 8/15/44 | 77,966,000 | 63,252,963 | |
| 3.125% 5/15/48 | 306,342,000 | 243,410,258 | |
| 3.25% 5/15/42 | 379,100,000 | 318,799,406 | |
| 3.375% 8/15/42 | 534,560,000 | 457,174,090 | |
| 3.375% 5/15/44 | 122,930,000 | 103,928,672 | |
| 3.375% 11/15/48 | 187,191,000 | 155,522,085 | |
| 3.5% 2/15/39 | 128,034,000 | 116,490,935 | |
| 3.625% 8/15/43 | 393,132,000 | 346,570,429 | |
| 3.625% 2/15/44 | 142,857,000 | 125,591,392 | |
| 3.625% 2/15/53 | 342,780,000 | 299,691,485 | |
| 3.625% 5/15/53 | 790,000,000 | 691,188,285 | |
| 3.75% 8/15/41 | 107,358,000 | 97,955,788 | |
| 3.75% 11/15/43 | 103,069,000 | 92,407,800 | |
| 3.875% 2/15/43 | 264,800,000 | 242,426,468 | |
| 3.875% 5/15/43 | 106,500,000 | 97,331,021 | |
| 4% 11/15/42 | 176,720,000 | 164,963,978 | |
| 4% 11/15/52 | 371,200,000 | 347,564,998 | |
| 4.125% 8/15/53 | 476,900,000 | 456,557,234 | |
| 4.25% 5/15/39 | 7,357,000 | 7,277,682 | |
| 4.25% 11/15/40 | 47,867,000 | 46,799,341 | |
| 4.25% 2/15/54 | 116,700,000 | 114,511,875 | |
| 4.375% 2/15/38 | 82,124,000 | 83,086,391 | |
| 4.375% 11/15/39 | 17,280,000 | 17,277,300 | |
| 4.375% 5/15/40 | 164,823,000 | 164,237,105 | |
| 4.375% 5/15/41 | 84,468,000 | 83,583,726 | |
| 4.375% 8/15/43 | 129,270,000 | 126,563,409 | |
| 4.5% 2/15/36 | 70,718,000 | 73,182,080 | |
| 4.5% 5/15/38 | 29,300,000 | 29,963,828 | |
| 4.5% 8/15/39 | 89,444,000 | 90,848,550 | |
| 4.625% 2/15/40 | 35,743,000 | 36,720,348 | |
| 4.75% 2/15/37 | 35,563,000 | 37,564,808 | |
| 4.75% 2/15/41 | 71,173,000 | 73,819,746 | |
| 4.75% 11/15/43 | 251,100,000 | 258,397,594 | |
| 4.75% 11/15/53 | 536,700,000 | 570,998,484 | |
| 5% 5/15/37 | 151,627,000 | 163,692,007 | |
| TOTAL U.S. GOVERNMENT AND GOVERNMENT AGENCY OBLIGATIONS (Cost $24,622,863,444) | 19,573,038,610 | ||
| Money Market Funds - 1.3% | |||
| Shares | Value ($) | ||
Fidelity Cash Central Fund 5.39% (b) (Cost $253,791,208) | 253,740,460 | 253,791,208 | |
| TOTAL INVESTMENT IN SECURITIES - 100.3% (Cost $24,876,654,652) | 19,826,829,818 |
NET OTHER ASSETS (LIABILITIES) - (0.3)% | (63,287,437) |
| NET ASSETS - 100.0% | 19,763,542,381 |
| (a) | Amount is stated in United States dollars unless otherwise noted. |
| (b) | Affiliated fund that is generally available only to investment companies and other accounts managed by Fidelity Investments. The rate quoted is the annualized seven-day yield of the fund at period end. A complete unaudited listing of the fund's holdings as of its most recent quarter end is available upon request. In addition, each Fidelity Central Fund's financial statements, which are not covered by the Fund's Report of Independent Registered Public Accounting Firm, are available on the SEC's website or upon request. |
| Affiliate | Value, beginning of period ($) | Purchases ($) | Sales Proceeds ($) | Dividend Income ($) | Realized Gain (loss) ($) | Change in Unrealized appreciation (depreciation) ($) | Value, end of period ($) | % ownership, end of period |
| Fidelity Cash Central Fund 5.39% | 220,005,277 | 1,300,110,691 | 1,266,324,760 | 6,212,603 | - | - | 253,791,208 | 0.5% |
| Fidelity Securities Lending Cash Central Fund 5.39% | 91,383,143 | 1,163,523,941 | 1,254,907,084 | 170,469 | - | - | - | 0.0% |
| Total | 311,388,420 | 2,463,634,632 | 2,521,231,844 | 6,383,072 | - | - | 253,791,208 | |
| Valuation Inputs at Reporting Date: | ||||
| Description | Total ($) | Level 1 ($) | Level 2 ($) | Level 3 ($) |
Investments in Securities: | ||||
| U.S. Government and Government Agency Obligations | 19,573,038,610 | - | 19,573,038,610 | - |
| Money Market Funds | 253,791,208 | 253,791,208 | - | - |
| Total Investments in Securities: | 19,826,829,818 | 253,791,208 | 19,573,038,610 | - |
| Statement of Assets and Liabilities | ||||
| February 29, 2024 | ||||
| Assets | ||||
| Investment in securities, at value - See accompanying schedule: | ||||
Unaffiliated issuers (cost $24,622,863,444) | $ | 19,573,038,610 | ||
Fidelity Central Funds (cost $253,791,208) | 253,791,208 | |||
| Total Investment in Securities (cost $24,876,654,652) | $ | 19,826,829,818 | ||
| Receivable for fund shares sold | 669,418,688 | |||
| Interest receivable | 108,229,179 | |||
| Distributions receivable from Fidelity Central Funds | 806,170 | |||
Total assets | 20,605,283,855 | |||
| Liabilities | ||||
| Payable for investments purchased | $ | 673,515,684 | ||
| Payable for fund shares redeemed | 168,158,347 | |||
| Distributions payable | 168 | |||
| Other payables and accrued expenses | 67,275 | |||
| Total Liabilities | 841,741,474 | |||
| Net Assets | $ | 19,763,542,381 | ||
| Net Assets consist of: | ||||
| Paid in capital | $ | 25,948,573,049 | ||
| Total accumulated earnings (loss) | (6,185,030,668) | |||
| Net Assets | $ | 19,763,542,381 | ||
Net Asset Value, offering price and redemption price per share ($19,763,542,381 ÷ 3,535,367,278 shares) | $ | 5.59 | ||
| Statement of Operations | ||||
Year ended February 29, 2024 | ||||
| Investment Income | ||||
| Interest | $ | 648,874,780 | ||
| Income from Fidelity Central Funds (including $170,469 from security lending) | 6,383,072 | |||
| Total Income | 655,257,852 | |||
| Expenses | ||||
| Custodian fees and expenses | $ | 158,186 | ||
| Independent trustees' fees and expenses | 60,141 | |||
| Miscellaneous | 86 | |||
| Total expenses before reductions | 218,413 | |||
| Expense reductions | (1,420) | |||
| Total expenses after reductions | 216,993 | |||
| Net Investment income (loss) | 655,040,859 | |||
| Realized and Unrealized Gain (Loss) | ||||
| Net realized gain (loss) on: | ||||
| Investment Securities: | ||||
| Unaffiliated issuers | (724,264,803) | |||
| Total net realized gain (loss) | (724,264,803) | |||
| Change in net unrealized appreciation (depreciation) on investment securities | (364,854,037) | |||
| Net gain (loss) | (1,089,118,840) | |||
| Net increase (decrease) in net assets resulting from operations | $ | (434,077,981) | ||
| Statement of Changes in Net Assets | ||||
Year ended February 29, 2024 | Year ended February 28, 2023 | |||
| Increase (Decrease) in Net Assets | ||||
| Operations | ||||
| Net investment income (loss) | $ | 655,040,859 | $ | 475,693,836 |
| Net realized gain (loss) | (724,264,803) | (466,967,551) | ||
| Change in net unrealized appreciation (depreciation) | (364,854,037) | (4,409,523,731) | ||
| Net increase (decrease) in net assets resulting from operations | (434,077,981) | (4,400,797,446) | ||
| Distributions to shareholders | (606,523,970) | (449,770,175) | ||
| Share transactions | ||||
| Proceeds from sales of shares | 5,632,851,217 | 9,182,425,036 | ||
| Reinvestment of distributions | 606,520,433 | 449,255,711 | ||
| Cost of shares redeemed | (2,980,965,139) | (2,364,393,486) | ||
Net increase (decrease) in net assets resulting from share transactions | 3,258,406,511 | 7,267,287,261 | ||
| Total increase (decrease) in net assets | 2,217,804,560 | 2,416,719,640 | ||
| Net Assets | ||||
| Beginning of period | 17,545,737,821 | 15,129,018,181 | ||
| End of period | $ | 19,763,542,381 | $ | 17,545,737,821 |
| Other Information | ||||
| Shares | ||||
| Sold | 993,209,134 | 1,373,818,678 | ||
| Issued in reinvestment of distributions | 106,407,571 | 71,082,578 | ||
| Redeemed | (517,708,239) | (369,851,700) | ||
| Net increase (decrease) | 581,908,466 | 1,075,049,556 | ||
| Fidelity® Series Long-Term Treasury Bond Index Fund |
| Years ended February 28, | 2024 A | 2023 | 2022 | 2021 | 2020 A | |||||
Selected Per-Share Data | ||||||||||
| Net asset value, beginning of period | $ | 5.94 | $ | 8.05 | $ | 8.33 | $ | 10.06 | $ | 8.43 |
| Income from Investment Operations | ||||||||||
Net investment income (loss) B,C | .202 | .185 | .175 | .201 | .249 | |||||
| Net realized and unrealized gain (loss) | (.365) | (2.121) | (.253) | (.752) | 2.319 | |||||
| Total from investment operations | (.163) | (1.936) | (.078) | (.551) | 2.568 | |||||
| Distributions from net investment income | (.187) | (.174) | (.169) | (.199) | (.243) | |||||
| Distributions from net realized gain | - | - | (.033) | (.980) | (.695) | |||||
| Total distributions | (.187) | (.174) | (.202) | (1.179) | (.938) | |||||
| Net asset value, end of period | $ | 5.59 | $ | 5.94 | $ | 8.05 | $ | 8.33 | $ | 10.06 |
Total Return D | (2.77)% | (24.16)% | (1.01)% | (6.47)% | 31.91% | |||||
Ratios to Average Net Assets C,E,F | ||||||||||
Expenses before reductions G | -% | -% | -% | -% | -% | |||||
Expenses net of fee waivers, if any G | -% | -% | -% | -% | -% | |||||
Expenses net of all reductions G | -% | -% | -% | -% | -% | |||||
| Net investment income (loss) | 3.53% | 2.87% | 2.10% | 2.03% | 2.68% | |||||
| Supplemental Data | ||||||||||
| Net assets, end of period (000 omitted) | $ | 19,763,542 | $ | 17,545,738 | $ | 15,129,018 | $ | 9,356,431 | $ | 7,414,223 |
Portfolio turnover rate H | 11% | 10% | 18% | 56% | 33% I |
| Fidelity Central Fund | Investment Manager | Investment Objective | Investment Practices | Expense RatioA |
| Fidelity Money Market Central Funds | Fidelity Management & Research Company LLC (FMR) | Each fund seeks to obtain a high level of current income consistent with the preservation of capital and liquidity. | Short-term Investments | Less than .005% |
| Gross unrealized appreciation | $88,614,740 |
| Gross unrealized depreciation | (5,091,117,721) |
| Net unrealized appreciation (depreciation) | $(5,002,502,981) |
| Tax Cost | $24,829,332,799 |
| Capital loss carryforward | $(1,178,409,167) |
| Net unrealized appreciation (depreciation) on securities and other investments | $(5,002,502,981) |
Short-term | $(183,630,013) |
Long-term | (994,779,154) |
| Total capital loss carryforward | $(1,178,409,167) |
| February 29, 2024 | February 28, 2023 | |
| Ordinary Income | $606,523,970 | $ 449,770,175 |
| Total Security Lending Fees Paid to NFS | Security Lending Income From Securities Loaned to NFS | Value of Securities Loaned to NFS at Period End | |
| Fidelity Series Long-Term Treasury Bond Index Fund | $18,474 | $- | $- |
| The Example is based on an investment of $1,000 invested at the beginning of the period and held for the entire period (September 1, 2023 to February 29, 2024). |
Annualized Expense Ratio- A | Beginning Account Value September 1, 2023 | Ending Account Value February 29, 2024 | Expenses Paid During Period- C September 1, 2023 to February 29, 2024 | |||||||
| Fidelity® Series Long-Term Treasury Bond Index Fund | -%-D | |||||||||
| Actual | $ 1,000 | $ 997.70 | $-E | |||||||
Hypothetical-B | $ 1,000 | $ 1,024.86 | $-E | |||||||
- Highly liquid investments - cash or convertible to cash within three business days or less
- Moderately liquid investments - convertible to cash in three to seven calendar days
- Less liquid investments - can be sold or disposed of, but not settled, within seven calendar days
- Illiquid investments - cannot be sold or disposed of within seven calendar days
| A special meeting of shareholders was held on October 18, 2023. The results of votes taken among shareholders on the proposal before them are reported below. Each vote reported represents one dollar of net asset value held on the record date for the meeting. | ||
| Proposal 1 | ||
| To elect a Board of Trustees. | ||
# of Votes | % of Votes | |
| Abigail P. Johnson | ||
| Affirmative | 378,729,502,260.01 | 97.58 |
| Withheld | 9,407,876,478.96 | 2.42 |
| TOTAL | 388,137,378,738.97 | 100.00 |
| Jennifer Toolin McAuliffe | ||
| Affirmative | 378,454,868,010.95 | 97.51 |
| Withheld | 9,682,510,728.02 | 2.49 |
| TOTAL | 388,137,378,738.97 | 100.00 |
| Christine J. Thompson | ||
| Affirmative | 378,837,121,274.52 | 97.60 |
| Withheld | 9,300,257,464.45 | 2.40 |
| TOTAL | 388,137,378,738.97 | 100.00 |
| Elizabeth S. Acton | ||
| Affirmative | 378,262,110,794.85 | 97.46 |
| Withheld | 9,875,267,944.12 | 2.54 |
| TOTAL | 388,137,378,738.97 | 100.00 |
| Laura M. Bishop | ||
| Affirmative | 380,482,113,171.06 | 98.03 |
| Withheld | 7,655,265,567.91 | 1.97 |
| TOTAL | 388,137,378,738.97 | 100.00 |
| Ann E. Dunwoody | ||
| Affirmative | 380,016,034,008.12 | 97.91 |
| Withheld | 8,121,344,730.85 | 2.09 |
| TOTAL | 388,137,378,738.97 | 100.00 |
| John Engler | ||
| Affirmative | 379,432,488,394.20 | 97.76 |
| Withheld | 8,704,890,344.77 | 2.24 |
| TOTAL | 388,137,378,738.97 | 100.00 |
| Robert F. Gartland | ||
| Affirmative | 378,741,819,600.60 | 97.58 |
| Withheld | 9,395,559,138.37 | 2.42 |
| TOTAL | 388,137,378,738.97 | 100.00 |
| Robert W. Helm | ||
| Affirmative | 380,389,324,755.07 | 98.00 |
| Withheld | 7,748,053,983.90 | 2.00 |
| TOTAL | 388,137,378,738.97 | 100.00 |
| Arthur E. Johnson | ||
| Affirmative | 378,427,694,151.67 | 97.50 |
| Withheld | 9,709,684,587.30 | 2.50 |
| TOTAL | 388,137,378,738.97 | 100.00 |
| Michael E. Kenneally | ||
| Affirmative | 377,842,228,145.18 | 97.35 |
| Withheld | 10,295,150,593.79 | 2.65 |
| TOTAL | 388,137,378,738.97 | 100.00 |
| Mark A. Murray | ||
| Affirmative | 380,158,432,703.37 | 97.94 |
| Withheld | 7,978,946,035.60 | 2.06 |
| TOTAL | 388,137,378,738.97 | 100.00 |
| Carol J. Zierhoffer | ||
| Affirmative | 380,522,113,360.24 | 98.04 |
| Withheld | 7,615,265,378.73 | 1.96 |
| TOTAL | 388,137,378,738.97 | 100.00 |
| Proposal 1 reflects trust wide proposal and voting results. | ||
 |


Contents
| Average Annual Total Returns | |||
Periods ended February 29, 2024 | Past 1 year | Past 5 years | Life of Fund A |
| Fidelity® SAI U.S. Treasury Bond Index Fund | 2.25% | 0.13% | 0.29% |
| $10,000 Over Life of Fund |
Let's say hypothetically that $10,000 was invested in Fidelity® SAI U.S. Treasury Bond Index Fund, on March 1, 2016, when the fund started. The chart shows how the value of your investment would have changed, and also shows how the Bloomberg U.S. Treasury Index performed over the same period. |
 |
| Coupon Distribution (% of Fund's Investments) | ||
| 0.01 - 0.99% | 17.1 | |
| 1 - 1.99% | 22.3 | |
| 2 - 2.99% | 18.4 | |
| 3 - 3.99% | 16.1 | |
| 4 - 4.99% | 18.7 | |
| 5 - 5.99% | 2.2 | |
| 6 - 6.99% | 3.2 | |
| Coupon distribution shows the range of stated interest rates on the fund's investments, excluding short-term investments. | ||
Asset Allocation (% of Fund's net assets) |
 |
| U.S. Government and Government Agency Obligations - 99.0% | |||
Principal Amount (a) | Value ($) | ||
| U.S. Treasury Obligations - 99.0% | |||
| U.S. Treasury Bonds: | |||
| 1.125% 5/15/40 | 21,884,000 | 13,503,967 | |
| 1.125% 8/15/40 | 121,437,000 | 74,199,904 | |
| 1.25% 5/15/50 | 12,672,000 | 6,435,990 | |
| 1.375% 11/15/40 | 89,634,300 | 56,924,783 | |
| 1.375% 8/15/50 | 4,170,000 | 2,188,924 | |
| 1.625% 11/15/50 | 120,537,500 | 67,694,048 | |
| 1.75% 8/15/41 | 169,627,000 | 112,967,606 | |
| 1.875% 2/15/41 | 14,329,000 | 9,874,136 | |
| 1.875% 2/15/51 | 158,731,000 | 95,021,585 | |
| 1.875% 11/15/51 | 90,363,000 | 53,836,581 | |
| 2% 11/15/41 | 95,700,000 | 66,257,297 | |
| 2% 2/15/50 | 94,678,000 | 58,948,150 | |
| 2% 8/15/51 | 124,145,000 | 76,451,012 | |
| 2.25% 5/15/41 | 75,633,000 | 55,223,908 | |
| 2.25% 8/15/46 | 1,600,000 | 1,086,750 | |
| 2.25% 8/15/49 | 63,180,000 | 41,839,474 | |
| 2.25% 2/15/52 | 138,800,000 | 90,794,718 | |
| 2.375% 2/15/42 | 97,200,000 | 71,411,625 | |
| 2.375% 11/15/49 | 35,960,000 | 24,473,870 | |
| 2.375% 5/15/51 | 204,437,000 | 137,955,046 | |
| 2.5% 2/15/45 | 4,601,000 | 3,335,006 | |
| 2.5% 2/15/46 | 15,623,000 | 11,213,164 | |
| 2.5% 5/15/46 | 24,683,000 | 17,666,664 | |
| 2.75% 8/15/42 | 59,738,000 | 46,476,631 | |
| 2.75% 11/15/42 | 32,626,000 | 25,281,327 | |
| 2.75% 8/15/47 | 12,031,000 | 8,941,947 | |
| 2.75% 11/15/47 | 318,000 | 235,954 | |
| 2.875% 5/15/43 | 56,884,000 | 44,771,708 | |
| 2.875% 8/15/45 | 47,454,000 | 36,645,239 | |
| 2.875% 11/15/46 | 4,289,000 | 3,281,420 | |
| 2.875% 5/15/49 | 34,911,000 | 26,397,353 | |
| 2.875% 5/15/52 | 33,900,000 | 25,525,641 | |
| 3% 5/15/42 | 31,038,000 | 25,158,966 | |
| 3% 11/15/44 | 29,700,000 | 23,555,813 | |
| 3% 5/15/45 | 39,700,000 | 31,390,914 | |
| 3% 11/15/45 | 57,800,000 | 45,546,851 | |
| 3% 2/15/47 | 77,389,000 | 60,457,133 | |
| 3% 5/15/47 | 82,292,000 | 64,223,120 | |
| 3% 2/15/48 | 36,059,000 | 28,020,378 | |
| 3% 8/15/48 | 106,508,000 | 82,647,711 | |
| 3% 2/15/49 | 128,911,000 | 99,885,883 | |
| 3% 8/15/52 | 88,500,000 | 68,418,106 | |
| 3.125% 11/15/41 | 50,864,000 | 42,346,267 | |
| 3.125% 2/15/42 | 11,800,000 | 9,786,625 | |
| 3.125% 2/15/43 | 67,701,000 | 55,562,422 | |
| 3.125% 5/15/48 | 99,204,500 | 78,824,950 | |
| 3.25% 5/15/42 | 182,400,000 | 153,387,000 | |
| 3.375% 8/15/42 | 60,100,000 | 51,399,586 | |
| 3.375% 5/15/44 | 61,800,000 | 52,247,555 | |
| 3.375% 11/15/48 | 8,391,300 | 6,971,662 | |
| 3.5% 2/15/39 | 315,000 | 286,601 | |
| 3.625% 8/15/43 | 33,301,000 | 29,356,913 | |
| 3.625% 2/15/44 | 38,656,000 | 33,984,060 | |
| 3.625% 2/15/53 | 63,100,000 | 55,168,133 | |
| 3.625% 5/15/53 | 95,300,000 | 83,380,055 | |
| 3.75% 11/15/43 | 12,484,000 | 11,192,686 | |
| 3.875% 2/15/43 | 57,200,000 | 52,367,047 | |
| 4% 11/15/42 | 127,500,000 | 119,018,261 | |
| 4% 11/15/52 | 138,800,000 | 129,962,343 | |
| 4.125% 8/15/53 | 79,800,000 | 76,396,031 | |
| 4.25% 5/15/39 | 8,898,000 | 8,802,068 | |
| 4.25% 11/15/40 | 17,780,000 | 17,383,423 | |
| 4.25% 2/15/54 | 29,600,000 | 29,045,000 | |
| 4.375% 2/15/38 | 6,284,000 | 6,357,641 | |
| 4.375% 11/15/39 | 4,140,000 | 4,139,353 | |
| 4.375% 5/15/41 | 7,517,000 | 7,438,306 | |
| 4.375% 8/15/43 | 6,500,000 | 6,363,906 | |
| 4.5% 2/15/36 | 24,732,200 | 25,593,963 | |
| 4.5% 5/15/38 | 24,300,000 | 24,850,547 | |
| 4.5% 8/15/39 | 3,831,000 | 3,891,159 | |
| 4.625% 2/15/40 | 4,405,000 | 4,525,449 | |
| 4.75% 2/15/37 | 13,000 | 13,732 | |
| 4.75% 2/15/41 | 33,300,000 | 34,538,344 | |
| 4.75% 11/15/53 | 37,400,000 | 39,790,094 | |
| 5% 5/15/37 | 1,967,000 | 2,123,515 | |
| 5.25% 11/15/28 | 31,601,000 | 32,866,274 | |
| 5.25% 2/15/29 | 10,374,000 | 10,835,967 | |
| 5.375% 2/15/31 | 3,562,000 | 3,813,566 | |
| 5.5% 8/15/28 | 154,965,000 | 162,501,383 | |
| 6% 2/15/26 | 3,771,000 | 3,869,694 | |
| 6.125% 11/15/27 | 139,604,000 | 148,007,506 | |
| 6.125% 8/15/29 | 47,344,000 | 51,436,667 | |
| 6.25% 5/15/30 | 201,878,000 | 223,359,081 | |
| 6.375% 8/15/27 | 21,500,000 | 22,865,586 | |
| 6.5% 11/15/26 | 39,000 | 41,028 | |
| 6.625% 2/15/27 | 9,550,000 | 10,147,621 | |
| 6.75% 8/15/26 | 56,623,000 | 59,469,633 | |
| 6.875% 8/15/25 | 91,000 | 93,833 | |
| U.S. Treasury Notes: | |||
| 0.25% 5/31/25 | 12,744,000 | 12,029,639 | |
| 0.25% 6/30/25 | 115,476,400 | 108,665,096 | |
| 0.25% 7/31/25 | 157,226,000 | 147,436,226 | |
| 0.25% 8/31/25 | 124,344,000 | 116,227,639 | |
| 0.25% 9/30/25 | 150,380,000 | 140,100,116 | |
| 0.25% 10/31/25 | 127,321,300 | 118,219,816 | |
| 0.375% 4/15/24 | 49,000 | 48,699 | |
| 0.375% 4/30/25 | 11,267,000 | 10,690,006 | |
| 0.375% 11/30/25 | 32,600,000 | 30,244,141 | |
| 0.375% 12/31/25 (b) | 86,183,100 | 79,732,834 | |
| 0.375% 1/31/26 | 123,905,000 | 114,253,963 | |
| 0.375% 7/31/27 | 141,814,000 | 123,943,221 | |
| 0.375% 9/30/27 | 61,826,000 | 53,733,073 | |
| 0.5% 3/31/25 | 97,681,000 | 93,094,572 | |
| 0.5% 2/28/26 | 156,611,000 | 144,388,000 | |
| 0.5% 4/30/27 | 119,444,000 | 105,824,584 | |
| 0.5% 5/31/27 | 38,920,000 | 34,371,225 | |
| 0.5% 6/30/27 | 25,881,000 | 22,794,489 | |
| 0.5% 8/31/27 | 76,109,000 | 66,642,943 | |
| 0.625% 7/31/26 | 129,205,000 | 117,798,621 | |
| 0.625% 3/31/27 | 17,704,000 | 15,799,437 | |
| 0.625% 11/30/27 | 28,200,700 | 24,607,314 | |
| 0.625% 12/31/27 | 15,039,900 | 13,082,363 | |
| 0.625% 5/15/30 | 191,927,000 | 154,073,898 | |
| 0.625% 8/15/30 | 182,194,900 | 145,044,221 | |
| 0.75% 3/31/26 | 114,616,000 | 105,975,029 | |
| 0.75% 4/30/26 | 79,288,000 | 73,096,722 | |
| 0.75% 5/31/26 | 144,299,000 | 132,653,620 | |
| 0.75% 8/31/26 | 57,499,000 | 52,449,869 | |
| 0.75% 1/31/28 | 122,528,000 | 106,848,245 | |
| 0.875% 6/30/26 | 32,001,000 | 29,444,670 | |
| 0.875% 9/30/26 | 199,077,000 | 181,813,291 | |
| 0.875% 11/15/30 | 64,580,900 | 51,980,056 | |
| 1% 7/31/28 | 142,409,000 | 123,673,316 | |
| 1.125% 2/28/25 | 16,425,900 | 15,803,512 | |
| 1.125% 10/31/26 | 107,215,000 | 98,265,061 | |
| 1.125% 2/28/27 | 89,038,000 | 80,899,370 | |
| 1.125% 2/29/28 | 29,970,000 | 26,475,451 | |
| 1.125% 8/31/28 | 190,807,000 | 166,255,505 | |
| 1.125% 2/15/31 | 30,498,000 | 24,868,975 | |
| 1.25% 11/30/26 | 76,047,000 | 69,790,946 | |
| 1.25% 12/31/26 | 85,700,000 | 78,519,278 | |
| 1.25% 3/31/28 | 39,508,000 | 35,006,249 | |
| 1.25% 4/30/28 | 120,599,000 | 106,602,920 | |
| 1.25% 5/31/28 | 169,074,000 | 149,148,365 | |
| 1.25% 6/30/28 | 159,735,000 | 140,591,759 | |
| 1.25% 9/30/28 | 131,538,000 | 115,028,954 | |
| 1.25% 8/15/31 | 211,866,000 | 171,495,595 | |
| 1.375% 8/31/26 | 132,600,000 | 122,893,266 | |
| 1.375% 10/31/28 | 131,200,000 | 115,204,875 | |
| 1.375% 12/31/28 | 23,700,000 | 20,723,613 | |
| 1.375% 11/15/31 | 85,946,000 | 69,760,623 | |
| 1.5% 2/15/25 | 12,900,000 | 12,466,137 | |
| 1.5% 8/15/26 | 102,770,000 | 95,636,317 | |
| 1.5% 1/31/27 | 129,900,000 | 119,579,040 | |
| 1.5% 11/30/28 | 67,400,000 | 59,419,945 | |
| 1.5% 2/15/30 | 30,793,000 | 26,342,449 | |
| 1.625% 2/15/26 | 29,244,000 | 27,609,306 | |
| 1.625% 9/30/26 | 75,600,000 | 70,432,031 | |
| 1.625% 10/31/26 | 87,777,000 | 81,550,319 | |
| 1.625% 11/30/26 | 9,625,000 | 8,927,188 | |
| 1.625% 8/15/29 | 116,062,000 | 101,527,047 | |
| 1.625% 5/15/31 | 276,993,000 | 232,100,657 | |
| 1.75% 3/15/25 | 127,700,000 | 123,455,009 | |
| 1.75% 12/31/26 | 39,400,000 | 36,606,601 | |
| 1.75% 1/31/29 | 76,700,000 | 68,185,102 | |
| 1.75% 11/15/29 | 21,907,000 | 19,215,691 | |
| 1.875% 8/31/24 | 1,000 | 983 | |
| 1.875% 6/30/26 | 30,005,000 | 28,271,508 | |
| 1.875% 7/31/26 | 63,142,000 | 59,358,413 | |
| 1.875% 2/28/27 | 71,600,000 | 66,520,875 | |
| 1.875% 2/28/29 | 2,900,000 | 2,589,723 | |
| 1.875% 2/15/32 | 128,600,000 | 107,963,725 | |
| 2% 2/15/25 | 6,597,000 | 6,406,305 | |
| 2% 8/15/25 | 54,627,000 | 52,480,329 | |
| 2% 11/15/26 | 30,050,000 | 28,184,787 | |
| 2.125% 5/15/25 | 5,400,000 | 5,224,711 | |
| 2.125% 5/31/26 | 37,900,000 | 35,942,821 | |
| 2.25% 4/30/24 | 1,000 | 995 | |
| 2.25% 11/15/25 | 54,523,000 | 52,320,782 | |
| 2.25% 2/15/27 | 44,880,000 | 42,197,719 | |
| 2.25% 8/15/27 | 28,284,000 | 26,374,830 | |
| 2.25% 11/15/27 | 43,000,000 | 39,934,570 | |
| 2.375% 4/30/26 | 44,609,000 | 42,598,110 | |
| 2.375% 5/15/27 | 7,901,000 | 7,426,631 | |
| 2.375% 5/15/29 | 93,199,000 | 85,011,322 | |
| 2.5% 2/28/26 | 2,000 | 1,920 | |
| 2.625% 3/31/25 | 16,295,000 | 15,890,171 | |
| 2.625% 4/15/25 | 118,500,000 | 115,463,438 | |
| 2.625% 12/31/25 | 83,200,000 | 80,219,750 | |
| 2.625% 1/31/26 | 28,504,000 | 27,456,255 | |
| 2.625% 5/31/27 | 40,400,000 | 38,241,125 | |
| 2.625% 2/15/29 | 76,744,000 | 71,111,110 | |
| 2.625% 7/31/29 | 29,600,000 | 27,260,906 | |
| 2.75% 2/28/25 | 16,080,000 | 15,723,225 | |
| 2.75% 5/15/25 | 11,800,000 | 11,501,313 | |
| 2.75% 6/30/25 | 89,960,000 | 87,545,839 | |
| 2.75% 8/31/25 | 17,437,000 | 16,918,658 | |
| 2.75% 4/30/27 | 83,900,000 | 79,832,817 | |
| 2.75% 7/31/27 | 12,400,000 | 11,762,563 | |
| 2.75% 2/15/28 | 86,418,200 | 81,476,159 | |
| 2.75% 5/31/29 | 53,900,000 | 50,070,152 | |
| 2.75% 8/15/32 | 129,700,000 | 115,792,715 | |
| 2.875% 4/30/25 | 80,986,000 | 79,097,381 | |
| 2.875% 5/31/25 | 5,889,000 | 5,745,226 | |
| 2.875% 6/15/25 | 56,500,000 | 55,074,258 | |
| 2.875% 7/31/25 | 120,897,000 | 117,676,229 | |
| 2.875% 11/30/25 | 93,000,000 | 90,148,242 | |
| 2.875% 5/15/28 | 113,885,000 | 107,607,979 | |
| 2.875% 8/15/28 | 92,876,000 | 87,528,375 | |
| 2.875% 4/30/29 | 74,400,000 | 69,613,406 | |
| 2.875% 5/15/32 | 201,400,000 | 182,030,983 | |
| 3% 7/15/25 | 28,400,000 | 27,704,422 | |
| 3% 9/30/25 | 81,060,000 | 78,881,513 | |
| 3% 10/31/25 | 72,984,000 | 70,954,133 | |
| 3.125% 8/15/25 | 31,000,000 | 30,267,383 | |
| 3.125% 8/31/27 | 9,600,000 | 9,211,875 | |
| 3.125% 11/15/28 | 26,503,000 | 25,196,485 | |
| 3.125% 8/31/29 | 12,300,000 | 11,608,125 | |
| 3.25% 6/30/27 | 46,500,000 | 44,881,582 | |
| 3.25% 6/30/29 | 51,100,000 | 48,608,875 | |
| 3.375% 5/15/33 | 146,700,000 | 136,855,054 | |
| 3.5% 2/15/33 | 151,300,000 | 142,724,363 | |
| 3.625% 3/31/28 | 128,600,000 | 125,239,321 | |
| 3.75% 12/31/28 | 182,200,000 | 178,057,796 | |
| 3.75% 6/30/30 | 76,200,000 | 73,958,649 | |
| 3.875% 1/15/26 | 34,100,000 | 33,612,476 | |
| 3.875% 11/30/27 | 6,500,000 | 6,392,090 | |
| 3.875% 12/31/27 | 35,600,000 | 34,999,578 | |
| 3.875% 9/30/29 | 4,900,000 | 4,801,617 | |
| 3.875% 11/30/29 | 32,200,000 | 31,539,649 | |
| 3.875% 12/31/29 | 69,900,000 | 68,450,121 | |
| 3.875% 8/15/33 | 152,600,000 | 148,045,844 | |
| 4% 12/15/25 | 53,800,000 | 53,142,211 | |
| 4% 2/15/26 | 82,200,000 | 81,220,664 | |
| 4% 1/15/27 | 132,200,000 | 130,650,781 | |
| 4% 1/31/29 (b) | 65,200,000 | 64,446,125 | |
| 4% 10/31/29 | 16,600,000 | 16,363,320 | |
| 4% 2/28/30 | 28,500,000 | 28,071,387 | |
| 4% 7/31/30 | 96,800,000 | 95,272,375 | |
| 4% 1/31/31 | 130,300,000 | 128,182,625 | |
| 4% 2/15/34 | 68,000,000 | 66,671,875 | |
| 4.125% 9/30/27 | 94,400,000 | 93,636,687 | |
| 4.125% 7/31/28 | 123,300,000 | 122,437,863 | |
| 4.125% 8/31/30 | 74,800,000 | 74,125,047 | |
| 4.125% 11/15/32 | 112,900,000 | 111,704,847 | |
| 4.25% 10/15/25 | 7,500,000 | 7,439,648 | |
| 4.25% 12/31/25 | 137,800,000 | 136,723,823 | |
| 4.375% 8/15/26 | 125,600,000 | 125,182,969 | |
| 4.375% 12/15/26 | 66,000,000 | 65,865,938 | |
| 4.375% 8/31/28 | 122,400,000 | 122,792,062 | |
| 4.375% 11/30/28 | 117,700,000 | 118,196,547 | |
| 4.375% 11/30/30 | 35,900,000 | 36,090,719 | |
| 4.5% 11/15/25 | 13,300,000 | 13,249,086 | |
| 4.5% 7/15/26 | 107,600,000 | 107,524,344 | |
| 4.5% 11/15/33 | 159,600,000 | 162,617,438 | |
| 4.625% 6/30/25 | 94,800,000 | 94,500,047 | |
| 4.625% 10/15/26 | 118,500,000 | 118,888,828 | |
| 4.625% 9/30/30 | 104,700,000 | 106,736,742 | |
| 4.875% 10/31/28 | 85,100,000 | 87,180,961 | |
| 4.875% 10/31/30 | 83,800,000 | 86,628,250 | |
| 5% 10/31/25 | 133,700,000 | 134,214,852 | |
| TOTAL U.S. GOVERNMENT AND GOVERNMENT AGENCY OBLIGATIONS (Cost $16,794,223,255) | 15,674,485,295 | ||
| Money Market Funds - 2.0% | |||
| Shares | Value ($) | ||
| Fidelity Cash Central Fund 5.39% (c) | 202,034,345 | 202,074,752 | |
| Fidelity Securities Lending Cash Central Fund 5.39% (c)(d) | 117,887,970 | 117,899,759 | |
| TOTAL MONEY MARKET FUNDS (Cost $319,974,511) | 319,974,511 | ||
| TOTAL INVESTMENT IN SECURITIES - 101.0% (Cost $17,114,197,766) | 15,994,459,806 |
NET OTHER ASSETS (LIABILITIES) - (1.0)% | (151,221,194) |
| NET ASSETS - 100.0% | 15,843,238,612 |
| (a) | Amount is stated in United States dollars unless otherwise noted. |
| (b) | Security or a portion of the security is on loan at period end. |
| (c) | Affiliated fund that is generally available only to investment companies and other accounts managed by Fidelity Investments. The rate quoted is the annualized seven-day yield of the fund at period end. A complete unaudited listing of the fund's holdings as of its most recent quarter end is available upon request. In addition, each Fidelity Central Fund's financial statements, which are not covered by the Fund's Report of Independent Registered Public Accounting Firm, are available on the SEC's website or upon request. |
| (d) | Investment made with cash collateral received from securities on loan. |
| Affiliate | Value, beginning of period ($) | Purchases ($) | Sales Proceeds ($) | Dividend Income ($) | Realized Gain (loss) ($) | Change in Unrealized appreciation (depreciation) ($) | Value, end of period ($) | % ownership, end of period |
| Fidelity Cash Central Fund 5.39% | 58,458,024 | 1,556,665,553 | 1,413,048,825 | 1,860,059 | - | - | 202,074,752 | 0.4% |
| Fidelity Securities Lending Cash Central Fund 5.39% | 104,033,885 | 1,383,044,132 | 1,369,178,258 | 96,603 | - | - | 117,899,759 | 0.4% |
| Total | 162,491,909 | 2,939,709,685 | 2,782,227,083 | 1,956,662 | - | - | 319,974,511 | |
| Valuation Inputs at Reporting Date: | ||||
| Description | Total ($) | Level 1 ($) | Level 2 ($) | Level 3 ($) |
Investments in Securities: | ||||
| U.S. Government and Government Agency Obligations | 15,674,485,295 | - | 15,674,485,295 | - |
| Money Market Funds | 319,974,511 | 319,974,511 | - | - |
| Total Investments in Securities: | 15,994,459,806 | 319,974,511 | 15,674,485,295 | - |
| Statement of Assets and Liabilities | ||||
| February 29, 2024 | ||||
| Assets | ||||
| Investment in securities, at value (including securities loaned of $115,342,123) - See accompanying schedule: | ||||
Unaffiliated issuers (cost $16,794,223,255) | $ | 15,674,485,295 | ||
Fidelity Central Funds (cost $319,974,511) | 319,974,511 | |||
| Total Investment in Securities (cost $17,114,197,766) | $ | 15,994,459,806 | ||
| Receivable for investments sold | 205,097,188 | |||
| Receivable for fund shares sold | 219,717,703 | |||
| Interest receivable | 80,748,050 | |||
| Distributions receivable from Fidelity Central Funds | 370,689 | |||
| Prepaid expenses | 8,982 | |||
| Receivable from investment adviser for expense reductions | 645,886 | |||
Total assets | 16,501,048,304 | |||
| Liabilities | ||||
| Payable for investments purchased | $ | 528,334,609 | ||
| Payable for fund shares redeemed | 9,049,178 | |||
| Distributions payable | 1,622,561 | |||
| Accrued management fee | 490,073 | |||
| Other payables and accrued expenses | 413,512 | |||
| Collateral on securities loaned | 117,899,759 | |||
| Total Liabilities | 657,809,692 | |||
| Net Assets | $ | 15,843,238,612 | ||
| Net Assets consist of: | ||||
| Paid in capital | $ | 17,874,420,228 | ||
| Total accumulated earnings (loss) | (2,031,181,616) | |||
| Net Assets | $ | 15,843,238,612 | ||
Net Asset Value, offering price and redemption price per share ($15,843,238,612 ÷ 1,829,995,396 shares) | $ | 8.66 | ||
| Statement of Operations | ||||
Year ended February 29, 2024 | ||||
| Investment Income | ||||
| Interest | $ | 420,437,429 | ||
| Income from Fidelity Central Funds (including $96,603 from security lending) | 1,956,662 | |||
| Total Income | 422,394,091 | |||
| Expenses | ||||
| Management fee | $ | 5,630,277 | ||
| Custodian fees and expenses | 120,208 | |||
| Independent trustees' fees and expenses | 45,855 | |||
| Registration fees | 813,794 | |||
| Audit | 60,665 | |||
| Legal | 8,284 | |||
| Miscellaneous | 69,815 | |||
| Total expenses before reductions | 6,748,898 | |||
| Expense reductions | (2,473,221) | |||
| Total expenses after reductions | 4,275,677 | |||
| Net Investment income (loss) | 418,118,414 | |||
| Realized and Unrealized Gain (Loss) | ||||
| Net realized gain (loss) on: | ||||
| Investment Securities: | ||||
| Unaffiliated issuers | (414,743,660) | |||
| Total net realized gain (loss) | (414,743,660) | |||
| Change in net unrealized appreciation (depreciation) on investment securities | 231,592,953 | |||
| Net gain (loss) | (183,150,707) | |||
| Net increase (decrease) in net assets resulting from operations | $ | 234,967,707 | ||
| Statement of Changes in Net Assets | ||||
Year ended February 29, 2024 | Year ended February 28, 2023 | |||
| Increase (Decrease) in Net Assets | ||||
| Operations | ||||
| Net investment income (loss) | $ | 418,118,414 | $ | 263,915,621 |
| Net realized gain (loss) | (414,743,660) | (563,513,094) | ||
| Change in net unrealized appreciation (depreciation) | 231,592,953 | (1,059,635,332) | ||
| Net increase (decrease) in net assets resulting from operations | 234,967,707 | (1,359,232,805) | ||
| Distributions to shareholders | (313,253,523) | (209,327,205) | ||
| Share transactions | ||||
| Proceeds from sales of shares | 8,204,835,452 | 13,241,194,566 | ||
| Reinvestment of distributions | 281,774,224 | 182,738,336 | ||
| Cost of shares redeemed | (6,022,265,993) | (9,625,546,014) | ||
Net increase (decrease) in net assets resulting from share transactions | 2,464,343,683 | 3,798,386,888 | ||
| Total increase (decrease) in net assets | 2,386,057,867 | 2,229,826,878 | ||
| Net Assets | ||||
| Beginning of period | 13,457,180,745 | 11,227,353,867 | ||
| End of period | $ | 15,843,238,612 | $ | 13,457,180,745 |
| Other Information | ||||
| Shares | ||||
| Sold | 941,510,346 | 1,470,547,195 | ||
| Issued in reinvestment of distributions | 32,477,756 | 20,547,113 | ||
| Redeemed | (698,661,878) | (1,083,249,754) | ||
| Net increase (decrease) | 275,326,224 | 407,844,554 | ||
| Fidelity® SAI U.S. Treasury Bond Index Fund |
| Years ended February 28, | 2024 A | 2023 | 2022 | 2021 | 2020 A | |||||
Selected Per-Share Data | ||||||||||
| Net asset value, beginning of period | $ | 8.66 | $ | 9.79 | $ | 10.10 | $ | 10.60 | $ | 9.65 |
| Income from Investment Operations | ||||||||||
Net investment income (loss) B,C | .257 | .184 | .106 | .168 | .229 | |||||
| Net realized and unrealized gain (loss) | (.063) | (1.170) | (.316) | (.191) | .937 | |||||
| Total from investment operations | .194 | (.986) | (.210) | (.023) | 1.166 | |||||
| Distributions from net investment income | (.194) | (.144) | (.098) | (.175) | (.216) | |||||
| Distributions from net realized gain | - | - | (.002) | (.302) | - | |||||
| Total distributions | (.194) | (.144) | (.100) | (.477) | (.216) | |||||
| Net asset value, end of period | $ | 8.66 | $ | 8.66 | $ | 9.79 | $ | 10.10 | $ | 10.60 |
Total Return D | 2.25% | (10.10)% | (2.09)% | (.33)% | 12.21% | |||||
Ratios to Average Net Assets C,E,F | ||||||||||
| Expenses before reductions | .05% | .05% | .05% | .05% | .08% | |||||
| Expenses net of fee waivers, if any | .03% | .03% | .03% | .03% | .03% | |||||
| Expenses net of all reductions | .03% | .03% | .03% | .03% | .03% | |||||
| Net investment income (loss) | 2.97% | 2.05% | 1.06% | 1.56% | 2.27% | |||||
| Supplemental Data | ||||||||||
| Net assets, end of period (000 omitted) | $ | 15,843,239 | $ | 13,457,181 | $ | 11,227,354 | $ | 9,575,368 | $ | 9,284,624 |
Portfolio turnover rate G | 37% | 60% | 45% | 167% | 23% |
| Fidelity Central Fund | Investment Manager | Investment Objective | Investment Practices | Expense RatioA |
| Fidelity Money Market Central Funds | Fidelity Management & Research Company LLC (FMR) | Each fund seeks to obtain a high level of current income consistent with the preservation of capital and liquidity. | Short-term Investments | Less than .005% |
| Gross unrealized appreciation | $44,854,961 |
| Gross unrealized depreciation | (1,044,548,909) |
| Net unrealized appreciation (depreciation) | $(999,693,948) |
| Tax Cost | $16,994,153,754 |
| Undistributed tax-exempt income | $1,663,050 |
| Undistributed ordinary income | $(1,033,150,718) |
| Net unrealized appreciation (depreciation) on securities and other investments | $(999,693,948) |
Short-term | $(368,834,696) |
Long-term | (664,316,022) |
| Total capital loss carryforward | $(1,033,150,718) |
| February 29, 2024 | February 28, 2023 | |
| Ordinary Income | $313,253,523 | $209,327,205 |
| Amount | |
| Fidelity SAI U.S. Treasury Bond Index Fund | $24,168 |
| Total Security Lending Fees Paid to NFS | Security Lending Income From Securities Loaned to NFS | Value of Securities Loaned to NFS at Period End | |
| Fidelity SAI U.S. Treasury Bond Index Fund | $10,504 | $- | $- |
| Strategic Advisers Core Income Fund | Strategic Advisers Fidelity Core Income Fund | |
| Fidelity SAI U.S. Treasury Bond Index Fund | 14% | 39% |
| Fund | % of shares held |
| Fidelity SAI U.S. Treasury Bond Index Fund | 53% |
| The Example is based on an investment of $1,000 invested at the beginning of the period and held for the entire period (September 1, 2023 to February 29, 2024). |
Annualized Expense Ratio- A | Beginning Account Value September 1, 2023 | Ending Account Value February 29, 2024 | Expenses Paid During Period- C September 1, 2023 to February 29, 2024 | |||||||
| Fidelity® SAI U.S. Treasury Bond Index Fund | .03% | |||||||||
| Actual | $ 1,000 | $ 1,016.80 | $ .15 | |||||||
Hypothetical-B | $ 1,000 | $ 1,024.71 | $ .15 | |||||||
- Highly liquid investments - cash or convertible to cash within three business days or less
- Moderately liquid investments - convertible to cash in three to seven calendar days
- Less liquid investments - can be sold or disposed of, but not settled, within seven calendar days
- Illiquid investments - cannot be sold or disposed of within seven calendar days
| A special meeting of shareholders was held on October 18, 2023. The results of votes taken among shareholders on the proposal before them are reported below. Each vote reported represents one dollar of net asset value held on the record date for the meeting. | ||
| Proposal 1 | ||
| To elect a Board of Trustees. | ||
# of Votes | % of Votes | |
| Abigail P. Johnson | ||
| Affirmative | 378,729,502,260.01 | 97.58 |
| Withheld | 9,407,876,478.96 | 2.42 |
| TOTAL | 388,137,378,738.97 | 100.00 |
| Jennifer Toolin McAuliffe | ||
| Affirmative | 378,454,868,010.95 | 97.51 |
| Withheld | 9,682,510,728.02 | 2.49 |
| TOTAL | 388,137,378,738.97 | 100.00 |
| Christine J. Thompson | ||
| Affirmative | 378,837,121,274.52 | 97.60 |
| Withheld | 9,300,257,464.45 | 2.40 |
| TOTAL | 388,137,378,738.97 | 100.00 |
| Elizabeth S. Acton | ||
| Affirmative | 378,262,110,794.85 | 97.46 |
| Withheld | 9,875,267,944.12 | 2.54 |
| TOTAL | 388,137,378,738.97 | 100.00 |
| Laura M. Bishop | ||
| Affirmative | 380,482,113,171.06 | 98.03 |
| Withheld | 7,655,265,567.91 | 1.97 |
| TOTAL | 388,137,378,738.97 | 100.00 |
| Ann E. Dunwoody | ||
| Affirmative | 380,016,034,008.12 | 97.91 |
| Withheld | 8,121,344,730.85 | 2.09 |
| TOTAL | 388,137,378,738.97 | 100.00 |
| John Engler | ||
| Affirmative | 379,432,488,394.20 | 97.76 |
| Withheld | 8,704,890,344.77 | 2.24 |
| TOTAL | 388,137,378,738.97 | 100.00 |
| Robert F. Gartland | ||
| Affirmative | 378,741,819,600.60 | 97.58 |
| Withheld | 9,395,559,138.37 | 2.42 |
| TOTAL | 388,137,378,738.97 | 100.00 |
| Robert W. Helm | ||
| Affirmative | 380,389,324,755.07 | 98.00 |
| Withheld | 7,748,053,983.90 | 2.00 |
| TOTAL | 388,137,378,738.97 | 100.00 |
| Arthur E. Johnson | ||
| Affirmative | 378,427,694,151.67 | 97.50 |
| Withheld | 9,709,684,587.30 | 2.50 |
| TOTAL | 388,137,378,738.97 | 100.00 |
| Michael E. Kenneally | ||
| Affirmative | 377,842,228,145.18 | 97.35 |
| Withheld | 10,295,150,593.79 | 2.65 |
| TOTAL | 388,137,378,738.97 | 100.00 |
| Mark A. Murray | ||
| Affirmative | 380,158,432,703.37 | 97.94 |
| Withheld | 7,978,946,035.60 | 2.06 |
| TOTAL | 388,137,378,738.97 | 100.00 |
| Carol J. Zierhoffer | ||
| Affirmative | 380,522,113,360.24 | 98.04 |
| Withheld | 7,615,265,378.73 | 1.96 |
| TOTAL | 388,137,378,738.97 | 100.00 |
| Proposal 1 reflects trust wide proposal and voting results. | ||
 |


Contents
| Average Annual Total Returns | |||
Periods ended February 29, 2024 | Past 1 year | Past 5 years | Life of Fund A |
| Fidelity® SAI Long-Term Treasury Bond Index Fund | -3.91% | -2.58% | -0.71% |
| $10,000 Over Life of Fund |
Let's say hypothetically that $10,000 was invested in Fidelity® SAI Long-Term Treasury Bond Index Fund, on October 8, 2015, when the fund started. The chart shows how the value of your investment would have changed, and also shows how the Bloomberg U.S. 20+ Year Treasury Bond Index performed over the same period. |
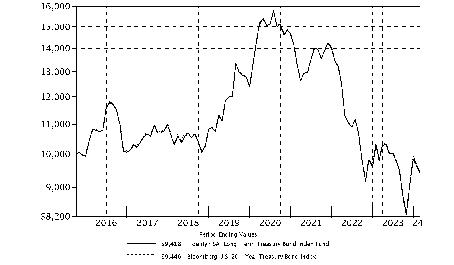 |
| Coupon Distribution (% of Fund's Investments) | ||
| 1 - 1.99% | 11.1 | |
| 2 - 2.99% | 45.3 | |
| 3 - 3.99% | 31.3 | |
| 4 - 4.99% | 11.3 | |
| Coupon distribution shows the range of stated interest rates on the fund's investments, excluding short-term investments. | ||
Asset Allocation (% of Fund's net assets) |
 |
| U.S. Government and Government Agency Obligations - 99.3% | |||
Principal Amount (a) | Value ($) | ||
| U.S. Treasury Obligations - 99.3% | |||
| U.S. Treasury Bonds: | |||
| 1.25% 5/15/50 | 253,000 | 128,496 | |
| 1.625% 11/15/50 | 148,642,000 | 83,477,579 | |
| 1.875% 2/15/51 | 254,713,000 | 152,479,559 | |
| 1.875% 11/15/51 | 229,500,000 | 136,731,797 | |
| 2% 2/15/50 | 165,843,800 | 103,257,201 | |
| 2% 8/15/51 | 224,588,000 | 138,305,852 | |
| 2.25% 8/15/46 | 109,454,000 | 74,343,209 | |
| 2.25% 2/15/52 | 91,300,000 | 59,723,039 | |
| 2.375% 11/15/49 | 103,225,000 | 70,253,484 | |
| 2.375% 5/15/51 | 474,770,000 | 320,377,017 | |
| 2.5% 2/15/45 | 91,179,700 | 66,091,036 | |
| 2.5% 2/15/46 | 107,485,000 | 77,145,680 | |
| 2.5% 5/15/46 | 59,700,000 | 42,729,809 | |
| 2.75% 8/15/42 | 3,500 | 2,723 | |
| 2.75% 8/15/47 | 232,357,000 | 172,697,526 | |
| 2.75% 11/15/47 | 70,354,000 | 52,202,119 | |
| 2.875% 5/15/43 | 20,200 | 15,899 | |
| 2.875% 8/15/45 | 43,359,100 | 33,483,049 | |
| 2.875% 11/15/46 | 40,096,000 | 30,676,572 | |
| 2.875% 5/15/49 | 154,018,000 | 116,458,063 | |
| 2.875% 5/15/52 | 210,200,000 | 158,274,031 | |
| 3% 11/15/44 | 800 | 635 | |
| 3% 5/15/45 | 36,846,800 | 29,134,880 | |
| 3% 11/15/45 | 135,806,000 | 107,016,189 | |
| 3% 2/15/47 | 59,046,000 | 46,127,381 | |
| 3% 5/15/47 | 50,348,000 | 39,293,074 | |
| 3% 2/15/48 | 128,187,000 | 99,610,312 | |
| 3% 8/15/48 | 122,455,000 | 95,022,210 | |
| 3% 2/15/49 | 51,759,000 | 40,105,138 | |
| 3% 8/15/52 | 278,900,000 | 215,613,669 | |
| 3.125% 2/15/42 | 68,100 | 56,480 | |
| 3.125% 8/15/44 | 15,364,300 | 12,464,889 | |
| 3.125% 5/15/48 | 154,814,000 | 123,010,608 | |
| 3.375% 5/15/44 | 17,923,800 | 15,153,313 | |
| 3.625% 2/15/53 | 215,300,000 | 188,236,118 | |
| 3.625% 5/15/53 | 41,700,000 | 36,484,242 | |
| 4% 11/15/52 | 170,300,000 | 159,456,679 | |
| 4.125% 8/15/53 | 226,600,000 | 216,934,094 | |
| 4.75% 11/15/53 | 600,000 | 638,344 | |
| TOTAL U.S. GOVERNMENT AND GOVERNMENT AGENCY OBLIGATIONS (Cost $3,836,027,283) | 3,313,211,995 | ||
| Money Market Funds - 1.0% | |||
| Shares | Value ($) | ||
Fidelity Cash Central Fund 5.39% (b) (Cost $33,489,230) | 33,482,533 | 33,489,230 | |
| TOTAL INVESTMENT IN SECURITIES - 100.3% (Cost $3,869,516,513) | 3,346,701,225 |
NET OTHER ASSETS (LIABILITIES) - (0.3)% | (8,594,267) |
| NET ASSETS - 100.0% | 3,338,106,958 |
| (a) | Amount is stated in United States dollars unless otherwise noted. |
| (b) | Affiliated fund that is generally available only to investment companies and other accounts managed by Fidelity Investments. The rate quoted is the annualized seven-day yield of the fund at period end. A complete unaudited listing of the fund's holdings as of its most recent quarter end is available upon request. In addition, each Fidelity Central Fund's financial statements, which are not covered by the Fund's Report of Independent Registered Public Accounting Firm, are available on the SEC's website or upon request. |
| Affiliate | Value, beginning of period ($) | Purchases ($) | Sales Proceeds ($) | Dividend Income ($) | Realized Gain (loss) ($) | Change in Unrealized appreciation (depreciation) ($) | Value, end of period ($) | % ownership, end of period |
| Fidelity Cash Central Fund 5.39% | 36,864,367 | 232,527,559 | 235,902,696 | 649,466 | - | - | 33,489,230 | 0.1% |
| Fidelity Securities Lending Cash Central Fund 5.39% | - | 78,756,729 | 78,756,729 | 2,805 | - | - | - | 0.0% |
| Total | 36,864,367 | 311,284,288 | 314,659,425 | 652,271 | - | - | 33,489,230 | |
| Valuation Inputs at Reporting Date: | ||||
| Description | Total ($) | Level 1 ($) | Level 2 ($) | Level 3 ($) |
Investments in Securities: | ||||
| U.S. Government and Government Agency Obligations | 3,313,211,995 | - | 3,313,211,995 | - |
| Money Market Funds | 33,489,230 | 33,489,230 | - | - |
| Total Investments in Securities: | 3,346,701,225 | 33,489,230 | 3,313,211,995 | - |
| Statement of Assets and Liabilities | ||||
| February 29, 2024 | ||||
| Assets | ||||
| Investment in securities, at value - See accompanying schedule: | ||||
Unaffiliated issuers (cost $3,836,027,283) | $ | 3,313,211,995 | ||
Fidelity Central Funds (cost $33,489,230) | 33,489,230 | |||
| Total Investment in Securities (cost $3,869,516,513) | $ | 3,346,701,225 | ||
| Receivable for investments sold | 54,459,714 | |||
| Receivable for fund shares sold | 79,043 | |||
| Interest receivable | 19,146,801 | |||
| Distributions receivable from Fidelity Central Funds | 93,390 | |||
| Prepaid expenses | 2,112 | |||
| Receivable from investment adviser for expense reductions | 37,801 | |||
Total assets | 3,420,520,086 | |||
| Liabilities | ||||
| Payable for investments purchased | $ | 78,913,703 | ||
| Payable for fund shares redeemed | 3,259,565 | |||
| Distributions payable | 79,622 | |||
| Accrued management fee | 112,048 | |||
| Other payables and accrued expenses | 48,190 | |||
| Total Liabilities | 82,413,128 | |||
| Net Assets | $ | 3,338,106,958 | ||
| Net Assets consist of: | ||||
| Paid in capital | $ | 6,155,115,649 | ||
| Total accumulated earnings (loss) | (2,817,008,691) | |||
| Net Assets | $ | 3,338,106,958 | ||
Net Asset Value, offering price and redemption price per share ($3,338,106,958 ÷ 465,213,598 shares) | $ | 7.18 | ||
| Statement of Operations | ||||
Year ended February 29, 2024 | ||||
| Investment Income | ||||
| Interest | $ | 142,714,116 | ||
| Income from Fidelity Central Funds (including $2,805 from security lending) | 652,271 | |||
| Total Income | 143,366,387 | |||
| Expenses | ||||
| Management fee | $ | 1,475,889 | ||
| Custodian fees and expenses | 4,323 | |||
| Independent trustees' fees and expenses | 11,793 | |||
| Registration fees | 60,696 | |||
| Audit | 60,271 | |||
| Legal | 2,097 | |||
| Miscellaneous | 22,900 | |||
| Total expenses before reductions | 1,637,969 | |||
| Expense reductions | (511,822) | |||
| Total expenses after reductions | 1,126,147 | |||
| Net Investment income (loss) | 142,240,240 | |||
| Realized and Unrealized Gain (Loss) | ||||
| Net realized gain (loss) on: | ||||
| Investment Securities: | ||||
| Unaffiliated issuers | (285,914,913) | |||
| Total net realized gain (loss) | (285,914,913) | |||
| Change in net unrealized appreciation (depreciation) on investment securities | 88,170,554 | |||
| Net gain (loss) | (197,744,359) | |||
| Net increase (decrease) in net assets resulting from operations | $ | (55,504,119) | ||
| Statement of Changes in Net Assets | ||||
Year ended February 29, 2024 | Year ended February 28, 2023 | |||
| Increase (Decrease) in Net Assets | ||||
| Operations | ||||
| Net investment income (loss) | $ | 142,240,240 | $ | 141,418,609 |
| Net realized gain (loss) | (285,914,913) | (1,997,160,741) | ||
| Change in net unrealized appreciation (depreciation) | 88,170,554 | (377,370,992) | ||
| Net increase (decrease) in net assets resulting from operations | (55,504,119) | (2,233,113,124) | ||
| Distributions to shareholders | (126,136,529) | (133,766,281) | ||
| Share transactions | ||||
| Proceeds from sales of shares | 1,571,655,121 | 4,729,413,945 | ||
| Reinvestment of distributions | 124,963,502 | 133,514,177 | ||
| Cost of shares redeemed | (1,415,721,451) | (6,343,836,524) | ||
Net increase (decrease) in net assets resulting from share transactions | 280,897,172 | (1,480,908,402) | ||
| Total increase (decrease) in net assets | 99,256,524 | (3,847,787,807) | ||
| Net Assets | ||||
| Beginning of period | 3,238,850,434 | 7,086,638,241 | ||
| End of period | $ | 3,338,106,958 | $ | 3,238,850,434 |
| Other Information | ||||
| Shares | ||||
| Sold | 226,044,229 | 534,586,650 | ||
| Issued in reinvestment of distributions | 17,057,001 | 16,005,056 | ||
| Redeemed | (196,792,164) | (793,669,358) | ||
| Net increase (decrease) | 46,309,066 | (243,077,652) | ||
| Fidelity® SAI Long-Term Treasury Bond Index Fund |
| Years ended February 28, | 2024 A | 2023 | 2022 | 2021 | 2020 A | |||||
Selected Per-Share Data | ||||||||||
| Net asset value, beginning of period | $ | 7.73 | $ | 10.71 | $ | 11.04 | $ | 12.59 | $ | 9.72 |
| Income from Investment Operations | ||||||||||
Net investment income (loss) B,C | .283 | .243 | .219 | .227 | .251 | |||||
| Net realized and unrealized gain (loss) | (.582) | (2.991) | (.309) | (.965) | 2.876 | |||||
| Total from investment operations | (.299) | (2.748) | (.090) | (.738) | 3.127 | |||||
| Distributions from net investment income | (.251) | (.232) | (.213) | (.226) | (.257) | |||||
| Distributions from net realized gain | - | - | (.027) | (.586) | - | |||||
| Total distributions | (.251) | (.232) | (.240) | (.812) | (.257) | |||||
| Net asset value, end of period | $ | 7.18 | $ | 7.73 | $ | 10.71 | $ | 11.04 | $ | 12.59 |
Total Return D | (3.91)% | (25.78)% | (.85)% | (6.39)% | 32.55% | |||||
Ratios to Average Net Assets B,E,F | ||||||||||
| Expenses before reductions | .04% | .04% | .08% | .05% | .08% | |||||
| Expenses net of fee waivers, if any | .03% | .03% | .03% | .03% | .03% | |||||
| Expenses net of all reductions | .03% | .03% | .03% | .03% | .03% | |||||
| Net investment income (loss) | 3.85% | 2.85% | 1.97% | 1.77% | 2.21% | |||||
| Supplemental Data | ||||||||||
| Net assets, end of period (000 omitted) | $ | 3,338,107 | $ | 3,238,850 | $ | 7,086,638 | $ | 1,174,635 | $ | 1,055,440 |
Portfolio turnover rate G | 51% | 107% | 62% | 47% | 18% |
| Fidelity Central Fund | Investment Manager | Investment Objective | Investment Practices | Expense RatioA |
| Fidelity Money Market Central Funds | Fidelity Management & Research Company LLC (FMR) | Each fund seeks to obtain a high level of current income consistent with the preservation of capital and liquidity. | Short-term Investments | Less than .005% |
| Gross unrealized appreciation | $42,677,045 |
| Gross unrealized depreciation | (576,855,309) |
| Net unrealized appreciation (depreciation) | $(534,178,264) |
| Tax Cost | $3,880,879,489 |
| Undistributed ordinary income | $164,589 |
| Capital loss carryforward | $(2,282,995,015) |
| Net unrealized appreciation (depreciation) on securities and other investments | $(534,178,264) |
| Short-term | $(812,706,493) |
| Long-term | (1,470,288,522) |
| Total capital loss carryforward | $(2,282,995,015) |
| February 29, 2024 | February 28, 2023 | |
| Ordinary Income | $126,136,529 | $ 133,766,281 |
| Amount | |
| Fidelity SAI Long-Term Treasury Bond Index Fund | $6,262 |
| Total Security Lending Fees Paid to NFS | Security Lending Income From Securities Loaned to NFS | Value of Securities Loaned to NFS at Period End | |
| Fidelity SAI Long-Term Treasury Bond Index Fund | $293 | $- | $- |
| Strategic Advisers Core Income Fund | Strategic Advisers Fidelity Core Income Fund | |
| Fidelity SAI Long-Term Treasury Bond Index Fund | 13% | 81% |
| Fund | % of shares held |
| Fidelity SAI Long-Term Treasury Bond Index Fund | 94% |
| The Example is based on an investment of $1,000 invested at the beginning of the period and held for the entire period (September 1, 2023 to February 29, 2024). |
Annualized Expense Ratio- A | Beginning Account Value September 1, 2023 | Ending Account Value February 29, 2024 | Expenses Paid During Period- C September 1, 2023 to February 29, 2024 | |||||||
| Fidelity® SAI Long-Term Treasury Bond Index Fund | .03% | |||||||||
| Actual | $ 1,000 | $ 993.20 | $ .15 | |||||||
Hypothetical-B | $ 1,000 | $ 1,024.71 | $ .15 | |||||||
- Highly liquid investments - cash or convertible to cash within three business days or less
- Moderately liquid investments - convertible to cash in three to seven calendar days
- Less liquid investments - can be sold or disposed of, but not settled, within seven calendar days
- Illiquid investments - cannot be sold or disposed of within seven calendar days
| A special meeting of shareholders was held on October 18, 2023. The results of votes taken among shareholders on the proposal before them are reported below. Each vote reported represents one dollar of net asset value held on the record date for the meeting. | ||
| Proposal 1 | ||
| To elect a Board of Trustees. | ||
# of Votes | % of Votes | |
| Abigail P. Johnson | ||
| Affirmative | 378,729,502,260.01 | 97.58 |
| Withheld | 9,407,876,478.96 | 2.42 |
| TOTAL | 388,137,378,738.97 | 100.00 |
| Jennifer Toolin McAuliffe | ||
| Affirmative | 378,454,868,010.95 | 97.51 |
| Withheld | 9,682,510,728.02 | 2.49 |
| TOTAL | 388,137,378,738.97 | 100.00 |
| Christine J. Thompson | ||
| Affirmative | 378,837,121,274.52 | 97.60 |
| Withheld | 9,300,257,464.45 | 2.40 |
| TOTAL | 388,137,378,738.97 | 100.00 |
| Elizabeth S. Acton | ||
| Affirmative | 378,262,110,794.85 | 97.46 |
| Withheld | 9,875,267,944.12 | 2.54 |
| TOTAL | 388,137,378,738.97 | 100.00 |
| Laura M. Bishop | ||
| Affirmative | 380,482,113,171.06 | 98.03 |
| Withheld | 7,655,265,567.91 | 1.97 |
| TOTAL | 388,137,378,738.97 | 100.00 |
| Ann E. Dunwoody | ||
| Affirmative | 380,016,034,008.12 | 97.91 |
| Withheld | 8,121,344,730.85 | 2.09 |
| TOTAL | 388,137,378,738.97 | 100.00 |
| John Engler | ||
| Affirmative | 379,432,488,394.20 | 97.76 |
| Withheld | 8,704,890,344.77 | 2.24 |
| TOTAL | 388,137,378,738.97 | 100.00 |
| Robert F. Gartland | ||
| Affirmative | 378,741,819,600.60 | 97.58 |
| Withheld | 9,395,559,138.37 | 2.42 |
| TOTAL | 388,137,378,738.97 | 100.00 |
| Robert W. Helm | ||
| Affirmative | 380,389,324,755.07 | 98.00 |
| Withheld | 7,748,053,983.90 | 2.00 |
| TOTAL | 388,137,378,738.97 | 100.00 |
| Arthur E. Johnson | ||
| Affirmative | 378,427,694,151.67 | 97.50 |
| Withheld | 9,709,684,587.30 | 2.50 |
| TOTAL | 388,137,378,738.97 | 100.00 |
| Michael E. Kenneally | ||
| Affirmative | 377,842,228,145.18 | 97.35 |
| Withheld | 10,295,150,593.79 | 2.65 |
| TOTAL | 388,137,378,738.97 | 100.00 |
| Mark A. Murray | ||
| Affirmative | 380,158,432,703.37 | 97.94 |
| Withheld | 7,978,946,035.60 | 2.06 |
| TOTAL | 388,137,378,738.97 | 100.00 |
| Carol J. Zierhoffer | ||
| Affirmative | 380,522,113,360.24 | 98.04 |
| Withheld | 7,615,265,378.73 | 1.96 |
| TOTAL | 388,137,378,738.97 | 100.00 |
| Proposal 1 reflects trust wide proposal and voting results. | ||
 |
Item 2.
Code of Ethics
As of the end of the period, February 29, 2024, Fidelity Salem Street Trust (the trust) has adopted a code of ethics, as defined in Item 2 of Form N-CSR, that applies to its President and Treasurer and its Chief Financial Officer. A copy of the code of ethics is filed as an exhibit to this Form N-CSR.
Item 3.
Audit Committee Financial Expert
The Board of Trustees of the trust has determined that Elizabeth S. Acton is an audit committee financial expert, as defined in Item 3 of Form N-CSR. Ms. Acton is independent for purposes of Item 3 of Form N-CSR.
Item 4.
Principal Accountant Fees and Services
Fees and Services
The following table presents fees billed by Deloitte & Touche LLP, the member firms of Deloitte Touche Tohmatsu, and their respective affiliates (collectively, “Deloitte Entities”) in each of the last two fiscal years for services rendered to Fidelity SAI Long-Term Treasury Bond Index Fund and Fidelity SAI U.S. Treasury Bond Index Fund (the “Funds”):
Services Billed by Deloitte Entities
February 29, 2024 FeesA
Audit Fees | Audit-Related Fees | Tax Fees | All Other Fees | |
Fidelity SAI Long-Term Treasury Bond Index Fund | $44,500 | $- | $11,000 | $1,100 |
Fidelity SAI U.S. Treasury Bond Index Fund | $45,500 | $- | $7,900 | $1,100 |
February 28, 2023 FeesA
Audit Fees | Audit-Related Fees | Tax Fees | All Other Fees | |
Fidelity SAI Long-Term Treasury Bond Index Fund | $42,000 | $- | $10,500 | $1,000 |
Fidelity SAI U.S. Treasury Bond Index Fund | $45,300 | $- | $7,900 | $1,100 |
A Amounts may reflect rounding.
The following table presents fees billed by PricewaterhouseCoopers LLP (“PwC”) in each of the last two fiscal years for services rendered to Fidelity Intermediate Treasury Bond Index Fund, Fidelity Long-Term Treasury Bond Index Fund, Fidelity Series Long-Term Treasury Bond Index Fund, and Fidelity Short-Term Treasury Bond Index Fund (the “Funds”):
Services Billed by PwC
February 29, 2024 FeesA
Audit Fees | Audit-Related Fees | Tax Fees | All Other Fees | |
Fidelity Intermediate Treasury Bond Index Fund | $37,000 | $3,400 | $9,500 | $1,400 |
Fidelity Long-Term Treasury Bond Index Fund | $36,900 | $3,400 | $9,500 | $1,400 |
Fidelity Series Long-Term Treasury Bond Index Fund | $43,200 | $3,800 | $8,800 | $1,600 |
Fidelity Short-Term Treasury Bond Index Fund | $36,900 | $3,400 | $9,500 | $1,400 |
February 28, 2023 FeesA
Audit Fees | Audit-Related Fees | Tax Fees | All Other Fees | |
Fidelity Intermediate Treasury Bond Index Fund | $36,900 | $3,200 | $9,500 | $1,400 |
Fidelity Long-Term Treasury Bond Index Fund | $36,900 | $3,200 | $9,500 | $1,400 |
Fidelity Series Long-Term Treasury Bond Index Fund | $42,600 | $3,500 | $8,800 | $1,500 |
Fidelity Short-Term Treasury Bond Index Fund | $36,900 | $3,200 | $9,500 | $1,400 |
A Amounts may reflect rounding
The following table(s) present(s) fees billed by Deloitte Entities and PwC that were required to be approved by the Audit Committee for services that relate directly to the operations and financial reporting of the Fund(s) and that are rendered on behalf of Fidelity Management & Research Company LLC ("FMR") and entities controlling, controlled by, or under common control with FMR (not including any sub-adviser whose role is primarily portfolio management and is subcontracted with or overseen by another investment adviser) that provide ongoing services to the Fund(s) (“Fund Service Providers”):
Services Billed by Deloitte Entities
February 29, 2024A | February 28, 2023A | |
Audit-Related Fees | $75,000 | $80,000 |
Tax Fees | $- | $- |
All Other Fees | $935,000 | $- |
A Amounts may reflect rounding.
Services Billed by PwC
February 29, 2024A | February 28, 2023A | |
Audit-Related Fees | $9,422,800 | $8,469,200 |
Tax Fees | $61,000 | $1,000 |
All Other Fees | $- | $- |
A Amounts may reflect rounding.
“Audit-Related Fees” represent fees billed for assurance and related services that are reasonably related to the performance of the fund audit or the review of the fund's financial statements and that are not reported under Audit Fees.
“Tax Fees” represent fees billed for tax compliance, tax advice or tax planning that relate directly to the operations and financial reporting of the fund.
“All Other Fees” represent fees billed for services provided to the fund or Fund Service Provider, a significant portion of which are assurance related, that relate directly to the operations and financial reporting of the fund, excluding those services that are reported under Audit Fees, Audit-Related Fees or Tax Fees.
Assurance services must be performed by an independent public accountant.
* * *
The aggregate non-audit fees billed by Deloitte Entities and PwC for services rendered to the Fund(s), FMR (not including any sub-adviser whose role is primarily portfolio management and is subcontracted with or overseen by another investment adviser), and any Fund Service Provider for each of the last two fiscal years of the Fund(s) are as follows:
Billed By | February 29, 2024A | February 28, 2023A |
Deloitte Entities | $6,320,600 | $803,500 |
PwC | $15,085,600 | $14,220,100 |
A Amounts may reflect rounding.
The trust's Audit Committee has considered non-audit services that were not pre-approved that were provided by Deloitte Entities and PwC to Fund Service Providers to be compatible with maintaining the independence of Deloitte Entities and PwC in its(their) audit of the Fund(s), taking into account representations from Deloitte Entities and PwC, in accordance with Public Company Accounting Oversight Board rules, regarding its independence from the Fund(s) and its(their) related entities and FMR’s review of the appropriateness and permissibility under applicable law of such non-audit services prior to their provision to the Fund(s) Service Providers.
Audit Committee Pre-Approval Policies and Procedures
The trust’s Audit Committee must pre-approve all audit and non-audit services provided by a fund’s independent registered public accounting firm relating to the operations or financial reporting of the fund. Prior to the commencement of any audit or non-audit
services to a fund, the Audit Committee reviews the services to determine whether they are appropriate and permissible under applicable law.
The Audit Committee has adopted policies and procedures to, among other purposes, provide a framework for the Committee’s consideration of non-audit services by the audit firms that audit the Fidelity funds. The policies and procedures require that any non-audit service provided by a fund audit firm to a Fidelity fund and any non-audit service provided by a fund auditor to a Fund Service Provider that relates directly to the operations and financial reporting of a Fidelity fund (“Covered Service”) are subject to approval by the Audit Committee before such service is provided.
All Covered Services must be approved in advance of provision of the service either: (i) by formal resolution of the Audit Committee, or (ii) by oral or written approval of the service by the Chair of the Audit Committee (or if the Chair is unavailable, such other member of the Audit Committee as may be designated by the Chair to act in the Chair’s absence). The approval contemplated by (ii) above is permitted where the Treasurer determines that action on such an engagement is necessary before the next meeting of the Audit Committee.
Non-audit services provided by a fund audit firm to a Fund Service Provider that do not relate directly to the operations and financial reporting of a Fidelity fund are reported to the Audit Committee periodically.
Non-Audit Services Approved Pursuant to Rule 2-01(c)(7)(i)(C) and (ii) of Regulation S-X (“De Minimis Exception”)
There were no non-audit services approved or required to be approved by the Audit Committee pursuant to the De Minimis Exception during the Fund’s(s’) last two fiscal years relating to services provided to (i) the Fund(s) or (ii) any Fund Service Provider that relate directly to the operations and financial reporting of the Fund(s).
The Registrant has not retained, for the preparation of the audit report on the financial statements included in the Form N-CSR, a registered public accounting firm that has a branch or office that is located in a foreign jurisdiction and that the Public Company Accounting Oversight Board (the “PCAOB”) has determined that the PCAOB is unable to inspect or investigate completely because of a position taken by an authority in the foreign jurisdiction.
The Registrant is not a “foreign issuer,” as defined in 17 CFR 240.3b-4.
Item 5.
Audit Committee of Listed Registrants
Not applicable.
Item 6.
Investments
(a)
Not applicable.
(b)
Not applicable.
Item 7.
Disclosure of Proxy Voting Policies and Procedures for Closed-End Management Investment Companies
Not applicable.
Item 8.
Portfolio Managers of Closed-End Management Investment Companies
Not applicable.
Item 9.
Purchase of Equity Securities by Closed-End Management Investment Company and Affiliated Purchasers
Not applicable.
Item 10.
Submission of Matters to a Vote of Security Holders
There were no material changes to the procedures by which shareholders may recommend nominees to the trust’s Board of Trustees.
Item 11.
Controls and Procedures
(a)(i) The President and Treasurer and the Chief Financial Officer have concluded that the trust’s disclosure controls and procedures (as defined in Rule 30a-3(c) under the Investment Company Act) provide reasonable assurances that material information relating to the trust is made known to them by the appropriate persons, based on their evaluation of these controls and procedures as of a date within 90 days of the filing date of this report.
(a)(ii) There was no change in the trust’s internal control over financial reporting (as defined in Rule 30a-3(d) under the Investment Company Act) that occurred during the period covered by this report that has materially affected, or is reasonably likely to materially affect, the trust’s internal control over financial reporting.
Item 12.
Disclosure of Securities Lending Activities for Closed-End Management
Investment Companies
Not applicable.
Item 18.
Recovery of Erroneously Awarded Compensation
(a)
Not applicable.
(b)
Not applicable.
Item 19.
Exhibits
(a) | (1) | Code of Ethics pursuant to Item 2 of Form N-CSR is filed and attached hereto as EX-99.CODE ETH. |
(a) | (2) | |
(a) | (3) | Not applicable. |
(b) |
SIGNATURES
Pursuant to the requirements of the Securities Exchange Act of 1934 and the Investment Company Act of 1940, the registrant has duly caused this report to be signed on its behalf by the undersigned, thereunto duly authorized.
Fidelity Salem Street Trust
By: | /s/Laura M. Del Prato |
Laura M. Del Prato | |
President and Treasurer (Principal Executive Officer) | |
Date: | April 22, 2024 |
Pursuant to the requirements of the Securities Exchange Act of 1934 and the Investment Company Act of 1940, this report has been signed below by the following persons on behalf of the registrant and in the capacities and on the dates indicated.
By: | /s/Laura M. Del Prato |
Laura M. Del Prato | |
President and Treasurer (Principal Executive Officer) | |
Date: | April 22, 2024 |
By: | /s/John J. Burke III |
John J. Burke III | |
Chief Financial Officer (Principal Financial Officer) | |
Date: | April 22, 2024 |